Attached files
| file | filename |
|---|---|
| EXCEL - IDEA: XBRL DOCUMENT - Violin Memory Inc | Financial_Report.xls |
| EX-23.1 - EX-23.1 - Violin Memory Inc | d860990dex231.htm |
| EX-31.1 - EX-31.1 - Violin Memory Inc | d860990dex311.htm |
| EX-31.2 - EX-31.2 - Violin Memory Inc | d860990dex312.htm |
| EX-32.1 - EX-32.1 - Violin Memory Inc | d860990dex321.htm |
| EX-32.2 - EX-32.2 - Violin Memory Inc | d860990dex322.htm |
Table of Contents
UNITED STATES
SECURITIES AND EXCHANGE COMMISSION
Washington, DC 20549
FORM 10-K
(Mark One)
| x | ANNUAL REPORT PURSUANT TO SECTION 13 OR 15(d) OF THE SECURITIES EXCHANGE ACT OF 1934 |
For the fiscal year ended January 31, 2015
OR
| ¨ | TRANSITION REPORT PURSUANT TO SECTION 13 OR 15(d) OF THE SECURITIES EXCHANGE ACT OF 1934 |
For the transition period from to
Commission File Number: 001- 36069
VIOLIN MEMORY, INC.
(Exact Name of Registrant as Specified in Its Charter)
| Delaware | 20-3940944 | |
| (State or Other Jurisdiction of Incorporation or Organization) |
(I.R.S. Employer Identification No.) | |
| 4555 Great America Parkway, Santa Clara, California | 95054 | |
| (Address of Principal Executive Offices) | (Zip Code) | |
Registrant’s telephone number, including area code: (650) 396-1500
Indicate by check mark if the registrant is a well-known seasoned issuer, as defined in Rule 405 of the Securities Act. Yes ¨ No x
Indicate by check mark if the registrant is not required to file reports pursuant to Section 13 or Section 15(d) of the Act. Yes ¨ No x
Indicate by check mark whether the registrant: (1) has filed all reports required to be filed by Section 13 or 15(d) of the Securities Exchange Act of 1934 during the preceding 12 months (or for such shorter period that the registrant was required to file such reports), and (2) has been subject to such filing requirements for the past 90 days. Yes x No ¨
Indicate by check mark whether the registrant has submitted electronically and posted on its corporate Web site, if any, every Interactive Data File required to be submitted and posted pursuant to Rule 405 of Regulation S-T (§232.405 of this chapter) during the preceding 12 months (or for such shorter period that the registrant was required to submit and post such files). Yes x No ¨
Indicate by check mark if disclosure of delinquent filers pursuant to Item 405 of Regulation S-K (§232.405 of this chapter) is not contained herein, and will not be contained, to the best of the registrant’s knowledge, in definitive proxy or information statements incorporated by reference in Part III of this Form 10-K or any amendment to this Form 10-K. x
Indicate by check mark whether the registrant is a large accelerated filer, an accelerated filer, a non-accelerated filer, or a smaller reporting company. See definition of “large accelerated filer,” “accelerated filer” and “smaller reporting company” in Rule 12b-2 of the Exchange Act. (Check one):
| Large accelerated filer | ¨ | Accelerated filer | x | |||
| Non-accelerated filer | ¨ (Do not check if a smaller reporting company) | Smaller reporting company | ¨ | |||
Indicate by check mark whether the registrant is a shell company (as defined in Rule 12b-2 of the Exchange Act). Yes ¨ No x
The aggregate market value of voting stock held by non-affiliates of the registrant on July 31, 2014, based on the closing price of $3.96 for shares of the registrant’s common stock as reported by the New York Stock Exchange, was approximately $363,862,216. Shares of common stock held by each executive officer, director, and holder of 5% or more of the outstanding common stock have been excluded in that such persons may be deemed to be affiliates. This determination of affiliate status is not necessarily a conclusive determination for other purposes.
As of March 31, 2015, 95,789,619 shares of the registrant’s common stock were outstanding.
Table of Contents
Violin Memory, Inc.
Form 10-K
2
Table of Contents
Special Note Regarding Forward-Looking Statements
The information in this Annual Report on Form 10-K contains forward-looking statements within the meaning of Section 27A of the Securities Act of 1933, as amended, or the Securities Act, and Section 21E of the Securities Exchange Act of 1934, as amended, or the Exchange Act. Such statements are based upon current expectations that involve risks and uncertainties. Any statements contained herein that are not statements of historical facts may be deemed to be forward-looking statements. For example, words such as “may,” “will,” “should,” “estimates,” “predicts,” “potential,” “continue,” “strategy,” “believes,” “anticipates,” “plans,” “expects,” “intends” and similar expressions are intended to identify forward-looking statements. Our actual results and the timing of certain events may differ significantly from the results discussed in the forward-looking statements. Factors that might cause or contribute to such differences include, but are not limited to, those discussed elsewhere in this Annual Report on Form 10-K in the section titled “Risk Factors” and the risks discussed in our other filings with the Securities and Exchange Commission, or the SEC. In light of these risks, uncertainties and assumptions, the forward-looking events and circumstances discussed in this prospectus may not occur, and actual results could differ materially and adversely from those anticipated or implied in the forward-looking statements. Forward-looking statements include, but are not limited to, statements about:
| • | our financial performance, including our revenue, cost of revenue and operating expenses; |
| • | our ability to effectively manage our growth; |
| • | our ability to attract and retain customers; |
| • | anticipated trends and challenges in our business and the competition that we face; and |
| • | our liquidity and working capital requirements. |
Although we believe that the expectations reflected in the forward-looking statements are reasonable, we cannot guarantee future results, level of activity, performance or achievements. In addition, neither we nor any other person assumes responsibility for the accuracy and completeness of any of these forward-looking statements. Any forward-looking statement made by us in this Annual Report on Form 10-K speaks only as of the date on which it is made. We disclaim any duty to update any of these forward-looking statements after the date of this Annual Report on Form 10-K to confirm these statements to actual results or revised expectations.
| Item | 1. Business |
Overview
We have pioneered a new class of persistent flash-based storage solutions designed to bring storage performance in line with high-speed applications, servers and networks. Our Flash Storage Platform™ and All Flash Arrays are specifically designed at each level of the system architecture to leverage the inherent capabilities of flash memory and meet the sustained high-performance requirements of business-critical applications, virtualized environments and Big Data - data sets that are so large or complex that traditional processing applications are inadequate - solutions in the cloud and in enterprise data centers. We have demonstrated that our Flash Storage Platforms and All Flash Arrays provide low latency and sustainable performance with enterprise-class data services, reliability, availability, capacity and serviceability through product testing and customer feedback. Our solutions enable customers to realize significant capital expenditure and operational cost savings by simplifying their data center environments.
In February 2015, we introduced the Flash Storage Platform, the industry’s first vertically integrated design of software, firmware and hardware that delivers the highest performance, resiliency and availability at the same cost as legacy enterprise-class primary storage. The Flash Storage Platform runs our Concerto™ OS 7, a single operating system with integrated continuous data protection, in-line block de-duplication and compression,
3
Table of Contents
stretch metro cluster and LUN mirroring as well as our suite of other Enterprise Data Services. With our Flash Storage Platform, all active data (Tiers 0, 1, and 2) can be consolidated onto a single tier, simplifying storage administration. Additionally, with our release of Symphony™ Management Suite Version 3.0, the entire software functionality can all be controlled in 1, 2 or 3 clicks, with management of the entire storage estate, through a single pane of glass.
We believe our relationship with Toshiba Corporation, or Toshiba, a leading provider of flash memory and one of our principal stockholders, allows us to design our storage systems to unlock the inherent performance capabilities of flash technology and provides us with knowledge of future generations of flash. A key component of our close relationship with Toshiba is frequent direct technical interactions between our respective engineering teams.
As of January 31, 2015, our products have been purchased by more than 350 enterprises in diverse end markets, including financial services, health care, Internet, government, media and entertainment and telecommunications. We primarily sell our products and services through our direct sales force and global channels network to provide a high level of end-customer engagement. We maintain relationships with systems vendors and key technology partners, such as Dell, Inc., or Dell, Fujitsu Limited, or Fujitsu, Microsoft Corporation, or Microsoft, SAP AG, or SAP, Symantec Corporation, or Symantec, Toshiba and VMware, Inc., or VMware. We had total revenue of $79.0 million, $107.7 million and $73.8 million in fiscal 2015, 2014 and 2013, respectively. We had a net loss of $108.9 million, $149.8 million and $109.1 million in fiscal 2015, 2014 and 2013, respectively.
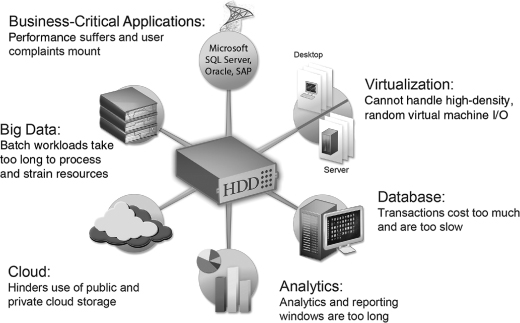
Industry Background
A number of important IT trends are highlighting the widening performance gap between storage and other data center technologies. These trends include the acceleration of server and network technologies, widespread adoption of virtualization technologies, proliferation of public and private cloud-based environments, explosive data growth and demand for high-frequency, real-time access, the increasing strategic importance of in-memory computing, a focus on reducing data center complexity, and lowering total cost of ownership. Organizations seek to address this performance gap and optimize the utilization of both their enterprise data center and cloud environments. We believe that traditional disk-based storage solutions provided by incumbent primary storage vendors, such as Dell, EMC Corporation, or EMC, Hewlett-Packard (3PAR), or HP, Hitachi Data Systems Corporation, or Hitachi, International Business Machines, or IBM, and NetApp, Inc., or NetApp, have been unable to adequately scale performance to address this widening gap due to the inherent limitations of hard disk drives. There has been an accelerating shift towards the use of flash-based solutions. We believe other flash-based solutions provided by legacy vendors, while offering greater performance than disk-based storage solutions, have nevertheless been unable to adequately address this bottleneck while providing the data services, resilience, reliability density and availability required by enterprise applications.
Key IT Trends Impacting the Data Center
There are a number of important IT trends that are having a transformational impact on the design, performance and efficiency of storage in the data center:
| • | Improving performance of server and network technologies. Server performance, driven by microprocessor advancements, multi-core processors and threading technology, has progressed at a rapid pace. We believe performance of server microprocessor units, or MPU, will continue to scale in line with the increasing number of cores per processing unit. Data center network performance has also significantly increased as networks have become faster, less intricate and more efficient. |
| • | Widespread adoption of virtualization technologies. The broad adoption of server and desktop virtualization technologies as well as the associated increase in the number of virtual machines per physical server are placing a greater burden on storage systems within existing data center environments. This trend is driving a |
4
Table of Contents
| significant need for high I/O Operations per Second, or IOPS, to support highly unpredictable traffic patterns and the increasing mix of random I/O operations. |
| • | Proliferation of cloud-based architectures. The rapid proliferation of private and public cloud-based architectures is driving an increasing demand in storage infrastructure and data management solutions. Enterprises are acknowledging the importance of transitioning to the cloud with significant investments in storage hardware and software capabilities to better access, manage, and protect business-critical data and applications. Similarly, the emergence of cloud service providers is a key driver of storage consumption in providing access to large quantities of real-time content. |
| • | Explosive data growth and demand for high-frequency, real-time access. The number of applications used and volume of data generated by enterprises and individuals continue to grow rapidly. In addition, the need for real-time access is being driven by the rapid proliferation of mobile devices. |
| • | Increasing strategic importance of in-memory computing. In-memory computing is gaining increasing strategic importance in both enterprise data center and cloud environments as organizations look to IT as an enabler of growth and differentiation in their businesses. The growing use of in-memory computing is being driven by its inclusion in traditional products and cloud services, the growing need for faster performance and greater scalability requirements by high-performance applications such as Big Data analytics and the declining cost of flash memory. |
| • | Focus on reducing data center complexity and lowering total cost of ownership. Organizations continue to deploy an increasing amount of storage to address the rapid growth in data and the rising performance requirements of applications and users. Typically, this compels IT departments to add more storage to support greater workloads, or over-provision, in an attempt to achieve the required I/O throughput levels. This over-provisioning has resulted in an overly complex infrastructure that is underutilized and increasingly expensive to manage. Consequently, organizations have become increasingly focused on efficiently scaling capacity and consolidating data center resources to lower operating costs. |
These trends have placed a great strain on the performance and efficiency of data centers, highlighting the widening performance gap between storage and other data center technologies. Disk-based storage providers have been unable to adequately scale performance to address this gap due to the inherent limitations of hard disk drives. Organizations are increasingly seeking alternatives to traditional disk-based storage to address this performance gap and optimize the utilization of both their enterprise data center and cloud environments.
IDC estimates worldwide spending on enterprise storage systems will grow from $35.7 billion in 2014 to $42.5 billion in 2018.1 A majority of this market is comprised of disk-based capacity-optimized and performance-optimized systems. As enterprises seek alternatives to traditional disk-based storage solutions and the price of flash continues to decline, there has been a faster shift toward flash-based storage. IDC predicts the all-flash array market will grow at a compounded annual growth rate of 26.6% from $1.3 billion in 2014 to $3.3 billion in 2018.2 We believe there is a continuing opportunity for a disruptive solution to capture the I/O intensive storage market as well as a meaningful portion of the primary storage market historically served, albeit poorly, by disk-based capacity-optimized and performance-optimized systems.
Attempts to Address the Widening Performance Gap in Data Center Environments
Traditional disk-based storage solutions exhibit significant delays in accessing data, or latency, which limit the overall performance of data center environments. Latency associated with accessing the data stored on array-based hard disk drives, or HDDs, is caused by the physics of rotating media where the data retrieval process is sequential. As application workloads increase, each I/O request is placed in a queue, resulting in a significant
| 1 | IDC, “Worldwide Enterprise Storage Systems 2014-2018 Forecast: Alignment with the 3rd Platform Is the Next Must-Have,” May 2014. |
| 2 | IDC, “Worldwide All-Flash Array and Hybrid Flash Array 2014-2018 Forecast and 1H14 Vendor Shares,” November 2014. |
5
Table of Contents
increase in disk response time, creating an I/O bottleneck and the more the response time deteriorates, the more severe the bottleneck. A common approach to address the I/O bottleneck involves over-provisioning of disk-based storage resources and only storing data on the faster outer tracks of the drive. This practice is called “short stroking.” However, over-provisioning and short stroking results in a structural underutilization of storage capacity and IT capital.
Relative Latency of HDD arrays and Flash Storage Platforms
| Storage technology |
Latency | |||
| HDD-based arrays |
2 to 20 ms | |||
| Flash Storage Platforms |
0.2 to 1 ms | |||
As data center technologies have improved, we believe it has become increasingly clear that disk-based storage solutions are not sufficient to meet the requirements of today’s I/O intensive data center environments. In an effort to overcome the limited performance capabilities of disk-based storage solutions, vendors have begun incorporating flash technology in their storage systems as an alternative. This has been facilitated by the decrease in the price of flash components over time.
Flash-based storage solutions designed for enterprise applications are generally deployed in array-based configurations which enable storage resources to be shared across data center networks. Solutions are found in three configurations:
| • | Arrays built using off-the-shelf controllers and Solid State Drives (SSDs) |
| • | A hybrid of both HDDs and SSDs, or |
| • | Specifically designed all flash arrays |
Flash-based solutions using off-the-shelf components and SSDs deliver improved performance relative to disk-based storage solutions. However, their ability to optimize flash technology is severely limited by factors which include the utilization of off-the-shelf flash memory chips, commodity controllers, commercially available data protection algorithms and management software originally designed for HDDs.
Flash is a medium that becomes progressively slower and more error-prone as data is repeatedly written, read and erased. We believe that the implementation of purpose-built intelligent software and controller technologies that are tightly integrated with flash-based solutions are necessary to address the challenges of the underlying flash technology and to deliver sustained high performance and endurance. Without the implementation of technologies specifically designed for flash, the performance, sustainability, and endurance of flash-based storage solutions that use off-the-shelf components remain significantly limited.
The key limitations of HDD- and SSD-based storage solutions include:
| • | Slow response times of disk-based storage solutions. Disk-based storage solutions are unable to deliver the low latency required by today’s high-performance applications. While over-provisioning and short-stroking with more HDDs modestly increases I/O throughput, this approach cannot reduce I/O response time due to the physics of rotating media and the architecture of disk-based storage solutions. |
| • | Limited ability to provide scalable and sustained performance under peak workloads. While SSD-based storage solutions that use off-the-shelf drives can provide improved performance over disk-based storage solutions, they suffer from the “Write Cliff” issue, a phenomenon that refers to a significant spike in latency and slower I/O response times experienced by SSDs during erase cycles. This prevents SSD-based storage solutions from delivering predictable and sustainable performance during periods of peak workloads. |
6
Table of Contents
| • | High cost per transaction and overall cost of ownership. Disk-based storage solutions are not typically optimized to reduce the cost of storage associated with the execution of individual transactions of high- speed applications, which we refer to as cost per transaction. In addition, the current approach of over- provisioning and short-stroking HDD arrays to address the performance gap increases facilities costs, management overhead and energy consumption. Today’s disk-based infrastructures have multiple performance tiers of storage, requiring the expensive management of data and workloads within this infrastructure, which adds to the overall cost of ownership. |
| • | Not optimized for real-time application workloads. Disk-based storage solutions were not originally designed to serve the dynamic requirements of real-time application workloads. For example, disk-based storage solutions are designed for sequential workloads, not the random I/O patterns inherent in virtualized and cloud-based environments. Similarly, disk-based storage solutions are not designed to deliver the high-performance and high scalability requirements of Big Data analytics applications. |
Limitations of Disk-Based Storage Solutions in Addressing Real-time Application Workloads
As a result of these limitations, we believe there is a pressing need for a fundamentally new approach to provide sustained high-performance storage that offers low latency, high bandwidth and extensive capacity as well as enterprise-class data services, reliability, availability and serviceability. In addition, these solutions must enable enterprises to realize capital expenditure and operational cost savings by simplifying their data center environments.
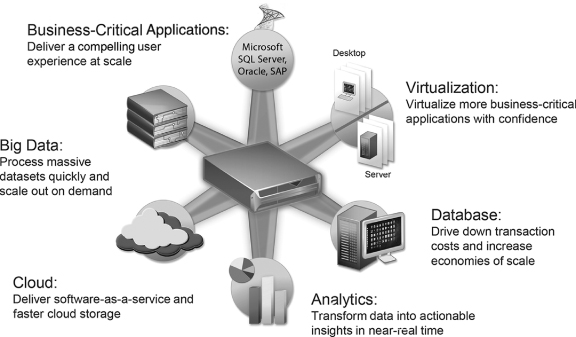
Our Solution
We have pioneered a new class of flash-based storage solutions designed to bring storage performance in line with high-speed applications, servers and networks. Our Flash Storage Platforms and All Flash Arrays are specifically designed at each level of the system architecture starting with raw flash and optimized through the array to leverage the technologies inherent capabilities and meet the sustained high-performance requirements of business-critical applications, virtualized environments and Big Data solutions in enterprise data centers. Our Flash Storage Platforms and All Flash Arrays integrate enterprise-class software and hardware technologies to
7
Table of Contents
address the limitations cost-effectively of both disk-based and SSD-based storage solutions that use off-the-shelf components. Our systems are based on a four-layer hardware architecture that enables sustained performance during periods of peak workload as well as high reliability and availability through our intelligent, fail-in-place and hot-swappable modules, which we refer to as Violin® Intelligent Memory Modules, or VIMMs. Our module design enables the delivery of sustained high performance and uninterrupted data access should a VIMM need to be replaced. Our storage systems are tightly integrated with our Concerto OS 7 software stack. It includes our proprietary hardware-accelerated vRAID data protection technology, continuous data protection, in-line block de-duplication and compression, stretch metro cluster and LUN mirroring as well as our suite of other Enterprise Data Services.
Our Flash Storage Platforms and All Flash Arrays address fundamental challenges in the data center and deliver critical benefits to enterprises, including:
| • | Low latency and fast response times. Our flash-based storage solutions significantly reduce latency and enable fast response times across multiple write and read processes. Our solutions provide lower predictable latency when compared to disk-based solutions as a result of our parallel system and proprietary hardware-accelerated management algorithms. This allows servers to process more data efficiently and quickly, thereby eliminating disruption from peak workloads and accelerating application performance. For example, a single 7000 Series Flash Storage Platform can generate one million IOPS at sustained response times of under a millisecond, performance levels that are orders of magnitude faster than those delivered by comparable disk-based storage solutions. |
| • | Sustained and scalable high performance. Our Flash Storage platforms and All Flash Arrays provide enterprises with the sustained high performance required to run business-critical applications in today’s random I/O workload environments. Our Flash Storage Platforms and All Flash Arrays overcome the Write Cliff issues experienced by SSD-based storage solutions that use off-the-shelf components to increase throughput, reduce latency and provide sustained performance through the use of proprietary hardware-accelerated data protection and management algorithms. Further, we believe our Concerto OS 7 software stack enables our Flash Storage Platforms to scale performance more effectively than disk-based and competing flash-based storage solutions on a sustained basis. For example, a single SSD utilized consistently over an 11-hour period can undergo a 50% drop in performance over the first 45 minutes which can persist throughout the entire period of use, while our 6000 Series All Flash Array used over a similar 11-hour period typically experiences no performance degradation or increase in latency. |
| • | Significantly lower overall total cost of ownership. At the same price as legacy enterprise-class primary storage, our flash-based storage solutions can generate significant savings and provide greater return on investment to enterprises. A single Flash Storage Platform or All Flash Array delivers sufficient IOPS per rack unit, or performance density, to replace multiple racks of disk-based storage solutions. Accordingly, our Flash Storage Platforms and All Flash Arrays can potentially provide improvements of up to 75% less power and 80% less cooling requirements compared to a competitive disk-based storage solution. With the Flash Storage Platform for primary storage, all active data (Tiers 0, 1, and 2) can be consolidated onto a single tier, eliminating the need to manage data and workloads across the tiers. And, with our release of Symphony Management Suite Version 3.0, the entire software functionality can all be controlled in 1, 2 or 3 clicks, with management of the entire storage estate, through a single pane of glass; thereby saving significant storage administrative resources. Finally, with the ability to scale-up to 1.3 petabytes in 24 rack units, the Flash Storage Platform offers significant opportunities for infrastructure consolidation, which reduces both capital and operating expenses necessary to manage data center assets. |
| • | Optimized for real-time application workloads. Our Flash Storage Platforms and All Flash Arrays are specifically designed to deliver the sustainable and scalable performance required by a broad range of real-time application workloads. Our systems are optimized for random I/O workloads generated in virtualized and cloud-based environments and enable the consolidation of thousands of virtual servers to share a common storage infrastructure while significantly increasing host CPU utilization. Additionally, our Flash Storage Platforms and All Flash Arrays are highly interoperable with existing virtualization infrastructures, |
8
Table of Contents
| allowing IT managers to leverage existing data center networking and operating systems in both virtual and cloud-based environments without making changes to management software. Our solutions deliver high-performance that scales to petabytes of data and enables the acceleration of Big Data analytics applications. |
Our Solution is Optimized for the Demanding Requirements of Real-time Application Workloads
Our Strategy
Our objective is to be the leading supplier of purpose-built flash-based storage solutions for primary storage, business-critical applications, virtualized environments and Big Data environments. Key elements of our strategy include:
| • | Continue to pursue technology and product innovation to bring storage capabilities in line with advancements in server and network technologies. We intend to continue to innovate and invest in new products designed to leverage the capabilities of future generations of flash technology to cost-effectively provide greater levels of enterprise-grade data protection and sustained sub-millisecond performance. For example, our Flash Storage Platform tightly integrates our latest hardware design with firmware and software to deliver the highest performance, resiliency and availability at the same cost as legacy enterprise-class primary storage, which we believe re-establishes price leadership in the all-flash-array market. Our Concerto OS7 operating software provides a single operating system with integrated continuous data protection, in-line block de-duplication and compression, stretch metro cluster and LUN mirroring as well as our suite of other Enterprise Data Services. We intend to continue to integrate software hardware and firmware to build leadership end-to-end Flash Storage Platforms that further enhances analytics capabilities and other embedded applications. |
| • | Maintain high levels of customer engagement to drive sales. We intend to drive further penetration and deployment of flash-based storage solutions within our existing base of end-customers globally. Many of our customers initially deploy our solutions on a limited scale, tiered with disk-based storage solutions, which provides us with significant opportunities to sell more of our products as their storage performance and capacity requirements increase. We believe we are well positioned to benefit as our customers expand their investments in high-performance storage offerings to include primary storage workloads, and we |
9
Table of Contents
| intend to continue to maintain our high levels of engagement with our existing customers. In addition, our close relationships and frequent dialogues with our customers contribute to our development activities and enable us to introduce future products that anticipate specific customer needs. |
| • | Continue to grow our relationships with systems vendors and technology partners to accelerate the adoption of our solutions. We have established relationships with a number of industry-leading systems vendors, including Dell and Fujitsu, and intend to leverage their distribution capabilities to expand our global reach to customers in diverse end-markets. We believe that the integration of our solutions into systems vendor platforms validates our technology and provides us with valuable feedback that assists in developing new persistent memory-based storage solutions that address the critical business needs of our end-customers. In addition to our relationship with Toshiba, we also collaborate with other key technology leaders, such as Citrix, Microsoft, SAP, Symantec and VMware, to help design reference architectures and integrate our persistent memory-based storage solutions with their software solutions. We intend to expand our existing relationships while establishing new relationships with leading software, memory and IT hardware vendors and system integrators globally. |
| • | Invest in our global distribution channel to expand our presence. We intend to leverage and expand our relationships with our resellers, distributors and system integrators to penetrate existing and new markets more effectively. Our solutions are already sold in more than 15 countries, but we believe that international markets represent a significant opportunity for further growth. We intend to continue to grow our operations in Europe and Asia and further expand our geographic reach by continuing to invest in our direct sales teams and network of resellers and distributors globally. |
| • | Opportunistically pursue strategic acquisitions and investments. We intend to evaluate complementary businesses and discrete hardware and software technologies to accelerate our go-to-market strategy and extend our technology leadership position. In addition, we may opportunistically make strategic investments in, or pursue acquisitions of, companies with innovative technologies that will broaden the features and capabilities of our solutions, extend our product portfolio, increase our geographic presence or expand our market share. |
Technology
Our flash-based storage solutions integrate enterprise-class hardware and software technologies to cost-effectively address shortcomings found in both HDD-based and SSD-based storage solutions that use off-the-shelf components. Our Flash Storage Platforms’ and All Flash Arrays’ differentiated hardware incorporates a four layer architecture that enables low, predictable latency with sustained high performance under peak workloads, as well as high reliability and availability through intelligent fail-in-place and hot-swappable modules.
Integrated with our hardware architecture is our powerful operating system Concerto OS 7, which is engineered to optimize the management of flash, ensure interoperability with existing data center operating systems and a full suite of enterprise-class data management services.
Violin Symphony is a comprehensive storage management platform that enables centralized administration of all Violin arrays and Flash Storage Platforms, real-time SLA-based health monitoring, customizable dashboards and comprehensive reporting, which can all be controlled in 1, 2 or 3 clicks through a single pane of glass.
Additionally, we have a technology and supply relationship with Toshiba, a leading supplier of flash memory and one of our principal stockholders. Through our relationship, we have developed a fundamental understanding of Toshiba’s flash specifications at the chip level, which we believe allows us to optimize our hardware and software technologies to unlock the inherent performance capabilities of flash. Additionally, our frequent interaction with Toshiba’s engineering teams provides us with insights into Toshiba’s product development roadmap for flash memory. This enables us to engineer our products for future generations of memory technology.
10
Table of Contents
Overcoming Flash Management Challenges
Flash arrays become progressively slower and more error-prone as data is repeatedly written, read and erased. We believe that without the implementation of intelligent software and controller technologies that have been purpose-built to address the technical challenges of flash, the sustainable performance and endurance of flash-based storage solutions can be severely limited.
Our proprietary, hardware-accelerated vRAID technology, which is a key component of our Concerto OS 7 operating system software, solves several key challenges that prevent sustained performance and consistent low latency for enterprise application workloads on raw flash during memory erase cycles. Although a flash memory block can be read very quickly, it takes significantly more time for that block to be written or programmed; in addition, once a flash memory block is full, it cannot be modified without first being erased, which takes much longer than reading or writing. This asymmetry creates problems when the individual blocks that comprise a flash device become full, requiring empty space to be recovered to allow more writes. The recovery process, also known as grooming or garbage collection, requires that currently accessed data be gathered and placed into a free block so that the targeted block can be erased. In flash-based storage solutions that use off-the-shelf SSDs, grooming activities are performed in software using the server processor, reducing computing bandwidth and potentially impacting performance in demanding data center and cloud environments. Such degradation in performance, commonly referred to as the Write Cliff, results in a significant decrease in throughput and large spikes in latency. We believe our system-level approach, hardware-accelerated vRAID implementation and deep software integration expertise enable us to handle the Write Cliff phenomenon more efficiently than flash-based storage solutions that use off-the-shelf components.
Violin’s Flash Fabric Architecture™
Key components of our differentiated four-layer Flash Fabric Architecture include:
| • | Custom-designed distributed flash controllers. Our proprietary distributed flash controllers are tightly integrated with individual raw flash components and provide the foundation for the three higher layers of our system architecture. Active communication with higher system layers enables the controller to intelligently schedule reads, writes and erases to minimize latency and maximize performance of application workloads. |
| • | Intelligent memory modules. Our system architecture aggregates flash components into hot-swappable intelligent memory modules, which we refer to as VIMMs. Each VIMM contains a hardware-accelerated translation layer that provides essential process and correction functions, such as wear-leveling and error/fault management. Our module design enables the delivery of sustained performance and uninterrupted data access in the event of a failure of one or more flash memory chips within a VIMM. In addition, our architecture optimizes the data grooming process by allowing it to be performed intelligently across individual VIMMs without consuming CPU or system resources, unlike other flash-based storage solutions. Our arrays are populated with SLC or MLC VIMMs depending on the performance and capacity requirements of our customers. |
| • | Violin vXM switched memory tightly integrated with vRAID. Our Violin Switched Memory Controller, or vXM, delivers high resiliency and performance scaling across a network of flash memory modules. vXM incorporates each VIMM into a reliable, switched fabric of flash components and provides fault isolation, instantaneous re-routing of data traffic and automated re-striping of data in the event of a complete failure of one or more VIMMs. Our vXM design enables hot-swapping and in-place replacement of VIMMs, flash controllers and other system controller elements for uninterrupted operation. Unlike other memory interconnects, vXM was custom-designed to support large topologies and fault tolerance while enabling multiple memory types. In conjunction with our proprietary vRAID data distribution and protection method, vXM provides the core fabric for delivering reliable data persistence and scalable performance in our Flash Storage Platforms and All Flash Arrays. |
| • | Array controller. Our array controller is a low latency system controller that provides network connectivity to flash capacity through various standards-based storage protocols. The array controller orchestrates |
11
Table of Contents
| memory virtualization, logical capacity management, and load-balancing functions of our Flash Storage Platforms and All Flash Arrays |
Our Flash Fabric Architecture is designed not only to meet the latency and throughput needs of today’s enterprise applications, such as databases, ERP, CRM and virtual servers, but also to scale to address the high-performance demands of cloud applications.
Concerto OS 7 Software Stack
Our Concerto OS 7 software stack is specifically designed to optimize the storage and management of data on flash. Concerto OS 7 is a broad suite of management capabilities that provides data protection, systems management, capacity management and load balancing of data storage on flash memory. The key components of our Concerto OS 7 software stack include:
| • | Data management functionality. Concerto OS 7 integrates Violin’s system-level raw flash management and one of the broadest sets of data management services into a single operating system. Concerto OS 7 delivers simplicity, flexibility and control by allowing control of enterprise-grade data services such as inline, block-level deduplication and compression, synchronous replication, application consistent snapshots, thin provisioning, continuous data protection, consistency groups, clones, backup integration and WAN security and optimization with a simple one, two, or three clicks, application by application or LUN by LUN. |
| • | Hardware accelerated flash optimization and data protection with vRAID. Our proprietary Flash vRAID methods provide hardware-accelerated RAID data protection and a fundamentally more efficient and higher performance solution than existing RAID implementations that are not designed for flash memory. Our vRAID technology manages RAID groups and flash maintenance across the All Flash Array’s vRAID groups, where any vRAID group can access any VIMM. VIMMs are combined in groups of five to comprise one vRAID group. Our vRAID algorithm significantly lowers latency by enabling massively parallel data striping for high throughput and IOPS. Further, vRAID enables fail-in-place support of VIMMs and fast rebuilds that have minimal impact on application performance. |
| • | Integrated clustering for high availability. Our Concerto OS 7 software stack provides high availability clustering while enabling integrated management of multiple memory arrays using Symphony’s web-based management console. |
Products
7300 Flash Storage Platform
Violin’s 7300 Flash Storage Platform combines comprehensive data protection and reduction services with high performance, high resiliency all-flash solutions that are designed to deliver a better customer experience at the cost of existing disk drive-based products. Enterprise and cloud data centers based on Violin Memory Flash Storage Platforms for their primary storage needs can be easier to manage, consume less space and power and transform data center economics.
The Violin 7300 Flash Storage Platform powered by Concerto OS 7 delivers a rich suite of Enterprise Data Services for a comprehensive solution that is designed to deliver the performance and capabilities enterprise-class primary storage requires. The Violin 7300 Flash Storage Platform consists of high performance storage with embedded enterprise-grade data services including business continuity, data protection, data scalability, and data efficiency. Violin’s Enterprise Data Services deliver several benefits:
| • | Data reduction including advanced switchable inline data deduplication and compression for savings up to 10:1 for suitable applications; |
| • | Flexible and powerful business continuity with asynchronous replication; |
12
Table of Contents
| • | Clones and mirroring protect valuable enterprise data; |
| • | Data scaling is simple with pay-as-you-grow capacity licensing for low risk, non-disruptive growth |
| • | Configuration choice as a stand-alone storage array, or as a shelf in the 7700 Flash Storage Platform; and |
| • | Performance that is transformative with capabilities built for demanding enterprise environments enabling high levels of data center consolidation |
7300E Flash Storage Platform
The Violin 7300E Flash Storage Platform provides the same capabilities and features as the 7300 Flash Storage Platform, but at an entry-point as low as 34TB effective. With our industry-leading “Pay-As-You-Grow” capacity licensing model the 7300E can be expanded seamlessly and without any additional hardware upgrades up to 125TB effective in a compact and cost effective 3 rack unit foot print.
7700 Flash Storage Platform
The Violin 7700 Flash Storage Platform is the latest generation of our high-end modular array line up, engineered for maximum performance, scalability and the only all-flash platform in the industry that natively delivers a zero data loss architecture. The Violin 7700 Flash Storage Platform is targeted at large, multi-petabyte and multi-site deployments for customers that look for ultimate scale, availability and flexibility.
Powered by Concerto OS 7, the Violin 7700 Flash Storage Platform provides over 1.3 petabytes of effective capacity or serves 20,000 persistent virtual desktops across six shelves, and adds synchronous replication and stretch cluster capabilities to the menu of data protection services.
The Violin 7700 Flash Storage Platform also provides an excellent investment protection path for existing Violin 6000 series and 7000 series All Flash Array customers, because these All Flash Arrays can now upgrade to a Violin 7700 Flash Storage Platform, and may take advantage of the Concerto OS 7 industry-leading feature set and Symphony 3 revolutionary storage management experience.
6000 Series All Flash Array
Our 6000 Series All Flash Array consists of an integrated highly available, fault-tolerant system. The 6000 Series All Flash Array is available based on either SLC or MLC flash technology. Systems based on SLC can support up to 17 terabytes per array with performance of up to one million IOPS. Systems based on MLC can support up to 70 terabytes per array with performance of up to 750,000 IOPS. We offer different All Flash Array solutions within our 6000 Series All Flash Array, which are designed to meet various customer requirements, including a variety of capacity features, performance criteria and price points.
Windows Flash Array
Violin’s Windows Flash Array (WFA) delivers superior performance and economics to the datacenter so users can do more with existing IT resources. The combination of Violin Memory’s patented Flash Fabric Architecture, Microsoft’s fast SMB Direct protocol, and Microsoft Windows Storage Server 2012 R2 means users can optimize their Windows Server environment to deliver consistent high performance on a simpler architecture with reduced CPU load for every byte, every time. Workloads including OLTP, business intelligence, data warehousing, file servers and virtualized enterprise server (Hyper—V) and desktop applications are ideal for WFA’s performance. Continuous availability with reduced risk to operations is at the center of the WFA design. Multilayered hardware and software resiliency delivers enterprise-class performance and certainty so that mission critical applications and data will remain online 24x7.
13
Table of Contents
Symphony™ System Management Software
Symphony is a system management software solution that enables centralized management of Violin Flash Storage Platforms and All Flash Arrays. Symphony provides a single pane of glass view into our Violin infrastructure and reduces operational complexity with customized dashboards, in-depth performance and health monitoring, automated operations and a consolidated management interface across hundreds of Flash Storage Platforms and All Flash Arrays.
Customer Support
We offer a variety of support programs based on the needs of our customers. Our customer service and support programs involve hardware support, software support and software updates along with other product support including on-site or classroom training, on-site professional services, Internet access to technical content and 24-hour telephone and email access to technical support personnel.
Beyond our standard product and software warranties, we provide three tiers of support offerings. Our entry-level support offering, or our Bronze support offering, provides for technical support at varying response times depending on the customer support issue, delivery of replacements parts and software and firmware maintenance updates. Our Silver support offering includes all of the support in our Bronze support offering with accelerated response times as well as part replacement by a qualified field service technician, standard system installation for initial systems installations and administrative-level training for two attendees at one of our designated sites.
We also sell premium support, which we refer to as our Gold support offering. Our Gold support offering includes all of the items included in our Silver support offering together with faster target response times for technical support matters and replacement parts, including delivery of replacement parts within four hours of a customer’s request.
Our service contracts typically have terms of either one or three years. In some circumstances, we rely on authorized service providers in certain international locations to deliver on-site customer support, system maintenance and part replacement. We work closely with these authorized service providers to train and certify them to provide support for our products. These authorized service providers are typically companies with which we have contracts for providing support for our customers in locations where we do not have support operations. In some instances, these authorized service providers are also our resellers, distributors or systems vendors. We provide a significant amount of customer service support directly to our customers, but the amount of direct customer service support we provide in the future may varies depending on our customer mix, customer location and if we elect to increase the utilization of authorized service providers. We use IBM, our third party hardware maintenance provider, to provide vendor neutral hardware support and repair services to our end-customers.
Sales and Marketing
We sell our products to end-customers either directly or through resellers and distributors, as well as to large systems vendors and system integrators, which in turn incorporate our products into their solutions. We also work with technology partners, such as large software providers, to integrate and market our products with their solutions. We refer to our network of systems vendors, resellers and technology partners as our channel partners.
In our direct sales efforts, our sales team directly engages with customers to understand customer requirements and to assist customers in determining which of our products best satisfies those requirements. For large customers, we establish an account team that manages the relationship with the customer. An account team may include members of our sales staff, service and support professionals and technical resources. Our sales process often involves installing trial deployments of our products, which allows customers to experience the operation of our products and appreciate the value of our products. Generally, our large customers to date have relied on an existing vendor relationship for sourcing their IT equipment. Consequently, we transact most of our sales through resellers even though we maintain a direct selling and support relationship with the customer. By using these
14
Table of Contents
sourcing vendors as our resellers, we eliminate the time that would otherwise be spent on negotiating the terms and conditions directly with the end-customer and potentially decrease the length of the sales cycle. In fiscal 2015, 2014 and 2013, the substantial majority of our revenue resulted from our direct sales team’s engagement with target end-customers.
We also sell to systems vendors and system integrators, which integrate our product into a broader enterprise solution offered by the systems vendors. We then work with our systems vendor and systems integrator partners to co-market our solutions and typically offer service and support to the customer together with our partner. In addition, we establish relationships with other technology providers, such as large software providers. We integrate our storage systems with their software and other technologies to offer a comprehensive solution to customers.
We work closely with our channel partners to promote and sell our products. As of January 31, 2015, we had over 100 channel partners, including Arrow, Commtech Innovative Solutions, Dell, ePlus, Fujitsu, OnX and Mainline Information Systems, covering over 30 countries. We may seek to selectively add new channel partners, particularly in additional regions outside North America to complement or expand our business.
Our marketing efforts are focused on building brand awareness and qualifying sales leads for new and existing customers. A key element of our efforts to grow our business will be increasing awareness of our brand and technological capabilities through advertising and other marketing activities. We employ an international team of marketing professionals and utilize our resellers, distributors, systems vendors and other technology partners for additional marketing efforts. In addition to our marketing employees, we engage outside marketing professionals to augment our marketing capabilities and expand our international marketing reach. Our marketing team is responsible for branding, product marketing and managing our channel marketing programs. We rely on a variety of marketing vehicles, including advertising, trade shows, public relations, industry research, our website and collaborative relationships with technology vendors. We spent $5.5 million, $4.6 million and $3.9 million in fiscal 2015, 2014 and 2013, respectively, on such activities. We have entered into an agreement with the Forty Niners SC Stadium Company LLC pursuant to which we will receive advertising, branding and other sales and marketing benefits through fiscal 2024. For additional information regarding this agreement, see the section entitled “Management Discussion and Analysis-Contractual Obligations.”
We maintain sales office in the United States as well as in China, Japan, Singapore, South Korea and the United Kingdom. As of January 31, 2015, we had 140 sales and marketing employees worldwide.
Customers
Our products are used in a variety of markets, such as consumer, education, financial services, government, healthcare, industrial, Internet, media and entertainment telecom and transportation. In most cases, we have sold our products to large systems vendors or through resellers. When we sell through resellers, we establish direct communications with the end-customers who make the decision to purchase our products. End-customers that have purchased our products either directly from us or through resellers include: AOL, Bank of America, Equinix, ICAP, Pella Corporation, Toshiba, Verizon Wireless and the U.S. Federal government.
Our top five customers accounted for 30%, 35% and 37% of our revenue for fiscal 2015, 2014 and fiscal 2013, respectively. We released our 6000 Series All Flash Arrays in January 2012, which represented approximately 83%, 84% and 78% of our product revenue for fiscal 2015, 2014 and 2013, respectively.
We derived 61%, 62% and 76% of our total revenue from sales to customers located in the United States in fiscal 2015, 2014 and 2013, respectively.
Research and Development
We believe continued investment in research and development is critical to our business. We work closely with our customers to understand their current and future needs and have designed a product development process that integrates our customers’ feedback as a key component.
15
Table of Contents
As of January 31, 2015, we had 129 employees in our research and development organization, including approximately 68 employees in software development. Substantially all of these employees are located at our headquarters in Santa Clara, California. We plan to continue to dedicate significant resources to our research and development efforts. Our research and development expenses were $52.1 million in fiscal 2015, $73.7 million in fiscal 2014 and $57.8 million in fiscal 2013.
Manufacturing
We rely on a single contract manufacturer, Flextronics, to manufacture all of our products, manage our supply chain and, alone or together with us, negotiate component costs. We place orders with our contract manufacturer on a purchase order basis, and in general, we engage our contract manufacturer to manufacture products to meet our forecasted demand or when our inventories drop below certain levels. Our contract manufacturer works closely with us to improve the manufacturability and quality of our products.
We believe that our manufacturing and logistics arrangements allow us to preserve our working capital, reduce manufacturing and logistics costs and optimize fulfillment while maintaining product quality and flexibility. Our operations group oversees the manufacturing process and maintains relationships with our manufacturer and its component suppliers. Historically, we have not experienced significant delays in fulfilling customers’ orders and we maintain a good record of on-time delivery. In addition, we have not experienced any significant manufacturing capacity or material constraints. In the future, we may need to add manufacturing partners to satisfy our production needs.
We source the components included in our products from various suppliers and consign certain components to Flextronics for final assembly. We have not historically had any material issues procuring desired quantities of components necessary for production. We have an agreement with Toshiba, our sole supplier for flash components, although there is no guarantee of supply or fixed pricing in our agreement. We rely on a limited number of suppliers, and in some cases single-source suppliers, for several key components of our products. Neither we nor our contract manufacturer have entered into agreements for the long-term purchase of these components.
Competition
We compete with companies that sell products using various traditional datacenter architectures, including high-performance array-based storage solutions. These may include the traditional data storage providers, including storage array vendors such as Dell, EMC, Hitachi, HP, IBM, NetApp and Pure Storage, which typically sell centralized storage products as well as high-performance storage solutions utilizing SSDs. We also compete with vertically integrated appliance vendors such as Oracle. A number of privately-held and newly public companies are currently attempting to enter our market, some of which may become significant competitors in the future.
We believe that the principal competitive factors in our market are as follows:
| • | sustainable performance, low latency and high bandwidth; |
| • | serviceability, reliability and availability; |
| • | enterprise-class data management services; |
| • | in-line, block deduplication and compression; |
| • | non-disruptive software upgrades; |
| • | flexibility and interoperability with existing data center infrastructure; |
| • | ease of management; |
| • | depth of technology collaboration with leading memory suppliers; |
16
Table of Contents
| • | the ability to provide an integrated hardware and software solution; |
| • | lowering cost per transaction and total cost of ownership, including space and energy efficiency; and |
| • | the ability to be bundled with system and technology vendors as solutions. |
We believe that we compete favorably with our competitors on the basis of these factors. However, the market for data storage products is highly competitive, and we expect competition to intensify in the future. Many of our current competitors have, and some of our potential competitors may have, longer operating histories, greater name recognition, larger customer bases and significantly greater financial, technical, sales, marketing and other resources than we have.
Intellectual Property
We have 35 issued patents and 47 provisional and nonprovisional patent applications in the United States and 56 issued or allowed patents and 60 corresponding patent applications in foreign jurisdictions, including Patent Cooperation Treaty applications, as of January 31, 2015 relating to solid-state storage, solid-state memory, software acceleration, and related technologies. We own a registered trademark for “Violin” in the United States, the European Union (Community Trade Mark Registration), China, India and Japan. As of January 31, 2015, we also owned seven additional U.S. and foreign registered trademarks.
Our core intellectual property relates to our All Flash Arrays. Our hardware and software technologies are not materially dependent on any third-party technology. We protect our intellectual property primarily with patents and by generally requiring our employees and independent contractors with knowledge of our proprietary information to execute nondisclosure and assignment of intellectual property agreements. However, the steps we have taken to protect our technology may not be successful in preventing misuse by unauthorized parties in the future. In addition, if any of our products, patents or patent applications is found to conflict with any patents held by third parties, we could be prevented from selling our products, our patents may be declared invalid or our patent applications may not result in issued patents.
Insurance
From time to time, our products may malfunction or have undetected errors or security vulnerabilities. We have purchased insurance to protect against certain specific claims that are related to the use of our products. Our insurance, subject to the terms and conditions of our policies, provides coverage for network and information security liability, technology errors and omissions liability, and manufacturer’s errors and omissions liability.
Employees
As of January 31, 2015, we had 329 employees, including 140 employees in sales and marketing, 128 employees in research and development, 27 employees in customer support, 26 employees in general and administrative and 8 employees in operations. None of our employees are represented by labor organizations or are a party to any collective bargaining arrangements. We have never had a work stoppage, and we consider our relationship with our employees to be good.
Financial Information about Segments and Geographic Areas
We operate our business in one segment. The segment and geographic information required herein is contained in Note 12 “Segment Information”, in the notes to our consolidated financial statements.
Backlog
Product backlog includes orders confirmed for products generally scheduled to be shipped to customers within two weeks. We believe that our product backlog, as of any particular date, is not necessarily indicative of actual
17
Table of Contents
product revenue for any future period because a substantial portion of our products is sold on the basis of standard purchase orders that are cancellable prior to shipment without penalty. Orders for services for multiple years are billed upfront shortly after their receipt and are included in deferred revenue until such time revenue recognition obligations are satisfied. Timing of revenue recognition for services may vary depending on the contractual service period or when the services are rendered.
Corporate Information
Our website address is www.vmem.com. Our Annual Report on Form 10-K, Quarterly Reports on Form 10-Q, Current Reports on Form 8-K and amendments to reports filed pursuant to Sections 13(a) and 15(d) of the Securities Exchange Act of 1934, as amended, are filed with the U.S. Securities and Exchange Commission (SEC) and such reports and other information filed by the Company with the SEC are available free of charge on our website at investor.vmem.com when such reports are available.
The public may read and copy any materials filed by Violin Memory®, Inc. with the SEC at the SEC’s Public Reference Room at 100 F Street, NE, Room 1580, Washington, DC 20549. The public may obtain information on the operation of the Public Reference Room by calling the SEC at 1-800-SEC-0330. The SEC maintains an Internet site that contains reports, proxy and information statements and other information regarding issuers that file electronically with the SEC at www.sec.gov.
The contents of the websites referred to above are not incorporated into this filing. Further, our references to the URLs for these websites are intended to be inactive textual references only.
| ITEM | 1A. RISK FACTORS |
Investing in our common stock involves a high degree of risk. You should carefully consider the risks and uncertainties described below, together with all of the other information in this Annual Report on Form 10-K, before making a decision to invest in our common stock. The description below includes any material changes to and supersedes the description of the risk factors associated with our business previously disclosed in Item 1A of our Annual Report on Form 10-K for the fiscal year ended January 31, 2014, and our Form 10-Q for the third quarter of fiscal 2015. The risks and uncertainties described below may not be the only ones we face. If any of the risks actually occur, our business, financial condition, operating results and prospects could be materially and adversely affected. In that event, the trading price of our common stock could decline, and you could lose part or all of your investment.
Risks Related to Our Business
Our limited operating history makes it difficult to evaluate our current business and future prospects, and may increase the risk of your investment.
We were incorporated in March 2005 and recapitalized in 2009. We introduced our All Flash Arrays in May 2010. The majority of our revenue growth has occurred since the first quarter of our fiscal 2012. Our limited operating history makes it difficult for you to evaluate our business and our future prospects, as well as for us to plan for and model future growth. For example, our revenue result for our fourth quarter of fiscal 2015 was below the guidance we provided the previous quarter. In addition, we have limited experience from which to formulate an accurate expectation of our product lifecycles, which could make it more difficult for us to plan our product development timelines to meet customer and market demands. We have encountered and will continue to encounter risks and difficulties frequently experienced by growing companies in rapidly changing industries, including the risks described in this annual report. If we do not address these risks successfully, our business and operating results would be adversely affected.
We have a history of losses and our liquidity position imposes risk to our operations.
We have incurred recurring operating losses and negative cash flows from operating activities since inception through January 31, 2015, and we have an accumulated deficit of $461.5 million as of January 31, 2015. Through
18
Table of Contents
January 31, 2015, we have not generated any cash from operations and have relied primarily on the proceeds from equity offerings, debt financing and credit facilities to fund our operations. Our ability to continue as a going concern is dependent upon our achieving profitability or obtaining the necessary financing to fund our operations.
We have expended, and will continue to expend, substantial funds to pursue engineering, research and development projects, enhance sales and marketing efforts and otherwise operate our business. We may not be profitable on a quarterly or annual basis in the future. Our existing cash balance and any cash flow from operating activities may not be sufficient to satisfy current obligations or finance our operations. Our existing lines of credit may not be available to us, when needed in the future. If we are not able to finance our expected future operations from existing cash, future cash flows and new capital, we may need to curtail our operations. We may consider various alternatives to remedy any future shortfall in capital. We may deem it necessary to raise capital through equity markets, debt markets or other financing arrangements that may be available. Should we be unable to raise sufficient capital in a timely manner, our operations could be negatively affected or it may create doubt about our ability to continue as a going concern.
We may elect to raise or might require additional capital to support business growth, and this capital might not be available on acceptable terms, or at all.
We intend to continue to make investments to support our business and may seek or be required to seek additional funds to respond to business challenges, including the need to develop new products or enhance our existing products, enhance our operating infrastructure and acquire complementary businesses and technologies. Accordingly, we may need to engage in equity or debt financing to secure additional funds. We recently raised additional funds through the issuance of convertible debt securities and our stockholders could suffer significant dilution. If we issue additional equity or convertible debt securities, our stockholders could suffer additional significant dilution, and any new equity securities we issue could have rights, preferences and privileges superior to those of holders of our common stock.
For example, if we issue preferred stock to raise capital, the holders of preferred stock may have liquidation rights senior to our holders of common stock, which would allow them to receive proceeds from a sale of our Company at a preferred rate over our common holders. Any additional debt financing could involve restrictive covenants, which may restrict our flexibility in operating our business and make it more difficult for us to obtain additional capital and to pursue business opportunities, including potential acquisitions.
We may not be able to obtain additional financing on terms favorable to us, if at all. If we are unable to obtain adequate financing on terms satisfactory to us, when we require it, our ability to continue to support our business growth and to respond to business challenges could be significantly limited, and our business, operating results, financial condition and prospects could be adversely affected.
We have incurred significant net losses and may not achieve or maintain profitability.
We have incurred a net loss in each quarter since our inception. As of January 31, 2015, we had an accumulated deficit of $461.5 million. We expect to incur losses in future periods as we continue to increase our expenses in order to position us to grow our business. If our revenue does not increase substantially, we will not be profitable. Even if we achieve profitability in a particular period, we may not be able to sustain it.
Our historical revenue growth rate is not likely to recur and is not indicative of our future performance.
Our revenue and our revenue growth rates achieved in prior periods may not be indicative of our future revenue or revenue growth rates. While we have experienced significant revenue growth rates in the years ended January 31, 2014 and 2013, we did not achieve a similar revenue growth rate for the year ended January 31, 2015. For example, our revenue for the first quarter of fiscal 2015 declined by approximately $9.9 million as
19
Table of Contents
compared to the fourth quarter of fiscal 2014. Our revenue for any prior quarterly or annual periods may not be indicative of our future revenue or revenue growth. If our revenue does not grow, it may be difficult to achieve and maintain profitability.
Our overall business has experienced rapid growth in recent periods, and we may not be able to sustain or manage any future growth effectively.
We have significantly expanded our overall business, customer base and operations, and we anticipate that this growth will continue. Our future operating results depend to a large extent on our ability to successfully manage our anticipated expansion and growth.
To manage our growth successfully, we believe we must effectively, among other things:
| • | maintain and extend our leadership in the development of the all flash array market; |
| • | compete effectively in the primary storage market with our new Flash Storage Platform, including our Concerto OS 7 operating system software; |
| • | maintain our direct sales force as well as grow and expand our relationships with key customers, systems vendors and technology partners; |
| • | expand our channel relationships; |
| • | forecast and control expenses; |
| • | recruit, hire, train and manage additional research and development, and sales and marketing personnel; |
| • | expand our customer support capabilities on a global basis; |
| • | enhance and expand our distribution and supply chain infrastructure; |
| • | manage inventory levels, including trial deployments of systems; |
| • | enhance and expand our international operations; and |
| • | implement and improve our administrative, financial and operational systems, procedures and controls. |
We expect that our future growth will continue to place a significant strain on our managerial, administrative, operational, financial and other resources. We will incur costs to support this anticipated growth prior to realizing any benefits, and the return on these investments may be lower, or may develop more slowly, than we expect or may be nonexistent. If we are unable to manage our growth effectively, we may not be able to take advantage of market opportunities or develop new products or enhancements to existing products and we may fail to satisfy end-customers’ requirements, maintain product quality, execute on our business plan or respond to competitive pressures, any of which would adversely affect our business and operating results.
We compete with large data storage providers and expect competition to intensify in the future from established companies and new market entrants.
The market for primary data storage products is highly competitive, and we expect competition to intensify in the future. Our products compete with various high-performance array-based storage approaches employed by next-generation datacenters. Competitors include incumbent primary storage vendors, such as EMC, HP, Hitachi, IBM and NetApp, which typically sell centralized storage products as well as high-performance storage approaches utilizing solid state drives, or SSDs, as well as vertically integrated appliance vendors such as Oracle. In addition, a number of privately-held and newly public companies are attempting to enter our market, some of which may become significant competitors in the future.
Many of our current competitors have, and some of our potential competitors could have, longer operating histories, greater name recognition, larger customer bases and significantly greater financial, technical, sales,
20
Table of Contents
marketing and other resources than we have. Potential customers may prefer to purchase from their existing suppliers rather than a new supplier regardless of product performance or features. New start-up companies continue to innovate and may invent similar or superior products and technologies that may compete with our products and technology. Some of our competitors have made acquisitions of businesses that may allow them to offer more directly competitive and comprehensive solutions than they had previously offered. In addition, some of our competitors, including our systems vendor customers, may develop competing technologies and sell at zero or negative margins, through product bundling, closed technology platforms or otherwise, to gain business. Our current and potential competitors may also establish cooperative relationships among themselves or with third parties. In addition, consolidations among systems vendors, which can occur unexpectedly, can significantly impact our sales efforts to systems vendors. As a result, we cannot assure you that our products will compete favorably, and any failure to do so could seriously harm our business, operating results and financial condition. Due to the class action litigation and management turnover, our competitors may attempt to use this information against us, which could delay or prevent future business.
Competitive factors could make it more difficult for us to sell our products, resulting in increased pricing pressure, reduced gross margins, increased sales and marketing expenses, longer customer sales cycles and failure to increase, or the loss of, market share, any of which could seriously harm our business, operating results and financial condition. Any failure to meet and address competitive challenges could seriously harm our business and operating results.
If our new Flash Storage Platform products are not successful, our business could be materially and adversely affected.
Our ability to compete effectively in the primary storage market is dependent upon the success of our new Flash Storage Platform 7300, 7300E and 7700 products. If our new Flash Storage Platform products are not successful, it will be difficult for us to compete in the primary storage market with our current products at margins that enable us to achieve and maintain profitability. We could face increased pricing pressure, reduced gross margins, increased sales and marketing expenses, longer customer sales cycles and the loss of market share. In addition, if we have to compete in the primary storage market with our 6000 Series products, we could be forced to modify substantially our cost structure and business strategy, which could have a material adverse effect on our business and operating results.
We expect large and concentrated purchases by a limited number of customers to continue to represent a majority of our product revenue, and any loss of, or delay or reduction in purchases by a small number of customers could adversely affect our operating results.
Historically, large purchases by a relatively limited number of customers have accounted for a majority of our product revenue, and the composition of the group of our largest customers has changed from period to period. These concentrated purchases are made on a purchase order basis rather than pursuant to long-term contracts. Total revenue from our five largest customers for the years ended January 31, 2015, 2014 and 2013 were 30%, 35% and 37%, respectively.
As a consequence of our limited number of customers, the concentrated nature of their purchases and the timing of purchases from these large customers, our quarterly revenue and operating results may fluctuate from quarter to quarter and are difficult to estimate. Any acceleration or delay in anticipated product purchases or the acceptance of shipped products by our larger customers could materially impact our revenue and operating results in any quarterly period. For example, in the fourth quarter of fiscal 2015, a couple large customers decided to evaluate our new Flash Storage Platform instead of continuing with their purchases of our 6000 Series products. Consequently, our revenue for the period was below our guidance and declined slightly as compared to the third quarter of fiscal 2015. We cannot provide any assurance that we will be able to offset the discontinuation or reduction of concentrated purchases by our larger customers with purchases by other new or existing customers. We expect that sales of our products to a limited number of customers will continue to
21
Table of Contents
contribute materially to our revenue for the foreseeable future. The loss of, or a significant delay or reduction in purchases by, a small number of customers could materially harm our business and operating results.
Toshiba is our sole supplier for flash memory. Any disruption in our relationship with Toshiba could have a material adverse effect on our business.
The most significant component that we use in our products is flash memory. Although we have an agreement with Toshiba, the sole supplier of our flash memory components, we may experience a shortage of flash memory if Toshiba is not able to meet our demand. Toshiba may not be able to meet our demand for a variety of reasons, including our inability to forecast our future needs accurately to Toshiba or a shortfall in production by Toshiba for reasons unrelated to us. In addition, our agreement with Toshiba does not provide us with fixed pricing for flash memory, which subjects us to fluctuations in pricing. Our agreement with Toshiba also requires us to purchase 70% of our annual requirement for flash memory from Toshiba, subject to specified conditions, and to design our products to be substantially compatible with Toshiba flash memory. If Toshiba were to increase the price of its flash memory, we may not be able to implement a corresponding increase in the price of our products and our revenue and gross margins would be materially adversely affected. In addition, if the flash memory we purchase from Toshiba is not competitive with the performance of other flash memory in the market, the competitiveness of our products may be adversely affected and our business could suffer. For example, the introduction of three dimensional, or 3D, flash memory allows for improved economics. We will need to find supply in a timely manner in order to develop future generations of product. We do not currently have any agreement in place with other flash memory providers in the event that Toshiba cannot meet our demand or we are unable to renew our contract with Toshiba. If we cannot obtain sufficient supply of flash memory at an acceptable price to us, our ability to respond to our customer demand and grow our business could be significantly harmed.
Our agreements with Toshiba, our sole supplier of flash memory, may not be the result of arm’s-length negotiations because Toshiba is also one of our principal stockholders.
We have entered into agreements with Toshiba, one of our principal stockholders, relating to our purchase of flash memory from Toshiba, and we may enter into additional agreements with Toshiba and its affiliates. Although we believe that the terms in our agreements, as a whole, are no less favorable to us than could be obtained through arm’s-length dealing, these agreements include specific terms and conditions that may be different from terms contained in comparable agreements with unaffiliated third parties. In addition, because Toshiba is also one of our principal stockholders and because we have a significant relationship with Toshiba, it may be difficult or impossible for us to enforce claims that we may have against it. Although we have a significant relationship with Toshiba, we may not be able to successfully negotiate and execute future agreements, or we may not do so on terms that are beneficial to us or on terms that we currently anticipate.
Our products are highly technical and may contain undetected defects, which could cause data unavailability, loss or corruption that might, in turn, result in liability to our customers and harm to our reputation and business.
Our All Flash Array products, including our new Flash Storage Platform and Concerto OS 7 operating system software, and related software are highly technical and complex and are often used to store information critical to our end-customers’ business operations. Our products may contain undetected errors, defects or security vulnerabilities that could result in data unavailability, loss or corruption or other harm to our end-customers. Some errors in our products may only be discovered after they have been installed and used by end-customers. Any errors, defects or security vulnerabilities discovered in our products after commercial release, or any perception of the same in the marketplace, could result in a loss of revenue or delay in revenue recognition, injury to our reputation, a loss of end-customers or increased service and warranty costs, any of which could adversely affect our business. In addition, we could face claims for product liability, tort or breach of warranty. Many of our contracts with customers contain provisions relating to warranty disclaimers and liability
22
Table of Contents
limitations, which may be difficult to enforce. Defending a lawsuit, regardless of its merit, would be costly and might divert management’s attention and adversely affect the market’s perception of us and our products. In addition, our business liability insurance coverage could prove inadequate or could be subject to coverage exclusions or deductibles with respect to a claim and future coverage may be unavailable on acceptable terms or at all. These product-related issues could result in claims against us and our business could be adversely impacted.
Servicing our debt requires a significant amount of cash, and we may not have sufficient cash flow from our business to pay our substantial debt.
Our ability to make scheduled payments of the principal amount of, to pay interest on or to refinance our indebtedness, including our convertible senior notes, depends upon our future performance, which is subject to economic, financial, competitive and other factors beyond our control. Our business may not generate cash flow from operations in the future sufficient to service our debt and other fixed charges, fund working capital needs, and make necessary capital expenditures. If we are unable to generate such cash flow, we may be required to adopt one or more alternatives, such as selling assets, restructuring debt or obtaining additional equity capital on terms that may be onerous or highly dilutive. Our ability to refinance our indebtedness will depend on the capital markets and our financial condition at the time. We may not be able to engage in any of these activities or engage in these activities on desirable terms, which could result in a default on our debt obligations.
We may not have the ability to raise the funds necessary to pay interest on our convertible senior notes, to repurchase the notes upon a fundamental change or to settle conversions of the notes in cash.
Our convertible senior notes bear interest semi-annually at a rate of 4.25% per year. In addition, in certain circumstances, we are obligated to pay additional interest or special interest on the notes. If a “fundamental change” occurs, holders of the notes may require us to repurchase all or a portion of their notes in cash. Furthermore, if we obtain stockholder approval, upon conversion of any notes, unless we elect to deliver solely shares of our common stock to settle the conversion (excluding cash in lieu of delivering fractional shares of our common stock), we must make cash payments in respect of the notes. Any of the cash payments described above could be significant, and we may not have enough available cash or be able to obtain financing so that we can make such payments when due or to repay the indebtedness under our then outstanding credit facilities in order to be permitted to make such cash payments. Our existing credit agreement prohibits us from making any optional prepayments with respect to the notes, which may potentially restrict our ability to make any cash payments upon conversion, and the events that would trigger a fundamental change would be default under the credit agreement, which could prohibit us from repurchasing the notes. In addition, our ability to repurchase the notes or to pay cash upon conversions of the notes may be limited by law, by regulatory authority or by agreements governing our future indebtedness. If we fail to pay interest on the notes, repurchase the notes when required or deliver the consideration due upon conversion, we will be in default under the indenture. A default under the indenture would be a default under our credit agreement and could lead also to a default under the agreements governing our future indebtedness. If the repayment of the related indebtedness were to be accelerated after any applicable grace periods, we may not have sufficient funds to repay the indebtedness and repurchase the notes or make cash payments upon conversion of the notes. Our inability to do so could result in a default on our debt obligations.
Our operating results may fluctuate significantly, which could make our future results difficult to predict and could cause our operating results to fall below expectations.
Our operating results may fluctuate due to a variety of factors, many of which are outside of our control. As a result, comparing our operating results on a period-to-period basis may not be meaningful. You should not rely on our past results as an indication of our future performance. If our revenue or operating results fall below expectations, the price of our common stock would likely decline.
23
Table of Contents
Factors that are difficult to predict and that could cause our operating results to fluctuate include:
| • | the timing and magnitude of orders, shipments and acceptance of our products in any quarter, including orders from large customers; |
| • | a postponement or cancellation of significant orders; |
| • | cost and timing of trial deployments; |
| • | product mix; |
| • | mix of sales between end-customers and channel partners; |
| • | availability of, and our ability to control the costs of, the components we use in our hardware products, specifically flash memory; |
| • | reductions in customers’ budgets for information technology purchases; |
| • | additional restrictions on our ability to export our products; |
| • | delays in end-customers’ purchasing cycles or deferments of end-customers’ product purchases in anticipation of new products or product enhancements from us or our competitors; |
| • | any change in the competitive dynamics of our markets, including actions by large storage providers who may discount product prices or bundle storage products to provide lower overall systems costs; |
| • | fluctuations in demand and prices for our products; |
| • | changes in standards in the data storage industry; |
| • | our ability to develop, introduce and ship in a timely manner new products and product enhancements that meet end-customer requirements; |
| • | our ability to control costs, including our operating expenses; and |
| • | future accounting pronouncements and changes in accounting policies. |
The occurrence of any one of these risks could negatively affect our operating results in any particular quarter and cause the price of our common stock to decline.
Our sales cycles can be long and unpredictable, particularly with respect to large orders and establishing systems vendor and systems integrator relationships that require considerable time and expense. As a result, it can be difficult for us to predict when, if ever, a particular customer will choose to purchase our products, which may cause our operating results to fluctuate significantly.
Our sales efforts include convincing end-customers of our products’ reliability and interoperability with their existing network infrastructure. Because our products are based on emerging flash technology, we often must invest time in educating our potential end-customers of the benefits of flash technology over legacy technologies, such as HDDs. Customers often undertake a trial deployment to evaluate and test our products which can result in a lengthy sales cycle. We spend substantial time and resources on our sales efforts without any assurance that our efforts will produce any sales. In addition, product purchases are frequently subject to budget constraints, multiple approvals and unplanned administrative, processing and other delays. Additionally, a significant portion of our sales personnel have been with us for less than a year, and we continue to increase the number of our sales personnel, which could further extend the sales cycle as these new personnel typically require a significant amount of training and experience until they are productive. These factors, among others, result in long and unpredictable sales cycles, particularly with respect to large orders and the establishment of system vendor and systems integrator relationships. Further, we may invest significant management attention and expense in building relationships that do not ultimately result in successful sales.
24
Table of Contents
We also sell to systems vendors and systems integrators that incorporate our products into their solutions, which can require an extended evaluation and testing process before our product is approved for inclusion in one of their solutions. We also may be required to customize our product to interoperate with a systems vendor’s solution, which could further lengthen the sales cycle for sales to systems vendors.
The length of our sales cycle makes us susceptible to the risk of delays or termination of orders if end-customers decide to delay or withdraw funding for datacenter projects, which could occur for various reasons, including global economic cycles and capital market fluctuations. In addition, as a result of the lengthy and uncertain sales cycles of our products, it is difficult for us to predict when customers may purchase products from us and as a result, our operating results may vary significantly and be adversely affected.
Ineffective management of product transitions or our inventory levels, including inventory used in trial deployments, could adversely affect our operating results.
If we are unable to properly forecast, monitor, control and manage our inventory and maintain appropriate inventory levels and mix of products to support our customers’ needs, we may incur increased and unexpected costs. Sales of our products are generally made through individual purchase orders and some of our customers place large orders with short lead times, which make it difficult to predict demand for our products and the level of inventory that we need to maintain in order to satisfy customer demand. If we build our inventory in anticipation of future demand that does not materialize, or if a customer cancels or postpones outstanding orders, we could experience an unanticipated increase in the inventory level of our finished products which would cause us to incur manufacturing costs in a period that are not offset by sales of finished products. In addition, our inability to manage inventory levels in connection with future product transitions may harm our operating results. For example, in the fourth quarter of fiscal 2015, we incurred a provision for excess and obsolete inventory of $17.6 million and an increase in accrued liabilities of $2.3 million for non-cancellable purchase orders when we transitioned from our 6000 Series All Flash Array to our new Flash Storage Platform. In addition, in the fourth quarter of fiscal 2014, we incurred a provision for excess and obsolete inventory related to our PCIe inventory and non-cancellable purchase commitments of $9.2 million. Alternatively, we could carry insufficient inventory, and we may not be able to satisfy demand, which could have a material adverse effect on our customer relationships or cause us to lose potential sales.
We typically provide trial deployments to potential customers and maintain the classification of these products in the field as inventory. We may not be able to convert these trial deployments into sales, which could lead to higher levels of inventory, lost or damaged units, risk of obsolescence and excessive wear making them unsaleable or saleable only at low margin or at a loss. Although our sales contracts typically provide that we are not obligated to accept product returns, except for warranty claims, for purchased products, in limited circumstances, we may determine that it is in our best interest to accept returns or exchange products in order to maintain good relationships with customers. Product returns or exchanges would increase our inventory and reduce our revenue. If we are unable to sell our inventory in a timely manner, we could incur additional carrying costs, reduced inventory turns and potential write-downs due to obsolescence, particularly in periods of product transition.
The occurrence of any of these risks related to inventory could adversely affect our business, operating results and financial condition.
Our gross profit may vary and such variation may make it more difficult to forecast our earnings.
Our gross profit has been and may continue to be affected by a variety of factors, including:
| • | demand for our products and related services; |
| • | discount levels and price competition; |
| • | average order size and customer mix; |
25
Table of Contents
| • | product mix; |
| • | the provision for excess or obsolete inventory; |
| • | the cost and availability of components; |
| • | level of costs for providing customer support; |
| • | the mix of services or software as a percentage of revenue; |
| • | new product introductions and enhancements; and |
| • | geographic sales mix. |
Any of these factors could adversely affect our gross profit and operating results compared to prior periods or future expectations from us or analysts who have issued research reports about us.
Many of our established competitors have long-standing relationships with key decision makers at many of our current and prospective customers. As a result, we may not be able to compete effectively and maintain or increase our market share.
Many of our competitors benefit from established brand awareness and long-standing relationships with key decision makers at many of our current and prospective customers. We expect that our competitors will seek to leverage these existing relationships to discourage customers from purchasing our products. In particular, when competing against us, we expect our competitors to emphasize the importance of data storage retention, the high cost of data storage failure and the perceived risks of relying on products from a company with a shorter operating history and less predictable operating results. Additionally, most of our prospective customers have existing storage systems manufactured by our competitors. This gives an incumbent competitor an advantage in retaining the customer because the incumbent competitor already understands the customer’s network infrastructure, user demands and information technology needs. These factors may cause our current or prospective customers to be unwilling to purchase our products and instead to purchase the products of our better-known and more established competitors. In the event that we are unable to successfully sell our products to new customers, persuade customers of our competitors to purchase our products instead, or prevent our competitors from persuading our customers to purchase our competitors’ products, we may not be able to maintain or increase our market share and our operating results would be adversely affected.
The use of flash memory in storage products is rapidly evolving, which makes it difficult to forecast customer adoption rates and demand for our products.
The market for flash memory in storage products is rapidly evolving. Accordingly, our future financial performance will depend in large part on growth in this market and on our ability to adapt to trends in this market as they develop and evolve. Sales of our products are dependent in large part upon our ability to penetrate the primary storage market in addition to markets that require high-performance data storage solutions, such as business-critical applications, virtualization and Big Data. It is difficult to predict with any precision customer adoption rates, end-customer demand for our products or the future growth rate and size of our market. The rapidly evolving nature of the technology in the data storage products market, as well as other factors that are beyond our control, reduce our ability to accurately predict our future performance. Our products may never gain broad adoption, and changes or advances in technologies could adversely affect the demand for our products. Further, although flash-based data storage products have a number of advantages compared to other data storage alternatives, flash-based storage devices have certain disadvantages as well, including increased utilization of host system resources than traditional storage, and in some circumstances may require end-customers to modify or replace network systems originally installed for traditional storage media. A reduction in demand for flash-based data storage caused by lack of end-customer acceptance, technological challenges, competing technologies and products or otherwise would result in a lower revenue growth rate or decreased revenue, either of which would negatively impact our business and operating results.
26
Table of Contents
We have derived substantially all of our revenue from a single line of products, and a decline in demand for these products would cause our revenue to grow more slowly or to decline.
Our All Flash Array product line has accounted for substantially all of our revenue, and the Flash Storage Platform is expected to comprise a significant portion of our revenue for the foreseeable future. As a result, our revenue could be reduced by:
| • | the failure of our All Flash Arrays and Flash Storage Platform products to achieve broad market acceptance; |
| • | any decline or fluctuation in demand for our All Flash Array or Flash Storage Platform products, whether as a result of product obsolescence, technological change, customer budgetary constraints or other factors; |
| • | any constraint on our ability to meet demand for our products, whether as a result of component supply constraint or the inability or unwillingness of our contract manufacturer to timely deliver products; |
| • | pricing pressures; |
| • | the introduction of products and technologies by competitors that serve as a replacement or substitute for, or represent an improvement over, these products; |
| • | an order resulting from a judgment of patent infringement or otherwise, that restricts our ability to market and sell our products; and |
| • | our inability to release enhanced versions of our products, including any related software or future generations of products, on a timely basis. |
If we fail to develop and introduce new or enhanced products on a timely basis, our ability to attract and retain customers could be impaired and our competitive position would be harmed.
We operate in a dynamic environment characterized by rapidly changing technologies and industry standards and technological obsolescence. To compete successfully, we must design, develop, market and sell new or enhanced products that provide increasingly higher levels of performance, capacity and reliability and meet the cost expectations of our customers. The introduction of new products by our competitors, the market acceptance of products based on new or alternative technologies, or the emergence of new industry standards could render our existing or future products obsolete. Our failure to anticipate or timely develop new or enhanced products or technologies in response to technological shifts could result in decreased revenue and harm our business. If we fail to introduce new or enhanced products that meet the needs of our customers or penetrate new markets in a timely fashion, we will lose market share and our operating results will be adversely affected.
In order to maintain or increase our gross margins, we need to continue to create valuable software solutions to be integrated with our products. Any new feature or application that we develop or acquire may not be introduced in a timely or cost-effective manner and may not achieve the broad market acceptance necessary to increase our overall gross margins. If we are unable to successfully develop or acquire, and then market and sell future generations of our products, our ability to increase our revenue and gross margin will be adversely affected.
Our products must interoperate with network interfaces, such as operating systems, software applications and hardware developed by others, and if we are unable to ensure that our products interoperate with such software and hardware, we may fail to increase, or we may lose, market share and we may experience reduced demand for our products.
Our storage products comprise only a part of a datacenter’s infrastructure. Accordingly, our products must interoperate with our end-customers’ existing infrastructure, specifically their networks, servers, software and operating systems, which are typically manufactured by a wide variety of systems vendors. When new or updated versions of these software operating systems or applications are introduced, we must sometimes develop updated versions of our software so that our products interoperate properly. We may not accomplish these development
27
Table of Contents
efforts quickly, cost-effectively or at all. These development efforts require capital investment and the devotion of engineering resources. If we fail to maintain compatibility with these applications, our end-customers may not be able to adequately utilize the data stored on our products, and we may, among other consequences, fail to increase, or we may lose, market share and experience reduced demand for our products, which would adversely affect our business, operating results and financial condition.
We rely on our key technical, sales and management personnel to grow our business, and the loss of one or more key employees or the inability to attract and retain qualified personnel could harm our business.
Our success and future growth depends to a significant degree on the skills and continued services of our key technical, sales and management personnel. In particular, we are highly dependent on the services of our Chief Executive Officer, Kevin A. DeNuccio. We also are very dependent on the services of our senior vice presidents. We could experience difficulty in integrating and retaining members of our senior management team. We do not have “key person” life insurance policies that cover any of our officers or other key employees. The loss of the services of any of our key employees could disrupt our operations, delay the development and introduction of our products, and negatively impact our business, prospects and operating results.
In the longer term, we expect to hire personnel in all areas of our business, particularly in sales and research and development. Competition for these types of personnel is intense. There can be no assurance that we will be able to successfully attract or retain qualified personnel. Our inability to attract and retain the necessary personnel could adversely affect our business, operating results and financial condition.
We intend to continue focusing on revenue growth and increasing market penetration at the expense of profitability by investing in our operations.
We intend to make investments in our marketing services and sales organization and to continue investing in research and development at the expense of near-term profitability. We believe our decision to continue investing in these operations will be critical to our revenue growth and our increased market penetration. Accordingly, we anticipate that our investments will result in continued net losses for at least the next twelve months. However, we cannot assure you that this strategy will result in revenue growth. Even if we achieve significant revenue growth, we may continue to experience net losses and operating losses similar to those we have incurred historically. Additionally, at least as long as we pursue this strategy, we may not achieve profitability or, if achieved, we may not be able to sustain profitability.
We are exposed to the credit risk of some of our customers and to credit exposure in weakened markets, which could result in material losses.
Most of our sales are on an open credit basis, which subjects us to the risk of loss resulting in nonpayment or nonperformance by our customers. Although we have programs in place that are designed to monitor and mitigate our customers’ credit risks, we cannot assure you these programs will be effective in reducing our credit risks, especially as we expand our business internationally. If we are unable to adequately control these risks, our business, operating results and financial condition could be harmed.
Our research and development efforts may not produce successful products that result in significant revenue in the near future, if at all.
Developing our products and related enhancements is expensive. Our investments in research and development may not result in marketable products or may result in products that are more expensive than anticipated, take longer to generate revenue or generate less revenue, if at all, than we anticipate. Our future plans include significant investments in research and development and related product opportunities. We believe that we must continue to dedicate a significant amount of resources to our research and development efforts to maintain our competitive position. However, we may not receive significant revenue from these investments in the near future, if at all, which could adversely affect our business and operating results.
28
Table of Contents
Developments or improvements in storage system technologies may materially adversely affect the demand for our products.
Significant developments in data storage systems, such as advances in solid state storage drives or improvements in non-volatile memory, may materially and adversely affect our business and prospects in ways we do not currently anticipate. For example, improvements in existing data storage technologies, such as a significant increase in the speed of traditional interfaces for transferring data between storage and a server or the speed of traditional embedded controllers, could emerge as preferred alternatives to our products, especially if they are sold at lower prices. This could be the case even if such advances do not deliver all of the benefits of our products. Any failure on our part to demonstrate the benefits of our products would result in lost sales. In addition, any failure by us to develop new or enhanced technologies or processes, or to react to changes or advances in existing technologies, including the development of the new 3D flash memory technology, could materially delay our development and introduction of new products, which could result in the loss of competitiveness of our products, decreased revenue and a loss of market share to competitors.
The rate at which we grow our business is impacted by systems vendor customers incorporating our products into their vertically integrated appliances and data storage systems and these systems vendors’ sales efforts. Any failure to grow our systems vendor sales and maintain relationships with systems vendors or systems integrators could adversely affect our business, operating results and financial condition.
Historically, sales of products to systems vendors have represented a significant portion of our revenue. In some cases, our products must be designed into the systems vendor’s products. If that fails to occur for a given product line of a systems vendor, we would likely be unable to sell our products to that systems vendor for that product line during the life cycle of that product. Even if a systems vendor integrates one or more of our products into its solutions, we cannot assure that its product will be commercially successful, and as a result, our sales volumes may be less than anticipated. Our systems vendor customers are typically not obligated to purchase our products and can choose at any time to stop using our products if their own systems are not commercially successful or if they decide to pursue other strategies or for any other reason, including the incorporation or development of competing products by these systems vendors.
Moreover, our systems vendor and systems integrator customers may not devote sufficient attention and resources to selling our products. We may not be able to develop or maintain relationships with systems vendor and systems integrator customers for a number of reasons, including because of their relationships with our competitors or prospective competitors. In addition, there may be competing incentives that may not motivate their internal sales forces to promote our products. If we are unable to grow our sales to systems vendors, if our system vendor customers’ systems incorporating our products are not commercially successful, if our products are not designed into a given systems vendor product cycle or into a systems integrator’s solution or if our systems vendor customers significantly reduce, cancel or delay their orders with us, our revenue would suffer and our business, operating results and financial condition could be materially adversely affected.
Our ability to sell our products is highly dependent on the quality of our customer support and services, and any failure to offer high-quality support and services would harm our business, operating results and financial condition.
Once our products are deployed, our customers depend on our support organization to resolve any issues relating to our products. Our products provide business-critical services to our customers and a high level of customer support is necessary to maintain our customer relationships. We rely on authorized service providers in certain locations in the United States to install our products and deliver initial levels of on-site customer support and services. While we attempt to carefully identify, train and certify our authorized service providers, we may not be successful in ensuring the proper delivery and installation of our products or the quality or responsiveness of the support and services being provided.
As we grow our business, our ability to provide effective customer support and services will be largely dependent on our ability to attract, train and retain qualified direct customer service personnel and our ability to maintain
29
Table of Contents
and grow our network of authorized service providers. Additionally, as we continue to expand our operations internationally, our support organization will face additional challenges, including those associated with delivering support, training and documentation in languages other than English, as well as identifying, training and certifying international authorized service providers to support products we may deploy in geographical areas in which we may not currently have authorized service providers.
Any failure to maintain high-quality customer support and services, or a market perception that we do not maintain high-quality customer support and services, could harm our reputation, adversely affect our ability to sell our products to existing and prospective customers, and could harm our business, operating results and financial condition.
If our security measures are breached or unauthorized access to our data is otherwise obtained, our solutions may be perceived as not being secure, customers may reduce the use of or stop using our solutions and we may incur significant liabilities.
Security breaches could result in the loss of information, litigation, indemnity obligations and other liability. While we have security measures in place, our systems and networks are subject to ongoing threats and therefore these security measures may be breached as a result of third-party action, including cyber-attacks or other intentional misconduct by computer hackers, employee error, malfeasance or otherwise. This could result in one or more third parties obtaining unauthorized access to our data, including intellectual property and other confidential business information. Because techniques used to obtain unauthorized access or to sabotage systems change frequently and generally are not recognized until launched against a target, we may be unable to anticipate these techniques or to implement adequate preventative measures. Third parties may also attempt to fraudulently induce employees or customers into disclosing sensitive information such as user names, passwords or other information in order to gain access to our data, including intellectual property and other confidential business information. If an actual or perceived breach of our security occurs, the market perception of the effectiveness of our security measures could be harmed, we could lose potential sales and existing customers or we could incur other liability.
Some of our large end-customers demand more favorable terms and conditions from us and may request price concessions. As we seek to sell more products to large end-customers, we may be required to agree to terms and conditions that may have an adverse effect on our business or ability to recognize revenue.
Some of our large end-customers have significant purchasing power and, accordingly, have requested and received from us more favorable terms and conditions, including lower prices and extended payment terms, than we typically provide. As we seek to sell more products to this class of customer, we may be required to agree to more favorable customer terms and conditions, which may include terms that affect the timing of our revenue recognition or may reduce our gross margins and have an adverse effect on our business and operating results.
We rely on systems vendors and resellers to sell our products in markets where we do not have a direct sales force, and on authorized service providers to service and support our products in markets where we do not have direct customer service personnel. Any disruptions to, or failure to develop and manage, our relationships with systems vendors, resellers and authorized service providers could have an adverse effect on our customer relationships and on our ability to increase revenue.
Our future success is highly dependent upon our ability to establish and maintain successful relationships with a variety of systems vendors, resellers and authorized service providers in markets where we do not have a direct sales force or direct customer service personnel. We currently have sales personnel in over 15 countries. In other markets, we rely and expect to continue to rely on establishing relationships with systems vendors, resellers and authorized service providers. Our ability to maintain or grow our international revenue will depend, in part, on our ability to carefully select, manage and expand our network of systems vendor partners, resellers and authorized service providers. In addition to their sales activities, our systems vendor partners also provide
30
Table of Contents
installation, post-sale service and support on our behalf in their local markets. We also have agreements with authorized service providers that deliver and install our products, as well as provide post-sale customer service and support, on our behalf in their local markets. In markets where we rely on systems vendor partners, resellers and authorized service providers, we have less contact with our customers and less control over the sales process and their responsiveness. As a result, it may be more difficult for us to ensure the proper delivery and installation of our products or the quality or responsiveness of the support and services being offered. Any failure on our part to effectively identify and train our systems vendor partners, resellers and authorized service providers and to monitor their sales activity as well as the customer support and services being provided to our customers in their local markets could harm our business, operating results and financial condition.
Identifying, training, and retaining qualified systems vendors, resellers and authorized service providers requires significant time and resources. In order to maintain and expand our network of systems vendor partners, resellers and authorized service providers, we must continue to scale and improve the systems, processes, and procedures that support them, which will require continuing investment in our information technology infrastructure and dedication of significant training resources. As we grow our business and support organization, these systems, processes, and procedures may become increasingly complex, difficult and expensive to manage, particularly as the geographic scope of our customer base expands globally.
We typically enter into non-exclusive agreements with our systems vendor partners, resellers and authorized service providers. These agreements generally have a one-year, self-renewing term, have no minimum sales commitment, and do not prohibit our systems vendor partners, resellers and authorized service providers from offering products and services that compete with ours. Accordingly, our systems vendor partners, resellers and authorized service providers may choose to discontinue offering our products and services or may not devote sufficient attention and resources toward selling our products and services. Additionally, our competitors may provide incentives to our existing and potential systems vendor partners, resellers and authorized service providers to use, purchase or offer their products and services which may prevent or reduce sales of our products and services. The occurrence of any of these events could harm our business, operating results and financial condition.
If our third-party hardware repair service fails to timely and correctly resolve hardware failures experienced by our end-customers, our reputation will suffer, our competitive position will be impaired and our expenses could increase.
We and our authorized service providers rely upon third-party hardware maintenance providers, which specialize in providing vendor-neutral support of storage equipment, network devices and peripherals, to provide repair services to our end-customers. If our third-party repair service fails to timely and correctly resolve hardware failures, our reputation will suffer, our competitive position will be impaired and our expenses could increase. In February 2011, we entered into a five-year agreement with IBM Global Services for our on-site response and call center support. Either party may terminate the agreement for any reason by providing the other party 120-day notice of termination. In addition, either party may immediately terminate the agreement for a material default by the other party that is not cured within 30 days. If our relationship with our third-party repair service were to end, we would have to engage a new third party provider of hardware support, and the transition could result in delays in effecting repairs and damage our reputation and competitive position as well as increase our operating expenses.
We rely on a single contract manufacturer to manufacture our products, and our failure to accurately forecast demand for our products or successfully manage our relationship with our contract manufacturer could negatively impact our ability to sell our products.
We rely on Flextronics to manufacture all of our products, manage our supply chain and, alone or together with us, negotiate component costs. We purchase our flash components directly from a single-source supplier and consign these components to Flextronics. Our reliance on our contract manufacturer reduces our control over the
31
Table of Contents
assembly process, quality assurance, production costs and product supply. If we fail to manage our relationship with our contract manufacturer or if our contract manufacturer experiences delays, disruptions, capacity constraints or quality control problems in its operations, our ability to ship products to our customers could be impaired and our competitive position and reputation could be harmed. If we or our contract manufacturer are unable to negotiate with suppliers for reduced component costs, our operating results could be harmed.
If we are required to change to a new contract manufacturer, qualify an additional contract manufacturer or assume internal manufacturing operations for any reason, including financial problems of our contract manufacturer, reduction of manufacturing output made available to us, or the termination of our contract, we may lose revenue, incur increased costs and damage our customer relationships. Our contract manufacturer may terminate our agreement with them with prior notice to us or for reasons such as we fail to perform a material obligation under our agreements with them. Qualifying a new contract manufacturer and commencing volume production is expensive and time-consuming.
We are required to provide forecasts to our contract manufacturer regarding product demand and production levels. We provide our contract manufacturer with purchase orders for products they manufacture for us, and these orders may only be rescheduled or cancelled under certain limited conditions. If we inaccurately forecast demand for our products, we may have excess or inadequate inventory or incur cancellation charges or penalties, which could adversely impact our operating results.
We intend to introduce new products and product enhancements, which could require us to achieve volume production rapidly by coordinating with our contract manufacturer and component suppliers. We may need to increase our component purchases, contract manufacturing capacity and internal test and quality functions if we experience increased demand for our products. Our orders may represent a relatively small percentage of the overall orders received by our contract manufacturer from their customers. As a result, fulfilling our orders may not be considered a priority in the event our contract manufacturer is constrained in its ability to fulfill all of its customer obligations in a timely manner. If our contract manufacturer is unable to provide us with adequate supplies of high-quality products, or if we or our contract manufacturer is unable to obtain adequate quantities of components, it could cause a delay in our order fulfillment, in which case our business, operating results and financial condition could be adversely affected.
We rely on a limited number of suppliers, and in some cases single-source suppliers, and any disruption or termination of these supply arrangements could delay shipments of our products and could materially and adversely affect our relationships with current and prospective customers.
We rely on a limited number of suppliers, and in some cases single-source suppliers, for several key components of our products, and neither our contract manufacturer nor we have entered into agreements for the long-term purchase of these components. This reliance on a limited number of suppliers and the lack of any guaranteed sources of supply exposes us to several risks, including:
| • | the inability to obtain an adequate supply of key components in a timely manner, including flash memory and field programmable gate arrays; |
| • | price volatility for the components of our products; |
| • | failure of a supplier to meet our quality, yield or production requirements; |
| • | failure of a key supplier to remain in business or adjust to market conditions; and |
| • | consolidation among suppliers, resulting in some suppliers exiting the industry or discontinuing the manufacture of components. |
If our supply of certain components is disrupted or delayed, or if we need to replace one or more of our existing suppliers, there can be no assurance that additional supplies or components will be available when required or
32
Table of Contents
that supplies will be available on terms that are favorable to us, which could extend our lead times, increase the costs of our components and materially adversely affect our business, operating results and financial condition. If we are successful in growing our business, we may not be able to continue to procure components at acceptable prices, which would require us to enter into longer term contracts with component suppliers to obtain these components at competitive prices. In addition, errors or defects may arise in some of our components supplied by third parties that are beyond our detection or control, which could lead to additional customer returns or product warranty claims. If any of these were to occur, our costs would increase and our gross margins would decrease, harming our operating results.
Our products incorporate components that are subject to supply and pricing volatility, and, as a result, our ability to respond in a timely manner to customer demand and our cost structure are sensitive to such volatility in the supply and market prices for these components.
We do not enter into long-term supply contracts for the components we use in our products, but instead generally we, or our contract manufacturer on our behalf, purchase these components pursuant to individual purchase orders. In addition, it is common in the storage and networking industries for component vendors to discontinue the manufacture of certain types of components from time to time due to evolving technologies and changes in the market. If we are required to make significant “last time” purchases of components that are being discontinued and do not purchase enough components, we may experience delayed shipments, order cancellations or otherwise be required to purchase more expensive components to meet customer demand, which could negatively impact our revenue, gross margins and operating results. If we purchase too many such components, we could be subject to inventory write-offs adversely affecting our operating results.
A portion of our expenses are directly related to the pricing of components utilized in the manufacture of our products, such as field programmable gate arrays, memory chips and central processing units, or CPUs. In some cases, our contract manufacturer purchases these components in a competitive-bid purchase order environment with suppliers or on the open market at spot prices. As a result, our cost structure is affected by price volatility in the marketplace for these components, especially for field programmable gate arrays, memory chips and CPUs. This volatility makes it difficult to predict expense levels and operating results, and may cause our expense levels and operating results to fluctuate significantly. Furthermore, these components can be subject to limits on supply or other supply volatility which may negatively impact our ability to obtain quantities necessary at reasonable prices to grow our business and respond to customer demand for our products.
As we seek to increase our sales to government customers, we may face difficulties and risks unique to government contracts and attempting to do business with the government that may have a detrimental impact on our business, operating results and financial condition.
Historically, we have sold products to the United States government through third-party resellers. Developing new business in the public sector often requires the development of relationships with different agencies or entities, as well as with other government contractors. If we are unable to develop or sustain such relationships, we may be unable to procure new contracts within the timeframes we expect, and our business, operating results and financial condition may be adversely affected. Contracting with the United States government often requires businesses to participate in a highly competitive bidding process to obtain new contracts. We may be unable to bid competitively if our products or services are improperly priced, or if we do not offer our products and services at a competitive price. The bidding process is an expensive and time-consuming endeavor that may result in a financial loss for us if we fail to win a contract on which we submitted a bid. Further, some agencies within the United States government may also require some or all of our personnel to obtain a security clearance or may require us to add features or functionality to our products that could require a significant amount of time and prevent our employees from working on other critical projects. If our key personnel are unable to obtain or retain this clearance or if we cannot or do not provide required features or functionality, we may be unsuccessful in our bid for some government contracts.
33
Table of Contents
Contracts with the United States government also frequently include provisions not found in private sector contracts and are often governed by laws and regulations that do not affect private sector contracts. These provisions may permit public sector customers to take actions not always available to customers in the private sector. These actions may include termination of contracts for convenience. The United States government can also suspend operations if Congress does not allocate sufficient funds to a particular agency or organization, and the United States government may allow our competitors to protest our successful bids. The occurrence of any of these events may negatively affect our business, operating results and financial condition.
In order to maintain contracts we may obtain with government entities, we must also comply with many rules and regulations that may affect our relationships with other customers. For example, the United States government could terminate its contracts with us if we come under foreign government control or influence, may require that we disclose our pricing data during the course of negotiations, and may require us to prevent access to classified data. If the United States government requires us to meet any of these demands, it could increase our costs or prevent us from taking advantage of certain opportunities that may present themselves in the future. The United States government routinely investigates and audits government contractors. It may audit our performance and our pricing, and review our compliance with rules and regulations. If it finds that we have improperly allocated costs, it may require us to refund those costs or may refuse to pay us for outstanding balances related to the improper allocation. An unfavorable audit could reduce our revenue, and may result in civil or criminal liability if the audit uncovers improper or illegal activities. This could harm our business, operating results and financial condition. Further, general uncertainty about the global economic recovery and ongoing fiscal and budgetary uncertainty in the United States, including the adverse economic effects of the U.S. government shutdown in October 2013 or any future possible shutdowns is likely to continue to adversely affect our ability to maintain and increase our sales to government customers, which in turn may continue to adversely affect our results of operations.
Third-party claims that we are infringing the intellectual property rights of others, whether successful or not, could subject us to costly and time-consuming litigation, require us to acquire expensive licenses, prohibit us from selling products and harm our business.
The storage and networking industries are characterized by the existence of a large number of patents, copyrights, trademarks, trade secrets and by frequent litigation based on allegations of infringement or other violations of intellectual property rights. We have in the past received and may in the future receive inquiries from other intellectual property holders and may become subject to claims that we infringe their intellectual property rights, particularly as we expand our presence in the market and face increasing competition. The costs associated with any actual, pending or threatened litigation could negatively impact our operating results regardless of outcome.
We currently have a number of agreements in effect pursuant to which we have agreed to defend, indemnify and hold harmless our customers, suppliers and channel partners from damages and costs which may arise from the infringement by our products of third-party patents, trademarks or other proprietary rights. The scope of these indemnity obligations varies, but may, in some instances, include indemnification for damages and expenses, including attorneys’ fees. Our insurance may not cover intellectual property infringement claims. A claim that our products infringe a third party’s intellectual property rights could harm our relationships with our customers, may deter future customers from purchasing our products and could expose us to costly litigation and settlement expenses. Even if we are not a party to any litigation between a customer and a third party relating to infringement by our products, an adverse outcome in any such litigation could make it more difficult for us to defend our products against intellectual property infringement claims in any subsequent litigation in which we are a named party. Any of these results could harm our brand and operating results.
Any intellectual property rights claim against us or our customers, suppliers and channel partners, with or without merit, could be time-consuming, expensive to litigate or settle, divert management resources and attention and force us to acquire intellectual property rights and licenses, which may involve substantial royalty
34
Table of Contents
payments. Further, a party making such a claim, if successful, could secure a judgment that requires us to pay substantial damages. An adverse determination also could invalidate our intellectual property rights and prevent us from offering our products to our customers and may require that we procure or develop substitute products that do not infringe, which could require significant effort and expense. We may have to seek a license for the technology, which may not be available on reasonable terms or at all, may significantly increase our operating expenses or require us to restrict our business activities in one or more respects. Any of these events could seriously harm our business, operating results and financial condition. In addition, parties to intellectual property litigation often announce the results of hearings, motions or other interim developments, and if securities analysts or investors perceive these results to be negative, it could have a substantial adverse effect on the price of our common stock.
The success of our business depends in part on our ability to protect and enforce our intellectual property rights.
We rely on a combination of patent, copyright, service mark, trademark, and trade secret laws, as well as confidentiality procedures and contractual restrictions, to establish and protect our proprietary rights, all of which provide only limited protection. There can be no assurance that any patents will issue with respect to our pending patent applications in a manner that gives us the protection that we seek, if at all, or that any patents issued to us will not be challenged, invalidated or circumvented. Our issued patents and any patents that may be issued in the future with respect to pending or future patent applications may not provide sufficiently broad protection or they may not prove to be enforceable in actions against alleged infringers. We cannot be certain that the steps we have taken will prevent unauthorized use of our technology or reverse engineering of our technology. Moreover, others may independently develop technologies that are competitive with ours or that design around our intellectual property. Although we endeavor to sign confidentiality agreements with our employees and others who may have access to our trade secrets, we cannot guarantee that we have entered into these agreements with all such parties, nor that the agreements we have entered will not be breached.
Protecting against the unauthorized use of our intellectual property, products and other proprietary rights is expensive and difficult. Litigation may be necessary in the future to enforce or defend our intellectual property rights or to determine the validity and scope of the proprietary rights of others. Any such litigation could result in substantial costs and diversion of management resources, either of which could materially and adversely affect our business, operating results and financial condition. In addition, many of our current and potential competitors have the ability to dedicate substantially greater resources to defending intellectual property infringement claims and to enforcing their intellectual property rights than we have. As a result, we may not be able to prevent third parties from infringing upon or misappropriating our intellectual property. Effective patent, trademark, service mark, copyright and trade secret protection may not be available in every country in which our products are available.
An inability to adequately protect and enforce our intellectual property and other proprietary rights could seriously harm our business, operating results and financial condition.
Adverse economic conditions and reduced information technology spending could have an adverse impact on our revenue, revenue growth rates and operating results.
Our business depends on the overall demand for information technology, and in particular for storage infrastructure, and on the capital spending budgets and financial health of our current and prospective customers. The purchase of our products is often discretionary and may require our customers to make significant initial commitments of capital. A general economic downturn, such as the slowdown that began in 2008, could dramatically reduce business spending on technology infrastructure. In response to a global economic slowdown, including a deterioration in their own financial condition, or an inability to obtain financing for capital investments, our customers and customer prospects could reduce or defer their spending on storage infrastructure, which could result in lost opportunities, declines in bookings and revenue, order cancellations or indefinite shipping delays.
35
Table of Contents
The global economic environment has been volatile as a result of many factors, including the economic uncertainty faced by a number of European countries, the strength of the U.S. dollar, a collapse in the price of oil and other commodities, acts of terrorism and the threat of military action in other parts of the world. If this volatility continues and there is a growing weakness in general economic conditions, a reduction in storage infrastructure spending, or deterioration in the financial condition of our customers and customer prospects will adversely impact our business, revenue, operating results and financial condition, including as a result of potential inventory write downs, longer sales cycles, potential increases in price competition, reduced unit sales, increased number of days of sales outstanding and customer payment defaults.
If we experience declines in average selling prices, our revenue and gross profit may decline.
The data storage industry is highly competitive and has historically been characterized by declines in average selling prices. It is possible that the market for flash-based data storage solutions could experience similar trends. Our average selling price on a per-gigabyte basis has declined over time and could continue to decline due to pricing pressure caused by several factors, including competition, the introduction of alternative technologies, overcapacity in the worldwide supply of flash-based or similar memory components, increased manufacturing efficiencies, implementation of new manufacturing processes and expansion of manufacturing capacity by component suppliers. If we are required to decrease our prices to be competitive and are not able to offset this decrease by increases in sales volume or cost reductions, our gross margins and operating results would be adversely affected.
We expect to face numerous challenges as we attempt to grow our operations, channel partner relationships and end-customer base internationally.
We have recently begun to grow our business internationally. Through January 31, 2015, we had 140 sales and marketing employees worldwide as well as over 100 channel partners in over 30 countries. Although we expect a portion of our future revenue growth will be from channel partners and end-customers located outside of the United States, we may not be able to increase international market demand for our products.
We expect to face numerous challenges as we attempt to grow our operations, channel partner relationships and end-customer base internationally, including attracting and retaining distributors and resellers with international capabilities or distributors and resellers located in international markets. Our revenue and expenses could be adversely affected by a variety of factors associated with international operations, some of which are beyond our control, including:
| • | difficulties of managing and staffing international offices, and the increased travel, infrastructure and legal compliance costs associated with international locations; |
| • | difficulty in collecting accounts receivable and longer collection periods; |
| • | difficulty in contract enforcement; |
| • | regulatory, political or economic conditions in a specific country or region; |
| • | compliance with local laws and regulations and unanticipated changes in local laws and regulations, including tax laws and regulations; |
| • | compliance with local privacy laws and regulations and unanticipated changes as country or region-specific privacy laws and regulations are enacted or expanded; |
| • | export and import controls, trade protection measures, FCPA compliance and other regulatory requirements; |
| • | economic sanctions enacted by the United States against certain countries, companies, and individuals, including those sanctions enacted in 2014 against entities located in Russia and Ukraine; |
| • | effects of changes in currency exchange rates; |
36
Table of Contents
| • | potentially adverse tax consequences; |
| • | service provider and government spending patterns; |
| • | reduced protection of our intellectual property and other assets in some countries; |
| • | greater difficulty documenting and testing our internal controls; |
| • | differing employment practices and labor issues; and |
| • | acts of terrorism and international conflicts. |
We are incurring significant increased costs as a result of operating as a public company and our management will be required to devote substantial time to new compliance initiatives.
As a public company and particularly after we cease to be an emerging growth company, we expect to incur significant legal, accounting and other expenses that we did not incur as a private company. For example, we are now subject to the reporting requirements of the Securities Exchange Act of 1934, as amended (the Exchange Act), and are required to comply with the applicable requirements of the Sarbanes-Oxley Act and the Dodd-Frank Wall Street Reform and Consumer Protection Act, as well as rules and regulations subsequently implemented by the SEC and the New York Stock Exchange, including the establishment and maintenance of effective disclosure and financial controls and changes in corporate governance practices. Compliance with these requirements has increased and will continue to increase our legal and financial compliance costs and has and will increasingly make some activities more time consuming and costly. In addition, we expect that our management and other personnel will need to divert attention from operational and other business matters to devote substantial time to these public company requirements. In particular, we expect to incur significant expenses and devote substantial management effort toward ensuring compliance with the requirements of Section 404 of the Sarbanes-Oxley Act, which will increase when we are no longer an emerging growth company, as defined by the JOBS Act. We will need to hire additional accounting and financial staff with appropriate public company experience and technical accounting knowledge and will need to expand our internal audit function. We cannot predict or estimate the amount of additional costs we may incur as a result of becoming a public company or the timing of such costs.
We also expect that operating as a public company will make it more expensive for us to obtain director and officer liability insurance on the terms that we would like. As a public company, it may be more difficult for us to attract and retain qualified people to serve on our board of directors, our board committees or as executive officers.
Our use of open source and third-party software could impose unanticipated conditions or restrictions on our ability to commercialize our products.
We incorporate open source software into our products. Although we monitor our use of open source software closely, we cannot guarantee that we are aware of all the open source software included in our products. Moreover, the terms of many open source licenses have not been interpreted by courts in or outside of the United States, and there is a risk that such licenses could be construed in a manner that imposes unanticipated conditions or restrictions on our ability to market our products. In this event, we could be required to seek licenses from third parties in order to continue offering our products, to make generally available, in source code form, proprietary code that links to certain open source modules, to re-engineer our products, or to discontinue the sale of our products if re-engineering could not be accomplished on a timely basis, any of which could adversely affect our business, operating results and financial condition.
We also incorporate proprietary third-party technologies, including software programs, into our products. We rely on license agreements to gain access to these third-party technologies and may need to enter into additional license agreements in the future. However, licenses to relevant third-party technology may not be or remain
37
Table of Contents
available to us on commercially reasonable terms, or at all. Therefore, we could face delays in product releases until equivalent technology can be identified, licensed or developed, and integrated into our current products. These delays, if they occur, could materially adversely affect our business, operating results and financial condition.
The accounting method for convertible senior notes that may be settled in cash, such as the notes if stockholder approval is obtained, could have a material effect on our reported financial results.
In May 2008, the Financial Accounting Standards Board, or FASB, issued FASB Staff Position No. APB 14-1, Accounting for Convertible Debt Instruments That May Be Settled in Cash Upon Conversion (including Partial Cash Settlement), which has subsequently been codified as Accounting Standards Codification 470-20, Debt with Conversion and Other Options, or ASC 470-20. ASC 470-20 requires an entity to separately account for the liability and equity components of convertible debt instruments whose conversion may be settled entirely or partially in cash (such as our convertible senior notes if we obtain stockholder approval) in a manner that reflects the issuer’s economic interest cost for non-convertible debt. The liability component of the notes would initially be valued at the fair value of a similar debt instrument that does not have an associated equity component and would be reflected as a liability in our consolidated balance sheet. The equity component of the notes would be included in the additional paid-in capital section of our stockholder’ equity on our consolidated balance sheet, and the value of the equity component would be treated as original issue discount for purposes of accounting for the debt component. This original issue discount would be amortized to non-cash expense over the term of the notes, and we would record a greater amount of non-cash interest expense in current periods as a result of this amortization. Accordingly, we would report lower net income in our financial results because ASC 470-20 would require the interest expense associated with the notes to include both the then current period’s amortization of the debt discount and the notes’ coupon interest, which could adversely affect our reported or future financial results, the trading price of our common stock and the trading price of the notes.
In addition, under certain circumstances, convertible debt instruments whose conversion may be settled entirely or partly in cash (such as our convertible senior notes if we obtain stockholder approval) are currently accounted for using the treasury stock method. Under this method, the shares issuable upon conversion of the notes are not included in the calculation of diluted earnings per share unless the conversion value of the notes exceeds their principal amount, then, for diluted earnings per share purposes, the notes are accounted for as if the number of shares of common stock that would be necessary to settle the excess, if we elected to settle the excess in shares, are issued. The accounting standards in the future may not continue to permit the use of the treasury stock method. If we are unable to use the treasury stock method in accounting for the shares, if any, issuable upon conversion of the notes, then our diluted earnings per share could be adversely affected.
If we are unable to implement and maintain effective internal control over financial reporting in the future, investors may lose confidence in the accuracy and completeness of our financial reports and the market price of our common stock may be negatively affected.
As a public company, we are required to maintain internal control over financial reporting and to report any material weaknesses in such internal control. Section 404 of the Sarbanes-Oxley Act of 2002 (the Sarbanes-Oxley Act) requires that we evaluate and determine the effectiveness of our internal control over financial reporting and, beginning with our annual report for the fiscal year ended January 31, 2015, provide a management report on the internal control over financial reporting. If we have a material weakness in our internal control over financial reporting, we may not detect errors on a timely basis and our financial statements may be materially misstated. If we identify material weaknesses in our internal control over financial reporting, if we are unable to comply with the requirements of Section 404 in a timely manner, if we are unable to assert that our internal control over financial reporting are effective, or if our independent registered public accounting firm, when required, is unable to express an opinion as to the effectiveness of our internal control over financial reporting, investors may lose confidence in the accuracy and completeness of our financial reports and the
38
Table of Contents
market price of our common stock could be negatively affected, and we could become subject to investigations by the stock exchange on which our securities are listed, the SEC, or other regulatory authorities, which could require additional financial and management resources.
We may acquire or make investments in other companies, each of which may divert our management’s attention, and result in additional dilution to our stockholders and consumption of resources that are necessary to sustain and grow our business.
Our business strategy may, from time to time, include acquiring other complementary products, technologies or businesses. We also may enter into strategic relationships with other businesses in order to expand our product offerings, which could involve preferred or exclusive licenses, additional channels of distribution or discount pricing or investments in other companies. Negotiating these transactions can be time-consuming, difficult and expensive, and our ability to close these transactions may be subject to third-party or governmental approvals. Consequently, we can make no assurance that these transactions, once undertaken and announced, will close. Acquisitions or investments may result in unforeseen operating difficulties and expenditures. In particular, we may encounter difficulties assimilating or integrating the businesses, technologies, products, personnel or operations of the acquired companies, particularly if the key personnel of the acquired business choose not to work for us, and we may have difficulty retaining the customers of any acquired business. Acquisitions may also disrupt our ongoing business, divert our resources and require significant management attention that would otherwise be available for development of our business. Any acquisition or investment could also expose us to unknown liabilities. Moreover, we cannot assure you that we would realize the anticipated benefits of any acquisition or investment. In connection with these types of transactions, we may issue additional equity securities that would dilute our stockholders, use cash that we may need in the future to operate our business, incur debt on terms unfavorable to us or that we are unable to repay, incur significant charges or substantial liabilities, encounter difficulties integrating diverse business cultures, and become subject to adverse tax consequences, substantial depreciation or deferred compensation charges. These challenges related to acquisitions or investments could adversely affect our business, operating results and financial condition.
Our business is subject to the risks of earthquakes and other natural catastrophic events, and to interruption by man-made problems such as computer viruses or terrorism.
Our sales headquarters, corporate headquarters and our current contract manufacturer are located in the San Francisco Bay area, which has a heightened risk of earthquakes. We may not have adequate business interruption insurance to compensate us for losses that may occur from a significant natural disaster, such as an earthquake, which could have a material adverse impact on our business, operating results and financial condition. In addition, acts of terrorism or malicious computer viruses could cause disruptions in our or our customers’ businesses or the economy as a whole. To the extent that these disruptions result in delays or cancellations of customer orders or the deployment of our products, our business, operating results and financial condition would be adversely affected.
Our results of operations could be affected by natural catastrophes in locations in which our customers, suppliers or contract manufacturers operate.
Several of our customers, suppliers and our contract manufacturer have operations in locations that are subject to natural disasters, such as severe weather and geological events, which could disrupt the operations of those customers, suppliers and our contract manufacturer. Some of our customers and suppliers, including our sole flash memory supplier, Toshiba, are located in Japan and they have experienced, and may experience in the future, shutdowns as a result of these events, and their operations may be negatively impacted by these events. Our customers affected by a natural disaster could postpone or cancel orders of our products, which would negatively impact our business. In addition, a natural disaster could delay or prevent our contract manufacturer in the manufacture of our products, and we may need to qualify a replacement manufacturer. Moreover, should any
39
Table of Contents
of our key suppliers fail to deliver components to us as a result of a natural disaster, we may be unable to purchase these components in the necessary quantities or may be forced to purchase components in the open market at significantly higher costs. We may also be forced to purchase components in advance of our normal supply chain demand to avoid potential market shortages. In addition, if we are required to obtain one or more new suppliers for components or use alternative components in our solutions, we may need to conduct additional testing of our solutions to ensure those components meet our quality and performance standards, all of which could delay shipments to our customers and adversely affect our financial condition and results of operations.
Our reported financial results may be adversely affected by changes in accounting principles applicable to us.
Generally accepted accounting principles in the United States are subject to interpretation by the Financial Accounting Standards Board, or FASB, the SEC and other bodies formed to promulgate and interpret appropriate accounting principles. A change in these principles or interpretations could have a significant effect on our reported financial results, and could affect the reporting of transactions completed before the announcement of a change. In addition, the SEC has announced a multi-year plan that could ultimately lead to the use of International Financial Reporting Standards by U.S. issuers in their SEC filings. Any such change could have a significant effect on our reported financial results.
The conditional conversion feature of our convertible senior notes, if triggered, may adversely affect our financial condition and operating results.
In the event the conditional conversion feature of our convertible senior notes is triggered, holders of the notes will be entitled to convert the notes at any time during specified periods at their option. Even if holders do not elect to convert their notes, we could be required under applicable accounting rules to reclassify all or a portion of the outstanding principal of the notes as a current rather than long-term liability, which would result in a material reduction of our net working capital.
If our estimates or judgments relating to our critical accounting policies are based on assumptions that change or prove to be incorrect, our operating results could fall below expectations of securities analysts and investors, resulting in a decline in our stock price.
The preparation of financial statements in conformity with U.S. generally accepted accounting principles requires management to make estimates and assumptions that affect the amounts reported in our consolidated financial statements and accompanying notes. We base our estimates on historical experience and on various other assumptions that we believe to be reasonable under the circumstances, as described under “Management’s Discussion and Analysis of Financial Condition and Results of Operations” in this periodic report, the results of which form the basis for making judgments about the carrying values of assets and liabilities that are not readily apparent from other sources. Our operating results may be adversely affected if our assumptions change or if actual circumstances differ from those in our assumptions, which could cause our operating results to fall below market expectations, resulting in a decline in our stock price. Significant assumptions and estimates used in preparing our consolidated financial statements include those related to revenue recognition, inventory valuation, product warranty, stock-based compensation, and deferred income tax valuation allowances.
Our ability to use net operating losses to offset future taxable income may be subject to certain limitations.
In general, under Section 382 of the Internal Revenue Code of 1986, as amended, or the Internal Revenue Code, a corporation that undergoes an “ownership change” is subject to limitations on its ability to utilize its pre-change net operating losses, or NOLs, to offset future taxable income. Our existing NOLs may be subject to substantial limitations arising from previous ownership changes, and if we undergo an ownership change, our ability to utilize NOLs could be further limited by Section 382 of the Internal Revenue Code. In addition, future changes in our stock ownership, many of which are outside of our control, could result in an ownership change under Section 382 of the Internal Revenue Code. Our net operating losses may also be impaired under state law. Accordingly, we may not be able to utilize a material portion of our NOLs.
40
Table of Contents
Changes in our provision for income taxes or adverse outcomes resulting from examination of our income tax returns could materially and adversely affect our operating results, financial condition and cash flows.
Our provision for income taxes is subject to volatility and could be adversely affected by the following:
| • | changes in the valuation of our deferred tax assets and liabilities; |
| • | expiration of, or lapses in, the research and development tax credits; |
| • | transfer pricing adjustments; |
| • | tax effects of nondeductible compensation; |
| • | tax costs related to intercompany realignments; |
| • | changes in accounting principles; |
| • | changes in tax laws and regulations, including possible changes to the taxation of earnings in the United States of our foreign subsidiaries, and the deductibility of expenses attributable to foreign income, or the foreign tax credit rules; or |
| • | earnings that are lower than anticipated in countries that have lower tax rates and higher than anticipated in countries that have higher tax rates. |
Significant judgment is required to determine the recognition and measurement attribute prescribed in the accounting guidance for uncertainty in income taxes. The accounting guidance for uncertainty in income taxes applies to all income tax positions, including the potential recovery of previously paid taxes, which if settled unfavorably could adversely impact our provision for income taxes or additional paid-in capital. In addition, we are subject to the examination of our income tax returns by the Internal Revenue Service and other tax authorities. We regularly assess the likelihood of adverse outcomes resulting from these examinations to determine the adequacy of our provision for income taxes. The outcomes from these examinations may have a material adverse effect on our operating results, financial condition and cash flows.
We are subject to governmental export and import controls that could subject us to liability or impair our ability to compete in foreign markets.
Because we incorporate encryption technology into our products, our products are subject to United States export controls and may be exported outside the United States only with the required level of export license or through an export license exception. In addition, various countries regulate the import of certain encryption technology and have enacted laws that could limit our ability to introduce products in those countries. Changes in our products or changes in export and import regulations may create delays in the introduction of our products in international markets, prevent our customers with international operations from deploying our products throughout their global systems or, in some cases, prevent the export or import of our products to certain countries altogether. Any change in export or import regulations or related legislation, shift in approach to the enforcement or scope of existing regulations, or change in the countries, persons or technologies affected by such regulations, could result in decreased use of our products by, or an inability to export or sell our products to, existing or prospective customers with international operations and harm our business. In addition, any failure by us to comply with these rules and regulations could subject us to significant fines and penalties.
Failure to comply with governmental laws and regulations could harm our business.
Our business is subject to regulation by various federal, state, local and foreign governmental agencies, including agencies responsible for monitoring and enforcing employment and labor laws, workplace safety, product safety, environmental laws, consumer protection laws, anti-bribery laws, import/export controls, federal securities laws and tax laws and regulations. In certain jurisdictions, these regulatory requirements may be more stringent than in the United States. Noncompliance with applicable regulations or requirements could subject us to investigations,
41
Table of Contents
sanctions, mandatory product recalls, enforcement actions, disgorgement of profits, fines, damages, civil and criminal penalties or injunctions. If any governmental sanctions are imposed, or if we do not prevail in any possible civil or criminal litigation, our business, operating results and financial condition could be materially adversely affected. In addition, responding to any action will likely result in a significant diversion of management’s attention and resources and an increase in professional fees. Enforcement actions and sanctions could harm our business, operating results and financial condition.
We are subject to environmental, health and safety laws and regulations pursuant to which we may incur substantial costs or liabilities, which could harm our business, operating results or financial condition.
We are subject to various state, federal, local and international laws and regulations relating to the environment or human health and safety, including those governing the presence of certain substances in electronic products and making producers of those products financially responsible for the collection, treatment, recycling and disposal of certain products. These laws and regulations have been enacted in several jurisdictions in which we sell our products, including the European Union, or EU, and certain of its member countries. For example, the EU has enacted the Restriction on Hazardous Substances, or RoHS, and Waste Electrical and Electronic Equipment, or WEEE, directives. RoHS prohibits the use of certain substances, including lead, in certain products, including hard drives, sold after July 1, 2006. The WEEE directive obligates parties that sell electrical and electronic equipment in the EU to put a clearly identifiable mark on the equipment, register with and report to EU member countries regarding distribution of the equipment and provide a mechanism to take back and properly dispose of the equipment. There is still some uncertainty in certain EU countries as to which party involved in the manufacture, distribution and sale of electronic equipment will be ultimately responsible for registration, reporting and disposal. Similar legislation may be enacted in other locations where we sell our products. We will need to ensure that we comply with these laws and regulations as they are enacted, and that our component suppliers also comply with these laws and regulations. If we or our component suppliers fail to comply with the legislation, our customers may refuse or be unable to purchase our products, which could harm our business, operating results and financial condition.
Pursuant to such laws and regulations, we could incur substantial costs and be subject to disruptions to our operations and logistics or other liabilities. For example, if we were found to be in violation of these laws or regulations, we could be subject to governmental fines or other sanctions and liability to our customers. In addition, we have to make significant expenditures to comply with such laws and regulations. Any such costs or liabilities pursuant to environmental, health or safety laws or regulations could have a material adverse effect on our business, operating results or financial condition.
We are exposed to fluctuations in currency exchange rates, which could negatively affect our financial condition and results of operations.
While our international revenue has typically been denominated in U.S. dollars, fluctuations in currency exchange rates could cause our products to become relatively more expensive to customers in a particular country, leading to a reduction in revenue or profitability from sales in that country. We currently do not enter into hedging arrangements to minimize the impact of foreign currency fluctuations. Our exposure to foreign currency fluctuation may change over time as our business practices evolve and could have a material adverse impact on our financial condition and results of operations. Gains and losses on the conversion to U.S. dollars of accounts receivable and other monetary assets and liabilities arising from international operations may contribute to fluctuations in operating results.
Risks Related to Our Common Stock
Our stock price may be volatile. Further, you may not be able to resell shares of our common stock at or above the price you paid.
Our common stock is currently traded on the New York Stock Exchange, but we can provide no assurance that there will be active trading on that market or any other market in the future. If there is not an active trading
42
Table of Contents
market or if the volume of trading is limited, the price of our common stock could decline and holders of our common stock may have difficulty selling their shares. In addition, the trading price of our common stock may be highly volatile and could be subject to wide fluctuations in response to various factors, some of which are beyond our control. For example, since our shares were sold in our IPO in September 2013 at $9.00 per share, our stock price has ranged from $2.50 to $7.98 per share through March 25, 2015. Some of the factors affecting our volatility include:
| • | actual or anticipated variation in our and our competitors’ results of operations; |
| • | announcements by us or our competitors of new products, new or terminated significant contracts, commercial relationships or capital commitments; |
| • | issuance of new securities analysts’ reports or changed recommendations for our stock; |
| • | developments or disputes concerning our intellectual property or other proprietary rights; |
| • | commencement of, or our involvement in litigation; |
| • | announced or completed acquisitions of businesses or technologies by us or our competitors; |
| • | any major change in our management; and |
| • | general economic conditions and slow or negative growth of our markets. |
In addition, the stock market in general, and the market for technology companies in particular, has experienced and may continue to experience extreme price and volume fluctuations that have often been unrelated or disproportionate to the operating performance of those companies. Broad market and industry factors may seriously affect the market price of our common stock, regardless of our actual operating performance. These fluctuations may be even more pronounced in the trading market for our stock during the period following our recently completed public offering. In addition, in the past, following periods of volatility in the overall market and the market price of a particular company’s securities, securities class action litigation has often been instituted against these companies. This litigation, if instituted against us, could result in substantial costs and a diversion of our management’s attention and resources.
We have been named as a defendant in a putative securities class action law suit. This, and other litigation, could cause us to incur substantial costs and divert our attention and resources.
In the past, securities class action litigation has often been brought against a company following periods of volatility in the market price of its securities. Companies such as ours in the high technology industry are particularly vulnerable to this kind of litigation due to the high volatility of their stock prices. We and a number of our current and former officers and directors and others are defendants in putative class and derivative action litigation, which is discussed below in the Section entitled “Legal Proceedings.” Any litigation to which we are a party may result in the diversion of management attention and resources from our business and business goals. In addition, any litigation to which we are a party may result in an onerous or unfavorable judgment that may not be reversed upon appeal and that may require us to make payments of substantial monetary damages or fines, or we may decide to settle lawsuits on similarly unfavorable terms, which could adversely affect our business, financial condition or results of operations.
If securities or industry analysts issue an adverse opinion regarding our stock or do not publish research or reports about our business, our stock price and trading volume could decline.
The trading market for our common stock will depend in part on the research and reports that equity research analysts publish about us and our business. We do not control these analysts or the content and opinions included in their reports. The price of our common stock has declined and could decline again when one or more equity analysts downgrade our common stock or when those analysts issue other unfavorable commentary or cease publishing reports about us or our business. If one or more equity research analyst ceases coverage of our
43
Table of Contents
company, we could lose visibility in the market, which in turn could cause our stock price to decline. Further, securities analysts may elect not to provide research coverage of our common stock, and such lack of research coverage may adversely affect the market price of our common stock.
The issuance of our convertible senior notes could affect the market price of our common stock.
The market price of our common stock could be adversely affected by possible sales of common stock by investors who view our convertible senior notes as an attractive means of equity participation in us and by hedging or arbitrage activity involving our common stock.
Conversion of our convertible senior notes may affect the market price of our common stock.
If we do not obtain stockholder approval and satisfy our conversion obligation by delivering shares of common stock, or if we obtain stockholder approval and elect to satisfy our conversion obligation by paying cash and delivering shares of common stock, the issuance of additional shares will dilute the ownership of stockholders. In addition, any sales in the public market of shares of common stock that we issue upon conversion could adversely affect the price of our common stock.
Certain provisions in the indenture governing our convertible senior notes could delay or prevent an otherwise beneficial takeover or other takeover attempt of us.
Certain provisions in our convertible senior notes and the indenture could make it more difficult or more expensive for a third party to acquire us. For example, if a takeover would constitute a fundamental change, holders of the notes will have the right to require us to repurchase their notes in cash. In addition, if a takeover constitutes a make-whole fundamental change, we may be required to increase the conversion rate for holders who convert their notes in connection with such takeover. In either case, and in other cases, our obligations under the notes and the indenture could increase the cost of acquiring us or otherwise discourage a third party from acquiring us or removing incumbent management.
Anti-takeover provisions in our charter documents and under Delaware law could discourage, delay or prevent a change in control and may affect the trading price of our common stock.
Provisions in our certificate of incorporation and bylaws may have the effect of delaying or preventing a change of control or changes in our management. Our amended and restated certificate of incorporation and amended and restated bylaws include provisions that:
| • | authorize our board of directors to issue, without further action by the stockholders, up to 10,000,000 shares of undesignated preferred stock; |
| • | require that any action to be taken by our stockholders be effected at a duly called annual or special meeting and not by written consent; |
| • | specify that special meetings of our stockholders can be called only by our board of directors or the chief executive officer; |
| • | establish an advance notice procedure for stockholder approvals to be brought before an annual meeting of our stockholders, including proposed nominations of persons for election to our board of directors; |
| • | establish that our board of directors is divided into three classes, Class I, Class II and Class III, with each class serving staggered terms; |
| • | provide that our directors may be removed only for cause; |
| • | provide that vacancies on our board of directors may be filled only by a majority of directors then in office, even though less than a quorum; |
| • | specify that no stockholder is permitted to cumulate votes at any election of directors; and |
| • | require a super-majority of votes to amend certain of the above-mentioned provisions. |
44
Table of Contents
In addition, we are subject to the provisions of Section 203 of the Delaware General Corporation Law regulating corporate takeovers. Section 203 generally prohibits us from engaging in a business combination with an interested stockholder subject to certain exceptions.
We have never paid dividends on our capital stock, and we do not anticipate paying any cash dividends in the foreseeable future.
We have not paid cash dividends on any of our classes of capital stock to date, have contractual restrictions against paying cash dividends, and currently intend to retain our future earnings to fund the development and growth of our business. As a result, capital appreciation, if any, of our common stock would be the sole source of gain for the foreseeable future.
| Item 1B. | Unresolved Staff Comments |
None.
| Item 2. | Properties |
Our headquarters occupy approximately 66,000 square feet in Santa Clara, California under a lease that expires in February 2017. In addition, we have offices in New York, Washington, D.C., China, Japan, Singapore, South Korea and the United Kingdom. We believe that our current facilities are adequate to meet our ongoing needs and if we require additional space, we will be able to obtain additional facilities on commercially reasonable terms.
| Item 3. | Legal Proceedings |
Beginning on November 26, 2013, four putative class action lawsuits were filed in the United States District Court for the Northern District of California, naming us and a number of our present or former directors and officers, and several underwriters of our September 27, 2013 IPO. The four complaints have been consolidated into a single, putative class action, and co-lead plaintiffs have been appointed by the court. On March 28, 2014, a consolidated complaint was filed. The complaint purports to assert claims under the federal securities laws on behalf of purchasers of our common stock issued in the IPO, based on seven categories of alleged omissions. The complaint seeks damages in an unspecified amount and other relief. On April 18, 2014, the defendants filed motions to dismiss the complaint. On October 31, 2014, the court granted in part and denied in part defendants’ motions to dismiss. The court’s order dismissed all except one category of alleged omissions, and gave plaintiffs the opportunity to amend the complaint. On November 21, 2014, the plaintiffs filed an amended complaint. In so doing, the plaintiffs chose not to amend their claims against us or the present or former directors and officers. Pending further developments regarding plaintiffs’ claims against the underwriters, the case will proceed to the discovery phase on the remaining allegations against us and the present or former directors and officers.
A purported stockholder derivative action also is pending before the same federal district court judge to whom the putative class action has been assigned. In the derivative action, the plaintiffs allege that certain of our current and former officers and directors breached their fiduciary duties to us by violating the federal securities laws and exposing us to possible financial liability. Pursuant to a stipulation by the parties, the derivative action currently is stayed pending further developments in the putative class action. The stay may be lifted at any time.
We intend to defend ourselves vigorously in both securities actions.
| Item 4. | Mine Safety Disclosures |
Not applicable.
45
Table of Contents
| Item 5. | Market for Registrant’s Common Equity, Related Stockholder Matters and Issuer Purchases of Equity Securities. |
Market Information for Common Stock
Our common stock began trading publicly on the New York Stock Exchange under the ticker symbol “VMEM” on September 27, 2013. Prior to that time, there was no public market for our common stock. The following table sets forth, for the period indicated, the high and low sale prices of our common stock as reported by the New York Stock Exchange since our IPO.
| High | Low | |||||||
| Fiscal Year Ended January 31, 2014: |
||||||||
| Third Quarter (from September 27, 2013) |
$ | 7.98 | $ | 6.50 | ||||
| Fourth Quarter |
$ | 6.56 | $ | 2.50 | ||||
| Fiscal Year Ended January 31, 2015: |
||||||||
| First Quarter |
$ | 5.15 | $ | 3.49 | ||||
| Second Quarter |
$ | 4.58 | $ | 3.07 | ||||
| Third Quarter |
$ | 5.32 | $ | 3.61 | ||||
| Fourth Quarter |
$ | 5.38 | $ | 3.84 | ||||
Holders of Record
As of January 31, 2015, there were approximately 259 holders of record of our common stock. This figure does not include a substantially greater number of “street name” holders or beneficial holders of our common stock whose shares are held of record by banks, brokers and other financial institutions.
Dividend Policy
We have never declared or paid any cash dividend on our capital stock. We currently intend to retain any future earnings and do not expect to pay any dividends in the foreseeable future. In addition, the terms of our loan and security agreement with a financial institution currently prohibits us from paying cash dividends on our common stock. Any future determination to declare cash dividends will be made at the discretion of our board of directors, subject to applicable laws and compliance with certain covenants under our loan and security agreement with the financial institution, and will depend on our financial condition, results of operations, capital requirements, general business conditions and other factors that our board of directors may deem relevant.
Equity Plan Information
Our equity plan information required by this item is incorporated by reference to the information in Part III, Item 12 of this annual report on Form 10-K.
Stock Performance Graph
This performance graph shall not be deemed “soliciting material” or to be “filed” with the SEC for purposes of Section 18 of the Securities Exchange Act of 1934, as amended (Exchange Act), or otherwise subject to the liabilities under that Section, and shall not be deemed to be incorporated by reference into any filing of Violin Memory, Inc. under the Securities Act of 1933, as amended, or the Exchange Act.
46
Table of Contents
The following graph shows a comparison from September 27, 2013 (the date our common stock commenced trading on the New York Stock Exchange) through January 31, 2015 of the cumulative total return for our common stock, the Standard & Poor’s 500 Stock Index (S&P 500 Index) and the NYSE Composite Index. The graph assumes that $100 was invested on September 27, 2013 in the common stock of Violin Memory, Inc., the S&P 500 Index and the NYSE Composite Index and assumes reinvestment of any dividends. The stock price performance on the following graph is not necessarily indicative of future stock price performance.
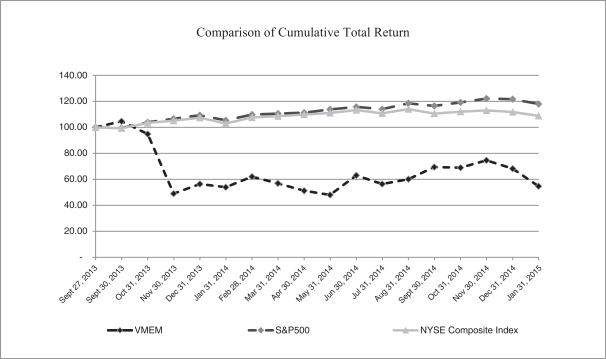
Sale of Unregistered Securities and Use of Proceeds
Sale of Unregistered Securities
Pursuant to an agreement effective as of September 29, 2014, an executive of the Company purchased 200,000 shares of common stock for approximately $0.9 million in cash in a private placement pursuant to Section 4(2) of the Securities Act of 1933, as amended (the “Securities Act”). The purchase price per share of $4.54 was the closing price of the Company’s common stock, as reported by the New York Stock Exchange, on September 29, 2014. The shares are restricted securities and are subject to the requirements of Rule 144 under the Securities Act.
In fiscal 2014, we issued and sold an aggregate of 1.2 million shares of our common stock to employees and former employees at a weighted-average exercise price of approximately $0.50 per share pursuant to exercises of options granted under our 2005 Stock Plan. In addition, we issued warrants to purchase shares of Series D convertible preferred stock which was converted into warrants to purchase 84,278 shares of our common stock at $11.80 per share upon completion of our IPO.
The sales of the above securities were deemed to be exempt from registration under the Securities Act in reliance on Section 4(2) of the Securities Act or Rule 701 promulgated under Section 3(b) of the Securities Act, as transactions by an issuer not involving a public offering or transactions pursuant to compensatory benefit plans and contracts relating to compensation as provided under Rule 701.
47
Table of Contents
Use of Proceeds from Public Offering of Common Stock
Our IPO was made pursuant to a registration statement on Form S-1 (File No. 333-190823), which the SEC declared effective on September 26, 2013. As a result of the offering, we raised approximately $145.8 million in proceeds, net of underwriting discounts, commissions and offering expenses. We have invested a portion of the net proceeds in short-term, interest bearing obligations and investment grade instruments, and repaid all of our outstanding debt obligations shortly after the IPO. Going forward, we intend to use a portion of the net proceeds for working capital and general corporate purposes, including further expansion of our sales and marketing efforts, continued investments in research and development and for capital expenditures. There has been no material change in the planned use of proceeds from our initial public offering as described in our final prospectus filed with the SEC pursuant to Rule 424(b) on September 27, 2013.
Purchases of Equity Securities by the Issuer
None.
Trading Plans
Our Insider Trading Policy permits directors, officers and other employees covered under the policy to establish, subject to certain conditions and limitations set forth in the policy, written trading plans which are intended to comply with Rule 10b5-1 under the Securities Exchange Act, which permits automatic trading of common stock of Violin Memory, Inc. or trading of common stock by an independent person (such as a stockbroker) who is not aware of material, nonpublic information at the time of the trade.
Item 6. Selected Financial Data
The following tables present selected historical financial data for our business. You should read this information together with “Management’s Discussion and Analysis of Financial Condition and Results of Operations” and the consolidated financial statements, related notes and other financial information included elsewhere in this Annual Report on Form 10-K. The selected consolidated financial data in this section is not intended to replace the consolidated financial statements and are qualified in their entirety by the consolidated financial statements and related notes included elsewhere in this Annual Report on Form 10-K.
We derived the consolidated statements of operations data for the years ended January 31, 2015, 2014, and 2013 and the consolidated balance sheets data as of January 31, 2015 and 2014 from our audited consolidated financial statements included elsewhere in this report. We derived the consolidated statements of operations data for the years ended January 31, 2012 and 2011 and the consolidated balance sheets data as of January 31, 2013, 2012 and 2011 from our audited consolidated financial statements that are not included in this report. Our historical results are not necessarily indicative of our results in any future period.
48
Table of Contents
| Year Ended January 31, | ||||||||||||||||||||
| 2015 | 2014 | 2013 | 2012 | 2011 | ||||||||||||||||
| (In thousands, except per share data) | ||||||||||||||||||||
| Consolidated Statements of Operations Data: |
||||||||||||||||||||
| Revenue: |
||||||||||||||||||||
| Product revenue |
$ | 58,378 | $ | 88,321 | $ | 69,584 | $ | 52,541 | $ | 11,031 | ||||||||||
| Service revenue |
20,597 | 19,335 | 4,214 | 1,347 | 366 | |||||||||||||||
|
|
|
|
|
|
|
|
|
|
|
|||||||||||
| Total revenue |
78,975 | 107,656 | 73,798 | 53,888 | 11,397 | |||||||||||||||
|
|
|
|
|
|
|
|
|
|
|
|||||||||||
| Cost of revenue: |
||||||||||||||||||||
| Cost of product revenue (1) |
30,450 | 47,773 | 38,180 | 38,110 | 7,953 | |||||||||||||||
| Inventory provisions due to product transitions |
19,928 | 9,154 | — | — | — | |||||||||||||||
| Cost of service revenue (1) |
8,389 | 7,846 | 4,474 | 1,156 | 125 | |||||||||||||||
|
|
|
|
|
|
|
|
|
|
|
|||||||||||
| Total cost of revenue |
58,767 | 64,773 | 42,654 | 39,266 | 8,078 | |||||||||||||||
|
|
|
|
|
|
|
|
|
|
|
|||||||||||
| Gross profit |
20,208 | 42,883 | 31,144 | 14,622 | 3,319 | |||||||||||||||
|
|
|
|
|
|
|
|
|
|
|
|||||||||||
| Operating expenses: |
||||||||||||||||||||
| Sales and marketing (1) |
61,871 | 81,104 | 61,094 | 21,493 | 5,323 | |||||||||||||||
| Research and development (1) |
52,091 | 73,743 | 57,840 | 26,641 | 9,701 | |||||||||||||||
| General and administrative (1) |
20,645 | 29,622 | 21,105 | 6,222 | 4,895 | |||||||||||||||
| Gain on sale of PCIe product line |
(17,448 | ) | — | — | — | — | ||||||||||||||
| Restructuring charges |
3,062 | 4,869 | — | — | — | |||||||||||||||
| Litigation settlement |
652 | 350 | — | 2,100 | — | |||||||||||||||
|
|
|
|
|
|
|
|
|
|
|
|||||||||||
| Total operating expenses |
120,873 | 189,688 | 140,039 | 56,456 | 19,919 | |||||||||||||||
|
|
|
|
|
|
|
|
|
|
|
|||||||||||
| Loss from operations |
(100,665 | ) | (146,805 | ) | (108,895 | ) | (41,834 | ) | (16,600 | ) | ||||||||||
| Other income (expense), net |
(4,910 | ) | (1,389 | ) | (79 | ) | 89 | 110 | ||||||||||||
| Interest and other financing expense |
(3,205 | ) | (1,539 | ) | (31 | ) | (3,033 | ) | (251 | ) | ||||||||||
|
|
|
|
|
|
|
|
|
|
|
|||||||||||
| Loss before income taxes |
(108,780 | ) | (149,733 | ) | (109,005 | ) | (44,778 | ) | (16,741 | ) | ||||||||||
| Income taxes |
123 | 76 | 97 | 7 | 1 | |||||||||||||||
|
|
|
|
|
|
|
|
|
|
|
|||||||||||
| Net loss |
$ | (108,903 | ) | $ | (149,809 | ) | $ | (109,102 | ) | $ | (44,785 | ) | $ | (16,742 | ) | |||||
|
|
|
|
|
|
|
|
|
|
|
|||||||||||
| Net loss per share of common stock, basic and diluted (2) |
$ | (1.20 | ) | $ | (3.88 | ) | $ | (8.01 | ) | $ | (4.77 | ) | $ | (3.10 | ) | |||||
|
|
|
|
|
|
|
|
|
|
|
|||||||||||
| Shares used to compute net loss per share of common stock, basic and diluted (2) |
90,959 | 38,591 | 13,624 | 9,396 | 5,404 | |||||||||||||||
|
|
|
|
|
|
|
|
|
|
|
|||||||||||
| (1) Includes stock-based compensation expense as follows: |
||||||||||||||||||||
| Cost of product revenue |
$ | 718 | $ | 100 | $ | 150 | $ | 15 | $ | 1 | ||||||||||
| Cost of service revenue |
658 | 889 | 474 | 4 | — | |||||||||||||||
| Sales and marketing |
4,792 | 10,344 | 4,061 | 299 | 59 | |||||||||||||||
| Research and development |
9,570 | 6,900 | 3,228 | 236 | 23 | |||||||||||||||
| General and administrative |
7,228 | 18,166 | 10,010 | 492 | 21 | |||||||||||||||
|
|
|
|
|
|
|
|
|
|
|
|||||||||||
| $ | 22,966 | $ | 36,399 | $ | 17,923 | $ | 1,046 | $ | 104 | |||||||||||
|
|
|
|
|
|
|
|
|
|
|
|||||||||||
| (2) | See Note 13 of the consolidated financial statements for an explanation of the calculations of basic and diluted net loss per share available to common stock holders. |
49
Table of Contents
| January 31, | ||||||||||||||||||||
| 2015 | 2014 | 2013 | 2012 | 2011 | ||||||||||||||||
| (In thousands) | ||||||||||||||||||||
| Consolidated Balance Sheet Data: |
||||||||||||||||||||
| Cash, cash equivalents and investments |
$ | 153,915 | $ | 99,379 | $ | 17,378 | $ | 22,604 | $ | 6,082 | ||||||||||
| Working capital |
132,842 | 97,057 | 32,175 | 37,689 | 10,726 | |||||||||||||||
| Total assets |
208,235 | 184,663 | 88,150 | 73,285 | 21,731 | |||||||||||||||
| Convertible notes |
120,000 | — | — | 682 | — | |||||||||||||||
| Total liabilities |
186,829 | 80,939 | 43,426 | 29,134 | 24,303 | |||||||||||||||
| Additional paid-in-capital |
482,674 | 456,223 | 247,531 | 137,938 | 46,346 | |||||||||||||||
| Accumulated deficit |
(461,525 | ) | (352,622 | ) | (202,813 | ) | (93,711 | ) | (48,926 | ) | ||||||||||
| Total stockholders’ equity (deficit) |
21,406 | 103,724 | 44,724 | 44,151 | (2,572 | ) | ||||||||||||||
Item 7. Management’s Discussion and Analysis of Financial Condition and Results of Operations
The following discussion and analysis of our financial condition and results of operations should be read in conjunction with our consolidated financial statements and the related notes included in Part II, Item 8, “Financial Statements and Supplementary Data” of this Annual Report on Form 10-K. In addition to our historical consolidated financial information, the following discussion contains forward-looking statements that reflect our plans, estimates and beliefs. Our actual results could differ materially from those discussed in the forward-looking statements. Factors that could cause or contribute to these differences include those discussed below and elsewhere in this Annual Report on Form 10-K, particularly in Part I, Item 1A, “Risk Factors.”
Overview
We were incorporated in 2005 with the goal of bringing storage performance in line with advancements in server and network technologies. Since our inception, we have focused on persistent memory-based technology as the key to solving the performance limitations of traditional storage solutions in the data center environment. We have invested significantly in our research and development efforts to design hardware and software at each level of the system architecture starting with memory and optimized through the array level to capitalize on the benefits of flash technology. We were recapitalized in 2009. In 2009, we transitioned to build an enterprise-class all-flash storage solution serving diverse end markets and applications. In May 2010, we introduced our 3000 Series All Flash Array to accelerate business-critical applications.
In March 2010, we established a relationship with Toshiba, one of the two largest providers of flash memory. Through this relationship, we have developed a fundamental understanding of Toshiba’s flash specifications at the chip level, which allows us to optimize our hardware and software technologies to unlock the inherent performance capabilities of flash memory.
In September 2011, we expanded our product offering with the introduction of our 6000 Series All Flash Arrays, which is based on our four-layer architecture that significantly improves performance density, or IOPS per rack unit.
In February 2015, we introduced the Flash Storage Platform, the industry’s first vertically integrated design of software, firmware and hardware that delivers the highest performance, resiliency and availability at the same cost as legacy enterprise-class primary storage. The Flash Storage Platform runs our Concerto OS 7, a single operating system with integrated continuous data protection, in-line block de-duplication and compression, stretch metro cluster and LUN mirroring as well as our suite of other Enterprise Data Services. With our Flash Storage Platform, all active data (Tiers 0, 1, and 2) can be consolidated onto a single tier, simplifying storage administration. Additionally, with our release of Symphony Management Suite Version 3.0, the entire software functionality can all be controlled in 1, 2 or 3 clicks, with management of the entire storage estate, through a single pane of glass.
50
Table of Contents
We market and sell our products directly to end-customers and through channel partners, including systems vendors, technology partners and resellers. As of January 31, 2015, we had 140 sales and marketing employees worldwide as well as over 100 channel partners in over 30 countries. As of January 31, 2015, we believe our All Flash Arrays have been deployed by over 350 end-customers. We and our authorized service providers also sell support services to our end-customers.
An initial sale by us to an end-customer typically requires three to nine months of selling effort because we devote time to educating the prospective end-customer about the technical merits, potential cost savings and other benefits of our products in contrast to our competitors’ products. In addition, our sales process typically includes a trial deployment of our systems in the end-customer’s data center. We currently derive and expect to continue to derive a significant portion of our revenue from existing end-customers. The selling effort required for repeat orders from end-customers is usually less time-consuming than that required for initial orders. We maintain a close relationship with our end-customers through our client teams consisting of sales, service and support and technical personnel. It has generally taken between six and twelve months for us to establish a relationship with a systems vendor or technology partner, because our products are often integrated into a broader enterprise solution offered by them. Once we establish a relationship with a systems vendor or technology partner, we work with them to co-market our solutions.
A limited number of customers have accounted for a substantial majority of our revenue, and the composition of the group of our largest customers has changed from period to period. Some of our end-customers make periodic purchases of our system solutions in large quantities to complete or upgrade specific large-scale storage installations. Purchases are typically made on a purchase order basis rather than pursuant to long-term contract. Revenue from our five largest customers was 30%, 35% and 37% for fiscal 2015, 2014 and 2013, respectively. As a consequence of these concentrated purchases by a shifting customer base, we believe that revenue may fluctuate in future periods, and period-to-period comparisons of revenue and operating results are not necessarily meaningful and should not be relied upon as an indication of future performance.
Our sales are principally denominated in U.S. dollars. Revenue from customers with a bill-to location in the United States accounted for 61%, 62% and 76% of total revenue for fiscal 2015, 2014 and 2013, respectively.
We outsource the manufacturing of our hardware products to a single contract manufacturer, Flextronics. We believe this arrangement makes our operations more efficient and flexible. We procure the flash memory components used in our products directly from Toshiba. Our manufacturer procures, on our behalf, the remaining components used in our products. To date, we have not experienced a material shortage of supply of any components. However, because we only have one manufacturer qualified to manufacture our products and some of our components, such as flash memory, are procured from a single-source supplier, we could face product shortages and component shortages, which could prevent us from fulfilling customer orders.
We have experienced significant losses as we have continued to invest in our product development, customer service and sales and marketing organizations. We have funded our activities primarily through debt and equity financings. As of January 31, 2015, we had an accumulated deficit of $461.5 million. In February 2014, we announced a strategic restructuring plan designed to accelerate our growth and increase our operating leverage. The restructuring plan included three elements: a reorganization of our sales and marketing functions to align our resources around a more partner and channel-centric go-to-market model; a realignment of our engineering resources to concentrate our efforts on core product areas while reducing or eliminating investments in non-core areas; and a review of strategic alternatives for our PCIe Flash Memory Card product line.
Fiscal 2015 was a transformational year for Violin. We built a world-class management team. We restructured and refocused the business, exiting the PCIe card segment and reducing our quarterly cash burn rate by nearly 60%. We strengthened the balance sheet by raising $120 million through a convertible senior note offering. And, we introduced multiple new products, including our Windows Flash Array, Concerto data management services and our de-duplication and compression technology, culminating in the Flash Storage Platform, which bring all
51
Table of Contents
our technology together in one solution to serve the primary storage market for large enterprises. We believe the Flash Storage Platform increases our addressable market significantly, creating a large opportunity for our customer, the industry and us.
We had total revenue of $79.0 million, $107.7 million and $73.8 million for fiscal 2015, 2014 and 2013, respectively. Our headcount decreased to 329 as of January 31, 2015 from 437 employees as of January 31, 2014. We had a net loss of $108.9 million, $149.8 million and $109.1 million for fiscal 2015, 2014 and 2013, respectively.
Initial public offering
On October 2, 2013, we closed our IPO of 18,000,000 shares of common stock. The public offering price of the shares sold in the IPO was $9.00 per share. The total gross proceeds to us from the IPO were $162 million. After deducting underwriting discounts and commissions and IPO expenses, the aggregate net proceeds to us totaled $145.8 million.
Key Trends Affecting Our Results of Operations
Adoption of Flash-Based Solutions
There has been an increasing shift towards the use of persistent memory-based solutions by organizations. Traditional data center architectures have typically deployed disk-based storage approaches. We believe that flash memory technology has the significant potential to displace HDDs in primary storage solutions and bring storage solutions in line with other advanced data center technologies. Our success, however, depends on the adoption of flash-based solutions in enterprise data centers. A lack of demand for flash-based storage solutions for any reason, including technological challenges associated with the use of flash memory or the adoption of competing technologies and products, would adversely affect our growth prospects. To the extent more enterprise IT organizations recognize the benefits of flash memory in data center storage solutions and as the adoption of flash memory technology as primary storage increases, our target customer base will expand.
Relationships with Systems Vendors, Systems Integrators and Technology Partners
One of the keys to growing our business is our ability to broaden our routes to market and our geographic reach. A key component of this strategy is our intention to establish relationships with systems vendors, systems integrators and technology partners. Systems vendors incorporate our products into a broader enterprise solution offered by them. These relationships also allow us to leverage the account control, marketing, brand and other resources of our systems vendor partners to reach more potential customers and broaden our target markets.
System integrators design, recommend, implement and outsource storage and other hardware and software infrastructures. By working with them, we can promote our storage solutions as more efficient primary storage options; thereby lowering enterprises’ overall total cost of ownership and dramatically improving data center economics. Large system integrators have greater reach and influence in large enterprises than we do.
Technology partners allow us to enhance our product offerings by leveraging leading technologies that are well-accepted in the marketplace. Our relationships with technology partners also extend our reach into different end markets and new target end-customers. Success in establishing relationships with systems vendors, systems integrators and technology partners would allow us to grow our business by expanding our target markets and distribution capabilities.
Size of our Field Organization, Including Sales, Field Application Engineers and Customer Support Personnel
We target large customer storage deployments in the data center. Often, our end-customer relationships start with a limited initial deployment of our products to demonstrate the performance benefits of our solution. Our
52
Table of Contents
objective is to leverage initial deployments into large-scale deployments as our customers’ experience with our products and their storage performance and capacity requirements increase. In an effort to do this, we maintain a very close relationship with our end-customers through the efforts of our field organization. Our ability to grow our business and to establish a growing number of these high-touch end-customer relationships is dependent upon our ability to expand the size of our field organization in an efficient and effective manner. As we grow our field organization, we must closely monitor productivity to ensure our investments in personnel are translating into product sales and positive operating results.
Cost of Flash Memory
A significant percentage of our cost of revenue is the cost of flash memory. We have a relationship with Toshiba, our sole supplier of our flash memory components. By working closely with Toshiba on future generations of flash memory, we may be able to design our products in a more timely fashion to take advantage of the lower price per gigabyte on each successive generation of flash technology, creating a competitive advantage for us. We believe with expected price declines in flash memory over the next several years, the enterprise storage industry will reach a “tipping point,” whereby large enterprises will cease purchasing disk-based storage systems for primary storage in favor of all-flash arrays.
Although we have historically received competitive pricing from Toshiba, our agreement with Toshiba does not provide us with fixed pricing. Under the agreement with Toshiba, we are required to purchase 70% of our annual requirements of flash memory from Toshiba, subject to specified conditions, and design our products to be substantially compatible with Toshiba. However, our supply of flash memory from Toshiba is not guaranteed. There are many variables that may change our cost to procure flash memory. If the component costs of flash memory were to increase, we may not be able to pass on the cost increase to our customers, which could harm our gross margin and operating results. If the component costs of flash memory were to decrease, we may be able to leverage these cost savings into offering a more competitive solution to our end-customers.
Components of Consolidated Statements of Operations
Revenue
We derive revenue primarily from the sale of our All Flash Array products, software and related support and services. We sell our products on a purchase order basis directly to end-customers and through channel partners, including systems vendors, distributors and resellers. Our mix of sales between end-customers and channel partners impacts the average selling price of our products. We derive support services revenue from the sale of our premium support services. These support services are provided pursuant to support terms that generally are for either one- or three-year durations. Support services are typically billed in advance on an annual basis or at the inception of a multiple year support contract, and revenue is recognized ratably over the support period. We expect our support services revenue to continue to grow in future periods as support contracts are renewed and the installed base of All Flash Arrays grows.
Cost of Revenue
Cost of revenue consists primarily of component costs, amounts paid to our contract manufacturer to assemble our products, provisions for excess and obsolete inventory, shipping and logistics costs and estimated warranty obligations. The largest portion of our cost of revenue consists of the cost of flash memory components. Neither our contract manufacturer nor we enter into supply contracts with fixed pricing for our product components, including our flash memory, which can cause our cost of revenue to fluctuate from quarter to quarter. We may not be able to pass flash or component cost increases to our customers immediately or at all resulting in lower gross margins. Cost of revenue is recorded when the related product revenue is recognized. Cost of revenue also includes personnel expenses related to customer support. We intend to add customer support personnel to increase our customer support efforts as we increase the installed base of our All Flash Arrays globally.
53
Table of Contents
Operating Expenses
Operating expenses consist primarily of sales and marketing, research and development and general and administrative expenses. The largest component of our operating expenses is personnel costs, consisting of salaries, benefits and incentive compensation for our employees, including stock-based compensation. We expect operating expenses to increase slightly in absolute dollars over the next several quarters as we continue to develop our go-to-market capabilities; however, they may fluctuate from quarter to quarter or as a percentage of revenue from period to period, as we grow our revenue.
Sales and Marketing
Sales and marketing expenses consist primarily of personnel costs, incentive compensation, marketing programs, travel-related expenses, consulting expenses associated with sales and marketing activities and allocated facilities costs. Our sales personnel are typically not immediately productive, and therefore, the increase in sales and marketing expenses is not immediately offset by increased revenue and may not result in increased revenue over the long-term. The timing of our hiring of new sales personnel and the rate at which they generate incremental revenue could cause our future period-to-period financial performance to fluctuate. We have generated a larger percentage of our sales from direct sales or through resellers with whom we will be directly involved in the sales process with the end-customer. This type of selling typically requires greater involvement of our direct sales force than sales to systems vendors and may increase our sales and marketing expense as a percentage of revenue. We are focused on improving the productivity of our direct sales teams. In addition, we continue to work with our technology partners on joint solutions and to develop go-to-market capabilities through channel partners. To the extent we are successful, these activities will provide incremental sales leverage to our existing direct selling efforts.
Research and Development
Research and development expenses consist primarily of personnel costs, prototype expenses, software tools, consulting services and allocated facilities costs. Consulting services generally consist of contracted engineering consulting for specific projects on an as-required basis. We recognize research and development expense as incurred. We expect to continue to devote substantial resources to the development of our products including the development of new software capabilities. We believe that these investments are necessary to maintain and improve our competitive position. In particular, our recent hiring has been focused on software engineers. We believe our current level of personnel is sufficient to develop our products in the near term.
General and Administrative
General and administrative expenses consist primarily of personnel costs, legal expenses, consulting and professional services, insurance and allocated facilities costs for our executive, finance, human resources and legal organizations. While we expect personnel costs to be the primary component of general and administrative expenses, we also incur significant legal and accounting costs related to compliance with rules and regulations implemented by the SEC and the NYSE, as well as additional insurance, investor relations and other costs associated with being a public company.
Other Operating Expenses
Other operating expenses consist of the gain on the sale of our PCIe product line, costs associated with the restructuring activities and expenses for a legal settlement.
Other Expense, Net
Other expense, net generally consists of impairment losses on cost method investments, interest income and foreign currency gains and losses.
54
Table of Contents
Interest and Other Financing Expense
Interest and other financing expense consists of interest related to convertible notes and debt as well as amortization of deferred debt issuance costs associated with the securities. Also included in interest and other financing expense is a loss on extinguishment of debt and the costs associated with the reduction of the revolving credit facility.
Provision for Income Taxes
From inception through January 31, 2015, we incurred operating losses and, accordingly, have not recorded a provision for U.S. federal income taxes but have recorded provisions for foreign income and state taxes. As of January 31, 2015, we had approximately $232.7 million and $87.7 million of net operating loss carry forwards available to offset future taxable income for both Federal and State purposes, respectively. If not utilized, these carry forward losses will expire in various amounts for Federal and State tax purposes beginning in 2025 and 2015, respectively.
Results of Operations
The following table summarizes our consolidated statements of operations data for the periods shown (in thousands, except per share data):
| Year Ended January 31, | ||||||||||||
| 2015 | 2014 | 2013 | ||||||||||
| Revenue: |
||||||||||||
| Product revenue |
$ | 58,378 | $ | 88,321 | $ | 69,584 | ||||||
| Service revenue |
20,597 | 19,335 | 4,214 | |||||||||
|
|
|
|
|
|
|
|||||||
| Total revenue |
78,975 | 107,656 | 73,798 | |||||||||
|
|
|
|
|
|
|
|||||||
| Cost of revenue: |
||||||||||||
| Cost of product revenue (1) |
30,450 | 47,773 | 38,180 | |||||||||
| Inventory provisions due to product transitions |
19,928 | 9,154 | — | |||||||||
| Cost of service revenue (1) |
8,389 | 7,846 | 4,474 | |||||||||
|
|
|
|
|
|
|
|||||||
| Total cost of revenue |
58,767 | 64,773 | 42,654 | |||||||||
|
|
|
|
|
|
|
|||||||
| Gross profit |
20,208 | 42,883 | 31,144 | |||||||||
|
|
|
|
|
|
|
|||||||
| Operating expenses: |
||||||||||||
| Sales and marketing (1) |
61,871 | 81,104 | 61,094 | |||||||||
| Research and development (1) |
52,091 | 73,743 | 57,840 | |||||||||
| General and administrative (1) |
20,645 | 29,622 | 21,105 | |||||||||
| Gain on sale of PCIe product line |
(17,448 | ) | — | — | ||||||||
| Restructuring charges |
3,062 | 4,869 | — | |||||||||
| Litigation settlement |
652 | 350 | — | |||||||||
|
|
|
|
|
|
|
|||||||
| Total operating expenses |
120,873 | 189,688 | 140,039 | |||||||||
|
|
|
|
|
|
|
|||||||
| Loss from operations |
(100,665 | ) | (146,805 | ) | (108,895 | ) | ||||||
| Other expense, net |
(4,910 | ) | (1,389 | ) | (79 | ) | ||||||
| Interest and other financing expense |
(3,205 | ) | (1,539 | ) | (31 | ) | ||||||
|
|
|
|
|
|
|
|||||||
| Loss before income taxes |
(108,780 | ) | (149,733 | ) | (109,005 | ) | ||||||
| Income taxes |
123 | 76 | 97 | |||||||||
|
|
|
|
|
|
|
|||||||
| Net loss |
$ | (108,903 | ) | $ | (149,809 | ) | $ | (109,102 | ) | |||
|
|
|
|
|
|
|
|||||||
| Net loss per share of common stock, basic and diluted |
$ | (1.20 | ) | $ | (3.88 | ) | $ | (8.01 | ) | |||
|
|
|
|
|
|
|
|||||||
| Shares used to compute net loss per share of common stock, basic and diluted |
90,959 | 38,591 | 13,624 | |||||||||
|
|
|
|
|
|
|
|||||||
| (1) Includes stock-based compensation expense as follows (Note 7): |
||||||||||||
| Cost of product revenue |
$ | 718 | $ | 100 | $ | 150 | ||||||
| Cost of service revenue |
658 | 889 | 474 | |||||||||
| Sales and marketing |
4,792 | 10,344 | 4,061 | |||||||||
| Research and development |
9,570 | 6,900 | 3,228 | |||||||||
| General and administrative |
7,228 | 18,166 | 10,010 | |||||||||
|
|
|
|
|
|
|
|||||||
| $ | 22,966 | $ | 36,399 | $ | 17,923 | |||||||
|
|
|
|
|
|
|
|||||||
55
Table of Contents
Revenue
| Year Ended January 31, | Change in | Year Ended January 31, | Change in | |||||||||||||||||||||||||||||
| 2015 | 2014 | $ | % | 2014 | 2013 | $ | % | |||||||||||||||||||||||||
| Product revenue |
$ | 58,378 | $ | 88,321 | $ | (29,943 | ) | (34 | %) | $ | 88,321 | $ | 69,584 | $ | 18,737 | 27 | % | |||||||||||||||
| Service revenue |
20,597 | 19,335 | 1,262 | 7 | % | 19,335 | 4,214 | 15,121 | 359 | % | ||||||||||||||||||||||
|
|
|
|
|
|
|
|
|
|
|
|
|
|||||||||||||||||||||
| $ | 78,975 | $ | 107,656 | $ | (28,681 | ) | (27 | %) | $ | 107,656 | $ | 73,798 | $ | 33,858 | 46 | % | ||||||||||||||||
|
|
|
|
|
|
|
|
|
|
|
|
|
|||||||||||||||||||||
Fiscal Year 2015 Compared to Fiscal Year 2014
After four years of significant revenue growth, total revenue decreased $28.7 million from fiscal 2014 to fiscal 2015. The decrease in total revenue was due to a disruption in the sales cycle caused by a number of factors, including increased competition, especially against competitors with data efficiency software; the public disclosure at the time of our IPO of the size of our quarterly operating losses; the restructuring of our sales and marketing organization to a more efficient go-to-market model; and concern around executive turnover.
Specifically, product revenue decreased by $29.9 million due to a decrease of approximately 35% in the total number of All Flash Arrays sold and a decrease in PCIe cards of $4.2 million as we stopped selling PCIe cards in order to focus on our All Flash Array business. During fiscal 2015 and 2014, revenue associated with our 6000 Series All Flash Arrays represented $48.4 million and $74.0 million, or 83% and 84% of product revenue, respectively. In addition, software revenue increased by $1.3 million to $5.3 million in fiscal 2015 as compared to $4.0 million in fiscal 2014. The increase in service revenue of $1.3 million primarily relates to an increase in our support revenue of $6.1 million related to the continued growth in our installed base partially offset by a decrease in PCIe card development services provided to Toshiba of $5.0 million.
With the introduction of our Flash Storage Platform in January 2015, we believe we have reestablished product leadership in the All Flash Array market and expect to return to revenue growth in fiscal 2016.
Fiscal Year 2014 Compared to Fiscal Year 2013
Total revenue increase $33.9 million from fiscal 2013 to fiscal 2014. The increase in total revenue was primarily due to an increase in product revenue of $18.8 million and service revenue of $15.1 million. The product revenue increase was primarily due to an increase of approximately 21% in the total number of Flash Memory Arrays sold and our initial sales of our PCIe cards of $4.2 million and software of $4.0 million. During fiscal 2014 and 2013, revenue associated with our 6000 Series Flash Memory Arrays represented 85% and 82% of product revenue, respectively. The increase in service revenue primarily relates to the continued growth of support contracts as our installed base grew and due to the recognition of $6.0 million associated with the development services related to PCIe cards for Toshiba.
Revenue from our five largest customers for the years ended January 31, 2015, 2014 and 2013 was 30%, 35% and 37% of total revenue, respectively.
56
Table of Contents
Cost of Revenue and Gross Margin
| Year Ended January 31, | Change in | Year Ended January 31, | Change in | |||||||||||||||||||||||||||||
| 2015 | 2014 | $ | % | 2014 | 2013 | $ | % | |||||||||||||||||||||||||
| Cost of product revenue |
$ | 30,450 | $ | 47,773 | $ | (17,323 | ) | (36 | %) | $ | 47,773 | $ | 38,180 | $ | 9,593 | 25 | % | |||||||||||||||
| Inventory provisions due to product transitions |
19,928 | 9,154 | 10,774 | 118 | % | 9,154 | — | 9,154 | 100 | % | ||||||||||||||||||||||
| Cost of service revenue |
8,389 | 7,846 | 543 | 7 | % | 7,846 | 4,474 | 3,372 | 75 | % | ||||||||||||||||||||||
|
|
|
|
|
|
|
|
|
|
|
|
|
|||||||||||||||||||||
| $ | 58,767 | $ | 64,773 | $ | (6,006 | ) | (9 | %) | $ | 64,773 | $ | 42,654 | $ | 22,119 | 52 | % | ||||||||||||||||
|
|
|
|
|
|
|
|
|
|
|
|
|
|||||||||||||||||||||
| Gross Profit |
$ | 20,208 | $ | 42,883 | $ | (22,675 | ) | (53 | %) | $ | 42,883 | $ | 31,144 | $ | 11,739 | 38 | % | |||||||||||||||
|
|
|
|
|
|
|
|
|
|
|
|
|
|||||||||||||||||||||
| Product gross margin |
14 | % | 36 | % | 36 | % | 45 | % | ||||||||||||||||||||||||
| Service gross margin |
59 | % | 59 | % | 59 | % | (6 | %) | ||||||||||||||||||||||||
| Total gross margin |
26 | % | 40 | % | 40 | % | 42 | % | ||||||||||||||||||||||||
Fiscal Year 2015 Compared to Fiscal Year 2014
Cost of revenue decreased $6.0 million from $64.8 million for fiscal 2014 to $58.8 million for fiscal 2015. The decrease was primarily due to the decrease in product revenue of approximately $29.9 million offset by an increase in our inventory provision of $10.8 million in fiscal 2015 due to our product transition to the Flash Storage Platform. Based on the positive customer feedback on the new Flash Storage Platform, we expect the transition from the 6000 Series All Flash Arrays to the Flash Storage Platform will occur rapidly. Furthermore, given the size and growth of the all flash array market, we made the strategic decision to pivot our selling resources to the more competitive Flash Storage Platform. Consequently, our forecast for sales of the 6000 Series All Flash Arrays declined significantly, leading us to write-off the substantial majority of these products. Going forward, to the extent we sell the previously written-off inventory, we will realize 100% gross margin.
Gross margin declined from 40% in fiscal 2014 to 26% in fiscal 2015. Excluding the inventory provisions from each year, our overall gross margin improved from 48% to 51% and our product gross margin improved from 46% to 48%. The improvement is primarily due to greater sales of our 6264 All Flash Array and software products, which have higher gross margin profiles, in fiscal 2015 as compared to fiscal 2014 partially offset by heavily discounted 32nm products and the introduction of our “Pay-As-You-Grow” model in the second quarter of fiscal 2015. The Pay-As-You-Grow model provides our customers with the ability to expand capacity non-disruptively. We accomplish this by initially shipping full capacity hardware at lower capacity prices, resulting in lower gross margins initially. If and when the customer buys capacity upgrades in the future, we will recognize 100% gross margin. Going forward, we expect our product gross margins will improve due to sales of the more competitive Flash Storage Platform, cost reductions and greater software content.
Service gross margin was 59% for the years ended January 31, 2015 and 2014. We expect our service gross margin will continue to be in the high fifties.
Fiscal Year 2014 Compared to Fiscal Year 2013
Cost of revenue increased $22.1 million from $42.7 million for fiscal 2013 to $64.8 million for fiscal 2014. The increase was primarily due to provision for excess and obsolete inventory of $9.2 million in fiscal 2014 that we recognized relating to inventory and non-cancellable purchase commitments associated with PCIe card inventory combined with an approximately 21% increase in the number of Flash Memory Arrays sold. The increase in cost of service revenue was primarily due to an increase in personnel costs as we increased headcount to support our increased customer base and, to a lesser extent, costs associated with the Toshiba development agreement. Gross profit increased $11.7 million from fiscal 2013 to fiscal 2014.
57
Table of Contents
Gross margin decreased to 40% for the year ended January 31, 2014 compared to 42% for fiscal 2013 primarily due to provision for excess and obsolete inventory of $9.2 million that we recognized relating to inventory and non-cancellable purchase commitments associated with PCIe card inventory, partially offset by improved product margins resulting from the introduction of our 6264 Flash Memory Array, which has a higher gross margin due to its larger capacity and higher average selling price. Service margin increased due primarily to services provided under our development agreement with Toshiba and to improved economies of scale associated with our support services as our larger installed base grew.
Operating Expenses
| Year Ended January 31, | Change in | Year Ended January 31, | Change in | |||||||||||||||||||||||||||||
| 2015 | 2014 | $ | % | 2014 | 2013 | $ | % | |||||||||||||||||||||||||
| Sales and marketing |
$ | 61,871 | $ | 81,104 | $ | (19,233 | ) | (24 | %) | $ | 81,104 | $ | 61,094 | $ | 20,010 | 33 | % | |||||||||||||||
| Research and development |
52,091 | 73,743 | (21,652 | ) | (29 | %) | 73,743 | 57,840 | 15,903 | 27 | % | |||||||||||||||||||||
| General and administrative |
20,645 | 29,622 | (8,977 | ) | (30 | %) | 29,622 | 21,105 | 8,517 | 40 | % | |||||||||||||||||||||
| Gain on sale of PCIe product line |
(17,448 | ) | — | (17,448 | ) | (100 | %) | — | — | — | * | |||||||||||||||||||||
| Restructuring charges |
3,062 | 4,869 | (1,807 | ) | (37 | %) | 4,869 | — | 4,869 | 100 | % | |||||||||||||||||||||
| Litigation settlement |
652 | 350 | 302 | 86 | % | 350 | — | 350 | 100 | % | ||||||||||||||||||||||
|
|
|
|
|
|
|
|
|
|
|
|
|
|||||||||||||||||||||
| $ | 120,873 | $ | 189,688 | $ | (68,815 | ) | $ | 189,688 | $ | 140,039 | $ | 49,649 | ||||||||||||||||||||
|
|
|
|
|
|
|
|
|
|
|
|
|
|||||||||||||||||||||
| * | Not meaningful |
Fiscal Year 2015 Compared to Fiscal Year 2014
Sales and marketing expense decreased $19.2 million from fiscal 2014 to fiscal 2015. The decrease was primarily due to a decrease in personnel related expenses of $20.1 million, including a reduction in stock-based compensation expenses of $5.6 million. In the fourth quarter of fiscal 2014, we began reducing our sales and marketing organization to better align our expense structure with revenue. As of January 31, 2015, we had 140 sales and marketing employees compared to 189 sales and marketing employees at January 31, 2014. Travel and entertainment expenses also decreased $1.9 million as a result. These decreases were offset by increases in marketing expenses of $1.2 million and depreciation and amortization of $1.3 million.
Research and development expenses decreased $21.7 million from fiscal 2014 to fiscal 2015 primarily due to a decrease in personnel-related costs of $8.4 million, which includes an increase in stock-based compensation of $2.7 million. The decrease is primarily due to the transfer of an assembled workforce in connection with the sale of our PCIe product line and to having less employees throughout the year as compared to the prior year. The number of research and development employees was 128 as of January 31, 2015 and compares to 182 as of January 31, 2014. We also experienced decreases in licensed software fees of $8.7 million, depreciation and amortization of $2.7 million and outside services costs of $0.8 million. In fiscal 2014, we expensed $6.0 million related to a software OEM agreement.
General and administrative expenses decreased $9.0 million from fiscal 2014 to fiscal 2015 primarily due to a decrease in stock-based compensation of $10.9 million primarily related to the accelerated vesting of equity awards held by certain former executives in the prior year and outside services of $1.3 million primarily related to fees associated with the CEO search incurred in the prior year. These decreases were partially offset by increases in personnel costs of $1.9 million primarily related to the CEO’s sign-on bonus being recognized over 18 months, insurance and business license expenses associated with being a public company of $0.9 million and bad debt expenses of $0.4 million.
58
Table of Contents
In May 2014, we entered into an asset purchase agreement with SK Hynix to sell certain intellectual property rights and fixed assets as well as transfer an assembled workforce related to our PCIe product line. As consideration, SK Hynix agreed to pay us $23.0 million and assume certain employee-related liabilities of approximately $0.5 million. We closed the transaction in July 2014 and recorded a gain of $17.4 million after deducting from the aggregate consideration (i) compensation paid to the transferred workforce of $3.2 million, which includes $1.4 million stock-based compensation, (ii) professional fees of $2.4 million and (iii) the net book value of the fixed assets sold of $0.5 million.
Beginning in the fourth quarter of fiscal 2014, we began a strategic restructuring of our operations to focus on accelerating revenue growth and increasing operating leverage. For the year ended January 31, 2015, we recognized restructuring charges of $3.1 million, consisting of excess facilities of $1.8 million and severance expenses of $1.2 million. With the closing of the transaction with SK Hynix in the second quarter of fiscal 2015, we completed our restructuring plan.
Fiscal Year 2014 Compared to Fiscal Year 2013
Sales and marketing expense increased $20.0 million from fiscal 2013 to fiscal 2014. The increase was primarily due to an increase in personnel related expenses of $13.0 million. We continued to increase the number of sales and marketing employees from 218 as of January 31, 2013 to 259 as of October 31, 2013. In the fourth quarter of fiscal 2014, we began reducing our sales and marketing organization to better align our expense structure with revenue. As of January 31, 2014, we had 189 sales and marketing employees compared to 218 sales and marketing employees at January 31, 2013. We also incurred increased expenses relating to stock-based compensation of $6.2 million and professional and consulting fees of $1.6 million.
Research and development expenses increased $15.9 million from fiscal 2013 to fiscal 2014 primarily due to an increase in personnel-related costs of $5.1 million. The increase is primarily due to having more employees throughout the year as compared to the prior year. In fiscal 2013, we ramped up our research and development personnel. The number of research and development employees was 182 as of January 31, 2014 and compares to 194 as of January 31, 2013 and 131 employees as of January 31, 2012. We also incurred increased expenses related to licensed software fees of $6.1 million, stock-based compensation of $3.7 million, facility costs of $2.1 million and professional and consulting fees of $0.6 million partially offset by a decrease in software tools and prototypes of $1.2 million.
General and administrative expenses increased $8.5 million from fiscal 2013 to fiscal 2014 primarily due to an increase in stock-based compensation of $8.1 million related primarily to the accelerated vesting of equity awards held by certain former executives and recruiting fees of $1.2 million, partially offset by a reduction in audit fees of $0.7 million and personnel related expenses of $0.3 million.
For the year ended January 31, 2014, we recognized restructuring and transition charges of $4.9 million related to the implementation of strategic restructuring initiatives. During the fourth quarter of fiscal 2014, we incurred severance expenses related to restructuring charges of $2.7 million for involuntary termination of employees, an impairment of assets of $1.2 million, excess facility charges of $0.5 million and other transition related expenses of $0.4 million.
Other Expense, Net
Other expense, net increased $3.5 million in fiscal 2015 to $4.9 million primarily due to the impairment of a cost-method investment of $3.5 million. In addition, we incurred exchange rate losses of $1.4 million primarily related to Euro-denominated cash balances, accounts receivable and intercompany accounts. For the year ended January 2014, other expense, net consisted primarily of an impairment of a cost-method investment of $0.7 million and exchange rate losses of $0.4 million primarily related to foreign currency denominated accounts receivable.
59
Table of Contents
Interest and Other Financing Expense
Interest and other financing expense for the year ended January 31, 2015 consists primarily of interest accrued on our convertible senior notes of $1.7 million, amortization of debt issuance costs of $0.6 million and loss on extinguishment of debt of $0.4 million. This compares to interest expense of $1.0 million on amounts outstanding on the TriplePoint facility, including the “end-of-term” interest payments, in the prior year.
60
Table of Contents
Quarterly Results of Operations Data
The following tables set forth our unaudited quarterly consolidated statements of operations data in dollars and as a percentage of total revenue for each of the eight quarters in the period ended January 31, 2015. We have prepared the quarterly consolidated statements of operations data on a basis consistent with the audited consolidated financial statements included in Part II, Item 8, “Financial Statements and Supplementary Data” in this Annual Report on Form 10-K. In the opinion of management, the financial information reflects all adjustments, consisting only of normal recurring adjustments, which we consider necessary for a fair presentation of this data. This information should be read in conjunction with the audited consolidated financial statements and related notes included in Part II, Item 8, “Financial Statements and Supplementary Data” in this Annual Report on Form 10-K. The results of historical periods are not necessarily indicative of the results of operations for any future period.
| Three Months Ended | ||||||||||||||||||||||||||||||||
| Jan. 31, 2015 |
Oct. 31, 2014 |
Jul. 31, 2014 |
Apr. 30, 2014 |
Jan. 31, 2014 |
Oct. 31, 2013 |
Jul. 31 2013 |
Apr. 30, 2013 |
|||||||||||||||||||||||||
| (In thousands) | ||||||||||||||||||||||||||||||||
| Revenue: |
||||||||||||||||||||||||||||||||
| Product revenue |
$ | 14,530 | $ | 16,887 | $ | 14,188 | $ | 12,773 | $ | 20,832 | $ | 21,416 | $ | 23,595 | $ | 22,478 | ||||||||||||||||
| Service revenue |
5,990 | 4,842 | 4,405 | 5,360 | 7,215 | 6,890 | 2,910 | 2,320 | ||||||||||||||||||||||||
|
|
|
|
|
|
|
|
|
|
|
|
|
|
|
|
|
|||||||||||||||||
| Total revenue |
20,520 | 21,729 | 18,593 | 18,133 | 28,047 | 28,306 | 26,505 | 24,798 | ||||||||||||||||||||||||
|
|
|
|
|
|
|
|
|
|
|
|
|
|
|
|
|
|||||||||||||||||
| Cost of revenue : |
||||||||||||||||||||||||||||||||
| Cost of product revenue (1) |
8,373 | 8,477 | 6,934 | 6,666 | 10,480 | 10,555 | 13,661 | 13,077 | ||||||||||||||||||||||||
| Inventory provisions due to product transitions |
19,928 | — | — | — | 9,154 | — | — | — | ||||||||||||||||||||||||
| Cost of service revenue (1) |
2,421 | 2,099 | 1,971 | 1,898 | 2,142 | 2,382 | 1,673 | 1,649 | ||||||||||||||||||||||||
|
|
|
|
|
|
|
|
|
|
|
|
|
|
|
|
|
|||||||||||||||||
| Total cost of revenue |
30,722 | 10,576 | 8,905 | 8,564 | 21,776 | 12,937 | 15,334 | 14,726 | ||||||||||||||||||||||||
|
|
|
|
|
|
|
|
|
|
|
|
|
|
|
|
|
|||||||||||||||||
| Gross profit |
(10,202 | ) | 11,153 | 9,688 | 9,569 | 6,271 | 15,369 | 11,171 | 10,072 | |||||||||||||||||||||||
|
|
|
|
|
|
|
|
|
|
|
|
|
|
|
|
|
|||||||||||||||||
| Operating expenses : |
||||||||||||||||||||||||||||||||
| Sales and marketing (1) |
14,871 | 15,660 | 15,107 | 16,233 | 22,929 | 21,299 | 18,624 | 18,252 | ||||||||||||||||||||||||
| Research and development (1) |
10,724 | 12,537 | 12,994 | 15,836 | 18,898 | 20,111 | 18,800 | 15,934 | ||||||||||||||||||||||||
| General and administrative (1) |
4,769 | 4,890 | 5,154 | 5,832 | 14,845 | 6,627 | 4,040 | 4,110 | ||||||||||||||||||||||||
| Gain on sale of PCIe product line |
— | — | (17,448 | ) | — | — | — | — | — | |||||||||||||||||||||||
| Restructuring charges |
— | — | 1,306 | 1,756 | 4,869 | — | — | — | ||||||||||||||||||||||||
| Litigation settlement |
— | — | 652 | — | — | 350 | — | — | ||||||||||||||||||||||||
|
|
|
|
|
|
|
|
|
|
|
|
|
|
|
|
|
|||||||||||||||||
| Total operating expenses |
30,364 | 33,087 | 17,765 | 39,657 | 61,541 | 48,387 | 41,464 | 38,296 | ||||||||||||||||||||||||
|
|
|
|
|
|
|
|
|
|
|
|
|
|
|
|
|
|||||||||||||||||
| Loss from operations |
(40,566 | ) | (21,934 | ) | (8,077 | ) | (30,088 | ) | (55,270 | ) | (33,018 | ) | (30,293 | ) | (28,224 | ) | ||||||||||||||||
| Other income (expense), net |
(4,421 | ) | (427 | ) | (181 | ) | 119 | (1,086 | ) | (17 | ) | (6 | ) | (280 | ) | |||||||||||||||||
| Interest expense |
(1,791 | ) | (1,122 | ) | (124 | ) | (168 | ) | (137 | ) | (1,060 | ) | (342 | ) | — | |||||||||||||||||
|
|
|
|
|
|
|
|
|
|
|
|
|
|
|
|
|
|||||||||||||||||
| Loss before income taxes |
(46,778 | ) | (23,483 | ) | (8,382 | ) | (30,137 | ) | (56,493 | ) | (34,095 | ) | (30,641 | ) | (28,504 | ) | ||||||||||||||||
| Income taxes |
43 | 44 | 30 | 6 | 31 | 18 | 7 | 20 | ||||||||||||||||||||||||
|
|
|
|
|
|
|
|
|
|
|
|
|
|
|
|
|
|||||||||||||||||
| Net loss |
$ | (46,821 | ) | $ | (23,527 | ) | $ | (8,412 | ) | $ | (30,143 | ) | $ | (56,524 | ) | $ | (34,113 | ) | $ | (30,648 | ) | $ | (28,524 | ) | ||||||||
|
|
|
|
|
|
|
|
|
|
|
|
|
|
|
|
|
|||||||||||||||||
| Net loss per share of common stock, basic and diluted |
$ | (0.50 | ) | $ | (0.25 | ) | $ | (0.09 | ) | $ | (0.35 | ) | $ | (0.69 | ) | $ | (0.85 | ) | $ | (1.98 | ) | $ | (1.86 | ) | ||||||||
|
|
|
|
|
|
|
|
|
|
|
|
|
|
|
|
|
|||||||||||||||||
| Shares used to compute net loss per share of common stock, basic and diluted |
93,611 | 92,373 | 91,410 | 85,951 | 82,514 | 40,362 | 15,507 | 15,358 | ||||||||||||||||||||||||
|
|
|
|
|
|
|
|
|
|
|
|
|
|
|
|
|
|||||||||||||||||
| (1) Includes stock-based compensation expense as follows (Note 7): |
|
|||||||||||||||||||||||||||||||
| Cost of product revenue |
$ | 104 | $ | 156 | $ | 279 | $ | 179 | $ | 24 | $ | 37 | $ | 22 | $ | 17 | ||||||||||||||||
| Cost of service revenue |
268 | 210 | 93 | 87 | 114 | 124 | 425 | 226 | ||||||||||||||||||||||||
| Sales and marketing |
879 | 1,291 | 1,191 | 1,437 | 4,963 | 2,101 | 1,763 | 1,517 | ||||||||||||||||||||||||
| Research and development |
1,735 | 1,735 | 1,834 | 4,266 | 2,452 | 1,828 | 1,260 | 1,360 | ||||||||||||||||||||||||
| General and administrative |
2,277 | 1,861 | 1,419 | 1,671 | 10,647 | 4,165 | 1,653 | 1,701 | ||||||||||||||||||||||||
|
|
|
|
|
|
|
|
|
|
|
|
|
|
|
|
|
|||||||||||||||||
| $ | 5,263 | $ | 5,253 | $ | 4,816 | $ | 7,640 | $ | 18,200 | $ | 8,255 | $ | 5,123 | $ | 4,821 | |||||||||||||||||
|
|
|
|
|
|
|
|
|
|
|
|
|
|
|
|
|
|||||||||||||||||
61
Table of Contents
The following table sets forth consolidated results of operations for the specified periods as a percentage of our revenues for those periods.
| Three Months Ended | ||||||||||||||||||||||||||||||||
| Jan. 31, 2015 |
Oct. 31, 2014 |
Jul. 31, 2014 |
Apr. 30, 2014 |
Jan. 31, 2014 |
Oct. 31, 2013 |
Jul. 31 2013 |
Apr. 30, 2013 |
|||||||||||||||||||||||||
| (As percentage of total revenue) | ||||||||||||||||||||||||||||||||
| Revenue: |
||||||||||||||||||||||||||||||||
| Product revenue |
71 | % | 78 | % | 76 | % | 70 | % | 74 | % | 76 | % | 89 | % | 91 | % | ||||||||||||||||
| Service revenue |
29 | 22 | 24 | 30 | 26 | 24 | 11 | 9 | ||||||||||||||||||||||||
|
|
|
|
|
|
|
|
|
|
|
|
|
|
|
|
|
|||||||||||||||||
| Total revenue |
100 | 100 | 100 | 100 | 100 | 100 | 100 | 100 | ||||||||||||||||||||||||
|
|
|
|
|
|
|
|
|
|
|
|
|
|
|
|
|
|||||||||||||||||
| Cost of revenue: |
||||||||||||||||||||||||||||||||
| Cost of product revenue |
41 | 39 | 37 | 37 | 37 | 37 | 52 | 53 | ||||||||||||||||||||||||
| Inventory provisions due to product transitions |
97 | — | — | — | 33 | — | — | — | ||||||||||||||||||||||||
| Cost of service revenue |
12 | 10 | 11 | 10 | 8 | 8 | 6 | 7 | ||||||||||||||||||||||||
|
|
|
|
|
|
|
|
|
|
|
|
|
|
|
|
|
|||||||||||||||||
| Total cost of revenue |
150 | 49 | 48 | 47 | 78 | 45 | 58 | 60 | ||||||||||||||||||||||||
|
|
|
|
|
|
|
|
|
|
|
|
|
|
|
|
|
|||||||||||||||||
| Gross profit |
(50 | ) | 51 | 52 | 53 | 22 | 55 | 42 | 40 | |||||||||||||||||||||||
|
|
|
|
|
|
|
|
|
|
|
|
|
|
|
|
|
|||||||||||||||||
| Operating expenses: |
||||||||||||||||||||||||||||||||
| Sales and marketing |
72 | 72 | 81 | 90 | 82 | 75 | 70 | 74 | ||||||||||||||||||||||||
| Research and development |
52 | 58 | 70 | 87 | 67 | 71 | 71 | 64 | ||||||||||||||||||||||||
| General and administrative |
23 | 23 | 28 | 32 | 53 | 23 | 15 | 17 | ||||||||||||||||||||||||
| Gain on sale of PCIe product line |
— | — | (94 | ) | — | — | — | — | — | |||||||||||||||||||||||
| Restructuring charges |
— | — | 7 | 10 | 17 | — | — | — | ||||||||||||||||||||||||
| Litigation settlement |
— | — | 4 | — | — | 1 | — | — | ||||||||||||||||||||||||
|
|
|
|
|
|
|
|
|
|
|
|
|
|
|
|
|
|||||||||||||||||
| Total operating expenses |
147 | 153 | 96 | 219 | 219 | 170 | 156 | 155 | ||||||||||||||||||||||||
|
|
|
|
|
|
|
|
|
|
|
|
|
|
|
|
|
|||||||||||||||||
| Loss from operations |
(197 | ) | (102 | ) | (44 | ) | (166 | ) | (197 | ) | (115 | ) | (114 | ) | (115 | ) | ||||||||||||||||
| Other income (expense), net |
(22 | ) | (2 | ) | (1 | ) | 1 | (4 | ) | — | — | (1 | ) | |||||||||||||||||||
| Interest expense |
(9 | ) | (5 | ) | (1 | ) | (1 | ) | — | (4 | ) | (1 | ) | — | ||||||||||||||||||
|
|
|
|
|
|
|
|
|
|
|
|
|
|
|
|
|
|||||||||||||||||
| Loss before income taxes |
(228 | ) | (109 | ) | (46 | ) | (166 | ) | (201 | ) | (119 | ) | (115 | ) | (116 | ) | ||||||||||||||||
| Income taxes |
— | — | — | — | — | — | — | — | ||||||||||||||||||||||||
|
|
|
|
|
|
|
|
|
|
|
|
|
|
|
|
|
|||||||||||||||||
| Net loss |
(228 | )% | (109 | )% | (46 | )% | (166 | )% | (201 | )% | (119 | )% | (115 | )% | (116 | )% | ||||||||||||||||
|
|
|
|
|
|
|
|
|
|
|
|
|
|
|
|
|
|||||||||||||||||
Liquidity and Capital Resources
Primary Sources of Liquidity
As of January 31, 2015, our principal sources of liquidity were our cash, cash equivalents, restricted cash and short-term investments of $156.2 million and accounts receivable of $15.1 million. Historically, our primary sources of liquidity have been from the issuance of common stock, convertible notes and convertible preferred stock. In October 2013, we completed our IPO, in which we issued and sold 18,000,000 shares and received net proceeds of $145.8 million.
In September 2014, we issued $120 million of convertible senior notes, which included $15 million of principal amount issued pursuant to an over-allotment option granted to the initial purchasers, and received net proceeds of $115.4 million.
62
Table of Contents
In October 2014, we entered into a $20.0 million secured revolving line of credit with Silicon Valley Bank, or SVB. The Company’s obligations under the agreement are secured by a first priority security interest in the Company’s accounts receivable and the proceeds therefrom.
Cash Flow Analysis
| Year Ended January 31, | ||||||||||||
| 2015 | 2014 | 2013 | ||||||||||
| Net cash provided by (used in): |
||||||||||||
| Operating activities |
$ | (79,503 | ) | $ | (81,548 | ) | $ | (76,910 | ) | |||
| Investing activities |
7,576 | (68,999 | ) | (15,540 | ) | |||||||
| Financing activities |
124,953 | 173,442 | 87,224 | |||||||||
Operating Activities
We used net cash in operating activities for the year ended January 31, 2015 of $79.5 million, which largely reflects our net loss less non-cash items and the payment of accrued liabilities during the fiscal year partially offset by a decrease in inventory. Specifically, we had a net loss of $108.9 million for the year ended January 31, 2015, less the following non-cash items: stock-based compensation of $23.0 million, provision for excess and obsolete inventory of $21.0 million and depreciation and amortization of $11.0 million and increased by a gain on the sale of PCIe product line of $17.5 million. In addition, we paid down accrued liabilities by $17.1 million, which relates primarily to the payment of non-cancellable inventory purchase commitments, the refund of fees associated with the termination of our PCIe development contract with Toshiba and a litigation settlement. These reductions in cash were offset by an increase in cash due to lower inventory of $9.1 million.
Our net cash used in operating activities for fiscal 2014 was $81.5 million and was primarily due to costs related to building the infrastructure to support our current and anticipated growth. Our net loss for fiscal 2014 was $149.8 million and included non-cash stock-based compensation of $36.4 million, depreciation of $12.6 million, impairment charges of $2.0 million and a provision for excess and obsolete inventory related to our PCIe card inventory of $9.2 million.
Our net cash used in operating activities for fiscal 2013 was $76.9 million and was primarily due to increased headcount to support our current and anticipated growth. Our headcount increased in all areas of our business from 252 employees as of January 31, 2012 to 449 employees as of January 31, 2013. Our net loss for fiscal 2013 was $109.1 million and included non-cash stock-based compensation of $17.9 million and depreciation of $9.0 million.
Investing Activities
Cash flows from investing activities generally consist of purchase of property and equipment, including product development and testing lab equipment used to support engineers and support service personnel. We have purchased property and equipment of $11.8 million, $9.3 million and $10.6 million for fiscal 2015, 2014 and 2013, respectively. A large portion of this equipment is All Flash Arrays that we have capitalized. The majority of laboratory equipment purchased in fiscal 2015 relates to new products introduced during the year. In addition, we have transferred inventory into lab equipment within fixed assets of $0.7 million, $4.4 million and $3.6 million during fiscal 2015, 2014 and 2013, respectively, which has been reflected as a non-cash transaction in the statements of cash flows.
In addition to purchases of property and equipment, cash from investing activities for the year ended January 31, 2015 was attributable to proceeds from the sale of the PCIe product line of $23.0 million offset by $2.3 million we placed in escrow and by net purchases of short-term investments of $1.4 million.
63
Table of Contents
Cash flows from investing activities in fiscal 2014 generally consist of purchase of property and equipment, including product development and testing lab equipment used to support engineers and support service personnel. Our purchases of product development and testing lab equipment had increased over time as we had increased the number of our engineers and support service personnel and as we introduced new products. We purchased property and equipment of $9.3 million for fiscal 2014, a large portion of which was All Flash Arrays that we capitalized. In addition, we transferred inventory into lab equipment within fixed assets of $4.4 million during fiscal 2014
In addition to purchases of property and equipment, cash used in investing activities for the year ended January 31, 2014 was attributable to purchases of short-term investments of $66.2 million, partially offset by maturity of short-term investments of $7.1 million.
In addition to purchases of property and equipment, cash used in investing activities for the year ended January 31, 2013 was attributable to purchases of cost method investments of $5.0 million.
Financing Activities
Cash flows from financing activities for the year ended January 31, 2015 primarily include net proceeds from convertible debt of $115.4 million, net proceeds from borrowings on our line of credit of $9.5 million, and proceeds from the exercise of common stock options and from the sale of common stock of $3.2 million and $0.9 million, respectively, offset by taxes paid related to net share settlement of equity awards of $3.9 million.
We generated $173.4 million of net cash from financing activities in fiscal 2014. This consisted of proceeds from our IPO, net of underwriting discount and commission and offering costs, of $145.8 million and proceeds from issuance of preferred stock, net of issuance costs, and convertible notes of $21.0 million and $5.2 million, respectively.
We generated $87.2 million of net cash from financing activities in fiscal 2013, primarily due to $86.3 million of net proceeds from the issuance of Series D convertible preferred stock and $2.7 million from the issuance of convertible notes.
Future Capital Requirements
As of January 31, 2015, we have cash, cash equivalents, restricted cash and short-term investments of $156.2 million. For the year ended January 31, 2015, cash used in operations was primarily funded through borrowing as well as from the sale of the PCIe product line during the year. Our future capital requirements will depend on many factors, including our rate of revenue growth, changes in gross margin, the transition of our sales and marketing activities, the timing and extent of spending to support product development efforts, the timing of new product introductions and related inventory commitments, the building of infrastructure to support our growth, the continued market acceptance of our products and possible acquisitions of, or investments in businesses, technologies or other assets.
In October 2014, we entered into a $20.0 million secured revolving credit facility with SVB. The Company’s obligations under the agreement are secured by a first priority security interest in the Company’s accounts receivable and the proceeds therefrom. Borrowings under this facility will bear interest at a rate per annum of either (a) the sum of (i) the Eurodollar rate plus (ii) 5.00%, or (b) the sum of (i) ABR plus (ii) 2.00%. The line of credit expires on October 24, 2016, subject to acceleration upon certain specified events of default. As of January 31, 2015, we had $10.0 million outstanding on the line of credit.
The credit agreement with SVB contains customary representations and warranties, as well as affirmative and negative covenants. The credit agreement contains financial covenants, including covenants requiring us to maintain minimum consolidated quick assets, a minimum consolidated adjusted quick ratio and minimum
64
Table of Contents
revenue relative to the revenue plan. The credit agreement also contains certain affirmative covenants, including covenants regarding the payment of taxes and other obligations, maintenance of insurance, reporting requirements and compliance with applicable laws and regulations. In addition, the credit agreement contains certain negative covenants, including restrictions on liens, indebtedness, fundamental changes, dispositions, restricted payments and investments.
An event of default under our Credit Agreement with SVB occurred solely because we did not satisfy a financial condition covenant requiring us to generate revenue for the fourth quarter of fiscal 2015 in an amount not less than 80% of the amount of revenue we forecasted for the quarter in our annual operating plan. We requested, and SVB agreed, subject to certain terms and conditions, to waive the event of default. We and SVB agreed, subject to the same terms and conditions, to amend the Credit Agreement to provide that our quarterly revenue forecast for fiscal 2016 will be based upon the annual operating plan we delivered to SVB on March 11, 2015.
In September 2014, we completed a convertible senior note offering, or the Notes, and received net proceeds of $115.4 million. With respect to the Notes, the credit agreement contains a covenant that prohibits us from paying cash upon conversion (other than cash in lieu of fractional shares), redemption, repurchase or other payment in respect of the principal amount of any of the Notes. The credit agreement also contains certain affirmative covenants, including covenants regarding the payment of taxes and other obligations, maintenance of insurance, reporting requirements and compliance with applicable laws and regulations. Noncompliance with one or more of the covenants and restrictions could result in the amounts borrowed under the agreement becoming immediately due and payable.
During the time that the Notes are outstanding, we may not at any time incur any indebtedness other than permitted debt, which is defined as: (a) revolving debt secured by our accounts receivable and the proceeds therefrom in a principal amount not to exceed $50 million; (b) unsecured indebtedness (including the Notes) in a principal amount not to exceed (when combined with any indebtedness incurred under clause (c) below) $150 million; (c) secured indebtedness secured by our intellectual property in a principal amount not to exceed (when combined with any indebtedness incurred under clause (b) above) $150 million; and (d) unsecured subordinated indebtedness in a principal amount not to exceed $50 million. Furthermore, we may incur indebtedness if (a) we are not in default and such additional debt would not put us into default and (ii) the consolidated leverage ratio, as defined, after taking the additional debt into account does not exceed 5:1. We were in compliance with these covenants as of January 31, 2015.
In July 2013, we entered into a $7.5 million line of credit with Comerica Bank, or Comerica. Under the line of credit, we were able to borrow up to 80% of our current US-based receivables or $7.5 million, whichever was lower. The line of credit was secured by our accounts receivable, collections thereon and intellectual property and bore interest at the rate of prime plus 1%. In August 2014, we repaid all outstanding amounts under the line of credit and terminated the Loan and Security Agreement with Comerica.
In May 2013, we entered into a $50.0 million debt facility with TriplePoint Capital LLC, or TriplePoint, which was available to us for one year. The debt facility with TriplePoint terminated in May 2014.
We believe that our existing cash, cash equivalents, short-term investments and available line of credit will be sufficient to meet our working capital and capital expenditure requirements for at least the next twelve months. Although management believes existing financial resources and available line of credit will be sufficient to fund our operations and capital expenditures for at least the next twelve months, it may be necessary thereafter to finance our future operations and capital expenditures by raising additional capital. However, there can be no assurances that capital will be available on acceptable terms to us or at all, or that we will ever achieve profitable operations. If we are not able to raise additional capital or access our debt facilities in sufficient amounts to fund our operations in the future, it could have a negative impact on our business plans.
Stock Split
In September 2013, we completed a two-for-one reverse stock split of our common stock, with an automatic adjustment to the conversion ratio of the outstanding shares of convertible preferred stock to reflect the same
65
Table of Contents
reverse stock split ratio upon conversion of the convertible preferred stock into common stock. Based on the adjusted conversion ratio, two outstanding shares of convertible preferred stock converted into one share of common stock, except for Series D convertible preferred stock for which every two shares converted into 1.016998402 shares of common stock. All information related to common stock, stock options, RSUs and earnings per share for prior periods has been retroactively adjusted to give effect to the two-for-one reverse stock split.
Off-Balance Sheet Arrangements
During the periods presented, we did not have any relationships with unconsolidated entities or financial partnerships, such as entities often referred to as structured finance or special purpose entities, which would have been established for the purpose of facilitating off-balance sheet arrangements or other contractually narrow or limited purpose.
Contractual Obligations
The following summarizes our contractual obligations as of January 31, 2015 (in thousands):
| Less than 1 | 2 to 3 | 4 to 5 | After 5 | |||||||||||||||||
| Total | year | years | years | years | ||||||||||||||||
| Facility operating lease commitments |
$ | 7,805 | $ | 3,896 | $ | 3,909 | $ | — | $ | — | ||||||||||
| Purchase commitments (1)(2)(3) |
30,311 | 14,311 | 5,500 | 3,500 | 7,000 | |||||||||||||||
|
|
|
|
|
|
|
|
|
|
|
|||||||||||
| $ | 38,116 | $ | 18,207 | $ | 9,409 | $ | 3,500 | $ | 7,000 | |||||||||||
|
|
|
|
|
|
|
|
|
|
|
|||||||||||
| (1) | Purchase obligations include non-cancelable purchase orders for raw materials inventory and others. Purchase obligations under purchase orders or contracts that we can cancel without a significant penalty, such as routine purchases for operating expenses, are not included in the above table. |
| (2) | In June 2012, we entered into an agreement with the Forty Niners SC Stadium Company LLC, or the Team. As part of this agreement, we will receive advertising, branding in various locations throughout the stadium and the ability to meet with potential and existing partners and customers at sporting and other events at the stadium in Santa Clara, California. We committed to make payments to the Team of $1.75 million per year through fiscal 2024. Purchase obligations include all amounts we are obligated to pay under this agreement totaling $15.7 million. |
| (3) | In July 2012, we entered into OEM agreement with a software vendor, which obligates us to pay an aggregate of $5.0 million in minimum royalty fees over a three-year period beginning after the first commercial shipment of the related product. During April 2013, we made our first commercial shipment under the agreement and began paying royalties. Purchase obligations include all remaining amounts we are obligated to pay under this agreement totaling $3.2 million. |
Critical Accounting Policies and Estimates
Our consolidated financial statements are prepared in accordance with U.S. generally accepted accounting principles, or GAAP. The preparation of these consolidated financial statements requires us to make estimates and assumptions that affect the reported amounts of assets, liabilities, revenue, expenses and related disclosures. These estimates and assumptions are often based on judgments that we believe to be reasonable under the circumstances at the time made, but all such estimates and assumptions are inherently uncertain and unpredictable. Actual results may differ from those estimates and assumptions, and it is possible that others, applying their own judgment to the same facts and circumstances, could develop and support alternative estimates and assumptions that would result in material changes to our operating results and financial condition. We evaluate our estimates and assumptions on an ongoing basis. Our estimates are based on historical experience and various other assumptions that we believe to be reasonable under the circumstances. Our actual results could differ from these estimates.
66
Table of Contents
We believe that the assumptions and estimates associated with revenue recognition, stock-based compensation, inventory valuation, warranty liability and income taxes have the greatest potential impact on our consolidated financial statements. Therefore, we consider these to be our critical accounting policies and estimates. For further information on all of our significant accounting policies, see Note 1 of the accompanying notes to our consolidated financial statements.
Revenue Recognition
We derive our revenue from sales of products and related support services and enter into multiple-element arrangements in the normal course of business with our direct customers, distributors, resellers and systems vendors. In all of our arrangements, we do not recognize revenue until we can determine that persuasive evidence of an arrangement exists; delivery has occurred; the fee is fixed or determinable; and we deem collection to be reasonably assured. In making these judgments, we evaluate these criteria as follows:
| • | Evidence of an Arrangement – We consider a non-cancelable agreement signed by a direct customer, distributor, reseller or systems vendor or purchase order generated by a customer, distributor, reseller or systems vendor to be persuasive evidence of an arrangement. |
| • | Delivery has Occurred – We consider delivery to have occurred when product has been delivered to the customer and no post-delivery obligations exist other than ongoing support obligations sold under separate support terms. In instances where customer acceptance is required, delivery is deemed to have occurred when customer acceptance has been achieved. |
| • | Fees are Fixed or Determinable – We consider the fee to be fixed or determinable unless the fee is subject to refund or adjustment or is not payable within normal payment terms. If the fee is subject to refund or adjustment, we recognize revenue net of estimated returns or if a reasonable estimate cannot be made, when the right to a refund or adjustment lapses. We currently do not provide price protection, rebates or other sales incentives to customers. We also do not allow a right of return to our customers, including distributors and resellers. |
| • | Collection is Reasonably Assured – We conduct a credit worthiness assessment on our customers, distributors, resellers and systems vendors. If we determine that collection is not reasonably assured, revenue is deferred and recognized upon the receipt of cash. |
Our multiple-element arrangements typically include two elements: hardware, which includes embedded software, and support services. Beginning in the second quarter of fiscal 2014, following introduction of the Violin Symphony Management Software Suite, our multiple-element arrangements also may include non-essential software elements. We have determined that our hardware and the embedded software are considered a single unit of accounting, because the hardware and software function together to deliver the hardware’s essential functionality and the hardware is never sold separately without the essential software. Standalone software, professional services and support services are each considered a separate unit of accounting as they are sold separately and have standalone value.
When more than one element, such as hardware, software and services, are contained in a single arrangement, we first allocate consideration to the software deliverables as a group and non-software deliverables based on the relative selling price method. Our appliance products, embedded software and certain other services are considered to be non-software deliverables in our arrangements. We allocate revenue within the software group based upon fair value using vendor specific objective evidence, or VSOE, with the residual revenue allocated to the delivered element. If we cannot objectively determine the VSOE of the fair value of any undelivered software element, we defer revenue until all elements are delivered and services have been performed, or until fair value can objectively be determined for any remaining undelivered elements. We allocate revenue within the non-software group to each element based upon their relative selling price in accordance with the selling price hierarchy, which includes: (1) VSOE, if available; (2) third-party evidence, or TPE, if VSOE is not available; and (3) best estimate of selling price, or BESP, if neither VSOE nor TPE are available.
| • | VSOE – We determine VSOE based on our historical pricing and discounting practices for the specific product or support service when sold separately or as an optional stated renewal rate in the transaction. In |
67
Table of Contents
| determining VSOE, we require that a substantial majority of the selling prices for products or support services fall within a reasonably narrow pricing range. |
| • | TPE – When VSOE cannot be established for deliverables in multiple-element arrangements, we apply judgment with respect to whether we can establish selling price based on TPE. TPE is determined based on competitor prices for similar deliverables when sold separately. Generally, our products differ from those of our peers such that the comparable pricing of support services with similar functionality cannot be obtained. Furthermore, we are unable to reliably determine what similar competitor services’ selling prices are on a stand-alone basis. As a result, we have not been able to establish selling price based on TPE. |
| • | BESP – When we are unable to establish selling price using VSOE or TPE, we use BESP in our allocation of arrangement consideration. The objective of BESP is to determine the price at which we would transact a sale if the product or support service was sold on a stand-alone basis. We determine BESP for deliverables by considering multiple factors including, but not limited to, prices we charge for similar offerings, gross margin expectations, sales volume, geographies, market conditions, competitive landscape and pricing practices. We have historically priced our products within a narrow range and have used BESP to allocate the selling price of deliverables for product sales. |
Deferred revenue primarily represents customer billings in excess of revenue recognized, primarily for support services. Support services are typically billed in advance on an annual basis or at the inception of a multiple year support contract, and revenue is recognized ratably over the support period of generally one to three years.
Stock-Based Compensation
Overview
We grant stock options, restricted stock awards and RSUs to our employees, consultants and members of our board of directors. These equity awards typically vest upon the satisfaction of a service condition, which, for the majority of these awards, is satisfied over four years.
We account for stock-based employee compensation under the fair value recognition and measurement provisions in accordance with applicable accounting standards, which require all stock-based payments to employees, including grants of stock options, restricted stock awards and RSUs to be measured based on the grant date fair value of the awards. We record stock-based compensation expense for service-based equity awards, including RSUs, using the straight-line attribution method over the period during which the employee is required to perform service in exchange for the awards. We capitalize stock-based employee compensation when appropriate. Capitalized stock-based compensation expense was not material in the three years ended January 31, 2015.
Determining the fair value of stock-based awards at the grant date requires judgment. We estimate the fair value of stock option awards using the Black-Scholes single option-valuation model, which requires assumptions such as fair value of our common stock, expected term, expected volatility and risk-free interest rate, which are estimated as follows:
| • | Expected Term – We determine the expected term of options granted using the “simplified” method. Under this approach, the expected term is presumed to be the average of the vesting term and the contractual term of the option. |
| • | Volatility – Because we do not have a trading history for our common stock, the expected stock price volatility for our common stock was estimated by taking the average historic price volatility for a group of companies we consider our peers based on a number of factors including, but not limited to, similarity to us with respect to industry, business model, stage of growth, financial risk or other factors, along with considering the future plans of our company to determine the appropriate volatility over the expected life of the option. We used the weekly closing price of these peers over a period equivalent to the expected term of |
68
Table of Contents
| the stock option grants. We did not rely on implied volatilities of traded options in our peers’ common stock because the volume of activity was relatively low. Our group of comparable industry peer companies has changed from time to time. We removed certain companies that became financially distressed or for which public information was no longer available. Meanwhile, we added a new public company and other larger companies in our industry. We intend to continue to consistently apply this process using the same or similar public companies until a sufficient amount of historical information regarding the volatility of our own common stock share price becomes available, or unless circumstances change such that the identified companies are no longer similar to us, in which case, more suitable companies whose share prices are publicly available would be utilized in the calculation. |
| • | Risk-free Interest Rate – The risk-free interest rate was determined by reference to the U.S. Treasury rates with the remaining term approximating the expected option life assumed at the date of grant. |
| • | Dividend Yield – We have never declared or paid any cash dividends and do not presently plan to pay cash dividends in the foreseeable future. Consequently, we used an expected dividend yield of zero. |
In addition, we are required to estimate the expected forfeiture rate and only recognize expense for those options, restricted stock awards and RSUs expected to vest. We estimate a forfeiture rate based on our historical experience. Further, to the extent our actual forfeiture rate is different from our estimate, stock-based compensation expense is adjusted accordingly. If any of the assumptions used in the Black-Scholes single option-valuation model change significantly, the fair value and stock-based compensation expense on future grants is impacted accordingly and stock-based compensation expense may differ materially in the future from that recorded in the current period.
We have used and will continue to use judgment in evaluating the expected term, expected volatility and forfeiture rate related to our stock-based compensation expense on a prospective basis. As we continue to accumulate additional data related to our common stock, we may have refinements to the estimates of our expected volatility, expected terms and forfeiture rates, which could materially impact our future stock-based compensation expense.
Inventory Valuation
Inventory consists of raw materials and finished goods and is stated at the lower of cost, determined on a first-in, first-out (“FIFO”) basis, or market. We assess the valuation of inventory, including raw materials and finished goods, on a periodic basis. Inventory carrying value adjustments are established to reduce the carrying amounts of our inventory to their net estimated realizable value. Carrying value adjustments are based on historical usage, expected demand and trial deployment conversion rates. Inherent in our estimates of market value in determining inventory valuation are estimates related to economic trends, future demand for our products and technological obsolescence of our products. For example, because our revenue often is comprised of large, concentrated sales to a limited number of customers, we may carry high levels of inventory prior to shipment. In addition, in circumstances where a supplier discontinues the production of a key raw material component, such as non-volatile memory components, we may be required to make significant “last-time” purchases in order to ensure supply continuity until the transition is made to products based on next generation components. If a significant order were cancelled after we had purchased the related inventory, or if estimates of “last-time” purchases exceed actual demand, we may be required to record additional inventory carrying value adjustments.
Warranty Liability
We provide our customers a limited product warranty of three years. Our standard warranties require us to repair or replace defective products during such warranty period at no cost to the customer. We estimate the costs that may be incurred under our basic limited warranty and record a liability in the amount of such costs at the time product sales are recognized. Factors that affect our warranty liability include the number of installed units,
69
Table of Contents
performance of equipment in our test and support labs, historical data and trends of product reliability and costs of repairing and replacing defective products. We assess the adequacy of our recorded warranty liability each period and make adjustments to the liability as necessary.
Income Taxes
Significant judgment may be required in determining our provision for income taxes and evaluating our uncertain tax positions. We record income taxes using the asset and liability method, which requires the recognition of deferred tax assets and liabilities for the expected future tax consequences of events that have been recognized in our financial statements or tax returns. In estimating future tax consequences, generally all expected future events other than enactments or changes in the tax law or rates are considered. Valuation allowances are provided when necessary to reduce deferred tax assets to the amount expected to be realized.
We provide reserves as necessary for uncertain tax positions taken on our tax filings. First, we determine if the weight of available evidence indicates that a tax position is more likely than not to be sustained upon audit, including resolution of related appeals or litigation processes, if any. Second, based on the largest amount of benefit, which is more likely than not to be realized on ultimate settlement, we recognize any such differences as a liability or as a reduction to deferred tax assets. Because of our full valuation allowance against the net deferred tax assets, any change in our uncertain tax positions would generally not impact our effective tax rate.
In evaluating our ability to recover our deferred tax assets, in full or in part, we consider all available positive and negative evidence, including our past operating results, our forecast of future market growth, forecasted earnings, future taxable income and prudent and feasible tax planning strategies. The assumptions utilized in determining future taxable income require significant judgment and are consistent with the plans and estimates we are using to manage the underlying businesses. Due to the net losses incurred and the uncertainty of realizing the deferred tax assets, for all the periods presented, we have a full valuation allowance against our net deferred tax assets.
As of January 31, 2015, we had federal and state net operating loss carryforwards of $232.7 million and $87.7 million, respectively, and federal and state research and development tax credit carryforwards of $9.0 million and $10.0 million, respectively. In the future, we intend to utilize any carryforwards available to us to reduce our tax payments. A substantial amount of these carryforwards may be subject to annual limitations that may result in their expiration before some portion, or all, of them has been fully utilized.
JOBS Act
In April 2012, the JOBS Act was enacted. Section 107 of the JOBS Act provides that an emerging growth company can take advantage of the extended transition period provided in Section 7(a)(2)(B) of the Securities Act for complying with new or revised accounting standards. In other words, an emerging growth company can delay the adoption of certain accounting standards until those standards would otherwise apply to private companies. We are electing to delay such adoption of new or revised accounting standards, and as a result, we may not comply with new or revised accounting standards on the relevant dates on which adoption of such standards is required for other companies.
Subject to certain conditions set forth in the JOBS Act, as an emerging growth company, we currently rely on certain of these exemptions. These exemptions include, without limitation, providing an auditor’s attestation report on our system of internal controls over financial reporting pursuant to Section 404 and complying with any requirement that may be adopted. We will remain an emerging growth company upon the earliest of (i) February 1, 2019, (ii) the first fiscal year after our annual gross revenues are $1.0 billion or more, (iii) the date on which we have, during the previous three-year period, issued more than $1.0 billion in non-convertible debt securities or (iv) as of the end of any fiscal year in which the market value of our common stock that is held by nonaffiliates exceeds $700 million as of the end of the second quarter of that fiscal year.
70
Table of Contents
Recent Accounting Pronouncements
For information with respect to recent accounting pronouncements and the impact of these pronouncements on our consolidated financial statements, see Note 1 “Organization and Summary of Significant Accounting Policies – Recent Accounting Pronouncements” in the notes to consolidated financial statements.
Segments
Operating segments are defined in accounting standards as components of an enterprise about which separate financial information is available and is regularly evaluated by management, namely the chief operating decision maker of an organization, in order to make operating and resource allocation decisions. We have concluded that we operate in one business segment. Substantially all of our revenue for all periods presented in the accompanying consolidated statements of operations has been from sales of the All Flash Arrays and related customer support services.
Certain Relationships and Related Party Transactions
For a discussion of certain relationships and related party transactions, see Note 10 “Related Party Transactions” in the notes to consolidated financial statements.
Item 7A. Quantitative and Qualitative Disclosures About Market Risk
Interest Rate Fluctuation Risk
Our cash and cash equivalents consist of cash, held by large, United States commercial banks. As a result, the fair value of our portfolio is relatively insensitive to interest rate changes.
The primary objective of our investment activities is to preserve principal and maintain liquidity while maximizing income without significantly increasing risk. We determined that the increase in yield from potentially investing our cash and cash equivalents in longer-term investments did not warrant a change in our investment strategy. In future periods, we will continue to evaluate our investment policy in order to ensure that we continue to meet our overall objectives.
Foreign Currency Exchange Risk
Our sales transactions are primarily denominated in U.S. dollars and therefore the substantial majority all of our revenue is not subject to foreign currency risk. However, certain of our operating expenses are incurred outside the United States and are dominated in foreign currencies and are subject to fluctuations due to changes in foreign currency exchange rates, particularly changes in the British Pounds, Chinese Yuan, Euro, Japanese Yen and Singapore Dollar. The volatility of exchange rates depends on many factors that we cannot forecast with reliable accuracy. Although we have experienced and will continue to experience fluctuations in our net loss as a result of transaction gains (losses) related to revaluing certain cash balances, accounts receivable, accounts payable, current liabilities and intercompany balances that are denominated in currencies other than the U.S. dollar, we believe a 10% change in foreign currencies exchange rates would not have a material impact on our results of operations.
Inflation Risk
We do not believe that inflation has had a material effect on our business, financial condition or results of operations. If our costs were to become subject to significant inflationary pressures, we may not be able to fully offset such higher costs through price increases. Our inability or failure to do so could materially and adversely affect our business, financial condition and results of operations.
71
Table of Contents
| Item 8. | Financial Statements and Supplementary Data |
Violin Memory, Inc.
INDEX TO CONSOLIDATED FINANCIAL STATEMENTS
| 73 | ||||
| 74 | ||||
| 75 | ||||
| 76 | ||||
| 77 | ||||
| 78 | ||||
| 79 |
72
Table of Contents
REPORT OF INDEPENDENT REGISTERED PUBLIC ACCOUNTING FIRM
The Board of Directors and Stockholders
Violin Memory, Inc.:
We have audited the accompanying consolidated balance sheets of Violin Memory, Inc. and subsidiaries (the Company) as of January 31, 2015 and 2014, and the related consolidated statements of operations, comprehensive loss, stockholders’ equity and cash flows for each of the years in the three-year period ended January 31, 2015. These consolidated financial statements are the responsibility of the Company’s management. Our responsibility is to express an opinion on these consolidated financial statements based on our audits.
We conducted our audits in accordance with the standards of the Public Company Accounting Oversight Board (United States). Those standards require that we plan and perform the audit to obtain reasonable assurance about whether the financial statements are free of material misstatement. An audit includes examining, on a test basis, evidence supporting the amounts and disclosures in the financial statements. An audit also includes assessing the accounting principles used and significant estimates made by management, as well as evaluating the overall financial statement presentation. We believe that our audits provide a reasonable basis for our opinion.
In our opinion, the consolidated financial statements referred to above present fairly, in all material respects, the financial position of Violin Memory, Inc. and subsidiaries as of January 31, 2015 and 2014, and the results of their operations and their cash flows for each of the years in the three year-period ended January 31, 2015, in conformity with U.S. generally accepted accounting principles.
/s/ KPMG LLP
Santa Clara, California
April 8, 2015
73
Table of Contents
Consolidated Balance Sheets
(In thousands, except par value)
| January 31, 2015 |
January 31, 2014 |
|||||||
| Assets | ||||||||
| Current assets: |
||||||||
| Cash and cash equivalents |
$ | 93,432 | $ | 40,273 | ||||
| Restricted cash |
2,300 | — | ||||||
| Short-term investments |
60,483 | 59,106 | ||||||
| Accounts receivable, net (including amounts due from a related party of $232 and $565 as of January 31, 2015 and 2014, respectively) |
15,080 | 21,055 | ||||||
| Inventory |
10,322 | 39,653 | ||||||
| Other current assets |
5,949 | 6,154 | ||||||
|
|
|
|
|
|||||
| Total current assets |
187,566 | 166,241 | ||||||
| Property and equipment, net |
9,863 | 13,653 | ||||||
| Intangibles and other assets |
10,806 | 4,769 | ||||||
|
|
|
|
|
|||||
| $ | 208,235 | $ | 184,663 | |||||
|
|
|
|
|
|||||
| Liabilities and Stockholders’ Equity | ||||||||
| Current liabilities: |
||||||||
| Line of credit |
$ | 10,000 | $ | — | ||||
| Accounts payable (including amounts due to a related party of $2,432 and $12,208 as of January 31, 2015 and 2014, respectively) |
11,065 | 18,389 | ||||||
| Accrued liabilities (including amounts due to a related party of $0 and $6,875 as of January 31, 2015 and 2014, respectively) |
18,024 | 37,315 | ||||||
| Deferred revenue |
15,635 | 13,480 | ||||||
|
|
|
|
|
|||||
| Total current liabilities |
54,724 | 69,184 | ||||||
| Convertible senior notes, net |
120,000 | — | ||||||
| Deferred revenue |
10,398 | 11,755 | ||||||
| Long-term liabilities |
1,707 | — | ||||||
|
|
|
|
|
|||||
| Total liabilities |
186,829 | 80,939 | ||||||
|
|
|
|
|
|||||
| Commitments and contingencies (Note 9) |
||||||||
| Stockholders’ equity: |
||||||||
| Preferred stock, $0.0001 par value, 10,000 shares authorized as of January 31, 2015; no shares issued and outstanding as of January 31, 2015 and 2014 |
— | — | ||||||
| Common stock, $0.0001 par value, 1,000,000 shares authorized as of January 31, 2015; 93,872 and 83,057 shares issued and outstanding as of January 31, 2015 and 2014, respectively |
9 | 8 | ||||||
| Additional paid-in capital |
482,674 | 456,223 | ||||||
| Accumulated other comprehensive income |
248 | 115 | ||||||
| Accumulated deficit |
(461,525 | ) | (352,622 | ) | ||||
|
|
|
|
|
|||||
| Total stockholders’ equity |
21,406 | 103,724 | ||||||
|
|
|
|
|
|||||
| $ | 208,235 | $ | 184,663 | |||||
|
|
|
|
|
|||||
See accompanying notes to the consolidated financial statements.
74
Table of Contents
Consolidated Statements of Operations
(In thousands, except per share data)
| Year Ended January 31, | ||||||||||||
| 2015 | 2014 | 2013 | ||||||||||
| Revenue: |
||||||||||||
| Product revenue (including related party sales of $1,527, $7,128 and $5,242 for the years ended January 31, 2015, 2014 and 2013, respectively) |
$ | 58,378 | $ | 88,321 | $ | 69,584 | ||||||
| Service revenue (including related party sales of $1,102, $6,360 and $332 for the years ended January 31, 2015, 2014 and 2013, respectively) |
20,597 | 19,335 | 4,214 | |||||||||
|
|
|
|
|
|
|
|||||||
| Total revenue |
78,975 | 107,656 | 73,798 | |||||||||
|
|
|
|
|
|
|
|||||||
| Cost of revenue: |
||||||||||||
| Cost of product revenue (including related party purchases of $9,190, $38,239 and $27,510 for the years ended January 31, 2015, 2014 and 2013, respectively) (1) |
50,378 | 56,927 | 38,180 | |||||||||
| Cost of service revenue (1) |
8,389 | 7,846 | 4,474 | |||||||||
|
|
|
|
|
|
|
|||||||
| Total cost of revenue |
58,767 | 64,773 | 42,654 | |||||||||
|
|
|
|
|
|
|
|||||||
| Gross profit |
20,208 | 42,883 | 31,144 | |||||||||
|
|
|
|
|
|
|
|||||||
| Operating expenses: |
||||||||||||
| Sales and marketing (1) |
61,871 | 81,104 | 61,094 | |||||||||
| Research and development (1) |
52,091 | 73,743 | 57,840 | |||||||||
| General and administrative (1) |
20,645 | 29,622 | 21,105 | |||||||||
| Gain on sale of PCIe product line |
(17,448 | ) | — | — | ||||||||
| Restructuring charges |
3,062 | 4,869 | — | |||||||||
| Litigation settlement |
652 | 350 | — | |||||||||
|
|
|
|
|
|
|
|||||||
| Total operating expenses |
120,873 | 189,688 | 140,039 | |||||||||
|
|
|
|
|
|
|
|||||||
| Loss from operations |
(100,665 | ) | (146,805 | ) | (108,895 | ) | ||||||
| Other expense, net |
(4,910 | ) | (1,389 | ) | (79 | ) | ||||||
| Interest and other financing expense |
(3,205 | ) | (1,539 | ) | (31 | ) | ||||||
|
|
|
|
|
|
|
|||||||
| Loss before income taxes |
(108,780 | ) | (149,733 | ) | (109,005 | ) | ||||||
| Income taxes |
123 | 76 | 97 | |||||||||
|
|
|
|
|
|
|
|||||||
| Net loss |
$ | (108,903 | ) | $ | (149,809 | ) | $ | (109,102 | ) | |||
|
|
|
|
|
|
|
|||||||
| Net loss per share of common stock, basic and diluted |
$ | (1.20 | ) | $ | (3.88 | ) | $ | (8.01 | ) | |||
|
|
|
|
|
|
|
|||||||
| Shares used to compute net loss per share of common stock, basic and diluted |
90,959 | 38,591 | 13,624 | |||||||||
|
|
|
|
|
|
|
|||||||
| (1) Includes stock-based compensation expense as follows (Note 7): |
||||||||||||
| Cost of product revenue |
$ | 718 | $ | 100 | $ | 150 | ||||||
| Cost of service revenue |
658 | 889 | 474 | |||||||||
| Sales and marketing |
4,792 | 10,344 | 4,061 | |||||||||
| Research and development |
9,570 | 6,900 | 3,228 | |||||||||
| General and administrative |
7,228 | 18,166 | 10,010 | |||||||||
|
|
|
|
|
|
|
|||||||
| $ | 22,966 | $ | 36,399 | $ | 17,923 | |||||||
|
|
|
|
|
|
|
|||||||
See accompanying notes to the consolidated financial statements.
75
Table of Contents
Consolidated Statements of Comprehensive Loss
(In thousands)
| Year Ended January 31, | ||||||||||||
| 2015 | 2014 | 2013 | ||||||||||
| Net loss |
$ | (108,903 | ) | $ | (149,809 | ) | $ | (109,102 | ) | |||
| Foreign currency translation adjustments, net of tax |
123 | 111 | 81 | |||||||||
| Unrealized holding gains on investments, net of tax |
10 | 11 | — | |||||||||
|
|
|
|
|
|
|
|||||||
| Comprehensive loss |
$ | (108,770 | ) | $ | (149,687 | ) | $ | (109,021 | ) | |||
|
|
|
|
|
|
|
|||||||
There were no reclassification adjustments during each of the years ended January 31, 2015, 2014 and 2013, respectively.
See accompanying notes to the consolidated financial statements.
76
Table of Contents
Consolidated Statements of Stockholders’ Equity
(In thousands, except per share amounts)
| Convertible Preferred Stock |
Common Stock | Additional Paid-in Capital |
Other Comprehensive Income/(Loss) |
Accumulated Deficit |
Total Stockholders’ Equity |
|||||||||||||||||||||||||||
| Shares | Amount | Shares | Amount | |||||||||||||||||||||||||||||
| Balances as of January 31, 2012 |
75,942 | $ | 8 | 15,324 | $ | 4 | $ | 137,938 | $ | (88 | ) | $ | (93,711 | ) | $ | 44,151 | ||||||||||||||||
| Issuance of Series D convertible preferred stock at $6.00 and $7.00 per share, net of issuance costs of $3,200 |
15,428 | 1 | — | — | 89,727 | — | — | 89,728 | ||||||||||||||||||||||||
| Issuance of Series D convertible preferred stock in connection with a litigation settlement at $7.00 per share |
200 | — | — | — | 1,400 | — | — | 1,400 | ||||||||||||||||||||||||
| Issuance of common stock upon exercise of stock options |
— | — | 353 | — | 543 | 543 | ||||||||||||||||||||||||||
| Repurchased of unvested portion of common stock |
— | — | (63 | ) | — | — | — | — | — | |||||||||||||||||||||||
| Stock-based compensation |
— | — | — | — | 17,923 | — | — | 17,923 | ||||||||||||||||||||||||
| Translation adjustment |
— | — | — | — | — | 81 | — | 81 | ||||||||||||||||||||||||
| Net loss |
— | — | — | — | — | — | (109,102 | ) | (109,102 | ) | ||||||||||||||||||||||
|
|
|
|
|
|
|
|
|
|
|
|
|
|
|
|
|
|||||||||||||||||
| Balances as of January 31, 2013 |
91,570 | 9 | 15,614 | 4 | 247,531 | (7 | ) | (202,813 | ) | 44,724 | ||||||||||||||||||||||
| Issuance of Series D convertible preferred stock at $6.00 per share, net of issuance costs of $498 |
3,575 | 1 | — | — | 20,952 | — | — | 20,953 | ||||||||||||||||||||||||
| Issuance of common stock at initial public offering, net of issuance costs of $16,180 |
— | — | 18,000 | 2 | 145,818 | — | — | 145,820 | ||||||||||||||||||||||||
| Conversion of convertible preferred stock into common stock |
(95,145 | ) | (10 | ) | 47,735 | 2 | 8 | — | — | — | ||||||||||||||||||||||
| Conversion of convertible notes into common stock |
— | — | 585 | — | 5,203 | — | — | 5,203 | ||||||||||||||||||||||||
| Common stock warrants |
— | — | — | — | 309 | — | — | 309 | ||||||||||||||||||||||||
| Issuance of common stock upon exercise of stock options |
— | — | 1,008 | — | 732 | — | — | 732 | ||||||||||||||||||||||||
| Issuance of common stock for settlement of RSUs |
— | — | 250 | — | — | — | — | — | ||||||||||||||||||||||||
| Shares withheld related to net share settlement of RSUs |
— | — | (38 | ) | — | (341 | ) | — | — | (341 | ) | |||||||||||||||||||||
| Repurchase of unvested portion of common stock |
— | — | (97 | ) | — | (388 | ) | — | — | (388 | ) | |||||||||||||||||||||
| Stock-based compensation |
— | — | — | — | 36,399 | — | — | 36,399 | ||||||||||||||||||||||||
| Translation adjustment |
— | — | — | — | — | 111 | — | 111 | ||||||||||||||||||||||||
| Unrealized gain on investments |
— | — | — | — | — | 11 | — | 11 | ||||||||||||||||||||||||
| Net loss |
— | — | — | — | — | — | (149,809 | ) | (149,809 | ) | ||||||||||||||||||||||
|
|
|
|
|
|
|
|
|
|
|
|
|
|
|
|
|
|||||||||||||||||
| Balances as of January 31, 2014 |
— | — | 83,057 | 8 | 456,223 | 115 | (352,622 | ) | 103,724 | |||||||||||||||||||||||
| Issuance of common stock upon exercise of stock options |
— | — | 1,648 | — | 1,930 | — | — | 1,930 | ||||||||||||||||||||||||
| Issuance of common stock for settlement of RSUs |
— | — | 8,611 | 1 | (1 | ) | — | — | — | |||||||||||||||||||||||
| Issuance of common stock/RSUs in settlement of liabilities |
— | — | 715 | — | 3,380 | — | — | 3,380 | ||||||||||||||||||||||||
| Issuance of common stock under the employee stock purchase plan |
— | — | 431 | — | 1,239 | — | — | 1,239 | ||||||||||||||||||||||||
| Sale of common stock |
— | — | 200 | — | 908 | — | — | 908 | ||||||||||||||||||||||||
| Shares withheld related to net share settlement of RSUs |
— | — | (790 | ) | — | (3,971 | ) | — | — | (3,971 | ) | |||||||||||||||||||||
| Stock-based compensation |
— | — | — | — | 22,966 | — | — | 22,966 | ||||||||||||||||||||||||
| Translation adjustment |
— | — | — | — | — | 123 | — | 123 | ||||||||||||||||||||||||
| Unrealized gain on investments |
— | — | — | — | — | 10 | — | 10 | ||||||||||||||||||||||||
| Net loss |
— | — | — | — | — | — | (108,903 | ) | (108,903 | ) | ||||||||||||||||||||||
|
|
|
|
|
|
|
|
|
|
|
|
|
|
|
|
|
|||||||||||||||||
| Balances as of January 31, 2015 |
— | $ | — | 93,872 | $ | 9 | $ | 482,674 | $ | 248 | $ | (461,525 | ) | $ | 21,406 | |||||||||||||||||
|
|
|
|
|
|
|
|
|
|
|
|
|
|
|
|
|
|||||||||||||||||
See accompanying notes to the consolidated financial statements.
77
Table of Contents
Consolidated Statements of Cash Flows
(In thousands)
| Year Ended January 31, | ||||||||||||
| 2015 | 2014 | 2013 | ||||||||||
| Cash flows from operating activities: |
||||||||||||
| Net loss |
$ | (108,903 | ) | $ | (149,809 | ) | $ | (109,102 | ) | |||
| Adjustments to reconcile net loss to net cash used in operating activities: |
||||||||||||
| Depreciation and amortization |
10,961 | 12,552 | 9,013 | |||||||||
| Amortization of debt issuance costs |
639 | 175 | — | |||||||||
| Gain on sale of PCIe product line |
(17,448 | ) | — | — | ||||||||
| Provision for excess and obsolete inventory |
20,961 | 10,973 | 1,052 | |||||||||
| Loss on extinguishment of debt |
372 | — | 31 | |||||||||
| Impairment of assets |
3,470 | 1,965 | — | |||||||||
| Stock-based compensation |
22,966 | 36,399 | 17,923 | |||||||||
| Changes in operating assets and liabilities, net: |
||||||||||||
| Accounts receivable |
5,975 | 957 | (6,354 | ) | ||||||||
| Inventory |
9,076 | (24,339 | ) | (6,538 | ) | |||||||
| Other assets |
531 | (932 | ) | 733 | ||||||||
| Accounts payable |
(11,804 | ) | 2,881 | (1,930 | ) | |||||||
| Accrued liabilities |
(17,097 | ) | 15,413 | 7,540 | ||||||||
| Deferred revenue |
798 | 12,217 | 10,722 | |||||||||
|
|
|
|
|
|
|
|||||||
| Net cash used in operating activities |
(79,503 | ) | (81,548 | ) | (76,910 | ) | ||||||
|
|
|
|
|
|
|
|||||||
| Cash flows from investing activities: |
||||||||||||
| Purchase of property and equipment |
(11,745 | ) | (9,300 | ) | (10,554 | ) | ||||||
| Purchase of cost method investments |
— | (604 | ) | (4,986 | ) | |||||||
| Proceeds from sale of PCIe product line |
23,000 | — | — | |||||||||
| Increase in restricted cash |
(2,300 | ) | — | — | ||||||||
| Purchase of investments |
(57,396 | ) | (66,224 | ) | — | |||||||
| Proceeds from maturity of investments |
56,017 | 7,129 | — | |||||||||
|
|
|
|
|
|
|
|||||||
| Net cash provided by (used in) investing activities |
7,576 | (68,999 | ) | (15,540 | ) | |||||||
|
|
|
|
|
|
|
|||||||
| Cash flows from financing activities: |
||||||||||||
| Proceeds from issuance of convertible notes, net of issuance costs |
115,397 | 5,160 | 2,698 | |||||||||
| Proceeds from issuance of convertible preferred stock, net of issuance costs |
— | 20,953 | 86,316 | |||||||||
| Proceeds from debt and lines of credit, net of issuance costs |
46,776 | 20,078 | — | |||||||||
| Repayment of debt and lines of credit |
(37,326 | ) | (20,500 | ) | — | |||||||
| Proceeds from issuance of common stock, net of related costs |
908 | 147,870 | (2,050 | ) | ||||||||
| Proceeds from exercise of common stock options and stock purchase plan |
3,169 | 610 | 260 | |||||||||
| Repurchase of unvested portion of common stock |
— | (388 | ) | — | ||||||||
| Taxes paid related to net share settlement of equity awards |
(3,971 | ) | (341 | ) | — | |||||||
|
|
|
|
|
|
|
|||||||
| Net cash provided by financing activities |
124,953 | 173,442 | 87,224 | |||||||||
|
|
|
|
|
|
|
|||||||
| Effect of exchange rates on cash and cash equivalents |
133 | — | — | |||||||||
|
|
|
|
|
|
|
|||||||
| Net increase (decrease) in cash and cash equivalents |
53,159 | 22,895 | (5,226 | ) | ||||||||
| Cash and cash equivalents at beginning of year |
40,273 | 17,378 | 22,604 | |||||||||
|
|
|
|
|
|
|
|||||||
| Cash and cash equivalents at end of year |
$ | 93,432 | $ | 40,273 | $ | 17,378 | ||||||
|
|
|
|
|
|
|
|||||||
| Supplemental disclosure of other cash flow information: |
||||||||||||
| Taxes paid |
$ | 115 | $ | 47 | $ | 10 | ||||||
| Interest paid |
419 | 972 | — | |||||||||
| Supplemental disclosure of non-cash investing and financing activities: |
||||||||||||
| Conversion of convertible notes to common stock |
— | 5,203 | — | |||||||||
| Transfer of inventory to property and equipment |
707 | 4,418 | 3,574 | |||||||||
| Conversion of notes payable and accrued interest to convertible preferred stock |
— | — | 3,415 | |||||||||
| Settlement of loan receivable from officer in lieu of bonus payment |
— | — | 1,000 | |||||||||
| Issuance of Series D convertible preferred stock in connection with litigation |
— | — | 1,400 | |||||||||
| Payables related to purchases of fixed assets |
2,234 | — | — | |||||||||
| Issuance of common stock in settlement of liabilities |
3,379 | — | — | |||||||||
See accompanying notes to the consolidated financial statements.
78
Table of Contents
Notes to Consolidated Financial Statements
1. Organization and Summary of Significant Accounting Policies
Description of Business
Violin Memory, Inc. (the “Company”) was incorporated in the State of Delaware on March 9, 2005 under the name Violin Technologies, Inc. The Company re-incorporated as Violin Memory, Inc. in the State of Delaware on April 11, 2007. The Company is a developer and supplier of high-performance, persistent memory-based storage systems that are designed to bring storage performance in line with high-speed applications, servers and networks. These All Flash Arrays are specifically designed at each level of the system architecture, starting with memory and optimized through the array, to leverage the inherent capabilities of flash memory. The Company also recently introduced the Flash Storage Platform, the industry’s first vertically integrated design of software, firmware and hardware that delivers the highest performance, resiliency and availability at the same cost as legacy enterprise-class primary storage. The Flash Storage Platform runs the Company’s Concerto OS 7, a single operating system with integrated continuous data protection, in-line block de-duplication and compression, stretch metro cluster and LUN mirroring as well as its suite of other Enterprise Data Services. With Violin’s Flash Storage Platform, all active data (Tiers 0, 1, and 2) can be consolidated onto a single tier, simplifying storage administration. Additionally, with Violin’s release of Symphony Management Suite Version 3.0, the entire software functionality can all be controlled in 1, 2 or 3 clicks, with management of the entire storage estate, through a single pane of glass. The Company sells its products through its global direct sales force, systems vendors, resellers and other channel partners. The Company operates in a single business segment.
Basis of Presentation and Consolidation
We prepared the consolidated financial statements in accordance with U.S. generally accepted accounting principles (GAAP). The consolidated financial statements include the accounts of Violin Memory, Inc. and its wholly owned subsidiaries. All intercompany balances and transactions have been eliminated.
Reclassifications
Certain prior year amounts have been reclassified for consistency with the current period presentation. These reclassifications had no effect on the previously reported financial position, results of operations or cash flows.
Foreign Currency Translations and Remeasurement
The local currency is the functional currency for each of the Company’s subsidiaries. Assets and liabilities are translated into U.S. dollars at exchange rates in effect at the balance sheet date. Income and expense items are translated at average exchange rates for the respective period.
Gains and losses from foreign currency transactions are included in other expense, net. Foreign currency translation adjustments are included in other comprehensive loss.
Use of Estimates
The preparation of consolidated financial statements in conformity with U.S. generally accepted accounting principles requires management to make estimates and assumptions that affect the reported amounts of assets and liabilities and disclosure of contingent assets and liabilities at the date of the financial statements and the reported amounts of revenues and expenses during the reporting period. On an on-going basis, the Company evaluates its significant estimates, including those related to estimated selling prices for elements sold in multiple-element revenue arrangements, product warranty, determination of the fair value of stock options, carrying values of inventories, liabilities for unrecognized tax benefits and deferred income tax asset valuation allowances. The Company also uses estimates in determining the useful lives of property and equipment and in its provision for doubtful accounts. Actual results could differ from those estimates.
79
Table of Contents
Concentrations of Market, Credit Risk, Significant Customers and Manufacturing
The Company participates in the business of developing and manufacturing scalable All Flash Arrays and believes that changes in any of the following areas could have a material adverse effect on the Company’s future financial position, results of operations or cash flows: advances and trends in new technologies and industry standards; competitive pressures in the form of new products or price reduction on current products; changes in the overall demand for products offered by the Company; changes in certain strategic relationships or customer relationships; litigation or claims against the Company based on intellectual property, patent, product, regulatory or other factors; and risks associated with changes in domestic and international economic and international and/or political conditions or regulations.
Financial instruments that potentially subject the Company to concentrations of credit risk primarily consist of cash, cash equivalents, investments and accounts receivable. The Company places its cash and cash equivalents and investments with high credit quality financial institutions which the Company believes are creditworthy. Deposits may exceed the insured limits provided on them.
The Company generally requires no collateral from its customers. The Company mitigates its credit risk with associated with its accounts receivable by performing ongoing credit evaluations of its customers and establishes an allowance for doubtful accounts for estimated losses based on management’s assessment of the collectability of customer accounts.
Customers that represented more than 10% of total revenue and gross accounts receivable are as follows:
| Year Ended January 31, | ||||||||||||
| 2015 | 2014 | 2013 | ||||||||||
| Percent of revenue: |
||||||||||||
| Enterprise Vision Technology |
10 | % | * | * | ||||||||
| Toshiba (Note 10) |
* | 12 | % | * | ||||||||
| CompSec |
* | * | 12 | % | ||||||||
| * | Less than 10% |
| January 31, | ||||||||
| 2015 | 2014 | |||||||
| Percent of gross accounts receivable: |
||||||||
| Arrow ECS |
19 | % | * | |||||
| Commtech Innovative Solutions |
* | 27 | % | |||||
| Avnet, Inc. |
* | 15 | ||||||
| * | Less than 10% |
The Company sells to a limited number of large systems vendors, resellers and end-customers and, as a result, maintains individually significant receivable balances with such customers. The Company’s systems vendor customers and certain large resellers tend to be well-capitalized, multi-national companies, while other customers may not be as well capitalized. Sales of products to large systems vendors and resellers are expected to account for a majority of the Company’s revenues in the foreseeable future, and the Company’s financial results will depend in part upon the success of these customers. The composition of the Company’s major customer base may change as the market demand for its products changes, and the Company expects this variability will continue in the future. The loss of, or a significant reduction in purchases by, any of the major customers may harm the Company’s business, financial condition and results of operations.
The Company relies on a limited number of suppliers for its contract manufacturing and certain raw material components. The Company believes that other vendors would be able to provide similar products and services;
80
Table of Contents
however, the qualification of such vendors may require substantial start-up time. In order to mitigate any adverse impacts from disruption of supply, the Company attempts to maintain an adequate supply of critical single-sourced raw materials.
Cash and Cash Equivalents
Cash consists of deposits with financial institutions. The Company considers all highly liquid investments with a maturity of three months or less when purchased to be cash equivalents. Cash equivalents consist of money market funds, which are readily convertible into cash and are stated at cost, which approximates fair market value. Cash and cash equivalents were $93.4 million and $40.3 million as of January 31, 2015 and 2014, respectively.
Restricted Cash
In connection with the sale of its PCIe product line, the Company is obligated to maintain a balance of $2.3 million with an escrow agent for one year. Such amount will be held for the purpose of securing certain of the Company’s indemnification obligations and to compensate the buyer for damages for which they are indemnified pursuant to the asset purchase agreement. No claims for indemnification have been filed to date. The agreement expires on July 24, 2015.
Investments
The Company classifies its investments as available-for-sale at the time of purchase since it is the Company’s intent that these investments are available for current operations and includes these investments on the consolidated balance sheet as short-term or long-term investments depending on their maturity and management’s intention with regard to the utilization of these investments, as needed, to fund current operations. As of January 31, 2015, all investments have been classified as short-term.
Investments are considered impaired when a decline in fair value is judged to be other-than-temporary. The Company consults with its investment managers and considers available quantitative and qualitative evidence in evaluating potential impairment of its investments on a quarterly basis. If the cost of an individual investment exceeds its fair value, the Company evaluates, among other factors, general market conditions, the duration and extent to which the fair value is less than cost, and its intent and ability to hold the investment. Once a decline in fair value is determined to be other-than-temporary, an impairment charge is recorded and a new cost basis in the investment is established.
Fair Value Measurements and Disclosures
The Company records its financial assets and liabilities at fair value. The accounting guidance for fair value provides a framework for measuring fair value, clarifies the definition of fair value and expands disclosures regarding fair value measurements. Fair value is defined as the price that would be received to sell an asset or paid to transfer a liability (an exit price) in an orderly transaction between market participants at the reporting date. The accounting guidance establishes a three-tiered hierarchy, which prioritizes the inputs used in the valuation methodologies in measuring fair value:
Level 1 – Quoted prices in active markets for identical assets or liabilities.
Level 2 – Inputs other than Level 1 that are observable, either directly or indirectly, such as quoted prices in markets that are not active; or other inputs that are observable or can be corroborated by observable market data for substantially the full term of the assets or liabilities.
Level 3 – Unobservable inputs that are supported by little or no market activity and that are significant to the fair value of the assets or liabilities.
81
Table of Contents
The Company recognizes transfers among Level 1, Level 2 and Level 3 classifications as of the actual date of the events or change in circumstances that caused the transfers.
The Company’s financial instruments, including cash equivalents, accounts receivable, accounts payable and accrued liabilities have carrying amounts which approximate fair value due to the short-term maturity of these instruments.
Accounts Receivable
Trade accounts receivable are recorded at the invoiced amount and do not bear interest. The Company maintains an allowance for doubtful accounts for estimated losses inherent in its accounts receivable portfolio. In establishing the required allowance, management considers expected losses after taking into account current market conditions, customers’ financial condition, current receivable aging and current payment patterns. Account balances are charged off against the allowance after all means of collection have been exhausted and the potential for recovery is considered remote. As of January 31, 2015 and 2014, the Company’s allowance for doubtful accounts was insignificant.
Inventory
Inventory consists of raw materials and finished goods and is stated at the lower of cost, determined on a first-in, first-out (“FIFO”) basis, or market. The Company periodically assesses the recoverability of all inventory, including raw materials and finished goods to determine whether adjustments are required to record inventory at the lower of cost or market. Inventory that the Company determines to be obsolete or in excess of forecasted usage is reduced to its estimated realizable value based on assumptions about future and current market conditions. In the case of inventory which has been written down below cost through the use of a reserve, such reduced amount is considered the cost for subsequent accounting purposes.
Revenue Recognition
The Company derives revenue primarily from sales of its All Flash Arrays, software and related support and professional services. Revenue is recognized when persuasive evidence of an arrangement exists, delivery has occurred or services have been rendered, the price is fixed and determinable and collectability is reasonably assured. Evidence of an arrangement exists when there is a customer contract or purchase order. The Company considers delivery complete when title and risk of loss transfer to the customer, which is generally upon shipment, but no later than physical receipt by the customer.
The Company sells its products and support services directly to end-customers, systems vendors and resellers. The Company currently does not provide price protection, rebates or other sales incentives to customers. The Company generally does not allow a right of return to its customers, including resellers.
The Company’s multiple-element arrangements typically include two elements: hardware, which includes embedded software, and support services. Beginning in the second quarter of fiscal 2014, following introduction of the Violin Symphony Management Software Suite, the Company’s multiple-element arrangements also may include software elements. The Company has determined that its hardware and the embedded software are considered a single unit of accounting, because the hardware and software individually do not have standalone value and are not sold separately. Standalone software, professional services and support services are each considered a separate unit of accounting as they can be sold separately and have standalone value.
When more than one element, such as hardware, software and services, are contained in a single arrangement, the Company first allocates consideration to the software deliverables as a group and non-software deliverables based on the relative selling price method. The Company’s appliance products, embedded software and certain other services are considered to be non-software deliverables in such arrangements. The Company allocates
82
Table of Contents
revenue within the software group based upon fair value using vendor-specific objective evidence, or VSOE, with the residual revenue allocated to the delivered element. If VSOE of fair value cannot be objectivity determined for any undelivered software elements, we defer revenue until all elements are delivered and services have been performed, or until fair value can objectively be determined for any remaining undelivered elements. The Company allocates revenue within the non-software group to each element based upon its relative selling price in accordance with the selling price hierarchy, which includes: (1) VSOE, if available; (2) third-party evidence, or TPE, if VSOE is not available; and (3) best estimate of selling price, or BESP, if neither VSOE nor TPE is available. The Company establishes BESP considering multiple factors including, but not limited to, historical prices of products sold on a stand-alone basis, cost and gross margin objectives, competitive pricing practices and customer and market specific considerations.
The Company then recognizes revenue on each deliverable in accordance with its policies for product and service revenue recognition. Revenue allocated to the Company’s products is recognized upon shipment or delivery. Revenue allocated to support services is recognized over the term, which is generally one or three years.
The Company’s policy is to record revenue net of any applicable sales, use or excise tax.
Property and Equipment
Property and equipment consist primarily of capitalized equipment and computer hardware and software, which are stated at cost and depreciated using the straight-line method over the estimated useful lives of two years and three years, respectively. Leasehold improvements are amortized using the straight-line method over the shorter of the lease term or the estimated useful life of the asset. Costs of maintenance and repairs that do not improve or extend the lives of the respective assets are expensed as incurred. Upon retirement or sale, the cost and related accumulated depreciation are removed from the balance sheet and the resulting gain or loss is reflected in operating expenses.
Research and Development
Research and development costs are expensed as incurred. Research and development costs consist primarily of personnel costs, prototype expenses, software tools, consulting services and allocated facilities costs.
Software Development Costs
The Company expenses software development costs as incurred until technological feasibility is attained, including research and development costs associated with stand-alone software products and software embedded in hardware products. Technological feasibility is attained when the Company has completed the planning, design and testing phase of development of its software and the software has been determined viable for its intended use, which typically occurs when beta testing commences. The period of time between when beta testing commences and when the software is available for general release to customers has historically been short with immaterial amounts of software development costs incurred during this period. Accordingly, the Company has not capitalized any internal software development costs to date.
Advertising Expenses
All advertising costs are expensed as incurred. The Company recognized advertising expenses of $1.6 million, $0.6 million and $1.0 million for the years ended January 31, 2015, 2014 and 2013, respectively.
Income Taxes
Income taxes are accounted for under the asset and liability method. Deferred tax assets and liabilities are recognized for the future tax consequences attributable to differences between the financial statement carrying
83
Table of Contents
amounts of existing assets and liabilities and their respective tax bases and operating loss and tax credit carry forwards. Deferred tax assets and liabilities are measured using enacted tax rates expected to apply to taxable income (or loss) in the years in which those temporary differences are expected to be recovered or settled. The effect on deferred tax assets and liabilities of a change in tax rates is recognized in income in the period that includes the enactment date. Valuation allowances are established for deferred tax assets to the extent it is more likely than not that the deferred tax assets may not be realized.
The Company evaluates uncertain tax positions taken or expected to be taken in the course of preparing an enterprise’s tax return to determine whether the tax positions are more likely than not of being sustained upon challenge by the applicable tax authority. Tax positions with respect to any potential income tax for the Company not deemed to meet the more likely than not threshold would be recorded as a tax expense in the current year.
Net Loss Per Share
Basic net loss per share is computed by dividing the net loss by the weighted-average number of shares of common stock outstanding for each fiscal period presented.
Diluted net loss per share is computed by giving effect to all potential shares of common stock, including stock options, warrants and convertible preferred stock, to the extent dilutive. Basic and diluted net loss per share was the same for each period presented as the inclusion of all potential shares of common stock outstanding would have been anti-dilutive.
Stock-Based Compensation
The Company records stock-based compensation expense related to employee stock-based awards on a straight-line basis based on the estimated fair value of the awards as determined on the date of grant. The Company utilizes the Black-Scholes option pricing model to estimate the fair value of employee stock options and Employee Stock Purchase Plan (ESPP). The Black-Scholes model requires the input of highly subjective and complex assumptions, including the expected term of the stock option, the expected volatility of the Company’s common stock over the period equal to the expected term of the grant and forfeitures. The Company estimates forfeitures at the date of grant and revises the estimates, if necessary, in subsequent periods if actual forfeitures differ from those estimates.
The Company accounts for stock options that are issued to non-employees based on the estimated fair value of such awards using the Black-Scholes option pricing model. The measurement of stock-based compensation expense for these awards is variable and subject to periodic adjustments to the estimated fair value until the awards vest and the resulting change in the estimated fair value is recognized in the Company’s consolidated statements of operations during the period in which the related services are rendered.
The Company grants restricted stock units (RSUs) to employees. Stock-based compensation expense related to these grants is based on the grant date fair value of the RSUs and is recognized on a straight-line basis over the applicable service period, which is generally four years.
Impairment of Long-Lived Assets
Long-lived assets, such as property and equipment, are reviewed for impairment whenever events or changes in circumstances indicate that the carrying amount of an asset may not be recoverable. If circumstances require a long-lived asset or asset group be tested for possible impairment, the Company first compares undiscounted cash flows expected to be generated by that asset or asset group to its carrying value. If the carrying value of the long-lived asset or asset group is not recoverable on an undiscounted cash flow basis, an impairment charge is recognized to the extent that the carrying value exceeds its fair value. Fair value is determined through various
84
Table of Contents
valuation techniques including discounted cash flow models, quoted market values and third-party independent appraisals, as considered necessary.
Investment in Privately-held Companies
The Company analyzes equity investments in privately held companies to determine if it should be accounted for under the cost or equity method of accounting based on such factors as the percentage ownership of the voting stock outstanding and our ability to exert significant influence over these companies. For the cost method investments, the Company determines at each reporting period whether a decline in fair value has occurred and whether such decline is considered to be an other-than-temporary impairment. If a decline in fair value is determined to be other-than-temporary, the Company would recognize an impairment to reduce the investment to the lower of cost or fair value.
For the year ended January 31, 2015 and 2014, the Company recorded an impairment on its cost-method investments in the amount of $3.5 million and $0.7 million, respectively, in other expense, net in the consolidated statements of operations. There was no impairment recorded for the year ended January 31, 2013. As of January 31, 2015, the net carrying value of the Company’s investments in privately-held companies was nil.
Commitments and Contingencies
Liabilities for loss contingencies arising from claims, assessments, litigation, fines and penalties and other sources are recorded when it is probable that a liability has been incurred and the amount can be reasonably estimated. Legal costs incurred in connection with loss contingencies are expensed as incurred.
Product Warranties
The Company generally provides a three-year warranty on all of its products. The Company accrues for potential liability claims as a component of cost of revenue based upon performance of equipment in the Company’s test and support labs, historical data and trends of product reliability and costs of repairing and replacing defective products. The accrued warranty balance is reviewed periodically for adequacy and is included in accrued liabilities in the consolidated balance sheets.
Recent Accounting Pronouncements
In August 2014, the FASB issued Accounting Standards Update (ASU) No. 2014-15, Disclosure of Uncertainties about an Entity’s Ability to Continue as a Going Concern, which requires management to assess a company’s ability to continue as a going concern and to provide related footnote disclosures in certain circumstances. Before this new standard, there was minimal guidance in U.S. GAAP specific to going concern. Under the new standard, disclosures are required when conditions give rise to substantial doubt about a company’s ability to continue as a going concern within one year from the financial statement issuance date. The new standard applies to all companies and is effective for the annual period ending after December 15, 2016, and all annual and interim periods thereafter. The Company has determined that this pronouncement is not likely to have a material impact on the Company’s consolidated financial statements.
In May 2014, the FASB issued ASU No. 2014-09, Revenue from Contracts with Customers, a converged standard on revenue recognition. The new pronouncement requires revenue recognition to depict the transfer of promised goods or services to customer in an amount that reflects the consideration to which the entity expects to be entitled in exchange for those goods or services. The guidance also specifies the accounting for some costs to obtain or fulfil a contract with a customer, as well as enhanced disclosure requirements. ASU 2014-9 is effective for annual reporting periods beginning after December 15, 2016, including interim reporting periods within that reporting periods. Early adoption is not permitted. The Company is currently in the process of evaluating the impact of the adoption will have on its consolidated financial statements.
85
Table of Contents
In April 2014, the FASB issued ASU No. 2014-08, Presentation of Financial Statements (Topic 2015) and Property Plant, and Equipment (Topic 360): Reporting Discontinued Operations and Disclosures of Disposals of Components of an entity, an accounting standard update that changes the criteria for reporting discontinued operations. Under the accounting standard update, a disposal of a component of an entity or a group of components of an entity is required to be reported in discontinued operations if the disposal represents a strategic shift that has, or will have, a major effect on an entity’s operations and financial results when either it qualifies as held for sale, disposed of by sale, or disposed of other than by sale. This accounting standard update became effective for the Company on February 1, 2015. The Company anticipates that this pronouncement will not have a material impact on the Company’s consolidated financial statements.
In July 2013, the FASB issued ASU No. 2013-11, Income Taxes (Topic 740): Presentation of an Unrecognized Tax Benefit When a Net Operating Loss Carry-forward, a Similar Tax Loss, or a Tax Credit Carry-forward Exists, which is effective for the periods beginning after December 15, 2013. The new guidance provides that a liability related to an unrecognized tax benefit would be presented as a reduction of a deferred tax asset for a net operating loss carryforward, a similar tax loss or a tax credit carryforward if such settlement is required or expected in the event the uncertain tax position is disallowed. The new guidance became effective for the Company on February 1, 2014, and was applied prospectively to unrecognized tax benefits that existed at the effective date. The adoption of this new guidance did not have a material impact on the Company’s consolidated financial statements.
In March 2013, the FASB issued an accounting standard update requiring an entity to release into net income the entire amount of a cumulative translation adjustment related to its investment in a foreign entity when as a parent it either sells a part or all of its investment in a foreign entity or no longer holds a controlling financial interest in a subsidiary or group of assets within a foreign entity. This accounting standard update was effective prospectively for the Company on February 1, 2014. The adoption of this accounting standard update did not have a material impact on the Company’s consolidated financial statements.
2. Balance Sheet Components
Accounts Receivable
The following table shows the components of accounts receivable, net (in thousands):
| January 31, | ||||||||
| 2015 | 2014 | |||||||
| Accounts receivable |
$ | 15,680 | $ | 21,248 | ||||
| Allowance for doubtful accounts |
(39 | ) | — | |||||
| Allowance for sales returns |
(561 | ) | (193 | ) | ||||
|
|
|
|
|
|||||
| $ | 15,080 | $ | 21,055 | |||||
|
|
|
|
|
|||||
The following table shows a rollforward of our allowance for doubtful accounts for the years ended January 31, 2015, 2014 and 2013 (in thousands):
| Balance at Beginning of Year |
Additions Charged to Expense or Other Accounts |
Deductions | Balance at End of Year |
|||||||||||||
| Year ended January 31, 2015 |
$ | — | $ | 80 | $ | (41 | ) | $ | 39 | |||||||
| Year ended January 31, 2014 |
350 | — | (350 | ) | — | |||||||||||
| Year ended January 31, 2013 |
32 | 357 | (39 | ) | 350 | |||||||||||
86
Table of Contents
Inventory
The following table shows the components of inventory (in thousands):
| January 31, | ||||||||
| 2015 | 2014 | |||||||
| Raw materials |
$ | 3,677 | $ | 15,326 | ||||
| Finished goods |
6,645 | 24,327 | ||||||
|
|
|
|
|
|||||
| $ | 10,322 | $ | 39,653 | |||||
|
|
|
|
|
|||||
Included in the components of inventory are reserves of $23.2 million and $6.7 million as of January 31, 2015 and 2014, respectively. In the fourth quarter of fiscal 2015, the Company incurred a provision for excess and obsolete inventory of approximately $19.9 million in connection with its transition from its 6000 Series All Flash Array to its 7000 Series Flash Storage Platform. This provision resulted in an increase in inventory reserves of $17.6 million and an increase in accrued liabilities of $2.3 million for non-cancellable purchase orders related to the 6000 Series parts. In December 2013, the Company decided to pursue strategic alternatives for its PCIe card business and to stop selling its PCIe cards. In light of this decision, the Company recorded a PCIe card inventory provision of $9.2 million. This provision resulted in an increase in inventory reserves of $3.4 million and an increase in accrued liabilities of $5.8 million for non-cancellable purchase orders related to PCIe card components. For the year ended January 31, 2014, the Company also recorded a provision for excess inventory of $1.8 million of which $1.2 million was recorded in the fourth quarter of that year.
Property and Equipment
The following table shows the components of property and equipment (in thousands):
| January 31, | ||||||||
| 2015 | 2014 | |||||||
| Laboratory equipment |
$ | 25,589 | $ | 22,854 | ||||
| Computer hardware and software |
12,165 | 11,440 | ||||||
| Leasehold improvements |
691 | 310 | ||||||
| Office furniture |
326 | 305 | ||||||
|
|
|
|
|
|||||
| 38,771 | 34,909 | |||||||
| Less: accumulated depreciation |
(28,908 | ) | (21,256 | ) | ||||
|
|
|
|
|
|||||
| $ | 9,863 | $ | 13,653 | |||||
|
|
|
|
|
|||||
Depreciation expense (including amortization of leasehold improvements) was $11.0 million, $12.6 million and $9.0 million for fiscal 2015, 2014 and 2013, respectively.
Intangibles and Other Assets
The following table shows the components of intangibles and other assets (in thousands):
| January 31, | ||||||||
| 2015 | 2014 | |||||||
| Licensed OEM software |
$ | 6,086 | $ | 604 | ||||
| Deferred borrowing costs |
4,032 | — | ||||||
| Cost method investments |
— | 3,470 | ||||||
| Other |
688 | 695 | ||||||
|
|
|
|
|
|||||
| $ | 10,806 | $ | 4,769 | |||||
|
|
|
|
|
|||||
87
Table of Contents
During the year we capitalized $6.0 million in licensed OEM software which we are amortizing over the greater of an estimated useful life of ten years on a straight line basis, or in proportion of the actual revenue to date over the expected revenue from our Flash Storage Platform product over the ten year estimated life of the product.
Accrued Liabilities
The following table shows the components of accrued liabilities (in thousands):
| January 31, | ||||||||
| 2015 | 2014 | |||||||
| Compensation and benefits |
$ | 9,036 | $ | 10,805 | ||||
| Purchase commitments |
2,328 | 6,661 | ||||||
| Accrued interest |
1,700 | — | ||||||
| Warranty |
1,262 | 1,223 | ||||||
| Restructuring charges |
313 | 3,248 | ||||||
| Professional fees |
101 | 4,635 | ||||||
| Customer advance from Toshiba (Note 10) |
— | 6,875 | ||||||
| Other |
3,284 | 3,868 | ||||||
|
|
|
|
|
|||||
| $ | 18,024 | $ | 37,315 | |||||
|
|
|
|
|
|||||
Accrued Warranty
The following table is a reconciliation of the changes in the Company’s aggregate product warranty liability (in thousands):
| Year ended January 31, | ||||||||
| 2015 | 2014 | |||||||
| Balance, beginning of year |
$ | 1,223 | $ | 994 | ||||
| Additions |
1,301 | 1,663 | ||||||
| Settlements |
(1,262 | ) | (1,434 | ) | ||||
|
|
|
|
|
|||||
| Balance, end of period |
$ | 1,262 | $ | 1,223 | ||||
|
|
|
|
|
|||||
3. Fair Value Measurements
The following tables present, for assets or liabilities measured at fair value, the respective fair value and the classification by level of input within the fair value hierarchy (in thousands):
| January 31, 2015 | ||||||||||||||||
| Level 1 | Level 2 | Level 3 | Total | |||||||||||||
| Cash equivalents: |
||||||||||||||||
| Commercial paper |
$ | — | $ | 34,395 | $ | — | $ | 34,395 | ||||||||
| Money market funds |
24,534 | — | — | 24,534 | ||||||||||||
| Corporate debt securities |
— | 6,116 | — | 6,116 | ||||||||||||
|
|
|
|
|
|
|
|
|
|||||||||
| Total cash equivalents |
24,534 | 40,511 | — | 65,045 | ||||||||||||
|
|
|
|
|
|
|
|
|
|||||||||
| Short-term investments: |
||||||||||||||||
| Corporate debt securities |
— | 44,711 | — | 44,711 | ||||||||||||
| U.S. government and agency obligations |
— | 7,808 | — | 7,808 | ||||||||||||
| Municipal obligations |
— | 4,967 | — | 4,967 | ||||||||||||
| Commercial paper |
— | 2,997 | — | 2,997 | ||||||||||||
|
|
|
|
|
|
|
|
|
|||||||||
| Total short-term investments |
— | 60,483 | — | 60,483 | ||||||||||||
|
|
|
|
|
|
|
|
|
|||||||||
| $ | 24,534 | $ | 100,994 | $ | — | $ | 125,528 | |||||||||
|
|
|
|
|
|
|
|
|
|||||||||
88
Table of Contents
| January 31, 2014 | ||||||||||||||||
| Level 1 | Level 2 | Level 3 | Total | |||||||||||||
| Cash equivalents: |
||||||||||||||||
| Money market funds |
$ | 15,229 | $ | — | $ | — | $ | 15,229 | ||||||||
| Commercial paper |
— | 11,099 | — | 11,099 | ||||||||||||
| Municipal obligations |
— | 4,601 | — | 4,601 | ||||||||||||
|
|
|
|
|
|
|
|
|
|||||||||
| Total cash equivalents |
15,229 | 15,700 | — | 30,929 | ||||||||||||
|
|
|
|
|
|
|
|
|
|||||||||
| Short-term investments: |
||||||||||||||||
| U.S. government and agency obligations |
— | 29,132 | — | 29,132 | ||||||||||||
| Municipal obligations |
— | 13,841 | — | 13,841 | ||||||||||||
| Corporate debt securities |
— | 8,135 | — | 8,135 | ||||||||||||
| Commercial paper |
— | 7,998 | — | 7,998 | ||||||||||||
|
|
|
|
|
|
|
|
|
|||||||||
| Total short-term investments |
— | 59,106 | — | 59,106 | ||||||||||||
|
|
|
|
|
|
|
|
|
|||||||||
| $ | 15,229 | $ | 74,806 | $ | — | $ | 90,035 | |||||||||
|
|
|
|
|
|
|
|
|
|||||||||
The Company measures its cash equivalents and marketable securities at fair value. Money market funds are valued primarily using quoted market prices utilizing market observable inputs. The Company’s investments in commercial paper, treasury bills, corporate debt securities and federal and municipal obligations are classified within Level 2 as the market inputs to value these instruments consist of market yields, reported trades and broker/dealer quotes.
No financial assets and liabilities measured at fair value on a recurring basis were held by the Company as of January 31, 2013. There have been no transfers between Level 1 and 2 during fiscal 2015 or 2014.
No assets or liabilities measured at fair value on a nonrecurring basis were held by the Company as of January 31, 2015 or 2014.
The carrying amounts of the Company’s accounts receivable, accounts payable, accrued liabilities and other liabilities approximate their fair value due to their short term maturities.
4. Investments
Short term investments as of January 31, 2015 and 2014 consist of U.S. corporate debt securities, U.S. government and municipal debt, agency obligations and commercial paper. All marketable securities are deemed by management to be available-for-sale and are reported at fair value. Net unrealized gains or losses that are not determined to be other-than-temporary are reported within stockholders’ equity on the Company’s consolidated balance sheets as a component of accumulated comprehensive loss. Realized gains or losses are recorded based on the specific identification method. The Company’s investments are detailed in the tables below (in thousands):
| January 31, 2015 | ||||||||||||||||
| Amortized Cost |
Unrealized Gains |
Unrealized Losses |
Estimated Fair Value |
|||||||||||||
| Corporate debt securities |
$ | 44,705 | $ | 14 | $ | (8 | ) | $ | 44,711 | |||||||
| U.S. government and agency obligations |
7,807 | 2 | (1 | ) | 7,808 | |||||||||||
| Municipal obligations |
4,964 | 3 | — | 4,967 | ||||||||||||
| Commercial paper |
2,997 | — | — | 2,997 | ||||||||||||
|
|
|
|
|
|
|
|
|
|||||||||
| $ | 60,473 | $ | 19 | $ | (9 | ) | $ | 60,483 | ||||||||
|
|
|
|
|
|
|
|
|
|||||||||
89
Table of Contents
| January 31, 2014 | ||||||||||||||||
| Amortized Cost |
Unrealized Gains |
Unrealized Losses |
Estimated Fair Value |
|||||||||||||
| U.S. government and agency obligations |
$ | 29,130 | $ | 5 | $ | (3 | ) | $ | 29,132 | |||||||
| Municipal obligations |
13,833 | 8 | — | 13,841 | ||||||||||||
| Corporate debt securities |
8,134 | 4 | (3 | ) | 8,135 | |||||||||||
| Commercial paper |
7,998 | — | — | 7,998 | ||||||||||||
|
|
|
|
|
|
|
|
|
|||||||||
| $ | 59,095 | $ | 17 | $ | (6 | ) | $ | 59,106 | ||||||||
|
|
|
|
|
|
|
|
|
|||||||||
The amortized cost and fair value of investments held as of January 31, 2015 and 2014, by contractual years-to-maturity, are as follows (in thousands):
| January 31, | ||||||||||||||||
| 2015 | 2014 | |||||||||||||||
| Amortized Cost |
Fair Value |
Amortized Cost |
Fair Value |
|||||||||||||
| Due within one year |
$ | 60,473 | $ | 60,483 | $ | 47,707 | $ | 47,712 | ||||||||
| Due within one to two years |
— | — | 11,388 | 11,394 | ||||||||||||
|
|
|
|
|
|
|
|
|
|||||||||
| $ | 60,473 | $ | 60,483 | $ | 59,095 | $ | 59,106 | |||||||||
|
|
|
|
|
|
|
|
|
|||||||||
5. Stockholders’ Equity
Stock Split
The Company effected a two-for-one reverse stock split to its common stock for all stockholders of record as of September 12, 2013 with an automatic adjustment to the conversion ratio of the outstanding shares of convertible preferred stock to reflect the same reverse stock split ratio upon conversion of the convertible preferred stock into common stock. Based on the adjusted conversion ratio, two outstanding shares of preferred stock converted into one share of common stock, except for Series D convertible preferred stock for which every two shares converted into 1.016998402 shares of common stock. All information related to common stock, stock options, RSUs and earnings per share for prior periods has been retroactively adjusted to give effect to the two-for-one reverse stock split.
Initial Public Offering
On October 2, 2013, the Company closed its initial public offering, or IPO, of 18,000,000 shares of common stock. The public offering price of the shares sold in the IPO was $9.00 per share. The total gross proceeds were $162 million. After deducting underwriting discounts and commissions and IPO expenses, the aggregate net proceeds totaled $145.8 million.
90
Table of Contents
Convertible Preferred Stock
Upon the closing of the Company’s IPO, all shares of our then-outstanding convertible preferred stock, as shown on the table below, automatically converted into an aggregate of 47.7 million shares of its common stock. The following table summarizes the convertible preferred stock authorized, issued and outstanding, and the rights and preferences of the respective series immediately prior to the conversion into common stock (in thousands, except per share data):
| Shares | Liquidation Preference Per Share |
Dividend Per Share Per Annum |
Conversion Ratio Per Share |
|||||||||||||||||
| Authorized | Issued and Outstanding |
|||||||||||||||||||
| Series 1 |
8,797 | 8,796 | 1.28 | $ | 0.068 | 0.500000 | ||||||||||||||
| Series A |
35,357 | 35,357 | 0.90 | 0.048 | 0.500000 | |||||||||||||||
| Series B |
18,265 | 18,264 | 3.00 | 0.160 | 0.500000 | |||||||||||||||
| Series C |
13,525 | 13,525 | 6.00 | 0.320 | 0.500000 | |||||||||||||||
| Series D |
35,056 | 19,203 | 8.75 | 0.560 | 0.508499 | |||||||||||||||
|
|
|
|
|
|||||||||||||||||
| 111,000 | 95,145 | |||||||||||||||||||
|
|
|
|
|
|||||||||||||||||
Common Stock
The Company is authorized to issue 1 billion shares of common stock at a par value of $0.0001 per share. As of January 31, 2015 and 2014, the Company had 93.9 million and 83.1 million shares of common stock issued and outstanding, respectively. Holders of common stock are entitled to one vote per share on all matters to be voted upon by the shareholders of the Company.
Warrants
In August 2014, the Company entered into a secured $40.0 million credit facility with Silicon Valley Bank (“SVB”). Pursuant to this arrangement, the Company agreed to issue SVB a warrant to purchase 79,323 shares of its common stock, $0.0001 par value per share, at a price per share of $3.782. The warrant expires in August 2019.
During the second quarter of fiscal 2014, the Company issued warrants to purchase 131,875 shares of Series D convertible preferred stock at $6.00 per share. These warrants were issued to TriplePoint in conjunction with the TriplePoint debt facility and to several investors in conjunction with the Company’s sale of convertible notes. In conjunction with the Company’s IPO, the warrants converted to warrants to purchase 84,278 shares of common stock at $11.80 per share. The warrants will expire during the second quarter of fiscal year ended January 31, 2018.
6. Equity Award and Employee Compensation Plans
2005 Stock Plan
The 2005 Stock Plan (the “2005 Plan”) expired October 2, 2013 upon closing of the Company’s IPO and was replaced by the 2012 Stock Incentive Plan. Under the 2005 Plan, the Company was able to directly sell or award restricted shares, restricted stock units and options to employees, directors and consultants. The share awards and options were granted at prices no less than the estimated fair value at the date of grant and generally vest ratably over three to four years. The options generally expire ten years from the date of grant.
2012 Stock Plan
In November 2012, the Company’s stockholders approved the adoption of the 2012 Stock Incentive Plan (the “2012 Plan”) as the successor plan to the 2005 Plan, which became effective at the completion of the Company’s
91
Table of Contents
initial public offering (“IPO”). Unexercised options or restricted stock units under the 2005 Plan that cancel due to a grantee’s termination may be reissued under the 2012 Plan. Under the 2012 Plan, stock options, restricted shares, restricted stock units and stock appreciation rights may be granted to employees, outside directors and consultants at not less than 100% of the fair value on the date of grant and generally vest ratably over four years. Options generally expire seven years from the date of grant.
As of January 31, 2015, shares authorized under the 2012 Plan include 11,652,856 and any shares forfeited from the 2005 Plan. The reserve will automatically increase on the first day of each fiscal year in an amount equal to the lesser of (i) 5% of the outstanding shares of common stock on the last day of the immediately preceding fiscal year or (ii) a lesser amount determined by the Board of Directors. On February 1, 2015, the share reserve increased by 4,699,362 shares to an aggregate of 16,352,218 shares authorized under the plan. The 2012 Stock Plan is administered by the Compensation Committee of the Board of Directors (the “Compensation Committee”), and the Compensation Committee may terminate or amend the plan at any time.
Inducement Awards
During fiscal 2015, the Company issued inducement awards totaling 6,250,000 shares outside of the 2012 Plan under the employee inducement award exemption under the New York Stock Exchange Listed Company Manual Rule 303A.08, to the Company’s CEO and certain key executives. In February 2015, 1,250,000 shares were forfeited.
92
Table of Contents
Stock Options
The following table summarizes the stock option activity related to shares of common stock under the Company’s 2005 and 2012 Plans and the inducement awards (in thousands, except per share data):
| Outstanding Options | ||||||||||||||||||||
| Weighted-Average | ||||||||||||||||||||
| Shares | Weighted- | Remaining | Aggregate | |||||||||||||||||
| Available | Number of | Average | Contractual Life | Intrinsic | ||||||||||||||||
| for Grant | Options | Exercise Price ($) | (in years) | Value (1) | ||||||||||||||||
| Balances, January 31, 2012 |
2,594 | 7,061 | 0.94 | 9.29 | $ | 12,792 | ||||||||||||||
| Shares authorized |
10,020 | |||||||||||||||||||
| RSUs granted |
(9,018 | ) | ||||||||||||||||||
| RSUs forfeited |
555 | |||||||||||||||||||
| Options exercised |
— | (353 | ) | 0.72 | ||||||||||||||||
| Options forfeited |
641 | (641 | ) | 1.08 | ||||||||||||||||
| Repurchase of shares |
66 | — | 0.20 | |||||||||||||||||
|
|
|
|
|
|||||||||||||||||
| Balances, January 31, 2013 |
4,858 | 6,067 | 0.94 | 8.31 | $ | 42,096 | ||||||||||||||
| Shares authorized |
7,500 | |||||||||||||||||||
| RSUs granted |
(10,496 | ) | ||||||||||||||||||
| Recovery of RSUs from net settlement |
39 | |||||||||||||||||||
| RSUs forfeited |
3,632 | |||||||||||||||||||
| Options granted |
(1,320 | ) | 1,320 | 5.00 | ||||||||||||||||
| Options exercised |
(1,008 | ) | 0.61 | |||||||||||||||||
| Options forfeited |
1,149 | (1,149 | ) | 2.13 | ||||||||||||||||
| Repurchase of shares |
97 | — | ||||||||||||||||||
|
|
|
|
|
|||||||||||||||||
| Balances, January 31, 2014 |
5,459 | 5,230 | 1.43 | 7.23 | $ | 19,770 | ||||||||||||||
| Shares authorized, including 6,250 shares from inducement awards |
10,403 | |||||||||||||||||||
| RSUs granted |
(4,572 | ) | ||||||||||||||||||
| Recovery of RSUs from net settlement |
790 | |||||||||||||||||||
| RSUs forfeited |
3,601 | |||||||||||||||||||
| Options granted |
(9,371 | ) | 9,371 | 3.99 | ||||||||||||||||
| Options exercised |
— | (1,648 | ) | 1.02 | ||||||||||||||||
| Options forfeited |
304 | (304 | ) | 0.25 | ||||||||||||||||
|
|
|
|
|
|||||||||||||||||
| Balances, January 31, 2015 |
6,614 | 12,649 | 3.35 | 7.25 | $ | 34,255 | ||||||||||||||
|
|
|
|
|
|||||||||||||||||
| Options vested and expected to vest - January 31, 2015 |
6,475 | $ | 4.02 | 7.28 | $ | 390 | ||||||||||||||
| Options exercisable – January 31, 2015 |
4,368 | $ | 2.08 | 7.25 | $ | 7,710 | ||||||||||||||
| (1) | Aggregate intrinsic value is based on the common stock price at each respective date presented. |
93
Table of Contents
The weighted average grant date fair value of options granted during the year ended January 31, 2015 was $1.74 per share. The total intrinsic value of options exercised during the year ended January 31, 2015 was $5.0 million. The following table summarizes additional information regarding outstanding and exercisable options under the Stock Plans at January 31, 2015 (in thousands, except per share data):
| Options Outstanding | ||||||||||||
| Weighted-Average Exercise Price($) |
Number Outstanding |
Weighted- Average Remaining Contractual Life (years) |
Number Exercisable |
|||||||||
| 0.002 |
30 | 4.45 | 30 | |||||||||
| 0.14 |
844 | 5.86 | 844 | |||||||||
| 0.5 |
30 | 6.23 | 30 | |||||||||
| 1.42 |
1,755 | 6.54 | 1,754 | |||||||||
| 3.07 - 3.75 |
5,548 | 8.33 | 1,710 | |||||||||
| 4.28 |
4,442 | 6.47 | — | |||||||||
|
|
|
|
|
|||||||||
| 12,649 | 4,368 | |||||||||||
|
|
|
|
|
|||||||||
Restricted Stock Units
The table below summarizes the RSU activity under the Company’s 2005 and 2012 Plans (in thousands, except per share data):
| Number of RSUs Outstanding |
Weighted- Average Grant Date Fair Value |
Aggregate Intrinsic Value (1) |
||||||||||
| Balance, January 31, 2012 |
— | $ | — | $ | — | |||||||
| RSUs granted |
9,018 | 6.20 | ||||||||||
| RSUs forfeited |
(555 | ) | 4.88 | |||||||||
|
|
|
|||||||||||
| Balance, January 31, 2013 |
8,463 | 6.52 | $ | 63,469 | ||||||||
| RSUs granted |
10,496 | 6.35 | ||||||||||
| RSUs vested |
(250 | ) | 6.87 | |||||||||
| RSUs forfeited |
(3,632 | ) | 7.46 | |||||||||
|
|
|
|||||||||||
| Balance, January 31, 2014 |
15,077 | 6.09 | $ | 56,990 | ||||||||
| RSUs granted |
4,572 | 4.16 | ||||||||||
| RSUs vested |
(9,199 | ) | 6.12 | |||||||||
| RSUs forfeited |
(3,601 | ) | 5.57 | |||||||||
|
|
|
|||||||||||
| Balance, January 31, 2015 |
6,849 | $ | 4.71 | $ | 26,299 | |||||||
|
|
|
|||||||||||
| (1) | Aggregate intrinsic value is based on the common stock price at each respective date presented. |
The aggregate intrinsic value of RSUs that vested during the year ended January 31, 2015, amounted to $37.0 million.
Non-employee Stock Options and Awards
During the years ended January 31, 2015, 2014 and 2013, the Company granted stock options to purchase 0, 5,000 and 0 shares, respectively, to non-employees. The Company granted 230,098, 6,000 and 177,500 restricted stock units to non-employees in fiscal 2015, 2014 and 2013, respectively.
94
Table of Contents
Employee Stock Purchase Plan
In November 2012, the Company’s stockholders approved the adoption of the 2012 Employee Stock Purchase Plan (the “2012 Purchase Plan”). Upon adoption, a total of 1,000,000 shares were reserved for issuance under the 2012 Purchase Plan. The number of shares available for issuance under the 2012 Purchase Plan automatically increases on February 1 each year, beginning in 2014, by the lesser of 0.75% of the shares of common stock then outstanding or 1,000,000 shares. On February 1, 2014, pursuant to the provisions of the plan, the share reserved was increased by 600,000 shares to an aggregate of 1,600,000 shares reserved under the plan. The 2012 Purchase Plan permits eligible employees to purchase common stock on favorable terms via payroll deductions of up to 15% of the employee’s salary, subject to certain share and statutory dollar limits. Two overlapping offering periods commence during each calendar year, on each June 1 and December 1 or such other periods or dates as determined by the Compensation Committee from time to time, and the offering periods last up to 24 months with a purchase date every six months. The price of each share purchased is 85% of the lower of a) the fair value per share of common stock on the last trading day before the commencement of the applicable offering period, or b) the fair value per share of common stock on the purchase date. The 2012 Purchase Plan is administered by the Compensation Committee, and the Compensation Committee may terminate or amend the plan.
Employee 401(k) Plan
The Company sponsors the Violin Memory, Inc. 401(k) Plan (“401(k) Plan”), which qualifies under Section 401(k) of the Internal Revenue Code and is designed to provide retirement benefits for its eligible employees through tax-deferred salary deductions.
Employees may elect to contribute up to 90% of their eligible compensation to the 401(k) Plan. Employee contributions are limited to a maximum annual amount as set periodically by the Internal Revenue Service (“IRS”). The Company does not currently match employee contributions.
7. Stock-Based Compensation
As of January 31, 2015, total stock-based compensation cost related to unvested equity awards not yet recognized, net of estimated forfeitures, totaled $29.3 million. The Company expects to amortize $14.7 million in fiscal 2016, $8.4 million in fiscal 2017, $4.9 million in fiscal 2018 and $1.3 million in fiscal 2019. Capitalized stock-based compensation expense was not material for any period presented.
The Company used the following assumptions for its employee stock option and ESPP grants:
| Year Ended January 31, | ||||||||
| Employee stock options |
2015 | 2014 | 2013 (1) | |||||
| Expected life of options (in years) |
4.6 - 7.0 | 3.5 - 4.6 | — | |||||
| Expected volatility |
47% - 49% | 45% - 50% | — | |||||
| Risk-free interest rate |
1.4% - 2.1% | 0.9% - 1.5% | — | |||||
| Dividend yield |
— | — % | — | |||||
| (1) | No stock options were granted during fiscal 2013. |
| Year Ended January 31, | ||||||||||
| Employee stock purchase plan |
2015 | 2014 | 2013 (1) | |||||||
| Expected life (in years) |
0.5 | 2.18 | — | |||||||
| Expected volatility |
44% - 51% | 45.6 | % | — | ||||||
| Risk-free interest rate |
0.1% - 0.2% | 0.12 | % | — | ||||||
| Dividend yield |
— % | — | % | — | ||||||
| (1) | The ESPP plan was established in fiscal 2014. |
95
Table of Contents
During the year ended January 31, 2015 and 2014, the Company recognized stock-based compensation associated with its ESPP plan of $0.8 million and $0.4 million, respectively.
Stock-based compensation associated with non-employee awards was approximately $0.8 million, $0.8 million and $2.5 million for fiscal 2015, 2014 and 2013, respectively.
Award Modification and Accelerations
During fiscal 2014, the Company modified 225,000 options issued to a non-employee, accelerating the vesting of the award. The Company recognized a charge of $2.0 million within general and administrative expenses in the accompanying consolidated statement of operations for fiscal 2014 relating to this modification.
In January 2014, as part of its retention program, the Company repriced approximately 377,000 stock options originally granted to 51 non-executive employees in September and November 2013 at exercise prices ranging from $5.97 to $8.82 per share to $3.49 per share, the fair market value of the Company’s common stock as of the date of the modification. The incremental compensation charged recognized in fiscal 2014 for these awards was not significant. Total incremental charge relating to this modification, approximately $0.3 million, net of forfeitures, will be recognized using the straight-line attribution method over the remaining service period.
During the fourth quarter of fiscal 2014, as result of the Company’s strategic restructuring initiatives, the Company accelerated the vesting of certain stock options and RSU awards as result of the termination of certain former executives of the Company. Under the terms of the former employees’ executed employment agreements, accelerated vesting of certain awards was granted in the event of involuntary termination which was not ‘for cause’, as defined in such agreements. As a result, the Company recognized incremental charges relating to equity awards impacted by such accelerations of approximately $14.6 million in the consolidated statement of operations for the year ended January 31, 2014. Given that the acceleration was contemplated in the original employment agreements of these employees, modification accounting was not required.
8. Income Taxes
The components of loss before provision for income taxes are as follows (in thousands):
| Year Ended January 31, | ||||||||||||
| 2015 | 2014 | 2013 | ||||||||||
| United States |
$ | (109,342 | ) | $ | (150,146 | ) | $ | (109,311 | ) | |||
| Foreign |
562 | 413 | 306 | |||||||||
|
|
|
|
|
|
|
|||||||
| Total |
$ | (108,780 | ) | $ | (149,733 | ) | $ | (109,005 | ) | |||
|
|
|
|
|
|
|
|||||||
The Company’s tax provision for the years ended January 31, 2015, 2014 and 2013 consists of state and foreign taxes. Income tax expense differed from the amounts computed by applying the federal statutory income tax rate of 35% to pretax loss for the years ended January 31, 2015, 2014 and 2013, respectively, as result of the following (in thousands):
| Year Ended January 31, | ||||||||||||
| 2015 | 2014 | 2013 | ||||||||||
| Federal tax at statutory rate |
$ | (38,073 | ) | $ | (52,406 | ) | $ | (37,021 | ) | |||
| Loss not being benefited |
32,422 | 55,506 | 37,320 | |||||||||
| Nondeductible expenses |
7,601 | 470 | 1,559 | |||||||||
| State taxes |
7 | 11 | 6 | |||||||||
| Nondeductible interest on convertible notes |
— | (1,751 | ) | 10 | ||||||||
| Research credits |
(1,834 | ) | (1,754 | ) | (1,777 | ) | ||||||
|
|
|
|
|
|
|
|||||||
| $ | 123 | $ | 76 | $ | 97 | |||||||
|
|
|
|
|
|
|
|||||||
96
Table of Contents
The tax effects of temporary differences and carryforwards that give rise to significant portions of the Company’s deferred tax assets and liabilities related to the following (in thousands):
| January 31, | ||||||||
| 2015 | 2014 | |||||||
| Net operating loss carryforwards |
$ | 84,222 | $ | 56,529 | ||||
| Depreciation and amortization |
49,251 | 39,700 | ||||||
| Tax credits and other |
12,441 | 7,755 | ||||||
| Inventory valuations |
8,730 | 3,854 | ||||||
| Accrual and reserve |
7,476 | 5,516 | ||||||
| Stock-based compensation |
4,856 | 18,031 | ||||||
|
|
|
|
|
|||||
| Gross deferred tax assets |
166,976 | 131,385 | ||||||
| Valuation allowance |
(166,976 | ) | (131,385 | ) | ||||
|
|
|
|
|
|||||
| Net deferred tax assets (liabilities) |
$ | — | $ | — | ||||
|
|
|
|
|
|||||
Management believes that, based on available evidence, both positive and negative, it is more likely than not that the net deferred tax assets will not be utilized, such that a full valuation allowance has been recorded. The valuation allowance for deferred tax assets was $167.0 million and $131.4 million as of January 31, 2015 and 2014, respectively. The net change in the total valuation allowance for the year ended January 31, 2015 and 2014 was an increase of $35.6 million and $58.2 million, respectively.
As of January 31, 2015, the Company had approximately $232.7 million and $87.7 million of net operating loss carry forwards available to offset future taxable income for both Federal and State purposes, respectively. If not utilized, these carry forward losses will expire in various amounts for Federal and State tax purposes beginning in 2025 and 2015, respectively. The Company also has Federal and State research and development tax credit carryforwards of approximately $9.0 million and $10.0 million, respectively. The Federal tax credits will expire at various dates beginning in the year 2030 unless previously utilized. The State tax credits do not expire and will carry forward indefinitely until utilized.
Utilization of the net operating loss carry forwards and credits may be subject to substantial annual limitation due to the ownership change limitations provided by the Internal Revenue Code of 1986, as amended, and similar state provisions. The annual limitation may result in the expiration of net operating losses and credits before utilization.
The following table reflects changes in the gross unrecognized tax benefits (in thousands):
| January 31, | ||||||||||||
| 2015 | 2014 | 2013 | ||||||||||
| Gross unrecognized tax benefits-beginning of year |
$ | 4,048 | $ | 2,444 | $ | 932 | ||||||
| Net decreases related to prior year tax positions |
(8 | ) | (122 | ) | (106 | ) | ||||||
| Increases related to current year tax positions |
1,649 | 1,726 | 1,618 | |||||||||
|
|
|
|
|
|
|
|||||||
| Gross unrecognized tax benefits-end of year |
$ | 5,689 | $ | 4,048 | $ | 2,444 | ||||||
|
|
|
|
|
|
|
|||||||
None of the unrecognized tax benefits would have a net impact to income tax expense if subsequently recognized since the recognition of such benefits would result in a corresponding increase to the Company’s valuation allowance.
Income taxes payable of $116,000 and $115,000 are included within accrued liabilities in the Company’s consolidated balance sheets as and January 31, 2015 and 2014, respectively.
The Company’s policy is to classify interest and penalties associated with unrecognized tax benefits as income tax expense. The Company had no interest or penalty accruals associated with uncertain tax benefits.
97
Table of Contents
The Company is subject to taxation in the United States and in California and New Jersey among other states, and in certain foreign jurisdictions. As of January 31, 2015, the Company’s federal and state returns for the years ended 2010 through the current period are still open to examination. Net operating losses and research and development carryforwards that may be used in future years are still subject to inquiry given that the statute of limitation for these items would be from the year of the utilization. There are no tax years under examination by any jurisdiction at this time.
9. Commitments and Contingencies
Legal Disclosure
Beginning on November 26, 2013, four putative class action lawsuits were filed in the United States District Court for the Northern District of California, naming as defendants the Company, a number of the Company’s present or former directors and officers, and several underwriters of the Company’s September 27, 2013 IPO. The four complaints have been consolidated into a single, putative class action, and co-lead plaintiffs have been appointed by the court. On March 28, 2014, a consolidated complaint was filed. The complaint purports to assert claims under the federal securities laws on behalf of purchasers of our common stock issued in the IPO, based on seven categories of alleged omissions. The complaint seeks damages in an unspecified amount and other relief. On April 18, 2014, the defendants filed motions to dismiss the complaint. On October 31, 2014, the court granted in part and denied in part defendants’ motions to dismiss. The court’s order dismissed all except one category of alleged omissions, and gave plaintiffs the opportunity to amend the complaint. On November 21, 2014, the plaintiffs filed an amended complaint. In so doing, the plaintiffs chose not to amend their claims against the Company or the present or former directors and officers. Pending further developments regarding plaintiffs’ claims against the underwriters, the case will proceed to the discovery phase on the remaining allegations against the Company and the present or former directors and officers.
A purported stockholder derivative action also is pending before the same federal district court judge to whom the putative class action has been assigned. In the derivative action, the plaintiffs allege that certain of the Company’s current and former officers and directors breached their fiduciary duties to the Company by violating the federal securities laws and exposing the Company to possible financial liability. Pursuant to a stipulation by the parties, the derivative action currently is stayed pending further developments in the putative class action. The stay may be lifted at any time.
The Company intends to defend itself vigorously in both securities actions.
Indemnification
The Company indemnifies certain of its officers and directors for certain events or occurrences, subject to certain limits, while the officer or director is or was serving at the Company’s request in such capacity. The Company’s certificate of incorporation and bylaws require that it indemnify its officers and directors against expenses, judgments, fines, settlements and other amounts actually and reasonably incurred in connection with any proceedings arising out of their services to the Company. In addition, the Company has entered into separate indemnification agreements with each of its directors and executive officers, which provide for indemnification of these individuals under certain circumstances. The maximum amount of potential future indemnification is unlimited; however, the Company has a Directors and Officers insurance policy that enables the Company to recover a portion of any future amounts paid. Historically, the Company has not been obligated to make any payments for these obligations and no liabilities have been recorded for these obligations on the consolidated balance sheets as of January 31, 2015 and 2014.
The Company may, in the ordinary course of business, agree to defend and indemnify some customers against legal claims that the Company’s products infringe on certain U.S. patents or copyrights. The terms of such obligations may vary. To date, the Company has not been required to make any payments resulting from such infringement indemnifications and no amounts have been accrued for such matters.
98
Table of Contents
Other Contingencies
From time to time, the Company may become involved in legal proceeding or other claims and assessments arising in the ordinary course of business. The Company is not currently a party to any litigation matters, except as discussed above, which, individually or in the aggregate, are expected to have a material adverse effect on the Company’s business, financial condition or results of operations.
Operating Lease Commitments
The Company leases office space under various non-cancelable operating leases that expire at various dates through fiscal 2018. Rent expense related to operating leases was $2.4 million, $2.5 million and $2.0 million for the years ended January 31, 2015, 2014 and 2013, respectively. Future minimum lease payments under the Company’s operating leases as of January 31, 2015, are as follows (in thousands):
| Amount | ||||
| Fiscal years ending January 31: |
||||
| 2016 |
$ | 3,896 | ||
| 2017 |
3,615 | |||
| 2018 |
294 | |||
|
|
|
|||
| $ | 7,805 | |||
|
|
|
|||
Purchase Commitments
The Company depends entirely upon a contract manufacturer to manufacture its products and provide test services. Due to the lengthy lead times, the Company must order from its contract manufacturer well in advance and is obligated to pay for the materials when received and services once they are completed. As of January 31, 2015, the Company had approximately $2.3 million of outstanding purchase commitments to such contract manufacturer and other vendors.
In July 2012, we entered into an OEM agreement with a software vendor, which obligates us to pay an aggregate of $5.0 million in minimum royalty fees over a three-year period beginning after the first commercial shipment of the related product. The Company made the first commercial shipment in April 2013 and began paying royalties. As of January 31, 2015, the remaining purchase commitment was $3.2 million.
Advertising Commitment
In June 2012, the Company entered into an agreement with the Forty Niners SC Stadium Company LLC, which was amended in April 2014. As part of the amended agreement, the Company will receive advertising and related benefits at the stadium in Santa Clara, California from 2014 through 2023 for $1.75 million per year over the 10-year term. The Company recognized $1.2 million in advertising expenses related to this agreement for the year ended January 31, 2015.
10. Related Party Transactions
Toshiba
As of January 31, 2015, Toshiba Corporation and its affiliates, including Toshiba America Electronic Components, Inc. (collectively Toshiba), owned 9.2 million shares of the Company’s common stock or 10% of the Company’s total common stock outstanding.
In June 2011, the Company entered into a Sales Agreement with Toshiba pursuant to which the Company agreed to purchase at least 70% of its annual flash memory requirement from Toshiba. Our Sales Agreement with Toshiba expired in June 2014 and automatically renews for successive one-year periods unless terminated by either party.
99
Table of Contents
In July 2013, the Company signed an agreement with Toshiba for the development of PCIe cards and the sale of sample cards and received a prepayment of $16 million. The $16 million prepayment consisted of $8 million for services to be performed for the development of the PCIe cards and $8 million for the sale of sample PCIe cards and related support services. The Company retains all ownership of the intellectual property developed under the agreement. The Company applied ASC 605-25, Revenue Recognition – Multiple Element Arrangements to identify the deliverables. The Company concluded that the deliverables are development services, sample PCIe cards and support services for the sample PCIe cards. The Company recognized $6.0 million of revenue related to development services of PCIe cards and $3.1 million of revenue related to sample products during fiscal 2014 as determined on a relative fair value basis. For the year ended January 31, 2015, the Company recognized an additional $1.0 million under the agreement related to development services performed. The remaining $5.8 million advance payment was repaid to Toshiba in May 2014 pursuant to a Mutual Termination of Contract Agreement between Toshiba and the Company. Any incremental research and development expense related to this arrangement was recognized as cost of services. During fiscal 2015 and 2014, the Company recognized incremental cost of services of $0 and $1.0 million, respectively.
In addition to the development agreement, the Company recognized revenue of $1.6 million, $4.0 million and $3.6 million related to the sale of All Flash Arrays and services to Toshiba during fiscal 2015, 2014 and 2013, respectively.
The Company purchased $9.2 million, $38.2 million and $27.5 million of NAND flash memory from Toshiba during fiscal 2015, 2014 and 2013, respectively.
RiverMeadow Software, Inc.
In August 2012, the Company purchased 866,325 shares of Series A-1 convertible preferred stock of RiverMeadow Software, Inc., or RiverMeadow, for consideration of $3.0 million representing 9% of the outstanding stock of RiverMeadow. During fiscal 2013, we had product sales to RiverMeadow of $1.4 million. In September 2013, the Company purchased 118,204 shares of Series B convertible preferred stock for consideration of $0.5 million. Mr. Rosenblatt, a former member of our board of directors, previously served as a member of the Board of Directors of RiverMeadow, and Mr. Newman, a former director of Violin Memory serves as the Chairman of the Board of RiverMeadow. From April 2012 to August 2013, Mr. Basile, a former executive and director of Violin Memory served as a director of RiverMeadow.
As part of the Company’s annual review of its long-lived assets for impairment, the Company evaluated the near-term prospects of its cost method investment, including performing a probability-weighted assessment of potential outcomes with the assistance of independent investment bankers. Based on that evaluation, the Company considered the investment to be other-than-temporarily impaired at January 31, 2015. For the year ended January 31, 2015, the Company recorded an impairment on its RiverMeadow investment in the amount of $3.5 million, which was included in other expense, net in the consolidated statements of operations.
11. Restructuring Charges
During the fourth quarter of fiscal 2014, the Company initiated a restructuring plan focused on accelerating growth and increasing operating leverage, including a reorganization of its sales, marketing and engineering functions in order to better focus on the core segments of the flash-based storage market and improve operating and financial efficiency. In connection with the Company’s restructuring activities and decision to focus on its core All Flash Array market, the Company sold its PCIe Flash Memory Card product line in July 2014 and realized proceeds of $23.0 million and a gain of $17.4 million thereon.
The Company’s restructuring and transition charges consist primarily of severance, facility costs and other related charges. Severance generally includes severance payments, payments for pro-rata share of earned incentive pay and health insurance coverage. Facility costs include rent expense and related common area
100
Table of Contents
maintenance charges attributable to a leased facility that will not utilized over the remaining lease term. Other related charges primarily consist of write-off of purchased software, which will not be utilized and consulting charges associated with the reorganization of the Company. A summary of the restructuring activities is as follows (in thousands):
| Severance and Related Charges |
Excess Facility Charges |
Impairment of Assets |
Other Restructuring Charges |
Total | ||||||||||||||||
| Balance January 31, 2013 |
$ | — | $ | — | $ | — | $ | — | $ | — | ||||||||||
| Restructuring provision |
2,728 | 511 | 1,231 | 399 | 4,869 | |||||||||||||||
| Payments and other adjustments |
(357 | ) | — | (1,231 | ) | (33 | ) | (1,621 | ) | |||||||||||
|
|
|
|
|
|
|
|
|
|
|
|||||||||||
| Balance January 31, 2014 |
2,371 | 511 | — | 366 | 3,248 | |||||||||||||||
| Restructuring provision |
1,185 | 1,810 | — | 67 | 3,062 | |||||||||||||||
| Payments |
(3,556 | ) | (1,057 | ) | — | (433 | ) | (5,046 | ) | |||||||||||
|
|
|
|
|
|
|
|
|
|
|
|||||||||||
| Balance January 31, 2015 |
$ | — | $ | 1,264 | $ | — | $ | — | 1,264 | |||||||||||
|
|
|
|
|
|
|
|
|
|||||||||||||
| Less: non-current portion |
(951 | ) | ||||||||||||||||||
|
|
|
|||||||||||||||||||
| Current portion of restructuring accrual |
$ | 313 | ||||||||||||||||||
|
|
|
|||||||||||||||||||
12. Segment Information
Operating segments are defined as components of an enterprise about which separate financial information is available that is evaluated regularly by the chief operating decision maker, the Company’s chief executive officer. The Company’s chief executive officer reviews financial information presented on a consolidated basis, accompanied by information about revenue by geographic region for purposes of allocating resources and evaluating financial performance. The Company has one business activity, and there are no segment managers who are held accountable for operations, operating results and plans for levels or components below the consolidated unit level. Accordingly, the Company considers itself to be in a single reportable segment and operating unit structure.
Revenue by geography is based on the billing address of the customer. The following table sets forth revenue and property and equipment by geographic area (in thousands):
| Year Ended January 31, | ||||||||||||
| 2015 | 2014 | 2013 | ||||||||||
| Revenue |
||||||||||||
| Americas: |
||||||||||||
| United States |
$ | 48,247 | $ | 66,502 | $ | 56,229 | ||||||
| Other Americas |
402 | 425 | 543 | |||||||||
|
|
|
|
|
|
|
|||||||
| 48,649 | 66,927 | 56,772 | ||||||||||
|
|
|
|
|
|
|
|||||||
| Europe: |
||||||||||||
| United Kingdom |
5,807 | 7,491 | 5,270 | |||||||||
| Other Europe |
12,796 | 9,003 | 4,356 | |||||||||
|
|
|
|
|
|
|
|||||||
| 18,603 | 16,494 | 9,626 | ||||||||||
|
|
|
|
|
|
|
|||||||
| Asia Pacific: |
11,723 | 24,235 | 7,400 | |||||||||
|
|
|
|
|
|
|
|||||||
| $ | 78,975 | $ | 107,656 | $ | 73,798 | |||||||
|
|
|
|
|
|
|
|||||||
101
Table of Contents
| January 31, | ||||||||
| 2015 | 2014 | |||||||
| Property and Equipment |
||||||||
| United States |
$ | 9,653 | $ | 13,232 | ||||
| Europe |
204 | 415 | ||||||
| Asia Pacific |
6 | 6 | ||||||
|
|
|
|
|
|||||
| $ | 9,863 | $ | 13,653 | |||||
|
|
|
|
|
|||||
13. Net Loss Per Share
Basic net loss per share is computed by dividing the net loss by the weighted-average number of shares of common stock outstanding during the period, less the weighted-average unvested common stock subject to repurchase or forfeiture. Diluted net loss per share is computed by giving effect to all potential shares of common stock, including preferred stock, stock options and warrants, to the extent dilutive. Basic and diluted net loss per share was the same for each period presented as the inclusion of all potential common shares outstanding would have been anti-dilutive. The following table sets forth the computation of historical basic and diluted net loss per share (in thousands, except per share data):
| Year Ended January 31, | ||||||||||||
| 2015 | 2014 | 2013 | ||||||||||
| Numerator: |
||||||||||||
| Net loss |
$ | (108,903 | ) | $ | (149,809 | ) | $ | (109,102 | ) | |||
|
|
|
|
|
|
|
|||||||
| Denominator: |
||||||||||||
| Weighted average common shares outstanding |
90,994 | 38,804 | 15,443 | |||||||||
| Less: Weighted average unvested common shares subject to repurchase |
35 | 213 | 1,819 | |||||||||
|
|
|
|
|
|
|
|||||||
| Weighted average shares used to compute net loss per share of common stock, basic and diluted |
90,959 | 38,591 | 13,624 | |||||||||
|
|
|
|
|
|
|
|||||||
| Net loss per share of common stock, basic and diluted |
$ | (1.20 | ) | $ | (3.88 | ) | $ | (8.01 | ) | |||
|
|
|
|
|
|
|
|||||||
Since the Company experienced losses for all periods presented, basic net loss per share is the same as diluted net loss per share for all periods. The following potential common stock equivalents that could potentially dilute net loss per share in the future were excluded from the computation of diluted net loss per share because including them would have been anti-dilutive for the periods presented (in thousands):
| Year Ended January 31, | ||||||||||||
| 2015 | 2014 | 2013 | ||||||||||
| Convertible senior notes (on an as-converted basis) |
21,352 | — | — | |||||||||
| Shares subject to outstanding common stock options and restricted stock units |
19,498 | 20,307 | 14,529 | |||||||||
| Warrants related to common stock |
164 | 84 | — | |||||||||
| Convertible preferred stock (on an as converted basis) |
— | — | 45,858 | |||||||||
| Common stock subject to repurchase |
— | 70 | 356 | |||||||||
|
|
|
|
|
|
|
|||||||
| 41,014 | 20,461 | 60,743 | ||||||||||
|
|
|
|
|
|
|
|||||||
14. Convertible Senior Notes, Line of Credit and Debt Facility
Convertible Senior Notes
On September 19, 2014, the Company issued $120 million aggregate principal amount of Convertible Senior Notes (the “Notes”), which included $15 million issued pursuant to an over-allotment option granted to the initial
102
Table of Contents
purchasers. The aggregate principal amount of the Notes is due on October 1, 2019, unless earlier repurchased, redeemed or converted. The Company received net proceeds of $115.4 million after deducting offering costs.
Interest on the outstanding Notes accrues at a rate of 4.25% per annum and is payable semi-annually on April 1 and October 1 of each year beginning on April 1, 2015. Interest began to accrue on September 24, 2014. The Notes are unsecured senior obligations of Violin. These Notes were offered and sold only to qualified institutional investors, as defined in Rule 144 under the Securities Act of 1933 (“Securities Act”), and the Notes and the shares of the Company’s common stock issuable upon conversion of the Notes have not been registered under the Securities Act.
The Company used the net proceeds to repay all amounts outstanding and owed under its credit agreement with SVB and intends to use the remaining net proceeds for general corporate purposes, including working capital. In addition, the Company believes that the issuance of the Notes provides greater financial flexibility to the Company and should provide its customers and/or potential customers with greater confidence in the Company’s liquidity.
The Company may redeem the Notes, at its option, in whole or in part on or after October 1, 2017, if the last reported sale price per share of its common stock equals or exceeds 130% of the applicable conversion price for at least 20 trading days (whether or not consecutive) during any 30 consecutive trading day period ending on the trading day immediately prior to the date on which the Company delivers notice of the redemption.
Holders of the Notes may convert all or any portion of their notes, in multiples of $1,000 principal amount, at their option at any time prior to the close of business on the business day immediately preceding the maturity date. The Notes are convertible at an initial conversion rate of 177.8489 shares of our common stock per $1,000 principal amount of notes. This is equivalent to an initial conversion price of approximately $5.62 per share of the Company’s common stock, subject to adjustment upon the occurrence of certain dilutive events, or, if the Company obtains the required consent from its shareholders, into shares of the Company’s common stock, cash or a combination of cash and shares of its common stock, at the Company’s election. The conversion rate will be increased in the case of corporate events that constitute a “Make-Whole Fundamental Change” (as defined in the indenture governing the notes). As of January 31, 2015, the Notes are not convertible.
The holders of the Notes will have the ability to require the Company to repurchase the notes in whole or in part upon the occurrence of an event that constitutes a “Fundamental Change” (as defined in the indenture governing the notes including such events as a “change in control” or “termination of trading”). In such case, the repurchase price would be 100% of the principal amount of the notes plus accrued and unpaid interest, if any. Certain events are also considered “Events of Default,” which may result in the acceleration of the maturity of the Notes, as described in the indenture governing the Notes, including, among other events, the Company’s failure to timely file with the SEC the reports required pursuant to Section 13 or 15(d) of the Securities Exchange of 1934, as amended. There were no “Fundamental Changes” or “Events of Default” that occurred for the year ended January 31, 2015. The Company was in compliance with its covenants under the notes as of January 31, 2015.
During the time that the Notes are outstanding, the Company may not at any time incur any indebtedness other than permitted debt, which is defined as: (a) revolving debt secured by the Company’s accounts receivable and the proceeds therefrom in a principal amount not to exceed $50 million; (b) unsecured indebtedness (including the Notes) in a principal amount not to exceed (when combined with any indebtedness incurred under clause (c) below) $150 million; (c) secured indebtedness secured by the Company’s intellectual property in a principal amount not to exceed (when combined with any indebtedness incurred under clause (b) above) $150 million; and (d) unsecured subordinated indebtedness in a principal amount not to exceed $50 million. Furthermore, the Company may incur indebtedness if (a) the Company is not in default and such additional debt would not put it into default and (ii) the consolidated leverage ratio, as defined, after taking the additional debt into account does not exceed 5:1.
The conversion option of the Notes cannot be settled in cash prior to obtaining the necessary approval of the Company’s shareholders. In accordance with guidance in ASC 470-20, Debt with Conversion and Other Options
103
Table of Contents
and ASC 815-15, Embedded Derivatives, the Company determined that until shareholder approval that allows for settlement by issuing shares of the Company’s common stock, cash or a combination of cash and shares of its common stock, the embedded conversion components of the Notes do not require bifurcation and separate accounting. The $120 million principal amount of the Notes has been recorded as debt on the Company’s accompanying condensed consolidated balance sheet as of January 31, 2015.
The deferred debt issuance costs are recorded in other assets and are being amortized to interest and other financing expense using the effective interest method over the Notes’ five-year term. The deferred debt issuance costs have been classified as long-term as the underlying debt instrument is classified as a long-term liability in the Company’s accompanying condensed consolidated balance sheet. For the year ended January 31, 2015, the Company amortized debt issuance costs of $0.6 million to interest and other financing expenses. The Company also accrued interest of $1.7 million related to the Notes.
Silicon Valley Bank Credit Agreements
In August 2014, the Company entered into a $40.0 million credit facility with SVB that provides for a term loan of $10.0 million and a line of credit with a maximum commitment of $30.0 million. The Company’s obligations under the agreement were secured by a first priority security interest in substantially all of its assets. Pursuant to this arrangement, the Company agreed to issue SVB a warrant to purchase 79,323 shares of its common stock, $0.0001 par value per share, at a price per share of $3.782. The warrant expires in August 2019.
In connection with the Notes offering, the Company terminated the credit facility and repaid the loan. In addition, the Company recorded a loss on extinguishment on the term loan amounting to $0.4 million, which relates to the write-off of debt issuance costs, including the warrant issued with the term loan. The loss on extinguishment is reflected as a part of interest and other financing expense in the accompanying consolidated statements of operations.
In October 2014, the Company entered into a new $20.0 million secured revolving line of credit with SVB. The Company’s obligations under the agreement are secured by a first priority security interest in the Company’s accounts receivable and proceeds therefrom. Borrowings under this facility will bear interest at a rate per annum of either (a) the sum of (i) the Eurodollar rate plus (ii) 5.00%, or (b) the sum of (i) ABR plus (ii) 2.00%. The Company borrowed $10.0 million on this facility in January 2015. The line of credit expires on October 24, 2016, subject to acceleration upon certain specified events of defaults.
An event of default under the Company’s Credit Agreement with SVB occurred solely because the Company did not satisfy a financial condition covenant requiring it to generate revenue for the fourth quarter of fiscal 2015 in an amount not less than 80% of the amount of revenue the Company forecasted for the quarter in the annual operating plan. The Company requested, and SVB agreed, subject to certain terms and conditions, to waive the event of default. The Company and SVB agreed, subject to the same terms and conditions, to amend the Credit Agreement to provide that its revenue forecast for fiscal 2016 will be based upon the annual operating plan the Company delivered to SVB on March 11, 2015.
After the loss on extinguishment of $0.4 million, the remaining debt issuance costs associated with these two transactions are reflected in other assets and are being amortized to interest and other financing expense using the straight line method over the facility’s two-year term.
TriplePoint Capital Debt Facility
During May 2013, the Company entered into a $50.0 million debt arrangement with TriplePoint Capital LLC, or TriplePoint. The facility had first secured interest in substantially all of the Company’s assets and intellectual property other than $7.5 million of accounts receivable. The Company had one year to utilize the facility, which has a number of borrowing options ranging in duration from three months up to five years. Depending on the
104
Table of Contents
loan option, annualized interest rates range from 7.00% to 13.50%. In addition, the loans had an end-of-term payment, ranging from 0.50% to 14.00% of the principal amount depending on the duration of the loan. As of January 31, 2014, the Company had repaid all amounts outstanding on this facility. The facility was terminated in May 2014.
Convertible Notes
In fiscal 2014, the Company issued and sold convertible promissory notes for an aggregate amount of $5.2 million pursuant to a note and warrant purchase agreement. The notes had an interest rate of 10%. The outstanding principal and accrued interest converted, upon completion of the IPO, into Company’s common stock at $9.00 per share.
The Company also issued $8.7 million in convertible notes during the year ended January 31, 2013, which were converted into preferred stock upon completion of the equity financing. The convertible notes bore 6% interest per annum.
The following table is a reconciliation of the changes in the Company’s aggregate convertible notes payable liability (in thousands, except for per share data):
| Notes Value | Shares | Conversion Price per Share |
||||||||||
| Balance at January 31, 2012 |
$ | 688 | ||||||||||
| Issued |
8,698 | |||||||||||
| Accrued interest |
29 | |||||||||||
| Converted into Series D convertible preferred stock |
(9,415 | ) | 1569 | 6.00 | ||||||||
|
|
|
|||||||||||
| Balance at January 31, 2013 |
— | |||||||||||
| Issued |
5,165 | |||||||||||
| Accrued interest |
43 | |||||||||||
| Converted into common stock |
(5,203 | ) | 585 | 9.00 | ||||||||
|
|
|
|||||||||||
| Balance at January 31, 2014 |
$ | — | ||||||||||
|
|
|
|||||||||||
Other Short-term Borrowings
Line of Credit: In July 2013, the Company entered into a $7.5 million line of credit with Comerica Bank. The Company could borrow up to 80% of its current U.S.-based receivables, or $7.5 million, whichever is lower. The line was secured against the Company’s accounts receivable and collections thereof as well as its intellectual property. The line had a two-year term and bore interest of prime plus 1%. In August 2014, the Company repaid all outstanding amounts under the line of credit and terminated the Loan and Security Agreement with Comerica.
Product Financing Arrangement: In July 2014, the Company entered into a managed inventory program to run through December 2014. Under the agreement, the Company gave title to 194,000 units of product to the counterparty for approximately $2.3 million. The Company is obligated to repurchase the product in five equal monthly installments, including predetermined transaction fees of between 4.5% and 6%. As of January 31, 2015, the Company had settled this liability in full.
105
Table of Contents
Item 9. Changes in and Disagreements with Accountants on Accounting and Financial Disclosure
None.
Item 9A. Controls and Procedures
Evaluation of Disclosure Controls and Procedures
Our management, with the participation of our Chief Executive Officer and our Chief Financial Officer, evaluated the effectiveness of our disclosure controls and procedures as of January 31, 2015. The term “disclosure controls and procedures,” as defined in Rules 13a-15(e) and 15d-15(e) under the Securities Exchange Act of 1934, as amended (the “Exchange Act”), means controls and other procedures of a company that are designed to ensure that information required to be disclosed by a company in the reports that it files or submits under the Exchange Act is recorded, processed, summarized and reported, within the time periods specified in the SEC’s rules and forms. Disclosure controls and procedures include, without limitation, controls and procedures designed to ensure that information required to be disclosed by a company in the reports that it files or submits under the Exchange Act is accumulated and communicated to the company’s management, including its principal executive and principal financial officers, as appropriate to allow timely decisions regarding required disclosure. Management recognizes that any controls and procedures, no matter how well designed and operated, can provide only reasonable assurance of achieving their objectives and management necessarily applies its judgment in evaluating the cost-benefit relationship of possible controls and procedures. Based on the evaluation of our disclosure controls and procedures as of January 31, 2015, our Chief Executive Officer and Chief Financial Officer concluded that, as of such date, our disclosure controls and procedures were effective at the reasonable assurance level.
Changes in Internal Control over Financial Reporting
There were no changes in our internal control over financial reporting identified in management’s evaluation pursuant to Rules 13a-15(d) or 15d-15(d) of the Exchange Act during the fourth quarter of 2015 that materially affected, or are reasonably likely to materially affect, our internal control over financial reporting.
Management’s Report on Internal Control over Financial Reporting
Our management is responsible for establishing and maintaining adequate internal control over financial reporting. Internal control over financial reporting is a process designed by, or under the supervision of, our CEO and CFO, and effected by our Board of Directors, management and other personnel, to provide reasonable assurance regarding the reliability of financial reporting and the preparation of financial statements for external purposes in accordance with generally accepted accounting principles and includes those policies and procedures that:
| • | Pertain to the maintenance of records that accurately and fairly reflect in reasonable detail the transactions and dispositions of the assets of our company; |
| • | Provide reasonable assurance that transactions are recorded as necessary to permit preparation of financial statements in accordance with generally accepted accounting principles, and that our receipts and expenditures are being made only in accordance with authorizations of our management and directors; and |
| • | Provide reasonable assurances regarding prevention or timely detection of unauthorized acquisition, use or disposition of our assets that could have a material adverse effect on our financial statements. |
Our management assessed our internal control over financial reporting as of January 31, 2015, the end of our fiscal year. Management based its assessment on criteria established in “Internal Control-Integrated Framework (2013)” issued by the Committee of Sponsoring Organizations of the Treadway Commission. Based on management’s assessment of our internal control over financial reporting, management concluded that, as of January 31, 2015, our internal control over financial reporting was effective.
106
Table of Contents
Limitations on Effectiveness of Controls and Procedures
Internal control over financial reporting has inherent limitations. Internal control over financial reporting is a process that involves human diligence and compliance and is subject to lapses in judgment and breakdowns resulting from human failures. Internal control over financial reporting also can be circumvented by collusion or improper management override. Because of such limitations, there is a risk that material misstatements will not be prevented or detected on a timely basis by internal control over financial reporting. However, these inherent limitations are known features of the financial reporting process. Therefore, it is possible to design into the process safeguards to reduce, though not eliminate, this risk.
In designing and evaluating the disclosure controls and procedures, management recognizes that any controls and procedures, no matter how well designed and operated, can provide only reasonable assurance of achieving the desired control objectives. In addition, the design of disclosure controls and procedures must reflect the fact that there are resource constraints and that management is required to apply judgment in evaluating the benefits of possible controls and procedures relative to their costs.
Part II. Item 9B. Other Information
None.
Item 10. Directors, Executive Officers and Corporate Governance
Officers and Directors
The information required by this item is incorporated herein by reference to information contained in the Proxy Statement for our 2015 Annual Meeting of Stockholders.
Corporate Governance
We have adopted a code of business conduct that applies to each of our directors, officers and employees. The code addresses various topics, including:
| • | compliance with laws, rules and regulations, including the Foreign Corrupt Practices Act; |
| • | conflicts of interest; |
| • | insider trading; |
| • | corporate opportunities; |
| • | competition and fair dealing; |
| • | equal employment and working conditions; |
| • | record keeping; |
| • | confidentiality; |
| • | giving and accepting gifts; |
| • | compensation or reimbursement to customers; |
| • | protection and proper use of company assets; and |
| • | payments to government personnel and political contributions. |
We have adopted a code of ethics for senior financial officers applicable to our Chief Executive Officer, Chief Financial Officer and other key management employees addressing ethical issues. The code of business conduct and the code of ethics is posted on our website. The code of business conduct and the code of ethics can only be
107
Table of Contents
amended by the approval of a majority of our board of directors. Any waiver to the code of business conduct for an executive officer or director or any waiver of the code of ethics may only be granted by our board of directors or our nominating and corporate governance committee and must be timely disclosed as required by applicable law. We also have implemented whistleblower procedures that establish formal protocols for receiving and handling complaints from employees. Any concerns regarding accounting or auditing matters reported under these procedures will be communicated promptly to our audit committee.
Item 11. Executive Compensation
The information required by this item is incorporated herein by reference to information contained in the Proxy Statement for our 2015 Annual Meeting of Stockholders.
Item 12. Security Ownership of Certain Beneficial Owners and Management and Related Stockholder Matters
The information required by this item is incorporated herein by reference to information contained in the Proxy Statement for our 2015 Annual Meeting of Stockholders.
Item 13. Certain Relationships and Related Transactions and Director Independence
The information required by this item is incorporated herein by reference to information contained in the Proxy Statement for our 2015 Annual Meeting of Stockholders.
Item 14. Principal Accountant Fees and Services
The information required by this item is incorporated herein by reference to information contained in the Proxy Statement for our 2015 Annual Meeting of Stockholders.
108
Table of Contents
| Item 15. | Exhibits and Financial Statement Schedules |
We have filed the following documents as part of this Form 10-K:
| 1. | Consolidated Financial Statements: |
| 73 | ||||
| 74 | ||||
| 75 | ||||
| 76 | ||||
| 77 | ||||
| 78 | ||||
| 79 |
| 2. | Exhibits |
See the Exhibit Index immediately following the signature page of this Annual Report on Form 10-K.
109
Table of Contents
SIGNATURES
Pursuant to the requirements of Section 13 or 15(d) of the Securities Exchange Act of 1934, the registrant has duly caused this report to be signed on its behalf by the undersigned, thereunto duly authorized.
| VIOLIN MEMORY, INC. | ||||||
| Dated: April 8, 2015 | By: | /s/ Kevin A. DeNuccio | ||||
| Kevin A. DeNuccio | ||||||
| President, Chief Executive Officer and Director | ||||||
| (Principal Executive Officer) | ||||||
| Dated: April 8, 2015 | By: | /s/ Cory J. Sindelar | ||||
| Cory J. Sindelar | ||||||
| Chief Financial Officer | ||||||
| (Principal Financial Officer and Principal Accounting Officer) | ||||||
110
Table of Contents
POWER OF ATTORNEY
Each person whose individual signature appears below hereby authorizes and appoints Kevin A. DeNuccio and Cory J. Sindelar, and each of them, with full power of substitution and resubstitution and full power to act without the other, as his or her true and lawful attorney-in-fact and agent to act in his or her name, place and stead and to execute in the name and on behalf of each person, individually and in each capacity stated below, and to file any and all amendments to this Annual Report on Form 10-K, and to file the same, with all exhibits thereto, and other documents in connection therewith, with the Securities and Exchange Commission, granting unto said attorneys-in-fact and agents, and each of them, full power and authority to do and perform each and every act and thing, ratifying and confirming all that said attorneys-in-fact and agents or any of them or their or his substitute or substitutes may lawfully do or cause to be done by virtue thereof.
Pursuant to the requirements of the Securities Exchange Act of 1934, this report has been signed below by the following persons on behalf of the registrant and in the capacities and on the dates indicated
| Name |
Title |
Date | ||
| /s/ Kevin A. DeNuccio |
President, Chief Executive Officer and Director | April 8, 2015 | ||
| Kevin A. DeNuccio | ||||
| /s/ Cory J. Sindelar |
Chief Financial Officer (Principal Financial and Accounting Officer) | April 8, 2015 | ||
| Cory J. Sindelar | ||||
| /s/ Richard N. Nottenburg |
Chairman of the Board | April 8, 2015 | ||
| Richard N. Nottenburg | ||||
| /s/ Georges J. Antoun |
Director | April 8, 2015 | ||
| Georges J. Antoun | ||||
| /s/ Cheemin Bo-Linn |
Director | April 8, 2015 | ||
| Cheemin Bo-Linn | ||||
| /s/ William H. Kurtz |
Director | April 8, 2015 | ||
| William H. Kurtz | ||||
| /s/ Lawrence J. Lang |
Director | April 8, 2015 | ||
| Lawrence J. Lang | ||||
| /s/ Vivekanand Mahadevan |
Director | April 8, 2015 | ||
| Vivekanand Mahadevan | ||||
| /s/ David B. Walrod |
Director | April 8, 2015 | ||
| David B. Walrod | ||||
111
Table of Contents
EXHIBIT INDEX
| Incorporated by Reference | ||||||||||||||||
| Exhibit |
Description |
Form |
Exhibit |
Date Filed |
Filed | |||||||||||
| 3.1 |
Restated Certificate of Incorporation of the Registrant | S-1 | 3.1(b) | 9/16/2013 | ||||||||||||
| 3.2 |
Amended and Restated Bylaws of the Registrant | S-1 | 3.2(b) | 9/16/2013 | ||||||||||||
| 4.1 |
Form of Common Stock Certificate | S-1 | 4.1 | 9/16/2013 | ||||||||||||
| 4.2 |
Plain English Warrant Agreement between the Registrant and TriplePoint Capital LLC dated May 13, 2013 | S-1 | 4.5 | 8/26/2013 | ||||||||||||
| 4.3 |
Form of Warrants to Purchase Shares of Series D Preferred Stock issued June 2013 | S-1 | 4.8 | 8/26/2013 | ||||||||||||
| 4.4 |
Schedule of Warrants issued by the Registrant to purchase shares of Series D Preferred Stock | S-1 | 4.9 | 8/26/2013 | ||||||||||||
| 10.1 |
Form of Indemnification Agreement between the Registrant and its officers and directors | S-1 | 10.1 | 8/26/2013 | ||||||||||||
| 10.2# |
2005 Stock Plan and form of agreements thereunder | S-1 | 10.2 | 8/26/2013 | ||||||||||||
| 10.3# |
2012 Stock Incentive Plan and form of agreement thereunder | S-8 | 99.2 | 9/27/2013 | ||||||||||||
| 10.4# |
2012 Employee Stock Purchase Plan | S-8 | 99.3 | 9/12/2013 | ||||||||||||
| 10.5 |
Sublease between the Registrant and Tellabs Operations, Inc. dated June 24, 2013 | S-1 | 10.18 | 8/26/2013 | ||||||||||||
| 10.6# |
Offer Letter dated February 1, 2014 between the Registrant and Kevin A. DeNuccio | 8-K | 10.1 | 2/6/2014 | ||||||||||||
| 10.7# |
Stock Option Agreement dated February 3, 2014 providing Kevin A. DeNuccio an option to purchase 1,000,000 shares of Registrant Common Stock | 8-K | 10.2 | 2/6/2014 | ||||||||||||
| 10.8# |
Stock Option Agreement dated February 3, 2014 providing Kevin A. DeNuccio an option to purchase 3,000,000 shares of Registrant Common Stock | 8-K | 10.3 | 2/6/2014 | ||||||||||||
| 10.9# |
Offer Letter between the Registrant and Cory J. Sindelar dated December 4, 2011 | S-1 | 10.8 | 8/26/2013 | ||||||||||||
| 10.10# |
Change of Control and Severance Agreement between the Registrant and Cory J. Sindelar dated January 31, 2014 | 8-K | 10.1 | 2/6/2014 | ||||||||||||
| 10.11# |
Offer Letter dated February 12, 2014, and effective February 18, 2014, between the Registrant and Thomas G. Mitchell | 8-K | 10.1 | 2/24/2014 | ||||||||||||
| 10.12# |
Stock Option Agreement dated February 19, 2014 providing Thomas G. Mitchell an option to purchase 1,000,000 shares of Registrant common stock | 8-K | 10.2 | 2/24/2014 | ||||||||||||
| 10.13# |
Change of Control and Severance Agreement dated February 20, 2014 between the Registrant and Thomas G. Mitchell | 8-K | 10.3 | 2/24/2014 | ||||||||||||
112
Table of Contents
| Incorporated by Reference | ||||||||||||||||
| Exhibit |
Description |
Form |
Exhibit |
Date Filed |
Filed | |||||||||||
| 10.14+ |
Sponsorship Agreement between the Registrant and Forty Niners SC Stadium Company LLC dated June 13, 2012 | S-1 | 10.14 | 8/26/2013 | ||||||||||||
| 10.15+ |
Supply Agreement among the Registrant, Toshiba Corporation and Toshiba America Electronic Components, Inc. dated June 27, 2011, as amended | S-1 | 10.15 | 8/26/2013 | ||||||||||||
| 10.16+ |
PCIe Card Development Agreement between the Registrant and Toshiba Corporation dated July 16, 2013 | S-1 | 10.23 | 9/16/2013 | ||||||||||||
| 10.17+ |
Flextronics Infrastructure Manufacturing Services Agreement between the Registrant and Flextronics Telecom Systems, Ltd. dated May 13, 2011 | S-1 | 10.10 | 8/26/2013 | ||||||||||||
| 10.18# |
Settlement Agreement and Release by and between Donald G. Basile and the Registrant effective April 12, 2014 | 10-K | 10.19 | 4/16/2014 | ||||||||||||
| 10.19# |
Separation Agreement between the Registrant and Dixon R. Doll, Jr. dated January 2, 2014 | 10-K | 10.20 | 4/16/2014 | ||||||||||||
| 10.20 |
Plain English Growth Capital Loan and Security Agreement between the Registrant and TriplePoint Capital LLC dated May 13, 2013 | S-1 | 10.16 | 8/26/2013 | ||||||||||||
| 10.21 |
Plain English Intellectual Property Security Agreement between the Registrant and TriplePoint Capital LLC dated May 13, 2013 | S-1 | 10.17 | 9/16/2013 | ||||||||||||
| 10.22 |
Loan and Security Agreement between the Registrant and Comerica Bank dated July 18, 2013 | S-1 | 10.19 | 8/26/2013 | ||||||||||||
| 10.23 |
Intellectual Property Security Agreement between the Registrant and Comerica Bank dated July 18, 2013 |
S-1 | 10.20 | 9/16/2013 | ||||||||||||
| 10.24 |
Inter Creditor Agreement between the Registrant, Comerica Bank and TriplePoint Capital LLC dated July 18, 2013 | S-1 | 10.21 | 8/26/2013 | ||||||||||||
| 10.25 |
Form of Subordination Agreement between Comerica Bank and certain creditors | S-1 | 10.22 | 8/26/2013 | ||||||||||||
| 10.26+ |
First Amendment to Sponsorship Agreement by and between Forty Niners SC Stadium Company and the Company — redacted version | 8-K | 10.1 | 6/6/2014 | ||||||||||||
| 10.27 |
Credit Agreement dates as of October 24, 2014, entered into by and among the Company, certain subsidiaries of the Company, the lenders party hereto from time to time and Silicon Valley Bank, as administrative agent and collateral agent | 8-K | 10.1 | 10/30/2014 | ||||||||||||
| 10.28 |
Guarantee and Collateral Agreement dated as of October 24, 2014 between the Company in favor of Silicon Valley Bank, as administrative agent | 8-K | 10.2 | 10/30/2014 | ||||||||||||
113
Table of Contents
| Incorporated by Reference | ||||||||||||||||||
| Exhibit |
Description |
Form |
Exhibit |
Date Filed |
Filed |
|||||||||||||
| 10.29 |
Indenture dated as of September 24, 2014, between Violin Memory, Inc. and Wilmington Trust, National Association, as trustee (including form of Note) (incorporated by reference to Exhibit 4.1 to the Company’s Current Report on Form 8-K filed September 24, 2014 | 8-K | 4.1 | 10/6/2014 | ||||||||||||||
| 10.30# |
Agreement dated September 30, 2014, between Kevin A. DeNuccio and Violin Memory, Inc. | 8-K | 10.1 | 10/1/2014 | ||||||||||||||
| 10.31 |
Indenture dated as of September 24, 2014, between Violin Memory, Inc. and Wilmington Trust, National Association, as trustee (including form of Note) | 8-K | 4.1 | 9/24/2014 | ||||||||||||||
| 21.1 |
List of Subsidiaries | S-1 | 21.1 | 8/26/2013 | ||||||||||||||
| 23.1 |
Consent of Registered Public Accounting Firm — KPMG LLP | X | ||||||||||||||||
| 31.1 |
Certification of Principal Executive Officer required by Rule 13a-14(a) or Rule 15d-14(a) of the Securities Exchange Act of 1934, as adopted pursuant to Section 302 of the Sarbanes-Oxley Act of 2002 | X | ||||||||||||||||
| 31.2 |
Certification of Principal Financial Officer required by Rule 13a-14(a) or Rule 15d-14(a) of the Securities Exchange Act of 1934, as adopted pursuant to Section 302 of the Sarbanes-Oxley Act of 2002 | X | ||||||||||||||||
| 32.1 |
Certification of Chief Executive Officer pursuant to 18 U.S.C. Section 1350, as adopted pursuant to Section 906 of the Sarbanes-Oxley Act of 2002* | X | ||||||||||||||||
| 32.2 |
Certification of Chief Financial Officer pursuant to 18 U.S.C. Section 1350, as adopted pursuant to Section 906 of the Sarbanes-Oxley Act of 2002* | X | ||||||||||||||||
| 101.INS |
XBRL Instance Document** | X | ||||||||||||||||
| 101.SCH |
XBRL Taxonomy Extension Schema Document | X | ||||||||||||||||
| 101.CAL |
XBRL Taxonomy Extension Calculation Linkbase Document | X | ||||||||||||||||
| 101.DEF |
XBRL Taxonomy Extension Definition Linkbase Document | X | ||||||||||||||||
| 101.LAB |
XBRL Taxonomy Extension Label Linkbase Document | X | ||||||||||||||||
| 101.PRE |
XBRL Taxonomy Extension Presentation Linkbase Document | X | ||||||||||||||||
| # | Management contract or compensatory arrangement |
| + | Confidential treatment request |
| * | The certification furnished in Exhibits 32.1 and 32.2 hereto are deemed to accompany this Annual Report on Form 10-K and will not be deemed “filed” for purposes of Section 18 of the Securities Exchange Act of 1934, as amended. Such certifications will not be deemed to be incorporated by reference into any filings under the Securities Act of 1933, as amended, or the Securities Exchange Act of 1934, as amended, except to the extent that the registrant specifically incorporates it by reference. |
114