Attached files
| file | filename |
|---|---|
| 8-K - FORM 8-K - Global Net Lease, Inc. | v406619_8k.htm |
| EX-10.1 - EXHIBIT 10.1 - Global Net Lease, Inc. | v406619_ex10-1.htm |
Exhibit 99.1

Anticipated NYSE Listing
We Are Applying To List On The NYSE Incorporated July 2011 Anticipated Listing on NYSE Assembled High - Quality Net Lease Real Estate Portfolio Initial Capital Raised Fully Invested Q1 2015 Portfolio Positioned for Future Growth and Value Creation Closed Non - Traded Equity Offering June 2014 1 Executive Summary Portfolio Overview Investment Strategy Management Team Financial Overview Conclusion

Global Net Lease, Inc. (1) NYSE: GNL Anticipated listing to occur the week of May 4, 2015 $0.71 per share annualized distribution (paid monthly) No lock - up; shares will be freely tradable Management will not sell shares in connection with the listing Upon listing, we expect to commence a tender offer: Tender Amount: Up to $125 million Tender Price: $10.50 per share Tender Period: 20 business days Ticker Listing Date Distribution No Lock - up Company Listing Summary Global Net Lease, Inc. (“GNL”) intends to list on the New York Stock Exchange. 2 Tender Offer Executive Summary Portfolio Overview Investment Strategy Management Team Financial Overview Conclusion ___________________________ 1. The company expects to change its name to “Global Net Lease, Inc. in conjunction with the listing.
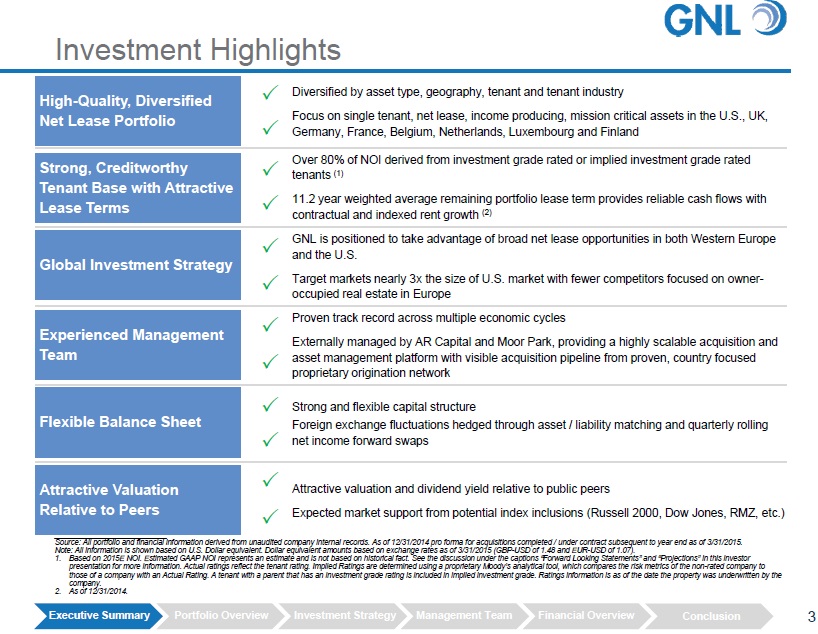
Diversified by asset type, geography, tenant and tenant industry Focus on single tenant, net lease, income producing, mission critical assets in the U.S., UK, Germany, France, Belgium, Netherlands, Luxembourg and Finland Over 80% of NOI derived from investment grade rated or implied investment grade rated tenants (1) 11.2 year weighted average remaining portfolio lease term provides reliable cash flows with contractual and indexed rent growth (2) GNL is positioned to take advantage of broad net lease opportunities in both Western Europe and the U.S. Target markets nearly 3x the size of U.S. market with fewer competitors focused on owner - occupied real estate in Europe Proven track record across multiple economic cycles Externally managed by AR Capital and Moor Park, providing a highly scalable acquisition and asset management platform with visible acquisition pipeline from proven, country focused proprietary origination network Strong and flexible capital structure Foreign exchange fluctuations hedged through asset / liability matching and quarterly rolling net income forward swaps Attractive valuation and dividend yield relative to public peers Expected market support from potential index inclusions (Russell 2000, Dow Jones, RMZ, etc.) Investment Highlights High - Quality, Diversified Net Lease Portfolio Strong, Creditworthy Tenant Base with Attractive Lease Terms Global Investment Strategy Experienced Management Team Flexible Balance Sheet Attractive Valuation Relative to Peers 3 Executive Summary Portfolio Overview Investment Strategy Management Team Financial Overview Conclusion ___________________________ Source: All portfolio and financial information derived from unaudited company internal records. As of 12/31/2014 pro forma f or acquisitions completed / under contract subsequent to year end as of 3/31/2015. Note: All information is shown based on U.S. Dollar equivalent. Dollar equivalent amounts based on exchange rates as of 3/31/ 201 5 (GBP - USD of 1.48 and EUR - USD of 1.07). 1. Based on 2015E NOI. Estimated GAAP NOI represents an estimate and is not based on historical fact. See the discussion under t he captions “Forward Looking Statements” and “Projections” in this investor presentation for more information. Actual ratings reflect the tenant rating. Implied Ratings are determined using a proprieta ry Moody’s analytical tool, which compares the risk metrics of the non - rated company to those of a company with an Actual Rating. A tenant with a parent that has an investment grade rating is included in implied i nve stment grade. Ratings information is as of the date the property was underwritten by the company. 2. As of 12/31/2014.
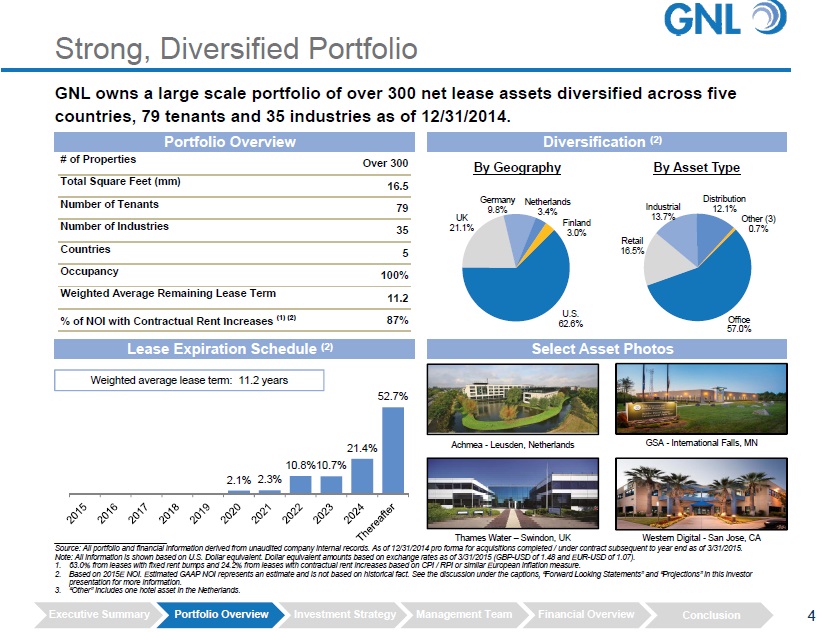
2.1% 2.3% 10.8% 10.7% 21.4% 52.7% U.S. 62.6% UK 21.1% Germany 9.8% Netherlands 3.4% Finland 3.0% Strong, Diversified Portfolio Portfolio Overview Diversification (2) ___________________________ Source: All portfolio and financial information derived from unaudited company internal records. As of 12/31/2014 pro forma f or acquisitions completed / under contract subsequent to year end as of 3/31/2015. Note: All information is shown based on U.S. Dollar equivalent. Dollar equivalent amounts based on exchange rates as of 3/31/ 201 5 (GBP - USD of 1.48 and EUR - USD of 1.07). 1. 63.0% from leases with fixed rent bumps and 24.2% from leases with contractual rent increases based on CPI / RPI or similar E uro pean inflation measure. 2. Based on 2015E NOI. Estimated GAAP NOI represents an estimate and is not based on historical fact. See the discussion under t he captions, “Forward Looking Statements” and “Projections” in this investor presentation for more information. 3. “Other” includes one hotel asset in the Netherlands. GNL owns a large scale portfolio of over 300 net lease assets diversified across five countries, 79 tenants and 35 industries as of 12/31/2014. By Geography By Asset Type Thames Water – Swindon, UK Western Digital - San Jose, CA GSA - International Falls, MN Select Asset Photos Achmea - Leusden, Netherlands Lease Expiration Schedule (2) Weighted average lease term: 11.2 years 4 Office 57.0% Retail 16.5% Industrial 13.7% Distribution 12.1% Other (3) 0.7% Executive Summary Portfolio Overview Investment Strategy Management Team Financial Overview Conclusion # of Properties Over 300 Total Square Feet (mm) 16.5 Number of Tenants 79 Number of Industries 35 Countries 5 Occupancy 100% Weighted Average Remaining Lease Term 11.2 % of NOI with Contractual Rent Increases (1) (2) 87%
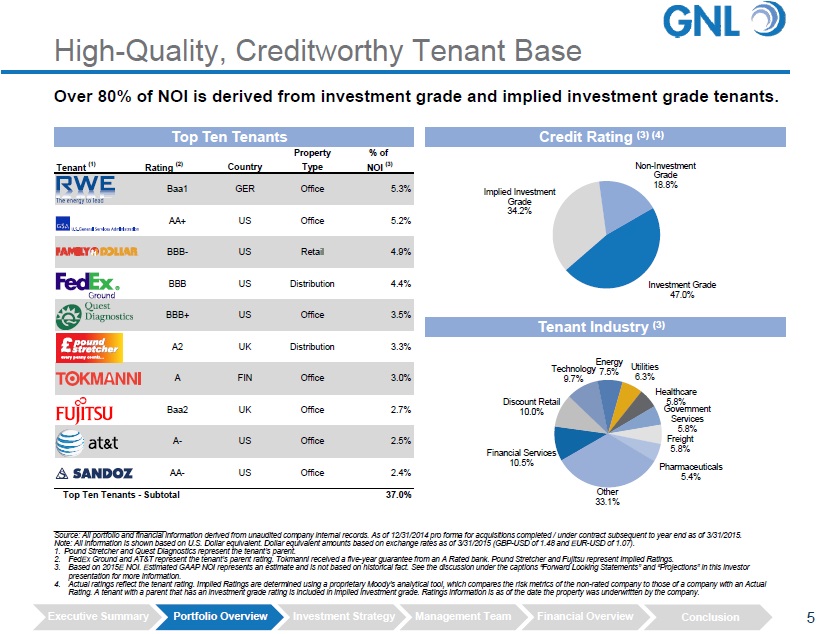
Property % of Tenant (1) Rating (2) Country Type NOI (3) Baa1 GER Office 5.3% AA+ US Office 5.2% BBB- US Retail 4.9% BBB US Distribution 4.4% BBB+ US Office 3.5% A2 UK Distribution 3.3% A FIN Office 3.0% Baa2 UK Office 2.7% A- US Office 2.5% AA- US Office 2.4% Top Ten Tenants - Subtotal 37.0% Top Ten Tenants High - Quality, Creditworthy Tenant Base ___________________________ Source: All portfolio and financial information derived from unaudited company internal records. As of 12/31/2014 pro forma f or acquisitions completed / under contract subsequent to year end as of 3/31/2015. Note: All information is shown based on U.S. Dollar equivalent. Dollar equivalent amounts based on exchange rates as of 3/31/ 201 5 (GBP - USD of 1.48 and EUR - USD of 1.07). 1. Pound Stretcher and Quest Diagnostics represent the tenant’s parent. 2. FedEx Ground and AT&T represent the tenant’s parent rating. Tokmanni received a five - year guarantee from an A Rated bank. Pound Stretcher and Fujitsu represent Implied Ratings. 3. Based on 2015E NOI. Estimated GAAP NOI represents an estimate and is not based on historical fact. See the discussion under t he captions “Forward Looking Statements” and “Projections” in this investor presentation for more information. 4. Actual ratings reflect the tenant rating. Implied Ratings are determined using a proprietary Moody’s analytical tool, which c omp ares the risk metrics of the non - rated company to those of a company with an Actual Rating. A tenant with a parent that has an investment grade rating is included in implied investment grade. Ratings informati on is as of the date the property was underwritten by the company. Investment Grade 47.0% Implied Investment Grade 34.2% Non - Investment Grade 18.8% Credit Rating (3) (4) Financial Services 10.5% Discount Retail 10.0% Technology 9.7% Energy 7.5% Utilities 6.3% Healthcare 5.8% Government Services 5.8% Freight 5.8% Pharmaceuticals 5.4% Other 33.1% Tenant Industry (3) Over 80% of NOI is derived from investment grade and implied investment grade tenants. 5 Executive Summary Portfolio Overview Investment Strategy Management Team Financial Overview Conclusion
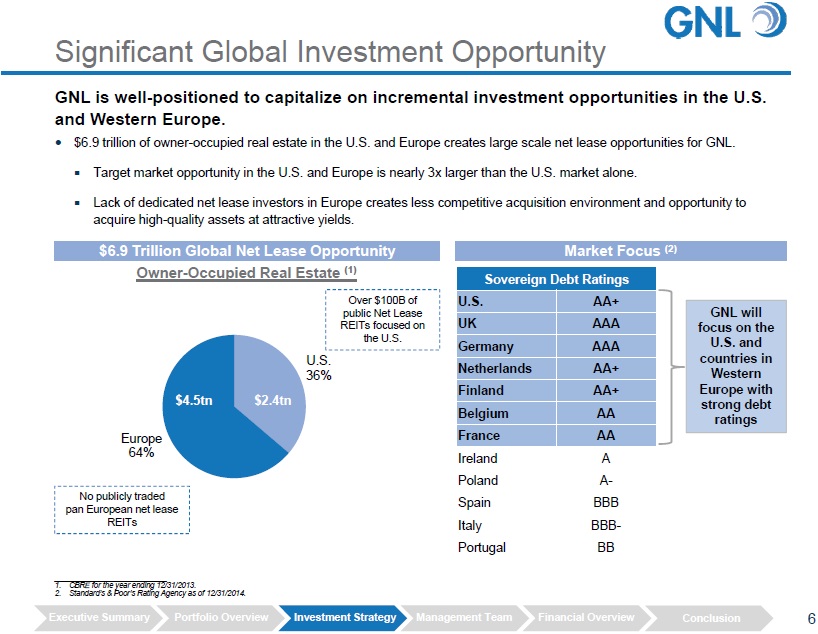
Significant Global Investment Opportunity GNL is well - positioned to capitalize on incremental investment opportunities in the U.S. and Western Europe. Sovereign Debt Ratings U.S. AA+ UK AAA Germany AAA Netherlands AA+ Finland AA+ Belgium AA France AA Ireland A Poland A - Spain BBB Italy BBB - Portugal BB ___________________________ 1. CBRE for the year ending 12/31/2013. 2. Standard’s & Poor’s Rating Agency as of 12/31/2014. GNL will focus on the U.S. and countries in Western Europe with strong debt ratings Owner - Occupied Real Estate (1) $6.9 Trillion Global Net Lease Opportunity $6.9 trillion of owner - occupied real estate in the U.S. and Europe creates large scale net lease opportunities for GNL. Target market opportunity in the U.S. and Europe is nearly 3x larger than the U.S. market alone. Lack of dedicated net lease investors in Europe creates less competitive acquisition environment and opportunity to acquire high - quality assets at attractive yields. Market Focus (2) U.S. 36% Europe 64% 6 $2.4tn $4.5tn No publicly traded pan European net lease REITs Over $100B of public Net Lease REITs focused on the U.S. Executive Summary Portfolio Overview Investment Strategy Management Team Financial Overview Conclusion

Focused Investment Strategy Creates Value U.S ., UK , Germany, Finland , Belgium, Netherlands, Luxembourg and France Tenant Credit Quality Geography Real Estate / Market Fundamentals Asset Type Investment Strategy – Key Criteria Competitive advantage analysis Business model evaluation Tenant credit review Real Estate financial analysis Review & benchmark underlying asset level trading performance Key due diligence metrics – valuation, technical, insurance, legal, tax, accounting Disciplined Acquisition Process Total Net Lease Deals Evaluated: ~ $19.7 billion Total Net Lease Acquisitions: ~ $2.2 billion Total Net Lease LOIs Submitted: ~$6.8 billion 7 Structure & Pricing Single tenant, net lease, income producing, commercial properties Corporate headquarters or other mission critical assets Long - term leases tied to inflation indices for annual increases Maximize differential between cap rates and cost of funding Well - defined investment strategy and rigorous underwriting process used to assemble high - quality, long duration, diversified, net lease property portfolio in the U.S. and Europe. Executive Summary Portfolio Overview Investment Strategy Management Team Financial Overview Conclusion

Proven Track Record Over $25 billion Over $30 billion • Principals have combined experience of 66 years in the European real estate market • Acquired and currently asset manage 101 properties, $2.8 billion, 9.8 million sq. ft. across Europe since the beginning of 2013 • Among leading global real estate managers • Acquired ~5,200 properties totaling over ~165 million sq. ft. across the U.S. since 2007 • Created over 20 public registered companies Long term, relationship ___________________________ Note: Dollar equivalent amounts based on exchange rates as of 3/31/2015 (GBP - USD of 1.48 and EUR - USD of 1.07). 1. As of 12/31/2014. Fully integrated external management team creates highly scalable platform with visible acquisition pipeline generated by proven, country focused origination network. Europe U.S. Manager Geographic Focus Real Estate Acquired (1) Track Record 8 Executive Summary Portfolio Overview Investment Strategy Management Team Financial Overview Conclusion
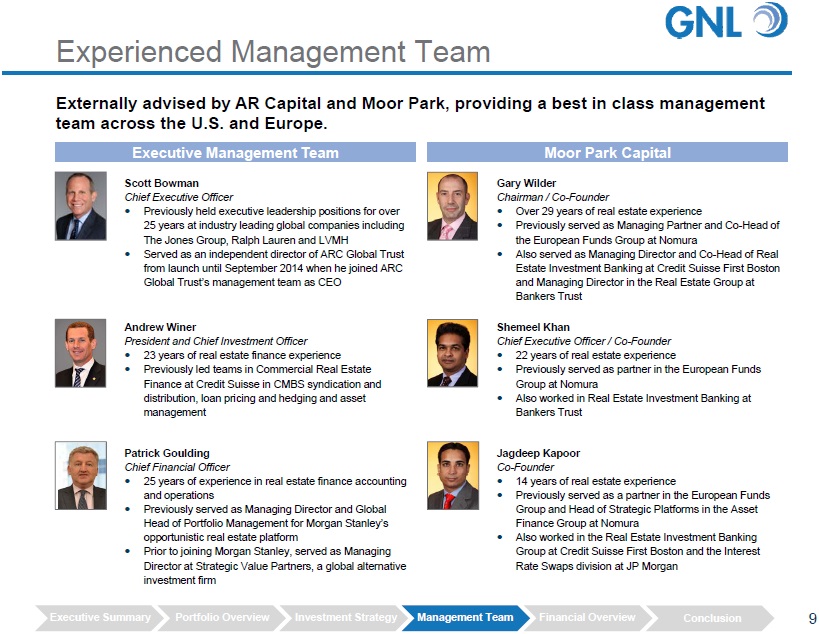
Experienced Management Team Executive Management Team Moor Park Capital Shemeel Khan Chief Executive Officer / Co - Founder 22 years of real estate experience Previously served as partner in the European Funds Group at Nomura Also worked in Real Estate Investment Banking at Bankers Trust Jagdeep Kapoor Co - Founder 14 years of real estate experience Previously served as a partner in the European Funds Group and Head of Strategic Platforms in the Asset Finance Group at Nomura Also worked in the Real Estate Investment Banking Group at Credit Suisse First Boston and the Interest Rate Swaps division at JP Morgan Gary Wilder Chairman / Co - Founder Over 29 years of real estate experience Previously served as Managing Partner and Co - Head of the European Funds Group at Nomura Also served as Managing Director and Co - Head of Real Estate Investment Banking at Credit Suisse First Boston and Managing Director in the Real Estate Group at Bankers Trust 9 Scott Bowman Chief Executive Officer Previously held executive leadership positions for over 25 years at industry leading global companies including The Jones Group, Ralph Lauren and LVMH Served as an independent director of ARC Global Trust from launch until September 2014 when he joined ARC Global Trust’s management team as CEO Andrew Winer President and Chief Investment Officer 23 years of real estate finance experience Previously led teams in Commercial Real Estate Finance at Credit Suisse in CMBS syndication and distribution, loan pricing and hedging and asset management Patrick Goulding Chief Financial Officer 25 years of experience in real estate finance accounting and operations Previously served as Managing Director and Global Head of Portfolio Management for Morgan Stanley’s opportunistic real estate platform Prior to joining Morgan Stanley, served as Managing Director at Strategic Value Partners, a global alternative investment firm Executive Summary Portfolio Overview Investment Strategy Management Team Financial Overview Conclusion Externally advised by AR Capital and Moor Park, providing a best in class management team across the U.S. and Europe.
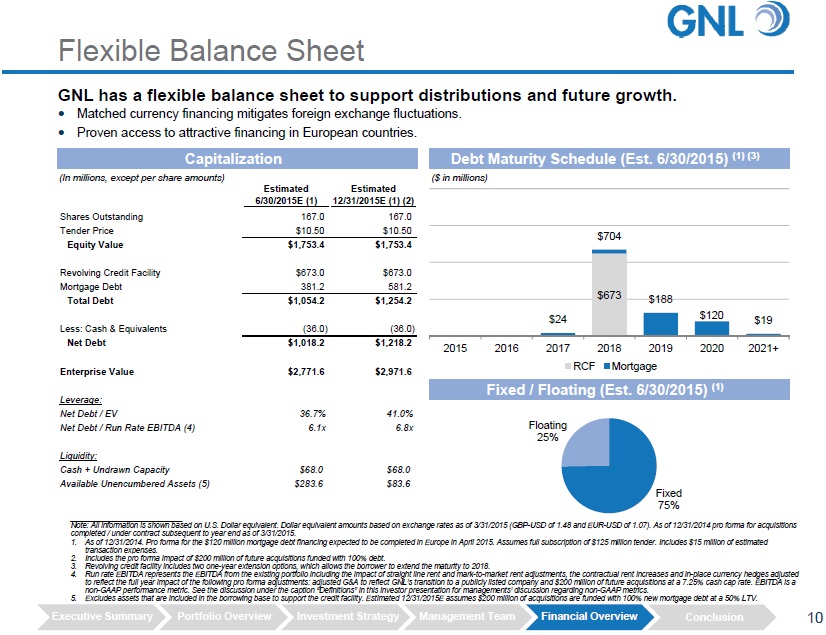
Fixed 75% Floating 25% Flexible Balance Sheet GNL has a flexible balance sheet to support distributions and future growth. ___________________________ Note: All information is shown based on U.S. Dollar equivalent. Dollar equivalent amounts based on exchange rates as of 3/31/ 201 5 (GBP - USD of 1.48 and EUR - USD of 1.07). As of 12/31/2014 pro forma for acquisitions completed / under contract subsequent to year end as of 3/31/2015. 1. As of 12/31/2014. Pro forma for the $120 million mortgage debt financing expected to be completed in Europe in April 2015. As sum es full subscription of $125 million tender. Includes $15 million of estimated transaction expenses. 2. Includes the pro forma impact of $200 million of future acquisitions funded with 100% debt. 3. Revolving credit facility includes two one - year extension options, which allows the borrower to extend the maturity to 2018. 4. Run rate EBITDA represents the EBITDA from the existing portfolio including the impact of straight line rent and mark - to - market rent adjustments, the contractual rent increases and in - place currency hedges adjusted to reflect the full year impact of the following pro forma adjustments: adjusted G&A to reflect GNL’s transition to a publicl y l isted company and $200 million of future acquisitions at a 7.25% cash cap rate. EBITDA is a non - GAAP performance metric. See the discussion under the caption “Definitions” in this investor presentation for managements’ d iscussion regarding non - GAAP metrics. 5. Excludes assets that are included in the borrowing base to support the credit facility. Estimated 12/31/2015E assumes $200 mi lli on of acquisitions are funded with 100% new mortgage debt at a 50% LTV. $673 $24 $704 $188 $120 $19 2015 2016 2017 2018 2019 2020 2021+ RCF Mortgage Debt Maturity Schedule (Est. 6/30/2015) (1) (3) Capitalization (In millions, except per share amounts) ($ in millions) Matched currency financing mitigates foreign exchange fluctuations. Proven access to attractive financing in European countries. 10 Fixed / Floating (Est. 6/30/2015) (1) Executive Summary Portfolio Overview Investment Strategy Management Team Financial Overview Conclusion Estimated Estimated 6/30/2015E (1) 12/31/2015E (1) (2) Shares Outstanding 167.0 167.0 Tender Price $10.50 $10.50 Equity Value $1,753.4 $1,753.4 Revolving Credit Facility $673.0 $673.0 Mortgage Debt 381.2 581.2 Total Debt $1,054.2 $1,254.2 Less: Cash & Equivalents (36.0) (36.0) Net Debt $1,018.2 $1,218.2 Enterprise Value $2,771.6 $2,971.6 Leverage: Net Debt / EV 36.7% 41.0% Net Debt / Run Rate EBITDA (4) 6.1x 6.8x Liquidity: Cash + Undrawn Capacity $68.0 $68.0 Available Unencumbered Assets (5) $283.6 $83.6
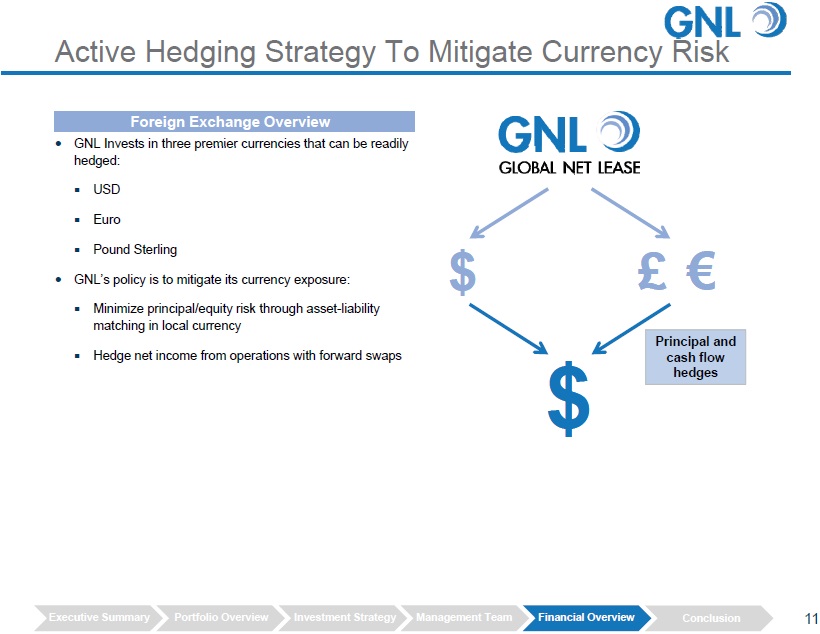
Active Hedging Strategy To Mitigate Currency Risk 11 Foreign Exchange Overview GNL Invests in three premier currencies that can be readily hedged: USD Euro Pound Sterling GNL’s policy is to mitigate its currency exposure: Minimize principal/equity risk through asset - liability matching in local currency Hedge net income from operations with forward swaps £ € $ $ Principal and cash flow hedges Executive Summary Portfolio Overview Investment Strategy Management Team Financial Overview Conclusion
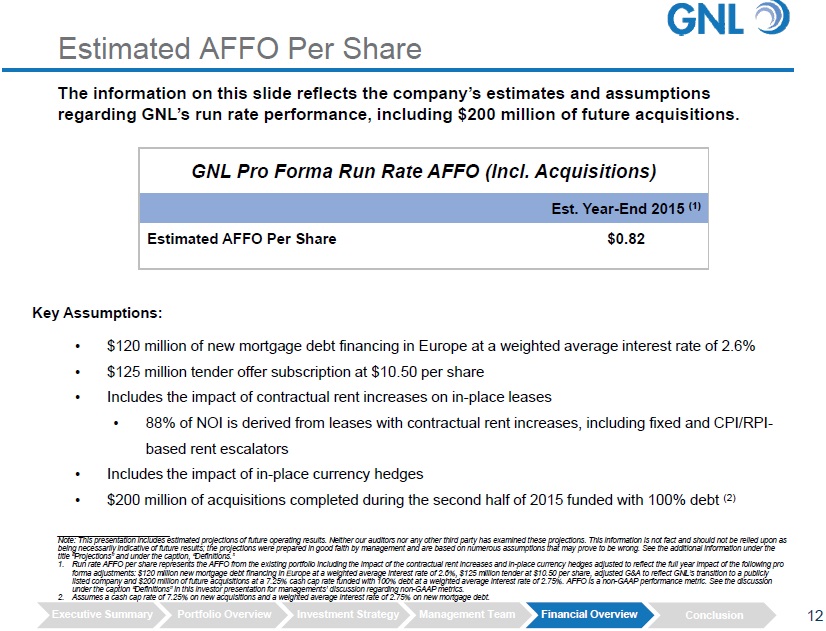
2015 AFFO Guidance Key Assumptions: • $120 million of new mortgage debt financing in Europe at a weighted average interest rate of 2.6% • $125 million tender offer subscription at $10.50 per share • Includes the impact of contractual rent increases on in - place leases • 88% of NOI is derived from leases with contractual rent increases, including fixed and CPI/RPI - based rent escalators • Includes the impact of in - place currency hedges • $200 million of acquisitions completed during the second half of 2015 funded with 100% debt (2) GNL Pro Forma Run Rate AFFO (Incl. Acquisitions) Est. Year - End 2015 (1) Estimated AFFO Per Share $0.82 Estimated AFFO Per Share 12 The information on this slide reflects the company’s estimates and assumptions regarding GNL’s run rate performance, including $200 million of future acquisitions. ___________________________ Note: This presentation includes estimated projections of future operating results. Neither our auditors nor any other third par ty has examined these projections. This information is not fact and should not be relied upon as being necessarily indicative of future results; the projections were prepared in good faith by management and are based on nu mer ous assumptions that may prove to be wrong. See the additional information under the title “Projections” and under the caption, “Definitions.” 1. Run rate AFFO per share represents the AFFO from the existing portfolio including the impact of the contractual rent increase s a nd in - place currency hedges adjusted to reflect the full year impact of the following pro forma adjustments: $120 million new mortgage debt financing in Europe at a weighted average interest rate of 2.6%, $125 milli on tender at $10.50 per share, adjusted G&A to reflect GNL’s transition to a publicly listed company and $200 million of future acquisitions at a 7.25% cash cap rate funded with 100% debt at a weighted average i nte rest rate of 2.75%. AFFO is a non - GAAP performance metric. See the discussion under the caption “Definitions” in this investor presentation for managements’ discussion regarding non - GAAP metrics. 2. Assumes a cash cap rate of 7.25% on new acquisitions and a weighted average interest rate of 2.75% on new mortgage debt. Executive Summary Portfolio Overview Investment Strategy Management Team Financial Overview Conclusion

$10.50 $12.22 $15.66 $8.00 $10.00 $12.00 $14.00 $16.00 $18.00 GNL At Tender Price 12.9x GNL At Comps Average Multiple (2) 14.9x GNL At Realty Income's Multiple 19.1x Attractive Valuation ___________________________ Sources: U.S. SEC Company filings and SNL Financial. As of 12/31/2014. Market Data as of 3/31/2015. Note: All information is shown based on U.S. Dollar equivalent. Dollar equivalent amounts based on exchange rates as of 3/31/ 201 5 (GBP - USD of 1.48 and EUR - USD of 1.07). As of 12/31/2014 pro forma for acquisitions completed / under contract subsequent to year end as of 3/31/2015. 1. Run rate AFFO per share represents the AFFO from the existing portfolio including the impact of the contractual rent increase s a nd in - place currency hedges adjusted to reflect the full year impact of the following pro forma adjustments: $120 million new mortgage debt financing in Europe at a weighted average interest rate of 2.6%, $125 milli on tender at $10.50 per share, adjusted G&A to reflect GNL’s transition to a publicly listed company and $200 million of future acquisitions at a 7.25% cash cap rate funded with 100% debt at a weighted average i nte rest rate of 2.75%. AFFO is a non - GAAP performance metric. See the discussion under the caption “Definitions” in this investor presentation for managements’ discussion regarding non - GAAP metrics. 2. Includes CSG, GPT, LXP, NNN, O, SIR, SRC, STOR and WPC. GNL Implied Price Per Share • GNL will continue to pay a distribution of $0.71 per share. • GNL will exhibit a strong distribution payout ratio of 87% based on Pro Forma Run Rate AFFO. 13 Estimated Pro Forma Run Rate AFFO per share of $0.82 (1) Executive Summary Portfolio Overview Investment Strategy Management Team Financial Overview Conclusion
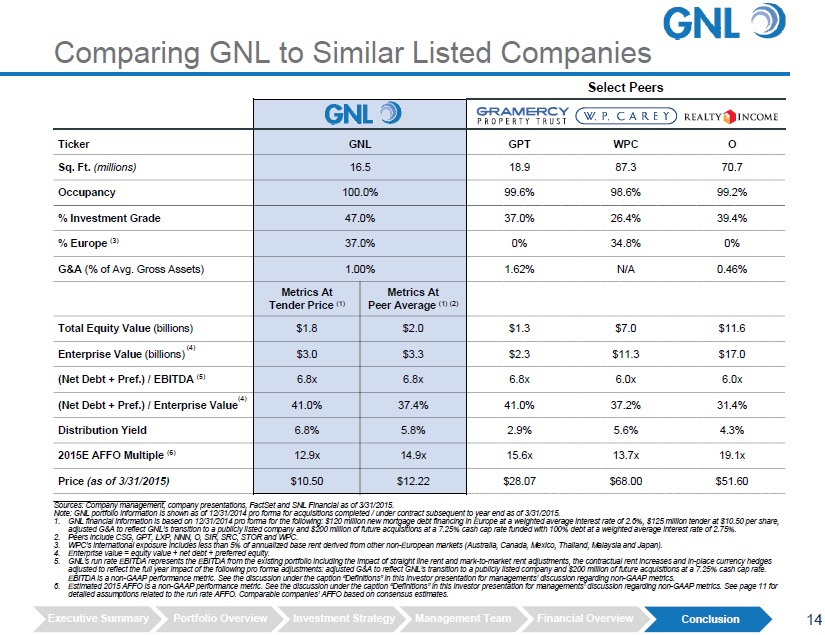
Select Peers Ticker GNL GPT WPC O Sq. Ft. (millions) 16.5 18.9 87.3 70.7 Occupancy 100.0% 99.6% 98.6% 99.2% % Investment Grade 47.0% 37.0% 26.4% 39.4% % Europe (3) 37.0% 0% 34.8% 0% G&A (% of Avg. Gross Assets) 1.00% 1.62% N/A 0.46% Metrics At Tender Price (1) Metrics At Peer Average (1) (2) Total Equity Value (billions) $1.8 $2.0 $1.3 $7.0 $11.6 Enterprise Value (billions) (4) $3.0 $3.3 $2.3 $11.3 $17.0 (Net Debt + Pref.) / EBITDA (5) 6.8x 6.8x 6.8x 6.0x 6.0x (Net Debt + Pref.) / Enterprise Value (4) 41.0% 37.4% 41.0% 37.2% 31.4% Distribution Yield 6.8% 5.8% 2.9% 5.6% 4.3% 2015E AFFO Multiple (6) 12.9x 14.9x 15.6x 13.7x 19.1x Price (as of 3/31/2015 ) $10.50 $12.22 $28.07 $68.00 $51.60 ___________________________ Sources: Company management, company presentations, FactSet and SNL Financial as of 3/31/2015. Note: GNL portfolio information is shown as of 12/31/2014 pro forma for acquisitions completed / under contract subsequent to ye ar end as of 3/31/2015. 1. GNL financial information is based on 12/31/2014 pro forma for the following: $120 million new mortgage debt financing in Eur ope at a weighted average interest rate of 2.6%, $125 million tender at $10.50 per share, adjusted G&A to reflect GNL’s transition to a publicly listed company and $200 million of future acquisitions at a 7.25% cash ca p rate funded with 100% debt at a weighted average interest rate of 2.75%. 2. Peers include CSG, GPT, LXP, NNN, O, SIR, SRC, STOR and WPC. 3. WPC’s international exposure includes less than 5% of annualized base rent derived from other non - European markets (Australia, C anada, Mexico, Thailand, Malaysia and Japan). 4. Enterprise value = equity value + net debt + preferred equity. 5. GNL’s run rate EBITDA represents the EBITDA from the existing portfolio including the impact of straight line rent and mark - to - m arket rent adjustments, the contractual rent increases and in - place currency hedges adjusted to reflect the full year impact of the following pro forma adjustments: adjusted G&A to reflect GNL’s transition to a p ublicly listed company and $200 million of future acquisitions at a 7.25% cash cap rate. EBITDA is a non - GAAP performance metric. See the discussion under the caption “Definitions” in this investor presentation for ma nagements’ discussion regarding non - GAAP metrics. 6. Estimated 2015 AFFO is a non - GAAP performance metric. See the discussion under the caption “Definitions” in this investor presen tation for managements’ discussion regarding non - GAAP metrics. See page 11 for detailed assumptions related to the run rate AFFO. Comparable companies’ AFFO based on consensus estimates. Comparing GNL to Similar Listed Companies # Executive Summary Portfolio Overview Investment Strategy Management Team Financial Overview Conclusion 14
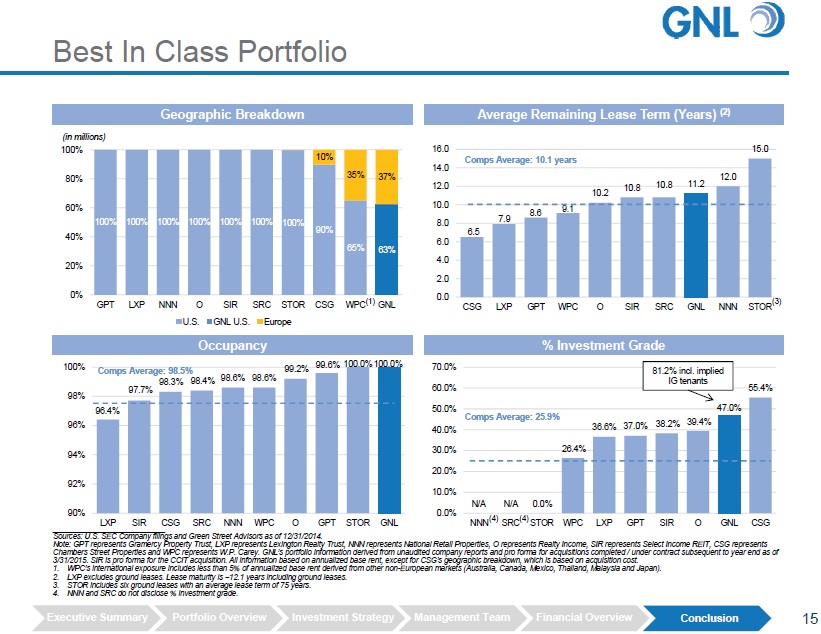
96.4% 97.7% 98.3% 98.4% 98.6% 98.6% 99.2% 99.6% 100.0% 100.0% 90% 92% 94% 96% 98% 100% LXP SIR CSG SRC NNN WPC O GPT STOR GNL Best In Class Portfolio Geographic Breakdown Occupancy Average Remaining Lease Term (Years) (2) ___________________________ Sources: U.S. SEC Company filings and Green Street Advisors as of 12/31/2014. Note: GPT represents Gramercy Property Trust, LXP represents Lexington Realty Trust, NNN represents National Retail Propertie s, O represents Realty Income, SIR represents Select Income REIT, CSG represents Chambers Street Properties and WPC represents W.P. Carey. GNL’s portfolio information derived from unaudited company reports and pro forma for acquisitions completed / under contract subsequent to year end as of 3/31/2015. SIR is pro forma for the CCIT acquisition. All information based on annualized base rent, except for CSG’s geograp hic breakdown, which is based on acquisition cost. 1. WPC’s international exposure includes less than 5% of annualized base rent derived from other non - European markets (Australia, C anada, Mexico, Thailand, Malaysia and Japan). 2. LXP excludes ground leases. Lease maturity is ~12.1 years including ground leases. 3. STOR includes six ground leases with an average lease term of 75 years. 4. NNN and SRC do not disclose % investment grade. % Investment Grade 6.5 7.9 8.6 9.1 10.2 10.8 10.8 11.2 12.0 15.0 0.0 2.0 4.0 6.0 8.0 10.0 12.0 14.0 16.0 CSG LXP GPT WPC O SIR SRC GNL NNN STOR N/A N/A 0.0% 26.4% 36.6% 37.0% 38.2% 39.4% 47.0% 55.4% 0.0% 10.0% 20.0% 30.0% 40.0% 50.0% 60.0% 70.0% NNN SRC STOR WPC LXP GPT SIR O GNL CSG Comps Average: 10.1 years Comps Average: 98.5% Comps Average: 25.9% 81.2% incl. implied IG tenants 15 (4) (4) 100% 100% 100% 100% 100% 100% 100% 90% 65% 63% 10% 35% 37% 0% 20% 40% 60% 80% 100% GPT LXP NNN O SIR SRC STOR CSG WPC GNL (in millions) U.S. GNL U.S. Europe (3) (1) Executive Summary Portfolio Overview Investment Strategy Management Team Financial Overview Conclusion

Assembled highest - quality net lease property portfolio Originated all assets in portfolio Established local presence and expertise in our markets Designed cost - effective management structure Created in - place hedges to mitigate currency risk Pursuing pragmatic, steady growth Conclusion RWE – North Rhine, Germany Western Digital - San Jose, CA GSA - International Falls, MN Provident Financial - Bradford, UK 16 Executive Summary Portfolio Overview Investment Strategy Management Team Financial Overview Conclusion

Legal Notices
Forward Looking Statements Certain statements made in this presentation are forward - looking statements . These forward - looking statements include statements regarding our intent, belief or current expectations and are based on various assumptions . These statements involve substantial risks and uncertainties . Actual results or events could differ materially from the plans, intentions and expectations disclosed in the forward - looking statements that we make . Forward - looking statements may include, but are not limited to, statements regarding stockholder liquidity and investment value and returns . The words "anticipates," "believes," "expects," "estimates," "projects," "plans," "intends," "may," "will," "would" and similar expressions are intended to identify forward - looking statements, although not all forward - looking statements contain these identifying words . Actual results may differ materially from those contemplated by the forward - looking statement . Further, forward - looking statements speak only as of the date they are made, and we undertake no obligation to update or reverse any forward - looking statement to reflect changed assumptions, the occurrence of unanticipated events on changes to future operating results, unless required to do so by law . Factors that might cause such differences include, but are not limited to : our ability to complete the listing of our shares of common stock on the New York Stock Exchange (“NYSE”) ; our ability to complete the tender offer ; the price at which our shares of common stock may trade on the NYSE, which may be higher or lower than the purchase price in the tender offer ; the number of shares acquired in the tender offer ; the cost of any indebtedness incurred to fund this offer ; the impact of current and future regulation ; the effects of competition ; the ability of our advisor to attract, develop and retain executives and other qualified employees ; changes in general economic or market conditions ; and other factors, many of which are beyond our control . 17
Risk Factors Our executive officers, our Advisor and its affiliates face conflicts of interest, including significant conflicts created by our Advisor's compensation arrangements with us and other investment programs advised by American Realty Capital affiliates and conflicts in allocating tim e among these investment programs and us. No public market currently exists, or may exist, for shares of our common stock and our shares are, and may continue to be, illi qui d. We may be unable to pay or maintain cash distributions or increase distributions over time. We depend on tenants for our rental revenue and, accordingly, our rental revenue is dependent upon the success and economic viab ili ty of our tenants. Increases in interest rates could increase the amount of our debt payments and limit our ability to pay distributions to our stockholde rs. Distributions may reduce the amount of capital we ultimately invest in properties We are subject to risks associated with our international investments, including risks associated with compliance with and chang es in foreign laws, fluctuations in foreign currency exchange rates and inflation. We are subject to risks associated with any dislocations or liquidity disruptions that may exist or occur in the credit markets of the United States of America and Europe from time to time. We may fail to continue to qualify, to be treated as a real estate investment trust ("REIT") for U.S. federal income tax purposes, which would result in higher taxes, may adversely affect operations and would reduce our NAV and cash available for distributions. We may be exposed to risks due to a lack of tenant diversity, investment types and geographic diversity. We may be exposed to changes in general economic, business and political conditions, including the possibility of intensified in ter national hostilities, acts of terrorism, and changes in conditions of United States or international lending, capital and financing markets. Risks associated with our international investments, including risks associated with compliance with and changes in foreign laws, f luc tuations in foreign currency exchange rates and inflation . The October 29, 2014 and March 2, 2015 disclosures made by American Realty Capital Properties, Inc. (“ARCP”), an entity previously sponsored by AR Capital (“AR Capital”), the parent of our sponsor, relating to errors and omissions in ARCP’s first - and second - quarter 2014 fin ancial statements, as well as additional errors and omissions relating to ARCP’s prior financial reporting periods disclosed by ARCP as a result of ARCP ’s audit committee’s investigation and amended - and re - stated financial statements, may adversely affect our ability to raise substantial funds. For additional information regarding ARCP’s public disclosures regarding such errors and omissions, please refer to ARCP’s public filings available at t he internet site maintained by the SEC, www.sec.gov. An indirect subsidiary of AR Capital previously provided advisory services to ARCP until ARCP’s int ern alization of management in the first quarter of 2014. ARCP’s former chief financial officer is one of the non - controlling owners of AR Capi tal, but does not have a role in managing AR Capital, our business or our sponsor’s business. In December 2014, ARCP announced the resignation of its exe cutive chairman, Nicholas S. Schorsch, who was also the executive chairman of our board of directors until his resignation on December 29, 201 4. Nicholas S. Schorsch also is one of the controlling members of AR Capital. In its public filings, ARCP has disclosed that the SEC has commenced a fo rmal investigation of ARCP, that the United States Attorney’s Office for the Southern District of New York contacted counsel for both ARCP’s audit com mittee and ARCP with respect to the matter and that the Secretary of the Commonwealth of Massachusetts has issued a subpoena for various documents . O n March 30, 2015, ARCP filed its form 10 - K for the year ended December 31, 2014. There can be no assurance that any pending or potential investiga tions or litigation related to ARCP will not adversely affect GNL, its sponsor, its advisor, or AR Capital or any individuals who directly or ind ire ctly control GNL, its sponsor, its advisor, or AR Capital. The following are some of the risks and uncertainties, although not all risks and uncertainties, that could cause our actual res ults to differ materially from those presented in our forward - looking statements: 18
Projections This presentation includes estimated projections of future operating results . These projections were not prepared in accordance with published guidelines of the SEC or the guidelines established by the American Institute of Certified Public Accountants for preparation and presentation of financial projections . This information is not fact and should not be relied upon as being necessarily indicative of future results ; the projections were prepared in good faith by management and are based on numerous assumptions that may prove to be wrong . Important factors that may affect actual results and cause the projections to not be achieved include, but are not limited to, risks and uncertainties relating to the company and other factors described under “Risk Factors” section of the Company’s Annual Report on Form 10 - K dated April 3 , 2015 and any subsequent Quarterly Reports on Form 10 - Q or Current Reports on Form 8 - K and “Forward - Looking Statements . ” The projections also reflect assumptions as to certain business decisions that are subject to change . As a result, actual results may differ materially from those contained in the estimates . Accordingly, there can be no assurance that the estimates will be realized . This presentation also contains estimates and information concerning our industry, including market position, market size, and growth rates of the markets in which we participate, that are based on industry publications and reports . This information involves a number of assumptions and limitations, and you are cautioned not to give undue weight to these estimates . We have not independently verified the accuracy or completeness of the data contained in these industry publications and reports . The industry in which we operate is subject to a high degree of uncertainty and risk due to variety of factors, including those described in the “Risk Factors” section of the Company’s Annual Report on Form 10 - K dated April 3 , 2015 and any subsequent Quarterly Reports on Form 10 - Q or Current Reports on Form 8 - K . These and other factors could cause results to differ materially from those expressed in these publications and reports . 19

Important Notice This investor presentation is for informational purposes only and is not an offer to buy or the solicitation of an offer to sell any securities of the Company . The tender offer will be made only pursuant to an offer to purchase, letter of transmittal and related materials the Company intends to distribute to its stockholders and file with the SEC. The full details of the tender offer , including complete instructions on how to tender shares, will be included in the offer to purchase , the letter of transmittal and related materials, which will become available to stockholders promptly following commencement of the tender offer . Stockholders should read carefully the offer to purchase, the letter of transmittal and other related materials when they are available because they will contain important information. Stockholders may obtain free copies, when available, of the offer to purchase and other related materials that will be filed by the Company by visiting EDGAR on the SEC website at www.sec.gov. Stockholders also may obtain a copy of these documents, free of charge, from the Company the materials become available. 20
Definitions 21 Funds from operations (“FFO”) We define funds from operations (“FFO”) , a measure not determined pursuant to accounting principles generally accepted in the United States (“GAAP ”), consistent with the standards established by the White Paper on FFO approved by the Board of Governors of NAREIT (“NAREIT”) , as revised in February 2004 (the “White Paper”) . The White Paper defines FFO as net income or loss computed in accordance with GAAP, excluding gains or losses from sales of property and asset impairment writedowns, plus depreciation and amortization, and after adjustments for unconsolidated partnerships and joint ventures . Adjustments for unconsolidated partnerships and joint ventures are calculated to reflect FFO . Our FFO calculation complies with NAREIT's policy described above . We believe that, since real estate values historically rise and fall with market conditions, including inflation, interest rates, the business cycle, unemployment and consumer spending, presentations of operating results for a REIT using historical accounting for depreciation may be less informative . Additionally, we believe it is appropriate to disregard impairment charges, as this is a fair value adjustment that is largely based on market fluctuations and assessments regarding general market conditions which can change over time . An asset will only be evaluated for impairment if certain impairment indicators exist and if the carrying, or book value, exceeds the total estimated undiscounted future cash flows (including net rental and lease revenues, net proceeds on the sale of the property, and any other ancillary cash flows at a property or group level under GAAP) from such asset . Our computation of FFO may not be comparable to FFO reported by other REITs or real estate companies that do not define the term in accordance with the current NAREIT definition or that interpret the current NAREIT definition differently . Historical accounting for real estate involves the use of GAAP . Any other method of accounting for real estate such as the fair value method cannot be construed to be any more accurate or relevant than the comparable methodologies of real estate valuation found in GAAP . Nevertheless, we believe that the use of FFO, which excludes the impact of real estate related depreciation and amortization and impairments, provides a more complete understanding of our performance to investors and to management, and when compared year over year, reflects the impact on our operations from trends in occupancy rates, rental rates, operating costs, general and administrative expenses, and interest costs, which may not be immediately apparent from net income . However, FFO and modified funds from operations ("MFFO"), as described below, should not be construed to be more relevant or accurate than the current GAAP methodology in calculating net income or in its applicability in evaluating our operating performance . The method utilized to evaluate the value and performance of real estate under GAAP should be construed as a more relevant measure of operational performance and considered more prominently than the non - GAAP FFO and MFFO measures and the adjustments to GAAP in calculating FFO and MFFO .
Definitions (cont’d) 22 Adjusted funds from operations (“AFFO”) We define adjusted funds from operations (“AFFO”), a non - GAAP financial measure, as FFO further adjusted for maintenance capital expenditures ; and the following items, as applicable, included in the determination of GAAP net income : acquisition fees and expenses ; amounts relating to deferred rent receivables and amortization of above and below market leases and liabilities ; accretion of discounts and amortization of premiums on debt investments ; mark - to - market adjustments included in net income ; and gains or losses included in net income from the extinguishment or sale of debt, hedges, foreign exchange, derivatives or securities holdings where trading of such holdings is not a fundamental attribute of the business plan . We believe that our use of AFFO and the adjustments used to calculate it allow us to present our performance in a manner that reflects certain characteristics that are unique to REITs . By excluding expensed acquisition costs and fair value adjustments, the use of AFFO provides information consistent with management's analysis of the underlying operating performance of the investment portfolio . Although our AFFO may not be comparable to that of other REITs and real estate companies, we believe it provides a useful indicator of our ability to fund cash needs and to make cash distributions to stockholders . In addition, we believe that to further understand our liquidity, AFFO should be compared with our cash flows determined in accordance with GAAP, as presented in our consolidated financial statements . AFFO does not represent cash generated from operating activities determined in accordance with GAAP, and AFFO should not be considered as an alternative to net income (determined in accordance with GAAP) as an indication of our performance, as an alternative to net cash flows from operating activities (determined in accordance with GAAP), or as a measure of our liquidity .

Definitions (cont’d) 23 Net operating income (“NOI”) We define net operating income (“NOI”), a non - GAAP financial measure, as net income attributable to stockholders, the most directly comparable GAAP financial measure, minus discontinued operations, plus corporate general and administrative expense, acquisition and transaction costs, depreciation and amortization and interest expense, income from unconsolidated joint ventures, interest and other income and gains from investments in securities . NOI is adjusted to include our pro - rata share of NOI from unconsolidated joint ventures . We use NOI internally as a performance measure and believe NOI provides useful information to investors regarding our financial condition and results of operations because it reflects only those income and expense items that are incurred at the property level . Therefore, we believe NOI is a useful measure for evaluating the operating performance of our real estate assets and to make decisions about resource allocations . Further, we believe NOI is useful to investors as a performance measure because, when compared across periods, NOI reflects the impact on operations from trends in occupancy rates, rental rates, operating costs acquisition activity on an unleveraged basis, providing perspective not immediately apparent from net income . NOI excludes certain components from net income in order to provide results that are more closely related to a property's results of operations . For example, interest expense is not necessarily linked to the operating performance of a real estate asset and is often incurred at the corporate level as opposed to the property level . In addition, depreciation and amortization, because of historical cost accounting and useful life estimates, may distort operating performance at the property level . NOI presented by us may not be comparable to NOI reported by other REITs that define NOI differently . We believe that in order to facilitate a clear understanding of our operating results, NOI should be examined in conjunction with net income as presented in our consolidated financial statements . NOI should not be considered as an alternative to net income as an indication of our performance or to cash flows as a measure of our liquidity or ability to make distributions .

Definitions (cont’d) 24 Earnings before interest, taxes, depreciation and amortization (EBITDA) We define EBITDA, a non - GAAP financial measure, as net income in accordance with GAAP before interest, taxes, depreciation and amortization . We believe EBITDA is an appropriate measure of our ability to incur and service debt . EBITDA should not be considered as an alternative to cash flows from operating activities, as a measure of our liquidity or as an alternative to net income as an indicator of our operating activities . Other REITs may calculate EBITDA differently and our calculation should not be compared to that of other REITs . EBITDA is adjusted to include our pro - rata share of EBITDA from unconsolidated joint ventures . We use EBITDA as an integral part of our report and planning processes and as one of the primary measures to, among other things : • Monitor and evaluate the performance of our business operations ; • Facilitate management’s internal comparisons of the historical operating performance of our business operations ; • Facilitate management’s external comparisons of the results of our overall business to the historical operating performance of other companies that may have different capital structures and debt levels ; • Analyze and evaluate financial and strategic planning decisions regarding future operating investments ; • Provide useful information to investors regarding financial and business trends related to our results of operations ; and • Plan for and prepare future annual operating budgets and determine appropriate levels of operating investments . The non - GAAP measures (including FFO, AFFO, NOI, Cash NOI, and EBITDA), have limitations as analytical tools, and you should not consider any of these measures in isolation or as a substitute for analyses of our income or cash flows as reported under GAAP . Some of these limitations are : • They do not reflect our cash expenditures, or future requirements for capital expenditures, or contractual commitments ; • They do not reflect changes in, or cash requirements for, our working capital needs ; • They do not reflect the interest expense, or the cash requirements necessary to service interest or principal payments, on our debt ; and depreciation and amortization are non - cash expense items that are reflected in our statements of cash flows .

Appendices

The Company
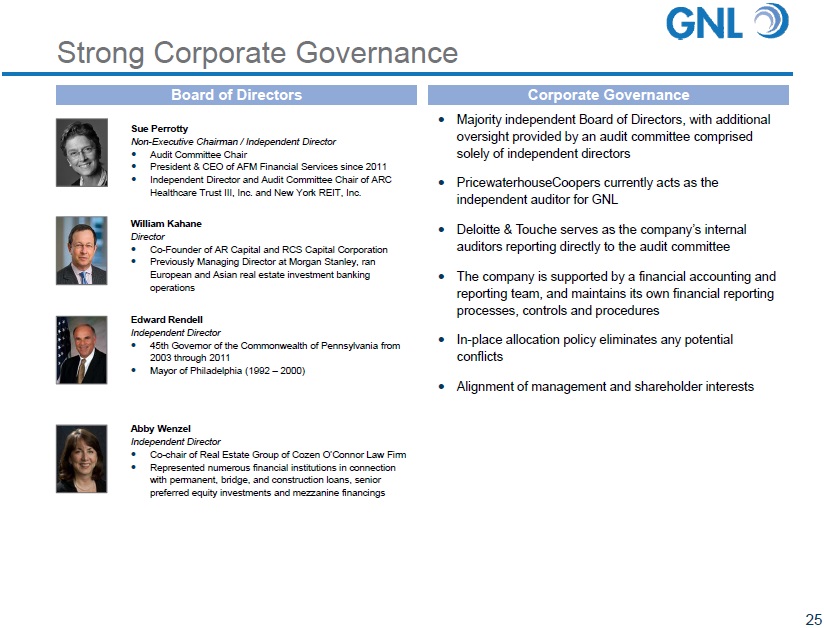
Majority independent Board of Directors , with additional oversight provided by an audit committee comprised solely of independent directors PricewaterhouseCoopers currently acts as the independent auditor for GNL Deloitte & Touche serves as the company’s internal auditors reporting directly to the audit committee The company is supported by a financial accounting and reporting team, and maintains its own financial reporting processes, controls and procedures In - place allocation policy eliminates any potential conflicts Alignment of management and shareholder interests Strong Corporate Governance 25 Board of Directors William Kahane Director Co - Founder of AR Capital and RCS Capital Corporation Previously Managing Director at Morgan Stanley, ran European and Asian real estate investment banking operations Edward Rendell Independent Director 45th Governor of the Commonwealth of Pennsylvania from 2003 through 2011 Mayor of Philadelphia (1992 – 2000) Abby Wenzel Independent Director Co - chair of Real Estate Group of Cozen O’Connor Law Firm Represented numerous financial institutions in connection with permanent, bridge, and construction loans, senior preferred equity investments and mezzanine financings Sue Perrotty Non - Executive Chairman / Independent Director Audit Committee Chair President & CEO of AFM Financial Services since 2011 Independent Director and Audit Committee Chair of ARC Healthcare Trust III, Inc. and New York REIT, Inc. Corporate Governance

Shameel Kahn CEO Gary Wilder Executive Chairman Jagdeep Kapoor CIO Moor Park Investment Committee Germany United Kingdom Nordics Benelux France Michael Glaser Karan Daswani Illias Harcha Javier paz Valibuena Carolin Durr Lars Von der Berg Greg Smith Veronia Baldi Diego Voss Mike Pille Jamal Dutheil Rafik Soussi Brian Mansouri Vice President Drew Yates Analyst Audrey Ellis Vice President Lucas O’Conner Analyst U.S. Team GNL Board of Directors Synergistic Value: Advisory Services Group Operations Investor Relations Accounting Legal Due Diligence IT Marketing Human Resources Financing Asset Management William Kahane Director Edward Rendell Independent Sue Perrotty Exec. Chairman GNL Management Team / Investment Committee Scott Bowman CEO Andrew Winer President & CIO Patrick Goulding CFO Broad, Multi - Disciplinary Acquisition Footprint Abby Wenzel Independent 26
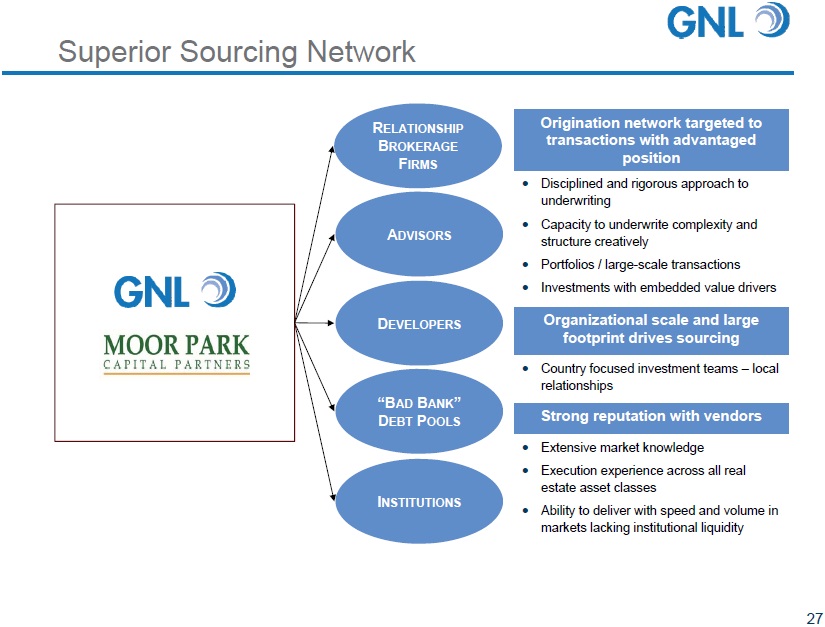
I NSTITUTIONS A DVISORS D EVELOPERS R ELATIONSHIP B ROKERAGE F IRMS “B AD B ANK ” D EBT P OOLS Origination network targeted to transactions with advantaged position Disciplined and rigorous approach to underwriting Capacity to underwrite complexity and structure creatively Portfolios / large - scale transactions Investments with embedded value drivers Organizational scale and large footprint drives sourcing Country focused investment teams – local relationships Strong reputation with vendors Extensive market knowledge Execution experience across all real estate asset classes Ability to deliver with speed and volume in markets lacking institutional liquidity Superior Sourcing Network 27
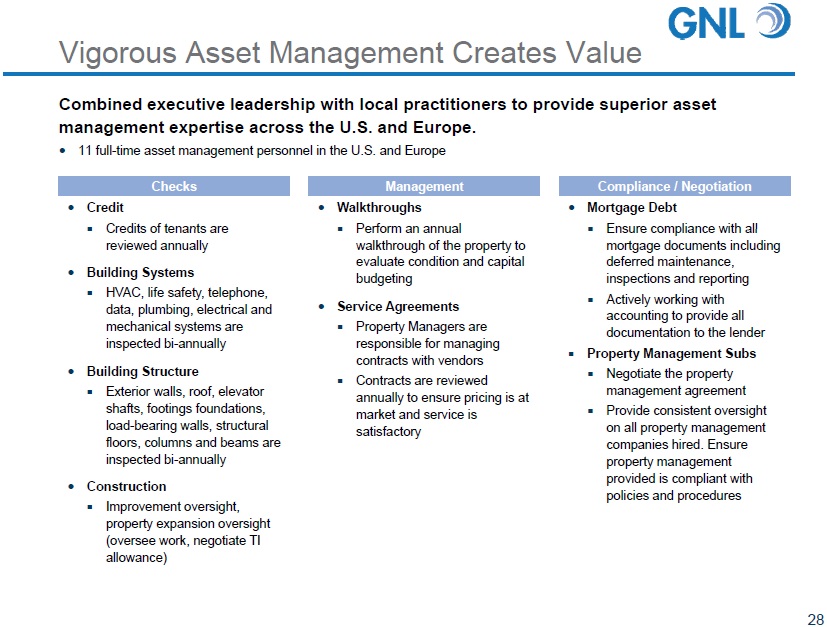
Vigorous Asset Management Creates Value 11 full - time asset management personnel in the U.S. and Europe Combined executive leadership with local practitioners to provide superior asset management expertise across the U.S. and Europe. 28 Checks Compliance / Negotiation Management Credit Credits of tenants are reviewed annually Building Systems HVAC, life safety, telephone, data, plumbing, electrical and mechanical systems are inspected bi - annually Building Structure Exterior walls, roof, elevator shafts, footings foundations, load - bearing walls, structural floors, columns and beams are inspected bi - annually Construction Improvement oversight, property expansion oversight (oversee work, negotiate TI allowance) Walkthroughs Perform an annual walkthrough of the property to evaluate condition and capital budgeting Service Agreements Property Managers are responsible for managing contracts with vendors Contracts are reviewed annually to ensure pricing is at market and service is satisfactory Mortgage Debt Ensure compliance with all mortgage documents including deferred maintenance, inspections and reporting Actively working with accounting to provide all documentation to the lender Property Management Subs Negotiate the property management agreement Provide consistent oversight on all property management companies hired. Ensure property management provided is compliant with policies and procedures

Frequently Asked Questions
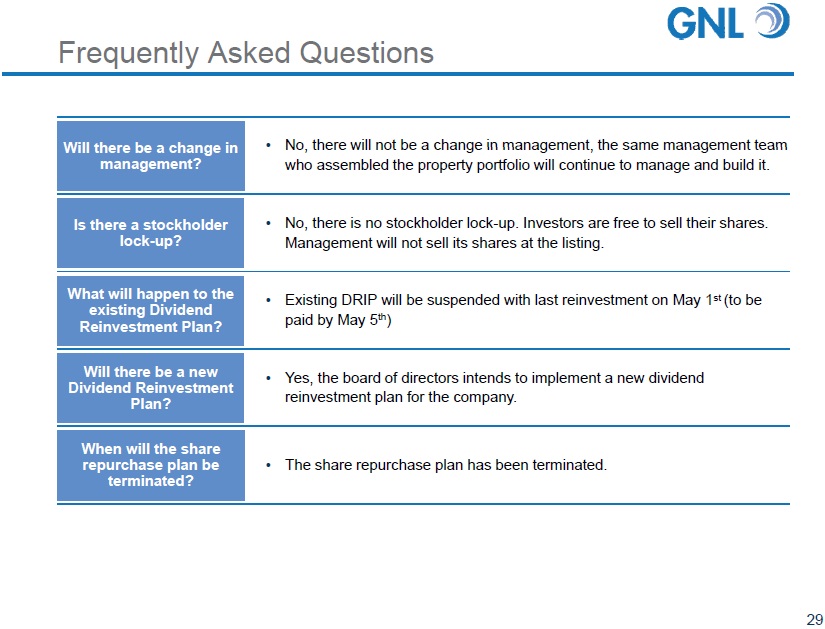
• No, there will not be a change in management, the same management team who assembled the property portfolio will continue to manage and build it. • No, there is no stockholder lock - up. Investors are free to sell their shares. Management will not sell its shares at the listing. • Existing DRIP will be suspended with last reinvestment on May 1 st (to be paid by May 5 th ) • Yes, the board of directors intends to implement a new dividend reinvestment plan for the company. • The share repurchase plan has been terminated. Is there a stockholder lock - up? What will happen to the existing Dividend Reinvestment Plan? Will there be a new Dividend Reinvestment Plan? When will the share repurchase plan be terminated? Will there be a change in management? Frequently Asked Questions 29
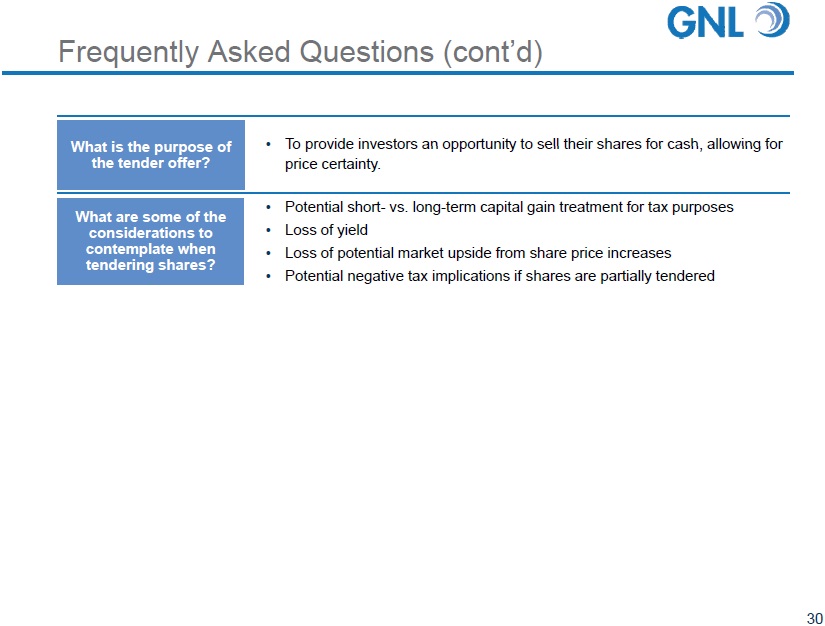
• To provide investors an opportunity to sell their shares for cash, allowing for price certainty. • Potential short - vs. long - term capital gain treatment for tax purposes • Loss of yield • Loss of potential market upside from share price increases • Potential negative tax implications if shares are partially tendered What are some of the considerations to contemplate when tendering shares? What is the purpose of the tender offer? Frequently Asked Questions (cont’d) 30

Tender Offer
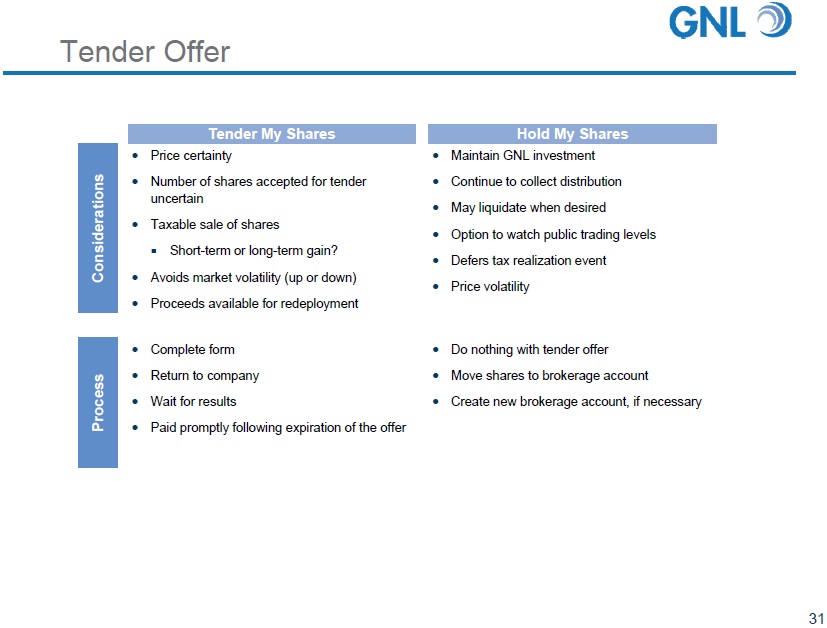
Tender Offer Considerations Process Maintain GNL investment Continue to collect distribution May liquidate when desired Option to watch public trading levels Defers tax realization event Price volatility Hold My Shares Price certainty Number of shares accepted for tender uncertain Taxable sale of shares Short - term or long - term gain? Avoids market volatility ( up or down) Proceeds available for redeployment Tender My Shares Do nothing with tender offer Move shares to brokerage account Create new brokerage account, if necessary Complete form Return to company Wait for results Paid promptly following expiration of the offer 31