Attached files
| file | filename |
|---|---|
| EX-4.3 - EX-4.3 - Milacron Holdings Corp. | d896698dex43.htm |
| EX-4.2 - EX-4.2 - Milacron Holdings Corp. | d896698dex42.htm |
| EX-23.1 - EX-23.1 - Milacron Holdings Corp. | d896698dex231.htm |
| EX-10.5 - EX-10.5 - Milacron Holdings Corp. | d896698dex105.htm |
| EX-21.1 - EX-21.1 - Milacron Holdings Corp. | d896698dex211.htm |
Table of Contents
As filed with the Securities and Exchange Commission on April 3, 2015
Registration No. 333-
UNITED STATES
SECURITIES AND EXCHANGE COMMISSION
Washington, D.C. 20549
FORM S-1
REGISTRATION STATEMENT UNDER THE SECURITIES ACT OF 1933
Milacron Holdings Corp.
(Exact name of registrant as specified in its charter)
| Delaware | 3559 | 80-0798640 | ||
| (State or Other Jurisdiction of Incorporation or Organization) |
(Primary Standard Industrial Classification Code Number) |
(I.R.S. Employer Identification Number) |
3010 Disney Street
Cincinnati, OH 45209
(513) 487-5000 (Phone)
(Address, Including Zip Code, and Telephone Number, Including Area Code, of Registrant’s Principal Executive Offices)
Hugh C. O’Donnell
Vice President, General Counsel and Secretary
3010 Disney Street
Cincinnati, OH 45209
(513) 487-5000 (Phone)
(513) 487-5086 (Fax)
(Name, Address, Including Zip Code, and Telephone Number, Including Area Code, of Agent For Service)
Copies to:
| Alexander D. Lynch, Esq. Heather L. Emmel, Esq. (212) 310-8007 (Fax) |
Marc D. Jaffe, Esq. Ian D. Schuman, Esq. Latham & Watkins LLP 885 Third Avenue New York, New York 10022 (212) 906-1200 (Phone) (212) 751-4864 (Fax) |
Approximate date of commencement of proposed sale to the public: As soon as practicable after the effective date of this Registration Statement.
If any of the securities being registered on this Form are to be offered on a delayed or continuous basis pursuant to Rule 415 under the Securities Act of 1933, check the following box. ¨
If this Form is filed to register additional securities for an offering pursuant to Rule 462(b) under the Securities Act, please check the following box and list the Securities Act registration statement number of the earlier effective registration statement for the same offering. ¨
If this Form is a post-effective amendment filed pursuant to Rule 462(c) under the Securities Act, check the following box and list the Securities Act registration statement number of the earlier effective registration statement for the same offering. ¨
If this Form is a post-effective amendment filed pursuant to Rule 462(d) under the Securities Act, check the following box and list the Securities Act registration statement number of the earlier effective registration statement for the same offering. ¨
Indicate by check mark whether the registrant is a large accelerated filer, an accelerated filer, a non-accelerated filer or a smaller reporting company. See the definitions of “large accelerated filer,” “accelerated filer” and “smaller reporting company” in Rule 12b-2 of the Exchange Act.
| Large accelerated filer ¨ | Accelerated filer ¨ | Non-accelerated filer x | Smaller reporting company ¨ |
CALCULATION OF REGISTRATION FEE
|
| ||||
| Title of Each Class of Securities to be Registered |
Proposed Maximum Aggregate Offering Price(1)(2) |
Amount of Registration Fee | ||
| Common Stock, $0.01 par value per share |
$100,000,000 | $11,620 | ||
|
| ||||
|
| ||||
| (1) | Estimated solely for the purpose of calculating the registration fee in accordance with Rule 457(o) promulgated under the Securities Act. |
| (2) | Includes shares of common stock that may be issuable upon exercise of an option to purchase additional shares granted to the underwriters. |
The Registrant hereby amends this Registration Statement on such date or dates as may be necessary to delay its effective date until the Registrant shall file a further amendment which specifically states that this Registration Statement shall thereafter become effective in accordance with Section 8(a) of the Securities Act or until the Registration Statement shall become effective on such date as the Commission, acting pursuant to said Section 8(a), may determine.
Table of Contents
The information in this preliminary prospectus is not complete and may be changed. We may not sell these securities until the registration statement filed with the Securities and Exchange Commission is effective. This preliminary prospectus is not an offer to sell these securities and it is not soliciting an offer to buy these securities in any state where the offer or sale is not permitted.
Subject to Completion
Preliminary Prospectus dated April 3, 2015
PROSPECTUS
Shares

Milacron Holdings Corp.
Common Stock
This is the initial public offering of our common stock. We are selling shares of our common stock.
We expect the public offering price to be between $ and $ per share. Currently, no public market exists for the shares. After pricing the offering, we expect that the shares will trade on the New York Stock Exchange (the “NYSE”) or Nasdaq Global Market (“Nasdaq”) under the symbol “MCRN.”
Investing in the common stock involves risks that are described in the “Risk Factors ” section beginning on page 18 of this prospectus.
| Per Share |
Total |
|||||||
| Public offering price |
$ | $ | ||||||
| Underwriting discount(1) |
$ | $ | ||||||
| Proceeds, before expenses, to us |
$ | $ | ||||||
| (1) | We refer you to “Underwriting” beginning on page 146 of this prospectus for additional information regarding underwriting compensation |
The underwriters may also exercise their option to purchase up to an additional shares from us, at the public offering price, less the underwriting discount, for 30 days after the date of this prospectus.
Neither the Securities and Exchange Commission nor any state securities commission has approved or disapproved of these securities or determined if this prospectus is truthful or complete. Any representation to the contrary is a criminal offense.
The underwriters expect to deliver the shares against payment in New York, New York on or about , 2015.
| BofA Merrill Lynch | Barclays | J.P. Morgan | ||
| Baird | Credit Suisse | Goldman, Sachs & Co. | ||
The date of this prospectus is , 2015.
Table of Contents
| Page |
||||
| 1 | ||||
| 18 | ||||
| 39 | ||||
| 41 | ||||
| 42 | ||||
| 43 | ||||
| 45 | ||||
| 47 | ||||
| 49 | ||||
| 54 | ||||
| Management’s Discussion and Analysis of Financial Condition and Results of Operations |
56 | |||
| 81 | ||||
| 99 | ||||
| 103 | ||||
| 110 | ||||
| 126 | ||||
| 128 | ||||
| 130 | ||||
| 137 | ||||
| 141 | ||||
| Material U.S. Federal Income Tax Considerations for Non-U.S. Holders |
143 | |||
| 146 | ||||
| 154 | ||||
| 154 | ||||
| 154 | ||||
| F-1 | ||||
You should rely only on the information contained in this prospectus or in any free-writing prospectus we may authorize to be delivered or made available to you. Neither we, nor the underwriters (or any of our or their respective affiliates) have authorized anyone to provide any information other than that contained in this prospectus or in any free writing prospectus prepared by or on behalf of us or to which we have referred you. Neither we, nor the underwriters (or any of our or their respective affiliates) take any responsibility for, and can provide no assurance as to the reliability of, any other information that others may give you. We and the underwriters (or any of our or their respective affiliates) are not making an offer to sell these securities in any jurisdiction where the offer or sale is not permitted. The information contained in this prospectus is only accurate as of the date on the front cover of this prospectus. Our business, financial condition, results of operations and prospectus may have changed since that date.
Trademarks and Trade Names
We own or have rights to trademarks or trade names that we use in conjunction with the operation of our business. In addition, our name, logo and website name and address are our service marks or trademarks. Some of the more important trade names and trademarks that we use include Cimcool, DME, Ferromatik Milacron, Milacron, Uniloy, TIRAD, Mold-Masters, M-PET, Kortec and E-Multi. Solely for convenience, we refer to trademarks, service marks and trade names in this prospectus without the ™, SM and ® symbols. Such references are not intended to indicate, in any way, that we will not assert, to the fullest extent permitted by law, our rights to our trademarks, service marks and trade names. Other trademarks, trade names or service marks appearing in this prospectus are the property of their respective owners.
i
Table of Contents
Market and Industry Information
Market data used throughout this prospectus is based on management’s knowledge of the industry and the good faith estimates of management. We also relied, to the extent available, upon management’s review of independent industry surveys and publications and other publicly available information prepared by a number of sources, including the Freedonia Group, Inc. (“Freedonia”), Global Industry Analysts, Inc., a market research report publisher, Interconnection Consulting, Society of Indian Automobile Manufacturers and the U.S. Department of Commerce Bureau of Economic Analysis. We also purchased a hot runner market analysis report prepared by Interconnection Consulting in relation to the economic environment and regional landscape pertaining to that market. All Interconnection Consulting market share data presented in this prospectus is for the year ended December 31, 2013, as no additional study has been completed since that date. All of the market data used in this prospectus involves a number of assumptions and limitations, and you are cautioned not to give undue weight to such estimates. While we believe the estimated market position, market opportunity and market size information included in this prospectus is generally reliable, such information, which in part is derived from management’s estimates and beliefs, is inherently uncertain and imprecise. Projections, assumptions and estimates of our future performance and the future performance of the industry in which we operate are necessarily subject to a high degree of uncertainty and risk due to a variety of factors, including those described in “Risk Factors,” “Cautionary Note Regarding Forward-Looking Statements” and elsewhere in this prospectus. These and other factors could cause results to differ materially from those expressed in the estimates prepared by independent parties and by us.
ii
Table of Contents
This summary highlights information contained elsewhere in this prospectus and does not contain all of the information that you should consider before investing in our common stock. You should read this entire prospectus, including the sections entitled “Risk Factors” and “Management’s Discussion and Analysis of Financial Condition and Results of Operations” and our consolidated financial statements and related notes thereto before making an investment decision. Unless otherwise stated in this prospectus, references to “we,” “our,” “us,” “Milacron” and the “Company” and similar terms refer to Milacron Holdings Corp. and its consolidated subsidiaries; references to “Milacron Holdings” refer to Milacron Holdings Corp.; references to “Milacron Intermediate Holdings” refer to Milacron Intermediate Holdings Inc., our wholly owned subsidiary; and references to “Milacron LLC” refer to Milacron LLC, our indirect wholly owned subsidiary.
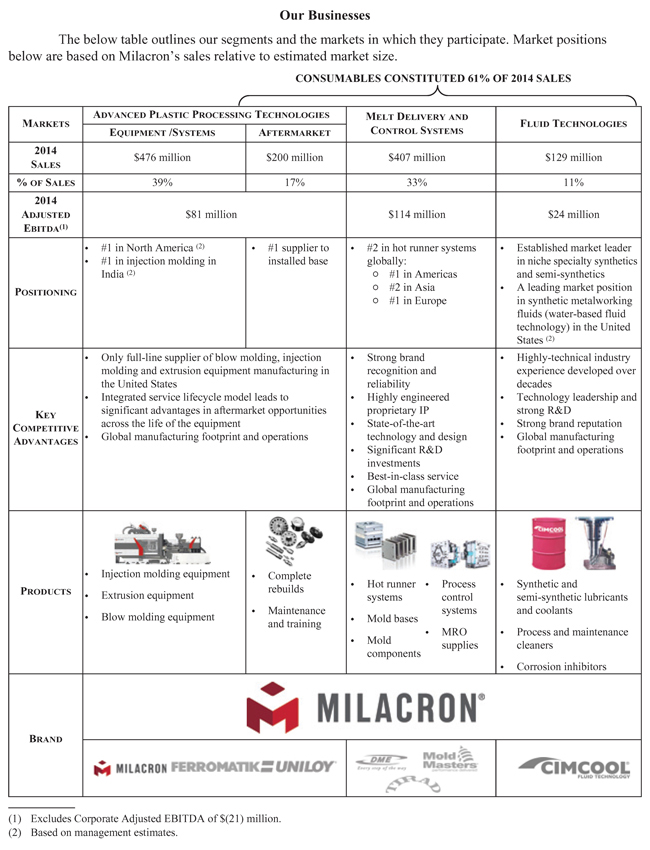
Company Overview
We are a global leader in the manufacture, distribution and service of highly engineered and customized systems within the $27 billion plastic technology and processing industry. We are the only global company with a full-line product portfolio that includes hot runner systems, injection molding, blow molding and extrusion equipment. We maintain strong market positions across these products as well as leading positions in process control systems, mold bases and components, maintenance, repair and operating (“MRO”) supplies for plastic processing equipment and fluid technology. Our strategy is to deliver highly customized equipment, components and service to our customers throughout the lifecycle of their plastic processing technology systems.
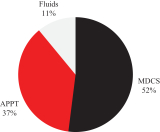
We serve the market through three segments: Advanced Plastic Processing Technologies, which we refer to as “APPT,” Melt Delivery and Control Systems, which we refer to as “MDCS,” and Fluid Technologies, which we refer to as “Fluids.” Our APPT segment designs, manufactures and sells injection, extrusion, and blow molding equipment, co-injection systems and related parts and services. Our MDCS segment designs, manufactures and sells hot runner and process control systems, mold bases and components, and sells MRO supplies. Hot runner systems are custom designed for each product a customer manufactures on an injection molding machine. Our Fluids segment is a global manufacturer of synthetic and semi-synthetic lubricants and coolants used in various industrial metalworking applications. Approximately 61% of our 2014 sales were from consumable products, which we define as products that are replaced and services provided throughout the life of the injection, extrusion, and blow molding systems and fluids used in the metalworking process. Our lifecycle sales include (1) machine aftermarket parts and service; (2) hot runner systems and mold bases, which are replaced each time new plastic parts are designed and existing parts are redesigned; and (3) upgrades and overhauls as customers decide to improve the performance or extend the life of equipment. We serve a diverse range of industries and have longstanding relationships with many of our over 27,000 customers. We have leading market shares in North America and in emerging markets, such as China and India.
The charts below illustrate Milacron’s diversification by principal business segment as a percentage of sales and Adjusted EBITDA for the year ended December 31, 2014.
| By Business (Sales) |
By Segment (Adjusted EBITDA)(1) | |
|
|
|
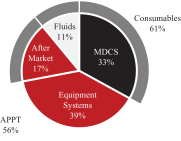
| (1) | Excludes Corporate Adjusted EBITDA of $(21) million. |
1
Table of Contents
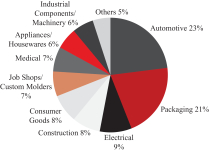
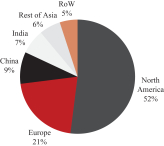
The charts below illustrate Milacron’s diversification by end market and geography as a percentage of sales for the year ended December 31, 2014.
| By End Market (Sales) |
By Geography (Sales) | |
|
|
| |
For the year ended December 31, 2014, we generated total sales, Adjusted EBITDA, Adjusted Net Income and net (loss) attributable to Milacron Holdings Corp. of $1,211 million, $199 million, $75 million, and $(15) million, respectively. Since early 2012, we have broadened our portfolio significantly through a series of strategic initiatives and value-enhancing acquisitions. We have made significant investments to upgrade our machining capabilities, expand capacity in China and India and pursue adjacent growth opportunities in our high-margin consumables businesses. Through our “One Milacron” initiative, we are leveraging our global capabilities, along with investing in new product development and improving manufacturing capabilities and engineering processes. We believe our recent and continuing investments in low cost manufacturing capabilities and our shared service center as well as the continued integration of prior acquisitions position us to drive significant margin improvement over the next three years.
| Significant Initiatives & Investments Since Early 2012 |
Milacron Today | |
| • Acquired Mold-Masters Luxembourg Holdings S.à r.l. (“Mold-Masters”), Kortec, Inc. (“Kortec”) and TIRAD, s.r.o. (“TIRAD”)
• Recruited high-caliber executive team
• Rolled out “One Milacron” initiative—integration and leveraging of our global footprint capabilities and customer relationships across all segments
• Developed new products, such as the E-Multi, M-PET and hybrid machine technologies
• Expanded production capabilities in certain high-growth and lower cost regions
• Employed manufacturing efficiency and low-cost sourcing initiatives
• Implemented an internal global back-office and engineering shared service center in India |
• Global growth platform with leading market positions in North America, China and India
• Plastic technology systems and solutions provider with a strong intellectual property portfolio
• 61% of 2014 sales from higher margin consumable products (recent acquisitions significantly enhanced historic percentages)
• Leading position in the high-growth and high-margin hot runner market
• Industry leading technology for shelf stable plastic packaging
• Upper teens Adjusted EBITDA margins
• Blue-chip customer relationships in all regions among original equipment manufacturers, molders and mold makers | |
2
Table of Contents
3
Table of Contents
Our Industry
We are a global leader in the manufacture, distribution and service of highly engineered and customized systems within the $27 billion plastic technology and processing industry.
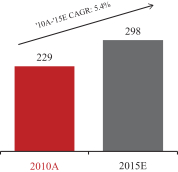
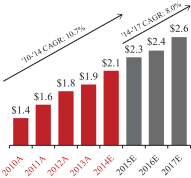
The following charts illustrate the growth in global plastic consumption, global plastic processing machinery demand and the global hot runner market for the periods set forth below.
| Global Plastic Consumption (in millions of tons)(1) |
Global Plastic Processing |
Global Hot Runner Market ($ in bn)(3) | ||
|
|
|
|
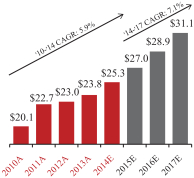
| (1) | Source: Global Industry Analysts, Inc. (January 2012). |
| (2) | Source: Global Industry Analysts, Inc. (May 2014). |
| (3) | Source: Interconnection Consulting (October 2014). |
We believe the following factors will contribute to demand growth for products in our APPT and MDCS segments:
Increasing Global Demand for Plastic Finished Products: We believe the growing demand for plastic products is supported by long term macroeconomic trends. Global population growth, coupled with continued urbanization, increased purchasing power and improved lifestyle in emerging markets have resulted in greater demand for a broad range of finished plastic products in many segments of the economy, including automotive, construction and consumer products. We believe that our strong global presence positions us well to benefit from this growth.
Technological Advancements, New Product Introductions and Continued Preference for Plastic Over Other Materials: Technological advancements in resin, product design and systems integration have increased the number and range of applications for which plastic products can be used. These advancements have led to increased adoption and penetration rates in both high growth industries, such as healthcare and electronics, as well as high volume industries, such as automotive and consumer packaging. For example, the use of plastic components assists automakers in reducing vehicle weight to meet federally mandated fuel economy standards. Consumers have continued to exhibit a preference for plastic packaging over available alternatives, particularly in food packaging. We believe our technology and track record for delivering efficient high speed systems for shelf stable plastic packaging will position us to take advantage of the continued materials conversion from metal and glass to plastic.
Hot Runner Market Demand Growth: Demand for hot runner systems (a custom designed product that channels molten plastic from an injection molding machine into a particular mold) is tied to new product design and product design changeover rather than broader capital investment trends. For instance, in certain large end markets, including electronics and consumer products where technology and preference are rapidly changing, product life cycles have significantly decreased in recent years. In certain emerging markets, such as Asia, hot
4
Table of Contents
runner systems are displacing legacy cold runner technology driven by an increased need for productivity, efficiency, automation and higher part quality. Although growing, hot runner systems penetration levels in emerging markets remain well below the penetration levels seen in developed economies.
Pent-up Equipment Demand: According to the U.S. Department of Commerce Bureau of Economic Analysis, the average age of plastic processing equipment in 2013 was 12 years compared to an average age of eight years in 1980. We believe much of the equipment purchased in the 1980s and 1990s is now nearing the end of its useful life, and the plastic processing industry will experience sustained growth as customers begin to make significant investments in machinery and equipment due to strong plastic demand, lower resin costs and a more robust manufacturing environment. We offer our customers several options to address this issue, including machine replacement, used machine purchases and retrofit services to upgrade their technology. Technological advances in our products have made it more compelling for our customers to purchase new equipment or engage us to retrofit their existing equipment before the end of their existing equipment’s useful life. Upgrading their equipment can provide our customers with several key advantages, including increased resin efficiency, energy efficiency and higher throughput capabilities.
Our Competitive Strengths
Leading Market Positions, Product Breadth and Highly Regarded Brands
Based on management estimates, we believe Milacron is the #1 manufacturer and supplier of plastic processing technologies in North America on a consolidated basis across the industry’s primary plastic processing machinery applications based on sales. We are also the #2 provider of hot runner systems worldwide based on sales. We continue to reinvest capital to establish and maintain our leading positions in emerging markets. We believe that the significant depth and breadth of our product portfolio provides us with a competitive advantage because it allows us to meet more of our customers’ demands as they expand their production capabilities. We believe Milacron has strong brand recognition with over 150 years of continuous operations. Our world class portfolio of brands, including Milacron, DME, Mold-Masters, TIRAD, Cimcool, Ferromatik and Uniloy, have long records of success selling products in over 100 countries across six continents.
Strategically Positioned to Benefit from Global Plastic Market Growth
Market growth is being driven by several fundamental dynamics including the re-tooling of an aging fleet in North America, continued conversion of metal and glass to plastic, and increased plastic consumption in emerging markets. We believe that our plastic processing technology combined with our customer driven sales approach positions us to add value to our customer base as they re-tool their aging fleets with aftermarket sales, retrofits and new equipment. Additionally, our strong technology offering across multiple applications positions us well to capitalize on the incremental growth from the continued materials conversion to plastic. Our international presence and our significant investments in manufacturing capacity in China and India provide a strong base on which we expect to capture emerging market growth.
Large Installed Base and Recurring Revenue Streams
We estimate that we have over 40,000 machines and over 140,000 hot runner systems installed globally. We have a significant opportunity to leverage our aftermarket business and contract services across our existing customer base. We believe we have a significant opportunity to further leverage our machine and hot runner customer base to drive sales and offer customized solutions combining the technology of Mold-Masters and Milacron. We believe we are the top global supplier of parts and service for our own equipment and have the opportunity to increase our share of this business for our installed base as well as that of our customers’ other equipment. The consumable products sold by our APPT aftermarket business, our MDCS business and our Fluids business provide recurring revenue streams. The acquisition of Mold-Masters in March 2013 significantly increased our sales of consumable products and services. We seek to add value to our customers through our lifecycle sales approach and capabilities, which allows us to capture more of our customers’ equipment spend on consumable products.
5
Table of Contents
Leading Technology and Extensive R&D Capabilities
Our products and systems are highly engineered and customized. We hold approximately 1,000 active and pending patents on a range of technologies across our businesses and employ over 750 engineers and designers. Recent innovations include (1) our E-Multi co-injection unit which enables cost effective retrofit of injection molding systems to produce multi-material parts; (2) multi-layer blow molding; (3) co-injection solutions; (4) hybrid machine technologies that blend hydraulic and electric movements; and (5) our M-PET series product line for polyethylene terephthalate (“PET”) preform molding. A number of our technologies are helping to drive the conversion from metal and glass to plastic. We maintain a global engineering and design center in India with over 140 associates to lower design and engineering costs and offer customers 24-hour access to our engineering capabilities.
Diverse End-Markets and Customer Base
Our products and systems serve a broad and diverse range of end markets and customers. For the year ended December 31, 2014, no end-market accounted for more than 23% of our sales and we have a balanced geographical exposure. Our MDCS leadership positions in the medical, teletronics and closures end-markets supplement our APPT strength in automotive and packaging end-markets and offer a platform from which we can expand the presence of each business in new markets and cross-sell our products and services to existing customers. As of December 31, 2014, our businesses maintained an estimated total of more than 27,000 customers. No single customer accounted for more than 1.6% of sales and our top 10 customers accounted for 8.9% of sales for the year ended December 31, 2014. Milacron is a preferred supplier to many key original equipment manufacturers (“OEMs”), end-users whose time to market and profitability depend on our ability to design and manufacture highly customized products with short lead times. As a result of working directly with end users including OEMs and brand owners, our systems are frequently specified by name by the end user and we gain visibility into new opportunities in the plastic technology value chain.
Efficient Cost Structure and Operating Flexibility
We are in the early stages of lean implementation and have undertaken a number of initiatives to improve our cost structure and operating flexibility which we believe will drive significant margin growth over the next three years. This includes consolidating manufacturing locations in North America and Europe and implementing lean initiatives to leverage our supply chain and increase low cost country sourcing. We are concurrently investing to expand capacity in higher growth markets in China and India, both for local market sales and for export to our global customer base and see continued opportunities to implement lean initiatives across our facilities. We are experiencing strong margin improvement momentum through continued operational excellence, further enhancing the attractive free cash flow characteristics of our business.
Track Record of Deploying Capital at Attractive Returns
Since early 2012, our management has identified and executed strategic capital deployment initiatives including accretive tuck-in acquisitions and manufacturing efficiency projects, which have improved our competitive position and financial profile. Our acquisition strategy is intended to broaden and deepen our portfolio and enhance our ability to service customers. These acquisitions have included our 2014 acquisitions of Kortec and TIRAD, each of which have been successfully integrated with our existing business and product development process. As part of our ongoing lean manufacturing initiatives, we have implemented several successful manufacturing footprint projects including our ongoing manufacturing footprint projects in Europe. We believe these projects allow us to expand margins and compete effectively across our global manufacturing base. We continue to see opportunity to execute accretive acquisitions and high payback efficiency projects.
6
Table of Contents
Experienced and Highly Skilled Management Team
Our senior management team consists of industry veterans with proven track records of operational excellence and strategic vision. Our team has successfully implemented both organic growth initiatives and strategic acquisitions. We have realigned our business segments and management structure to maintain and enhance our market leading position and executed effective strategies to focus on high growth and profitable markets. Our senior management team has an average of 30 years of plastic and industry experience, with much of this experience stemming from either our customers or other organizations within our value chain. This experience enables us to bring a customer’s perspective to our company and has influenced our strategy of providing value-enhancing lifecycle solutions to our customers.
Our Strategy
The key elements of our growth strategy include:
Grow Share Profitably
| • | Leverage our Installed Base and Technology to Continue to Drive Lifecycle Sales: Consumable sales are an attractive and recurring revenue opportunity. Our management estimates that the value of available consumable revenue across the life of a machine is one to four times its initial cost. Our lifecycle sales include (1) machine aftermarket parts and service; (2) hot runner systems and mold bases, which are replaced each time new plastic parts are designed and existing parts are redesigned; and (3) upgrades and overhauls as customers decide to improve the performance or extend the life of equipment. |
| • | Continue to Penetrate Emerging Markets: Over the last three years, we have invested in additional sales, service and manufacturing capacity in China and India, as well as maintaining a large and experienced local sales force in these and other emerging growth countries. Our businesses in emerging markets are growing and we believe we can further increase our penetration rate in emerging markets in Asia, Africa and Central America. |
| • | Customer Focused Market Approach: Our market approach is to provide a tailored solution addressing the needs of each customer. As a part of our lifecycle sales approach, we offer fleet assessments whereby we analyze the costs and benefits of upgrading or overhauling the customer’s fleet as opposed to outright replacement with new equipment. We believe we have a competitive advantage because we offer a broad set of repair services and upgrade technologies and do not limit our upgrades and overhauls to only Milacron equipment. |
| • | New Product and Technology Innovation: We have a pipeline of new product technical innovations that are designed to provide customer focused solutions. These technology solutions are expected to increase penetration in growth areas including co-injection systems for packaging and medical applications and next-generation hot runner systems design. We believe there is a large addressable market for high performance products, and we have a significant opportunity to gain additional market share. Our innovative solutions allow us to price our products at a premium to our competitors because of the differentiated technology and attractive value proposition that we offer. We recently launched new technology, including the Klear Can Co-injection Turn-Key Systems and the E-Multi All Electric Retrofit Solution. |
| • | Leverage the Capability and Reach of our Sales Force: We believe we have one of the largest direct sales forces in the industry, with over 400 sales professionals across our businesses. We have recently acquired or opened centers in Texas, California and Mexico to extend our sales reach in those markets. We have also created a Strategic Accounts Management sales leadership team to |
7
Table of Contents
| drive relationships with major plastic processors across our different product lines. We believe this will enhance our leadership position in the injection molding equipment market and continue to drive share gains for our overall business. |
Fund the Future by Driving Margin Improvements
We are in the early stages of implementing a number of initiatives which we anticipate will drive margin growth over the next three years. In addition to savings achieved to date through our ongoing lean initiatives, we expect our recent and continuing investment in facilities consolidation, administrative and sourcing cost savings and back office integration efforts to drive over $30.0 million of run-rate annual savings by the end of 2017.
| • | Facilities Consolidation Enabled by Recent Acquisitions: We continue to optimize our facility footprint by moving production to low cost countries. Our recent acquisitions of Mold-Masters in 2013 and Czech Republic-based TIRAD in 2014 provide the incremental scale to enable additional facility consolidation. While these initiatives are in early stages, currently announced facilities closures are expected to reduce annual operating expenses by approximately $2.2 million upon completion. We have also recently made substantial investments in China and India, both to meet growing domestic demand in those markets and to expand our low cost production capabilities for export. We will continue to seek opportunities to expand our low cost manufacturing footprint in growing markets and consolidate production to drive greater efficiencies. |
| • | Continued Back Office Integration and Operating Efficiencies: We are also in the process of transitioning certain engineering and administrative functions to a shared service center in India and have realized approximately $1.8 million of annual run-rate savings as a result of these initiatives. We expect these savings to increase as we continue to explore opportunities to maximize efficiencies and overhead savings by expanding the shared service center platform. |
| • | Continue to Implement Lean Initiatives: We are successfully improving operational efficiency and reducing costs through the implementation of lean initiatives which include low cost country sourcing. In 2014, we realized approximately $11 million in savings from improvements in global sourcing programs. We anticipate that our global sourcing leverage will improve, particularly due to overlapping spend in steel, electrical and other commodity purchases across our APPT and MDCS business segments. |
Make Possibilities a Reality by Continued Reinvestment
We continually invest in new product development in pursuit of our product vitality goal to achieve 15% of sales from products introduced in the last three years. We have made investments to improve efficiencies, develop new products and increase capacity across our three business segments. We plan to continue focusing on growing each business through efficient use of existing capacity and workforce. We have broadened our portfolio significantly through a series of strategic acquisitions as large as $1 billion and as small as $1 million in size and continue to see opportunity to execute accretive acquisitions.
Win Together as “One Milacron”
Our “One Milacron” initiative was designed to integrate and leverage our global footprint capabilities and customer relationships across all of our business segments with a “win together” culture. First, we are dedicated to providing best-in-class quality and safety for our customers and employees. We believe this approach will continue to allow us to build world-class leaders, account management and sales teams who deliver great service to every customer across Milacron’s businesses. We work closely with our customers throughout their design process and provide them with one-stop complete end-to-end plastic processing solutions that optimize their total cost of production rather than just focusing on selling new equipment. We believe this approach differentiates us from our competitors and helps us develop and maintain long-term customer loyalty.
8
Table of Contents
Risks Affecting Our Business
Investing in our common stock involves a high degree of risk. You should consider carefully the risks described in “Risk Factors” before making a decision to invest in our common stock. If any of these risks actually occur, our business, financial condition and results of operations would likely be materially adversely affected. In such case, the trading price of our common stock would likely decline, and you may lose all or part of your investment. Below is a summary of some of the principal risks that we face.
| • | Demand for our products is affected by general economic conditions, including our customers’ industries and capital expenditures, consumer spending trends and other macroeconomic conditions. |
| • | If the use of plastic declines, it could materially adversely affect our business, financial condition or results of operations. |
| • | We operate in highly competitive industries, many of which are currently subject to intense price competition, and if we are unable to compete successfully, our results of operations could be materially adversely affected. |
| • | We may not be able to successfully implement strategic initiatives designed to increase our cost savings. |
| • | Increases in our cost structure or a disruption in our supply chain could have an adverse effect on our operating results and cash flows. |
| • | Our significant international operations subject us to risks such as unfavorable political, regulatory, labor and tax conditions. |
| • | We have a history of net losses and may not maintain profitability in the future. |
| • | We have a substantial amount of indebtedness, which could have a material adverse effect on our financial condition and our ability to obtain financing in the future and to react to changes in our business. |
| • | We will incur increased costs as a result of operating as a publicly traded company, and our management will be required to devote substantial time to new compliance initiatives. |
| • | CCMP will have a controlling interest in our company, and CCMP’s interests may be different from or conflict with those of our other stockholders. |
Our Principal Stockholder
We were acquired by affiliates of CCMP Capital Advisors, LLC (collectively referred to as “CCMP”) together with certain members of our management in April 2012 (the “CCMP Acquisition”). After this offering, affiliates of CCMP are expected to own approximately % of our common stock. As a result of this offering, CCMP will be able to exert significant voting influence of fundamental and significant corporate matters and transactions. See “Risk Factors—Risks Related to this Offering—CCMP will have a controlling interest in our company, and CCMP’s interests may be different from or conflict with those of our other stockholders.”
CCMP is a leading global private equity firm specializing in buyout and growth equity investments in companies ranging from $250 million to more than $2 billion in size. CCMP’s founders have invested over $16 billion since 1984, which includes their activities at J.P. Morgan Partners, LLC (a private equity division of
9
Table of Contents
JPMorgan Chase & Co.) and its predecessor firms. CCMP was formed in August 2006 when the buyout and growth equity investment professionals of J.P. Morgan Partners, LLC separated from JPMorgan Chase & Co. to commence operations as an independent firm. The foundation of CCMP’s investment approach is to leverage the combined strengths of its deep industry expertise and proprietary operating resources to create value by investing in four targeted industries—Industrials, Consumer/Retail, Energy and Healthcare.
Corporate Information
Milacron Holdings is a Delaware corporation. Milacron Holdings was incorporated on March 16, 2012. Our principal executive offices are located at 3010 Disney Street, Cincinnati, Ohio 45209. Our telephone number at our principal executive offices is 513-487-5000. Our corporate website is www.milacron.com. The information that appears on our website is not part of, and is not incorporated into, this prospectus.
10
Table of Contents
The Offering
| Common stock offered by us |
shares ( shares if the underwriters exercise their option to purchase additional shares in full). |
| Common stock to be outstanding after this offering |
shares ( shares if the underwriters exercise their option to purchase additional shares in full). |
| Option to purchase additional shares of common stock |
The underwriters also have the option to purchase up to an additional shares of common stock from us. The underwriters can exercise this option at any time within 30 days from the date of this prospectus. |
| Use of proceeds |
We estimate that the net proceeds to us from our sale of shares of common stock in this offering will be approximately $ million, after deducting underwriting discounts and commissions and estimated expenses payable by us in connection with this offering. This assumes a public offering price of $ per share, which is the midpoint of the price range set forth on the cover of this prospectus. We expect to use net proceeds from this offering for general corporate purposes, including the repayment of outstanding indebtedness. See “Use of Proceeds.” |
| Dividend policy |
We do not anticipate paying any dividends on our common stock in the foreseeable future; however, we may change this policy in the future. Present and future agreements may also limit our ability to pay dividends. See “Dividend Policy” and “Description of Certain Indebtedness.” |
| Voting rights |
Each share of our common stock will entitle its holder to one vote on all matters to be voted on by stockholders generally. See “Description of Capital Stock.” |
| Risk factors |
Investing in our common stock involves a high degree of risk. See “Risk Factors” beginning on page 18 of this prospectus for a discussion of factors you should carefully consider before investing in our common stock. |
| Proposed NYSE or Nasdaq symbol |
“MCRN.” |
Unless otherwise indicated, the number of shares of common stock to be outstanding after this offering is based on shares outstanding as of 2015 and excludes:
| • | shares of our common stock issuable upon the exercise of options to purchase shares of our common stock, which have a weighted average exercise price of $ per share; and |
| • | shares of common stock reserved for future grant under our 2015 Equity Incentive Plan (the “2015 Equity Incentive Plan”). |
11
Table of Contents
Unless otherwise indicated, all information in this prospectus:
| • | gives effect to a -for-1 stock split of our common stock prior to the consummation of this offering; |
| • | gives effect to our amended and restated certificate of incorporation and our amended and restated bylaws, which will be in effect prior to the consummation of this offering; |
| • | assumes no exercise of the underwriters’ option to purchase up to additional shares of common stock from us; and |
| • | assumes an initial public offering price of $ per share, the midpoint of the price range set forth on the cover of this prospectus. |
12
Table of Contents
SUMMARY HISTORICAL FINANCIAL AND OTHER DATA
The following table sets forth our summary historical financial and other data for the periods and as of the dates indicated. We derived our summary consolidated statements of operations data for the period from January 1, 2012 to April 30, 2012 (Predecessor) (“Predecessor Period 2012”), for the period from May 1, 2012 to December 31, 2012 (Successor) (“Successor Period 2012”) and for the years ended December 31, 2013 and 2014 (Successor) and our balance sheet data as of December 31, 2014 (Successor) from our audited consolidated financial statements included elsewhere in this prospectus.
The summary as adjusted balance sheet data as of December 31, 2014 has been prepared to give effect to the issuance of shares of our common stock in this offering at an assumed initial public offering price of $ , which is the midpoint of the range set forth on the cover of this prospectus, and the application of the net proceeds from this offering as described under “Use of Proceeds.” The following unaudited summary as adjusted financial information is presented for illustrative purposes only and is not necessarily indicative of the financial position that would have occurred if the relevant transactions had been consummated on the date indicated.
In April 2012, affiliates of CCMP, together with members of our management formed Milacron Holdings and, through Milacron Holdings, acquired all of the capital stock of Milacron Intermediate Holdings. Milacron in all periods prior to May 2012 is referred to as “Predecessor,” and in all periods including and after such date is referred to as “Successor.” As a result of acquisition accounting adjustments associated with the CCMP Acquisition, the consolidated financial statements for all Successor periods may not be comparable to those of the Predecessor period. In addition, our historical financial statements for the periods prior to the acquisition of Mold-Masters on March 28, 2013 may not be comparable to our financial statements for periods following such acquisition.
Our historical results are not necessarily indicative of future operating results. You should read the information set forth below in conjunction with “Selected Historical Financial Data of Milacron,” “Management’s Discussion and Analysis of Financial Condition and Results of Operations” and our financial statements and the related notes thereto included elsewhere in this prospectus.
| Period from |
Period from May 1, |
Year ended |
Year ended |
|||||||||||||||
| (Dollars in millions, except share and per share data) | (Predecessor) | (Successor) | (Successor) | (Successor) | ||||||||||||||
| Statements of operations: |
||||||||||||||||||
| Sales |
$ | 260.7 | $ | 571.7 | $ | 1,028.8 | $ | 1,211.3 | ||||||||||
| Costs of sales |
181.5 | 423.3 | 689.1 | 792.3 | ||||||||||||||
|
|
|
|
|
|
|
|
|
|||||||||||
| Manufacturing margins |
79.2 | 148.4 | 339.7 | 419.0 | ||||||||||||||
| Operating expenses: |
||||||||||||||||||
| Selling, general and administrative expenses |
55.6 | 104.9 | 223.4 | 266.9 | ||||||||||||||
| Business combination costs |
8.8 | 9.9 | 2.9 | 1.1 | ||||||||||||||
| Officer severance costs |
— | 6.2 | — | — | ||||||||||||||
| Amortization expense |
0.4 | 24.9 | 47.6 | 44.2 | ||||||||||||||
| (Gain) loss on currency translation |
(0.4 | ) | (0.1 | ) | 10.4 | 16.3 | ||||||||||||
| Other expense (income), net |
0.4 | (0.6 | ) | 1.1 | 8.8 | |||||||||||||
|
|
|
|
|
|
|
|
|
|||||||||||
| Total operating expenses |
64.8 | 145.2 | 285.4 | 337.3 | ||||||||||||||
|
|
|
|
|
|
|
|
|
|||||||||||
| Operating earnings |
14.4 | 3.2 | 54.3 | 81.7 | ||||||||||||||
| Interest expense, net |
11.8 | 20.7 | 70.1 | 74.6 | ||||||||||||||
|
|
|
|
|
|
|
|
|
|||||||||||
| Earnings (loss) before income taxes |
2.6 | (17.5 | ) | (15.8 | ) | 7.1 | ||||||||||||
| Income tax expense |
2.4 | 3.5 | 8.9 | 22.0 | ||||||||||||||
|
|
|
|
|
|
|
|
|
|||||||||||
| Net earnings (loss) |
0.2 | (21.0 | ) | (24.7 | ) | (14.9 | ) | |||||||||||
|
|
|
|
|
|
|
|
|
|||||||||||
13
Table of Contents
| Period from |
Period from May 1, |
Year ended |
Year ended |
|||||||||||||||
| (Dollars in millions, except share and per share data) | (Predecessor) | (Successor) | (Successor) | (Successor) | ||||||||||||||
| Less: Net loss (earnings) attributable to the noncontrolling interest |
0.1 | (0.2 | ) | 0.1 | 0.1 | |||||||||||||
|
|
|
|
|
|
|
|
|
|||||||||||
| Net earnings (loss) attributable to Milacron Holdings Corp. |
$ | 0.3 | $ | (21.2 | ) | $ | (24.6 | ) | $ | (14.8 | ) | |||||||
|
|
|
|
|
|
|
|
|
|||||||||||
| Basic earnings (loss) per share(1) |
$ | 4.36 | $ | (107.95 | ) | $ | (58.40 | ) | $ | (30.14 | ) | |||||||
| Diluted earnings (loss) per share(1) |
$ | 4.04 | $ | (107.95 | ) | $ | (58.40 | ) | $ | (30.14 | ) | |||||||
| Weighted average shares outstanding: |
||||||||||||||||||
| Basic |
68,877 | 196,387 | 421,200 | 490,965 | ||||||||||||||
| Diluted |
74,330 | 196,387 | 421,200 | 490,965 | ||||||||||||||
| Select segment and geographic data: |
||||||||||||||||||
| Sales by segment: |
||||||||||||||||||
| APPT |
$ | 177.9 | $ | 407.2 | $ | 580.1 | $ | 675.8 | ||||||||||
| MDCS |
38.9 | 76.1 | 320.5 | 406.7 | ||||||||||||||
| Fluids |
43.9 | 88.4 | 128.2 | 128.8 | ||||||||||||||
| Sales by geography: |
||||||||||||||||||
| North America |
$ | 148.0 | $ | 343.6 | $ | 526.4 | $ | 628.5 | ||||||||||
| Europe |
56.0 | 101.2 | 235.5 | 258.8 | ||||||||||||||
| Asia |
45.5 | 91.8 | 218.1 | 270.1 | ||||||||||||||
| Rest of World |
11.2 | 35.1 | 48.8 | 53.9 | ||||||||||||||
| Statement of Cash Flows Data: |
||||||||||||||||||
| Net cash provided by operating activities |
$ | 12.4 | $ | 8.1 | $ | 82.1 | $ | 37.6 | ||||||||||
| Net cash used in investing activities |
(4.9 | ) | (210.3 | ) | (993.4 | ) | (94.3 | ) | ||||||||||
| Net cash (used in) provided by financing activities |
(17.2 | ) | 55.2 | 964.8 | 41.2 | |||||||||||||
| Select supplemental data: |
||||||||||||||||||
| New orders(3) |
$ | 274.4 | $ | 522.7 | $ | 1,076.0 | $ | 1,230.4 | ||||||||||
| Backlog(4) |
119.6 | 201.1 | 227.9 | |||||||||||||||
| Adjusted EBITDA by segment(5): |
||||||||||||||||||
| APPT |
$ | 15.1 | $ | 47.3 | $ | 62.6 | $ | 81.0 | ||||||||||
| MDCS |
5.4 | 12.8 | 85.0 | 114.4 | ||||||||||||||
| Fluids |
6.9 | 18.7 | 23.5 | 23.8 | ||||||||||||||
| Corporate |
(2.9 | ) | (7.6 | ) | (9.5 | ) | (20.7 | ) | ||||||||||
| Adjusted EBITDA(5) |
24.5 | 71.2 | 161.6 | 198.5 | ||||||||||||||
| Adjusted Net Income(5) |
8.1 | 34.7 | 57.0 | 74.5 | ||||||||||||||
| Capital expenditures |
4.9 | 11.8 | 30.0 | 41.4 | ||||||||||||||
| Cash interest expense |
4.9 | 13.1 | 46.1 | 71.3 | ||||||||||||||
14
Table of Contents
| Year Ended December 31, 2014 |
||||||||
| Actual |
As Adjusted(2) |
|||||||
| Balance sheet data: |
||||||||
| Cash and cash equivalents |
$ | 81.5 | $ | |||||
| Accounts receivable |
183.3 | |||||||
| Inventories, net |
238.1 | |||||||
| Property and equipment, net |
216.9 | |||||||
| Total assets |
1,790.7 | |||||||
| Accounts payable |
89.9 | |||||||
| Advanced billings and deposits |
58.5 | |||||||
| Total debt and capital lease obligations, including current portion |
1,034.6 | |||||||
| (1) | Basic and diluted earnings (loss) per share is computed by dividing the net earnings (loss) available to common stockholders by the weighted-average number of shares of common stock outstanding during the period. |
| (2) | As adjusted information gives effect to the application of the net proceeds received by us from the offering as described under “Use of Proceeds.” |
| (3) | New orders represent the value of incoming purchase orders received for a period of time that may or may not have been shipped during the period. New orders are counted once we verify acceptance of price and terms and verify credit history and references. |
| (4) | Backlog represents the value of unfilled orders as of the applicable date. These unfilled orders are supported by a valid purchase order and price, terms and credit have been approved by us. All of our backlog is expected to be filled within the current fiscal year and there are no seasonal or other aspects of our backlog that would impact filling the orders. |
| (5) | We prepare our financial statements in conformity with U.S. GAAP. To supplement this information, we also use the following non-GAAP financial measures in this prospectus: Adjusted EBITDA and Adjusted Net Income. For a discussion of and important limitations on the usefulness of non-GAAP financial measures in this prospectus, see “Non-GAAP Financial Measures.” |
15
Table of Contents
The following table provides a reconciliation of net earnings (loss) attributable to Milacron Holdings Corp., the most comparable U.S. GAAP measure, to Adjusted Net Income and to Adjusted EBITDA for the periods presented.
| Period from |
Period from |
Year ended |
Year ended |
|||||||||||||||
| (Dollars in millions) | (Predecessor) | (Successor) | (Successor) | (Successor) | ||||||||||||||
| Net earnings (loss) attributable to Milacron Holdings Corp. |
$ | 0.3 | $ | (21.2 | ) | $ | (24.6 | ) | $ | (14.8 | ) | |||||||
| Amortization expense |
0.4 | 24.9 | 47.6 | 44.2 | ||||||||||||||
| Currency effect on intercompany advances(a) |
— | — | 10.0 | 13.8 | ||||||||||||||
| Organizational redesign costs(b) |
— | 6.5 | 4.4 | 12.9 | ||||||||||||||
| Long-term equity options and shareholder fees(c) |
0.7 | 2.3 | 5.0 | 5.5 | ||||||||||||||
| Debt costs(d) |
— | — | 0.2 | 4.1 | ||||||||||||||
| Acquisition integration costs(e) |
— | — | 2.0 | 4.0 | ||||||||||||||
| Professional services(f) |
— | 2.9 | 2.8 | 3.6 | ||||||||||||||
| Business combination costs(g) |
8.8 | 9.9 | 2.9 | 1.1 | ||||||||||||||
| Fair market value adjustments(h) |
(2.2 | ) | 9.4 | 4.8 | — | |||||||||||||
| Other(i) |
0.1 | — | 1.9 | 0.1 | ||||||||||||||
|
|
|
|
|
|
|
|
|
|||||||||||
| Adjusted Net Income |
8.1 | 34.7 | 57.0 | 74.5 | ||||||||||||||
| Income tax expense |
2.4 | 3.5 | 8.9 | 22.0 | ||||||||||||||
| Interest expense, net |
11.8 | 20.7 | 70.1 | 74.6 | ||||||||||||||
| Depreciation expense |
2.2 | 12.3 | 25.6 | 27.4 | ||||||||||||||
|
|
|
|
|
|
|
|
|
|||||||||||
| Adjusted EBITDA |
$ | 24.5 | $ | 71.2 | $ | 161.6 | $ | 198.5 | ||||||||||
|
|
|
|
|
|
|
|
|
|||||||||||
| (a) | Non-cash currency effect on intercompany advances relates to advances in foreign currency exchange rates. The most significant exposure relates to the Canadian dollar pursuant to intercompany advances associated with the acquisition of Mold-Masters. |
| (b) | Organizational redesign costs in Successor Period 2012 primarily include restructuring expense related to CEO transition and severance costs of $6.2 million. Costs in 2013 and 2014 relate to salary and severance associated with a reduction of headcount as a result of company initiatives to transition processes to low-cost countries. Also included are facility shut down costs of $1.3 million and $1.9 million in 2013 and 2014, respectively. |
| (c) | Long-term equity options and shareholder’s fees include the non-cash charges associated with stock based compensation awards granted to certain executives and independent directors in the Predecessor Period 2012, the Successor Period 2012, 2013 and 2014 and a cash advisory fee paid to CCMP for all Successor periods. CCMP will not receive a cash advisory fee after this offering. |
| (d) | Debt costs in 2014 include a $2.9 million loss on the early extinguishment of a portion of our 8.375% senior secured notes. The loss consists of a $1.6 million premium paid for the early extinguishment and $1.3 million of previously deferred financing costs. We also incurred $0.7 million of fees to increase the term loan facility and expensed $0.5 million of previously deferred financing costs related to the term loan facility. |
| (e) | Acquisition integration costs incurred to fully integrate the acquisition of Mold-Masters, Kortec, TIRAD and certain other smaller acquisitions. Costs include travel, consulting services, restructuring associated with personnel changes and a branding study to integrate the acquired companies into Milacron. |
16
Table of Contents
| (f) | Professional fees in 2013 include consulting services associated with a manufacturing efficiency project and costs incurred on certain business development projects. Costs in 2014 relate to certain advisory services associated with readiness initiatives for this offering, and one-time business-related advisory services. |
| (g) | Business combination costs in the Predecessor Period 2012 include a $2.8 million non-cash charge related to the accelerated vesting of certain stock-based compensation associated with a change of control as a result of the CCMP Acquisition in April 2012 and $6.0 million of certain professional, audit, and other fees related to the transaction. Costs in the Successor Period 2012 include $9.9 million of certain professional, audit and other fees related to the CCMP Acquisition in April 2012. Costs in 2013 and 2014 relate to certain professional, audit and other fees related to the acquisitions of Mold-Masters, Kortec, TIRAD, and certain other smaller acquisitions. |
| (h) | Non-cash fair market value adjustments includes expenses related to acquisition accounting fair market value adjustments to inventory for the CCMP Acquisition in April 2012, and the acquisition of Mold-Masters in 2013. |
| (i) | Other costs in 2013 include a charge of $1.6 million related to environmental remediation required for the disposition of a building associated with a European facility. |
For a reconciliation of operating earnings, the most directly comparable U.S. GAAP measure, to Adjusted EBITDA for each of our segments, see “Selected Historical Financial Data of Milacron.”
17
Table of Contents
An investment in our common stock involves a high degree of risk. You should carefully consider the risks and uncertainties described below and all of the other information included in this prospectus, including our consolidated financial statements and the related notes appearing elsewhere in this prospectus, before investing in our common stock. If any of the following risks actually occur, our business, financial condition, operating results and prospects could be materially adversely affected. As a result, the trading price of our common stock could decline and you could lose part or all of your investment.
Risks Related to Our Business and Industry
Demand for our products is affected by general economic conditions, including our customers’ industries and capital expenditures, consumer spending trends and other macroeconomic conditions.
Our business is affected by general economic conditions. Any uncertainty or adverse changes such as turmoil in global economic and political conditions, including through rising interest rates or inflation, commodity prices, high unemployment, increased volatility in global capital markets, international conflicts, sovereign debt concerns and/or other factors beyond our control, could lead to a significant decline in demand for our products. In addition, the success of our business depends on the profitability of our customers’ businesses. Many of our customers are in businesses that are cyclical in nature and sensitive to changes in general economic conditions, such as the packaging, automotive, industrial components and machinery, construction, consumer durables, electronics, medical and other industries. The performance of our business is directly related to the production levels of our customers. In particular, prices for plastic resins used to make plastic products and parts tend to fluctuate to a greater degree than our customers can adjust for in the pricing of their products. When resin prices increase, our customers’ profit margins decrease, which may result in lower demand for our products. Therefore, our business is affected by fluctuations in the price of resin, which could have an adverse effect on our business and ability to generate operating cash flows.
In addition, deterioration in the credit quality of our customers or the estimated residual value of our equipment could negatively impact the ability of our customers to obtain the resources they need to make purchases of our equipment. If our customers cannot access credit markets or do not utilize discretionary funds to purchase our products and services as a result of the economy or other factors, our business could suffer. Moreover, any prolonged periods of decline in our customers’ capital expenditures could have a material adverse effect on our business, financial condition or results of operations.
If the use of plastic declines, it could have a material adverse effect on our business, financial condition or results of operations.
Approximately 89% of our 2014 sales and profits were realized from the sale of equipment and services to the plastic processing market. A reduction in the usage of plastic would likely result in the reduction of our sales of equipment and services, which could have a material adverse effect on our business, financial condition, or results of operations. Factors that could result in a decline in the usage of plastic include:
| • | The relative cost of plastic compared with other materials, such as glass, metal and paper. The principal cost of plastic is petroleum-based resins and fluctuations in the price of crude oil and natural gas typically impact the price of these resins. If the price of plastic resins were to increase substantially or the cost associated with other competing materials such as glass, metal and paper, were to materially decrease, the plastic products of our customers may no longer be economically competitive relative to other alternatives. |
| • | The environmental impact of plastic may be perceived negatively by environmental groups, customers and government regulators. A number of governmental authorities and advocacy groups have lobbied for and considered, or are expected to consider, legislation aimed at addressing the environmental impacts of plastic. These proposals have included mandating certain rates of |
18
Table of Contents
| recycling and/or the use of recycled materials, imposing deposits or taxes on plastic packaging material, requiring retailers or manufacturers to develop a recycling infrastructure and increased scrutiny on the use of plastic. Legislative and other changes aimed at reducing the environmental impact of plastic may result in increased costs associated with plastic and/or reduced demand for plastic. |
Any of the foregoing factors and other factors, including those unknown to us, could result in a decline in the usage of plastic and could have a material adverse effect on our business, financial condition or results of operations.
We operate in highly competitive industries, many of which are currently subject to intense price competition, and if we are unable to compete successfully, it could have a material adverse effect on our business, financial condition and results of operations.
Many of the industries in which we operate are highly competitive. Our products may not compete successfully with those of our competitors. The markets for plastic processing equipment and related products, mold components and metalworking fluids are highly competitive and include a number of North American, European and Asian competitors. Principal competitive factors in the plastic processing industry include price, product features, technology, performance, reliability, quality, delivery and customer service. Principal competitive factors in the mold components industry include technology, price, quality, performance and delivery. Principal competitive factors in the metalworking industrial fluids industry include price, market coverage, technology, performance, delivery and customer service.
Our competitors may be positioned to offer more favorable pricing to customers, resulting in reduced profitability and a loss of market share for us. In certain cases we have lost business to competitors who offered prices lower than ours. Competition may also limit our ability to pass on the effects of increases in our cost structure. In addition, some of our competitors may have greater financial resources and less debt than we do, which may place us at a competitive disadvantage in the future. These competitors may be better able to withstand and respond to changes in conditions within our industry. Additionally, due to the recent strength of the U.S. dollar, some of our European competitors may be able to offer prices lower than ours.
Competition in any of these areas may reduce our sales and adversely affect our earnings and/or cash flow by resulting in decreased sales volumes, reduced prices and increased costs of manufacturing, distributing and selling our products.
Our results also depend on the successful implementation of several additional strategic initiatives. We may not be able to implement these strategies successfully, on a timely basis, or at all.
We have recently implemented or begun to implement several strategic initiatives that are designed to increase our cost savings and revenue, transform our business and improve our performance. These initiatives include expanding low cost production capabilities and consolidation of facilities, continued back-office integration to a shared service center and implementation of lean sourcing initiatives. The success of our recent initiatives is subject to both the risks affecting our business generally and the inherent difficulty associated with implementing these initiatives, and is largely dependent on the skills, experience, and efforts of our management and other employees. We face a number of uncertainties in connection with the successful implementation of these strategic initiatives. As a result, we may not be successful in implementing these initiatives nor realize anticipated cost savings and increases in revenue. If we are unsuccessful in implementing these initiatives, our financial condition, results of operations and cash flows could be adversely affected.
Increases in our cost structure or disruption in our supply chain could have a material adverse effect on our results of operations and cash flows.
Our costs are subject to fluctuations, particularly for raw materials and purchased components used in our business, including the cost of labor and steel and the cost of oil and chemicals used in the production of
19
Table of Contents
metalworking fluids. Our success is dependent, in part, upon our ability to manage these fluctuations through pricing actions, cost savings projects and global sourcing actions. While we have historically responded by reducing our cost structure and increasing the prices we charge our customers, these measures may not always be sufficient to offset the effects of the cost increases we experience. Accordingly, market changes in raw material and purchased component prices could have a material adverse effect on our results of operations and cash flows.
Additionally, we have developed a network of third-party vendors who supply certain parts and components for our products. While we currently believe that these third-party vendors represent a low-cost source of supply, their costs could rise in the future and we may not be able to effectively source or produce these components and parts. Significant disruptions to our supply chain could limit our ability to source parts and components on a cost effective basis, if at all, and could have a material adverse effect on our business, financial condition or results of operations.
Our significant international operations subject us to risks such as unfavorable political, regulatory, labor and tax conditions.
Our business is subject to risks related to the different legal, political, social and regulatory requirements and economic conditions of many jurisdictions. We have operations in many foreign countries, including, but not limited to, countries in Europe and Asia. For the year ended December 31, 2014, markets outside North America represented the following percentages of our sales: Asia 22%; Europe 21%; and the rest of the world 5%. In addition, as of December 31, 2014, approximately 68% of our workforce was located outside the United States.
Additional risks associated with our international operations include, but are not limited to the following:
| • | agreements may be difficult to enforce and receivables difficult to collect through a foreign country’s legal system; |
| • | foreign countries may impose additional withholding taxes or otherwise tax our foreign income, attempt to impose transfer taxes on past or future corporate level transactions, impose tariffs or adopt other restrictions on foreign trade or investment, including currency exchange controls; |
| • | general economic and political conditions or instability in the countries in which we operate could have an adverse effect on our earnings from operations in those countries; |
| • | restrictions on or costs relating to the repatriation of foreign profits to the United States, including possible taxes or withholding obligations; |
| • | differing, and possibly more stringent, labor regulations; |
| • | natural disasters, pandemics or international conflict, including terrorist acts, could interrupt the manufacturing of our products or performance of services, endanger our personnel or cause delays; |
| • | enforcement of anti-bribery laws, including the U.S. Foreign Corrupt Practices Act of 1977, as amended, (the “FCPA”), the U.K. Bribery Act (the “UKBA”) and similar laws, economic sanctions laws, regulations and regimes (including those administered by the Office of Foreign Assets Control (“OFAC”) of the U.S. Department of the Treasury), and other international laws and regulations; |
| • | the difficulties of staffing and managing dispersed international operations; |
| • | less protective foreign intellectual property laws; |
20
Table of Contents
| • | unexpected adverse changes in foreign laws or regulatory requirements may occur; |
| • | longer customer payment cycles; and |
| • | legal systems that may be less developed and less predictable than those in the United States. |
We are also subject to numerous regulations in the jurisdictions in which we operate, including customs and international trade laws, export control, antitrust laws and zoning and occupancy laws that regulate producers generally and/or govern the importation, exportation, promotion and sale of our products, the operation of facilities and our relationships with our customers, suppliers and competitors. If these regulations or laws were to change or were violated by our management, employees, suppliers, or agents, the costs of certain goods could increase, or we could experience delays in shipments of our goods, be subjected to fines or penalties, or suffer reputational harm, any of which could reduce demand for our products and negatively impact our business and results of operations. In addition, changes in national and local minimum wage laws and other laws relating to employee benefits could cause us to incur additional wage and benefits costs, which could negatively impact our profitability.
Our overall success as a global business depends, in part, upon our ability to succeed in differing and unpredictable legal, regulatory, economic, social and political conditions. We may not be able to continue to succeed in developing and implementing policies and strategies that will be effective in each foreign market where we do business. Any of the foregoing factors may have a material adverse effect on our ability to generate cash flow and grow our business.
Our operations partly depend on the rate of economic development and growth in the emerging markets of Asia, Africa, Central America and South America.
Our operations partly depend upon the economies of the Asian, African, Central American and South American markets. These markets include countries with economies in various stages of development or structural reform, some of which are subject to rapid fluctuations in terms of consumer prices, employment levels, gross domestic product, interest rates and foreign exchange rates. Our operations in these markets may also be subject to risks relating to weak legal systems which may affect our ability to enforce our intellectual property and contractual rights, exchange controls, unstable governments and privatization, changes in customs or tax regimes, or other government actions affect the flow of goods and currency. To the extent such fluctuations and risks have an effect on the ability of our consumers to pay for our products, the growth of sales of our products in such markets could be impacted negatively.
Our operations are conducted worldwide and our results of operations are subject to currency translation risk and currency transaction risk that could have a material adverse effect on our financial condition and results of operations.
Since significant sales are made in currencies other than the U.S. dollar, our financial results are affected by currency fluctuations. The financial condition and results of operations of each of our foreign operating subsidiaries are reported in the relevant local currency and then translated to U.S. dollars at the applicable currency exchange rate for inclusion in our financial statements. Exchange rates between these currencies, including the Canadian dollar, the Euro, Chinese yuan renminbi, Indian rupee and U.S. dollars in recent years have fluctuated significantly and may do so in the future.
For the year ended December 31, 2014, approximately 45% of our sales were in currency other than U.S. dollars. Significant changes in the value of the Euro, Chinese yuan renminbi and Indian rupee relative to the U.S. dollar could have an adverse effect on our financial condition and results of operations. If the Euro, Chinese yuan renminbi or Indian rupee should weaken against the U.S. dollar in the future, we will experience a negative effect in translating our new orders, sales and earnings when compared to historical results. In addition to
21
Table of Contents
currency translation risks, we incur currency transaction risk whenever one of our operating subsidiaries enters into either a purchase or a sales transaction using a different currency from the currency in which it records revenues. See “Management’s Discussion and Analysis of Financial Condition and Results of Operations—Quantitative and Qualitative Disclosure about Market Risk—Foreign Currency Exchange Rate Risk.” Given the volatility of exchange rates, we may not be able to effectively manage our currency transaction and translation risks and any volatility in currency exchange rates may have a material adverse effect on our business, financial condition or results of operations.
We might not be able to timely develop, manufacture and gain market acceptance of new and enhanced products required to maintain or expand our business.
Our success in the future will depend in part upon our ability to maintain and enhance our technological capabilities, develop and market products and applications that meet changing customer needs and successfully anticipate or respond to technological changes of our competitors in a cost-effective and timely manner. Difficulties or delays in identifying viable new products, research, development or production of new products or failure to gain regulatory approval, intellectual property protection or market acceptance of new products and technologies may reduce future sales and adversely affect our competitive position. Our competitors may develop other patent technologies that are more effective or commercially attractive than our current or future technologies or render our technologies or services less competitive or obsolete. Our inability to anticipate, respond to or utilize changing technologies could cause us to lose customers.
Our business, financial condition and results of operations could be adversely impacted by business disruptions, security threats and security breaches.
Business disruptions, including supply disruptions, increasing costs for energy, temporary plant and/or power outages and network disruptions, could harm our operations as well as the operations of our customers, distributors or suppliers. In addition, the operation of our business relies on information technology (“IT”) infrastructure and systems on multiple platforms to process, transmit and store electronic information, and to support a variety of business processes and activities. We face security threats and risks of security breaches to our facilities, data and IT infrastructure. Although it is impossible to predict the occurrence or consequences of business disruptions, security threats or security breaches, they could harm our reputation, subject us to material liabilities, result in reduced demand for our products, make it difficult or impossible for us to deliver products to our customers or distributors or to receive raw materials from suppliers, compromise our networks, subject us to liability or regulatory penalty under laws protecting the privacy of personal information and create delays and inefficiencies in our supply chain. Further, the failure of our systems to perform could severely disrupt our business and adversely affect our results of operations. Our systems are also vulnerable to natural or man-made disasters, computer viruses or hackers, power loss or other technology system failures. We may also be required to incur significant costs to protect against damage caused by these disruptions or security breaches in the future. These events could have a material adverse effect on our business, financial condition or results of operations.
We may not be able to adequately protect our intellectual property and proprietary rights and our products could infringe on the intellectual property of others, which could harm our future success and competitive position.
Our future success and competitive position depend in part upon our ability to obtain and maintain certain proprietary technologies used in our principal products. We may not always be successful in preventing the unauthorized use of our existing intellectual property rights by our competitors. We may not be able to discover unauthorized use of our proprietary technologies in the future or be able to receive any payments therefor. If we are not successful in protecting our intellectual property, it may result in the loss of valuable technologies or require us to make payments to other companies for infringing on their intellectual property rights. We generally rely on patent, trade secret and copyright laws as well as confidentiality agreements with other parties to protect our technologies; however, some of our technologies may not be protected.
22
Table of Contents
Confidentiality agreements may be breached or terminated, and we may not have adequate remedies for any breach. A third party could copy or otherwise obtain and use our products or technology without authorization. Additionally, third parties may assert infringement or other intellectual property claims against us based on their patents or other intellectual property rights. Litigation may be necessary for us to defend against claims of infringement or to protect our intellectual property rights and could result in substantial cost to us and diversion of our efforts. Further, we might not prevail in such litigation, which could harm our business and could result in us having to obtain a license to sell our products or pay substantial royalties. Our failure to obtain or maintain adequate protection of our intellectual property rights for any reason could have a material adverse effect on our business, results of operations and financial condition.
We have applied for patent protection relating to certain existing and proposed products, processes and services. While we generally apply for patents in those countries where we intend to make, have made, use, or sell patented products, we may not accurately predict all of the countries where patent protection will ultimately be desirable. If we fail to timely file a patent application in any such country, we may be precluded from doing so at a later date. The patents issued as a result of our foreign patent applications may not have the same scope of coverage as our U.S. patents. Further, competitors may infringe on our patents and we may not have adequate resources to enforce our patents. We may also have any of the following occur:
| • | any of our patents could be invalidated, circumvented or challenged; |
| • | any of our pending or future patent applications could fail to be issued within the scope of the claims sought by us, if at all, and patents issued from such applications may not be of sufficient scope or strength to provide us with any meaningful protection or commercial advantage; |
| • | others may develop technologies that are similar or superior to our technologies, duplicate our technologies or design around our patents; or |
| • | steps taken by us to protect our technologies may not prevent misappropriation of such technologies. |
We also own or have rights to various trademark registrations and trademark registration applications in the United States and certain international jurisdictions that we use in connection with our business. Monitoring unauthorized use of our trademarks is difficult and expensive, and we may not be able to prevent misappropriation of our trademark rights in all jurisdictions, particularly in countries whose laws do not grant the same protections as the United States grants.
Our financial results are impacted by unpredictable customer purchasing trends and the timing of converting orders into sales can lead to variations in, and uncertainties regarding, our financial results from period to period.
Sales of our plastic processing machinery products are subject to customer buying patterns and can vary from period to period. We sometimes have sales to customers that are large relative to our sales in any given period. Fluctuations in demand for our plastic processing machinery products due to large unpredictable sales to customers and delays or failures to fulfill purchase orders could lead to variations in, and uncertainties regarding, our financial results from period to period. In addition, our plastic processing machinery sales are impacted by the timing of orders and the length of time required to convert these unshipped orders, or backlog, into sales, which varies based on the type of customer and product and can range from several weeks to several months.
Our inability to satisfy orders on a timely basis could have a material adverse effect on our business, results of operations and financial condition and the conversion of our backlog and open orders into revenue may occur at a slower rate than historical trends.
Our backlog as of December 31, 2014 was $227.9 million. This backlog is based upon anticipated sales revenue from confirmed orders. The majority of our plastic processing machinery products are produced after a
23
Table of Contents
price has been agreed to, an order has been received and a deposit has been paid by our customers and generally require delivery within a specified period of time. If we are unsuccessful in recruiting skilled labor, experience delays in purchase component deliveries or experience changes in customer specifications on ordered equipment, the rate at which backlog or open orders are converted into revenue may be slower than we have historically experienced. If it takes longer than expected to realize revenue, our results of operations and financial condition may be materially and adversely affected. Additionally, any failure to deliver products on a timely basis could result in our customers cancelling their orders, requesting discounts or ceasing to do business with us altogether. Furthermore, the portion of our backlog that may be produced in our foreign subsidiaries is exposed to fluctuations in the applicable foreign currencies, which may be material. The historical relationship of backlog to sales revenues actually realized by us, should not be considered indicative of future results. See “Management’s Discussion and Analysis of Financial Condition and Results of Operations of Milacron—New Orders and Backlog.”
Our operations depend on our ability to maintain production at our facilities.
Our operations may be subject to disruption due to extreme weather conditions, floods, fire, natural disaster, war, terrorist activity, sustained mechanical failure and similar events, major industrial accidents, strikes and lockouts, new laws or regulations, changes in interpretations of existing laws or regulations or changes in governmental enforcement policies, regulatory actions and other events. Any disruption resulting from any of these events could cause significant delays in shipments of products and the loss of sales and customers and we may not have insurance to adequately compensate us. Our facilities and the manufacturing equipment located in our facilities would be difficult to replace and could require substantial replacement lead time. Furthermore, due to the concentration of our operations, a closure of one of our manufacturing facilities could have a substantial negative effect on our results of operations. Our business, financial condition or results of operations could be materially and adversely affected by any prolonged interruption of all or a substantial portion of our business.
If our products fail to perform or fail to meet customer requirements or expectations, we could incur significant additional costs.
The production of some of our products involves highly complex processes. Our customers specify quality, performance and reliability standards that we must meet. If our products do not meet these standards, we may be required to replace or rework the products. In some cases, our products may contain undetected defects or flaws that only become evident after shipment. In the past, we have proactively replaced parts in the field that have experienced a high rate of failure.
We also may be the target of product liability lawsuits. If a person were to bring a product liability suit against one of our customers, this customer may attempt to seek contribution from us. A person may also bring a product liability claim directly against us. A successful product liability claim or series of claims against us in excess of our insurance coverage for payments, for which we are not otherwise indemnified, could have a material adverse effect on our business, financial condition or results of operations. In addition, we may not be able to continue to maintain our existing insurance or obtain comparable insurance at a reasonable cost, if at all, in the event a significant product or service claim arises. A significant product liability case could also result in adverse publicity, damage to our reputation, and a loss of customer confidence in our products.
We could be subject to litigation that could have an adverse effect upon our business, financial condition, results of operations or reputation.
From time to time we are a defendant in or otherwise a party to certain lawsuits and other proceedings that result from, and are incidental to, the conduct of our business. These suits and proceedings may concern issues including product liability, employment, antitrust, warranty and contractual disputes, environmental matters, and intellectual property matters. In addition, various factors or developments can lead to changes in current estimates of liabilities such as a final adverse judgment, significant settlement or changes in applicable
24
Table of Contents
law. A future adverse ruling or unfavorable development could result in future charges that could have a material adverse effect on us. While it is not feasible to predict the outcome of all pending or future suits, claims and proceedings, the ultimate resolution of these matters could have a material adverse effect upon our business, financial condition, results of operations or reputation.
Our business depends on attracting and retaining qualified management personnel.
The unanticipated departure of any key member of our management team could have an adverse effect on our business. Given our relative size and the breadth of our global operations, there are a limited number of qualified management personnel to assume the responsibilities of management level employees should there be management turnover. Our success depends to a significant extent upon a number of key employees, including members of senior management. The loss of the services of one or more of these key employees could have a material adverse effect on our results of operations and prospects. In addition, because of the specialized and technical nature of our business, our future performance depends on the continued service of, and our ability to attract and retain, qualified management, commercial and technical personnel. Competition for such personnel is intense, and we may be unable to continue to attract or retain such personnel to support our growth and operational initiatives and replace executives who retire or resign. Failure to retain our leadership team and attract and retain other important management and technical personnel could place a constraint on our growth and operational initiatives, which could have a material adverse effect on our revenues, results of operations and product development efforts and eventually result in a decrease in profitability.
Our operations may subject us to potential responsibilities and costs under environmental laws that could have a material adverse effect on our business, financial condition or results of operations.
Our operations are subject to environmental and health and safety laws, regulations and permitting requirements in the United States and abroad relating to the protection of the environment and health and safety matters, including those governing discharges of pollutants to the air, soil and water, the management, treatment, storage and disposal of, and exposure to, solid and hazardous substances and wastes, the investigation and clean-up of contaminated sites and the protection of employee health and safety. Environmental, health and safety regulations and standards are becoming increasingly strict, which could require us to make potentially significant capital or operating expenditures to comply with such standards. In addition, we could incur significant costs, including fines and sanctions, and claims by third parties for property damage and personal injury, as a result of violations of these laws and regulations.
Certain environmental laws, in the jurisdictions in which we operate, including the Comprehensive Environmental Response, Compensation and Liability Act (“CERCLA”), in the United States, impose joint and several liability for cleanup costs, without regard to fault, on current and former owners of property that has been impacted by a release of a hazardous substance or on persons who have disposed of, arranged for the disposal of or released hazardous substances into the environment. We have been involved in remedial investigations and actions at various locations, and could in the future become involved in such matters at current or former facilities or off-site disposal sites. An adverse result in any potential future matter could materially and adversely affect our business, financial position and results of operations.
Terrorist attacks, other acts of violence or war, natural disasters, political unrest or other uncommon global events may affect the markets in which we operate and our profitability.
Terrorist attacks, other acts of violence or war, natural disasters, political unrest or other uncommon global events may negatively affect our operations. There could be further terrorist attacks against the United States or other locations where we do business. Also, other uncommon global events, such as earthquakes, fires and tsunamis, cannot be predicted. Terrorist attacks, other acts of violence or armed conflicts, and natural disasters may directly impact our physical facilities or those of our suppliers or customers. Additional terrorist attacks or natural disasters may disrupt the global insurance and reinsurance industries with the result that we may not be able to obtain insurance at historical terms, pricing and levels for all of our operations.
25
Table of Contents
Furthermore, any of these events may make travel and the transportation of our supplies and products more difficult and more expensive and ultimately affect the sales of our products. The consequences of terrorist attacks, other acts of violence or armed conflicts, natural disasters or other uncommon global events are unpredictable, and we may not be able to foresee events, such as these, that could have a material adverse effect on our business, financial condition and results of operations.
Work stoppages or unionization activities could disrupt our operations.
As of December 31, 2014, approximately 700 (13% of our total number of employees) of our European workforce belong to work councils or are otherwise subject to labor agreements. These employees are primarily members of the European Works Council, as is standard practice in the region. None of our other employees were represented by unions, although it is possible that our workforce will become unionized in the future. Unionization activities could increase our costs, which could have a material adverse effect on our business, financial condition or results of operations.
We may be subject to work stoppages and may be affected by other labor disputes. A work stoppage at one or more of our plants may have a material adverse effect on our business, financial condition or results of operations. Additionally, a work stoppage at one or more of our customers or our customers’ suppliers could materially adversely affect our operations if an alternative source of supply were not readily available. Stoppages by employees of our customers also could result in reduced demand for our products and have a material adverse effect on our business.
Governmental authorities may question our intercompany transfer pricing policies or change their laws in a manner that could increase our effective tax rate or otherwise harm our business.
As a U.S. company doing business in international markets through subsidiaries, we are subject to foreign tax and intercompany transfer pricing laws, including those relating to the flow of funds between the parent and subsidiaries. Regulators in the United States and in foreign markets closely monitor our corporate structure and how we account for intercompany fund transfers. If regulators challenge our corporate structure, transfer pricing mechanisms or intercompany transfers, our operations may be negatively affected and our effective tax rate may increase. Tax rates vary from country to country and if regulators determine that our profits in one jurisdiction should be increased, we may not be able to fully utilize all foreign tax credits that are generated, which would increase our effective tax rate. We may not be in compliance with all applicable exchange control and transfer pricing laws despite our efforts to be aware of and to comply with such laws. Further, if these laws change, we may need to adjust our operating procedures, and our business could be materially and adversely affected.
We are exposed to a number of different tax uncertainties, which could have a material adverse effect on our results of operations.
We are required to pay taxes in multiple jurisdictions. We determine the tax liability we are required to pay based on our interpretation of applicable tax laws and regulations in the jurisdictions in which we operate. We may be subject to unfavorable changes, including retroactive changes, in the tax laws and regulations to which we are subject. We are subject to tax audits by governmental authorities in the United States and numerous non-U.S. jurisdictions, which are inherently uncertain. Negative or unexpected results from one or more such tax audits could adversely affect our results of operations. Tax controls and changes in tax laws or regulations or the interpretation given to them may expose us to negative tax consequences, including interest payments and potential penalties, which could have a material adverse effect on our results of operations.
Our ability to use our net operating loss carryforwards might be limited.
As of December 31, 2014, we had net operating loss carryforwards of approximately $73.1 million for U.S. federal income tax purposes. These loss carryforwards will expire in varying amounts through 2031. To the extent these net operating loss carryforwards are available, we intend to use them to reduce the corporate income
26
Table of Contents
tax liability associated with our operations. Section 382 of the Code generally imposes an annual limit on the amount of net operating loss carryforwards that might be used to offset taxable income when a corporation has undergone significant changes in stock ownership. As a result, prior or future changes in ownership could put limitations on the availability of our net operating loss carryforwards. In addition, our ability to use the current net operating loss carryforwards might be further limited by the issuance of common stock in the future. To the extent our use of net operating loss carryforwards is significantly limited, our income could be subject to corporate income tax earlier than it would if we were able to use net operating loss carryforwards, which could result in lower profits.
We have determined that we have experienced multiple ownership changes under Section 382. We have estimated that approximately $45.4 million of federal net operating losses may be utilized in the future based on limitations that we have calculated under Section 382.
We have a history of net losses and may not maintain profitability in the future.
We have not been consistently profitable on a quarterly or annual basis. For the years ended December 31, 2014 and 2013, we incurred net losses of approximately $14.8 million and $24.6 million, respectively. We have historically incurred net losses and may continue to incur losses for the foreseeable future. We may not be able to sustain or increase our growth or profitability in the future. In addition, following the completion of this offering, we expect that our selling, general and administrative expenses will increase due to the additional operational and reporting costs associated with being a public company. As a result of these increased expenditures and expenses, we will need to generate and sustain increased revenue to achieve future profitability expectations. We may incur significant losses in the future for a number of reasons, including the other risks and uncertainties described in this prospectus. Additionally, we may encounter unforeseen operating expenses, difficulties, complications, delays and other unknown factors that may result in losses in future periods. If these losses exceed our expectations or our growth expectations are not met in future periods, our financial performance will be affected adversely.
Downturns in the economy and disruptions in the financial and credit markets may negatively affect our ability to raise capital to fund capital expenditures, pursue proposed expansion or acquisition opportunities or refinance our indebtedness.
Our businesses are capital intensive. We rely on earnings and cash flow from operations to finance our business, capital expenditures, expansion and acquisitions and, to the extent that we cannot fund such expenditures from cash generated by operations, funds must be borrowed or otherwise obtained. We will also be required in the future to refinance our outstanding debt. Downturns in the economy and disruptions in the financial and credit markets have periodically made it more difficult and more expensive to raise capital. Our ability to effectively operate and grow our businesses may be constrained if we are unable to borrow additional capital or refinance existing borrowings on reasonable terms. If we do not have access to credit or capital markets at desirable times or at rates that we would consider acceptable, the lack of such funding could have a material adverse effect on our business, results of operations and financial condition and our ability to service our indebtedness.
If we are not able to maintain and enhance our brand, or if events occur that damage our reputation and brand, our ability to maintain and expand our base of customers may be impaired, and our business and financial results may be harmed.
We believe that the Milacron brand has significantly contributed to the success of our business. We also believe that maintaining and enhancing our brand is critical to maintaining and expanding our base of customers. Maintaining and enhancing our brand will depend largely on our ability to continue to provide useful, reliable, trustworthy, and innovative products, which we may not do successfully. We may introduce new products or technologies that do not meet the market demand, which may negatively affect our brand. We have in the past experienced, and we expect that in the future we will continue to experience, media, legislative, or regulatory
27
Table of Contents
scrutiny of our impact on the environment, which may adversely affect our reputation and brand. We also may fail to provide adequate customer service, which could erode confidence in our brand. Maintaining and enhancing our brand may require us to make substantial investments and these investments may not be successful. As part of our broader branding and marketing strategy we may choose to consolidate or change product brands which may result in us incurring impairment charges. If we fail to successfully promote and maintain the Milacron brand or if we incur excessive expenses or impairment charges in this effort, our business and financial results may be adversely affected.
We are subject to anti-corruption statutes and a number of U.S. regulations, and if we fail to comply with such statutes and regulations it could have a material adverse effect on our business, financial condition and results of operations.
As a global business, we are subject to anti-bribery laws and regulations of the U.S. government and those of various international and subnational jurisdictions, and our failure to successfully comply with these rules and regulations may expose us to liabilities. These laws and regulations apply to companies, individual directors, officers, employees and agents, and may restrict our operations, trade practices, investment decisions and partnering activities. In particular, our international operations are subject to U.S. and foreign anti-corruption laws and regulations, such as the FCPA and the UKBA, as well as anti-corruption laws of the various jurisdictions in which we operate. The FCPA and other laws prohibit us and our officers, directors, employees and agents acting on our behalf from corruptly offering, promising, authorizing or providing anything of value to foreign officials for the purposes of influencing official decisions or obtaining or retaining business or otherwise obtaining favorable treatment. As part of our business, we deal with state-owned business enterprises, the employees and representatives of which may be considered foreign officials for purposes of the FCPA. We are subject to the jurisdiction of various governments and regulatory agencies outside of the United States, which may bring our personnel into contact with foreign officials responsible for issuing or renewing permits, licenses or approvals or for enforcing other governmental regulations. In addition, some of the international locations in which we operate lack a developed legal system and have elevated levels of corruption. Our global operations expose us to the risk of violating, or being accused of violating, the foregoing or other anti-corruption laws. Such violations could be punishable by criminal fines, imprisonment, civil penalties, disgorgement of profits, injunctions and debarment from government contracts, as well as other remedial measures. Investigations of alleged violations can be very expensive and disruptive. If we have been determined to be in violation of the FCPA, the UKBA or other anti-corruption laws, we could be subject to significant fines, penalties, repayments, other damages (in certain cases, treble damages) which could have a material and adverse effect on our business, financial condition and results of operations.
Our business activities are also subject to various restrictions under U.S. export controls and trade and economic sanctions laws, including the U.S. Commerce Department’s Export Administration Regulations and economic and trade sanctions regulations maintained by OFAC. If we fail to comply with these laws and regulations, we could be subject to civil or criminal penalties and reputational harm, which could have a material and adverse effect on our business, financial condition and results of operations.
Goodwill and other identifiable intangible assets represent a significant portion of our total assets, and we may never realize the full value of our intangible assets.
As of December 31, 2014, goodwill and other identifiable intangible assets were approximately $991.4 million, or 55.4% of our total assets. Goodwill and other identifiable intangible assets are recorded at fair value on the date of acquisition. In accordance with the guidance under Financial Accounting Standards Board (“FASB”) ASC 350-20, “Intangibles—Goodwill and Other,” we review such assets at least annually for impairment. Impairment may result from, among other things, deterioration in performance, adverse market conditions, adverse changes in applicable laws or regulations, including changes that restrict the activities of or affect the products and services we sell, challenges to the validity of certain registered intellectual property, reduced sales of certain products incorporating registered intellectual property, and a variety of other factors. The amount of any quantified impairment must be expensed immediately as a charge to results of operations.
28
Table of Contents
Depending on future circumstances, it is possible that we may never realize the full value of our intangible assets. Any future determination of impairment of goodwill or other identifiable intangible assets could have a material adverse effect on our financial position and results of operations.
Our growth strategy may include acquisitions, and we may not be able to execute on our acquisition strategy or integrate acquisitions successfully which could materially adversely affect our business.
As part of our growth strategy, we may consider the acquisition of other companies, assets and product lines that either complement or expand our existing business and create economic value. We continually evaluate potential acquisition opportunities in the ordinary course of business, including those that could be material in size and scope. Acquisitions involve a number of special risks, which may include:
| • | the diversion of management’s time and attention from other business concerns to the assimilation of the acquired companies and their employees and on the management of expanding operations; |
| • | the use of debt to finance acquisitions, increasing the risk that we may be unable to satisfy our financial obligations; |
| • | the incorporation of acquired products into our product line; |
| • | the disruption of existing supplier or customer relationships and the difficulty of presenting a unified corporate image; |
| • | the increasing demands on our operational systems and integration costs, which may be greater than expectations; |
| • | difficulties in maintaining uniform standards, controls, procedures and policies throughout acquired companies; |
| • | increased regulatory scrutiny as a result of perceived concentration in certain markets; |
| • | the impact of accounting requirements relating to business combinations, including the requirement to expense certain acquisition costs as incurred, which may cause us to experience greater earnings volatility and generally lower earnings during period in which we acquire new businesses; and |
| • | difficulties in retaining key employees, customers or suppliers of the acquired business. |
We may become responsible for unexpected liabilities that we failed or were unable to discover in the course of performing due diligence in connection with any future acquisitions. Any indemnification rights we obtain in the future may not be enforceable, collectible or sufficient in amount, scope or duration to fully offset the possible liabilities associated with the business or property acquired. Any of these liabilities, individually or in the aggregate, could have a material adverse effect on our business, financial condition or results of operations.
In addition, any acquisition, once successfully integrated, may not perform as planned, be accretive to earnings, or prove to be beneficial to our operations and cash flow. The costs of such integration could have a material adverse effect on our business, financial condition or results of operations.
Risks Related to our Capital Structure
We have a substantial amount of indebtedness, which could have a material adverse effect on our financial condition and our ability to obtain financing in the future and to react to changes in our business.
As of December 31, 2014, we had $1,035.9 million aggregate principal amount of senior debt outstanding, including $465.0 million outstanding principal amount under our 7.750% Senior Notes due 2021 (the “Senior Unsecured Notes”), $220.0 million outstanding principal amount under our 8.375% Senior Secured
29
Table of Contents
Notes due 2019 (the “Senior Secured Notes”) and $340.0 million under our seven-year $342.6 million Term Loan Facility maturing in 2020 (the “Term Loan Facility”). We also had $79.8 million (excluding approximately $14.9 million of undrawn letters of credit) of availability under our senior secured asset-based revolving facility (the “ABL Facility”), and $12.7 million of undrawn availability under other lines of credit, in each case subject to borrowing base or other limitations.
Our substantial indebtedness could limit our ability to satisfy our obligations and operate our business and could also impair our competitive position. For example, it could:
| • | make it more difficult for us to satisfy our obligations under the Senior Unsecured Notes, the Senior Secured Notes, the ABL Facility or the Term Loan Facility; |
| • | increase our vulnerability to adverse economic and general industry conditions, including interest rate fluctuations, because a portion of our borrowings are and will continue to be at variable rates of interest; |
| • | require us to dedicate a substantial portion of our cash flow from operations to payments on our debt, which would reduce the availability of our cash flow from operations to fund working capital, capital expenditures, acquisitions, or other general corporate purposes; |
| • | limit our flexibility in planning for, or reacting to, changes in general economic conditions or in our business and industry; place us at a disadvantage compared to competitors that may have proportionately less debt; |
| • | limit our ability to obtain additional debt or equity financing due to applicable financial and restrictive covenants in our debt agreements; and |
| • | increase our cost of borrowing. |
Despite our current indebtedness levels and restrictive covenants, we and our subsidiaries may still incur significant additional indebtedness. Incurring more indebtedness could increase the risks associated with our substantial indebtedness.
Certain agreements governing our indebtedness, including the indentures relating to our Senior Unsecured Notes and our Senior Secured Notes and the credit agreements governing our ABL Facility and our Term Loan Facility, contain restrictions on the incurrence of additional indebtedness, subject to specified conditions and limitations. Under certain circumstances, the amount of indebtedness, including senior secured indebtedness, we could incur in compliance with these restrictions could be substantial. Additionally, these restrictions may not prevent us from incurring obligations that, although preferential to our common stock in terms of payment, do not constitute indebtedness. If we add new debt to our outstanding debt levels, the risks relating to our indebtedness would increase. If we incur additional debt, the risks associated with our substantial leverage and the ability to service such debt would increase. See “Management’s Discussion and Analysis of Financial Condition and Results of Operations—Liquidity and Capital Resources.”
The credit agreements governing our ABL Facility and Term Loan Facility and the indentures governing our Senior Unsecured Notes and Senior Secured Notes impose significant operating and financial restrictions on Milacron LLC and its subsidiaries, which may prevent us from capitalizing on business opportunities.
The credit agreements governing our ABL Facility and Term Loan Facility and the indentures governing our Senior Unsecured Notes and Senior Secured Notes impose significant operating and financial restrictions on the issuers of such indebtedness and their restricted subsidiaries. These restrictions limit the ability of Milacron LLC and its restricted subsidiaries, among other things, to:
| • | incur, assume or permit to exist additional indebtedness (including guarantees thereof); |
30
Table of Contents
| • | pay dividends or certain other distributions on their capital stock or repurchase our capital stock or prepay subordinated indebtedness; |
| • | incur liens on assets; |
| • | make certain investments or other restricted payments; |
| • | allow to exist certain restrictions on the ability of the restricted subsidiaries to pay dividends or make other payments to the issuers of such indebtedness; |
| • | engage in transactions with affiliates; |
| • | sell certain assets or merge or consolidate with or into other companies; |
| • | guarantee indebtedness; and |
| • | alter the business that we conduct. |
In addition, our ABL Facility contains a financial covenant requiring Milacron LLC and its restricted subsidiaries to maintain a 1.0 to 1.0 minimum trailing four quarter fixed charge coverage ratio, to be tested at any time that excess availability under the ABL Facility decreases to a level below the greater of 12.5% of the aggregate revolver commitments and $13.8 million, until the date on which excess availability exceeds the greater of 12.5% of the aggregate revolver commitments and $13.8 million for 30 consecutive days.
As a result of these covenants and restrictions, we will be limited in how we conduct our business and we may be unable to raise additional debt or equity financing to compete effectively or to take advantage of new business opportunities. The terms of any future indebtedness we may incur could include more restrictive covenants. As of December 31, 2014, we were in compliance with all of the covenants under our debt instruments. However, we may not be able to maintain compliance with these covenants in the future and, if we fail to do so, we may not be able to obtain waivers from the applicable lenders or noteholders and/or amend the covenants. A breach of any of these covenants could result in an event of default under one or more of the credit agreements governing the ABL Facility and the Term Loan Facility or the indentures governing the Senior Unsecured Notes and Senior Secured Notes and, if not cured or waived, could give the holders of the defaulted debt a right to accelerate such debt. Acceleration of any of our debt could result in cross-defaults under our other debt instruments.
We may not be able to generate sufficient cash to service all of our indebtedness and may be forced to take other actions to satisfy our obligations under our indebtedness, which may not be successful.
Our ability to make scheduled payments on or to refinance our debt obligations depends on our financial condition and operating performance, which is subject to prevailing economic and competitive conditions and to certain financial, business and other factors beyond our control. We may not be able to maintain a level of cash flows from operating activities sufficient to permit us to pay the principal, premium, if any, and interest on our indebtedness.
If our cash flows and capital resources are insufficient to fund our debt service obligations, we may be forced to reduce or delay investments and capital expenditures, or to sell assets, seek additional capital or restructure or refinance our indebtedness. Our ability to restructure or refinance our debt will depend on the condition of the capital markets and our financial condition at such time. Any refinancing of our debt could be at higher interest rates and may require us to comply with more onerous covenants, which could further restrict our business operations. The terms of existing or future debt instruments may restrict us from adopting some of these alternatives. In addition, any failure to make payments of interest and principal on our outstanding indebtedness on a timely basis would likely result in a reduction of our credit rating, which could harm our ability to incur additional indebtedness.
31
Table of Contents
Risks Related to this Offering
There is no existing public market for our common stock and an active, liquid trading market for our common stock may not develop.
There is no existing public market for our common stock. We cannot predict the extent to which investor interest in our company will lead to the development of an active trading market or how liquid that market may become. If an active trading market does not develop, you may have difficulty selling any of our shares that you purchase. The initial public offering price of our common stock will be determined by negotiations between us and the underwriters and may not be indicative of prices that will prevail following the completion of this offering. The market price of our common stock may decline below the initial public offering price, and you may not be able to resell your shares at, or above, the initial public offering price, or at all.
Future sales of our common stock or securities convertible into or exchangeable for common stock could depress the market price of our common stock.
We and all of our existing stockholders may sell additional shares of common stock in subsequent public offerings. We may also issue additional shares of common stock or convertible debt securities to finance future acquisitions. Sales of substantial amounts of our common stock in the public market, or the perception that such sales could occur, could adversely affect the market price of our common stock. This includes shares of common stock that we are selling in this offering, or shares if the underwriters exercise their option to purchase additional shares in full, which may be resold immediately in the public market. Our directors, executive officers and CCMP will be subject to the lock-up agreements described in “Underwriting” and are subject to the Rule 144 holding period requirements described in “Shares Eligible for Future Sale—Lock-Up Arrangements and Registration Rights.” After giving effect to this offering, we will have shares of common stock authorized and shares of common stock outstanding (or shares of common stock outstanding if the underwriters exercise their option to purchase additional shares in full). After this offering and upon expiration of the lock-up agreements, and after the holding period requirements of Rule 144 of the Securities Act of 1933, as amended (the “Securities Act”), have elapsed, approximately additional shares will be eligible for sale in the public market.
CCMP and certain of our other stockholders (and certain permitted transferees thereof) have registration rights with respect to the common stock they hold. These shares may be sold in the public market; however, the shares held by CCMP and certain other stockholders are subject to a 180-day lock-up period.
The underwriters may, in their sole discretion and without notice, release all or any portion of the shares subject to lock-up agreements prior to expiration of the lock-up period. Subject to the terms of the lock-up agreements, we also may issue our shares of common stock or securities convertible into our common stock from time to time in connection with a financing, acquisition, investments or otherwise. We cannot predict the size of future issuances of our common stock or the effect, if any, that future issuances and sales of our common stock will have on the market price of our common stock. Any such issuance could result in substantial dilution to our existing stockholders. Due to these factors, sales of a substantial number of shares of our common stock in the public market could occur at any time. Any decline in the price of shares of our common stock could impede our ability to raise capital through the issuance of additional shares of our common stock or other equity securities.
We will incur increased costs as a result of operating as a publicly traded company, and our management will be required to devote substantial time to new compliance initiatives.
As a publicly traded company, we will incur additional legal, accounting and other expenses that we do not currently incur as a private company. Although we are currently unable to estimate these costs with any degree of certainty, they may be material in amount. In addition, the Sarbanes-Oxley Act, the Dodd-Frank Act and the rules of the Securities and Exchange Commission (the “SEC”) and the NYSE or Nasdaq have imposed various requirements on public companies. Our management and other personnel will need to devote a
32
Table of Contents
substantial amount of time to these compliance initiatives, as well as to investor relations. Moreover, these rules and regulations will increase our legal and financial compliance costs and will make some activities more time-consuming and costly. For example, we expect these rules and regulations to make it more difficult and more expensive for us to obtain director and officer liability insurance, and we may be required to incur additional costs to maintain the same or similar coverage.
Furthermore, if we are not able to comply with the requirements of Section 404 of the Sarbanes-Oxley Act in a timely manner, the market price of our common stock could decline and we could be subject to potential delisting by the NYSE or Nasdaq and review by such exchange, the SEC, or other regulatory authorities, which would require the expenditure by us of additional financial and management resources. As a result, our stockholders could lose confidence in our financial reporting, which would harm our business and the market price of our common stock.
Our internal control over financial reporting does not currently meet the standards required by Section 404 of the Sarbanes-Oxley Act, and failure to achieve and maintain effective internal control over financial reporting in accordance with Section 404 of the Sarbanes-Oxley Act could have a material adverse effect on our business, financial condition and results of operations.
We do not currently document or test our compliance with internal control over financial reporting on a periodic basis in accordance with Section 404. Furthermore, due to our lack of documentation, such a test would not be possible to perform at this time.
We are in the early stages of addressing our internal control procedures to satisfy the requirements of Section 404 of the Sarbanes-Oxley Act, which requires that we must perform system and process evaluation and testing of our internal control over financial reporting to allow management and our independent registered public accounting firm to report on the effectiveness of our internal control over financial reporting, with auditor attestation of the effectiveness of our internal controls, beginning with our annual report on Form 10-K for the fiscal year ending December 31, 2016 if we then constitute an accelerated filer or large accelerated filer. If we are not able to implement the requirements of Section 404 in a timely manner or with adequate compliance, our independent registered public accounting firm may not be able to attest to the effectiveness of our internal control over financial reporting. If we are unable to maintain adequate internal control over financial reporting, we may be unable to report our financial information on a timely basis, may suffer adverse regulatory consequences or violations of applicable stock exchange listing rules and may breach the covenants under our credit facilities. There could also be a negative reaction in the financial markets due to a loss of investor confidence in us and the reliability of our financial statements.
In addition, we will incur additional costs in order to improve our internal control over financial reporting and comply with Section 404, including increased auditing and legal fees and costs associated with hiring additional accounting and administrative staff.
Our ability to successfully implement our business plan and comply with the Sarbanes-Oxley Act requires us to be able to prepare timely and accurate financial statements, among other requirements. Any delay in the implementation of, or disruption in the transition to, new or enhanced systems, procedures or controls, may cause our operations to suffer and we may be unable to conclude that our internal control over financial reporting is effective and to obtain an unqualified report on internal controls from our independent registered public accounting firm. Moreover, we cannot be certain that these measures would ensure that we implement and maintain adequate controls over our financial processes and reporting in the future. Even if we were to conclude, and our independent registered public accounting firm were to concur, that our internal control over financial reporting provided reasonable assurance regarding the reliability of financial reporting and the preparation of financial statements for external purposes in accordance with U.S. GAAP, because of its inherent limitations, internal control over financial reporting may not prevent or detect fraud or misstatements. This, in turn, could have an adverse impact on trading prices for our common stock.
33
Table of Contents
The price of our common stock may be volatile and you could lose all or part of your investment.
Securities markets worldwide have experienced, and are likely to continue to experience, significant price and volume fluctuations. This market volatility, as well as general economic, market or political conditions could reduce the market price of our common stock regardless of our results of operations. The trading price of our common stock is likely to be highly volatile and could be subject to wide price fluctuations in response to various factors, including, among other things, the risk factors described herein, and other factors beyond our control. Factors affecting the trading price of our common stock could include:
| • | market conditions in the broader stock market; |
| • | actual or anticipated variations in our quarterly and annual financial and operating results and in our prospects; |
| • | variations in financial and operating results and prospects of similar companies; |
| • | introduction of new services or strategic actions, such as acquisitions or restructurings, by us, our competitors or our customers; |
| • | issuance of new, negative or changed securities analysts’ reports or recommendations or estimates; |
| • | investor perceptions of us and the industries in which we or our customers operate; |
| • | sales, or anticipated sales, of our stock, including sales by existing stockholders, and the termination or expiration of lock-up agreements with our management and stockholders; |
| • | additions or departures of key personnel; |
| • | changes in accounting standards, policies, guidance, interpretations or principles; |
| • | legal, regulatory or political developments; |
| • | stock-based compensation expense under applicable accounting standards; |
| • | litigation and governmental investigations; and |
| • | changing economic conditions in the United States and globally. |
These and other factors may cause the market price and demand for shares of our common stock to fluctuate substantially, which may limit or prevent investors from readily selling their shares of common stock and may otherwise negatively affect the liquidity of our common stock. In addition, in the past, when the market price of a stock has been volatile, holders of that stock have sometimes instituted securities class action litigation against the Company that issued the stock. Securities litigation against us, regardless of the merits or outcome, could result in substantial costs and divert the time and attention of our management from our business, which could significantly harm our business, profitability and reputation.
We do not anticipate paying any dividends for the foreseeable future.
We do not intend in the foreseeable future to pay any dividends to holders of our common stock. We currently intend to retain our future earnings, if any, for the foreseeable future, to repay indebtedness and to support our general corporate purposes. Therefore, you are not likely to receive any dividends on your common stock for the foreseeable future, and the success of an investment in shares of our common stock will depend upon any future appreciation in their value. There is no guarantee that shares of our common stock will
34
Table of Contents
appreciate in value or even maintain the price at which our stockholders have purchased their shares. However, the payment of future dividends will be at the discretion of our board of directors (the “Board”), subject to applicable law, and will depend on, among other things, our earnings, financial condition, capital requirements, level of indebtedness, statutory and contractual restrictions apply to the payment of dividends and other considerations that our Board deems relevant. Our debt agreements limit the amounts available to us to pay cash dividends, and, to the extent that we require additional funding, sources may prohibit the payment of a dividend. See “Dividend Policy.” As a consequence of these limitations and restrictions, we may not be able to make, or may have to reduce or eliminate, the payment of dividends on our common stock.
If you purchase shares of common stock sold in this offering, you will incur immediate and substantial dilution.
The initial public offering price per share is substantially higher than the pro forma net tangible book value per share immediately after this offering. As a result, you will pay a price per share that substantially exceeds the book value of our assets after subtracting the book value of our liabilities. Based on our net tangible book value as of December 31, 2014 and assuming an offering price of $ per share, the midpoint of the range set forth on the cover page of this prospectus, you will incur immediate and substantial dilution in the amount of $ per share. See “Dilution.”
We are a holding company and rely on dividends and other payments, advances and transfers of funds from our subsidiaries to meet our obligations and pay any dividends.
We have no direct operations and no significant assets other than ownership of 100% of the capital stock of our subsidiaries. Because we conduct our operations through our subsidiaries, we depend on those entities for dividends and other payments to generate the funds necessary to meet our financial obligations, and to pay any dividends with respect to our common stock. Legal and contractual restrictions in our senior secured facilities, the Senior Unsecured Notes and the Senior Secured Notes and other agreements which may govern future indebtedness of our subsidiaries, as well as the financial condition and operating requirements of our subsidiaries, may limit our ability to obtain cash from our subsidiaries. The earnings from, or other available assets of, our subsidiaries might not be sufficient to pay dividends or make distributions or loans to enable us to pay any dividends on our common stock or other obligations. Any of the foregoing could materially and adversely affect our business, financial condition, results of operations and cash flows.
We are a “controlled company” within the meaning of the NYSE or Nasdaq rules and, as a result, we will qualify for, and intend to rely on, exemptions from certain corporate governance requirements. Our stockholders will not have the same protections afforded to stockholders of companies that are subject to such requirements.
Following this offering, CCMP will continue to control a majority of the voting power of our outstanding common stock. As a result, we are a “controlled company” within the meaning of the corporate governance standards of the NYSE or Nasdaq. Under these rules, a company of which more than 50% of the voting power is held by an individual, group or another company is a “controlled company” and may elect not to comply with certain corporate governance requirements, including:
| • | the requirement that a majority of our Board consist of independent directors; |
| • | the requirement that we have a nominating/corporate governance committee that is composed entirely of independent directors with a written charter addressing the committee’s purpose and responsibilities, or otherwise have director nominees selected by vote of a majority of the independent directors; |
35
Table of Contents
| • | the requirement that we have a compensation committee that is composed entirely of independent directors with a written charter addressing the committee’s purpose and responsibilities; and |
| • | the requirement for an annual performance evaluation of the nominating/corporate governance and compensation committees. |
Following this offering, we intend to utilize these exemptions. As a result, we will not have a majority of independent directors, our nominating and corporate governance committee and compensation committee will not consist entirely of independent directors and such committees will not be subject to annual performance evaluations. Additionally, we only are required to have one independent audit committee member upon the listing of our common stock on the NYSE or Nasdaq, a majority of independent audit committee members within 90 days from the date of listing and all independent audit committee members within one year from the date of listing. Accordingly, you will not have the same protections afforded to stockholders of companies that are subject to all of the corporate governance requirements of the NYSE or Nasdaq.
CCMP is not subject to any contractual obligation to retain its controlling interest, except that it has agreed, subject to certain exceptions, not to sell or otherwise dispose of any shares of our common stock or other capital stock or other securities exercisable or convertible therefor for a period of at least 180 days after the date of this prospectus without the prior written consent of the representatives of the underwriters in this offering. Except for this brief period, there may be a time during which CCMP will no longer maintain its ownership of our common stock following the offering. As a result, we may not always be able to avail ourselves of the “controlled company” exemptions.
CCMP will have a controlling interest in our company, and CCMP’s interests may be different from or conflict with those of our other stockholders.
As of December 31, 2014, CCMP owned 78.8% of our outstanding common stock on an actual basis and 70.0% on a fully diluted basis and is able to control our affairs in all cases. After the consummation of this offering, CCMP will collectively beneficially own % of our outstanding common stock, or % of our outstanding common stock if the underwriters fully exercise their option to purchase additional shares. As a consequence, CCMP will be able to exert a significant degree of influence or actual control over our management and affairs and will control matters requiring stockholder approval, including the election of directors, a merger, consolidation or sale of all or substantially all of our assets, and any other significant transaction. The interests of CCMP might not always coincide with our interests or the interests of our other stockholders. For instance, this concentration of ownership may have the effect of delaying or preventing a change in control of us otherwise favored by our other stockholders and could depress our stock price to the extent investors perceive disadvantages in owning stock of a company with a controlling stockholder.
In addition, we have historically paid CCMP a quarterly fee for certain advisory services pursuant to an advisory services and monitoring agreement. See “Certain Relationships and Related Person Transactions.” This agreement will terminate automatically upon the consummation of this offering.
CCMP makes investments in companies and may, from time to time, acquire and hold interests in businesses that compete directly or indirectly with us. CCMP may also pursue, for its own accounts, acquisition opportunities that may be complementary to our business, and as a result, those acquisition opportunities might not be available to us. Our organizational documents contain provisions renouncing any interest or expectancy held by our directors affiliated with CCMP in certain corporate opportunities. Accordingly, the interests of CCMP may supersede ours, causing CCMP or its affiliates to compete against us or to pursue opportunities instead of us, for which we have no recourse. Such actions on the part of CCMP and inaction on our part could have a material adverse effect on our business, financial condition, results of operations and cash flows.
36
Table of Contents
Upon the consummation of this offering, full-time investment professionals of CCMP will occupy three seats on our Board. Since CCMP could invest in entities that directly or indirectly compete with us, when conflicts arise between the interests of CCMP and the interests of our stockholders, these directors may not be disinterested.
Provisions of our corporate governance documents and Delaware law could make an acquisition of our company more difficult and may prevent attempts by our stockholders to replace or remove our current management, even if beneficial to our stockholders.
Provisions of our amended and restated certificate of incorporation and our amended and restated bylaws will contain provisions that delay, defer or discourage transactions involving an actual or potential change in control of us or change in our management that stockholders may consider favorable, including transactions in which you might otherwise receive a premium for your shares. These provisions could also limit the price that investors might be willing to pay in the future for shares of our common stock, thereby depressing the market price of our common stock. In addition, these provisions may frustrate or prevent any attempts by our stockholders to replace or remove our current management by making it more difficult for stockholders to replace members of our Board. Because our Board is responsible for appointing the members of our management team, these provisions could in turn affect any attempt to replace current members of our management team. Among others, these provisions include:
| • | our ability to issue preferred stock without stockholder approval; |
| • | a classified board of directors so not all directors are elected at one time; |
| • | the requirement that our stockholders may not act without a meeting; |
| • | requirements for advance notification of stockholder nominations and proposals contained in our bylaws; |
| • | the absence of cumulative voting for our directors; and |
| • | requirements for stockholder approval of certain business combinations. |
Additionally, Section 203 of the Delaware General Corporation Law (the “DGCL”) prohibits a publicly held Delaware corporation from engaging in a business combination with an interested stockholder, generally a person which together with its affiliates owns, or within the last three years has owned, 15% of our voting stock, for a period of which the person became an interested stockholder, unless the business combination is approved in a prescribed manner. The existence of the foregoing provision could also limit the price that investors might be willing to pay in the future for shares of our common stock, thereby depressing the market price of our common stock.
We have broad discretion in the use of the net proceeds from this offering and may not use them effectively.
Our management will have broad discretion in the application of the net proceeds from this offering, including for any of the purposes described in the section entitled “Use of Proceeds,” and you will not have the opportunity as part of your investment decision to assess whether the net proceeds are being used appropriately. Because of the number and variability of factors that will determine our use of the net proceeds from this offering, their ultimate use may vary substantially from their currently intended use. Our management might not apply our net proceeds in ways that ultimately increase the value of your investment. The failure by our management to apply these funds effectively could harm our business. Pending their use, we may invest the net proceeds from this offering in a manner that does not produce income or that loses value.
37
Table of Contents
If securities or industry analysts do not publish research or reports about our business, if they adversely change their recommendations regarding our stock or if our results of operations do not meet their expectations, our stock price and trading volume could decline.
The trading market for our common stock will be influenced by the research and reports that industry or securities analysts publish about us, our business or our industry. If one or more of these analysts cease coverage of our company or fail to publish reports on us regularly, we could lose visibility in the financial markets, which in turn could cause our stock price or trading volume to decline. Moreover, if one or more of the analysts who cover us downgrade our stock, or if our results of operations do not meet their expectations, our stock price could decline.
38
Table of Contents
CAUTIONARY NOTE REGARDING FORWARD-LOOKING STATEMENTS
This prospectus contains forward-looking statements that are subject to risks and uncertainties. All statements other than statements of historical fact or relating to present facts or current conditions included in this prospectus are forward-looking statements. Forward-looking statements give our current expectations and projections relating to our financial condition, results of operations, plans, objectives, future performance and business. You can identify forward-looking statements by the fact that they do not relate strictly to historical or current facts. These statements may include words such as “anticipate,” “estimate,” “expect,” “project,” “plan,” “intend,” “believe,” “may,” “should,” “can have,” “likely” and other words and terms of similar meaning in connection with any discussion of the timing or nature of future operating or financial performance or other events. Examples of forward-looking statements include, but are not limited to statements we make regarding (1) our belief that our cash and cash equivalents, cash flow from operations and borrowings under our ABL Facility and other foreign lines of credit will provide us adequate cash to fund the operating needs, working capital, capital expenditure, debt service and other requirements for our business for the foreseeable future; (2) estimated capital expenditures for future periods; and (3) estimated cost savings and opportunities to drive margin improvements.
The forward-looking statements contained in this prospectus are based on assumptions that we have made in light of our industry experience and our perceptions of historical trends, current conditions, expected future developments and other factors we believe are appropriate under the circumstances. As you read and consider this prospectus, you should understand that these statements are not guarantees of performance or results. They involve risks, uncertainties (many of which are beyond our control) and assumptions. Although we believe that these forward-looking statements are based on reasonable assumptions, you should be aware that many factors could affect our actual operating and financial performance and cause our performance to differ materially from the performance anticipated in the forward-looking statements, including the risks and uncertainties discussed in this prospectus under the headings “Risk Factors,” “Management Discussion and Analysis of Financial Condition and Results of Operations,” “Business,” and “Industry.” We believe these factors include, but are not limited to:
| • | demand for our products being significantly affected by general economic conditions; |
| • | any decline in the use of plastic; |
| • | the competitiveness of the industries in which we operate and the financial resources of our competitors; |
| • | our ability to successfully develop and implement strategic initiatives to increase cost savings and improve operating margins; |
| • | increases in our cost structure, including the cost of raw materials, components and parts and any disruption in our supply chain; |
| • | unfavorable international political, regulatory, labor and tax conditions; |
| • | the rate of economic development and growth in emerging markets; |
| • | our exposure to currency translation risk and currency transaction risk; |
| • | our ability to develop new products and respond to technological changes in our industry; |
| • | the effect of business disruptions, security threats and security breaches; |
| • | our ability to adequately protect our intellectual property and proprietary rights; |
39
Table of Contents
| • | our inability to convert backlog and open orders into revenue; |
| • | our inability to satisfy orders on a timely basis and maintain production at our facilities; |
| • | the failure of our products to perform and meet customer requirements or expectations; |
| • | potential responsibilities and costs under environmental laws; |
| • | work stoppages or unionization activities; |
| • | tax uncertainties and limits on our ability to use our net operating loss carryforwards; |
| • | downturns in the economy and disruptions in the financial and credit markets; |
| • | our ability to maintain and enhance our brand and reputation; |
| • | potential responsibilities and costs under anti-corruption statutes and U.S. regulations; |
| • | the catastrophic loss of one of our key manufacturing facilities; |
| • | our substantial indebtedness; |
| • | significant operating and financial restrictions under our credit agreements and indentures; |
| • | risks related to our capital structure and ownership; and |
| • | other factors that are described in “Risk Factors.” |
Should one or more of these risks or uncertainties materialize, or should any of these assumptions prove incorrect, our actual operating and financial performance may vary in material respects from the performance projected in these forward-looking statements. We caution you therefore against relying on these forward-looking statements.
Any forward-looking statement made by us in this prospectus speaks only as of the date on which we make it. Factors or events that could cause our actual operating and financial performance to differ may emerge from time to time, and it is not possible for us to predict all of them. We undertake no obligation to publicly update any forward-looking statement, whether as a result of new information, future developments or otherwise, except as may be required by law.
40
Table of Contents
We estimate that the net proceeds to us from our sale of shares of common stock in this offering will be approximately $ million, after deducting underwriting discounts and commissions and estimated expenses payable by us in connection with this offering. This assumes a public offering price of $ per share, which is the midpoint of the price range set forth on the cover of this prospectus.
We expect to use net proceeds from this offering for general corporate purposes, including the repayment of outstanding indebtedness.
A $1.00 increase (decrease) in the assumed initial public offering price of $ per share, the midpoint of the price range set forth on the cover of this prospectus, would increase (decrease) the net proceeds to us from this offering by $ million, assuming the number of shares offered by us, as set forth on the cover page of this prospectus, remains the same and after deducting underwriting discounts and commissions and estimated offering expenses payable by us.
The foregoing represents our current intentions with respect to the use and allocation of the net proceeds of this offering based upon our present plans and business conditions, but our management will have significant flexibility and discretion in applying the net proceeds. The occurrence of unforeseen events or changed business conditions could result in application of the net proceeds of this offering in a manner other than as described in this prospectus. See “Risk Factors—Risks Related to this Offering—We have broad discretion in the use of the net proceeds from this offering and may not use them effectively.”
41
Table of Contents
We do not intend to pay cash dividends on our common stock in the foreseeable future. We are a holding company that does not conduct any business operations of our own. As a result, our ability to pay cash dividends on our common stock is depended upon cash dividends and distributions and other transfers from our subsidiaries. The amounts available to us to pay cash dividends are restricted by our subsidiaries’ debt agreements. The declaration and payment of dividends also is subject to the discretion of our Board and depends on various factors, including our net earnings, financial condition, cash requirements, future prospects and other factors deemed relevant by our Board.
In addition, under Delaware law, our Board may declare dividends only to the extent of our surplus (which is defined as total assets at fair market value minus total liabilities, minus statutory capital) or, if there is no surplus, out of our net profits for the then current and/or immediately preceding fiscal year.
Any future determination to pay dividends will be at the discretion of our Board, and will take into account:
| • | restrictions in our debt instruments, including our senior secured credit facilities, our senior secured ABL facility, the indenture governing our Senior Secured Notes and the indenture governing our Senior Unsecured Notes; |
| • | general economic business conditions; |
| • | our financial condition, results of operations and cash flows; |
| • | the ability of our operating subsidiaries to pay dividends and make distributions to us; |
| • | legal restrictions; and |
| • | such other factors as our Board may deem relevant. |
See “Management’s Discussion and Analysis of Financial Condition and Results of Operations—Liquidity and Capital Resources” and “Description of Certain Indebtedness.”
42
Table of Contents
The following table sets forth our cash and cash equivalents and our capitalization as of December 31, 2014:
| • | on an actual basis; and |
| • | on an as adjusted basis to give effect to the sale of shares of our common stock in this offering and the application of the net proceeds received by us from this offering as described under “Use of Proceeds,” at an assumed initial public offering price of $ , which is the midpoint of the range set forth on the cover of this prospectus, and after deducting underwriting discounts and commissions and estimated offering expenses payable by us. |
This table should be read in conjunction with “Use of Proceeds,” “Selected Historical Financial Data of Milacron,” “Management’s Discussion and Analysis of Financial Condition and Results of Operations,” “Description of Capital Stock” and our financial statements and the related notes thereto included elsewhere in this prospectus.
| As of December 31, 2014 |
||||||||
| Actual |
As Adjusted(1) |
|||||||
| (in millions, except share data) | ||||||||
| Cash and cash equivalents |
$ | 81.5 | $ | |||||
|
|
|
|
|
|||||
| Total debt: |
||||||||
| ABL Facility(2) |
$ | — | $ | |||||
| Term Loan Facility, net of discount of $1.3 million(3) |
338.7 | |||||||
| Senior Secured Notes(4) |
220.0 | |||||||
| Senior Unsecured Notes(5) |
465.0 | |||||||
| Capital lease obligations and other |
1.7 | |||||||
| Other lines of credit(6) |
9.2 | |||||||
|
|
|
|
|
|||||
| Total long-term debt, including current portion |
1,034.6 | |||||||
|
|
|
|
|
|||||
| Equity: |
||||||||
| Preferred stock, $0.01 par value; 10,000 shares authorized, none issued and outstanding |
— | |||||||
| Common stock, $0.01 par value; 790,000 shares authorized; 491,873 issued and outstanding, actual; shares issued and outstanding, as adjusted |
— | |||||||
| Capital in excess of par value |
500.1 | |||||||
| Accumulated other comprehensive (loss) income |
(60.6 | ) | ||||||
| Retained deficit |
(54.1 | ) | ||||||
|
|
|
|
|
|||||
| Total stockholders’ equity |
385.4 | |||||||
|
|
|
|
|
|||||
| Total capitalization |
$ | 1,420.0 | $ | |||||
|
|
|
|
|
|||||
| (1) | Assuming the number of shares sold by us in this offering remains the same as set forth on the cover page, a $1.00 increase or decrease in the assumed initial public offering price would increase or decrease, as applicable, our total capitalization by approximately $ million. |
| (2) | Consists of a five-year $80.0 million U.S. revolving credit facility, the Canadian dollar equivalent of a $20.0 million Canadian revolving credit facility and the Euro dollar equivalent of a $25.0 million German revolving credit facility maturing in 2019. As of December 31, 2014, $14.9 million of undrawn letters of credit were outstanding. See “Description of Certain Indebtedness.” |
43
Table of Contents
| (3) | Consists of a seven-year $342.6 million term loan facility maturing in 2020. See “Description of Certain Indebtedness.” |
| (4) | Consists of $220.0 million of 8.375% Senior Secured Notes due 2019. See “Description of Certain Indebtedness.” |
| (5) | Consists of $465.0 million of 7.750% Senior Notes due 2021. See “Description of Certain Indebtedness.” |
| (6) | Consists of lines of credit used for working capital and to issue letters of credit and guarantees in the ordinary course of business. As of December 31, 2014, we had approximately $27.2 million of committed lines of credit with approximately $12.7 million of undrawn availability. See “Description of Certain Indebtedness.” |
44
Table of Contents
If you invest in our common stock, your interest will be diluted to the extent of the difference between the initial public offering price per share of common stock and the net tangible book value per share of our common stock upon the consummation of this offering. Dilution results from the fact that the per share offering price of our common stock is substantially in excess of the book value per share attributable to our existing stockholders.
Our net tangible book value as of December 31, 2014 would have been approximately $ , or $ per share, of our common stock. Net tangible book value represents the amount of total tangible assets less total liabilities and net tangible book value per share represents net tangible book value divided by the number of shares of common stock outstanding, in each case, after giving effect to this offering.
After giving effect to (i) the sale of shares of common stock in this offering at the assumed initial public offering price of $ per share (the midpoint of the range set forth on the cover of this prospectus) and (ii) the application of the net proceeds from this offering, our net tangible book value as of December 31, 2014 would have been $ , or $ per share. This represents an immediate increase in net tangible book value of $ per share to our existing stockholders and an immediate dilution in net tangible book value of $ per share to new investors in this offering.
The following table illustrates this dilution on a per share of common stock basis:
| Assumed initial public offering price per share |
$ | |||||||
| Net tangible book value per share as of December 31, 2014 |
$ | |||||||
| Increase in net tangible book value per share attributable to new investors in this offering |
||||||||
|
|
|
|||||||
| As adjusted net tangible book value per share after this offering |
||||||||
|
|
|
|||||||
| Dilution in net tangible book value per share to new investors in this offering |
$ | |||||||
|
|
|
A $1.00 increase (decrease) in the assumed initial public offering price of $ per share (the midpoint of the price range set forth on the cover page of this prospectus) would increase (decrease) our as adjusted net tangible book value after this offering by $ million and increase (decrease) the dilution per share to new investors purchasing in this offering by $ per share, assuming no other change to the number of shares of common stock offered by us as set forth on the cover page of this prospectus.
If the underwriters were to fully exercise their option to purchase additional shares of our common stock, the net tangible book value per share after this offering would be $ per share, and the dilution in net tangible book value per share to new investors in this offering would be $ per share.
The following table summarizes, on an as adjusted basis as of December 31, 2014 after giving effect to this offering, the total number of shares of common stock purchased from us, the total cash consideration paid to us and the average price per share paid by our existing stockholders and by new investors purchasing shares in this offering at an assumed initial public offering price of $ , which is the midpoint of the range set forth on the cover of this prospectus, and after deducting underwriting discounts and commissions and estimated expenses payable by us.
| Shares Purchased |
Total Consideration |
Average |
||||||||||||||||
| Number |
Percent |
Amount |
Percent |
|||||||||||||||
| Existing stockholders |
% | $ | % | $ | ||||||||||||||
| New investors in this offering |
$ | |||||||||||||||||
|
|
|
|
|
|
|
|
||||||||||||
| Total |
100 | % | $ | 100 | % | $ | ||||||||||||
|
|
|
|
|
|
|
|
|
|
||||||||||
45
Table of Contents
If the underwriters were to fully exercise their option to purchase additional shares of our common stock, the percentage of shares of our common stock held by existing stockholders would be %, and the percentage of shares of our common stock held by new investors in this offering would be %.
The above discussion and tables are based on the number of shares outstanding at December 31, 2014. In addition, we may choose to raise additional capital due to market conditions or strategic considerations even if we believe we have sufficient funds for our current or future operating plans. To the extent that additional capital is raised through the sale of equity or convertible debt securities, the issuance of such securities could result in further dilution to our stockholders. See “Description of Capital Stock.”
46
Table of Contents
We prepare our financial statements in conformity with U.S. GAAP. To supplement this information, we also use the following non-GAAP financial measures in this prospectus: Adjusted EBITDA and Adjusted Net Income. Adjusted EBITDA is a measure used by management to measure operating performance. Adjusted EBITDA is not a presentation made in accordance with U.S. GAAP, is not a measure of financial condition or profitability, and should not be considered as an alternative to net earnings (loss) determined in accordance with U.S. GAAP or operating cash flows determined in accordance with U.S. GAAP or any other performance measure derived in accordance with U.S. GAAP and should not be construed as an inference that our future results will be unaffected by unusual non-recurring items. Additionally, Adjusted EBITDA is not intended to be a measure of free cash flow for management’s discretionary use, as it does not include certain cash requirements such as interest payments, tax payments, debt service requirements and certain other cash costs that may recur in the future. Management uses Adjusted EBITDA or comparable metrics:
| • | as a measurement used in evaluating our consolidated and segment-level operating performance on a consistent basis; |
| • | to calculate incentive compensation for our employees; |
| • | for planning purposes, including the preparation of our internal annual operating budget; |
| • | to evaluate the performance and effectiveness of our operational strategies; and |
| • | to assess compliance with various metrics associated with our debt agreements. |
We believe that the inclusion of Adjusted EBITDA in this prospectus is useful to provide additional information to investors about certain material non-cash items. While we believe these financial measures are commonly used by investors to evaluate our performance and that of our competitors, because not all companies use identical calculations, this presentation of Adjusted EBITDA may not be comparable to other similarly titled measures of other companies and should not be considered as an alternative to performance measures derived in accordance with U.S. GAAP. Adjusted EBITDA is calculated as net earnings (loss) attributable to Milacron Holdings Corp. before income tax expense, interest expense, net, depreciation and amortization further adjusted to exclude unusual and other items reflected in the reconciliation table below.
In evaluating Adjusted EBITDA, you should be aware that in the future we will incur expenses such as those used in calculating Adjusted EBITDA. Our presentation of Adjusted EBITDA should not be construed as an inference that our future results will be unaffected by usual or non-recurring items.
Adjusted EBITDA has important limitations as an analytical tool and you should not consider it in isolation, or as a substitute for, analysis of our results as reported under U.S. GAAP. Some of these limitations are:
| • | it does not reflect our interest expense, or the cash requirements necessary to service interest or principal payments, on our debt; |
| • | it does not reflect our cash expenditures, or future requirements for capital expenditures or contractual commitments; |
| • | it does not reflect changes in, or cash requirements for, our working capital needs; |
| • | although depreciation and amortization are non-cash charges, the assets being depreciated and amortized will often have to be replaced in the future, and Adjusted EBITDA does not reflect the cash requirements for such replacements; |
| • | it does not reflect our income tax expense or the cash requirements to pay our taxes; |
| • | it does not reflect the non-cash component of our employee compensation; |
47
Table of Contents
| • | it does not reflect the impact of earnings or charges resulting from matters we consider not to be indicative of our ongoing operations, as discussed in our presentation of Adjusted EBITDA and “Management’s Discussion and Analysis of Financial Condition and Results of Operations” in this prospectus; and |
| • | other companies in our industry may calculate Adjusted EBITDA differently than we do, limiting its usefulness as comparative measures. |
Because of these limitations, Adjusted EBITDA should not be considered as a measure of discretionary cash available to us to invest in the growth of our business. We compensate for these limitations by relying primarily on our U.S. GAAP results and using Adjusted EBITDA only supplementally.
Adjusted Net Income measures our operating performance by adjusting net earnings (loss) attributable to Milacron Holdings Corp. to exclude amortization expense, non-cash currency effect on intercompany loan, organizational redesign costs, long-term equity options and shareholder fees, debt costs, acquisition integration costs, professional services, business combination costs, fair market value adjustments and certain other non-recurring items. Management uses this measure to evaluate our core operating results as it excludes certain items whose fluctuations from period-to-period do not necessarily correspond to changes in the core operations of the business, but includes certain items such as depreciation, interest expense and interest tax expense, which are otherwise excluded from Adjusted EBITDA. We believe the presentation of Adjusted Net Income enhances our investors’ overall understanding of the financial performance and cash flow of our business. You should not consider Adjusted Net Income as an alternative to net earnings (loss) attributable to Milacron Holdings Corp., determined in accordance with U.S. GAAP, as an indicator of operating performance.
See the consolidated financial statements included elsewhere in this prospectus for our U.S. GAAP results. Additionally, for reconciliations of Adjusted EBITDA and Adjusted Net Income to our closest reported U.S. GAAP measures see “Selected Historical Financial Data of Milacron.”
We also present Adjusted EBITDA and Adjusted Net Income for Mold-Masters for periods prior to the acquisition of Mold-Masters in 2013. These supplemental measures for Mold-Masters are subject to the limitations described above. You should not consider these measures as alternatives to net income earnings (loss) as determined in accordance with International Financial Reporting Standards as adopted by the European Union (“IFRS”). For reconciliations of Adjusted EBITDA and Adjusted Net Income to the closest reported IFRS measures see “Supplemental Financial Data of Mold-Masters.”
48
Table of Contents
SELECTED HISTORICAL FINANCIAL DATA OF MILACRON
The following table sets forth our selected historical financial and other data for the periods and as of the dates indicated. We derived our selected consolidated statements of operations data for the period from January 1, 2012 to April 30, 2012 (Predecessor), for the period from May 1, 2012 to December 31, 2012 (Successor) and for the years ended December 31, 2013 and 2014 (Successor) from our audited consolidated financial statements included elsewhere in this prospectus. We derived our selected consolidated statements of operations data for each of the fiscal years ended December 31, 2011 and December 31, 2010 (Predecessor) from our audited consolidated financial statements which are not included in this prospectus.
In April 2012, affiliates of CCMP, together with members of our management formed Milacron Holdings and, through Milacron Holdings, acquired all of the capital stock of Milacron Intermediate Holdings. Milacron in all periods prior to May 2012 is referred to as “Predecessor,” and in all periods including and after such date is referred to as “Successor.” As a result of acquisition accounting adjustments associated with the CCMP Acquisition, the consolidated financial statements for all Successor periods may not be comparable to those of the Predecessor period. In addition, our historical financial statements for the periods prior to the acquisition of Mold-Masters on March 28 2013 may not be comparable to our financial statements for periods following such acquisition.
Our historical results are not necessarily indicative of future operating results. You should read the information set forth below in conjunction with “Management’s Discussion and Analysis of Financial Condition and Results of Operations,” and our financial statements and the related notes thereto included elsewhere in this prospectus.
| Year ended |
Year ended |
Period from |
Period from May 1, 2012 to |
Year ended |
Year ended |
|||||||||||||||||||||||
| (Dollars in millions, except share and per share data) |
(Predecessor) | (Predecessor) | (Predecessor) | (Successor) | (Successor) | (Successor) | ||||||||||||||||||||||
| Statements of operations: |
||||||||||||||||||||||||||||
| Sales |
$ | 633.4 | $ | 783.2 | $ | 260.7 | $ | 571.7 | $ | 1,028.8 | $ | 1,211.3 | ||||||||||||||||
| Costs of sales |
450.9 | 548.5 | 181.5 | 423.3 | 689.1 | 792.3 | ||||||||||||||||||||||
|
|
|
|
|
|
|
|
|
|
|
|
|
|||||||||||||||||
| Manufacturing margins |
182.5 | 234.7 | 79.2 | 148.4 | 339.7 | 419.0 | ||||||||||||||||||||||
| Operating expenses: |
||||||||||||||||||||||||||||
| Selling, general and administrative expenses |
141.7 | 158.6 | 55.6 | 104.9 | 223.4 | 266.9 | ||||||||||||||||||||||
| Business combination costs |
— | — | 8.8 | 9.9 | 2.9 | 1.1 | ||||||||||||||||||||||
| Officer severance costs |
— | — | — | 6.2 | — | — | ||||||||||||||||||||||
| Amortization expense |
0.3 | 1.3 | 0.4 | 24.9 | 47.6 | 44.2 | ||||||||||||||||||||||
| (Gain) loss on currency translation |
— | — | (0.4 | ) | (0.1 | ) | 10.4 | 16.3 | ||||||||||||||||||||
| Other expense (income), net |
12.2 | (2.0 | ) | 0.4 | (0.6 | ) | 1.1 | 8.8 | ||||||||||||||||||||
|
|
|
|
|
|
|
|
|
|
|
|
|
|||||||||||||||||
| Total operating expenses |
154.2 | 157.9 | 64.8 | 145.2 | 285.4 | 337.3 | ||||||||||||||||||||||
|
|
|
|
|
|
|
|
|
|
|
|
|
|||||||||||||||||
| Operating earnings |
28.3 | 76.8 | 14.4 | 3.2 | 54.3 | 81.7 | ||||||||||||||||||||||
| Interest expense, net |
6.3 | 10.7 | 11.8 | 20.7 | 70.1 | 74.6 | ||||||||||||||||||||||
|
|
|
|
|
|
|
|
|
|
|
|
|
|||||||||||||||||
| Earnings (loss) before income taxes |
22.0 | 66.1 | 2.6 | (17.5 | ) | (15.8 | ) | 7.1 | ||||||||||||||||||||
| Income tax expense |
6.5 | 8.1 | 2.4 | 3.5 | 8.9 | 22.0 | ||||||||||||||||||||||
|
|
|
|
|
|
|
|
|
|
|
|
|
|||||||||||||||||
| Net earnings (loss) |
15.5 | 58.0 | 0.2 | (21.0 | ) | (24.7 | ) | (14.9 | ) | |||||||||||||||||||
|
|
|
|
|
|
|
|
|
|
|
|
|
|||||||||||||||||
| Less: Net loss (earnings) attributable to the noncontrolling interest |
(0.3 | ) | 0.2 | 0.1 | (0.2 | ) | 0.1 | 0.1 | ||||||||||||||||||||
|
|
|
|
|
|
|
|
|
|
|
|
|
|||||||||||||||||
| Net earnings (loss) attributable to Milacron Holdings Corp. |
$ | 15.2 | $ | 58.2 | $ | 0.3 | $ | (21.2 | ) | $ | (24.6 | ) | $ | (14.8 | ) | |||||||||||||
|
|
|
|
|
|
|
|
|
|
|
|
|
|||||||||||||||||
| Basic earnings (loss) per share(1) |
$ | 138.18 | $ | 624.30 | $ | 4.36 | $ | (107.95 | ) | $ | (58.40 | ) | $ | (30.14 | ) | |||||||||||||
| Diluted earnings (loss) per share(1) |
$ | 138.18 | $ | 594.87 | $ | 4.04 | $ | (107.95 | ) | $ | (58.40 | ) | $ | (30.14 | ) | |||||||||||||
| Weighted average shares outstanding: |
||||||||||||||||||||||||||||
| Basic |
110,000 | 93,224 | 68,877 | 196,387 | 421,200 | 490,965 | ||||||||||||||||||||||
| Diluted |
110,000 | 97,836 | 74,330 | 196,387 | 421,200 | 490,965 | ||||||||||||||||||||||
49
Table of Contents
| Year ended |
Year ended |
Period from |
Period from May 1, 2012 to |
Year ended |
Year ended |
|||||||||||||||||||||||
| (Dollars in millions, except share and per share data) |
(Predecessor) | (Predecessor) | (Predecessor) | (Successor) | (Successor) | (Successor) | ||||||||||||||||||||||
| Select segment and geographic data: |
||||||||||||||||||||||||||||
| Sales by segment: |
||||||||||||||||||||||||||||
| APPT |
$ | 424.5 | $ | 541.7 | $ | 177.9 | $ | 407.2 | $ | 580.1 | $ | 675.8 | ||||||||||||||||
| MDCS(2) |
99.2 | 112.4 | 38.9 | 76.1 | 320.5 | 406.7 | ||||||||||||||||||||||
| Fluids |
109.7 | 129.1 | 43.9 | 88.4 | 128.2 | 128.8 | ||||||||||||||||||||||
| Sales by geography: |
||||||||||||||||||||||||||||
| North America |
$ | 332.5 | $ | 420.1 | $ | 148.0 | $ | 343.6 | $ | 526.4 | $ | 628.5 | ||||||||||||||||
| Europe |
149.0 | 198.6 | 56.0 | 101.2 | 235.5 | 258.8 | ||||||||||||||||||||||
| Asia |
101.9 | 116.6 | 45.5 | 91.8 | 218.1 | 270.1 | ||||||||||||||||||||||
| Rest of World |
50.0 | 47.9 | 11.2 | 35.1 | 48.8 | 53.9 | ||||||||||||||||||||||
| Statements of cash flows data: |
||||||||||||||||||||||||||||
| Net cash provided by operating activities |
$ | 21.5 | $ | 26.2 | $ | 12.4 | $ | 8.1 | $ | 82.1 | $ | 37.6 | ||||||||||||||||
| Net cash used in investing activities |
(14.7 | ) | (16.4 | ) | (4.9 | ) | (210.3 | ) | (993.4 | ) | (94.3 | ) | ||||||||||||||||
| Net cash (used in) provided by financing activities |
(4.2 | ) | (10.2 | ) | (17.2 | ) | 55.2 | 964.8 | 41.2 | |||||||||||||||||||
| Balance sheet data: |
||||||||||||||||||||||||||||
| Cash and cash equivalents |
$ | 40.1 | $ | 39.7 | $ | 48.4 | $ | 100.7 | $ | 81.5 | ||||||||||||||||||
| Accounts receivable |
79.7 | 98.4 | 105.6 | 174.5 | 183.3 | |||||||||||||||||||||||
| Inventories, net |
124.2 | 165.4 | 165.3 | 207.4 | 238.1 | |||||||||||||||||||||||
| Property and equipment, net |
65.8 | 74.8 | 119.7 | 203.6 | 216.9 | |||||||||||||||||||||||
| Total assets |
354.1 | 424.7 | 672.3 | 1,794.2 | 1,790.7 | |||||||||||||||||||||||
| Accounts payable |
61.3 | 69.5 | 67.0 | 83.4 | 89.9 | |||||||||||||||||||||||
| Advanced billings and deposits |
34.0 | 47.7 | 29.2 | 56.2 | 58.5 | |||||||||||||||||||||||
| Total debt and capital lease obligations, including current portion |
67.2 | 147.9 | 284.8 | 989.4 | 1,034.6 | |||||||||||||||||||||||
| Select supplemental data: |
||||||||||||||||||||||||||||
| Adjusted EBITDA by segment(3): |
||||||||||||||||||||||||||||
| APPT |
$ | 32.5 | $ | 60.1 | $ | 15.1 | $ | 47.3 | $ | 62.6 | $ | 81.0 | ||||||||||||||||
| MDCS |
9.6 | 15.5 | 5.4 | 12.8 | 85.0 | 114.4 | ||||||||||||||||||||||
| Fluids |
17.4 | 21.8 | 6.9 | 18.7 | 23.5 | 23.8 | ||||||||||||||||||||||
| Corporate |
(14.1 | ) | (12.5 | ) | (2.9 | ) | (7.6 | ) | (9.5 | ) | (20.7 | ) | ||||||||||||||||
| Adjusted EBITDA(3) |
45.4 | 84.9 | 24.5 | 71.2 | 161.6 | 198.5 | ||||||||||||||||||||||
| Adjusted Net Income(3) |
26.9 | 59.8 | 8.1 | 34.7 | 57.0 | 74.5 | ||||||||||||||||||||||
| (1) | Basic and diluted earnings (loss) per share is computed by dividing the net earnings (loss) available to common stockholders by the weighted-average number of shares of common stock outstanding during the period. |
| (2) | MDCS includes sales from Mold-Masters beginning March 28, 2013. |
| (3) | We prepare our financial statements in conformity with U.S. GAAP. To supplement this information, we also use the following non-GAAP financial measures in this prospectus: Adjusted EBITDA and Adjusted Net Income. For a discussion of the non-GAAP financial measures in this prospectus, see “Non-GAAP Financial Measures.” |
50
Table of Contents
The following is a reconciliation of net earnings (loss) attributable to Milacron Holdings Corp., the most comparable U.S. GAAP measure, to Adjusted Net Income and to Adjusted EBITDA:
| Year ended |
Year ended |
Period from January 1, 2012 to April 30, 2012 |
Period from 2012 to |
Year ended |
Year ended |
|||||||||||||||||||||||
| (Predecessor) | (Predecessor) | (Predecessor) | (Successor) | (Successor) | (Successor) | |||||||||||||||||||||||
| Net earnings (loss) attributable to Milacron Holdings Corp. |
$ | 15.2 | $ | 58.2 | $ | 0.3 | $ | (21.2 | ) | $ | (24.6 | ) | $ | (14.8 | ) | |||||||||||||
| Amortization expense |
0.3 | 1.3 | 0.4 | 24.9 | 47.6 | 44.2 | ||||||||||||||||||||||
| Currency effect on intercompany advances(a) |
— | — | — | — | 10.0 | 13.8 | ||||||||||||||||||||||
| Organizational redesign costs(b) |
9.8 | 1.2 | — | 6.5 | 4.4 | 12.9 | ||||||||||||||||||||||
| Long-term equity options and shareholder’s fees(c) |
2.4 | 3.0 | 0.7 | 2.3 | 5.0 | 5.5 | ||||||||||||||||||||||
| Debt costs(d) |
— | — | — | — | 0.2 | 4.1 | ||||||||||||||||||||||
| Acquisition integration costs(e) |
— | — | — | — | 2.0 | 4.0 | ||||||||||||||||||||||
| Professional services(f) |
1.7 | 0.2 | — | 2.9 | 2.8 | 3.6 | ||||||||||||||||||||||
| Business combination costs(g) |
— | — | 8.8 | 9.9 | 2.9 | 1.1 | ||||||||||||||||||||||
| Fair market value adjustments(h) |
(2.5 | ) | (4.1 | ) | (2.2 | ) | 9.4 | 4.8 | — | |||||||||||||||||||
| Other(i) |
— | — | 0.1 | — | 1.9 | 0.1 | ||||||||||||||||||||||
|
|
|
|
|
|
|
|
|
|
|
|
|
|||||||||||||||||
| Adjusted Net Income |
26.9 | 59.8 | 8.1 | 34.7 | 57.0 | 74.5 | ||||||||||||||||||||||
| Income tax expense |
6.5 | 8.1 | 2.4 | 3.5 | 8.9 | 22.0 | ||||||||||||||||||||||
| Interest expense, net |
6.3 | 10.7 | 11.8 | 20.7 | 70.1 | 74.6 | ||||||||||||||||||||||
| Depreciation expense |
5.7 | 6.3 | 2.2 | 12.3 | 25.6 | 27.4 | ||||||||||||||||||||||
|
|
|
|
|
|
|
|
|
|
|
|
|
|||||||||||||||||
| Adjusted EBITDA |
$ | 45.4 | $ | 84.9 | $ | 24.5 | $ | 71.2 | $ | 161.6 | $ | 198.5 | ||||||||||||||||
|
|
|
|
|
|
|
|
|
|
|
|
|
|||||||||||||||||
| (a) | Non-cash currency effect on intercompany advances relates to advances in foreign currency exchange rates. The most significant exposure relates to the Canadian dollar pursuant to intercompany advances associated with the acquisition of Mold-Masters. |
| (b) | Organizational redesign costs in 2010, included $9.8 million of restructuring costs, including $8.7 million related to employee termination costs and $1.1 million of non-cash impairment charges related to two closed facilities. Organizational redesign costs in 2011 are primarily related to the Ferromatik Milacron Maschinenbau GmbH subsidiary and associated employee termination costs. Organizational redesign costs in 2012 primarily include restructuring expense related to CEO transition and severance costs of $6.2 million. Costs in 2013 and 2014 relate to salary and severance associated with a reduction of headcount as a result of company initiatives to transition processes to low-cost countries. Also included are facility shut down costs of $1.3 million and $1.9 million in 2013 and 2014, respectively. |
| (c) | Long-term equity options and shareholder’s fees include the non-cash charges associated with stock based compensation awards granted to certain executives and independent directors in the period from January 1, 2012 to April 30, 2012, the period from May 1, 2012 to December 31, 2012, 2013 and 2014 and a cash advisory fee paid to CCMP for all Successor periods. CCMP will not receive a cash advisory fee after this offering. |
| (d) | Debt costs in 2014 include a $2.9 million loss on the early extinguishment of a portion of our Senior Secured Notes. The loss consists of a $1.6 million premium paid for the early extinguishment and $1.3 million of previously deferred financing costs. We also incurred $0.7 million of fees to increase the term loan facility and expensed $0.5 million of previously deferred financing costs related to the term loan facility. |
| (e) | Acquisition integration costs incurred to fully integrate the acquisition of Mold-Masters, Kortec, TIRAD and certain other smaller acquisitions. Costs include travel, consulting services, restructuring associated with personnel changes and a branding study to integrate the acquired companies into Milacron. |
| (f) | Professional fees in 2011 include a gain from the sale of a vacant facility and other one-time items. Costs in 2013 include consulting services associated with a manufacturing efficiency project and business development projects. Costs in 2014 relate to certain advisory services associated with readiness initiatives for this offering and other business-related advisory services. |
| (g) | Business combination costs in the Predecessor Period 2012 include a $2.8 million non-cash charge related to the accelerated vesting of certain stock-based compensation associated with a change of control as a result of the CCMP Acquisition in April 2012 and $6.0 million of certain professional, audit, and other fees related to the transaction. Costs in the Successor Period 2012 include $9.9 million of certain professional, audit and other fees related to the CCMP Acquisition in April 2012. Costs in 2013 and 2014 relate to certain professional, audit and other fees related to the acquisitions of Mold-Masters, Kortec, TIRAD, and certain other smaller acquisitions. |
| (h) | Non-cash fair market value adjustments includes expenses related to purchase accounting fair market value adjustments to inventory for the CCMP Acquisition in April 2012, and the acquisition of Mold-Masters in 2013. |
| (i) | Other costs in 2013 include a charge of $1.6 million related to environmental remediation required for the disposition of a building associated with a European facility. |
51
Table of Contents
The following table provides a reconciliation of operating earnings, the most comparable U.S. GAAP measure, to Adjusted EBITDA for each of our segments.
| Year ended |
Year ended |
Period from April 30, |
Period
from |
Year ended |
Year ended |
|||||||||||||||||||||||
| (Predecessor) | (Predecessor) | (Predecessor) | (Successor) | (Successor) | (Successor) | |||||||||||||||||||||||
| Operating earnings: |
||||||||||||||||||||||||||||
| APPT |
$ | 17.4 | $ | 54.2 | $ | 13.2 | $ | 16.6 | $ | 34.1 | $ | 51.9 | ||||||||||||||||
| MDCS |
8.4 | 14.4 | 5.0 | 3.7 | 28.8 | 57.2 | ||||||||||||||||||||||
| Fluids |
15.9 | 20.0 | 6.3 | 9.6 | 12.4 | 13.5 | ||||||||||||||||||||||
| Corporate |
(13.4 | ) | (11.8 | ) | (10.1 | ) | (26.7 | ) | (21.0 | ) | (40.9 | ) | ||||||||||||||||
|
|
|
|
|
|
|
|
|
|
|
|
|
|||||||||||||||||
| Total operating earnings |
28.3 | 76.8 | 14.4 | 3.2 | 54.3 | 81.7 | ||||||||||||||||||||||
| Adjustments to operating earnings: |
||||||||||||||||||||||||||||
| APPT: |
||||||||||||||||||||||||||||
| Depreciation and amortization |
6.4 | 4.6 | 1.6 | 21.5 | 25.4 | 22.6 | ||||||||||||||||||||||
| Net earnings (loss) attributable to noncontrolling interest: |
(0.3 | ) | 0.2 | 0.1 | (0.2 | ) | 0.1 | 0.1 | ||||||||||||||||||||
| Fair market value adjustments(h) |
— | — | — | 7.0 | — | — | ||||||||||||||||||||||
| Organizational redesign costs(b) |
8.5 | 1.1 | — | — | 1.3 | 5.5 | ||||||||||||||||||||||
| Acquisition integration costs(e) |
— | — | — | — | — | 0.3 | ||||||||||||||||||||||
| Professional services(f) |
0.5 | — | 2.4 | 1.5 | 0.5 | |||||||||||||||||||||||
| Other(e) |
— | — | 0.2 | — | 0.2 | 0.1 | ||||||||||||||||||||||
|
|
|
|
|
|
|
|
|
|
|
|
|
|||||||||||||||||
| Total APPT Adjustments |
15.1 | 5.9 | 1.9 | 30.7 | 28.5 | 29.1 | ||||||||||||||||||||||
| MDCS Adjustments: |
||||||||||||||||||||||||||||
| Depreciation and amortization |
1.6 | 1.0 | 0.4 | 7.0 | 36.4 | 39.9 | ||||||||||||||||||||||
| Fair market value adjustments(h) |
— | — | — | 2.0 | 4.8 | — | ||||||||||||||||||||||
| Organizational redesign costs(b) |
(0.4 | ) | 0.1 | — | 0.1 | 2.0 | 1.7 | |||||||||||||||||||||
| Acquisition integration costs(e) |
— | — | — | — | 0.8 | 1.8 | ||||||||||||||||||||||
| Professional services(f) |
— | — | — | — | 0.5 | 0.3 | ||||||||||||||||||||||
| Other(i) |
— | — | — | — | 1.6 | — | ||||||||||||||||||||||
| Currency effect on intercompany advances(a) |
— | — | — | — | 10.1 | 13.5 | ||||||||||||||||||||||
|
|
|
|
|
|
|
|
|
|
|
|
|
|||||||||||||||||
| Total MDCS Adjustments |
1.2 | 1.1 | 0.4 | 9.1 | 56.2 | 57.2 | ||||||||||||||||||||||
| Fluids Adjustments: |
||||||||||||||||||||||||||||
| Depreciation and amortization |
1.4 | 1.8 | 0.6 | 8.6 | 11.1 | 8.9 | ||||||||||||||||||||||
| Fair market value adjustments(h) |
— | — | — | 0.4 | — | — | ||||||||||||||||||||||
| Other(i) |
— | — | — | — | — | — | ||||||||||||||||||||||
| Organizational redesign costs(b) |
0.1 | — | — | 0.1 | — | 1.4 | ||||||||||||||||||||||
|
|
|
|
|
|
|
|
|
|
|
|
|
|||||||||||||||||
| Total Fluids Adjustments |
1.5 | 1.8 | 0.6 | 9.1 | 11.1 | 10.3 | ||||||||||||||||||||||
| Corporate Adjustments: |
||||||||||||||||||||||||||||
| Depreciation and amortization |
(3.4 | ) | 0.2 | — | 0.1 | 0.3 | 0.2 | |||||||||||||||||||||
| Business combination costs(g) |
— | — | 8.8 | 9.9 | 2.9 | 1.1 | ||||||||||||||||||||||
| Fair market value adjustments(h) |
(2.5 | ) | (4.1 | ) | (2.2 | ) | — | — | — | |||||||||||||||||||
| Organizational redesign costs(b) |
1.6 | — | — | 6.3 | 1.1 | 4.3 | ||||||||||||||||||||||
52
Table of Contents
| Year ended |
Year ended |
Period from April 30, |
Period
from |
Year ended |
Year ended |
|||||||||||||||||||||||
| (Predecessor) | (Predecessor) | (Predecessor) | (Successor) | (Successor) | (Successor) | |||||||||||||||||||||||
| Acquisition integration |
— | — | — | — | 1.2 | 1.9 | ||||||||||||||||||||||
| Professional services(f) |
1.2 | 0.2 | — | 0.5 | 0.8 | 2.8 | ||||||||||||||||||||||
| Debt costs(d) |
— | — | — | — | 0.2 | 4.1 | ||||||||||||||||||||||
| Other(i) |
— | — | (0.1 | ) | — | 0.1 | — | |||||||||||||||||||||
| Long-term equity options and shareholder fees(c) |
2.4 | 3.0 | 0.7 | 2.3 | 5.0 | 5.5 | ||||||||||||||||||||||
| Currency effect on intercompany advances(a) |
— | — | — | — | (0.1 | ) | 0.3 | |||||||||||||||||||||
|
|
|
|
|
|
|
|
|
|
|
|
|
|||||||||||||||||
| Total Corporate Adjustments |
(0.7 | ) | (0.7 | ) | 7.2 | 19.1 | 11.5 | 20.2 | ||||||||||||||||||||
| Adjusted EBITDA: |
||||||||||||||||||||||||||||
| APPT |
32.5 | 60.1 | 15.1 | 47.3 | 62.6 | 81.0 | ||||||||||||||||||||||
| MDCS |
9.6 | 15.5 | 5.4 | 12.8 | 85.0 | 114.4 | ||||||||||||||||||||||
| Fluids |
17.4 | 21.8 | 6.9 | 18.7 | 23.5 | 23.8 | ||||||||||||||||||||||
| Corporate |
(14.1 | ) | (12.5 | ) | (2.9 | ) | (7.6 | ) | (9.5 | ) | (20.7 | ) | ||||||||||||||||
|
|
|
|
|
|
|
|
|
|
|
|
|
|||||||||||||||||
| Total Adjusted EBITDA |
$ | 45.4 | $ | 84.9 | $ | 24.5 | $ | 71.2 | $ | 161.6 | $ | 198.5 | ||||||||||||||||
|
|
|
|
|
|
|
|
|
|
|
|
|
|||||||||||||||||
| (a) | Non-cash currency effect on intercompany advances primarily relates to advances in foreign currency exchange rates within the MDCS segment. The most significant exposure relates to the Canadian dollar pursuant to intercompany advances associated with the acquisition of Mold-Masters. |
| (b) | Organizational redesign costs in 2012 primarily include restructuring expense related to CEO transition and severance costs of $6.2 million. Costs in 2013 and 2014 relate to salary and severance associated with a reduction of headcount as a result of company initiatives to transition processes to low-cost countries. Also included are facility shut down costs of $1.3 million and $1.9 million in 2013 and 2014, respectively. |
| (c) | Long-term equity options and shareholder’s fees in Corporate include the non-cash charges associated with stock based compensation awards granted to certain executives and independent directors in the period from January 1, 2012 to April 30, 2012, the period from May 1, 2012 to December 31, 2012, 2013 and 2014 and a cash advisory fee paid to CCMP for all Successor periods. CCMP will not receive a cash advisory fee after this offering. |
| (d) | Debt costs in Corporate in 2014 include a $2.9 million loss on the early extinguishment of a portion of our Senior Secured Notes. The loss consists of a $1.6 million premium paid for the early extinguishment and $1.3 million of previously deferred financing costs. We also incurred $0.7 million of fees to increase the term loan facility and expensed $0.5 million of previously deferred financing costs related to the term loan facility. |
| (e) | Acquisition integration costs incurred to fully integrate the acquisition of Mold-Masters, Kortec, TIRAD and certain other smaller acquisitions. Costs include travel, consulting services, restructuring associated with personnel changes and a branding study to integrate the acquired companies into Milacron. |
| (f) | Professional fees in 2013 include consulting services associated with a manufacturing efficiency project and costs incurred on certain business development projects. Costs in 2014 relate to certain advisory services associated with readiness initiatives for this offering, and one-time business-related advisory services. |
| (g) | Business combination costs in the Predecessor Period 2012 include a $2.8 million non-cash charge related to the accelerated vesting of certain stock-based compensation associated with a change of control as a result of the CCMP Acquisition in April 2012 and $6.0 million of certain professional, audit, and other fees related to the transaction. Costs in the Successor Period 2012 include $9.9 million of certain professional, audit and other fees related to the CCMP Acquisition in April 2012. Costs in 2013 and 2014 relate to certain professional, audit and other fees related to the acquisitions of Mold-Masters, Kortec, TIRAD, and certain other smaller acquisitions. |
| (h) | Non-cash fair market value adjustments includes expenses related to purchase accounting fair market value adjustments to inventory for the CCMP Acquisition in April 2012, and the acquisition of Mold-Masters in 2013. |
| (i) | Other costs within the MDCS segment in 2013 include a charge of $1.6 million related to environmental remediation required for the disposition of a building associated with a European facility. |
53
Table of Contents
SUPPLEMENTAL FINANCIAL DATA OF MOLD-MASTERS
The following tables set forth certain supplemental financial data as of and for the periods indicated for Mold-Masters. We are presenting the supplemental financial data below in order to provide a view of the longer-term trends of the results of operations of Milacron and Mold-Masters, before and after the acquisition of Mold-Masters in 2013. The consolidated statements of income data and other financial data for the years ended December 31, 2010, 2011 and 2012 and the period from January 1, 2013 to March 28, 2013 were derived from Mold-Masters’ consolidated financial statements not included in this prospectus. The financial statements of Mold-Masters were prepared in accordance with IFRS as adopted by the European Union and differences between U.S. GAAP and IFRS are not believed to be significant.
| Year ended (CAD) |
Year ended (CAD) |
Year ended (CAD) |
Year ended (USD)(1) |
Period from (CAD) |
Period from (USD)(1) |
|||||||||||||||||||
| (Dollars in millions) | ||||||||||||||||||||||||
| Statements of income: |
||||||||||||||||||||||||
| Sales |
$ | 203.6 | $ | 251.4 | $ | 271.2 | $ | 271.3 | $59.3 | $58.5 | ||||||||||||||
| Cost of sales |
100.5 | 124.2 | 134.5 | 134.6 | 28.0 | 27.6 | ||||||||||||||||||
|
|
|
|
|
|
|
|
|
|
|
|
|
|||||||||||||
| Gross profit |
103.1 | 127.2 | 136.7 | 136.7 | 31.3 | 30.9 | ||||||||||||||||||
| Other costs and expenses: |
||||||||||||||||||||||||
| Selling and distribution expenses |
21.7 | 23.7 | 26.7 | 26.7 | 5.3 | 5.2 | ||||||||||||||||||
| General and administrative expenses |
49.2 | 50.0 | 53.5 | 53.5 | 52.0 | 51.2 | ||||||||||||||||||
| Research and development |
6.7 | 8.1 | 8.3 | 8.3 | 2.2 | 2.2 | ||||||||||||||||||
| Other (income) loss |
(3.5 | ) | 7.9 | (4.6 | ) | (4.6 | ) | 3.2 | 3.2 | |||||||||||||||
|
|
|
|
|
|
|
|
|
|
|
|
|
|||||||||||||
| Total other costs and expenses |
74.1 | 89.7 | 83.9 | 83.9 | 62.7 | 61.8 | ||||||||||||||||||
|
|
|
|
|
|
|
|
|
|
|
|
|
|||||||||||||
| Operating earnings (loss) |
29.0 | 37.5 | 52.8 | 52.8 | (31.4 | ) | (30.9 | ) | ||||||||||||||||
| Interest expense, net |
15.6 | 10.3 | 11.5 | 11.5 | 5.5 | 5.4 | ||||||||||||||||||
|
|
|
|
|
|
|
|
|
|
|
|
|
|||||||||||||
| Income (loss) before income taxes |
13.4 | 27.2 | 41.3 | 41.3 | (36.9 | ) | (36.3 | ) | ||||||||||||||||
| Income tax expense |
5.7 | 6.1 | 13.6 | 13.6 | 2.4 | 2.4 | ||||||||||||||||||
|
|
|
|
|
|
|
|
|
|
|
|
|
|||||||||||||
| Net income earnings (loss) |
$ | 7.7 | $ | 21.1 | $ | 27.7 | $ | 27.7 | $ | (39.3 | ) | $ | (38.7 | ) | ||||||||||
|
|
|
|
|
|
|
|
|
|
|
|
|
|||||||||||||
| Statements of cash flow data: |
||||||||||||||||||||||||
| Net cash provided by operating activities |
$ | 40.8 | $ | 35.6 | $ | 48.3 | $ | 48.3 | $ | (7.7 | ) | $ | (7.6 | ) | ||||||||||
| Net cash used in investing activities |
(21.7 | ) | (14.3 | ) | (19.9 | ) | (19.9 | ) | (5.1 | ) | (5.0 | ) | ||||||||||||
| Net cash (used in) provided by financing activities |
(21.1 | ) | (14.6 | ) | (22.5 | ) | (22.5 | ) | — | — | ||||||||||||||
| Supplemental data: |
||||||||||||||||||||||||
| Adjusted Net Income(2) |
$ | 27.2 | $ | 44.4 | $ | 47.6 | $ | 47.6 | $ | 6.7 | $ | 7.0 | ||||||||||||
| Adjusted EBITDA(2) |
58.6 | 71.6 | 81.6 | 81.6 | 16.9 | 17.2 | ||||||||||||||||||
| (1) | Presented in U.S. dollars for convenience only. We have set forth in the table below, for the periods indicated, certain exchange rates between the U.S. dollar and the Canadian dollar. The source of the exchange rate is the H. 10 statistical release of the Federal Reserve Board. |
| USD$ per CAD$1.00 |
||||||||||||||||
| Period |
Period |
High |
Low |
Period |
||||||||||||
| Year ended December 31, 2012 |
1.000 | 1.029 | 0.960 | 1.004 | ||||||||||||
| Period from January 1, 2013 to March 27, 2013 |
0.986 | 1.016 | 0.971 | 0.983 | ||||||||||||
54
Table of Contents
| Mold-Masters’ statement of operations data for the year ended December 31, 2012 and for the period from January 1, 2013 to March 27, 2013 has been converted at the period average rate of USD$1.000/CAD$1.00 and USD$0.986/CAD$1.00, respectively. |
| (2) | The financial results of Mold-Masters are presented in accordance with IFRS as adopted by the European Union. To supplement this information, we also present the following financial measures for Mold-Masters: Adjusted EBITDA and Adjusted Net Income. For a discussion of and important limitations on these financial measures, see “Non-GAAP Financial Measures.” |
The following table provides a reconciliation of net earnings (loss), the most comparable IFRS measure, to Adjusted Net Income and to Adjusted EBITDA for the periods presented
| Year ended (CAD) |
Year ended (CAD) |
Year ended (CAD) |
Year ended (USD) |
Period from to March 27, 2013 (CAD) |
Period from to March 27, 2013 (USD) |
|||||||||||||||||||
| (Dollars in millions) | ||||||||||||||||||||||||
| Net income (loss) |
$ | 7.7 | $ | 21.1 | $ | 27.7 | $ | 27.7 | $ | (39.3 | ) | $ | (38.7 | ) | ||||||||||
| Amortization expense |
13.4 | 13.3 | 14.2 | 14.2 | 3.6 | 3.5 | ||||||||||||||||||
| Interest swap costs, foreign currency transaction and derivative adj(a) |
(3.0 | ) | 6.0 | (5.4 | ) | (5.4 | ) | 3.3 | 3.3 | |||||||||||||||
| Organizational redesign costs(b) |
4.1 | (0.2 | ) | 3.0 | 3.0 | 0.3 | 0.3 | |||||||||||||||||
| Long-term equity options and shareholder’s fees(c) |
1.6 | 3.0 | 2.2 | 2.2 | 1.2 | 1.2 | ||||||||||||||||||
| Acquisition integration costs(d) |
0.6 | — | 1.1 | 1.1 | 37.6 | 37.0 | ||||||||||||||||||
| Professional services(e) |
1.6 | 0.1 | 3.7 | 3.7 | — | — | ||||||||||||||||||
| Other(f) |
1.2 | 1.1 | 1.1 | 1.1 | — | — | ||||||||||||||||||
|
|
|
|
|
|
|
|
|
|
|
|
|
|||||||||||||
| Adjusted Net Income |
27.2 | 44.4 | 47.6 | 47.6 | 6.7 | 6.6 | ||||||||||||||||||
| Provision for income taxes |
5.7 | 6.1 | 13.6 | 13.6 | 2.4 | 2.4 | ||||||||||||||||||
| Interest expense, net |
15.6 | 10.3 | 11.5 | 11.5 | 5.5 | 5.4 | ||||||||||||||||||
| Depreciation expense |
10.1 | 10.8 | 8.9 | 8.9 | 2.3 | 2.3 | ||||||||||||||||||
|
|
|
|
|
|
|
|
|
|
|
|
|
|||||||||||||
| Adjusted EBITDA |
$ | 58.6 | $ | 71.6 | $ | 81.6 | $ | 81.6 | $ | 16.9 | $ | 16.7 | ||||||||||||
|
|
|
|
|
|
|
|
|
|
|
|
|
|||||||||||||
| (a) | Represents interest swap costs, foreign currency transaction and derivative adjustments, related to non-cash foreign exchange gains (losses) on revaluation of debt and mark-to-market gains (losses) on Mold-Masters’ hedge against currency movements to the Japanese yen as it relates to its exchange commitments, net of cash settlement costs. |
| (b) | Organizational redesign costs include costs related to certain reorganization initiatives and includes severance, advisory and other related costs. In 2012, costs were primarily to reorganize operations in Brazil and discontinue manifold and hot halve manufacturing at that location. In 2011, Brazil restructuring accruals were reduced, offset in part by reorganization costs related to Fused Metals Inc. In 2010, Mold-Masters incurred severance and lease termination costs. |
| (c) | Shareholder costs and non-cash stock based compensation include the non-cash charges associated with stock based compensation awards granted to certain executives and independent directors and also includes management advisory fees paid to the prior equity owner and interim chairman of Mold-Masters. |
| (d) | Acquisition integration costs in 2012 includes $0.5 million of professional and other fees related to merger and acquisitions, including the acquisition of the U.K. Controller division. In 2010, transaction related expenses were associated with the acquisition of ABBA systems. |
| (e) | Professional services represent costs for productivity, efficiency and other one-time projects and costs. In 2013, costs were primarily for professional fees, bonus payments and other costs associated with the sale of Mold-Masters to Milacron. In 2012, costs were primarily for professional and consulting fees including increasing shop floor efficiency, manufacturing batch size optimization and supply chain cost reductions. In 2010, costs were primarily related to professional and tax consulting fees related to the issuance of ordinary and preferred shares and to a working capital improvement project. |
| (f) | Other includes non-cash loss on disposal of fixed assets, non-cash costs related to write-off of abandoned patents and extraordinary cash costs related to certain marketing initiatives. |
55
Table of Contents
MANAGEMENT’S DISCUSSION AND ANALYSIS OF FINANCIAL CONDITION AND
RESULTS OF OPERATIONS
The following discussion and analysis of our financial condition and results of operations should be read together with “Selected Historical Financial Data of Milacron” and the consolidated financial statements and the related notes included elsewhere in this prospectus. This discussion contains forward-looking statements related to future events and our future financial performance that are based on our current expectations and subject to risks and uncertainties. Our actual results may differ materially from those anticipated by our forward-looking statements as a result of many factors, including those discussed in “Risk Factors,” “Cautionary Note Regarding Forward-Looking Statements” and elsewhere in this prospectus. This discussion covers periods prior to and after the March 27, 2013 close of business acquisition of Mold-Masters. The discussion and analysis of our pre-March 28, 2013 results of historical periods do not reflect the significant impact of the acquisition of Mold-Masters, including without limitation, increased leverage, the impact of purchase accounting and debt service requirements as described in the accompanying financial statements and notes.
Overview
We are a global leader in the manufacture, distribution, and service of highly engineered and customized systems within the plastic technology and processing industry. We serve this market through the following three segments:
| • | Advanced Plastic Processing Technologies (“APPT”); |
| • | Melt Delivery and Control Systems (“MDCS”); and |
| • | Fluid Technologies (“Fluids”). |
Our APPT segment designs, manufactures and sells plastic processing equipment and systems, which include injection molding, blow molding, extrusion and auxiliary systems along with the related parts and service, whereas our MDCS segment designs, manufactures and sells hot runner and process control systems, mold bases and components, and sells maintenance, repair and operating (“MRO”) supplies. Hot runner systems are custom designed for each product a customer manufactures on an injection molding machine. Our Fluids segment is a global manufacturer of synthetic and semi-synthetic lubricants and coolants.
We are the only global company with a full-line product portfolio that includes hot runner systems, injection molding, blow molding and extrusion equipment. We maintain strong market positions across these products as well as leading positions in process control systems, mold bases and components, MRO supplies and fluid technology.
Milacron has strong brand recognition with over 150 years of continuous operations. With products sold in over 100 countries across six continents, our established and market driven global footprint is well-positioned to benefit from continued robust industry growth in both developed and emerging markets. Our breadth of products, long history, and global reach have resulted in a large installed base of over 40,000 plastic processing machines and over 140,000 hot runner systems.
56
Table of Contents
Long-Standing, World Class Brands Supporting our Segments
| Brand |
Description |
Brand Since | ||

|
Traditionally associated with injection molding equipment, extrusion equipment, and related aftermarket parts and services. Currently, the Milacron brand name is used across all segments | 1860 | ||

|
Comprehensive line of plastic delivery and precision control systems for injection molding applications | 1963 | ||

|
Blow molding and structured foam equipment for a wide range of applications | 1962 | ||

|
Industrial fluids technology, including synthetic and semi-synthetic lubricants and coolants | 1945 | ||

|
Essential resource for mold technologies, including mold bases, mold components and MRO supplies | 1942 | ||

|
High precision custom mold plates, bases and components for injection molds and special machining | 1993 | ||

|
Designs, engineers, builds and sells injection molding equipment in Europe | 1973 | ||
Our strategy is designed to maximize revenue from consumable products across the life of a machine, while offering plastic technology solutions to a broad customer base. Management estimates that the value of available consumables revenue across the life of a machine is one to four times the cost of a machine. This strategy has shifted our revenue and earnings model to be more heavily weighted towards consumables, which comprise the majority of revenue from our plastic processing related APPT and MDCS segments on a combined basis for the years ended December 31, 2013 and 2014. The consumables portion of our APPT and MDCS segments consists of: (1) machine aftermarket parts and service which are required annually, (2) hot runner systems and mold bases which are required each time new plastic parts are designed and existing plastic parts are redesigned, and (3) upgrades and overhauls which occur as customers decide to improve the performance or extend the life of their machines. Upon a customer’s decision to replace a machine, we can repurchase the existing machine and sell it as a certified pre-owned machine. All of our sales in our Fluids segment are considered to be consumable and, when combined with our APPT and MDCS consumable product lines, consumables accounted for 61% of total 2014 sales, a percentage which we believe will increase as we capture more of our customers’ spend on consumable products through our lifecycle sales approach.
We have over 27,000 customers globally, made up of many blue-chip and Fortune 500 companies including OEMs, molders and mold-makers. Our customer base covers a wide range of end-market applications including packaging, automotive, medical, construction, consumer goods and electronics. Our sales are geographically diversified, with 52% in North America, 21% in Europe, 9% in China, 7% in India and 11% in the rest of the world for 2014.
Global population growth, coupled with continued urbanization, increased purchasing power and improved lifestyle in emerging markets has resulted in greater demand for a broad range of finished plastic products in many segments of the economy, including automotive, construction and consumer products. We believe that our strong global presence positions us well to capture a portion of this growth. Milacron has made
57
Table of Contents
significant investments in China and India in order to capitalize on the high projected growth rates of the plastic business in these markets. We plan to continue to expand our manufacturing capabilities while also increasing our technical, marketing and sales efforts. In Central and South America, Southeast Asia and Eastern Europe, we are building capabilities and working on creating new relationships to support this growth. We also continue to strategically reorganize our manufacturing base in order to shift resources to high growth geographic markets.
Recent Acquisitions
Milacron has broadened its portfolio significantly through a series of strategic acquisitions targeted to strengthen its product offering by expanding its consumable products line, improving product technology and enhancing manufacturing capabilities.
| ACQUISITION |
CLOSING DATE |
GEOGRAPHIES |
END MARKETS |
COMMENTARY | ||||

|
3/27/2013 | Global (MDCS) |
• Electronics • Medical • Personal Care • Housewares • Packaging • Global Vehicle |
• Leading hot-runner and process control systems manufacturer • Strengthens our market leadership in the plastic processing industry through technologically advanced products • Increases our sales from recurring consumable products • Geographical diversification into higher growth emerging markets • Provides a strong market position in a high-margin segment of the business
| ||||

|
2/28/2014 | Americas EMEA Asia (APPT) |
• Beverages • Foods • Closures |
• Global supplier of co-injection systems to the plastic and packaging industries • Systems are used throughout the world to produce high-barrier multi-layer containers featuring three-layer construction that optimize clarity and strength • Provides increased net sales from fully-integrated turn-key co-injection barrier systems, while leveraging equipment, hot-runner and other products
| ||||

|
4/30/2014 | Europe (MDCS) |
• Medical • Packaging • PET |
• Leading supplier of non-standardized mold bases to the injection molding industry, specializing in the production of high precision custom mold plates, bases, and components • Advanced facility is well known for high-end machining work • Allows expansion of offering of nonstandard mold bases to Europe and creates a center of excellence for precision machining in Eastern Europe
| ||||
In addition, Milacron purchased American Extrusion Services (“AES”) in December 2013 and Industrial Machine Sales and Precision Plastics Machinery (“IMSI”) in February 2014. AES offers efficient and effective extrusion machine and gearbox repair. This acquisition facilitates the unification, standardization and growth of the gearbox repair business across our APPT segment’s aftermarket business. IMSI specializes in the application engineering of primary plastic processing and support systems for many operations within our APPT segment,
58
Table of Contents
including injection molding, extrusion and blow molding, and the sale of auxiliaries. IMSI rebuilds and sells used machines to enable the launch of our certified pre-owned offering. These acquisitions strengthen our ability to support our customers through the entire life cycle of their equipment.
Key Drivers of our Businesses
Milacron’s strategy is focused on growing revenue and operating profits through selective initiatives that leverage our market position, geographic footprint and core competencies. Management expects, in the near term, profitability will be driven by both revenue growth and margin expansion. Management expects that revenue growth will come from underlying market growth in our key segments, geographic expansion of certain product lines, and incremental share gain from new products. New products are focused on solidifying our current market position, expanding our addressable market and expanding the market through the introduction of technology that displaces other materials, primarily metal and glass. Operating margin expansion is expected to result from active cost reduction initiatives focused on leveraging our geographic footprint that will allow us to consolidate manufacturing capacity, sales offices and call centers on a regional basis, and shift certain back-office functions from a decentralized local structure to a low-cost country global shared service center model.
Cost Reduction Initiatives
Milacron’s organizational redesign and cost reduction initiatives are in the process of being implemented and are expected to yield approximately $30.0 million of run-rate annual cost savings by the end of 2017. In 2014, Milacron incurred approximately $10.0 million of one-time costs related to these projects that could not be capitalized under U.S. GAAP and expects to incur approximately $24.0 million of additional costs related to these projects in 2015. See “Risk Factors—Risks Related to our Business and Industry—Our results also depend on the successful implementation of several additional strategic initiatives. We may not be able to implement these strategies successfully, on a timely basis, or at all.”
Advanced Plastic Processing Technologies
The key factors affecting our APPT segment results include demand for plastic processing machinery, capacity and capital investment, raw material inputs and cost structure.
Demand. Increased demand in the plastic processing machinery industry is expected to be driven by the overall expected rise in plastic processing, increasing equipment age and continuing advances in technology, such as the shift to higher-end equipment as plastic processors seek to reduce their operating costs and produce higher quality products.
Capacity and Capital Investment. Our capital expenditures in our APPT business increased from $15.4 million in 2013 to $22.9 million in 2014. Over $10 million, or approximately 44%, of our total capital spend for this business in 2014 was related to capacity expansion for the production of plastic processing equipment.
Raw Material Inputs. In order to secure our supply needs, we have developed a global network of reliable, low-cost suppliers. We sourced approximately 24% of our components and materials from suppliers located in low cost countries in 2014 and are working toward increasing this percentage. We source certain components from third-party suppliers and continually review our costs to determine whether to outsource. Prior to sourcing from third-party suppliers, we evaluate the supplier’s management capabilities and, where necessary, product quality and performance. Steel, which we source both directly and indirectly through our component suppliers, is the primary material used in our products and represented approximately 32% of total material costs in 2014 globally. We do not enter into derivative financial instruments to hedge our commodity price risk and currently do not have a significant number of long-term supply contracts with key suppliers. We estimate that approximately $8 million to $10 million of annual run-rate cost-savings will be realized by the end of 2015 from ongoing low cost country sourcing initiatives and other third-party supplier cost reduction projects.
59
Table of Contents
Cost Structure. Management continues to focus on optimizing our global manufacturing and back-office infrastructure to maximize operating efficiencies and minimize fixed cost structure.
Melt Delivery and Control Systems
The key factors affecting our MDCS segment results include demand for hot runner systems and hot halves, capacity and capital investment, raw material inputs and cost structure.
Demand. Consistent with historical periods, according to Interconnection Consulting, the hot runner market is expected to grow faster than the overall global economy based on macro-economic drivers involving product life cycles, demographics, technology conversion and greater use of plastic. Demand within the hot runner market is driven more by the frequency of product design changes and model refreshes than by end product volume, because hot runner systems are typically custom ordered for each new product mold, representing a critical factor in the market’s resiliency during economic cycles.
Capacity and Capital Investment. Capital expenditures in our MDCS segment increased from $11.7 million in 2013 to $15.8 million in 2014. Approximately $6.0 million of capital spending in 2014 was related to capacity expansion for the production of hot runner systems and related products; specifically, increased manifold and component production in Asia in addition to incremental component capacity in North America. As a result of, and to date since the acquisition of Mold-Masters, Milacron has realized total savings of approximately $8.4 million through multiple synergy initiatives including the in-sourcing of custom mold bases, the in-sourcing of hot runner machining work at Mold-Masters’ facilities in regions that were previously supplied by third-party vendors, elimination of redundant headcount, and reduction in other general and administrative expenses. On a go forward basis, we expect annual run-rate savings in excess of $7.0 million.
Raw Material Inputs. Steel is the primary raw material input for our MDCS segment. Although long-term contracts with steel suppliers are not typical, our business has purchase order commitments for a portion of our annual spend of higher-volume grades of steel. These purchase orders extend an average of three to six months, with prices negotiated annually. This allows us to forecast our costs in the MDCS segment and, given the short lead time between the initial request for a quotation and the finalized design, we have historically been able to pass along price changes, accordingly.
Cost Structure. Our MDCS business is focused on controlling its cost structure by increasing low cost country sourcing in addition to establishing comprehensive operations in India for applications engineering and the consolidation of several back office support functions within our shared services center.
Fluid Technologies
The key factors affecting our Fluids segment results include demand for metalworking fluids, capacity and capital investment and raw material inputs.
Demand. Demand for industrial fluids is closely tied to demand for metal products, which are produced on metalworking machinery through cutting, stamping and other processes. As industrial production and demand for metalworking machinery grows, manufacturers will require increased amounts of high-quality coolants, lubricants and cleaners to maximize productivity and extend the life of equipment and tooling. Market trends indicate higher technology fluids demand due to environmental and health concerns and as more exotic metals become more prevalent.
Capacity and Capital Investment. We believe we are able to leverage our core technologies in higher growth regions with minimal capital investment. As of December 31, 2014, our net sales of our Fluids segment in Asia have increased 196.1% since 2007. Global capital spending for our Fluids segment was $1.8 million for the
60
Table of Contents
year ended December 31, 2014 and $2.1 million for the year ended December 31, 2013. Capital investment was made in 2012 to triple capacity at our China facility to meet the growing demand for our premium metalworking fluids in the region, primarily from the automotive, aerospace and electronics end markets. We believe our focus on expanding our Fluids segment will ultimately drive higher overall sales growth and improved margins, particularly as it comprises a greater proportion of our total sales.
Raw Material Inputs. Many of the raw materials in our industrial fluids are derivatives of petroleum or natural gas. As a result, fluctuations in commodity-based pricing may impact the cost of these materials. We manage the impact of raw material cost increases through sales pricing adjustments, but we may be impacted by a delay in implementing these adjustments throughout our distribution network. In addition, due to the specialty nature of our products, some of our raw materials have few sources, and we may be impacted by disruptions to supply. Where possible, we seek alternative sources and, in some situations, we are able to reformulate product with alternative materials without impacting performance, environmental, or health and safety features.
New Orders and Backlog
New orders represent the value of incoming purchase orders received for a period of time that may or may not have been shipped during the period. New orders are counted once we verify acceptance of price and terms and verify the credit history and references. New orders in 2014 were $1,230.4 million, an increase of $154.4 million, or 14.3%, compared to $1,076.0 million in 2013. The increase in new orders includes strong growth in our APPT North American equipment and aftermarket businesses as well as growth in our MDCS European mold-component and Fluids businesses. Growth includes $25.2 million of new orders associated with businesses acquired during 2014. Unfavorable foreign currency translation effects decreased new orders by $11.8 million when compared to average exchange rates in 2013.
Backlog represents the value of unfilled orders as of the applicable date. These unfilled orders are supported by a valid purchase order and price, terms and credit have been approved by us. Our backlog of unfilled orders at December 31, 2014 was $227.9 million, an increase of $26.8 million, or 13.3%, compared to $201.1 million at December 31, 2013. Growth in our backlog reflects higher levels of capital and consumable spending within our customer base. All of our backlog is expected to be filled within the current fiscal year and there are no seasonal or other aspects of the backlog that would impact filling the orders.
Backlog of confirmed orders for equipment within the APPT business is tracked on a monthly basis. Lead times can vary significantly depending on the type and size of machine. Backlog within our MDCS businesses is relatively stable, as mold bases and hot runner systems have a short lead time from receipt of order to shipment with a global average of six to eight weeks; whereas spare parts sales of standard products are typically in stock and shipped with very little lead time. Backlog is adjusted on a monthly basis for currency fluctuations, which may be material. We do not track backlog in our Fluids segment as most orders are filled with minimal lead time.
Description of Key Line Items
Sales
We generate our sales primarily from the sale of plastic processing equipment, hot runner systems, mold assemblies, process control systems, mold bases and components, maintenance, repair and operating supplies, aftermarket services and parts, and industrial fluids. Sales are recorded net of volume discounts and rebates and are recognized when persuasive evidence of an arrangement exists, legal title has passed and the risks and rewards of ownership are transferred, the sales price is fixed and determinable, all significant contractual obligations have been satisfied and collectability of the sales price is reasonably assured.
61
Table of Contents
We offer volume discounts and rebates to certain customers and distributors which are reported as a reduction to sales revenue. Due to our international operations a significant portion of our sales are incurred in foreign currencies.
Cost of Sales
Cost of sales includes direct and indirect costs to manufacture, procure and ship products sold and recognized as sales revenue. Cost of sales primarily relates to materials used in the manufacturing process, engineering and manufacturing labor, and manufacturing, warehousing, delivery and facility costs. The principal methods of determining parts and material costs are average or standard costs, which approximate the first-in, first-out method. Due to our international operations a significant portion of our cost of goods sold is incurred in foreign currencies.
Selling, General and Administrative Expenses
Selling, general and administrative (“SG&A”) expenses consist of salaries and benefits for our sales, marketing, management and administrative personnel, professional fees, expenses relating to certain IT systems and bonuses and share-based compensation. After the consummation of this offering we expect to incur additional legal, accounting and other expenses in connection with being a public company. We also expect to see an increase in our stock-based compensation expense with the establishment of a new equity plan.
Loss (Gain) on Currency Translation
As a global business, we are exposed to changes in foreign currency exchange rates. Our most significant exposure relates to the Canadian dollar from an intercompany advance associated with the acquisition of Mold-Masters. We are also exposed to foreign currency exchange rate risk where we purchase supplies or sell products in currencies other than our local operations’ functional currency.
Other Expense, Net
Other expense, net relates primarily to losses of $2.9 million on the early extinguishment of debt pursuant to the 2014 redemption of a portion of our Senior Secured Notes.
Business Combination Costs
Business combination costs include primarily legal fees and advisory services incurred in conjunction with our acquisitions. Acquisition related costs are expensed as incurred.
Income Tax Expense
Income tax expense consists of federal, state and local taxes based on income in multiple jurisdictions. Our income tax expense is impacted by the pre-tax earnings in jurisdictions with varying tax rates and any related foreign tax credits that may be available to us. Our current and future provision for income taxes will vary from statutory rates due to the impact of valuation allowances in certain countries, income tax incentives, certain non-deductible expenses, withholding taxes and other discrete items. Furthermore, as a result of the CCMP Acquisition in 2012 and other acquisitions since 2012, we have significant book and tax accounting differences which impact the amount of deferred taxes.
62
Table of Contents
Results of Operations
Comparison of the Years Ended December 31, 2014 and 2013
The following table sets forth certain financial information for the years ended December 31, 2014 and 2013, and should be read in conjunction with our historical audited financial statements and the notes thereto included elsewhere in this prospectus. Our historical results of operations set forth below and elsewhere may not reflect what will occur in the future.
| (Dollars in millions) | Year ended |
Year ended |
||||||
| Sales |
$ | 1,028.8 | $ | 1,211.3 | ||||
| Cost of sales |
689.1 | 792.3 | ||||||
|
|
|
|
|
|||||
| Manufacturing margins |
339.7 | 419.0 | ||||||
| Operating expenses: |
||||||||
| Selling, general and administrative expenses |
223.4 | 266.9 | ||||||
| Business combination costs |
2.9 | 1.1 | ||||||
| Amortization expense |
47.6 | 44.2 | ||||||
| Loss on currency translation |
10.4 | 16.3 | ||||||
| Other expense, net |
1.1 | 8.8 | ||||||
|
|
|
|
|
|||||
| Total operating expenses |
285.4 | 337.3 | ||||||
|
|
|
|
|
|||||
| Operating earnings |
54.3 | 81.7 | ||||||
| Interest expense, net |
70.1 | 74.6 | ||||||
|
|
|
|
|
|||||
| (Loss) earnings before income taxes |
(15.8 | ) | 7.1 | |||||
| Income tax expense |
8.9 | 22.0 | ||||||
|
|
|
|
|
|||||
| Net loss |
(24.7 | ) | (14.9 | ) | ||||
| Less: Net loss attributable to the noncontrolling interest |
0.1 | 0.1 | ||||||
|
|
|
|
|
|||||
| Net loss attributable to Milacron Holdings Corp. |
$ | (24.6 | ) | $ | (14.8 | ) | ||
|
|
|
|
|
|||||
Sales
Sales for the year ended December 31, 2014 were $1,211.3 million compared to $1,028.8 million for the year ended December 31, 2013, an increase of $182.5 million, or 17.7%. Sales in 2014 benefited from an incremental $87.5 million related to a full year effect of prior year acquisitions, in addition to market growth in our North American and Indian equipment businesses, primarily the automotive end market segment. Additionally, sales benefited from increased volume within our APPT segment and $31.2 million of sales related to businesses acquired during 2014. Unfavorable foreign currency translation effects reduced sales by $12.2 million compared to average exchange rates for 2013.
The following table sets forth our sales by segment for the periods presented:
| (Dollars in millions) | Year ended |
Year ended |
||||||
| Sales by segment: |
||||||||
| Advanced Plastic Processing Technologies |
$ | 580.1 | $ | 675.8 | ||||
| Melt Delivery and Control Systems |
320.5 | 406.7 | ||||||
| Fluid Technologies |
128.2 | 128.8 | ||||||
|
|
|
|
|
|||||
| Total |
$ | 1,028.8 | $ | 1,211.3 | ||||
|
|
|
|
|
|||||
63
Table of Contents
Sales for our APPT segment for the year ended December 31, 2014 were $675.8 million, compared to $580.1 million for the year ended December 31, 2013, an increase of $95.7 million, or 16.5%. Sales in 2014 benefited from market growth in North America through increased sales in the automotive and appliances/housewares end markets, market growth in Indian equipment businesses and $23.4 million of sales related to businesses acquired in 2014. Sales in our European equipment business decreased slightly. Unfavorable foreign currency translation effects decreased sales by $4.6 million compared to average exchange rates 2013.
Sales for our MDCS segment for the year ended December 31, 2014 were $406.7 million compared to $320.5 million for the year ended December 31, 2013, an increase of $86.2 million, or 26.9%. Sales in 2014 include a full year effect of prior year acquisitions and $7.8 million related to partial year impact of recent acquisitions. Unfavorable foreign currency translation effects decreased sales by $7.1 million compared to average exchange rates for 2013. In 2014, MDCS recognized increases in sales from both new products, including E-Multi and Fusion for the automotive market, in addition to sales growth from geographic expansion, particularly India and North America.
Sales for our Fluids segment for the year ended December 31, 2014 were $128.8 million, compared to $128.2 million for the year ended December 31, 2013, an increase of $0.6 million, or 0.5%. Sales growth was primarily in our European business partially offset by a decrease in the North American business from 2013. Unfavorable foreign currency translation effects decreased sales by $0.5 million compared to average exchange rates 2013.
Cost of Sales
Cost of sales for the year ended December 31, 2014 was $792.3 million compared to $689.1 million for the year ended December 31, 2013, an increase of $103.2 million, or 15%, primarily due to increased sales volumes.
Manufacturing Margin
Our manufacturing margin (or gross margin) for the year ended December 31, 2014 was $419.0 million compared to $339.7 million for the year ended December 31, 2013, an increase of $79.3 million or 23.3%. The manufacturing margin in 2014 reflects an incremental $56.2 million related to the full year effect of prior year acquisitions in addition to the effect of higher sale volumes, material cost savings and efficiency savings partially offset by competitive pricing pressure, some higher manufacturing-related costs and the effect of foreign currency translation.
The manufacturing margin as a percent of sales for the year ended December 31, 2014 was 34.6% compared to 33.0% for the year ended December 31, 2013. The change was due to material cost savings, higher manufacturing capacity utilization, and a full year effect of higher margin sales. These improvements were partially offset by the impact of mix in our sales portfolio as APPT sales increased over the same period from the prior year and carry a lower margin. Additionally, margins were negatively impacted by competitive pricing pressures on sales, higher manufacturing-related costs and foreign currency translation.
Selling, General and Administrative Expenses
Selling, general and administrative expenses for the year ended December 31, 2014 were $266.9 million compared to $223.4 million for the year ended December 31, 2013, an increase of $43.5 million or 19.5%. The increase is primarily driven by an incremental $20.5 million related to the full year effect of prior year acquisitions, along with higher variable sales expenses related to sales growth, higher costs related to investments in our sales and service capabilities, the development of our global sourcing, human resource and executive management teams and other costs incurred related to preparing for this offering and organizational redesign.
64
Table of Contents
Business Combination Costs
Business combination costs for the year ended December 31, 2014 were $1.1 million compared to $2.9 million for the year ended December 31, 2013, net of a $2.2 million gain on a foreign currency hedge related to the acquisition of Mold-Masters, a decrease of $1.8 million or 62.1%. Acquisition related costs are expensed as incurred.
Amortization Expense
Amortization expense related to intangible assets for the year ended December 31, 2014 was $44.2 million compared to $47.6 million for the year ended December 31, 2013, a decrease of $3.4 million or 7.1%. While amortization expense includes a full year of amortization on the intangible assets related to the acquisition of Mold-Masters and the partial year effect for other acquisitions completed in 2014, the increase is offset by favorable foreign currency translation effects.
Loss on Currency Translation
Loss on currency translation for the year ended December 31, 2014 was $16.3 million compared to $10.4 million for the year ended December 31, 2013, an increase of $5.9 million or 56.7%. The losses primarily relate to the translation impact on intercompany advances related to the Canadian dollar associated with the acquisition of Mold-Masters. We are also exposed where we purchase supplies or sell products in currencies other than our local operation’s functional currency.
Other Expense, Net
Other expense for the year ended December 31, 2014 was $8.8 million compared to expense of $1.1 million for the year ended December 31, 2013, an increase of $7.7 million, or 700.0%. The increase was primarily driven by $2.9 million of losses on the early extinguishment of debt pursuant to paying down a portion of our Senior Secured Notes.
Operating Earnings
Operating earnings for the year ended December 31, 2014 were $81.7 million compared to $54.3 million for the year ended December 31, 2013, an increase of $27.4 million or 50.5%. The increase partially is attributable to the inclusion of the results of prior year acquisitions, in addition to margin improvements related to higher sale volumes, material cost savings and lower business combination expenses. These improvements were offset in part by increased variable sales expense, debt extinguishment losses, and investments in sales and service capabilities and in our global leadership team, higher manufacturing-related expenses and acquisition integration activities.
Interest Expense, Net
Interest expense, net of interest income, for the year ended December 31, 2014 was $74.6 million compared to $70.1 million for the year ended December 31, 2013, an increase of $4.5 million or 6.4%. The increase was primarily due to a full year’s effect of the incremental incurred debt in connection with the acquisition of Mold-Masters. The effect of increasing our senior secured term loan facility due 2020 and paying down a portion of our Senior Secured Notes was not material.
Income Tax Expense
Income tax expense for the year ended December 31, 2014 was $22.0 million compared to $8.9 million for the year ended December 31, 2013, an increase of $13.1 million, or 147.2%. Income tax expense for both periods was primarily due to earnings in jurisdictions paying cash taxes or where utilization of deferred tax assets was not offset by reversal of valuation allowances. The increase in income tax expense in 2014 was primarily
65
Table of Contents
related to the increase in earnings before income taxes. In addition, income tax expense in 2013 included a benefit of $3.2 million related to the impact of a three-year reduced statutory tax rate at one of our non-U.S. subsidiaries.
Year Ended December 31, 2013 compared to Successor Period 2012 and Predecessor Period 2012
The following table sets forth certain financial information for the year ended December 31, 2013, the Successor Period 2012 and the Predecessor Period 2012, and should be read in conjunction with our historical audited financial statements and notes thereto included elsewhere in this prospectus. Our historical financial statements for the periods prior to the acquisition of Mold-Masters in March 2013 may not be comparable to our financial statements for periods following such acquisition. Additionally, in April 2012, affiliates of CCMP, together with members of our management formed Milacron Holdings and, through Milacron Holdings, acquired all of the capital stock of Milacron Intermediate Holdings. Milacron in all periods prior to May 2012 is referred to as “Predecessor,” and in all periods including and after such date is referred to as “Successor.” As a result of acquisition accounting adjustments associated with the CCMP Acquisition, the consolidated financial statements for all Successor periods may not be comparable to those of the Predecessor Period.
| Predecessor |
Successor |
|||||||||||||
|
Period from |
Period from |
Year ended |
||||||||||||
| (Dollars in millions) |
||||||||||||||
| Sales |
$ | 260.7 | $ | 571.7 | $ | 1,028.8 | ||||||||
| Cost of sales |
181.5 | 423.3 | 689.1 | |||||||||||
|
|
|
|
|
|
|
|||||||||
| Manufacturing margins |
79.2 | 148.4 | 339.7 | |||||||||||
| Operating expenses: |
||||||||||||||
| Selling, general and administrative expenses |
55.6 | 104.9 | 223.4 | |||||||||||
| Business combination costs |
8.8 | 9.9 | 2.9 | |||||||||||
| Officer severance costs |
— | 6.2 | — | |||||||||||
| Amortization expense |
0.4 | 24.9 | 47.6 | |||||||||||
| Loss (gain) on currency translation |
(0.4 | ) | (0.1 | ) | 10.4 | |||||||||
| Other expense (income), net |
0.4 | (0.6 | ) | 1.1 | ||||||||||
|
|
|
|
|
|
|
|||||||||
| Total operating expenses |
64.8 | 145.2 | 285.4 | |||||||||||
|
|
|
|
|
|
|
|||||||||
| Operating earnings |
14.4 | 3.2 | 54.3 | |||||||||||
| Interest expense, net |
11.8 | 20.7 | 70.1 | |||||||||||
|
|
|
|
|
|
|
|||||||||
| (Loss) earnings before income taxes |
2.6 | (17.5 | ) | (15.8 | ) | |||||||||
| Income tax expense |
2.4 | 3.5 | 8.9 | |||||||||||
|
|
|
|
|
|
|
|||||||||
| Net (loss) earnings |
0.2 | (21.0 | ) | (24.7 | ) | |||||||||
| Less: Net loss (earnings) attributable to the noncontrolling interest |
0.1 | (0.2 | ) | 0.1 | ||||||||||
|
|
|
|
|
|
|
|||||||||
| Net earnings (loss) attributable to Milacron Holdings Corp. |
$ | 0.3 | $ | (21.2 | ) | $ | (24.6 | ) | ||||||
|
|
|
|
|
|
|
|||||||||
Sales
Sales for the year ended December 31, 2013, Successor Period 2012 and Predecessor Period 2012 were $1,028.8 million, $571.7 million and $260.7 million, respectively. The increase in 2013 included sales of $208.1 million contributed from the acquisition of Mold-Masters. Sales in 2013 also benefited from new customer accounts, a full year’s effect of shorter lead times in our North America equipment businesses and higher volumes in Asia.
66
Table of Contents
The following table sets forth our sales by segment for the year ended December 31, 2013, the Successor Period 2012 and the Predecessor Period 2012:
| Predecessor |
Successor |
|||||||||||||
| (Dollars in millions) |
Period from |
Period from |
Year ended |
|||||||||||
| Sales by segment: |
||||||||||||||
| Advanced Plastic Processing Technologies |
$ | 177.9 | $ | 407.2 | $ | 580.1 | ||||||||
| Melt Delivery and Control Systems |
38.9 | 76.1 | 320.5 | |||||||||||
| Fluid Technologies |
43.9 | 88.4 | 128.2 | |||||||||||
|
|
|
|
|
|
|
|||||||||
| Total |
$ | 260.7 | $ | 571.7 | $ | 1,028.8 | ||||||||
|
|
|
|
|
|
|
|||||||||
Sales for our APPT segment for the year ended December 31, 2013 were $580.1 million compared to $407.2 million for the Successor Period 2012 and $177.9 million for the Predecessor Period 2012. Sales in 2013 were favorably influenced by shortened delivery lead times for North America, growth in aftermarkets and higher sales in Europe. These benefits were primarily offset by lower blow molding sales and by unfavorable currency translation effects of $2.7 million compared to average exchange rates in 2012.
Sales for our MDCS segment for the year ended December 31, 2013 were $320.5 million compared to $76.1 million for the Successor Period 2012 and $38.9 million for the Predecessor Period 2012. Sales in 2013 included sales of $208.1 million contributed from the acquisition of Mold-Masters and favorable foreign currency translation effects of $0.1 million compared to average exchange rates in 2012.
Sales for our Fluids segment for the year ended December 31, 2013 were $128.2 million compared to $88.4 million for the Successor Period 2012 and $43.9 million for the Predecessor Period 2012. While sales in the aerospace, electrical, appliance and medical industries grew in 2013, there was a slight contraction in automotive and heavy equipment. Sales also increased in Europe and benefited from favorable foreign currency translation effects of $2.3 million compared to average exchange rates in 2012.
Cost of Sales
Cost of sales for the year ended December 31, 2013 was $689.1 million compared to $423.3 million for the Successor Period 2012 and $181.5 million for the Predecessor Period 2012. The increase was due primarily to the acquisition of Mold-Masters in March 2013.
Manufacturing Margins
Our manufacturing margins for the year ended December 31, 2013 were $339.7 million compared to $148.4 million for the Successor Period 2012 and $79.2 million for the Predecessor Period 2012. Improvements in manufacturing margins include $97.9 million contributed from the acquisition of Mold-Masters, benefits from our production efficiency projects and material cost saving projects, partially offset by a full year’s effect of the CCMP Acquisition’s acquisition accounting on inventory sold and on plant and equipment depreciation.
The manufacturing margin ratio as a percent of sales for the year ended December 31, 2013 was 33.0% compared to 26.0% for the Successor Period 2012 and 30.4% for the Predecessor Period 2012. The improved ratio resulted from product cost reductions, pricing discipline and process efficiencies along with the change in mix of our portfolio related to higher margin products at Mold-Masters. These improvements were partially offset by the impact of purchase accounting for the acquisition of Mold-Masters and the CCMP Acquisition in April 2012 on inventory sold and on plant and equipment depreciation.
67
Table of Contents
Selling, General and Administrative Expense
Selling, general and administrative expenses for the year ended December 31, 2013 were $223.4 million compared to $104.9 million for the Successor Period 2012 and $55.6 million for the Predecessor Period 2012. The increase in 2013 includes $47.3 million contributed from Mold-Masters.
Business Combination Costs
Business combination costs for the year ended December 31, 2013 were $2.9 million compared to $9.9 million for the Successor Period 2012 and $8.8 million for the Predecessor Period 2012. The 2013 transaction costs were related to the acquisition of Mold-Masters, net of a $2.2 million gain on a foreign currency hedge related to the acquisition of Mold-Masters. In 2012, transaction costs were associated with the CCMP Acquisition in April 2012. Acquisition related costs are expensed as incurred.
Officer Severance Costs
Officer severance costs were $6.2 million in the Successor Period 2012 related to executive officer termination costs.
Amortization Expense
Amortization expense related to intangible assets for the year ended December 31, 2013 was $47.6 million compared to $24.9 million for the Successor Period 2012 and $0.4 million for the Predecessor Period 2012. The increase is primarily related to the intangible assets acquired as part of the acquisition of Mold-Masters and to the full year effect from the CCMP Acquisition in April 2012.
Loss on Currency Translation
Loss on currency translation for the year ended December 31, 2013 was $10.4 million compared to a gain of $0.1 million for the Successor Period 2012 and a gain of $0.4 million for the Predecessor Period 2012. The loss in 2013 primarily relates to translation impact on the intercompany advances related to the Canadian dollar associated with the acquisition of Mold-Masters. We are also exposed where we purchase supplies or sell products in currencies other than our local operation’s functional currency.
Other Expense (Income), Net
Other expense (income), net for the year ended December 31, 2013 was $1.1 million compared to income of $0.6 million for the Successor Period 2012 and expense of $0.4 million for the Predecessor Period 2012. In 2013, other expense included the write-down of idled equipment, reorganization costs and miscellaneous expenses, offset in part by the sale of scrap.
Operating Earnings
Operating earnings for the year ended December 31, 2013 was $54.3 million compared to $3.2 million for the Successor Period 2012 and $14.4 million for the Predecessor Period 2012. In 2013, operating earnings improved primarily due to the acquisition of Mold-Masters as the increased sales volumes generated growth in manufacturing margins, offset in part by higher selling, general and administrative costs and intangible asset amortization.
Interest Expense, Net
Interest expense, net of interest income, for the year ended December 31, 2013 was $70.1 million compared to $20.7 million for the Successor Period 2012 and $11.8 million for the Predecessor Period 2012. The 2013 increase in was primarily due to higher levels of debt related to the acquisition of Mold-Masters, a full year’s effect of the CCMP Acquisition in April 2012 and related debt commitment costs.
68
Table of Contents
Income Tax Expense
Income tax expense for the year ended December 31, 2013 was $8.9 million compared $3.5 million for the Successor Period 2012 and $2.4 million for the Predecessor Period 2012. Income tax expense for both periods was primarily due to earnings in jurisdictions paying cash taxes or where utilization of deferred tax assets was not offset by reversal of valuation allowances. The increase in income tax expense in 2013 was primarily related to the acquisition of Mold-Masters in March 2013. This increase was partially offset by a $3.2 million tax benefit recognized as a result of a three-year reduced statutory tax rate at one of our non-U.S. subsidiaries.
Liquidity and Capital Resources
Our primary source of liquidity is cash generated from operations and availability under our ABL Facility and other foreign credit facilities. At December 31, 2014, we had $81.5 million of cash and cash equivalents, $79.8 million of availability under our ABL Facility and $12.7 million of availability under other foreign credit facilities. Our primary cash requirements included the payment of working capital, operating expenses, capital expenditures, and scheduled payments of principal and interest.
During the year ended December 31, 2014 we used $19.2 million of cash compared to generating $52.3 million during the year ended December 31, 2013. During 2014, cash was used primarily to fund acquisitions, capital expenditures and working capital growth, offset in part by proceeds from the issuance of long-term debt, net of debt redemptions. During 2013, cash was generated primarily from operating activities and financing activities to fund capital expenditures and the acquisition of Mold-Masters.
On April 30, 2012, we issued $275.0 million aggregate principal amount of Senior Secured Notes pursuant to an indenture, dated as of April 30, 2012; the notes mature on May 15, 2019. On March 28, 2013, we (i) entered into an amended and restated senior secured asset-based revolving credit facility with Bank of America, N.A., as agent, and certain financial institutions as lenders (the “ABL Facility”); (ii) we issued $465.0 million aggregate principal amount of Senior Unsecured Notes pursuant to an indenture; the notes mature on February 15, 2021; and (iii) we entered into a new $245.0 senior secured term loan facility with JPMorgan Chase Bank, N.A., as administrative agent, and certain financial institutions as lenders (the “Term Loan Facility”).
We believe that our current level of operations, our cash and cash equivalents, cash flow from operations and borrowings under our ABL Facility and other foreign lines of credit will provide us adequate cash to fund the operating needs, working capital, capital expenditure, debt service and other requirements for our business for the foreseeable future. Our ability to meet future operating needs, working capital, capital expenditure and debt service requirements will depend on our future financial performance, which will be affected by a range of economic, competitive and business factors, particularly interest rates and changes in our industry, many of which are outside of our control. To the extent we make acquisitions or have other strategic needs, we may need to incur additional indebtedness. We cannot assure you, however, that our business will generate sufficient cash flow from operations or that future borrowings will be available to us under our ABL Facility or other lines of credit in an amount sufficient to enable us to service our indebtedness or to fund our other liquidity needs. As of December 31, 2014, we have unused availability, subject to certain terms and conditions and other limitations, of $92.5 million under these lines of credit.
The following table shows our statements of cash flows for the years ended December 31, 2014 and 2013 and the Successor Period 2012 and Predecessor Period 2012.
| (Dollars in millions) | Period from |
Period from |
Year ended |
Year ended |
||||||||||||||
| Statements of cash flow data | (Predecessor) | (Successor) | (Successor) | (Successor) | ||||||||||||||
| Net cash provided by operating activities |
$ | 12.4 | $ | 8.1 | $ | 82.1 | $ | 37.6 | ||||||||||
| Net cash used in investing activities |
(4.9 | ) | (210.3 | ) | (993.4 | ) | (94.3 | ) | ||||||||||
| Net cash (used in) provided by financing activities |
(17.2 | ) | 55.2 | 964.8 | 41.2 | |||||||||||||
69
Table of Contents
Cash provided by operating activities
Operating activities for the year ended December 31, 2014 generated $37.6 million of cash compared to $82.1 million for the year ended December 31, 2013. The decrease was primarily driven by increased working capital to support higher backlog levels.
Operating activities for the year ended December 31, 2013 generated $82.1 million of cash compared to $8.1 million for the Successor Period 2012 and $12.4 million for the Predecessor Period 2012. The increase in 2013 was primarily driven by cash earnings and higher advance deposits, partially offset by higher levels of inventory and accounts receivable.
Cash used in investing activities
Investing activities for the year ended December 31, 2014 used $94.3 million of cash compared to $993.4 million of cash for the year ended December 31, 2013. The decrease was primarily driven by the reduction in acquisitions, which included $965.0 million for the acquisition of Mold-Masters, offset by an increase of $11.4 million in capital expenditures. We expect capital expenditures to increase by approximately $13 million in 2015 in connection with our cost savings initiatives, and return to normalized levels of approximately 3% of net sales thereafter.
Investing activities for the year ended December 31, 2013 used $993.4 million of cash compared to $210.3 million for the Successor Period 2012 and $4.9 million for the Predecessor Period 2012. The increase included $965.0 million of cash paid for the acquisition of Mold-Masters, offset by an increase in capital expenditures.
Cash (used in) provided by financing activities
Financing activities for the year ended December 31, 2014 generated $41.2 million of cash compared to $964.8 million of cash for the year ended December 31, 2013. During the year ended December 31, 2014, sources of funds included the issuance of $99.5 million of debt, net of a discount, and an increase in our short-term borrowings offset by the redemption of $55.0 million of our Senior Secured Notes, the purchase of the noncontrolling interest in one of our subsidiaries and servicing our long-term debt. During the year ended December 31, 2013, we issued $708.8 million of debt, net of a discount, to fund the acquisition of Mold-Masters including transaction and debt issuance costs.
Financing activities for the year ended December 31, 2013 generated $964.8 million of cash compared to $55.2 million for the Successor Period 2012 and usage of $17.2 million of cash during the Predecessor Period 2012. During the year ended December 31, 2013, we issued $708.8 million of debt, net of a discount, to fund the acquisition of Mold-Masters including transaction and debt issuance costs. During the Successor Period 2012, we issued $275.0 million aggregate principal amount of Senior Secured Notes pursuant to an indenture, dated as of April 30, 2012, to refinance debt during the Predecessor 2012 period in connection with the CCMP Acquisition.
Total debt was $1,034.6 million at December 31, 2014 compared to $989.4 million at December 31, 2013. Total debt at December 31, 2014 included $220.0 million outstanding on the Senior Secured Notes, $338.7 million, net of a discount, outstanding on the Term Loan Facility and $465.0 million outstanding on the Senior Unsecured Notes, while no amounts were outstanding under the ABL Facility except for $14.9 million of undrawn letters of credit.
Description of the ABL Facility
On April 30, 2012, we entered into a senior secured asset-based revolving credit facility with Merrill Lynch, Pierce, Fenner & Smith Incorporated, RBC Capital Markets and Barclays Bank PLC, as joint lead arrangers and bookrunners which was amended and restated on March 28, 2013. The ABL Facility matures on
70
Table of Contents
April 30, 2017, bears interest at a floating rate and provides for an aggregate principal amount of $70.0 million of loans under the U.S. sub-facility thereunder, subject to a borrowing base and other limitations, and for an aggregate principal amount of $30.0 million of loans under the Canadian sub-facility thereunder, subject to a borrowing base and other limitations. We have the right at any time to request up to $20.0 million of additional commitments. The existing lenders under the ABL Facility are not under any obligation to provide such additional commitments, and any increase in commitments is subject to customary conditions precedent. We had approximately $14.9 million of undrawn letters of credit outstanding as of December 31, 2014. On March 17, 2014, we exercised our right to increase the U.S. sub-facility of the ABL Facility by $10.0 million to $80.0 million and decrease the Canadian sub-facility by $10.0 million to $20.0 million. The covenants and other terms of the ABL Facility were not changed. On October 17, 2014, the ABL Facility was amended and restated to add a $25.0 million German sub-facility and the term was reset to five years from the date of the amendment. The covenants and other terms of the ABL Facility were not materially changed.
The obligations under the ABL Facility are secured, subject to certain exceptions, by substantially all of the assets of the borrowers and the assets of the guarantors under such facility. In addition, the ABL Facility includes certain customary negative covenants that, subject to exceptions, limit the ability of the borrowers and their restricted subsidiaries to incur additional indebtedness, pay dividends or certain other distributions on the Company’s capital stock, repurchase the Company’s capital stock, prepay subordinated indebtedness, incur liens on assets, make certain investments or other restricted payments, engage in transactions with affiliates, sell certain assets, merge or consolidate with or into other companies and alter the business that the Company conducts. See “Description of Certain Indebtedness—Senior Credit Facilities.”
Description of the 8.375% Senior Secured Notes due 2019
On April 30, 2012, we issued $275.0 million aggregate principal amount of Senior Secured Notes (the “Senior Secured Notes”) pursuant to an indenture, dated as of April 30, 2012, among the Company, Mcron Finance Corp, the guarantors party thereto and U.S. Bank National Association, as Trustee and Notes Collateral Agent (the “2012 Indenture”). The Senior Secured Notes mature on May 15, 2019 and interest on the notes is payable semi-annually on May 15 and November 15 of each year. The Senior Secured Notes were issued in a private transaction that is not subject to the registration requirements of the Securities Act. The Senior Secured Notes are secured by first-priority liens on substantially all of the Company and the guarantors’ assets other than accounts receivable, inventory, and other certain assets. The Senior Secured Notes are also secured by a second-priority lien on all of the Company and the guarantors’ assets that secure the ABL Facility. The notes are redeemable, in whole or in part, at any time on or after May 15, 2015 on the redemption dates and at the redemption prices set forth in the Indenture. In addition, we may redeem up to 35% of the Senior Secured Notes before May 15, 2015 with the net cash proceeds from certain equity offerings. We may also redeem some or all of the Senior Secured Notes before May 15, 2015 at a redemption price of 100% of the principal amount thereof plus accrued and unpaid interest, if any, to the redemption date, plus a “make whole” premium. In addition, we may be required to make an offer to purchase the Senior Secured Notes upon the sale of certain assets and upon a change of control.
On April 29, 2014 and April 30, 2014, we redeemed a combined $55.0 million of our Senior Secured Notes.
Description of the Senior Secured Term Loan Facility due 2020
On March 28, 2013, we entered into a $245.0 million term loan, with a 50 basis point discount, pursuant to a term loan agreement, among the Company and Milacron LLC, the guarantors party thereto, and J.P. Morgan Securities LLC, Merrill Lynch, Pierce, Fenner & Smith Incorporated, Credit Suisse Securities (USA) LLC, Barclays Bank PLC and RBC Capital Markets as Joint Lead Arrangers and Bookrunners (the “Term Loan Facility”). The Term Loan Facility matures on March 28, 2020. The Term Loan Facility ranks equal in right of payment with all existing and future senior secured indebtedness of the issuers and guarantors. The Term Loan
71
Table of Contents
Facility is also secured by a second-priority lien on all of the Company and the guarantors’ assets that secure the ABL Facility. The interest rates applicable to the Term Loan Facility is, at our option, equal to either (i) the published LIBOR, plus a margin of 3.25% per annum or (ii) the greater of (1) the prime rate, (2) the federal funds rate plus 0.50% per annum, (3) published LIBOR plus 1.00% or (4) 2.25% per annum, plus a margin of 2.25% per annum. In no event will the LIBOR rate be less than 1.00% at any time. The Term Loan Facility provides us with the right at any time to request one or more incremental term increases in an aggregate amount (x) not to exceed $175.0 million plus (y) an unlimited amount so long as our senior secured net leverage ratio does not exceed the specified threshold. The Term Loan Facility is subject to quarterly amortization of principal equal to 0.25% of the original aggregate principal amount of the Loan Facility, with the balance payable at final maturity. The following amounts will be applied to repay the Term Loan Facility, subject to certain thresholds, carve-outs and exceptions: (i) 100% of the net cash proceeds of any incurrence of debt by us and certain of our subsidiaries, (ii) 100% of net cash proceeds of any non-ordinary course sale or other disposition of assets by us or certain subsidiaries and (iii) 50% of our excess cash flow, subject to certain reductions.
On March 31, 2014, we exercised our right to request an incremental term increase and borrowed an additional $100.0 million, net of a discount of $0.5 million, under the senior secured term loan facility due 2020 for the principal purpose of funding acquisitions in 2014 as well as refinancing portions of our outstanding debt. The agreement was also amended to reduce the margin on the interest rate from 3.25% to 3.00% for LIBOR loans and from 2.25% to 2.00% for non-LIBOR loans. No other terms of the facility were changed. See “Description of Certain Indebtedness—Senior Secured Notes.”
Description of the 7.75% Senior Unsecured Notes due 2021
On March 28, 2013, we issued $465.0 million aggregate principal amount of Senior Unsecured Notes pursuant to an indenture, among the Company, Mcron Finance Corp, the guarantors party thereto and U.S. Bank National Association, as Trustee and Notes Collateral Agent (the “2013 Indenture”). The Senior Unsecured Notes mature on February 15, 2021 and interest on the Senior Unsecured Notes is payable semi-annually on February 15 and August 15 of each year. The Senior Unsecured Notes were issued in a private transaction that is not subject to the registration requirements of the Securities Act. The Senior Unsecured Notes are guaranteed, jointly and severally, on a senior unsecured basis by Milacron Intermediate Holdings Inc. and each of our wholly-owned domestic subsidiaries that are obligors under our ABL Facility, Term Loan Facility and Senior Secured Notes. The Senior Unsecured Notes are redeemable, in whole or in part, at any time on or after February 15, 2016 on the redemption dates and at the redemption prices set forth in the 2013 Indenture. In addition, we may redeem up to 40% of the Senior Unsecured Notes before February 15, 2016 with the net cash proceeds from certain equity offerings. We may also redeem some or all of the Senior Unsecured Notes before February 15, 2016 at a redemption price of 100% of the principal amount thereof plus accrued and unpaid interest, if any, to the redemption date, plus a “make whole” premium. In addition, we may be required to make an offer to purchase the Senior Unsecured Notes upon the sale of certain assets and upon a change of control. See “Description of Certain Indebtedness—Senior Unsecured Notes.”
Description of Other Debt
At December 31, 2014, we have approximately $1.6 million in capital lease obligations outstanding as well as $9.3 million of borrowings under certain lines of credit and discounting programs. We also have approximately $3.7 million of outstanding letters of credit and other commitments related to these facilities at December 31, 2014. See “Description of Certain Indebtedness—Other Indebtedness.”
72
Table of Contents
Contractual Obligations
The following table summarizes our contractual obligations as of December 31, 2014:
| Total |
2015 |
2016 - 2017 |
2018 - 2019 |
Beyond |
||||||||||||||||
| (Dollars in millions) |
||||||||||||||||||||
| Senior Secured Notes |
$ | 220.0 | $ | — | $ | — | $ | 220.0 | $ | — | ||||||||||
| Term Loan Facility |
340.0 | 3.4 | 6.8 | 6.8 | 323.0 | |||||||||||||||
| Senior Unsecured Notes |
465.0 | — | — | — | 465.0 | |||||||||||||||
| Interest on long term debt(a) |
387.6 | 68.2 | 136.0 | 126.2 | 57.2 | |||||||||||||||
| Other long-term debt |
0.1 | 0.1 | — | — | — | |||||||||||||||
| Capital lease obligations |
1.6 | 0.5 | 0.9 | 0.2 | — | |||||||||||||||
| Estimated pension benefit payments(b) |
12.0 | 0.9 | 1.9 | 2.1 | 7.1 | |||||||||||||||
| Operating leases |
25.5 | 10.3 | 13.1 | 2.0 | 0.1 | |||||||||||||||
|
|
|
|
|
|
|
|
|
|
|
|||||||||||
| Total |
$ | 1,451.8 | $ | 83.4 | $ | 158.7 | $ | 357.3 | $ | 852.4 | ||||||||||
|
|
|
|
|
|
|
|
|
|
|
|||||||||||
| (a) | Amounts include contractual interest payments using the interest rates as of December 31, 2014 applicable to the Company’s variable-rate debt and stated fixed interest rates for fixed-rate debt. |
| (b) | Amounts include estimated pension benefit payments based on actuarial estimates and are estimated through 2024. |
Quantitative and Qualitative Disclosures about Market Risk
Market Risk
We are exposed to financial market risks associated with foreign currency exchange rates, interest rates, commodity prices and credit risk. In the normal course of business and in accordance with our policies, we manage these risks through a variety of strategies, which may include the use of derivative financial instruments to hedge our underlying exposure. We do not use derivative instruments for speculative or trading purposes and we have policies and procedures in place that monitor and control their use.
Foreign Currency Exchange Rate Risk
We operate in international markets and, accordingly, our competitiveness and financial results are subject to foreign currency fluctuations where revenues and costs are denominated in currencies other than the U.S. dollar. In 2014, approximately 54% of our sales are attributable to our operations outside of the United States. Approximately 45% of sales were typically denominated in currencies other than the U.S. dollar, whereas a significant portion of our fixed costs, including payments made on our ABL Facility, our Senior Secured Notes, our Senior Term Loan Facility and our Senior Unsecured Notes are denominated in U.S. dollars. Our earnings could be materially impacted particularly by movement in the exchange rate between the Canadian dollar, the Euro, the Chinese yuan renminbi, the Indian rupee and the U.S. dollar.
We occasionally use foreign currency forward exchange contracts to hedge our exposure to adverse changes in foreign currency exchange rates related to known or expected cash flow exposures arising from international transactions. At December 31, 2014, we had $37.7 million of forward exchange contracts outstanding with remaining maturities of up to 12 months. As of December 31, 2014, the net fair value liability of financial instruments with exposure to foreign currency risk was $3.2 million. The fair value of these financial instruments would hypothetically decrease by $3.6 million as of December 31, 2014 if the U.S. dollar were to appreciate against all other currencies by 10% of current levels. See “Risk Factors—Risks Related to Our Business and Industry—Our operations are conducted worldwide and our results of operations are subject to currency translation risk and currency transaction risk that could have a material adverse effect on our financial condition and results of operations.”
73
Table of Contents
Interest Rate Risk
We are primarily exposed to interest rate risk through our ABL Facility, Term Loan Facility, and other foreign lines of credit. Interest on our ABL Facility accrues, at our option, at either (i) LIBOR plus a margin of 1.75% to 2.25% per annum, based on availability or (ii) the highest rate of (a) the prime rate, (b) the federal funds rate plus 0.50% per annum, or (c) LIBOR plus 1.00% per annum, plus a margin of 0.75% to 1.25% per annum, based on availability. Interest on the Term Loan Facility accrues, at our option at either (i) the published LIBOR, plus a margin of 3.00% per annum or (ii) the greater of (1) the prime rate, (2) the federal funds rate plus 0.50% per annum, (3) published LIBOR plus 1.0% or (4) 2.00% per annum, plus a margin of 2.00% per annum. In no event will the LIBOR rate be less than 1.00% at any time. We currently estimate that our annual interest expense on floating rate indebtedness would increase by approximately $3.4 million for each 1.00% increase in interest rates once LIBOR exceeds 1.00%.
Commodity Risk
We have direct and indirect exposure to certain commodities, principally steel and steel-based components. We typically do not enter into derivative financial instruments to hedge our commodity price risk and we do not currently have long-term supply contracts with key suppliers.
Credit Risk
Our financial assets exposed to credit risk primarily consist of cash and cash equivalents and accounts receivable.
Our customers are geographically diversified, and we typically have no material concentration of receivables by customer. We manage credit risk by typically requiring substantial customer deposits before shipment, analyzing the counterparties’ financial condition prior to accepting new customers and prior to adjusting existing credit limits or obtaining letters of credit or other acceptable forms of security from customers, or any combination thereof, based on our analysis of the customer and the terms and conditions applicable to each transaction.
Risk of Inflation
Historically, in certain circumstances, we have been able to pass through price increases in our primary raw material (steel) to customers. Although we generally have been able to increase the price of our products to reflect increases in the price of these raw materials, we cannot rely on our ability to do so in the future. The timing of such increases in the selling price of our products may not coincide with timing of raw materials price increases, nor may our ability to increase the selling prices of our products allow us to fully compensate for such increased raw materials prices in all cases. However, we believe that inflation in the near term will not have a material adverse impact on us.
Recently Issued Accounting Standards
In May 2014, the FASB issued Accounting Standards Update (ASU) No. 2014-09 Revenue from Contracts with Customers, which will be introduced into the FASB’s Accounting Standards Codification as Topic 606. Topic 606 replaces Topic 605, the previous revenue recognition guidance. The new standard’s core principle is for companies to recognize revenue to depict the transfer of goods or services to customers in amounts that reflect the consideration (that is, payment) to which the Company expects to be entitled in exchange for those goods or services. The new standard also will result in enhanced disclosures about revenue, provide guidance for transactions that were not previously addressed comprehensively (for example, service revenue and contract modifications) and improve guidance for multiple element arrangements. The new standard is effective for the interim and annual period beginning on or after December 15, 2016, with early adoption not permitted.
74
Table of Contents
The new standard permits two implementation approaches, one requiring retrospective application of the new standard with restatement of prior years, and one requiring prospective application of the new standard with disclosure of results under old standards. We are currently evaluating the impact of this accounting standard and have not yet selected an implementation approach.
Critical Accounting Policies
We prepare our consolidated financial statements in conformity with U.S. GAAP and our significant accounting significant policies are described in Note 1 to our consolidated financial statements. The preparation of financial statements in conformity with U.S. GAAP requires us to make estimates and assumptions that affect reported amounts and related disclosures. We base our estimates and judgments on historical experience and other relevant factors that we believe to be reasonable under the circumstances, the results of which form the basis for making judgments about the carrying values of assets and liabilities that are not readily apparent from other sources. Actual results may differ from these estimates under different assumptions or conditions. We have identified below the accounting policies and estimates that we believe are most critical in compiling our consolidated statements of financial condition and operating results.
Business Combinations
Accounting for acquisitions requires us to recognize separately from goodwill the assets acquired and liabilities assumed at their acquisition date fair values. Goodwill as of the acquisition date is measured as the excess of consideration transferred over the net of acquisition date fair values of the assets acquired and liabilities assumed. While we use our best estimates and assumptions to accurately value assets acquired and liabilities assumed at the acquisition date, our estimates are inherently uncertain and subject to refinement. As a result, during the measurement period, which may be up to one year from the acquisition date, we record adjustments to the assets acquired and liabilities assumed with the corresponding offset to goodwill. Upon the conclusion of the measurement period or final determination of values of assets acquired and liabilities assumed, whichever comes first, any subsequent adjustments are recorded to our consolidated statements of operations.
Revenue Recognition
We record revenue on products when persuasive evidence of an arrangement exists, legal title has passed and the risk and rewards of ownership are transferred, the sales price is fixed and determinable, all significant contractual obligations have been satisfied and the collectability of the sales price is reasonably assured. We extend volume discounts and rebates to certain customers and reflect these amounts as a reduction of sales.
We continually evaluate the creditworthiness of our customers and enter into sales contracts only when collection of the sales price is reasonably assured. For sales of plastic processing equipment, customers are generally required to make substantial down-payments prior to shipment which helps to ensure collection of the full price. The estimate of the allowance for doubtful accounts is our best estimate of the amount of probable credit loss in our existing accounts receivable. We regularly review the adequacy of our allowance for doubtful accounts. We determine the allowance based upon an analysis of prior collection experience, specific customer creditworthiness and economic trends within the industries we serve. In circumstances where we are aware of a specific customer’s inability to meet its financial obligation (e.g., bankruptcy filings), we record a specific reserve to reduce the receivable to the amount reasonably believed to be collected.
Goodwill and Indefinite-Lived Intangible Assets
We perform an annual impairment assessment for goodwill and intangible assets with indefinite useful lives as of October 1, or more frequently when impairment indicators exist. The annual impairment assessment for goodwill is performed at the reporting unit level, which is at the operating segment level or one level below
75
Table of Contents
the operating segment. This impairment assessment is performed to determine whether it is more likely than not that the fair value of a reporting unit in which goodwill resides is less than its carrying value. For reporting units in which this assessment concludes that it is more likely than not that the fair value is more than its carrying value, goodwill is not considered impaired and we are not required to perform the two-step goodwill impairment test. For reporting units in which this impairment assessment is not conclusive that it is more likely than not that the fair value is greater than its carrying value, we perform step 1 of the goodwill impairment test for which we compare the estimated fair value of each reporting unit to its carrying value, including goodwill. If the estimated fair value exceeds the carrying amount, then no impairment exists.
For our Mold-Masters reporting unit, a business we acquired in 2013, we perform step 1 of the goodwill impairment test whereby we compare the estimated fair value of the reporting unit to its carrying value, including goodwill. As the estimated fair value has exceeded the carrying amount for all periods presented, no impairment has been recognized since the inception of this reporting unit. The estimated fair value of this reporting unit is determined by using a discounted cash flow approach, with an appropriate risk adjusted discount rate, and a market approach. The significant estimates and assumptions utilized in the fair value estimate for this reporting unit included projected sales growth, operating earnings rates, working capital requirements, capital expenditures, terminal growth rates, discount rates per reporting unit and the selection of peer company multiples. We also used comparable market earnings multiple data to corroborate our reporting unit valuation. Due to the historical and projected performance for this reporting unit, we do not believe there is a reasonable likelihood that goodwill could be impaired, unless future sales and cash flow projections differ significantly from our current estimates as a result of unforeseen circumstances or if the assumed weighted average cost of capital were to become substantially higher in future periods.
For the remainder of the Company’s reporting units, a qualitative assessment is performed as historical step 1 calculations have resulted in fair values that consistently exceeded respective carrying values. Qualitative factors considered in this assessment include industry and market considerations, overall financial performance, and other relevant events and factors affecting the reporting unit. Management judgment is necessary to evaluate the impact of operating and macroeconomic changes on each reporting unit subject to a qualitative assessment and comparable market earnings multiple data is also utilized to corroborate our conclusion. We do not believe these reporting units are susceptible to impairment based on our evaluation of qualitative considerations.
Indefinite-lived intangible assets relate to certain unamortized trade names. The estimated fair value of these assets, as calculated during our annual impairment test, are determined using a relief from royalty valuation methodology similar to that employed when the associated assets were acquired. Significant assumptions used under this approach include sales projections, the royalty rate and the weighted average cost of capital for each of the respective assets. Due to the historical and projected performance for the reporting units which hold indefinite-lived trade names, we do not believe there is a reasonable likelihood these assets could be impaired, unless future sales and cash flow projections differ significantly from our current estimates as a result of unforeseen circumstances.
If actual results are materially inconsistent with our estimates or assumptions for any of the above assessments, we may be exposed to impairment charges in future periods.
Long-Lived Assets
Expenditures for long-lived assets, including property and equipment and definite-lived intangible assets, are recorded at cost and are depreciated using the straight-line method over the estimated useful lives of the assets. Long-lived assets are reviewed for impairment whenever events or changes in circumstances indicate that the carrying amount of an asset may not be recoverable. Examples of events or changes in circumstances could include, but are not limited to, a prolonged economic downturn, current period operating or cash flow losses combined with a history of losses or a forecast of continuing losses associated with the use of an asset group, or a current expectation that an asset group will be sold or disposed of before the end of its previously
76
Table of Contents
estimated useful life. Recorded values of long-lived assets that are not expected to be recovered through undiscounted future cash flows are written down to current fair value, which generally is determined from estimated discounted future net cash flows (for assets held for use) or net realizable value (for assets held for sale).
The carrying values of long-lived assets are reviewed if facts and circumstances indicate potential impairment of their carrying value. If the review indicates that the long-lived assets are impaired, as determined by the undiscounted cash flow method, the carrying value will be reduced to the estimated fair value.
Pension Benefit Plans
The determination of pension obligations and the related pension expense or credits to operations for our defined benefit plans (“Plans”) involves significant estimates. The most significant estimate is the discount rate used to calculate the actuarial present value of benefit obligations for each Plan. Accumulated and projected benefit obligations are measured as the present value of expected payments. We discount those cash payments using the weighted average of market-observed yields for high-quality fixed-income securities with maturities that correspond to the payment of benefits. Lower discount rates increase present values and subsequent-year pension expense; higher discount rates decrease present values and subsequent-year pension expense. The weighted average discount rates for our pension plans at December 31, 2014, 2013 and 2012 were 2.44%, 3.78% and 4.21%, respectively. We evaluate the discount rates for our Plans at least annually on a plan and country-specific basis. We periodically evaluate other assumptions involving demographic factors such as retirement age, mortality and turnover, and update them to reflect our experience and expectations for the future. Actual results in any given year will often differ from actuarial assumptions because of economic and other factors.
Stock-Based Compensation
We issue stock-based awards to employees, principally in the form of stock options and restricted stock awards (RSUs), and account for our stock-based compensation awards in accordance with FASB ASC Topic 718, Compensation—Stock Compensation, or ASC 718. ASC 718, which requires all stock-based payments to employees, including grants of employee stock options and restricted stock to be recognized in the statements of operations and comprehensive loss based on their grant-date fair values. Described below is the methodology we have utilized in historically measuring stock-based compensation expense. Following the consummation of this offering, stock option and restricted stock values will be determined based on the quoted market price of our common stock.
We estimate the fair value of our stock-based awards of options to purchase shares of common stock to employees utilizing the Black-Scholes option pricing model, which requires the input of highly subjective assumptions, including (a) the expected stock price volatility, (b) the calculation of the expected term of the award, (c) the risk-free interest rate and (d) expected dividends on the underlying common stock. Due to the lack of a public market for the trading of our common stock and a lack of company-specific historical and implied volatility data, we have based our estimate of expected volatility on the historical volatility of a group of similar companies that are publicly traded. We believe the group selected has sufficient similar economic and industry characteristics, and includes companies that are most representative of our company. The historical volatility is calculated based on a period of time commensurate with the expected term assumption. The expected term represents the period that our option awards are expected to be outstanding. We use the simplified method as prescribed by the SEC Staff Accounting Bulletin No. 107, Share-Based Payment, to calculate the expected term for options granted to employees as we do not have sufficient historical exercise data to provide a reasonable basis upon which to estimate the expected term. This simplified method utilizes the midpoint between the vesting date and the end of the contractual term. The risk-free interest rate is based on a treasury instrument whose term is consistent with the expected term of the stock options. The expected dividend yield is assumed to be zero as we have not historically paid any dividends on our common stock. The grant date fair value of restricted stock award grants is based on the estimated value of our common stock at the date of grant.
77
Table of Contents
Our stock-based awards are subject to either service, performance or market-based vesting conditions. Compensation expense related to awards to employees with service-based vesting conditions is recognized on a straight-line basis based on the grant date fair value over the associated service period of the award, which is generally the vesting term. Compensation expense related to awards to employees with performance-based vesting conditions is recognized based on the grant date fair value over the requisite service period using the accelerated attribution method to the extent achievement of the performance condition is probable. We are also required to estimate forfeitures at the time of grant and revise those estimates in subsequent periods if actual forfeitures differ from our estimates. Historically forfeitures have not been significant and actual forfeiture activity has not differed materially from our original estimates.
We have estimated the fair value of employee stock options at the date of grant using the following weighted-average assumptions:
|
Period from May 1, 2012 to |
Year-ended December 31, |
|||||||||||
| 2013 | 2014 | |||||||||||
| Expected stock price volatility over the option’s expected term |
76.06 | % | 74.99 | % | 71.89 | % | ||||||
| Expected term (in years) |
5.32 | 4.93 | 4.78 | |||||||||
| Risk-free interest rate |
0.84 | % | 0.75 | % | 1.21 | % | ||||||
| Expected dividend yield on the underlying common stock over the option’s expected term |
0.00 | % | 0.00 | % | 0.00 | % | ||||||
The weighted-average grant date fair value of employee stock options granted during 2014, 2013 and 2012 was $580.41, $602.33 and $628.00, respectively, per share.
The estimated fair value of our underlying common stock is a significant assumption in estimating the fair value of our stock-based awards. The historical valuations of our common stock were determined in accordance with the guidelines outlined in the American Institute of Certified Public Accountants Practice Aid, Valuation of Privately-Held-Company Equity Securities Issued as Compensation. In the absence of a public trading market, we considered all relevant facts and circumstances known at the time of valuation, made certain assumptions based on future expectations and exercised significant judgment to determine the fair value of our common stock. The factors considered in determining the fair value include, but are not limited to, the following:
| • | contemporaneous valuations of our common stock performed by unrelated third-party specialists completed in March 2014, March 2013 and October 2012; |
| • | our historical financial results and estimated trends and projections of our future operating and financial performance; |
| • | the likelihood of achieving a liquidity event, such as an initial public offering or sale of our company, given prevailing market conditions; |
| • | the market performance of comparable, publicly-traded companies; and |
| • | the overall global economic and industry conditions. |
The fair value of our common stock is determined on each date of grant by the Board, with input from management, and considers our most recently available valuation of common stock and our assessment of additional objective and subjective factors that we believe are relevant and which may change from the date of the most recent third-party valuation through the date of the grant.
78
Table of Contents
The following table presents the timing of grants, number of underlying shares and related exercise prices of stock options granted between January 1, 2014 and December 31, 2014, along with the fair value per share of common stock utilized to calculate stock-based compensation expense. There were no restricted stock awards issued between January 1, 2014 and December 31, 2014.
| Shares Underlying |
Common Stock Fair Value Per Share as of Grant Date |
Exercise Price Per Option |
||||||||||
| Grant Timing | ||||||||||||
| 2014 |
||||||||||||
| First Quarter |
— | — | — | |||||||||
| Second Quarter |
12,039 | $ | 1,000 | $ | 1,000 | |||||||
| Third Quarter |
1,400 | $ | 1,000 | $ | 1,000 | |||||||
| Fourth Quarter |
564 | $ | 1,000 | $ | 1,000 | |||||||
In order to determine the fair value of our common stock underlying stock option grants, we first determine our business enterprise value (“BEV”) and then allocate the BEV to each element of our capital structure (common stock, options, etc.). Our BEV was estimated using a combination of the income approach as well as two forms of the market approach, the market comparable approach and the reference transaction approach. Our indicated BEV at each valuation date was allocated to the different layers of our capital structure, including shares of common stock and stock options, using the Black-Scholes option-pricing model (“OPM”). The OPM treats common stock as a call option on our total equity value, with exercise (or strike) prices based on the value thresholds at which the allocation among the various holders of our securities changes. The rights and preferences of the various securities included within the capital structure were established and then the various equity values (strike prices) at which the sharing percentages would change among our securities were calculated. These strike prices are based on the current values of debt and values at which options would exercise. The values of the options associated with each strike price are calculated using the OPM. The options value bands are allocated to the various security holders who would share in the enterprise value if our value was between the two corresponding strike prices. Estimates of the volatility of our invested capital were based on available information on the volatility of the invested capital of comparable, publicly-traded companies and estimates of expected term were based on the estimated time to a liquidity event.
Income Taxes
We are subject to income taxes in the United States and numerous foreign jurisdictions. Significant judgment in the forecasting of taxable income using historical and projected future operating results is required in determining our provision for income taxes and the related assets and liabilities. The provision for income taxes includes income taxes paid, currently payable or receivable and deferred taxes including those related to investments in foreign subsidiaries that are not permanent in nature. Under U.S. GAAP, deferred tax assets and liabilities are recognized for future tax consequences attributable to temporary differences between financial statement carrying amounts of existing assets and liabilities and their respective tax bases. Deferred tax assets and liabilities are measured using enacted tax rates expected to apply to taxable income in the years in which those temporary differences are expected to be settled or realized. Deferred tax assets are also recognized for the estimated future effects of tax loss carryforwards. The effect on deferred taxes of changes in tax rates is recognized in the period in which the enactment date occurs.
Valuation allowances are established when necessary on a jurisdictional basis to reduce deferred tax assets to the amounts expected to be realized. The recoverability of deferred tax assets and the recognition and measurement of uncertain tax positions are subject to various assumptions and judgment. If actual results differ from the estimates made in establishing or maintaining valuation allowances against deferred tax assets, the resulting change in the valuation allowance would generally impact earnings or other comprehensive income depending on the nature of the respective deferred tax asset. Positive and negative evidence is considered in determining the need for a valuation allowance against deferred tax assets, which includes such evidence as historical earnings, projected future earnings, tax planning strategies and expected timing of reversal of existing temporary differences.
79
Table of Contents
In determining the recoverability of deferred tax assets, we give consideration to all available positive and negative evidence including reversals of deferred tax liabilities (other than those with an indefinite reversal period), projected future taxable income, tax planning strategies and recent financial operations. We reflect increases and decreases in our valuation allowances based on the overall weight of positive versus negative evidence on a jurisdiction by jurisdiction basis.
At December 31, 2014, as a result of an updated analysis of future cash needs in the U.S. and opportunities for investment outside the U.S., we assert that all foreign earnings will be indefinitely reinvested with the exception of certain foreign investments in which earnings and cash generation are in excess of local needs. We will continue to monitor our assertion related to investment of foreign earnings. In the event that the actual outcome of future tax consequences differs from our estimates and assumptions due to changes or future events such as tax legislation, geographic mix of earnings, completion of tax audits or earnings repatriation plans, the resulting change to the provision for income taxes could have a material effect on our consolidated financial statements.
80
Table of Contents
Overview
We are a global leader in the manufacture, distribution and service of highly engineered and customized systems within the $27 billion plastic technology and processing industry. Approximately 61% of our 2014 sales are tied to consumables, which we define as products that are replaced and services throughout the life of the injection, extrusion, and blow molding systems and fluids used in the metalworking process. Advanced Plastic Processing Technologies’ sales of new equipment comprise the remaining 39% of our 2014 sales. We serve these markets through three segments:
| • | Advanced Plastic Processing Technologies (“APPT”); |
| • | Melt Delivery and Control Systems (“MDCS”); and |
| • | Fluid Technologies (“Fluids”). |
Through our APPT segment, we offer injection molding, blow molding and extrusion equipment as well as aftermarket services and parts. Based on management estimates, we believe we are the #1 manufacturer and supplier of plastic processing technologies in North America on a consolidated basis across the industry’s primary plastic processing machinery applications based on sales. We believe we are the #1 manufacturer and supplier of injection molding technologies in India based on sales. We serve a diverse set of customers and geographies, including many companies that manufacture products such as food and beverage containers, consumer goods packaging, electronic components, medical devices and automotive parts. Our long track record, well-established brand names and reputation for product quality have resulted in a large estimated installed base of over 23,000 machines in North America and 17,000 machines across Europe and the rest of the world. We support this large installed base with a full suite of aftermarket parts and services.
Through our MDCS segment, we offer hot runner and process control systems, mold bases and components and numerous other technologies for injection molding applications, as well as MRO supplies for other plastic processing operations under its Mold-Masters and DME brands. The Mold-Masters product line includes highly engineered, proprietary hot runner systems, process control systems, aftermarket parts and related services while the DME brand offers mold bases and related components. According to Interconnection Consulting, we hold the #2 market position in the global hot runner industry based on sales, the #1 market position in the Americas, the #1 market position in Europe and a growing #2 market position in Asia, with a focus in the electronics and medical end-markets. We believe that our MDCS business and aftermarket parts and services business provide us with a recurring revenue streams that generate attractive margins.
Through our Fluids segment, we formulate, manufacture and sell coolants, lubricants, process cleaners, and corrosion inhibitors to the metalworking industry under the Cimcool brand name. Our Fluids segment specializes in high-performance, specialty synthetic (non-oil based) fluids that are essential in prolonging tool life and enhancing productivity in the metal cutting and grinding processes for critical parts within end-markets such as aerospace, automotive, and electronics. These fluids are often custom engineered for each application and continuously applied during the metal cutting or grinding process to achieve desired part quality, speed of output, and productivity of expensive machine tools.
We are the only global company with a full-line product portfolio that includes hot runner systems, injection molding, blow molding and extrusion equipment. We maintain strong market positions across these products and in process control systems, mold bases and components, MRO supplies and fluid technology. Our strategy is designed to utilize our strengths, installed base and leadership positions across our business units to maximize revenue across the life of the machine, which can be as long as 25 years or more. Management estimates that the value of available “consumable” revenue across the life of the machine is one to four times the cost of the machine. The consumables portion of the machine business is composed of (1) machine aftermarket parts and service which are required annually; (2) hot runner systems, hot halves and mold bases which are
81
Table of Contents
required each time new plastic parts are designed and existing parts are redesigned; and (3) upgrades and overhauls which occur as customers decide to improve the performance or extend the life of their machines. We offer service on both our own systems as well our customers’ other equipment. Finally, upon a customer’s decision to replace a machine, we can repurchase the machine and sell it in the secondary market as a certified pre-owned machine.
Typical Injection Molding Machine Lifecycle
According to the U.S. Department of Commerce Bureau of Economic Analysis, the average age of plastic processing equipment in 2013 in North America was approximately 12 years, representing an increase of in average age of 50% since 1980. Through our APPT and MDCS segments, we are uniquely positioned to supply and service the aging fleet of our customers.
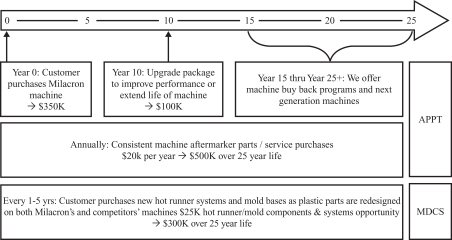
Our operations are diversified by geography, business and end market. We maintain over 27,000 customer relationships globally made up of many blue-chip and Fortune 500 companies including OEMs, molders and mold makers, across a diverse range of industries and also maintain longstanding relationships with customers, many with a tenure of over 30 years. For the year ended December 31, 2014, our top 10 customers accounted for only 8.9% of sales and no customer accounted for more than 1.6% of sales.
The charts below illustrate Milacron’s diversification by principal business segment, as a percentage of sales and Adjusted EBITDA for the year ended December 31, 2014.
| By Business (Sales) |
By Segment (Adjusted EBITDA)(1) | |
|
|
|
| (1) | Excludes Corporate Adjusted EBITDA of $(21) million. |
82
Table of Contents
The charts below illustrate Milacron’s diversification by end market and geography as a percentage of sales for the year ended December 31, 2014.
| By End Market (Sales) |
By Geography (Sales) | |
|
|
|
For the year ended December 31, 2014, we generated total sales, Adjusted EBITDA, Adjusted Net Income and net (loss) attributable to Milacron Holdings Corp. of $1,211 million, $199 million, $75 million, and $(15) million respectively.
Over the past seven years, we have realigned our global platform to improve profitability and competitive position. This realignment of our cost structure has included a shifting of the global manufacturing footprint, with the consolidation of plants in North America and Europe, offset by a significantly expanded presence in Asia. Over the last five years, we have invested approximately $35.3 million to increase manufacturing capacity in China and India. As a result of these investments and our ongoing facility consolidation in Europe, we will have an increasingly efficient network of production facilities in North America, China, India, and Europe sized to meet the demands in each region.
| Significant Initiatives & Investments since Early 2012 |
Milacron Today | |
| • Acquired Mold-Masters, Kortec and TIRAD
• Recruited high-caliber executive team
• Rolled out “One Milacron” initiative—integration and leveraging of our global footprint capabilities and customer relationships across all segments
• Developed new products, such as the E-Multi, M-PET and hybrid machine technologies
• Expanded production capabilities in certain high-growth and lower cost regions
• Employed manufacturing efficiency and low-cost sourcing initiatives
• Implemented an internal global back-office and engineering shared service center in India |
• Global growth platform with leading market positions in North America, China and India
• Plastic technology systems and solutions provider with a strong intellectual property portfolio
• 61% of 2014 sales from higher margin consumable products (recent acquisitions significantly enhanced historic percentages)
• Leading position in the high-growth and high-margin hot runner market
• Industry leading technology for shelf stable plastic packaging
• Upper teens Adjusted EBITDA margins
• Blue-chip customer relationships in all regions among original equipment manufacturers, molders and mold makers | |
83
Table of Contents
Our History
Milacron began operations in 1860 in Cincinnati, Ohio as a screw and die tap manufacturer, and expanded over the subsequent decades into a leading U.S. manufacturer of milling machinery and other equipment for metal processing. During World War II, we were a leading supplier of machinery and equipment for the war effort, and responded to the U.S. Government’s call for reduced oil consumption by developing the Cimcool line of synthetic metalworking fluids, which was launched commercially in 1945.
In the 1960s, we diversified into the growing market for plastic processing equipment by developing a line of injection molding equipment. We quickly grew into a leading position in the market, developing technologies for hydraulic and electric injection molding technology and entering the extrusion equipment market in 1972. We significantly expanded our plastic processing technology offering with the acquisition of Ferromatik in 1993, DME in 1996 and Uniloy Blow Molding in 1998. Ferromatik had a strong position in the European injection molding equipment market. In 1995 Milacron started operations in India, eventually establishing the leading position in that market. While we built our plastic processing technology business via acquisition in the 1990s, we concurrently sold the majority of our legacy metalworking equipment businesses, retaining only the Fluids business.
Mold-Masters was founded in 1963 as an independent manufacturer of hot runner systems, which were then penetrating the injection molding market given their efficiency, operating and product quality advantages over traditional cold runner systems. Mold-Masters expanded internationally with the establishment of operations in Japan in 1984, Germany in 1987, China in 2004, and India in 2007. Through a consistent focus on the development on new hot runner technology, Mold-Masters established a reputation as one of the leading innovators in the plastic industry.
After consistent growth from the 1960s through the 1990s, the plastic processing technology industry in North America was challenged in the 2001-2009 period by a reduction of spending by its customer base. We maintained strong share through this period but were burdened by significant legacy liabilities and excess production capacity. As a result of these liabilities and the 2009 recession, Milacron Inc. and its U.S. subsidiaries filed for bankruptcy protection in March 2009. In accordance with the Section 363 of the U.S. Bankruptcy Code sale, substantially all the assets and certain liabilities of Milacron Inc.’s U.S. subsidiaries and the equity interests of certain foreign subsidiaries, which did not file for bankruptcy protection, were acquired in August 2009 by Milacron LLC and its subsidiaries. The consistent support of its customers and efforts of Milacron’s employees enabled the business to emerge from bankruptcy with a clean balance sheet, reduced legacy costs and strong competitive position. We quickly regained our leading market share in North America, and the business continued to invest through this period to expand our position in emerging markets, particularly in India.
Following the CCMP Acquisition in April 2012, we significantly increased our capital investments to upgrade our machining capabilities and expand capacity in China and India to drive growth. Additionally, we identified the hot runner market as a highly attractive adjacency to capture more high-margin consumables revenue, add technology to enable unique solutions for our customers, and obtain greater visibility on project spending by customers early in the purchasing cycle. As a result, we targeted Mold-Masters as an acquisition opportunity and completed its purchase in March 2013 to combine two established leaders with complementary product offerings in plastic processing technologies. This transformational acquisition brought us a strong base of intellectual property applicable across our plastic technology business, leading hot runner market positions in North America, Europe, and Asia, and a consistent, high margin revenue stream. In summary, our strategy has resulted in a company that has fundamentally shifted its position in the industry and is now a leading global player in plastic processing technology across key technologies, end markets, and geographies.
84
Table of Contents
Our Competitive Strengths
Leading Market Positions, Product Breadth and Highly Regarded Brands Based on management estimates, we believe Milacron is the #1 manufacturer and supplier of plastic processing technologies in North America on a consolidated basis across the industry’s primary plastic processing machinery applications based on sales. We are also the #2 provider of hot runner systems worldwide based on sales. We continue to reinvest capital to establish and maintain our leading positions in emerging markets. We believe that the significant depth and breadth of our product portfolio provides us with a competitive advantage because it allows us to meet more of our customers’ demands as they expand their production capabilities. We believe Milacron has strong brand recognition with over 150 years of continuous operations. Our world class portfolio of brands, including Milacron, DME, Mold-Masters, TIRAD, Cimcool, Ferromatik and Uniloy, have long records of success selling products in over 100 countries across six continents.
Strategically Positioned to Benefit from Global Plastic Market Growth: Market growth is being driven by several fundamental dynamics including the re-tooling of an aging fleet in North America, continued conversion of metal and glass to plastic, and increased plastic consumption in emerging markets. We believe that our plastic processing technology combined with our customer driven sales approach positions us to add value to our customer base as they re-tool their aging fleets with aftermarket sales, retrofits and new equipment. Additionally, our strong technology offering across multiple applications positions us well to capitalize on the incremental growth from the continued materials conversion to plastic. Our international presence and our significant investments in manufacturing capacity in China and India provide a strong base on which we expect to capture emerging market growth.
Large Installed Base and Recurring Revenue Streams: We estimate that we have over 40,000 machines and over 140,000 hot runner systems installed globally. We have a significant opportunity to leverage our aftermarket business and contract services across our existing customer base. We believe we have a significant opportunity to further leverage our machine and hot runner customer base to drive sales and offer customized solutions combining the technology of Mold-Masters and Milacron. We believe we are the top global supplier of parts and service for our own equipment and have the opportunity to increase our share of this business for our installed base as well as that of our customers’ other equipment. The consumable products sold by our MDCS business, our Fluids business and our APPT aftermarket business provide recurring revenue streams. The acquisition of Mold-Masters in March 2013 significantly increased our sales of consumable products and services. We seek to add value to our customers through our lifecycle sales approach and capabilities, which allows us to capture more of our customers’ equipment spend on consumable products.
Leading Technology and Extensive R&D Capabilities: Our products and systems are highly engineered and customized. We hold approximately 1,000 active and pending patents on a range of technologies across our businesses and employ over 750 engineers and designers. Recent innovations include (1) our E-Multi co-injection unit which enables cost effective retrofit of injection molding systems to produce multi-material parts; (2) multi-layer blow molding; (3) co-injection solutions; (4) hybrid machine technologies that blend hydraulic and electric movements; and (5) our M-PET series product line for preform molding. A number of our technologies are helping to drive the conversion from metal and glass to plastic. We maintain a global engineering and design center in India with over 140 associates to lower design and engineering costs and offer customers 24-hour access to our engineering capabilities.
Diverse End-Markets and Customer Base: Our products and systems serve a broad and diverse range of end markets and customers. For the year ended December 31, 2014, no end-market accounted for more than 23% of our sales and we have a balanced geographical exposure. Our MDCS leadership positions in the medical, teletronics and closures end-users supplement our APPT strength in automotive and packaging end-markets and offers a platform from which we can expand the presence of each business in new markets and cross-sell our products and services to existing customers. As of December 31, 2014, our businesses maintained an estimated total of more than 27,000 customers. No single customer accounted for more than 1.6% of sales and our top 10
85
Table of Contents
customers accounted for 8.9% of sales for the year ended December 31, 2014. Milacron is a preferred supplier to many key original equipment manufacturers (“OEMs”), end-customers whose time to market and profitability depend on our ability to design and manufacture highly customized products with short lead times. As a result of working directly with end users including OEMs and brand owners, our systems are frequently specified by name by the end user and we gain visibility into new opportunities in the plastic technology value chain.
Efficient Cost Structure and Operating Flexibility: We are in the early stages of lean implementation and have undertaken a number of initiatives to improve our cost structure and operating flexibility, which we believe will drive significant growth over the next three years. This includes consolidating manufacturing locations in North America and Europe and implementing lean initiatives to leverage our supply chain and increase low cost country sourcing. We are concurrently investing to expand capacity in higher growth markets in China and India, both for local market sales and for export to our global customer base and see continued opportunities to implement lean initiatives across our facilities. We are experiencing strong margin improvement momentum through continued operational excellence, further enhancing the attractive free cash flow characteristics of our business.
Track Record of Deploying Capital at Attractive Returns: Since early 2012, our management has identified and executed strategic capital deployment initiatives including accretive tuck-in acquisitions and manufacturing efficiency projects, which have improved our competitive position and financial profile. Our acquisition strategy is intended to broaden and deepen our portfolio and enhance our ability to service customers. These acquisitions have included our 2014 acquisitions of Kortec and TIRAD, each of which have been successfully integrated with our existing business and product development process. As part of our ongoing lean manufacturing initiatives, we have implemented several successful manufacturing footprint projects including our ongoing manufacturing footprint projects in Europe. We believe these projects allow us to expand margins and compete effectively across our global manufacturing base. We continue to see opportunity to execute accretive acquisitions and high payback efficiency projects.
Experienced and Highly Skilled Management Team: Our senior management team consists of industry veterans with proven track records of operational excellence and strategic vision. Our team has successfully implemented both organic growth initiatives and strategic acquisitions. We have realigned our business segments and management structure to maintain and enhance our market leading position and executed effective strategies to focus on high growth and profitable markets. Our senior management team has an average of 30 years of plastic and industry experience, with much of this experience stemming from either our customers or other organizations within our value chain. This experience enables us to bring a customer’s perspective to our company and has influenced our strategy of providing value-enhancing lifecycle solutions to our customers.
Our Strategy
Our strategy is to Grow Share Profitably, Fund the Future by Driving Margin Improvements, Make Possibilities a Reality by Continued Reinvestment and Win Together as “One Milacron.”
Grow Share Profitably: We plan to grow our market share profitably by: continuing to drive lifecycle sales, continuing to penetrate emerging markets, continuing our customer focused market approach, introducing new products and technology innovation and leveraging the capability and reach of our sales force.
| • | Leverage our Installed Base and Technology to Continue to Drive Lifecycle Sales: Consumable sales are an attractive and recurring revenue opportunity. Our management estimates that the value of available consumable revenue across the life of a machine is one to four times its initial cost. Our lifecycle sales include (1) machine aftermarket parts and service; (2) hot runners and mold bases, which are replaced each time new plastic parts are designed and existing parts are redesigned; and (3) upgrades and overhauls as customers decide to improve the performance or extend the life of equipment. |
86
Table of Contents
| • | Continue to Penetrate Emerging Markets: Over the last three years, we have invested in additional sales, service and manufacturing capacity in China and India, as well as maintaining a large and experienced local sales force in these and other emerging growth countries. Our businesses in emerging markets are growing and we believe we can further increase our penetration rate in emerging markets in Asia, Africa and Central America. |
| • | Customer Focused Market Approach: Our market approach is to provide a tailored solution addressing the needs of each customer. As a part of our lifecycle sales approach, we offer fleet assessments whereby we analyze the costs and benefits of upgrading or overhauling the customer’s fleet as opposed to outright replacement with new equipment. We believe we have a competitive advantage because we offer a broad set of repair services and upgrade technologies and do not limit our upgrades and overhauls to only Milacron equipment. |
| • | New Product and Technology Innovation: We have a pipeline of new product technical innovations that are designed to provide customer focused solutions. These technology solutions are expected to increase penetration in growth areas including co-injection systems for packaging and medical applications and next-generation hot runner systems design. We believe there is a large addressable market for high performance products, and we have a significant opportunity to gain additional market share. Our innovative solutions allow us to price our products at a premium to our competitors because of the differentiated technology and attractive value proposition that we offer. We recently launched new technology, including the Klear Can Co-injection Turn-Key System and the E-Multi All Electric Retrofit Solution. |
| • | Leverage the Capability and Reach of our Sales Force: We believe we have one of the largest direct sales forces in the industry, with over 400 sales professionals across our businesses. We have recently acquired or opened centers in Texas, California and Mexico to extend our sales reach in those markets. We have also created a Strategic Accounts Management sales leadership team to drive relationships with major plastic processors across our different product lines. We believe this will enhance our leadership position in the injection molding equipment market, and continue to drive share gains for our overall business. |
Fund the Future by Driving Margin Improvement: While we have made significant progress in improving our operational efficiencies, we are in the early stages of implementing a number of initiatives which we anticipate will drive margin growth over the next three years. In addition to savings achieved to date through our ongoing lean initiatives, we expect our recent and continuing investment in facilities consolidation, administrative and sourcing cost savings and back office integration efforts to drive over $30.0 million of run-rate annual savings by the end of 2017.
| • | Facilities Consolidation Enabled by Recent Acquisitions: We continue to optimize our facility footprint by moving production to low cost countries. Our recent acquisitions of Mold-Masters in 2013 and Czech Republic-based TIRAD in 2014 provide the incremental scale to enable additional facility consolidation. While these initiatives are in early stages, currently announced facilities closures are expected to reduce annual operating expenses by approximately $2.2 million upon completion. We have also recently made substantial investments in China and India, both to meet growing domestic demand in those markets and to expand our low cost production capabilities for export. We will continue to seek opportunities to expand our low cost manufacturing footprint in growing markets and consolidate production to drive greater efficiencies. |
| • | Continued Back Office Integration and Operating Efficiencies: We are also in the process of transitioning certain engineering and administrative functions to a shared service center in India. We have realized approximately $1.8 million of annual run-rate savings as a result of these initiatives. We expect these savings to increase as we continue to explore opportunities to maximize efficiencies and overhead savings by expanding the shared service center platform. |
87
Table of Contents
| • | Continue to Implement Lean Initiatives: We are successfully improving operational efficiency and reducing costs through the implementation of lean initiatives which include low cost country sourcing. In 2014, we procured approximately 25% of material requirements for our APPT, MDCS and Fluids businesses from low cost countries and plan to increase this amount over the next few years by continuously sourcing additional providers of lower cost materials. In 2014, we realized approximately $11 million in savings from improvements in global sourcing programs. We anticipate that our global sourcing leverage will improve, particularly due to overlapping spend in steel, electrical and other commodity purchases across our APPT and MDCS business segments. |
Make Possibilities a Reality by Continued Reinvestment: We continually invest in new product development in pursuit of our product vitality goal to achieve 15% of sales from products introduced in the last three years. We have made investments to improve efficiencies and increase capacity. In 2014, we added capacity across our three business segments and we intend to leverage our existing European and Asian manufacturing footprint to increase capacity in our MDCS product lines with minimal incremental investment. We plan to continue focusing on growing each of our businesses through efficient use of existing capacity and workforce:
| • | Over the last three years, we invested approximately $12.6 million to develop infrastructure in China and shifted production of several standard components, such as nozzles and manifolds to the China facility. This has resulted in significant cost savings for the realigned products. We plan to continue investing in the Chinese facility to further increase capacity and capabilities. |
| • | Over the last five years we have doubled our production capacity to serve the growing India injection molding market, while investing over $16 million in our Ahmedabad, India facility. |
We have broadened our portfolio significantly through a series of strategic acquisitions as large as $1 billion and as small as $1 million in size, and continue to see opportunity to execute accretive acquisitions.
Win Together as “One Milacron”: Our “One Milacron” initiative was designed to integrate and leverage our global footprint capabilities and customer relationships across all of our business segments with a “win together” culture. First, we are dedicated to providing best-in-class quality and safety for our customers and employees. We believe this approach will continue to allow us to build world-class leaders, account management and sales teams who deliver great service to every customer across Milacron’s businesses. We work closely with our customers throughout their design process and provide them with one-stop complete end-to-end plastic processing solutions that optimize their total cost of production rather than just focusing on selling new equipment. We believe this approach differentiates us from our competitors and helps us develop and maintain long-term customer loyalty.
Our Businesses
We operate globally through three segments: Advanced Plastic Processing Technologies, Melt Delivery and Control Systems and Fluid Technologies. Our products include, but are not limited to:
| APPT |
MDCS |
Fluids | ||
| • Injection molding machines • Extrusion machines • Blow molding systems • Structural foam equipment • Spare parts • Retrofit packages • Complete rebuilds, machine calibration • Maintenance and training • Contract machining |
• Hot runner systems • Process control systems • Mold bases • Mold components • MRO supplies (maintenance, repairs, operations) |
• Synthetic and semi-synthetic lubricants and coolants and premium soluble oil • Process and maintenance cleaners • Stamping and forming fluids • Corrosion inhibitors |
88
Table of Contents
Advanced Plastic Processing Technologies

We are a global leader in the manufacturing, distribution, servicing and sale of equipment and products used in the plastic processing equipment industry, including injection molding, blow molding and extrusion applications through our APPT business segment. We are the only full-line plastic equipment supplier with a significant offering across all three applications in North America. Based on management estimates, we believe we are the #1 manufacturer and supplier of plastic processing technologies in North America on a consolidated basis across the industry’s primary plastic processing machinery applications based on sales. We believe we are the #1 manufacturer and supplier of injection molding technologies in India based on sales. We provide aftermarket service and support for our core plastic equipment business and are expanding our capabilities of the high growth co-injection market. We serve a diverse set of customers, including companies that manufacture products such as food and beverage containers, consumer goods packaging, electronic components, medical devices and automotive parts. We believe that our competitive strength in equipment is our ability to supply and support our customers through the entire life cycle of their equipment usage to deliver precision parts at the lowest cost for our customers.
Injection Molding: Injection molding is a highly versatile process used to make a wide variety of plastic products, ranging from automotive parts and electronic devices to consumer goods, medical equipment and containers. Injection molding machines are used for creating solid plastic parts, including those used in consumer goods such as appliances, car seats, automotive products such as interior panels and trim, dash boards, bumpers, air vents and hoses, and “under-the-hood” components, parts for electronics such as casings and frames for cell phones and other hand-held devices, televisions, office equipment, and a variety of packaging products including food and beverage containers. We believe we are the largest manufacturer and supplier of injection molding equipment for the North American market and a recognized technology leader in all-electric injection molding, co-injection, multi component/material/color, high-tonnage, and low-pressure foam/gas-assisted injection molding. Our injection molding technology offering includes our patented Kortec co-injection system for high speed production of multi-layer parts. We provide tailored solutions using best-in-class technology, sophisticated engineering and processing capabilities and comprehensive support leading to reduced cost per part for customers, while assuring high-quality part production.
Blow Molding: Blow molding is used to produce hollow plastic parts. Common products manufactured using blow molding machines include containers for dairy and other beverages, food, oils, pharmaceuticals and cosmetics, and fuel and chemicals, automotive components such as fluid reservoirs, headrests and other hollow plastic parts. Our equipment is capable of processing a broad range of plastic resins, including high density polyethylene, polypropylene, polycarbonate and polyvinyl chloride. Our Uniloy brand is well known for quality blow molding systems in the automotive, food packaging, medical, toy, household chemical, personal care and industrial end markets, among others, and is an industry leader in liquid food packaging applications, particularly the dairy, juice and water packaging markets. Our ability to design and manufacture molds and tooling enables us to provide full blow molding systems and single source solutions to our customers.
Extrusion Applications: Extrusion equipment produces parts by providing a continuous flow of plastic, extruded through a die and cut to individual lengths, such as plastic piping. In North America, we are a leading producer of extrusion process technology, primarily for building and construction materials. Our twin screw extruder products excel in producing PVC pipe, window profiles, vinyl siding, and profiles of wood and natural fiber plastic composites while our single screw extruders are used in sheet, profile, pipe and pelletizing applications. Smaller models of our single screw extruder products serve end markets for plastic film and medical tubing. In 2015, we launched our extrusion product line into India.
89
Table of Contents
Aftermarket: We provide aftermarket services, parts and support to customers throughout the product lifecycle to increase efficiency and reduce costs within a broad range of applications. We provide a wide range of technologies to extend equipment life cycles for injection, molding, extrusion, blow molding and structural foam equipment along with spare parts, retrofit packages, complete rebuilds, machine calibration and process, maintenance, and operator training. We offer a unique technology using full 3-D modeling which helps customers troubleshoot common maintenance issues and efficiently order spare parts online. We manufacture and rebuild (including for competitor products) parallel and conical twin screws in North America and our coatings applied to twin screws are relied upon to extend their useful lives. We have a large installed base estimated at over 40,000 machines globally and estimate that we are the #1 supplier of aftermarket services and sales on our machines. Aftermarket sales represent a recurring and high margin business relative to the equipment businesses. We have invested over the past five years to upgrade our aftermarket sales and service organization, including by establishing a new call center in Batavia, Ohio. Aftermarket sales comprised approximately $200 million, or approximately 30%, of our APPT sales in 2014.
Melt Delivery and Control Systems

|

|

|

|
We are a global leader in the manufacturing of a comprehensive line of plastic delivery and precision control systems for injection molding applications through our MDCS business segment. We provide highly-engineered, technically advanced hot runner systems, process control systems, mold bases, mold components, aftermarket parts and related technologies and services for injection molding, as well as MRO supplies for plastic processing operations.
Based on management estimates, we believe we are a leading supplier of hot runner systems, hot halves, mold bases, components and MRO supplies in North America, Europe, and Asia. Through our Mold-Masters brand we are a leading global manufacturer of a comprehensive line of plastic delivery and precision control systems for injection molding applications. The Mold-Masters product line includes highly engineered, proprietary hot runner systems, control systems, aftermarket parts and related services. According to Interconnection Consulting, we hold the #2 market position in the global hot runner industry, the #1 market position in the Americas, the #1 market position in Europe and a growing #2 market position in Asia, with leading global market positions in the electronics and medical end-markets, in each case based on sales relative to estimated market size. Through our DME brand we provide a wide range of standard and special mold tooling products with the latest advances in mold technologies to reduce cycle times, increase output and improve productivity. Our DME brand products fall into three primary categories: mold bases, mold components and hot runner systems, each of which are typically replaced in an injection molding system when a new end product is produced or the mold component product wears over time. Offering high-quality MRO products at competitive prices, we strive to become an extension of our customers’ businesses by meeting their day-to-day needs for small tools, gauges, temperature regulators, lubricants, safety supplies and thousands of other items.
Our MDCS segment serves a diverse group of global customers across the entire plastic processing value chain and manufacturing spectrum, including OEMs, molders and mold makers, in the consumer electronics, automotive parts and structures, food and beverage containers, medical devices, building supplies and general packaging. Our MDCS segment supports its global customer base through 13 manufacturing facilities, sales and service locations in 23 countries and over 2,500 employees worldwide.
Our MDCS segment derives substantially all of its revenue from recurring consumable products, parts and services. Hot runner systems are highly customized and replaced frequently due to design changes and innovation in customers’ end products, driving a one to five year replacement cycle. Recurring revenue for our
90
Table of Contents
MDCS segment is supported by a large estimated installed base of more than 140,000 systems worldwide as of December 31, 2014, generating an aftermarket service opportunity with attractive margins.
The following are descriptions of the key product categories we provide through our MDCS segment:
Hot Runner Systems. A hot runner system is a highly engineered, custom designed system that channels molten plastic from an injection molding machine into a mold while optimally filling the mold cavity at the required uniform temperature and pressure. The key components of hot runner systems are the technically advanced manifolds and nozzles that facilitate the melt, distribution and transfer, or “shot” of the molten plastic into the mold.
Process Control Systems. Our E-Multi auxiliary injection molding unit typically bolts onto the injection molding machine and allows molders to convert their standard injection molding machines into higher value multi-material systems which mold more than one plastic material in the machine. This process is critical in the production of items such as toothbrushes or closures with integrated oxygen barrier properties.
Controllers. A controller is electronic technology used to control the hot runner temperature but also for motion control pressure, sequence control, mold cooling and other value-added intelligence activities. A hot runner controller can be sold with a hot runner system or as a standalone product and can control a Mold-Masters hot runner system or a competitor’s hot runner system.
Mold Technologies excluding Hot Runners. We define Mold Technologies as mold bases and mold components. A mold base is an assembly of special mold steel blocks manufactured to specific dimensions. Mold components include items used in the molding process such as leader pins, sprue bushings, dowels, locating rings, springs and baffles.
Aftermarket Parts. MDCS aftermarket parts and value-added post-sale services establish our MDCS business as a partner to its customers. We have an installed estimated base of more than 140,000 systems worldwide as of December 31, 2014, providing a growing source of aftermarket parts demand.
As injection molding processing technologies and material requirements evolve, our MDCS business is committed to partnering with its customers across the life cycle of a machine by leveraging its industry knowledge and engineering expertise to develop technologies that help its customers adapt and succeed. We believe that our MDCS business is a global leader in manufacturing technologically advanced hot runner and control systems and our commitment to technology is evidenced by what we believe to be an industry leading patent portfolio.
Fluid Technologies

Through our Cimcool brand, we are a leading manufacturer of premium coolants, lubricants, process cleaners and corrosion inhibitors that are used in a variety of metalworking applications such as cutting, grinding, stamping and forming, as well as in the production of glass and mirrors and in high-tech processes such as high speed machining. In particular, we are an established market leader in synthetic and semi-synthetic metalworking fluids. Our fluid products are essential to manufacturing operations, preventing the malfunction of machinery, rusting, machine overheating, contamination and disruption in the production process. We sell fluids with advanced formulations that prolong the life of our customers’ tools, reduce coolant usage, and improve metal removal and metal forming productivity, while meeting stringent performance, health, safety and environmental requirements. Major global end markets for our fluids include automotive, industrial components and machinery,
91
Table of Contents
aerospace, appliances and oil and primary metals. While our fluids typically represent a small portion of our customers’ total production costs, they are essential to their manufacturing operations. For over half a century, our specialty has been synthetic (water based) and semi-synthetic fluids, which provide excellent lubricity and are generally more environmentally friendly than traditional oil-based products. We have also developed advanced “green” fluids, made from renewable oils and synthetic esters.
When customers want to improve part quality, tool life, production efficiency or even the work environment, they turn to us to deliver solutions. Supplied in trademarked pink drums, our Fluids segment provides high quality lubrication technology. Coupled with on-site technical services, we help customers lower operating costs and to help them be more competitive. Milacron was the first company to patent fluids diluted in water and has been a supplier of choice since 1947. With what we believe to be some of the strongest and longest customer relationships in the industry, our business is consistently recognized as a market leader in technology by both customers and competitors. Our fluids products are used in diverse emerging applications such as aerospace titanium, sapphire glass grinding, windmill energy systems and smartphones. We support traditional metalworking customers while always looking to expand into new market opportunities.
Global Operations
As OEMs continue to increase their activity with suppliers who possess a seamlessly integrated global manufacturing, selling, distribution and service platform, we differentiate ourselves by managing a highly complex set of material flows through a coordinated global footprint mapping process. The result is local customization governed by global methods standardization. We have the ability to accurately map out global material availability and manufacturing capacity to bring a high quality product to market in the shortest amount of time. The tight integration among sales, engineering and operations teams leads to a global footprint which distills a very complex system of moving parts into a clear operating plan. Ultimately, our global reach allows product complexity and cost structures to be balanced against regional service levels, capabilities and capacities.
Over the last few years, we have realigned our operational structure to optimize our presence in the global markets we serve. Specifically, we have increased our investment in Asia and reduced costs in our European operations to better match our resources with shifting market demand. While continuing to emphasize operational excellence, management is also focused on growing our business through expansion in emerging economies, particularly in India, Eastern Europe, Central and South America, Africa and Asia increasing marketing efforts to win new customers, and leveraging our industry leading technologies to capture market share in attractive end markets. In 2014, approximately 55% of our total sales were generated outside of the United States. In the past several years, we have undertaken several initiatives to capitalize on the significant opportunities available in emerging markets, particularly in Asia. Leading our expansion in this region is Ferromatik India, which we believe is the #1 manufacturer and supplier of injection molding technologies in India based on sales, excluding imports, and China, where we have a leading position in the hot runner market through our MDCS business.
Since 2010, we have doubled the machine production of our India injection equipment operations to meet anticipated market demand. We also have blending operations in China and Korea for our Fluids business, with recently expanded capacity as sales have almost tripled in those regions since 2007. In the last four years, we have reinvested $17 million to more than double component capacity at our Mold-Masters facility in Kunshan, China.
We believe we are well positioned to leverage our experience operating in India to gain plastic equipment market share in China, which, based on research from Freedonia and management estimates represents a $7.6 billion annual market as of 2012, by far the largest market in the world, and is projected to grow by 8.2% annually through 2017 according to Global Industry Analysts, Inc. We believe that we can significantly increase our penetration rate into this large market as we continue to expand our capabilities, operations and relationships in the region.
92
Table of Contents
We have also increased our presence in China by expanding our capacity for injection molding assembly in our Jiangyin, China facility in 2014.
In addition to India and our growing presence in China, we have a significant presence in other non-traditional and growing markets. We have a significant market position in Mexico and other Latin America markets, with nearly $80.4 million in sales to these regions for the year ended December 31, 2014, which reflects an increase of 38% over the prior year.
We are also focused on Eastern Europe and locations outside traditional Western European markets. In 2014, we acquired TIRAD, a leading Czech precision manufacturer of components for injection molding and other industries. Sales in these countries accounted for over $63.8 million for the year ended December 31, 2014 and are expected to experience above market growth, relative to the rest of Europe over the long term.
Customers
We maintain over 27,000 customer relationships, including OEMs, molders and mold makers, across a diverse range of industries, including medical, teletronics, household appliances, consumer goods, automotive, packaging, construction and industrial equipment and components. We have long-standing relationships with our key customers, having served many of our top customers for over 30 years. In 2014, our largest customer accounted for only 1.6% of total sales and our top 10 largest customers accounted for only 8.9% of total sales.
Competition
Advanced Plastic Processing Technologies
In general, plastic equipment competitors are large companies that compete with us on a global basis. Some are divisions of larger companies, and some offer an extensive range of plastic processing machines for extrusion, injection molding, blow molding, compression molding and thermoforming processes. Our main machine competitors are Arburg (Germany), Battenfeld Cincinnati (Austria, which includes American Maplan (United States)), Bekum (Germany), Davis Standard (United States), Engel (Austria), Graham Engineering (United States), Haitian International Holdings (China), Husky (Canada), Krauss Maffei (Germany, which includes Netstal Maschinen AG (Switzerland)), Sumitomo Heavy Industries (Japan) and Toshiba (Japan). Many of our international competitors have recognized the attractive opportunities that exist in North America and have made efforts to penetrate the market.
We believe we have an attractive competitive position in APPT. As a leading player in North America with a strong sales and service team and the only major U.S. production facility capable of producing injection molding, blow molding and extrusion applications, we are well positioned to maintain our market share in this highly desirable market. Moreover, we have a global manufacturing and sales base, in contrast to the local or regional presence of some of our competitors. From a technology perspective, we have the capability to supply customers with fully integrated systems, or critical subsystems (equipment, hot runners, and mold bases) based on their preference. Finally, customers of our products benefit from a strong, global aftermarket service and support network that addresses both the large Milacron and competitor installed bases.
We believe we are the #1 global supplier of parts and service for our own equipment and believe we have room to increase share of aftermarket on our competitors’ equipment. We compete with various regional and local parts and service providers, as well as certain OEMs in this market. Because customers prefer an integrated service model once the machines are installed, we believe we have significant advantages over our competitors in achieving additional growth in the aftermarket business.
93
Table of Contents
Melt Delivery and Control Systems
The hot runner and mold industry is highly fragmented. The majority of the industry competes on regional and niche levels, with only a few truly global players. We estimate that there are thousands of hot runner / mold makers serving the plastic industry, mostly operating as small scale custom tooling shops. We have industrialized and standardized the mold and parts-making process by employing large scale automated manufacturing processes that use innovative manufacturing techniques that we believe cannot easily be replicated. Our main competitors in the MDCS market are LKM (China), Futaba (Japan), Hasco (Germany), Meusburger (Austria), Misumi (Japan, which includes PCS (United States), Progressive (United States). Husky (Canada), Synventive (United States) and Yudo (Korea).
According to Interconnection Consulting, we hold the #1 position in the Americas and Europe and a growing #2 position in Asia in the overall hot runner segment, as well as leading global market positions in the electronics and medical end markets, in each case based on sales relative to estimated market size. Management estimates that MDCS holds the #1 market position in the global premium hot runner segment, and differentiates itself from competitors with its technically advanced product designs, market specific solutions and best in class service.
Fluid Technologies
Our Fluids segment competes with other suppliers of industrial fluids such as Castrol Industrial (U.K.), FUCHS Petrolub (Germany), Quaker Chemical (US) and Houghton/DA Stuart (US), which was acquired by Gulf Oil of India. However, because we specialize in high-performance synthetic (water based) and semi-synthetic fluids, we believe there are few players who compete directly with our Fluids business. We believe we are well positioned to maintain a leadership role in the industrial fluids industry. The Fluids segment has inherent customer retention value, given its emphasis on high-end products with low turnover and high-touch service compared to its competitors’ commodity based products. Moreover, we continuously invest in research and development to develop advanced “green” fluids made from renewable oils and synthetic esters.
Facilities
We have taken a disciplined approach in realigning our manufacturing presence to optimize our cost structure and ability to serve high growth regions. We operate sales offices in over 20 countries with a sales and service network that covers all major markets across the globe. Our corporate headquarters, which includes our executive offices, are located in Cincinnati, Ohio.
94
Table of Contents
The following table describes our principal owned and leased properties as of December 31, 2014:
| Location |
Square |
Type |
Own/ |
APPT |
MDCS |
Fluids |
||||||||||||||
| Americas |
||||||||||||||||||||
| Batavia, Ohio |
490,000 | Manufacturing | Own | ü | ||||||||||||||||
| Irvine, California |
16,000 | Distribution | Lease | ü | ||||||||||||||||
| McPherson, Kansas |
93,000 | Manufacturing | Lease | ü | ||||||||||||||||
| Mt. Orab, Ohio |
213,000 | Manufacturing | Own | ü | ||||||||||||||||
| Rowley, Massachusetts |
46,000 | Manufacturing | Lease | ü | ||||||||||||||||
| Querétaro, Mexico |
41,000 | Distribution and Service | Lease | ü | ||||||||||||||||
| Southlake, Texas |
24,000 | Distribution and Service | Lease | ü | ||||||||||||||||
| Tecumseh, Michigan |
75,000 | Manufacturing | Lease | ü | ||||||||||||||||
| Georgetown, Ontario, Canada |
122,000 | Manufacturing | Lease | ü | ||||||||||||||||
| Georgetown, Ontario, Canada |
54,000 | R&D | Lease | ü | ||||||||||||||||
| Brantford, Ontario, Canada |
18,000 | Manufacturing | Lease | ü | ||||||||||||||||
| Sao Paulo, Brazil |
12,000 | Manufacturing | Lease | ü | ||||||||||||||||
| Madison Heights, Michigan |
71,000 | Distribution | Own | ü | ||||||||||||||||
| Greenville, Michigan |
65,000 | Manufacturing | Lease | ü | ||||||||||||||||
| Windsor, Ontario, Canada |
24,000 | Manufacturing | Own | ü | ||||||||||||||||
| Youngwood, Pennsylvania |
140,000 | Manufacturing | Own | ü | ||||||||||||||||
| Cincinnati, Ohio |
100,000 | Manufacturing, Corporate HQ | Own | ü | ||||||||||||||||
| Europe |
||||||||||||||||||||
| Berlin, Germany |
16,000 | Distribution and Service | Lease | ü | ||||||||||||||||
| Magenta, Italy |
97,000 | Manufacturing | Lease | ü | ||||||||||||||||
| Malterdingen, Germany |
420,000 | Manufacturing | Own | ü | ||||||||||||||||
| Policka, Czech Republic |
55,000 | Manufacturing | Lease | ü | ||||||||||||||||
| Baden-Baden, Germany |
67,000 | Manufacturing | Lease | ü | ||||||||||||||||
| Hereford, United Kingdom |
14,000 | Manufacturing | Own | ü | ||||||||||||||||
| Mechelen, Belgium |
70,000 | Distribution | Own | ü | ||||||||||||||||
| Zeletava, Czech Republic |
36,000 | Manufacturing | Own | ü | ||||||||||||||||
| Vlaardingen, Netherlands |
74,000 | Manufacturing | Own | ü | ||||||||||||||||
| Asia Pacific |
||||||||||||||||||||
| Ahmedabad, India |
240,000 | Manufacturing | Own | ü | ||||||||||||||||
| Jiangyin, China |
87,000 | Manufacturing | Lease | ü | ||||||||||||||||
| Kunshan, China |
176,000 | Manufacturing | Own | ü | ||||||||||||||||
| Coimbatore, India |
25,000 | Manufacturing | Lease | ü | ||||||||||||||||
| Maharashtra, India |
22,000 | Manufacturing | Own | ü | ||||||||||||||||
| Shenzhen, China |
13,000 | Distribution | Lease | ü | ||||||||||||||||
| Shinoli, India |
22,000 | Manufacturing | Own | ü | ||||||||||||||||
| Shanghai, China |
59,000 | Manufacturing | Lease | ü | ||||||||||||||||
| Ulsan, South Korea |
100,000 | Manufacturing | Own | ü | ||||||||||||||||
|
|
|
|||||||||||||||||||
| Total |
3,197,000 | |||||||||||||||||||
|
|
|
|||||||||||||||||||
Our ownership interests in real property are materially important as a whole. However, we do not own any individual materially important property and therefore do not present a description of our title to, or other interest in, our properties.
95
Table of Contents
Research and Development
We continually invest in research and development to improve the performance of existing products, to bring new products to market and to remain at the technological forefront of the plastic processing, melt delivery and controls and metalworking fluids industries. A longstanding organizational commitment to funding developments in new technology has led to numerous new products and serves as the engine for a new product development pipeline that we believe positions us for continued growth and increased market share. Recent research and development innovations have focused on the transition to a fully integrated process controls company, with new technologies, such as E-Multi, presenting significant market opportunities. We have design engineers in all major production regions worldwide, including a global design center in India and a research and development center in Ohio, USA and Canada.
We are committed to developing new products that meet the evolving needs of the industries and customers we serve. The new product development team is working to bring new products to market faster and more effectively in order to increase global sales from new products released within the last three years to their innovation target of 15% of total net sales. We invested $24.3 million and $19.0 million in research and development for the years ended December 31, 2014 and December 31, 2013, respectively, and $8.0 million for the Successor Period 2012 and $4.3 million for the Predecessor Period 2012.
Intellectual Property
We have a long history of new product development and currently hold approximately 1,000 active and pending patents on a range of technologies. Our intellectual property portfolio, and in particular product designs with MDCS and proprietary chemical formulations used in our Fluids business, serve an important role in protecting our and our customers’ competitive positions by building barriers to entry and increasing switching costs. Our recent Mold-Masters and Kortec acquisitions have added significant intellectual property related to hot runner system design and functionality, which we believe provides us with a competitive advantage. In connection with our patented and proprietary technologies, we hold a number of trademarks worldwide that we believe are important to protecting our brand.
Raw Materials and Suppliers
In order to secure our supply needs, we have developed a global network of reliable, low-cost suppliers. We source approximately 25% of our components and materials from suppliers located in low cost countries and are working towards increasing this percentage. We source certain components from third-party suppliers and continually review our costs to determine whether to outsource or utilize in-house capabilities. Prior to sourcing from third-party suppliers we evaluate the suppliers management capabilities and, where necessary, product quality and performance. Steel, which we source both directly and indirectly through our component suppliers, is the primary material used in our products and represented approximately 35% of total material costs globally in 2014. We do not enter into derivative financial instruments to hedge our commodity price risk and currently do not have a significant number of long-term supply contracts with suppliers. We estimate that approximately $8 million to $10 million of annual run-rate cost-savings will be realized by the end of 2015 from ongoing low cost country sourcing initiatives and other third-party supplier cost reduction projects.
Sales and Marketing
Our approach to sales and marketing is a key part of our strategic initiatives to drive growth. Our sales have an increasingly global focus, while maintaining regional flavor through our international brands. We have also focused our sales on key accounts, implementing corporate buying agreements with select customers while targeting several others. Our sales of aftermarket services and parts and our MDCS products benefit from our extensive global installed base of equipment, creating an advantage over our competitors in securing a wide base of customers for our high-margin offerings. In order to better leverage our proprietary network of installed
96
Table of Contents
machines, we have taken steps to implement best-in-class practices in a number of areas such as pricing, inventory management, e-commerce programs and using the latest technology to best serve our customers. We plan to replicate the Americas aftermarket component of our APPT business model on a global level, building on existing infrastructure and growth strategies to increase aftermarket sales levels across all of our businesses worldwide.
Our direct sales efforts have resulted in a more concentrated effort to promote our value-add products which may include machine upgrades to promote improved performance or cost savings for our customers. We have also created a Strategic Accounts Management sales leadership team to drive relationships with major plastic processors across our different product lines. We believe this will enhance our leadership position in the injection molding equipment market and continue to drive share gains for the overall business.
Our APPT sales teams often work closely with all decision makers in the value chain to ensure that our equipment and products are effectively designed to produce the desired solution. Our sales force acts as the conduit between the customer and our team of engineers, working closely with the customer to design a product that meets their specifications
Most of our direct MDCS sales team members have engineering backgrounds with significant tenure in the plastic industry, supporting the team’s highly technical approach to the sales process. Our sales force focuses on generating pull-through demand. We believe that one of the value drivers of our MDCS sales force is that we work extensively with OEMs, or brand owners, on product design and design for manufacturing, which allows us to be specified as the hot runner supplier when those projects go to production. The sales force acts as the conduit between the customer and designers, working closely with designers to communicate customer needs and working with customers to communicate our unique design and functional capabilities. We believe that these points of contact throughout the value chain give us visibility on where investment is happening in the plastic industry, which is relevant both to our APPT business and our MDCS business.
Our Fluids business sells its products primarily through its direct sales and distribution networks. In connection with most accounts, the segment supports their fluids with service and analysis, but generally does not enter into contracts for chemical management. New business may be captured by offering customer trials of the product. We continuously work with customers to reformulate our products to best serve their individual needs.
We do not typically have long-term supply agreements with customers and terms are generally negotiated on an individual order basis. We typically require customers purchasing injection molding, blow molding or extrusion machines to make a 10% to 40% down payment when an order is placed, often with a series of additional progress payments required prior to shipment which helps ensure collection of the full purchase price. Pricing is set at the time of order, typically on a customized basis for each product. Raw materials and component purchases are managed based on new machine order trends, allowing us to reduce the risk of changes in raw material and components pricing.
Employees
As of December 31, 2014, we employed 5,252 associates. Approximately 700 of our European associates belong to work councils or are otherwise subject to labor agreements. We believe that relations with its employees are generally good.
Indemnification and Insurance
We have domestic and international insurance coverage, leveraging our purchasing base across facilities for property and casualty, workers compensation, and other liability insurance. Management believes its insurance levels are appropriate for the scope and size of its operations.
97
Table of Contents
Regulatory
We are subject to various regulatory reviews and compliance including Ministry of Labor, OSHA and ISO audits. We believe we are in compliance with regulations in all material respects.
Environmental
We are subject to laws, regulations and permitting requirements relating to the protection of the environment and public and workplace health and safety, including those governing discharges of pollutants to the air and water, the management and disposal of hazardous substances and wastes, the clean-up of contaminated sites and the protection of employee health and safety. Failure to comply with, or imposition of liability under, such laws and regulations could result in significant costs, including clean-up costs, fines and sanctions, and claims by third parties for property damage and personal injury. Some environmental laws impose strict, and in certain circumstances joint and several, liability on present and former owners and operators of facilities and sites for contamination at those locations. Many of our facilities and sites have an extended history of industrial use. From time to time, soil or groundwater contamination has been detected at some of our sites. We are currently, and have in the past been, engaged in investigation and remediation of these facilities. We do not currently believe that any future remediation or compliance costs, or claims of government or other parties, involving environmental, health or safety matters would have a material adverse effect on our business. However, it is not possible to quantify with certainty the potential impact of actions relating to environmental, health and safety matters, particularly remediation and other compliance efforts that our subsidiaries may undertake in the future, due to uncertainties about the status of laws, regulations, technology and information related to individual sites.
Legal Proceedings
Various lawsuits arising during the normal course of business are pending against us and our consolidated subsidiaries. We are vigorously defending these claims and believe we have reserves and insurance coverage sufficient to cover potential exposures.
While, in the opinion of management, the liability resulting from these matters will not have a significant effect on our consolidated financial position or results of operations, the outcome of individual matters cannot be predicted with reasonable certainty at this time.
98
Table of Contents
We are a global leader in the manufacture, distribution and service of highly engineered and customized systems within the $27 billion plastic technology and processing industry.
Plastic Processing Technologies Industry
The global plastic processing technology industry is comprised of equipment for injection molding, blow molding, extrusion, thermoforming, compression molding and other types of plastic processing equipment. Of these, we design and manufacture equipment for the three primary plastic processing equipment applications: injection molding, blow molding and extrusion applications, along with mold technologies products such as mold bases, mold components, hot runner systems, process control systems, auxiliary equipment and related aftermarket services and parts. We believe our comprehensive portfolio and large direct sales force allows us to serve the entire value chain.

|

|

| ||
|
• Products and Services: Mold bases, components and hot runner systems
• Replaced every 1-5 years
• Hot runner system channels molten plastic from machine into the mold
• Mold bases provide platform for building and holding the plastic mold |
• Products and Services: Milacron injection molding machine
• Machine melts resin and injects molten plastic into the mold via hot runner system
• 15-25 year replacement cycle
• Products and Services: Equipment aftermarket services and parts
• Large installed base of 40,000+ machines and 140,000+ systems globally including repair and replacement parts captures attractive recurring revenue stream |
• Products and Services: • OEMs with in-house molding operations purchase machinery and aftermarket parts and services
• OEMs with outsourced molding often specify equipment to their suppliers
|
Based on research from Global Industry Analysts, Inc., management estimates that the annual global market for plastic processing machinery is currently $25 billion and is expected to reach $31.1 billion by the end of 2017, reflecting a CAGR of approximately 7.1%. Global Industry Analysts, Inc. estimates that the total market size of the injection molding, extrusion, and blow molding segments are approximately 52%, 18%, and 7%, respectively, of the total market. Growth in these segments is driven by the overall expected rise in plastic processing and continuing advances in technology, such as the shift to higher-end equipment as plastic processors seek to reduce their operating costs and produce higher quality products.
According to Interconnection Consulting, the global hot runner market is approximately Euro 1.7 billion ($2.1 billion) in size and is projected to grow to Euro 2.2 billion ($2.6 billion) by 2017, representing a CAGR of 8.0%. Consistent with historical periods, the hot runner market is expected to grow faster than the overall global economy based on macro-economic drivers involving product life cycles, demographics, technology conversion and greater use of plastic. Demand within the hot runner market is driven more by product design changes and
99
Table of Contents
model refreshes than by end product volume, because hot runners are typically custom ordered for each new product mold, representing a critical factor in the market’s resiliency during economic cycles. Through the use of hot runners, customers are able to increase efficiency and differentiate on quality, aesthetics and functionality. A variety of end markets utilize hot runner technology to improve their plastic injection molding process, including vehicle, electronics, transportation, packaging, medical, household and consumer goods and closures. While the hot runner market is expected to experience strong growth across the developed world, significant growth is also expected in emerging markets. According to Interconnection Consulting, China accounts for 26.6% of the hot runner market and is expected to expand to Euro 0.6 billion ($0.7 billion) by 2017, representing a CAGR of 8.3% from 2014 through 2017. India accounts for 2.5% of the hot runner market and is expected to grow by a CAGR of 11.8% from 2014 through 2017. This growth is primarily due to the rise of the middle class in emerging markets driving above market growth in the packaging, personal care and electronics industries. The developed North American and European markets, which currently account for 17.8% and 31.5% of global hot runner demand, respectively, are expected to grow at a CAGR of 8.5% and 8.1%, respectively, from 2014 through 2017.
The following charts illustrate the growth in global plastic consumption, global plastic processing machinery demand and the global hot runner market for the periods set forth below.
| Global Plastic Consumption |
Global Plastic Processing |
Global Hot Runner Market | ||
|
|
|
|
| (1) | Source: Global Industry Analysts, Inc. (January 2012). |
| (2) | Source: Global Industry Analysts, Inc. (May 2014). |
| (3) | Source: Interconnection Consulting. (October 2014). |
We believe the following factors will contribute to demand growth for products in our APPT and MDCS segments:
Increasing Global Demand for Plastic Finished Products: According to Global Industry Analysts, Inc. global consumption of plastic was 229 million tons in 2010 and was projected to grow at a CAGR from 2010 to 2015 of approximately 5% to 298 million tons. We believe the growing demand for plastic products is supported by long term macroeconomic trends. Global population growth, coupled with continued urbanization, increased purchasing power and improved lifestyle in emerging markets have resulted in greater demand for a broad range of finished plastic products in many segments of the economy, including automotive, construction and consumer products. We believe that our strong global presence positions us well to benefit from this growth.
Technological Advancements, New Product Introductions and Continued Preference for Plastic Over Other Materials: Technological advancements in resin, product design and systems integration have increased the number and range of applications for which plastic products can be used. These advancements have led to increased adoption and penetration rates in both high growth industries, such as healthcare and electronics as well as high volume industries, such as automotive and consumer packaging. For example, the use of plastic components assists automakers in reducing vehicle weight to meet federally mandated fuel economy standards. Consumers have continued to exhibit a
100
Table of Contents
preference for plastic packaging over available alternatives, particularly in food packaging. We believe our technology and track record for delivering efficient high speed systems for shelf stable plastic packaging will position us to take advantage of the continued materials conversion from metal and glass to plastic.
Hot Runner Market Demand Growth: Demand for hot runner systems is tied to new product design and product design changeover rather than broader capital investment trends. For instance, in certain large end markets, including electronics and consumer products where technology and preference are rapidly changing, product life cycles have significantly decreased in recent years. In certain emerging markets, such as Asia, hot runner systems are displacing legacy cold runner technology driven by an increased need for productivity, efficiency, automation and higher part quality. Although growing, hot runner penetration levels in emerging markets remain well below the penetration levels seen in developed economies.
Pent-up Equipment Demand: The average age of plastic processing equipment, particularly in the United States, has steadily increased as a result of under-investment in equipment in the last decade and especially from 2008 to 2010 due to the economic recession. According to the U.S. Department of Commerce Bureau of Economic Analysis, the average age of plastic processing equipment in 2013 was 12 years compared to an average age of eight years in 1980. According to the U.S. Federal Reserve Board, the capacity utilization of the U.S. plastic and rubber products industry decreased to 57.5% in 2009, but has since improved and was estimated to be 80.0% in January 2015. We believe that many processors deferred investment in new equipment in the United States in the decade from 2000 to 2010 as they invested in emerging markets and delayed replacement during the 2008-2010 recession. Since 2010, many customers have reinvested in their North American plants due to rising demand and the improved competitiveness of North American manufacturing. We believe much of the equipment purchased in the 1980s and 1990s is now nearing the end of its useful life, and the plastic processing industry will experience sustained growth as customers begin to make significant investments in machinery and equipment due to strong plastic demand, lower resin costs and a more robust manufacturing environment. We offer our customers several options to address this issue, including machine replacement, used machine purchases and retrofit services to upgrade their technology. Technological advances in our products have made it more compelling for our customers to purchase new equipment or engage us to retrofit their existing equipment before the end of their existing equipment’s useful life. Upgrading their equipment can provide our customers with several key advantages, including increased resin efficiency, energy efficiency and higher throughput capabilities.
We believe these global macroeconomic trends, along with other specific regional trends, will impact our end markets in the following ways:
Automotive. The global automotive vehicle production market, as estimated by Interconnection Consulting, is expected to grow 2.2% annually from 2014 to 2017, representing approximately 97 million vehicles in 2017. As vehicles are redesigned, we believe demand for our machines capable of producing plastic automotive parts, such as interior trim, dashboards, and bumpers, will continue to increase. Another long-term trend, helping to drive new vehicle launches in the automotive sector, is the promotion of fuel efficiency through Corporate Average Fuel Economy standards as promulgated by the United States Department of Transportation. Because plastic is a more lightweight material than the various types of metals used in car and truck manufacturing, we believe carmakers will be encouraged to use plastic for an increasing number of components to increase fuel efficiency. In emerging markets, particularly China, India, and Brazil, the automotive market has been experiencing significant growth and represents additional opportunities for expansion. In India, automotive production grew 13.9%, 1.3%, and 4.0% in 2012, 2013 and 2014, respectively. In China, light vehicle sales have doubled over the period from 2008 to 2013, and annual sales are estimated at 20 million vehicles.
Construction. Many of our products, particularly in extrusion equipment, are used in the construction end market in a wide variety of products including pipes and fittings, siding, window and door frames, tile, decking and fencing. According to the U.S. Census Bureau, housing starts in the United States in 2014 increased by 8.8% compared to 2013. In 2014, we experienced a 14.1% increase in sales of extrusion equipment and tooling compared to the prior year, which reflects the continued recovery in the residential and non-residential construction markets.
101
Table of Contents
PET Preform Systems. A preform is a test-tube shaped molded part that is later stretched and blow molded to make a lightweight and durable container or bottle. The most common end use for a preform is a water bottle. Our APPT segment provides technology-leading PET preform systems that can include a high output injection molding machine, high speed robot with post mold cooling technology, preform molds, hot runner systems and specialized auxiliary equipment (dryers, chillers, dehumidification and material handling). As part of a turn-key system provider, we lead the installation and system validation process. This is an unserved market expansion opportunity for us.
Other End Markets. Several of our other end markets, such as medical and other consumer applications, represent attractive high growth opportunities. Plastic is used in a number of medical applications, including blood tubes, petri dishes, inhalers, insulin injection pens, disposable syringes and parts of intravenous infusion kits. Additionally, we are a supplier to leading manufacturers of consumer electronics, another high-growth area for us. As a result of continuing technological advancement, the plastic components required for these product applications will become smaller and more precise, driving the need for value-added high-precision hybrid and all-electric plastic equipment.
Metalworking Industrial Fluids
We estimate the global market for metalworking industrial fluids will grow at an annual rate of 4.2% to $430 million in 2018, with volume expanding to 34 million gallons. We expect this growth to be driven by demand for metal products, which are produced on metalworking machinery through cutting, stamping and other processes. Key characteristics of the premium segment of this industry where our Fluids segment is positioned include:
Highly Specialized Products Resulting in High Barriers to Entry. As industrial production and demand for metalworking machinery grows, manufacturers require higher amounts of high-quality coolants, lubricants and cleaners to maximize productivity and extend equipment and tooling life spans. Products are developed with specific demands of customers in mind and represent a high degree of proprietary information that cannot be easily reproduced by competitors. Metalworking fluids are critical to enabling high plant throughput, increasing the life of machine tools, and reducing scrap, creating significant barriers to entry for new competitors and high switching costs for customers. Given the essential nature of the industrial fluid products while only comprising a small fraction of total operating cost for customers, we believe that customers prefer to source products from trusted technologically focused suppliers with whom they have long-term relationships.
Technologically Advanced and Greater Health, Safety and Environmental Requirements. The synthetic industrial fluids market in which we participate has an improved health, safety and environmental profile relative to traditional oil-based fluids. Due to evolving regulatory requirements such as those enacted by Registration, Evaluation, Authorisation and Restriction of Chemicals (“REACH”) in the European Union, participants in this industry are continuously seeking to innovate and develop specific formulations to meet the standards. Based on market trends, we expect significantly higher demand for technology fluids due to environmental and health concerns and as new applications are developed.
Technological Developments. Because our Fluids products are developed with customers’ specific demands in mind, the products represent a high degree of proprietary information that cannot be easily reproduced by competitors. Additionally, the chemicals industry is highly regulated in all parts of the world and our dedicated scientists and chemists work to ensure that our products are compliant with the relevant regulations in each of our customers’ respective jurisdictions. This results in barriers to entry from competition and switching costs for customers.
102
Table of Contents
Executive Officers and Directors
The following table sets forth information regarding our directors and executive officers as of March 1, 2015.
| Name |
Age |
Position | ||
| Tom Goeke |
56 | President, Chief Executive Officer and Director | ||
| Bruce Chalmers |
48 | Chief Financial Officer | ||
| Ronald Krisanda |
52 | Chief Operating Officer—APPT | ||
| John Gallagher III |
51 | Chief Operating Officer—MDCS and Fluids and Director | ||
| Ira Boots |
61 | Chairman and Director | ||
| Greg Brenneman |
53 | Director | ||
| Timothy Walsh |
51 | Director | ||
| Mark McFadden |
37 | Director | ||
| Jim Gentilcore |
62 | Director | ||
| Waters Davis |
61 | Director | ||
| Jim Kratochvil |
58 | Director | ||
| James Ridout |
44 | Director |
Tom Goeke was appointed President and Chief Executive Officer of Milacron in September 2012. Mr. Goeke has over 25 years of industry experience and previously served as Chief Operating Officer of Seakeeper Inc. from October 2011 to June 2012 and as Chief Executive Officer of Klöckner Pentaplast Group from July 2005 to May 2011. Prior to that, Mr. Goeke served in a number of positions at Klöckner Pentaplast since 1989 and also gained experience at Hoechst Celanese Rigid Film Division. Mr. Goeke received his Bachelor of Science degree in Mechanical Engineering from Widener University and his Masters of Business Administration degree from the College of William and Mary. Mr.Goeke was elected to serve on our Board due to being a seasoned executive with experience in a variety of senior roles in the plastics industry.
Bruce Chalmers was appointed Chief Financial Officer in November 2014, and prior to that, he was our Vice President, Finance since January 2014. Mr. Chalmers also heads our finance and shared service function. Mr. Chalmers has over 20 years of experience in finance. Most recently, Mr. Chalmers served as Chief Financial Officer of MetoKote Corporation, Inc. from 2012 until 2014. Prior to that, he served as a Managing Director at PricewaterhouseCoopers in their transaction services practice from 2006 until 2012. Mr. Chalmers was a Managing Director at Stout Causey Capital from 2005 until 2006. He held various positions in finance at Millenium Capital from 1997 until 2005. Mr. Chalmers started his career in finance at Ernst & Young. Mr. Chalmers received a Bachelor of Science degree in Finance from Drexel University.
Ronald Krisanda was appointed as Chief Operating Officer—APPT in July 2014 and prior to that was President of the Mold-Masters business and leader of the integration of Mold-Masters into Milacron. Previously, Mr. Krisanda served as the Chief Operating Officer of Edwards Group Limited from January 2009 through November 2012, and led the Operations, Supply Chain, Engineering and Technology organizations, responsible for its extensive restructuring program. From 2002 to 2008, Mr. Krisanda held senior management positions with Tyco International, including President of Tyco Fire & Security Europe, Middle East and Africa businesses, President of Tyco Safety Products, and Vice President of Operations for Tyco Plastics. Prior to Tyco, he was Senior Vice President of Operations of Multilink Technology Corp. from November 2000 to 2002 and Vice President Operations for Motorola’s Broadband Segment , based out of Taiwan from 1997 to 2000. Mr. Krisanda started his career at The Ford Motor Company, and worked in both the Electronics Division and the Climate Control Division. Mr. Krisanda received a Bachelor of Science degree in Mechanical Engineering from Clarkson University and a Master of Science degree in Manufacturing Systems Engineering from Lehigh University.
103
Table of Contents
John Gallagher III was appointed Chief Operating Officer—MDCS and Fluids in May 2014 and serves on our Board, a position he has held since August 2012. Previously, Mr. Gallagher served as Chief Executive Officer of Stellar CJS Holdings, LLC, a privately held investment company formed in 2009 from April 2009 to April 2014, and served on our Audit Committee from August 2012 until April 2014. Prior to his service with Stellar CJS, Mr. Gallagher served in various senior executive capacities with Celanese Corporation from 2005 until 2009, including as Executive Vice President and President, Acetyl and Celanese Asia from 2007 to 2009 and Executive Vice President and Chief Financial Officer of Celanese Corporation from 2005 to 2007. Prior to his service with Celanese, Mr. Gallagher served in several executive positions with Great Lakes Chemical Corporation including acting Chief Executive Officer, Chief Financial Officer and Senior Vice President, Global Supply Chain. Prior to that time, Mr. Gallagher was Vice President and Chief Financial Officer of UOP LLC from 1999 to 2001; served in various capacities at AlliedSignal, Inc., including as Chief Financial Officer, Bendix Commercial Vehicle Systems Division, from 1995 to 1999; and worked as a senior manager for the public accounting firm Price Waterhouse LLP from 1986 to 1994. Mr. Gallagher currently serves on the board of directors of Kraton Performance Polymers, Inc. Mr. Gallagher received a Bachelor of Science degree in Accounting from the University of Delaware and is a Certified Public Accountant (inactive). He is a member of the American Institute of Certified Public Accountants. Mr. Gallagher was elected to serve on our Board due to being a seasoned executive with experience in a variety of senior roles.
Ira Boots was appointed our Chairman in April 2012. He was previously Chairman of the Board and Chief Executive Officer of Berry Plastics Corporation from 2001 to 2010, and a Director of Berry Plastics Corporation since April 1992. Prior to that, Mr. Boots served as Chief Operating Officer of Berry Plastics Corporation since August 2000 and Vice President of Operations, Engineering and Product Development of Berry Plastics Corporation since April 1992. Mr. Boots joined a predecessor company to Berry Plastics Corporation in 1978 as Manager of Tooling. Mr. Boots was elected to serve on our Board due to his knowledge and experience in the industry and his extensive leadership experience.
Greg Brenneman serves as a member of our Board, a position he has held since April 2012. Mr. Brenneman is Chairman, President and Chief Executive Officer of CCMP and a member of the firm’s Investment Committee. Prior to joining CCMP in October 2008, Mr. Brenneman served as Chief Executive Officer of QCE Holdings LLC (“Quiznos”), a U.S. quick service restaurant chain, from January 2007 until September 2008 and as President of Quiznos from January 2007 until November 2007. He also served as Executive Chairman of Quiznos from 2008 to 2009. Prior to joining Quiznos, from 2004 to 2006, Mr. Brenneman was Chairman and Chief Executive Officer of Burger King Corporation. Prior to joining Burger King, Mr. Brenneman was named President and Chief Executive Officer of PwC Consulting in June 2002. Mr. Brenneman joined Continental Airlines in 1995 as President and Chief Operating Officer and a member of its board of directors. In 1994, Mr. Brenneman founded Turnworks, Inc., his personal investment firm that focuses on corporate turnarounds. Prior to founding Turnworks, Inc., Mr. Brenneman was a Vice President for Bain and Company. Mr. Brenneman currently serves on the board of directors of PQ Corporation, Francesca’s Holdings Corp., Eco Services Operations LLC, Volotea SL, The Home Depot, Inc. and Baker Hughes Inc. Mr. Brenneman holds a Masters of Business Administration degree with distinction from Harvard Business School and a Bachelors Administration of Business degree in Accounting/Finance, summa cum laude from Washburn University of Topeka, Kansas. He was awarded an honorary Doctor of Commerce degree from Washburn University. Mr. Brenneman was elected to serve on our Board due to his extensive experience in the industrials industry and his affiliation with CCMP.
Timothy Walsh serves as a member of our Board, a position he has held since April 2012. Mr. Walsh is Chief Operating Officer and a Managing Director of CCMP and a member of the firm’s Investment Committee. Prior to joining CCMP upon its formation in August 2006, Mr. Walsh was a Partner at J.P. Morgan Partners, LLC between 2002 and 2006. Before joining J.P. Morgan Partners in 1993, Mr. Walsh worked on various industry-focused client teams within The Chase Manhattan Corporation. Mr. Walsh currently serves on the board of directors of Generac Holdings, Inc., PQ Corporation, Eco Services Operations LLC and Volotea SL. Mr. Walsh holds a Bachelor of Science degree from Trinity College and a Master of Business Administration
104
Table of Contents
degree from the University of Chicago Graduate School of Business. Mr. Walsh was elected to serve on our Board due to his extensive experience in the industrials industry and his affiliation with CCMP.
Mark McFadden serves as a member of our Board, a position he has held since April 2012. Mr. McFadden is a Managing Director of CCMP focused on investments in the industrial sector. Prior to joining CCMP in 2002 upon its formation in August 2006, Mr. McFadden was an Associate with J.P. Morgan Partners, LLC between 2002 and 2006. Prior to joining J.P. Morgan Partners, Mr. McFadden was an investment banking analyst at Credit Suisse First Boston. Mr. McFadden currently serves on the board of directors of Eco Services Operations LLC. Mr. McFadden holds a Bachelor of Business Administration degree in Finance and a Bachelor of Arts degree in History from the College of William and Mary. Mr. McFadden was elected to serve on our Board due to his extensive experience in the industrials industry and his affiliation with CCMP.
Jim Gentilcore serves as a member of our Board, a position he has held since February 2014. Mr. Gentilcore most recently served as Chief Executive Officer of Edwards Group Limited from March 2013 to January 2014. Mr. Gentilcore is currently an Executive Advisor to CCMP, where he has served in an advisory role since April 2014. Mr. Gentilcore previously served as a Director of Edwards from December 2007 to January 2014. Prior to that, from January 2009 until March 2011 he was Chief Executive Officer of EPAC Technologies Inc., a logistics technology solutions company. Mr. Gentilcore also served as Chief Operating Officer of Brooks Automation Inc., a position he held from November 2005 until November 2007 after leading the merger between Brooks and Helix Technology Corp. where he had been the Chief Executive Officer from December 2002 until October 2005. Prior to that, Mr. Gentilcore was the Chief Operating Officer of Advanced Energy Industries, Inc., a process power supplier to the semiconductor and solar industries. Earlier in his career, he spent 10 years in the electronics materials industry with Air Products Inc., serving in various business development and operational roles. Mr. Gentilcore also currently serves on the board of directors of KMG Chemicals, Inc. and Entegris, Inc. Mr. Gentilcore holds a Bachelor of Science degree in Engineering from Drexel University and a Masters of Business Administration degree from Lehigh University. Mr. Gentilcore was elected to serve on our Board due to his years of experience as an executive officer of a number of companies.
Waters Davis serves as a member of our Board, a position he has held since July 2013. Mr. Davis also served as Executive Vice President of NuDevco LLC from December 2009 to July 2014. Mr. Davis is currently an Executive Advisor to CCMP, where he has served in an advisory role since October 2012. Mr. Davis currently serves on the board of directors of Newark E&P Holdings, LLC and Earthwork Solutions, LLC. He is also President of the National Christian Foundation. Mr. Davis holds a Bachelor of Science degree in Architectural Engineering from the University of Texas at Austin and a Master’s of Business Administration degree from Harvard Business School. Mr. Davis was elected to serve on our Board due to his years of experience as a senior executive at a number of companies.
Jim Kratochvil serves as a member of our Board, a position he has held since November 2014. Mr. Kratochvil is President of Jorgenson Petroleum Maintenance, Inc. Prior to joining Jorgenson Petroleum Maintenance, Inc. in March 2014, Mr. Kratochvil served as Chief Financial Officer of Berry Plastics Group, Inc. from December 1990 until December 2013 and as Assistant Treasurer from October 2009 until November 2013. He served in various roles at Berry Plastics Corporation since joining its predecessor in 1985. Mr. Kratochvil holds a Bachelor of Science degree in Finance from the University of Illinois. Mr. Kratochvil was elected to serve on our Board due to his many years of experience in the plastic industry.
James Ridout serves as a member of our Board, a position he has held since August 2013. Mr. Ridout is a Director of Private Equity at AIMCo, where he has served since February 2009. Mr. Ridout currently serves on the board of directors of Alegeus Technologies, LLC and Conversant Intellectual Property Management Inc. Mr. Ridout holds a Bachelor of Commerce degree in Finance from Dalhousie University. Mr. Ridout was elected to serve on our Board due to his affiliation with AIMCo and his extensive experience as a private equity professional.
105
Table of Contents
Board of Directors
Our business and affairs are managed under the direction of our Board. Upon the completion of this offering, our amended and restated bylaws will provide that our Board will consist of between and directors. Upon the consummation of this offering, our Board will be composed of directors, and three seats on our board will be occupied by full-time investment professionals of CCMP. Our executive officers and key employees serve at the discretion of our Board.
Controlled Company Exception
After the completion of this offering, affiliates of CCMP will continue to beneficially own shares representing more than 50% of the voting power of our shares eligible to vote in the election of directors. As a result, we will be a “controlled company” for purposes of the rules of the NYSE or Nasdaq. Under these corporate governance standards, a company of which more than 50% of the voting power for the election of directors is held by an individual, group or another company is a “controlled company” and may elect not to comply with certain corporate governance requirements, including the requirements (1) that a majority of our Board consist of independent directors; (2) that our Board has a compensation committee that is comprised entirely of independent directors with a written charter addressing the committee’s purpose and responsibilities; (3) that our director nominees are selected, or recommended for selection by the Board, either by (a) independent directors constituting a majority of the board’s independent directors in a vote in which only independent directors participate or (b) a nominating and corporate governance committee comprised solely of independent directors with a written charter addressing the committee’s purpose and responsibilities; and (4) of an annual performance evaluation of the nominating and corporate governance and compensation committees. For at least some period following this offering, we intend to utilize these exemptions. Immediately following this offering we do not expect the majority of our directors will be independent or that our compensation committee or nominating and corporate governance committee will be comprised entirely of independent directors. Accordingly, although we may transition to fully independent compensation and nominating and corporate governance committees prior to the time we cease to be a “controlled company,” for such period of time you will not have the same protections afforded to stockholders of companies that are subject to all of these corporate governance requirements. In the event that we cease to be a “controlled company” and our shares continue to be listed on the NYSE or Nasdaq, we will be required to comply with these provisions within the applicable transition periods. The controlled company exemption does not modify the independence requirements for the audit committee, and we intend to comply with the requirements of the Sarbanes-Oxley Act and the NYSE or Nasdaq rules, which require that our audit committee be composed of at least three members, one of whom will be independent upon the listing of our common stock on the NYSE or Nasdaq, a majority of whom will be independent within 90 days of the date of this prospectus and each of whom will be independent within one year of the date of this prospectus. In the event we cease to be a “controlled company” and our common stock continues to be listed on the NYSE or Nasdaq, we will be required to comply with these provisions within the applicable transition periods.
Director Independence
Our Board has affirmatively determined that and are independent directors under the applicable rules of the NYSE and Nasdaq and as such term is defined in Rule 10A-3(b)(1) under the Exchange Act.
Board Committees
Our Board has the authority to appoint committees to perform certain management and administration functions. Upon the consummation of this offering, our Board will have three committees: the audit committee, the compensation committee and the nominating and corporate governance committee.
106
Table of Contents
Audit Committee
The primary purpose of our audit committee is to assist the board’s oversight of:
| • | the adequacy integrity of our financial statements; |
| • | our internal financial reporting and compliance with our disclosure controls and procedures; |
| • | the qualifications, engagement, compensation, independence and performance of our independent registered public accounting firm; |
| • | our independent registered public accounting firm’s annual audit of our financial statements and any engagement to provide other services; |
| • | the performance of our internal audit function; |
| • | our legal and regulatory compliance; and |
| • | the application of our codes of business conduct and ethics as established by management and the board. |
Upon the consummation of this offering, , and will serve on the audit committee. will serve as chairman of the audit committee and also qualifies as an “audit committee financial expert” as such term has been defined by the SEC in Item 401(h)(2) of Regulation S-K and each audit committee member meets the financial literacy requirements of the NYSE or Nasdaq. Our Board has affirmatively determined that meet the definition of an “independent director” for the purposes of serving on the audit committee under applicable SEC and NYSE or Nasdaq rules, and we intend to comply with these independence requirements for all members of the audit committee within the time periods specified therein. The audit committee is governed by a charter that complies with the rules of the NYSE or Nasdaq.
Compensation Committee
The primary purposes of our compensation committee are to:
| • | oversee our executive compensation policies and practices; |
| • | review, determine, and approve the compensation of our executive officers (including our chief executive officer); |
| • | provide oversight of our compensation policies, plans and benefit programs including reviewing, and approving all equity incentive plans, policies and programs; and |
| • | approve and recommend to the Board reports on compensation matters required to be included in our annual proxy statement or annual report. |
Upon the consummation of this offering, , and will serve on the compensation committee, and will serve as the chairman. Our Board has affirmatively determined that meets the definition of an “independent director” for the purposes of serving on the compensation committee under applicable NYSE or Nasdaq rules, and we intend to comply with these independence requirements for all members of the compensation committee within the time periods specified therein. The compensation committee is governed by a charter that complies with the rules of the NYSE or Nasdaq.
107
Table of Contents
Nominating and Corporate Governance Committee
The primary purposes of our nominating and corporate governance committee are to:
| • | recommend to the Board for approval the qualifications, qualities, skills and expertise required for Board membership; |
| • | identify potential members of the Board consistent with the criteria approved by the board and select and recommend to the board the director nominees for election at the next annual meeting of stockholders or to otherwise fill vacancies; |
| • | evaluate and make recommendations regarding the structure, membership and governance of the committees of the Board; |
| • | develop and make recommendations to the Board with regard to our corporate governance policies and principles; and |
| • | oversee the annual review of the Board’s performance. |
Upon the consummation of this offering, , and will serve on the nominating and corporate governance committee, and will serve as the chairman. Our Board has affirmatively determined that meets the definition of an “independent director” for the purposes of serving on the nominating and corporate governance committee under applicable NYSE or Nasdaq rules, and we intend to comply with these independence requirements for all members of the nominating and corporate governance committee within the time periods specified therein. The nominating and corporate governance committee is governed by a charter that complies with the rules of the NYSE or Nasdaq.
Compensation Committee Interlocks and Insider Participation
None of our executive officers serves, or in the past year has served, as a member of the compensation committee (or other committee performing equivalent functions) of any entity that has one or more executive officers serving on our Board or compensation committee. No interlocking relationship exists between any member of the compensation committee (or other committee performing equivalent functions) and any executive, member of the Board or member of the compensation committee (or other committee performing equivalent functions) of any other company.
Code of Business Conduct and Ethics
We have adopted a code of business conduct and ethics that applies to all of our employees, officers and directors, including those officers responsible for financial reporting. These standards are designed to deter wrongdoing and to promote honest and ethical conduct. The code of business conduct and ethics will be available on our website at www.milacron.com. Any waiver of the code for directors or executive officers may be made only by our Board and will be promptly disclosed to our stockholders as required by applicable U.S. federal securities laws and the corporate governance rules of the NYSE or Nasdaq. Amendments to the code must be approved by our Board and will be promptly disclosed (other than technical, administrative or non-substantive changes). Any amendments to the code, or any waivers of its requirements, will be disclosed on our website.
Corporate Governance Guidelines
Our Board will adopt corporate governance guidelines in accordance with the corporate governance rules of the NYSE or Nasdaq, as applicable, that serve as a flexible framework within which our Board and its committees operate. These guidelines will cover a number of areas including the size and composition of the
108
Table of Contents
board, board membership criteria and director qualifications, director responsibilities, board agenda, roles of the Chairman of the Board, Chief Executive Officer and presiding director, meetings of independent directors, committee responsibilities and assignments, board member access to management and independent advisors, director communications with third parties, director compensation, director orientation and continuing education, evaluation of senior management and management succession planning. A copy of our corporate governance guidelines will be posted on our website.
Indemnification of Officers and Directors
Our amended and restated bylaws provide that we will indemnify our directors and officers to the fullest extent permitted by the DGCL. We have established directors’ and officers’ liability insurance that insures such persons against the costs of defense, settlement or payment of a judgment under certain circumstances.
Our amended and restated certificate of incorporation provides that our directors will not be liable for monetary damages for breach of fiduciary duty, except for liability relating to any breach of the director’s duty of loyalty, acts or omissions not in good faith or which involve intentional misconduct or a knowing violation of law, violations under Section 174 of the DGCL or any transaction from which the director derived an improper personal benefit.
We intend to enter into new indemnification agreements with each of our directors and executive officers. These agreements, among other things, will require us to indemnify each director and executive officer to the fullest extent permitted by Delaware law, including indemnification of expenses such as attorneys’ fees, judgments, fines and settlement amounts incurred by the director or executive officer in any action or proceeding, including any action or proceeding by or in right of us, arising out of the person’s services as a director or executive officer, as applicable.
109
Table of Contents
EXECUTIVE AND DIRECTOR COMPENSATION
The following discussion and analysis of compensation arrangements should be read with the compensation tables and related disclosures set forth below. This discussion contains forward-looking statements that are based on our current plans and expectations regarding future compensation programs. Actual compensation programs that we adopt may differ materially from the programs summarized in this discussion.
Compensation Discussion and Analysis
This section discusses the principles underlying the material components of our executive compensation program for our executive officers who are named in the Summary Compensation Table and the factors relevant to an analysis of these policies and decisions. For the year ended December 31, 2014, our “named executive officers” included our principal executive officer, our principal financial officer, our former chief financial officer and the two other most highly compensated executive officers with policy-making functions.
| Name |
Title | |
| Thomas Goeke | President and Chief Executive Officer | |
| Bruce Chalmers(1) | Chief Financial Officer (since November 21, 2014) | |
| John Gallagher III | Chief Operating Officer—MDCS and Fluids | |
| Ronald Krisanda | Chief Operating Officer—APPT | |
| John Francy(2) | Chief Financial Officer (until November 21, 2014) |
| (1) | Mr. Chalmers joined the Company on January 1, 2014 as Vice President of Finance. He was appointed Chief Financial Officer on November 21, 2014. |
| (2) | Mr. Francy stepped down from the position of Chief Financial Officer on November 21, 2014 and left the Company on December 31, 2014. |
Our executive compensation programs are determined and approved by our compensation committee. During 2014, the compensation committee was responsible for the oversight, implementation and administration of all of our executive compensation plans and programs. None of the named executive officers are members of the compensation committee or otherwise had any role in determining the compensation of the other named executive officers, although the compensation committee does consider the recommendations of our Chief Executive Officer in setting compensation levels for our executive officers other than our Chief Executive Officer. The compensation committee determined all of the components of compensation of our Chief Executive Officer. Our Board reviewed the compensation committee’s recommendations for the compensation of our Chief Executive Officer and the non-executive chairman’s assessment of the Chief Executive Officer’s performance and approved his final compensation.
Executive Compensation Program Objectives and Overview
Once a year the compensation committee reviews compensation for the named executive officers in conjunction with performance discussions, salary increase recommendations and determination of bonus payouts. Going forward, the compensation committee will conduct annual reviews of our executive compensation program to ensure that:
| • | the program is designed to align the interests of our named executive officers with our stockholders’ interests by rewarding performance that is tied to creating stockholder value; and |
| • | the program provides a total compensation package for each of our named executive officers that we believe is competitive. |
We seek to accomplish these objectives by providing a total compensation package which includes three main components: base salary, annual performance-based bonus and long-term equity-based awards. Of these
110
Table of Contents
components, the compensation committee has endeavored to set base salary and annual performance-based bonus at the market median. In assessing market competitive practices, the compensation committee has historically relied on its experience and knowledge of general industry practices. Our long-term equity-based awards have mainly been in the form of stock options and stock appreciation rights that only have value if our stock price appreciates after the date of grant. Half of all the stock options and stock appreciation rights granted to employees also have performance conditions that must be achieved before the awards can vest. The size of the long-term awards has been competitive for private equity backed ventures in the technology and tooling industry. The size of grants already made was not determined with reference to public company market data.
In structuring executive compensation packages, the compensation committee considers how each component promotes retention and motivates performance. Base salaries and severance and other termination benefits are primarily intended to attract and retain highly qualified executives. These are the elements of our executive compensation program where the value of the benefit in any given year is not dependent on performance (although base salary amounts and benefits determined by reference to base salary may change from year to year depending on performance, among other things). We believe that in order to attract and retain top executives, we need to provide them with compensation levels that reward their continued service. Certain elements, such as base salaries, are paid out on a short-term or current basis. Other elements, such as certain severance benefits and equity awards subject to multi-year vesting schedules, are paid out on a longer-term basis. We believe this mix of short- and long-term incentives allows us to achieve our goals of attracting, retaining and motivating our top executives.
We believe that by providing a substantial portion of our named executive officers’ total compensation package in the form of equity-based awards through stock option grants that vest both over time and subject to the achievement of performance conditions, we are able to create an incentive to build stockholder value over the long-term and closely align the interests of our named executive officers to those of our stockholders by incentivizing our named executive officers to produce stockholder value. Additionally, our annual performance-based bonus is also contingent upon the achievement of financial performance metrics and the amount of compensation ultimately received for these awards vary with our annual financial performance, thereby providing an additional incentive to maximize stockholder value. We believe that this philosophy has been successful by motivating, retaining and incentivizing our named executive officers and providing value to our stockholders.
Compensation Consultant; Review of Relevant Compensation Data
We have engaged Pearl Meyer & Partners (“PM&P”) as our independent advisor to the compensation committee from time to time since 2012 to provide advice on incentive compensation programs. Neither PM&P nor our compensation committee historically “benchmarked” our compensation levels, other than on an ad hoc basis.
Role of the Compensation Committee and our Executive Officers
Historically, our compensation has been highly individualized, the result of arm’s-length negotiations and based on a variety of informal factors including, in addition to the factors listed above, our financial condition and available resources, our need for a particular position to be filled and the compensation levels of our other executive officers.
Elements of Compensation
For 2014, our compensation program for the named executive officers consisted of:
| • | base salary; |
111
Table of Contents
| • | annual performance-based cash awards; |
| • | long-term equity based incentive awards; |
| • | severance and change in control benefits; and |
| • | other benefits, including a retirement savings plan. |
We strive to achieve an appropriate mix between the various elements of our compensation program to meet our compensation objectives and philosophy; however, we do not apply any rigid allocation formula in setting our named executive officers’ compensation, and we may make adjustments to this approach for various positions after giving due consideration to prevailing circumstances.
Base Salary
We provide an annual base salary to our named executive officers to induce talented executives to join or remain with our Company, to compensate them for their services during the year and to provide them with a stable source of income. For 2014, each of our named executive officers, except Mr. Chalmers, was party to an employment agreement which set his minimum level of annual base salary. Mr. Chalmers had an employment letter that established an initial annualized base salary level. For more information regarding the current terms and conditions of our named executive officers’ employment, see the narrative under “—Employment Agreements.”
The base salary levels of our named executive officers are reviewed annually by our compensation committee to determine whether an adjustment is warranted. The compensation committee may take into account numerous factors in making its determination, none of which are dispositive or individually weighted, including the named executive officer’s relative importance and responsibilities, the named executive officer’s performance and periodic reference to comparable salaries paid to other executives of similar experience in our industry in general, based on our expertise and knowledge of general industry practices.
During 2014, our compensation committee determined that the base salary for Mr. Goeke should be increased by $30,000 to $780,000 and the base salary for Mr. Krisanda should be increased by £23,550 to £338,550. The compensation committee reached this decision based on, among other factors, an informal review of base salaries of similarly situated officers in the technology and tooling industry in general based on our subjective knowledge of the industry, the importance of their services to us, and based on the general knowledge and expertise possessed by the members of our compensation committee. Our compensation committee maintained the base salaries of our other named executive officers since they were newly hired during 2014. The base salaries paid to our named executive officers during 2014 are reported in the “Summary Compensation Table” below. The annual base salaries in effect for each of our named executive officers as of December 31, 2013 and December 31, 2014 are as follows:
| Name |
2013 Annual Salary |
2014 Annual Salary |
||||||
| Thomas Goeke(1) |
$ | 750,000 | $ | 780,000 | ||||
| Bruce Chalmers(2) |
N/A | $ | 300,000 | |||||
| John Gallagher, III(3) |
N/A | $ | 600,000 | |||||
| Ronald Krisanda(4) |
$ | 490,550 | $ | 527,224 | ||||
| John Francy |
$ | 330,000 | $ | 330,000 | ||||
| (1) | Mr. Goeke’s base salary was increased from $750,000 to $780,000 effective January 1, 2014. |
| (2) | Mr. Chalmers joined the Company on January 1, 2014 |
| (3) | Mr. Gallagher joined the Company on May 1, 2014. |
| (4) | Mr. Krisanda’s base salary has been converted to U.S. dollars based on a conversion rate of 1 British Pound to $1.5573 as of December 31, 2014. His base salary was increased from £315,000 to £338,550 on July 1, 2014. |
112
Table of Contents
Annual Performance-Based Cash Awards
We provide our named executive officers with annual performance-based cash award opportunities linked to our annual financial performance pursuant to a bonus plan (the “Bonus Plan”).
The target annual performance-based cash award opportunity for each eligible executive is set as a percentage of annualized base salary (i.e., actual base salary paid during 2014). Our named executive officers were eligible to receive a target annual performance-based cash award in 2014 equal to a percentage of their respective base salaries. For named executive officers that joined the Company during 2014, target bonus opportunity was pro-rated based on the number of days the executive worked during 2014. The target annual performance-based cash award amounts were determined by our compensation committee, and such target amounts generally reflect the executive’s position and market conditions.
Under the Bonus Plan, awards payable for 2014 to the named executive officers were based on the achievement of the Company’s budgeted sales and Adjusted EBITDA. The sales measure was weighted 30% and the Adjusted EBITDA measure was weighted 70%. A minimum level of Adjusted EBITDA of $194.7 million for 2014 had to be achieved in order for any bonus to be funded under the Bonus Plan.
The compensation committee chose sales and Adjusted EBITDA as the objective financial incentive target goals for the Bonus Plan since such goals, when set at the appropriate level, can encourage growth in a prudent fashion. Sales performance levels are determined in accordance with U.S. GAAP. For a discussion of Adjusted EBITDA see “Non-GAAP Financial Measures.”
Depending on achieved sales and Adjusted EBITDA performance levels, the named executive officers could earn 0% of their target bonus opportunity for below threshold performance, 50% of their target bonus opportunity for achievement of threshold performance and 100% of their target bonus opportunity for achievement of target performance. There is no cap on the percentage of target bonus opportunity for the achievement of above-target performance. There is no adjustment of the objectively determined bonus payout based on individual performance.
Actual bonus payouts are based on the below formula:
| Annualized Salary | x | Target Bonus % |
x |
1. Adjusted EBITDA (70% x Adjusted
|
+ | 2. Sales Performance Factor (30% x Sales Payout) |
= | Actual Bonus |
During 2014, the Bonus Plan was funded as the minimum $194.7 million level of Adjusted EBITDA was achieved. The Company’s 2014 Adjusted EBITDA of $198.5 million was above the threshold performance level and yielded a 57.335% payout for the Adjusted EBITDA metric. The Company’s 2014 sales of $1.211 billion was above threshold performance level and yielded a 79.274% payout for the sales metric. As a result, 2014 financial performance resulted in the total bonus payout of 64% of each named executive officer’s individual target bonus opportunity. See the Non-Equity Incentive Plan Compensation column in the Summary Compensation Table below for each named executive officers actual bonus payout for 2014.
Long-Term Equity Based Incentive Awards
We have historically made equity-based incentive awards on an ad hoc basis. During 2014 we granted stock option awards to all of our named executive officers except for Mr. Goeke and Mr. Francy. Mr. Goeke and Mr. Francy did not receive equity awards in 2014 in light of their existing equity holdings in the Company.
113
Table of Contents
Most of our named executive officers currently own vested and unvested equity awards from grants made in and prior to 2014 in the form of fair market value stock options. All stock options awards are 50% time-based and 50% performance-based. The time-based stock options generally vest ratably over four years on the anniversary of the date of the grant. The performance-based stock options are all unvested and will only vest upon the occurrence of either: (1) a change in control of the Company that results in a quotient equal to or greater than two when the aggregate net proceeds received by CCMP with respect to their shares of capital stock of the Company is divided by the dollar amount of CCMP’s equity investment in the Company; or (2) from and after the date of the consummation of this offering, the achievement with respect to shares of common stock of an average closing trading price equal or exceeding, in any 10 trading day period, the lowest amount which when multiplied by the number of shares of common stock then held by CCMP and added to the aggregate net proceeds received by CCMP with respect to their shares of capital stock of the Company would yield a quotient of equal to or greater than two when divided by CCMP’s equity investment in the Company.
Unvested equity awards at the time of the offering will continue to vest pursuant to their original terms following the offering.
Additional Executive Benefits and Perquisites
We provide our named executive officers with certain executive benefits that the compensation committee believes are reasonable and in the best interests of the Company and its stockholders. The compensation committee, in its discretion, may revise, amend or add to an officer’s executive benefits if it deems it advisable. We believe these benefits are generally equivalent to benefits provided by comparable companies based on our expertise and knowledge of general industry practices.
Retirement Plan Benefits. We do not sponsor a defined benefit retirement plan as we do not believe that such a plan best serves the needs of our employees or the business at this time. However, we do sponsor a qualified defined contribution (401(k)) retirement plan. The qualified plan is available to all eligible employees located in the United States, including our named executive officers located in the United States, and permits participants to make contributions up to the maximum limits allowable under the Code and provides for Company contributions on a discretionary basis only. For 2014, we made a discretionary matching contribution to employees’ accounts based upon their deferral elections for the previous fiscal year. Employees’ contributions vest immediately. Company contributions vest over a three year period. For our employees located in the United Kingdom we also offer a workplace defined contribution pension plan and make contributions on behalf of such employees into this plan. Mr. Krisanda participates in a private pension plan that mirrors the plan offered to our employees in the United Kingdom.
Health and Welfare Benefits. Our named executive officers have the option to participate in various employee welfare benefit programs, including medical, dental and life insurance benefits. These benefit programs are generally available to all employees.
Relocation Assistance. Our business needs require us on occasion to relocate certain employees. To meet this need, we may, on a case by case basis, cover certain expenses, including temporary housing, relocation, living and travel expenses.
Perquisites. For 2014, we provided certain our named executive officers with an automobile allowance. In addition, from time to time, we have covered certain personal travel expenses and related tax gross-ups for our named executive officers.
114
Table of Contents
Employment Agreements; Severance and Change in Control Benefits
Employment Agreements
We have entered into employment agreements with each of our named executive officers except Mr. Chalmers. We entered into an employment offer letter with Mr. Chalmers and intend to enter into a severance agreement with Mr. Chalmers before the consummation of this offering. The employment agreements provide for severance and other benefits which are designed to provide economic protection so that an executive can remain focused on our business without undue personal concern in the event that his position is eliminated or, in some cases, significantly altered by the Company, which we believe is particularly important in light of the executives’ leadership roles at the Company. The compensation committee believes that providing severance or similar benefits is common among similarly situated executives in the technology and tooling industry generally and remains important in recruiting and retaining key executives. The employment agreements and offer letter we have entered into with our named executive officers are described in further detail in the narrative following the Summary Compensation Table. For more information regarding the potential payments and benefits that would be provided to our named executive officers in connection with certain terminations of their employment or a change in control on December 31, 2014, see “—Potential Payments Upon Termination or Change-in-Control.”
Change in Control Provisions
The prospect of a change in control of the Company can cause significant distraction and uncertainty for executive officers and, accordingly, the compensation committee believes that appropriate change in control provisions in employment agreements, severance agreements and/or equity award agreements are important tools for aligning executives’ interests in change in control transactions with those of our stockholders by allowing our executive officers to focus on strategic transactions that may be in the best interest of our stockholders without undue concern regarding the effect of such transactions on their continued employment.
Accordingly, as described in “—Potential Payments Upon Termination or Change-in-Control” below, upon a change in control (as defined in the plan or the applicable award agreement), awards granted pursuant to the 2012 Plan will vest and become exercisable upon or follow the change of control if such change in control results in a quotient equal to or greater than two when the aggregate net proceeds received by CCMP, with respect to their shares of capital stock of the Company is divided by the dollar amount of CCMP’s equity investment in the Company, subject to the named executive officer’s continued employment through the change in control.
For more information regarding the potential payments and benefits that would be provided to our continuing named executive officers in connection with a change in control on December 31, 2014, see “—Potential Payments Upon Termination or Change-in-Control” below.
Accounting and Tax Considerations
In determining which elements of compensation are to be paid, and how they are weighted, on a going forward basis, we will take into account whether a particular form of compensation will be deductible under Section 162(m) of the Code (“Section 162(m)”). Section 162(m) generally limits the deductibility of compensation paid to our named executive officers to $1 million during any fiscal year unless such compensation is “performance-based” under Section 162(m). However, under a Section 162(m) transition rule for compensation plans or agreements of corporations which are privately held and which become publicly held in an initial public offering, compensation paid under a plan or agreement that existed prior to the initial public offering will not be subject to Section 162(m) until the earliest of (1) the expiration of the plan or agreement, (2) a material modification of the plan or agreement, (3) the issuance of all employer stock and other compensation that has been allocated under the plan, or (4) the first meeting of stockholders at which directors are to be elected that occurs after the close of the third calendar year following the year of the initial public offering (the “Transition Date”). After the Transition Date, rights or awards granted under the plan, other than options and stock appreciation rights, will not qualify as “performance-based compensation” for purposes of Section 162(m) unless such rights or awards are granted or vest upon pre-established objective performance goals.
115
Table of Contents
Stock Ownership Guidelines
In connection with this offering we expect our compensation committee to adopt stock ownership guidelines to directly align the interests of our executive officers and non-employee directors with us and our stockholders.
Clawback Policy
The Company expects to adopt a clawback policy, pursuant to the 2015 Equity Incentive Plan, that is triggered upon:
| • | termination for cause; |
| • | the compensation committee’s determination that an executive that left the Company for any other reason breached material terms of restrictive covenants (such as a non-competition or confidentiality agreement) in his employment agreement or other grant agreements; or |
| • | an accounting restatement. |
The clawback policy for termination for cause and for breach of restrictive covenants after termination for any other reason will apply at any time within one year after the date on which an executive exercises a stock option or stock appreciation right or on which a full value share award vests or becomes payable or on which a cash performance award is paid. The executive would be required to pay the Company any gain realized in connection with any of the awards noted above.
If an executive receives compensation (whether a stock option, cash performance award or otherwise) based on financial statements that are subsequently required to be restated in any way that would decrease the value of such compensation, the executive will be required to forfeit and repay to the Company the difference between what the executive received and what the executive should have received based on the accounting restatement.
116
Table of Contents
2014 Summary Compensation Table
The following table sets forth certain information with respect to compensation earned by our named executive officers for the year ended December 31, 2014.
| Name and Principal Position |
Year |
Salary ($) |
Option ($)(1) |
Non-Equity ($)(2) |
All Other ($)(3) |
Total ($) |
||||||||||||||||||
| Thomas Goeke |
2014 | 780,000 | — | 487,103 | 30,804 | 1,297,907 | ||||||||||||||||||
| Chief Executive Officer |
||||||||||||||||||||||||
| Bruce Chalmers |
2014 | 300,000 | 860,640 | 85,627 | 14,718 | 1,260,985 | ||||||||||||||||||
| Chief Financial Officer from November 21, 2014(4) |
||||||||||||||||||||||||
| John Gallagher |
2014 | 400,000 | 3,155,680 | 162,163 | 1,700 | 3,719,543 | ||||||||||||||||||
| Chief Operating Officer, MDCS and Fluids(5) |
||||||||||||||||||||||||
| Ron Krisanda |
2014 | 508,886 | 229,504 | 187,877 | 5,295 | 931,562 | ||||||||||||||||||
| Chief Operating Officer, APPT(6) |
||||||||||||||||||||||||
| John Francy |
2014 | 330,000 | — | 126,487 | 20,012 | 476,499 | ||||||||||||||||||
| Former Chief Financial Officer(7) |
||||||||||||||||||||||||
| (1) | As required by SEC rules, amounts shown in the column “Option Awards” present the aggregate grant date fair value of option awards granted in the fiscal year in accordance with accounting rules ASC 718, Compensation—Stock Compensation. For a description of the assumptions used in calculating the fair value of equity awards in 2014 under ASC 718, see Note 9 to the Company’s audited financial statements included elsewhere in this prospectus. These amounts reflect our cumulative accounting expense over the vesting period and do not correspond to the actual values that were to be realized by the named executive officers. |
| (2) | The amounts reported in this column represent the annual cash performance-based bonuses earned by our named executive officers pursuant to the achievement of certain Company performance objectives described above in “Elements of Compensation —Annual Performance-Based Cash Awards.” |
| (3) | This column includes matching contributions made under our 401(k) plan and perquisites and other personal benefits as set forth in the table below. |
| Name |
401(k) Match | Travel Expense(a) |
Car Allowance(b) |
Executive Physical |
Relocation Expense |
Private Pension Contribution(c) |
||||||||||||||||||
| Thomas Goeke |
$ | 4,900 | $ | 15,994 | $ | 6,769 | $ | 3,141 | — | — | ||||||||||||||
| Bruce Chalmers |
$ | 2,173 | — | — | — | $ | 12,545 | — | ||||||||||||||||
| John Gallagher |
$ | 1,700 | — | — | — | — | — | |||||||||||||||||
| Ron Krisanda |
— | — | — | — | — | $ | 5,295 | |||||||||||||||||
| John Francy |
$ | 4,850 | — | $ | 12,813 | $ | 2,349 | — | — | |||||||||||||||
| (a) | This column represents payment for personal travel expenses. |
| (b) | This column represents an annual car allowance. |
| (c) | The column represents contributions to a private pension fund for Mr. Krisanda’s benefit. |
| (4) | Mr. Chalmers became our Chief Financial Officer on November 21, 2014. Prior to this time his position was Vice President of Finance from January 1, 2014. The base salary shown for Mr. Chalmers includes all amounts earned in his prior position. |
| (5) | Mr. Gallagher’s employment start date was May 1, 2014. |
| (6) | Mr. Krisanda’s cash compensation was paid in British Pounds. For convenience, this has been converted to U.S. dollars at the December 31, 2014 exchange rate of $1.5573 per £1.00. His base salary was increased from £315,000 to £338,550 on July 1, 2014. |
| (7) | Mr. Francy served as Chief Financial Officer until November 21, 2014. From November 21, 2014 to December 31, 2014, Mr. Francy served in the role of Executive – Special Projects. Mr. Francy left the Company on December 31, 2014. The base salary shown for Mr. Francy includes base salary earned in both of the positions he held in 2014. |
117
Table of Contents
2014 Grants of Plan-Based Awards
The following table summarizes plan-based awards granted to our named executive officers for the year ended December 31, 2014.
| Estimated Future Payouts Under Non-Equity Incentive Plan Awards |
Estimated Future Payouts Under Equity Incentive Plan Awards |
All Other Stock Awards: Number of Shares of Stock or Units |
All Other Option Awards: Number of Securities Underlying Options |
Exercise or Base Price of Option Awards |
Market Price on Grant Date |
Grant Date Fair Value of Stock and Option Awards |
||||||||||||||||||||||||||||||||
| Name |
Grant Date |
Threshold ($)(1) |
Target ($)(1) |
Maximum ($) |
||||||||||||||||||||||||||||||||||
| (#)(2) | (#) | (#) | ($/Sh) | ($/Sh) | ($)(3) | |||||||||||||||||||||||||||||||||
| Thomas Goeke Bonus Plan Payment |
N/A | 381,250 | 762,500 | N/A | — | — | — | N/A | N/A | — | ||||||||||||||||||||||||||||
| Bruce Chalmers Stock Option Grant Bonus Plan Payment |
|
4/30/2014 N/A |
|
|
N/A 67,019 |
|
|
N/A 134,038 |
|
N/A N/A |
|
750 — |
|
|
— — |
|
|
750 — |
|
|
1,000 N/A |
|
|
1,000 N/A |
|
|
860,640 — |
| ||||||||||
| John Gallagher Stock Option Grant Bonus Plan Payment |
|
5/1/2014 N/A |
|
|
N/A 126,923 |
|
|
N/A 253,847 |
|
N/A N/A |
|
2,750 — |
|
|
— — |
|
|
2,750 — |
|
|
1,000 N/A |
|
|
1,000 N/A |
|
|
3,155,680 — |
| ||||||||||
| Ron Krisanda Stock Option Grant Bonus Plan Payment(3) |
|
8/6/2014 N/A |
|
|
N/A 147,050 |
|
|
N/A 294,100 |
|
N/A N/A |
|
200 — |
|
|
— — |
|
|
200 — |
|
|
1,000 N/A |
|
|
1,000 N/A |
|
|
229,504 — |
| ||||||||||
| John Francy Bonus Plan Payment |
N/A | 99,000 | 198,000 | N/A | — | — | — | N/A | N/A | — | ||||||||||||||||||||||||||||
| (1) | Represents potential payments pursuant to the Company’s Bonus Plan. Payments under the Bonus Plan are based on a percentage of the base salary actually paid to each NEO during 2014. |
| (2) | These options to purchase shares of our common stock, immediately vest in full upon the occurrence, provided the participant is still then employed by us or one of our subsidiaries, of either: (a) a change in control of the Company that results in a quotient equal to or greater than two when the aggregate net proceeds received by CCMP, with respect to their shares of capital stock of the Company is divided by the dollar amount of CCMP’s equity investment in the Company; or (b) from and after the date of the consummation of this offering, the achievement with respect to shares of the common stock of an average closing trading price equal or exceeding, in any 10 trading day period, the lowest amount which when multiplied by the number of shares of common stock then held by the CCMP Investors and added to the aggregate net proceeds received by CCMP with respect to their shares of capital stock of the Company would yield a quotient of equal to or greater than two when divided by CCMP’s equity investment in the Company. |
| (3) | As required by SEC rules, amounts shown in the column “Grant Date Fair Value of Stock and Option Awards” present the aggregate grant date fair value of option awards granted in the fiscal year in accordance with accounting rules ASC 718, Compensation—Stock Compensation. For a description of the assumptions used in calculating the fair value of equity awards in 2014 under ASC 718, see Note 9 to the Company’s audited financial statements included elsewhere in this prospectus. These amounts reflect our cumulative accounting expense over the vesting period and do not correspond to the actual values that were to be realized by the named executive officers. |
| (4) | Mr. Krisanda’s Bonus Plan payment was paid in British Pounds. For convenience this has been converted to U.S. dollars at the December 31, 2014 exchange rate of $1.5573 per £1.00. |
118
Table of Contents
2014 Outstanding Equity Awards at Fiscal Year-End
The following table sets forth certain information with respect to outstanding equity awards held by our named executive officers as of December 31, 2014.
| Option Awards | ||||||||||||||||||||||||
| Name |
Grant Date |
Number of Securities Underlying Unexercised Options Exercisable (#) |
Number of Securities Underlying Unexercised Options Unexercisable (#)(1) |
Equity Incentive Plan Awards: Number of Securities Underlying Unexercised Unearned Options (#)(2) |
Option Exercise Price ($) |
Option Expiration Date(3) |
||||||||||||||||||
| Thomas Goeke |
10/4/2012 | 1,916.25 | 1,916.25 | 3,832.5 | 1,000 | 10/4/2022 | ||||||||||||||||||
| 3/28/2013 | 123.125 | 369.375 | 492.5 | 1,000 | 3/28/2023 | |||||||||||||||||||
| Bruce Chalmers |
4/30/2014 | — | 750.0 | 750.0 | 1,000 | 4/30/2024 | ||||||||||||||||||
| John Gallagher |
11/27/2012 |
225.6 | 338.4 | — | 1,000 | 11/27/2022 | ||||||||||||||||||
| 5/1/2014 | — | 2,750.0 | 2,750.0 | 1,000 | 5/1/2024 | |||||||||||||||||||
| Ron Krisanda |
5/8/2013 | 350.0 | 1,050.0 | 1,400.0 | 1,000 | 5/8/2023 | ||||||||||||||||||
| 8/6/2014 | — | 200.0 | 200.0 | 1,000 | 8/6/2024 | |||||||||||||||||||
| John Francy |
3/29/2012 | 958.0 | — | — | 1,000 | 3/31/2015 | ||||||||||||||||||
| (1) | These options to purchase common stock, with the exception of the options granted to Mr. Gallagher on November 27, 2012, vest over four years, at a rate of 25% per year, beginning on the first anniversary of the grant dates listed above, or in the case of the options granted to Mr. Krisanda on May 8, 2013, the first anniversary of March 28, 2013. The stock options granted to Mr. Gallagher on November 27, 2012 vest over five years, at a rate of 20% per year beginning on the first anniversary of the grant date. Additionally, the options to purchase shares of our common stock immediately vest in full upon the occurrence, provided the participant is still then employed by us or one of our subsidiaries, of either: (a) prior to this offering, a change in control of the Company that results in a quotient equal to or greater than two when the aggregate net proceeds received by the CCMP Investors, with respect to their shares of capital stock of the Company is divided by the dollar amount of the CCMP Investors’ equity investment in the Company; or (b) from and after the date of the consummation of this offering, the achievement with respect to shares of the common stock of an average closing trading price equal or exceeding, in any 10 trading day period, the lowest amount which when multiplied by the number of shares of common stock then held by the CCMP Investors and added to the aggregate net proceeds received by the CCMP Investors with respect to their shares of capital stock of the Company would yield a quotient of equal to or greater than two when divided by the CCMP Investors equity investment in the Company. |
| (2) | These options to purchase shares of our common stock, immediately vest in full upon the occurrence, provided the participant is still then employed by us or one of our subsidiaries, of either: (a) a change in control of the Company that results in a quotient equal to or greater than two when the aggregate net proceeds received by the CCMP Investors, with respect to their shares of capital stock of the Company is divided by the dollar amount of the CCMP Investors’ equity investment in the Company; or (b) from and after the date of the consummation of this offering, the achievement with respect to shares of the common stock of an average closing trading price equal or exceeding, in any 10 trading day period, the lowest amount which when multiplied by the number of shares of common stock then held by the CCMP Investors and added to the aggregate net proceeds received by the CCMP Investors with respect to their shares of capital stock of the Company would yield a quotient of equal to or greater than two when divided by the CCMP Investors equity investment in the Company. |
| (3) | As a result of Mr. Francy’s termination, any unvested options held by him were forfeited on December 31, 2014, and all vested options held by him expire 90 days following his termination of employment. |
119
Table of Contents
Option Exercises and Stock Vested in 2014
None of our named executive officers exercised any options or had any stock awards vest in 2014.
Pension Benefits
Our named executive officers did not participate in any defined benefit pension plan during 2014.
Nonqualified Deferred Compensation
In the year ended December 31, 2014, our named executive officers received no nonqualified deferred compensation and had no deferred compensation benefits.
Potential Payments Upon Termination or Change-In-Control
Cash Benefits
Our named executive officers, except for Mr. Chalmers, are entitled to the following cash severance under their respective employment agreements. We expect to enter into a severance agreement with Mr. Chalmers prior to the consummation of this offering.
If Mr. Goeke’s employment is terminated either by us without “cause” (other than by reason of death or “disability”) or by Mr. Goeke for “good reason” (as such terms are defined in his employment agreement), Mr. Goeke will receive a cash severance payment equal to the following:
| • | 200% of his annual base salary as then in effect; plus |
| • | 200% of the greater of (i) his annual bonus for the year prior to the date of termination or (ii) his annual bonus for the year of termination calculated at the target level; plus |
| • | the pro-rated amount of the target annual cash bonus for the year of termination, based on actual audited year-end results for such year and payable when bonuses are normally paid to employees; plus |
| • | 18 months of the cost of health insurance under COBRA. |
If Mr. Goeke’s employment is terminated by reason of death or “disability” (as such term is defined in his employment agreement), he will receive a cash severance payment equal to any earned but unpaid annual cash bonus for the year prior to termination.
If Mr. Gallagher’s employment is terminated either by us without “cause” (other than by reason of death or “disability”) or by Mr. Gallagher for “good reason” (as such terms are defined in his employment agreement), Mr. Gallagher will receive a cash severance payment equal to the following:
| • | 18 months of his annual base salary as then in effect; plus |
| • | the pro-rated amount of the target annual cash bonus for the year of termination, based on actual audited year-end results for such year and payable when bonuses are normally paid to employees; plus |
| • | 18 months of the cost of health insurance under COBRA. |
If Mr. Gallagher’s employment is terminated by reason of death or “disability” (as such term is defined in his employment agreement), he will receive a cash severance payment equal to any earned but unpaid annual cash bonus for the year prior to his termination.
120
Table of Contents
If Mr. Krisanda’s employment is terminated either by us without “cause” or by Mr. Krisanda for “good reason” (as such terms are defined in his employment agreement), Mr. Krisanda will receive a cash severance payment equal to the following:
| • | six months of his annual base salary as then in effect; plus |
| • | if less than 12 months prior written notice of termination is given by the Company to Mr. Krisanda, an amount equal to the annual base salary that he would have been entitled to during the remainder of the notice period. |
Mr. Francy’s employment was terminated on December 31, 2014 and he received the payments described under “—Separation Agreement with Mr. Francy.”
For purposes of the employment agreements with Mr. Goeke and Mr. Gallagher, “cause” means:
| • | any act or omission that constitutes a material breach of any of his obligations under the agreement or any written policy of ours, including, without limitation, the willful and continued failure or refusal of the Executive to substantially perform the duties reasonably required of him as an employee of the Company; |
| • | conviction of, or plea of nolo contendere to, (A) any felony or (B) another crime involving material acts of dishonesty or moral turpitude that relates to the property of the ours or which is or could reasonably be expected to be materially injurious to the financial condition or business reputation of us any of our subsidiaries or affiliates; |
| • | engaging in any willful misconduct which is or could reasonably be expected to be materially injurious to the financial condition or business reputation of the Company or any of its subsidiaries or affiliates; |
| • | any material act or omission by the executive involving malfeasance or gross negligence in the performance of the executive’s duties to us, or material deviation from any of our material policies or directives, that is not cured within 15 business days of written notice from us; or |
| • | engaging in any intentional act of dishonesty, violence or threat of violence (including any violation of federal securities laws) which is or could reasonably be expected to be materially injurious to the financial condition or business reputation of the Company or any of its subsidiaries or affiliates. |
For purposes of Mr. Krisanda’s employment agreement, “cause” means, if Mr. Krisanda (a) is guilty of any gross misconduct affecting the business of the Company, (b) commits any serious or repeated breach or non-observance of any of the provisions of his employment agreement or the articles of association, by-laws or constitution of the Company, (c) refuses or neglects to comply with any reasonable and lawful directions of the Board, (d) is, in the reasonable opinion of the Board, seriously negligent or incompetent, (e) acts in any manner which in the opinion of the Board is likely to bring disrepute upon himself or the Company or is materially adverse to the interests of the Company, (f) is charged with or convicted of any offense in any jurisdiction (other than certain traffic offenses), (g) is declared bankrupt or makes any arrangement with or for the benefit or his creditors, (h) is disqualified from acting as a director or resigns as a director with the prior written consent of the Board or (i) ceases to be eligible to work in the United Kingdom.
For purposes of Mr. Goeke’s employment agreement, “good reason” means termination by Mr. Goeke based on any of (a) a material reduction in base salary, unless agreed to in writing, (b) delivery by us of a notice of non-renewal of the term, (c) a material reduction in the authority, duties, or responsibilities of Mr. Goeke, (d) a requirement for Mr. Goeke to report to a corporate officer or employee rather than to our Board, (e) a change in
121
Table of Contents
the geographic location where Mr. Goeke is required to perform his duties of more than 100 miles from the current headquarters in Cincinnati, Ohio, other than required travel, or (f) any other action or inaction that constitutes a material breach by us of the agreement.
For purposes of Mr. Gallagher’s employment agreement, “good reason” means termination by the named executive officer based on any of (a) a material reduction in base salary, unless agreed to in writing, (b) delivery by us of a notice of non-renewal of the term, (c) a material reduction in the authority, duties, or responsibilities of the named executive officer or (d) a change in the geographic location where the named executive officer is required to perform his duties of more than 100 miles from the current headquarters in Cincinnati, Ohio, other than required travel.
For purposes of Mr. Krisanda’s employment agreement, “good reason” means a material reduction in his base salary without the written consent of Mr. Krisanda.
Equity Benefits
Each named executive officer’s stock option agreements provide that upon a “change of control” (as defined in the 2012 Plan (as defined below)), 100% of the named executive officer’s unvested stock options, including both time-based and performance-based stock options, will vest and become exercisable upon or following the change of control if such change of control results in a quotient equal to or greater than two when the aggregate net proceeds received by CCMP, with respect to their shares of capital stock of the Company is divided by the dollar amount of CCMP’s equity investment in the Company, subject to the named executive officer’s continued employment through the change of control.
Separation Agreement with John Francy
On December 11, 2014 we entered into a separation agreement with John Francy pursuant to which he agreed to serve as an employee in the role of Executive—Special Projects until December 31, 2014 (the “Termination Date”). Pursuant to the separation agreement, Mr. Francy was entitled to (a) 18 months of base salary following the Termination Date, (b) COBRA coverage at active employee rates for him and his spouse for a period of 18 months following the Termination Date, (c) a lump sum payment equal to the cash value of his Company-supplied automobile and (d) executive out placement services for a period of 12 months following the Termination Date. The terms of the separation agreement also provide that Mr. Francy is entitled to an annual bonus under the Bonus Plan for 2014. Mr. Francy declined the COBRA coverage that he was entitled to under the terms of his severance agreement. As consideration for the Company’s entry into such agreement, the agreement contains a release of claims against the Company by Mr. Francy, as well as other typical restrictive covenants relating to his departure.
The table below shows the estimated value transfer to each continuing named executive officer if they are terminated by us without cause or by the named executive officer for good reason. Unless otherwise noted, the table below assumes that such termination occurred on December 31, 2014, and payments are made under the employment agreements then in effect. The actual amounts that would be paid to any named executive officer can only be determined at the time of an actual termination of employment and would vary from those listed below.
| Termination without Cause or for Good Reason without a Change of Control |
||||||||
| Name |
Severance Pay $ |
Benefits $(1) |
||||||
| Thomas Goeke |
3,607,365 | 34,184 | ||||||
| Bruce Chalmers(2) |
||||||||
| John Gallagher |
985,673 | 27,649 | ||||||
| Ron Krisanda(3) |
790,836 | 7,449 | ||||||
| John Francy(4) |
533,606 | — | ||||||
| (1) | Represents the estimated value of the Company paid portion of the premium for executive’s medical and dental for the salary continuation period. |
122
Table of Contents
| (2) | We intend to enter into a severance agreement with Mr. Chalmers prior to the consummation of this offering and will update accordingly in a subsequent amendment assuming that the terms of his severance agreement were in effect as of December 31, 2014. |
| (3) | The severance amount shown for Mr. Krisanda assumes that he was terminated with no notice period, which would entitle him to a total of 18 months of his annual base salary in effect on December 31, 2014. Additionally, any severance amount payable to Mr. Krisanda would be paid in British Pounds. For convenience, amounts presented have been converted to U.S. dollars at the December 31, 2014 exchange rate of $1.5573 per £1.00. |
| (4) | The amounts shown for Mr. Francy reflect the terms of his separation agreement. Pursuant to the terms of his separation agreement, Mr. Francy is entitled to 18 months of base salary and a lump sum payment of $38,606 in respect of the cash value of his Company supplied automobile. Mr. Francy declined the COBRA coverage that he was entitled to under the terms of his severance agreement. |
Employment Agreements
We entered into an employment agreement with Thomas Goeke on October 4, 2012. Mr. Goeke’s contract period is valid through October 4, 2017 and automatically renews on an annual basis thereafter, unless either party provides notice of at least six months prior to the expiration date. The agreement provides that Mr. Goeke will receive an initial annualized base salary of $750,000. The agreement also provides for an annual bonus payment for Mr. Goeke determined by the board of directors or a committee thereof based on performance goals established with respect to that particular year with the target bonus level set at a percentage of his annualized base salary. Mr. Goeke’s agreement also contains standard non-solicitation, non-competition and confidentiality provisions.
We entered into an offer letter with Bruce Chalmers on October 31, 2013. The offer letter provides that Mr. Chalmers will receive an initial annualized base salary of $300,000. The offer letter also provides that Mr. Chalmers will be eligible to participate in the Bonus Plan with a target bonus level set at a percentage of his annualized base salary. Pursuant to the offer letter and a related stock option award agreement, Mr. Chalmers was granted an option to purchase 1,500 shares of our common stock at a price of $1,000 per share.
We entered into an employment agreement with John Gallagher on May 1, 2014. Mr. Gallagher’s contract period is valid through May 1, 2019 and automatically renews on an annual basis thereafter, unless either party provides notice of at least six months prior to the expiration date. The agreement provides that Mr. Gallagher will receive an initial annualized base salary of $600,000. The agreement also provides for an annual bonus payment for Mr. Gallagher determined in accordance with the Bonus Plan with a target bonus level set at a percentage of his annualized base salary. Pursuant to his employment agreement and a related stock option award agreement, Mr. Gallagher was issued an option to purchase 5,500 shares of our common stock. Mr. Gallagher’s agreement also provides that he will not be entitled to any cash compensation with respect to his services on our Board during his employment term. Mr. Gallagher’s agreement contains standard non-solicitation, non-competition and confidentiality provisions.
We entered into an employment agreement with Ron Krisanda on March 20, 2013. Mr. Krisanda’s contract is valid until either party provides at least 12 months’ notice of termination. The agreement provides that Mr. Krisanda will receive an initial annualized base salary of £315,000. Mr. Krisanda also received a one-time signing bonus of £30,000 in 2013. Pursuant to his employment agreement, Mr. Krisanda’s agreement provides for an annual bonus payment for Mr. Krisanda determined in accordance with the Bonus Plan with a target bonus level set at a percentage of his annualized base salary. Mr. Krisanda’s agreement contains customary restrictive covenants, including confidentiality, non-solicitation and non-competition covenants.
Each of Messrs. Goeke, Chalmers, Gallagher and Krisanda are also entitled to certain payments upon their termination or upon a change of control as described above under “—Potential Payments Upon Termination or Change-In-Control.”
123
Table of Contents
Director Compensation
During 2014, certain of our directors received cash compensation for their services as directors. Certain directors were also granted stock options. The following table sets forth certain information with respect to cash compensation paid to our directors for 2014 service and stock options granted to our directors in 2014.
| Name |
Fees Earned or ($)(1) |
Option Awards ($)(2) |
Total ($) |
|||||||||
| Ira Boots |
380,000 | — | 380,000 | |||||||||
| Greg Brenneman |
— | — | — | |||||||||
| Waters Davis |
50,000 | — | 50,000 | |||||||||
| John Gallagher |
37,857 | — | 37,857 | |||||||||
| Jim Gentilcore |
32,639 | 370,559 | 403,198 | |||||||||
| Jim Kratochvil |
11,481 | 370,559 | 382,040 | |||||||||
| Mark McFadden |
— | — | — | |||||||||
| James Ridout |
— | — | — | |||||||||
| Timothy Walsh |
— | — | — | |||||||||
| (1) | Mr. Gallagher ceased to be a non-employee director and ceased to be chair of the audit committee on April 30, 2014, and he was paid only for this period of service. Mr. Gentilcore and Mr. Kratochvil were appointed to the Board on February 5, 2014 and October 28, 2014, respectively, and were paid only for their respective periods of service. |
| (2) | As required by SEC rules, amounts shown in the column “Grant Date Fair Value of Stock and Option Awards” present the aggregate grant date fair value of option awards granted in the fiscal year in accordance with accounting rules ASC 718, Compensation—Stock Compensation. For a description of the assumptions used in calculating the fair value of equity awards in 2014 under ASC 718, see Note 9 to the Company’s audited financial statements included elsewhere in this prospectus. These amounts reflect our cumulative accounting expense over the vesting period and do not correspond to the actual values that were to be realized by the directors. |
Director Compensation
With the exception of our chairman, Mr. Boots, certain of our directors are paid an annual cash fee of $50,000, paid in equal quarterly installments, for their service on our Board. Mr. Gallagher received an additional quarterly cash payment of $3,750 for his service as Chair of the Audit Committee until April 30, 2014.
We do not pay any additional remuneration for director service to any of our directors who are either our officers, namely Mr. Goeke and Mr. Gallagher, or who are full-time investment professionals of CCMP or employees of AIMCo. However, all directors are reimbursed for reasonable travel and lodging expenses incurred to attend meetings of our Board or a committee thereof.
Mr. Boots receives an annual fee of $380,000 for his services as non-employee chairman of the Company.
2012 Equity Incentive Plan
The 2012 Equity Incentive Plan (the “2012 Plan”) authorizes our compensation committee to grant options, stock appreciation rights, restricted shares or other share based awards to selected employees. The 2012 Plan is administered by the compensation committee of the Board. The compensation committee shall determine the recipients of awards, the types of awards to be granted and the applicable terms, provisions, limitations and performance requirements of such awards. The compensation committee will also have the authority to conclusively interpret the 2012 Plan and any award agreements under the plan.
The Company has reserved 53,000 shares of our common stock for issuance pursuant to the 2012 Plan. To the extent any award under the 2012 Plan is cancelled, terminated or forfeited, then the number of shares of common stock covered by the award so cancelled, terminated or forfeited will again be available for awards under the 2012 Plan.
124
Table of Contents
The number of shares of common stock available for grants or subject to outstanding awards shall be proportionally adjusted in the event of any dividend payable in capital stock of the Company, and any stock split, share combination, cash dividend, recapitalization, reorganization, merger, consolidation, split-up, spin-off, combination, exchange of shares or other similar event.
The compensation committee, in its sole discretion, may determine that an award will be immediately vested in whole or in part, or that all or any portion may not be vested until a date, or dates, subsequent to its grant date, or until the occurrence of one or more specified events, subject in any case to the terms of the 2012 Plan. The compensation committee may impose on any award such additional terms and conditions as the compensation committee determines, including terms requiring forfeiture of awards in the event of a participant’s termination of service.
The compensation committee generally may terminate, suspend or amend the 2012 Plan in a manner that does not adversely affect outstanding awards at any time. The 2012 Plan will expire on the tenth anniversary of its adoption by the Board, unless earlier terminated.
2015 Equity Incentive Plan
We anticipate that at the time of, or shortly after, completion of this offering, we will make changes to certain of our compensation arrangements, including those covering our named executive officers and members of our Board. We expect to adopt a 2015 Equity Incentive Plan (the “2015 Plan”) prior to the completion of this offering.
125
Table of Contents
CERTAIN RELATIONSHIPS AND RELATED PERSON TRANSACTIONS
The following includes a summary of transactions since January 1, 2012 to which we have been a party in which the amount involved exceeded or will exceed $120,000, and in which any of our directors, executive officers or, to our knowledge, beneficial owners of more than 5% of our capital stock or any member of the immediate family of any of the foregoing persons had or will have a direct or indirect material interest, other than equity and other compensation, termination, change in control and other arrangements, which are described under “Executive and Director Compensation” We also describe below certain other transactions with our directors, executive officers and stockholders.
Amended and Restated Stockholders Agreement
On July 8, 2013, we, affiliates of CCMP, affiliates of Alberta Investment Management Corporation (“AIMCo”), our management investors and Ira Boots entered into an Amended and Restated Stockholders Agreement (the “Stockholders Agreement”). The Stockholders Agreement contains provisions relating to the election of directors, governance, stock transfer restrictions with respect to stock held by non-CCMP shareholders, customary drag-along rights in favor of CCMP and customary tag-along rights, preemptive rights and registration rights. These provisions, other than the registration rights provisions, will terminate upon the consummation of this offering.
CCMP Acquisition
Upon the closing of the CCMP Acquisition, CCMP and Ira Boots received an aggregate one-time transaction fee and reimbursement of expenses of $5.2 million. Pursuant to an advisory services and monitoring agreement entered into in connection with the CCMP Acquisition, CCMP also receives a quarterly advisory fee of $125,000 and reimbursement for reasonable out-of-pocket expenses incurred in connection with the provision of services, including the reasonable fees and disbursements of legal counsel and other advisors retained by CCMP and travel and reasonable out-of-pocket expenses of each director appointed by CCMP to our Board of directors or the board of directors of our affiliates. The advisory services and monitoring agreement also provides for customary exculpation, indemnification and confidentiality provisions. The advisory services and monitoring agreement will terminate automatically upon the consummation of this offering.
Employment Agreements
Milacron Intermediate Holdings previously entered into employment agreements with certain of its executive officers. Milacron UK Limited entered into an employment agreement with Mr. Krisanda. See “Executive and Director Compensation—Employment Agreements; Severance and Change in Control Benefits—Employment Agreements.”
Indemnification of Officers and Directors
We have entered into indemnification agreements with our current directors and executive officers and expect to enter into similar agreements with any new directors and new executive officers in the future.
Policies for Approval of Related Person Transactions
In connection with this offering, we will adopt a written policy relating to the approval of related person transactions. Our audit committee will review and approve or ratify all relationships and related person transactions between us and (1) our directors, director nominees, executive officers or their immediate family members; (2) any 5% record or beneficial owner of our common stock; or (3) any immediate family member of
126
Table of Contents
any person specified in (1) and (2) above. Our corporate controller will be primarily responsible for the development and implementation of processes and controls to obtain information from our directors and executive officers with respect to related party transactions and for determining, based on the facts and circumstances, whether we or a related person have a direct or indirect material interest in the transaction.
As set forth in the related person transaction policy, in the course of its review and approval or ratification of a related party transaction, the committee will consider:
| • | the nature of the related person’s interest in the transaction; |
| • | the availability of other sources of comparable products or services; |
| • | the material terms of the transaction, including, without limitation, the amount and type of transaction; and |
| • | the importance of the transaction to us. |
Any member of the audit committee who is a related person with respect to a transaction under review will not be permitted to participate in the discussions or approval or ratification of the transaction. However, such member of the audit committee will provide all material information concerning the transaction to the audit committee.
127
Table of Contents
Security Ownership
The following table shows information as of , 2015 regarding the beneficial ownership of our common stock (1) prior to this offering and (2) as adjusted to give effect to this offering by:
| • | each person or group who is known by us to own beneficially more than 5% of our common stock; |
| • | each member of our board and each of our named executive officers; and |
| • | all members of our board and our executive officers as a group. |
For further information regarding material transactions, see “Certain Relationship and Related Person Transactions.”
Beneficial ownership of shares is determined under rules of the SEC and generally includes any shares over which a person exercises sole or shared voting or investment power. Percentage of beneficial ownership is based on shares of common stock outstanding as of , 2015 and shares of common stock outstanding after giving effect to this offering, assuming no exercise of the underwriters’ option to purchase additional shares, or shares of common stock, assuming the underwriters exercise their option to purchase additional shares in full. Shares of common stock subject to options currently exercisable or exercisable within 60 days of the date of this prospectus are deemed to be outstanding and beneficially owned by the person holding the options for the purposes of computing the percentage of beneficial ownership of that person and any group of which that person is a member, but are not deemed outstanding for the purpose of computing the percentage of beneficial ownership for any other person. Except as otherwise indicated, the persons named in the table below have sole voting and investment power with respect to all shares of capital stock held by them. Unless otherwise indicated, the address for each holder listed below is c/o Milacron Holdings Corp., 3010 Disney Street, Cincinnati, OH 45209.
| Shares of common stock this offering |
Shares of common stock exercise of the option to shares) |
Shares of common stock this offering assuming full exercise of the option to purchase additional shares | ||||||||||
| Name and address of beneficial owner |
Number |
Percentage |
Number of shares |
Percentage of shares |
Number |
Percentage | ||||||
| 5% stockholders: |
||||||||||||
| Affiliates of CCMP(1) |
||||||||||||
| Affiliates of AIMCo(2) |
||||||||||||
| Named executive officers and directors: |
||||||||||||
| Tom Goeke |
||||||||||||
| Bruce Chalmers |
||||||||||||
| Ronald Krisanda |
||||||||||||
| John Gallagher III |
||||||||||||
| John Francy |
||||||||||||
| Ira Boots |
||||||||||||
| Greg Brenneman |
||||||||||||
| Mark McFadden |
||||||||||||
| Waters Davis |
||||||||||||
| Jim Gentilcore |
||||||||||||
| Timothy Walsh |
||||||||||||
| Jim Kratochvil |
||||||||||||
| James Ridout |
||||||||||||
| All board of director members and executive officers as a group (13 persons) |
||||||||||||
128
Table of Contents
| * | Less than 1% |
| (1) | Includes shares of common stock owned by CCMP Capital Investors II, L.P. (“CCMP Capital Investors”) and shares of common stock owned by CCMP Capital Investors (Cayman) II, L.P. (“CCMP Cayman,” and together with CCMP Capital Investors, the “CCMP Capital Funds”). The general partner of the CCMP Capital Funds is CCMP Capital Associates, L.P (“CCMP Capital Associates”). The general partner of CCMP Capital Associates is CCMP Capital Associates GP, LLC (“CCMP Capital Associates GP”). CCMP Capital Associates GP is wholly-owned by CCMP Capital, LLC. CCMP Capital, LLC ultimately exercises voting and dispositive power over the shares held by the CCMP Capital Funds. Voting and disposition decisions at CCMP Capital, LLC with respect to such shares are made by a committee, the members of which are Greg Brenneman, Christopher Behrens and Timothy Walsh. Greg Brenneman is Chairman, President and Chief Executive Officer of CCMP. Timothy Walsh is Chief Operating Officer and a Managing Director of CCMP. Mark McFadden is a Managing Director of CCMP. The address of each of Messrs. Brenneman, McFadden and Walsh and each of the entities described above is c/o CCMP Capital Advisors, LLC, 245 Park Avenue, New York, New York 10167, except the address of CCMP Cayman is c/o Intertrust Corporate Services (Cayman) Limited, 190 Elgin Avenue, George Town, Grand Cayman, KY1-9005, Cayman Islands. Each of Messrs. Brenneman, McFadden and Walsh disclaims any beneficial ownership of any shares beneficially owned by the CCMP Capital Funds. |
| (2) | Comprises common stock owned by PE12GVPE (Talon) Ltd. and PE12PXPE (Talon) Ltd., all of which are directly or indirectly owned by entities advised and managed by AIMCo. The address for each of PE12GVPE (Talon) Ltd. and PE12GVPE (Talon) Ltd. is 1100—10830 Jasper Avenue, Edmonton, Alberta Canada, T5J 2B3. |
129
Table of Contents
DESCRIPTION OF CERTAIN INDEBTEDNESS
The following descriptions are only summaries of the material provisions of the ABL Facility, the Term Loan Facility, the Senior Secured Notes, the Senior Unsecured Notes and certain other of our indebtedness, and do not purport to be complete.
Senior Credit Facilities
In connection with the acquisition of Mold-Masters in 2013 (i) Milacron Intermediate Holdings, Milacron LLC and certain domestic subsidiaries of Milacron Intermediate Holdings as borrowers (together with Milacron LLC, collectively, the “U.S. Borrowers”), certain other domestic subsidiaries of Milacron Intermediate Holdings as guarantors (together with the U.S. Borrowers, the “U.S. ABL Obligors”), Mold-Masters 2007 (Limited) and certain other Canadian subsidiaries of Milacron Intermediate Holdings (together with Mold-Masters 2007 (Limited), collectively, the “Canadian ABL Obligors”) amended and restated their existing senior secured asset-based revolving credit facility, originally dated as of April 30, 2012, on March 28, 2013, which was subsequently further amended and restated on October 17, 2014, with Bank of America, N.A., as agent, and certain financial institutions as lenders (the “ABL Facility”); and (ii) Milacron LLC, Milacron Intermediate Holdings and certain domestic subsidiaries of Milacron Intermediate Holdings entered into a new senior secured term loan facility, dated as of March 28, 2013, as amended on March 31, 2014, with JPMorgan Chase Bank, N.A., as administrative agent, and certain financial institutions as lenders (the “Term Loan Facility”).
Merrill Lynch, Pierce, Fenner & Smith Incorporated, RBC Capital Markets, and Barclays Bank PLC acted as lead arrangers and bookrunners for the original ABL Facility, Merrill Lynch, Pierce, Fenner & Smith Incorporated, RBC Capital Markets, Credit Suisse Securities (USA) LLC, J.P. Morgan Securities LLC and Barclays Bank PLC acted as lead arrangers and bookrunners for the first amendment and restatement of the ABL Facility and Bank of America, N.A. acted as lead arranger and bookrunner for the second amendment and restatement of the ABL Facility. J.P. Morgan Securities LLC, Merrill Lynch, Pierce, Fenner & Smith Incorporated, Barclays Bank PLC, Credit Suisse Securities (USA) LLC and RBC Capital Markets acted as joint lead arrangers and joint bookrunners for the original Term Loan Facility and J.P. Morgan Securities LLC acted as sole lead arranger and bookrunner in connection with the incremental amendment to the Term Loan Facility entered into on March 31, 2014.
General
ABL Facility. Our ABL Facility terminates either on (x) February 15, 2019 or (y) October 17, 2019, subject to the satisfaction of certain conditions on or prior to February 14, 2019. The ABL Facility consists of a U.S. revolving credit facility in an aggregate principal amount of $80.0 million (the “U.S. ABL Facility”), a Canadian revolving credit facility in an aggregate principal amount of CAD equivalent of $20.0 million (the “Canadian ABL Facility”), and a German revolving credit facility in an aggregate principal amount of the Euro equivalent of $25.0 million (the “German ABL Facility”), in each case, providing for loans and/or letters of credit thereunder. Proceeds from the ABL Facility, including any letters of credit, may be used for working capital needs and other general corporate purposes, including the financing of capital expenditures, permitted acquisitions, other permitted investments, restricted payments and any other purposes not prohibited by the ABL Facility.
Availability under the U.S. ABL Facility is limited to the lesser of $80.0 million and a borrowing base (the “U.S. Borrowing Base”) equal to the sum (subject to certain reserves and other adjustments) of:
| • | 85% of the U.S. Borrowers’ eligible accounts receivable, plus |
| • | the lesser of (x) 65% of the lesser of cost (valued based on historical accounting practices) or market value of the U.S. Borrowers’ eligible inventory and (y) 85% of the appraised net orderly liquidation value of the U.S. Borrowers’ eligible inventory. |
130
Table of Contents
Availability under the Canadian ABL Facility is limited to the lesser of the CAD equivalent of $20.0 million and a borrowing base (the “Canadian Borrowing Base”) equal to the sum (subject to certain reserves and other adjustments) of:
| • | 85% of the Canadian ABL Obligors’ eligible accounts receivable, plus |
| • | the lesser of (x) 65% of the lesser of cost (valued based on historical accounting practices) or market value of the Canadian ABL Obligors’ eligible inventory and (y) 85% of the appraised net orderly liquidation value of the Canadian ABL Obligors’ eligible inventory. |
Availability under the German ABL Facility is limited to the lesser of the Euro equivalent of $25.0 million and a borrowing base (the “German Borrowing Base”) equal to the sum (subject to certain reserves and other adjustments) of:
| • | 85% of certain of Holdings’ German subsidiaries’ (the “German Borrowers”) eligible accounts receivable, plus |
| • | the lesser of (x) 65% of the lesser of cost (valued based on historical accounting practices) or market value of the German Borrowers’ eligible inventory and (y) 85% of the appraised net orderly liquidation value of the German Borrowers’ eligible inventory. |
The ABL Facility provides the administrative agent customary discretion to impose reserves or availability blocks, which could materially impair the amount of borrowings that would otherwise be available to us, the Canadian ABL Obligors and the German Borrowers and may require us, the Canadian ABL Obligors or the German Borrowers to repay certain amounts outstanding under the ABL Facility.
The ABL Facility includes borrowing capacity available of up to $40.0 million, the CAD equivalent of $10.0 million and the Euro equivalent of $15.0 million for letters of credit. There is also a $6.0 million sublimit, in the case of the U.S. ABL Facility, and a $5.0 million sublimit, in the case of the Canadian ABL Facility, at the swingline lenders’ discretion, for borrowings on same-day notice, referred to as swingline loans.
The ABL Facility provides us with the right at any time to request up to (i) $20.0 million of additional commitments to be allocated between the U.S. ABL Facility and the Canadian ABL Facility and which shall be applied 80% to increase the U.S. ABL Facility and 20% to increase the Canadian ABL Facility and (ii) $10.0 million of additional commitments with respect to the German ABL Facility (any such increase, an “Incremental ABL Increase”). The existing lenders under the ABL Facility will not be under any obligation to provide such additional commitments, and any increase in commitments is subject to customary conditions precedent. If we were to request any such additional commitments, the facility size could increase to up to $155.0 million, but our ability to borrow under the ABL Facility would still be limited by the amount of the U.S. Borrowing Base, the Canadian Borrowing Base and the German Borrowing Base. The ABL Facility also provides us with the right to reallocate up to an agreed upon amount of the commitments between the U.S. ABL Facility and the Canadian ABL Facility.
The ABL Facility also provides us with the ability to refinance the loans and commitments under the ABL Facility (including after giving effect to any Incremental ABL Increase) with a new revolving facility or one or more series of senior secured loans, subject to customary conditions precedent.
Additional borrowings under the ABL Facility are subject to the satisfaction of customary conditions, including absence of defaults or events of default, accuracy of representations and warranties in all material respects and availability.
Term Loan Facility. Subject to certain permitted extensions, our senior secured term loan facility has a seven year term and provided for an aggregate principal amount of $342.6 million of loans thereunder as of
131
Table of Contents
March 31, 2014. Proceeds from the initial term loans under the Term Loan Facility were used (i) to finance a portion of the acquisition of Mold-Masters (including working capital and/or purchase price adjustments) and (ii) to pay the fees, premiums, costs and expenses related to the acquisition of Mold-Masters (including original issue discount or upfront fees) and proceeds from the incremental term loans made pursuant to the March 31, 2014 incremental amendment, to repay certain of the initial term loans and for general corporate purposes. The original Term Loan Facility of $245.0 million, less the required principal amortization payments, was increased by $100.0 million to an aggregate principal amount of $342.6 million of incremental term loans on March 31, 2014 pursuant to an amendment.
The Term Loan Facility provides us with the right at any time to request one or more incremental term loan facilities to the Term Loan Facility (each, an “Incremental Term Increase”) in an aggregate amount not to exceed (x) $175.0 million plus (y) an unlimited amount so long as our senior secured net leverage ratio does not exceed 4.0 to 1.0. The existing lenders under the Term Loan Facility are not under any obligation to provide such additional commitments, and any increase in commitments is subject to customary conditions precedent.
The Term Loan Facility also provides us with the ability to refinance the loans under the Term Loan Facility (including after giving effect to any Incremental Term Increase) with a new secured or unsecured term facility or one or more series of secured or unsecured notes, subject to customary conditions precedent.
Interest rate and fees
ABL Facility. The interest rates applicable to loans under the U.S. ABL Facility are, at our option, equal to either (1) the Adjusted LIBOR, plus a margin of 1.75% to 2.25% per annum, based on availability or (2) the highest of (i) the prime commercial lending rate publicly announced by the ABL Administrative Agent as its “prime rate” as in effect on such day, (ii) the Federal Funds Effective Rate plus 0.50% per annum and (iii) published LIBOR plus 1.0% per annum, plus a margin of 0.75% to 1.25% per annum, based on availability. The interest rates applicable to loans under the Canadian ABL Facility are, at our option, equal to either (1) the B/A Equivalent Rate, plus a margin of 1.75% to 2.25% per annum, based on availability or (2) the highest of (i) the prime commercial lending rate publicly announced by the ABL Administrative Agent in Canada as its “prime rate” as in effect on such day, (ii) the Bank of Canada Overnight Rate plus 0.50% per annum and (iii) one-month B/A Equivalent Rate plus 1.0% per annum, plus a margin of 0.75% to 1.25% per annum, based on availability. The interest rates applicable to loans under the German ABL Facility are equal to (1) with respect to loans denominated in Euros, the rate equal to the higher of (i) the rate as set and published by the European Central Bank known as the ECB Main Refinancing Rate (or any successor rate), and (ii) the LIBOR rate on such day (or if such day is not a Business Day, the immediately preceding Business Day), with a maturity of three months and (2) with respect to loans denominated in Dollars and funded outside the United States and Canada, a fluctuating rate per annum equal to the rate of interest in effect for such day as publicly announced from time to time by the local branch of Bank of America in the jurisdiction in which such currency is funded as its “base rate,” plus a margin of 1.75% to 2.25% per annum, based on availability.
The commitment fee on the unused portion of the ABL Facility is 0.50% per annum on the average daily unused portion of the ABL Facility, subject to a step-down based on availability. The letter of credit fee on the aggregate face amount of outstanding letters of credit under the ABL Facility is equal to the interest rate margin for Adjusted LIBOR or B/A Equivalent Rate, as the case may be, loans. In addition there is a fronting fee on the aggregate face amount of outstanding letters of credit of up to 0.125%.
Term Loan Facility. The interest rates applicable to loans under the Term Loan Facility is, at our option, equal to either (i) the published LIBOR, plus a margin of 3.00% per annum or (ii) the greater of (1) the prime rate, (2) the federal funds rate plus 0.50% per annum, (3) published LIBOR plus 1.0% or (4) 2.00% per annum, plus a margin of 2.00% per annum. In no event will the LIBOR rate be less than 1.00% at any time.
132
Table of Contents
Mandatory repayments
ABL Facility. If at any time the aggregate amount of outstanding loans, unreimbursed letter of credit drawings and outstanding letters of credit under our U.S. ABL Facility exceeds the lesser of (i) the sublimit on the U.S. ABL Facility and (ii) the then applicable U.S. Borrowing Base (the “U.S. Maximum Credit”), the borrowers under the U.S. ABL Facility shall repay the outstanding loans under such facility (and cash collateralize outstanding letters of credit) in an aggregate amount equal to such excess. If at any time the aggregate amount of outstanding loans, unreimbursed letter of credit drawings and outstanding letters of credit under our Canadian ABL Facility exceeds the lesser of (i) the sublimit on the Canadian ABL Facility and (ii) the then applicable Canadian Borrowing Base (the “Canadian Maximum Credit”), the borrowers under the Canadian ABL Facility shall repay the outstanding loans under such facility (and cash collateralize outstanding letters of credit) in an aggregate amount equal to such excess. If at any time the aggregate amount of outstanding loans, unreimbursed letter of credit drawings and outstanding letters of credit under our German ABL Facility exceeds the lesser of (i) the sublimit on the German ABL Facility and (ii) the then applicable German Borrowing Base (the “German Maximum Credit”), the German Borrowers shall repay the outstanding loans under such facility (and cash collateralize outstanding letters of credit) in an aggregate amount equal to such excess.
In addition, at any time following the occurrence and during the continuation of a liquidity condition, defined as the period from the date availability shall have been less than the greater of (i) 12.5% of the sum of the U.S. Maximum Credit, Canadian Maximum Credit and German Maximum Credit (the “Line Cap”) and (ii) $13.8 million, in either case for five consecutive business days, in each case to the date availability shall have been at least equal to the greater of (i) 12.5% of the Line Cap and (ii) $13.8 million for 30 consecutive calendar days, the ABL Loans shall be prepaid and the letters of credit cash collateralized with 100% of the net cash proceeds of dispositions of any collateral securing the ABL Facility on a first-priority basis by the borrowers under the ABL Facility (including insurance and condemnation proceeds) in excess of an amount to be agreed.
Term Loan Facility. The following amounts will be applied to prepay loans under the Term Loan Facility, subject to certain thresholds, carve-outs and exceptions set forth in the documentation for the Term Loan Facility: (i) 100% of the net cash proceeds of any incurrence of debt by us and certain of our subsidiaries, (ii) 100% of the net cash proceeds of any non-ordinary course sale or other disposition of assets by us or certain of our subsidiaries and (iii) and 50% of our excess cash flow (subject to reduction if our senior secured net leverage ratio is equal or less than certain specified thresholds).
Voluntary repayment
We may voluntarily reduce the unutilized portion of the commitment amount under the ABL Facility and repay outstanding loans at any time without premium or penalty other than customary “breakage” costs with respect to Adjusted LIBOR and B/A Equivalent Rate borrowings. We may voluntarily prepay loans under the Term Loan Facility at any time with customary “breakage” costs with respect to LIBOR rate borrowings. If we prepay loans under the Term Loan Facility in connection with a repricing during the period of 12 months following the incremental amendment date of March 31, 2014, we will pay a prepayment premium of 1% of the aggregate principal amount of prepaid loans.
Amortization and final maturity
There is no scheduled amortization under our ABL Facility. All outstanding loans under the ABL Facility are due and payable in full upon the expiration of its term. The Term Loan Facility is subject to quarterly amortization of principal equal to 0.25% of the aggregate principal amount of the Term Loan Facility, as of March 31, 2014, with the balance payable at final maturity.
133
Table of Contents
Guarantees and security
All obligations under our ABL Facility and Term Loan Facility are each unconditionally guaranteed jointly and severally on a senior basis by: (i) in the case of the Term Loan Facility, Milacron Intermediate Holdings and each of the U.S. Borrowers (other than Milacron LLC), (ii) in the case of the U.S. ABL Facility, Milacron Intermediate Holdings, each of the U.S. ABL Obligors and each of the U.S. Borrowers’ wholly-owned domestic subsidiaries (subject to certain customary exceptions) whose assets are, at the U.S. ABL Facility borrowers’ option, to be included in the U.S. Borrowing Base; (iii) in the case of the Canadian ABL Facility, by Milacron Intermediate Holdings, the Canadian ABL Obligors, the U.S. ABL Obligors, the German Borrowers, certain European subsidiaries of Milacron Intermediate Holdings (the “European Guarantors), certain subsidiaries of Milacron Intermediate Holdings that become party to an intercompany cash pooling arrangement (subject to certain customary exceptions), each of the Canadian ABL Facility borrower’s and U.S. Borrowers’ respective wholly-owned domestic subsidiaries (in each case, subject to certain customary exceptions) and Canadian subsidiaries of Milacron Intermediate Holdings (subject to customary exceptions) whose assets are, at the U.S. Borrowers’ or Canadian ABL Facility borrowers’ option, to be included in the Canadian Borrowing Base; and (iv) in the case of the German ABL Facility, by Milacron Intermediate Holdings, the U.S. ABL Obligors, the German Borrowers, the Canadian ABL Obligors, the European Guarantors, certain subsidiaries of Milacron Intermediate Holdings that become party to an intercompany cash pooling arrangement (subject to certain customary exceptions), each of the Canadian ABL Facility borrower’s and U.S. Borrowers’ respective wholly-owned domestic subsidiaries (in each case, subject to certain customary exceptions) and German subsidiaries of Milacron Intermediate Holdings (subject to customary exceptions) whose assets are, at the U.S. Borrowers’ or the German Borrowers’ option, to be included in the German Borrowing Base. Following the consummation of this offering, Milacron expects to provide a guarantee under the ABL Facility and the Term Loan Facility to streamline reporting obligations.
All obligations under the U.S. ABL Facility, Canadian ABL Facility, German ABL Facility and Term Loan Facility, and the guarantees of those obligations (other than the guarantees provided by the European Guarantors), are secured, subject to certain exceptions, by substantially all of the assets of the borrowers under each such facility and the assets of the respective guarantors under each such facility.
The assets securing the U.S. ABL Facility, the Canadian ABL Facility and the German ABL Facility (the “ABL Collateral”) include a first-priority (subject to permitted liens and other exceptions) security interest in personal property consisting of accounts receivable, inventory, tax refunds, cash, deposit accounts and securities accounts (other than any deposit account or securities account established solely to hold identified proceeds of first-priority liens collateral), investment property (other than capital stock), and general intangibles, chattel paper, documents, supporting obligations, certain other assets and books and records related to the foregoing, and, in each case, proceeds thereof, subject to customary exceptions.
The Term Loan Facility is secured by a second priority lien on and security interest in the ABL Collateral securing the U.S. ABL Facility.
The assets securing the Term Loan Facility (the “Term Loan Collateral”) include a first-priority security interest, which ranks pari passu with the liens securing the Senior Secured Notes, (subject to permitted liens and other exceptions) on 100% of the present and future shares of capital stock in our subsidiaries and the subsidiary guarantors thereunder (but limited in the case of the voting capital stock of any first-tier foreign subsidiary and any direct or indirect domestic subsidiary of which substantially all of its assets consist of the equity of one or more direct or indirect foreign subsidiaries, to 65% of such capital stock), substantially all of our and the subsidiary guarantors’ material owned real property and equipment and all other personal property of us and the subsidiary guarantors to the extent not constituting collateral securing the ABL Facility on a first-priority basis, including, without limitation, contracts (other than those relating to collateral securing the ABL Facility on a first-priority basis), patents, copyrights, trademarks, other general intangibles, intercompany notes and proceeds of the foregoing, subject to customary exceptions.
134
Table of Contents
The ABL Facility is secured by a second priority lien on and security interest in the Term Loan Collateral.
Restrictive covenants and other matters
The credit agreements for the ABL Facility and the Term Loan Facility contain certain negative covenants that, subject to significant exceptions, limit the ability of Milacron Intermediate Holdings and the ability of its restricted subsidiaries to, among other things:
| • | incur, assume or permit to exist additional indebtedness (including guarantees thereof); |
| • | pay dividends or certain other distributions on its capital stock or repurchase its capital stock or prepay subordinated indebtedness; |
| • | incur liens on assets; |
| • | make certain investments or other restricted payments; |
| • | allow certain restrictions on the ability of its restricted subsidiaries to pay dividends or make other payments to Milacron Intermediate Holdings; |
| • | engage in transactions with affiliates; |
| • | sell certain assets or merge or consolidate with or into other companies; |
| • | guarantee indebtedness; |
| • | change its fiscal year; and |
| • | alter the business that we conduct. |
Our ABL Facility and Term Loan Facility also contain certain customary representations and warranties, affirmative operating covenants and events of default, including among other things payment defaults, breach of representations and warranties, covenant defaults, cross-defaults to certain indebtedness, certain events of bankruptcy, certain events under ERISA, material judgments, actual or asserted failure of any guaranty or security document supporting our ABL Facility or Term Loan Facility, as applicable, to be in full force and effect, and change of control. If such an event of default occurs, the lenders under our ABL Facility or Term Loan Facility, as applicable, would be entitled to take various actions, including the acceleration of amounts due under our ABL Facility or Term Loan Facility, as applicable, and all actions permitted to be taken by a secured creditor.
In addition, our ABL Facility contains a financial covenant requiring Milacron LLC and its restricted subsidiaries to maintain a 1.0 to 1.0 minimum trailing four quarter fixed charge coverage ratio, to be tested at any time that excess availability under the ABL Facility decreases to a level below the greater of 12.5% of the aggregate revolver commitments and $13.8 million until the date on which excess availability exceeds the greater of 12.5% of the aggregate revolver commitments and $13.8 million for 30 consecutive days.
Senior Secured Notes
In April 2012, Milacron LLC and Mcron Finance Corp. issued $275.0 million aggregate principal amount of 8.375% Senior Secured Notes due 2019 (the “Senior Secured Notes”). The Senior Secured Notes have a maturity date of May 15, 2019. The Senior Secured Notes pay interest semi-annually in cash in arrears on May 15 and November 15 of each year, and are guaranteed on a senior secured basis by Milacron Intermediate Holdings and all of its wholly-owned domestic subsidiaries that are obligors under the ABL Facility. The Senior
135
Table of Contents
Secured Notes and the related guarantees are secured by first-priority liens on substantially all the assets of Milacron LLC and each of the subsidiary guarantors (other than accounts receivable, inventory, tax refunds, cash and deposit accounts, securities accounts, investment property (other than (i) capital stock and (ii) certain deposit accounts or securities accounts with proceeds of first-priority notes collateral) and related general intangibles, certain other related assets and proceeds thereof that secure our ABL Facility), subject to certain exceptions and permitted liens. The Senior Secured Notes and the related guarantees are also secured by second-priority liens on all of the assets of the borrowers and the subsidiary guarantors that secure the U.S. ABL Facility on a first priority basis.
The Senior Secured Notes are redeemable, in whole or in part, at any time on or after May 15, 2015 on specified redemption dates and at the redemption prices specified in the indenture governing the Senior Secured Notes. In addition, we may redeem up to 35% of the Senior Secured Notes before May 15, 2015 with the net cash proceeds from certain equity offerings. At any time prior to May 15, 2015 we may redeem up to 10% of the original principal amount of the Senior Secured Notes during each twelve-month period commencing with the issue date at a redemption price of 103% of the aggregate principal amount thereof, plus accrued and unpaid interest, if any, to, but not including, the redemption date. We may also redeem some or all of the Senior Secured Notes before May 15, 2015 at a redemption price of 100% of the principal amount thereof plus accrued and unpaid interest, if any, to the redemption date, plus a “make whole” premium. We may be required to make an offer to purchase the Senior Secured Notes upon the sale of certain assets and upon a change of control. On each of April 29, 2014 and April 30, 2014, we redeemed a combined $55.0 million of the Senior Secured Notes at a redemption price of 103% of the aggregate principal amount thereof, plus accrued and unpaid interest, to, but not including, the respective redemption date. As at December 31, 2014, the aggregate principal amount of the outstanding Senior Secured Notes was $220.0 million.
Senior Unsecured Notes
In March 2013, Milacron LLC and Mcron Finance Corp. issued $465.0 million aggregate principal amount of 7.750% Senior Notes due 2019 (the “Senior Unsecured Notes”). The Senior Unsecured Notes have a maturity date of February 15, 2021. The Senior Unsecured Notes pay interest semi-annually in cash in arrears on February 15 and August 15 of each year, and are guaranteed on a senior unsecured basis by Milacron Intermediate Holdings and each wholly-owned domestic subsidiary of Milacron LLC that is an obligor under the Term Loan Facility and ABL Facility. Following the consummation of this offering, Milacron expects to guarantee the Senior Unsecured Notes to streamline reporting obligations.
The Senior Unsecured Notes are redeemable, in whole or in part, at any time on or after February 15, 2016 on specified redemption dates and at the redemption prices specified in the indenture governing the Senior Unsecured Notes. In addition, we may redeem up to 40% of the Senior Unsecured Notes before February 15, 2016 with the net cash proceeds from certain equity offerings. We may also redeem some or all of the Senior Unsecured Notes before February 15, 2016 at a redemption price of 100% of the principal amount thereof plus accrued and unpaid interest, if any, to the redemption date, plus a “make whole” premium. We may be required to make an offer to purchase the Senior Unsecured Notes upon the sale of certain assets and upon a change of control. As at December 31, 2014, the aggregate principal amount of the outstanding Senior Unsecured Notes was $465.0 million.
Other Indebtedness
As of December 31, 2014, we had approximately $1.6 million of capital lease obligations outstanding as well as $9.3 million of borrowings under certain lines of credit. Certain of these lines of credit are used only for working capital. Others are used to issue letters of credit and guarantees in the ordinary course of business. As of December 31, 2014, we had approximately $27.2 million of committed lines of credit with approximately $12.7 million of undrawn availability under these lines of credit. Based on amounts outstanding and total facility size, the weighted average interest rate for the capital lease obligations and lines of credit is approximately 2.9% and 6.2%, respectively, as of December 31, 2014.
136
Table of Contents
The following is a description of the material terms of our amended and restated certificate of incorporation and amended and restated bylaws as they will be in effect upon the consummation of this offering. Such summaries do not purport to be complete and are subject to, and qualified in their entirety, by reference to our amended and restated certificate of incorporation and amended and restated bylaws, copies of which will be filed as exhibits to the registration statement of which this prospectus is a part.
Authorized Capitalization
Upon the consummation of this offering, our authorized capital stock shall consist of shares of common stock, par value $0.01 per share, of which shares shall be issued and outstanding.
Common Stock
Holders of our common stock are entitled to the following rights.
Voting Rights
Directors will be elected by a plurality of the votes entitled to be cast. Our stockholders will not have cumulative voting rights. Except as otherwise provided in our amended and restated certificate of incorporation or as required by law, all matters to be voted on by our stockholders other than matters relating to the election and removal of directors must be approved by a majority of the shares present in person or by proxy at the meeting and entitled to vote on the subject matter or by a written resolution of the stockholders representing the number of affirmative votes required for such matter at a meeting.
Dividend Rights
Holders of common stock will share equally in any dividend declared by our board, subject to the rights of the holders of any outstanding preferred stock.
Liquidation Rights
In the event of any voluntary or involuntary liquidation, dissolution or winding up of our affairs, holders of our common stock would be entitled to share ratably in our assets that are legally available for distribution to stockholders after payment of liabilities. If we have any preferred stock outstanding at such time, holders of the preferred stock may be entitled to distribution and/or liquidation preferences. In either such case, we must pay the applicable distribution to the holders of our preferred stock before we may pay distributions to the holders of our common stock.
Other Rights
Our stockholders have no preemptive or other rights to subscribe for additional shares. All holders of our common stock are entitled to share equally on a share-for-share basis in any assets available for distribution to common stockholders upon our liquidation, dissolution or winding up. All outstanding shares are, and all shares offered by this prospectus will be, when sold, validly issued, fully paid and nonassessable.
Preferred Stock
Our board is authorized to provide for the issuance of preferred stock in one or more series and to fix the preferences, powers and relative, participating, optional or other special rights and qualifications, limitations or restrictions thereof, including the dividend rate, conversion rights, voting rights, redemption rights and liquidation preference and to fix the number of shares to be included in any such series without any further vote
137
Table of Contents
or action by our stockholders. Any preferred stock so issued may rank senior to our common stock with respect to the payment of dividends or amounts upon liquidation, dissolution or winding up, or both. In addition, any such shares of preferred stock may have class or series voting rights. The issuance of preferred stock may have the effect of delaying, deferring or preventing a change in control of our company without further action by the stockholders and may adversely affect the voting and other rights of the holders of our common stock.
Registration Rights
Certain of our existing stockholders have registration rights with respect to our common stock pursuant to a stockholders agreement. See “Certain Relationships and Related Person Transactions—Amended and Restated Stockholders Agreement.”
Anti-takeover Provisions
Our amended and restated certificate of incorporation and amended and restated bylaws contain provisions that delay, defer or discourage transactions involving an actual or potential change in control of us or change in our management. We expect that these provisions, which are summarized below, will discourage coercive takeover practices or inadequate takeover bids. These provisions are also designed to encourage persons seeking to acquire control of us to first negotiate with our board, which we believe may result in an improvement of the terms of any such acquisition in favor of our stockholders. However, they also give our board the power to discourage transactions that some stockholders may favor, including transactions in which stockholders might otherwise receive a premium for their shares or transactions that our stockholders might otherwise deem to be in their best interests. Accordingly, these provisions could adversely affect the price of our common stock.
Board Composition
We will have a classified board of directors upon the closing of this offering. See “Management—Board of Directors.” Our Board will be divided into classes, with one class being elected at each annual meeting of stockholders. Each director will serve a -year term, with termination staggered according to class. Class I will initially consist of directors, Class II will initially consist of directors, and Class III will initially consist of directors. As a result, it may discourage third-party proxy contests, tender offers or attempts to obtain control of us even if such changes would be beneficial to us and our stockholders.
Our amended and restated certificate of incorporation will provide that directors may only be removed for cause by the affirmative vote of the remaining members of the Board or the holders of at least a majority of the voting power of all outstanding shares of common stock then entitled to vote on the election of directors. Furthermore, any vacancy on our Board, however occurring, including a vacancy resulting from an increase in the size of our Board, may only be filled by the affirmative vote of a majority of our directors then in office, even if less than a quorum.
Requirements for Advance Notification of Stockholder Meetings, Nominations and Proposals
Our amended and restated bylaws provide that special meetings of the stockholders may be called only upon the request of a majority of our board or upon the request of the Chief Executive Officer. Our amended and restated bylaws prohibit the conduct of any business at a special meeting other than as specified in the notice for such meeting. These provisions may have the effect of deferring, delaying or discouraging hostile takeovers or changes in control or management of our company.
Our amended and restated bylaws establish advance notice procedures with respect to stockholder proposals and the nomination of candidates for election as directors, other than nominations made by or at the direction of our board or a committee of our board. In order for any matter to be “properly brought” before a meeting, a stockholder will have to comply with the advance notice requirements of directors, which may be
138
Table of Contents
filled only by a vote of a majority of directors then in office, even though less than a quorum, and not by the stockholders. Our amended and restated bylaws allow the presiding officer at a meeting of the stockholders to adopt rules and regulations for the conduct of meetings which may have the effect of precluding the conduct of certain business at a meeting if the rules and regulations are not followed. These provisions may also defer, delay or discourage a potential acquirer from conducting a solicitation of proxies to elect the acquirer’s own slate of directors or otherwise attempting to obtain control of our company.
No Stockholder Action by Written Consent
Our amended and restated certificate of incorporation will provide that, subject to the rights of any holders of preferred stock to act by written consent instead of a meeting, stockholder action may be taken only at an annual meeting or special meeting of stockholders and may not be taken by written consent instead of a meeting, unless affiliates of CCMP own at least 50% of our outstanding common stock or the action to be taken by written consent of stockholders and the taking of this action by written consent has been expressly approved in advance by our board. Failure to satisfy any of the requirements for a stockholder meeting could delay, prevent or invalidate stockholder action.
Section 203 of the DGCL
Our amended and restated certificate of incorporation will provide that the provisions of Section 203 of the DGCL, which relate to business combinations with interested stockholders, do not apply to us, until the moment in time, if ever, immediately following the time at which both of the following conditions exist: (i) Section 203 by its terms would, but for the terms of our amended and restated certificate of incorporation, apply to us and (ii) there occurs a transaction following the consummation of which CCMP no longer owns at least 5% or more of our issued and outstanding common stock entitled to vote. Our amended and restated certificate of incorporation will provide that, at such time, we will automatically become subject to Section 203 of the DGCL. Section 203 of the DGCL prohibits a publicly held Delaware corporation from engaging in a business combination transaction with an interested stockholder (a stockholder who owns more than 15% of our common stock) for a period of three years after the interested stockholder became such unless the transaction fits within an applicable exemption, such as board approval of the business combination or the transaction that resulted in such stockholder becoming an interested stockholder. These provisions would apply even if the business combination could be considered beneficial by some stockholders. Although we have elected to opt out of the statute’s provisions, we could elect to be subject to Section 203 in the future.
Exclusive Forum
Our amended and restated certificate of incorporation provides that, subject to certain exceptions, the Court of Chancery of the State of Delaware shall be the sole and exclusive forum for certain stockholder litigation matters. However, it is possible that a court could rule that this provision is unenforceable or inapplicable.
Corporate Opportunities
Our amended and restated certificate of incorporation provides that directors appointed by CCMP do not have any obligation to offer us an opportunity to participate in business opportunities presented to CCMP even if the opportunity is one that we might reasonably have pursued (and therefore may be free to compete with us in the same business or similar businesses), and that, to the extent permitted by law, CCMP will not be liable to us or our stockholders for breach of any duty by reason of any such activities.
139
Table of Contents
Authorized but Unissued Shares
The authorized but unissued shares of our common stock and our preferred stock will be available for future issuance without any further vote or action by our stockholders. These additional shares may be utilized for a variety of corporate purposes, including future public offerings to raise additional capital, corporate acquisitions and employee benefit plans. The existence of authorized but unissued shares of our common stock and our preferred stock could render more difficult or discourage an attempt to obtain control over us by means of a proxy contest, tender offer, merger or otherwise.
Listing
We intend to apply to have our common stock listed on the NYSE or Nasdaq under the symbol “MCRN.”
Transfer Agent and Registrar
The transfer agent and registrar for our common stock is .
140
Table of Contents
SHARES ELIGIBLE FOR FUTURE SALE
Prior to this offering, there has been no public market for our common stock. Future sales of our common stock in the public market, or the perception that sales may occur, could materially adversely affect the prevailing market price of our common stock at such time and our ability to raise equity capital in the future.
Sale of Restricted Securities
Upon consummation of this offering, we will have shares of our common stock outstanding (or shares, if the underwriters exercise their option to purchase additional shares in full). Of these shares, all shares sold in this offering will be freely tradable without further restriction or registration under the Securities Act, except that any shares purchased by our affiliates may generally only be sold in compliance with Rule 144 under the Securities Act, which is described below. Of the remaining outstanding shares, shares (or shares, if the underwriters exercise their option to purchase additional shares in full) will be deemed “restricted securities” under the Securities Act.
Lock-Up Arrangements and Registration Rights
In connection with this offering, we, each of our directors and executive officers, as well as certain other stockholders, will enter into lock-up agreements described under “Underwriting” that restrict the sale of our securities for up to 180 days after the date of this prospectus, subject to certain exceptions or an extension in certain circumstances. Certain stockholders will also be subject to lock-up provisions contained in the Stockholders Agreement. See “Certain Relationships and Related Person Transactions—Amended and Restated Stockholders Agreement.”
In addition, following the expiration of the lock-up period, certain stockholders will have the right, subject to certain conditions, to require us to register the sale of their shares of our common stock under federal securities laws. See “Certain Relationships and Related Person Transactions—Amended and Restated Stockholders Agreement.” If these stockholders exercise this right, our other existing stockholders may require us to register their registrable securities.
Following the lock-up periods described above, all of the shares of our common stock that are restricted securities or are held by our affiliates as of the date of this prospectus will be eligible for sale in the public market in compliance with Rule 144 under the Securities Act.
Rule 144
The shares of our common stock sold in this offering will generally be freely transferable without restriction or further registration under the Securities Act, except that any shares of our common stock held by an “affiliate” of ours may not be resold publicly except in compliance with the registration requirements of the Securities Act or under an exemption under Rule 144 or otherwise. Rule 144 permits our common stock that has been acquired by a person who is an affiliate of ours, or has been an affiliate of ours within the past three months, to be sold into the market in an amount that does not exceed, during any three-month period, the greater of:
| • | one percent of the total number of shares of our common stock outstanding; or |
| • | the average weekly reported trading volume of our common stock for the four calendar weeks prior to the sale. |
Such sales are also subject to specific manner of sale provisions, a six-month holding period requirement, notice requirements and the availability of current public information about us.
Approximately shares of our common stock that are not subject to lock-up arrangements described above will be eligible for sale under Rule 144 immediately upon the closing.
141
Table of Contents
Rule 144 also provides that a person who is not deemed to have been an affiliate of ours at any time during the three months preceding a sale, and who has for at least six months beneficially owned shares of our common stock that are restricted securities, will be entitled to freely sell such shares of our common stock subject only to the availability of current public information regarding us. A person who is not deemed to have been an affiliate of ours at any time during the three months preceding a sale, and who has beneficially owned for at least one year shares of our common stock that are restricted securities, will be entitled to freely sell such shares of our common stock under Rule 144 without regard to the current public information requirements of Rule 144.
Additional Registration Statements
We intend to file a registration statement on Form S-8 under the Securities Act to register shares of our common stock to be issued or reserved for issuance under our equity incentive plans. Such registration statement is expected to be filed soon after the date of this prospectus and will automatically become effective upon filing with the SEC. Accordingly, shares registered under such registration statement will be available for sale in the open market, unless such shares are subject to vesting restrictions with us or the lock-up restrictions described above.
Rule 701
In general, under Rule 701 as currently in effect, any of our employees, directors, officers, consultants or advisors who acquired common stock from us in connection with a written compensatory stock or option plan or other written agreement in compliance with Rule 701 under the Securities Act before the effective date of a registration statement is entitled to rely on Rule 701 to resell such shares in reliance on Rule 144. An affiliate of the issuer can resell shares in reliance on Rule 144 without having to comply with the holding period requirements of Rule 144, and a non-affiliate of the issuer can resell shares in reliance on Rule 144 without having to comply with the holding period requirements of Rule 144 and without regard to the volume of such sales or the availability of public information about the issuer. However, substantially all of our shares issued under Rule 701 will be subject to lock-up agreements as described above and will only become eligible for sale upon the expiration of the restrictions set forth in those agreements.
142
Table of Contents
MATERIAL U.S. FEDERAL INCOME TAX CONSIDERATIONS FOR NON-U.S. HOLDERS
The following discussion summarizes the material U.S. federal income and estate tax consequences to “non-U.S. holders” of ownership and disposition of our common stock, but does not purport to provide a complete analysis of all potential U.S. federal income tax and estate tax considerations relating thereto.
A “non-U.S. holder” is a beneficial owner of our common stock that is, for U.S. federal income tax purposes:
| • | a non-resident alien individual; |
| • | a foreign corporation; or |
| • | a foreign estate or trust. |
You are not a non-U.S. holder if you are a nonresident alien individual present in the United States for 183 days or more in the taxable year of disposition, or if you are a former citizen or former resident of the United States, in either of which cases you should consult your tax advisor regarding the U.S. federal income tax consequences of owning or disposing of our common stock.
If an entity or arrangement treated as a partnership or other type of pass-through entity for U.S. federal income tax purposes owns our common stock, the tax treatment of a partner or beneficial owner of the entity may depend upon the status of the owner, the activities of the entity and certain determinations made at the partner or beneficial owner level. Partners and beneficial owners in partnerships or other pass-through entities that own our common stock should consult their own tax advisors as to the particular U.S. federal income and estate tax consequences applicable to them.
This discussion is based on the Internal Revenue Code of 1986, as amended (the “Code”), and administrative pronouncements, judicial decisions and final, temporary and proposed Treasury regulations, changes to any of which subsequent to the date of this prospectus may affect the tax consequences described herein. This discussion does not address all aspects of U.S. federal income and estate taxation that may be relevant to non-U.S. holders in light of their particular circumstances and does not address any tax consequences arising under the laws of any state, local or foreign jurisdiction. Prospective purchasers should consult their tax advisors with respect to the particular tax consequences to them of owning and disposing of our common stock, including the consequences under the laws of any state, local or foreign jurisdiction.
Distributions on Common Stock
We do not expect to pay any dividends on our common stock in the foreseeable future. If we do pay dividends on shares of our common stock, however, such distributions will constitute dividends for U.S. federal income tax purposes to the extent paid from our current or accumulated earnings and profits, as determined under U.S. federal income tax principles. Distributions in excess of our current and accumulated earnings and profits will constitute a return of capital that is applied against and reduces, but not below zero, a non-U.S. holder’s adjusted tax basis in shares of our common stock. Any remaining excess will be treated as gain realized on the sale or other disposition of our common stock. See “—Dispositions of Common Stock.”
Any dividend paid to a non-U.S. holder on our common stock will generally be subject to U.S. federal withholding tax at a 30% rate or a reduced rate specified by an applicable tax treaty. In order to obtain a reduced rate of withholding, a non-U.S. holder will be required to provide an Internal Revenue Service (“IRS”) Form W-8BEN or W-8BEN-E (or other applicable form) certifying its entitlement to benefits under a treaty.
143
Table of Contents
The withholding tax does not apply to dividends paid to a non-U.S. holder who provides a Form W- 8ECI, certifying that the dividends are effectively connected with the non-U.S. holder’s conduct of a trade or business within the United States. Instead, the effectively connected dividends will be generally subject to regular U.S. income tax as if the non-U.S. holder were a United States person, subject to an applicable tax treaty providing otherwise. In addition, in certain circumstances, if you are a foreign corporation you may be subject to a 30% (or, if a tax treaty applies, such lower rate as provided) branch profits tax.
Dispositions of Common Stock
Subject to the discussion below on backup withholding and FATCA, gain realized by a non-U.S. holder on a sale, exchange or other disposition of our common stock generally will not be subject to U.S. federal income or withholding tax, unless:
| • | the gain is effectively connected with a trade or business of the non-U.S. holder in the United States, subject to an applicable treaty providing otherwise, in which case the gain will be subject to U.S. federal income tax generally in the same manner as effectively connected dividend income as described above; or |
| • | we are or have been a U.S. real property holding corporation at any time within the five-year period preceding the disposition or the non-U.S. holder’s holding period, whichever period is shorter, and either (i) our common stock has ceased to be “regularly traded” as defined by applicable Treasury regulations on an established securities market prior to the beginning of the calendar year in which the sale or disposition occurs or (ii) such non-U.S. holder owns, or has owned, at any time during the five-year period preceding the disposition or such non-U.S. holder’s holding period, whichever is shorter, actually or constructively, more than 5% of our common stock. |
We believe that we are not, and we do not anticipate becoming, a U.S. real property holding corporation.
Backup Withholding and Information Reporting
Any dividends that are paid to a non-U.S. holder must be reported annually to the IRS and to the non-U.S. holder. Copies of these information returns also may be made available to the tax authorities of the country in which the non-U.S. holder resides under the provisions of various treaties or agreements for the exchange of information. Unless the non-U.S. holder is an exempt recipient, dividends paid on our common stock and the gross proceeds from a taxable disposition of our common stock may be subject to additional information reporting and may also be subject to U.S. federal backup withholding if such non-U.S. holder fails to comply with applicable U.S. information reporting and certification requirements. Provision of any properly completed IRS Form W-8 appropriate to the non-U.S. holder’s circumstances will satisfy the certification requirements necessary to avoid the backup withholding.
Backup withholding is not an additional tax. Any amounts so withheld under the backup withholding rules will be refunded by the IRS or credited against the non-U.S. holder’s U.S. federal income tax liability, provided that the required information is timely furnished to the IRS.
FATCA Withholding Taxes
Provisions commonly referred to as “FATCA” impose withholding of 30% on payments of U.S.-source dividends, and, beginning in 2017, sales or other disposition proceeds from our common stock to “foreign financial institutions” (which is broadly defined for this purpose and in general includes investment vehicles) and certain other non-U.S. entities unless various U.S. information reporting and due diligence requirements (generally relating to ownership by U.S. persons of interests in or accounts with those entities) have been
144
Table of Contents
satisfied, or an exemption applies (typically certified as to by the delivery of a properly completed IRS Form W-8BEN-E). If FATCA withholding is imposed, a beneficial owner that is not a foreign financial institution generally will be entitled to a refund of any amounts withheld by filing a U.S. federal income tax return (which may entail significant administrative burden). Foreign financial institutions located in jurisdictions that have an intergovernmental agreement with the United States governing FATCA may be subject to different rules. Prospective investors should consult their tax advisers regarding the effects of FATCA on their investment in our common shares.
U.S. Federal Estate Tax
The estates of nonresident alien individuals generally are subject to U.S. federal estate tax on property with a U.S. situs. Because we are a U.S. corporation, our common stock will be U.S. situs property and therefore will be included in the taxable estate of a nonresident alien decedent, unless an applicable estate tax treaty between the United States and the decedent’s country of residence provides otherwise.
145
Table of Contents
Merrill Lynch, Pierce, Fenner & Smith Incorporated, Barclays Capital Inc. and J.P. Morgan Securities LLC are acting as representatives of each of the underwriters named below. Subject to the terms and conditions set forth in an underwriting agreement among us and each of the underwriters, we have agreed to sell to the underwriters, and the underwriters has agreed, severally and not jointly, to purchase from us, the number of shares of common stock set forth opposite its name below.
| Underwriter | Number of Shares | |
| Merrill Lynch, Pierce, Fenner & Smith Incorporated |
||
| Barclays Capital Inc. |
||
| J.P. Morgan Securities LLC |
||
| Robert W. Baird & Co. Incorporated |
||
| Credit Suisse Securities (USA) LLC |
||
| Goldman, Sachs & Co. |
||
|
| ||
| Total |
||
|
|
Subject to the terms and conditions set forth in the underwriting agreement, the underwriters have agreed, severally and not jointly, to purchase all of the shares sold under the underwriting agreement if any of these shares are purchased. If an underwriter defaults, the underwriting agreement provides that the purchase commitments of the nondefaulting underwriters may be increased or the underwriting agreement may be terminated.
We have agreed to indemnify the underwriters against certain liabilities, including liabilities under the Securities Act, or to contribute to payments the underwriters may be required to make in respect of those liabilities.
The underwriters are offering the shares, subject to prior sale, when, as and if issued to and accepted by them, subject to approval of legal matters by their counsel, including the validity of the shares, and other conditions contained in the underwriting agreement, such as the receipt by the underwriters of officer’s certificates and legal opinions. The underwriters reserve the right to withdraw, cancel or modify offers to the public and to reject orders in whole or in part.
Commissions and Discounts
The representatives have advised us that the underwriters propose initially to offer the shares to the public at the public offering price set forth on the cover page of this prospectus and to dealers at that price less a concession not in excess of $ per share. After the initial offering, the public offering price, concession or any other term of the offering may be changed. Sales of shares made outside of the United States may be made by affiliates of the underwriters.
The following table shows the public offering price, underwriting discount and proceeds before expenses to us. The information assumes either no exercise or full exercise by the underwriters of their option to purchase additional shares.
| Per Share |
Without Option |
With Option |
||||||||||
| Public offering price |
$ | $ | $ | |||||||||
| Underwriting discount |
$ | $ | $ | |||||||||
| Proceeds, before expenses, to Milacron Holdings Corp. |
$ | $ | $ | |||||||||
The expenses of the offering, not including the underwriting discount, are estimated at $ and are payable by us.
146
Table of Contents
Option to Purchase Additional Shares
We have granted an option to the underwriters, exercisable for 30 days after the date of this prospectus, to purchase up to additional shares at the public offering price, less the underwriting discount. If the underwriters exercise this option, each will be obligated, subject to conditions contained in the underwriting agreement, to purchase a number of additional shares proportionate to that underwriter’s initial amount reflected in the above table.
No Sales of Similar Securities
We, our executive officers and directors and certain other existing security holders have agreed not to sell or transfer any common stock or securities convertible into, exchangeable for, exercisable for, or repayable with common stock, for 180 days after the date of this prospectus without first obtaining the written consent of Merrill Lynch, Pierce, Fenner & Smith Incorporated, Barclays Capital Inc. and J.P. Morgan Securities LLC. Specifically, we and these other persons have agreed, with certain limited exceptions, not to directly or indirectly
| • | offer, pledge, sell or contract to sell any common stock, |
| • | sell any option or contract to purchase any common stock, |
| • | purchase any option or contract to sell any common stock, |
| • | grant any option, right or warrant for the sale of any common stock, |
| • | lend or otherwise dispose of or transfer any common stock, |
| • | request or demand that we file a registration statement related to the common stock, or |
| • | enter into any swap or other agreement that transfers, in whole or in part, the economic consequence of ownership of any common stock whether any such swap or transaction is to be settled by delivery of shares or other securities, in cash or otherwise. |
This lock-up provision applies to common stock and to securities convertible into or exchangeable or exercisable for or repayable with common stock. It also applies to common stock owned now or acquired later by the person executing the agreement or for which the person executing the agreement later acquires the power of disposition. In the event that either (x) during the last 17 days of the lock-up period referred to above, we issue an earnings release or material news or a material event relating to us occurs or (y) prior to the expiration of the lock-up period, we announce that we will release earnings results or become aware that material news or a material event will occur during the 16-day period beginning on the last day of the lock-up period, the restrictions described above shall continue to apply until the expiration of the 18-day period beginning on the issuance of the earnings release or the occurrence of the material news or material event.
NYSE or Nasdaq Listing
We will apply to have our common stock approved for listing/quotation on the NYSE or Nasdaq under the symbol “MCRN.”
Determination of Offering Price
Before this offering, there has been no public market for our common stock. The initial public offering price will be determined through negotiations between us and the representatives. In addition to prevailing market conditions, the factors to be considered in determining the initial public offering price are:
| • | the valuation multiples of publicly traded companies that the representatives believe to be comparable to us, |
147
Table of Contents
| • | our financial information, |
| • | the history of, and the prospects for, our company and the industry in which we compete, |
| • | an assessment of our management, its past and present operations, and the prospects for, and timing of, our future revenues, |
| • | the present state of our development, and |
| • | the above factors in relation to market values and various valuation measures of other companies engaged in activities similar to ours. |
An active trading market for the shares may not develop. It is also possible that after the offering the shares will not trade in the public market at or above the initial public offering price.
The underwriters do not expect to sell more than 5% of the shares in the aggregate to accounts over which they exercise discretionary authority.
Price Stabilization, Short Positions and Penalty Bids
Until the distribution of the shares is completed, SEC rules may limit underwriters and selling group members from bidding for and purchasing our common stock. However, the representatives may engage in transactions that stabilize the price of the common stock, such as bids or purchases to peg, fix or maintain that price.
In connection with the offering, the underwriters may purchase and sell our common stock in the open market. These transactions may include short sales, purchases on the open market to cover positions created by short sales and stabilizing transactions. Short sales involve the sale by the underwriters of a greater number of shares than they are required to purchase in the offering. “Covered” short sales are sales made in an amount not greater than the underwriters’ option to purchase additional shares described above. The underwriters may close out any covered short position by either exercising their option to purchase additional shares or purchasing shares in the open market. In determining the source of shares to close out the covered short position, the underwriters will consider, among other things, the price of shares available for purchase in the open market as compared to the price at which they may purchase shares through the option granted to them. “Naked” short sales are sales in excess of such option. The underwriters must close out any naked short position by purchasing shares in the open market. A naked short position is more likely to be created if the underwriters are concerned that there may be downward pressure on the price of our common stock in the open market after pricing that could adversely affect investors who purchase in the offering. Stabilizing transactions consist of various bids for or purchases of shares of common stock made by the underwriters in the open market prior to the completion of the offering.
The underwriters may also impose a penalty bid. This occurs when a particular underwriter repays to the underwriters a portion of the underwriting discount received by it because the representatives have repurchased shares sold by or for the account of such underwriter in stabilizing or short covering transactions.
Similar to other purchase transactions, the underwriters’ purchases to cover the syndicate short sales may have the effect of raising or maintaining the market price of our common stock or preventing or retarding a decline in the market price of our common stock. As a result, the price of our common stock may be higher than the price that might otherwise exist in the open market. The underwriters may conduct these transactions on the New York Stock Exchange or Nasdaq Global Market, in the over-the-counter market or otherwise.
Neither we nor any of the underwriters make any representation or prediction as to the direction or magnitude of any effect that the transactions described above may have on the price of our common stock. In addition, neither we nor any of the underwriters make any representation that the representatives will engage in these transactions or that these transactions, once commenced, will not be discontinued without notice.
148
Table of Contents
Electronic Distribution
In connection with the offering, certain of the underwriters or securities dealers may distribute prospectuses by electronic means, such as e-mail.
Other Relationships
The underwriters and their respective affiliates are full service financial institutions engaged in various activities, which may include sales and trading, commercial and investment banking, advisory, investment management, investment research, principal investment, hedging, market making, brokerage and other financial and non-financial activities and services. Certain of the underwriters and their respective affiliates have provided, and may in the future provide, a variety of these services to us and our affiliates and to persons and entities with relationships with us and our affiliates, for which they received or will receive customary fees and expenses. In addition, under our ABL Facility and our Term Loan Facility, Merrill Lynch, Pierce, Fenner & Smith Incorporated, Barclays Capital Inc., J.P. Morgan Securities LLC, Credit Suisse Securities (USA) LLC and/or certain of their respective affiliates act as agents, arrangers or lenders.
In addition, in the ordinary course of their various business activities, the underwriters and their respective affiliates, officers, directors and employees may purchase, sell or hold a broad array of investments and actively trade securities, derivatives, loans, commodities, currencies, credit default swaps and other financial instruments (including bank loans) for their own account and for the accounts of their customers, and such investment and trading activities may involve or relate to assets, securities and/or instruments of ours or our affiliates (directly, as collateral securing other obligations or otherwise) and/or persons and entities with relationships with us or our affiliates. The underwriters and their respective affiliates may also communicate independent investment recommendations, market color or trading ideas and/or publish or express independent research views in respect of such assets, securities or instruments and may at any time hold, or recommend to clients that they should acquire, long and/or short positions in such assets, securities and instruments.
Sales Outside of the United States
Other than in the United States, no action has been taken by us or the underwriters that would permit a public offering of the shares offered by this prospectus in any jurisdiction where action for that purpose is required. The shares offered by this prospectus may not be offered or sold, directly or indirectly, nor may this prospectus or any other offering material or advertisements in connection with the offer and sale of any such shares be distributed or published in any jurisdiction, except under circumstances that will result in compliance with the applicable rules and regulations of that jurisdiction. Persons into whose possession this prospectus comes are advised to inform themselves about and to observe any restrictions relating to the offering and the distribution of this prospectus. This prospectus does not constitute an offer to sell or a solicitation of an offer to buy any shares offered by this prospectus in any jurisdiction in which such an offer or a solicitation is unlawful.
Notice to Prospective Investors in the European Economic Area
In relation to each Member State of the European Economic Area (each, a “Relevant Member State”), no offer of shares may be made to the public in that Relevant Member State other than:
| A. | to any legal entity which is a qualified investor as defined in the Prospectus Directive: |
| B. | to fewer than 100 or, if the Relevant Member State has implemented the relevant provision of the 2010 PD Amending Directive, 150, natural or legal persons (other than qualified investors as defined in the Prospectus Directive), as permitted under the Prospectus Directive, subject to obtaining the prior consent of the representatives; or |
149
Table of Contents
| C. | in any other circumstances falling within Article 3(2) of the Prospectus Directive, |
provided that no such offer of shares shall require the Company or the representatives to publish a prospectus pursuant to Article 3 of the Prospectus Directive or supplement a prospectus pursuant to Article 16 of the Prospectus Directive.
Each person in a Relevant Member State who initially acquires any shares or to whom any offer is made will be deemed to have represented, acknowledged and agreed that it is a “qualified investor” within the meaning of the law in that Relevant Member State implementing Article 2(1)(e) of the Prospectus Directive. In the case of any shares being offered to a financial intermediary as that term is used in Article 3(2) of the Prospectus Directive, each such financial intermediary will be deemed to have represented, acknowledged and agreed that the shares acquired by it in the offer have not been acquired on a non-discretionary basis on behalf of, nor have they been acquired with a view to their offer or resale to, persons in circumstances which may give rise to an offer of any shares to the public other than their offer or resale in a Relevant Member State to qualified investors as so defined or in circumstances in which the prior consent of the representatives has been obtained to each such proposed offer or resale.
The Company, the representatives and their respective affiliates will rely upon the truth and accuracy of the foregoing representations, acknowledgements and agreements.
This prospectus has been prepared on the basis that any offer of shares in any Relevant Member State will be made pursuant to an exemption under the Prospectus Directive from the requirement to publish a prospectus for offers of shares. Accordingly any person making or intending to make an offer in that Relevant Member State of shares which are the subject of the offering contemplated in this prospectus may only do so in circumstances in which no obligation arises for the Company or any of the underwriters to publish a prospectus pursuant to Article 3 of the Prospectus Directive in relation to such offer. Neither the Company nor the underwriters have authorized, nor do they authorize, the making of any offer of shares in circumstances in which an obligation arises for the Company or the underwriters to publish a prospectus for such offer.
For the purpose of the above provisions, the expression “an offer to the public” in relation to any shares in any Relevant Member State means the communication in any form and by any means of sufficient information on the terms of the offer and the shares to be offered so as to enable an investor to decide to purchase or subscribe the shares, as the same may be varied in the Relevant Member State by any measure implementing the Prospectus Directive in the Relevant Member State and the expression “Prospectus Directive” means Directive 2003/71/EC (including the 2010 PD Amending Directive, to the extent implemented in the Relevant Member States) and includes any relevant implementing measure in the Relevant Member State and the expression “2010 PD Amending Directive” means Directive 2010/73/EU.
Notice to Prospective Investors in the United Kingdom
In addition, in the United Kingdom, this document is being distributed only to, and is directed only at, and any offer subsequently made may only be directed at persons who are “qualified investors” (as defined in the Prospectus Directive) (i) who have professional experience in matters relating to investments falling within Article 19 (5) of the Financial Services and Markets Act 2000 (Financial Promotion) Order 2005, as amended (the “Order”) and/or (ii) who are high net worth companies (or persons to whom it may otherwise be lawfully communicated) falling within Article 49(2)(a) to (d) of the Order (all such persons together being referred to as “relevant persons”). This document must not be acted on or relied on in the United Kingdom by persons who are not relevant persons. In the United Kingdom, any investment or investment activity to which this document relates is only available to, and will be engaged in with, relevant persons.
150
Table of Contents
Notice to Prospective Investors in Switzerland
The shares may not be publicly offered in Switzerland and will not be listed on the SIX Swiss Exchange (“SIX”) or on any other stock exchange or regulated trading facility in Switzerland. This document has been prepared without regard to the disclosure standards for issuance prospectuses under art. 652a or art. 1156 of the Swiss Code of Obligations or the disclosure standards for listing prospectuses under art. 27 ff. of the SIX Listing Rules or the listing rules of any other stock exchange or regulated trading facility in Switzerland. Neither this document nor any other offering or marketing material relating to the shares or the offering may be publicly distributed or otherwise made publicly available in Switzerland.
Neither this document nor any other offering or marketing material relating to the offering, the Company, the shares have been or will be filed with or approved by any Swiss regulatory authority. In particular, this document will not be filed with, and the offer of shares will not be supervised by, the Swiss Financial Market Supervisory Authority FINMA (“FINMA”), and the offer of shares has not been and will not be authorized under the Swiss Federal Act on Collective Investment Schemes (“CISA”). The investor protection afforded to acquirers of interests in collective investment schemes under the CISA does not extend to acquirers of shares.
Notice to Prospective Investors in the Dubai International Financial Centre
This prospectus relates to an Exempt Offer in accordance with the Offered Securities Rules of the Dubai Financial Services Authority (“DFSA”). This prospectus is intended for distribution only to persons of a type specified in the Offered Securities Rules of the DFSA. It must not be delivered to, or relied on by, any other person. The DFSA has no responsibility for reviewing or verifying any documents in connection with Exempt Offers. The DFSA has not approved this prospectus nor taken steps to verify the information set forth herein and has no responsibility for the prospectus. The shares to which this prospectus relates may be illiquid and/or subject to restrictions on their resale. Prospective purchasers of the shares offered should conduct their own due diligence on the shares. If you do not understand the contents of this prospectus you should consult an authorized financial advisor.
Notice to Prospective Investors in Australia
No placement document, prospectus, product disclosure statement or other disclosure document has been lodged with the Australian Securities and Investments Commission (“ASIC”), in relation to the offering. This prospectus does not constitute a prospectus, product disclosure statement or other disclosure document under the Corporations Act 2001 (the “Corporations Act”), and does not purport to include the information required for a prospectus, product disclosure statement or other disclosure document under the Corporations Act.
Any offer in Australia of the shares may only be made to persons (the “Exempt Investors”) who are “sophisticated investors” (within the meaning of section 708(8) of the Corporations Act), “professional investors” (within the meaning of section 708(11) of the Corporations Act) or otherwise pursuant to one or more exemptions contained in section 708 of the Corporations Act so that it is lawful to offer the shares without disclosure to investors under Chapter 6D of the Corporations Act.
The shares applied for by Exempt Investors in Australia must not be offered for sale in Australia in the period of 12 months after the date of allotment under the offering, except in circumstances where disclosure to investors under Chapter 6D of the Corporations Act would not be required pursuant to an exemption under section 708 of the Corporations Act or otherwise or where the offer is pursuant to a disclosure document which complies with Chapter 6D of the Corporations Act. Any person acquiring shares must observe such Australian on-sale restrictions.
This prospectus contains general information only and does not take account of the investment objectives, financial situation or particular needs of any particular person. It does not contain any securities recommendations or financial product advice. Before making an investment decision, investors need to consider whether the information in this prospectus is appropriate to their needs, objectives and circumstances, and, if necessary, seek expert advice on those matters.
151
Table of Contents
Notice to Prospective Investors in Hong Kong
The shares have not been offered or sold and will not be offered or sold in Hong Kong, by means of any document, other than (a) to “professional investors” as defined in the Securities and Futures Ordinance (Cap. 571) of Hong Kong and any rules made under that Ordinance; or (b) in other circumstances which do not result in the document being a “prospectus” as defined in the Companies Ordinance (Cap. 32) of Hong Kong or which do not constitute an offer to the public within the meaning of that Ordinance. No advertisement, invitation or document relating to the shares has been or may be issued or has been or may be in the possession of any person for the purposes of issue, whether in Hong Kong or elsewhere, which is directed at, or the contents of which are likely to be accessed or read by, the public of Hong Kong (except if permitted to do so under the securities laws of Hong Kong) other than with respect to shares which are or are intended to be disposed of only to persons outside Hong Kong or only to “professional investors” as defined in the Securities and Futures Ordinance and any rules made under that Ordinance.
Notice to Prospective Investors in Japan
The shares have not been and will not be registered under the Financial Instruments and Exchange Law of Japan (Law No. 25 of 1948, as amended) and, accordingly, will not be offered or sold, directly or indirectly, in Japan, or for the benefit of any Japanese Person or to others for re-offering or resale, directly or indirectly, in Japan or to any Japanese Person, except in compliance with all applicable laws, regulations and ministerial guidelines promulgated by relevant Japanese governmental or regulatory authorities in effect at the relevant time. For the purposes of this paragraph, “Japanese Person” shall mean any person resident in Japan, including any corporation or other entity organized under the laws of Japan.
Notice to Prospective Investors in Singapore
This prospectus has not been registered as a prospectus with the Monetary Authority of Singapore. Accordingly, this prospectus and any other document or material in connection with the offer or sale, or invitation for subscription or purchase, of shares may not be circulated or distributed, nor may the shares be offered or sold, or be made the subject of an invitation for subscription or purchase, whether directly or indirectly, to persons in Singapore other than (i) to an institutional investor under Section 274 of the Securities and Futures Act, Chapter 289 of Singapore (the “SFA”), (ii) to a relevant person pursuant to Section 275(1), or any person pursuant to Section 275(1A), and in accordance with the conditions specified in Section 275, of the SFA, or (iii) otherwise pursuant to, and in accordance with the conditions of, any other applicable provision of the SFA.
Where the shares are subscribed or purchased under Section 275 of the SFA by a relevant person which is:
| (a) | a corporation (which is not an accredited investor (as defined in Section 4A of the SFA)) the sole business of which is to hold investments and the entire share capital of which is owned by one or more individuals, each of whom is an accredited investor; or |
| (b) | a trust (where the trustee is not an accredited investor) whose sole purpose is to hold investments and each beneficiary of the trust is an individual who is an accredited investor, |
securities (as defined in Section 239(1) of the SFA) of that corporation or the beneficiaries’ rights and interest (howsoever described) in that trust shall not be transferred within six months after that corporation or that trust has acquired the shares pursuant to an offer made under Section 275 of the SFA except:
| i. | to an institutional investor or to a relevant person defined in Section 275(2) of the SFA, or to any person arising from an offer referred to in Section 275(1A) or Section 276(4)(i)(B) of the SFA; |
| ii. | where no consideration is or will be given for the transfer; |
152
Table of Contents
| iii. | where the transfer is by operation of law; |
| iv. | as specified in Section 276(7) of the SFA; or |
| v. | as specified in Regulation 32 of the Securities and Futures (Offers of Investments) (Shares and Debentures) Regulations 2005 of Singapore. |
153
Table of Contents
Weil, Gotshal & Manges LLP, New York, New York, has passed upon the validity of the common stock offered hereby on behalf of us. Certain legal matters will be passed upon on behalf of the underwriters by Latham & Watkins LLP, New York, New York.
The consolidated financial statements of Milacron Holdings Corp. at December 31, 2014 and 2013, and for the year ended December 31, 2014 (Successor), the year ended December 31, 2013 (Successor), the period from May 1, 2012 to December 31, 2012 (Successor) and the period from January 1, 2012 to April 30, 2012 (Predecessor), appearing in this Prospectus and Registration Statement have been audited by Ernst & Young LLP, independent registered public accounting firm, as set forth in their report thereon appearing elsewhere herein, and are included in reliance upon such report given on the authority of such firm as experts in accounting and auditing.
WHERE YOU CAN FIND MORE INFORMATION
We have filed a registration statement on Form S-1 with the SEC for the common stock we are offering by this prospectus. This prospectus does not include all of the information contained in the registration statement. You should refer to the registration statement and its exhibits for additional information. Whenever we make reference in this prospectus to any of our contracts, agreements or other documents, the references are not necessarily complete and you should refer to the exhibits attached to the registration statement for copies of the actual contract, agreement or other document. When we complete this offering, we will also be required to file annual, quarterly and current reports, proxy statements and other information with the SEC.
You can read our SEC filings, including the registration statement, over the Internet at the SEC’s website at http://www.sec.gov. You may also read and copy any document we file with the SEC at its public reference facilities at 100 F Street, N.E., Room 1580, Washington, DC 20549. You may also obtain copies of the documents at prescribed rates by writing to the Public Reference Section at the SEC at 100 F Street, NE, Room 1580, Washington, DC 20549. Please call the SEC at 1-800-SEC-0330 for further information on the operation of the public reference facilities.
You may obtain a copy of any of our filings, at no cost, by writing or telephoning us at:
Milacron Holdings Corp.
3010 Disney Street
Cincinnati, OH 45209
Phone: (513) 487-5000
Attn: Investor Relations
154
Table of Contents
| Page |
||||
| Audited Financial Statements of Milacron Holdings Corp. |
||||
| F-2 | ||||
| Consolidated Balance Sheets as of December 31, 2014 and 2013 |
F-3 | |||
| F-4 | ||||
| F-5 | ||||
| F-6 | ||||
| F-7 | ||||
| F-8 | ||||
F-1
Table of Contents
Report of Independent Registered Public Accounting Firm
The Board of Directors and Shareholders
Milacron Holdings Corp.
We have audited the accompanying consolidated balance sheets of Milacron Holdings Corp. (the Company), as of December 31, 2014 and 2013, and the related consolidated statements of operations, comprehensive income (loss), shareholders’ equity (deficit), and cash flows for the year ended December 31, 2014 (Successor), the year ended December 31, 2013 (Successor), the period from May 1, 2012 to December 31, 2012 (Successor) and the period from January 1, 2012 to April 30, 2012 (Predecessor). Our audits also included the financial statement schedule listed in the Index at Item 16(b). These financial statements and schedule are the responsibility of the Company’s management. Our responsibility is to express an opinion on these financial statements and schedule based on our audits.
We conducted our audits in accordance with the standards of the Public Company Accounting Oversight Board (United States). Those standards require that we plan and perform the audit to obtain reasonable assurance about whether the financial statements are free of material misstatement. We were not engaged to perform an audit of the Company’s internal control over financial reporting. Our audits included consideration of internal control over financial reporting as a basis for designing audit procedures that are appropriate in the circumstances, but not for the purpose of expressing an opinion on the effectiveness of the Company’s internal control over financial reporting. Accordingly, we express no such opinion. An audit also includes examining, on a test basis, evidence supporting the amounts and disclosures in the financial statements, assessing the accounting principles used and significant estimates made by management, and evaluating the overall financial statement presentation. We believe that our audits provide a reasonable basis for our opinion.
In our opinion, the financial statements referred to above present fairly, in all material respects, the consolidated financial position of Milacron Holdings Corp. at December 31, 2014 and 2013, and the consolidated results of its operations and its cash flows for the year ended December 31, 2014 (Successor), the year ended December 31, 2013 (Successor), the period from May 1, 2012 to December 31, 2012 (Successor) and the period from January 1, 2012 to April 30, 2012 (Predecessor) in conformity with U.S. generally accepted accounting principles. Also, in our opinion, the related financial statement schedule, when considered in relation to the basic financial statements taken as a whole, presents fairly in all material respects the information set forth therein.
/s/ Ernst & Young LLP
Ernst & Young LLP
April 3, 2015
F-2
Table of Contents
MILACRON HOLDINGS CORP.
| December 31, |
||||||||
| 2014 |
2013 |
|||||||
| (Dollars in Millions) | ||||||||
| Assets |
||||||||
| Current assets: |
||||||||
| Cash and cash equivalents |
$ | 81.5 | $ | 100.7 | ||||
| Accounts receivable, less allowance for doubtful accounts of $4.5 and $3.0 at December 31, 2014 and 2013, respectively |
183.3 | 174.5 | ||||||
| Inventories, net: |
||||||||
| Raw materials |
84.5 | 89.7 | ||||||
| Work-in-process |
52.5 | 40.3 | ||||||
| Finished products |
101.1 | 77.4 | ||||||
|
|
|
|
|
|||||
| Total inventories |
238.1 | 207.4 | ||||||
| Prepaid and other current assets |
43.1 | 37.0 | ||||||
|
|
|
|
|
|||||
| Total current assets |
546.0 | 519.6 | ||||||
| Property and equipment, net |
216.9 | 203.6 | ||||||
| Goodwill |
548.6 | 538.2 | ||||||
| Intangible assets, net |
442.8 | 496.3 | ||||||
| Other noncurrent assets |
36.4 | 36.5 | ||||||
|
|
|
|
|
|||||
| Total assets |
$ | 1,790.7 | $ | 1,794.2 | ||||
|
|
|
|
|
|||||
| Liabilities and shareholders’ equity |
||||||||
| Current liabilities: |
||||||||
| Short-term borrowings |
$ | 9.2 | $ | 4.6 | ||||
| Long-term debt and capital lease obligations due within one year |
3.8 | 4.9 | ||||||
| Accounts payable |
89.9 | 83.4 | ||||||
| Advanced billings and deposits |
58.5 | 56.2 | ||||||
| Accrued salaries, wages and other compensation |
33.2 | 29.0 | ||||||
| Accrued interest |
16.2 | 16.7 | ||||||
| Other current liabilities |
60.2 | 58.2 | ||||||
|
|
|
|
|
|||||
| Total current liabilities |
271.0 | 253.0 | ||||||
| Long-term debt and capital lease obligations |
1,021.6 | 979.9 | ||||||
| Deferred income tax liabilities |
72.6 | 73.1 | ||||||
| Accrued pension liabilities |
29.0 | 25.9 | ||||||
| Other noncurrent accrued liabilities |
11.1 | 12.2 | ||||||
|
|
|
|
|
|||||
| Total liabilities |
1,405.3 | 1,344.1 | ||||||
| Shareholders’ equity: |
||||||||
| Preferred stock—$0.01 par value, 10,000 shares authorized, none outstanding |
— | — | ||||||
| Common stock—$0.01 par value, 790,000 shares authorized; 491,873 and 490,139 issued and outstanding as of December 31, 2014 and 2013, respectively |
— | — | ||||||
| Capital in excess of par value |
500.1 | 495.1 | ||||||
| Retained deficit |
(60.6 | ) | (45.8 | ) | ||||
| Accumulated other comprehensive (loss) income |
(54.1 | ) | 0.4 | |||||
|
|
|
|
|
|||||
| Total Milacron Holdings Corp. shareholders’ equity |
385.4 | 449.7 | ||||||
| Noncontrolling interest |
— | 0.4 | ||||||
|
|
|
|
|
|||||
| Total shareholders’ equity |
385.4 | 450.1 | ||||||
|
|
|
|
|
|||||
| Total liabilities and shareholders’ equity |
$ | 1,790.7 | $ | 1,794.2 | ||||
|
|
|
|
|
|||||
See accompanying notes.
F-3
Table of Contents
MILACRON HOLDINGS CORP.
CONSOLIDATED STATEMENTS OF OPERATIONS
(Dollars in Millions, Except Per Share Amounts)
| Successor |
Predecessor |
|||||||||||||||||
| Year ended |
Year ended |
Period from |
Period from |
|||||||||||||||
| Net sales |
$ | 1,211.3 | $ | 1,028.8 | $ | 571.7 | $ | 260.7 | ||||||||||
| Cost of sales |
792.3 | 689.1 | 423.3 | 181.5 | ||||||||||||||
|
|
|
|
|
|
|
|
|
|||||||||||
| Manufacturing margins |
419.0 | 339.7 | 148.4 | 79.2 | ||||||||||||||
| Operating expenses: |
||||||||||||||||||
| Selling, general and administrative expenses |
266.9 | 223.4 | 104.9 | 55.6 | ||||||||||||||
| Business combination costs |
1.1 | 2.9 | 9.9 | 8.8 | ||||||||||||||
| Officer severance costs |
— | — | 6.2 | — | ||||||||||||||
| Amortization expense |
44.2 | 47.6 | 24.9 | 0.4 | ||||||||||||||
| Loss (gain) on currency translation |
16.3 | 10.4 | (0.1 | ) | (0.4 | ) | ||||||||||||
| Other expense (income), net |
8.8 | 1.1 | (0.6 | ) | 0.4 | |||||||||||||
|
|
|
|
|
|
|
|
|
|||||||||||
| Total operating expenses |
337.3 | 285.4 | 145.2 | 64.8 | ||||||||||||||
|
|
|
|
|
|
|
|
|
|||||||||||
| Operating earnings |
81.7 | 54.3 | 3.2 | 14.4 | ||||||||||||||
| Interest expense, net |
74.6 | 70.1 | 20.7 | 11.8 | ||||||||||||||
|
|
|
|
|
|
|
|
|
|||||||||||
| Earnings (loss) before income taxes |
7.1 | (15.8 | ) | (17.5 | ) | 2.6 | ||||||||||||
| Income tax expense |
22.0 | 8.9 | 3.5 | 2.4 | ||||||||||||||
|
|
|
|
|
|
|
|
|
|||||||||||
| Net (loss) earnings |
(14.9 | ) | (24.7 | ) | (21.0 | ) | 0.2 | |||||||||||
| Less: Net loss (earnings) attributable to the noncontolling interest |
0.1 | 0.1 | (0.2 | ) | 0.1 | |||||||||||||
|
|
|
|
|
|
|
|
|
|||||||||||
| Net (loss) earnings attributable to Milacron Holdings Corp. |
$ | (14.8 | ) | $ | (24.6 | ) | $ | (21.2 | ) | $ | 0.3 | |||||||
|
|
|
|
|
|
|
|
|
|||||||||||
| Earnings per share: |
||||||||||||||||||
| Basic |
$ | (30.14 | ) | $ | (58.40 | ) | $ | (107.95 | ) | $ | 4.36 | |||||||
| Diluted |
$ | (30.14 | ) | $ | (58.40 | ) | $ | (107.95 | ) | $ | 4.04 | |||||||
See accompanying notes.
F-4
Table of Contents
MILACRON HOLDINGS CORP.
CONSOLIDATED STATEMENTS OF COMPREHENSIVE INCOME (LOSS)
(Dollars in Millions)
| Successor |
Predecessor |
|||||||||||||||||
| Year ended |
Year ended |
Period from |
Period |
|||||||||||||||
| Net (loss) earnings |
$ | (14.9 | ) | $ | (24.7 | ) | $ | (21.0 | ) | $ | 0.2 | |||||||
| Other comprehensive (loss) income, net of tax: |
||||||||||||||||||
| Foreign currency translation adjustments |
(49.1 | ) | 4.0 | (0.3 | ) | 1.5 | ||||||||||||
| Unrecognized post-retirement plan losses |
(4.1 | ) | (1.0 | ) | (0.5 | ) | (2.3 | ) | ||||||||||
| Unrealized loss on hedging activities |
(1.3 | ) | (1.8 | ) | — | — | ||||||||||||
|
|
|
|
|
|
|
|
|
|||||||||||
| Total other comprehensive (loss) income, net of tax |
(54.5 | ) | 1.2 | (0.8 | ) | (0.8 | ) | |||||||||||
|
|
|
|
|
|
|
|
|
|||||||||||
| Comprehensive loss |
(69.4 | ) | (23.5 | ) | (21.8 | ) | (0.6 | ) | ||||||||||
| Less: Comprehensive loss (income) attributable to noncontrolling interest |
0.1 | 0.1 | (0.2 | ) | 0.1 | |||||||||||||
|
|
|
|
|
|
|
|
|
|||||||||||
| Comprehensive loss attributable to Milacron Holdings Corp. |
$ | (69.3 | ) | $ | (23.4 | ) | $ | (22.0 | ) | $ | (0.5 | ) | ||||||
|
|
|
|
|
|
|
|
|
|||||||||||
See accompanying notes.
F-5
Table of Contents
MILACRON HOLDINGS CORP.
CONSOLIDATED STATEMENTS OF SHAREHOLDERS’ EQUITY (DEFICIT)
| Common |
Common |
Capital In |
Retained |
Accumulated |
Noncontrolling |
Totals |
||||||||||||||||||||||
| (Dollars in Millions) | ||||||||||||||||||||||||||||
| Predecessor |
||||||||||||||||||||||||||||
| Balance at December 31, 2011 |
81,253 | $ | — | $ | 4.4 | $ | 71.7 | $ | (9.7 | ) | $ | 0.5 | $ | 66.9 | ||||||||||||||
| Stock-based compensation |
3,286 | — | 3.4 | — | — | — | 3.4 | |||||||||||||||||||||
| Repurchase of common stock |
(24,678 | ) | — | — | (82.5 | ) | — | — | (82.5 | ) | ||||||||||||||||||
| Net earnings (loss) |
— | — | — | 0.3 | — | (0.1 | ) | 0.2 | ||||||||||||||||||||
| Other comprehensive loss, |
— | — | — | — | (0.8 | ) | — | (0.8 | ) | |||||||||||||||||||
|
|
|
|
|
|
|
|
|
|
|
|
|
|
|
|||||||||||||||
| Balance at April 30, 2012 |
59,861 | $ | — | $ | 7.8 | $ | (10.5 | ) | $ | (10.5 | ) | $ | 0.4 | $ | (12.8 | ) | ||||||||||||
|
|
|
|
|
|
|
|
|
|
|
|
|
|
|
|||||||||||||||
| Successor |
||||||||||||||||||||||||||||
| Initial capital contribution |
195,238 | $ | — | $ | 195.2 | $ | — | $ | — | $ | — | $ | 195.2 | |||||||||||||||
| Fair value of minority interest assumed |
— | — | — | — | — | 0.3 | 0.3 | |||||||||||||||||||||
| Stock-based compensation |
1,500 | — | 3.0 | — | — | — | 3.0 | |||||||||||||||||||||
| Capital contribution |
2,522 | — | 2.5 | — | — | — | 2.5 | |||||||||||||||||||||
| Net (loss) earnings |
— | — | — | (21.2 | ) | — | 0.2 | (21.0 | ) | |||||||||||||||||||
| Other comprehensive loss, |
— | — | — | — | (0.8 | ) | — | (0.8 | ) | |||||||||||||||||||
|
|
|
|
|
|
|
|
|
|
|
|
|
|
|
|||||||||||||||
| Balance at December 31, 2012 |
199,260 | — | 200.7 | (21.2 | ) | (0.8 | ) | 0.5 | 179.2 | |||||||||||||||||||
| Capital contribution |
290,537 | — | 290.6 | — | — | — | 290.6 | |||||||||||||||||||||
| Repurchase of common stock |
(658 | ) | — | (0.7 | ) | — | — | — | (0.7 | ) | ||||||||||||||||||
| Stock-based compensation |
1,000 | — | 4.5 | — | — | — | 4.5 | |||||||||||||||||||||
| Net loss |
— | — | — | (24.6 | ) | — | (0.1 | ) | (24.7 | ) | ||||||||||||||||||
| Other comprehensive income, |
— | — | — | — | 1.2 | — | 1.2 | |||||||||||||||||||||
|
|
|
|
|
|
|
|
|
|
|
|
|
|
|
|||||||||||||||
| Balance at December 31, 2013 |
490,139 | — | 495.1 | (45.8 | ) | 0.4 | 0.4 | 450.1 | ||||||||||||||||||||
| Purchase of noncontrolling interest |
— | — | (1.6 | ) | — | — | (0.3 | ) | (1.9 | ) | ||||||||||||||||||
| Capital contribution |
1,715 | — | 1.8 | — | — | — | 1.8 | |||||||||||||||||||||
| Stock-based compensation |
19 | — | 4.8 | — | — | — | 4.8 | |||||||||||||||||||||
| Net loss |
— | — | — | (14.8 | ) | — | (0.1 | ) | (14.9 | ) | ||||||||||||||||||
| Other comprehensive loss, |
— | — | — | — | (54.5 | ) | — | (54.5 | ) | |||||||||||||||||||
|
|
|
|
|
|
|
|
|
|
|
|
|
|
|
|||||||||||||||
| Balance at December 31, 2014 |
491,873 | $ | — | $ | 500.1 | $ | (60.6 | ) | $ | (54.1 | ) | — | $ | 385.4 | ||||||||||||||
|
|
|
|
|
|
|
|
|
|
|
|
|
|
|
|||||||||||||||
See accompanying notes.
F-6
Table of Contents
MILACRON HOLDINGS CORP.
CONSOLIDATED STATEMENTS OF CASH FLOWS
(Dollars in Millions)
| Successor |
Predecessor |
|||||||||||||||
| Year ended December 31, 2014 |
Year ended December 31, 2013 |
Period from May 1 (Change in Control Date) to December 31, 2012 |
Period from January 1 to April 30, 2012 |
|||||||||||||
| Operating activities |
||||||||||||||||
| Net (loss) earnings |
$ | (14.9 | ) | $ | (24.7 | ) | $ | (21.0 | ) | $ | 0.2 | |||||
| Less: Net loss (earnings) attributable to the noncontrolling interest |
0.1 | 0.1 | (0.2 | ) | 0.1 | |||||||||||
|
|
|
|
|
|
|
|
|
|||||||||
| Net (loss) earnings attributable to Milacron Holdings Corp. |
(14.8 | ) | (24.6 | ) | (21.2 | ) | 0.3 | |||||||||
| Adjustments to reconcile net (loss) earnings to net cash provided by operating activities: |
||||||||||||||||
| Depreciation and amortization |
71.6 | 73.2 | 37.2 | 2.6 | ||||||||||||
| Unrealized loss on currency translation of intercompany advances |
13.8 | 10.0 | — | — | ||||||||||||
| Amortization of deferred financing costs |
4.7 | 4.2 | 1.6 | 7.3 | ||||||||||||
| Stock-based compensation |
4.8 | 4.5 | 3.0 | 3.4 | ||||||||||||
| Deferred income taxes |
(2.6 | ) | (6.5 | ) | (0.4 | ) | 0.3 | |||||||||
| Changes in assets and liabilities: |
||||||||||||||||
| Accounts receivable |
(15.8 | ) | (12.4 | ) | (10.7 | ) | 6.3 | |||||||||
| Inventories |
(36.0 | ) | (13.6 | ) | 25.4 | (14.0 | ) | |||||||||
| Prepaid expenses and other current assets |
(4.5 | ) | 2.1 | 2.6 | 0.6 | |||||||||||
| Accounts payable |
6.3 | 0.9 | (8.4 | ) | 3.6 | |||||||||||
| Advanced billings and deposits |
(2.7 | ) | 23.8 | (26.5 | ) | 8.2 | ||||||||||
| Other current liabilities |
10.3 | 16.5 | 2.4 | (7.3 | ) | |||||||||||
| Other noncurrent assets |
1.3 | 5.4 | 2.7 | 0.9 | ||||||||||||
| Other noncurrent liabilities |
1.2 | (1.4 | ) | 0.4 | 0.2 | |||||||||||
|
|
|
|
|
|
|
|
|
|||||||||
| Net cash provided by operating activities |
37.6 | 82.1 | 8.1 | 12.4 | ||||||||||||
| Investing activities |
||||||||||||||||
| Purchases of property and equipment |
(41.4 | ) | (30.0 | ) | (11.8 | ) | (4.9 | ) | ||||||||
| Net disposals of property and equipment |
0.1 | 1.6 | 0.2 | — | ||||||||||||
| Acquisitions, net of cash acquired |
(53.0 | ) | (965.0 | ) | (198.7 | ) | — | |||||||||
|
|
|
|
|
|
|
|
|
|||||||||
| Net cash used in investing activities |
(94.3 | ) | (993.4 | ) | (210.3 | ) | (4.9 | ) | ||||||||
| Financing activities |
||||||||||||||||
| Proceeds from issuance of long-term debt (original maturities longer than 90 days) |
151.5 | 710.6 | 276.3 | 77.4 | ||||||||||||
| Payments on long-term debt and capital lease obligations (original maturities longer than 90 days) |
(108.4 | ) | (4.1 | ) | (2.4 | ) | (21.5 | ) | ||||||||
| Payment of debt settled in Acquisition of Predecessor |
— | — | (207.3 | ) | — | |||||||||||
| Net increase (decrease) in short-term borrowings (original maturities of 90 days or less) |
0.4 | (2.2 | ) | 1.5 | 11.4 | |||||||||||
| Purchase of noncontrolling interest |
(1.9 | ) | — | — | — | |||||||||||
| Proceeds from the issuance of common stock |
1.8 | 290.6 | 2.5 | — | ||||||||||||
| Repurchase of common stock |
— | (0.7 | ) | — | (82.5 | ) | ||||||||||
| Debt issuance costs |
(2.2 | ) | (29.4 | ) | (15.4 | ) | (2.0 | ) | ||||||||
|
|
|
|
|
|
|
|
|
|||||||||
| Net cash provided by (used in) financing activities |
41.2 | 964.8 | 55.2 | (17.2 | ) | |||||||||||
| Effect of exchange rate changes on cash |
(3.7 | ) | (1.2 | ) | 0.2 | 0.6 | ||||||||||
|
|
|
|
|
|
|
|
|
|||||||||
| (Decrease) increase in cash and cash equivalents |
(19.2 | ) | 52.3 | (146.8 | ) | (9.1 | ) | |||||||||
| Cash and cash equivalents at beginning of period |
100.7 | 48.4 | 195.2 | 39.7 | ||||||||||||
|
|
|
|
|
|
|
|
|
|||||||||
| Cash and cash equivalents at end of period |
$ | 81.5 | $ | 100.7 | $ | 48.4 | $ | 30.6 | ||||||||
|
|
|
|
|
|
|
|
|
|||||||||
| Supplemental cash flow information: |
||||||||||||||||
| Cash paid for interest |
$ | 71.3 | $ | 46.1 | $ | 13.1 | $ | 4.9 | ||||||||
| Income taxes paid, net |
$ | 18.0 | $ | 19.9 | $ | 3.3 | $ | 3.3 | ||||||||
See accompanying notes.
F-7
Table of Contents
MILACRON HOLDINGS CORP.
NOTES TO CONSOLIDATED FINANCIAL STATEMENTS
Years ended December 31, 2014 and 2013, Period from May 1, 2012 (Change in Control Date) to
December 31, 2012, and Period from January 1, 2012 to April, 2012
1. Summary of Significant Accounting Policies
Description of Business
At the close of business on April 30, 2012 (the Acquisition Date), Milacron Holdings Corp. (the Company or the Successor), an affiliate of CCMP Capital Advisors, LLC (CCMP), acquired all of the outstanding equity interests (the Acquisition) in Milacron Intermediate Holdings Inc. (the Predecessor). The Company is a global leader in the manufacture, distribution, and service of highly engineered and customized systems used in the plastic technology and processing industry. The Company has a full-line product portfolio that includes hot runner systems, injection molding, blow molding and extrusion equipment and produces process control systems, mold bases and components and maintenance, repair and operating (MRO) supplies for plastic processing equipment and fluid technology. The Company operates throughout the world and is headquartered in Cincinnati, Ohio.
On March 28, 2013, the Company acquired Mold-Masters Luxembourg Holdings S.à r.l. (Mold-Masters) (the Mold-Masters Acquisition), enhancing its capabilities to provide a broader set of processing technology solutions for the plastic processing industry, including its hot runner and process control systems, mold bases and components, and MRO supplies. The Company’s acquisition of Mold-Masters is more fully described in Note 2.
Principles of Consolidation and Basis of Presentation
The accompanying Consolidated Financial Statements have been prepared in accordance with accounting principles generally accepted in the United States of America (U.S. GAAP) and include the accounts of the Company, its majority-owned subsidiaries and entities over which the Company has control. All intercompany balances and transactions have been eliminated in consolidation.
The Company’s Consolidated Financial Statements and accompanying footnotes have been segregated to present pre-acquisition activity as the “Predecessor” Company and post-acquisition activity as the “Successor” Company. Purchase accounting has resulted in the assets and liabilities of the Company being recorded at their respective fair values at April 30, 2012.
As a result, the Company’s Consolidated Statements of Operations subsequent to the Acquisition include amortization expense relating to intangible assets and depreciation of fixed assets based upon their respective fair value. Therefore, the Company’s financial data prior to the Acquisition will not generally be comparable to its financial data subsequent to the Acquisition.
Use of Estimates
The preparation of consolidated financial statements in conformity with U.S. GAAP requires management to make estimates and assumptions that affect the amounts of assets and liabilities at the reporting date and the amounts of revenue and expenses in the periods presented in the Consolidated Financial Statements. Actual results could differ from these estimates. The Company’s results are affected by economic, political, legislative, regulatory and legal actions. Economic conditions, such as recessionary trends, inflation, interest and monetary exchange rates, governmental fiscal policies and changes in the prices of raw materials, can have a significant effect on estimates recognized.
F-8
Table of Contents
MILACRON HOLDINGS CORP.
NOTES TO CONSOLIDATED FINANCIAL STATEMENTS (CONTINUED)
1. Summary of Significant Accounting Policies (continued)
Foreign Currency
Assets and liabilities of the Company’s non-U.S. operations, whose functional currency is the local currency, are translated into U.S. dollars at period-end exchange rates. Income and expense items are translated at the average rates of exchange during the period. Net exchange gains or losses resulting from such translation are included in accumulated other comprehensive income (loss), a component of Shareholders’ Equity, and included in net earnings only upon sale or liquidation of the underlying foreign subsidiary. Foreign currency transaction gains and losses are recognized in net earnings based on differences between foreign exchange rates on the transaction date and the settlement date. Intercompany foreign currency transactions, including intercompany advances, that are not long-term in nature are recorded within loss (gain) on currency translation on the Consolidated Statements of Operations.
Cash and Cash Equivalents
Cash and cash equivalents consist of cash on hand and all highly liquid investments with original maturities of three months or less. The carrying value of cash and cash equivalents approximates fair value.
Accounts Receivable and Allowance for Doubtful Accounts
Accounts receivable consists of amounts owed to the Company through product shipments and services provided and is presented net of an allowance for doubtful accounts. The Company grants credit to its customers in the normal course of business. To reduce credit risk, the Company performs credit investigations prior to accepting new customers and prior to adjusting existing credit limits.
The estimate of the allowance for doubtful accounts is the Company’s best estimate of the amount of probable credit loss in the Company’s existing accounts receivable. The Company regularly reviews the adequacy of its allowance for doubtful accounts. The Company determines the allowance based upon an analysis of prior collection experience, specific customer creditworthiness and economic trends within the industries the Company serves. In circumstances where the Company is aware of a specific customer’s inability to meet its financial obligation (e.g., bankruptcy filings), the Company records a specific reserve to reduce the receivable to the amount reasonably believed to be collected. When an account is considered uncollectible, it is written off against the allowance for doubtful accounts.
Inventories
Inventories consist of metalworking fluids and chemicals, machinery parts and supplies, and machines and components manufactured or in the process of assembly. Inventories are stated at the lower of cost or market. The principal methods of determining costs are average or standard costs, which approximate the first-in, first-out method.
Inventories are recorded net of reserves for obsolescence of $8.7 million and $4.7 million at December 31, 2014 and 2013, respectively. The inventory obsolescence reserve is determined by specific identification, as well as an estimate based on age, salability and market conditions.
F-9
Table of Contents
MILACRON HOLDINGS CORP.
NOTES TO CONSOLIDATED FINANCIAL STATEMENTS (CONTINUED)
1. Summary of Significant Accounting Policies (continued)
Debt financing costs
The Company capitalizes costs associated with the issuance of debt and amortizes these costs over the lives of the debt instruments using the effective interest method or the straight-line method based on the terms of the underlying debt instrument. Amortization of deferred financing costs is included within interest expense, net within the Consolidated Statements of Operations and amounted to $4.7 million and $4.2 million for the years ended December 31, 2014 and 2013, respectively, and $1.6 million for the period from May 1, 2012 (Change in Control Date) to December 31, 2012. The Predecessor recorded expense of $7.3 million for the period from January 1, 2012 to April 30, 2012.
Property and Equipment
Expenditures for property and equipment, including amounts related to capital leases, are carried at cost and are depreciated using the straight-line method over the estimated useful lives of the assets. Buildings are generally depreciated over useful lives of 20 to 45 years and machinery and equipment over useful lives of 3 to 12 years. Leasehold improvements are depreciated over the shorter of their estimated useful life or the remaining term of the associated lease. Repairs, betterments, and renewals that extend the life of the asset are capitalized. Other repairs and maintenance expenditures are expensed as incurred.
Property and equipment consist of the following as of:
| December 31, |
||||||||
| 2014 |
2013 |
|||||||
| (Dollars in Millions) | ||||||||
| Land |
$ | 34.0 | $ | 35.5 | ||||
| Buildings |
63.8 | 50.1 | ||||||
| Machinery and equipment |
180.2 | 155.0 | ||||||
|
|
|
|
|
|||||
| 278.0 | 240.6 | |||||||
| Accumulated depreciation |
(61.1 | ) | (37.0 | ) | ||||
|
|
|
|
|
|||||
| $ | 216.9 | $ | 203.6 | |||||
|
|
|
|
|
|||||
The Company recorded depreciation expense of $27.4 million and $25.6 million for the years ended December 31, 2014 and 2013, respectively, and $12.3 million for the period from May 1, 2012 (Change in Control Date) to December 31, 2012. The Predecessor recorded depreciation expense of $2.2 million for the period from January 1, 2012 to April 30, 2012. The Company allocates depreciation expense to cost of sales and selling, general and administrative expense as appropriate.
Goodwill and Other Intangible Assets
Goodwill represents the excess of acquisition cost over the fair value of net assets acquired in business combinations. Intangible assets are recorded at cost, and those intangible assets with finite lives are amortized over their respective estimated useful lives. The Company estimates the useful lives of the intangible assets acquired in business combinations based on information available at the time of acquisition. In establishing the useful lives of acquired customer relationships, the Company considered the buying patterns and length of time that the acquired customers have purchased the Company’s products as well as the estimated future cash flows
F-10
Table of Contents
MILACRON HOLDINGS CORP.
NOTES TO CONSOLIDATED FINANCIAL STATEMENTS (CONTINUED)
1. Summary of Significant Accounting Policies (continued)
the Company anticipates to be generated from these customers. For technology, the Company considered the likelihood of competitors creating new competing technologies. For trademarks, the Company considered how well the acquired trademarks are known throughout the industry and are expected to continue to generate cash flows in the future. The useful lives of non-compete agreements are equal to the respective agreement terms.
The Company performs an annual impairment test on all existing goodwill and other indefinite lived assets on October 1 of each year and whenever events or circumstances make it more likely than not that impairment may have occurred. The Company tested goodwill for impairment based on its identified reporting units.
As a result of the adoption of Accounting Standards Update (ASU) No. 2011-08, “Testing Goodwill for Impairment,” the Company may first assess a range of qualitative factors including, but not limited to, macroeconomic conditions, industry conditions, the competitive environment, changes in the market for the Company’s products and services, regulatory and political developments, entity-specific factors such as strategies and financial performance, when evaluating the potential for impairment of goodwill. For reporting units in which this assessment is not conclusive that it is more likely than not that the fair value is greater than its carrying value, the Company will perform a two-step impairment test.
The first step compares the estimated fair value of a reporting unit with its carrying amount, including goodwill allocated to each reporting unit (Step 1). If the estimated fair value of the reporting unit is in excess of the carrying value, the related goodwill is considered not to be impaired, and no further analysis is necessary. If the carrying amount of the reporting unit exceeds the estimated fair value, there is an indication of potential impairment, and a second step of testing is performed to measure the amount of the impairment, if any, for that reporting unit.
When required, the second step compares the implied fair value of the reporting unit goodwill with the carrying amount of the reporting unit goodwill. The implied fair value of goodwill is determined in the same manner as the amount of goodwill recognized in a business combination, which is the excess of the fair value of the reporting unit determined in step one over the fair value of the net assets and identifiable intangible assets as if the reporting unit were being acquired. Any excess of the carrying value of the reporting unit goodwill over the implied fair value of the reporting unit goodwill will be recorded as an impairment loss.
The Company performed a quantitative impairment test, Step 1, for its Mold-Masters reporting unit in 2014 and 2013. The Company’s determination of estimated fair value of a reporting unit was determined using a combination of the market approach and the income approach. Under the market approach, fair value is based on revenue and earnings multiples for guideline public companies in the reporting unit’s peer group. The market approach requires significant judgment regarding the selection of guideline companies. Under the income approach, value is determined based upon the value of net cash flows to be derived from ownership. The income approach requires significant judgment including estimates about future cash flows and risk-adjusted discount rates. A combination of the methodologies is used and weighted appropriately for each reporting unit.
The Company performed a qualitative analysis for its remaining reporting units in 2014 and 2013. A qualitative analysis is performed by assessing certain trends and factors, including projected market outlook and growth rates, forecasted and actual sales and operating profit margins, discount rates, industry data and other relevant qualitative factors. These trends and factors are compared to, and based on, the assumptions used in the most recent quantitative assessment.
F-11
Table of Contents
MILACRON HOLDINGS CORP.
NOTES TO CONSOLIDATED FINANCIAL STATEMENTS (CONTINUED)
1. Summary of Significant Accounting Policies (continued)
The Company also tests its indefinite-lived intangible assets consisting of trademarks for impairment using a “relief-from-royalty” method. Significant assumptions inherent in the methodologies are employed and include such estimates as royalty and discount rates.
The Company performed its annual impairment test of goodwill and indefinite-lived intangible assets in 2014, 2013 and 2012, none of which resulted in the recognition of impairment charges. For further information on goodwill and other intangible assets refer to Note 3.
Long-Lived Assets
Long-lived assets are reviewed for impairment whenever events or changes in circumstances indicate that the carrying amount of an asset may not be recoverable. Examples of events or changes in circumstances could include, but are not limited to, a prolonged economic downturn, current period operating or cash flow losses combined with a history of losses or a forecast of continuing losses associated with the use of an asset group, or a current expectation that an asset group will be sold or disposed of before the end of its previously estimated useful life. Recoverability of long-lived assets is assessed by a comparison of the carrying amount of the asset to the estimated future undiscounted net cash flows expected to be generated by the asset or group of assets. If estimated future undiscounted net cash flows are less than the carrying amount of the asset or group of assets, the asset is considered impaired and a loss is recognized in an amount required to reduce the carrying amount of the asset to its then estimated fair value. Fair value generally is determined from estimated discounted future net cash flows (for assets held for use) or net realizable value (for assets held for sale).
Self-Insurance Reserves
The Company is primarily self-insured for many types of risks, including, but not limited to, general liability, auto liability, product liability, environmental claims and workers’ compensation for most domestic employees. The Company establishes undiscounted reserves for the estimated ultimate cost of all asserted and unasserted claims incurred and is established based on historical experience and known or estimated ultimate exposure. The Company’s exposure, except for certain environmental claims, is limited by excess liability coverage. Workers’ compensation claims in excess of certain limits are insured with commercial carriers. Reserves, gross of expected recoveries, are included in current and noncurrent liabilities. Expected recoveries from excess carriers are included in noncurrent assets.
Employee Benefit Plans
The Company maintains a defined contribution plan for its U.S. employees. Certain of the Company’s non-U.S. subsidiaries in Germany and the United Kingdom sponsor defined benefit pension plans for certain non-U.S. employees. The Company’s policy is to fund the plans in accordance with applicable laws and regulations and the funded status of the Company’s defined benefit plans is recognized in the Consolidated Balance Sheets. The funded status is measured as the difference between the fair value of plan assets and the benefit obligation at December 31, the measurement date. For defined benefit pension plans, the benefit obligation is the projected benefit obligation (PBO) and for the other postretirement benefit plan, the benefit obligation is the accumulated postretirement benefit obligation (APBO). The PBO represents the actuarial present value of benefits expected to be paid upon retirement based on estimated future compensation levels. The APBO represents the actuarial present value of postretirement benefits attributed to employee service already rendered. The fair value of plan assets represents the current market value of assets. The measurement of the benefit obligation is based on the Company’s estimates and actuarial valuations. These valuations reflect the
F-12
Table of Contents
MILACRON HOLDINGS CORP.
NOTES TO CONSOLIDATED FINANCIAL STATEMENTS (CONTINUED)
1. Summary of Significant Accounting Policies (continued)
terms of the plans and use participant-specific information such as compensation, age and years of service, as well as certain key assumptions that require significant judgment, including, but not limited to, estimates of discount rates, expected return on plan assets, rate of compensation increases, interest crediting rates and mortality rates. For additional information regarding plan assumptions and the current financial position of the pension and other postretirement plans, see Note 6.
Revenue Recognition
The Company records revenue on products when persuasive evidence of an arrangement exists, legal title has passed and the risks and rewards of ownership are transferred, the sales price is fixed and determinable, all significant contractual obligations have been satisfied and the collectability of the sales price is reasonably assured.
The Company offers volume discounts and rebates to certain customers. Discounts and rebates offered are based on the volume of a particular order or volume of purchases during a given period and are recognized in net sales in the Consolidated Statements of Operations.
Appropriate allowances for returns are recorded at the time revenue is recognized. The Company continually evaluates the creditworthiness of its customers and enters into sales contracts only when collection of the sales price is reasonably assured. For sales of plastic processing machinery, customers are generally required to make substantial down-payments prior to shipment, which helps to ensure collection of the full price. These down-payments are classified within advanced billings and deposits on the Consolidated Balance Sheets.
Cost of Sales
Costs associated with net sales are recorded in cost of sales. Cost of sales includes the costs of receiving, producing, inspecting, warehousing, insuring, and shipping goods during the period, as well as depreciation and amortization of long-lived assets used in these processes. Cost of sales also includes shipping and handling costs associated with the delivery of goods to customers and costs associated with internal transfers between plant locations.
Advertising Costs
Advertising costs are charged to expense as incurred and include amounts related to participation in trade shows. The Company incurred advertising costs of $6.7 million and $9.0 million for the years ended December 31, 2014 and 2013, respectively, and $3.0 million for the period from May 1, 2012 (Change in Control Date) to December 31, 2012. The Predecessor incurred advertising costs of $4.9 million for the period from January 1, 2012 to April 30, 2012.
Warranty Costs
A reserve for estimated warranty costs is recorded at the time of sale of machinery and parts and these estimates are based on historical warranty claim experience, with subsequent adjustments for ongoing claims exposure. The reserve for estimated warranty costs is included in other current liabilities in the accompanying Consolidated Balance Sheets.
F-13
Table of Contents
MILACRON HOLDINGS CORP.
NOTES TO CONSOLIDATED FINANCIAL STATEMENTS (CONTINUED)
1. Summary of Significant Accounting Policies (continued)
The following table summarizes changes in the Company’s warranty reserves.
| Successor |
Predecessor |
|||||||||||||||||
| Year ended |
Year ended |
Period
from |
Period from |
|||||||||||||||
| (Dollars in Millions) | ||||||||||||||||||
| Balance at beginning of period |
$ | 8.5 | $ | 5.6 | $ | 6.2 | $ | 6.2 | ||||||||||
| Warranty expense |
4.3 | 5.2 | 1.9 | 1.4 | ||||||||||||||
| Warranty assumed as a result of acquisitions |
0.5 | 4.5 | — | — | ||||||||||||||
| Warranty claims paid |
(4.1 | ) | (6.7 | ) | (2.4 | ) | (1.4 | ) | ||||||||||
| Foreign currency translation adjustments |
(0.6 | ) | (0.1 | ) | (0.1 | ) | — | |||||||||||
|
|
|
|
|
|
|
|
|
|||||||||||
| Balance at end of period |
$ | 8.6 | $ | 8.5 | $ | 5.6 | $ | 6.2 | ||||||||||
|
|
|
|
|
|
|
|
|
|||||||||||
Stock-Based Compensation
The Company accounts for stock-based payment transactions in which the Company receives employee services in exchange for equity instruments of the Company. Stock-based compensation, including grants of stock options and restricted stock units, is measured in the Consolidated Statement of Operations based on the grant date fair values of the stock-based awards.
The compensation expense recognized for each stock-based award is recognized ratably on a straight-line basis over the requisite service period except for performance-based awards which are recognized over the requisite service period if it is probable that the performance conditions will be satisfied. Stock-based compensation is reported within selling, general and administrative expenses in the Consolidated Statements of Operations. The Company will recognize a benefit from stock-based compensation in equity if an incremental tax benefit is realized by following the ordering provisions of the tax law. Further, stock-based compensation expense is recorded net of estimated forfeitures in the Company’s Consolidated Statements of Operations and as such, only those stock-based awards that the Company expects to vest are recognized as expense. Additional information regarding stock-based compensation can be found in Note 9.
Research and Development
Expenditures for research and development are expensed as incurred and included in selling, general and administrative expense in the accompanying Consolidated Statements of Operations. The Company incurred research and development expenses of $24.3 million and $19.0 million for the years ended December 31, 2014 and 2013, respectively, and $8.0 million for the period from May 1, 2012 (Change in Control Date) to December 31, 2012. The Predecessor incurred research and development expenses of $4.3 million for the period from January 1, 2012 to April 30, 2012.
Income Taxes
The Company is subject to income taxes in the United States and numerous foreign jurisdictions. Significant judgment in the forecasting of taxable income using historical and projected future operating results is required in determining the Company’s provision for income taxes and the related assets and liabilities. The
F-14
Table of Contents
MILACRON HOLDINGS CORP.
NOTES TO CONSOLIDATED FINANCIAL STATEMENTS (CONTINUED)
1. Summary of Significant Accounting Policies (continued)
provision for income taxes includes income taxes paid, currently payable or receivable, and deferred taxes including those related to investments in foreign subsidiaries that are not permanent in nature. Under U.S. GAAP, deferred tax assets and liabilities are recognized for future tax consequences attributable to temporary differences between financial statement carrying amounts of existing assets and liabilities and their respective tax bases. Deferred tax assets and liabilities are measured using enacted tax rates expected to apply to taxable income in the years in which those temporary differences are expected to be settled or realized. Deferred tax assets are also recognized for the estimated future effects of tax loss carryforwards. The effect of changes in tax rates on deferred taxes is recognized in the period in which the enactment dates change.
The Company regularly reviews its deferred tax assets for recoverability and establishes a valuation allowance if it is more likely than not that some portion or all of a deferred tax asset will not be realized. The determination as to whether a deferred tax asset will be realized is made on a jurisdictional basis and is based on the evaluation of positive and negative evidence. This evidence includes historical pre-tax and taxable income, projected future taxable income, the expected timing of the reversal of temporary differences and the implementation of tax planning strategies. Projected future taxable income is based on expected results and assumptions as to the jurisdiction in which the income will be earned. The expected timing of the reversals of existing temporary differences is based on current tax law and the Company’s tax methods of accounting.
The Company records income tax liabilities for uncertain foreign and domestic tax positions utilizing the prescribed recognition and measurement principles under U.S. GAAP.
Fair Value of Financial Instruments
The Company applies fair value accounting for all financial assets and liabilities and non-financial assets and liabilities that are recognized or disclosed at fair value in the Consolidated Financial Statements on a recurring basis. The Company defines fair value as the price that would be received from selling an asset or paid to transfer a liability in an orderly transaction between market participants at the measurement date. When determining the fair value measurements for assets and liabilities, the Company considers the principal or most advantageous market in which the Company would transact and the market-based risk measurements or assumptions that market participants would use in pricing the asset or liability, such as inherent risk, transfer restrictions and credit risk.
The Company estimates fair value of its financial instruments utilizing an established three-level hierarchy. The hierarchy is based upon the transparency of inputs to the valuation of an asset or liability as of the measurement date as follows:
| • | Level 1–Valuation is based upon unadjusted quoted prices for identical assets or liabilities in active markets. |
| • | Level 2–Valuation is based upon quoted prices for similar assets and liabilities in active markets, or other inputs that are observable for the asset or liability, either directly or indirectly, for substantially the full term of the financial statements. |
| • | Level 3–Valuation is based upon other unobservable inputs that are significant to the fair value measurements. |
F-15
Table of Contents
MILACRON HOLDINGS CORP.
NOTES TO CONSOLIDATED FINANCIAL STATEMENTS (CONTINUED)
1. Summary of Significant Accounting Policies (continued)
Derivative Financial Instruments
The Company’s risk management strategy includes the use of derivative instruments, specifically foreign currency forward contracts, to reduce the effects on its operating results and cash flows from fluctuations caused by volatility in currency exchange rates. The Company recognizes all derivative instruments as either assets or liabilities in the Consolidated Balance Sheets at their respective estimated fair values. The accounting for changes in the fair value (i.e., unrealized gains or losses) of a derivative instrument depends on whether it has been designated, and is highly effective, as a hedge and further, on the type of hedging relationship. For those derivative instruments that are designated and qualify as hedging instruments, the Company designates the hedging instrument, based upon the exposure being hedged, as a fair value hedge, cash flow hedge or a hedge of a net investment in a foreign operation. Changes in the fair value of derivative instruments that are highly effective and designated as cash flow hedges are reported as a component of other comprehensive income (loss) (OCI) and reclassified into earnings in the same line-item associated with the forecasted transaction and in the same period during which the hedged transaction impacts earnings. The change in the fair value of the ineffective portion of a derivative instrument and the change in the fair value of derivative instruments that are not designated as hedges are recognized in earnings immediately.
New Pronouncements
In May 2014, the Financial Accounting Standards Board (FASB) issued ASU No. 2014-09 Revenue from Contracts with Customers, which will be introduced into the FASB’s Accounting Standards Codification as Topic 606. Topic 606 replaces Topic 605, the previous revenue recognition guidance. The new standard’s core principle is for companies to recognize revenue to depict the transfer of goods or services to customers in amounts that reflect the consideration (that is, payment) to which the company expects to be entitled in exchange for those goods or services. The new standard also will result in enhanced disclosures about revenue, provide guidance for transactions that were not previously addressed comprehensively (for example, service revenue and contract modifications) and improve guidance for multiple element arrangements. The new standard will be effective for the Company in the first quarter of 2017, with early adoption not permitted. The new standard permits two implementation approaches, one requiring retrospective application of the new standard with restatement of prior years, and one requiring prospective application of the new standard with disclosure of results under old standards. The Company is currently evaluating the impact of this ASU and has not yet selected an implementation approach.
In February 2013, the FASB issued ASU 2013-02, Comprehensive Income (Topic 220): Reporting of Amounts Reclassified Out of Accumulated Other Comprehensive Income (ASU 2013-02). The standard requires an entity to present (either on the face of the statement where net earnings is presented or in the notes) the effects on the line items of net earnings of significant amounts reclassified out of accumulated other comprehensive income if the item reclassified is required under U.S. GAAP to be reclassified to net earnings in its entirety in the same reporting period. For reclassification items not required under U.S. GAAP to be reclassified directly to net earnings in their entirety in the same reporting period, an entity is required to cross-reference to other disclosures currently required under U.S. GAAP that provide additional detail about those amounts. ASU 2013-02 applies to all public and private companies that report items of other comprehensive income. ASU 2013-02 was effective for public companies for reporting periods beginning after December 15, 2012 and was effective for non-public companies for fiscal years beginning after December 15, 2013 and interim and annual periods thereafter, with prospective adoption required and early adoption permitted. The Company adopted ASU 2013-02 effective January 1, 2013 and its adoption had no impact on the Consolidated Financial Statements. See Note 11.
F-16
Table of Contents
MILACRON HOLDINGS CORP.
NOTES TO CONSOLIDATED FINANCIAL STATEMENTS (CONTINUED)
2. Business Combinations
Milacron Intermediate Holdings Inc.
On April 30, 2012, the Company acquired all the outstanding equity interests of the Predecessor. The total purchase price was $198.7 million. Simultaneous with the Acquisition, the Company issued $275.0 million of long-term debt and settled the Predecessor’s existing U.S. debt of $207.3 million.
The Company accounted for the acquisition using the acquisition method of accounting in accordance with applicable U.S. GAAP whereby the total purchase price was allocated to tangible and intangible assets acquired and liabilities assumed based on respective fair values. The following table summarizes the values of the assets acquired and liabilities assumed at the date of acquisition (dollars in millions):
| Accounts receivable |
$ | 94.7 | ||
| Total inventories |
191.1 | |||
| Prepaid and other current assets |
30.0 | |||
| Property and equipment |
119.9 | |||
| Intangible assets |
155.2 | |||
| Goodwill |
54.4 | |||
| Other noncurrent assets |
6.7 | |||
| Short-term borrowings |
(16.7 | ) | ||
| Long-term debt and capital lease obligations due within one year |
(12.4 | ) | ||
| Accounts payable |
(69.2 | ) | ||
| Advanced billings and deposits |
(56.0 | ) | ||
| Other current liabilities |
(57.2 | ) | ||
| Long-term debt and capital lease obligations |
(187.7 | ) | ||
| Other noncurrent accrued liabilities |
(54.1 | ) | ||
|
|
|
|||
| Consideration, net of cash acquired |
$ | 198.7 | ||
|
|
|
Goodwill was calculated as the excess of the consideration transferred over the net assets recognized and represents the estimated future economic benefits arising from other assets acquired that could not be individually identified and separately recognized. The resulting goodwill from the Acquisition was primarily attributable to the Company’s workforce and is not deductible for income tax purposes.
Mold-Masters
On March 28, 2013, the Company acquired all the outstanding equity interests of Mold-Masters, subject to a working capital settlement. The consideration, net of cash, to acquire Mold-Masters was $965.5 million. On March 28, 2013, the Company paid cash consideration of approximately $920.5 million and subsequently paid an additional $42.4 million of consideration through December 31, 2013. The remaining balance of $2.6 million still outstanding as of December 31, 2013 was paid during 2014. The additional amount outstanding as of December 31, 2013 was included in other current liabilities in the Consolidated Balance Sheets. Simultaneous with the acquisition of Mold-Masters, the Company issued $708.8 million of long-term debt (see Note 5) and received $289.2 million from certain of its equity holders to fund the Mold-Masters Acquisition.
The Company accounted for the acquisition of Mold-Masters using the acquisition method of accounting in accordance with applicable U.S. GAAP whereby the total purchase price was allocated to tangible
F-17
Table of Contents
MILACRON HOLDINGS CORP.
NOTES TO CONSOLIDATED FINANCIAL STATEMENTS (CONTINUED)
2. Business Combinations (continued)
and intangible assets acquired and liabilities assumed based on respective estimated fair values. The following table summarizes the values of the assets acquired and liabilities assumed at the date of acquisition (dollars in millions):
| Accounts receivable |
$ | 54.5 | ||
| Total inventories |
29.2 | |||
| Prepaid and other current assets |
11.6 | |||
| Property and equipment |
79.6 | |||
| Intangible assets |
419.4 | |||
| Goodwill |
478.6 | |||
| Other noncurrent assets |
0.4 | |||
| Accounts payable |
(12.2 | ) | ||
| Advanced billings and deposits |
(3.6 | ) | ||
| Other current liabilities |
(28.2 | ) | ||
| Deferred income tax liabilities |
(62.6 | ) | ||
| Other noncurrent accrued liabilities |
(1.2 | ) | ||
|
|
|
|||
| Consideration, net of cash acquired |
$ | 965.5 | ||
|
|
|
The Company’s Consolidated Financial Statements include Mold-Masters’ results of operations from the date of acquisition on March 28, 2013 through December 31, 2013. Net sales and operating earnings attributable to Mold-Masters during this period and included in the Company’s Consolidated Financial Statements for the year ended December 31, 2013 total $208.1 million and $21.5 million, respectively.
The following unaudited pro forma information gives effect to the Company’s acquisition of Mold-Masters as if the acquisition had occurred on January 1, 2013 and Mold-Masters had been included in the Company’s consolidated results of operations for the year ended December 31, 2013 (dollars in millions, except per share amounts).
| 2013 |
||||
| Net sales |
$ | 1,087.6 | ||
| Net loss attributable to Milacron Holdings Corp. |
(29.2 | ) | ||
| Diluted loss per share |
$ | (59.67 | ) | |
The historical consolidated financial information of the Company and Mold-Masters has been adjusted in the pro forma information to give effect to pro forma events that are (1) directly attributable to the transaction, (2) factually supportable and (3) expected to have continuing impact on the combined results.
Goodwill was calculated as the excess of the consideration transferred over the net assets recognized and represents the expected revenue and cost synergies of the combined company and assembled workforce as well as several strategic benefits including a comprehensive portfolio of brands, complementary product offerings, enhanced global footprint and attractive synergy opportunities. Goodwill recognized as a result of the Mold-Masters Acquisition is not deductible for income tax purposes.
F-18
Table of Contents
MILACRON HOLDINGS CORP.
NOTES TO CONSOLIDATED FINANCIAL STATEMENTS (CONTINUED)
2. Business Combinations (continued)
2014 Acquisitions
During 2014, the Company completed five acquisitions including a U.S. manufacturer of turn-key, co-injection molding equipment and a high-precision component supplier to the plastics industry located in the Czech Republic. The total consideration, net of cash, related to the acquisitions to date in 2014 was $50.4 million.
The Company accounted for the acquisitions using the acquisition method of accounting in accordance with applicable U.S. GAAP whereby the total purchase price was allocated to tangible and intangible assets acquired and liabilities assumed based on respective estimated fair values. The following table summarizes the values of the assets acquired and liabilities assumed at the date of acquisition (dollars in millions):
| Accounts receivable |
$ | 2.7 | ||
| Total inventories |
4.8 | |||
| Prepaid and other current assets |
4.3 | |||
| Property and equipment |
10.2 | |||
| Intangible assets |
13.7 | |||
| Goodwill |
32.2 | |||
| Accounts payable |
(2.4 | ) | ||
| Advanced billings and deposits |
(6.5 | ) | ||
| Other current liabilities |
(4.1 | ) | ||
| Deferred income tax liabilities |
(2.5 | ) | ||
| Other noncurrent accrued liabilities |
(2.0 | ) | ||
|
|
|
|||
| Consideration, net of cash acquired |
$ | 50.4 | ||
|
|
|
Goodwill was calculated as the excess of the consideration transferred over the net assets recognized and represents the expected revenue and cost synergies of the combined company and assembled workforce as well as several strategic benefits including a comprehensive portfolio of brands, complementary product offerings, enhanced global footprint and attractive synergy opportunities. Goodwill recognized as a result of the acquisitions is not deductible for income tax purposes. See Note 3 for additional information regarding goodwill and other intangible assets.
Significant assumptions related to the valuations of assets and liabilities acquired during 2014, 2013 and 2012 include the following:
| • | Inventory fair values were estimated by significant component. Raw materials were valued at current replacement costs and work-in-process was valued at the estimated selling prices of finished goods less the sum of costs to complete, costs of disposal and reasonable profit allowances for completing and selling efforts based on profits for similar finished goods. Finished goods were valued at estimated selling prices less the sum of costs of disposal and reasonable profit allowances for the selling efforts. |
| • | Property and equipment fair values were estimated at their highest and best use value, using a combination of the cost and market approaches. Several key factors affected the values by location, including physical deterioration and age, functional obsolescence and economic obsolescence. |
F-19
Table of Contents
MILACRON HOLDINGS CORP.
NOTES TO CONSOLIDATED FINANCIAL STATEMENTS (CONTINUED)
2. Business Combinations (continued)
| • | Identified intangible assets include trademarks, technology, and customer relationships which were determined based on a combination of the income approach, the market approach and the cost approach. |
| • | Pension and retiree benefit plan liabilities were recorded at actuarially determined fair values. |
| • | Short-term borrowing, long-term debt and capital lease obligation fair values were determined using a discounted cash flow basis and approximates face value, as most of the Company’s debt bears a floating interest rate or was issued on the Acquisition Date. |
Acquisition related costs were expensed as incurred and included legal fees and advisory services. The Company incurred acquisition related costs of $1.1 million for the year ended December 31, 2014, $2.9 million for the year ended December 31, 2013, net of a $2.2 million gain on a foreign currency hedge related to the Mold-Masters Acquisition and $9.9 million for the period from May 1, 2012 (Change in Control Date) to December 31, 2012. These costs are included in business combination costs within the Consolidated Statement of Operations. The Predecessor incurred acquisition related costs of $8.8 million for the period from January 1, 2012 to April 30, 2012. In addition, the Company incurred incremental interest expense of $7.0 million for the year ended December 31, 2013 related to commitment fees associated with the financing of the Mold-Masters Acquisition and $4.1 million for the year ended December 31, 2012 related to commitment fees associated with the financing of the Milacron Intermediate Holdings Inc. acquisition.
3. Goodwill and Other Intangible Assets
The following table summarizes the changes in the Company’s goodwill, by reportable segment, for the years ended December 31, 2014 and 2013, and the period from May 1, 2012 (Change in Control Date) through December 31, 2012:
| Advanced Plastic Processing Technologies |
Melt Delivery and Control Systems |
Fluid Technologies |
Corporate | Total | ||||||||||||||||
| (Dollars in millions) | ||||||||||||||||||||
| Balance at May 1, 2012 and December 31, 2012 |
$ | 8.1 | $ | 1.3 | $ | 46.8 | $ | — | $ | 56.2 | ||||||||||
| Acquisitions |
0.8 | 478.6 | 0.1 | — | 479.5 | |||||||||||||||
| Foreign currency translation adjustments |
— | 2.5 | — | — | 2.5 | |||||||||||||||
|
|
|
|
|
|
|
|
|
|
|
|||||||||||
| Balance at December 31, 2013 |
8.9 | 482.4 | 46.9 | — | 538.2 | |||||||||||||||
| Acquisitions |
17.2 | 15.0 | — | — | 32.2 | |||||||||||||||
| Foreign currency translation adjustments |
— | (21.8 | ) | — | — | (21.8 | ) | |||||||||||||
|
|
|
|
|
|
|
|
|
|
|
|||||||||||
| Balance at December 31, 2014 |
$ | 26.1 | $ | 475.6 | $ | 46.9 | $ | — | $ | 548.6 | ||||||||||
|
|
|
|
|
|
|
|
|
|
|
|||||||||||
F-20
Table of Contents
MILACRON HOLDINGS CORP.
NOTES TO CONSOLIDATED FINANCIAL STATEMENTS (CONTINUED)
3. Goodwill and Other Intangible Assets (continued)
The following table summarizes the other intangible assets acquired through business combinations completed during the year ended December 31, 2014:
| Amount (in Millions) |
Weighted- (in Years) |
|||||||
| Intangible assets subject to amortization: |
||||||||
| Trademarks |
$ | 0.8 | 6.2 | |||||
| Technology |
5.0 | 9.8 | ||||||
| Customer relationships |
7.9 | 10.3 | ||||||
|
|
|
|
|
|||||
| Total |
$ | 13.7 | 9.9 | |||||
|
|
|
|
|
|||||
The following table summarizes the Company’s other intangible assets at December 31, 2014:
| Gross |
Accumulated |
Net |
||||||||||
| (Dollars in Millions) | ||||||||||||
| Intangible assets subject to amortization: |
||||||||||||
| Non-compete agreements |
$ | 1.9 | $ | 1.8 | $ | 0.1 | ||||||
| Trademarks |
48.1 | 12.4 | 35.7 | |||||||||
| Technology |
127.1 | 19.9 | 107.2 | |||||||||
| Customer relationships |
231.2 | 79.7 | 151.5 | |||||||||
|
|
|
|
|
|
|
|||||||
| Total intangible assets subject to amortization |
408.3 | 113.8 | 294.5 | |||||||||
| Trademarks, not subject to amortization |
148.3 | — | 148.3 | |||||||||
|
|
|
|
|
|
|
|||||||
| Total |
$ | 556.6 | $ | 113.8 | $ | 442.8 | ||||||
|
|
|
|
|
|
|
|||||||
The following table summarizes the Company’s other intangible assets at December 31, 2013:
| Gross Amount |
Accumulated |
Net Amount |
||||||||||
| (Dollars in Millions) | ||||||||||||
| Intangible assets subject to amortization: |
||||||||||||
| Non-compete agreements |
$ | 1.9 | $ | 1.3 | $ | 0.6 | ||||||
| Trademarks |
48.9 | 7.2 | 41.7 | |||||||||
| Technology |
131.7 | 10.6 | 121.1 | |||||||||
| Customer relationships |
231.8 | 53.5 | 178.3 | |||||||||
|
|
|
|
|
|
|
|||||||
| Total intangible assets subject to amortization |
414.3 | 72.6 | 341.7 | |||||||||
| Trademarks, not subject to amortization |
154.6 | — | 154.6 | |||||||||
|
|
|
|
|
|
|
|||||||
| Total |
$ | 568.9 | $ | 72.6 | $ | 496.3 | ||||||
|
|
|
|
|
|
|
|||||||
Consolidated amortization expense related to intangible assets subject to amortization was $44.2 million and $47.6 million for the years ended December 31, 2014 and 2013, respectively, and $24.9 million for the period from May 1, 2012 (Change in Control Date) to December 31, 2012. The Predecessor incurred $0.4 million
F-21
Table of Contents
MILACRON HOLDINGS CORP.
NOTES TO CONSOLIDATED FINANCIAL STATEMENTS (CONTINUED)
3. Goodwill and Other Intangible Assets (continued)
of amortization expense for the period from January 1, 2012 to April 30, 2012. Estimated annual amortization expense for intangible assets subject to amortization over the next five years is as follows: $39.3 million in 2015, $34.7 million in 2016, $31.6 million in 2017, $28.6 million in 2018 and $24.1 million in 2019.
4. Income Taxes
The Company’s provision for income taxes consists of the following:
| Successor |
Predecessor |
|||||||||||||||||
| Year ended |
Year ended |
Period
from |
Period from |
|||||||||||||||
| (Dollars in Millions) | ||||||||||||||||||
| Current: |
||||||||||||||||||
| United States |
$ | (0.3 | ) | $ | (0.4 | ) | $ | (0.6 | ) | $ | — | |||||||
| State and local |
0.4 | 0.2 | 0.4 | 0.2 | ||||||||||||||
| Foreign |
24.5 | 15.6 | 4.1 | 1.9 | ||||||||||||||
|
|
|
|
|
|
|
|
|
|||||||||||
| Total current |
24.6 | 15.4 | 3.9 | 2.1 | ||||||||||||||
| Deferred: |
||||||||||||||||||
| United States |
0.1 | 0.2 | 0.2 | — | ||||||||||||||
| State and local |
(0.2 | ) | (0.8 | ) | (0.2 | ) | (0.1 | ) | ||||||||||
| Foreign |
(2.5 | ) | (5.9 | ) | (0.4 | ) | 0.4 | |||||||||||
|
|
|
|
|
|
|
|
|
|||||||||||
| Total deferred |
(2.6 | ) | (6.5 | ) | (0.4 | ) | 0.3 | |||||||||||
|
|
|
|
|
|
|
|
|
|||||||||||
| Total income tax expense |
$ | 22.0 | $ | 8.9 | $ | 3.5 | $ | 2.4 | ||||||||||
|
|
|
|
|
|
|
|
|
|||||||||||
The following sets forth the amount of earnings (loss) before income taxes for the years ended December 31, 2014 and 2013, the period from May 1, 2012 (Change in Control Date) to December 31, 2012 and for the period January 1, 2012 to April 30, 2012:
| Successor |
Predecessor |
|||||||||||||||||
| Year ended |
Year ended |
Period
from |
Period from |
|||||||||||||||
| (Dollars in Millions) | ||||||||||||||||||
| Earnings (loss) before income taxes: |
||||||||||||||||||
| United States |
$ | (38.5 | ) | $ | (36.2 | ) | $ | (34.5 | ) | $ | (7.9 | ) | ||||||
| Rest of the world |
45.6 | 20.4 | 17.0 | 10.5 | ||||||||||||||
|
|
|
|
|
|
|
|
|
|||||||||||
| $ | 7.1 | $ | (15.8 | ) | $ | (17.5 | ) | $ | 2.6 | |||||||||
|
|
|
|
|
|
|
|
|
|||||||||||
F-22
Table of Contents
MILACRON HOLDINGS CORP.
NOTES TO CONSOLIDATED FINANCIAL STATEMENTS (CONTINUED)
4. Income Taxes (continued)
The Company’s effective income tax rate differs from the amount calculated using the statutory U.S. federal income tax rate, principally due to the following:
| Successor | Predecessor | |||||||||||||||||
| Year ended |
Year ended |
Period
from |
Period from |
|||||||||||||||
| (Dollars in Millions) | ||||||||||||||||||
| Income tax expense (benefit) computed at U.S. federal statutory rate |
$ | 2.5 | $ | (5.5 | ) | $ | (6.2 | ) | $ | 0.9 | ||||||||
| Foreign withholding tax |
7.0 | 3.7 | — | 0.1 | ||||||||||||||
| State and local income taxes, net of federal benefit |
0.2 | (0.6 | ) | 0.2 | 0.1 | |||||||||||||
| Foreign tax differential |
(4.8 | ) | (3.5 | ) | (0.6 | ) | (0.3 | ) | ||||||||||
| Change in tax rates |
— | (3.2 | ) | — | — | |||||||||||||
| Change in valuation allowances |
7.1 | 7.8 | 8.0 | 6.7 | ||||||||||||||
| Dividend elimination and subpart F |
8.7 | 6.7 | — | — | ||||||||||||||
| Acquisition expenditures capitalized for tax |
— | 1.3 | 2.2 | 1.1 | ||||||||||||||
| Other permanent differences |
2.9 | 1.6 | (0.1 | ) | — | |||||||||||||
| Tax credits |
(1.7 | ) | (1.2 | ) | (0.6 | ) | — | |||||||||||
| Adjust deferred taxes |
(0.5 | ) | 0.6 | 0.6 | — | |||||||||||||
| Incentive stock option expense |
— | — | — | (6.1 | ) | |||||||||||||
| Other |
0.6 | 1.2 | — | (0.1 | ) | |||||||||||||
|
|
|
|
|
|
|
|
|
|||||||||||
| Income tax expense |
$ | 22.0 | $ | 8.9 | $ | 3.5 | $ | 2.4 | ||||||||||
|
|
|
|
|
|
|
|
|
|||||||||||
The Company’s effective tax rate can vary significantly from the federal statutory rate primarily due to the level and mix of income among domestic and foreign jurisdictions and the creation and release of valuation allowances. In addition, the 2013 effective tax rate varied from the federal statutory rate due to a benefit of $3.2 million related to a three-year reduced statutory tax rate at one of the Company’s non-U.S. subsidiaries. The reduction in the statutory rate is effective through December 31, 2015 and is expected to be renewed for a successive three-year period, although there can be no guarantees that the tax authority will accept the Company’s application.
F-23
Table of Contents
MILACRON HOLDINGS CORP.
NOTES TO CONSOLIDATED FINANCIAL STATEMENTS (CONTINUED)
4. Income Taxes (continued)
Significant components of net deferred tax assets and liabilities are as follows:
| December 31, |
||||||||
| 2014 |
2013 |
|||||||
| (Dollars in millions) | ||||||||
| Deferred tax assets: |
||||||||
| Net operating loss and other deferred carryforwards |
$ | 73.6 | $ | 79.1 | ||||
| Tax credit carryforwards |
19.5 | 20.7 | ||||||
| Inventories |
8.6 | 9.5 | ||||||
| Employee benefits |
10.9 | 5.6 | ||||||
| Accrued liabilities and other |
6.3 | 5.7 | ||||||
|
|
|
|
|
|||||
| Total deferred tax assets |
118.9 | 120.6 | ||||||
| Less valuation allowances |
(65.3 | ) | (63.6 | ) | ||||
|
|
|
|
|
|||||
| Deferred tax assets, net of valuation allowances |
53.6 | 57.0 | ||||||
| Deferred tax liabilities: |
||||||||
| Goodwill and other intangible assets |
98.7 | 108.0 | ||||||
| Property and equipment |
9.3 | 10.6 | ||||||
| Undistributed non-U.S. earnings |
8.5 | 3.9 | ||||||
|
|
|
|
|
|||||
| Total deferred tax liabilities |
116.5 | 122.5 | ||||||
|
|
|
|
|
|||||
| Net deferred tax liabilities |
$ | (62.9 | ) | $ | (65.5 | ) | ||
|
|
|
|
|
|||||
Deferred income taxes reflect the net effects of temporary differences between the carrying values of assets and liabilities and the tax basis of the assets and liabilities. Net deferred tax assets are recorded in prepaid and other current assets and other noncurrent assets and net deferred income tax liabilities are recorded in other noncurrent accrued liabilities in the Consolidated Balance Sheets.
At December 31, 2014, the Company had non-U.S. net operating loss carryforwards, principally in The Netherlands, Germany, Italy and Belgium, totaling $153.9 million, none of which are scheduled to expire in 2015. Non-U.S. net operating losses of $18.3 million will expire between 2016 and 2034. The remaining $135.6 million of non-U.S. net operating losses existing at December 31, 2014 have an indefinite carryforward period.
The Predecessor’s August 21, 2009 purchase of certain assets and assumption of certain liabilities of MI 2009 Inc., formerly Milacron Inc. (OLDCO), in a bankruptcy 363 Sale qualified as a tax free reorganization under Internal Revenue Code (IRC) Section 368(a)(1)(G). A reorganization under this section of the IRC provides for the continuation of most tax attributes for the benefit of the Company, including tax basis in assets and liabilities and net operating loss carryforwards after certain adjustments. The Chapter 7 liquidation was finalized in January 2013 and the final determination of the carryover attributes was complete at December 31, 2013.
At December 31, 2014, the Company had estimated U.S. net operating loss carryforwards totaling $73.1 million, which are scheduled to expire beginning in 2026. As a result of the Acquisition, U.S. net operating losses of $45.4 million are subject to limitation under IRC Section 382.
At December 31, 2014, as a result of an updated analysis of future cash needs in the U.S. and opportunities for investment outside the U.S., the Company asserts that all foreign earnings will be indefinitely reinvested with the exception of certain foreign investments in which earnings and cash generation are in excess
F-24
Table of Contents
MILACRON HOLDINGS CORP.
NOTES TO CONSOLIDATED FINANCIAL STATEMENTS (CONTINUED)
4. Income Taxes (continued)
of local needs. The Company will continue to monitor its assertion related to investment of foreign earnings. As of December 31, 2014, the Company has provided $8.5 million of deferred tax liabilities for planned repatriations of foreign earnings. The Company intends to indefinitely reinvest approximately $93.2 million and $66.4 million of foreign earnings at December 31, 2014 and 2013, respectively. It is not practicable to estimate the amount of worldwide tax that might be payable if these earnings were ever remitted due to changes in the mix of earnings by country and changes in the Company’s capital structure over time.
Effective January 1, 2014, the Internal Revenue Service issued final regulations under IRC Sections 162 and 263 regarding tangible property. These regulations impact the timing and amount of tax deductions for materials and supplies and capital assets. The Company is evaluating the impact of the regulations in conjunction with the preparation of its 2014 federal income tax return. At this time, the Company does not believe these regulations will have a material impact on the Consolidated Financial Statements.
The Company recorded a liability of $1.0 million and $0.6 million for uncertain tax positions as of December 31, 2014 and 2013, respectively, all of which would impact the effective tax rate. The Company does not expect the total amount of unrecognized tax benefits to significantly change within the next 12 months. The Company’s policy is to recognize interest and penalties associated with unrecognized tax benefits within income tax expense within the Consolidated Statements of Operations. The Company has not recognized a liability for interest and penalties as of December 31, 2014 and 2013.
The reconciliation of the beginning and ending total amounts of unrecognized tax benefits (exclusive of interest and penalties) is as follows:
| Successor |
Predecessor |
|||||||||||||||||
| Year ended |
Year ended |
Period from |
Period from |
|||||||||||||||
| (Dollars in Millions) | ||||||||||||||||||
| Balance as of beginning of the period |
$ | 0.6 | $ | 0.3 | $ | 0.2 | $ | 0.2 | ||||||||||
| Additions for tax positions of prior years |
0.1 | 0.3 | 0.1 | — | ||||||||||||||
| Additions for tax positions of current year |
0.5 | — | — | — | ||||||||||||||
| Reductions due to lapse of statutes |
(0.2 | ) | — | — | — | |||||||||||||
|
|
|
|
|
|
|
|
|
|||||||||||
| Balance as of the end of the period |
$ | 1.0 | $ | 0.6 | $ | 0.3 | $ | 0.2 | ||||||||||
|
|
|
|
|
|
|
|
|
|||||||||||
The following tax years remain subject to examinations by major tax jurisdictions:
| Tax Years |
||||
| Tax Jurisdiction: |
||||
| United States |
2011 - current | |||
| Germany |
2009 - current | |||
| China |
2011 - current | |||
| Netherlands |
2009 - current | |||
| Canada |
2012 - current | |||
| India |
2013 - current | |||
F-25
Table of Contents
MILACRON HOLDINGS CORP.
NOTES TO CONSOLIDATED FINANCIAL STATEMENTS (CONTINUED)
5. Debt
Debt for the Company consists of the following:
| December 31, |
||||||||
| 2014 |
2013 |
|||||||
| (Dollars in Millions) | ||||||||
| 8.375% senior secured notes due 2019 |
$ | 220.0 | $ | 275.0 | ||||
| Senior secured term loan facility due 2020 |
338.7 | 242.1 | ||||||
| 7.75% senior unsecured notes due 2021 |
465.0 | 465.0 | ||||||
| Borrowings under other lines of credit |
9.2 | 4.6 | ||||||
| Capital lease obligations and other |
1.7 | 2.7 | ||||||
|
|
|
|
|
|||||
| 1,034.6 | 989.4 | |||||||
| Less current portion |
(13.0 | ) | (9.5 | ) | ||||
|
|
|
|
|
|||||
| $ | 1,021.6 | $ | 979.9 | |||||
|
|
|
|
|
|||||
8.375% Senior Secured Notes
In connection with the Acquisition, the Company issued $275.0 million aggregate principal amount of 8.375% senior secured notes due 2019 (the 8.375% Notes) pursuant to an indenture, dated as of April 30, 2012 (the Indenture), among the Company, the guarantors party thereto and U.S. Bank National Association, as trustee and notes collateral agent. The 8.375% Notes mature on May 15, 2019 and interest is payable semi-annually in arrears on May 15 and November 15 of each year.
The 8.375% Notes were issued in a private transaction that is not subject to the registration requirements of the Securities Act of 1933, as amended. The 8.375% Notes are secured by first-priority liens on substantially all of the assets of Milacron LLC and each of the subsidiary guarantors other than accounts receivable, inventory and other certain assets. The 8.375% Notes are also secured by a second-priority lien on all of the assets of the borrower and the subsidiary guarantors that secure the U.S. ABL Facility. The 8.375% Notes are redeemable, in whole or in part, at any time on or after May 15, 2015 on the redemption dates and at the redemption prices set forth in the Indenture for the 8.375% Notes. In addition, the Company may redeem up to 35% of the 8.375% Notes before May 15, 2015 with the net cash proceeds from certain equity offerings. In addition, at any time prior to May 15, 2015, the Company may redeem up to 10% of the original principal amount of the 8.375% Notes during each 12-month period commencing with the issue date at a redemption price of 103% of the aggregate principal amount thereof, plus accrued and unpaid interest, if any, to, but not including, the redemption date. The Company may also redeem some or all of the 8.375% Notes before May 15, 2015 at a redemption price of 100% of the principal amount thereof plus accrued and unpaid interest, if any, to the redemption date, plus a “make whole” premium. In addition, the Company may be required to make an offer to purchase the 8.375% Notes upon the sale of certain assets and upon a change of control. The Company was in compliance with all applicable covenants as of and for the years ended December 31, 2014 and 2013.
In April of 2014, the Company redeemed $55.0 million of the 8.375% Notes. The Company recorded a $2.9 million loss on the early extinguishment of debt related to the redemption that is recorded in other expense (income), net in the Consolidated Statements of Operations.
Term Loan
In conjunction with the Mold-Masters Acquisition, Milacron Intermediate Holdings Inc., Milacron LLC and certain domestic subsidiaries entered into a seven-year $245.0 million senior secured term loan facility (the
F-26
Table of Contents
MILACRON HOLDINGS CORP.
NOTES TO CONSOLIDATED FINANCIAL STATEMENTS (CONTINUED)
5. Debt (continued)
Term Loan) with JPMorgan Chase Bank, N.A. acting as administrative agent. The facility requires quarterly principal installment payments, a yearly supplemental principal payment based on an excess cash flow calculation beginning in 2015 and the remaining principal balance due on March 28, 2020. Interest payable under the facility is variable and at December 31, 2013 was 4.25% per annum based on a minimum British Bankers’ Association LIBOR rate of 1.00% plus a margin of 3.25% per annum. The facility includes rights to issue incremental term loans up to $175.0 million. The facility contains normal and customary performance covenants including, but not limited to, limitations regarding the use of proceeds, dispositions, investments and transactions with affiliates and has financial performance covenants. The loan is secured by substantially all the assets of the borrowers and the guarantors, which represent certain North American subsidiaries of the Company. As presented in the preceding table, the value of the loan is net of the unamortized portion of a $1.2 million discount at issuance. The discount represents a closing fee paid to the lenders equal to one-half percent of the stated principal of the loan. As a result of the discount, the effective interest rate is approximately 4.32%. The Company was in compliance with all applicable covenants as of and for the years ended December 31, 2014 and 2013.
On March 31, 2014, the Company exercised its right to request an incremental term increase and borrowed an additional $100.0 million, net of a discount of $0.5 million, under the Term Loan facility due 2020 for the principal purpose of funding acquisitions in 2014 as well as redeeming a portion of the 8.375% Notes. The agreement was also amended to reduce the margin on the interest rate from 3.25% to 3.00% for LIBOR loans and from 2.25% to 2.00% for non-LIBOR loans. At December 31, 2014, interest was payable at a rate of 4.00% per annum based on a minimum British Bankers’ Association LIBOR rate of 1.00% plus a margin of 3.00% per annum. No other terms of the facility were changed. As a result of the modification, an additional $0.8 million of related costs were deferred and are being amortized over the term of the agreement.
7.75% Senior Unsecured Notes
Also, in connection with the Mold-Masters Acquisition, Milacron LLC and Mcron Financial Corp. issued $465.0 million aggregate principal amount of 7.75% senior unsecured notes due 2021 (the 7.75% Notes) pursuant to an indenture, dated as of March 28, 2013 (the 2013 Indenture), among Milacron LLC and Mcron Financial Corp., the guarantors party thereto and U.S. Bank National Association, as trustee and notes collateral agent. The 7.75% Notes mature on February 15, 2021 and interest is payable semi-annually on February 15 and August 15 of each year. The 7.75% Notes are unsecured and were issued in a private transaction that is not subject to the registration requirements of the Securities Act of 1933. The 7.75% Notes are redeemable, in whole or in part, at any time on or after February 15, 2016 on the redemption dates and at the redemption prices set forth in the 2013 Indenture. In addition, the Company may redeem up to 40% of the 7.75% Notes before February 15, 2016 with the net cash proceeds from certain equity offerings. The Company may also redeem some or all of the 7.75% Notes before February 15, 2016 at a redemption price of 100% of the principal amount thereof plus accrued and unpaid interest, if any, to the redemption date, plus a “make whole” premium. In addition, the Company may be required to make an offer to purchase the 7.75% Notes upon the sale of certain assets and upon a change of control. The Company was in compliance with all applicable covenants as of and for the years ended December 31, 2014 and 2013.
ABL Facility
In connection with the Acquisition, Milacron Intermediate Holdings Inc., Milacron LLC and certain subsidiaries entered into a new senior secured asset-based revolving credit facility (the ABL Facility). The ABL Facility has a five-year term, bears interest at a floating rate and provides for an aggregate principal amount of
F-27
Table of Contents
MILACRON HOLDINGS CORP.
NOTES TO CONSOLIDATED FINANCIAL STATEMENTS (CONTINUED)
5. Debt (continued)
$60.0 million of loans thereunder, subject to a borrowing base and other limitations. The Company has the right at any time to request up to $20.0 million of additional commitments. The existing lenders under the ABL Facility are not under any obligation to provide such additional commitments, and any increase in commitments is subject to customary conditions.
The obligations under the ABL Facility are secured, subject to certain exceptions, by substantially all of the assets of the borrowers and the assets of the guarantors under such facility. In addition, the ABL Facility includes certain customary negative covenants that, subject to exceptions, limit the ability of Milacron Intermediate Holdings Inc. to incur additional indebtedness, pay dividends or certain other distributions on the its capital stock, repurchase its capital stock, prepay subordinated indebtedness, incur liens on assets, make certain investments or other restricted payments, engage in transactions with affiliates, sell certain assets, merge or consolidate with or into other companies and alter the business that it conducts.
On March 28, 2013, the ABL Facility was amended to increase the maximum borrowings under the U.S. sub-facility from $60.0 million to $70.0 million and to allow for additional borrowings of up to $30.0 million under a Canadian sub-facility, subject to a borrowing base and other limitations. The covenants and other terms of the ABL Facility were not significantly changed. As a result of this modification, an additional $1.1 million of related costs were deferred and are being amortized over the term of the amended agreement. On March 17, 2014, the Company exercised its right to increase the U.S. sub-facility of the ABL Facility by $10.0 million to $80.0 million and decrease the Canadian sub-facility by $10.0 million to $20.0 million. The covenants and other terms of the program were not changed. On October 17, 2014, the ABL Facility was amended to add a $25.0 million German sub-facility and the term was reset to five years from the date of the amendment. The covenants and other terms of the ABL Facility were not materially changed. As a result of this modification, an additional $1.3 million of related costs were deferred and are being amortized over the term of the amended agreement.
At December 31, 2014, $14.9 million of the ABL Facility was utilized, all of which represent letters of credit, with $79.8 million available under the facility. At December 31, 2013, $10.0 million of the ABL Facility was utilized, all of which represent letters of credit, with $69.3 million available under the facility. The Company is in compliance with all covenants as of and for the years ended December 31, 2014 and 2013.
Other Borrowings
The Company has other lines of credit and capital lease arrangements with various U.S. and non-U.S. banks totaling approximately $27.2 million and $26.1 million at December 31, 2014 and 2013, respectively. These credit facilities support letters of credit, guarantees and leases in addition to providing borrowings under varying terms. At December 31, 2014, $14.5 million was outstanding with $10.9 million representing borrowings and $3.6 million representing letters of credit and bank guarantees. At December 31, 2013, $11.0 million was outstanding with $7.3 million representing borrowings and $3.7 million representing letters of credit and bank guarantees. Approximately $12.7 million and $15.2 million were available to the Company under certain conditions under these lines at December 31, 2014 and 2013, respectively. The weighted-average interest rate on short-term borrowings was 6.15% at December 31, 2014 and 5.28% at December 31, 2013.
Deferred Financing Costs
The Predecessor recorded $12.2 million of interest expense for the period from January 1, 2012 to April 30, 2012, which included the write-off of $6.9 million of deferred financing fees on the debt that was settled in conjunction with the Acquisition.
F-28
Table of Contents
MILACRON HOLDINGS CORP.
NOTES TO CONSOLIDATED FINANCIAL STATEMENTS (CONTINUED)
5. Debt (continued)
As a result of the Company’s issuance of the 8.375% Notes in 2012, $8.9 million of deferred financing costs were capitalized and are being amortized over seven years using the effective interest rate method. Additionally, as a result of the issuance of the Term Loan and 7.75% Notes in conjunction with the Mold-Masters Acquisition, $21.3 million of deferred financing costs were capitalized and are being amortized using the effective interest rate method. Deferred financing costs are recorded within other noncurrent assets in the accompanying Consolidated Balance Sheets and the related amortization expense is included in interest expense, net in the accompanying Consolidated Statements of Operations.
As of December 31, 2014, future minimum payments of the Company’s debt and capital lease arrangements are as follows (dollars in millions):
| 2015 |
$ | 4.0 | ||
| 2016 |
3.9 | |||
| 2017 |
3.8 | |||
| 2018 |
3.5 | |||
| 2019 |
223.4 |
At December 31, 2014, based on Level 2 inputs such as quoted market prices, the fair value of the 8.375% Notes was approximately $232.4 million, the fair value of the Term Loan was approximately $336.6 million and the fair value of the 7.75% Notes was approximately $472.0 million. The carrying amount of the Company’s other debt approximates fair value.
6. Employee Benefit Plans
Savings Plans
The Company sponsors a defined contribution plan (the 401(k) Plan) for eligible U.S. employees. The provisions of the 401(k) Plan allow eligible employees to contribute a percentage of their compensation, not to exceed the limits established by federal income tax law and employees are immediately vested in their voluntary contributions. The Company’s contributions to the 401(k) Plan are based on matching a portion of the employee contributions and employees become vested in the Company contributions once they attain three years of credited service.
As a result of the Mold-Masters Acquisition, the Company also maintains defined contribution plans for eligible employees at certain of its foreign subsidiaries. Employees are immediately vested in both their voluntary and company matching contributions.
The Company recorded expense of $2.6 million and $2.1 million for the years ended December 31, 2014 and 2013, respectively, and $1.2 million for the period from May 1, 2012 (Change in Control Date) to December 31, 2012 related to these defined contribution plans. The Predecessor recorded expense of $0.3 million for the period from January 1, 2012 to April 30, 2012.
Pension Plans
The Company sponsors three noncontributory defined benefit pension plans for certain non-U.S. employees and retirees. One plan covers certain employees in the United Kingdom and the other two plans cover certain employees in Germany. Contributions to these plans are expected to approximate benefit payments.
F-29
Table of Contents
MILACRON HOLDINGS CORP.
NOTES TO CONSOLIDATED FINANCIAL STATEMENTS (CONTINUED)
6. Employee Benefit Plans (continued)
Components of net periodic pension cost included in the accompanying Consolidated Statements of Operations were as follows:
| Successor | Predecessor | |||||||||||||||||
| Year ended |
Year ended |
Period from |
Period from |
|||||||||||||||
| (Dollars in Millions) | ||||||||||||||||||
| Service costs |
$ | 0.4 | $ | 0.4 | $ | 0.2 | $ | 0.2 | ||||||||||
| Interest cost |
1.2 | 1.2 | 0.7 | 0.7 | ||||||||||||||
| Expected return on plan assets |
(0.3 | ) | (0.2 | ) | (0.1 | ) | (0.3 | ) | ||||||||||
| Amortization of unrecognized gains and losses |
— | 0.1 | — | — | ||||||||||||||
|
|
|
|
|
|
|
|
|
|||||||||||
| Pension expense |
$ | 1.3 | $ | 1.5 | $ | 0.8 | $ | 0.6 | ||||||||||
|
|
|
|
|
|
|
|
|
|||||||||||
The measurement date for all of the Company’s defined benefit pension plans is December 31. The funded status of the plans is as follows:
| Successor | Predecessor | |||||||||||||||||
| Year ended |
Year ended |
Period from May 1 (Change |
Period from |
|||||||||||||||
| (Dollars in Millions) | ||||||||||||||||||
| Change in benefit obligation: |
||||||||||||||||||
| Projected benefit obligation at beginning of period |
$ | 32.0 | $ | 28.2 | $ | 27.9 | $ | 24.2 | ||||||||||
| Service cost |
0.4 | 0.4 | 0.2 | 0.2 | ||||||||||||||
| Interest cost |
1.2 | 1.2 | 0.7 | 0.7 | ||||||||||||||
| Benefits paid |
(0.9 | ) | (0.7 | ) | (0.6 | ) | (0.3 | ) | ||||||||||
| Actuarial loss |
6.7 | 1.7 | 0.1 | 2.6 | ||||||||||||||
| Foreign currency translation adjustments |
(4.1 | ) | 1.2 | (0.1 | ) | 0.5 | ||||||||||||
|
|
|
|
|
|
|
|
|
|||||||||||
| Projected benefit obligation at end of period |
$ | 35.3 | $ | 32.0 | $ | 28.2 | $ | 27.9 | ||||||||||
|
|
|
|
|
|
|
|
|
|||||||||||
| Change in plans assets: |
||||||||||||||||||
| Fair value of plan assets at beginning of period |
$ | 5.3 | $ | 4.4 | $ | 4.2 | $ | 3.7 | ||||||||||
| Employer contributions |
0.3 | 0.3 | 0.3 | 0.3 | ||||||||||||||
| Actual return on plan assets |
0.6 | 0.6 | 0.1 | 0.1 | ||||||||||||||
| Benefits paid |
(0.2 | ) | (0.1 | ) | (0.1 | ) | (0.1 | ) | ||||||||||
| Foreign currency translation adjustments |
(0.4 | ) | 0.1 | (0.1 | ) | 0.2 | ||||||||||||
|
|
|
|
|
|
|
|
|
|||||||||||
| Fair value of plan assets at end of period |
$ | 5.6 | $ | 5.3 | $ | 4.4 | $ | 4.2 | ||||||||||
|
|
|
|
|
|
|
|
|
|||||||||||
| Underfunded status |
$ | 29.7 | $ | 26.7 | $ | 23.8 | $ | 23.7 | ||||||||||
|
|
|
|
|
|
|
|
|
|||||||||||
F-30
Table of Contents
MILACRON HOLDINGS CORP.
NOTES TO CONSOLIDATED FINANCIAL STATEMENTS (CONTINUED)
6. Employee Benefit Plans (continued)
Amounts recognized in the Consolidated Balance Sheets consisted of:
| December 31, |
||||||||
| 2014 |
2013 |
|||||||
| (Dollars in Millions) | ||||||||
| Current accrued pension costs |
$ | 0.7 | $ | 0.8 | ||||
| Noncurrent accrued pension costs |
29.0 | 25.9 | ||||||
| Accumulated other comprehensive loss |
(6.8 | ) | (1.1 | ) | ||||
The actuarial loss included in accumulated other comprehensive loss that is expected to be recognized in net periodic pension cost during the fiscal year ended December 31, 2015 is $0.2 million. The accumulated benefit obligation for the defined benefit plans was $33.7 million and $29.9 million at December 31, 2014 and 2013, respectively.
Estimated future benefit payments from the defined benefit plans, including the effects of future service, are as follows (dollars in millions):
| 2015 |
$ | 0.9 | ||
| 2016 |
0.9 | |||
| 2017 |
1.0 | |||
| 2018 |
1.0 | |||
| 2019 |
1.1 | |||
| 2020 – 2024 |
7.1 |
The following table presents the weighted-average actuarial assumptions used to determine pension cost for the Company’s defined benefit plans:
| Successor |
Predecessor |
|||||||||||||||||
| Year ended |
Year ended |
Period
from |
Period from |
|||||||||||||||
| Discount rate |
3.78 | % | 4.21 | % | 5.14 | % | 5.48 | % | ||||||||||
| Expected long-term rate of return on plan assets |
5.45 | % | 5.10 | % | 4.82 | % | 5.08 | % | ||||||||||
| Rate of expected increase in future compensation levels |
3.34 | % | 3.21 | % | 2.99 | % | 3.81 | % | ||||||||||
The following table presents the weighted-average actuarial assumptions used to determine the projected benefit obligation for the Company’s defined benefit plans:
| December 31, |
||||||||
| 2014 |
2013 |
|||||||
| Discount rate |
2.44 | % | 3.78 | % | ||||
| Rate of expected increase in future compensation levels |
3.18 | % | 3.19 | % | ||||
Plan assets are held in the United Kingdom plan and in one of the plans in Germany. Plan assets are primarily invested common/collective trusts which are valued at the net asset value (NAV) per share or unit multiplied by the number of shares or units held as of the measurement date. The NAV is based on the fair value
F-31
Table of Contents
MILACRON HOLDINGS CORP.
NOTES TO CONSOLIDATED FINANCIAL STATEMENTS (CONTINUED)
6. Employee Benefit Plans (continued)
of the underlying net assets owned by the fund and the NAV’s unit or per share price is quoted on a private market that may not be active. The investment objectives for the plan assets are to generate returns that will enable the plans to meet their future obligations. The Company’s expected long-term rate of return was determined based on the asset mix of the plan, projected returns, past performance and other factors. There were no transfers between the three levels of the fair value hierarchy during the years ended December 31, 2014 and 2013.
The following table sets forth by level, within the fair value hierarchy, the plans assets at fair value as of December 31, 2014 and 2013:
| Total |
Level 1 |
Level 2 |
Level 3 |
|||||||||||||
| (Dollars in Millions) | ||||||||||||||||
| December 31, 2014 |
||||||||||||||||
| Investments: |
||||||||||||||||
| Common/Collective trusts: |
||||||||||||||||
| Equity |
$ | 2.6 | $ | — | $ | 2.6 | $ | — | ||||||||
| Corporate and government bonds |
2.7 | — | 2.7 | — | ||||||||||||
| Cash equivalents and other |
0.3 | 0.3 | — | — | ||||||||||||
|
|
|
|
|
|
|
|
|
|||||||||
| Total investments |
$ | 5.6 | $ | 0.3 | $ | 5.3 | $ | — | ||||||||
|
|
|
|
|
|
|
|
|
|||||||||
| December 31, 2013 |
||||||||||||||||
| Investments: |
||||||||||||||||
| Common/Collective trusts: |
||||||||||||||||
| Equity |
$ | 2.5 | $ | — | $ | 2.5 | $ | — | ||||||||
| Corporate and government bonds |
2.4 | — | 2.4 | — | ||||||||||||
| Cash equivalents and other |
0.4 | 0.4 | — | — | ||||||||||||
|
|
|
|
|
|
|
|
|
|||||||||
| Total investments |
$ | 5.3 | $ | 0.4 | $ | 4.9 | $ | — | ||||||||
|
|
|
|
|
|
|
|
|
|||||||||
7. Shareholders’ Equity
Predecessor
On February 21, 2012, the Predecessor repurchased 24,678 shares of common stock for $82.5 million and the repurchased shares were cancelled. The repurchase was recorded as a reduction to retained earnings as a permanent capitalization. The Predecessor was subject to Delaware law which restricts share repurchases that are in excess of book capital surplus unless real economic surplus is maintained. The Predecessor’s Board of Directors determined that the funds used in the share repurchase did not exceed the Predecessor’s real economic surplus. The common stock was retired as part of the Acquisition.
Successor
At the Acquisition Date, the Company had 460,000 authorized shares of common stock and 10,000 authorized shares of preferred stock, each with a par value of $0.01 per share. On March 7, 2013 the number of common shares authorized was increased to 790,000. The holders of the common stock are entitled to one vote for each share held of record on all matters submitted to a vote of shareholders. Subject to preferences that may be applicable to any outstanding preferred stock, holders of common stock are entitled to receive ratably such
F-32
Table of Contents
MILACRON HOLDINGS CORP.
NOTES TO CONSOLIDATED FINANCIAL STATEMENTS (CONTINUED)
7. Shareholders’ Equity (continued)
dividends as may be declared from time to time by the Board of Directors. At December 31, 2014 and 2013, the Company has 491,873 and 490,139 common shares issued and outstanding, respectively, and no preferred shares issued or outstanding for any period.
On February 17, 2014, the Company acquired all the non-controlling shares of Milacron Plastics Machinery (Jiangyin) Co., Ltd. for $1.9 million. As the Company already held a controlling interest, the purchase was accounted for as an equity transaction. For the year ended December 31, 2014, the Company recognized a reduction in paid-in capital of $1.6 million for the excess of par value of the purchase of the non-controlling shares.
8. Net (Loss) Earnings Per Share
The following is a reconciliation of the numerator and denominator of the basic and diluted net (loss) earnings per share (EPS) computations:
| Successor |
Predecessor |
|||||||||||||||||
| Year ended |
Year ended |
Period
from |
Period from |
|||||||||||||||
| (In millions, except common share and per common share amounts) |
||||||||||||||||||
| Numerator: |
||||||||||||||||||
| Net (loss) earnings applicable to common shareholders |
$ | (14.8 | ) | $ | (24.6 | ) | $ | (21.2 | ) | $ | 0.3 | |||||||
|
|
|
|
|
|
|
|
|
|||||||||||
| Denominator: |
||||||||||||||||||
| Denominator for basic EPS—weighted-average common shares |
490,965 | 421,200 | 196,387 | 68,877 | ||||||||||||||
| Dilutive effect of stock-based compensation arrangements |
— | — | — | 5,453 | ||||||||||||||
|
|
|
|
|
|
|
|
|
|||||||||||
| Denominator for diluted EPS—adjusted weighted-average common shares |
490,965 | 421,200 | 196,387 | 74,330 | ||||||||||||||
|
|
|
|
|
|
|
|
|
|||||||||||
| Basic EPS |
$ | (30.14 | ) | $ | (58.40 | ) | $ | (107.95 | ) | $ | 4.36 | |||||||
|
|
|
|
|
|
|
|
|
|||||||||||
| Diluted EPS |
$ | (30.14 | ) | $ | (58.40 | ) | $ | (107.95 | ) | $ | 4.04 | |||||||
|
|
|
|
|
|
|
|
|
|||||||||||
The diluted EPS calculation for the years ended December 31, 2014 and 2013 excludes the effect of 49,510 and 44,853 outstanding stock options, respectively, as their effect is anti-dilutive. The diluted EPS calculation for the period from May 1, 2012 (Change in Control Date) to December 31, 2012 excludes the effect of 1,000 restricted stock units and 24,798 outstanding stock options as their effect is anti-dilutive. Holders of non-vested stock-based compensation awards do not have voting rights or rights to receive nonforfeitable dividends on the shares covered by the awards.
F-33
Table of Contents
MILACRON HOLDINGS CORP.
NOTES TO CONSOLIDATED FINANCIAL STATEMENTS (CONTINUED)
9. Stock-Based Compensation
Predecessor
The Predecessor sponsored an equity incentive plan to provide for the granting of stock-based compensation to certain officers and directors.
On April 30, 2012, in conjunction with the Acquisition, the Predecessor’s outstanding stock options were acquired for the fair value of the underlying equity instruments and cancelled. The Acquisition was a change of control event that accelerated vesting of the remaining stock options. The Predecessor recognized $3.4 million of stock-based compensation expense for the period from January 1, 2012 to April 30, 2012, including $2.8 million related to the accelerated vesting. The stock options were settled for $19.1 million as part of the Acquisition.
Successor
The Company sponsors an equity incentive plan (the 2012 Incentive Plan) which provides for the granting of stock options, stock appreciation rights, restricted stock and other stock-based awards to employees, non-employee directors and Company consultants. The Company has granted both time-based and performance-based stock options. The time-based awards vest in equal increments over four years in tranches for the awards granted to employees and five years in tranches for awards granted to non-employee directors and were valued using a closed form option-pricing model. The performance-based awards only vest when specific liquidity events, as defined, occur and were valued using a Monte Carlo simulation. The performance-based awards also contain a market condition in which the CCMP Stockholders, as defined, must receive a certain multiple of their initial investment in order for the awards to vest. The time-based awards also contain provisions that accelerate vesting of the awards upon the occurrence of a liquidity event, as defined. No compensation expense was recognized during any period for performance-based awards.
The models require the input of certain subjective assumptions, including (a) the expected stock price volatility, (b) the calculation of expected term of the award, (c) the risk-free interest rate and (d) expected dividends. Due to the lack of a public market for the trading of the Company’s common stock and a lack of company-specific historical and implied volatility data, the Company has based its estimate of expected volatility on the historical volatility of a group of similar companies that are publicly traded. The historical volatility is calculated based on a period of time commensurate with the expected term assumption. The computation of expected volatility is based on the historical volatility of a representative group of companies with similar characteristics to the Company. The Company believes the group selected has sufficient similar economic and industry characteristics, and includes companies that are most representative of the Company. The Company uses the simplified method as prescribed by the SEC Staff Accounting Bulletin No. 107, Share-Based Payment, to calculate the expected term for the stock options granted to employees as it does not have sufficient historical exercise data to provide a reasonable basis upon which to estimate the expected term. The expected term of the performance-based options was based on the expected time to a liquidity event, as defined. The risk-free interest rate is based on a treasury instrument whose term is consistent with the expected life of the stock options. The expected dividend yield is assumed to be zero as the Company has no current plans to pay any dividends on its common stock.
F-34
Table of Contents
MILACRON HOLDINGS CORP.
NOTES TO CONSOLIDATED FINANCIAL STATEMENTS (CONTINUED)
9. Stock-Based Compensation (continued)
The key assumptions utilized in determining the fair value of the awards granted during the years ended December 31, 2014 and 2013 and the period from May 1, 2012 (Change in Control Date) to December 31, 2012 are as follows for the various tranches:
| Time-Based Options | ||||||
| Year ended 2014 |
Year ended |
Period from | ||||
| Assumptions: |
||||||
| Expected term (years) |
2.07 – 7.50 | 2.81 – 7.50 | 3.30 – 7.50 | |||
| Expected volatility |
47.00 – 77.00% | 64.00 – 84.00% | 75.00 – 80.00% | |||
| Risk-free interest rate |
0.46 – 2.31% | 0.34 – 1.35% | 0.46 – 1.44% | |||
| Expected dividend yield |
— % | — % | — % | |||
| Performance-Based Options | ||||||
| Year ended 2014 |
Year ended |
Period from 2012 | ||||
| Assumptions: |
||||||
| Expected term (years) |
2.07 – 4.30 | 2.80 – 3.80 | 3.30 – 4.30 | |||
| Expected volatility |
44.00 – 74.00% | 64.00 – 83.00% | 72.20 – 108.50% | |||
| Risk-free interest rate |
0.29 – 3.09% | 0.34 – 2.50% | 0.45 – 2.72% | |||
| Expected dividend yield |
— % | — % | — % | |||
The estimated grant date fair value of the Company’s common stock, as determined by the Company’s Board of Directors, which in part relied upon a valuation from a third-party specialist, approximated $1,000 during all periods presented. Accordingly, the strike prices for each respective grant were $1,000 and intrinsic values, if any, were determined to be insignificant rounding differences. Additionally, all awards granted for the periods presented expire ten years from the grant date. The total fair value of the time-based stock options granted is being recognized into compensation expense over the requisite service period and totaled $4.8 million and $3.7 million for the years ended December 31, 2014 and 2013, respectively, and $1.3 million for the period from May 1, 2012 (Change in Control Date) to December 31, 2012.
At December 31, 2014, the time-based stock options had unrecognized compensation expense related to nonvested options of $10.8 million which is expected to be recognized over a weighted-average remaining period of 2.7 years. The performance-based stock options had unrecognized compensation expense of $9.0 million at December 31, 2014, which will only be recognized when a liquidity event occurs that causes the options to vest. Approximately $4.2 million is expected to be recognized into compensation expense in 2015 related to the time-based awards.
F-35
Table of Contents
MILACRON HOLDINGS CORP.
NOTES TO CONSOLIDATED FINANCIAL STATEMENTS (CONTINUED)
9. Stock-Based Compensation (continued)
A summary of the stock option activity under the 2012 Incentive Plan for the year ended December 31, 2014 is presented below:
| Shares |
Weighted- |
Weighted- (In years) |
Aggregate (In millions) |
|||||||||||||
| Outstanding at December 31, 2013 |
44,853 | $ | 1,000.00 | |||||||||||||
| Granted |
14,003 | 1,000.00 | ||||||||||||||
| Exercised |
(19 | ) | 1,000.00 | |||||||||||||
| Expired |
(510 | ) | 1,000.00 | |||||||||||||
| Forfeited |
(8,817 | ) | 1,000.00 | |||||||||||||
|
|
|
|
|
|
|
|
|
|||||||||
| Outstanding at December 31, 2014 |
49,510 | $ | 1,000.00 | 8.0 | $ | — | ||||||||||
|
|
|
|
|
|
|
|
|
|||||||||
| Exercisable at December 31, 2014 |
9,212 | $ | 1,000.00 | 6.3 | $ | — | ||||||||||
|
|
|
|
|
|
|
|
|
|||||||||
| Options expected to vest |
29,831 | $ | 1,000.00 | 7.7 | $ | — | ||||||||||
|
|
|
|
|
|
|
|
|
|||||||||
At December 31, 2014, there were 30,438 time-based stock options and the weighted-average grant-date fair value of time-based stock options granted during the years ended December 31, 2014 and 2013 was $671.30 and $693.36, respectively, and $676.97 for the period from May 1, 2012 (Change in Control Date) to December 31, 2012. As of December 31, 2014, there were 19,072 performance-based stock options outstanding and the weighted-average grant-date fair value of performance-based stock options granted during the years ended December 31, 2014 and 2013 was $473.58 and $483.53, respectively, and $553.26 for the period from May 1, 2012 (Change in Control Date) to December 31, 2012.
Restricted stock
In connection with the Acquisition, the Company issued 1,500 shares of restricted common stock with a vesting period of one year and an estimated fair value of $1,000.00 per share to the former Chief Executive Officer (CEO). On September 19, 2012, the former CEO’s employment was terminated, resulting in the immediate vesting of the restricted common stock pursuant to the original terms of the agreement and the acceleration of the unrecognized compensation expense. On October 4, 2012, the Company issued 1,000 shares of restricted common stock with a vesting period of one year and an estimated fair value of $1,000.00 per share. The Company recorded $0.8 million of compensation expense for the year ended December 31, 2013 and $1.7 million for the period from May 1, 2012 (Change in Control Date) to December 31, 2012.
10. Derivative Financial Instruments
In the normal course of business, including the purchasing of materials and selling of products, the Company is exposed to certain risks related to fluctuations in foreign currency exchange rates. The Company uses foreign currency forward contracts to manage risks from these market fluctuations. The Company currently hedges its risk relative to fluctuations in the Canadian dollar and Japanese yen for forecasted cash outflows denominated in these currencies. The Company had foreign currency forward contracts denominated in these currencies outstanding with notional amounts totaling $29.3 million and $46.3 million at December 31, 2014 and 2013, respectively. As of December 31, 2014, all of the Company’s outstanding instruments mature within the next 12 months.
F-36
Table of Contents
MILACRON HOLDINGS CORP.
NOTES TO CONSOLIDATED FINANCIAL STATEMENTS (CONTINUED)
10. Derivative Financial Instruments (continued)
The Company’s derivative instruments discussed above are designated as cash flow hedges and the fair value of these derivative instruments at December 31, 2014 and 2013 was $3.1 million and $2.1 million, respectively, which is included in other current liabilities.
The following table provides the effect of the Company’s designated cash flow hedges on the Company’s Consolidated Financial Statements for the years ended December 31, 2014 and 2013 and the period from May 1, 2012 (Change in Control Date) to December 31, 2012:
| Type of instrument: |
Gain (Loss) Recognized in OCI on Derivative (Effective Portion) |
Gain (Loss) Reclassified from Accumulated OCI into Income (Effective Portion) |
||||||
| 2014: |
||||||||
| Foreign exchange contract |
$ | (3.7 | ) | $ | (3.0 | ) | ||
|
|
|
|
|
|||||
| 2013: |
||||||||
| Foreign exchange contract |
$ | (2.8 | ) | $ | (1.0 | ) | ||
|
|
|
|
|
|||||
| 2012: |
||||||||
| Foreign exchange contract |
$ | — | $ | — | ||||
|
|
|
|
|
|||||
All gains (losses) that are reclassified from accumulated other comprehensive income (loss) into income (effective portion) are classified in loss (gain) on currency translation or cost of sales within the Consolidated Statements of Operations. The gain (loss) recognized related to the ineffective portion of the derivative instruments was immaterial for all periods presented. As of December 31, 2014, deferred losses of $3.1 million on derivative instruments included in accumulated other comprehensive income (loss) are expected to be reclassified into earnings during the next 12 months. During 2014 and 2013, the Company recorded a net loss of $3.0 million and $1.0 million, respectively, related to the settlement of forward contracts which were designated as cash flow hedges.
The classification of fair value measurements within the established three-level hierarchy is based upon the lowest level of input that is significant to that measurement. The fair values of the Company’s derivatives instruments were measured using valuations based upon quoted prices for similar assets and liabilities in active markets (Level 2) and are valued by reference to similar financial instruments, adjusted for terms specific to the contracts. There were no transfers between the three levels of the fair value hierarchy during any period presented. The derivative assets and liabilities measured at fair value on a recurring basis as of December 31, 2014 and 2013 were as follows:
| Total |
Level 1 |
Level 2 |
Level 3 |
|||||||||||||
| (Dollars in Millions) | ||||||||||||||||
| December 31, 2014 |
||||||||||||||||
| Foreign currency forward contracts (liability position) |
$ | 3.1 | $ | — | $ | 3.1 | $ | — | ||||||||
|
|
|
|
|
|
|
|
|
|||||||||
| December 31, 2013 |
||||||||||||||||
| Foreign currency forward contracts (liability position) |
$ | 2.1 | $ | — | $ | 2.1 | $ | — | ||||||||
|
|
|
|
|
|
|
|
|
|||||||||
The Company also enters into derivative instruments (forwards) to economically hedge the impact of fluctuations in the Indian rupee. During the years ended December 31, 2014 and 2013, the Company recognized
F-37
Table of Contents
MILACRON HOLDINGS CORP.
NOTES TO CONSOLIDATED FINANCIAL STATEMENTS (CONTINUED)
10. Derivative Financial Instruments (continued)
a gain of $0.6 million and $0.3 million, respectively, related to changes in fair value of these derivative instruments not designated as hedges, compared to a gain of $0.2 million for the period in from May 1 (Change in Control Date) to December 31, 2012. The Predecessor recognized a gain of $0.1 million for the period from January 1 to April 30, 2012. These gains and losses are recognized immediately within the Consolidated Statement of Operations and are classified within loss (gain) on currency translation. The fair value of these derivative instruments not designated as hedges as December 31, 2014 was de minimis.
11. Accumulated Other Comprehensive Income (Loss)
The following table summarizes the changes in the accumulated balances for each component of accumulated other comprehensive income (loss):
| Foreign |
Unrecognized |
Derivative |
Total |
|||||||||||||
| Balance at December 31, 2012 |
$ | (0.3 | ) | $ | (0.5 | ) | $ | — | $ | (0.8 | ) | |||||
| Other comprehensive income (loss) before reclassifications |
4.0 | (1.1 | ) | (2.5 | ) | 0.4 | ||||||||||
| Amounts reclassified from accumulated other comprehensive income (loss) |
— | 0.1 | 0.7 | 0.8 | ||||||||||||
|
|
|
|
|
|
|
|
|
|||||||||
| Other comprehensive income (loss) |
4.0 | (1.0 | ) | (1.8 | ) | 1.2 | ||||||||||
|
|
|
|
|
|
|
|
|
|||||||||
| Balance at December 31, 2013 |
3.7 | (1.5 | ) | (1.8 | ) | 0.4 | ||||||||||
| Other comprehensive income (loss) before reclassifications |
(49.1 | ) | (4.1 | ) | (3.7 | ) | (56.9 | ) | ||||||||
| Amounts reclassified from accumulated other comprehensive income (loss) |
— | — | 2.4 | 2.4 | ||||||||||||
|
|
|
|
|
|
|
|
|
|||||||||
| Other comprehensive income (loss) |
(49.1 | ) | (4.1 | ) | (1.3 | ) | (54.5 | ) | ||||||||
|
|
|
|
|
|
|
|
|
|||||||||
| Balance at December 31, 2014 |
$ | (45.4 | ) | $ | (5.6 | ) | $ | (3.1 | ) | $ | (54.1 | ) | ||||
|
|
|
|
|
|
|
|
|
|||||||||
The following table summarizes the reclassifications out of accumulated other comprehensive income (loss) during the years ended December 31, 2014 and 2013:
| Classification of Expense |
Year ended December 31, |
|||||||||||
| 2014 |
2013 |
|||||||||||
| Unrealized pension and post-retirement obligations: |
||||||||||||
| Adjustment of pension and post-retirement obligations |
(a | ) | $ | — | $ | (0.1 | ) | |||||
| Tax benefit (expense) |
(b | ) | — | — | ||||||||
|
|
|
|
|
|||||||||
| Adjustment of pension and post-retirement obligations, net of tax |
— | (0.1 | ) | |||||||||
| Derivative financial instruments: |
||||||||||||
| Loss on derivative financial instruments |
(c | ) | (3.0 | ) | (1.0 | ) | ||||||
| Tax benefit (expense) |
(b | ) | 0.6 | 0.3 | ||||||||
|
|
|
|
|
|||||||||
| Loss on derivative financial instruments, net of tax |
(2.4 | ) | (0.7 | ) | ||||||||
|
|
|
|
|
|||||||||
| Total reclassifications from accumulated other comprehensive income (loss) |
$ | (2.4 | ) | $ | (0.8 | ) | ||||||
|
|
|
|
|
|||||||||
F-38
Table of Contents
MILACRON HOLDINGS CORP.
NOTES TO CONSOLIDATED FINANCIAL STATEMENTS (CONTINUED)
11. Accumulated Other Comprehensive Income (Loss) (continued)
| (a) | Amount is included in the calculation of pension cost within cost of sales and selling, general and administrative expense on the accompanying Consolidated Statement of Operations. See Note 6. |
| (b) | These amounts are included in income tax expense on the accompanying Consolidated Statement of Operations. |
| (c) | Amount is included in cost of sales and loss (gain) on currency translation on the accompanying Consolidated Statement of Operations. |
12. Related-Party Transaction
CCMP and the Chairman of the Board were paid a total of $5.2 million when the Acquisition closed. The Company executed a management agreement with CCMP on April 30, 2012 that provides a management fee to CCMP. The Company incurred $0.5 million of expense per year for the years ended December 31, 2014 and 2013 and $0.3 million for the period from May 1, 2012 (Change in Control Date) to December 31, 2012 related to the management agreement and these costs are included within selling, general and administrative expense within the Consolidated Statements of Operations.
On September 19, 2012, the Company’s former Chief Executive Officer’s employment was terminated. The costs related to his termination were accrued as of that date and are recorded in officer severance costs on the Consolidated Statements of Operations. These costs represent severance, medical and dental coverage, and the immediate vesting of restricted stock as stipulated by his employment agreement.
13. Commitments and Contingencies
The Company is obligated under various non-cancelable operating leases for equipment and facilities, some of which contain renewal options. At December 31, 2014, future minimum lease commitments under non-cancelable operating leases were approximately $25.5 million with required payments of $10.3 million in 2015, $7.6 million in 2016, $5.5 million in 2017, $1.6 million in 2018, $0.4 million in 2019, and $0.1 million thereafter. The Company recorded $11.8 million and $10.9 million of rent expense for the years ended December 31, 2014 and 2013, respectively, and $5.3 million for the period from May 1, 2012 (Change in Control Date) to December 31, 2012. The Predecessor recorded $2.6 million of rent expense for the period from January 1, 2012 to April 30, 2012.
The Company is involved in environmental remedial investigations and actions at certain locations where the Company has been designated a potentially liable party. The Company is also from time to time involved in various other loss contingencies, including tax and legal contingencies that arise during the normal course of business. The Company accrues for a loss contingency when it is probable that a liability has been incurred and the amount of such loss can be reasonably estimated. Accruals for estimated losses from environmental remediation obligations are recognized no later than the completion of a remediation feasibility study. The accruals are adjusted as further information becomes available or circumstances change. Environmental costs have not been material at the Company’s sites. At this time, the Company believes that the results of any such contingencies, either individually or in the aggregate, will not have a materially adverse effect on the Company’s results of operations or financial condition. However, the outcome of any litigation cannot be predicted with certainty. An unfavorable resolution of one or more pending matters could have a materially adverse impact on the Company’s results of operations or financial condition in the future.
F-39
Table of Contents
MILACRON HOLDINGS CORP.
NOTES TO CONSOLIDATED FINANCIAL STATEMENTS (CONTINUED)
14. Business Segment Information
The Company’s operations are principally managed based upon the products that are produced and are comprised of three operating segments, which are the same as the Company’s reportable segments: Advanced Plastic Processing Technologies, Melt Delivery and Control Systems, and Fluid Technologies. The factors for determining the Company’s reportable segments include the manner in which management evaluates performance combined with the nature of the individual business activities. The Company evaluates the performance of its segments based on net sales and operating earnings. Operating earnings includes net sales to third parties, related cost of sales and operating expenses directly attributable to the segments. Operating earnings for each segment excludes items that are of a non-operating nature or are of a corporate or functional governance nature. Costs excluded from segment operating earnings include interest expense, income taxes and various corporate expenses such as transaction costs associated with the acquisition of certain businesses, share-based compensation expense and other separately managed general and administrative costs. The effects of intersegment transactions have been eliminated.
The Advanced Plastic Processing Technologies segment is a global leader in the manufacture, distribution and service of equipment and products used in the plastic technology and processing industry, including injection molding, blow molding and extrusion applications with its principal operations located in the U.S., Germany, Italy and India. The segment also sells specialty and peripheral equipment for plastic processing as well as replacement parts for machinery products. The Melt Delivery and Control Systems segment, which has major operations in the U.S., Canada, Germany and China, is a global leader in the manufacture of plastic delivery and precision control systems which are recurring, consumable sales for injection molding applications. The Melt Delivery and Control segment sells highly engineered, technically advanced hot runner systems, process control systems, mold bases, mold components, aftermarket parts and related technologies and services for injection molding, as well as maintenance, repair and operating supplies for plastic processing operations. The Fluid Technologies segment has major blending facilities in the U.S., The Netherlands and South Korea and is a leading manufacturer of premium coolants, lubricants, process cleaners and corrosion inhibitors that are used in a variety of metalworking industries.
The following table summarizes total assets by segment:
| December 31, |
||||||||
| 2014 |
2013 |
|||||||
| (Dollars in Millions) | ||||||||
| Advanced Plastic Processing Technologies |
$ | 460.9 | $ | 405.7 | ||||
| Melt Delivery and Control Systems |
1,112.1 | 1,140.3 | ||||||
| Fluid Technologies |
150.2 | 163.9 | ||||||
| Corporate |
67.5 | 84.3 | ||||||
|
|
|
|
|
|||||
| Total assets |
$ | 1,790.7 | $ | 1,794.2 | ||||
|
|
|
|
|
|||||
The following table summarizes long-lived assets by segment:
| December 31, |
||||||||
| 2014 |
2013 |
|||||||
| (Dollars in Millions) | ||||||||
| Advanced Plastic Processing Technologies |
$ | 98.3 | $ | 82.6 | ||||
| Melt Delivery and Control Systems |
97.6 | 99.3 | ||||||
| Fluid Technologies |
17.1 | 18.6 | ||||||
| Corporate |
3.9 | 3.1 | ||||||
|
|
|
|
|
|||||
| Total long-lived assets |
$ | 216.9 | $ | 203.6 | ||||
|
|
|
|
|
|||||
F-40
Table of Contents
MILACRON HOLDINGS CORP.
NOTES TO CONSOLIDATED FINANCIAL STATEMENTS (CONTINUED)
14. Business Segment Information (continued)
The following tables summarize segment information:
| Successor |
Predecessor |
|||||||||||||||
| Year ended |
Year ended |
Period
from |
Period from |
|||||||||||||
| (Dollars in Millions) | ||||||||||||||||
| Net sales to external customers: | ||||||||||||||||
| Advanced Plastic Processing Technologies |
$ | 675.8 | $ | 580.1 | $ | 407.2 | $ | 177.9 | ||||||||
| Melt Delivery and Control Systems |
406.7 | 320.5 | 76.1 | 38.9 | ||||||||||||
| Fluid Technologies |
128.8 | 128.2 | 88.4 | 43.9 | ||||||||||||
|
|
|
|
|
|
|
|
|
|||||||||
| Total Sales |
$ | 1,211.3 | $ | 1,028.8 | $ | 571.7 | $ | 260.7 | ||||||||
|
|
|
|
|
|
|
|
|
|||||||||
| Operating earnings: |
||||||||||||||||
| Advanced Plastic Processing Technologies |
$ | 51.9 | $ | 34.1 | $ | 16.6 | $ | 13.2 | ||||||||
| Melt Delivery and Control Systems |
57.2 | 28.8 | 3.7 | 5.0 | ||||||||||||
| Fluid Technologies |
13.5 | 12.4 | 9.6 | 6.3 | ||||||||||||
| Corporate |
(40.9 | ) | (21.0 | ) | (26.7 | ) | (10.1 | ) | ||||||||
|
|
|
|
|
|
|
|
|
|||||||||
| Operating earnings |
$ | 81.7 | $ | 54.3 | $ | 3.2 | $ | 14.4 | ||||||||
|
|
|
|
|
|
|
|
|
|||||||||
| Capital expenditures: |
||||||||||||||||
| Advanced Plastic Processing Technologies |
$ | 22.9 | $ | 15.4 | $ | 6.5 | $ | 3.8 | ||||||||
| Melt Delivery and Control Systems |
15.8 | 11.7 | 2.0 | 0.4 | ||||||||||||
| Fluid Technologies |
1.8 | 2.1 | 2.7 | 0.7 | ||||||||||||
| Corporate |
0.9 | 0.8 | 0.6 | — | ||||||||||||
|
|
|
|
|
|
|
|
|
|||||||||
| Total capital expenditures |
$ | 41.4 | $ | 30.0 | $ | 11.8 | $ | 4.9 | ||||||||
|
|
|
|
|
|
|
|
|
|||||||||
| Depreciation and amortization: |
||||||||||||||||
| Advanced Plastic Processing Technologies |
$ | 22.6 | $ | 25.4 | $ | 21.5 | $ | 1.6 | ||||||||
| Melt Delivery and Control Systems |
39.9 | 36.4 | 7.0 | 0.4 | ||||||||||||
| Fluid Technologies |
8.9 | 11.1 | 8.6 | 0.6 | ||||||||||||
| Corporate |
0.2 | 0.3 | 0.1 | — | ||||||||||||
|
|
|
|
|
|
|
|
|
|||||||||
| Total depreciation and amortization |
$ | 71.6 | $ | 73.2 | $ | 37.2 | $ | 2.6 | ||||||||
|
|
|
|
|
|
|
|
|
|||||||||
F-41
Table of Contents
MILACRON HOLDINGS CORP.
NOTES TO CONSOLIDATED FINANCIAL STATEMENTS (CONTINUED)
14. Business Segment Information (continued)
The following tables summarize net sales to external customers and long-lived assets by geographic region:
| Successor |
Predecessor |
|||||||||||||||
| Year ended |
Year ended |
Period
from |
Period from |
|||||||||||||
| (Dollars in Millions) | ||||||||||||||||
| Net sales to external customers: |
||||||||||||||||
| United States |
$ | 541.6 | $ | 456.4 | $ | 296.7 | $ | 126.0 | ||||||||
| Rest of World |
669.7 | 572.4 | 275.0 | 134.7 | ||||||||||||
|
|
|
|
|
|
|
|
|
|||||||||
| Total net sales to external customers |
$ | 1,211.3 | $ | 1,028.8 | $ | 571.7 | $ | 260.7 | ||||||||
|
|
|
|
|
|
|
|
|
|||||||||
| December 31, |
||||||||
| 2014 |
2013 |
|||||||
| (Dollars in Millions) | ||||||||
| Long-lived assets |
||||||||
| United States |
$ | 72.8 | $ | 61.9 | ||||
| Rest of World |
144.1 | 141.7 | ||||||
|
|
|
|
|
|||||
| Long-lived assets |
$ | 216.9 | $ | 203.6 | ||||
|
|
|
|
|
|||||
F-42
Table of Contents
MILACRON HOLDINGS CORP.
Schedule II—Valuation and Qualifying Accounts
| Additions |
||||||||||||||||||||
| Description |
Balance at |
Charged to |
Acquired |
Deductions |
Balance at |
|||||||||||||||
| Valuation allowance for deferred tax assets: |
||||||||||||||||||||
| Year Ended December 31, 2014 |
$ | 63.6 | 13.4 | — | (11.7 | ) | $ | 65.3 | ||||||||||||
| Year Ended December 31, 2013 |
$ | 51.3 | 11.0 | 6.2 | (4.9 | ) | $ | 63.6 | ||||||||||||
| Successor Period Ended December 31, 2012 |
$ | 37.3 | 19.8 | — | (5.8 | ) | $ | 51.3 | ||||||||||||
| Predecessor Period Ended April 30, 2012 |
$ | 98.4 | 9.9 | — | (14.0 | ) | $ | 94.3 | ||||||||||||
F-43
Table of Contents
Through and including , 2015 (the 25th day after the date of this prospectus), all dealers effecting transactions in the Common Stock, whether or not participating in this offering, may be required to deliver a prospectus. This delivery requirement is in addition to a dealer’s obligation to deliver a prospectus when acting as an underwriter and with respect to an unsold allotment or subscription.

Shares
Common Stock
P R O S P E C T U S
BofA Merrill Lynch
Barclays
J.P. Morgan
Baird
Credit Suisse
Goldman, Sachs & Co.
, 2015
Table of Contents
PART II
INFORMATION NOT REQUIRED IN PROSPECTUS
| ITEM 13. | OTHER EXPENSES OF ISSUANCE AND DISTRIBUTION. |
The expenses, other than underwriting commissions, expected to be incurred by us, or the Registrant, in connection with the issuance and distribution of the securities being registered under this Registration Statement are estimated to be as follows:
| SEC Registration Fee |
$ | 11,620 | ||
| Financial Industry Regulatory Authority, Inc. Filing Fee |
15,500 | |||
| NYSE or Nasdaq Listing Fee |
* | |||
| Printing and Engraving |
* | |||
| Legal Fees and Expenses |
* | |||
| Accounting Fees and Expenses |
* | |||
| Transfer Agent and Registrar Fees |
* | |||
| Miscellaneous |
* | |||
|
|
|
|||
| Total |
$ | * | ||
|
|
|
| * | To be completed by amendment. |
| ITEM 14. | INDEMNIFICATION OF DIRECTORS AND OFFICERS. |
The Registrant is governed by the Delaware General Corporation Law, or DGCL. Section 145 of the DGCL provides that a corporation may indemnify any person, including an officer or director, who was or is, or is threatened to be made, a party to any threatened, pending or completed legal action, suit or proceeding, whether civil, criminal, administrative or investigative (other than an action by or in the right of such corporation), by reason of the fact that such person was or is an officer, director, employee or agent of such corporation or is or was serving at the request of such corporation as a director, officer, employee or agent of another corporation or enterprise. The indemnity may include expenses (including attorneys’ fees), judgments, fines and amounts paid in settlement actually and reasonably incurred by such person in connection with such action, suit or proceeding, provided such officer, director, employee or agent acted in good faith and in a manner such person reasonably believed to be in, or not opposed to, the corporation’s best interest and, for criminal proceedings, had no reasonable cause to believe that such person’s conduct was unlawful. A Delaware corporation may indemnify any person, including an officer or director, who was or is, or is threatened to be made, a party to any threatened, pending or contemplated action or suit by or in the right of such corporation, under the same conditions, except that such indemnification is limited to expenses (including attorneys’ fees) actually and reasonably incurred by such person, and except that no indemnification is permitted without judicial approval if such person is adjudged to be liable to such corporation. Where an officer or director of a corporation is successful, on the merits or otherwise, in the defense of any action, suit or proceeding referred to above, or any claim, issue or matter therein, the corporation must indemnify that person against the expenses (including attorneys’ fees) which such officer or director actually and reasonably incurred in connection therewith.
The Registrant’s amended and restated bylaws will authorize the indemnification of its officers and directors, consistent with Section 145 of the Delaware General Corporation Law, as amended. The Registrant intends to enter into indemnification agreements with each of its directors and executive officers. These agreements, among other things, will require the Registrant to indemnify each director and executive officer to the fullest extent permitted by Delaware law, including indemnification of expenses such as attorneys’ fees, judgments, fines and settlement amounts incurred by the director or executive officer in any action or proceeding, including any action or proceeding by or in right of the Registrant, arising out of the person’s services as a director or executive officer.
II-1
Table of Contents
Reference is made to Section 102(b)(7) of the DGCL, which enables a corporation in its original certificate of incorporation or an amendment thereto to eliminate or limit the personal liability of a director for violations of the director’s fiduciary duty, except (i) for any breach of the director’s duty of loyalty to the corporation or its stockholders, (ii) for acts or omissions not in good faith or which involve intentional misconduct or a knowing violation of law, (iii) pursuant to Section 174 of the DGCL, which provides for liability of directors for unlawful payments of dividends of unlawful stock purchase or redemptions or (iv) for any transaction from which a director derived an improper personal benefit.
The Registrant expects to maintain standard policies of insurance that provide coverage (i) to its directors and officers against loss rising from claims made by reason of breach of duty or other wrongful act and (ii) to the Registrant with respect to indemnification payments that it may make to such directors and officers.
The proposed form of Underwriting Agreement to be filed as Exhibit 1.1 to this Registration Statement provides for indemnification to the Registrant’s directors and officers by the underwriters against certain liabilities.
| ITEM 15. | RECENT SALES OF UNREGISTERED SECURITIES. |
Equity Securities
In April 2012, we sold an aggregate of 188,000 shares of our common stock for $1,000 per share to affiliates of CCMP and 7,238.48 shares of our common stock for $1,000 per share to certain of our directors and members of management as part of the CCMP Acquisition.
In March 2013, we sold an aggregate of 275,000 shares of our common stock for $1,000 per share to affiliates of CCMP and 13,669.99 shares of our common stock for $1,000 per share to certain of our directors and members of management and certain directors and management of Mold-Masters as part of the acquisition of Mold-Masters.
Between April 2012 and March 2015, we sold an aggregate of 7,400.51 shares of our common stock for $1,000 per share to our directors and employees.
Between April 2012 and March 2015, we granted stock options to purchase an aggregate of 73,723.75 shares of our common stock each at an exercise price of $1,000 per share and 3,047 stock appreciation rights under our 2012 Equity Incentive Plan. Of these, 2,063.75 options were exercised and 19,296 options and 150 stock appreciation rights were forfeited upon the termination of employees.
The securities in all of the transactions listed above were issued in reliance on Section4(2) or Rule 701 promulgated under Section 3(b) of the Securities Act, as the sale of the security did not involve a public offering.
Debt Securities
We issued $275,000,000 principal amount of Senior Secured Notes Merrill Lynch, Pierce Fenner & Smith Incorporated, RBC Capital Markets, LLC, Barclays Capital Inc. and KeyBanc Capital Markets Inc. on April 20, 2012 and $465,000,000 principal amount of 7.750% Senior Notes due 2021 to Merrill Lynch, Pierce Fenner & Smith Incorporated, J.P. Morgan Securities LLC, Barclays Capital Inc., Credit Suisse Securities (USA) LLC, RBC Capital Markets, LLC, KeyBanc Capital Markets Inc., and SG Americas Securities, LLC on March 21, 2013.
Each of the above offerings of debt securities was offered and sold to qualified institutional buyers pursuant to Rule 144A under the Securities Act or to non-U.S. investors outside the United States in compliance with Regulation S of the Securities Act.
II-2
Table of Contents
| ITEM 16. | EXHIBITS AND FINANCIAL STATEMENT SCHEDULES |
| (a) | Exhibits |
| Exhibit |
Description of Exhibits | |
| 1.1* | Form of Underwriting Agreement. | |
| 3.1* | Form of Amended and Restated Certificate of Incorporation of Milacron Holdings Corp. | |
| 3.2* | Form of Amended and Restated Bylaws of Milacron Holdings Corp. | |
| 4.1* | Form of Common Stock Certificate. | |
| 4.2 | Amended and Restated Stockholders’ Agreement, dated as of July 8, 2013, by and among Milacron Holdings Corp., certain stockholders of Milacron Holdings Corp., including CCMP Capital Investors II, L.P., CCMP Capital Investors (Cayman) II, L.P., certain funds affiliated with Alberta Investment Management Corporation, Ira Boots and the other stockholder party thereto. | |
| 4.3 | Amendment No. 1, dated as of March 20, 2015 to Amended and Restated Stockholders’ Agreement, dated as of July 8, 2013, by and among Milacron Holdings Corp., certain stockholders of Milacron Holdings Corp., including CCMP Capital Investors II, L.P., CCMP Capital Investors (Cayman) II, L.P., certain funds affiliated with Alberta Investment Management Corporation and the other stockholder party thereto. | |
| 4.4* | Indenture, dated as of April 30, 2012, among Milacron LLC, Mcron Finance Corp., the guarantors from time to time party thereto and U.S. Bank National Association, as trustee and collateral agent. | |
| 4.5* | Indenture, dated as of March 28, 2013, among Milacron LLC, Mcron Finance Corp., the guarantors from time to time party thereto and U.S. Bank National Association, as trustee. | |
| 5.1* | Opinion of Weil, Gotshal & Manges L.L.P. | |
| 10.1* | Term Loan Agreement, dated as of March 28, 2013, by and among Milacron Holdings Inc., Milacron LLC, the guarantors party thereto, the lenders party thereto and JP Morgan Chase Bank, N.A., as administrative agent. | |
| 10.2* | Second Amended and Restated Credit Agreement, dated as of October 17, 2014, by and among Milacron Holdings Inc., Milacron LLC, Mold-Masters (2007) Limited, the other subsidiaries of Milacron Holdings Inc. and Milacron LLC party thereto, the lenders party thereto, Barclays Bank PLC, as documentation agent, Keybank National Association and Société Générale, as amendment documentation agents and Bank of America, NA, as administrative agent and collateral agent for the lenders. | |
| 10.3* | Security Agreement, dated as of April 30, 2012, by among Milacron Holdings Inc., Milacron LLC, Mcron Finance Corp., the other grantors party thereto and U.S. Bank National Association, as notes collateral agent for the secured parties. | |
| 10.4* | Security Agreement, dated as of April 30, 2012, by and among Milacron Holdings Inc., Milacron LLC, Mcron Finance Sub LLC, the other grantors party thereto and Bank of America, N.A, as collateral agent for the secured parties. | |
| 10.5 | Milacron Holdings Corp. Amended and Restated 2012 Equity Incentive Plan. | |
| 10.6* | Form of 2015 Equity Incentive Plan. | |
| 10.7* | Employment Agreement, dated as of October 4, 2014, between Milacron Holdings Inc. and Thomas Goeke. | |
| 10.8* | Employment Agreement, dated as of May 1, 2014, between Milacron Holdings Inc. and John Gallagher III. | |
II-3
Table of Contents
| Exhibit |
Description of Exhibits | |
| 10.9* | Employment Agreement, dated as of March 20, 2013, between Milacron UK Limited and Ron Krisanda. | |
| 10.10* | Offer Letter to Bruce Chalmers, dated October 13, 2013. | |
| 10.11* | Form of Severance Agreement, between Milacron Holdings Inc. and Bruce Chalmers. | |
| 10.12* | Amended and Restated Employment Agreement, dated as of April 30, 2012, between Milacron Holdings Inc. and John Francy. | |
| 10.13* | Separation Agreement, dated as of December 11, 2014, between Milacron Holdings Inc. and John Francy. | |
| 10.14* | Form of Indemnification Agreement between Milacron Holdings Corp. and each of its officers and directors. | |
| 21.1 | List of Subsidiaries of Milacron Holdings Corp. | |
| 23.1 | Consent of Ernst & Young, LLP, Independent Registered Public Accounting Firm, relating to Milacron Holdings Corp. | |
| 23.2* | Consent of Weil, Gotshal & Manges LLP (included in the opinion filed as Exhibit 5.1 hereto). | |
| 24.1 | Power of Attorney (included on signature page to the Registration Statement). | |
| * | To be filed by amendment. |
| (b) | Financial Statement Schedules |
Schedule II—Valuation and Qualifying Accounts.
| ITEM 17. | UNDERTAKINGS. |
The undersigned registrant hereby undertakes to provide to the underwriters at the closing specified in the underwriting agreements, certificates in such denominations and registered in such names as required by the underwriters to permit prompt delivery to each purchaser.
Insofar as indemnification for liabilities arising under the Securities Act may be permitted to directors, officers and controlling persons of the registrant pursuant to the provisions referenced in Item 14 of this registration statement, or otherwise, the registrant has been advised that in the opinion of the SEC such indemnification is against public policy as expressed in the Securities Act and is, therefore, unenforceable. In the event that a claim for indemnification against such liabilities (other than the payment by the registrant of expenses incurred or paid by a director, officer, or controlling person of the registrant in the successful defense of any action, suit or proceeding) is asserted by such director, officer or controlling person in connection with the securities being registered hereunder, the registrant will, unless in the opinion of its counsel the matter has been settled by controlling precedent, submit to a court of appropriate jurisdiction the question of whether such indemnification by it is against public policy as expressed in the Securities Act and will be governed by the final adjudication of such issue.
The undersigned registrant hereby undertakes that:
| (1) | For purposes of determining any liability under the Securities Act, the information omitted from the form of prospectus filed as part of this registration statement in reliance upon Rule 430A and |
II-4
Table of Contents
| contained in a form of prospectus filed by the registrant pursuant to Rule 424(b)(1) or (4) or 497(h) under the Securities Act shall be deemed to be part of this registration statement as of the time it was declared effective. |
| (2) | For the purpose of determining any liability under the Securities Act, each post-effective amendment that contains a form of prospectus shall be deemed to be a new registration statement relating to the securities offered therein, and the offering of such securities at that time shall be deemed to be the initial bona fide offering thereof. |
II-5
Table of Contents
SIGNATURES
Pursuant to the requirements of the Securities Act of 1933, the registrant has duly caused this registration statement to be signed on its behalf by the undersigned, thereunto duly authorized, in the City of Cincinnati, State of Ohio, on April 3, 2015.
| Milacron Holdings Corp. | ||
| By: |
/s/ Bruce Chalmers | |
| Name: |
Bruce Chalmers |
| Title: |
Chief Financial Officer |
POWER OF ATTORNEY
KNOW ALL MEN BY THESE PRESENTS, that each of the undersigned constitutes and appoints each of Tom Goeke, Bruce Chalmers and Hugh C. O’Donnell or any of them, each acting alone, his true and lawful attorney-in-fact and agent, with full power of substitution and resubstitution, for such person and in his name, place and stead, in any and all capacities, to sign this Registration Statement on Form S-1 (including all pre-effective and post-effective amendments and registration statements filed pursuant to Rule 462(b) under the Securities Act of 1933), and to file the same, with all exhibits thereto, and other documents in connection therewith, with the SEC, granting unto said attorneys-in-fact and agents, each acting alone, full power and authority to do and perform each and every act and thing requisite and necessary to be done in and about the premises, as fully to all intents and purposes as he might or could do in person, hereby ratifying and confirming that any such attorney-in-fact and agent, or his substitute or substitutes, may lawfully do or cause to be done by virtue hereof.
Pursuant to the requirements of the Securities Act of 1933, this registration statement has been signed by the following persons in the capacities indicated on April 3, 2015.
| Signature |
Title | |
| /s/ Tom Goeke Tom Goeke |
Chief Executive Officer and Director (Principal Executive Officer) | |
| /s/ Bruce Chalmers Bruce Chalmers |
Chief Financial Officer (Principal Financial and Accounting Officer) | |
| /s/ Ira Boots Ira Boots |
Director | |
| /s/ Greg Brenneman Greg Brenneman |
Director | |
| /s/ Waters Davis Waters Davis |
Director | |
| /s/ Jim Gentilcore Jim Gentilcore |
Director | |
| /s/ Mark McFadden Mark McFadden |
Director | |
| /s/ Timothy Walsh Timothy Walsh |
Director | |
Table of Contents
| Signature |
Title | |
| /s/ Jim Kratochvil Jim Kratochvil |
Director | |
| /s/ James Ridout James Ridout |
Director | |
| /s/ John Gallagher John Gallagher |
Director | |
S-2
Table of Contents
EXHIBIT INDEX
| Exhibit |
Description of Exhibits | |
| 1.1* | Form of Underwriting Agreement. | |
| 3.1* | Form of Amended and Restated Certificate of Incorporation of Milacron Holdings Corp. | |
| 3.2* | Form of Amended and Restated Bylaws of Milacron Holdings Corp. | |
| 4.1* | Form of Common Stock Certificate. | |
| 4.2 | Amended and Restated Stockholders’ Agreement, dated as of July 8, 2013, by and among Milacron Holdings Corp., certain stockholders of Milacron Holdings Corp., including CCMP Capital Investors II, L.P., CCMP Capital Investors (Cayman) II, L.P., certain funds affiliated with Alberta Investment Management Corporation, Ira Boots and the other stockholder party thereto. | |
| 4.3 | Amendment No. 1, dated as of March 20, 2015 to Amended and Restated Stockholders’ Agreement, dated as of July 8, 2013, by and among Milacron Holdings Corp., certain stockholders of Milacron Holdings Corp., including CCMP Capital Investors II, L.P., CCMP Capital Investors (Cayman) II, L.P., certain funds affiliated with Alberta Investment Management Corporation and the other stockholder party thereto. | |
| 4.4* | Indenture, dated as of April 30, 2012, among Milacron LLC, Mcron Finance Corp., the guarantors from time to time party thereto and U.S. Bank National Association, as trustee and collateral agent. | |
| 4.5* | Indenture, dated as of March 28, 2013, among Milacron LLC, Mcron Finance Corp., the guarantors from time to time party thereto and U.S. Bank National Association, as trustee. | |
| 5.1* | Opinion of Weil, Gotshal & Manges L.L.P. | |
| 10.1* | Term Loan Agreement, dated as of March 28, 2013, by and among Milacron Holdings Inc., Milacron LLC, the guarantors party thereto, the lenders party thereto and JP Morgan Chase Bank, N.A., as administrative agent. | |
| 10.2* | Second Amended and Restated Credit Agreement, dated as of October 17, 2014, by and among Milacron Holdings Inc., Milacron LLC, Mold-Masters (2007) Limited, the other subsidiaries of Milacron Holdings Inc. and Milacron LLC party thereto, the lenders party thereto, Barclays Bank PLC, as documentation agent, Keybank National Association and Société Générale, as amendment documentation agents and Bank of America, NA, as administrative agent and collateral agent for the lenders. | |
| 10.3* | Security Agreement, dated as of April 30, 2012, by among Milacron Holdings Inc., Milacron LLC, Mcron Finance Corp., the other grantors party thereto and U.S. Bank National Association, as notes collateral agent for the secured parties. | |
| 10.4* | Security Agreement, dated as of April 30, 2012, by and among Milacron Holdings Inc., Milacron LLC, Mcron Finance Sub LLC, the other grantors party thereto and Bank of America, N.A, as collateral agent for the secured parties. | |
| 10.5 | Milacron Holdings Corp. Amended and Restated 2012 Equity Incentive Plan. | |
| 10.6* | Form of 2015 Equity Incentive Plan. | |
| 10.7* | Employment Agreement, dated as of October 4, 2014, between Milacron Holdings Inc. and Thomas Goeke. | |
| 10.8* | Employment Agreement, dated as of May 1, 2014, between Milacron Holdings Inc. and John Gallagher III. | |
| 10.9* | Employment Agreement, dated as of March 20, 2013, between Milacron UK Limited and Ron Krisanda. | |
Table of Contents
| Exhibit |
Description of Exhibits | |
| 10.10* | Offer Letter to Bruce Chalmers, dated October 13, 2013. | |
| 10.11* | Form of Severance Agreement, between Milacron Holdings Inc. and Bruce Chalmers. | |
| 10.12* | Amended and Restated Employment Agreement, dated as of April 30, 2012, between Milacron Holdings Inc. and John Francy. | |
| 10.13* | Separation Agreement, dated as of December 11, 2014, between Milacron Holdings Inc. and John Francy. | |
| 10.14* | Form of Indemnification Agreement between Milacron Holdings Corp. and each of its officers and directors. | |
| 21.1 | List of Subsidiaries of Milacron Holdings Corp. | |
| 23.1 | Consent of Ernst & Young, LLP, Independent Registered Public Accounting Firm, relating to Milacron Holdings Corp. | |
| 23.2* | Consent of Weil, Gotshal & Manges LLP (included in the opinion filed as Exhibit 5.1 hereto). | |
| 24.1 | Power of Attorney (included on signature page to the Registration Statement). | |
| * | To be filed by amendment. |