Attached files
| file | filename |
|---|---|
| EX-21 - EXHIBIT 21 - STAGE STORES INC | ssi-2014ex21.htm |
| EX-24.1 - EXHIBIT 24.1 - STAGE STORES INC | ssi-2014ex24_1.htm |
| EX-31.2 - EXHIBIT 31.2 - STAGE STORES INC | ssi-2014ex31_2.htm |
| EX-31.1 - EXHIBIT 31.1 - STAGE STORES INC | ssi-2014ex31_1.htm |
| EX-24.2 - EXHIBIT 24.2 - STAGE STORES INC | ssi-2014ex24_2.htm |
| EXCEL - IDEA: XBRL DOCUMENT - STAGE STORES INC | Financial_Report.xls |
| EX-23 - EXHIBIT 23 - STAGE STORES INC | ssi-2014ex23.htm |
| EX-32 - EXHIBIT 32 - STAGE STORES INC | ssi-2014ex32.htm |
UNITED STATES
SECURITIES AND EXCHANGE COMMISSION
Washington, D.C. 20549
_______________
FORM 10-K
(Mark One)
þ | ANNUAL REPORT PURSUANT TO SECTION 13 OR 15(d) OF THE SECURITIES EXCHANGE ACT OF 1934 |
For the fiscal year ended January 31, 2015
or
¨ | TRANSITION REPORT PURSUANT TO SECTION 13 OR 15(d) OF THE SECURITIES EXCHANGE ACT OF 1934 |
For the transition period from ______ to ______
Commission File No. 1-14035
Stage Stores, Inc.
(Exact Name of Registrant as Specified in Its Charter)
NEVADA (State or Other Jurisdiction of Incorporation or Organization) | 91-1826900 (I.R.S. Employer Identification No.) |
10201 MAIN STREET, HOUSTON, TEXAS (Address of Principal Executive Offices) | 77025 (Zip Code) |
Registrant's telephone number, including area code: (800) 579-2302
Securities registered pursuant to Section 12(b) of the Act:
Title of each class Common Stock ($0.01 par value) | Name of each exchange on which registered New York Stock Exchange |
Securities registered pursuant to Section 12(g) of the Act: None
Indicate by check mark if the registrant is a well-known seasoned issuer, as defined in Rule 405 of the Securities Act.
Yes o No þ
Indicate by check mark if the registrant is not required to file reports pursuant to Section 13 or Section 15(d) of the Act.
Yes o No þ
Indicate by check mark whether the registrant (1) has filed all reports required to be filed by Section 13 or 15(d) of the Securities Exchange Act of 1934 during the preceding 12 months (or for such shorter period that the registrant was required to file such reports), and (2) has been subject to such filing requirements for the past 90 days. Yes þ No o
Indicate by check mark whether the registrant has submitted electronically and posted on its corporate Web site, if any, every Interactive Data File required to be submitted and posted pursuant to Rule 405 of Regulation S-T (§ 232.405 of this chapter) during the preceding 12 months (or for such shorter period that the registrant was required to submit and post such files).
Yes þ No o
Indicate by check mark if disclosure of delinquent filers pursuant to Item 405 of Regulation S-K (§ 232.405 of this chapter) is not contained herein, and will not be contained, to the best of registrant's knowledge, in definitive proxy or information statements incorporated by reference in Part III of this Form 10-K or any amendment to this Form 10-K. Yes þ No o
Indicate by check mark whether the registrant is a large accelerated filer, an accelerated filer, a non-accelerated filer, or a smaller reporting company. See definition of "large accelerated filer," "accelerated filer" and "smaller reporting company" in Rule 12b-2 of the Exchange Act.
Large accelerated filer o Accelerated filer þ Non-accelerated filer o Smaller reporting company o
Indicate by check mark whether the registrant is a shell company (as defined in Rule 12b-2 of the Act). Yes o No þ
As of August 1, 2014 (the last business day of the registrant's most recently completed second quarter), the aggregate market value of the voting and non-voting common stock of the registrant held by non-affiliates of the registrant was $505,510,489 (based upon the closing price of the registrant's common stock as reported by the New York Stock Exchange on August 1, 2014).
As of March 24, 2015, there were 31,659,842 shares of the registrant's common stock outstanding.
DOCUMENTS INCORPORATED BY REFERENCE
Portions of the definitive proxy statement relating to the registrant's Annual Meeting of Shareholders to be held on June 11, 2015, which will be filed within 120 days of the end of the registrant's fiscal year ended January 31, 2015 ("Proxy Statement"), are incorporated by reference into Part III of this Form 10-K to the extent described therein.
2
TABLE OF CONTENTS | ||
Page | ||
3
References to a particular year are to Stage Stores, Inc.'s fiscal year, which is the 52- or 53-week period ending on the Saturday closest to January 31st of the following calendar year. For example, a reference to "2012" is a reference to the fiscal year ended February 2, 2013, "2013" is a reference to the fiscal year ended February 1, 2014 and "2014" is a reference to the fiscal year ended January 31, 2015. 2013 and 2014 consisted of 52 weeks, while 2012 consisted of 53 weeks.
PART I
ITEM 1. BUSINESS
Our Business
Stage Stores, Inc. and its subsidiary ("we," "us" or "our") operate specialty department stores primarily in small and mid-sized towns and communities. We provide customers a welcoming and comfortable shopping experience in our stores and direct-to-consumer business. Our merchandise assortment is a well-edited selection of moderately priced brand name and private label apparel, accessories, cosmetics, footwear and home goods. As of January 31, 2015, we operated 854 specialty department stores in 40 states under the BEALLS, GOODY'S, PALAIS ROYAL, PEEBLES and STAGE nameplates and a direct-to-consumer business.
On March 7, 2014, we divested Steele's, an off-price concept that we launched in November 2011, in order to focus solely on our core specialty department store business. Accordingly, the results of operations of Steele's and loss on the sale are reflected in discontinued operations for all periods presented.
Our History
Stage Stores, Inc. was formed in 1988 when the management of Palais Royal, together with several venture capital firms, acquired the family-owned Bealls and Palais Royal chains, both of which were originally founded in the 1920s. At the time of the acquisition, Palais Royal operated primarily larger stores, located in and around the Houston metropolitan area, while Bealls operated primarily smaller stores, principally located in rural Texas towns.
Our Market and Target Customer
Our distinct store environment and well-edited offerings of name brand and trend-right assortments attract a wide demographic. Our merchandise combination of apparel, accessories, cosmetics, footwear and home allows us participate in a number of market segments. While our broad assortment appeals to a wide array of people of varying ages and diverse backgrounds, our primary target customers are style and value savvy women over the age of 35 who are married, employed full time and have an average household income of $55,000. Our customer research reveals our target customer loves to shop for fun, and enjoys a shopping experience that brings her style, value and inspiration where she lives.
Competition
The retail industry is highly competitive and we compete in our stores and in our e-commerce business. However, as a result of our small and mid-sized market focus, our stores generally face less competition for our brand name merchandise since branded merchandise is typically available only in regional malls, which are often located more than 30 miles away from our nearest store. Due to minimal branded merchandise overlap, we generally do not directly compete for branded merchandise sales with national discounters such as Wal-Mart. In small and mid-sized markets where we do compete for brand name merchandise sales, competition generally comes from local retailers, small regional chains and, to a lesser extent, national department stores. In the more competitive markets where we compete against other national department store chains, we offer consumers a high level of customer service and the advantage of generally being in neighborhood locations with convenient parking and easy access. We believe we have a competitive advantage over local retailers and small regional chains due to our (i) broader selection of brand name merchandise, (ii) distinctive retail concept, (iii) economies of scale, (iv) strong vendor relationships and (v) private label credit card program. We also believe we have a competitive advantage in small and mid-sized markets over national department stores due to our experience with smaller markets.
4
Our Competitive Strengths
We believe the following strengths differentiate us from our competitors and are key drivers of our success:
Unique Real Estate Positioning and Powerful Store Economics. Our stores are predominantly located in small towns and communities with populations of less than 150,000. We predominantly lease our locations and are generally secondary users of space, allowing us to secure advantageous occupancy terms. Our average store is 18,000 square feet, which is a small-format footprint for a specialty department store concept. We believe this creates an opportunity to offer a selection that feels comprehensive and curated in an inviting environment.
Trend-Right, Brand Name Merchandise Delivered at a Compelling Value. Our stores and direct-to-consumer business carry a broad selection of trend-right, brand name apparel, accessories, cosmetics, footwear and home goods for the entire family. Our buyers identify and purchase nationally recognized, quality brands and trend-right styles our customers find compelling from respected brands such as Levi Strauss, Nike, Calvin Klein, Chaps, Izod, Dockers, Carters, Jockey, Estee Lauder, Clinique, Nautica, Skechers and DKNY. Our value proposition for moderately priced, brand name merchandise includes routine discount and promotional offers. We believe our use of discount and promotional offers generates customer excitement and drives loyalty and repeat shopping.
Experienced Management Team with a Disciplined Operating Philosophy. Our senior management team has extensive experience across a wide range of disciplines in the retail industry, including merchandising, marketing, human resources, information systems and finance. Our management team has built a solid operating foundation based on sound retail principles and is focused on taking care of our customers to provide great merchandise and a great experience.
Stores
Store Openings and Closures. During 2014, we opened 18 new stores and closed 12 stores. In 2015, we plan to slow our new store growth as we embark on a multi-year initiative to increase investments in our direct-to-consumer business and existing stores. We anticipate opening 2 new stores in 2015. We continually review the profitability of each store and look to close a store if the expected store performance does not meet our financial hurdle rates. We expect to close 10-20 stores, where lease terms permit, in 2015.
Expansion, Relocation and Remodeling. During 2014, we expanded 13 stores and relocated 7 stores. In 2015, we plan to increase our investment in the expansion, relocation and remodeling of our existing stores. We believe that remodeling improves the store environment and helps us create an inviting and differentiated shopping experience. Our remodeling projects are designed to create a bright, fun and comfortable store experience and may include upgrades ranging from improving lighting, flooring, paint, fixtures, fitting rooms, visual merchandising and signage, to more extensive expansion projects. Relocations are intended to improve the store's location and to help it capitalize on incremental sales productivity potential.
In 2014, we undertook an initiative to measure selling square footage for each store. Historically, selling square footage for our stores was based on a percentage of gross square footage. The changes as a result of that initiative are included in the beginning balance in the following tables.
Store count and selling square footage by nameplate are as follows:
Number of Stores | Selling Square Footage (in thousands) | ||||||||||||||||
February 1, 2014 | 2014 Activity Net Changes | January 31, 2015 | February 1, 2014 | 2014 Activity Net Changes | January 31, 2015 | ||||||||||||
Bealls | 215 | 4 | 219 | 4,332 | 71 | 4,403 | |||||||||||
Goody's | 268 | (2 | ) | 266 | 4,238 | (13 | ) | 4,225 | |||||||||
Palais Royal | 53 | — | 53 | 1,135 | — | 1,135 | |||||||||||
Peebles | 191 | 6 | 197 | 3,497 | 67 | 3,564 | |||||||||||
Stage | 121 | (2 | ) | 119 | 2,111 | (29 | ) | 2,082 | |||||||||
848 | 6 | 854 | 15,313 | 96 | 15,409 | ||||||||||||
5
Utilizing a ten-mile radius from each store, approximately 58% of our stores are located in communities with populations below 50,000 people, while an additional 26% of our stores are located in communities with populations between 50,000 and 150,000 people. The remaining 16% of our stores are located in higher-density markets with populations greater than 150,000, such as Houston, San Antonio and Lubbock, Texas. The store count and selling square footage by market area population are as follows:
Number of Stores | Selling Square Footage (in thousands) | ||||||||||||||||
February 1, 2014 | 2014 Activity Net Changes | January 31, 2015 | February 1, 2014 | 2014 Activity Net Changes | January 31, 2015 | ||||||||||||
Less than 50,000 | 491 | 5 | 496 | 7,793 | 100 | 7,893 | |||||||||||
50,000 to 150,000 | 217 | 3 | 220 | 4,303 | 51 | 4,354 | |||||||||||
Greater than 150,000 | 140 | (2 | ) | 138 | 3,217 | (55 | ) | 3,162 | |||||||||
848 | 6 | 854 | 15,313 | 96 | 15,409 | ||||||||||||
Direct-to-Consumer
Our direct-to-consumer business consists of our e-commerce website and Send program. Since launching our e-commerce website in 2010, we have made growing our direct-to-consumer business a high priority. Our e-commerce
website features a broader assortment of the merchandise categories found in our stores, as well as additional product offerings. Entering the 2013 holiday season, we replatformed our e-commerce website which improved functionality and enhanced the customer experience. Our in-store Send program allows customers to have merchandise shipped directly to their homes from another store if the preferred size or color is not available in their local store. Our direct-to-consumer business enables us to reach customers outside of store operating hours, acquire customers in all states and further build our brand. We believe there is significant potential to expand our direct-to-consumer business over time.
Merchandising
We offer a well-edited selection of moderately priced, branded merchandise within distinct merchandise categories, such as women's, men's and children's apparel, as well as accessories, cosmetics, footwear and home goods. Our direct-to-consumer business allows us to extend the breadth of our assortments and offer additional products.
The following table sets forth the distribution of net sales among our various merchandise categories:
Fiscal Year | |||||||||
Department | 2014 | 2013 | 2012 | ||||||
Women's (a) | 38 | % | 38 | % | 39 | % | |||
Men's (b) | 17 | 17 | 17 | ||||||
Children's | 11 | 11 | 12 | ||||||
Footwear | 13 | 13 | 13 | ||||||
Accessories | 8 | 8 | 8 | ||||||
Cosmetics/Fragrances | 9 | 9 | 8 | ||||||
Home/Gifts/Other | 4 | 4 | 3 | ||||||
100 | % | 100 | % | 100 | % | ||||
(a) Women's includes misses sportswear, junior sportswear, dresses, special sizes, intimates, outerwear and swim.
(b) Men's includes men's and young men's.
6
Merchandise selections reflect current styles and trends and merchandise mix may also vary from store to store to accommodate differing demographic, regional and climatic characteristics. Our buying and planning team use technology tools such as size pack optimization and store level markdown optimization to localize assortments.
Approximately 87% of sales consist of nationally recognized brands such as Levi Strauss, Nike, Calvin Klein, Chaps, Izod, Dockers, Carters, Nine West, Estee Lauder, Clinique, Nautica, Skechers and DKNY, while the remaining 13% of sales consist of our private label merchandise.
Our private label portfolio brands are developed and sourced through agreements with third party vendors. We believe our private label and exclusive brands offer a compelling mix of style, quality and excellent value. We continue to refine the positioning of our private brands and we see them as an avenue for growth.
We are also focused on growing our cosmetics business. In 2014, we installed Estee Lauder counters in 75 stores and Clinique counters in 76 stores.
Merchandise Distribution
We currently distribute all merchandise to our stores through distribution centers located in Jacksonville, Texas, South Hill, Virginia and Jeffersonville, Ohio. Incoming merchandise received at the distribution centers is inspected for quality control purposes.
Integrated merchandising and warehouse management systems support all corporate and distribution center locations. All of our distribution centers are equipped with modern sortation equipment which enables us to meet specific store merchandise assortment needs. The configurations of the distribution centers permit scheduled shipments to stores, with the majority of stores receiving merchandise within three days of shipment from the distribution centers. We utilize third party contract carriers to deliver merchandise from the distribution centers to our stores.
Direct-to-consumer orders are filled both from our distribution centers and our stores.
Marketing
We use a multi-media advertising approach, including broadcast media, digital media, mobile media, local newspaper inserts and direct mail. In addition, we leverage our private label credit card to create strong customer loyalty through continuous one-on-one communication.
Our marketing strategy is designed to establish and reward brand loyalty and support each store's position as the destination for desirable styles and nationally recognized brands at an attractive value in a comfortable and welcoming environment. Our marketing strategy leverages (i) consumer insight from brand and customer research, (ii) identified customer purchase history to plan and execute targeted omni-channel marketing to our customers and (iii) emerging technology and trends in retail marketing.
Maintaining a connection to the communities we serve is important to us and we have started a locally based giving campaign called 30 Days of Giving under our Community Counts program. In 2014, through our Community Counts program, we helped raise over $3.0 million for the communities we serve.
Brand image is an important part of our marketing program. Our principal trademarks, including the BEALLS, GOODY'S, PALAIS ROYAL, PEEBLES, and STAGE trademarks, have been registered with the U.S. Patent and Trademark Office. We have also registered trademarks used in connection with our private label merchandise. We regard our trademarks and their protection as important to our success.
7
Private Label Credit Card Program. We consider our private label credit card program to be a vital component of our business because it (i) enhances customer loyalty, (ii) allows us to identify and regularly contact our best customers and (iii) creates a comprehensive database that enables us to implement targeted and personalized marketing messages. Our Premier Rewards customer loyalty program provides significantly enhanced benefits and incentives for our private label credit card holders. Customers earn reward certificates redeemable for merchandise based on purchases, free shipping on direct-to-consumer purchases, special promotional discounts and invitations to private sales. The percentage of sales that are paid for using the private label credit card is our "penetration rate." The penetration rate for our private label credit card was 40% in 2014, an increase of more than 400 basis points compared to the prior year. In 2013 and 2012, the penetration rate was 36% and 33%, respectively.
Customer Service
We strive to provide exceptional customer service through conveniently located stores staffed with well-trained and motivated sales associates. In order to ensure consistency of execution, each sales associate is evaluated based on the attainment of specific customer service standards, such as offering a friendly greeting, providing prompt assistance, helping open private label credit card accounts, thanking customers and inviting return visits. We also conduct customer satisfaction surveys to measure and monitor attainment of customer service expectations. The results of customer surveys are used to provide feedback to reinforce and improve customer service. To further reinforce our focus on customer service, we have various programs in place to recognize our sales associates for providing outstanding customer service.
Information Systems
We support our business by using multiple, highly integrated systems in areas such as merchandising, store operations, distribution, sales promotion, personnel management, store design and accounting. Our core merchandising systems assist in planning, ordering, allocating and replenishing merchandise assortments for each store, based on specific characteristics and recent sales trends. Our price change management system allows us to identify and mark down slow moving merchandise. Our replenishment/fulfillment system allows us to maintain planned levels of in-stock positions in basic items such as jeans and underwear. In addition, a fully integrated warehouse management system is in place in all three distribution centers.
We have a markdown optimization tool, which is focused on pricing items on a style-by-style basis at the appropriate price, based on inventory levels and sales history, in order to maximize revenue and profitability. We continue to expand the utilization and effectiveness of our merchandise planning system in order to maximize the generation of sales and gross margin. In 2014, we implemented markdown optimization at the store level and continued to make progress on size pack optimization to better tailor assortments at the store level.
We utilize a point-of-sale ("POS") platform with bar code scanning, electronic credit authorization, instant credit, returns database and gift card processing in all our stores. The POS platform allows us to capture customer specific sales data for use in our merchandising, marketing and loss prevention systems, while quickly servicing our customers. The POS platform also manages coupon and deal-based pricing, which streamlines the checkout process and improves store associate adherence to promotional markdown policies.
Our Employees
At January 31, 2015, we employed approximately 14,300 hourly and salaried employees. Employee levels will vary during the year as we traditionally hire additional sales associates and increase the hours of part-time sales associates during peak seasonal selling periods. We consider our relationship with our employees to be good, and there are no collective bargaining agreements in effect with respect to any of our employees.
Seasonality
Our business is seasonal and sales are traditionally lower during the first three quarters of the fiscal year (February through October) and higher during the last quarter of the fiscal year (November through January). The fourth quarter usually accounts for approximately 30% of our annual sales, with each of the other quarters accounting for approximately 22% to 24%. Working capital requirements fluctuate during the year as well and generally reach their highest levels during the third and fourth quarters.
8
Available Information
We make available, free of charge, through the "Investor Relations" section of our website (www.stagestoresinc.com)
under the "SEC Filings" caption, our Annual Reports on Form 10-K, Quarterly Reports on Form 10-Q, Current Reports on Form 8-K and amendments to those reports filed or furnished pursuant to Section 13 or 15(d) of the Securities Exchange Act of 1934, as amended ("Exchange Act") as soon as reasonably practicable after we file such material with, or furnish it to the Securities and Exchange Commission ("SEC"). In this Form 10-K, we incorporate by reference certain information from parts of our Proxy Statement for our 2015 Annual Meeting of Shareholders ("Proxy Statement").
Also in the "Investor Relations" section of our website (www.stagestoresinc.com) under the "Corporate Governance" and "SEC Filings" captions, the following information relating to our corporate governance may be found: Corporate Governance Guidelines; charters of our Board of Directors' Audit, Compensation, and Corporate Governance and Nominating Committees; Code of Ethics and Business Conduct; Code of Ethics for Senior Officers; Chief Executive Officer and Chief Financial Officer certifications related to our SEC filings; and transactions in our securities by our directors and executive officers. The Code of Ethics and Business Conduct applies to all of our directors and employees. The Code of Ethics for Senior Officers applies to our Chief Executive Officer, Chief Financial Officer, Controller and other individuals performing similar functions, and contains provisions specifically applicable to the individuals serving in those positions. We intend to post amendments to and waivers from, if any, our Code of Ethics and Business Conduct (to the extent applicable to our directors and executive officers) and our Code of Ethics for Senior Officers in the "Investor Relations" section of our website (www.stagestoresinc.com) under the "Corporate Governance" caption. We will provide any of the foregoing information without charge upon written request to our Secretary. The contents of our websites are not part of this report.
ITEM 1A. RISK FACTORS
Cautionary Statement Concerning Forward-Looking Statements for Purposes of the Safe Harbor Provisions of the Private Securities Litigation Reform Act of 1995
The Private Securities Litigation Reform Act of 1995 ("Act") provides a safe harbor for forward-looking statements to encourage companies to provide prospective information, so long as those statements are identified as forward-looking and are accompanied by meaningful cautionary statements identifying important factors that may cause actual results to differ materially from those discussed in the statements. We wish to take advantage of the "safe harbor" provisions of the Act.
Certain statements in this report are forward-looking statements within the meaning of the Act, and such statements are intended to qualify for the protection of the safe harbor provided by the Act. The words "anticipate," "estimate," "expect," "objective," "goal," "project," "intend," "plan," "believe," "will," "should," "may," "target," "forecast," "guidance," "outlook," and similar expressions generally identify forward-looking statements. Similarly, descriptions of our objectives, strategies, plans, goals or targets are also forward-looking statements. Forward-looking statements relate to the expectations of management as to future occurrences and trends, including statements expressing optimism or pessimism about future operating results or events and projected sales, earnings, capital expenditures and business strategy.
Forward-looking statements are based upon a number of assumptions and factors concerning future conditions that may ultimately prove to be inaccurate and may cause actual results to differ materially from those in the forward-looking statements. Forward-looking statements that are made herein and in other reports and releases are not guarantees of future performance and actual results may differ materially from those discussed in such forward-looking statements as a result of various factors. These factors include, but are not limited to, the ability for us to maintain normal trade terms with vendors, the ability for us to comply with the various covenant requirements contained in the Revolving Credit Facility agreement (as defined in "Liquidity and Capital Resources"), the demand for apparel, and other factors. The demand for apparel and sales volume can be affected by significant changes in economic conditions, including an economic downturn, employment levels in our markets, consumer confidence, energy and gasoline prices and other factors influencing discretionary consumer spending. Other factors affecting the demand for apparel and sales volume include unusual weather patterns, an increase in the level of competition in our market areas, competitors' marketing strategies, changes in fashion trends, changes in the average cost of merchandise purchased for resale, availability of product on normal payment terms and the failure to achieve the expected results of our merchandising and marketing plans as well as our store opening or relocation plans. Additional assumptions, factors and risks concerning future conditions are discussed in the Risk Factors section of this Form 10-K, and may be discussed from time to time in our other filings with the SEC, including Quarterly Reports on Form 10-Q and Current Reports on Form 8-K. Most of these factors are difficult to predict accurately and are generally beyond our control.
9
Forward-looking statements are and will be based upon management’s then-current views and assumptions regarding future events and operating performance, and are applicable only as of the dates of such statements. Although management believes the expectations expressed in forward-looking statements are based on reasonable assumptions within the bounds of our knowledge, forward-looking statements, by their nature, involve risks, uncertainties and other factors, any one or a combination of which may materially affect our business, financial condition, results of operations or liquidity.
Readers should carefully review this Form 10-K in its entirety, including, but not limited to our financial statements and the accompanying notes, and the risks and uncertainties described in this Item 1A. Readers should consider these risks, uncertainties and other factors carefully in evaluating forward-looking statements. Readers are cautioned not to place undue reliance on forward-looking statements, which speak only as of the date they are made. Forward-looking statements contained in this Form 10-K are made as of the date of this Form 10-K. We undertake no obligation to publicly update forward-looking statements whether as a result of new information, future events or otherwise. Readers are advised, however, to consult any further disclosures we make on related subjects in our public announcements and SEC filings.
Our ability to achieve the results contemplated by forward-looking statements is subject to a number of factors, any one, or a combination, of which may materially affect our business, financial condition, results of operations, or liquidity. Described below are certain risk factors that management believes are applicable to our business and the industry in which we operate. There may also be additional risks that are presently immaterial or unknown.
If we are unable to successfully execute our strategies, our operating performance may be significantly impacted. There is a risk that we will be unable to meet or exceed our operating performance targets and goals in the future if our strategies and initiatives are unsuccessful. Our ability to develop and execute our strategic plan and to execute the business activities associated with our strategic and operating plans, may impact our ability to meet our operating performance targets.
Our failure to anticipate and respond to changing customer preferences in a timely manner may adversely affect our operations. Our success depends, in part, upon our ability to anticipate and respond to changing consumer preferences and fashion trends in a timely manner. We attempt to stay abreast of emerging lifestyles and consumer preferences affecting our merchandise. However, any sustained failure on our part to identify and respond to such trends may have a material and adverse effect on our business, financial condition and cash flows.
Failure to successfully operate our e-commerce website or fulfill customer expectations may adversely impact our business and sales. Our e-commerce platform provides another channel to generate sales. We believe that the e-commerce website will drive incremental sales by providing existing customers another opportunity to shop with us and also allowing us to reach new customers. If we do not successfully meet the challenges of operating an e-commerce website or fulfilling customer expectations, our business and sales may be adversely affected.
We face the risk of significant competition in the retail apparel industry which may result in the loss of customers and adversely affect revenues. The retail apparel business is highly competitive. Although competition varies widely from market to market, we face the risk of increased competition, particularly in our more highly populated markets from national, regional and local department and specialty stores. Some of our competitors are considerably larger than us and have substantially greater resources. Although we offer a unique product mix and brands that are not available at certain other retailers, including regional and national department stores, there is no assurance that our existing or new competitors will not carry similar branded merchandise in the future. This may have a material and adverse effect on our business, financial condition and cash flows. In addition to traditional store-based retailers, we also face e-commerce competition, which may materially affect our revenues and profitability.
An economic downturn or decline in consumer confidence may negatively impact our business and financial condition. Our results of operations are sensitive to changes in general economic conditions that impact consumer discretionary spending, such as employment levels, taxes, energy and gasoline prices and other factors influencing consumer confidence. We have extensive operations in the South Central, Southeastern and Mid-Atlantic states. In addition, many stores are located in small towns and rural environments that are substantially dependent upon the local economy. If there is an economic downturn or decline in consumer confidence, particularly in the South Central, Southeastern and Mid-Atlantic states and any state from which we derive a significant portion of our net sales (such as Texas or Louisiana), our business, financial condition and cash flows will be negatively impacted and such impact may be material.
10
There can be no assurance that our liquidity will not be affected by changes in economic conditions. Recent economic conditions have not had, nor do we anticipate that current economic conditions will have, a significant impact on our liquidity. Due to our significant operating cash flow and availability under our Revolving Credit Facility, we continue to believe that we have the ability to meet our financing needs for the foreseeable future. However, there can be no assurance that our liquidity will not be materially and adversely affected by changes in economic conditions.
Failure to obtain merchandise product on normal trade terms and/or our inability to pass on any price increases related to our merchandise may adversely impact our business, financial condition and cash flows. We are highly dependent on obtaining merchandise product on normal trade terms. Failure to meet our performance objectives may cause key vendors and factors to become more restrictive in granting trade credit. The tightening of credit, such as a reduction in our lines of credit or payment terms from the vendor or factor community, may have a material adverse impact on our business, financial condition and cash flows. We are also highly dependent on obtaining merchandise at competitive and predictable prices. In the event we experience rising prices related to our merchandise, whether due to cost of materials, inflation, transportation costs, or otherwise, and are unable to pass on those rising prices to our customers, our business, financial condition and cash flows may be adversely and materially affected.
Risks associated with our vendors from whom our products are sourced may have a material adverse effect on our business and financial condition. Our merchandise is sourced from a variety of domestic and international vendors. All of our vendors must comply with applicable laws, including our required standards of conduct. Political or financial instability, trade restrictions, tariffs, currency exchange rates, transport capacity and costs and other factors relating to foreign trade, the ability to access suitable merchandise on acceptable terms and the financial viability of our vendors are beyond our control and may adversely impact our performance.
Risks associated with our carriers, shippers and other providers of merchandise transportation services may have a material adverse effect on our business and financial condition. Our vendors rely on shippers, carriers and other merchandise transportation service providers (collectively "Transportation Providers") to deliver merchandise from their manufacturers, both in the United States and abroad, to the vendors' distribution centers in the United States. Transportation Providers are also responsible for transporting merchandise from their vendors' distribution centers to our distribution centers. We also rely on Transportation Providers to transport merchandise from our distribution centers to our stores and to our customers in the case of e-commerce sales. However, if work slowdowns, stoppages, weather or other disruptions affect the transportation of merchandise between the vendors and their manufacturers, especially those manufacturers outside the United States, between the vendors and us, or between us and our e-commerce customers, our business, financial condition and cash flows may be adversely affected.
Unusual weather patterns or natural disasters, whether due to climate change or otherwise, may negatively impact our financial condition. Our business depends, in part, on normal weather patterns in our markets. We are susceptible to unseasonable and severe weather conditions, including natural disasters, such as hurricanes and tornadoes. Any unusual or severe weather, especially in states such as Texas and Louisiana, whether due to climate change or otherwise, may have a material and adverse impact on our business, financial condition and cash flows. In addition, our business, financial condition and cash flow may be adversely affected if the businesses of our key vendors and their merchandise manufacturers, shippers, carriers and other merchandise transportation service providers, including those outside of the United States, are disrupted due to severe weather, such as, but not limited to, hurricanes, typhoons, tornadoes, tsunamis or floods, whether due to climate change or otherwise.
A catastrophic event adversely affecting any of our buying, distribution or other corporate facilities may result in reduced revenues and loss of customers. Our buying, distribution and other corporate operations are in highly centralized locations. Our operations may be materially and adversely affected if a catastrophic event (such as, but not limited to, fire, hurricanes, tornadoes or floods) impacts the use of these facilities. While we have developed contingency plans that would be implemented in the event of a catastrophic event, there are no assurances that we would be successful in obtaining alternative servicing facilities in a timely manner in the event of such a catastrophe.
War, acts of terrorism, Mexican border violence, public health issues and natural disasters may create uncertainty and may result in reduced revenues. We cannot predict, with any degree of certainty, what effect, if any, war, acts of terrorism, Mexican border violence, public health issues and natural disasters, if any, will have on us, our operations, the other risk factors discussed herein and the forward-looking statements we make in this Form 10-K. However, the consequences of these events may have a material adverse effect on our business, financial condition and cash flows.
11
A disruption of our information technology systems may have a material adverse impact on our business and financial condition. We are heavily dependent on our information technology systems for day to day business operations. In addition, as part of our normal course of business, we collect, process and retain sensitive and confidential customer information. Today's information technology risks are largely external and their consequences may affect us. Potential risks include, but are not limited to, the following: (i) an intrusion by a hacker, (ii) the introduction of malware (virus, Trojan horse, spyware), (iii) hardware failure, (iv) outages due to software defects and (v) human error. Although we run anti-virus and anti-spyware software and take other steps to ensure that our information technology systems will not be disabled or otherwise disrupted, there are no assurances that disruptions will not occur. The consequences of a disruption, depending on the severity, may have a material adverse effect on our business and financial condition and may expose us to civil, regulatory and industry actions and possible judgments, fees and fines.
A security breach that results in unauthorized disclosure of our, employee or customer information may adversely impact our business, reputation and financial condition. The protection of customer, employee, and company data is critical to us. Any security breach involving the misappropriation, loss or other unauthorized disclosure of confidential customer, employee or company information may severely damage our reputation, expose us to the risks of legal proceedings, disrupt our operations, attract a substantial amount of negative media attention, damage our customer relationships, and otherwise have a material adverse impact on our business and financial condition. While we have taken significant steps to protect confidential information, there is no assurance that advances in computer capabilities, new discoveries in the field of cryptography, or other developments will prevent the compromise of customer transaction processing capabilities and personal data. If any such compromise of our information security were to occur, it may have a material adverse effect on our reputation, business, operating results, financial condition and cash flows.
Our failure to attract, develop and retain qualified employees may deteriorate the results of our operations. We believe that our competitive advantage is providing well-trained and motivated sales associates in order to provide customers exceptional customer service. Our success depends in part upon our ability to attract, develop and retain a sufficient number of qualified employees, including store, service and administrative personnel. Competition for key personnel in the retail industry is intense and our future success will depend on our ability to recruit, train, and retain our senior executives and other qualified personnel.
Laws and regulations may adversely impact our business, financial condition and cash flows. We, like other businesses, are subject to various federal, state and local government laws and regulations including, but not limited to, tax laws. These may change periodically in response to economic or political conditions. We cannot predict whether existing laws or regulations, as currently interpreted or as reinterpreted in the future, or future laws and regulations, may have a material and adverse impact on our operations, financial condition and cash flows.
We may be subject to periodic litigation and regulatory proceedings which may adversely affect our business and financial performance. From time to time, we are involved in lawsuits and regulatory proceedings. Due to the inherent uncertainties of such matters, we may not be able to accurately determine the impact on us of any future adverse outcome of such matters. The ultimate resolution of these matters may have a material adverse impact on our financial condition, results of operations and liquidity. In addition, regardless of the outcome, these matters may result in substantial cost to us and may require us to devote substantial attention and resources to defend ourselves.
If our trademarks are successfully challenged, the outcome of those disputes may require us to abandon one or more of our trademarks. We regard our trademarks and their protection as important to our success. However, we cannot be sure that any trademark held by us will provide us a competitive advantage or will not be challenged by third parties. Although we intend to vigorously protect our trademarks, the cost of litigation to uphold the validity and prevent infringement of trademarks can be substantial and the outcome of those disputes may require us to abandon one or more of our trademarks.
Our dependence upon cash flows and net earnings generated during the fourth quarter, including the holiday season, may have a disproportionate impact on our results of operations. The seasonal nature of the retail industry causes a heavy dependence on earnings in the fourth quarter. A large fluctuation in economic or weather conditions occurring during the fourth quarter may adversely impact our earnings. In preparation for our peak season, we may carry a significant amount of inventory in advance. If, however, we do not manage inventory appropriately or customer preferences change we may need to increase markdowns or promotional sales to dispose of inventory which will negatively impact our financial results.
12
Covenants in our Revolving Credit Facility agreement may impose operating restrictions, impede or adversely affect our ability to pay dividends or repurchase common shares and raise capital through the sale of stock and other securities. Our Revolving Credit Facility agreement contains covenants which, among other things, restrict (i) the amount of additional debt or capital lease obligations we may incur, (ii) our payment of dividends and repurchase of common stock under certain circumstances and (iii) related party transactions. A violation of any of these covenants may permit the lenders to restrict our ability to further access loans and letters of credit and may require the immediate repayment of any outstanding loans. Our failure to comply with these covenants may have a material adverse effect on our capital resources, financial condition, results of operations and liquidity. In addition, any material or adverse developments affecting our business may significantly limit our ability to meet our obligations as they become due or to comply with the various covenant requirements contained in our Revolving Credit Facility agreement.
The inability or unwillingness of one or more lenders to fund their commitment under our Revolving Credit Facility may have a material adverse impact on our business and financial condition. Our Revolving Credit Facility, which matures on October 6, 2019, is a $350.0 million senior secured revolving credit facility. We use the Revolving Credit Facility to provide financing for working capital, capital expenditures and other general corporate purposes, as well as to support our outstanding letters of credit requirements. The lenders under the Revolving Credit Facility are: Wells Fargo Bank, National Association, JPMorgan Chase Bank, N.A, Regions Bank and Bank of America, N.A. Notwithstanding that we may be in full compliance with all covenants contained in the Revolving Credit Facility, the inability or unwillingness of one or more of those lenders to fund their commitment under our Revolving Credit Facility may have a material adverse impact on our business and financial condition.
Unexpected costs may arise from our current insurance program and our financial performance may be affected. Our insurance coverage is subject to deductibles, self-insured retentions, limits of liability and similar provisions that we believe are prudent based on the dispersion of our operations. However, we may incur certain types of losses that we cannot insure or which we believe are not economically reasonable to insure, such as losses due to acts of war, employee and certain other crime and some natural disasters. If we incur these losses and they are material, our business could suffer. Certain material events may result in sizable losses for the insurance industry and adversely impact the availability of adequate insurance coverage or result in excessive premium increases. To offset negative cost trends in the insurance market, we may elect to self-insure, accept higher deductibles or reduce the amount of coverage in response to these market changes. In addition, we self-insure a portion of expected losses under our workers' compensation, general liability and group health insurance programs. Unanticipated changes in any applicable actuarial assumptions and management estimates underlying our recorded liabilities for these losses, including potential increases in medical and indemnity costs, could result in materially different amounts of expense than expected under these programs, which may have a material adverse effect on our financial condition and results of operations. Although we continue to maintain property insurance for catastrophic events, we are self-insured for losses up to the amount of our deductibles. If we experience a greater number of self-insured losses than we anticipate, our financial performance may be adversely affected.
The price of our common stock as traded on the New York Stock Exchange may be volatile. Our stock price may fluctuate substantially as a result of factors beyond our control, including but not limited to, general economic and stock market conditions, risks relating to our business and industry as discussed above, strategic actions by us or our competitors, variations in our quarterly operating performance, our future sales or purchases of our common stock and investor perceptions of the investment opportunity associated with our common stock relative to other investment alternatives.
ITEM 1B. UNRESOLVED STAFF COMMENTS
Not applicable.
13
ITEM 2. PROPERTIES
Our corporate headquarters occupies approximately 195,000 square feet of leased space in Houston, Texas. We own our distribution centers in Jacksonville, Texas and South Hill, Virginia and lease our distribution center in Jeffersonville, Ohio, which have square footages and provide capacity of servicing stores as follows:
Location | Square Footage (in thousands) | Number of Stores Capable of Servicing |
Jacksonville, Texas | 437 | 600 |
South Hill, Virginia | 162 | 240 |
Jeffersonville, Ohio | 202 | 310 |
801 | 1,150 | |
We also lease a 176,000 square foot facility in Jacksonville, Texas to provide capacity expansion for our growing e-commerce business.
Our stores are primarily located in strip shopping centers. We own six of our stores and lease the balance. The majority of leases, which are typically for an initial 10-year term and often with two renewals of five years each, provide for a base rent plus payments for expenses incurred by the landlord, such as common area maintenance and insurance. Certain leases provide for contingent rents that are not measurable at inception. These contingent rents are primarily based on a percentage of sales that are in excess of a predetermined level. Stores range in size from approximately 5,000 to 57,000 selling square feet, with the average being approximately 18,000 selling square feet. At January 31, 2015, we operated 854 stores, in 40 states located within 7 regions, as follows:
Number of Stores | Number of Stores | |||||
South Central Region | Midwestern Region | |||||
Arkansas | 23 | Illinois | 6 | |||
Louisiana | 53 | Indiana | 24 | |||
Oklahoma | 38 | Iowa | 2 | |||
Texas | 231 | Kansas | 9 | |||
345 | Michigan | 15 | ||||
Mid-Atlantic Region | Minnesota | 1 | ||||
Delaware | 3 | Missouri | 19 | |||
Maryland | 8 | Ohio | 30 | |||
New Jersey | 5 | Wisconsin | 4 | |||
Pennsylvania | 35 | 110 | ||||
Virginia | 34 | Northeastern Region | ||||
West Virginia | 11 | Connecticut | 1 | |||
96 | Massachusetts | 2 | ||||
Southeastern Region | New Hampshire | 2 | ||||
Alabama | 35 | New York | 23 | |||
Florida | 6 | Vermont | 4 | |||
Georgia | 38 | 32 | ||||
Kentucky | 34 | Northwestern Region | ||||
Mississippi | 25 | Colorado | 6 | |||
North Carolina | 30 | Idaho | 3 | |||
South Carolina | 21 | Oregon | 4 | |||
Tennessee | 34 | Wyoming | 1 | |||
223 | 14 | |||||
Southwestern Region | Total Stores | 854 | ||||
Arizona | 7 | |||||
Nevada | 5 | |||||
New Mexico | 19 | |||||
Utah | 3 | |||||
34 | ||||||
14
ITEM 3. LEGAL PROCEEDINGS
No response is required under Item 103 of Regulation S-K.
ITEM 4. MINE SAFETY DISCLOSURES
Not applicable.
PART II
ITEM 5. | MARKET FOR REGISTRANT'S COMMON EQUITY, RELATED STOCKHOLDER MATTERS AND ISSUER PURCHASES OF EQUITY SECURITIES |
Market and Dividend Information
Our common stock trades on the New York Stock Exchange under the symbol "SSI". The following table sets forth the high and low market prices per share of our common stock as reported by the New York Stock Exchange and the amount of cash dividends per common share we paid during each quarter in 2014 and 2013:
Fiscal Year | |||||||||||||||||||||||
2014 | 2013 | ||||||||||||||||||||||
High | Low | Dividend | High | Low | Dividend | ||||||||||||||||||
1st Quarter | $ | 25.39 | $ | 18.39 | $ | 0.125 | $ | 29.59 | $ | 22.65 | $ | 0.100 | |||||||||||
2nd Quarter | 20.46 | 17.63 | 0.125 | 28.50 | 21.53 | 0.125 | |||||||||||||||||
3rd Quarter | 19.33 | 15.79 | 0.140 | 25.31 | 18.41 | 0.125 | |||||||||||||||||
4th Quarter | 22.52 | 15.71 | 0.140 | 22.99 | 19.35 | 0.125 | |||||||||||||||||
On June 11, 2014, we announced that our Board of Directors ("Board") approved a 12% increase in our quarterly cash dividend rate to $0.14 per share from the previous quarterly rate of $0.125 per share. The new quarterly rate of $0.14 per share is applicable to dividends declared by the Board beginning on August 21, 2014.
We paid aggregate cash dividends in 2014 and 2013 of $17.0 million and $15.5 million, respectively. While we expect to continue payment of quarterly cash dividends, the declaration and payment of future dividends are subject to the discretion of our Board. Any future determination to pay dividends will depend on our results of operations and financial condition, as well as meeting certain criteria under our Revolving Credit Facility (as defined in "Liquidity and Capital Resources") and other factors deemed relevant by our Board.
Holders
As of the close of trading on the New York Stock Exchange on March 24, 2015 there were approximately 258 holders of record of our common stock.
15
Performance Graph
The annual changes for the five-year period shown in the following graph are based on the assumption that $100 had been invested in each of our common stock, the S&P 500 Index and the S&P 500 Retail Index on January 29, 2010 (the last trading date of 2009), and that all quarterly dividends were reinvested at the average of the closing prices at the beginning and end of the quarter. Subsequent measurement points are the last trading days of 2010, 2011, 2012, 2013 and 2014. The total cumulative dollar returns shown on the graph represent the value that such investments would have had on January 30, 2015 (the last trading date of 2014). The calculations exclude trading commissions and taxes. The stock price performance on the following graph and table is not necessarily indicative of future stock price performance.
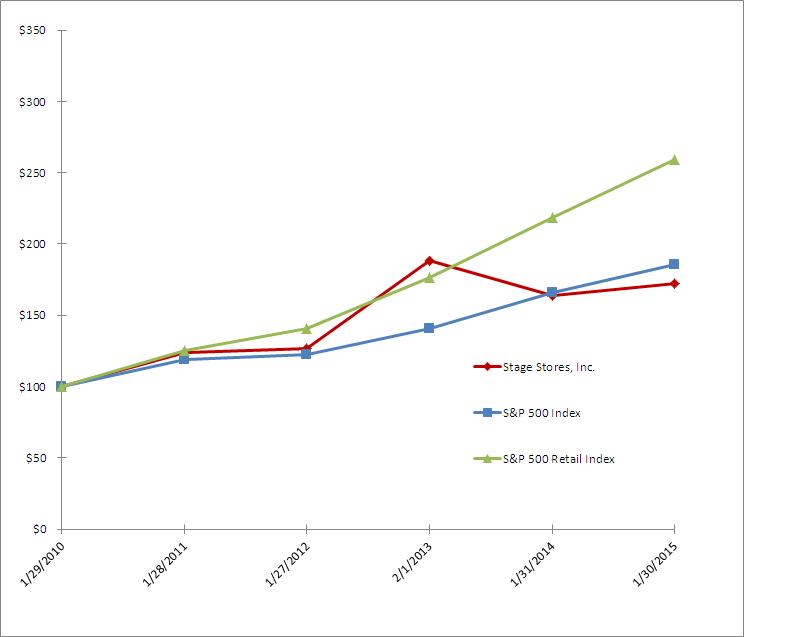
Date | Stage Stores, Inc. | S&P 500 Index | S&P 500 Retail Index | |||
1/29/2010 | $100.00 | $100.00 | $100.00 | |||
1/28/2011 | 123.96 | 118.85 | 125.46 | |||
1/27/2012 | 127.01 | 122.58 | 140.39 | |||
2/1/2013 | 188.25 | 140.91 | 176.18 | |||
1/31/2014 | 164.01 | 166.00 | 218.28 | |||
1/30/2015 | 172.25 | 185.78 | 259.21 | |||
16
Stock Repurchase Program
On March 7, 2011, our Board approved a stock repurchase program ("2011 Stock Repurchase Program") which authorized us to repurchase up to $200.0 million of our outstanding common stock. The 2011 Stock Repurchase Program will expire when we have repurchased $200.0 million of our outstanding common stock, unless terminated earlier by our Board. Through June 10, 2012, we repurchased approximately $100.1 million of our outstanding common stock under the 2011 Stock Repurchase Program. On June 11, 2012, we announced that our Board had chosen not to spend additional capital under the 2011 Stock Repurchase Program for the time being. In addition, our Board authorized us to repurchase shares of our outstanding common stock equal to the amount of the proceeds and related tax benefits from the exercise of stock options, stock appreciation rights ("SARs") and other equity grants. Purchases of shares of our common stock under this authorization may be made from time to time, either on the open market or through privately negotiated transactions and are financed by our existing cash, cash flow and other liquidity sources, as appropriate.
The table below sets forth information regarding our repurchases of our common stock during the fourth quarter of 2014:
ISSUER PURCHASES OF EQUITY SECURITIES | ||||||||||||||
Period | Total Number of Shares Purchased (a) | Average Price Paid Per Share (a) | Total Number of Shares Purchased as Part of Publicly Announced Plans or Programs | Approximate Dollar Value of Shares that May Yet Be Purchased Under the Plans or Programs (b) | ||||||||||
November 2, 2014 to November 29, 2014 | 174,187 | $ | 16.04 | — | $ | 99,938,428 | ||||||||
November 30, 2014 to January 3, 2015 | 1,579 | 19.82 | — | 99,938,428 | ||||||||||
January 4, 2015 to January 31, 2015 | 1,264 | 21.67 | — | 99,938,428 | ||||||||||
Total | 177,030 | $ | 16.11 | — | ||||||||||
(a) Although we did not repurchase any of our common stock during the fourth quarter of 2014 under the 2011 Stock Repurchase Program:
• | We repurchased 171,914 shares of common stock for approximately $2.7 million at a weighted average price of $15.99 associated with the proceeds and related tax benefits from the exercise of stock options, SARs and other equity grants; |
• | We reacquired 3,333 shares of common stock from certain employees to cover tax withholding obligations from exercises of SARs at a weighted average acquisition price of $20.49 per share; and |
• | The trustee of the grantor trust established by us for the purpose of holding assets under our deferred compensation plan purchased an aggregate of 1,783 shares of our common stock in the open market at a weighted average price of $19.51 in connection with the option to invest in our stock under the deferred compensation plan and reinvestment of dividends paid on our common stock held in trust in the deferred compensation plan. |
(b) Reflects the $200.0 million authorized under the 2011 Stock Purchase Program, less the $100.1 million repurchased using our existing cash, cash flow and other liquidity sources since March 2011.
17
ITEM 6. SELECTED FINANCIAL DATA
The following sets forth selected consolidated financial data for the periods indicated. Financial results for 2014, 2013, 2011, and 2010 are based on a 52-week period. Financial results for 2012 are based on a 53-week period. The selected consolidated financial data should be read in conjunction with our Consolidated Financial Statements included herein. All amounts are stated in thousands, except for per share data, percentages and number of stores.
Fiscal Year | |||||||||||||||||||
2014 | 2013 | 2012 | 2011 | 2010 | |||||||||||||||
Statement of operations data: | |||||||||||||||||||
Net sales | $ | 1,638,569 | $ | 1,609,481 | $ | 1,627,702 | $ | 1,511,220 | $ | 1,470,590 | |||||||||
Cost of sales and related buying, occupancy and distribution expenses | 1,188,763 | 1,172,995 | 1,168,907 | 1,099,982 | 1,053,766 | ||||||||||||||
Gross profit | 449,806 | 436,486 | 458,795 | 411,238 | 416,824 | ||||||||||||||
Selling, general and administrative expenses | 383,616 | 390,224 | 387,332 | 353,055 | 350,865 | ||||||||||||||
Store opening costs | 2,488 | 2,902 | 2,163 | 5,305 | 3,192 | ||||||||||||||
Interest expense, net | 3,002 | 2,744 | 3,011 | 3,821 | 3,875 | ||||||||||||||
Income from continuing operations before income tax | 60,700 | 40,616 | 66,289 | 49,057 | 58,892 | ||||||||||||||
Income tax expense | 22,847 | 15,400 | 24,373 | 16,930 | 21,252 | ||||||||||||||
Income from continuing operations | 37,853 | 25,216 | 41,916 | 32,127 | 37,640 | ||||||||||||||
Loss from discontinued operations, net | (7,003 | ) | (8,574 | ) | (3,737 | ) | (1,167 | ) | — | ||||||||||
Net income | $ | 30,850 | $ | 16,642 | $ | 38,179 | $ | 30,960 | $ | 37,640 | |||||||||
Adjusted earnings (non-GAAP) (a) | $ | 37,853 | $ | 39,986 | $ | 46,296 | $ | 32,127 | $ | 37,640 | |||||||||
Basic earnings per share data | |||||||||||||||||||
Continuing operations | $ | 1.18 | $ | 0.78 | $ | 1.32 | $ | 0.96 | $ | 1.00 | |||||||||
Discontinued operations | $ | (0.22 | ) | $ | (0.27 | ) | $ | (0.12 | ) | $ | (0.04 | ) | $ | — | |||||
Basic earnings per share (b) | $ | 0.96 | $ | 0.51 | $ | 1.20 | $ | 0.93 | $ | 1.00 | |||||||||
Basic weighted average common shares outstanding | 31,675 | 32,034 | 31,278 | 33,021 | 37,656 | ||||||||||||||
Diluted earnings per share data | |||||||||||||||||||
Continuing operations | $ | 1.18 | $ | 0.77 | $ | 1.31 | $ | 0.95 | $ | 0.99 | |||||||||
Discontinued operations | $ | (0.22 | ) | $ | (0.26 | ) | $ | (0.12 | ) | $ | (0.03 | ) | $ | — | |||||
Diluted earnings per share | $ | 0.96 | $ | 0.51 | $ | 1.19 | $ | 0.92 | $ | 0.99 | |||||||||
Adjusted diluted earnings per share (non-GAAP) (a) | $ | 1.18 | $ | 1.22 | $ | 1.44 | $ | 0.95 | $ | 0.99 | |||||||||
Diluted weighted average common shares outstanding | 31,763 | 32,311 | 31,600 | 33,278 | 38,010 | ||||||||||||||
Margin and other data: | |||||||||||||||||||
Gross profit margin | 27.5 | % | 27.1 | % | 28.2 | % | 27.2 | % | 28.3 | % | |||||||||
Selling, general and administrative expense rate | 23.4 | % | 24.2 | % | 23.8 | % | 23.4 | % | 23.9 | % | |||||||||
Capital expenditures | $ | 70,580 | $ | 61,263 | $ | 49,489 | $ | 45,731 | $ | 36,990 | |||||||||
Construction allowances from landlords | 5,538 | 4,162 | 4,193 | 4,499 | 5,476 | ||||||||||||||
Stock repurchases | 4,599 | 33,748 | 387 | 110,919 | 31,976 | ||||||||||||||
Cash dividends per share | 0.53 | 0.48 | 0.38 | 0.33 | 0.25 | ||||||||||||||
18
Store data: | |||||||||||||||||||
Comparable sales growth (decline) (c) | 1.4 | % | (1.5 | )% | 5.7 | % | 0.5 | % | 0.2 | % | |||||||||
Store openings (d) | 18 | 28 | 25 | 34 | 33 | ||||||||||||||
Store closings (d) | 12 | 10 | 5 | 10 | 5 | ||||||||||||||
Number of stores open at end of period (d) | 854 | 848 | 830 | 810 | 786 | ||||||||||||||
Total selling area square footage at end of period (d) | 15,409 | 15,313 | 15,255 | 15,027 | 14,681 | ||||||||||||||
January 31, | February 1, | February 2, | January 28, | January 29, | |||||||||||||||
2015 | 2014 | 2013 | 2012 | 2011 | |||||||||||||||
Balance sheet data: | |||||||||||||||||||
Working capital | $ | 299,279 | $ | 293,995 | $ | 259,260 | $ | 213,700 | $ | 262,100 | |||||||||
Total assets | 824,677 | 810,837 | 794,871 | 735,339 | 796,084 | ||||||||||||||
Debt obligations | 47,388 | 63,225 | 12,329 | 49,503 | 38,492 | ||||||||||||||
Stockholders' equity | 475,930 | 454,444 | 464,870 | 412,706 | 489,509 | ||||||||||||||
(a) See Non-GAAP Financial Measures following below for additional information and reconciliation to the most directly comparable U.S. GAAP financial measure.
(b) Earnings per share may not foot due to rounding.
(c) We follow the retail reporting calendar, which included an extra week of sales in the fourth quarter of 2012. However, many retailers report comparable sales on a shifted calendar, which excludes the first week of 2012 rather than the fifty-third week. On this shifted basis, comparable sales decreased 1.1% for 2013.
(d) Excludes Steele's stores that are now reflected in discontinued operations.
19
Non-GAAP Financial Measures
The following supplemental information presents the results of operations for 2014, 2013 and 2012 on a basis in conformity with accounting principles generally accepted in the United States of America ("GAAP") and on a non-GAAP basis to show earnings with and without charges associated with the South Hill Consolidation (see Note 16) and our former Chief Executive Officer's resignation. We believe this supplemental financial information enhances an investor's understanding of our financial performance as it excludes those items which impact comparability of operating trends. The non-GAAP financial information should not be considered in isolation or viewed as a substitute for net income, cash flow from operations, diluted earnings per common share or other measures of performance as defined by GAAP. Moreover, the inclusion of non-GAAP financial information as used herein is not necessarily comparable to other similarly titled measures of other companies due to the potential inconsistencies in the method of presentation and items considered. The following tables set forth the supplemental financial information and the reconciliation of GAAP disclosures to non-GAAP financial measures (in thousands, except diluted earnings per share):
Fiscal Year | |||||||||||
2014 | 2013 | 2012 | |||||||||
Net income (GAAP) | $ | 30,850 | $ | 16,642 | $ | 38,179 | |||||
Loss from discontinued operations, net of tax benefit of $4,228, $5,237 and $2,172, respectively | (7,003 | ) | (8,574 | ) | (3,737 | ) | |||||
Income from continuing operations | 37,853 | 25,216 | 41,916 | ||||||||
South Hill Consolidation related charges, net of tax of $9,019 and $1,330, respectively | — | 14,770 | 2,288 | ||||||||
Former Chief Executive Officer resignation related charges, net of tax of $1,216 | — | — | 2,092 | ||||||||
Adjusted earnings (non-GAAP)(a) | $ | 37,853 | $ | 39,986 | $ | 46,296 | |||||
Diluted earnings per share (GAAP) | $ | 0.96 | $ | 0.51 | $ | 1.19 | |||||
Loss from discontinued operations | (0.22 | ) | (0.26 | ) | (0.12 | ) | |||||
Income from continuing operations | 1.18 | 0.77 | 1.31 | ||||||||
South Hill Consolidation related charges | — | 0.45 | 0.07 | ||||||||
Former Chief Executive Officer resignation related charges | — | — | 0.07 | ||||||||
Adjusted diluted earnings per share (non-GAAP) (a) (b) | $ | 1.18 | $ | 1.22 | $ | 1.44 | |||||
(a) 2014 amounts are not adjusted. | |||||||||||
(b) Earnings per share may not foot due to rounding. | |||||||||||
20
ITEM 7. MANAGEMENT'S DISCUSSION AND ANALYSIS OF FINANCIAL CONDITION AND RESULTS OF OPERATIONS
The results of operations for 2014 and 2013 are based on 52-week periods and for 2012 is based on a 53-week period.
Our Business
We are a retailer operating specialty department stores primarily in small and mid-sized towns and communities. We provide customers a welcoming and comfortable shopping experience in our stores and direct-to-consumer business. Our merchandise assortment is a well-edited selection of moderately priced brand name and private label apparel, accessories, cosmetics, footwear and home goods. As of January 31, 2015, we operated 854 specialty department stores located in 40 states under the BEALLS, GOODY'S, PALAIS ROYAL, PEEBLES and STAGE nameplates and a direct-to-consumer business.
On March 7, 2014, we divested Steele's, an off-price concept that we launched in November 2011, in order to focus solely on our core specialty department store business. Accordingly, the results of operations of Steele's and loss on the sale are reflected in discontinued operations for all periods presented. Our results of operations for all periods presented within Management's Discussion and Analysis reflect continuing operations. For additional information regarding discontinued operations, see Note 15 to the consolidated financial statements.
Results of Operations
Our strategy for 2014 was to build on our prior year achievements and to pursue meaningful sales and earnings growth. Reflecting the successful implementation of our business strategy, we achieved the following results in 2014 (comparisons are to 2013):
Financial Highlights
• | Net sales increased $29.1 million, or 1.8%. |
• | Comparable sales increased 1.4%. |
• | Direct-to-consumer sales, included in comparable sales, increased 25.7%. |
• | Gross profit increased $13.3 million, or 3.1%. |
• | Income from continuing operations improved $12.6 million, or 50.1%. |
• | We grew the penetration rate of our private label credit card to 40%. |
• | In August 2014, we increased our quarterly dividend rate by 12.0% to $0.14 per common share |
• | We paid cash dividends of $17.0 million ($0.53 per share). |
• | On October 6, 2014, we entered into a $350.0 million senior secured revolving credit facility that replaced our previous facility and increased our borrowing capacity by $100.0 million. |
Strategic Highlights
• | To enhance our focus on our core specialty department store business, we completed the sale of off-price concept Steele’s in the first quarter of 2014. |
• | We expanded direct-to-consumer assortments and broadened our centralized fulfillment. |
• | We grew our cosmetics business with the installation of new Estee Lauder counters in 75 stores and new Clinique counters in 76 stores. |
• | We refined our assortments with updated styles, new brands, additional categories within existing brands and the expansion of existing brands to additional stores. |
• | We implemented store-level mark down optimization and continued to make progress on size pack optimization. |
• | We re-launched our home category with a focus on offering a highly curated selection of kitchen, textile and gift assortments. |
• | We continued to install new fixtures in our stores to improve product presentation and the shopping experience. New fixtures are now in approximately 20% of our stores. |
• | We opened 18 new stores. |
21
2015 Strategy and Outlook
Our strategy in 2015 will be focused on driving sales productivity and expanding our direct-to-consumer business. We plan to refine our assortments, in-store experience and marketing communications. We believe we can grow our revenue and earnings by executing on the following strategies:
Drive Sales Productivity. We intend to drive sales productivity in existing stores and our direct-to-consumer business by featuring quality, trend-right merchandise at a compelling value and refining our experience in the store environment, our direct-to-consumer business and our marketing touch points. We intend to lead with trend-right and style driven assortments and friendly service to foster a fun, comfortable shopping experience that translates to higher units sold and higher average unit retails.
Expand the Penetration and Presence of our Direct-to-Consumer Business. We expect to improve our brand experience with a growing direct-to-consumer business. Our direct-to-consumer business reinforces and builds further brand awareness and grew by 25.7% in 2014, representing 2.3% of our total sales. We have expanded assortments, implemented functionality enhancements and broadened centralized fulfillment, and we plan to continue making significant investments in our direct-to-consumer business that will further enhance our customers’ shopping experience from an assortment, technology and fulfillment perspective.
In 2015, we plan to slow our new store growth as we embark on a multi-year initiative to increase investments in our direct-to-consumer business and existing stores. We anticipate opening 2 new stores in 2015. We continually review the profitability of each store and look to close a store if the expected store performance does not meet our financial hurdle rates. We expect to close 10-20 stores, where lease terms permit, in 2015.
The financial information, discussion and analysis that follow should be read in conjunction with our Consolidated Financial Statements and accompanying footnotes included in this Form 10-K.
2014 Compared to 2013
Fiscal Year Ended | ||||||||||||||||||||
January 31, 2015 | February 1, 2014 | Change | ||||||||||||||||||
Amount | % to Sales (a) | Amount | % to Sales (a) | Amount | % | |||||||||||||||
Net sales | $ | 1,638,569 | 100.0 | % | $ | 1,609,481 | 100.0 | % | $ | 29,088 | 1.8 | % | ||||||||
Cost of sales and related buying, occupancy and distribution expenses | 1,188,763 | 72.5 | % | 1,172,995 | 72.9 | % | 15,768 | 1.3 | % | |||||||||||
Gross profit | 449,806 | 27.5 | % | 436,486 | 27.1 | % | 13,320 | 3.1 | % | |||||||||||
Selling, general and administrative expenses | 383,616 | 23.4 | % | 390,224 | 24.2 | % | (6,608 | ) | (1.7 | )% | ||||||||||
Store opening costs | 2,488 | 0.2 | % | 2,902 | 0.2 | % | (414 | ) | (14.3 | )% | ||||||||||
Interest expense | 3,002 | 0.2 | % | 2,744 | 0.2 | % | 258 | 9.4 | % | |||||||||||
Income before income tax | 60,700 | 3.7 | % | 40,616 | 2.5 | % | 20,084 | 49.4 | % | |||||||||||
Income tax expense | 22,847 | 1.4 | % | 15,400 | 1.0 | % | 7,447 | 48.4 | % | |||||||||||
Income from continuing operations | 37,853 | 2.3 | % | 25,216 | 1.6 | % | 12,637 | 50.1 | % | |||||||||||
Loss from discontinued operations, net of tax benefit of $4,228 and $5,237 | (7,003 | ) | (0.4 | )% | (8,574 | ) | (0.5 | )% | 1,571 | (18.3 | )% | |||||||||
Net income | $ | 30,850 | 1.9 | % | $ | 16,642 | 1.0 | % | $ | 14,208 | 85.4 | % | ||||||||
(a) Percentages may not foot due to rounding. | ||||||||||||||||||||
22
Net Sales
Sales for 2014 increased 1.8% to $1,638.6 million from $1,609.5 million for 2013. Comparable sales, which are sales in stores that are open for at least 14 full months prior to the reporting period, including direct-to-consumer sales, increased by 1.4% in 2014 as compared to a 1.5% decrease in 2013. Excluding direct-to-consumer sales, comparable sales increased 0.9% in 2014, as compared to a 2.0% decrease in 2013. The 1.4% increase in comparable sales was driven primarily by a 4.9% gain in average unit retail, which was partially offset by a decline in units per transaction and in the number of transactions. The higher average selling price was achieved through effectively managing inventory levels, resulting in an improved balance between regular priced and clearance goods.
Comparable sales increase (decrease) by quarter is presented below:
Fiscal Year | |||||
2014 | 2013 | ||||
1st Quarter | (0.2 | )% | 0.7 | % | |
2nd Quarter | (4.2 | ) | 1.7 | ||
3rd Quarter | 2.3 | (4.6 | ) | ||
4th Quarter | 6.4 | (3.4 | ) | ||
Total Year | 1.4 | % | (1.5 | )% | |
On a merchandise category basis, cosmetics, footwear, children's and home and gifts achieved positive comparable sales. Cosmetics had the strongest comparable sales increase, driven by the installation of Estee Lauder and Clinique counters in 75 and 76 stores, respectively, during 2014. We also continued to focus on sales growth through the introduction of new product offerings and the expansion of existing sought-after brand names.
On a market population basis, utilizing a ten-mile radius from each store, small market stores (populations less than 50,000), mid-sized market stores (populations of 50,000 to 150,000) and higher-density market stores (populations greater than 150,000) had comparable sales increases in 2014 of 0.9%, 0.1% and 1.0%, respectively.
Cost of Sales
The following is a summary of the changes in the components of cost of sales between 2014 and 2013, expressed as a percent of sales:
Increase (Decrease) in the Components of Cost of Sales | |
Merchandise cost of sales rate | (0.6)% |
Buying, occupancy and distribution expenses rate | 0.2 |
Cost of sales rate | (0.4)% |
Gross Profit
Gross profit in 2014 was $449.8 million, an increase of 3.1% from $436.5 million in 2013. Gross profit, as a percent of sales, increased to 27.5% in 2014 from 27.1% in 2013. The 0.4% increase in the gross profit rate reflects a 0.6% decrease in the merchandise cost of sales rate and a 0.2% increase in the buying, occupancy and distribution expenses rate. Merchandise cost of sales for 2013 includes approximately $12.5 million, or approximately 0.8% of sales, related to the South Hill Consolidation due to inventory liquidation costs associated with discontinued vendors and merchandise and advertising allowances deferred in inventory. The increase in buying, occupancy and distribution expenses rate is a result of higher store occupancy costs in 2014 compared to 2013.
23
Selling, General and Administrative Expenses
Selling, general and administrative ("SG&A") expenses in 2014 decreased $6.6 million to $383.6 million from $390.2 million in 2013. As a percent of sales, SG&A expenses decreased to 23.4% in 2014 from 24.2% in 2013. The decrease in SG&A expenses reflects charges of approximately $11.3 million incurred in 2013 related to the South Hill Consolidation. In addition, the decrease in 2014 also reflects increased credit income from our private label credit card program. These reductions were partially offset by higher incentive compensation expense in 2014.
Store Opening Costs
Store opening costs in 2014 were $2.5 million, which included costs related to opening 18 new stores and relocating 7 stores. In 2013, we incurred $2.9 million, which included costs related to opening 28 new stores and relocating 3 stores. Store opening costs are expensed as incurred and include costs of stores opening in future quarters.
Interest Expense
Interest expense was $3.0 million in 2014 and $2.7 million in 2013. Interest expense is primarily comprised of interest on borrowings under the Revolving Credit Facility, related letters of credit and commitment fees, amortization of debt issuance costs and interest on finance lease obligations. The increase in interest expense is primarily due to increased borrowings on the Revolving Credit Facility.
Income Taxes
Our effective tax rate in 2014 was 37.6%, resulting in tax expense of $22.8 million. This compares to income tax expense of $15.4 million in 2013 at an effective rate of 37.9%.
2013 Compared to 2012
Fiscal Year Ended | ||||||||||||||||||||
February 1, 2014 | February 2, 2013 | Change | ||||||||||||||||||
Amount | % to Sales (a) | Amount | % to Sales (a) | Amount | % | |||||||||||||||
Net sales | $ | 1,609,481 | 100.0 | % | $ | 1,627,702 | 100.0 | % | $ | (18,221 | ) | (1.1 | )% | |||||||
Cost of sales and related buying, occupancy and distribution expenses | 1,172,995 | 72.9 | % | 1,168,907 | 71.8 | % | 4,088 | 0.3 | % | |||||||||||
Gross profit | 436,486 | 27.1 | % | 458,795 | 28.2 | % | (22,309 | ) | (4.9 | )% | ||||||||||
Selling, general and administrative expenses | 390,224 | 24.2 | % | 387,332 | 23.8 | % | 2,892 | 0.7 | % | |||||||||||
Store opening costs | 2,902 | 0.2 | % | 2,163 | 0.1 | % | 739 | 34.2 | % | |||||||||||
Interest expense | 2,744 | 0.2 | % | 3,011 | 0.2 | % | (267 | ) | (8.9 | )% | ||||||||||
Income before income tax | 40,616 | 2.5 | % | 66,289 | 4.1 | % | (25,673 | ) | (38.7 | )% | ||||||||||
Income tax expense | 15,400 | 1.0 | % | 24,373 | 1.5 | % | (8,973 | ) | (36.8 | )% | ||||||||||
Income from continuing operations | 25,216 | 1.6 | % | 41,916 | 2.6 | % | (16,700 | ) | (39.8 | )% | ||||||||||
Loss from discontinued operations, net of tax benefit of $5,237 and $2,172 | (8,574 | ) | (0.5 | )% | (3,737 | ) | (0.2 | )% | (4,837 | ) | 129.4 | % | ||||||||
Net income | $ | 16,642 | 1.0 | % | $ | 38,179 | 2.3 | % | $ | (21,537 | ) | (56.4 | )% | |||||||
(a) Percentages may not foot due to rounding. | ||||||||||||||||||||
24
Net Sales
Sales for 2013 decreased 1.1% to $1,609.5 million from $1,627.7 million for 2012. Periods of unseasonable and severe weather, an intense promotional environment and weakness in the overall apparel market negatively impacted sales in 2013 compared to 2012. Comparable sales decreased by 1.5% in 2013. The 1.5% decrease in comparable sales for 2013 reflects a combination of a 1.3% increase in the number of transactions, a decrease of 3.3% in average unit retail and an increase of 0.3% in units per transaction. This compares to a 5.7% increase in comparable sales in 2012. Excluding direct-to-consumer sales, comparable sales decreased 2.0% in 2013 as compared to a 5.2% increase in 2012. Many retailers report comparable sales on a shifted calendar, which excludes the first week of 2012 rather than the fifty-third week. On this shifted basis, comparable sales for 2013 decreased 1.1%.
Comparable sales increase (decrease) by quarter is presented below:
Fiscal Year | |||||
2013 | 2012 | ||||
1st Quarter | 0.7 | % | 2.5 | % | |
2nd Quarter | 1.7 | 5.4 | |||
3rd Quarter | (4.6 | ) | 8.1 | ||
4th Quarter | (3.4 | ) | 6.6 | ||
Total Year | (1.5 | )% | 5.7 | % | |
On a merchandise category basis, cosmetics, footwear, home and gifts, men's and children's all outperformed our comparable sales average. Cosmetics had the strongest comparable sales increases driven by the installation of Estee Lauder counters in 35 stores and Clinique counters in 37 stores during 2013. Footwear was driven by sales of key brands such as Sperry, Nike, and Skechers. Home and gifts benefited from new product launches such as Keurig and Cuisinart.
On a market population basis, utilizing a ten-mile radius from each store, the larger market stores outperformed the smaller markets. Our higher-density markets (populations greater than 150,000) had a comparable sales increase of 0.5%, while the mid-sized (populations of 50,000 to 150,000) and smaller market stores (populations less than 50,000) experienced a comparable sales decrease of 0.9% and 2.7%, respectively.
Cost of Sales
The following is a summary of the changes in the components of cost of sales between 2013 and 2012, expressed as a percent of sales:
Increase in the Components of Cost of Sales | |
Merchandise cost of sales rate | 0.9% |
Buying, occupancy and distribution expenses rate | 0.2 |
Cost of sales rate | 1.1% |
Gross Profit
Gross profit in 2013 was $436.5 million, a decrease of 4.9% from $458.8 million in 2012. Gross profit as a percent of sales decreased to 27.1% in 2013 from 28.2% in 2012. The 1.1% decline in the gross profit rate reflects a 0.9% increase in the merchandise cost of sales rate and a 0.2% increase in the buying, occupancy and distribution expenses rate. Merchandise cost of sales for 2013 includes approximately $12.5 million, or approximately 0.8% of sales, related to the South Hill Consolidation due to inventory liquidation costs associated with discontinued vendors and merchandise and advertising allowances deferred in inventory. The increase in buying, occupancy and distribution expenses rate is a result of higher store occupancy costs and deleveraging from lower sales in 2013 compared to 2012.
25
Selling, General and Administrative Expenses
SG&A expenses in 2013 increased $2.9 million to $390.2 million from $387.3 million in 2012. As a percent of sales, SG&A expenses increased to 24.2% in 2013 from 23.8% in 2012. The increase in SG&A expenses reflects charges of approximately $11.3 million incurred in 2013 related to the South Hill Consolidation, while 2012 included $3.3 million of charges associated with the resignation of our former Chief Executive Officer and $1.1 million associated with the South Hill Consolidation. In addition, the increase in 2013 also reflects incremental costs to operate 18 net additional stores and higher medical insurance costs resulting from several large claims as compared to 2012. These higher costs were partially offset by higher credit income associated with our private label credit card portfolio and lower incentive compensation costs.
Store Opening Costs
Store opening costs in 2013 were $2.9 million, which included costs related to opening 28 new stores and relocating 3 stores. In 2012, we incurred $2.2 million, which included costs related to opening 25 new stores and relocating 6 stores. Store opening costs are expensed as incurred and include costs of stores opening in future quarters.
Interest Expense
Interest expense was $2.7 million in 2013 and $3.0 million in 2012. Interest expense is primarily comprised of interest on borrowings under the Revolving Credit Facility, related letters of credit and commitment fees, amortization of debt issuance costs, interest on finance lease obligations and equipment financing notes. The decrease in interest expense is primarily due to the reduced amount of long-term debt obligations, as we paid off our equipment financing notes in the second quarter of 2012, which is offset by increased borrowings on the Revolving Credit Facility.
Income Taxes
Our effective tax rate in 2013 was 37.9%, resulting in tax expense of $15.4 million. This compares to income tax expense of $24.4 million in 2012 at an effective rate of 36.8%. The 2013 rate increased due to the recording of a $0.5 million reserve related to an uncertain tax position.
Seasonality and Inflation
Historically, our business is seasonal and sales are traditionally lower during the first three quarters of the fiscal year (February through October) and higher during the last quarter of the fiscal year (November through January). The fourth quarter usually accounts for approximately 30% of our annual sales, with each of the other quarters accounting for approximately 22% to 24%. Working capital requirements fluctuate during the year and generally reach their highest levels during the third and fourth quarters. We do not believe that inflation has had a material effect on our results of operations. However, there can be no assurance that our business will not be affected by inflation in the future.
26
The following table shows quarterly information (unaudited) (in thousands, except per share amounts):
Fiscal Year 2014 | |||||||||||||||
Q1 | Q2 | Q3 | Q4 | ||||||||||||
Net sales | $ | 372,040 | $ | 377,446 | $ | 364,197 | $ | 524,886 | |||||||
Gross profit | 77,941 | 112,340 | 88,166 | 171,359 | |||||||||||
Income (loss) from continuing operations | $ | (12,046 | ) | $ | 11,192 | $ | (5,107 | ) | $ | 43,814 | |||||
Loss from discontinued operations | (6,748 | ) | — | (161 | ) | (94 | ) | ||||||||
Net income (loss) | $ | (18,794 | ) | $ | 11,192 | $ | (5,268 | ) | $ | 43,720 | |||||
Basic earnings (loss) per share data: | |||||||||||||||
Continuing operations | $ | (0.38 | ) | $ | 0.35 | $ | (0.16 | ) | $ | 1.37 | |||||
Discontinued operations | (0.22 | ) | — | (0.01 | ) | — | |||||||||
Basic earnings (loss) per common share | (0.60 | ) | 0.35 | (0.17 | ) | 1.37 | |||||||||
Diluted earnings (loss) per share data: | |||||||||||||||
Continuing operations | $ | (0.38 | ) | $ | 0.35 | $ | (0.16 | ) | $ | 1.36 | |||||
Discontinued operations | (0.22 | ) | — | (0.01 | ) | — | |||||||||
Diluted earnings (loss) per common share | (0.60 | ) | 0.35 | (0.17 | ) | 1.36 | |||||||||
Basic weighted average shares | 31,492 | 31,757 | 31,794 | 31,657 | |||||||||||
Diluted weighted average shares | 31,492 | 31,825 | 31,794 | 31,740 | |||||||||||
Fiscal Year 2013 | |||||||||||||||
Q1 | Q2 | Q3 | Q4 | ||||||||||||
Net sales | $ | 372,103 | $ | 389,991 | $ | 354,850 | $ | 492,537 | |||||||
Gross profit | 89,629 | 115,575 | 83,290 | 147,992 | |||||||||||
Income (loss) from continuing operations | $ | (6,188 | ) | $ | 10,832 | $ | (9,573 | ) | $ | 30,145 | |||||
Loss from discontinued operations | (668 | ) | (1,225 | ) | (1,398 | ) | (5,283 | ) | |||||||
Net income (loss) | $ | (6,856 | ) | $ | 9,607 | $ | (10,971 | ) | $ | 24,862 | |||||
Adjusted earnings (loss) (non-GAAP) (a) | $ | (126 | ) | $ | 14,936 | $ | (7,021 | ) | $ | 32,197 | |||||
Basic earnings (loss) per share data: | |||||||||||||||
Continuing operations | $ | (0.19 | ) | $ | 0.33 | $ | (0.30 | ) | $ | 0.95 | |||||
Discontinued operations | (0.02 | ) | (0.04 | ) | (0.04 | ) | (0.17 | ) | |||||||
Basic earnings (loss) per common share | (0.21 | ) | 0.29 | (0.34 | ) | 0.79 | |||||||||
Diluted earnings (loss) per share data: | |||||||||||||||
Continuing operations | $ | (0.19 | ) | $ | 0.32 | $ | (0.30 | ) | $ | 0.95 | |||||
Discontinued operations | (0.02 | ) | (0.03 | ) | (0.04 | ) | (0.17 | ) | |||||||
Diluted earnings (loss) per common share | (0.21 | ) | 0.29 | (0.34 | ) | 0.78 | |||||||||
Adjusted diluted earnings (loss) per common share (a) | — | 0.45 | (0.22 | ) | 1.01 | ||||||||||
Basic weighted average shares | 32,306 | 32,762 | 31,854 | 31,215 | |||||||||||
Diluted weighted average shares | 32,306 | 33,073 | 31,854 | 31,438 | |||||||||||
(a) See Item 6, Selected Financial Data, for discussion of this non-GAAP financial measure and reconciliation to the most directly comparable U.S. GAAP financial measure.
27
Liquidity and Capital Resources
Our liquidity is currently provided by (i) existing cash balances, (ii) operating cash flows, (iii) normal trade credit terms from our vendors and their factors and (iv) our Revolving Credit Facility. Our primary cash requirements are for seasonal and new store inventory purchases, as well as capital investments in our stores, direct-to-consumer business and information technology and the payment of our quarterly cash dividends.
While there can be no assurances, we believe that our sources of liquidity will be sufficient to cover working capital needs, planned capital expenditures and debt service requirements for the remainder of 2015 and the foreseeable future.
Key components of our cash flow are summarized below (in thousands):
Fiscal Year | |||||||||||
2014 | 2013 | 2012 | |||||||||
Net cash provided by (used in): | |||||||||||
Operating activities | $ | 102,214 | $ | 46,527 | $ | 75,981 | |||||
Investing activities | (67,634 | ) | (61,236 | ) | (49,439 | ) | |||||
Financing activities | (32,177 | ) | 11,534 | (27,226 | ) | ||||||
Operating Activities
During 2014, we generated $102.2 million in cash from operating activities. Net income, adjusted for non-cash expenses, provided cash of approximately $106.9 million. Changes in operating assets and liabilities used net cash of approximately $10.2 million, which included a $7.0 million increase in merchandise inventories, an increase in other assets of $1.7 million and a decrease in accounts payable and other liabilities of $1.5 million. Additionally, cash flows from operating activities included construction allowances from landlords of $5.5 million, which funded a portion of the capital expenditures related to store leasehold improvements in new and relocated stores.
During 2013, we generated $46.5 million in cash from operating activities. Net income, adjusted for non-cash expenses, provided cash of approximately $95.9 million. Changes in operating assets and liabilities used net cash of approximately $53.5 million, which included a $20.5 million increase in merchandise inventories, an increase in other assets of $6.4 million and a decrease in accounts payable and other liabilities of $26.7 million. Additionally, cash flows from operating activities included construction allowances from landlords of $4.2 million, which funded a portion of the capital expenditures related to store leasehold improvements in new and relocated stores.
During 2012, we generated $76.0 million in cash from operating activities. Net income, adjusted for non-cash expenses, provided cash of approximately $106.3 million. Changes in operating assets and liabilities used net cash of approximately $34.5 million, which included a $66.0 million increase in merchandise inventories primarily to support the higher number of stores open and strategic investments in 2012 to support various sales initiatives and an increase in other assets of $4.8 million partially offset by an increase in accounts payable and other liabilities of $36.2 million. Additionally, cash flows from operating activities also included construction allowances from landlords amounting to $4.2 million, which funded a portion of the capital expenditures related to store leasehold improvements in new and relocated stores.
Investing Activities
Capital expenditures for 2014 were $70.6 million compared to $61.3 million in 2013 and $49.5 million in 2012. Capital expenditures during 2014 reflect increased investments in our current stores through cosmetic counter installations and store expansions, partially offset by a decrease in store openings compared to 2013 and 2012. We opened 18 new stores and relocated 7 stores in 2014. In 2013, we opened 29 new stores (including one Steele's store) and relocated 3 stores. In 2012, we opened 56 new stores (including 31 Steele's stores) and relocated 6 stores. We received construction allowances from landlords of $5.5 million in 2014 to fund a portion of the capital expenditures related to store leasehold improvements in new and relocated stores, while $4.2 million and $4.2 million were received from landlords in 2013 and 2012, respectively. These funds have been recorded as deferred rent credits in the balance sheet and are amortized as an offset to rent expense over the lease term commencing with the date the allowances were contractually earned.
We estimate that capital expenditures in 2015, net of construction allowances to be received from landlords, will be approximately $75 million. The expenditures are principally for store remodels, expansions, and relocations, new cosmetic counters, investments in technology including our direct-to-consumer business and the opening of new stores.
28
Financing Activities
On October 6, 2014, we entered into a Second Amended and Restated Credit Agreement for a $350.0 million senior secured revolving credit facility ("Revolving Credit Facility"). The Revolving Credit Facility replaces our former $250.0 million senior secured revolving credit facility, which was set to mature on June 30, 2016. The Revolving Credit Facility (i) increases availability to $300.0 million, with a seasonal increase to $350.0 million, (ii) includes a $50.0 million letter of credit subfacility, (iii) provides better pricing terms, and (iv) extends the maturity date to October 6, 2019.
We use the Revolving Credit Facility to provide financing for working capital and general corporate purposes, as well as to finance capital expenditures and to support our letter of credit requirements. Borrowings are limited to the availability under a borrowing base that is determined principally on eligible inventory as defined by the Revolving Credit Facility agreement. Inventory, cash and cash equivalents are pledged as collateral. The daily interest rates are determined by a prime rate or LIBOR, plus an applicable margin, as set forth in the Revolving Credit Facility agreement. During 2014, the weighted average interest rate on outstanding borrowings and the average daily borrowings under the Revolving Credit Facility were 1.71% and $81.4 million, respectively, as compared to 1.82% and $57.6 million in 2013.
Letters of credit issued under the Revolving Credit Facility support certain merchandise purchases and collateralize retained risks and deductibles under various insurance programs. At January 31, 2015, we had outstanding letters of credit totaling approximately $6.7 million. These letters of credit expire within twelve months of issuance. Excess borrowing availability under the Revolving Credit Facility at January 31, 2015 was $251.4 million.
The Revolving Credit Facility agreement contains covenants which, among other things, restrict, based on required levels of excess availability, (i) the amount of additional debt or capital lease obligations, (ii) the payment of dividends and repurchase of common stock under certain circumstances and (iii) related party transactions. The agreement also contains a fixed charge coverage ratio covenant in the event excess availability is below a defined threshold or an event of default has occurred. At January 31, 2015, we were in compliance with all of the financial covenants of the Revolving Credit Facility agreement and expect to remain in compliance in 2015.
On June 11, 2014, we announced that our Board approved a 12% increase in our quarterly cash dividend rate to $0.14 per share from the previous quarterly rate of $0.125 per share. The new quarterly rate of $0.14 per share is applicable to dividends declared by our Board beginning August 21, 2014. On February 20, 2015, our Board declared a quarterly cash dividend of $0.14 per share on our common stock, payable on March 18, 2015, to shareholders of record at the close of business on March 3, 2015.
Contractual Obligations
We have contractual commitments for purchases of merchandise inventories, services arising in the ordinary course of business, letters of credit, Revolving Credit Facility and other debt service and leases. The following table summarizes payments due under our contractual obligations at January 31, 2015 (in thousands). These items are discussed in further detail in Note 6 and Note 11 to the consolidated financial statements.
Payment Due by Period | ||||||||||||||||||||
Contractual Obligations(a) | Total | Less Than One Year | 1-3 Years | 4-5 Years | More than 5 Years | |||||||||||||||
Revolving Credit Facility | $ | 41,910 | $ | — | $ | — | $ | 41,910 | $ | — | ||||||||||
Documentary letters of credit (b) | 1,439 | 1,439 | — | — | — | |||||||||||||||
Capital (finance) lease obligations | ||||||||||||||||||||
Finance lease obligations | 4,725 | 962 | 2,214 | 1,549 | — | |||||||||||||||
Interest payments on finance lease obligations | 1,049 | 404 | 518 | 127 | — | |||||||||||||||
Other long-term debt obligations | 753 | 753 | — | — | — | |||||||||||||||
Operating lease obligations (c) | 454,079 | 89,763 | 152,368 | 99,925 | 112,023 | |||||||||||||||
Purchase obligations (d) | 196,399 | 184,911 | 11,396 | 92 | — | |||||||||||||||
Other long-term liabilities (e) | 3,000 | 1,000 | 2,000 | — | — | |||||||||||||||
Total contractual obligations | $ | 703,354 | $ | 279,232 | $ | 168,496 | $ | 143,603 | $ | 112,023 | ||||||||||
29
(a) The disclosure of contractual obligations in this table is based on assumptions and estimates that we believe to be reasonable as of the date of this report. Those assumptions and estimates may prove to be inaccurate; consequently, the amounts provided in the table may differ materially from those amounts that we ultimately incur. Variables that may cause the stated amounts to vary from the amounts actually incurred include, but are not limited to: the timing of termination of a contractual obligation; the acquisition of more or less services or goods under a contractual obligation than are anticipated by us as of the date of this report; fluctuations in third party fees, governmental charges, or market rates that we are obligated to pay under contracts we have with certain vendors; and the exercise of renewal options under, or the automatic renewal of, contracts that provide for the same.
(b) These documentary letters of credit support the importing of private label merchandise. We also had outstanding stand-by letters of credit that totaled approximately $5.3 million at January 31, 2015 required to collateralize retained risks and deductibles under various insurance programs. The estimated liability that will be paid in cash related to stand-by letters of credit supporting insurance programs is reflected in accrued expenses. If we fail to make payments when due, the beneficiaries of letters of credit could make demand for payment under the letters of credit.
(c) We have operating leases related to office, property and equipment. Certain operating leases have provisions for step rent or escalation payments. We record rent expense on a straight-line basis, evenly dividing rent expense over the lease term, including the build-out period, if any, and where appropriate, applicable available lease renewal option periods. However, this accounting treatment does not affect the future annual operating lease cash obligations as shown herein. We record construction allowances from landlords as a deferred rent credit when earned. Such deferred rent credit is amortized over the related term of the lease, commencing with the date we contractually earned the construction allowance, as a reduction of rent expense.
Certain leases provide for contingent rents that are not measurable at inception. These contingent rents are primarily based on a percentage of sales that are in excess of a predetermined level. These amounts are excluded from minimum rent and are included in the determination of total rent expense when it is probable that the expense has been incurred and the amount is reasonably estimable.
(d) Purchase obligations include legally binding contracts for merchandise, utility purchases, capital expenditures, software acquisition/license commitments and legally binding service contracts. For the purposes of this table, contractual obligations for purchases of goods or services are defined as agreements that are enforceable and legally binding and that specify all significant terms, including: fixed or minimum quantities to be purchased; fixed, minimum or variable price provisions; and the approximate timing of the transaction. Included in purchase obligations are outstanding purchase orders in the ordinary course of business for merchandise of $165.9 million that are typically made up to six months in advance of expected delivery. For non-merchandise purchase obligations, if the obligation to purchase goods or services is non-cancelable, the entire value of the contract is also included in the above table. If the obligation is cancelable, but we would incur liquidated damages if canceled, the dollar amount of the liquidated damages is included as a "purchase obligation." We fully expect to receive the benefits of the goods or services in connection with fulfilling our obligation under these agreements. The expected timing for payment of the obligations discussed above is estimated based on current information. Timing of payments and actual amounts paid may be different depending on the timing of receipt of goods or services or changes to agreed-upon amounts for some obligations.
(e) Other long-term liabilities consist of deferred rent, deferred compensation, pension liability, deferred revenue and other (see Note 7 to the consolidated financial statements). Deferred rent of $45.1 million is included as a component of "operating lease obligations" in the contractual obligations table. Deferred compensation and pension liability are not included in the contractual obligations table as the timing of future payments is indeterminable.
Our funding policy is to make contributions to maintain the minimum funding requirements for our pension obligations in accordance with the Employee Retirement Income Security Act of 1974, as amended ("ERISA"). We may elect to contribute additional amounts to maintain a level of funding to minimize the Pension Benefit Guaranty Corporation premium costs or to cover short-term liquidity needs of our defined benefit plan in order to maintain current invested positions. We had no minimum contribution requirements for 2013 and 2014 and we do not expect a minimum contribution requirement in 2015.
We have not included $0.6 million of current liabilities for unrecognized tax benefits and the related interest and penalties in the contractual obligations table because the timing of cash settlements is not reasonably estimable. It is reasonably possible that such tax positions may change within the next 12 months, primarily as a result of ongoing audits.
30
Critical Accounting Policies and Estimates
The preparation of financial statements in conformity with GAAP requires management to make certain estimates and assumptions that affect the amounts reported in the financial statements and accompanying notes. The primary estimates underlying our consolidated financial statements include the valuation of inventory, the estimated useful life of property, equipment and leasehold improvements, the impairment analysis on long-lived assets, the valuation of the intangible asset, the reserve for sales returns, breakage income on gift cards and merchandise credits, self-insurance reserves and the estimated liability for pension obligations. We caution that future events rarely develop exactly as forecast, and the best estimates routinely require adjustment. Therefore, actual results may differ materially from these estimates. We base our estimates on historical experience and on various assumptions which are believed to be reasonable under the circumstances. The following critical accounting policies affect our more significant judgments and estimates used in the preparation of our consolidated financial statements.
Inventory Valuation. We value merchandise inventories using the lower of cost or market with cost determined using the weighted average cost method. We capitalize distribution center costs associated with preparing inventory for sale, such as distribution payroll, benefits, occupancy, depreciation and other direct operating expenses as part of merchandise inventories. We also include in inventory the cost of freight to our distribution centers and to stores as well as duties and fees related to import purchases.
Vendor Allowances. We receive consideration from our merchandise vendors in the form of allowances and reimbursements. Given the promotional nature of our business, the allowances are generally intended to offset our costs of handling, promoting, advertising and selling the vendors' products in our stores. Vendor allowances related to the purchase of inventory are recorded as a reduction to the cost of inventory until sold. Vendor allowances are recognized as a reduction of cost of goods sold or the related selling expense when the purpose for which the vendor funds were intended to be used has been fulfilled and amounts have been authorized by vendors.
Property, Equipment and Leasehold Improvements. Additions to property, equipment and leasehold improvements are recorded at cost and depreciated over their estimated useful lives using the straight-line method. The estimated useful lives of leasehold improvements do not exceed the term of the related lease, including applicable available renewal options where appropriate. The estimated useful lives in years are generally as follows:
Buildings & improvements | 20 | |
Store and office fixtures and equipment | 5-10 | |
Warehouse equipment | 5-15 | |
Leasehold improvements - stores | 5-15 | |
Leasehold improvements - corporate office | 10-20 | |
Impairment of Long-Lived Assets. Property, plant and equipment and other long-lived assets are reviewed to determine whether any events or changes in circumstances indicate that the carrying amount of the asset may not be recoverable. For long-lived assets to be held and used, we base our evaluation on impairment indicators such as the nature of the asset's physical condition, the future economic benefit of the asset, any historical or future profitability measurements and other external market conditions or factors that may be present. If such impairment indicators are present or other factors exist that indicate the carrying amount of the asset may not be recoverable, we determine whether impairment has occurred through the use of an undiscounted cash flow analysis of the asset at the lowest level for which identifiable cash flows exist. If impairment has occurred, we recognize a loss for the difference between the carrying amount and the estimated fair value of the asset. Management's judgment is necessary to estimate fair value.
Intangible Asset and Impairment of Intangible Assets. As a part of the acquisition of Peebles in 2003, we acquired the rights to the PEEBLES trade name and trademark (collectively, the "Trademark"), which was identified as an indefinite life intangible. The value of the Trademark was determined to be $14.9 million at the time of the Peebles acquisition. Indefinite life intangible assets are not amortized but are tested for impairment annually or more frequently when indicators of impairment exist. We completed our annual impairment test during the fourth quarter of 2014 and determined there was no impairment.
31
Revenue Recognition. Our retail stores record revenue at the point of sale. Sales from our e-commerce website are recorded at the time of shipment. Shipping and handling fees charged to customers are included in net sales with the corresponding costs recorded as costs of goods sold. Total revenues do not include sales tax because we are a pass-through conduit for collecting and remitting sales taxes. Revenues are recognized net of expected returns, which we estimate using historical return patterns as a percentage of sales.
We record deferred revenue on our balance sheet for the sale of gift cards and recognize this revenue upon the redemption of gift cards in net sales. We similarly record deferred revenue on our balance sheet for merchandise credits issued related to customer returns and recognize this revenue upon the redemption of the merchandise credits.
Gift Card and Merchandise Credits Liability. Unredeemed gift cards and merchandise credits are recorded as a liability. Our gift cards and merchandise credits do not expire. Based on historical redemption rates, a small and relatively stable percentage of gift cards and merchandise credits will never be redeemed, which is referred to as "breakage." Estimated breakage income is recognized over time in proportion to actual gift card and merchandise credit redemptions. We recognized approximately $1.1 million, $1.0 million and $1.0 million of breakage income in 2014, 2013 and 2012, respectively, which is recorded as an offset to SG&A expenses.
Customer Loyalty Program. Customers who spend a required amount within a specified time frame using our private label credit card receive reward certificates which can be redeemed for merchandise. We estimate the net cost of the rewards and record a liability associated with unredeemed certificates and customer spend toward unissued certificates. The cost of the loyalty rewards program benefit is recorded in cost of sales.
Self-Insurance Reserves. We maintain self-insurance retentions with respect to general liability, workers compensation and health benefits for our employees. We estimate the accruals for the liabilities based on industry development factors and historical claim trend experience. Although management believes adequate reserves have been provided for expected liabilities arising from our self-insured obligations, projections of future losses are inherently uncertain, and it is reasonably possible that estimates of these liabilities will change over the near term as circumstances develop.
Frozen Defined Benefit Plan. We maintain a frozen defined benefit plan. The plan's obligations and related assets are presented in Note 13 to the consolidated financial statements. The plan's assets are invested in actively managed and indexed mutual funds of domestic and international equities and investment-grade corporate bonds and U.S. government securities. The plan's obligations and the annual pension expense are determined by independent actuaries using a number of assumptions. Key assumptions in measuring the plan's obligations include the discount rate applied to future benefit obligations and the estimated future return on plan assets. At January 31, 2015, assumptions used were a weighted average discount rate of 3.9% and a weighted average long-term rate of return on the plan assets of 7.0%.
Recent Accounting Standards and Disclosures
In April 2014, the Financial Accounting Standards Board ("FASB") issued Accounting Standards Update ("ASU") No. 2014-08, Presentation of Financial Statements (Topic 205) and Property, Plant, and Equipment (Topic 360): Reporting Discontinued Operations and Disclosures of Disposals of Components of an Entity, which changes the criteria for reporting discontinued operations and also requires additional disclosures about discontinued operations. For public companies, the standard is effective prospectively for disposals that occur beginning on or after December 15, 2014, and interim periods within those years, with early adoption permitted. We did not early adopt this ASU.
In May 2014, the FASB issued ASU 2014-09, Revenue from Contracts with Customers (Topic 606), which provides a five-step analysis of transactions to determine when and how revenue is recognized. The core principle of the guidance is that a company should recognize revenue when it transfers promised goods or services to customers in an amount that reflects what a company expects to be entitled to in exchange for those goods or services. This update will be effective for us retrospectively in the first quarter of 2017 with early adoption not permitted. We are currently assessing the impact this ASU will have on our financial statements.
32
ITEM 7A. QUANTITATIVE AND QUALITATIVE DISCLOSURES ABOUT MARKET RISK
Borrowings under our Revolving Credit Facility bear a floating rate of interest. As of January 31, 2015, the outstanding borrowings under our Revolving Credit Facility were $41.9 million. On future borrowings, an increase in interest rates may have a negative impact on our results of operations and cash flows. During 2014, we had average daily borrowings of $81.4 million bearing a weighted average interest rate of 1.71%. A hypothetical 10% change from the weighted average interest rate would have a $0.1 million effect on our 2014 annual results of operations and cash flows.
ITEM 8. FINANCIAL STATEMENTS AND SUPPLEMENTARY DATA
See "Index to Consolidated Financial Statements of Stage Stores, Inc." included on page F-1 for information required under this Item 8.
ITEM 9. | CHANGES IN AND DISAGREEMENTS WITH ACCOUNTANTS ON ACCOUNTING AND FINANCIAL DISCLOSURE |
Not applicable.
33
ITEM 9A. CONTROLS AND PROCEDURES
Evaluation of Disclosure Controls and Procedures
Management, with the participation of our Chief Executive Officer and Chief Financial Officer, has evaluated the effectiveness of our disclosure controls and procedures, as that term is defined in Rules 13a-15(e) and 15d-15(e) of the Securities Exchange Act of 1934, as amended ("Exchange Act"), as of the end of the period covered by this report. Based on that evaluation, our Chief Executive Officer and Chief Financial Officer have each concluded that such disclosure controls and procedures were effective as of the end of the period covered by this report.
Management's Annual Report on Internal Control Over Financial Reporting
Management is responsible for establishing and maintaining adequate internal control over financial reporting, as defined in Rules 13a-15(f) and 15d-15(f) of the Exchange Act. Our internal control over financial reporting is designed to provide reasonable assurance regarding the reliability of financial reporting and the preparation of financial statements for external purposes in accordance with accounting principles generally accepted in the United States of America.
Our internal control over financial reporting includes those policies and procedures that (i) pertain to the maintenance of records that, in reasonable detail, accurately and fairly reflect the transactions and dispositions of our assets; (ii) provide reasonable assurance that transactions are recorded as necessary to permit preparation of financial statements in accordance with generally accepted accounting principles, and that our receipts and expenditures are being made only in accordance with authorizations of management and our directors; and (iii) provide reasonable assurance regarding prevention or timely detection of unauthorized acquisition, use, or disposition of our assets that could have a material effect on the financial statements, and provide reasonable assurance as to the detection of fraud.
Because of its inherent limitations, a system of internal control over financial reporting can provide only reasonable assurance and may not prevent or detect misstatements. Further, because of changes in conditions, effectiveness of internal controls over financial reporting may vary over time.
Our management, with the participation of our Chief Executive Officer and Chief Financial Officer, evaluated the effectiveness of our disclosure controls and procedures based on the framework and criteria established in Internal Control-Integrated Framework (2013), issued by the Committee of Sponsoring Organizations of the Treadway Commission and concluded that our internal control over financial reporting was effective as of January 31, 2015.
Our independent registered public accounting firm, Deloitte & Touche LLP, with direct access to our Board of Directors through our Audit Committee, has audited the consolidated financial statements we prepared and issued an attestation report on the effectiveness of our internal control over financial reporting. The report appears in the Consolidated Financial Statements section of this Form10-K.
Changes in Internal Control over Financial Reporting
Management, with the participation of our Chief Executive Officer and Chief Financial Officer, evaluated the internal control over financial reporting and concluded that no change in our internal control over financial reporting occurred during the fourth quarter ended January 31, 2015 that has materially affected, or is reasonably likely to materially affect, our internal control over financial reporting.
ITEM 9B. OTHER INFORMATION
Not applicable.
34
PART III
ITEM 10. | DIRECTORS, EXECUTIVE OFFICERS AND CORPORATE GOVERNANCE |
The following information pertains to our executive officers as of March 24, 2015:
Name | Age | Position | ||
Michael L. Glazer | 66 | President and Chief Executive Officer, Director | ||
Steven P. Lawrence | 47 | Chief Merchandising Officer | ||
William E. Gentner | 46 | Executive Vice President, Chief Marketing Officer | ||
Steven L. Hunter | 44 | Executive Vice President, Chief Information Officer | ||
Russell A. Lundy | 52 | Executive Vice President, Chief Stores Officer | ||
Stephen B. Parsons | 50 | Executive Vice President, Chief Human Resources Officer | ||
Oded Shein | 53 | Executive Vice President, Chief Financial Officer | ||
Chadwick P. Reynolds | 41 | Senior Vice President, Chief Legal Officer and Secretary | ||
Richard E. Stasyszen | 54 | Senior Vice President, Finance and Controller | ||
Mr. Glazer joined us in April 2012 as President and Chief Executive Officer. He has served as a member of our Board since August 2001. Mr. Glazer served as the President and CEO of Mattress Giant Corporation from October 2009 to April 2012.
Mr. Lawrence joined us in April 2012 as Chief Merchandising Officer. Previously, he spent 11 years with J.C. Penney Company, Inc., where he was most recently Co-Chief Merchant EVP GMM Men's, Kids & Home. Prior to joining J.C. Penney, Mr. Lawrence spent 11 years at the former Foley's Department Stores, where he held various merchandising positions of increasing responsibility.
Mr. Gentner joined us in June 2012 as Senior Vice President, Marketing and was promoted to Executive Vice President, Chief Marketing Officer in June 2014. From June 2007 to June 2012, he served in various marketing positions at J.C. Penney Company, Inc., including Senior Vice President, Strategic Brands and Senior Vice President, Marketing Planning and Promotions.
Mr. Hunter joined us in June 2008 as Senior Vice President, Chief Information Officer and was promoted to Executive Vice President, Chief Information Officer in March 2010. From May 2003 to June 2008, he served as Senior Vice President of Information Technology at Belk, Inc.
Mr. Lundy joined us in November 2003 as Senior Vice President, Stores, was promoted to Executive Vice President, Stores in January 2013, and to Executive Vice President, Chief Stores Officer in October 2014. Prior to joining us, he spent 27 years with Peebles, Inc.
Mr. Parsons joined us in April 2014 as Executive Vice President, Chief Human Resources Officer. From July 2011 to December 2013, he served as Chief Human Resources Officer of OfficeMax Incorporated. Prior to joining OfficeMax, Mr. Parsons served from June 2007 to July 2011 as the Senior Vice President - Human Resources & Labor Relations of Rite Aid Corporation.
Mr. Shein joined us in January 2011 as Executive Vice President, Chief Financial Officer. From July 2004 to January 2011, he served in various financial positions at Belk, Inc., including Vice President, Finance and Vice President and Treasurer. Prior to joining Belk, Inc., Mr. Shein served as the Vice President, Treasurer of Charming Shoppes, Inc.
Mr. Reynolds joined us in August 2014 as Senior Vice President, Chief Legal Officer and Secretary. Previously, he spent 16 years with Big Lots, Inc., where he most recently served as Vice President, Deputy General Counsel and Assistant Corporate Secretary from March 2009 to August 2014.
Mr. Stasyszen joined us in March 1998 as Assistant Controller and was promoted to Vice President and Controller in February 1999. In July 2001, he was promoted to Senior Vice President, Finance and Controller.
35
The remaining information called for by this item, including with respect to our directors, shareholder nomination procedures, code of ethics, Audit Committee, audit committee financial experts, and Section 16(a) beneficial ownership reporting compliance, is incorporated herein by reference "Item 1: Election of Directors," "Governance," "Security Ownership of Certain Beneficial Owners and Management" and "Section 16(a) Beneficial Ownership Reporting Compliance" in the Proxy Statement.
ITEM 11. EXECUTIVE COMPENSATION
Information regarding executive compensation, Compensation Committee interlocks and insider participation, director compensation, and the Compensation Committee Report called for by this item is incorporated herein by reference to "Governance," "Compensation Committee Interlocks and Insider Participation," "Executive Compensation," "Director Compensation" and "Compensation Committee Report" in the Proxy Statement.
ITEM 12. | SECURITY OWNERSHIP OF CERTAIN BENEFICIAL OWNERS AND MANAGEMENT AND RELATED STOCKHOLDER MATTERS |
Information regarding the security ownership of certain beneficial owners and management and related stockholder matters called for by this item is incorporated herein by reference to "Security Ownership of Certain Beneficial Owners and Management" in the Proxy Statement. The remaining information called for by this item is incorporated by reference to "Equity Compensation Plan Information" in the Proxy Statement.
ITEM 13. | CERTAIN RELATIONSHIPS AND RELATED TRANSACTIONS, AND DIRECTOR INDEPENDENCE |
Information regarding our review of director independence and transactions with related persons called for by this item is incorporated herein by reference to "Item 1: Election of Directors," "Governance" and "Transactions with Related Persons" in the Proxy Statement.
ITEM 14. PRINCIPAL ACCOUNTANT FEES AND SERVICES
Information regarding fees billed to us by our independent registered public accounting firm, Deloitte & Touche LLP, and our Audit Committee's pre-approval policies and procedures called for by this item is incorporated herein by reference to "Audit Committee Matters" in the Proxy Statement.
36
PART IV
ITEM 15. EXHIBITS AND FINANCIAL STATEMENT SCHEDULES
(a) | Documents filed as part of this report: |
1. Financial Statements:
See "Index to Consolidated Financial Statements of Stage Stores, Inc." on page F-1, the Report of Independent Registered Public Accounting Firm on page F-2, and the Financial Statements on pages F-3 to F-30, of this Form 10-K, all of which are incorporated herein by reference.
2. Financial Statement Schedules:
All schedules are omitted because they are not applicable or not required or because the required information is shown in the Consolidated Financial Statements or Notes thereto on pages F-3 to F-30, which are incorporated herein by reference.
3. Exhibits Index:
The following documents are the exhibits to this Form 10-K. Copies of exhibits will be furnished upon written request and payment of our reasonable expenses in furnishing the exhibits.
Exhibit
Number Description
37
38
39
101.INS* | XBRL Instance Document |
101.SCH* | XBRL Taxonomy Extension Schema Document |
101.CAL* | XBRL Taxonomy Extension Calculation Linkbase Document |
101.DEF* | XBRL Taxonomy Extension Definition Linkbase Document |
101.LAB* | XBRL Taxonomy Extension Label Linkbase Document |
101.PRE* | XBRL Taxonomy Extension Presentation Linkbase Document |
_________________________________________
* | Filed electronically herewith. |
† | Management contract or compensatory plan or arrangement. |
# | Certain confidential portions have been omitted pursuant to a confidential treatment request that has been filed separately with the Securities and Exchange Commission. |
40
SIGNATURES
Pursuant to the requirements of Section 13 or 15(d) of the Securities Exchange Act of 1934, the registrant has duly caused this report to be signed on its behalf by the undersigned, thereunto duly authorized.
STAGE STORES, INC. | |
/s/ Michael L. Glazer | April 1, 2015 |
Michael L. Glazer | |
President and Chief Executive Officer | |
(Principal Executive Officer) | |
STAGE STORES, INC. | |
/s/ Oded Shein | April 1, 2015 |
Oded Shein | |
Executive Vice President, Chief Financial Officer and Treasurer | |
(Principal Financial Officer) | |
STAGE STORES, INC. | |
/s/ Richard E. Stasyszen | April 1, 2015 |
Richard E. Stasyszen | |
Senior Vice President, Finance and Controller | |
(Principal Accounting Officer) | |
Pursuant to the requirements of the Securities Exchange Act of 1934, this report has been signed below by the following persons on behalf of the registrant and in the capacities and on the dates indicated.
* | Director | April 1, 2015 | * | Director | April 1, 2015 | |||||
Alan J. Barocas | Earl J. Hesterberg | |||||||||
* | Director | April 1, 2015 | * | Director | April 1, 2015 | |||||
Elaine D. Crowley | Lisa R. Kranc | |||||||||
* | Director | April 1, 2015 | * | Director | April 1, 2015 | |||||
Diane M. Ellis | William J. Montgoris | |||||||||
/s/ Michael L. Glazer | Director | April 1, 2015 | * | Director | April 1, 2015 | |||||
Michael L. Glazer | C. Clayton Reasor | |||||||||
* | Director | April 1, 2015 | * | Director | April 1, 2015 | |||||
Gabrielle E. Greene-Sulzberger | Ralph P. Scozzafava | |||||||||
(Constituting a majority of the Board of Directors) | ||||||||||
*By: | /s/ Oded Shein | |||||||||
Oded Shein | ||||||||||
Attorney-in-Fact | ||||||||||
41
INDEX TO CONSOLIDATED FINANCIAL STATEMENTS OF STAGE STORES, INC. | ||
Page | ||
F-1
REPORT OF INDEPENDENT REGISTERED PUBLIC ACCOUNTING FIRM
To the Board of Directors and Stockholders of Stage Stores, Inc.
Houston, Texas
We have audited the accompanying consolidated balance sheets of Stage Stores, Inc. and subsidiary (the "Company") as of January 31, 2015 and February 1, 2014, and the related consolidated statements of income, comprehensive income, stockholders' equity, and cash flows for each of the three years in the period ended January 31, 2015. We also have audited the Company's internal control over financial reporting as of January 31, 2015, based on criteria established in Internal Control - Integrated Framework (2013) issued by the Committee of Sponsoring Organizations of the Treadway Commission. The Company's management is responsible for these financial statements, for maintaining effective internal control over financial reporting, and for its assessment of the effectiveness of internal control over financial reporting, included in Management’s Annual Report on Internal Control Over Financial Reporting. Our responsibility is to express an opinion on these financial statements and an opinion on the Company's internal control over financial reporting based on our audits.
We conducted our audits in accordance with the standards of the Public Company Accounting Oversight Board (United States). Those standards require that we plan and perform the audit to obtain reasonable assurance about whether the financial statements are free of material misstatement and whether effective internal control over financial reporting was maintained in all material respects. Our audits of the financial statements included examining, on a test basis, evidence supporting the amounts and disclosures in the financial statements, assessing the accounting principles used and significant estimates made by management, and evaluating the overall financial statement presentation. Our audit of internal control over financial reporting included obtaining an understanding of internal control over financial reporting, assessing the risk that a material weakness exists, and testing and evaluating the design and operating effectiveness of internal control based on the assessed risk. Our audits also included performing such other procedures as we considered necessary in the circumstances. We believe that our audits provide a reasonable basis for our opinions.
A company's internal control over financial reporting is a process designed by, or under the supervision of, the company's principal executive and principal financial officers, or persons performing similar functions, and effected by the company's board of directors, management, and other personnel to provide reasonable assurance regarding the reliability of financial reporting and the preparation of financial statements for external purposes in accordance with generally accepted accounting principles. A company's internal control over financial reporting includes those policies and procedures that (1) pertain to the maintenance of records that, in reasonable detail, accurately and fairly reflect the transactions and dispositions of the assets of the company; (2) provide reasonable assurance that transactions are recorded as necessary to permit preparation of financial statements in accordance with generally accepted accounting principles, and that receipts and expenditures of the company are being made only in accordance with authorizations of management and directors of the company; and (3) provide reasonable assurance regarding prevention or timely detection of unauthorized acquisition, use, or disposition of the company's assets that could have a material effect on the financial statements.
Because of the inherent limitations of internal control over financial reporting, including the possibility of collusion or improper management override of controls, material misstatements due to error or fraud may not be prevented or detected on a timely basis. Also, projections of any evaluation of the effectiveness of the internal control over financial reporting to future periods are subject to the risk that the controls may become inadequate because of changes in conditions, or that the degree of compliance with the policies or procedures may deteriorate.
In our opinion, the consolidated financial statements referred to above present fairly, in all material respects, the financial position of Stage Stores, Inc. and subsidiary as of January 31, 2015 and February 1, 2014, and the results of their operations and their cash flows for each of the three years in the period ended January 31, 2015, in conformity with accounting principles generally accepted in the United States of America. Also, in our opinion, the Company maintained, in all material respects, effective internal control over financial reporting as of January 31, 2015, based on the criteria established in Internal Control - Integrated Framework (2013) issued by the Committee of Sponsoring Organizations of the Treadway Commission.
/s/ DELOITTE & TOUCHE LLP
Houston, Texas
April 1, 2015
F-2
Stage Stores, Inc. | |||||||
Consolidated Balance Sheets | |||||||
(in thousands, except par value) | |||||||
January 31, 2015 | February 1, 2014 | ||||||
ASSETS | |||||||
Cash and cash equivalents | $ | 17,165 | $ | 14,762 | |||
Merchandise inventories, net | 441,452 | 434,407 | |||||
Prepaid expenses and other current assets | 45,444 | 40,082 | |||||
Total current assets | 504,061 | 489,251 | |||||
Property, equipment and leasehold improvements, net | 285,450 | 282,534 | |||||
Intangible asset | 14,910 | 14,910 | |||||
Other non-current assets, net | 20,256 | 24,142 | |||||
Total assets | $ | 824,677 | $ | 810,837 | |||
LIABILITIES AND STOCKHOLDERS' EQUITY | |||||||
Accounts payable | $ | 121,778 | $ | 125,707 | |||
Income taxes payable | 13,455 | 5,345 | |||||
Current portion of debt obligations | 1,715 | 2,354 | |||||
Accrued expenses and other current liabilities | 67,834 | 61,850 | |||||
Total current liabilities | 204,782 | 195,256 | |||||
Long-term debt obligations | 45,673 | 60,871 | |||||
Deferred taxes | 20,474 | 15,644 | |||||
Other long-term liabilities | 77,818 | 84,622 | |||||
Total liabilities | 348,747 | 356,393 | |||||
Commitments and contingencies | |||||||
Common stock, par value $0.01, 100,000 shares authorized, 31,632 and 31,222 shares issued, respectively | 316 | 312 | |||||
Additional paid-in capital | 395,395 | 384,295 | |||||
Less treasury stock - at cost, 0 and 0 shares, respectively | (600 | ) | (967 | ) | |||
Accumulated other comprehensive loss | (6,874 | ) | (4,616 | ) | |||
Retained earnings | 87,693 | 75,420 | |||||
Total stockholders' equity | 475,930 | 454,444 | |||||
Total liabilities and stockholders' equity | $ | 824,677 | $ | 810,837 | |||
The accompanying notes are an integral part of these consolidated financial statements.
F-3
Stage Stores, Inc. | |||||||||||
Consolidated Statements of Operations and Comprehensive Income | |||||||||||
(in thousands, except earnings per share) | |||||||||||
Fiscal Year | |||||||||||
2014 | 2013 | 2012 | |||||||||
Net sales | $ | 1,638,569 | $ | 1,609,481 | $ | 1,627,702 | |||||
Cost of sales and related buying, occupancy and distribution expenses | 1,188,763 | 1,172,995 | 1,168,907 | ||||||||
Gross profit | 449,806 | 436,486 | 458,795 | ||||||||
Selling, general and administrative expenses | 383,616 | 390,224 | 387,332 | ||||||||
Store opening costs | 2,488 | 2,902 | 2,163 | ||||||||
Interest expense | 3,002 | 2,744 | 3,011 | ||||||||
Income from continuing operations before income tax | 60,700 | 40,616 | 66,289 | ||||||||
Income tax expense | 22,847 | 15,400 | 24,373 | ||||||||
Income from continuing operations | 37,853 | 25,216 | 41,916 | ||||||||
Loss from discontinued operations, net of tax benefit of $4,228, $5,237 and $2,172, respectively | (7,003 | ) | (8,574 | ) | (3,737 | ) | |||||
Net income | $ | 30,850 | $ | 16,642 | $ | 38,179 | |||||
Other comprehensive income (loss): | |||||||||||
Employee benefit related adjustment, net of tax of ($1,505), $683, ($992), respectively | $ | (2,507 | ) | $ | 1,138 | $ | (1,645 | ) | |||
Amortization of employee benefit related costs, net of tax of $150, $229, and $156, respectively | 249 | 381 | 258 | ||||||||
Total other comprehensive income (loss) | (2,258 | ) | 1,519 | (1,387 | ) | ||||||
Comprehensive income | $ | 28,592 | $ | 18,161 | $ | 36,792 | |||||
Basic earnings per share data: | |||||||||||
Continuing operations | $ | 1.18 | $ | 0.78 | $ | 1.32 | |||||
Discontinued operations | $ | (0.22 | ) | $ | (0.27 | ) | $ | (0.12 | ) | ||
Basic earnings per share | $ | 0.96 | $ | 0.51 | $ | 1.20 | |||||
Basic weighted average shares outstanding | 31,675 | 32,034 | 31,278 | ||||||||
Diluted earnings per share data: | |||||||||||
Continuing operations | $ | 1.18 | $ | 0.77 | $ | 1.31 | |||||
Discontinued operations | $ | (0.22 | ) | $ | (0.26 | ) | $ | (0.12 | ) | ||
Diluted earnings per share | $ | 0.96 | $ | 0.51 | $ | 1.19 | |||||
Diluted weighted average shares outstanding | 31,763 | 32,311 | 31,600 | ||||||||
The accompanying notes are an integral part of these consolidated financial statements.
F-4
Stage Stores, Inc. | |||||||||||
Consolidated Statements of Cash Flows | |||||||||||
(in thousands) | |||||||||||
Fiscal Year | |||||||||||
2014 | 2013 | 2012 | |||||||||
Cash flows from operating activities: | |||||||||||
Net income | $ | 30,850 | $ | 16,642 | $ | 38,179 | |||||
Adjustments to reconcile net income to net cash provided by operating activities: | |||||||||||
Depreciation, amortization and impairment of long-lived assets | 63,447 | 69,925 | 60,426 | ||||||||
Loss on retirements of property, equipment and leasehold improvements | 110 | 860 | 454 | ||||||||
Deferred income taxes | 3,348 | (808 | ) | 1,108 | |||||||
Tax benefit (deficiency) from stock-based compensation | 64 | 1,761 | (1,311 | ) | |||||||
Stock-based compensation expense | 9,664 | 8,417 | 7,803 | ||||||||
Amortization of debt issuance costs | 275 | 279 | 417 | ||||||||
Excess tax benefits from stock-based compensation | (852 | ) | (2,076 | ) | (1,024 | ) | |||||
Deferred compensation obligation | (367 | ) | 266 | (134 | ) | ||||||
Amortization of employee benefit related costs | 399 | 610 | 414 | ||||||||
Construction allowances from landlords | 5,538 | 4,162 | 4,193 | ||||||||
Other changes in operating assets and liabilities: | |||||||||||
Increase in merchandise inventories | (7,045 | ) | (20,479 | ) | (65,984 | ) | |||||
Increase in other assets | (1,737 | ) | (6,375 | ) | (4,802 | ) | |||||
Increase (decrease) in accounts payable and other liabilities | (1,480 | ) | (26,657 | ) | 36,242 | ||||||
Net cash provided by operating activities | 102,214 | 46,527 | 75,981 | ||||||||
Cash flows from investing activities: | |||||||||||
Additions to property, equipment and leasehold improvements | (70,580 | ) | (61,263 | ) | (49,489 | ) | |||||
Proceeds from insurance and disposal of assets | 2,946 | 27 | 50 | ||||||||
Net cash used in investing activities | (67,634 | ) | (61,236 | ) | (49,439 | ) | |||||
Cash flows from financing activities: | |||||||||||
Proceeds from revolving credit facility borrowings | 457,742 | 494,885 | 357,910 | ||||||||
Payments of revolving credit facility borrowings | (471,227 | ) | (445,490 | ) | (376,410 | ) | |||||
Payments of long-term debt obligations | (2,352 | ) | (744 | ) | (18,674 | ) | |||||
Payments of debt issuance costs | (663 | ) | (128 | ) | — | ||||||
Repurchases of common stock | (2,755 | ) | (31,367 | ) | (61 | ) | |||||
Payments for stock related compensation | (1,844 | ) | (2,381 | ) | (326 | ) | |||||
Proceeds from issuance of equity awards | 5,040 | 10,149 | 21,306 | ||||||||
Excess tax benefits from stock-based compensation | 852 | 2,076 | 1,024 | ||||||||
Cash dividends paid | (16,970 | ) | (15,466 | ) | (11,995 | ) | |||||
Net cash provided by (used in) financing activities | (32,177 | ) | 11,534 | (27,226 | ) | ||||||
Net increase (decrease) in cash and cash equivalents | 2,403 | (3,175 | ) | (684 | ) | ||||||
Cash and cash equivalents: | |||||||||||
Beginning of period | 14,762 | 17,937 | 18,621 | ||||||||
End of period | $ | 17,165 | $ | 14,762 | $ | 17,937 | |||||
Supplemental disclosures including non-cash investing and financing activities: | |||||||||||
Interest paid | $ | 2,733 | $ | 2,392 | $ | 2,679 | |||||
Income taxes paid | 7,084 | 18,789 | 13,674 | ||||||||
Unpaid liabilities for capital expenditures | 3,168 | 4,918 | 5,176 | ||||||||
The accompanying notes are an integral part of these consolidated financial statements.
F-5
Stage Stores, Inc. | |||||||||||||||||||||||||||||
Consolidated Statements of Stockholders' Equity | |||||||||||||||||||||||||||||
(in thousands, except per share amounts) | |||||||||||||||||||||||||||||
Common Stock | Additional Paid-in Capital | Treasury Stock | Accumulated Other Comprehensive Loss | Retained Earnings | |||||||||||||||||||||||||
Shares | Amount | Shares | Amount | Total | |||||||||||||||||||||||||
Balance, January 28, 2012 | 30,444 | $ | 304 | $ | 349,366 | — | $ | (835 | ) | $ | (4,748 | ) | $ | 68,619 | $ | 412,706 | |||||||||||||
Net income | — | — | — | — | — | — | 38,179 | 38,179 | |||||||||||||||||||||
Other comprehensive loss | — | — | — | — | — | (1,387 | ) | — | (1,387 | ) | |||||||||||||||||||
Dividends on common stock, $0.38 per share | — | — | — | — | — | — | (11,995 | ) | (11,995 | ) | |||||||||||||||||||
Deferred compensation | — | — | (134 | ) | — | 134 | — | — | — | ||||||||||||||||||||
Repurchases of common stock | — | — | — | (4 | ) | (61 | ) | — | — | (61 | ) | ||||||||||||||||||
Retirement of treasury stock | (4 | ) | — | (29 | ) | 4 | 61 | — | (32 | ) | — | ||||||||||||||||||
Issuance of equity awards, net | 1,574 | 16 | 21,290 | — | — | — | — | 21,306 | |||||||||||||||||||||
Tax withholdings paid for net settlement of stock awards | — | — | (460 | ) | — | — | — | — | (460 | ) | |||||||||||||||||||
Stock-based compensation expense | — | — | 7,803 | — | — | — | — | 7,803 | |||||||||||||||||||||
Tax deficiency from stock-based compensation | — | — | (1,311 | ) | — | — | — | — | (1,311 | ) | |||||||||||||||||||
Recognition of pre-reorganization deferred tax assets | — | — | 90 | — | — | — | — | 90 | |||||||||||||||||||||
Balance, February 2, 2013 | 32,014 | $ | 320 | $ | 376,615 | — | $ | (701 | ) | $ | (6,135 | ) | $ | 94,771 | $ | 464,870 | |||||||||||||
Net income | — | — | — | — | — | — | 16,642 | 16,642 | |||||||||||||||||||||
Other comprehensive income | — | — | — | — | — | 1,519 | — | 1,519 | |||||||||||||||||||||
Dividends on common stock, $0.475 per share | — | — | — | — | — | — | (15,466 | ) | (15,466 | ) | |||||||||||||||||||
Deferred compensation | — | — | 266 | — | (266 | ) | — | — | — | ||||||||||||||||||||
Repurchases of common stock | — | — | — | (1,626 | ) | (31,367 | ) | — | — | (31,367 | ) | ||||||||||||||||||
Retirement of treasury stock | (1,626 | ) | (16 | ) | (10,824 | ) | 1,626 | 31,367 | — | (20,527 | ) | — | |||||||||||||||||
Issuance of equity awards, net | 834 | 8 | 10,141 | — | — | — | — | 10,149 | |||||||||||||||||||||
Tax withholdings paid for net settlement of stock awards | — | — | (2,115 | ) | — | — | — | — | (2,115 | ) | |||||||||||||||||||
Stock-based compensation expense | — | — | 8,417 | — | — | — | — | 8,417 | |||||||||||||||||||||
Tax benefit from stock-based compensation | — | — | 1,761 | — | — | — | — | 1,761 | |||||||||||||||||||||
Recognition of pre-reorganization deferred tax assets | — | — | 34 | — | — | — | — | 34 | |||||||||||||||||||||
Balance, February 1, 2014 | 31,222 | $ | 312 | $ | 384,295 | — | $ | (967 | ) | $ | (4,616 | ) | $ | 75,420 | $ | 454,444 | |||||||||||||
Net income | — | — | — | — | — | — | 30,850 | 30,850 | |||||||||||||||||||||
Other comprehensive loss | — | — | — | — | — | (2,258 | ) | — | (2,258 | ) | |||||||||||||||||||
Dividends on common stock, $0.53 per share | — | — | — | — | — | — | (16,970 | ) | (16,970 | ) | |||||||||||||||||||
Deferred compensation | — | — | (367 | ) | — | 367 | — | — | — | ||||||||||||||||||||
Repurchases of common stock | — | — | — | (172 | ) | (2,755 | ) | — | — | (2,755 | ) | ||||||||||||||||||
Retirement of treasury stock | (172 | ) | (2 | ) | (1,146 | ) | 172 | 2,755 | (1,607 | ) | — | ||||||||||||||||||
Issuance of equity awards, net | 582 | 6 | 5,034 | — | — | — | — | 5,040 | |||||||||||||||||||||
Tax withholdings paid for net settlement of stock awards | — | — | (2,211 | ) | — | — | — | — | (2,211 | ) | |||||||||||||||||||
Stock-based compensation expense | — | — | 9,664 | — | — | — | — | 9,664 | |||||||||||||||||||||
Tax benefit from stock-based compensation | — | — | 64 | — | — | — | — | 64 | |||||||||||||||||||||
Recognition of pre-reorganization deferred tax assets | — | — | 62 | — | — | — | — | 62 | |||||||||||||||||||||
Balance, January 31, 2015 | 31,632 | $ | 316 | $ | 395,395 | — | $ | (600 | ) | $ | (6,874 | ) | $ | 87,693 | $ | 475,930 | |||||||||||||
The accompanying notes are an integral part of these consolidated financial statements.
F-6
Stage Stores, Inc.
Notes to Consolidated Financial Statements
NOTE 1 - DESCRIPTION OF BUSINESS AND SIGNIFICANT ACCOUNTING POLICIES
Description of Business. We are a retailer operating specialty department stores primarily in small and mid-sized towns and communities. Our merchandise assortment is a well-edited selection of moderately priced brand name and private label apparel, accessories, cosmetics, footwear and home goods. As of January 31, 2015, we operated 854 specialty department stores located in 40 states under the BEALLS, GOODY’S, PALAIS ROYAL, PEEBLES and STAGE nameplates and a direct-to-consumer business.
On March 7, 2014, we divested Steele's, an off-price concept that we launched in November 2011, in order to focus solely on our core specialty department store business. Accordingly, the results of operations of Steele's and loss on the sale are reflected in discontinued operations for all periods presented.
Principles of Consolidation. The consolidated financial statements include the accounts of Stage Stores, Inc. and its subsidiary. All intercompany transactions have been eliminated in consolidation. We report our specialty department stores and e-commerce website in a single operating segment. Revenues from customers are derived from merchandise sales. We do not rely on any major customer as a source of revenue.
Fiscal Year. References to a particular year are to our fiscal year, which is the 52- or 53-week period ending on the Saturday closest to January 31st of the following calendar year.
Fiscal Year | Ended | Weeks |
2014 | January 31, 2015 | 52 |
2013 | February 1, 2014 | 52 |
2012 | February 2, 2013 | 53 |
Use of Estimates. The preparation of financial statements in conformity with GAAP requires management to make certain estimates and assumptions that affect the amounts reported in the financial statements and accompanying notes. On an ongoing basis, we evaluate our estimates, including those related to inventory, deferred tax assets, intangible asset, long-lived assets, sales returns, gift card breakage, pension obligations, self-insurance and contingent liabilities. Actual results may differ materially from these estimates. We base our estimates on historical experience and on various assumptions which are believed to be reasonable under the circumstances.
Cash and Cash Equivalents. We consider highly liquid investments with initial maturities of less than three months to be cash equivalents.
Concentration of Credit Risk. Financial instruments which potentially subject us to concentrations of credit risk are primarily cash. Our cash management and investment policies restrict investments to low-risk, highly-liquid securities and we perform periodic evaluations of the relative credit standing of the financial institutions with which we deal.
Merchandise Inventories. We value merchandise inventories using the lower of cost or market with cost determined using the weighted average cost method. We capitalize distribution center costs associated with preparing inventory for sale, such as distribution payroll, benefits, occupancy, depreciation and other direct operating expenses as part of merchandise inventories. We also include in inventory the cost of freight to our distribution centers and to stores as well as duties and fees related to import purchases.
Vendor Allowances. We receive consideration from our merchandise vendors in the form of allowances and reimbursements. Given the promotional nature of our business, the allowances are generally intended to offset our costs of handling, promoting, advertising and selling the vendors' products in our stores. Vendor allowances related to the purchase of inventory are recorded as a reduction to the cost of inventory until sold. Vendor allowances are recognized as a reduction of cost of goods sold or the related selling expense when the purpose for which the vendor funds were intended to be used has been fulfilled and amounts have been authorized by vendors. As part our South Hill Consolidation (see Note 16), we changed the method of collecting advertising allowances from our vendors resulting in a reduction in the amount of these allowances considered as a reimbursement for specific, incremental, identifiable costs incurred to sell vendors' products. Accordingly, beginning in 2013, the majority of advertising allowances are recorded as a reduction to the cost of merchandise purchases.
F-7
Stock-Based Compensation. We recognize as compensation expense an amount equal to the fair value of share-based payments granted to employees and independent directors, net of estimated forfeitures. That cost is recognized ratably in SG&A expense over the period during which an employee or independent director is required to provide service in exchange for the award.
Property, Equipment and Leasehold Improvements. Additions to property, equipment and leasehold improvements are recorded at cost and depreciated over their estimated useful lives using the straight-line method. The estimated useful lives of leasehold improvements do not exceed the term of the related lease, including applicable available renewal options where appropriate. The estimated useful lives in years are generally as follows:
Buildings & improvements | 20 | ||
Store and office fixtures and equipment | 5 | - | 10 |
Warehouse equipment | 5 | - | 15 |
Leasehold improvements - stores | 5 | - | 15 |
Leasehold improvements - corporate office | 10 | - | 20 |
Impairment of Long-Lived Assets. Property, plant and equipment and other long-lived assets are reviewed to determine whether any events or changes in circumstances indicate that the carrying amount of the asset may not be recoverable. For long-lived assets to be held and used, we base our evaluation on impairment indicators such as the nature of the asset's physical condition, the future economic benefit of the asset, any historical or future profitability measurements and other external market conditions or factors that may be present. If such impairment indicators are present or other factors exist that indicate the carrying amount of the asset may not be recoverable, we determine whether impairment has occurred through the use of an undiscounted cash flows analysis of the asset at the lowest level for which identifiable cash flows exist. If impairment has occurred, we recognize a loss for the difference between the carrying amount and the estimated fair value of the asset. Management's judgment is necessary to estimate fair value.
Intangible Asset and Impairment of Intangible Assets. As a part of the acquisition of Peebles in 2003, we acquired the rights to the PEEBLES trade name and trademark (collectively the "Trademark"), which was identified as an indefinite life intangible. The value of the Trademark was determined to be $14.9 million at the time of the Peebles acquisition. Indefinite life intangible assets are not amortized but are tested for impairment annually or more frequently when indicators of impairment exist. We completed our annual impairment test during the fourth quarter of 2014 and determined there was no impairment.
Insurance Recoveries. We incurred casualty losses during 2014, 2013 and 2012. We received total insurance proceeds of $2.0 million, $0.7 million and $0.1 million during 2014, 2013 and 2012, respectively, and recognized a net gain of $0.9 million in 2014, a net gain of $0.2 million in 2013 and a net loss of $0.5 million in 2012, which are included in SG&A expenses.
Debt Issuance Costs. Debt issuance costs are accounted for as a deferred charge and amortized on a straight-line basis over the term of the related financing agreement. The balance of debt issuance costs, net of accumulated amortization of $0.1 million and $0.7 million, is $1.0 million and $0.7 million at January 31, 2015 and February 1, 2014, respectively.
Revenue Recognition. Our retail stores record revenue at the point of sale. Sales from our e-commerce website are recorded at the time of shipment. Shipping and handling fees charged to customers are included in net sales with the corresponding costs recorded as costs of goods sold. Total revenues do not include sales tax because we are a pass-through conduit for collecting and remitting sales taxes. Revenues are recognized net of expected returns, which we estimate using historical return patterns as a percentage of sales.
We record deferred revenue on our balance sheet for the sale of gift cards and recognize this revenue upon the redemption of gift cards in net sales. We similarly record deferred revenue on our balance sheet for merchandise credits issued related to customer returns and recognize this revenue upon the redemption of the merchandise credits.
F-8
Gift Card and Merchandise Credit Liability. Unredeemed gift cards and merchandise credits are recorded as a liability. Our gift cards and merchandise credits do not expire. Based on historical redemption rates, a small and relatively stable percentage of gift cards and merchandise credits will never be redeemed, which is referred to as "breakage." Estimated breakage income is recognized over time in proportion to actual gift card and merchandise credit redemptions. We recognized approximately $1.1 million, $1.0 million and $1.0 million of breakage income in 2014, 2013 and 2012, respectively, which is recorded as an offset to SG&A expenses.
Customer Loyalty Program. Customers who spend a required amount within a specified time frame using our private label credit card receive reward certificates which can be redeemed for merchandise. We estimate the net cost of the rewards and record a liability associated with unredeemed certificates and customer spend toward unissued certificates. The cost of the loyalty rewards program benefit is recorded in cost of sales.
Store Opening Expenses. Costs related to the opening of new stores and the relocation or rebranding of current stores to a new nameplate are expensed as incurred. Store opening expenses include the rent incurred during the rent holiday period on new and relocated stores.
Advertising Expenses. Advertising costs are charged to operations when the related advertising first takes place. Advertising costs were $92.1 million, $94.2 million and $74.7 million, for 2014, 2013 and 2012, respectively, which are net of advertising allowances received from vendors of $5.0 million, $5.2 million and $17.1 million, respectively.
Rent Expense. We record rent expense on a straight-line basis over the lease term, including the build out period, and where appropriate, applicable available lease renewal option periods. The difference between the payment and expense in any period is recorded as deferred rent in other long-term liabilities in the consolidated financial statements. We record construction allowances from landlords when contractually earned as a deferred rent credit in other long-term liabilities. Such deferred rent credit is amortized over the related term of the lease, commencing on the date we contractually earned the construction allowance, as a reduction of rent expense. The deferred rent credit was $45.1 million and $49.4 million as of January 31, 2015 and February 1, 2014, respectively.
Certain leases provide for contingent rents that are not measurable at inception. These contingent rents are primarily based on a percentage of sales that are in excess of a predetermined level. These amounts are excluded from minimum rent and are included in the determination of total rent expense when it is probable that the expense has been incurred and the amount is reasonably estimable.
Income Taxes. The provision for income taxes is computed based on the pretax income included in the consolidated financial statements. The asset and liability approach is used to recognize deferred tax liabilities and assets for the expected future tax consequences of temporary differences between the carrying amounts for financial reporting purposes and the tax basis of assets and liabilities. A valuation allowance is established if it is more likely than not that some portion of the deferred tax asset will not be realized. See Note 14 for additional disclosures regarding income taxes and deferred income taxes.
Earnings Per Share. Basic earnings per share is computed using the weighted average number of common shares outstanding during the measurement period. Diluted earnings per share is computed using the weighted average number of common shares as well as all potentially dilutive common share equivalents outstanding during the measurement period. Stock options, SARs and non-vested stock grants were the only potentially dilutive share equivalents we had outstanding at January 31, 2015.
We granted non-vested stock awards that contain non-forfeitable rights to dividends. Under Accounting Standards Codification ("ASC") 260-10, Earnings Per Share, non-vested stock awards that contain non-forfeitable rights to dividends or dividend equivalents are considered participating securities and are included in the calculation of basic and diluted earnings per share pursuant to the two-class method. The two-class method determines earnings per share for each class of common stock and participating securities according to dividends or dividend equivalents and their respective participation rights in undistributed earnings. See Note 2 for additional disclosures regarding earnings per share.
F-9
Recent Accounting Standards. In April 2014, the FASB issued ASU No. 2014-08, Presentation of Financial Statements (Topic 205) and Property, Plant, and Equipment (Topic 360): Reporting Discontinued Operations and Disclosures of Disposals of Components of an Entity, which changes the criteria for reporting discontinued operations and also requires additional disclosures about discontinued operations. For public companies, the standard is effective prospectively for disposals that occur on or after December 15, 2014, and interim periods within those years, with early adoption permitted. We did not early adopt this ASU.
In May 2014, the FASB issued ASU 2014-09, Revenue from Contracts with Customers (Topic 606), which provides a five-step analysis of transactions to determine when and how revenue is recognized. The core principle of the guidance is that a company should recognize revenue when it transfers promised goods or services to customers in an amount that reflects what a company expects to be entitled to in exchange for those goods or services. This update will be effective for us retrospectively in the first quarter of 2017 with early adoption not permitted. We are currently assessing the impact this ASU will have on our financial statements.
NOTE 2 - EARNINGS PER SHARE
Basic earnings per share ("EPS") is computed using the weighted average number of common shares outstanding during the measurement period. Diluted EPS is computed using the weighted average number of common shares as well as all potentially dilutive common share equivalents outstanding during the measurement period.
The following tables show the computation of basic and diluted EPS for each period (in thousands, except per share amounts):
Fiscal Year | |||||||||||
2014 | 2013 | 2012 | |||||||||
Basic EPS from continuing operations: | |||||||||||
Income from continuing operations | $ | 37,853 | $ | 25,216 | $ | 41,916 | |||||
Less: Allocation of earnings to participating securities | (503 | ) | (352 | ) | (594 | ) | |||||
Net income from continuing operations allocated to common shares | 37,350 | 24,864 | 41,322 | ||||||||
Basic weighted average shares outstanding | 31,675 | 32,034 | 31,278 | ||||||||
Basic EPS from continuing operations | $ | 1.18 | $ | 0.78 | $ | 1.32 | |||||
Fiscal Year | |||||||||||
2014 | 2013 | 2012 | |||||||||
Diluted EPS from continuing operations: | |||||||||||
Income from continuing operations | $ | 37,853 | $ | 25,216 | $ | 41,916 | |||||
Less: Allocation of earnings to participating securities | (502 | ) | (351 | ) | (590 | ) | |||||
Net income from continuing operations allocated to common shares | 37,351 | 24,865 | 41,326 | ||||||||
Basic weighted average shares outstanding | 31,675 | 32,034 | 31,278 | ||||||||
Add: Dilutive effect of stock awards | 88 | 277 | 322 | ||||||||
Diluted weighted average shares outstanding | 31,763 | 32,311 | 31,600 | ||||||||
Diluted EPS per continuing operations | $ | 1.18 | $ | 0.77 | $ | 1.31 | |||||
F-10
The number of shares attributable to stock options, SARs and non-vested stock grants that would have been considered dilutive securities, but were excluded from the calculation of diluted EPS because the effect was anti-dilutive were as follows (in thousands):
Fiscal Year | ||||||||
2014 | 2013 | 2012 | ||||||
Number of anti-dilutive stock options and SARs due to exercise price greater than average market price of our common stock | 234 | 414 | 329 | |||||
NOTE 3 – FAIR VALUE MEASUREMENTS
We recognize or disclose the fair value of our financial and non-financial assets and liabilities on a recurring and non-recurring basis. Fair value is defined as the price that would be received from selling an asset or paid to transfer a liability in an orderly transaction between market participants at the measurement date. When determining the fair value measurements for assets and liabilities which are required to be recorded at fair value, we assume the highest and best use of the asset by market participants in which we would transact and the market-based risk measurements or assumptions that market participants would use in pricing the asset or liability.
We applied the following fair value hierarchy, which prioritizes the inputs used to measure fair value into three levels, and bases the categorization within the hierarchy upon the lowest level of input that is available and significant to the fair value measurement:
Level 1 - | Quoted prices in active markets for identical assets or liabilities. |
Level 2 - | Observable inputs other than quoted prices in active markets for identical assets and liabilities, quoted prices for identical or similar assets or liabilities in inactive markets, or other inputs that are observable or can be corroborated by observable market data for substantially the full term of the assets or liabilities. |
Level 3 - | Inputs that are both unobservable and significant to the overall fair value measurement reflect our estimates of assumptions that market participants would use in pricing the asset or liability. |
F-11
Financial assets and liabilities measured at fair value on a recurring basis (in thousands):
January 31, 2015 | |||||||||||||||
Balance | Quoted Prices in Active Markets for Identical Instruments (Level 1) | Significant Other Observable Inputs (Level 2) | Significant Unobservable Inputs (Level 3) | ||||||||||||
Other assets: | |||||||||||||||
Securities held in grantor trust for deferred compensation plans (a)(b) | $ | 16,654 | $ | 16,654 | $ | — | $ | — | |||||||
February 1, 2014 | |||||||||||||||
Balance | Quoted Prices in Active Markets for Identical Instruments (Level 1) | Significant Other Observable Inputs (Level 2) | Significant Unobservable Inputs (Level 3) | ||||||||||||
Other assets: | |||||||||||||||
Securities held in grantor trust for deferred compensation plans (a)(b) | $ | 21,023 | $ | 21,023 | $ | — | $ | — | |||||||
Accrued expenses and other current liabilities: | |||||||||||||||
Deferred non-employee director equity compensation plan liability (b) | $ | 226 | $ | 226 | $ | — | $ | — | |||||||
(a) The liability for the amount due to participants corresponding in value to the securities held in the grantor trust is recorded in other long-term liabilities.
(b) Using the market approach, the fair values of these items represent quoted market prices multiplied by the quantities held. Net gains and losses related to the changes in fair value in the assets and liabilities under the various deferred compensation plans are recorded in SG&A expenses and were nil during 2014 and 2013.
F-12
Non-financial assets measured at fair value on a nonrecurring basis (in thousands):
January 31, 2015 | |||||||||||||||
Balance | Quoted Prices in Active Markets for Identical Instruments (Level 1) | Significant Other Observable Inputs (Level 2) | Significant Unobservable Inputs (Level 3) | ||||||||||||
Assets: | |||||||||||||||
Store property, equipment and leasehold improvements (a) | $ | 3,343 | $ | — | $ | — | $ | 3,343 | |||||||
February 1, 2014 | |||||||||||||||
Balance | Quoted Prices in Active Markets for Identical Instruments (Level 1) | Significant Other Observable Inputs (Level 2) | Significant Unobservable Inputs (Level 3) | ||||||||||||
Assets: | |||||||||||||||
Store property, equipment and leasehold improvements (a) | $ | 4,562 | $ | — | $ | — | $ | 4,562 | |||||||
(a) In accordance with ASC No. 360-10, Accounting for the Impairment or Disposal of Long-Lived Assets, using an undiscounted cash flow model, we identified certain stores whose cash flow trends indicated that the carrying value of store property, equipment and leasehold improvements may not be fully recoverable and determined that impairment charges were necessary for 2014. We use a discounted cash flow model to determine the fair value of our impaired assets. Key assumptions in determining future cash flows include, among other things, expected future operating performance and changes in economic conditions. Long-lived assets with a carrying amount of $3.9 million in 2014 and $12.6 million in 2013 were written down to their estimated fair value of $3.3 million in 2014 and $4.6 million in 2013, resulting in impairment charges of approximately $0.6 million during 2014 and $8.0 million during 2013. The $8.0 million in 2013 includes approximately $7.3 million of impairment charges for Steele's, which was disposed of subsequent to February 1, 2014. See Note 15 for additional disclosures on the Steele's divestiture.
The fair values of cash and cash equivalents, payables and short-term debt obligations approximate their carrying values due to the short-term nature of these instruments. In addition, we believe that the Revolving Credit Facility approximates fair value since interest rates are adjusted to reflect current rates.
F-13
NOTE 4 - PROPERTY, EQUIPMENT AND LEASEHOLD IMPROVEMENTS
The components of property, equipment and leasehold improvements were as follows (in thousands):
January 31, 2015 | February 1, 2014 | ||||||
Land | $ | 1,842 | $ | 1,842 | |||
Buildings and improvements | 15,633 | 15,511 | |||||
Fixtures and equipment | 489,243 | 457,335 | |||||
Leasehold improvements | 360,594 | 345,598 | |||||
Property, equipment and leasehold improvements | 867,312 | 820,286 | |||||
Accumulated depreciation | 581,862 | 537,752 | |||||
Property, equipment and leasehold improvements, net | $ | 285,450 | $ | 282,534 | |||
Depreciation expense was $62.7 million, $61.9 million and $59.3 million for 2014, 2013 and 2012, respectively. As a result of our ongoing review of the performance of our stores, we identified certain stores whose cash flow trends indicated that the carrying value of property, equipment and leasehold improvements may not be fully recoverable and recognized impairment charges of $0.6 million, $0.7 million and $0.8 million in 2014, 2013 and 2012, respectively. The charges reflect the difference between the carrying value and fair value of the stores. In addition, we recognized property and equipment impairment charges of approximately $7.3 million in 2013 for Steele's, which was disposed of subsequent to February 1, 2014, and $0.2 million in 2012 related to the South Hill Consolidation. Cost of sales includes $50.9 million, $49.2 million and $48.6 million in 2014, 2013 and 2012, respectively, related to depreciation expense and impairment charges. See Note 15 for additional disclosures on the Steele's divestiture.
NOTE 5 – ACCRUED EXPENSES AND OTHER CURRENT LIABILITIES
The components of accrued expenses and other current liabilities were as follows (in thousands):
January 31, 2015 | February 1, 2014 | ||||||
Accrued compensation and benefits | $ | 19,299 | $ | 13,730 | |||
Gift card and merchandise credit liability | 10,690 | 9,952 | |||||
Self-insurance liability | 10,395 | 8,603 | |||||
Accrued occupancy | 5,625 | 5,720 | |||||
Accrued advertising | 3,599 | 4,389 | |||||
Current deferred income tax | 1,822 | 4,721 | |||||
Accrued capital expenditures | 1,313 | 2,756 | |||||
Other | 15,091 | 11,979 | |||||
Accrued expenses and other current liabilities | $ | 67,834 | $ | 61,850 | |||
F-14
NOTE 6 - DEBT OBLIGATIONS
Debt obligations consist of the following (in thousands):
January 31, 2015 | February 1, 2014 | ||||||
Revolving Credit Facility | $ | 41,910 | $ | 55,395 | |||
Finance lease obligations | 4,725 | 5,584 | |||||
Other financing | 753 | 2,246 | |||||
Total debt obligations | 47,388 | 63,225 | |||||
Less: Current portion of debt obligations | 1,715 | 2,354 | |||||
Long-term debt obligations | $ | 45,673 | $ | 60,871 | |||
On October 6, 2014, we entered into the $350.0 million Revolving Credit Facility, which replaced our former $250.0 million senior secured revolving credit facility that was set to mature on June 30, 2016. The Revolving Credit Facility (i) increases availability to $300.0 million, with a seasonal increase to $350.0 million, (ii) includes a $50.0 million letter of credit subfacility, (iii) provides better pricing terms and (iv) extends the maturity date to October 6, 2019.
We use the Revolving Credit Facility to provide financing for working capital and general corporate purposes, as well as to finance capital expenditures and to support our letter of credit requirements. Borrowings are limited to the availability under a borrowing base that is determined principally on eligible inventory as defined by the Revolving Credit Facility agreement. Inventory, cash and cash equivalents are pledged as collateral. The daily interest rates are determined by a prime rate or LIBOR, plus an applicable margin, as set forth in the Revolving Credit Facility agreement. During 2014, the weighted average interest rate on outstanding borrowings and the average daily borrowings under the Revolving Credit Facility were 1.71% and $81.4 million, respectively, as compared to 1.82% and $57.6 million in 2013.
Letters of credit issued under the Revolving Credit Facility support certain merchandise purchases and collateralize retained risks and deductibles under various insurance programs. At January 31, 2015, we had outstanding letters of credit totaling approximately $6.7 million. These letters of credit expire within twelve months of issuance. Excess borrowing availability under the Revolving Credit Facility at January 31, 2015 was $251.4 million.
The Revolving Credit Facility agreement contains covenants which, among other things, restrict, based on required levels of excess availability, (i) the amount of additional debt or capital lease obligations, (ii) the payment of dividends and repurchase of common stock under certain circumstances and (iii) related party transactions. The agreement also contains a fixed charge coverage ratio covenant in the event excess availability is below a defined threshold or an event of default has occurred. At January 31, 2015, we were in compliance with all of the financial covenants of the Revolving Credit Facility agreement and expect to continue to be in compliance in 2015.
F-15
While infrequent in occurrence, occasionally we are responsible for the construction of leased stores and for paying project costs. ASC No. 840-40-55, The Effect of Lessee Involvement in Asset Construction, requires us to be considered the owner (for accounting purposes) of this type of project during the construction period. Such leases are accounted for as finance lease obligations with the amounts received from the landlord being recorded in debt obligations. Interest expense is recognized at a rate that will amortize the finance lease obligation over the initial term of the lease. Where ASC No. 840-40-55 was applicable, we have recorded finance lease obligations with interest rates ranging from 6.1% to 16.9% on our consolidated financial statements related to five store leases as of January 31, 2015. Minimum annual payments required under existing finance lease obligations as of January 31, 2015 are as follows (in thousands):
Fiscal Year | Minimum Lease Payments | Less: Interest | Principal Payments | ||||||||
2015 | $ | 1,366 | $ | 404 | $ | 962 | |||||
2016 | 1,366 | 311 | 1,055 | ||||||||
2017 | 1,366 | 207 | 1,159 | ||||||||
2018 | 1,096 | 101 | 995 | ||||||||
2019 | 580 | 26 | 554 | ||||||||
Total | $ | 5,774 | $ | 1,049 | $ | 4,725 | |||||
During 2013, we financed approximately $2.2 million of capital expenditures, bearing interest of 2.1% of which $1.5 million was paid in 2014 and $0.7 million will be paid in 2015.
NOTE 7 – OTHER LONG-TERM LIABILITIES
The components of other long-term liabilities were as follows (in thousands):
January 31, 2015 | February 1, 2014 | ||||||
Deferred rent | $ | 45,053 | $ | 49,376 | |||
Deferred compensation | 16,762 | 21,023 | |||||
Pension liability | 8,503 | 4,723 | |||||
Deferred revenue under ADS agreement | 5,500 | 6,500 | |||||
Other | 2,000 | 3,000 | |||||
Other long-term liabilities | $ | 77,818 | $ | 84,622 | |||
NOTE 8 - COMMITMENTS AND CONTINGENCIES
We have numerous contractual commitments for purchases of merchandise inventories, services arising in the ordinary course of business, letters of credit, Revolving Credit Facility and other debt service and leases. Contractual obligations for purchase of goods or services are defined as agreements that are enforceable and legally binding and that specify all significant terms, including: fixed or minimum quantities. In the ordinary course of business, we enter into arrangements with vendors to purchase merchandise typically up to six months in advance of expected delivery.
From time to time, we are involved in various legal proceedings arising in the ordinary course of our business. We do not believe that any pending legal proceedings, either individually or in the aggregate, are material to our financial condition, results of operations or cash flows.
F-16
NOTE 9 - STOCKHOLDERS' EQUITY
Our deferred compensation plan covering executives and certain officers provides an investment option that allows participants to elect to purchase shares of our common stock ("Company Stock Investment Option"). We established a grantor trust to facilitate the collection of funds and purchase our shares on the open market at prevailing market prices. All shares purchased through the grantor trust are held in the trust until the participants are eligible to receive the benefits under the terms of the plan. At the time of the participant's eligibility, the deferred compensation obligation related to the Company Stock Investment Option is settled by the delivery of the fixed number of shares held by the grantor trust on the participant's behalf. In 2014, 2013 and 2012, participants in our deferred compensation plan elected to invest approximately $0.4 million, $0.3 million and $0.1 million, respectively, of the total amount of deferred compensation withheld, in the Company Stock Investment Option. The purchase of shares made by the grantor trust on behalf of the participants is included in treasury stock and the corresponding deferred compensation obligation is included in additional paid-in capital.
On June 11, 2014, we announced that our Board approved a 12% increase in our quarterly cash dividend rate to $0.14 per share from the previous quarterly rate of $0.125 per share. The new quarterly rate of $0.14 per share is applicable to dividends declared by our Board beginning August 21, 2014. On February 20, 2015, our Board declared a quarterly cash dividend of $0.14 per share on our common stock, payable on March 18, 2015, to shareholders of record at the close of business on March 3, 2015.
On March 7, 2011, our Board approved the 2011 Stock Repurchase Program which authorized us to repurchase up to $200.0 million of our outstanding common stock. The 2011 Stock Repurchase Program will expire when we have repurchased $200.0 million of our outstanding common stock, unless terminated earlier by our Board. Through June 10, 2012, we repurchased approximately $100.1 million of our outstanding common stock under the 2011 Stock Repurchase Program. On June 11, 2012, we announced that our Board had chosen not to spend additional capital under the 2011 Stock Repurchase Program for the time being. In addition, our Board authorized us to repurchase shares of our outstanding common stock equal to the amount of the proceeds and related tax benefits from the exercise of stock options, SARs and other equity grants. Under such authorization, we repurchased 172,214 and 1,626,037 shares of our common stock for approximately $2.8 million and $31.4 million during 2014 and 2013, respectively. Purchases of shares of our common stock may be made from time to time, either on the open market or through privately negotiated transactions and are financed by our existing cash, cash flow and other liquidity sources, as appropriate.
F-17
NOTE 10 - PRIVATE LABEL CREDIT CARD PROGRAM
On August 8, 2012, we entered into an Amended and Restated Private Label Credit Card Plan Agreement ("Agreement") with World Financial Network Bank (now Comenity Bank) ("Bank"), an affiliate of Alliance Data Systems Corporation ("ADS"). The Agreement supersedes, restates and amends in its entirety an Amended and Restated Private Label Credit Card Program Agreement dated March 5, 2004, and various subsequent amendments thereto, between us and the Bank.
Under the terms of the Agreement, which will remain in effect until July 31, 2021, the Bank provides private label credit card services for our credit card program, including account acquisition and activation, receivables funding, card authorization, private label credit card issuance, statement generation, remittance processing, customer service functions and marketing services. We are required to perform certain duties, including electronic processing and transmitting of transaction records and marketing and promoting the private label credit card program. As consideration, among other payments set forth in the Agreement, the Bank pays us a monthly net portfolio yield payment and an annual portfolio performance bonus, if earned. Under the previous agreement, we received a premium or paid a discount on certain private label credit card sales, a share of certain fees generated by the portfolio and marketing support.
We received certain upfront payments upon execution of the Agreement that are being recognized over the life of the Agreement. We realized $54.1 million, $46.3 million and $31.0 million related to our private label credit card program during 2014, 2013 and 2012, respectively, which have been recorded as a reduction to SG&A expenses.
NOTE 11 - OPERATING LEASES
We lease stores, our corporate headquarters, one distribution center and equipment under operating leases. Such leases generally contain renewal options and require that we pay utilities, taxes and maintenance expenses. A number of store leases provide for escalating minimum rent. Rent expense for operating leases for 2014, 2013 and 2012 was $80.8 million, $80.7 million and $75.9 million, respectively, and includes minimum rentals of $77.1 million, $76.8 million and $71.5 million in 2014, 2013 and 2012, respectively. Rent expense also includes contingent rentals of $3.7 million, $3.9 million and $4.4 million in 2014, 2013 and 2012, respectively, and sublease rental income of $0.01 million, $0.01 million and $0.01 million in 2014, 2013 and 2012, respectively.
Minimum rental commitments on long-term, non-cancelable operating leases at January 31, 2015, net of sub-lease rental income, are as follows (in thousands):
Fiscal Year | Commitments | |||
2015 | $ | 89,763 | ||
2016 | 81,082 | |||
2017 | 71,286 | |||
2018 | 58,615 | |||
2019 | 41,310 | |||
Thereafter | 112,023 | |||
Total | $ | 454,079 | ||
F-18
NOTE 12 – STOCK-BASED COMPENSATION
As approved by our shareholders, we established the Amended and Restated 2001 Equity Incentive Plan ("2001 Equity Incentive Plan") and the Amended and Restated 2008 Equity Incentive Plan ("2008 Equity Incentive Plan" and collectively with the 2001 Equity Incentive Plan, "Equity Incentive Plans") to reward, retain and attract key personnel. The Equity Incentive Plans provide for grants of non-qualified or incentive stock options, SARs, performance shares or units, stock units and stock grants. To fund the 2001 and 2008 Equity Incentive Plans, 12,375,000 and 4,550,000 shares of our common stock were reserved for issuance upon exercise of awards, respectively. The 2001 Equity Incentive Plan expired in the second quarter of 2014.
The following table summarizes stock-based compensation expense by type of grant for each period presented (in thousands, except per share amounts):
Fiscal Year | |||||||||||
2014 | 2013 | 2012 | |||||||||
Stock options and SARs | $ | 703 | $ | 1,521 | $ | 3,034 | |||||
Non-vested stock | 5,034 | 4,204 | 3,198 | ||||||||
Performance shares | 3,927 | 2,692 | 1,571 | ||||||||
Total stock-based compensation expense | 9,664 | 8,417 | 7,803 | ||||||||
Related tax benefit | (3,634 | ) | (3,165 | ) | (2,869 | ) | |||||
Stock-based compensation expense, net of tax | $ | 6,030 | $ | 5,252 | $ | 4,934 | |||||
As of January 31, 2015, we had unrecognized compensation cost of $16.0 million related to stock-based compensation awards granted. That cost is expected to be recognized over a weighted average period of 2.3 years.
Stock Options and SARs
We historically granted stock options and SARs to our employees. The right to exercise stock options and SARs generally vests over four years from the date of grant, with 25% vesting at the end of each of the first four years following the date of grant. Stock options and SARs are settled by issuance of common stock. Options issued prior to January 29, 2005, will generally expire, if not exercised, within ten years from the date of the grant, while options and SARs granted after that date generally expire, if not exercised, within seven years from the date of grant. No stock options or SARs were granted during 2014, 2013 or 2012.
The following table summarizes stock options and SARs activity during 2014:
Number of Outstanding Shares | Weighted Average Exercise Price | Weighted Average Remaining Contractual Term (years) | Aggregate Intrinsic Value (in thousands) | |||||||||
Outstanding at February 1, 2014 | 1,062,851 | $ | 16.52 | |||||||||
Exercised | (578,943 | ) | 16.41 | |||||||||
Forfeited | (65,383 | ) | 17.68 | |||||||||
Outstanding at January 31, 2015 | 418,525 | $ | 16.49 | 2.2 | $ | 1,468 | ||||||
Vested or expected to vest at January 31, 2015 | 404,572 | $ | 16.41 | 2.2 | $ | 1,452 | ||||||
Exercisable at January 31, 2015 | 348,762 | $ | 16.02 | 2.0 | $ | 1,387 | ||||||
F-19
The following table summarizes non-vested stock options and SARs activity during 2014:
Stock Options/ SARs | Number of Shares | Weighted Average Grant Date Fair Value | |||||
Non-vested at February 1, 2014 | 292,075 | $ | 7.97 | ||||
Vested | (204,687 | ) | 7.67 | ||||
Forfeited | (17,625 | ) | 8.60 | ||||
Outstanding at January 31, 2015 | 69,763 | 8.69 | |||||
The aggregate intrinsic value of stock options and SARs, defined as the amount by which the market price of the underlying stock on the date of exercise exceeds the exercise price of the award, exercised during 2014, 2013 and 2012 was $3.7 million, $6.0 million and $6.9 million, respectively.
Non-vested Stock
We grant shares of non-vested stock to our employees and non-employee directors. The non-vested stock converts one for one to common stock at the end of the vesting period at no cost to the recipient to whom it is awarded. The vesting period of the non-vested stock ranges from one to four years from the date of grant.
The following table summarizes non-vested stock activity during 2014:
Non-vested Stock | Number of Shares | Weighted Average Grant Date Fair Value | |||||
Outstanding at February 1, 2014 | 652,459 | $ | 20.40 | ||||
Granted | 356,854 | 22.81 | |||||
Vested | (254,220 | ) | 19.89 | ||||
Forfeited | (76,489 | ) | 21.24 | ||||
Outstanding at January 31, 2015 | 678,604 | 21.76 | |||||
The aggregate intrinsic value of non-vested stock that vested during 2014, 2013 and 2012 was $5.7 million, $4.8 million and $2.3 million, respectively. The weighted-average grant date fair value for non-vested stock granted in 2014, 2013 and 2012 was $22.81, $24.97 and $16.10, respectively. The payment of the employees' tax liability for a portion of the non-vested stock that vested during 2014 was satisfied by withholding shares with a fair value equal to the tax liability. As a result, the actual number of shares issued was 188,920.
Performance Shares
We grant performance shares as a means of rewarding management for our long-term performance based on shareholder return performance measures. The actual number of shares that may be issued ranges from zero to a maximum of twice the number of granted shares outstanding, as reflected in the table below and is based on our shareholder return performance relative to a specific group of companies over a 3-year performance cycle. If earned, the performance shares vest following the 3-year cycle. Compensation expense, which is recorded ratably over the vesting period, is based on the fair value at grant date and the anticipated number of shares of our common stock, which is determined using a Monte Carlo probability model. Grant recipients do not have any shareholder rights until the granted shares have been issued.
F-20
The following table summarizes information about the performance shares that were outstanding at January 31, 2015:
Period Granted | Target Shares Outstanding at Beginning of Year | Target Shares Granted | Target Shares Vested | Target Shares Forfeited | Target Shares Outstanding at End of Year | Weighted Average Grant Date Fair Value per Share | |||||||||||||
2012 | 198,200 | — | (8,300 | ) | (20,800 | ) | 169,100 | $ | 18.04 | ||||||||||
2013 | 151,250 | — | (9,941 | ) | (23,059 | ) | 118,250 | 33.81 | |||||||||||
2014 | — | 168,445 | — | (2,292 | ) | 166,153 | 33.84 | ||||||||||||
Total | 349,450 | 168,445 | (18,241 | ) | (46,151 | ) | 453,503 | ||||||||||||
During 2014, 16,620 shares vested related to the 2011 performance share grant. The aggregate intrinsic value of shares that vested during 2014 was $0.8 million. The payment of the recipients' tax liability for shares vesting during 2014 of approximately $0.2 million was satisfied by withholding shares with a fair value equal to the tax liability. As a result, the actual number of shares issued was 24,508.
F-21
NOTE 13 - BENEFIT PLANS
401(k) Plan. We have a contributory 401(k) savings plan ("401(k) Plan") generally available to full and part-time employees with 60 days of service, who are age 21 or older. Under the 401(k) Plan, participants may contribute up to 50% of their qualifying earnings on a pre-tax basis, and up to 10% of their qualifying earnings on a post-tax basis, subject to certain restrictions. We currently match 50% of each participant's pre-tax contributions, limited up to 6% of each participant's compensation under the Plan. We may make discretionary matching contributions during the year. Our matching contributions expense for the 401(k) Plan were approximately $1.4 million, $1.5 million and $1.5 million in 2014, 2013 and 2012, respectively.
Deferred Compensation Plans. We have two nonqualified deferred compensation plans ("DC Plans") which provide executives and other key employees with the opportunity to participate in unfunded, deferred compensation programs that are not qualified under the Internal Revenue Code of 1986, as amended, ("Code"). Generally, the Code and ERISA restrict contributions to a 401(k) plan by highly compensated employees. The DC Plans are intended to allow participants to defer income on a pre-tax basis. Under the DC Plans, participants may defer up to 50% of their base salary and up to 100% of their bonus and earn a rate of return based on actual investments chosen by each participant. We have established grantor trusts for the purposes of holding assets to provide benefits to the participants. For the plan covering executives, we will match 100% of each participant's contributions, up to 10% of the sum of their base salary and bonus. For the plan covering other key employees, we may make a bi-weekly discretionary matching contribution. We currently match 50% of each participant's contributions, up to 6% of the participant's compensation offset by the contribution we make to the participant's 401(k) account, if any. For both DC Plans, our contributions are vested 100%. In addition, we may, with approval by our Board, make an additional employer contribution in any amount with respect to any participant as is determined in our sole discretion. Our matching contribution expense for the DC Plans was approximately $1.3 million, $0.9 million and $1.7 million for 2014, 2013 and 2012, respectively.
Non-Employee Director Equity Compensation Plan. In 2003, we adopted, and our shareholders approved, the 2003 Non-Employee Director Equity Compensation Plan. The plan was amended and restated effective June 10, 2014. We reserved 225,000 shares of our common stock to fund this plan. Under this plan, non-employee directors have the option to defer all or a portion of their annual compensation fees and to receive such deferred fees in the form of restricted stock or deferred stock units as defined in this plan. At February 1, 2014, $0.2 million was deferred under this plan and as of January 31, 2015, there were no participants in or amounts deferred under this plan.
Frozen Defined Benefit Plan. We sponsor a defined benefit plan ("DB Plan"), which covers substantially all employees who had met eligibility requirements and were enrolled prior to June 30, 1998. The DB Plan was frozen effective June 30, 1998.
Benefits for the DB Plan are administered through a trust arrangement, which provides monthly payments or lump sum distributions. Benefits under the DB Plan were based upon a percentage of the participant's earnings during each year of credited service. Any service after the date the DB Plan was frozen will continue to count toward vesting and eligibility for normal and early retirement for existing participants. The measurement dates used to determine pension benefit obligations were January 31, 2015 and February 1, 2014.
F-22
Information regarding the DB Plan is as follows (in thousands):
Fiscal Year | |||||||
2014 | 2013 | ||||||
Change in benefit obligation: | |||||||
Benefit obligation at beginning of year | $ | 36,579 | $ | 40,037 | |||
Employer service cost | 210 | 360 | |||||
Interest cost | 1,692 | 1,723 | |||||
Actuarial (gain) loss | 6,165 | (1,609 | ) | ||||
Plan disbursements | (3,351 | ) | (3,932 | ) | |||
Projected benefit obligation at end of year | 41,295 | 36,579 | |||||
Change in plan assets: | |||||||
Fair value of plan assets at beginning of year | 31,856 | 33,339 | |||||
Actual return on plan assets | 4,287 | 2,449 | |||||
Employer contributions | — | — | |||||
Plan disbursements | (3,351 | ) | (3,932 | ) | |||
Fair value of plan assets at end of year | 32,792 | 31,856 | |||||
Underfunded status | $ | (8,503 | ) | $ | (4,723 | ) | |
Amounts recognized in the consolidated balance sheet consist of: | |||||||
Accrued benefit liability - included in other long-term liabilities | $ | (8,503 | ) | $ | (4,723 | ) | |
Amount recognized in accumulated other comprehensive loss, pre-tax (a) | 11,055 | 7,442 | |||||
(a) Consists solely of net actuarial losses as there are no prior service costs.
Fiscal Year | ||||||||
2014 | 2013 | |||||||
Weighted-average assumptions: | ||||||||
For determining benefit obligations at year-end: | ||||||||
Discount rate | 3.90 | % | 4.81 | % | ||||
Fiscal Year | ||||||||
2014 | 2013 | 2012 | ||||||
For determining net periodic pension cost for year: | ||||||||
Discount rate | 4.81 | % | 4.43 | % | 5.10 | % | ||
Expected return on assets | 7.00 | % | 7.00 | % | 7.00 | % | ||
The discount rate was determined using yields on a hypothetical bond portfolio that matches the approximated cash flows of the DB Plan. We develop our long-term rate of return assumptions using long-term historical actual return data considering the mix of investments that comprise plan assets and input from professional advisors. The DB Plan's trustees have engaged investment advisors to manage and monitor performance of the investments of the DB Plan's assets and consult with the DB Plan's trustees.
F-23
The allocations of DB Plan assets by category are as follows:
Fiscal Year | |||||
2015 Target Allocation | 2014 | 2013 | |||
Equity securities | 50% | 49% | 56% | ||
Fixed income securities | 50 | 50 | 42 | ||
Other - primarily cash | — | 1 | 2 | ||
Total | 100% | 100% | 100% | ||
We employ a total return investment approach whereby a mix of equities and fixed income investments are used to maximize the long-term return on DB Plan assets for a prudent level of risk. The investment portfolio consists of actively managed and indexed mutual funds of domestic and international equities and investment-grade corporate bonds and U.S. government securities. Investment risk is measured and monitored on an ongoing basis through quarterly investment portfolio reviews and annual liability measurements.
The following tables present the DB Plan assets measured at fair value on a recurring basis in the consolidated financial statements (in thousands):
January 31, 2015 | |||||||||||||||
Balance | Quoted Prices in Active Markets for Identical Instruments (Level 1) | Significant Other Observable Inputs (Level 2) | Significant Unobservable Inputs (Level 3) | ||||||||||||
Mutual funds: | |||||||||||||||
Equity securities | $ | 15,943 | $ | 15,943 | $ | — | $ | — | |||||||
Fixed income securities | 16,437 | 16,437 | — | — | |||||||||||
Other - primarily cash | 412 | 412 | — | — | |||||||||||
Total | $ | 32,792 | $ | 32,792 | $ | — | $ | — | |||||||
February 1, 2014 | |||||||||||||||
Balance | Quoted Prices in Active Markets for Identical Instruments (Level 1) | Significant Other Observable Inputs (Level 2) | Significant Unobservable Inputs (Level 3) | ||||||||||||
Mutual funds: | |||||||||||||||
Equity securities | $ | 17,773 | $ | 17,773 | $ | — | $ | — | |||||||
Fixed income securities | 13,512 | 13,512 | — | — | |||||||||||
Other - primarily cash | 571 | 571 | — | — | |||||||||||
Total | $ | 31,856 | $ | 31,856 | $ | — | $ | — | |||||||
F-24
The components of net periodic benefit cost for the DB Plan were as follows (in thousands):
Fiscal Year | |||||||||||
2014 | 2013 | 2012 | |||||||||
Net periodic pension cost for the fiscal year: | |||||||||||
Employer service cost | $ | 210 | $ | 360 | $ | — | |||||
Interest cost | 1,692 | 1,723 | 1,889 | ||||||||
Expected return on plan assets | (2,134 | ) | (2,237 | ) | (2,253 | ) | |||||
Net loss amortization | 399 | 610 | 414 | ||||||||
Net pension cost | $ | 167 | $ | 456 | $ | 50 | |||||
Other changes in DB Plan assets and benefit obligations recognized in other comprehensive loss are as follows (in thousands):
Fiscal Year | |||||||
2014 | 2013 | ||||||
Amortization of net loss | $ | (399 | ) | $ | (610 | ) | |
Net loss (gain) | 4,012 | (1,821 | ) | ||||
Net change recognized in other comprehensive loss, pre-tax | $ | 3,613 | $ | (2,431 | ) | ||
The estimated net loss that will be amortized from accumulated other comprehensive loss into net periodic benefit cost over the next year is $0.7 million. The amortization of net loss is recorded in SG&A expenses.
Our funding policy is to make contributions to maintain the minimum funding requirements for our pension obligation in accordance with ERISA. We may elect to contribute additional amounts to maintain a level of funding to minimize the Pension Benefit Guaranty Corporation premium costs or to cover short-term liquidity needs of the DB Plan in order to maintain current invested positions. We do not have a minimum contribution requirement for 2015.
The following benefit payments are expected to be paid (in thousands):
Fiscal Year | Payments | ||
2015 | $ | 3,005 | |
2016 | 3,529 | ||
2017 | 3,401 | ||
2018 | 3,133 | ||
2019 | 3,408 | ||
Fiscal years 2020 - 2024 | 15,641 | ||
F-25
NOTE 14 - INCOME TAXES
All of our operations are domestic. Income tax expense consisted of the following (in thousands):
Fiscal Year | |||||||||||
2014 | 2013 | 2012 | |||||||||
Federal income tax expense: | |||||||||||
Current | $ | 12,948 | $ | 9,462 | $ | 17,467 | |||||
Deferred | 3,048 | (761 | ) | 1,170 | |||||||
15,996 | 8,701 | 18,637 | |||||||||
State income tax expense: | |||||||||||
Current | 2,323 | 1,509 | 3,626 | ||||||||
Deferred | 300 | (47 | ) | (62 | ) | ||||||
2,623 | 1,462 | 3,564 | |||||||||
Total income tax expense | $ | 18,619 | $ | 10,163 | $ | 22,201 | |||||
Income tax is included in the consolidated financial statements as follows (in thousands):
Fiscal Year | |||||||||||
2014 | 2013 | 2012 | |||||||||
Continuing operations | 22,847 | 15,400 | 24,373 | ||||||||
Discontinued operations | (4,228 | ) | (5,237 | ) | (2,172 | ) | |||||
Total income tax expense | $ | 18,619 | $ | 10,163 | $ | 22,201 | |||||
Reconciliation between the federal income tax expense charged to income before income tax computed at statutory tax rates and the actual income tax expense recorded follows (in thousands):
Fiscal Year | |||||||||||
2014 | 2013 | 2012 | |||||||||
Federal income tax expense at the statutory rate | $ | 17,314 | $ | 9,382 | $ | 21,133 | |||||
State income taxes, net | 1,811 | 974 | 2,199 | ||||||||
Uncertain tax position | 92 | 531 | — | ||||||||
Other | 590 | 399 | (99 | ) | |||||||
Job credits | (1,188 | ) | (1,123 | ) | (1,032 | ) | |||||
Total income tax expense | $ | 18,619 | $ | 10,163 | $ | 22,201 | |||||
F-26
Deferred tax assets (liabilities) consist of the following (in thousands):
January 31, 2015 | February 1, 2014 | ||||||
Gross deferred tax assets: | |||||||
Net operating loss carryforwards | $ | 521 | $ | 599 | |||
Accrued expenses | 2,392 | 3,031 | |||||
Lease obligations | 18,690 | 20,658 | |||||
Deferred compensation | 9,967 | 13,371 | |||||
Deferred income | 4,707 | 5,319 | |||||
Other | 2,905 | 1,366 | |||||
39,182 | 44,344 | ||||||
Gross deferred tax liabilities: | |||||||
Inventory | (5,756 | ) | (9,675 | ) | |||
Depreciation and amortization | (55,320 | ) | (54,570 | ) | |||
(61,076 | ) | (64,245 | ) | ||||
Valuation allowance | (402 | ) | (464 | ) | |||
Net deferred tax liabilities | $ | (22,296 | ) | $ | (20,365 | ) | |
ASC No. 740, Income Taxes, requires recognition of future tax benefits of deferred tax assets to the extent such realization is more likely than not. Net non-current deferred tax liabilities were $20.5 million and $15.6 million and net current deferred tax liabilities were $1.8 million and $4.7 million at January 31, 2015 and February 1, 2014, respectively. Consistent with the requirements of ASC No. 740, the tax benefits recognized related to pre-reorganization deferred tax assets have been recorded as a direct addition to additional paid-in capital. The remaining valuation allowance of $0.4 million and $0.5 million at January 31, 2015 and February 1, 2014, respectively, was established for pre-reorganization state net operating losses, which may expire prior to utilization. Adjustments are made to reduce the recorded valuation allowance when positive evidence exists that is sufficient to overcome the negative evidence associated with those losses.
We have net operating loss carryforwards for state income tax purposes of approximately $12.5 million which, if not utilized, will expire in varying amounts between 2015 and 2021. We do not have any net operating loss carryforwards for federal income tax purposes.
As of January 31, 2015, the total unrecognized tax benefit was $0.6 million, which if recognized, would favorably affect the effective income tax rate in a future period. A reconciliation of the beginning and ending amount of total unrecognized tax benefits, including associated interest, is as follows (in thousands):
2014 | |||
Balance, beginning of period | $ | 531 | |
Additions based on tax positions related to 2014 | 79 | ||
Additions for tax positions for prior years | 13 | ||
Balance, end of period | $ | 623 | |
F-27
We file income tax returns in the U.S. federal jurisdiction and various state and local jurisdictions. The Internal Revenue Service ("IRS") has initiated an examination of the federal tax return for 2012 and has completed its field examination of the federal income tax returns for 2009, 2010 and 2011. We have received a Revenue Agent Report from the IRS that seeks adjustments to income before taxes of approximately $2.3 million in connection with an unresolved issue related to Section 199, Domestic Production Deduction. In July 2014, we filed a protest with the IRS Appeals Office regarding the proposed adjustment. Meetings with the Appeals Office have not been set. We believe that adequate provision has been made for any adjustments that may result from tax audits. However, the outcome of tax audits cannot be predicted with certainty. If any issues addressed in our tax audits are resolved in a manner not consistent with our expectations, we could be required to adjust our provision for income taxes in the period such resolution occurs.
We recognize penalty and interest accrued related to unrecognized tax benefits as an income tax expense. During the years ended January 31, 2015, February 1, 2014, and February 2, 2013, the amount of penalties and interest accrued was almost nil. We are subject to U.S. federal income tax examinations by tax authorities for 2013 forward. We are also subject to audit by the taxing authorities of 38 states for years generally after 2009.
F-28
NOTE 15 - DISCONTINUED OPERATIONS
On March 7, 2014, we divested Steele's, an off-price concept that we launched in November 2011, in order to focus solely on our core specialty department store business. Accordingly, the results of operations of Steele's are reflected in discontinued operations for all periods presented.
Revenues and pre-tax loss of Steele's, which includes the 2014 loss on the sale of Steele's of $9.7 million, for each period presented were as follows (in thousands):
Fiscal Year | |||||||||||
2014 | 2013 | 2012 | |||||||||
Net Sales | $ | 2,414 | $ | 24,075 | $ | 18,098 | |||||
Pre-tax loss from discontinued operations | 11,231 | 13,811 | 5,909 | ||||||||
There were no assets or liabilities related to Steele’s included in the condensed consolidated financial statements as of January 31, 2015. The carrying values of the major assets and liabilities related to Steele’s included in the consolidated financial statements as of February 1, 2014 were as follows (in thousands):
February 1, 2014 | |||
Merchandise inventories, net | $ | 10,498 | |
Property, equipment and leasehold improvements, net | 732 | ||
Other assets | 442 | ||
Liabilities | 809 | ||
NOTE 16 - SOUTH HILL CONSOLIDATION
On February 11, 2013, we announced plans to consolidate our South Hill, Virginia operations into our Houston, Texas corporate headquarters ("South Hill Consolidation"). This action was the culmination of an initiative that we began in 2012. The reasons for the South Hill Consolidation were: (i) to have department store functions and processes entirely together in one location, (ii) to strengthen collaboration, teamwork and communications, while streamlining operations, enhancing overall operational efficiency and reducing costs, and (iii) to create consistency in merchandising, marketing and e-commerce.
The South Hill Consolidation was completed during 2013, and all liabilities related to the consolidation have been paid. Total expenses in 2013 associated with the South Hill Consolidation, were $11.3 million. The costs, which were primarily for severance and transitional payroll and related benefits, recruiting and relocation costs, and visual presentation supplies and other, were recorded in SG&A expenses in the consolidated financial statements. We incurred and paid $2.7 million in 2012 primarily for transitional payroll and related benefits, recruiting and relocation costs, and property and equipment impairment. Merchandise cost of sales for 2013 also includes approximately $12.5 million related to the South Hill Consolidation due to inventory liquidation costs associated with discontinued vendors and merchandise and advertising allowances deferred in inventory.
During 2014, we completed the sale of the building which housed our former South Hill operations. The building was sold for a gain of $0.8 million and is recorded as an offset to SG&A expenses.
F-29
NOTE 17 - QUARTERLY FINANCIAL INFORMATION (unaudited)
The following table shows quarterly information (in thousands, except per share amounts):
Fiscal Year 2014 | |||||||||||||||
Q1 | Q2 | Q3 | Q4 | ||||||||||||
Net sales | $ | 372,040 | $ | 377,446 | $ | 364,197 | $ | 524,886 | |||||||
Gross profit | 77,941 | 112,340 | 88,166 | 171,359 | |||||||||||
Income (loss) from continuing operations | $ | (12,046 | ) | $ | 11,192 | $ | (5,107 | ) | $ | 43,814 | |||||
Loss from discontinued operations | (6,748 | ) | — | (161 | ) | (94 | ) | ||||||||
Net income (loss) | $ | (18,794 | ) | $ | 11,192 | $ | (5,268 | ) | $ | 43,720 | |||||
Basic earnings (loss) per share data: | |||||||||||||||
Continuing operations | $ | (0.38 | ) | $ | 0.35 | $ | (0.16 | ) | $ | 1.37 | |||||
Discontinued operations | (0.22 | ) | — | (0.01 | ) | — | |||||||||
Basic earnings (loss) per share | (0.60 | ) | 0.35 | (0.17 | ) | 1.37 | |||||||||
Diluted earnings (loss) per share data: | |||||||||||||||
Continuing operations | $ | (0.38 | ) | $ | 0.35 | $ | (0.16 | ) | $ | 1.36 | |||||
Discontinued operations | (0.22 | ) | — | (0.01 | ) | — | |||||||||
Diluted earnings (loss) per share | (0.60 | ) | 0.35 | (0.17 | ) | 1.36 | |||||||||
Basic weighted average shares | 31,492 | 31,757 | 31,794 | 31,657 | |||||||||||
Diluted weighted average shares | 31,492 | 31,825 | 31,794 | 31,740 | |||||||||||
Fiscal Year 2013 | |||||||||||||||
Q1 | Q2 | Q3 | Q4 | ||||||||||||
Net sales | $ | 372,103 | $ | 389,991 | $ | 354,850 | $ | 492,537 | |||||||
Gross profit | 89,629 | 115,575 | 83,290 | 147,992 | |||||||||||
Income (loss) from continuing operations | $ | (6,188 | ) | $ | 10,832 | $ | (9,573 | ) | $ | 30,145 | |||||
Loss from discontinued operations | (668 | ) | (1,225 | ) | (1,398 | ) | (5,283 | ) | |||||||
Net income (loss) | $ | (6,856 | ) | $ | 9,607 | $ | (10,971 | ) | $ | 24,862 | |||||
Basic earnings (loss) per share data: | |||||||||||||||
Continuing operations | $ | (0.19 | ) | $ | 0.33 | $ | (0.30 | ) | $ | 0.95 | |||||
Discontinued operations | (0.02 | ) | (0.04 | ) | (0.04 | ) | (0.17 | ) | |||||||
Basic earnings (loss) per share | (0.21 | ) | 0.29 | (0.34 | ) | 0.79 | |||||||||
Diluted earnings (loss) per share data: | |||||||||||||||
Continuing operations | $ | (0.19 | ) | $ | 0.32 | $ | (0.30 | ) | $ | 0.95 | |||||
Discontinued operations | (0.02 | ) | (0.03 | ) | (0.04 | ) | (0.17 | ) | |||||||
Diluted earnings (loss) per common share | (0.21 | ) | 0.29 | (0.34 | ) | 0.78 | |||||||||
Basic weighted average shares | 32,306 | 32,762 | 31,854 | 31,215 | |||||||||||
Diluted weighted average shares | 32,306 | 33,073 | 31,854 | 31,438 | |||||||||||
F-30