Attached files
| file | filename |
|---|---|
| 8-K - 8-K - McGraw-Hill Global Education Intermediate Holdings, LLC | mhgenotes8-kdocx.htm |
| EX-99.1 - EXHIBIT 99.1 - McGraw-Hill Global Education Intermediate Holdings, LLC | holdco2015pressreleasefi.htm |

McGraw‐Hill Global Education (MHGE) Investor Presentation April 1, 2015
This presentation includes statements that are, or may be deemed to be, “forward-looking statements.” These forward-looking statements can be identified by the use of forward-looking terminology, including the terms “believes,” “estimates,” “anticipates,” “expects,” “intends,” “plans,” “may,” “will” or “should” or, in each case, their negative or other variations or comparable terminology. These forward-looking statements include all matters that are not historical facts. They appear in a number of places throughout this presentation and include statements regarding our intentions, beliefs or current expectations concerning, among other things, our results of operations, financial condition, liquidity, prospects, growth, strategies and the industry in which we operate. By their nature, forward-looking statements involve risks and uncertainties because they relate to events and depend on circumstances that may or may not occur in the future. We caution you that forward-looking statements are not guarantees of future performance and that our actual results of operations, financial condition and liquidity, and the development of the industry in which we operate, may differ materially from those made in or suggested by the forward-looking statements contained in this presentation, including the risks described in “Risk Factors” in the offering circular. In addition, even if our results of operations, financial condition and liquidity, and the development of the industry in which we operate are consistent with the forward-looking statements contained in this presentation, those results of operations, financial condition and liquidity or developments may not be indicative of results or developments in subsequent periods. Any forward-looking statements we make in this presentation speak only as of the date of such statement, and we undertake no obligation to update such statements. Comparisons of results for current and any prior periods are not intended to express any future trends or indications of future performance, unless expressed as such, and should only be viewed as historical data. The notes have not been and will not be registered under the United States Securities Act of 1933, as amended, or under any state securities laws on the United States. Accordingly, the Notes will be offered in the United States only to qualified institutional buyers as defined under Rule 144A under the Securities Act, and outside the United States in accordance with Regulation S under the Securities Act. Securities may not be offered or sold in the United States unless they are registered or exempt from registration under the Securities Act. Before you invest, you should read the confidential offering circular and the documents that affiliates of the issuers have filed with the SEC, which are incorporated by reference in the confidential offering circular, for more complete information about the issuers and this offering. The issuers or any initial purchaser will arrange to send you the confidential offering circular if you request it by contacting Credit Suisse Securities (USA) LLC, Attention: Prospectus Department, One Madison Avenue, New York, NY 10010, or by calling toll-free (800) 221-1037. Non-GAAP Financial Measures Certain historical financial information included herein, including EBITDA, Pre-Plate Adjusted Cash EBITDA and Post-Plate Adjusted Cash EBITDA, are not presentations made in accordance with U.S. GAAP, and use of the terms EBITDA, Post-Plate Adjusted Cash EBITDA and Pro Forma Post-Plate Adjusted Cash EBITDA varies from others in the same industry. Non-GAAP financial measures should not be considered as alternatives to income from continuing operations, income from operations or any other performance measures derived in accordance with U.S. GAAP as measures of operating performance or cash flows as measures of liquidity. Non-GAAP financial measures have important limitations as analytical tools, and you should not consider them in isolation or as substitutes for analysis of results as reported under U.S. GAAP. This presentation includes a reconciliation of certain non- GAAP financial measures to the most directly comparable financial measures calculated in accordance with GAAP. Disclosure 2

David Levin President and Chief Executive Officer Patrick Milano Chief Financial Officer and Chief Administrative Officer 3 Presenters David Kraut Treasurer and Vice President - Investor Relations
Q&A Company Overview and Business Update Digital Product Overview and Update Transaction Overview Conclusion 4 Agenda Financial Update

Transaction Overview 5
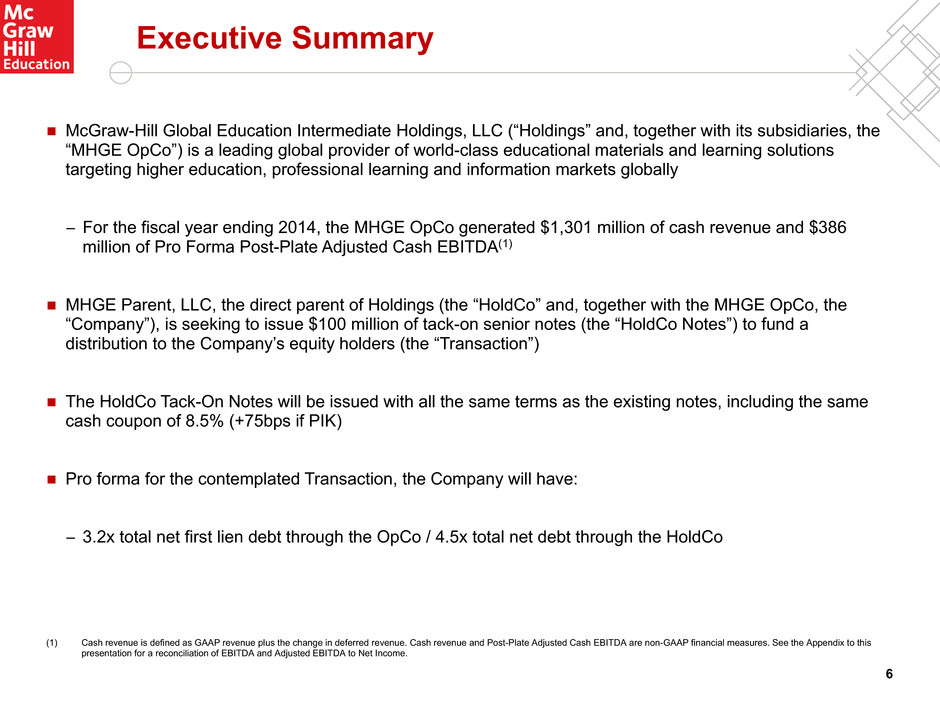
6 Executive Summary McGraw-Hill Global Education Intermediate Holdings, LLC (“Holdings” and, together with its subsidiaries, the “MHGE OpCo”) is a leading global provider of world-class educational materials and learning solutions targeting higher education, professional learning and information markets globally − For the fiscal year ending 2014, the MHGE OpCo generated $1,301 million of cash revenue and $386 million of Pro Forma Post-Plate Adjusted Cash EBITDA(1) MHGE Parent, LLC, the direct parent of Holdings (the “HoldCo” and, together with the MHGE OpCo, the “Company”), is seeking to issue $100 million of tack-on senior notes (the “HoldCo Notes”) to fund a distribution to the Company’s equity holders (the “Transaction”) The HoldCo Tack-On Notes will be issued with all the same terms as the existing notes, including the same cash coupon of 8.5% (+75bps if PIK) Pro forma for the contemplated Transaction, the Company will have: − 3.2x total net first lien debt through the OpCo / 4.5x total net debt through the HoldCo (1) Cash revenue is defined as GAAP revenue plus the change in deferred revenue. Cash revenue and Post-Plate Adjusted Cash EBITDA are non-GAAP financial measures. See the Appendix to this presentation for a reconciliation of EBITDA and Adjusted EBITDA to Net Income.
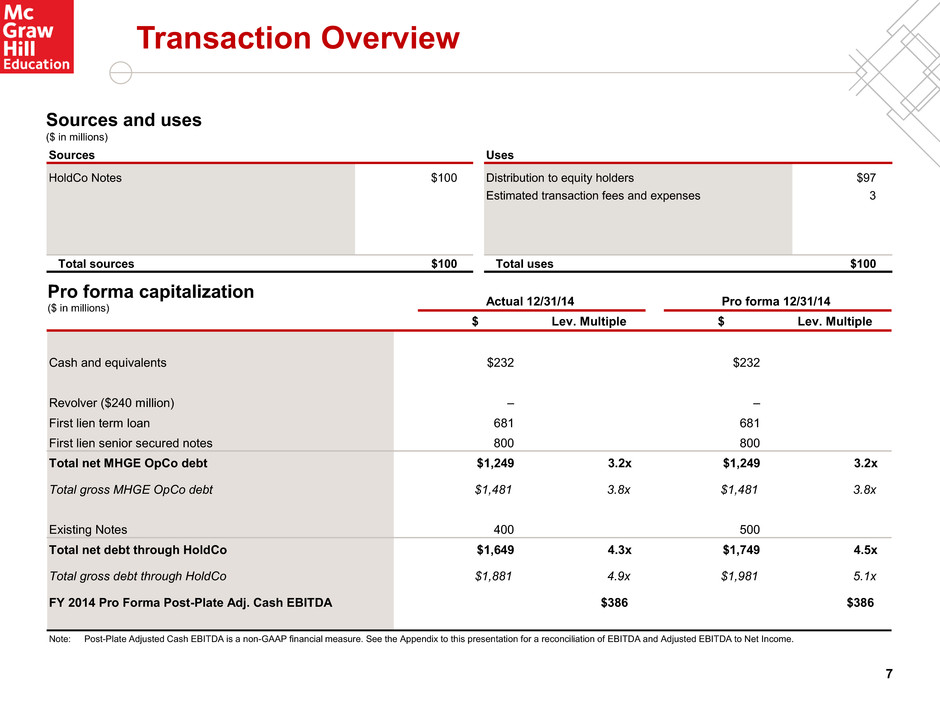
Actual 12/31/14 Pro forma 12/31/14 $ Lev. Multiple $ Lev. Multiple Cash and equivalents $232 $232 Revolver ($240 million) – – First lien term loan 681 681 First lien senior secured notes 800 800 Total net MHGE OpCo debt $1,249 3.2x $1,249 3.2x Total gross MHGE OpCo debt $1,481 3.8x $1,481 3.8x Existing Notes 400 500 Total net debt through HoldCo $1,649 4.3x $1,749 4.5x Total gross debt through HoldCo $1,881 4.9x $1,981 5.1x FY 2014 Pro Forma Post-Plate Adj. Cash EBITDA $386 $386 Transaction Overview Note: Post-Plate Adjusted Cash EBITDA is a non-GAAP financial measure. See the Appendix to this presentation for a reconciliation of EBITDA and Adjusted EBITDA to Net Income. Sources and uses ($ in millions) Pro forma capitalization ($ in millions) Sources Uses HoldCo Notes $100 Distribution to equity holders $97 Estimated transaction fees and expenses 3 Total sources $100 Total uses $100 7
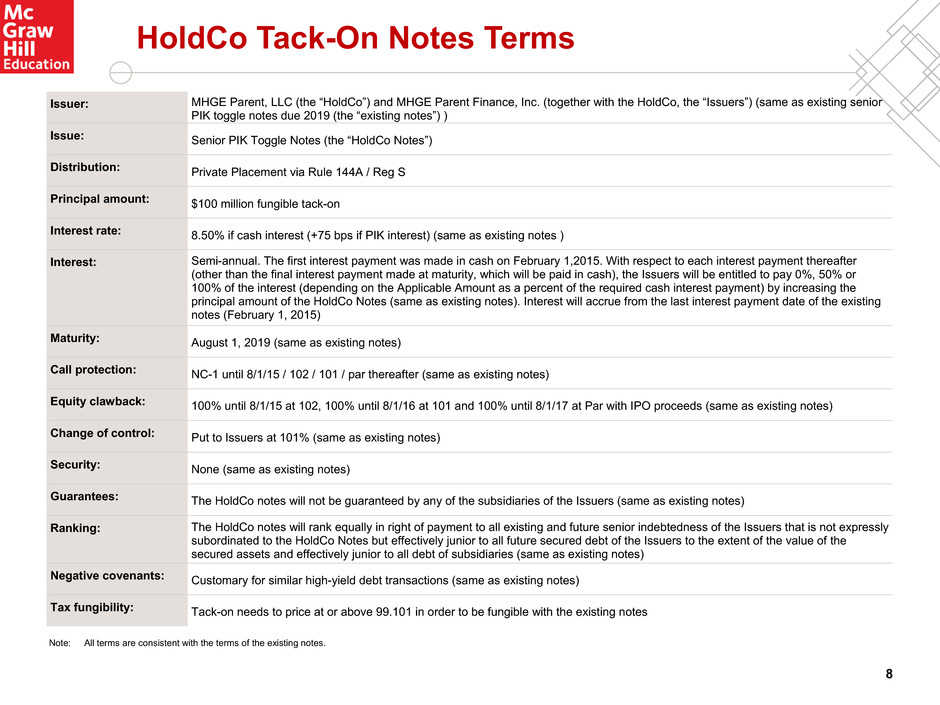
Issuer: MHGE Parent, LLC (the “HoldCo”) and MHGE Parent Finance, Inc. (together with the HoldCo, the “Issuers”) (same as existing senior PIK toggle notes due 2019 (the “existing notes”) ) Issue: Senior PIK Toggle Notes (the “HoldCo Notes”) Distribution: Private Placement via Rule 144A / Reg S Principal amount: $100 million fungible tack-on Interest rate: 8.50% if cash interest (+75 bps if PIK interest) (same as existing notes ) Interest: Semi-annual. The first interest payment was made in cash on February 1,2015. With respect to each interest payment thereafter (other than the final interest payment made at maturity, which will be paid in cash), the Issuers will be entitled to pay 0%, 50% or 100% of the interest (depending on the Applicable Amount as a percent of the required cash interest payment) by increasing the principal amount of the HoldCo Notes (same as existing notes). Interest will accrue from the last interest payment date of the existing notes (February 1, 2015) Maturity: August 1, 2019 (same as existing notes) Call protection: NC-1 until 8/1/15 / 102 / 101 / par thereafter (same as existing notes) Equity clawback: 100% until 8/1/15 at 102, 100% until 8/1/16 at 101 and 100% until 8/1/17 at Par with IPO proceeds (same as existing notes) Change of control: Put to Issuers at 101% (same as existing notes) Security: None (same as existing notes) Guarantees: The HoldCo notes will not be guaranteed by any of the subsidiaries of the Issuers (same as existing notes) Ranking: The HoldCo notes will rank equally in right of payment to all existing and future senior indebtedness of the Issuers that is not expressly subordinated to the HoldCo Notes but effectively junior to all future secured debt of the Issuers to the extent of the value of the secured assets and effectively junior to all debt of subsidiaries (same as existing notes) Negative covenants: Customary for similar high-yield debt transactions (same as existing notes) Tax fungibility: Tack-on needs to price at or above 99.101 in order to be fungible with the existing notes HoldCo Tack-On Notes Terms Note: All terms are consistent with the terms of the existing notes. 8
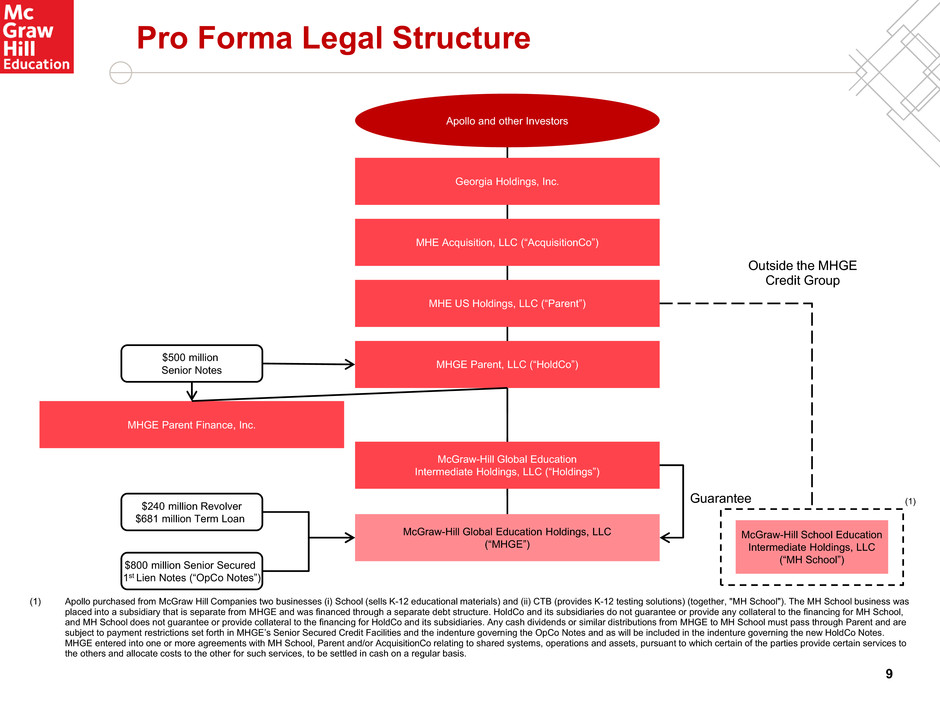
Pro Forma Legal Structure Apollo and other Investors $500 million Senior Notes MHE Acquisition, LLC (“AcquisitionCo”) MHE US Holdings, LLC (“Parent”) McGraw-Hill Global Education Holdings, LLC (“MHGE”) McGraw-Hill School Education Intermediate Holdings, LLC (“MH School”) $240 million Revolver $681 million Term Loan $800 million Senior Secured 1st Lien Notes (“OpCo Notes”) (1) (1) Apollo purchased from McGraw Hill Companies two businesses (i) School (sells K-12 educational materials) and (ii) CTB (provides K-12 testing solutions) (together, "MH School"). The MH School business was placed into a subsidiary that is separate from MHGE and was financed through a separate debt structure. HoldCo and its subsidiaries do not guarantee or provide any collateral to the financing for MH School, and MH School does not guarantee or provide collateral to the financing for HoldCo and its subsidiaries. Any cash dividends or similar distributions from MHGE to MH School must pass through Parent and are subject to payment restrictions set forth in MHGE’s Senior Secured Credit Facilities and the indenture governing the OpCo Notes and as will be included in the indenture governing the new HoldCo Notes. MHGE entered into one or more agreements with MH School, Parent and/or AcquisitionCo relating to shared systems, operations and assets, pursuant to which certain of the parties provide certain services to the others and allocate costs to the other for such services, to be settled in cash on a regular basis. Georgia Holdings, Inc. Outside the MHGE Credit Group MHGE Parent, LLC (“HoldCo”) McGraw-Hill Global Education Intermediate Holdings, LLC (“Holdings”) MHGE Parent Finance, Inc. Guarantee 9

Company Overview 10

Post-Plate Adj. Cash EBITDA(1) $293 2014 35% margin $38 2014 30% margin $38 2014 11% margin MHGE Company Overview Leading global provider of world-class educational materials and learning solutions targeting higher education, professional learning and information markets globally for over a century Marquee products containing proprietary and exclusive content distributed in nearly 60 languages across over 150 countries to users including students, educators, professionals and institutions Leading portfolio of high value-add digital learning solutions have demonstrated double-digit YoY growth and strong market shares Higher Education Professional International Leading provider of instructional content, adaptive learning and digital and print learning solutions to post- secondary students in the U.S. Leading provider of instructional content and subscription-based information services for professionals and education / test prep communities Serves the rapidly growing post- secondary, professional and primary education markets outside the U.S. Leverages the Company’s global scale, brand recognition and extensive high- quality product portfolio Description Cash Revenue Note: Higher Ed. includes applicable SAB 104 adjustments. (1) Post-Plate Adj. Cash EBITDA and Post-Plate Adj. Cash EBITDA margins refer to the twelve months ending 12/31/14. Excludes adjustments cost savings for initiatives that will be implemented. Post Plate Adjusted Cash EBITDA will not sum to total MHGE due to the ‘Other’ reporting segment. See Appendix – EBITDA Reconciliation. % of Total MHGE Post-Plate Adjusted Cash EBITDA(1) ($ in millions) 11 80% 10% % of Total MHGE Cash Revenues 64% 10% 26% 10% $838 2014 $127 2014 $336 2014

Business Update 12
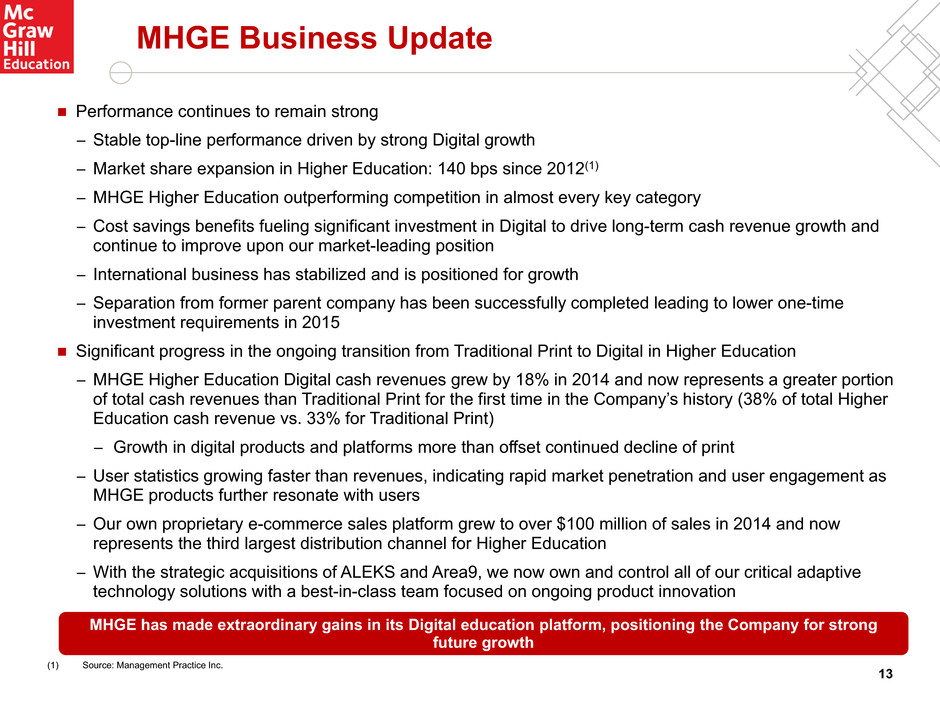
MHGE Business Update Performance continues to remain strong − Stable top-line performance driven by strong Digital growth − Market share expansion in Higher Education: 140 bps since 2012(1) − MHGE Higher Education outperforming competition in almost every key category − Cost savings benefits fueling significant investment in Digital to drive long-term cash revenue growth and continue to improve upon our market-leading position − International business has stabilized and is positioned for growth − Separation from former parent company has been successfully completed leading to lower one-time investment requirements in 2015 Significant progress in the ongoing transition from Traditional Print to Digital in Higher Education − MHGE Higher Education Digital cash revenues grew by 18% in 2014 and now represents a greater portion of total cash revenues than Traditional Print for the first time in the Company’s history (38% of total Higher Education cash revenue vs. 33% for Traditional Print) − Growth in digital products and platforms more than offset continued decline of print − User statistics growing faster than revenues, indicating rapid market penetration and user engagement as MHGE products further resonate with users − Our own proprietary e-commerce sales platform grew to over $100 million of sales in 2014 and now represents the third largest distribution channel for Higher Education − With the strategic acquisitions of ALEKS and Area9, we now own and control all of our critical adaptive technology solutions with a best-in-class team focused on ongoing product innovation (1) Source: Management Practice Inc. MHGE has made extraordinary gains in its Digital education platform, positioning the Company for strong future growth 13
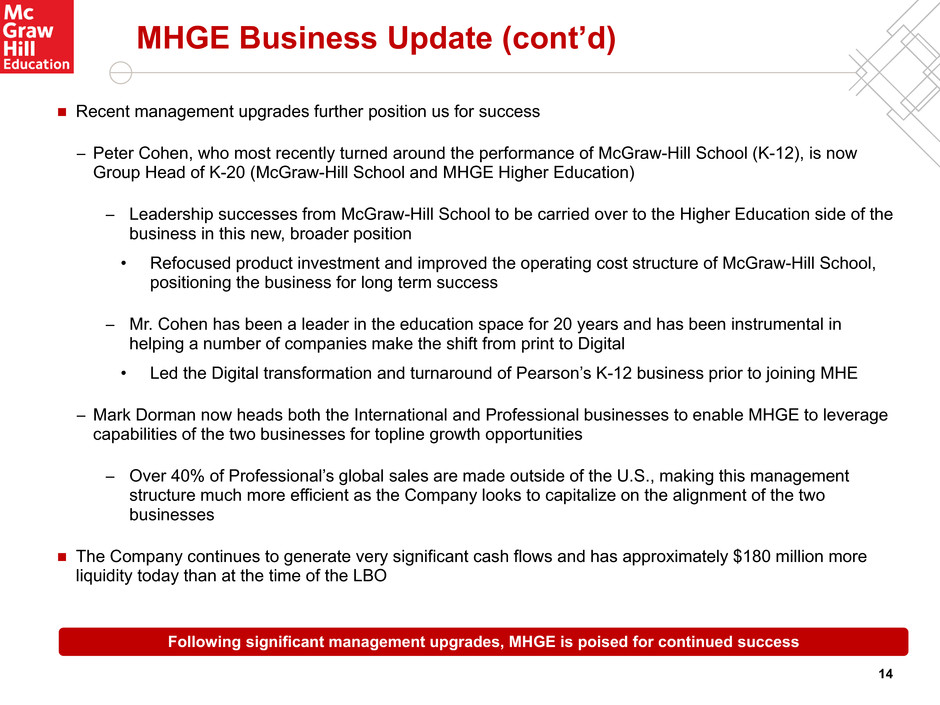
MHGE Business Update (cont’d) Recent management upgrades further position us for success − Peter Cohen, who most recently turned around the performance of McGraw-Hill School (K-12), is now Group Head of K-20 (McGraw-Hill School and MHGE Higher Education) − Leadership successes from McGraw-Hill School to be carried over to the Higher Education side of the business in this new, broader position • Refocused product investment and improved the operating cost structure of McGraw-Hill School, positioning the business for long term success − Mr. Cohen has been a leader in the education space for 20 years and has been instrumental in helping a number of companies make the shift from print to Digital • Led the Digital transformation and turnaround of Pearson’s K-12 business prior to joining MHE − Mark Dorman now heads both the International and Professional businesses to enable MHGE to leverage capabilities of the two businesses for topline growth opportunities − Over 40% of Professional’s global sales are made outside of the U.S., making this management structure much more efficient as the Company looks to capitalize on the alignment of the two businesses The Company continues to generate very significant cash flows and has approximately $180 million more liquidity today than at the time of the LBO Following significant management upgrades, MHGE is poised for continued success 14

Digital Product Overview and Update 15

Our industry leading platform: DPG and the Digital Learning Ecosystem Digital Learning Ecosystem OverviewDigital Platform Group Overview Established the Digital Platform Group (“DPG”) – a world class internal digital development capability About 500 engineers, learning technologists and technical product managers Headquartered in Boston Innovation Center Designed, built and shipped new products such as SmartBook, new releases of Connect and enhancements of Connect and LearnSmart Acquired and integrated ALEKS and Area9 product and engineering organization Between DPG and the acquisitions of ALEKS and Area9, we now own and control all of our key technology solutions with a best-in-class team focused on ongoing product innovation 16 DPG developed a framework called The McGraw-Hill Education Digital Learning Ecosystem for our digital development and market offerings Go to market in an easy to use, integrated, open, extensible, data-driven and data-aware platform Own the platform technologies that touch both the educator and learner and create sustainable value Enable personalized learning via adaptive and data- aware/data-generating learning interactions Compete on the basis of outcomes and ease of use License and implement enabling technology for enhanced MHE web footprint and commerce capabilities
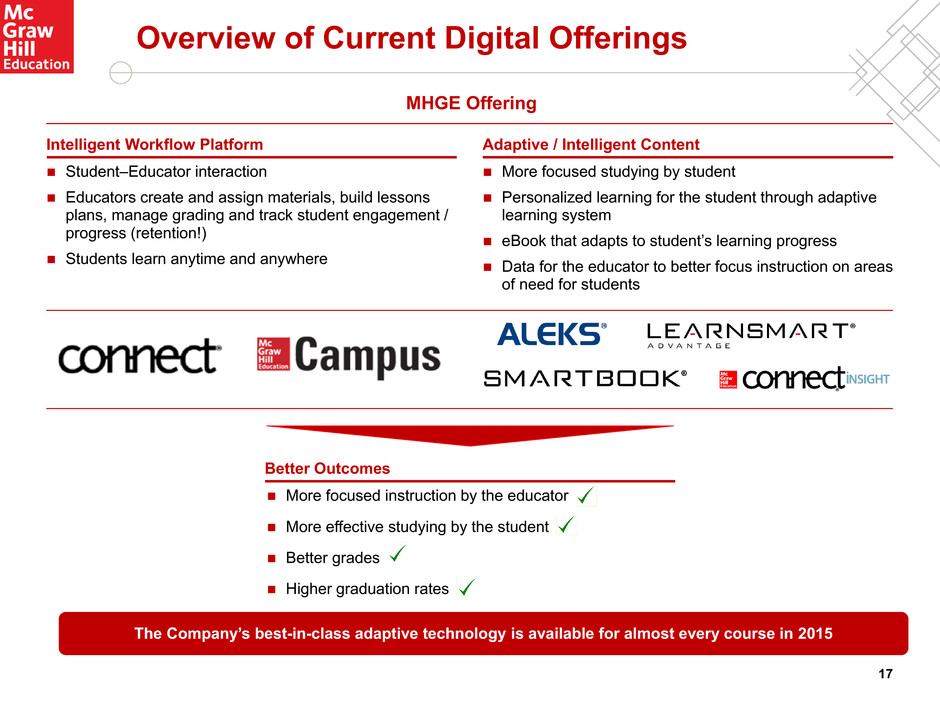
Overview of Current Digital Offerings More focused instruction by the educator More effective studying by the student Better grades Higher graduation rates Better Outcomes More focused studying by student Personalized learning for the student through adaptive learning system eBook that adapts to student’s learning progress Data for the educator to better focus instruction on areas of need for students Adaptive / Intelligent Content Student–Educator interaction Educators create and assign materials, build lessons plans, manage grading and track student engagement / progress (retention!) Students learn anytime and anywhere Intelligent Workflow Platform MHGE Offering The Company’s best-in-class adaptive technology is available for almost every course in 2015 17
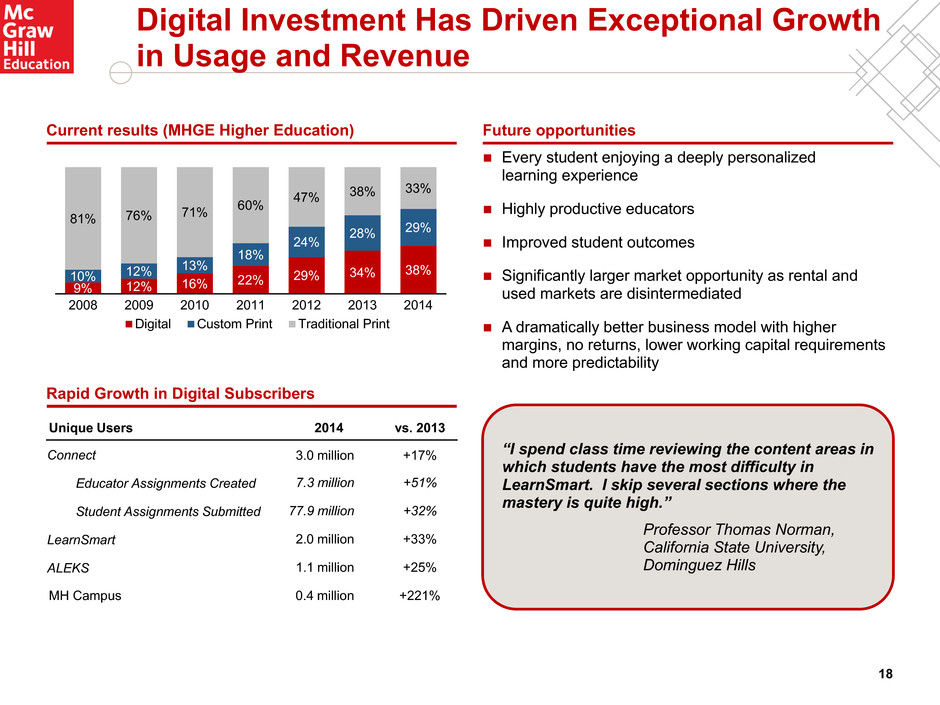
Digital Investment Has Driven Exceptional Growth in Usage and Revenue Rapid Growth in Digital Subscribers Every student enjoying a deeply personalized learning experience Highly productive educators Improved student outcomes Significantly larger market opportunity as rental and used markets are disintermediated A dramatically better business model with higher margins, no returns, lower working capital requirements and more predictability Future opportunitiesCurrent results (MHGE Higher Education) 9% 12% 16% 22% 29% 34% 38%10% 12% 13% 18% 24% 28% 29% 81% 76% 71% 60% 47% 38% 33% 2008 2009 2010 2011 2012 2013 2014 Digital Custom Print Traditional Print Unique Users 2014 vs. 2013 Connect 3.0 million +17% Educator Assignments Created 7.3 million +51% Student Assignments Submitted 77.9 million +32% LearnSmart 2.0 million +33% ALEKS 1.1 million +25% MH Campus 0.4 million +221% “I spend class time reviewing the content areas in which students have the most difficulty in LearnSmart. I skip several sections where the mastery is quite high.” Professor Thomas Norman, California State University, Dominguez Hills 18

Financial Update 19
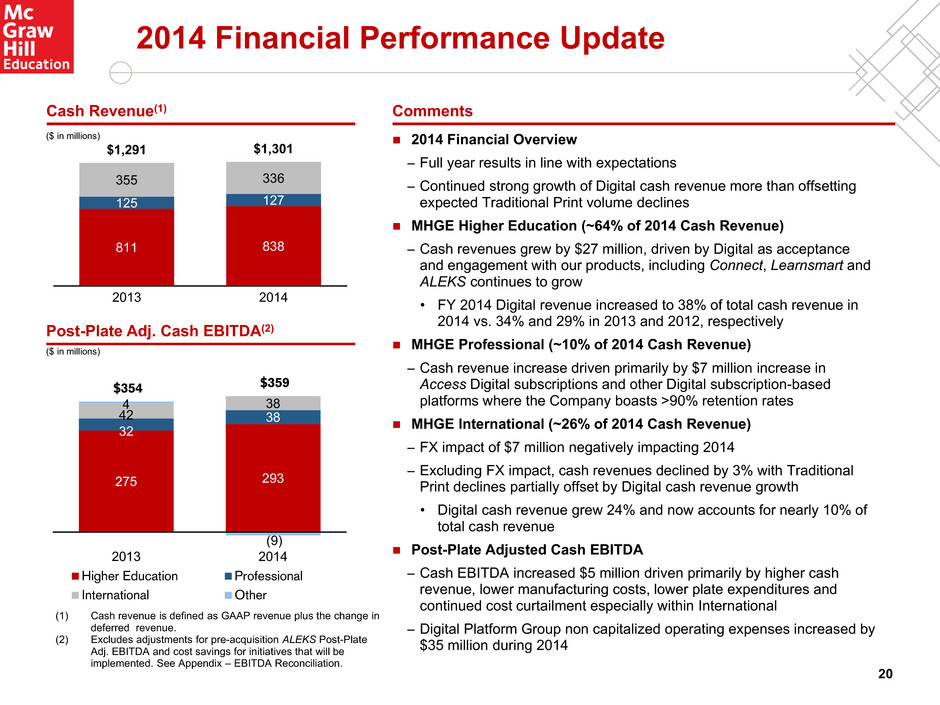
811 838 125 127 355 336 $1,291 $1,301 2013 2014 ($ in millions) 2014 Financial Performance Update Post-Plate Adj. Cash EBITDA(2) CommentsCash Revenue(1) 2014 Financial Overview − Full year results in line with expectations − Continued strong growth of Digital cash revenue more than offsetting expected Traditional Print volume declines MHGE Higher Education (~64% of 2014 Cash Revenue) − Cash revenues grew by $27 million, driven by Digital as acceptance and engagement with our products, including Connect, Learnsmart and ALEKS continues to grow • FY 2014 Digital revenue increased to 38% of total cash revenue in 2014 vs. 34% and 29% in 2013 and 2012, respectively MHGE Professional (~10% of 2014 Cash Revenue) − Cash revenue increase driven primarily by $7 million increase in Access Digital subscriptions and other Digital subscription-based platforms where the Company boasts >90% retention rates MHGE International (~26% of 2014 Cash Revenue) − FX impact of $7 million negatively impacting 2014 − Excluding FX impact, cash revenues declined by 3% with Traditional Print declines partially offset by Digital cash revenue growth • Digital cash revenue grew 24% and now accounts for nearly 10% of total cash revenue Post-Plate Adjusted Cash EBITDA − Cash EBITDA increased $5 million driven primarily by higher cash revenue, lower manufacturing costs, lower plate expenditures and continued cost curtailment especially within International − Digital Platform Group non capitalized operating expenses increased by $35 million during 2014 (1) Cash revenue is defined as GAAP revenue plus the change in deferred revenue. (2) Excludes adjustments for pre-acquisition ALEKS Post-Plate Adj. EBITDA and cost savings for initiatives that will be implemented. See Appendix – EBITDA Reconciliation. 20 275 293 32 3842 384 (9) $354 $359 2013 2014 Higher Education Professional International Other ($ in millions)
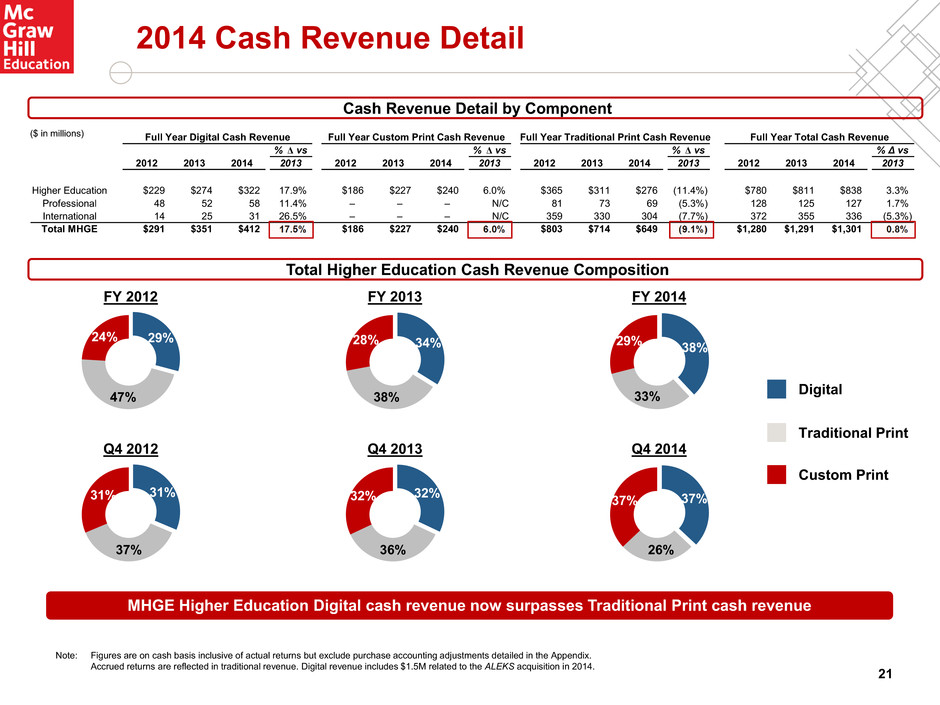
Full Year Digital Cash Revenue Full Year Custom Print Cash Revenue Full Year Traditional Print Cash Revenue Full Year Total Cash Revenue 2012 2013 2014 2013 2012 2013 2014 2013 2012 2013 2014 2013 2012 2013 2014 2013 Higher Education $229 $274 $322 17.9% $186 $227 $240 6.0% $365 $311 $276 (11.4%) $780 $811 $838 3.3% Professional 48 52 58 11.4% – – – N/C 81 73 69 (5.3%) 128 125 127 1.7% International 14 25 31 26.5% – – – N/C 359 330 304 (7.7%) 372 355 336 (5.3%) Total MHGE $291 $351 $412 17.5% $186 $227 $240 6.0% $803 $714 $649 (9.1%) $1,280 $1,291 $1,301 0.8% % Δ vs % Δ vs % Δ vs % ∆ vs MHGE Higher Education Digital cash revenue now surpasses Traditional Print cash revenue 37% 26% 37% 2014 Cash Revenue Detail Total Higher Education Cash Revenue Composition 29% 47% 24% 38% 33% 29%34% 38% 28% Digital Custom Print Traditional Print 200 Note: Figures are on cash basis inclusive of actual returns but exclude purchase accounting adjustments detailed in the Appendix. Accrued returns are reflected in traditional revenue. Digital revenue includes $1.5M related to the ALEKS acquisition in 2014. FY 2012 FY 2013 FY 2014 31% 37% 31% 32% 36% 32% Q4 2012 Q4 2013 Q4 2014 Cash Revenue Detail by Component ($ in millions) 21
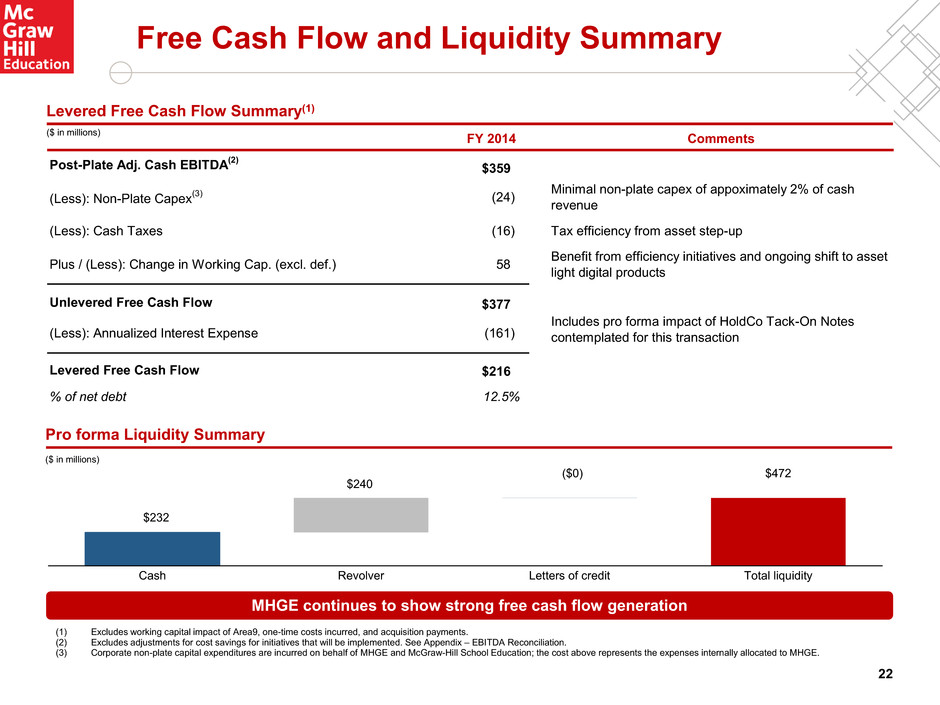
$232 ($0) $472 $240 Cash Revolver Letters of credit Total liquidity MHGE continues to show strong free cash flow generation Free Cash Flow and Liquidity Summary Pro forma Liquidity Summary Levered Free Cash Flow Summary(1) ($ in millions) (1) Excludes working capital impact of Area9, one-time costs incurred, and acquisition payments. (2) Excludes adjustments for cost savings for initiatives that will be implemented. See Appendix – EBITDA Reconciliation. (3) Corporate non-plate capital expenditures are incurred on behalf of MHGE and McGraw-Hill School Education; the cost above represents the expenses internally allocated to MHGE. ($ in millions) FY 2014 Comments Post-Plate Adj. Cash EBITDA(2) $359 (Less): Non-Plate Capex(3) (24) Minimal non-plate capex of appoximately 2% of cash revenue (Less): Cash Taxes (16) Tax efficiency from asset step-up Plus / (Less): Change in Working Cap. (excl. def.) 58 Benefit from efficiency initiatives and ongoing shift to asset light digital products Unlevered Free Cash Flow $377 (Less): Annualized Interest Expense (161) Levered Free Cash Flow $216 % of net debt 12.5% Includes pro forma impact of HoldCo Tack-On Notes contemplated for this transaction 22

Conclusion Higher Education Digital cash revenue surpassed Traditional Print cash revenue for the first fiscal year ever in 2014 − Digital represents 38% of Higher Education revenues today vs. 29% at LBO Traditional Print cash revenue continues to decline as expected and today only represents 33% of Higher Education cash revenues vs. 47% at LBO Continued investment made behind digital platforms to grow top-line and maintain digital leadership position – significant year-over-year increase in opex investment of $35 million in 2014 alone Two consecutive years of growth: Cash revenue and Post-Plate Adjusted Cash EBITDA were both declining at the time of the LBO Pro Forma Post-Plate Adj. Cash EBITDA has grown to $386 million today vs. $378 million at LBO Cost savings initiative continues to remain on track with additional opportunities already identified and available to pursue – cost savings are funding increased digital investment Separation from former parent company has been successfully completed leading to lower one-time investment in 2015 Liquidity has increased to $472 million today vs. $294 million at the time of the LBO as a result of robust free cash flow generation – inclusive of $151 million optional debt paydown Annual cash interest expense was ~$155 million at the LBO and will be ~$161 million pro forma for the proposed Transaction MHGE is a dramatically better credit today than at the time of the LBO Digital Leadership Strong Liquidity Improved Financial Performance Proposed transaction represents a very modest increase in leverage behind a materially and continuously improved credit – approximately 0.2x FY 2014 Pro Forma Post-Plate Adjusted Cash EBITDA 23

Appendix 24
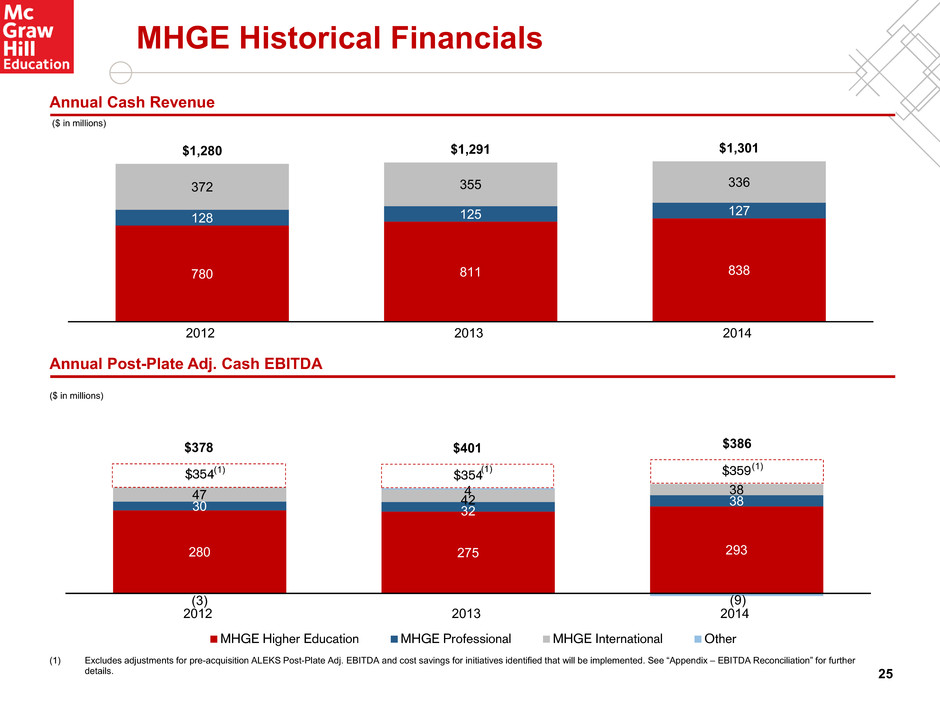
280 275 293 30 32 38 47 42 38 (3) 4 (9) $354 $354 $359 2012 2013 2014 MHGE Higher Education MHGE Professional MHGE International Other ($ in millions) Annual Cash Revenue MHGE Historical Financials 780 811 838 128 125 127 372 355 336 $1,280 $1,291 $1,301 2012 2013 2014 ($ in millions) (1) Excludes adjustments for pre-acquisition ALEKS Post-Plate Adj. EBITDA and cost savings for initiatives identified that will be implemented. See “Appendix – EBITDA Reconciliation” for further details. $401 $386 (1) (1) (1) $378 Annual Post-Plate Adj. Cash EBITDA 25
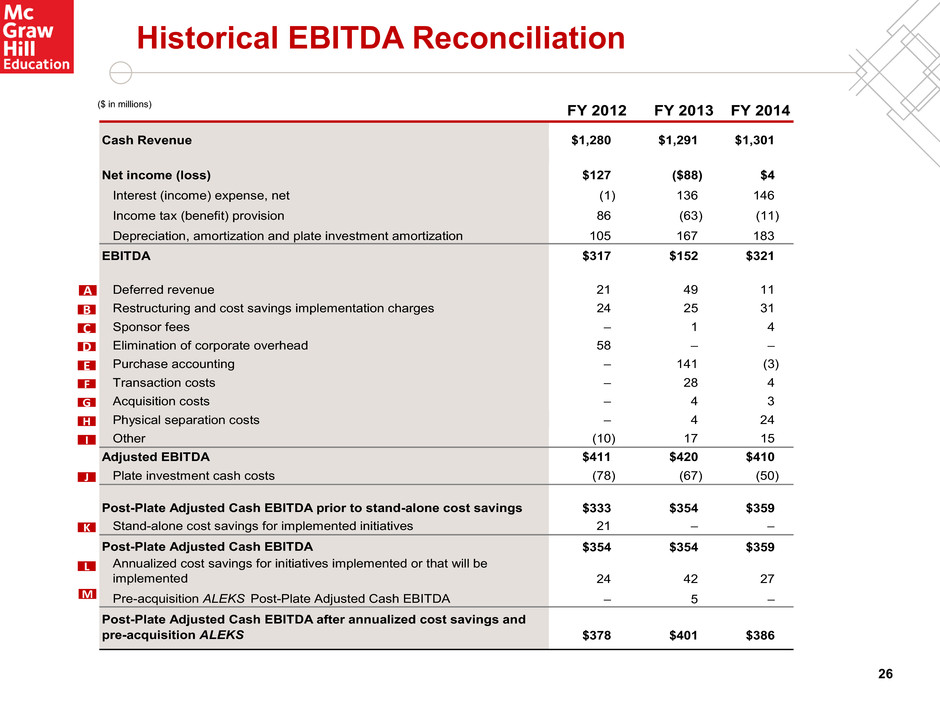
Historical EBITDA Reconciliation ($ in millions) 26 FY 2012 FY 2013 FY 2014 Cash Revenue $1,280 $1,291 $1,301 Net income (loss) $127 ($88) $4 Interest (income) expense, net (1) 136 146 Income tax (benefit) provision 86 (63) (11) Depreciation, amortization and plate investment amortization 105 167 183 EBITDA $317 $152 $321 Deferred revenue 21 49 11 Restructuring and cost savings implementation charges 24 25 31 Sponsor fees – 1 4 Elimination of corporate overhead 58 – – Purchase accounting – 141 (3) Transaction costs – 28 4 Acquisition costs – 4 3 Physical separation costs – 4 24 Other (10) 17 15 Adjusted EBITDA $411 $420 $410 Plate investment cash costs (78) (67) (50) Post-Plate Adjusted Cash EBITDA prior to stand-alone cost savings $333 $354 $359 Stand-alone cost savings for implemented initiatives 21 – – Post-Plate Adjusted Cash EBITDA $354 $354 $359 Annualized cost savings for initiatives implemented or that will be implemented 24 42 27 Pre-acquisition ALEKS Post-Plate Adjusted Cash EBITDA – 5 – Post-Plate Adjusted Cash EBITDA after annualized cost savings and pre-acquisition ALEKS $378 $401 $386 A B C H G E D F I J L M K
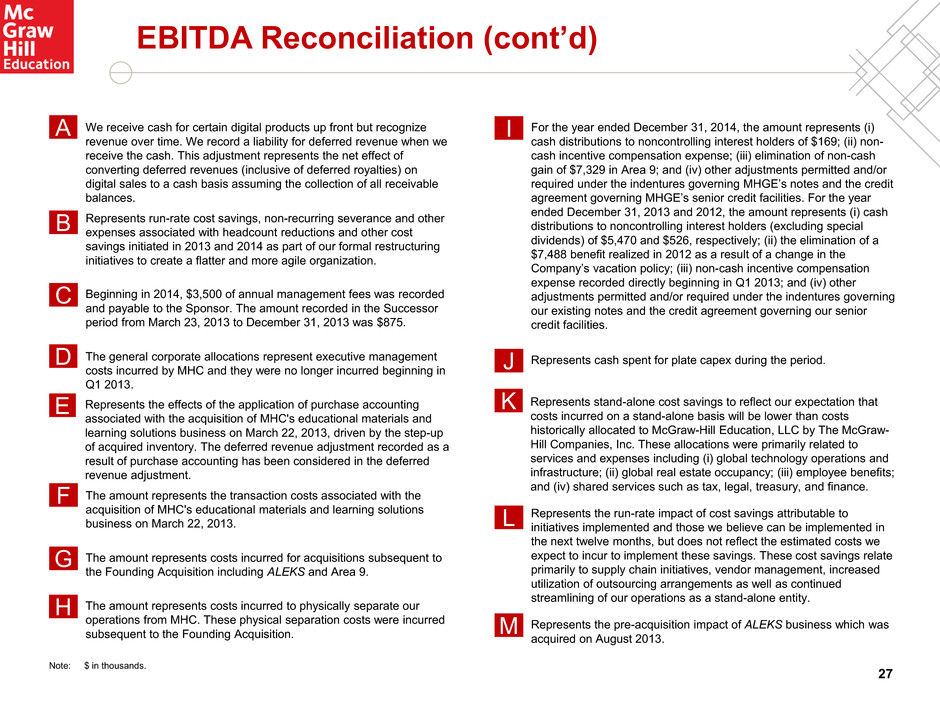
EBITDA Reconciliation (cont’d) We receive cash for certain digital products up front but recognize revenue over time. We record a liability for deferred revenue when we receive the cash. This adjustment represents the net effect of converting deferred revenues (inclusive of deferred royalties) on digital sales to a cash basis assuming the collection of all receivable balances. A The general corporate allocations represent executive management costs incurred by MHC and they were no longer incurred beginning in Q1 2013. D The amount represents the transaction costs associated with the acquisition of MHC's educational materials and learning solutions business on March 22, 2013. F Represents the effects of the application of purchase accounting associated with the acquisition of MHC's educational materials and learning solutions business on March 22, 2013, driven by the step-up of acquired inventory. The deferred revenue adjustment recorded as a result of purchase accounting has been considered in the deferred revenue adjustment. E The amount represents costs incurred for acquisitions subsequent to the Founding Acquisition including ALEKS and Area 9. G Represents stand-alone cost savings to reflect our expectation that costs incurred on a stand-alone basis will be lower than costs historically allocated to McGraw-Hill Education, LLC by The McGraw- Hill Companies, Inc. These allocations were primarily related to services and expenses including (i) global technology operations and infrastructure; (ii) global real estate occupancy; (iii) employee benefits; and (iv) shared services such as tax, legal, treasury, and finance. K Represents the run-rate impact of cost savings attributable to initiatives implemented and those we believe can be implemented in the next twelve months, but does not reflect the estimated costs we expect to incur to implement these savings. These cost savings relate primarily to supply chain initiatives, vendor management, increased utilization of outsourcing arrangements as well as continued streamlining of our operations as a stand-alone entity. L Represents the pre-acquisition impact of ALEKS business which was acquired on August 2013. M Beginning in 2014, $3,500 of annual management fees was recorded and payable to the Sponsor. The amount recorded in the Successor period from March 23, 2013 to December 31, 2013 was $875. C For the year ended December 31, 2014, the amount represents (i) cash distributions to noncontrolling interest holders of $169; (ii) non- cash incentive compensation expense; (iii) elimination of non-cash gain of $7,329 in Area 9; and (iv) other adjustments permitted and/or required under the indentures governing MHGE’s notes and the credit agreement governing MHGE’s senior credit facilities. For the year ended December 31, 2013 and 2012, the amount represents (i) cash distributions to noncontrolling interest holders (excluding special dividends) of $5,470 and $526, respectively; (ii) the elimination of a $7,488 benefit realized in 2012 as a result of a change in the Company’s vacation policy; (iii) non-cash incentive compensation expense recorded directly beginning in Q1 2013; and (iv) other adjustments permitted and/or required under the indentures governing our existing notes and the credit agreement governing our senior credit facilities. I Represents cash spent for plate capex during the period.J Represents run-rate cost savings, non-recurring severance and other expenses associated with headcount reductions and other cost savings initiated in 2013 and 2014 as part of our formal restructuring initiatives to create a flatter and more agile organization. B The amount represents costs incurred to physically separate our operations from MHC. These physical separation costs were incurred subsequent to the Founding Acquisition. H Note: $ in thousands. 27
EBITDA and Adjusted EBITDA 28 EBITDA, a measure used by management to assess operating performance, is defined as income from continuing operations plus interest, income taxes, depreciation and amortization, including amortization of prepublication costs (“plate investment”). Adjusted EBITDA is defined as EBITDA adjusted to exclude unusual items and other adjustments required or permitted in calculating covenant compliance under the indenture governing our senior secured notes and/or our new senior secured credit facilities. Post-Plate Adjusted Cash EBITDA reflects the impact of cash spent for plate investment. Plate investment costs, reflecting the cost of developing education content, are capitalized and amortized. These costs are capitalized when the title is expected to generate probable future economic benefits and are amortized upon publication of the title over its estimated useful life of up to six years. Post-Plate Adjusted Cash EBITDA reflects EBITDA as defined in the First Lien Credit Agreement and the Bond Indenture. Each of the above described EBITDA-based measures is not a recognized term under U.S. GAAP and does not purport to be an alternative to income from continuing operations as a measure of operating performance or to cash flows from operations as a measure of liquidity. Additionally, each such measure is not intended to be a measure of free cash flows available for management’s discretionary use, as it does not consider certain cash requirements such as interest payments, tax payments and debt service requirements. Such measures have limitations as analytical tools, and you should not consider any of such measures in isolation or as substitutes for our results as reported under U.S. GAAP. Management compensates for the limitations of using non-GAAP financial measures by using them to supplement U.S. GAAP results to provide a more complete understanding of the factors and trends affecting the business than U.S. GAAP results alone. Because not all companies use identical calculations, these EBITDA-based measures may not be comparable to other similarly titled measures of other companies. Management believes EBITDA is helpful in highlighting trends because EBITDA excludes the results of decisions that are outside the control of operating management and can differ significantly from company to company depending on long-term strategic decisions regarding capital structure, the tax rules in the jurisdictions in which companies operate, and capital investments. In addition, EBITDA provides more comparability between the historical operating results and operating results that reflect purchase accounting and the new capital structure. Management believes that the inclusion of supplementary adjustments to EBITDA applied in presenting Adjusted EBITDA and Post-Plate Adjusted Cash EBITDA are appropriate to provide additional information to investors about certain material non-cash items and about unusual items that we do not expect to continue at the same level in the future.

Review of the Significant Progress Made Since the LBO Digital cash revenues have grown at a 22% CAGR from FY 2011 to FY 2014 Higher Education cash revenues now 38% Digital in FY 2014, up from 34% in FY 2013, 29% in FY 2012, and 22% in FY 2011 − Higher Education Digital cash revenue now surpasses Traditional Print for the first time in the Company’s history 3rd party data indicates Higher Education has gained 140 bps of market share since 2012 The McGraw-Hill Digital Learning Ecosystem continues to expand its capabilities across every stage of the Digital learning lifecycle Proprietary e-commerce platform achieved $105 million in 2014 cash revenues, up 57% − Only two third-party distribution partners generated more cash revenue than our internal e-commerce platform Strong growth in Digital platform usage with increases in unique users of 17% for Connect and 33% for LearnSmart from 2013 to 2014 Poised to capitalize on the transition to Digital learning with a leading portfolio of high-growth, high-margin Digital solutions well positioned relative to competitors Quality of Digital offerings − Compelling opportunity to capture market share over time Desire to bolster Digital portfolio by enhancing in-house capabilities and through strategic tuck-in acquisitions Rapidly Growing Digital Portfolio New CEO, David Levin, with extensive international and public company experience New President of U.S. Education, Peter Cohen, who previously ran McGraw-Hill School Education (K-12) and joined from Pearson in 2013 − Turned around the McGraw-Hill School business by refocusing product investment and improving the operating cost structure − Mr. Cohen brings 30 years of experience running large operations and 20 years of experience in education − Previously led the Digital transformation and turnaround of Pearson’s K-12 business Separation from former parent company has been successfully completed Experienced team with 19 years average experience in education industry CFO and Chief Digital Officer were recent additions and share Apollo’s long-term vision for the business Apollo identified potential management additions during due diligence Strong Leadership Team Current net OpCo leverage of 3.2x as a result of optional term loan prepayments and EBITDA growth FY 2014 Pro Forma Post-Plate Adj Cash EBITDA of $386 million (includes $35 million of additional opex investment over last year in the Digital Platform Group) Total liquidity of $472 million ($240 million revolver availability and $232 million of cash) − ~$180 million more of liquidity today than at the time of the acquisition − Inclusive of $151 million of optional debt paydown Closing net leverage of 4.1x FY 2012 Post-Plate Adj. Cash EBITDA of $378 million Total liquidity of $294 million ($205 million revolver availability and $89 million of cash) Capital Structure & Liquidity Progress Since Acquisition At Time of Acquisition (1) Source: Management Practice, Inc. 29
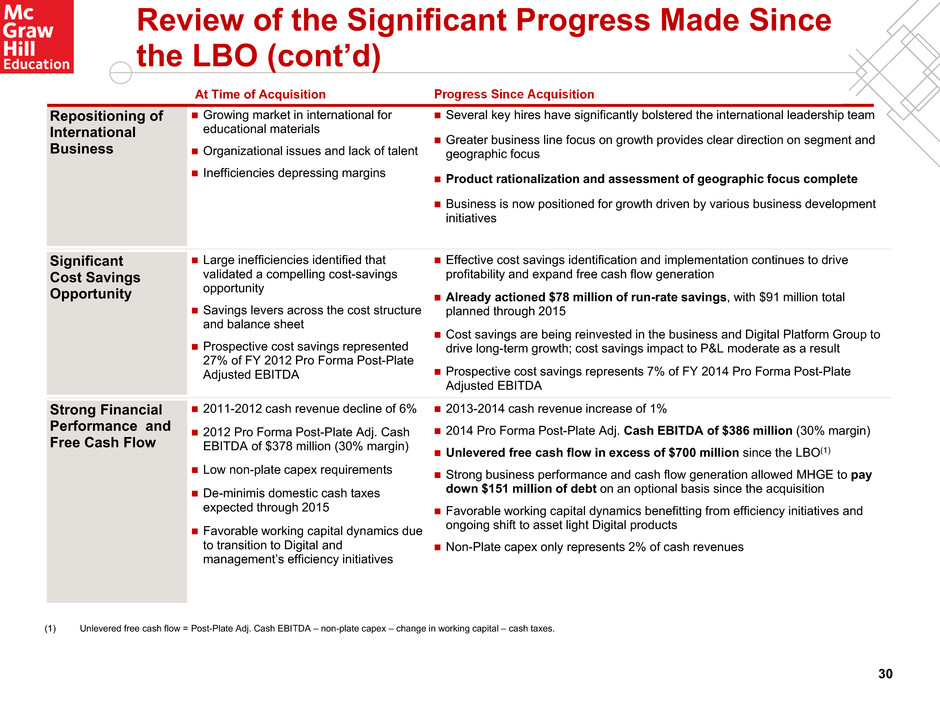
Review of the Significant Progress Made Since the LBO (cont’d) (1) Unlevered free cash flow = Post-Plate Adj. Cash EBITDA – non-plate capex – change in working capital – cash taxes. 2013-2014 cash revenue increase of 1% 2014 Pro Forma Post-Plate Adj. Cash EBITDA of $386 million (30% margin) Unlevered free cash flow in excess of $700 million since the LBO(1) Strong business performance and cash flow generation allowed MHGE to pay down $151 million of debt on an optional basis since the acquisition Favorable working capital dynamics benefitting from efficiency initiatives and ongoing shift to asset light Digital products Non-Plate capex only represents 2% of cash revenues 2011-2012 cash revenue decline of 6% 2012 Pro Forma Post-Plate Adj. Cash EBITDA of $378 million (30% margin) Low non-plate capex requirements De-minimis domestic cash taxes expected through 2015 Favorable working capital dynamics due to transition to Digital and management’s efficiency initiatives Strong Financial Performance and Free Cash Flow Effective cost savings identification and implementation continues to drive profitability and expand free cash flow generation Already actioned $78 million of run-rate savings, with $91 million total planned through 2015 Cost savings are being reinvested in the business and Digital Platform Group to drive long-term growth; cost savings impact to P&L moderate as a result Prospective cost savings represents 7% of FY 2014 Pro Forma Post-Plate Adjusted EBITDA Large inefficiencies identified that validated a compelling cost-savings opportunity Savings levers across the cost structure and balance sheet Prospective cost savings represented 27% of FY 2012 Pro Forma Post-Plate Adjusted EBITDA Significant Cost Savings Opportunity Several key hires have significantly bolstered the international leadership team Greater business line focus on growth provides clear direction on segment and geographic focus Product rationalization and assessment of geographic focus complete Business is now positioned for growth driven by various business development initiatives Growing market in international for educational materials Organizational issues and lack of talent Inefficiencies depressing margins Repositioning of International Business Progress Since Acquisition At Time of Acquisition 30

Cash Revenue MHGE Historical Financials: Higher Education $229 $274 $322 29% 34% 38% 2012 2013 2014 % of Higher Ed Cash Revenue 229 274 322 186 227 240 365 311 276 $780 $811 $838 2012 2013 2014 Traditional Print & Other Custom Print Digital Leading provider of instructional content, adaptive learning and custom solutions for the post-secondary and adult learner markets in the U.S. − Instructional materials include high-quality digital and adaptive learning solutions, SmartBooks, custom solutions, traditional print products, software and other multimedia products across the full spectrum of subjects Significant investment to date in an industry leading suite of digital and custom learning solutions − Digital solutions focus on adaptive learning products that personalize the learning experience in real time, based on individual learning patterns − Digital cash revenues: 20% CAGR from 2011 to 2014 and comprised ~38% of MHGE Higher Education cash revenue in FY 2014 − Custom print cash revenues: Comprise ~29% of cash revenue through FY 2014 − Traditional print cash revenues: ~33% of the business, down from ~59% in 2011 Over 2,000 titles with no single title accounting for more than 2% of cash revenue Fragmented customer base and a large sales force that interfaces directly with individual professors Traditional Print 33% Digital 38% Custom Print 29% $280 $275 $293 36% 34% 35% 2012 2013 2014 Margin ($ in millions) ($ in millions) (2) Figures include digital and custom digital. ($ in millions) (1) Excludes adjustments for cost savings for initiatives that will be implemented. See Appendix – EBITDA Reconciliation. Post-Plate Adj. Cash EBITDA(1) Digital Cash Revenue(2) 2014 Cash Revenue Mix 31

Digital Cash Revenue MHGE Historical Financials: Professional $48 $52 $58 37% 42% 46% 2012 2013 2014 % of Professional Cash Revenue $128 $125 $127 2012 2013 2014 Leading provider of medical, technical, business and educational content and training solutions in digital and print formats for students and professionals − Provides timely and authoritative mission critical information solutions to customers around the world through the release of approximately 500 titles per year − Distinguished authors and prestigious brands represent some of the best-selling professional publications such as Harrison’s Principles of Internal Medicine, Perry’s Chemical Engineers’ Handbook and Graham & Dodd’s Security Analysis Products include eBooks, digital subscription services and print products − Over 7,000 eBooks on multiple devices such as the Kindle, Nook and iPad − More than 200 medical, test prep and business mobile applications for the iPhone − Growing provider of subscription-based digital information solutions (>90% annual retention rates) to more than 2,000 institutional customers Increasing EBITDA margins from transition to digital − eBooks priced at parity to print books and with lower costs related to printing, distribution and warehousing, EBITDA margins are expected to rise as digital sales increase ($ in millions) $30 $32 $38 23% 26% 30% 2012 2013 2014 Margin ($ in millions) ($ in millions) (1) Excludes adjustments for cost savings for initiatives that will be implemented. See Appendix – EBITDA Reconciliation. Cash Revenue Post-Plate Adj. Cash EBITDA(1) 32

MHGE Historical Financials: International $14 $25 $31 4% 7% 9% 2012 2013 2014 % of International Cash Revenue $372 $355 $336 2012 2013 2014 $47 $42 $38 13% 12% 11% 2012 2013 2014 Margin ($ in millions) ($ in millions) ($ in millions) Serves the post-secondary, professional and primary education markets globally in nearly 60 languages across over 150 countries − Leverages the Company’s global scale, brand recognition and extensive high-quality product portfolio, including content, tools, services and expertise from the domestic businesses • 2/3 of revenue generated from unmodified or slightly modified U.S. products Leading market shares and strong brand equity across many high growth, developing geographies − Over 50% of revenues derived from emerging markets Significant opportunity to leverage brand, content and sales force to expand into adjacent educational services such as teacher training and English-based learning platforms The new President and CFO, recruited in April and August 2013, respectively, have begun to lead the comprehensive operational reorganization plan in the transition of the business towards long-term profitable growth − CEO David Levin also brings extensive international experience to McGraw Hill − Weak management and lack of coherent strategy prior to Apollo ownership − Comprehensive restructuring plan underway (1) Excludes adjustments for cost savings for initiatives that will be implemented. See Appendix – EBITDA Reconciliation. Digital Cash Revenue Cash Revenue Post-Plate Adj. Cash EBITDA(1) 33
