Attached files
| file | filename |
|---|---|
| 8-K - 8-K - MACERICH CO | a15-6873_38k.htm |
| EX-99.1 - EX-99.1 - MACERICH CO | a15-6873_3ex99d1.htm |
Exhibit 99.2
|
|
(NYSE: MAC) an S&P 500 Company March 31, 2015 Abbreviated |
|
|
LEGAL DISCLAIMER This document contains information constituting forward-looking statements and includes expectations regarding the Company’s future operational results as well as development, redevelopment and expansion activities. Stockholders are cautioned that any such forward-looking statements are not guarantees of future performance and involve risks, uncertainties and other factors that may cause actual results, performance or achievements of the Company to vary materially from those anticipated, expected or projected. Such factors include, among others, general industry, economic and business conditions, which will, among other things, affect demand for retail space or retail goods, availability and creditworthiness of current and prospective tenants, anchor or tenant bankruptcies, closures, mergers or consolidations, lease rates, terms and payments, interest rate fluctuations, availability, terms and cost of financing, operating expenses, and competition; adverse changes in the real estate markets, including the liquidity of real estate investments; and risks of real estate development, redevelopment, and expansion, including availability, terms and cost of financing, construction delays, environmental and safety requirements, budget overruns, sunk costs and lease-up; the inability to obtain, or delays in obtaining, all necessary zoning, land-use, building, and occupancy and other required governmental permits and authorizations; and governmental actions and initiatives (including legislative and regulatory changes) as well as terrorist activities or other acts of violence which could adversely affect all of the above factors. Furthermore, occupancy rates and rents at a newly completed property may not be sufficient to make the property profitable. The reader is directed to the Company’s various filings with the Securities and Exchange Commission, including the Annual Report on Form 10-K for the year ended December 31, 2014, for a discussion of such risks and uncertainties, which discussion is incorporated herein by reference. The Company does not intend, and undertakes no obligation, to update any forward-looking information to reflect events or circumstances after the date of this document or to reflect the occurrence of unanticipated events unless required by law to do so. In addition, references may be made to non-GAAP financial results. Investors are encouraged to review these non-GAAP financial measures, as well as the reconciliation of these measures to the comparable GAAP results included at the end of our earnings press release financial statements. Copies of our earnings press release containing these reconciliations can be found in the Investing section of our website at www.macerich.com. |
|
|
MANAGEMENT AND DIRECTORS HAVE CAREFULLY REVIEWED THE PROPOSAL 1 MACERICH The Macerich Board of Directors, working with financial and legal advisors, has undertaken a thorough and deliberate review of Simon's offer Retained Deutsche Bank, Goldman Sachs and JP Morgan as financial advisors Hired Eastdil Secured to act as real estate advisors Retained Kirkland & Ellis, Goodwin Procter and Venable as legal counsel The board has met eight times to discuss Simon’s interest Macerich's Independent Directors met without management and affiliated board members on multiple occasions The Macerich Board of Directors decision to reject Simon’s offer was unanimous Board includes real estate experts, financial experts, and a representative of one of Macerich’s largest shareholders Lead director, Fred Hubbell, was until 2006 a member of the executive board and Chairman, Insurance and Asset management Americas for the ING Group |
|
|
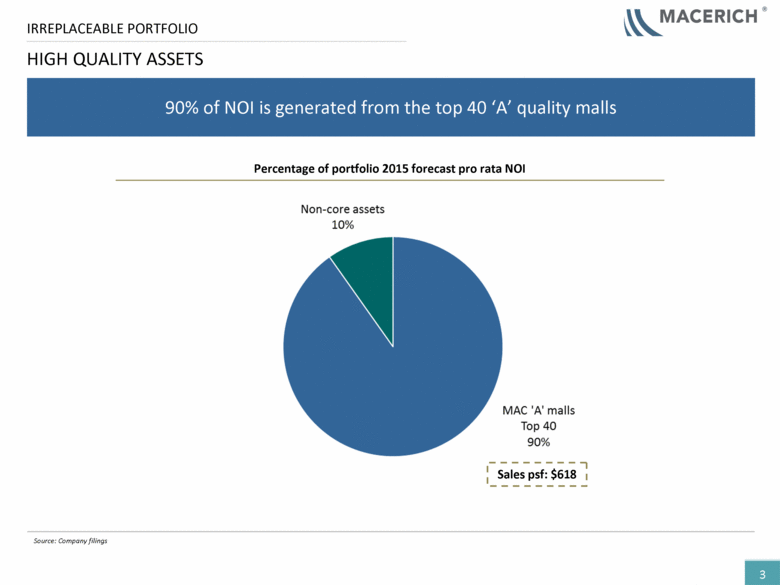
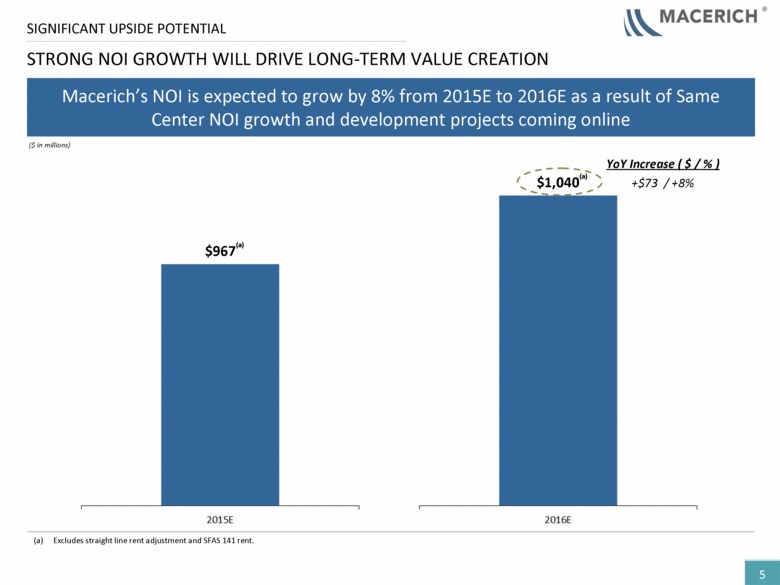
MANAGEMENT AND DIRECTORS HAVE CAREFULLY REVIEWED THE PROPOSAL (CONTINUED) 2 MACERICH The Macerich Board of Directors considered a number of key factors including, among others, the Company’s Unparalleled collection of assets in the most desirable and highest barrier-to-entry markets Successful track record and continued strategy of recycling out of lower growth assets and into highly productive assets 90% of NOI generated from high-quality, fortress malls 2016E NOI is expected to be $1.04 billion Numerous avenues for future value creation and significant upside potential Board is committed to continuing to enhance shareholder value Board intends to review staggered board and shareholder rights plan promptly following the 2015 annual meeting |
|
|
Percentage of portfolio 2015 forecast pro rata NOI HIGH QUALITY ASSETS 3 Source: Company filings IRREPLACEABLE PORTFOLIO 90% of NOI is generated from the top 40 ‘A’ quality malls Sales psf: $618 |
|
|
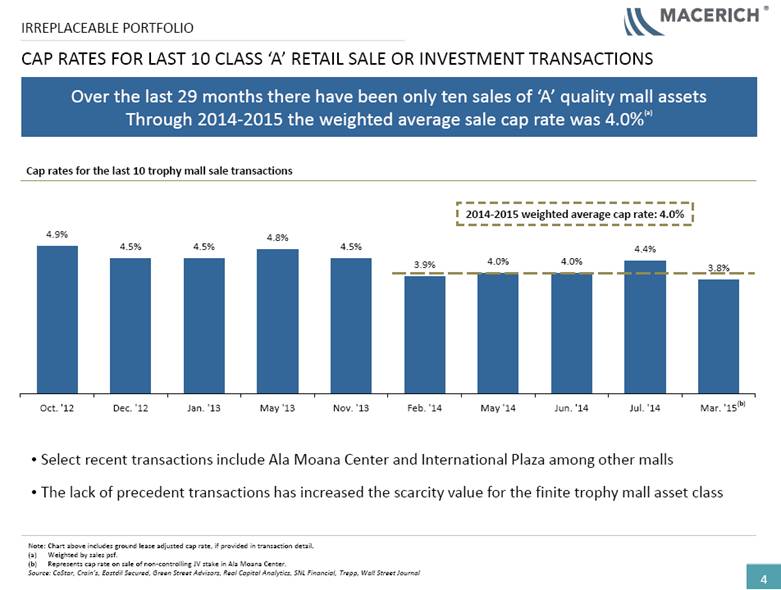
CAP RATES FOR LAST 10 CLASS ‘A’ RETAIL SALE OR INVESTMENT TRANSACTIONS 4 IRREPLACEABLE PORTFOLIO Select recent transactions include Ala Moana Center and International Plaza among other malls The lack of precedent transactions has increased the scarcity value for the finite trophy mall asset class Note: Chart above includes ground lease adjusted cap rate, if provided in transaction detail. (a) Weighted by sales psf. (b) Represents cap rate on sale of non-controlling JV stake in Ala Moana Center. Source: CoStar, Crain’s, Eastdil Secured, Green Street Advisors, Real Capital Analytics, SNL Financial, Trepp, Wall Street Journal Over the last 29 months there have been only ten sales of ‘A’ quality mall assets Through 2014-2015 the weighted average sale cap rate was 4.0%(a) Cap rates for the last 10 trophy mall sale transactions 2014-2015 weighted average cap rate: 4.0% (b) |
|
|
STRONG NOI GROWTH WILL DRIVE LONG-TERM VALUE CREATION 5 SIGNIFICANT UPSIDE POTENTIAL Macerich’s NOI is expected to grow by 8% from 2015E to 2016E as a result of Same Center NOI growth and development projects coming online ($ in millions) $967(a) $1,040(a) +$73 / +8% (a) Excludes straight line rent adjustment and SFAS 141 rent. YoY Increase ( $ / % ) |
|
|
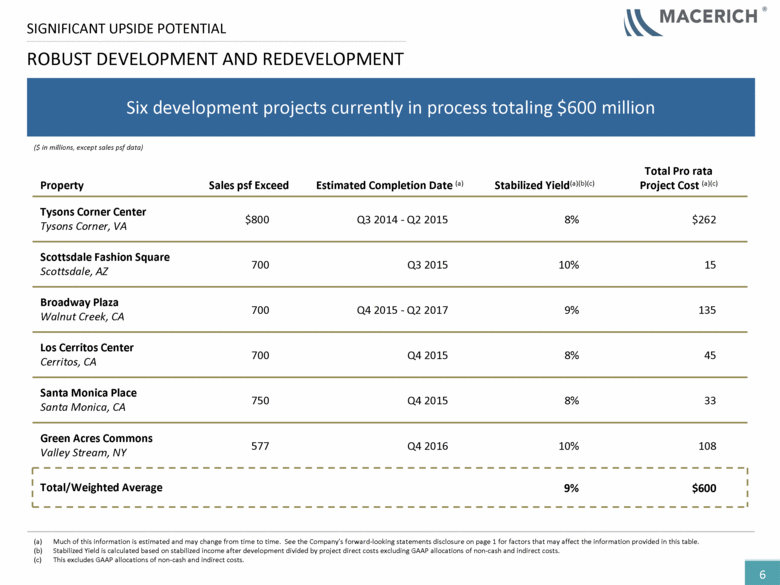
Property Sales psf Exceed Estimated Completion Date (a) Stabilized Yield(a)(b)(c) Total Pro rata Project Cost (a)(c) Tysons Corner Center Tysons Corner, VA $800 Q3 2014 - Q2 2015 8% $262 Scottsdale Fashion Square Scottsdale, AZ 700 Q3 2015 10% 15 Broadway Plaza Walnut Creek, CA 700 Q4 2015 - Q2 2017 9% 135 Los Cerritos Center Cerritos, CA 700 Q4 2015 8% 45 Santa Monica Place Santa Monica, CA 750 Q4 2015 8% 33 Green Acres Commons Valley Stream, NY 577 Q4 2016 10% 108 Total/Weighted Average 9% $600 ROBUST DEVELOPMENT AND REDEVELOPMENT (a) Much of this information is estimated and may change from time to time. See the Company’s forward-looking statements disclosure on page 1 for factors that may affect the information provided in this table. Stabilized Yield is calculated based on stabilized income after development divided by project direct costs excluding GAAP allocations of non-cash and indirect costs. This excludes GAAP allocations of non-cash and indirect costs. 6 SIGNIFICANT UPSIDE POTENTIAL Six development projects currently in process totaling $600 million ($ in millions, except sales psf data) |
|
|
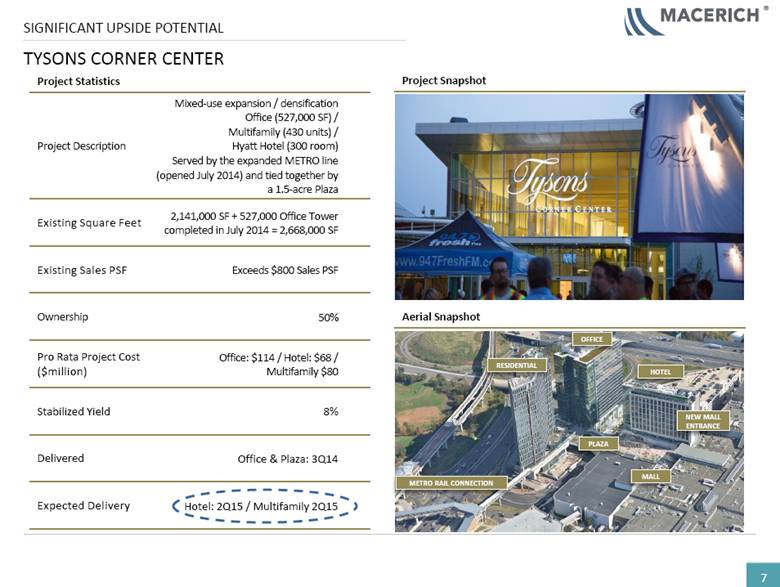
TYSONS CORNER CENTER 7 SIGNIFICANT UPSIDE POTENTIAL Project Statistics Project Description Mixed-use expansion / densification Office (527,000 SF) / Multifamily (430 units) / Hyatt Hotel (300 room) Served by the expanded METRO line (opened July 2014) and tied together by a 1.5-acre Plaza Existing Square Feet 2,141,000 SF + 527,000 Office Tower completed in July 2014 = 2,668,000 SF Existing Sales PSF Exceeds $800 Sales PSF Ownership 50% Pro Rata Project Cost ($million) Office: $114 / Hotel: $68 / Multifamily $80 Stabilized Yield 8% Delivered Office & Plaza: 3Q14 Expected Delivery Hotel: 2Q15 / Multifamily 2Q15 OFFICE RESIDENTIAL HOTEL PLAZA NEW MALL ENTRANCE METRO RAIL CONNECTION MALL Project Snapshot Aerial Snapshot |
|
|
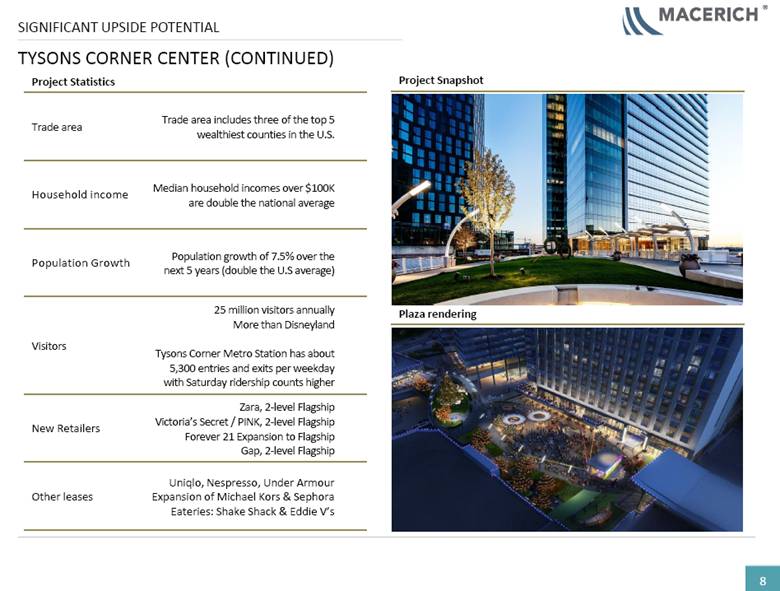
Project Statistics Trade area Trade area includes three of the top 5 wealthiest counties in the U.S. Household income Median household incomes over $100K are double the national average Population Growth Population growth of 7.5% over the next 5 years (double the U.S average) Visitors 25 million visitors annually More than Disneyland Tysons Corner Metro Station has about 5,300 entries and exits per weekday with Saturday ridership counts higher New Retailers Zara, 2-level Flagship Victoria’s Secret / PINK, 2-level Flagship Forever 21 Expansion to Flagship Gap, 2-level Flagship Other leases Uniqlo, Nespresso, Under Armour Expansion of Michael Kors & Sephora Eateries: Shake Shack & Eddie V’s TYSONS CORNER CENTER (CONTINUED) 8 SIGNIFICANT UPSIDE POTENTIAL Project Snapshot Plaza rendering |
|
|
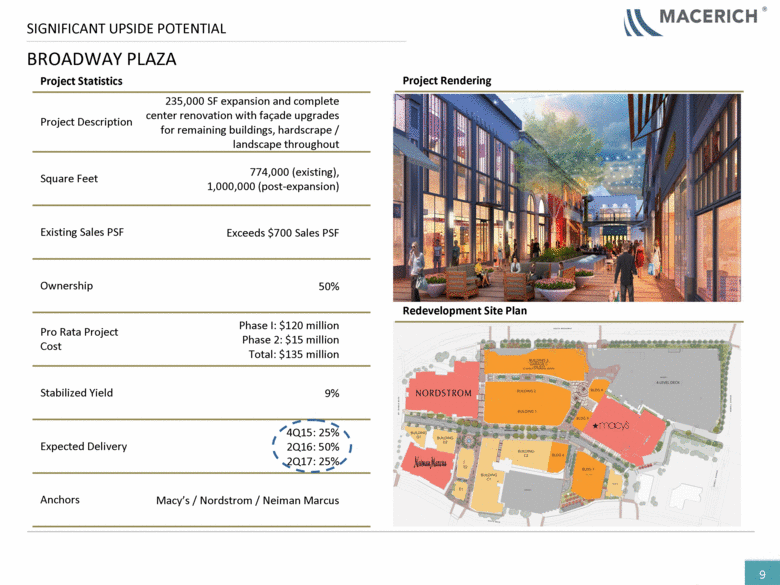
BROADWAY PLAZA 9 SIGNIFICANT UPSIDE POTENTIAL Project Statistics Project Description 235,000 SF expansion and complete center renovation with façade upgrades for remaining buildings, hardscrape / landscape throughout Square Feet 774,000 (existing), 1,000,000 (post-expansion) Existing Sales PSF Exceeds $700 Sales PSF Ownership 50% Pro Rata Project Cost Phase I: $120 million Phase 2: $15 million Total: $135 million Stabilized Yield 9% Expected Delivery 4Q15: 25% 2Q16: 50% 2Q17: 25% Anchors Macy’s / Nordstrom / Neiman Marcus Project Rendering Redevelopment Site Plan |
|
|
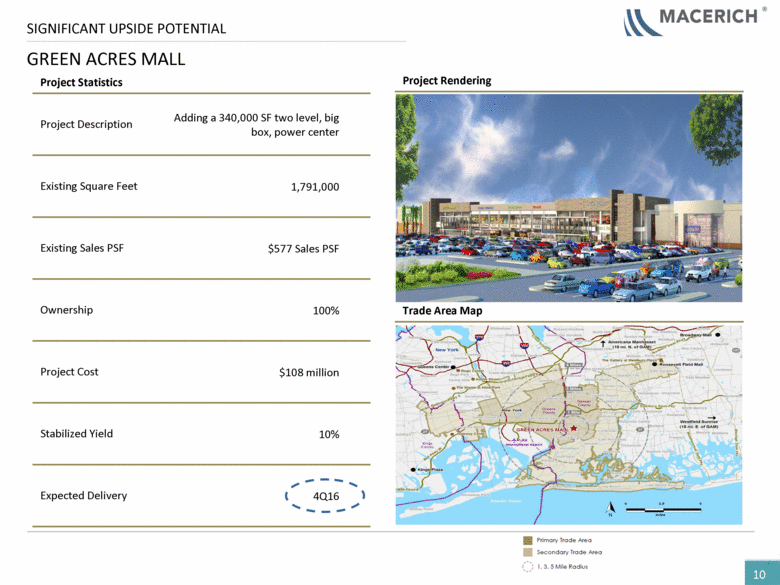
GREEN ACRES MALL 10 SIGNIFICANT UPSIDE POTENTIAL Project Statistics Project Description Adding a 340,000 SF two level, big box, power center Existing Square Feet 1,791,000 Existing Sales PSF $577 Sales PSF Ownership 100% Project Cost $108 million Stabilized Yield 10% Expected Delivery 4Q16 Project Rendering Trade Area Map |
|
|
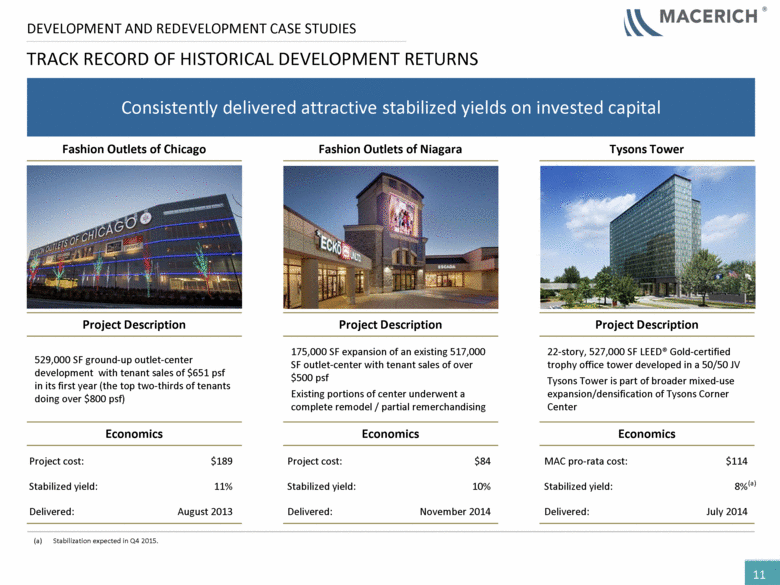
Fashion Outlets of Chicago Fashion Outlets of Niagara Tysons Tower Project Description Project Description Project Description 529,000 SF ground-up outlet-center development with tenant sales of $651 psf in its first year (the top two-thirds of tenants doing over $800 psf) 175,000 SF expansion of an existing 517,000 SF outlet-center with tenant sales of over $500 psf Existing portions of center underwent a complete remodel / partial remerchandising 22-story, 527,000 SF LEED® Gold-certified trophy office tower developed in a 50/50 JV Tysons Tower is part of broader mixed-use expansion/densification of Tysons Corner Center Economics Economics Economics TRACK RECORD OF HISTORICAL DEVELOPMENT RETURNS 11 (a) Stabilization expected in Q4 2015. (a) Project cost: $189 Stabilized yield: 11% Delivered: August 2013 Project cost: $84 Stabilized yield: 10% Delivered: November 2014 MAC pro-rata cost: $114 Stabilized yield: 8% Delivered: July 2014 DEVELOPMENT AND REDEVELOPMENT CASE STUDIES Consistently delivered attractive stabilized yields on invested capital |

