Attached files
| file | filename |
|---|---|
| EX-14.1 - EXHIBIT 14.1 - United States Commodity Index Funds Trust | v405938_ex14-1.htm |
| EX-31.1 - EXHIBIT 31.1 - United States Commodity Index Funds Trust | v405938_ex31-1.htm |
| EX-32.1 - EXHIBIT 32.1 - United States Commodity Index Funds Trust | v405938_ex32-1.htm |
| EX-31.2 - EXHIBIT 31.2 - United States Commodity Index Funds Trust | v405938_ex31-2.htm |
| EX-32.2 - EXHIBIT 32.2 - United States Commodity Index Funds Trust | v405938_ex32-2.htm |
| EX-23.1 - EXHIBIT 23.1 - United States Commodity Index Funds Trust | v405938_ex23-1.htm |
UNITED STATES
SECURITIES AND EXCHANGE COMMISSION
Washington, D.C. 20549
FORM 10-K/A
Amendment #1
| x | Annual report pursuant to Section 13 or 15(d) of the Securities Exchange Act of 1934 for the fiscal year ended December 31, 2014. |
or
| ¨ | Transition report pursuant to Section 13 or 15(d) of the Securities Exchange Act of 1934 for the transition period from to . |
Commission file number: 001-34833
United States Commodity Index Funds Trust
(Exact name of registrant as specified in its charter)
| Delaware | 27-1537655 | |
|
(State or other jurisdiction of incorporation or organization) |
(I.R.S. Employer Identification No.) |
1999 Harrison Street, Suite 1530
Oakland, California 94612
(Address of principal executive offices) (Zip code)
(510) 522-9600
(Registrant’s telephone number, including area code)
Securities registered pursuant to Section 12(b) of the Act:
| Shares of United States Agriculture Index Fund | NYSE Arca, Inc. | |
| Shares of United States Commodity Index Fund | NYSE Arca, Inc. | |
| Shares of United States Copper Index Fund | NYSE Arca, Inc. | |
| Shares of United States Metals Index Fund | NYSE Arca, Inc. | |
| (Title of each class) | (Name of exchange on which registered) |
Securities registered pursuant to Section 12(g) of the Act: None
Indicate by check mark if the registrant is a well-known seasoned issuer, as defined in Rule 405 of the Securities Act. ¨ Yes x No
Indicate by check mark if the registrant is not required to file reports pursuant to Section 13 or Section 15(d) of the Act. ¨ Yes x No
Indicate by check mark whether the registrant (1) has filed all reports required to be filed by Section 13 or 15(d) of the Securities Exchange Act of 1934 during the preceding 12 months (or for such shorter period that the registrant was required to file such reports), and (2) has been subject to such filing requirements for the past 90 days. x Yes ¨ No
Indicate by check mark whether the registrant has submitted electronically and posted on its corporate Website, if any, every Interactive Data File required to be submitted and posted pursuant to Rule 405 of Regulation S-T (§232.405 of this chapter) during the preceding 12 months (or for such shorter period that the registrant was required to submit and post such files). x Yes ¨ No
Indicate by check mark if disclosure of delinquent filers pursuant to Item 405 of Regulation S-K (§229.405 of this chapter) is not contained herein, and will not be contained, to the best of registrant’s knowledge, in definitive proxy or information statements incorporated by reference in Part III of this Form 10-K or any amendment to this Form 10-K. x
Indicate by check mark whether the registrant is a large accelerated filer, an accelerated filer, a non-accelerated filer, or a smaller reporting company. See the definitions of “large accelerated filer,” “accelerated filer” and “smaller reporting company” in Rule 12b-2 of the Exchange Act.
| Large accelerated filer ¨ | Accelerated filer x | |
| Non-accelerated filer ¨ | Smaller reporting company ¨ | |
| (Do not check if a smaller reporting company) | ||
Indicate by check mark whether the registrant is a shell company (as defined in Rule 12b-2 of the Exchange Act). ¨ Yes x No
The aggregate market value of the shares of each series of the registrant held by non-affiliates as of June 30, 2014 and the number of outstanding shares of each series of the registrant as of March 11, 2015 are included in the table below:
| Aggregate Market Value of Each Series’ Shares Held by Non-Affiliates as of June 30, 2014 | Number of Outstanding Shares as of March 11, 2015 | |||||||
| United States Agriculture Index Fund | $ | 2,561,872 | 100,000 | |||||
| United States Commodity Index Fund | 657,726,697 | 15,150,000 | ||||||
| United States Copper Index Fund | 4,285,143 | 100,000 | ||||||
| United States Metals Index Fund | 2,339,883 | 50,000 | ||||||
| Total | $ | 666,913,595 | 15,400,000 | |||||
DOCUMENTS INCORPORATED BY REFERENCE:
None.
UNITED STATES COMMODITY INDEX FUNDS TRUST
Table of Contents
Explanatory Note
The United States Commodity Index Funds Trust (the “Trust”) is filing this Amendment No. 1 to its annual report on Form 10-K (“Form 10-K/A”) for the fiscal year ended December 31, 2014 that was filed with the U.S. Securities and Exchange Commission on March 16, 2015 (the “Form 10-K”). This Form 10-K/A replaces Part II, Item 7 of the Form 10-K filed on March 16, 2015. The purpose of this Form 10-K/A is to correct certain percentages and a dollar value that were incorrectly reported in the Form 10-K filed on March 16, 2015. Specifically, the Form 10-K/A is filed to correct: (1) the percentages representing the actual total return of the United States Agriculture Index Fund (“USAG”) as measured by changes in its per share NAV for the year ended December 31, 2014; (2) the dollar value representing the estimated per share NAV of USAG as of December 31, 2014 if USAG had instead exactly tracked the changes in the daily total return of the SummerHaven Dynamic Agriculture Index Total ReturnSM (the “SDAI”); and (3) the percentages reflecting the estimated total return of USAG over the fiscal year ended December 31, 2014, had USAG instead exactly tracked the SDAI.
Except as set forth above, no other changes have been made to the Form 10-K, and the Form 10-K/A does not amend, update or change any other items or disclosure found in the Form 10-K. Further, the Form 10-K/A does not reflect events that occurred after the filing of the Form 10-K.
| Item 7. | Management’s Discussion and Analysis of Financial Condition and Results of Operations. |
The following discussion should be read in conjunction with the financial statements and the notes thereto of the Trust included elsewhere in this annual report on Form 10-K.
Forward-Looking Information
This annual report on Form 10-K, including this “Management’s Discussion and Analysis of Financial Condition and Results of Operations,” contains forward-looking statements regarding the plans and objectives of management for future operations. This information may involve known and unknown risks, uncertainties and other factors that may cause the Trust’s actual results, performance or achievements to be materially different from future results, performance or achievements expressed or implied by any forward-looking statements. Forward-looking statements, which involve assumptions and describe the Trust’s future plans, strategies and expectations, are generally identifiable by use of the words “may,” “will,” “should,” “expect,” “anticipate,” “estimate,” “believe,” “intend” or “project,” the negative of these words, other variations on these words or comparable terminology. These forward-looking statements are based on assumptions that may be incorrect, and the Trust cannot assure investors that the projections included in these forward-looking statements will come to pass. The Trust’s actual results could differ materially from those expressed or implied by the forward-looking statements as a result of various factors.
The Trust has based the forward-looking statements included in this annual report on Form 10-K on information available to it on the date of this annual report on Form 10-K, and the Trust assumes no obligation to update any such forward-looking statements. Although the Trust undertakes no obligation to revise or update any forward-looking statements, whether as a result of new information, future events or otherwise, investors are advised to consult any additional disclosures that the Trust may make directly to them or through reports that the Trust in the future files with the SEC, including annual reports on Form 10-K, quarterly reports on Form 10-Q and current reports on Form 8-K.
Introduction
Each Trust Series is a commodity pool that issues shares representing fractional undivided beneficial interests in such Trust Series that may be purchased and sold on the NYSE Arca. The Trust Series are series of the Trust, a Delaware statutory trust formed on December 21, 2009.
United States Commodity Index Fund
USCI invests in Futures Contracts for commodities that are traded on the Futures Exchanges and, to a lesser extent, in order to comply with regulatory requirements or in view of market conditions, Other Commodity-Related Investments. Market conditions that USCF currently anticipates could cause USCI to invest in Other Commodity Related Investments would be those allowing USCI to obtain greater liquidity or to execute transactions with more favorable pricing.
| 1 |
The investment objective of USCI is for the daily changes in percentage terms of its shares’ per share NAV to reflect the daily changes in percentage terms of the SDCI, less USCI’s expenses. USCF does not intend to operate USCI in a fashion such that its per share NAV will equal, in dollar terms, the spot prices of the commodities underlying the Benchmark Component Futures Contracts that comprise the SDCI or the prices of any particular group of Futures Contracts. The SDCI is comprised of 14 Futures Contracts that are selected on a monthly basis from a list of 27 possible Futures Contracts. USCI invests first in the current Benchmark Component Futures Contracts and other Futures Contracts intended to replicate the return on the current Benchmark Component Futures Contracts and, thereafter may hold Futures Contracts in a particular commodity other than one specified as the Benchmark Component Futures Contract, or may hold Other Commodity-Related Investments that may fail to closely track the SDCI’s total return movements. If USCI increases in size, and due to its obligations to comply with regulatory limits or due to other market pricing or liquidity factors, USCI may invest in Futures Contract months other than the designated month specified as the Benchmark Component Futures Contract, or in Other Commodity-Related Investments, which may have the effect of increasing transaction related expenses and may result in increased tracking error.
USCI seeks to achieve its investment objective by investing in Futures Contracts and Other Commodity-Related Investments such that daily changes in its per share NAV closely track the daily changes in the price of the SDCI. USCI’s positions in Commodity Interests are rebalanced on a monthly basis in order to track the changing nature of the SDCI. If Futures Contracts relating to a particular commodity remain in the SDCI from one month to the next, such Futures Contracts are rebalanced to the 7.14% target weight. Specifically, on the Selection Date, it will be determined if a current Benchmark Component Futures Contract will be replaced by a new Futures Contract in either the same or different underlying commodity as a Benchmark Component Futures Contract for the following month, in which case USCI’s investments would have to be changed accordingly. In order that USCI’s trading does not unduly cause extraordinary market movements, and to make it more difficult for third parties to profit by trading based on market movements that could be expected from changes in the Benchmark Component Futures Contracts, USCI’s investments typically are not rebalanced entirely on a single day, but rather typically rebalanced over a period of four days. After fulfilling the margin and collateral requirements with respect to its Commodity Interests, USCF invests the remainder of USCI’s proceeds from the sale of shares in Treasuries or cash equivalents, and/or merely hold such assets in cash (generally in interest-bearing accounts). As of December 31, 2014, USCI held 657 Futures Contracts on the NYMEX, 2,553 Futures Contracts on the ICE Futures, 5,487 Futures Contracts on the CBOT, 2,861 Futures Contracts on the CME, 5,001 Futures Contracts on the LME and 430 Futures Contracts on the COMEX.
United States Copper Index Fund
CPER invests in Futures Contracts for commodities that are traded on the COMEX and, to a lesser extent, in order to comply with regulatory requirements or in view of market conditions, Other Copper-Related Investments. Market conditions that USCF currently anticipates could cause CPER to invest in Other Copper-Related Investments would be those allowing CPER to obtain greater liquidity or to execute transactions with more favorable pricing.
The investment objective of CPER is for the daily changes in percentage terms of its shares’ per share NAV to reflect the daily changes in percentage terms of the SCI, less CPER’s expenses. USCF does not intend to operate CPER in a fashion such that its per share NAV will equal, in dollar terms, the spot prices of the commodities underlying the Benchmark Component Copper Futures Contracts that comprise the SCI or the prices of any particular group of Futures Contracts. The SCI is designed to reflect the performance of the investment returns form a portfolio of copper futures contracts. The SCI is owned and maintained by SHIM and calculated and published by the NYSE Arca. The SCI is comprised of either two or three Eligible Copper Futures Contracts that are selected on a monthly basis based on quantitative formulas relating to the prices of the Eligible Copper Futures Contracts developed by SHIM. The Eligible Copper Futures Contracts that at any given time make up the SCI are referred to herein as “Benchmark Component Copper Futures Contracts.”
CPER seeks to achieve its investment objective by investing to the fullest extent possible in the Benchmark Component Copper Futures Contracts. Then, if constrained by regulatory requirements or in view of market conditions, CPER will invest next in other Eligible Copper Futures Contracts, and finally to a lesser extent, in other exchange traded futures contracts that are economically identical or substantially similar to the Benchmark Component Copper Futures Contracts if one or more other Eligible Copper Futures Contracts is not available. When CPER has invested to the fullest extent possible in exchange-traded futures contracts, CPER may then invest in Other Copper-Related Investments. As of December 31, 2014, CPER held 40 Futures Contracts on the COMEX.
| 2 |
United States Agriculture Index Fund
USAG invests in Futures Contracts for commodities that are traded on ICE Futures US, ICE Futures Canada, CBOT, KCBT and the CME, and to a lesser extent, in order to comply with regulatory requirements or in view of market conditions, Other Agriculture-Related Investments. Market conditions that USCF currently anticipates could cause USAG to invest in Other Agriculture-Related Investments would be those allowing USAG to obtain greater liquidity or to execute transactions with more favorable pricing.
The investment objective of USAG is for the daily changes in percentage terms of its shares’ per share NAV to reflect the daily changes in percentage terms of the SDAI, less USAG’s expenses. USCF does not intend to operate USAG in a fashion such that its per share NAV will equal, in dollar terms, the spot prices of the commodities underlying the Benchmark Component Futures Contracts that comprise the SDAI or the prices of any particular group of Futures Contracts. The SDAI is designed to reflect the performance of a diversified group of agricultural commodities. The SDAI is comprised of 14 Eligible Agriculture Futures Contracts that are selected on a monthly basis based on quantitative formulas developed by SHIM. The Eligible Agriculture Futures Contracts that at any given time make up the SDAI are referred to herein as “Benchmark Component Agriculture Futures Contracts.”
USAG seeks to achieve its investment objective by investing to the fullest extent possible in Benchmark Component Agriculture Futures Contracts. Then, if constrained by regulatory requirements or in view of market conditions, USAG will invest next in other Eligible Agriculture Futures Contracts based on the same agricultural commodity as the futures contracts subject to such regulatory constraints or market conditions, and finally, to a lesser extent, in other exchange traded futures contracts that are economically identical or substantially similar to the Benchmark Component Agriculture Futures Contracts, if one or more Eligible Agriculture Futures Contracts is not available. When USAG has invested to the fullest extent possible in exchange-traded futures contracts, USAG may then invest in Other Agriculture-Related Interests. As of December 31, 2014, USAG held 41 Futures Contracts on the ICE Futures, 8 Futures Contracts on the CME, 2 Futures Contract on the KCBT and 31 Futures Contracts on the CBOT.
United States Metals Index Fund
On January 30, 2015, USCF as the sponsor of the Trust and its series USMI announced that its officers and members had authorized a plan to (i) liquidate USMI, (ii) terminate the continuous offering of USMI, and (iii) deregister USMI under the Exchange Act, and therefore, terminate the Trust’s obligation to include USMI on its periodic and current reports with the SEC. USCF has submitted written notice to the NYSE Arca of its decision to liquidate USMI, terminate the offering and to terminate USMI’s obligations under the Exchange Act.
Shares of USMI will cease trading on the NYSE Arca, Inc. and will be closed to purchase by investors as of the close of regular trading on the NYSE Arca on March 18, 2015 (the “Closing Date”). On March 18, 2015, USMI will cease accepting orders for Creation Baskets and Redemption Baskets. The Trust will file a post-effective amendment to the registration statement on behalf of USMI to terminate the offering of registered and unsold shares of USMI. The post-effective amendment to the registration statement will be effective on March 18, 2015.
Shareholders may sell shares of USMI prior to the Closing Date and customary brokerage charges, or Redemption Basket charges, as the case may be, may apply to these transactions. From March 18, 2015 through about March 25, 2015 (the “Liquidation Date”) there is no assurance that there will be a market for shares of USMI. Between the Closing Date and the Liquidation Date, USMI will be in the process of closing down and liquidating its portfolio. This process will result in USMI increasing its cash holdings and, as a consequence, not tracking its index, the SummerHaven Metals Index Total ReturnSM, which may not be consistent with USMI’s investment objective and strategy.
On or about the Liquidation Date, USMI will liquidate its assets and distribute cash pro rata to all remaining shareholders who have not previously redeemed or exchanged their shares. These distributions are taxable events. Once the distributions are complete, USMI will terminate.
| 3 |
USCF has determined that USMI could not continue its business and operations in an economically efficient manner due to USMI’s inability to attract sufficient assets, thereby hindering its ability to operate efficiently.
USCF intends to file a post-effective amendment on behalf of the Trust and USMI to terminate the offering of the registered and unsold shares of USMI. The NYSE Arca will file a Form 25 with the SEC to affect the withdrawal of the listing of USMI from the NYSE Arca. Delisting from the NYSE Arca will become effective 10 days after the filing date of the Form 25. Provided that USMI continues to meet the applicable legal requirements, USCF intends to file a Form 15 on behalf of the Trust and USMI with the SEC in early April 2015 to suspend the Trust’s duty to include USMI on its reports under Sections 13(a) and 15(d) of the Exchange Act. USMI expects the termination of registration will become effective 90 days after the date of the filing of the Form 15 with the SEC.
USMI invests in Futures Contracts for commodities that are traded on the NYMEX, the LME and the COMEX, and to a lesser extent, in order to comply with regulatory requirements or in view of market conditions, Other Metals-Related Investments. Market conditions that USCF currently anticipates could cause USMI to invest in Other Agriculture-Related Investments would be those allowing USMI to obtain greater liquidity or to execute transactions with more favorable pricing.
The investment objective of USMI is for the daily changes in percentage terms of its shares’ per share NAV to reflect the daily changes in percentage terms of the SDMI, less USMI’s expenses. USCF does not intend to operate USMI in a fashion such that its per share NAV will equal, in dollar terms, the spot prices of the commodities underlying the Benchmark Component Futures Contracts that comprise the SDMI or the prices of any particular group of Futures Contracts. The SDMI is designed to reflect the performance of a diversified group of metals. The SDMI is comprised of 10 Eligible Metals Futures Contracts that are selected on a monthly basis based on quantitative formulas developed by SHIM. The Eligible Metals Futures Contracts that at any given time make up the SDMI are referred to herein as “Benchmark Component Metals Futures Contracts.”
USMI seeks to achieve its investment objective by investing to the fullest extent possible in the Benchmark Component Metals Futures Contracts. Then, if constrained by regulatory requirements or in view of market conditions, USMI will invest next in other Eligible Metals Futures Contracts, and finally to a lesser extent, in other exchange traded futures contracts that are economically identical or substantially similar to the Benchmark Component Metals Futures Contracts if one or more other Eligible Metals Futures Contracts is not available. When USMI has invested to the fullest extent possible in exchange-traded futures contracts, USMI may then invest in other Eligible Metals Futures Contracts. As of December 31, 2014, USMI held 2 Futures Contracts on the NYMEX, 73 Futures Contracts on the LME and 12 Futures Contracts on the COMEX.
Regulation of Commodity Interests
The regulation of commodity interest trading in the United States and other countries is an evolving area of the law. The various statements made in this summary are subject to modification by legislative action and changes in the rules and regulations of the CFTC, the NFA, the SEC, the futures exchanges, clearing organizations and other regulatory bodies. Pending final resolution of all applicable regulatory requirements, some examples of how new rules and regulations could impact the Trust Series are discussed in “Item 1. Business” and “Item 1A. Risk Factors” in this annual report on Form 10-K.
Commodity Markets
Commodity Futures Price Movements
Year Ended December 31, 2014
As measured by the four major diversified commodity indexes listed below, commodity futures prices exhibited a downward trend during the year ended December 31, 2014. The table below compares the total returns of the SDCI to the three major diversified commodity indexes over this time period.
| SummerHaven Dynamic Commodity Index Total ReturnSM(“SDCI”)(1) | (12.10 | )% | ||
| S&P GSCI Commodity Index (GSCI®) Total Return(2) | (33.06 | )% | ||
| Bloomberg Commodity Index Total Return(2) | (17.01 | )% | ||
| Deutsche Bank Liquid Commodity Index-Optimum Yield Total ReturnTM(2) | (25.94 | )% |
(1) The inception date for the SummerHaven Dynamic Commodity Index Total ReturnSM is December 2009.
(2) Source: Bloomberg
| 4 |
The value of the SDCI as of January 1, 2014 was 1,678.73. As of December 31, 2014, the value of the SDCI was 1475.681, down approximately 12.10% over the year.
The return of approximately (12.10)% on the SDCI listed above is a hypothetical return only and could not actually be achieved by an investor holding Futures Contracts due to the impact of trading costs and other expenses. USCI’s per share NAV began the year at $56.06 and ended the year at $48.24 on December 31, 2014, a decrease of approximately 13.95% over the year. USCI’s per share NAV reached its high for the year on June 26, 2014 at $61.13 and reached its low for the year on December 31, 2014 at $48.24. See “Tracking Each Trust Series’ Benchmark” below for information about how expenses and income affect USCI’s NAV.
Copper Markets
Copper Futures Price Movements
Year Ended December 31, 2014
As measured by the two major copper indexes, copper futures prices exhibited a downward trend during the year ended December 31, 2014. The table below compares the total returns of the SCI to the Bloomberg Copper Sub index Total Return over this time period.
| SummerHaven Copper Index Total ReturnTM(“SCI”)(1) | (15.88 | )% | ||
| Bloomberg Copper Sub Index Total Return(2) | (16.55 | )% |
(1) The inception date for the SummerHaven Copper Index Total ReturnTM is November 2010.
(2) Source: Bloomberg
The value of the SCI as of January 1, 2014 was 1,114.30. As of December 31, 2014, the value of the SCI was 937.330, down approximately 15.88% over the year.
The return of approximately (15.88)% on the SCI listed above is a hypothetical return only and could not actually be achieved by an investor holding Futures Contracts due to the impact of trading costs and other expenses. CPER’s per share NAV began the year at $22.92 and ended the year at $19.10 on December 31, 2014, a decrease of approximately 16.67% over the year. CPER’s per share NAV reached its high for the year on January 2, 2014 at $22.82 and reached its low for the year on December 26, 2014 at $19.03. See “Tracking Each Trust Series’ Benchmark” for information about how expenses and income affect CPER’s NAV.
Agriculture Markets
Agriculture Futures Price Movements
Year Ended December 31, 2014
As measured by the four major agriculture indexes listed below, agriculture futures prices exhibited moderate daily swings along with an upward trend during the year ended December 31, 2014. The table below compares the total returns of the SDAI to the three major agriculture indexes over this time period.
| SummerHaven Dynamic Agriculture Index Total ReturnSM(“SDAI”)(1) | 1.78 | % | ||
| S&P GSCI® Agriculture Index Total Return(2) | (10.73 | )% | ||
| Bloomberg Agriculture Sub index Total ReturnSM(2) | (9.22 | )% | ||
| Deutsche Bank Liquid Commodity Index-Optimum Yield Agriculture ReturnTM(2) | (14.00 | )% |
(1) The inception date for the SummerHaven Dynamic Agriculture Index Total ReturnSM is September 2010.
(2) Source: Bloomberg
The value of the SDAI as of January 1, 2014 was 324.11. As of December 31, 2014, the value of the SDAI was 329.880, up approximately 1.78% over the year.
| 5 |
The return of approximately 1.78% on the SDAI listed above is a hypothetical return only and could not actually be achieved by an investor holding Futures Contracts due to the impact of trading costs and other expenses. USAG’s per share NAV began the year at $22.79 and ended the year at $22.97 on December 31, 2014, an increase of approximately 0.79% over the period. USAG’s per share NAV reached its high for the period on April 29, 2014 at $27.02 and reached its low for the period on September 25, 2014 at $22.54. See “Tracking Each Trust Series’ Benchmark” below for information about how expenses and income affect USAG’s per share NAV.
Metals Markets
Metals Futures Price Movements
Year Ended December 31, 2014
As measured by the four major metals indexes listed below, metals futures prices exhibited moderate daily swings along with a downward trend during the year ended December 31, 2014. The table below compares the total returns of the SDMI to the three major metals indexes over this time period.
| SummerHaven Metals Index Total ReturnSM(“SDMI”)(1) | (8.47 | )% | ||
| Rogers International Commodity Index®-Metals Total Return(2) | (8.74 | )% | ||
| Bloomberg Industrial Metals Sub index Total Return(2) | (6.87 | )% | ||
| Deutsche Bank Liquid Commodity Index-Optimum Yield Industrials Metals Total ReturnTM(2) | (3.70 | )% |
(1) The inception date for the SummerHaven Metals Index Total ReturnSM is September 2010.
(2) Source: Bloomberg
The value of the SDMI as of January 1, 2014 was 727.17. As of December 31, 2014, the value of the SDMI was 665.580, down approximately 8.47% over the year.
The return of approximately (8.47)% on the SDMI listed above is a hypothetical return only and could not actually be achieved by an investor holding Futures Contracts due to the impact of trading costs and other expenses. USMI’s per share NAV began the year at $21.97 and ended at $19.82 on December 31, 2014, a decrease of approximately 9.79% over the period. USMI’s per share NAV reached its high for the period on July 11, 2014 at $23.87 and reached its low for the period on December 29, 2014 at $19.80. See “Tracking Each Trust Series’ Benchmark” below for information about how expenses and income affect USMI’s per share NAV.
Valuation of Futures Contracts and the Computation of the Per Share NAV
Each Trust Series’ NAV is calculated once each NYSE Arca trading day. The per share NAV for a particular trading day is released after 4:00 p.m. New York time. Trading during the core trading session on the NYSE Arca typically closes at 4:00 p.m. New York time. The Trust Series’ Administrator uses the closing prices on the relevant Futures Exchanges of the Applicable Benchmark Component Futures Contracts (determined at the earlier of the close of such exchange or 2:30 p.m. New York time) for the contracts held on the Futures Exchanges, but calculates or determines the value of all other investments of such Trust Series using market quotations, if available, or other information customarily used to determine the fair value of such investments.
Results of Operations
On July 30, 2010, USCI received a notice of effectiveness from the SEC for its registration of 50,000,000 shares on Form S-1 with the SEC. On August 10, 2010, USCI listed its shares on the NYSE Arca under the ticker symbol “USCI.” USCI established its initial offering per share NAV by setting the price at $50.00 and issued 100,000 shares to the initial Authorized Participant, Merrill Lynch Professional Clearing Corp., in exchange for $5,000,000 in cash on August 10, 2010. USCI commenced investment operations on August 10, 2010 by purchasing Futures Contracts traded on the Futures Exchanges. In order to satisfy NYSE Arca listing standards that at least 100,000 shares be outstanding at the beginning of the trading day on the NYSE Arca, USCF purchased the initial Creation Basket from the initial Authorized Participant at the initial offering price. The $1,000 fee that would otherwise be charged to the Authorized Participant in connection with an order to create or redeem was waived in connection with the initial Creation Basket. USCF agreed not to resell the shares comprising such basket except that it may require the initial Authorized Participant to repurchase all of these shares at a per share price equal to USCI’s per share NAV within five days following written notice from USCF, subject to the conditions that: (i) on the date of repurchase, the initial Authorized Participant must immediately redeem these shares in accordance with the terms of the Authorized Participant Agreement and (ii) immediately following such redemption at least 100,000 shares of USCI remain outstanding. USCF held such initial Creation Basket until September 3, 2010, at which time the initial Authorized Participant repurchased the shares comprising such basket in accordance with the specified conditions noted above. On September 14, 2011, USCF redeemed the 20 Sponsor Shares of USCI, and on September 19, 2011, USCF purchased five shares of USCI in the open market.
| 6 |
Since its initial offering of 50,000,000 shares, USCI has not registered any subsequent offerings of its shares. As of December 31, 2014, USCI had issued 21,150,000 shares, 14,700,000 of which were outstanding. As of December 31, 2014, there were 28,850,000 shares registered but not yet issued. More shares may have been issued by USCI than are outstanding due to the redemption of shares.
In connection with the Second Amended and Restated Trust Agreement dated November 10, 2010, USMI, USAG and CPER were designated as three additional series of the Trust. Following the designation of the additional series, an initial capital contribution of $3,000 was transferred from USCF to the Trust. On November 10, 2010, the Trust transferred $1,000 to each of USMI, USAG and CPER, which was deemed a capital contribution to each series. On November 14, 2011, USCF received 40 Sponsor Shares of CPER in exchange for the previously received capital contribution, representing a beneficial interest in CPER. On December 7, 2011, USCF redeemed the 40 Sponsor Shares of CPER and purchased 40 shares of CPER in the open market. On April 13, 2012, USCF received 40 Sponsor Shares of USAG in exchange for the previously received capital contribution, representing a beneficial interest in USAG. On June 28, 2012, USCF redeemed the 40 Sponsor shares of USAG and on October 3, 2012, purchased 5 shares of USAG on the open market. On June 19, 2012, USCF received 40 Sponsor Shares of USMI in exchange for the previously received capital contribution, representing a beneficial interest in USMI. On August 27, 2012, USCF redeemed the 40 Sponsor shares of USMI and on September 4, 2013 purchased 5 shares on the open market.
CPER, USAG and USMI received notice of effectiveness from the SEC for its registration of 30,000,000 CPER shares, 20,000,000 USAG shares and 20,000,000 USMI shares on September 6, 2011. The order to permit listing CPER, USMI and USAG on the NYSE Arca was received on October 20, 2011. On November 15, 2011, CPER listed its shares on the NYSE Arca under the ticker symbol “CPER.” CPER established its initial offering per share NAV by setting the price at $25.00 and issued 100,000 shares to the initial Authorized Participant, Merrill Lynch Professional Clearing Corp., in exchange for $2,500,000 in cash on November 15, 2011. The $1,000 fee that would otherwise be charged to the Authorized Participant in connection with an order to create or redeem was waived in connection with the initial Creation Basket.
Since its initial offering of 30,000,000 shares, CPER has not registered any subsequent offerings of its shares. As of December 31, 2014, CPER had issued 300,000 shares, 150,000 of which were outstanding. As of December, 31, 2014, there were 29,700,000 shares registered but not yet issued. More shares may have been issued by CPER than are outstanding due to the redemption of shares.
On April 13, 2012, USAG listed its shares on the NYSE Arca under the ticker symbol “USAG.” USAG established its initial per share NAV by setting the price at $25.00. On April 14, 2012, USCF purchased 2 initial Creation Baskets of USAG. In accordance with applicable requirements of Regulation M under the Securities Exchange Act of 1934, no Creation Baskets were offered to Authorized Participants nor were the shares listed on the NYSE Arca until five business days had elapsed from the date of USCF’s purchase of the initial Creation Basket on April 4, 2012. The fee that would have otherwise been charged in connection with an order to create or redeem was waived in connection with the initial Creation Basket.
Since its initial offering of 20,000,000 shares, USAG has not registered any subsequent offerings of its shares. As of December 31, 2014, USAG had issued 200,000 shares, 100,000 of which were outstanding. As of December, 31, 2014, there were 19,800,000 shares registered but not yet issued. More shares may have been issued by USAG than are outstanding due to the redemption of shares.
On June 19, 2012, USMI listed its shares on the NYSE Arca under the ticker symbol “USMI.” USMI established its initial per share NAV by setting the price at $25.00. On June 11, 2012, USCF purchased two initial Creation Baskets of USMI. In accordance with applicable requirements of Regulation M under the Securities Exchange Act of 1934, no Creation Baskets were offered to Authorized Participants nor were the shares listed on the NYSE Arca until five business days had elapsed from the date of USCF’s purchase of the initial Creation Basket on June 11, 2012. The fee that would have otherwise been charged in connection with an order to create or redeem was waived in connection with the initial Creation Basket. On August 29, 2012, USCF redeemed one of two initial Creation Baskets of USMI, leaving its holdings to 50,000 shares.
| 7 |
Since its initial offering of 20,000,000 shares, USMI has not registered any subsequent offerings of its shares. As of December 31, 2014, USMI had issued 200,000 shares, 100,000 of which were outstanding. As of December, 31, 2014, there were 19,800,000 shares registered but not yet issued. More shares may have been issued by USMI than are outstanding due to the redemption of shares. On January 30, 2015, USCF as the sponsor of the Trust and its series USMI announced that its officers and members had authorized a plan to (i) liquidate USMI, (ii) terminate the continuous offering of USMI, and (iii) deregister USMI under the Exchange Act, and therefore, terminate the Trust’s obligation to include USMI on its periodic and current reports with the SEC. USCF has submitted written notice to the NYSE Arca, Inc. (“NYSE Arca”) of its decision to liquidate USMI, terminate the offering and to terminate USMI’s obligations under the Exchange Act.
Shares of USMI will cease trading on the NYSE Arca and will be closed to purchase by investors as of the close of regular trading on the NYSE Arca on March 18, 2015 (the “Closing Date”). On March 18, 2015, USMI will cease accepting orders for Creation Baskets and Redemption Baskets. The Trust will file a post-effective amendment to the registration statement on behalf of USMI to terminate the offering of registered and unsold shares of USMI. The post-effective amendment to the registration statement will be effective on March 18, 2015.
Shareholders may sell shares of USMI prior to the Closing Date and customary brokerage charges, or Redemption Basket charges, as the case may be, may apply to these transactions. From March 18, 2015 through about March 25, 2015 (the “Liquidation Date”) there is no assurance that there will be a market for shares of USMI. Between the Closing Date and the Liquidation Date, USMI will be in the process of closing down and liquidating its portfolio. This process will result in USMI increasing its cash holdings and, as a consequence, not tracking its index, the SummerHaven Metals Index Total ReturnSM, which may not be consistent with USMI’s investment objective and strategy.
On or about the Liquidation Date, USMI will liquidate its assets and distribute cash pro rata to all remaining shareholders who have not previously redeemed or exchanged their shares. These distributions are taxable events. Once the distributions are complete, USMI will terminate.
Unlike funds that are registered under the 1940 Act, shares that have been redeemed by the Trust Series cannot be resold. As a result, each Trust Series contemplates that additional offerings of its shares will be registered with the SEC in the future in anticipation of additional issuances and redemptions.
As of December 31, 2014, USCI had the following Authorized Participants: Citadel Securities LLC, Credit Suisse Securities (USA) LLC, Goldman Sachs & Company, Jefferies & Company Inc., JP Morgan Securities Inc., Merrill Lynch Professional Clearing Corp., Morgan Stanley & Co. LLC, NewEdge USA LLC, RBC Capital Markets LLC and Virtu Financial BD LLC.
As of December 31, 2014, CPER, USAG and USMI had the following Authorized Participants: Credit Suisse Securities (USA) LLC, Goldman Sachs & Company, Jefferies & Company Inc., JP Morgan Securities Inc., Merrill Lynch Professional Clearing Corp., NewEdge USA LLC, RBC Capital Markets LLC and Virtu Financial BD LLC.
| 8 |
For the Year Ended December 31, 2014 Compared to the Year Ended December 31, 2013; and for the Year Ended December 31, 2013, Compared to the Year Ended December 31, 2012
USCI
| For the Year
ended December 31, 2014 | For the Year ended December 31, 2013 | For the Year ended December 31, 2012 | ||||||||||
| Per share NAV, end of period | $ | 48.24 | $ | 56.06 | $ | 58.45 | ||||||
| Average daily total net assets | $ | 702,058,268 | $ | 509,704,914 | $ | 428,436,180 | ||||||
| Cash deposits and investments in Treasuries and money market funds | $ | 792,207,276 | $ | 494,440,076 | $ | 491,119,704 | ||||||
| Dividend and interest income earned on Treasuries, cash and/or cash equivalents | $ | 323,118 | $ | 265,555 | $ | 278,476 | ||||||
| Annualized yield based on average daily total net assets | 0.05 | % | 0.05 | % | 0.07 | % | ||||||
| Percentage of cash assets held as overnight deposits and investments in Treasuries at custodian | 89.87 | % | 95.89 | % | 87.72 | % | ||||||
| Percentage of cash assets held as investments in Treasuries and margin deposits for Futures Contracts | 10.13 | % | 4.11 | % | 12.28 | % | ||||||
| Total unrealized gain (loss) on Futures Contracts | $ | (38,267,159 | ) | $ | 10,789,747 | $ | (5,220,900 | ) | ||||
| Management fee | $ | 5,887,414 | $ | 4,842,197 | $ | 4,070,144 | ||||||
| Total fees and other expenses excluding management fees | $ | 1,394,071 | $ | 978,267 | $ | 856,041 | ||||||
| Fees and expenses related to the registration or offering of additional shares | $ | 850 | $ | 850 | $ | 800 | ||||||
| Total commissions accrued to brokers | $ | 653,625 | $ | 390,945 | $ | 310,109 | ||||||
| Total commissions as annualized percentage of average total net assets | 0.09 | % | 0.08 | % | 0.07 | % | ||||||
| Commissions accrued as a result of rebalancing | $ | 614,322 | $ | 376,294 | $ | 296,759 | ||||||
| Percentage of commissions accrued as a result of rebalancing | 93.99 | % | 96.25 | % | 95.70 | % | ||||||
| Commissions accrued as a result of creation and redemption activity | $ | 39,303 | $ | 14,651 | $ | 13,350 | ||||||
| Percentage of commissions accrued as a result of creation and redemption activity | 6.01 | % | 3.75 | % | 4.30 | % | ||||||
Portfolio Expenses. The Trust Series’ expenses consist of investment management fees, brokerage fees and commissions, certain offering costs, licensing fees, the fees and expenses of the independent directors of USCF and expenses relating to tax accounting and reporting requirements. The management fee that each Trust Series pays to USCF is calculated as a percentage of the total net assets of each Trust Series. The fee is accrued daily and paid monthly.
The decrease in the per share NAV for December 31, 2014, compared to the year ended December 31, 2013; and for the year ended December 31, 2013, compared to the year ended December 31, 2012, were primarily due to the decrease in values of the Futures Contracts held by USCI.
The increase in cash deposits and investments in Treasuries and money market funds for December 31, 2014, compared to year ended December 31, 2013; and for the year ended December 31, 2013, compared to the year ended December 31, 2012, was the result of USCI’s larger size as measured by total net assets.
The increase in dividend and interest income earned on Treasuries, cash and/or cash equivalents for December 31, 2014, compared to year ended December 31, 2013; was primarily due to USCI’s larger size as measured by total net assets. Average daily total net assets increased for December 31, 2013, compared to December 31, 2012, was similar.
The increase in total fees and expenses excluding management fees for December 31, 2014, compared to the year ended December 31, 2013; and for the year ended December 31, 2013, compared to the year ended December 31, 2012, was due to an increase in USCI’s commissions resulting from USCI’s larger size as represented by total net assets as well as the transition trades due to change of FCM.
The increase in USCI’s total commissions accrued to brokers for December 31, 2014, compared to the year ended December 31, 2013; and for the year ended December 31, 2013, compared to December 31, 2012, was primarily due to an increase in USCI’s total net assets (due to net creations) as well as an increase in the number of contracts traded due to the transition from one FCM to another.
| 9 |
CPER
| For the Year ended December 31, 2014 | For the Year ended December 31, 2013 | For the Year ended December 31, 2012 | ||||||||||
| Per share NAV, end of period | $ | 19.10 | $ | 22.92 | $ | 25.43 | ||||||
| Average daily total net assets | $ | 3,151,177 | $ | 2,296,522 | $ | 2,552,489 | ||||||
| Cash deposits and investments in Treasuries and money market funds | $ | 3,066,521 | $ | 2,166,695 | $ | 2,541,590 | ||||||
| Dividend and interest income earned on Treasuries, cash and/or cash equivalents | $ | 1,455 | $ | 1,260 | $ | 1,607 | ||||||
| Annualized yield based on average daily total net assets | 0.05 | % | 0.05 | % | 0.06 | % | ||||||
| Percentage of cash assets held as overnight deposits and investments in Treasuries at custodian | 89.01 | % | 94.19 | % | 82.98 | % | ||||||
| Percentage of cash assets held as investments in Treasuries and margin deposits for Futures Contracts | 10.99 | % | 5.81 | % | 17.02 | % | ||||||
| Total unrealized gain (loss) on Futures Contracts | $ | (197,525 | ) | $ | 130,163 | $ | 6,575 | |||||
| Management fee | $ | 20,483 | $ | 14,927 | $ | 19,823 | ||||||
| Total fees and other expenses excluding management fees | $ | 68,468 | $ | 86,632 | $ | 101,564 | ||||||
| Total amount of the expense waiver | $ | 62,989 | $ | 81,789 | $ | 96,364 | ||||||
| Expenses before allowance for the expense waiver | $ | 88,951 | $ | 101,559 | $ | 121,387 | ||||||
| Expenses after allowance for the expense waiver | $ | 25,962 | $ | 19,770 | $ | 25,023 | ||||||
| Fees and expenses related to the registration or offering of additional shares | $ | — | $ | — | $ | — | ||||||
| Total commissions accrued to brokers | $ | 1,896 | $ | 916 | $ | 956 | ||||||
| Total commissions as annualized percentage of average total net assets | 0.06 | % | 0.04 | % | 0.04 | % | ||||||
| Commissions accrued as a result of rebalancing | $ | 1,382 | $ | 916 | $ | 799 | ||||||
| Percentage of commissions accrued as a result of rebalancing | 72.89 | % | 100 | % | 83.58 | % | ||||||
| Commissions accrued as a result of creation and redemption activity | $ | 514 | $ | — | $ | 157 | ||||||
| Percentage of commissions accrued as a result of creation and redemption activity | 27.11 | % | — | % | 16.42 | % | ||||||
Portfolio Expenses. The Trust Series’ expenses consist of investment management fees, brokerage fees and commissions, certain offering costs, licensing fees, the fees and expenses of the independent directors of USCF and expenses relating to tax accounting and reporting requirements. The management fee that each Trust Series pays to USCF is calculated as a percentage of the total net assets of each Trust Series. The fee is accrued daily and paid monthly.
The decrease in the per share NAV for December 31, 2014, compared to the year ended December 31, 2013; and for the year ended December 31, 2013, compared to the year ended December 31, 2012, were primarily due to the decrease in values of the Futures Contracts held by CPER.
The increase in cash deposits and investments in Treasuries and money market funds for December 31, 2014, compared to year ended December 31, 2013, was the result of CPER’s larger size; whereas the decrease in cash deposits and investments in Treasuries and money market funds for the year ended December 31, 2013, compared to the year ended December 31, 2012, was the result of CPER’s smaller size as measured by total net assets.
The dividend and interest income earned on Treasuries, cash and/or cash equivalents for December 31, 2014, compared to year ended December 31, 2013; was similar. The dividend and interest income earned on Treasuries, cash and/or cash equivalents for December 31, 2013, compared to December 31, 2012, was similar.
The decrease in total gross fees and expenses excluding management fees for December 31, 2014, compared to the year ended December 31, 2013; and for the year ended December 31, 2013, compared to the year ended December 31, 2012, was primarily due to an decrease in certain CPER’s operating expenses.
The increase in CPER’s total commissions accrued to brokers for December 31, 2014, compared to the year ended December 31, 2013; and for the year ended December 31, 2013, compared to December 31, 2012, the slight decrease in total commissions accrued to brokers were primarily due to the total number of contracts traded as well as the transition trades due to change of FCM.
| 10 |
USAG
| For the Year ended December 31, 2014 | For the Year ended December 31, 2013 | For the Year ended December 31, 2012 | ||||||||||
| Per share NAV, end of period | $ | 22.97 | $ | 22.79 | $ | 25.56 | ||||||
| Average daily total net assets | $ | 2,441,385 | $ | 2,389,364 | $ | 2,948,838 | ||||||
| Cash deposits and investments in Treasuries and money market funds | $ | 2,365,241 | $ | 2,328,626 | $ | 2,679,845 | ||||||
| Dividend and interest income earned on Treasuries, cash and/or cash equivalents | $ | 1,176 | $ | 1,328 | $ | 1,573 | ||||||
| Annualized yield based on average daily total net assets | 0.05 | % | 0.06 | % | 0.07 | % | ||||||
| Percentage of cash assets held as overnight deposits and investments in Treasuries at custodian | 90.58 | % | 90.12 | % | 74.65 | % | ||||||
| Percentage of cash assets held as investments in Treasuries and margin deposits for Futures Contracts | 9.42 | % | 9.88 | % | 25.35 | % | ||||||
| Total unrealized gain (loss) on Futures Contracts | $ | (66,576 | ) | $ | (44,553 | ) | $ | (119,155 | ) | |||
| Management fee | $ | 17,092 | $ | 19,115 | $ | 17,492 | ||||||
| Total fees and other expenses excluding management fees | $ | 50,816 | $ | 87,824 | $ | 82,882 | ||||||
| Total amount of the expense waiver | $ | 46,339 | $ | 81,772 | $ | 76,851 | ||||||
| Expenses before allowance for the expense waiver | $ | 67,908 | $ | 106,939 | $ | 100,374 | ||||||
| Expenses after allowance for the expense waiver | $ | 21,569 | $ | 25,167 | $ | 23,523 | ||||||
| Fees and expenses related to the registration or offering of additional shares | $ | — | $ | — | $ | — | ||||||
| Total commissions accrued to brokers | $ | 2,020 | $ | 2,003 | $ | 2,632 | ||||||
| Total commissions as annualized percentage of average total net assets | 0.08 | % | 0.08 | % | 0.12 | % | ||||||
| Commissions accrued as a result of rebalancing | $ | 2,020 | $ | 2,003 | $ | 2,090 | ||||||
| Percentage of commissions accrued as a result of rebalancing | 100 | % | 100 | % | 79.41 | % | ||||||
| Commissions accrued as a result of creation and redemption activity | $ | — | $ | — | $ | 542 | ||||||
| Percentage of commissions accrued as a result of creation and redemption activity | — | % | — | % | 20.59 | % | ||||||
Portfolio Expenses. The Trust Series’ expenses consist of investment management fees, brokerage fees and commissions, certain offering costs, licensing fees, the fees and expenses of the independent directors of USCF and expenses relating to tax accounting and reporting requirements. The management fee that each Trust Series pays to USCF is calculated as a percentage of the total net assets of each Trust Series. The fee is accrued daily and paid monthly.
The slight increase in the per share NAV for USAG for December 31, 2014, compared to the year ended December 31, 2013; and decrease in the per share NAV for the year ended December 31, 2013, compared to the year ended December 31, 2012, were primarily due to an increase or decrease in values of the Futures Contracts held by USAG.
The slight increase in cash deposits and investments in Treasuries and money market funds for December 31, 2014, compared to year ended December 31, 2013, was the result of USAG’s increased size as measured by total net assets; and the decrease for the year ended December 31, 2013, compared to the year ended December 31, 2012, was the result of USAG’s smaller size as measured by total net assets.
USAG’s dividend and interest income earned on Treasuries, cash and/or cash equivalents for December 31, 2014, compared to year ended December 31, 2013; and for December 31, 2013 was similar. The dividend and interest income earned on Treasuries, cash and/or cash equivalents for December 31, 2013, compared to year ended December 31, 2012 was similar.
The decrease in gross total fees and expenses excluding management fees for December 31, 2014, compared to the year ended December 31, 2013, was primarily due to a decrease in certain of USAG’s operating expenses; and the increase in gross total fees and expenses excluding management fees for the year ended December 31, 2013, compared to the year ended December 31, 2012, was primarily due the fact that USAG had a full year of operations for year ended December 31, 2013.
USAG’s total commissions accrued to brokers for December 31, 2014, compared to the year ended December 31, 2013 remained static; and for the year ended December 31, 2013, compared to December 31, 2012, the increase was primarily a result of the higher number of contracts traded.
| 11 |
USMI
| For the Year ended December 31, 2014 | For the Year ended December 31, 2013 | For the Year ended December 31, 2012 | ||||||||||
| Per share NAV, end of period | $ | 19.82 | $ | 21.97 | $ | 26.47 | ||||||
| Average daily total net assets | $ | 2,216,973 | $ | 2,519,632 | $ | 2,849,399 | ||||||
| Cash deposits and investments in Treasuries and money market funds | $ | 2,120,591 | $ | 2,248,304 | $ | 2,605,049 | ||||||
| Dividend and interest income earned on Treasuries, cash and/or cash equivalents | $ | 1,015 | $ | 1,299 | $ | 1,270 | ||||||
| Annualized yield based on average daily total net assets | 0.05 | % | 0.05 | % | 0.08 | % | ||||||
| Percentage of cash assets held as overnight deposits and investments in Treasuries at custodian | 85.00 | % | 85.34 | % | 82.03 | % | ||||||
| Percentage of cash assets held as investments in Treasuries and margin deposits for Futures Contracts | 15.00 | % | 14.66 | % | 17.97 | % | ||||||
| Total unrealized gain (loss) on Futures Contracts | $ | (136,564 | ) | $ | (46,293 | ) | $ | 46,058 | ||||
| Management fee | $ | 14,774 | $ | 17,637 | $ | 10,681 | ||||||
| Total fees and other expenses excluding management fees | $ | 48,747 | $ | 87,302 | $ | 62,473 | ||||||
| Total amount of the expense waiver | $ | 44,985 | $ | 82,165 | $ | 59,316 | ||||||
| Expenses before allowance for the expense waiver | $ | 63,521 | $ | 104,939 | $ | 73,154 | ||||||
| Expenses after allowance for the expense waiver | $ | 18,536 | $ | 22,774 | $ | 13,838 | ||||||
| Fees and expenses related to the registration or offering of additional shares | $ | — | $ | — | $ | — | ||||||
| Total commissions accrued to brokers | $ | 826 | $ | 871 | $ | 714 | ||||||
| Total commissions as annualized percentage of average total net assets | 0.04 | % | 0.03 | % | 0.05 | % | ||||||
| Commissions accrued as a result of rebalancing | $ | 826 | $ | 774 | $ | 512 | ||||||
| Percentage of commissions accrued as a result of rebalancing | 100 | % | 88.86 | % | 71.71 | % | ||||||
| Commissions accrued as a result of creation and redemption activity | $ | — | $ | 97 | $ | 202 | ||||||
| Percentage of commissions accrued as a result of creation and redemption activity | — | % | 11.14 | % | 28.29 | % | ||||||
Portfolio Expenses. The Trust Series’ expenses consist of investment management fees, brokerage fees and commissions, certain offering costs, licensing fees, the fees and expenses of the independent directors of USCF and expenses relating to tax accounting and reporting requirements. The management fee that each Trust Series pays to USCF is calculated as a percentage of the total net assets of each Trust Series. The fee is accrued daily and paid monthly.
The decrease in the per share NAV for USMI for December 31, 2014, compared to the year ended December 31, 2013; and decrease in the per share NAV for the year ended December 31, 2013, compared to the year ended December 31, 2012, were primarily due to a decrease in values of the Futures Contracts held by USMI.
The decrease in cash deposits and investments in Treasuries and money market funds for December 31, 2014, compared to year ended December 31, 2013; and for the year ended December 31, 2013, compared to the year ended December 31, 2012, was the result of USMI’s smaller size as measured by total net assets.
USMI’s dividend and interest income earned on Treasuries, cash and/or cash equivalents for December 31, 2014, compared to year ended December 31, 2013 was similar; and for December 31, 2013, compared to December 31, 2012, the amount of interest income earned by USMI as a percentage of average total net assets were similar.
The decrease in gross total fees and expenses excluding management fees for December 31, 2014, compared to the year ended December 31, 2013, was primarily due to a decrease in certain of USMI’s operating expenses; and the increase in gross total fees and expenses excluding management fees for the year ended December 31, 2013, compared to the year ended December 31, 2012, was primarily due the fact that USMI had a full year of operations for year ended December 31, 2013.
USMI’s total commissions accrued to brokers for December 31, 2014, compared to the year ended December 31, 2013 remained static; and for the year ended December 31, 2013, compared to December 31, 2012, the increase was primarily a result of the higher number of contracts traded.
| 12 |
For the Three Months Ended December 31, 2014 Compared to the Three Months Ended December 31, 2013; and for the Three Months Ended December 31, 2013 Compared to the Three Months Ended December 31, 2012
USCI
| For the three months ended December 31, 2014 | For the three months ended December 31, 2013 | For the three months ended December 31, 2012 | ||||||||||
| Average daily total net assets | $ | 817,200,303 | $ | 508,589,477 | $ | 484,122,909 | ||||||
| Dividend and interest income earned on Treasuries, cash and/or cash equivalents | $ | 89,995 | $ | 59,083 | $ | 100,972 | ||||||
| Annualized yield based on average daily total net assets | 0.04 | % | 0.05 | % | 0.08 | % | ||||||
| Management fee | $ | 1,647,834 | $ | 1,217,828 | $ | 1,156,075 | ||||||
| Total fees and other expenses excluding management fees | $ | 485,590 | $ | 252,406 | $ | 171,863 | ||||||
| Fees and expenses related to the registration or offering of additional shares | $ | — | $ | — | $ | — | ||||||
| Total commissions accrued to brokers | $ | 207,424 | $ | 106,806 | $ | 85,901 | ||||||
| Total commissions as annualized percentage of average total net assets | 0.10 | % | 0.08 | % | 0.07 | % | ||||||
| Commissions accrued as a result of rebalancing | $ | 200,561 | $ | 100,298 | $ | 83,352 | ||||||
| Percentage of commissions accrued as a result of rebalancing | 96.69 | % | 93.91 | % | 97.03 | % | ||||||
| Commissions accrued as a result of creation and redemption activity | $ | 6,863 | $ | 6,508 | $ | 2,549 | ||||||
| Percentage of commissions accrued as a result of creation and redemption activity | 3.31 | % | 6.09 | % | 2.97 | % | ||||||
The increase in USCI’s average daily total net assets for the three months ended December 31, 2014, compared to the three months ended December 31, 2013; and for the three months ended December 31, 2013, compared to the three months ended December 31, 2012, were primarily due to an increase in size due to net creations.
The increase in USCI’S dividend and interest income earned on Treasuries, cash and/or cash equivalents for December 31, 2014, compared to the three months ended December 31, 2013; and for the three months ended December 31, 2013, compared to the three months ended December 31, 2012, was primarily due to USCI’s larger size as measured by total net assets.
The increase in USCI’s total fees and expenses excluding management fees for the three months ended December 31, 2014, compared to the three months ended December 31, 2013; and for the three months ended December 31, 2013, compared to the three months ended December 31, 2012, was due to an increase in USCI’s commissions resulting from USCI’s larger size as represented by total net assets.
The increase in USCI’s total commissions accrued to brokers for the year ended December 31, 2014, compared to the year ended December 31, 2013; and for the three months ended December 31, 2013, compared to the three months December 31, 2012, was primarily due to an increase in USCI’s total net assets (due to net creations) as well as an increase in the number of contracts traded during the rebalancing periods.
| 13 |
CPER
| For the three months ended December 31, 2014 | For the three months ended December 31, 2013 | For the three months ended December 31, 2012 | ||||||||||
| Average daily total net assets | $ | 3,015,303 | $ | 2,217,614 | $ | 2,515,754 | ||||||
| Dividend and interest income earned on Treasuries, cash and/or cash equivalents | $ | 340 | $ | 270 | $ | 514 | ||||||
| Annualized yield based on average daily total net assets | 0.04 | % | 0.05 | % | 0.08 | % | ||||||
| Management fee | $ | 4,940 | $ | 3,633 | $ | 4,111 | ||||||
| Total fees and other expenses excluding management fees | $ | 16,751 | $ | 15,951 | $ | 33,217 | ||||||
| Fees and expenses related to the registration or offering of additional shares | $ | — | $ | — | $ | — | ||||||
| Total amount of the expense waiver | $ | 15,611 | $ | 14,618 | $ | 31,459 | ||||||
| Expenses before allowance for the expense waiver | $ | 21,691 | $ | 19,584 | $ | 37,328 | ||||||
| Expenses after allowance for the expense waiver | $ | 6,080 | $ | 4,966 | $ | 5,869 | ||||||
| Total commissions accrued to brokers | $ | 225 | $ | 367 | $ | 359 | ||||||
| Total commissions as annualized percentage of average total net assets | 0.03 | % | 0.07 | % | 0.06 | % | ||||||
| Commissions accrued as a result of rebalancing | $ | 225 | $ | 367 | $ | 359 | ||||||
| Percentage of commissions accrued as a result of rebalancing | 100 | % | 100 | % | 100 | % | ||||||
| Commissions accrued as a result of creation and redemption activity | $ | — | $ | — | $ | — | ||||||
| Percentage of commissions accrued as a result of creation and redemption activity | — | % | — | % | — | % | ||||||
The increase in CPER’s average daily total net assets for the three months ended December 31, 2014, compared to the three months ended December 31, 2013; and for the three months ended December 31, 2013, compared to the three months ended December 31, 2012, were primarily due to an increase in size due to net creation.
The dividend and interest income earned on Treasuries, cash and/or cash equivalents for the three months ended December 31, 2014, compared to year ended December 31, 2013, was similar. The dividend and interest income earned on Treasuries, cash and/or cash equivalents for December 31, 2013, compared to December 31, 2012, was similar.
The slight increase in total gross fees and expenses excluding management fees for the three months ended December 31, 2014, compared to the three months ended December 31, 2013, was primarily due to an increase in certain CPER’s operating expenses; and for the three months ended December 31, 2013, compared to the three months ended December 31, 2012, the decrease in total gross fees and expenses excluding management fees was primarily due to a decrease in certain of CPER’s operating expenses.
CPER’s total commissions accrued to brokers for the three months ended December 31, 2014, compared to the three months ended December 31, 2013; and for the three months ended December 31, 2013, compared to December 31, 2012, were similar and primarily due to the total number of contracts traded.
| 14 |
USAG
| For the three months ended December 31, 2014 | For the three months ended December 31, 2013 | For the three months ended December 31, 2012 | ||||||||||
| Average daily total net assets | $ | 2,352,554 | $ | 2,337,457 | $ | 2,653,902 | ||||||
| Dividend and interest income earned on Treasuries, cash and/or cash equivalents | $ | 267 | $ | 292 | $ | 559 | ||||||
| Annualized yield based on average daily total net assets | 0.05 | % | 0.05 | % | 0.08 | % | ||||||
| Management fee | $ | 3,855 | $ | 4,713 | $ | 5,337 | ||||||
| Total fees and other expenses excluding management fees | $ | 22,974 | $ | 6,132 | $ | 32,086 | ||||||
| Fees and expenses related to the registration or offering of additional shares | $ | — | $ | — | $ | — | ||||||
| Total amount of the expense waiver | $ | 21,749 | $ | 4,637 | $ | 30,132 | ||||||
| Expenses before allowance for the expense waiver | $ | 26,829 | $ | 10,845 | $ | 37,423 | ||||||
| Expenses after allowance for the expense waiver | $ | 5,080 | $ | 6,208 | $ | 7,291 | ||||||
| Total commissions accrued to brokers | $ | 555 | $ | 479 | $ | 558 | ||||||
| Total commissions as annualized percentage of average total net assets | 0.09 | % | 0.08 | % | 0.08 | % | ||||||
| Commissions accrued as a result of rebalancing | $ | 555 | $ | 479 | $ | 558 | ||||||
| Percentage of commissions accrued as a result of rebalancing | 100 | % | 100 | % | 100 | % | ||||||
| Commissions accrued as a result of creation and redemption activity | $ | — | $ | — | $ | — | ||||||
| Percentage of commissions accrued as a result of creation and redemption activity | — | % | — | % | — | % | ||||||
USAG’s average daily total net assets for the three months ended December 31, 2014, compared to the three months ended December 31, 2013, was similar; and for the three months ended December 31, 2013, compared to the three months ended December 31, 2012, USAG’s average daily total net assets decreased was primarily due to an decrease in values of the Futures Contracts held by USAG.
USAG’s dividend and interest income earned on Treasuries, cash and/or cash equivalents for the three months ended December 31, 2014, compared to year ended December 31, 2013, was similar; and for the three months ended December 31, 2013, compared to December 31, 2012, was similar.
The increase in total gross fees and expenses excluding management fees for the three months ended December 31, 2014, compared to the three months ended December 31, 2013, was primarily due to an increase in certain USAG’s operating expenses; and for the three months ended December 31, 2013, compared to the three months ended December 31, 2012, the decrease in total gross fees and expenses excluding management fees was primarily due to a decrease in certain of USAG’s operating expenses.
USAG’s total commissions accrued to brokers for the three months ended December 31, 2014, compared to the three months ended December 31, 2013; and for the three months ended December 31, 2013, compared to December 31, 2012, were similar and primarily due to the total number of contracts traded.
| 15 |
USMI
| For the three months ended December 31, 2014 | For the three months ended December 31, 2013 | For the three months ended December 31, 2012 | ||||||||||
| Average daily total net assets | $ | 2,090,881 | $ | 2,220,427 | $ | 2,637,101 | ||||||
| Dividend and interest income earned on Treasuries, cash and/or cash equivalents | $ | 246 | $ | 252 | $ | 570 | ||||||
| Annualized yield based on average daily total net assets | 0.05 | % | 0.05 | % | 0.09 | % | ||||||
| Management fee | $ | 3,425 | $ | 3,917 | $ | 4,640 | ||||||
| Total fees and other expenses excluding management fees | $ | 21,753 | $ | 6,182 | $ | 31,766 | ||||||
| Fees and expenses related to the registration or offering of additional shares | $ | — | $ | — | $ | — | ||||||
| Total amount of the expense waiver | $ | 20,968 | $ | 4,987 | $ | 30,139 | ||||||
| Expenses before allowance for the expense waiver | $ | 25,178 | $ | 10,099 | $ | 36,406 | ||||||
| Expenses after allowance for the expense waiver | $ | 4,210 | $ | 5,112 | $ | 6,267 | ||||||
| Total commissions accrued to brokers | $ | 192 | $ | 228 | $ | 238 | ||||||
| Total commissions as annualized percentage of average total net assets | 0.04 | % | 0.04 | % | 0.04 | % | ||||||
| Commissions accrued as a result of rebalancing | $ | 192 | $ | 228 | $ | 238 | ||||||
| Percentage of commissions accrued as a result of rebalancing | 100 | % | 100 | % | 100 | % | ||||||
| Commissions accrued as a result of creation and redemption activity | $ | — | $ | — | $ | — | ||||||
| Percentage of commissions accrued as a result of creation and redemption activity | — | % | — | % | — | % | ||||||
The decrease in USMI’s average daily total net assets for the three months ended December 31, 2014, compared to the three months ended December 31, 2013; and for the three months ended December 31, 2013, compared to the three months ended December 31, 2012, were primarily due to a decrease in values of the Futures Contracts held by USMI.
USMI’s dividend and interest income earned on Treasuries, cash and/or cash equivalents for the three months ended December 31, 2014, compared to year ended December 31, 2013, was similar; and the dividend and interest income earned on Treasuries, cash and/or cash equivalents for December 31, 2013, compared to December 31, 2012, was similar.
The increase in total gross fees and expenses excluding management fees for the three months ended December 31, 2014, compared to the three months ended December 31, 2013, was primarily due to an increase in certain USMI’s operating expenses; and for the three months ended December 31, 2013, compared to the three months ended December 31, 2012, the slight decrease in total gross fees and expenses excluding management fees was primarily due to a decrease in certain USMI’s operating expenses.
USMI’s total commissions accrued to brokers for the three months ended December 31, 2014, compared to the three months ended December 31, 2013; and for the three months ended December 31, 2013, compared to December 31, 2012, were similar and primarily due to the total number of contracts traded.
Portfolio Holdings for USCI
During the year ended December 31, 2014, USCI’s portfolio held at all times Futures Contracts based on at least fourteen different commodities. Due to changes in the composition of the SDCI, each month the list of Benchmark Component Futures Contracts held by USCI changed (see the section “The SDCI” below). The table below lists the Benchmark Component Futures Contracts held during the year ended December 31, 2014.
| 16 |
Benchmark Component Futures Contracts for USCI
| Commodities | 1/1/2014 | 2/1/2014 | 3/1/2014 | 4/1/2014 | 5/1/2014 | 6/1/2014 | 7/1/2014 | 8/1/2014 | 9/1/2014 | 10/1/2014 | 11/1/2014 | 12/1/2014 | |||||||||||||
| Crude Oil (Brent) | · | · | · | · | · | ||||||||||||||||||||
| Crude Oil (WTI) | · | · | · | · | · | · | · | · | · | ||||||||||||||||
| Gas Oil | · | · | · | · | |||||||||||||||||||||
| Heating Oil | · | · | · | · | · | ||||||||||||||||||||
| Natural Gas | · | · | · | · | · | · | · | · | · | ||||||||||||||||
| Unleaded Gasoline | · | · | · | · | · | · | · | · | · | · | · | · | |||||||||||||
| Feeder Cattle | · | · | · | · | · | · | · | · | · | · | · | · | |||||||||||||
| Lean Hogs | · | · | · | · | · | · | · | · | · | · | · | ||||||||||||||
| Live Cattle | · | · | · | · | · | · | · | · | · | · | · | · | |||||||||||||
| Corn | · | · | · | · | · | · | |||||||||||||||||||
| Soybeans | |||||||||||||||||||||||||
| Soybean Meal | · | · | · | · | · | · | · | · | · | · | · | · | |||||||||||||
| Soybean Oil | · | ||||||||||||||||||||||||
| Wheat | · | · | · | · | · | · | · | · | · | · | · | · | |||||||||||||
| Aluminum | · | · | · | · | · | · | · | · | |||||||||||||||||
| Copper | · | · | · | · | · | · | · | ||||||||||||||||||
| Lead | · | · | · | · | · | ||||||||||||||||||||
| Nickel | · | · | |||||||||||||||||||||||
| Tin | |||||||||||||||||||||||||
| Zinc | · | · | · | · | · | · | · | · | · | · | · | · | |||||||||||||
| Gold | · | · | |||||||||||||||||||||||
| Platinum | · | · | · | · | · | · | · | · | · | · | |||||||||||||||
| Silver | · | · | · | · | · | · | · | · | · | · | · | · | |||||||||||||
| Cocoa | · | · | · | · | · | · | · | · | · | · | |||||||||||||||
| Coffee | · | · | · | · | · | · | · | · | · | · | · | · | |||||||||||||
| Cotton | |||||||||||||||||||||||||
| Sugar | · | · | · | · | · | · | · | · | · | · | · | · |
— = Component
The table below reflects the same listing of monthly Benchmark Component Futures Contracts as the tables above with two changes. First, the table below includes a column showing the change in the spot price of each of the 27 commodities for the year ended December 31, 2014. Second, while the tables above list the order of the commodities alphabetically (first by which of the six sectors a commodity falls into and then within each sector), the table below lists the commodities from the commodity that had the highest positive change in spot price to the commodity that had the lowest positive change or largest negative change in spot price. Investors are cautioned that the change in the spot price of a given commodity does not represent the actual return that USCI might have earned on any holdings in futures contracts based on that commodity. This is due to two factors. First, the return on a futures contract may be higher, or lower, than the change in the spot price of the commodity due to the impact of backwardation or contango. Second, USCI may not have owned any such futures contract for the entire time period represented in the table below. Thus, USCI’s total actual return on its holdings in any of the commodities shown below may be higher, or lower, than the actual change in the spot price of the particular commodity.
| 17 |
Benchmark Component Futures Contracts for USCI
| YTD Price | ||||||||||||||||||||||||||||
| Commodities | 1/1/2014 | 2/1/2014 | 3/1/2014 | 4/1/2014 | 5/1/2014 | 6/1/2014 | 7/1/2014 | 8/1/2014 | 9/1/2014 | 10/1/2014 | 11/1/2014 | 12/1/2014 | Performance | |||||||||||||||
| Crude Oil (Brent) | · | · | · | · | · | (31.70 | )% | |||||||||||||||||||||
| Crude Oil (WTI) | · | · | · | · | · | · | · | · | · | (40.00 | )% | |||||||||||||||||
| Gas Oil | · | · | · | · | (45.80 | )% | ||||||||||||||||||||||
| Heating Oil | · | · | · | · | · | (45.90 | )% | |||||||||||||||||||||
| Natural Gas | · | · | · | · | · | · | · | · | · | (48.30 | )% | |||||||||||||||||
| Unleaded Gasoline | · | · | · | · | · | · | · | · | · | · | · | · | (48.50 | )% | ||||||||||||||
| Feeder Cattle | · | · | · | · | · | · | · | · | · | · | · | · | 31.60 | % | ||||||||||||||
| Lean Hogs | · | · | · | · | · | · | · | · | · | · | · | 23.20 | % | |||||||||||||||
| Live Cattle | · | · | · | · | · | · | · | · | · | · | · | · | (4.90 | )% | ||||||||||||||
| Corn | · | · | · | · | · | · | (2.60 | )% | ||||||||||||||||||||
| Soybeans | (5.90 | )% | ||||||||||||||||||||||||||
| Soybean Meal | · | · | · | · | · | · | · | · | · | · | · | · | (16.70 | )% | ||||||||||||||
| Soybean Oil | · | (17.60 | )% | |||||||||||||||||||||||||
| Wheat | · | · | · | · | · | · | · | · | · | · | · | · | (22.30 | )% | ||||||||||||||
| Aluminum | · | · | · | · | · | · | · | · | 9.00 | % | ||||||||||||||||||
| Copper | · | · | · | · | · | · | · | 6.00 | % | |||||||||||||||||||
| Lead | · | · | · | · | · | 4.10 | % | |||||||||||||||||||||
| Nickel | · | · | (12.90 | )% | ||||||||||||||||||||||||
| Tin | (15.80 | )% | ||||||||||||||||||||||||||
| Zinc | · | · | · | · | · | · | · | · | · | · | · | · | (16.80 | )% | ||||||||||||||
| Gold | · | · | (1.50 | )% | ||||||||||||||||||||||||
| Platinum | · | · | · | · | · | · | · | · | · | · | (11.80 | )% | ||||||||||||||||
| Silver | · | · | · | · | · | · | · | · | · | · | · | · | (19.50 | )% | ||||||||||||||
| Cocoa | · | · | · | · | · | · | · | · | · | · | 50.50 | % | ||||||||||||||||
| Coffee | · | · | · | · | · | · | · | · | · | · | · | · | 7.40 | % | ||||||||||||||
| Cotton | (11.50 | )% | ||||||||||||||||||||||||||
| Sugar | · | · | · | · | · | · | · | · | · | · | · | · | (28.80 | )% | ||||||||||||||
• = Component
Source: Bloomberg
Tracking each Trust Series’ Benchmark
USCF seeks to manage each Trust Series’ portfolio such that changes in its average daily per share NAV, on a percentage basis, closely track the changes in the price of the Applicable Index, also on a percentage basis. Specifically, USCF seeks to manage the portfolio such that over any rolling period of 30-valuation days, the average daily change in a Trust Series’ per share NAV is within a range of 90% to 110% (0.9 to 1.1) of the average daily change in the price of the Applicable Index. As an example, if the average daily movement of the price of the Applicable Index for a particular 30-valuation day time period was 0.50% per day, USCF would attempt to manage the portfolio such that the average daily movement of the per share NAV during that same time period fell between 0.45% and 0.55% (i.e., between 0.9 and 1.1 of the Applicable Index’s results). Each Trust Series’ portfolio management goals do not include trying to make the nominal price of its per share NAV equal to the nominal price of the Applicable Index, the nominal price of any particular commodity Futures Contract or the spot price for any particular commodity. USCF believes that it is not practical to manage the portfolio to achieve such an investment goal when investing in listed Futures Contracts and Other Related Investments.
USCI
For the 30 valuation days ended December 31, 2014, the simple average daily change in the SDCI was (0.360)%, while the simple average daily change in the per share NAV of USCI over the same time period was (0.391)%. The average daily difference was (0.031)% (or (3.1) basis points, where 1 basis point equals 1/100 of 1%). As a percentage of the daily movement of the SDCI, the average error in daily tracking by the per share NAV was (5.08)%, meaning that over this time period USCI’s tracking error was within the plus or minus 10% range established as its benchmark tracking goal. The first chart below shows the daily movement of USCI’s per share NAV versus the daily movement of the SDCI for the 30-valuation day period ended December 31, 2014, the last trading day in December. The second chart below shows the monthly total returns of USCI as compared to the monthly value of the Benchmark Component Futures Contracts for the three years ended December 31, 2014.
Since the commencement of the offering of USCI’s shares to the public on August 10, 2010 to December 31, 2014, the simple average daily change in the SDCI was 0.000%, while the simple average daily change in the per share NAV of USCI over the same time period was 0.006%. The average daily difference was (0.00600)% (or (0.6) basis points, where 1 basis point equals 1/100 of 1%). As a percentage of the daily movement of the SDCI, the average error in daily tracking by the per share NAV was (10.05)%, meaning that over this time period USCI’s tracking error was not within the plus or minus 10% range established as its benchmark tracking goal.
| 18 |

*PAST PERFORMANCE IS NOT NECESSARILY INDICATIVE OF FUTURE RESULTS
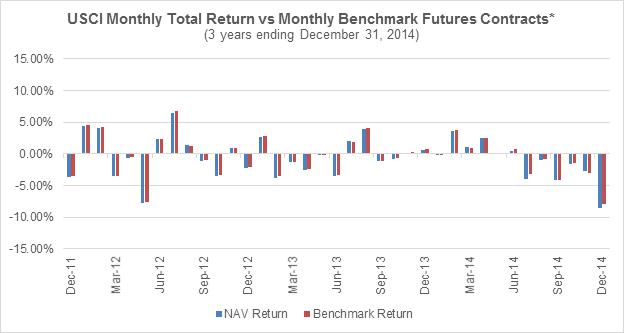
*PAST PERFORMANCE IS NOT NECESSARILY INDICATIVE OF FUTURE RESULTS
An alternative tracking measurement of the return performance of USCI versus the return of the SDCI can be calculated by comparing the actual return of USCI, measured by changes in its NAV, versus the expected changes in its NAV under the assumption that USCI’s returns had been exactly the same as the daily changes in the price of the SDCI.
| 19 |
For the year ended December 31, 2014, the actual total return of USCI as measured by changes in its per share NAV was (13.95)%. This is based on an initial per share NAV of $56.06 on December 31, 2013 and an ending per share NAV as of December 31, 2014 of $48.24. During this time period, USCI made no distributions to its shareholders. However, if USCI’s daily changes in its per share NAV had instead exactly tracked the changes in the daily return of the SDCI, USCI would have had an estimated per share NAV of $49.28 as of December 31, 2014, for a total return over the relevant time period of (12.09)%. The difference between the actual per share NAV total return of USCI of (13.95)% and the expected total return based on the SDCI of (12.09)% was an error over the time period of (1.86)%, which is to say that USCI’s actual total return underperformed the SDCI result by that percentage. USCF believes that a portion of the difference between the actual total return and the expected SDCI total return can be attributed to the net impact of the expenses that USCI pays, offset in part by the income that USCI collects on its cash and cash equivalent holdings. During the year ended December 31, 2014, USCI earned interest income of $323,118, which is equivalent to a weighted average income rate of approximately 0.05% for such period. In addition, during the year ended December 31, 2014, USCI also collected $23,400 from its Authorized Participants for creating or redeeming baskets of shares. This income also contributed to USCI’s actual total return. However, if the total assets of USCI continue to increase, USCF believes that the impact on actual total returns of these fees from creations and redemptions will diminish as a percentage of the actual total return. During the year ended December 31, 2014, USCI incurred total expenses of $7,281,485. Income from interest and Authorized Participant collections net of expenses was $(6,934,967), which is equivalent to a weighted average net income rate of approximately (0.99)% for the year ended December 31, 2014.
By comparison, for the year ended December 31, 2013, the actual total return of USCI as measured by changes in its per share NAV was (4.09)%. This was based on an initial per share NAV of $58.45 on December 31, 2012 and an ending per share NAV as of December 31, 2013 of $56.06. During this time period, USCI made no distributions to its shareholders. However, if USCI’s daily changes in its per share NAV had instead exactly tracked the changes in the daily return of the SDCI, USCI would have had an estimated per share NAV of $56.83 as of December 31, 2013, for a total return over the relevant time period of (2.77)%. The difference between the actual per share NAV total return of USCI of (4.09)% and the expected total return based on the SDCI of (2.79)% was an error over the time period of (1.32)%, which is to say that USCI’s actual total return underperformed the SDCI result by that percentage. USCF believes that a portion of the difference between the actual total return and the expected SDCI total return can be attributed to the net impact of the expenses that USCI paid, offset in part by the income that USCI collected on its cash and cash equivalent holdings. During the year ended December 31, 2013, USCI earned interest income of $265,555, which is equivalent to a weighted average income rate of approximately 0.05% for such period. In addition, during the year ended December 31, 2013, USCI also collected $15,750 from its Authorized Participants for creating or redeeming baskets of shares. This income also contributed to USCI’s actual total return. However, if the total assets of USCI continue to increase, USCF believes that the impact on actual total returns of these fees from creations and redemptions will diminish as a percentage of the actual total return. During the year ended December 31, 2013, USCI incurred total expenses of $5,820,464. Income from interest and Authorized Participant collections net of expenses was $(5,539,159), which is equivalent to a weighted average net income rate of approximately (1.09)% for the year ended December 31, 2013.
By comparison, for the year ended December 31, 2012, the actual total return of USCI as measured by changes in its per share NAV was (0.03)%. This was based on an initial per share NAV of $58.47 on December 31, 2011 and an ending per share NAV as of December 31, 2012 of $58.45. During this time period, USCI made no distributions to its shareholders. However, if USCI’s daily changes in its per share NAV had instead exactly tracked the changes in the daily return of the SDCI, USCI would have had an estimated per share NAV of $59.27 as of December 31, 2012, for a total return over the relevant time period of 1.37%. The difference between the actual per share NAV total return of USCI of (0.03)% and the expected total return based on the SDCI of 1.37% was an error over the time period of (1.40)%, which is to say that USCI’s actual total return underperformed the SDCI result by that percentage. USCF believes that a portion of the difference between the actual total return and the expected SDCI total return can be attributed to the net impact of the expenses that USCI paid, offset in part by the income that USCI collected on its cash and cash equivalent holdings. During the year ended December 31, 2012, USCI earned interest income of $278,476, which is equivalent to a weighted average income rate of approximately 0.07% for such period. In addition, during the year ended December 31, 2012, USCI also collected $12,950 from its Authorized Participants for creating or redeeming baskets of shares. This income also contributed to USCI’s actual total return. However, if the total assets of USCI continue to increase, USCF believes that the impact on actual total returns of these fees from creations and redemptions will diminish as a percentage of the actual total return. During the year ended December 31, 2012, USCI incurred total expenses of $4,926,185. Income from interest and Authorized Participant collections net of expenses was $(4,634,759), which is equivalent to a weighted average net income rate of approximately (1.08)% for the year ended December 31, 2012.
| 20 |
CPER
For the 30 valuation days ended December 31, 2014, the simple average daily change in the SCI was (0.218)%, while the simple average daily change in the per share NAV of CPER over the same time period was (0.229)%. The average daily difference was (0.011)% (or (1.1) basis points, where 1 basis point equals 1/100 of 1%). As a percentage of the daily movement of the SCI, the average error in daily tracking by the per share NAV was (1.53)%, meaning that over this time period CPER’s tracking error was within the plus or minus 10% range established as its benchmark tracking goal. The first chart below shows the daily movement of CPER’s per share NAV versus the daily movement of the SCI for the 30-valuation day period ended December 31, 2014, the last trading day in December. The second chart below shows the monthly total returns of CPER as compared to the monthly value of the Benchmark Component Copper Futures Contracts for the three years ended December 31, 2014.
Since the commencement of the offering of CPER’s shares to the public on November 15, 2011 to December 31, 2014, the simple average daily change in the SCI was (0.03)%, while the simple average daily change in the per share NAV of CPER over the same time period was (0.02)%. The average daily difference was (0.0040)% (or (0.4) basis points, where 1 basis point equals 1/100 of 1%). As a percentage of the daily movement of the SCI, the average error in daily tracking by the per share NAV was (4.93)%, meaning that over this time period CPER’s tracking error was within the plus or minus 10% range established as its benchmark tracking goal.

*PAST PERFORMANCE IS NOT NECESSARILY INDICATIVE OF FUTURE RESULTS
| 21 |
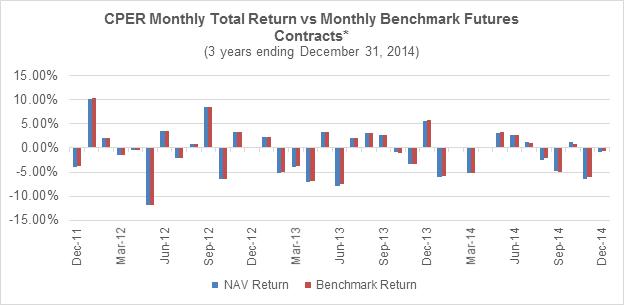
*PAST PERFORMANCE IS NOT NECESSARILY INDICATIVE OF FUTURE RESULTS
An alternative tracking measurement of the return performance of CPER versus the return of the SCI can be calculated by comparing the actual return of CPER, measured by changes in its per share NAV, versus the expected changes in its per share NAV under the assumption that CPER’s returns had been exactly the same as the daily changes in the price of the SCI.
For the year ended December 31, 2014, the actual total return of CPER as measured by changes in its per share NAV was (16.67)%. This is based on an initial per share NAV of $22.92 on December 31, 2013 and an ending per share NAV as of December 31, 2014 of $19.10. During this time period, CPER made no distributions to its shareholders. However, if CPER’s daily changes in its per share NAV had instead exactly tracked the changes in the daily return of the SCI, CPER would have had an estimated per share NAV of $19.28 as of December 31, 2014, for a total return over the relevant time period of (15.88)%. The difference between the actual per share NAV total return of CPER of (16.67)% and the expected total return based on the SCI of (15.88)% was an error over the time period of (0.79)%, which is to say that CPER’s actual total return underperformed the SCI result by that percentage. USCF believes that a portion of the difference between the actual total return and the expected SCI total return can be attributed to the net impact of the expenses that CPER pays, offset in part by the income that CPER collects on its cash and cash equivalent holdings. During the year ended December 31, 2014, CPER earned interest income of $1,455, which is equivalent to a weighted average income rate of approximately 0.05% for such period. During the year ended December 31, 2014, CPER collected $1,750 in fees from its Authorized Participants for creating or redeeming baskets of shares. During the year ended December 31, 2014, CPER incurred net expenses of $25,962. Income from interest and Authorized Participant collections net of expenses was $(22,757), which is equivalent to a weighted average net income rate of approximately (0.72)% for the year ended December 31, 2014.
By comparison, for the year ended December 31, 2013, the actual total return of CPER as measured by changes in its per share NAV was (9.87)%. This was based on an initial per share NAV of $25.43 on December 31, 2012 and an ending per share NAV as of December 31, 2013 of $22.92. During this time period, CPER made no distributions to its shareholders. However, if CPER’s daily changes in its per share NAV had instead exactly tracked the changes in the daily return of the SCI, CPER would have had an estimated per share NAV of $23.17 as of December 31, 2013, for a total return over the relevant time period of (8.89)%. The difference between the actual per share NAV total return of CPER of (9.87)% and the expected total return based on the SCI of (8.89)% was an error over the time period of (0.98)%, which is to say that CPER’s actual total return underperformed the SCI result by that percentage. USCF believes that a portion of the difference between the actual total return and the expected SCI total return can be attributed to the net impact of the expenses that CPER paid, offset in part by the income that CPER collected on its cash and cash equivalent holdings. During the year ended December 31, 2013, CPER earned interest income of $1,260, which is equivalent to a weighted average income rate of approximately 0.05% for such period. During the year ended December 31, 2013, CPER did not collect any fees from its Authorized Participants for creating or redeeming baskets of shares. During the year ended December 31, 2013, CPER incurred net expenses of $19,770. Income from interest and Authorized Participant collections net of expenses was $(18,510), which is equivalent to a weighted average net income rate of approximately (0.81)% for the year ended December 31, 2013.
| 22 |
By comparison, for the year ended December 31, 2012, the actual total return of CPER as measured by changes in its per share NAV was 3.92%. This was based on an initial per share NAV of $24.47 on December 31, 2011 and an ending per share NAV as of December 31, 2012 of $25.43. During this time period, CPER made no distributions to its shareholders. However, if CPER’s daily changes in its per share NAV had instead exactly tracked the changes in the daily return of the SCI, CPER would have had an estimated per share NAV of $25.70 as of December 31, 2012, for a total return over the relevant time period of 5.03%. The difference between the actual per share NAV total return of CPER of 3.92% and the expected total return based on the SCI of 5.03% was an error over the time period of (1.11)%, which is to say that CPER’s actual total return underperformed the SCI result by that percentage. USCF believes that a portion of the difference between the actual total return and the expected SCI total return can be attributed to the net impact of the expenses that CPER paid, offset in part by the income that CPER collected on its cash and cash equivalent holdings. During the year ended December 31, 2012, CPER earned interest income of $1,607, which is equivalent to a weighted average income rate of approximately 0.06% for such period. In addition, during the year ended December 31, 2012, CPER also collected $1,350 from its Authorized Participants for creating or redeeming baskets of shares. During the year ended December 31, 2012, CPER incurred net expenses of $25,023. Income from interest and Authorized Participant collections net of expenses was $(22,066), which is equivalent to a weighted average net income rate of approximately (0.86)% for the year ended December 31, 2012.
USAG
For the 30-valuation days ended December 31, 2014, the simple average daily change in the SDAI was (0.117)%, while the simple average daily change in the per share NAV of USAG over the same time period was (0.119)%. The average daily difference was (0.002)% (or (0.2)% basis points, where 1 basis point equals 1/100 of 1%). As a percentage of the daily movement of the SDAI, the average error in daily tracking by the per share NAV was 1.11%, meaning that over this time period USAG’s tracking error was within the plus or minus 10% range established as its benchmark tracking goal. The first chart below shows the daily movement of USAG’s per share NAV versus the daily movement of the SDAI for the 30-valuation day period ended December 31, 2014, the last trading day in December. The second chart below shows the monthly total returns of USAG as compared to the monthly value of the Benchmark Component Agriculture Futures Contracts for the two years ended December 31, 2014.
Since the commencement of the offering of USAG’s shares to the public on April 13, 2012 to December 31, 2014, the simple average daily change in the SDAI was 0.006%, while the simple average daily change in the per share NAV of USAG over the same time period was (0.01)%. The average daily difference was (0.0040)% (or (0.4) basis points, where 1 basis point equals 1/100 of 1%). As a percentage of the daily movement of the SDAI, the average error in daily tracking by the per share NAV was 7.54%, meaning that over this time period USAG’s tracking error was within the plus or minus 10% range established as its benchmark tracking goal.
| 23 |

*PAST PERFORMANCE IS NOT NECESSARILY INDICATIVE OF FUTURE RESULTS
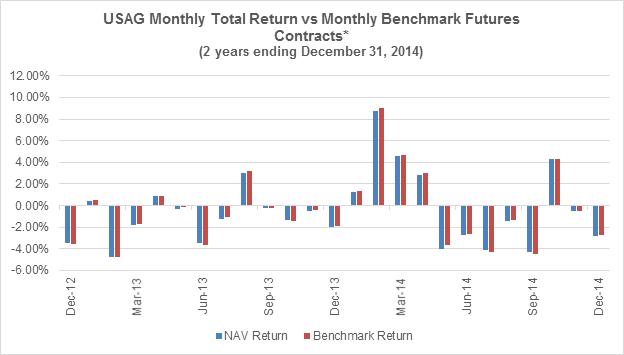
*PAST PERFORMANCE IS NOT NECESSARILY INDICATIVE OF FUTURE RESULTS
An alternative tracking measurement of the return performance of USAG versus the return of the SDAI can be calculated by comparing the actual return of USAG, measured by changes in its per share NAV, versus the expected changes in its per share NAV under the assumption that USAG’s returns had been exactly the same as the daily changes in the price of the SDAI.
| 24 |
For the year ended December 31, 2014, the actual total return of USAG as measured by changes in its per share NAV was 0.79%. This is based on an initial per share NAV of $22.79 on December 31, 2013 and an ending per share NAV as of December 31, 2014 of $22.97. During this time period, USAG made no distributions to its shareholders. However, if USAG’s daily changes in its per share NAV had instead exactly tracked the changes in the daily total return of the SDAI, USAG would have had an estimated per share NAV of $23.20 as of December 31, 2014, for a total return over the relevant time period of 1.78%. The difference between the actual per share NAV total return of USAG of 0.79% and the expected total return based on the SDAI of 1.78% was an error over the time period of (0.99)%, which is to say that USAG’s actual total return underperformed the SDAI result by that percentage. USCF believes that a portion of the difference between the actual total return and the expected SDAI total return can be attributed to the net impact of the expenses that USAG pays, offset in part by the income that USAG collects on its cash and cash equivalent holdings. During the year ended December 31, 2014, USAG earned interest income of $1,176, which is equivalent to a weighted average income rate of approximately 0.05% for such period. During the year ended December 31, 2014, USAG did not collect from its Authorized Participants for creating or redeeming baskets of shares. However, if the total assets of USAG continue to increase, USCF believes that the impact on actual total returns of these fees from creations and redemptions will diminish as a percentage of the actual total return. During the year ended December 31, 2014, USAG incurred net expenses of $21,569. Income from interest and Authorized Participant collections net of expenses was $(20,393), which is equivalent to a weighted average net income rate of approximately (0.84)% for the year ended December 31, 2014.
By comparison, for the period ended December 31, 2013, the actual total return of USAG as measured by changes in its per share NAV was (10.84)%. This was based on an initial per share NAV of $25.56 on December 31, 2012 and an ending per share NAV as of December 31, 2013 of $22.79. During this time period, USAG made no distributions to its shareholders. However, if USAG’s daily changes in its per share NAV had instead exactly tracked the changes in the daily total return of the SDAI, USAG would have had an estimated per share NAV of $22.97 as of December 31, 2013, for a total return over the relevant time period of (10.13)%. The difference between the actual per share NAV total return of USAG of (10.84)% and the expected total return based on the SDAI of (10.13)% was an error over the time period of (0.71)%, which is to say that USAG’s actual total return underperformed the SDAI result by that percentage. USCF believes that a portion of the difference between the actual total return and the expected SDAI total return can be attributed to the net impact of the expenses that USAG pays, offset in part by the income that USAG collects on its cash and cash equivalent holdings. During the year ended December 31, 2013, USAG earned interest income of $1,328, which is equivalent to a weighted average income rate of approximately 0.06% for such period. During the year ended December 31, 2013, USAG did not collect any from its Authorized Participants for creating or redeeming baskets of shares. However, if the total assets of USAG continue to increase, USCF believes that the impact on actual total returns of these fees from creations and redemptions will diminish as a percentage of the actual total return. During the year ended December 31, 2013, USAG incurred net expenses of $25,167. Income from interest and Authorized Participant collections net of expenses was $(23,839), which is equivalent to a weighted average net income rate of approximately (1.00)% for the year ended December 31, 2013.
By comparison, for the period ended December 31, 2012, the actual total return of USAG as measured by changes in its per share NAV was 2.24%. This was based on an initial per share NAV of $25.00 on April 13, 2012 and an ending per share NAV as of December 31, 2012 of $25.56. During this time period, USAG made no distributions to its shareholders. However, if USAG’s daily changes in its per share NAV had instead exactly tracked the changes in the daily total return of the SDAI, USAG would have had an estimated per share NAV of $25.80 as of December 31, 2012, for a total return over the relevant time period of 3.20%. The difference between the actual per share NAV total return of USAG of 2.24% and the expected total return based on the SDAI of 3.20% was an error over the time period of (0.96)%, which is to say that USAG’s actual total return underperformed the SDAI result by that percentage. USCF believes that a portion of the difference between the actual total return and the expected SDAI total return can be attributed to the net impact of the expenses that USAG pays, offset in part by the income that USAG collects on its cash and cash equivalent holdings. During the period ended December 31, 2012, USAG earned interest income of $1,573, which is equivalent to a weighted average income rate of approximately 0.07% for such period. In addition, during the period ended December 31, 2012, USAG also collected $2,700 from its Authorized Participants for creating or redeeming baskets of shares. This income also contributed to USAG’s actual total return. However, if the total assets of USAG continue to increase, USCF believes that the impact on actual total returns of these fees from creations and redemptions will diminish as a percentage of the actual total return. During the period ended December 31, 2012, USAG incurred net expenses of $23,523. Income from interest and Authorized Participant collections net of expenses was $(19,250), which is equivalent to a weighted average net income rate of approximately (0.91)% for the period ended December 31, 2012.
| 25 |
USMI
For the 30-valuation days ended December 31, 2014, the simple average daily change in the SDMI was (0.170)%, while the simple average daily change in the per share NAV of USMI over the same time period was (0.180)%. The average daily difference was (0.009)% (or (0.9) basis points, where 1 basis point equals 1/100 of 1%). As a percentage of the daily movement of the SDMI, the average error in daily tracking by the per share NAV was (5.57)%, meaning that over this time period USMI’s tracking error was within the plus or minus 10% range established as its benchmark tracking goal. The first chart below shows the daily movement of USMI’s per share NAV versus the daily movement of the SDMI for the 30-valuation day period ended December 31, 2014, the last trading day in December. The second chart below shows the monthly total returns of USMI as compared to the monthly value of the Benchmark Component Metals Futures Contracts for the two years ended December 31, 2014.
Since the commencement of the offering of USMI’s shares to the public on June 19, 2012 to December 31, 2014, the simple average daily change in the SDMI was (0.027)%, while the simple average daily change in the per share NAV of USMI over the same time period was (0.03)%. The average daily difference was (0.0050)% (or (0.5) basis points, where 1 basis point equals 1/100 of 1%). As a percentage of the daily movement of the SDMI, the average error in daily tracking by the per share NAV was (3.54)% meaning that over this time period USMI’s tracking error was within the plus or minus 10% range established as its benchmark tracking goal.
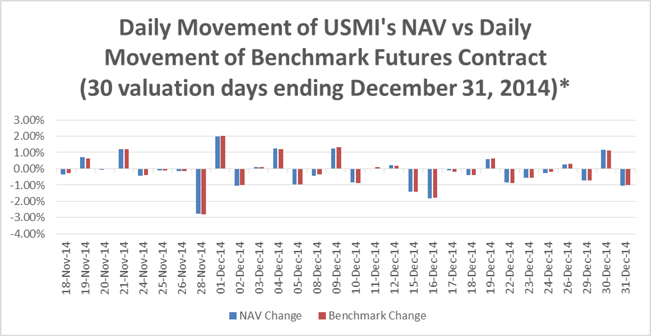
*PAST PERFORMANCE IS NOT NECESSARILY INDICATIVE OF FUTURE RESULTS
| 26 |
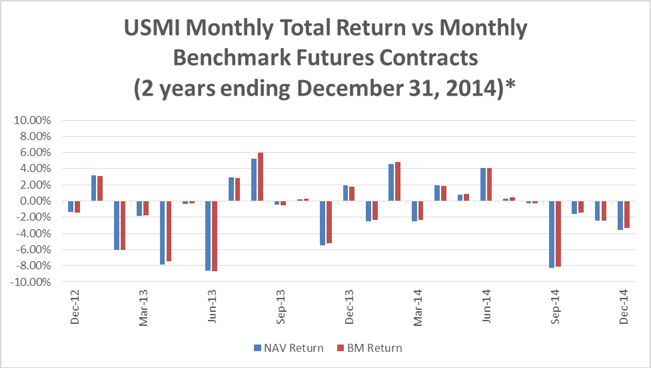
*PAST PERFORMANCE IS NOT NECESSARILY INDICATIVE OF FUTURE RESULTS
An alternative tracking measurement of the return performance of USMI versus the return of the SDMI can be calculated by comparing the actual return of USMI, measured by changes in its per share NAV, versus the expected changes in its per share NAV under the assumption that USMI’s returns had been exactly the same as the daily changes in the price of the SDMI.
For the year ended December 31, 2014, the actual total return of USMI as measured by changes in its per share NAV was (9.79)%. This is based on an initial per share NAV of $21.97 on December 31, 2013 and an ending per share NAV as of December 31, 2014 of $19.82. During this time period, USMI made no distributions to its shareholders. However, if USMI’s daily changes in its per share NAV had instead exactly tracked the changes in the daily total return of the SDMI, USMI would have had an estimated per share NAV of $20.43 as of December 31, 2014, for a total return over the relevant time period of (7.01)%. The difference between the actual per share NAV total return of USMI of (9.79)% and the expected total return based on the SDMI of (7.01)% was an error over the time period of (2.78)% which is to say that USMI’s actual total return underperformed the SDMI result by that percentage. USCF believes that a portion of the difference between the actual total return and the expected SDMI total return can be attributed to the net impact of the expenses that USMI pays, offset in part by the income that USMI collects on its cash and cash equivalent holdings. During the year ended December 31, 2014, USMI earned interest income of $1,015, which is equivalent to a weighted average income rate of approximately 0.05% for such period. During the year ended December 31, 2014, USMI did not collect from its Authorized Participants for creating or redeeming baskets of shares. However, if the total assets of USMI continue to increase, USCF believes that the impact on actual total returns of these fees from creations and redemptions will diminish as a percentage of the actual total return. During the year ended December 31, 2014, USMI incurred net expenses of $18,536. Income from interest and Authorized Participant collections net of expenses was $(17,521), which is equivalent to a weighted average net income rate of approximately (0.79)% for the year ended December 31, 2014.
| 27 |
By comparison, for the period ended December 31, 2013, the actual total return of USMI as measured by changes in its per share NAV was (17.00)%. This was based on an initial per share NAV of $26.47 on December 31, 2012 and an ending per share NAV as of December 31, 2013 of $21.97. During this time period, USMI made no distributions to its shareholders. However, if USMI’s daily changes in its per share NAV had instead exactly tracked the changes in the daily total return of the SDMI, USMI would have had an estimated per share NAV of $22.23 as of December 31, 2013, for a total return over the relevant time period of (16.00)%. The difference between the actual per share NAV total return of USMI of (17.00)% and the expected total return based on the SDMI of (16.00)% was an error over the time period of (1.00)% which is to say that USMI’s actual total return underperformed the SDMI result by that percentage. USCF believes that a portion of the difference between the actual total return and the expected SDMI total return can be attributed to the net impact of the expenses that USMI pays, offset in part by the income that USMI collects on its cash and cash equivalent holdings. During the year ended December 31, 2013, USMI earned interest income of $1,299, which is equivalent to a weighted average income rate of approximately 0.05% for such period. In addition, during the year ended December 31, 2013, USMI also collected $1,350 from its Authorized Participants for creating or redeeming baskets of shares. This income also contributed to USMI’s actual total return. However, if the total assets of USMI continue to increase, USCF believes that the impact on actual total returns of these fees from creations and redemptions will diminish as a percentage of the actual total return. During the year ended December 31, 2013, USMI incurred net expenses of $22,774. Income from interest and Authorized Participant collections net of expenses was $(20,125), which is equivalent to a weighted average net income rate of approximately (0.80)% for the year ended December 31, 2013.
By comparison, for the period ended December 31, 2012, the actual total return of USMI as measured by changes in its per share NAV was 5.88%. This was based on an initial per share NAV of $25.00 on June 19, 2012 and an ending per share NAV as of December 31, 2012 of $26.47. During this time period, USMI made no distributions to its shareholders. However, if USMI’s daily changes in its per share NAV had instead exactly tracked the changes in the daily total return of the SDMI, USMI would have had an estimated per share NAV of $26.57 as of December 31, 2012, for a total return over the relevant time period of 6.28%. The difference between the actual per share NAV total return of USMI of 5.88% and the expected total return based on the SDMI of 6.28% was an error over the time period of (0.40)% which is to say that USMI’s actual total return underperformed the SDMI result by that percentage. USCF believes that a portion of the difference between the actual total return and the expected SDMI total return can be attributed to the net impact of the expenses that USMI pays, offset in part by the income that USMI collects on its cash and cash equivalent holdings. During the period ended December 31, 2012, USMI earned interest income of $1,270, which is equivalent to a weighted average income rate of approximately 0.08% for such period. In addition, during the period ended December 31, 2012, USMI also collected $1,350 from its Authorized Participants for creating or redeeming baskets of shares. This income also contributed to USMI’s actual total return. However, if the total assets of USMI continue to increase, USCF believes that the impact on actual total returns of these fees from creations and redemptions will diminish as a percentage of the actual total return. During the period ended December 31, 2012, USMI incurred net expenses of $13,838. Income from interest and Authorized Participant collections net of expenses was $(11,218), which is equivalent to a weighted average net income rate of approximately (0.74)% for the period ended December 31, 2012.
Factors That Can Impact Ability to Track the Applicable Benchmark Component Futures Contract
There are currently three factors that have impacted or are most likely to impact a Trust Series’ ability to accurately track its Applicable Benchmark Component Futures Contract.
First, a Trust Series may buy or sell its holdings in the then current Applicable Benchmark Component Futures Contracts at a price other than the closing settlement price of that contract on the day during which such Trust Series executes the trade. In that case, a Trust Series may pay a price that is higher, or lower, than that of the Applicable Benchmark Component Futures Contracts, which could cause the changes in the daily per share NAV of a Trust Series to either be too high or too low relative to the daily changes in the price of the Applicable Benchmark Component Futures Contract. During the year ended December 31, 2014, USCF attempted to minimize the effect of these transactions by seeking to execute its purchase or sale of the Applicable Benchmark Component Futures Contracts at, or as close as possible to, the end of the day settlement price. However, it may not always be possible for a Trust Series to obtain the closing settlement price and there is no assurance that failure to obtain the closing settlement price in the future will not adversely impact a Trust Series’ attempt to track the Applicable Benchmark Component Futures Contract over time.
| 28 |
Second, each Trust Series incurs expenses primarily composed of the management fees, brokerage commissions for the buying and selling of futures contracts, and other expenses. The impact of these expenses tends to cause daily changes in the per share NAV of such Trust Series to track slightly lower than daily changes in the price of the Applicable Benchmark Component Futures Contract. At the same time, each Trust Series earns interest income on its cash, cash equivalents and Treasuries. A Trust Series is not required to distribute any portion of its income to its shareholders and none of the Trust Series made any distributions to shareholders during the year ended December 31, 2014. Interest payments, and any other income, were retained within the portfolio and added to each Trust Series’ NAV. At the same time, each Trust Series incurred expenses for its management fee, brokerage commissions and other expenses (including ongoing registration fees). The calculation of each Applicable Benchmark Component Futures Contract includes an interest portion, calculated daily using the 90-Day U.S. Treasury Bill’s total return, but does not include an expense component. When a Trust Series’ income exceeds the sum of its expenses by the yield on the 90-Day U.S. Treasury Bill, such Trust Series realizes a net yield that tends to cause daily changes in the per share NAV of such Trust Series to track slightly higher than daily changes in the price of the Applicable Benchmark Component Futures Contract. If this net yield is lower than the yield on the 90-Day U.S. Treasury Bill, that tends to cause daily changes in the per share NAV of such Trust Series to track slightly lower than daily changes in the price of the Applicable Benchmark Component Futures Contract. During the year ended December 31, 2014, USCI earned, on an annualized basis, approximately 0.05% on its cash holdings. It also incurred cash expenses on an annualized basis of (0.84)% for management fees, approximately (0.09)% in brokerage commission costs related to the purchase and sale of Futures Contracts, and approximately (0.11)% for other expenses. The foregoing fees and expenses resulted in a net yield on an annualized basis of approximately (0.99)% and affected USCI’s ability to track its benchmark. During the year ended December 31, 2014, CPER earned, on an annualized basis, approximately 0.05% on its cash holdings. It also incurred cash expenses on an annualized basis of approximately (0.65)% for management fees, approximately (0.06)% in brokerage commission costs related to the purchase and sale of Futures Contracts, and approximately (0.12)% for other net expenses. The foregoing fees and expenses resulted in a net yield on an annualized basis of approximately (0.78)% and affected CPER’s ability to track its benchmark. During the year ended December 31, 2014, USAG earned, on an annualized basis, approximately 0.05% on its cash holdings. It also incurred cash expenses on an annualized basis of approximately (0.70)% for management fees, approximately (0.08)% in brokerage commission costs related to the purchase and sale of Futures Contracts, and approximately (0.11)% for other net expenses. The foregoing fees and expenses resulted in a net yield on an annualized basis of approximately (0.84)% and affected USAG’s ability to track its benchmark. During the year ended December 31, 2014, USMI earned, on an annualized basis, approximately 0.05% on its cash holdings. It also incurred cash expenses on an annualized basis of approximately (0.67)% for management fees, approximately (0.04)% in brokerage commission costs related to the purchase and sale of Futures Contracts, and approximately (0.13)% for other net expenses. The foregoing fees and expenses resulted in a net yield on an annualized basis of approximately (0.79)% and affected USMI’s ability to track its benchmark. If this net yield is lower than the yield on the 90-Day U.S. Treasury Bill, that tends to cause daily changes in the per share NAV of such Trust Series to track slightly lower than daily changes in the price of the Applicable Benchmark Component Futures Contract. If short-term interest rates rise above the current levels, the level of deviation created by the yield would decrease. Conversely, if short-term interest rates were to decline, the amount of error created by the yield would increase. When short-term yields drop to a level lower than the combined expenses of the management fee and the brokerage commissions, then the tracking error becomes a negative number and would tend to cause the daily returns of the per share NAV to underperform the daily returns of the Applicable Benchmark Component Futures Contract. USCF anticipates that interest rates will continue to remain at historical lows and, therefore, it is anticipated that fees and expenses paid by each Trust Series will continue to be higher than interest earned by each Trust Series. As such, USCF anticipates that each Trust Series will continue to underperform tracking the Applicable Benchmark Component Futures Contract until such a time when interest earned at least equals or exceeds the fees and expenses paid by each Trust Series.
Third, a Trust Series may hold Futures Contracts in a particular commodity other than the one specified as the Applicable Benchmark Component Futures Contract, or may hold Other Related Investments in its portfolio that may fail to closely track the Applicable Benchmark Component Futures Contract’s total return movements. Taking USCI as an example, assume for a given month one of the Benchmark Component Futures Contracts is the NYMEX WTI physically settled Futures Contract, trading under the symbol “CL,” for the contract month of November 2014. It is possible that USCI could hold a NYMEX WTI financially settled Futures Contract, trading under the symbol “WS,” for the contract month of November 2014. Alternatively, and using the same example, USCI could hold the ICE WTI financially settled Futures Contract, also for the contract month of November 2014. As a third example, USCI could hold the NYMEX WTI physically settled Futures Contract, trading under the symbol “CL,” but for a contract month other than November 2014. During the year ended December 31, 2014, no Trust Series held any Other Related Investments.
Finally, a Trust Series could hold Other-Related Investments. In any of these cases, the error in tracking the Applicable Benchmark Component Futures Contract could result in daily changes in the per share NAV of a Trust Series that are either too high, or too low, relative to the daily changes in the price of the Applicable Benchmark Component Futures Contract. During the year ended December 31, 2014, none of the Trust Series held any Other-Related Investments, but did, at times, hold Futures Contracts that were in months other than the months specified as the Applicable Benchmark Component Futures Contract. If any Trust Series increases in size, and due to its obligations to comply with regulatory limits or due to other market pricing or liquidity factors, such Trust Series may invest in Futures Contract months other than the designated month specified as the Applicable Benchmark Component Futures Contract, or in Other-Related Investments, which may have the effect of increasing transaction related expenses and may result in increased tracking error.
| 29 |
Hypothetical Performance of Each Applicable Index
SDCI
The table and chart below show the hypothetical performance of the SDCI from December 31, 2004 through December 31, 2014.
HYPOTHETICAL PERFORMANCE RESULTS HAVE MANY INHERENT LIMITATIONS, SOME OF WHICH ARE DESCRIBED BELOW. NO REPRESENTATION IS BEING MADE THAT USCI WILL OR IS LIKELY TO ACHIEVE PROFITS OR LOSSES SIMILAR TO THOSE SHOWN. IN FACT, THERE ARE FREQUENTLY SHARP DIFFERENCES BETWEEN HYPOTHETICAL PERFORMANCE RESULTS AND THE ACTUAL RESULTS ACHIEVED BY ANY PARTICULAR TRADING PROGRAM.
ONE OF THE LIMITATIONS OF HYPOTHETICAL PERFORMANCE RESULTS IS THAT THEY ARE GENERALLY PREPARED WITH THE BENEFIT OF HINDSIGHT. IN ADDITION, HYPOTHETICAL TRADING DOES NOT INVOLVE FINANCIAL RISK, AND NO HYPOTHETICAL TRADING RECORD CAN COMPLETELY ACCOUNT FOR THE IMPACT OF FINANCIAL RISK IN ACTUAL TRADING.
FOR EXAMPLE, THE ABILITY TO WITHSTAND LOSSES OR TO ADHERE TO A PARTICULAR TRADING PROGRAM IN SPITE OF TRADING LOSSES ARE MATERIAL POINTS WHICH CAN ALSO ADVERSELY AFFECT ACTUAL TRADING RESULTS. THERE ARE NUMEROUS OTHER FACTORS RELATED TO THE MARKETS IN GENERAL OR TO THE IMPLEMENTATION OF ANY SPECIFIC TRADING PROGRAM WHICH CANNOT BE FULLY ACCOUNTED FOR IN THE PREPARATION OF HYPOTHETICAL PERFORMANCE RESULTS AND ALL OF WHICH CAN ADVERSELY AFFECT ACTUAL TRADING RESULTS.
Since the SDCI was launched on December 18, 2009, there is only actual performance history of the SDCI from that date to the present. This data is available for periods prior to December 18, 2009. However, the components of the SDCI and the weighting of the components of the SDCI are established each month based on purely quantitative data that is not subject to revision based on other external factors. As a result, the table below reflects how the SDCI would have performed from December 31, 2004 through December 31, 2014 had it been in effect during such time period. The performance data does not reflect any reinvestment or distribution of profits, commission charges, management fees or other expenses that would have been incurred in connection with operating and managing a commodity pool designed to track the SDCI. Such fees and expenses would reduce the performance returns shown in the table below.
Hypothetical Performance Results* for the period
from December 31, 2004 through December 31, 2014
| Year | Ending Level* | Annual Return | ||||||
| 2004 | 592.26 | 23.58 | % | |||||
| 2005 | 781.94 | 32.03 | % | |||||
| 2006 | 1,115.82 | 42.70 | % | |||||
| 2007 | 1,518.71 | 36.11 | % | |||||
| 2008 | 1,175.77 | (22.58 | )% | |||||
| 2009 | 1,532.84 | 30.37 | % | |||||
| 2010 | 1,852.04 | 20.82 | % | |||||
| 2011 | 1,703.23 | (8.03 | )% | |||||
| 2012 | 1,726.55 | 1.37 | % | |||||
| 2013 | 1,678.73 | (2.77 | )% | |||||
| 2014 | 1,475.68 | (12.10 | )% | |||||
* The “base level” for the SDCI was set at 100 on January 2, 1991. The “Ending Level” represents the value of the components of the SDCI on the last trading day of each year and is used to illustrate the cumulative performance of the SDCI.
| 30 |
PAST PERFORMANCE IS NOT NECESSARILY INDICATIVE OF FUTURE RESULTS
SummerHaven Dynamic Commodity IndexSM (“SDCI”) Year-Over-Year
Hypothetical Total Returns (12/31/04-12/31/2014)*
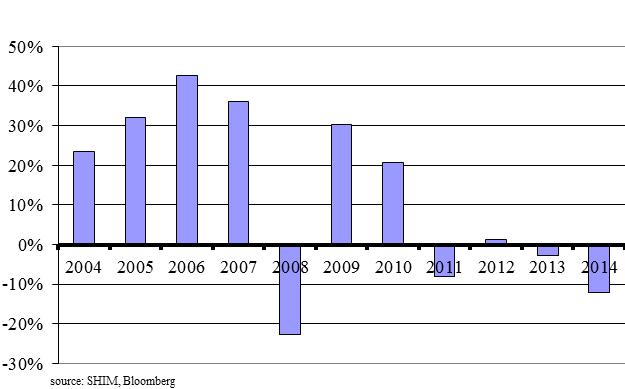
PAST PERFORMANCE IS NOT NECESSARILY INDICATIVE OF FUTURE RESULTS
The following table and chart compare the hypothetical total return of the SDCI in comparison with the actual total return of three major indexes for the period from December 31, 1997 to December 31, 2014.
| Hypothetical and Historical Results for the period from December 31, 1997 through December 31, 2014 | ||||||||||||||||
| BCOM TR | S&P GSCI TR | DB LCI OY TR | SDCI | |||||||||||||
| Total return | 36 | % | 6 | % | 232 | % | 556 | % | ||||||||
| Average annual return (total) | 3.97 | % | 4.52 | % | 9.97 | % | 13.79 | % | ||||||||
| Annualized volatility | 16.86 | % | 23.30 | % | 19.21 | % | 15.58 | % | ||||||||
| Annualized Sharpe ratio | 0.10 | 0.09 | 0.39 | 0.72 | ||||||||||||
Source: SHIM, Bloomberg
*PAST PERFORMANCE IS NOT NECESSARILY INDICATIVE OF FUTURE RESULTS
The table immediately above shows the performance of the SDCI from December 31, 1997 through December 31, 2014 in comparison with three traditional commodities indices: the S&P GSCI Commodity Index (GSCI®) Total Return, Bloomberg Commodity Index Total ReturnSM, and the Deutsche Bank Liquid Commodity Index-Optimum Yield Total ReturnTM. The S&P GSCI® Commodity Index Total Return is a composite index of commodity sector returns representing an unleveraged, long-only investment in commodity futures that is broadly diversified across the spectrum of commodities. The Bloomberg Commodity Index Total ReturnSM is currently composed of futures contracts on a diversified basket of commodities traded on U.S. exchanges. The Deutsche Bank Liquid Commodity Index-Optimum Yield Total ReturnTM is designed to reflect the performance of certain wheat, corn, light sweet crude oil, heating oil, gold and aluminum futures contracts plus the returns from investing in 3-month U.S. Treasury Bills. The data for the SDCI Total Return Index is derived by using the SDCI’s calculation methodology with historical prices for the futures contracts comprising the SDCI. The information about each of the indices comes from publicly-available material about such indices but is not designed to provide a thorough overview of the methodology of each index.
| 31 |
None of the indices has an investment objective identical to the SDCI. As a result, there are inherent limitations in comparing the performance of such indices against the SDCI. For more information about these indices and their methodologies, please refer to the material published by the sponsors of each such index which may be found on their websites. USCI is not responsible for any information found on such websites, and such information is not part of this annual report on Form 10-K.
In the table above, “Total Return” refers to the return of the relevant index from December 31, 1997 to December 31, 2014; “Annualized Volatility” is a measure of the amount of variation or fluctuation in the returns of the relevant index. Annualized Volatility is calculated by taking the monthly standard deviation of the relevant index’s return and multiplying it by the square root of 12; and “Annualized Sharpe Ratio” is a measure of the total return of each relevant index adjusted by the risk-free interest rate (the 90-Day U.S. Treasury Bill yield) and the volatility of each index. Many investors consider volatility to be a measure of risk, and lower volatility of investment returns is considered a positive investment attribute as opposed to higher volatility. Annualized Sharpe Ratio is a standard measure for investors to compare two different investments or indexes that have different levels of volatility. If two indexes have the same total return, but one has lower Annualized Volatility, then its Annualized Sharpe Ratio will be higher. The higher the Annualized Sharpe Ratio, the better the risk-adjusted performance. Annualized Sharpe Ratio is calculated by taking the average monthly total return of the relevant index and subtracting the then current yield on the 90-Day U.S. Treasury Bill. The annualized return of this series is then divided by the Annualized Volatility of this series, and this result is the Annualized Sharpe Ratio for the relevant index. A higher Sharpe Ratio is not a guarantee that one investment or index will in the future produce better risk adjustment total returns, but USCF believes it is a useful tool for investors to consider when making investment decisions.
| 32 |
Ten Year Comparison of Index Returns of the BCOM TR, S&P GSCI TR,
DB LCI OY TR, and the Hypothetical Returns of the SDCI
(12/31/04-12/31/14)
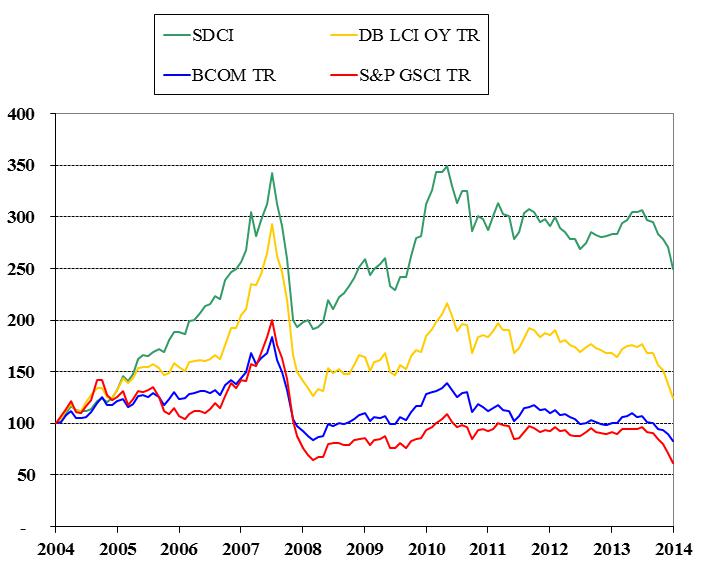
PAST PERFORMANCE IS NOT NECESSARILY INDICATIVE OF FUTURE RESULTS
| 33 |
The following chart compares the hypothetical total return of the SDCI in comparison with the actual total return of three major indexes over a five year period.
Five Year Comparison of Index Returns of the BCOM TR, S&P GSCI TR,
DB LCI OY TR, and the Hypothetical Returns of the SDCI
(12/31/08-12/31/14)
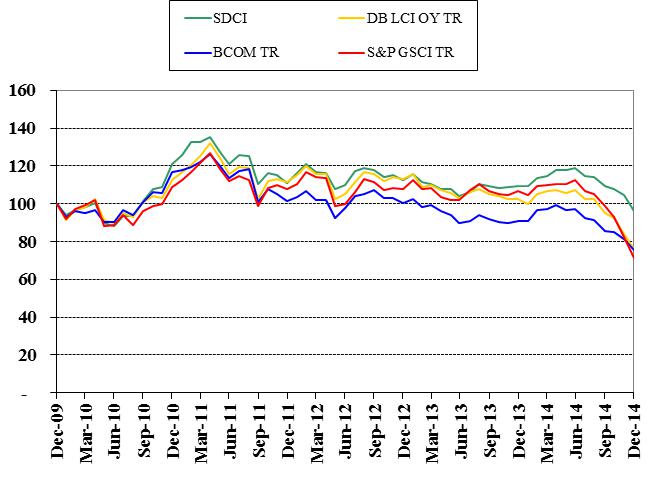
PAST PERFORMANCE IS NOT NECESSARILY INDICATIVE OF FUTURE RESULTS
SCI
The table and chart below show the hypothetical performance of the SCI from December 31, 2004 through December 31, 2014.
HYPOTHETICAL PERFORMANCE RESULTS HAVE MANY INHERENT LIMITATIONS, SOME OF WHICH ARE DESCRIBED BELOW. NO REPRESENTATION IS BEING MADE THAT CPER WILL OR IS LIKELY TO ACHIEVE PROFITS OR LOSSES SIMILAR TO THOSE SHOWN. IN FACT, THERE ARE FREQUENTLY SHARP DIFFERENCES BETWEEN HYPOTHETICAL PERFORMANCE RESULTS AND THE ACTUAL RESULTS ACHIEVED BY ANY PARTICULAR TRADING PROGRAM.
ONE OF THE LIMITATIONS OF HYPOTHETICAL PERFORMANCE RESULTS IS THAT THEY ARE GENERALLY PREPARED WITH THE BENEFIT OF HINDSIGHT. IN ADDITION, HYPOTHETICAL TRADING DOES NOT INVOLVE FINANCIAL RISK, AND NO HYPOTHETICAL TRADING RECORD CAN COMPLETELY ACCOUNT FOR THE IMPACT OF FINANCIAL RISK IN ACTUAL TRADING. FOR EXAMPLE, THE ABILITY TO WITHSTAND LOSSES OR TO ADHERE TO A PARTICULAR TRADING PROGRAM IN SPITE OF TRADING LOSSES ARE MATERIAL POINTS WHICH CAN ALSO ADVERSELY AFFECT ACTUAL TRADING RESULTS. THERE ARE NUMEROUS OTHER FACTORS RELATED TO THE MARKETS IN GENERAL OR TO THE IMPLEMENTATION OF ANY SPECIFIC TRADING PROGRAM WHICH CANNOT BE FULLY ACCOUNTED FOR IN THE PREPARATION OF HYPOTHETICAL PERFORMANCE RESULTS AND ALL OF WHICH CAN ADVERSELY AFFECT ACTUAL TRADING RESULTS.
| 34 |
Since the SCI was launched on November 4, 2010, there is no actual performance history of the SCI to present. However, the components of the SCI and the weighting of the components of the SCI are established each month based on purely quantitative data that is not subject to revisions based on other external factors. This data is available for periods prior to November 4, 2010. As a result, the table below reflects how the SCI would have performed from December 31, 2004 through December 31, 2014 had it been in effect during such time period. The performance data does not reflect any reinvestment or distribution profits, commission charges, management fees or other expenses that would have been incurred in connection with operating and managing a commodity pool designed to track the SCI. Such fees and expenses would reduce the performance returns shown in the table below.
Hypothetical Performance Results for the SCI for the period
from December 31, 2004 through December 31, 2014
| Year | Ending Level* | Annual Return | ||||||
| 2004 | 310.819 | 48.40 | % | |||||
| 2005 | 550.909 | 77.24 | % | |||||
| 2006 | 911.128 | 65.39 | % | |||||
| 2007 | 1,059.165 | 16.25 | % | |||||
| 2008 | 497.182 | (53.06 | )% | |||||
| 2009 | 1,153.122 | 131.93 | % | |||||
| 2010 | 1,491.949 | 29.38 | % | |||||
| 2011 | 1,164.510 | (21.95 | )% | |||||
| 2012 | 1,123.15 | 5.04 | % | |||||
| 2013 | 1,114.30 | (8.90 | )% | |||||
| 2014 | 937.33 | (15.88 | )% | |||||
| * | The “base level” for the SCI was set at 100 on January 2, 1991. The “Ending Level” represents the value of the components of the SCI on the last trading day of each year and is used to illustrate the cumulative performance of the SCI. |
PAST PERFORMANCE IS NOT NECESSARILY INDICATIVE OF FUTURE RESULTS
| 35 |
SCI Year-Over-Year
Hypothetical Total Returns (12/31/04-12/31/14)

source: SHIM, Bloomberg
PAST PERFORMANCE IS NOT NECESSARILY INDICATIVE OF FUTURE RESULTS
The following table compares the hypothetical total return of the SCI in comparison with the actual total return a major index and spot copper prices (less storage cost) from December 31, 1997 through December 31, 2014.
| Hypothetical and Historical Results for the period from December 31, 1997 through December 31, 2014 | ||||||||||||
| BCOM HG TR | Spot Copper (less storage) | SCI TR | ||||||||||
| Total return | 306 | % | 130 | % | 499 | % | ||||||
| Average annual return (total) | 15.63 | % | 11.61 | % | 18.65 | % | ||||||
| Annualized volatility | 27.43 | % | 26.42 | % | 26.79 | % | ||||||
| Annualized Sharpe ratio | 0.48 | 0.35 | 0.60 | |||||||||
Source: SHIM, Bloomberg
PAST PERFORMANCE IS NOT NECESSARILY INDICATIVE OF FUTURE RESULTS
The table above shows the performance of the SCI from December 31, 1997 through December 31, 2014 in comparison with a traditional commodity index and spot copper prices: the Bloomberg Copper Sub index Total ReturnSM and spot copper prices less warehouse storage rents. The Bloomberg Copper Sub index Total ReturnSM includes the contract in the Bloomberg Commodity Index Total Return that relates to a single commodity, copper (currently the Copper High Grade futures contract traded on the COMEX). The data for the SCI is derived by using the SCI’s calculation methodology with historical prices for the futures contracts comprising the SCI. The information about the index above comes from publicly-available material about such index but is not designed to provide a thorough overview of the methodology of such index. The index noted above does not have investment objectives identical to the SCI. As a result, there are inherent limitations in comparing such performance against the SCI. For more information about the index and its methodologies, please refer to the material published by the sponsor of the Bloomberg Copper Sub index Total Return which may be found on its website. USCF is not responsible for any information found on such website, and such information is not part of this annual report on Form 10-K.
| 36 |
In the table above, “Total Return” refers to the return of the relevant index from December 31, 1997 to December 31, 2014; “Annualized Volatility” is a measure of the amount of variation or fluctuation in the returns of the relevant index. Annualized Volatility is calculated by taking the monthly standard deviation of the relevant index’s return and multiplying it by the square root of 12; and “Annualized Sharpe Ratio” is a measure of the total return of each relevant index adjusted by the risk-free interest rate (the 90-Day U.S. Treasury Bill yield) and the volatility of each index. Many investors consider volatility to be a measure of risk, and lower volatility of investment returns is considered a positive investment attribute as opposed to higher volatility. Annualized Sharpe Ratio is a standard measure for investors to compare two different investments or indexes that have different levels of volatility. If two indexes have the same total return, but one has lower Annualized Volatility, then its Annualized Sharpe Ratio will be higher. The higher the Annualized Sharpe Ratio, the better the risk-adjusted performance. Annualized Sharpe Ratio is calculated by taking the average monthly total return of the relevant index and subtracting the then current yield on the 90-Day U.S. Treasury Bill. The annualized return of this series is then divided by the Annualized Volatility of this series, and this result is the Annualized Sharpe Ratio for the relevant index. A higher Sharpe Ratio is not a guarantee that one investment or index will in the future produce better risk adjustment total returns, but USCF believes it is a useful tool for investors to consider when making investment decisions.
| 37 |
The following chart compares the hypothetical total return of the SCI in comparison with the actual return of three major indexes over a ten year period.
10 Year Comparison of Index Returns of the S&P GSCI Copper TR,
BCOM HG TR, Spot Copper price, Spot Copper Price less Storage Cost, and
the Hypothetical Returns of the SCI (12/31/04-12/31/14)
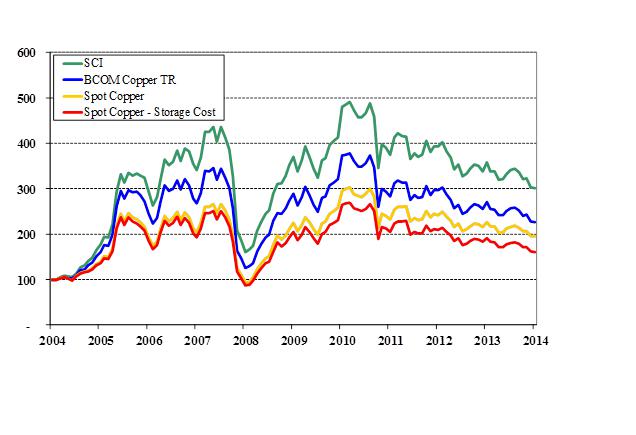
Source: SHIM, Bloomberg, LME
PAST PERFORMANCE IS NOT NECESSARILY INDICATIVE OF FUTURE RESULTS
| 38 |
The following chart compares the hypothetical total return of the SCI in comparison with the actual total return of two major indices and spot copper prices (less storage cost) over a five year period.
Five Year Comparison of Index Returns of the S&P GSCI Copper TR,
BCOM HG TR, Spot Copper price, Spot Copper Price less Storage
Cost, and the Hypothetical Returns of the SCI (12/31/09-12/31/14)
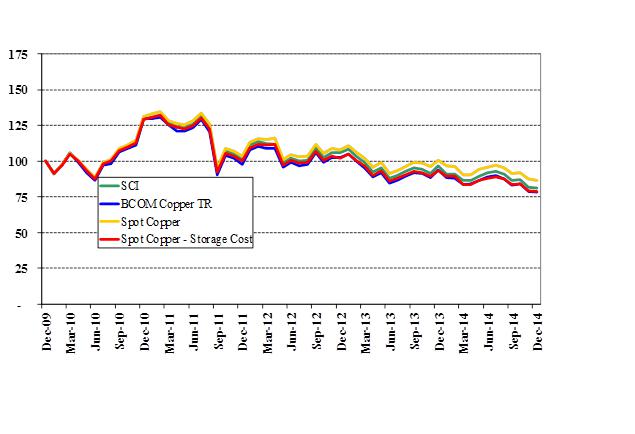
Source: SHIM, Bloomberg, LME
PAST PERFORMANCE IS NOT NECESSARILY INDICATIVE OF FUTURE RESULTS
| 39 |
SDAI
The table and chart below show the hypothetical performance of the SDAI from December 31, 2004 through December 31, 2014.
HYPOTHETICAL PERFORMANCE RESULTS HAVE MANY INHERENT LIMITATIONS, SOME OF WHICH ARE DESCRIBED BELOW. NO REPRESENTATION IS BEING MADE THAT USAG WILL OR IS LIKELY TO ACHIEVE PROFITS OR LOSSES SIMILAR TO THOSE SHOWN. IN FACT, THERE ARE FREQUENTLY SHARP DIFFERENCES BETWEEN HYPOTHETICAL PERFORMANCE RESULTS AND THE ACTUAL RESULTS ACHIEVED BY ANY PARTICULAR TRADING PROGRAM.
ONE OF THE LIMITATIONS OF HYPOTHETICAL PERFORMANCE RESULTS IS THAT THEY ARE GENERALLY PREPARED WITH THE BENEFIT OF HINDSIGHT. IN ADDITION, HYPOTHETICAL TRADING DOES NOT INVOLVE FINANCIAL RISK, AND NO HYPOTHETICAL TRADING RECORD CAN COMPLETELY ACCOUNT FOR THE IMPACT OF FINANCIAL RISK IN ACTUAL TRADING. FOR EXAMPLE, THE ABILITY TO WITHSTAND LOSSES OR TO ADHERE TO A PARTICULAR TRADING PROGRAM IN SPITE OF TRADING LOSSES ARE MATERIAL POINTS WHICH CAN ALSO ADVERSELY AFFECT ACTUAL TRADING RESULTS. THERE ARE NUMEROUS OTHER FACTORS RELATED TO THE MARKETS IN GENERAL OR TO THE IMPLEMENTATION OF ANY SPECIFIC TRADING PROGRAM WHICH CANNOT BE FULLY ACCOUNTED FOR IN THE PREPARATION OF HYPOTHETICAL PERFORMANCE RESULTS AND ALL OF WHICH CAN ADVERSELY AFFECT ACTUAL TRADING RESULTS.
Since the SDAI was launched on September 23, 2010, there is only actual performance history of the SDAI from that date to the present. However, the components of the SDAI and the weighting of the components of the SDAI are established each month based on purely quantitative data that is not subject to revisions based on other external factors. This data is available for periods prior to September 23, 2010. As a result, the table below reflects how the SDAI would have performed from December 31, 2004 through December 31, 2014 had it been in effect during such time period. The performance data does not reflect any reinvestment or distribution of profits, commission charges, management fees or other expenses that would have been incurred in connection with operating and managing a commodity pool designed to track the SDAI. Such fees and expenses would reduce the performance returns shown in the table below.
Hypothetical Performance Results for the period
from December 31, 2004 through December 31, 2014
| Year | Ending Level* | Annual Return | ||||||
| 2004 | 213.353 | 5.88 | % | |||||
| 2005 | 231.652 | 8.58 | % | |||||
| 2006 | 259.773 | 12.14 | % | |||||
| 2007 | 315.849 | 21.59 | % | |||||
| 2008 | 261.024 | (17.36 | )% | |||||
| 2009 | 282.237 | 8.13 | % | |||||
| 2010 | 377.898 | 33.89 | % | |||||
| 2011 | 348.780 | (7.71 | )% | |||||
| 2012 | 360.61 | 3.21 | % | |||||
| 2013 | 324.11 | (10.12 | )% | |||||
| 2014 | 329.880 | 1.78 | % | |||||
| * | The “base level” for the SDAI was set at 100 on January 2, 1991. The “Ending Level” represents the value of the components of the Index on the last trading day of each year and is used to illustrate the cumulative performance of the Index. |
PAST PERFORMANCE IS NOT NECESSARILY INDICATIVE OF FUTURE RESULTS
| 40 |
Summerhaven Dynamic Agriculture Index Year-Over-Year
Hypothetical Total Returns (12/31/04-12/31/14)
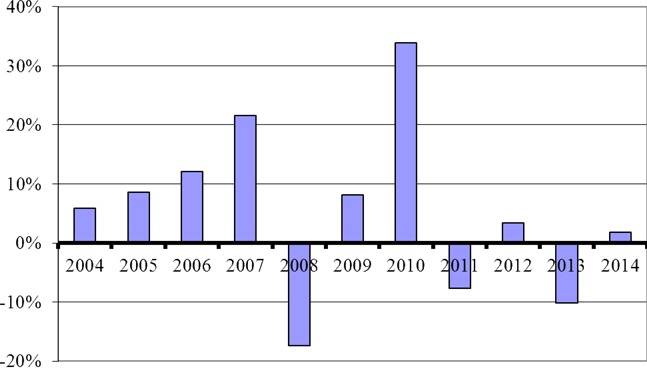
source: SHIM, Bloomberg
PAST PERFORMANCE IS NOT NECESSARILY INDICATIVE OF FUTURE RESULTS
The following table and chart compare the hypothetical total return of the SDAI in comparison with the actual total return of three major indexes from December 31, 1997 through December 31, 2014.
| Hypothetical and Historical Results for the period from December 31, 1997 through December 31, 2014 | ||||||||||||||||
| BCOM AG TR | S&P GSCI Ag TR | DB LCI OY Ag TR | SDAI | |||||||||||||
| Total return | (28 | )% | (57 | )% | (10 | )% | 53 | % | ||||||||
| Average annual return (total) | (0.39 | )% | (3.45 | )% | 0.43 | % | 3.40 | % | ||||||||
| Annualized volatility | 20.49 | % | 21.22 | % | 19.56 | % | 15.40 | % | ||||||||
| Annualized Sharpe ratio | (0.12 | ) | (0.25 | ) | (0.08 | ) | 0.08 | |||||||||
The table above shows the performance of the SDAI from December 31, 1997 through December 31, 2014 in comparison with three traditional agricultural commodities indices: the S&P GSCI® Agriculture Index Total Return, Bloomberg Agriculture Sub index Total ReturnSM, and the Deutsche Bank Liquid Commodity Index-Optimum Yield Agriculture Total ReturnTM. The S&P GSCI® Agriculture Index Total Return comprises the commodities: Wheat (Chicago and Kansas), Corn, Soybeans, Cotton, Sugar, Coffee, and Cocoa, and is part of a series of sub-indices representing components of the S&P GSCI. The Bloomberg Agriculture Sub index Total ReturnSM is currently composed of seven futures contracts on agricultural commodities traded on U.S. exchanges. The Deutsche Bank Liquid Commodity Index-Optimum Yield Agriculture Total ReturnTM is designed to reflect the performance of certain corn, wheat, soybean and sugar futures contracts plus the returns from investing in 3 month U.S. Treasury Bills. The data for the SDAI is derived by using the SDAI’s calculation methodology with historical prices for the futures contracts comprising the SDAI. The information about each of the indices comes from publicly-available material about such indices but is not designed to provide a thorough overview of the methodology of each index. None of the indices have investment objectives identical to the SDAI. As a result, there are inherent limitations in comparing the performance of such indices against the SDAI. For more information about these indices and their methodologies, please refer to the material published by the sponsors of each such index which may be found on their websites. USAG is not responsible for any information found on such website, and such information is not part of this annual report on Form 10-K.
| 41 |
In the table above, “Total Return” refers to the return of the relevant index from December 31, 1997 through December 31, 2014; “Annualized Volatility” is a measure of the amount of variation or fluctuation in the returns of the relevant index. Annualized Volatility is calculated by taking the monthly standard deviation of the relevant index’s return and multiplying it by the square root of 12; and “Annualized Sharpe Ratio” is a measure of the total return of each relevant index adjusted by the risk-free interest rate (the 90 Day U.S. Treasury Bill yield) and the volatility of each index. Many investors consider volatility to be a measure of risk, and lower volatility of investment returns is considered a positive investment attribute as opposed to higher volatility. Annualized Sharpe Ratio is a standard measure for investors to compare two different investments or indexes that have different levels of volatility. If two indexes have the same total return, but one has lower Annualized Volatility, then its Annualized Sharpe Ratio will be higher. The higher the Annualized Sharpe Ratio, the better the risk-adjusted performance. Annualized Sharpe Ratio is calculated by taking the average monthly total return of the relevant index and subtracting the then current yield on the 90 Day U.S. Treasury Bill. The annualized return of this series is then divided by the Annualized Volatility of this series, and this result is the Annualized Sharpe Ratio for the relevant index. A higher Sharpe Ratio is not a guarantee that one investment or index will in the future produce better risk adjustment total returns, but USCF believes it is a useful tool for investors to consider when making investment decisions.
10 Year Comparison of Index Returns of the BCOM AG TR, S&P GSCI Ag TR,
DB LCI OY Ag TR, and the Hypothetical Returns of the SDAI
(12/31/04-12/31/14)
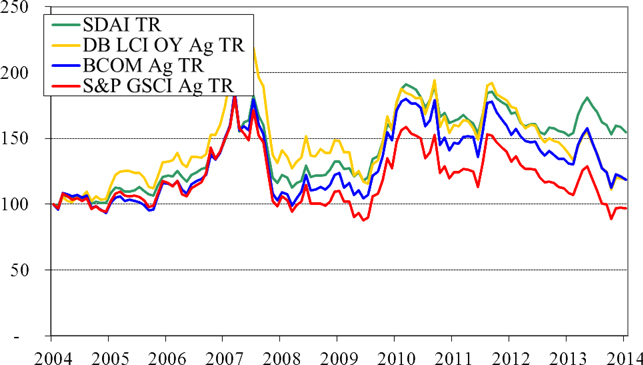
Source: SHIM, Bloomberg
PAST PERFORMANCE IS NOT NECESSARILY INDICATIVE OF FUTURE RESULTS
| 42 |
The following chart compares the hypothetical total return of the SDAI in comparison with the actual total return of three major indexes over a five year period.
Five Year Comparison of Index Returns of the BCOM AG TR, S&P GSCI Ag TR,
DB LCI OY Ag TR, and the Hypothetical Returns of the SDAI
(12/31/09-12/31/2014)
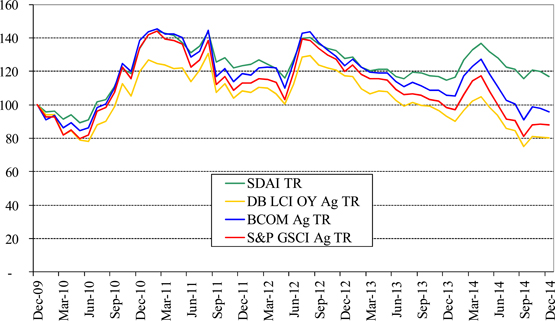
PAST PERFORMANCE IS NOT NECESSARILY INDICATIVE OF FUTURE RESULTS
| 43 |
SDMI
The table and chart below show the hypothetical performance of the SDMI from December 31, 2004 through December 31, 2014.
HYPOTHETICAL PERFORMANCE RESULTS HAVE MANY INHERENT LIMITATIONS, SOME OF WHICH ARE DESCRIBED BELOW. NO REPRESENTATION IS BEING MADE THAT USMI WILL OR IS LIKELY TO ACHIEVE PROFITS OR LOSSES SIMILAR TO THOSE SHOWN. IN FACT, THERE ARE FREQUENTLY SHARP DIFFERENCES BETWEEN HYPOTHETICAL PERFORMANCE RESULTS AND THE ACTUAL RESULTS ACHIEVED BY ANY PARTICULAR TRADING PROGRAM.
ONE OF THE LIMITATIONS OF HYPOTHETICAL PERFORMANCE RESULTS IS THAT THEY ARE GENERALLY PREPARED WITH THE BENEFIT OF HINDSIGHT. IN ADDITION, HYPOTHETICAL TRADING DOES NOT INVOLVE FINANCIAL RISK, AND NO HYPOTHETICAL TRADING RECORD CAN COMPLETELY ACCOUNT FOR THE IMPACT OF FINANCIAL RISK IN ACTUAL TRADING. FOR EXAMPLE, THE ABILITY TO WITHSTAND LOSSES OR TO ADHERE TO A PARTICULAR TRADING PROGRAM IN SPITE OF TRADING LOSSES ARE MATERIAL POINTS WHICH CAN ALSO ADVERSELY AFFECT ACTUAL TRADING RESULTS. THERE ARE NUMEROUS OTHER FACTORS RELATED TO THE MARKETS IN GENERAL OR TO THE IMPLEMENTATION OF ANY SPECIFIC TRADING PROGRAM WHICH CANNOT BE FULLY ACCOUNTED FOR IN THE PREPARATION OF HYPOTHETICAL PERFORMANCE RESULTS AND ALL OF WHICH CAN ADVERSELY AFFECT ACTUAL TRADING RESULTS.
Since the SDMI was launched on September 23, 2010, there is no actual performance history of the SDMI to present. However, the components of the SDMI and the weighting of the components of the SDMI are established each month based on purely quantitative data that is not subject to revisions based on other external factors. This data is available for periods prior to September 23, 2010. As a result, the table below reflects how the SDMI would have performed from December 31, 2004 through December 31, 2014 had it been in effect during such time period. The performance data does not reflect any reinvestment or distribution of profits, commission charges, management fees or other expenses that would have been incurred in connection with operating and managing a commodity pool designed to track the SDMI. Such fees and expenses would reduce the performance returns shown in the table below.
Hypothetical Performance Results for the period
from December 31, 2004 through December 31, 2014
| Year | Ending Level* | Annual Return | ||||||
| 2004 | 262.652 | 23.42 | % | |||||
| 2005 | 347.386 | 32.26 | % | |||||
| 2006 | 589.403 | 69.67 | % | |||||
| 2007 | 669.439 | 13.58 | % | |||||
| 2008 | 425.151 | (36.49 | )% | |||||
| 2009 | 735.929 | 73.10 | % | |||||
| 2010 | 975.580 | 32.56 | % | |||||
| 2011 | 823.695 | (15.57 | )% | |||||
| 2012 | 865.68 | 5.10 | % | |||||
| 2013 | 727.17 | (16.00 | )% | |||||
| 2014 | 665.580 | (8.47 | )% | |||||
| * | The “base level” for the SDMI was set at 100 on January 2, 1991. The “Ending Level” represents the value of the components of the Index on the last trading day of each year and is used to illustrate the cumulative performance of the Index. |
PAST PERFORMANCE IS NOT NECESSARILY INDICATIVE OF FUTURE RESULTS
| 44 |
Summerhaven Dynamic Metals Index Total Return Year-Over-Year
Hypothetical Total Returns (12/31/04-12/31/2014)
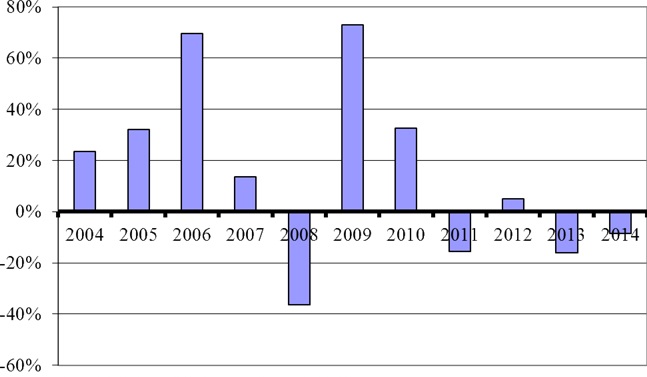
source: SHIM, Bloomberg
PAST PERFORMANCE IS NOT NECESSARILY INDICATIVE OF FUTURE RESULTS
The following table and chart compare the hypothetical total return of the SDMI in comparison with the actual total return of three major indexes between December 31, 1997 and December 31, 2014.
| Hypothetical and Historical Results for the period from December 31, 1997 through December 31, 2014 | ||||||||||||||||
| JJM | RICI Metals TR | DB LCI OY Industrial Metals TR | SDMI TR | |||||||||||||
| Total return | 124 | % | 283 | % | 195 | % | 428 | % | ||||||||
| Average annual return (total) | 9.88 | % | 11.50 | % | 11.96 | % | 13.97 | % | ||||||||
| Annualized volatility | 22.35 | % | 18.27 | % | 21.14 | % | 19.23 | % | ||||||||
| Annualized Sharpe ratio | 0.33 | 0.50 | 0.45 | 0.60 | ||||||||||||
PAST PERFORMANCE IS NOT NECESSARILY INDICATIVE OF FUTURE RESULTS
The table above shows the performance of the SDMI from December 31, 1997 through December 31, 2014 in comparison with three traditional metals indices: the Rogers International Commodity Index®–Metals Total Return, Bloomberg Industrial Metals Sub index Total ReturnSM (“JJM”), and the Deutsche Bank Liquid Commodity Index-Optimum Yield Industrial Metals Total ReturnTM. The Rogers International Commodity Index®–Metals Total Return is an index of ten metals commodity futures contracts, representing commodities consumed in the global economy and is a sub-index of the Rogers International Commodity Index. The Bloomberg Industrial Metals Sub index Total ReturnSM is currently composed of four futures contracts on industrial metals, three of which (aluminum, nickel and zinc) are traded on the LME and the other of which (copper) is traded on the COMEX division of the NYMEX. The Deutsche Bank Liquid Commodity Index-Optimum Yield Industrial Metals Total ReturnTM is designed to reflect the performance of certain futures contracts on aluminum, copper and zinc. The data for the SDMI Total Return Index is derived by using the SDMI’s calculation methodology with historical prices for the futures contracts comprising the SDMI. The information about each of the indices comes from publicly-available material about such indices but is not designed to provide a thorough overview of the methodology of each index. None of the indices have investment objectives identical to the SDMI. As a result, there are inherent limitations in comparing the performance of such indices against the SDMI. For more information about these indices and their methodologies, please refer to the material published by the sponsors of each such index which may be found on their websites. USMI is not responsible for any information found on such websites, and such information is not part of this annual report on Form 10-K.
| 45 |
In the table above, “Total Return” refers to the return of the relevant index from December 31, 1997 to December 31, 2014; “Annualized Volatility” is a measure of the amount of variation or fluctuation in the returns of the relevant index. Annualized Volatility is calculated by taking the monthly standard deviation of the relevant index’s return and multiplying it by the square root of 12; and “Annualized Sharpe Ratio” is a measure of the total return of each relevant index adjusted by the risk-free interest rate (the 90 Day U.S. Treasury Bill yield) and the volatility of each index. Many investors consider volatility to be a measure of risk, and lower volatility of investment returns is considered a positive investment attribute as opposed to higher volatility. Annualized Sharpe Ratio is a standard measure for investors to compare two different investments or indexes that have different levels of volatility. If two indexes have the same total return, but one has lower Annualized Volatility, then its Annualized Sharpe Ratio will be higher. The higher the Annualized Sharpe Ratio, the better the risk-adjusted performance. Annualized Sharpe Ratio is calculated by taking the average monthly total return of the relevant index and subtracting the then current yield on the 90 Day U.S. Treasury Bill. The annualized return of this series is then divided by the Annualized Volatility of this series, and this result is the Annualized Sharpe Ratio for the relevant index. A higher Sharpe Ratio is not a guarantee that one investment or index will in the future produce better risk adjustment total returns, but USCF believes it is a useful tool for investors to consider when making investment decisions.
| 46 |
10 Year Comparison of Index Returns of the JJM,
RICI Metals TR, DB LCI OY IM TR, and the Hypothetical Returns of the SDMI
(12/31/04-12/31/14)
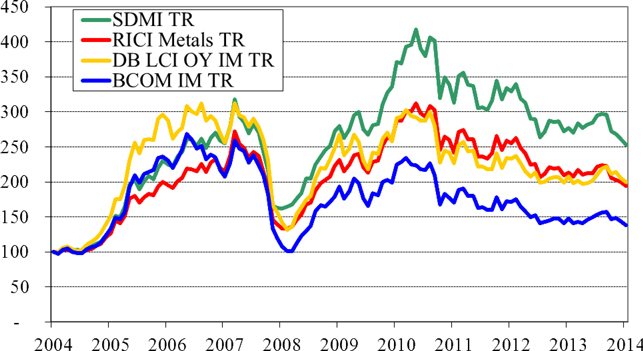
Source: SHIM, Bloomberg
PAST PERFORMANCE IS NOT NECESSARILY INDICATIVE OF FUTURE RESULTS
| 47 |
The following chart compares the hypothetical total return of the SDMI in comparison with the actual total return of three major indexes over a five year period.
Five Year Comparison of Index Returns of the JJM,
RICI Metals TR, DB LCI OY IM TR, and the Hypothetical Returns of the SDMI
(12/31/09-12/31/14)
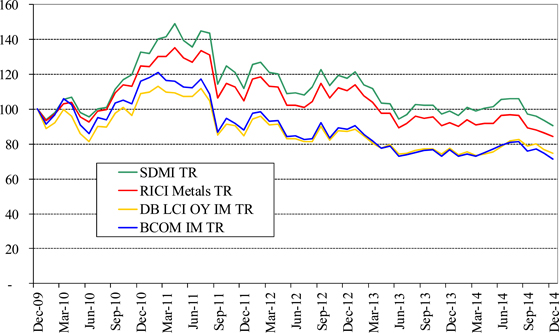
Source: SHIM, Bloomberg
PAST PERFORMANCE IS NOT NECESSARILY INDICATIVE OF FUTURE RESULTS
Critical Accounting Policies
Preparation of the financial statements and related disclosures in compliance with accounting principles generally accepted in the United States of America requires the application of appropriate accounting rules and guidance, as well as the use of estimates. The Trust’s application of these policies involves judgments and actual results may differ from the estimates used.
USCF has evaluated the nature and types of estimates that it makes in preparing the Trust’s financial statements and related disclosures and has determined that the valuation of Applicable Interests, which are not traded on a United States or internationally recognized futures exchange (such as forward contracts and over-the-counter contracts) involves a critical accounting policy. The values which are used by each Trust Series for its Futures Contracts are provided by its commodity broker who uses market prices when available, while over-the-counter contracts are valued based on the present value of estimated future cash flows that would be received from or paid to a third party in settlement of these derivative contracts prior to their delivery date and valued on a daily basis. In addition, each Trust Series estimates interest income on a daily basis using prevailing rates earned on its cash and cash equivalents. These estimates are adjusted to the actual amount received on a monthly basis and the difference, if any, is not considered material.
| 48 |
Liquidity and Capital Resources
None of the Trust Series has made, and does not anticipate making, use of borrowings or other lines of credit to meet its obligations. Each Trust Series has met, and it is anticipated that each Trust Series will continue to meet, its liquidity needs in the normal course of business from the proceeds of the sale of its investments, or from the Treasuries, cash and/or cash equivalents that it intends to hold at all times. Each Trust Series’ liquidity needs include: redeeming shares, providing margin deposits for its existing Futures Contracts or the purchase of additional Futures Contracts and posting collateral for its over-the-counter Applicable Interests, respectively, if applicable, and, except as noted below, payment of its expenses, summarized below under “Contractual Obligations.”
Each Trust Series currently generates cash primarily from: (i) the sale of Creation Baskets and (ii) income earned on Treasuries, cash and/or cash equivalents. Each Trust Series has allocated substantially all of its net assets to trading in Applicable Interests. Each Trust Series invests in Applicable Interests to the fullest extent possible without being leveraged or unable to satisfy its current or potential margin or collateral obligations with respect to its investments in Applicable Interests. A significant portion of each Trust Series’ NAV is held in Treasuries, cash and cash equivalents that are used as margin and as collateral for its trading in Applicable Interests. The balance of the assets is held in each Trust Series’ account at the Custodian and in Treasuries at the FCM. Income received from any investments in money market funds and Treasuries by a Trust Series will be paid to such Trust Series. During the year ended December 31, 2014, the Trust Series’ expenses exceeded the income earned or the cash earned from the sale of Creation Baskets and the redemption of Redemption Baskets. During the year ended December 31, 2013, the Trust Series’ expenses exceeded the income each Trust Series earned and the cash earned from the sale of Creation Baskets. During the years ended December 31, 2014 and 2013, each Trust Series used income and cash holdings to pay expenses, which could cause a decline in each Trust Series’ NAV over time. To the extent expenses exceed income, each Trust Series’ NAV will be negatively impacted.
Each Trust Series’ investments in Applicable Interests may be subject to periods of illiquidity because of market conditions, regulatory considerations and other reasons. For example, most commodity exchanges limit the fluctuations in futures contract prices during a single day by regulations referred to as “daily limits.” During a single day, no trades may be executed at prices beyond the daily limit. Once the price of a futures contract has increased or decreased by an amount equal to the daily limit, positions in the contracts can neither be taken nor liquidated unless the traders are willing to effect trades at or within the specified daily limit. Such market conditions could prevent a Trust Series from promptly liquidating its positions in Futures Contracts. During the year ended December 31, 2014, none of the Trust Series was forced to purchase or liquidate any of its positions while daily limits were in effect; however, no Trust Series can predict whether such an event may occur in the future.
Prior to the initial offering of each Trust Series, all payments with respect to each Trust Series’ expenses are paid by USCF. None of the Trust Series has an obligation or intention to refund such payments made by USCF. USCF is under no obligation to pay any Trust Series’ future expenses. Since the initial offering of shares, each Trust Series has been responsible for expenses relating to: (i) management fees, (ii) brokerage fees and commissions, (iii) ongoing registration expenses in connection with offers and sales of its shares subsequent to the initial offering, (iv) other expenses, including tax reporting costs, (v) the fees of the Trustee in connection with its services as Delaware trustee of the Trust, (vi) fees and expenses of the independent directors of USCF and (vii) other extraordinary expenses not in the ordinary course of business, while USCF has been responsible for expenses relating to the fees of the Trust Series’ Marketing Agent, Administrator and Custodian, the trading advisory and licensing fees of SummerHaven and offering expenses relating to the initial offering of shares of each Trust Series. If USCF and each Trust Series are unsuccessful in raising sufficient funds to cover these respective expenses or in locating any other source of funding, one or more of the Trust Series could terminate and investors may lose all or part of their investment.
Market Risk
Trading in Applicable Interests such as Futures Contracts involves each Trust Series entering into contractual commitments to purchase or sell specified amounts of commodities at a specified date in the future. The aggregate market value of the contracts will significantly exceed each Trust Series’ future cash requirements since each Trust Series intends to close out its open positions prior to settlement. As a result, each Trust Series is generally only subject to the risk of loss arising from the change in value of the contracts. Each Trust Series considers the “fair value” of its derivative instruments to be the unrealized gain or loss on the contracts. The market risk associated with each Trust Series’ commitments to purchase a specific commodity will be limited to the aggregate market value of the contracts held.
| 49 |
Each Trust Series’ exposure to market risk depends on a number of factors, including the markets for commodities, the volatility of interest rates and foreign exchange rates, the liquidity of the Applicable Interest markets and the relationships among the contracts held by each such Trust Series. The limited experience that each Trust Series has had in utilizing its model to trade in Applicable Interests in a manner intended to track the changes in the Applicable Index, as well as drastic market occurrences, could ultimately lead to the loss of all or substantially all of an investor’s capital.
Credit Risk
When a Trust Series enters into Futures Contracts and Other Related Investments, it is exposed to the credit risk that the counterparty will not be able to meet its obligations. The counterparty for the Futures Contracts traded on the Futures Exchanges is the clearinghouse associated with the particular exchange. In general, in addition to margin required to be posted by the clearinghouse in connection with cleared trades, clearinghouses are backed by their members who may be required to share in the financial burden resulting from the nonperformance of one of their members and, therefore, this additional member support should significantly reduce credit risk. Some foreign exchanges are not backed by their clearinghouse members but may be backed by a consortium of banks or other financial institutions. Unlike in the case of exchange-traded Futures Contracts, the counterparty to an over-the-counter contract is generally a single bank or other financial institution. As a result, there will be greater counterparty credit risk in over-the-counter transactions. There can be no assurance that any counterparty, clearinghouse, or their members or their financial backers will satisfy their obligations to a Trust Series in such circumstances.
USCF attempts to manage the credit risk of each Trust Series by following various trading limitations and policies. In particular, each Trust Series generally posts margin and/or holds liquid assets that are approximately equal to the market value of its obligations to counterparties under the Futures Contracts and Other Related Investments it holds. USCF has implemented procedures that include, but are not limited to, executing and clearing trades and entering into over-the-counter transactions only with creditworthy parties and/or requiring the posting of collateral or margin by such parties for the benefit of each Trust Series to limit its credit exposure. Newedge, each Trust Series’ commodity broker, or any other broker that may be retained by a Trust Series in the future, when acting as the Trust Series’ FCM in accepting orders to purchase or sell Futures Contracts on United States exchanges, is required by CFTC regulations to separately account for and segregate as belonging to a Trust Series, all assets of a Trust Series relating to domestic Futures Contracts trading. These FCMs are not allowed to commingle a Trust Series’ assets with their other assets. In addition, the CFTC requires commodity brokers to hold in a secure account a Trust Series’ assets related to foreign Futures Contracts trading. During the year ended December 31, 2014, the only foreign exchanges on which USCI made investments were the ICE Futures, which is a London based futures exchange, and the LME, which is a London based metal commodities exchange. Those Futures Contracts are denominated in U.S. dollars. During the year ended December 31, 2014, CPER did not make investments on any foreign exchanges. During the year ended December 31, 2014, the only foreign exchange on which USAG made investments was the ICE Futures. Those Futures Contracts are denominated in Canadian dollars and U.S. dollars. During the year ended December 31, 2014, the only foreign exchange on which USMI made investments was the LME. Those Futures Contracts are denominated in U.S. dollars.
If, in the future, a Trust Series purchases over-the-counter contracts, see “Item 7A. Quantitative and Qualitative Disclosures About Market Risk” in this annual report on Form 10-K for a discussion of over-the-counter contracts.
As of December 31, 2014, each of USCI, CPER, USAG and USMI held cash deposits and investments in Treasuries in the amount of $792,207,276, $3,066,521, $2,365,241 and $2,120,591, respectively, with the Custodian and FCM. Some or all of these amounts may be subject to loss should the Trust Series’ Custodian and/or FCM cease operations.
Off Balance Sheet Financing
As of December 31, 2014, neither the Trust nor any Trust Series had any loan guarantee, credit support or other off-balance sheet arrangement of any kind other than agreements entered into in the normal course of business, which may include indemnification provisions relating to certain risks that service providers undertake in performing services which are in the best interests of any Trust Series. While each Trust Series’ exposure under these indemnification provisions cannot be estimated, they are not expected to have a material impact on any Trust Series’ financial position.
| 50 |
European Sovereign Debt
None of the Trust Series had direct exposure to European sovereign debt as of December 31, 2014 or had direct exposure to European sovereign debt as of the filing of this annual report on Form 10-K.
Redemption Basket Obligation
In order to meet its investment objective and pay its contractual obligations described below, each Trust Series requires liquidity to redeem shares, which redemptions must be in blocks of 50,000 shares called “Redemption Baskets.” Each Trust Series has to date satisfied this obligation by paying from the cash or cash equivalents it holds or through the sale of its Treasuries in an amount proportionate to the number of shares being redeemed. From July 1, 2011 through December 31, 2014 (and continuing at least through May 1, 2015), Authorized Participants pay USCI $350 for each order placed to create one or more Creation Baskets or to redeem one or more Redemption Baskets; prior to July 1, 2011, Authorized Participants paid USCI $1,000 for each order placed to create one or more Creation Baskets or to redeem one or more Redemption Baskets. From May 1, 2012 through December 31, 2014 (and continuing at least through May 1, 2015), Authorized Participants pay each of CPER and USAG $350 for each order placed to create one or more Creation Baskets or to redeem one or more Redemption Baskets (for USMI, the period from May 1, 2012 through March 18, 2015); prior to May 1, 2012, Authorized Participants paid $1,000 for each order placed to create one or more Creation Baskets or to redeem one or more Redemption Baskets.
Contractual Obligations
The Trust’s (and each series thereunder) primary contractual obligations are with USCF and certain other service providers. USCF, in return for its services, is entitled to a management fee calculated as a fixed percentage of a Trust Series’ NAV. Effective May 1, 2014 and continuing through December 31, 2015, USCF has contractually agreed to lower the management fee to 0.80% per annum of average daily total net assets for USCI, 0.65% per annum of average daily total net assets for CPER, 0.65% per annum of average daily total net assets for USAG and 0.65% per annum of average daily total net assets for USMI. Effective as of May 29, 2012 through April 30, 2014, USCF voluntarily waived the management fee paid by each of CPER and USAG from 0.95% to 0.65% and 0.80% per annum of average daily total net assets, respectively. Effective as of May 30, 2012 through April 30, 2015, USCF voluntarily waived the management fee paid by USMI from 0.95% to 0.70% per annum of average daily total net assets. The reduced fee for USMI became operational as of June 19, 2012, the date USMI became listed on the NYSE Arca. Ongoing fees, costs and expenses of its operation for which a Trust Series is responsible include:
| • | brokerage and other fees and commissions incurred in connection with the trading activities of each Trust Series; |
| • | expenses incurred in connection with registering additional shares of each Trust Series or offering shares of each Trust Series after the time any shares of each Trust Series have begun trading on the NYSE Arca; |
| • | the routine expenses associated with distribution, including printing and mailing, of any monthly, annual and other reports to shareholders required by applicable U.S. federal and state regulatory authorities; |
| • | payment for routine services of the Trustee, legal counsel and independent accountants; |
| • | payment for fees associated with tax accounting and reporting, routine accounting, bookkeeping, whether performed by an outside service provider or by affiliates of USCF; |
| • | costs and expenses associated with investor relations and services; |
| • | the payment of any distributions related to redemption of shares; |
| • | payment of all federal, state, local or foreign taxes payable on the income, assets or operations of each Trust Series and the preparation of all tax returns related thereto; |
| • | fees and expenses of the independent directors of USCF; and |
| • | extraordinary expenses (including, but not limited to, indemnification of any person against liabilities and obligations to the extent permitted by law and required under the Trust Agreement and the bringing and defending of actions at law or in equity and otherwise engaging in the conduct of litigation and the incurring of legal expense and the settlement of claims and litigation). |
| 51 |
While USCF has agreed to pay registration fees to the SEC, FINRA, NYSE Arca or any other regulatory agency or exchange in connection with the initial offer and sale of the shares and the legal, printing, accounting and other expenses associated with such registration, each Trust Series is responsible for any registration fees and related expenses incurred in connection with any subsequent offer and sale of its shares after the initial offering of shares.
Each Trust Series pays its own brokerage and other transaction costs. Each Trust Series pays fees to FCMs in connection with its transactions in Futures Contracts. For the year ended December 31, 2014, FCM fees were approximately 0.09% of average daily total net assets for USCI, approximately 0.06% of average daily total net assets for CPER, approximately 0.08% of average daily total net assets for USAG and approximately 0.04% of average daily total net assets for USMI. In general, transaction costs on over-the-counter Applicable Interests and on Treasuries and other short-term securities are embedded in the purchase or sale price of the instrument being purchased or sold, and may not readily be estimated. USCF had voluntarily agreed to pay certain expenses normally borne by USCI to the extent that such expenses exceeded 0.15% (15 basis points) of USCI’s NAV, on an annualized basis, through March 31, 2011. As of March 31, 2011, the expense waiver was no longer in effect for USCI. USCF has voluntarily agreed to pay certain expenses normally borne by each of CPER, USAG and USMI to the extent that such expenses exceed 0.15% (15 basis points) of each of CPER’s, USAG’s and USMI’s NAV, on an annualized basis, through at least May 1, 2015. USCF has no obligation to continue such payments into subsequent periods. This voluntary expense waiver is in addition to those amounts USCF is contractually obligated to pay as described in Note 5.
The parties cannot anticipate the amount of payments that will be required under these arrangements for future periods, as each Trust Series’ NAVs and trading levels to meet its investment objective will not be known until a future date. These agreements are effective for a specific term agreed upon by the parties with an option to renew, or, in some cases, are in effect for the duration of a Trust Series’ existence. Either party may terminate these agreements earlier for certain reasons described in the agreements.
As of December 31, 2014, USCI’s portfolio consisted of 16,989 Futures Contracts traded on the Futures Exchanges, CPER’s portfolio consisted of 40 Futures Contracts traded on the COMEX, USAG’s portfolio consisted of 82 Futures Contracts traded on the Futures Exchanges and USMI’s portfolio consisted of 87 Futures Contracts traded on the Futures Exchanges. For a list of each of USCI’s, CPER’s, USAG’s and USMI’s current holdings, please see www.unitedstatescommodityfunds.com. See “Portfolio Holdings” for a complete list of Futures Contracts held by each of USCI, CPER, USAG and USMI during the year ended December 31, 2014.
| 52 |
Attestation Report of Registered Public Accounting Firm.
Report of Independent Registered Public Accounting Firm
Auditors’ Report on Internal Control over Financial Reporting
To the Sponsor of
United States Commodity Index Funds Trust
We have audited the internal control over financial reporting of the United States Commodity Index Funds Trust (the “Trust”), the United States Commodity Index Fund, the United States Copper Index Fund, the United States Agriculture Index Fund and the United States Metals Index Fund (collectively, the “Series”) as of December 31, 2014, based on criteria established in Internal Control — Integrated Framework issued by the Committee of Sponsoring Organizations of the Treadway Commission. The Trust’s and the Series’ management is responsible for maintaining effective internal control over financial reporting and for its assessment of the effectiveness of internal control over financial reporting, included in the accompanying Management’s Annual Report on Internal Control Over Financial Reporting. Our responsibility is to express an opinion on the Trust’s and the Series’ internal control over financial reporting based on our audit.
We conducted our audit in accordance with the standards of the Public Company Accounting Oversight Board (United States). Those standards require that we plan and perform the audit to obtain reasonable assurance about whether effective internal control over financial reporting was maintained in all material respects. Our audit of internal control over financial reporting included obtaining an understanding of internal control over financial reporting, assessing the risk that a material weakness exists, and testing and evaluating the design and operating effectiveness of internal control based on the assessed risk. Our audit also included performing such other procedures as we considered necessary in the circumstances. We believe that our audit provides a reasonable basis for our opinion.
An entity’s internal control over financial reporting is a process designed to provide reasonable assurance regarding the reliability of financial reporting and the preparation of financial statements for external purposes in accordance with accounting principles generally accepted in the United States of America. An entity’s internal control over financial reporting includes those policies and procedures that (1) pertain to the maintenance of records that, in reasonable detail, accurately and fairly reflect the transactions and dispositions of the assets of the entity; (2) provide reasonable assurance that transactions are recorded as necessary to permit preparation of financial statements in accordance with generally accepted accounting principles, and that receipts and expenditures of the entity are being made only in accordance with authorizations of management and directors of the entity; and (3) provide reasonable assurance regarding prevention or timely detection of unauthorized acquisition, use, or disposition of the entity’s assets that could have a material effect on the financial statements.
Because of its inherent limitations, internal control over financial reporting may not prevent or detect misstatements. Also, projections of any evaluation of the effectiveness to future periods are subject to the risk that the controls may become inadequate because of changes in conditions, or that the degree of compliance with the policies or procedures may deteriorate.
In our opinion, the Trust and the Series maintained, in all material respects, effective internal control over financial reporting as of December 31, 2014, based on the criteria established in Internal Control — Integrated Framework issued by the Committee of Sponsoring Organizations of the Treadway Commission.
We have also audited, in accordance with the standards of the Public Company Accounting Oversight Board (United States), the financial statements as of and for the year ended December 31, 2014, of the Trust and the Series and our report dated March 31, 2015 expressed an unqualified opinion on those financial statements.
/s/ Spicer Jeffries LLP
Greenwood Village, Colorado
March 31, 2015
| 53 |
Report of Independent Registered Public Accounting Firm
To the Sponsor of
United States Commodity Index Funds Trust
We have audited the accompanying statements of financial condition of the United States Commodity Index Funds Trust (the “Trust”), the United States Commodity Index Fund, the United States Copper Index Fund, the United States Agriculture Index Fund and the United States Metals Index Fund (collectively, the “Series”), in total and for the Series as of December 31, 2014 and 2013, including the schedule of investments as of December 31, 2014 and 2013, and the related statements of operations, changes in capital and changes in shares outstanding and cash flows for the years ended December 31, 2014, 2013 and 2012. These financial statements are the responsibility of the Trust’s management. Our responsibility is to express an opinion on these financial statements based on our audits.
We conducted our audits in accordance with standards of the Public Company Accounting Oversight Board (United States). Those standards require that we plan and perform the audits to obtain reasonable assurance about whether the financial statements are free of material misstatement. An audit includes examining, on a test basis, evidence supporting the amounts and disclosures in the financial statements. An audit also includes assessing the accounting principles used and significant estimates made by management, as well as evaluating the overall financial statement presentation. We believe that our audits provide a reasonable basis for our opinion.
In our opinion, the financial statements referred to above present fairly, in all material respects, the financial position of the United States Commodity Index Funds Trust, the United States Commodity Index Fund, the United States Copper Index Fund, the United States Agriculture Index Fund and the United States Metals Index Fund as of December 31, 2014 and 2013, and the results of their operations and their cash flows for the years ended December 31, 2014, 2013 and 2012, in conformity with accounting principles generally accepted in the United States of America.
We also have audited, in accordance with standards of the Public Company Accounting Oversight Board (United States), the Trust’s and the Series’ internal control over financial reporting as of December 31, 2014, based on criteria established in Internal Control — Integrated Framework issued by the Committee of Sponsoring Organizations of the Treadway Commission and our report dated March 16, 2015 expressed an unqualified opinion on the Trust’s and the Series’ internal control over financial reporting.
/s/ Spicer Jeffries LLP
Greenwood Village, Colorado
March 16, 2015
| 54 |
| Item 15. | Exhibits and Financial Statement Schedules. |
Listed below are the exhibits which are filed or furnished as part of this annual report on Form 10-K (according to the number assigned to them in Item 601 of Regulation S-K):
| Exhibit Number |
Description of Document | |
| 14.1* | Code of Ethics. | |
| 23.1* | Consent of Independent Registered Public Accounting Firm. | |
| 31.1* | Certification of Principal Executive Officer Pursuant to Rule 13a-14(a) under the Securities Exchange Act of 1934. | |
| 31.2* | Certification of Principal Financial Officer Pursuant to Rule 13a-14(a) under the Securities Exchange Act of 1934. | |
| 32.1* | Certification of Principal Executive Officer Pursuant to Section 906 of the Sarbanes-Oxley Act of 2002 (18 U. S. C. 1350). | |
| 32.2* | Certification of Principal Financial Officer Pursuant to Section 906 of the Sarbanes-Oxley Act of 2002 (18 U. S. C. 1350). | |
| 101.INS | XBRL Instance Document. | |
| 101.SCH | XBRL Taxonomy Extension Schema. | |
| 101.CAL | XBRL Taxonomy Extension Calculation Linkbase. | |
| 101.DEF | XBRL Taxonomy Extension Definition Linkbase. | |
| 101.LAB | XBRL Taxonomy Extension Label Linkbase. | |
| 101.PRE | XBRL Taxonomy Extension Presentation Linkbase. |
* Filed herewith
| 55 |
Pursuant to the requirements of Section 13 or 15(d) of the Securities Exchange Act of 1934, the registrant has duly caused this report to be signed on its behalf by the undersigned thereunto duly authorized.
| United States Commodity Index Funds Trust (Registrant) |
||
| By: United States Commodity Funds LLC, as Sponsor | ||
| By: | /s/ Nicholas D. Gerber | |
| Nicholas D. Gerber | ||
| President and Chief Executive Officer | ||
| (Principal executive officer) | ||
| Date: March 31, 2015 | ||
| By: | /s/ Howard Mah | |
| Howard Mah | ||
| Chief Financial Officer | ||
| (Principal financial and accounting officer) | ||
| Date: March 31, 2015 | ||
| 56 |
Pursuant to the requirements of the Securities Exchange Act of 1934, this Report has been signed below by the following persons on behalf of the Registrant in the capacities* and on the dates indicated.
| Signature | Title (Capacity) | Date | |||
| /s/ Nicholas D. Gerber | Chief Executive Officer of | March 31, 2015 | |||
| Nicholas D. Gerber | United States Commodity Funds, LLC | ||||
| (Principal Executive Officer) | |||||
| /s/ Howard Mah | Chief Financial Officer of | March 31, 2015 | |||
| Howard Mah | United States Commodity Funds, LLC | ||||
| (Principal Financial Officer) | |||||
| * | The Registrant is a trust and the persons are signing in their capacities as officers of United States Commodity Funds LLC, the Sponsor of the Registrant. |
| 57 |