Attached files
| file | filename |
|---|---|
| 8-K - 8-K - Northern Power Systems Corp. | d898568d8k.htm |
| EX-99.1 - EX-99.1 - Northern Power Systems Corp. | d898568dex991.htm |
 Troy
Patton – CEO
Ciel Caldwell -
CFO
31March2015
YE –
Q4 2014 Earnings Presentation
Northern Power Systems
Exhibit 99.2 |
 2
All
statements
and
other
information
contained
in
this
document
related
to
anticipated
future
events
or
results
constitute
forward-looking
statements.
Forward-looking
statements
often,
but
not
always,
are
identified
by
the
use
of
words
such
as
“seek”,
“anticipate”,
“believe”,
“plan”,
“estimate”,
“expect”,
“intend”,
“forecast”,
“project”,
“likely”,
“potential”,
“targeted”
and
“possible”
and
statements
that
an
event
or
result
“may”,
“will”,
“would”,
“should”,
“could”
or
“might”
occur
or
be
achieved
and
other
similar
expressions.
Forward-looking
statements
are
subject
to
known
and
unknown
business
and
economic
risks
and
uncertainties
and
other
factors
that
could
cause
actual
results
of
operations
to
differ
materially
from
those
expressed
or
implied
by
the
forward-looking
statements.
Forward-
looking
statements
are
based
on
estimates
and
opinions
of
management
at
the
date
the
statements
are
made.
Northern
Power
Systems
does
not
undertake
any
obligation
to
update
forward-looking
statements
even
if
circumstances
or
management’s
estimates
or
opinions
should
change,
except
as
required
by
law.
For
the
reasons
set
forth
above,
investors
should
not
place
undue
reliance
on
forward-looking
statements.
This
presentation
references
non-GAAP
financial
measures
with
the
required
reconciliation
referenced
in
the
table
captioned
“Non-GAAP
Reconciliations”
to
the
most
comparable
GAAP
financial
measures. |
 Presentation Organization and Call Details
3
Q&A Session:
Immediately following this call
Link from IR webpage at
http://www.ir.northernpower.com/events-
and-presentations.aspx
Troy Patton
President and CEO
Ciel Caldwell
CFO
Presentation Organization:
Q4 2014 business update
Q4 2014 operational and financial results
review
GAAP to Non-GAAP reconciliations
Basis of Presentation:
Q4 2014 = Northern Power Systems Corp.
YTD 2014 = Q1 Wind Power Holdings, Inc.
+ Q2 -
Q4 Northern Power Systems Corp.
2013 periods = Wind Power Holdings, Inc.
Hosted by: |
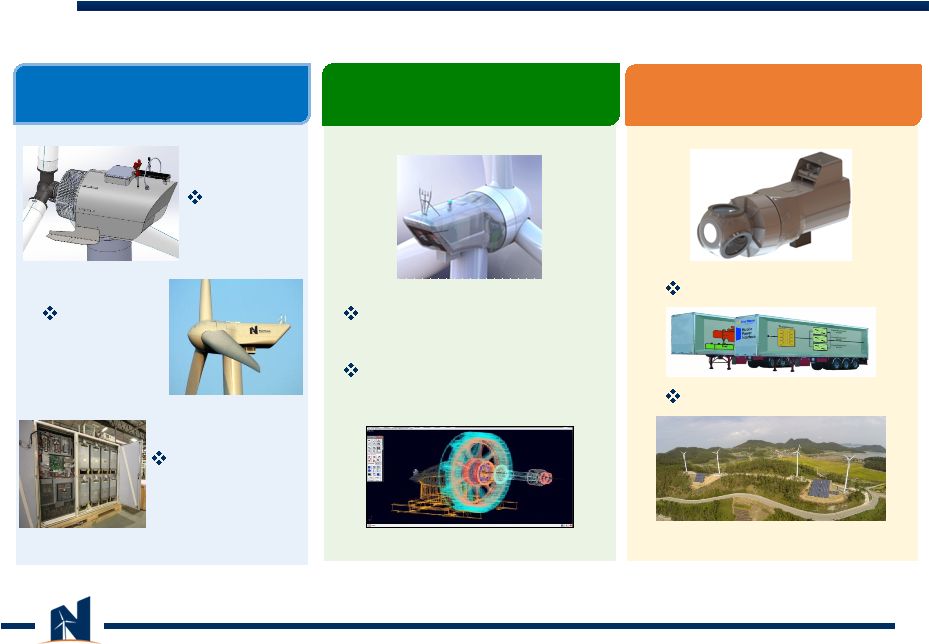 NPS’
Business Lines
Fully developed strategic
partnership approach
Successfully deployed in
China and Brazil to date
4
High-margin Development
Expansion of IP portfolio
NPS 2MW
turbine
platform
Converter and
Controls
Systems
NPS
60/100kW
Technology Licensing
Product Sales & Service
Technology Development |
 Business Expansion Trends
5
5
Non-GAAP EBITDA (Loss)/Income
Bridge to Net Loss |
 Q4
2014: Product Sales and Service Update Strong long-term European
demand Near term delays in Italy market as
customers awaited government decree
Strong demand in UK
Asia business development expanding
Follow-on installations complete
Private ownership of small generation
assets now permitted with KEPCO offering
20 year PPAs
US –
project pipeline growing
First installation complete in New York City
Sales hiring in new regions commenced
6
NPS 2MW
turbine
platform
Converter and
Controls
Systems
NPS
60/100kW
Product Sales & Service |
 Blade
Production Ramped third generation blade production with
US based producer in anticipation of Italian
market demand
Accelerated transition to dual sourcing
Two new suppliers being put in place to support
future sales
Located in prime shipping lanes
Strong track record
Impacted 4Q sales and will impact first half of
2015
$4 –
6 million revenue impact in 2015
7
Provides more stable and reliable foundation for future growth
|
 Q4
2014: Technology Licensing Update WEG 2.1MW turbines production has
achieved a steady 8 units per month
Healthy and increasing order backlog at
over 500MW
Revenue comes from WEG licensing and
commenced royalty payments
Actively exploring other regions
8
Fully developed strategic
partnership approach
Successfully deployed in
China and Brazil to date
Technology Licensing |
 Q4
2014: Technology Development WEG 3.3MW development progressing as
scheduled:
Expecting design completion in 2016
Backbone of planned development activity for
next twelve months
Laboratory R&D commenced on power
converter business applications
Initial full converter focus on distributed energy
markets and special applications
Inverter product optimized for energy storage
market, technology-agnostic
Anchor customer deployment in 2015, top and
bottom line impact in 2016
9
High-margin Development
Expansion of IP portfolio
Technology Development |
 YE
2014: Key Financial Metrics 10
FY 2014
Q4 2014
Revenue
•
$56M
•
174% y/y growth
•
$14M
•
56% y/y growth
Backlog
•
$41M
•
9% y/y reduction
Gross Margin
•
20%
•
Up from 6% in FY 2013
•
20%
•
PY at 8%
Net Loss
•
($7.9M)
•
44% y/y loss reduction
•
($.40/share)
•
($2.4M)
•
51% y/y loss reduction
•
($.11/share)
Non-GAAP
EBITDA Loss
•
($4.8M)
•
57% y/y loss reduction
•
($1.6M)
•
48% y/y loss reduction |
 Revenue and Gross Margin Trends
11
Q1 ‘13
Q2 ‘13
Q4 ‘13
Q2 ‘14
Q1 ‘14
Q3 ‘13
High-wind Regimes
Non-turbine Revenue
Low-wind Regimes
Q3 ‘14
Q4 ‘14 |
 YE
2014: Other Financial Metrics Cash Flow Statement
FY 2014
FY 2013
Cash used in operations
($14.8M)
•
Change in operating
assets / liab. ($9.1M)
($6.1M)
•
Change in operating
assets / liab. ($5.5M)
Cash (used in) provided by
investing activities
$0.2M
•
Cap-Ex ($1.0M)
•
Facility Sale $1.2M
($0.4M)
•
Cap-Ex ($0.4M)
Cash provided by financing
activities
$23.3M
$6.5M
12
Balance Sheet Metrics
December 31, 2014
December 31, 2013
Cash and cash equivalents
$13.1M
$4.5M
Debt
-
$12.5M
Working capital line
$4.0M*
-
* Comerica working capital line of credit available through 6/30/15 for up to
$6M |
 Full Year
Revenue for first half of 2015 lower than first half of 2014
Growth to resume in back half of year
Core business focus (utility through partnerships)
First Half
Second Half
Transitioning blade production
Reach full production
Delay in Italian market
Resume growth in Italy
Euro decrease
Continued negative impact
Gross margin pressure
Return to target gross margins of
low-mid 20s
13
2015 Expectations |
 14 |
 Non-GAAP Reconciliations Non-GAAP adjusted EBITDA
15
Q1
2013
Q2
2013
Q3
2013
Q4
2013
Q1
2014
Q2
2014
Q3
2014
Q4
2014
Net Loss
$(3,384)
$(2,753)
$(3,122)
$(4,869)
$(3,124)
$(2,064)
$(289)
$(2,417)
Interest
18
111
101
284
240
37
40
26
Taxes
26
3
(16)
22
14
15
412
454
Depreciation
227
310
234
214
178
391
194
179
Stock compensation
122
57
85
437
148
454
144
141
Fair value warrants
63
(724)
488
1
-
-
-
-
Non-cash
restructuring
50
(31)
4
47
-
-
-
-
Asset impairment
and loss on disposal
-
-
-
-
-
-
-
4
Loss on asset held
for sale
-
-
-
768
-
-
-
-
Adjusted EBITDA
$(2,878)
$(3,027)
$(2,226)
$(3,096)
$(2,544)
$(1,167)
$501
$(1,613)
(All amounts in thousands) |