Attached files
| file | filename |
|---|---|
| 8-K - 8-K - CBRE GROUP, INC. | d898630d8k.htm |
| EX-99.1 - EX-99.1 - CBRE GROUP, INC. | d898630dex991.htm |
Exhibit 99.2
|
|

CBRE GROUP, INC.
Acquisition of Global WorkPlace Solutions Business from Johnson Controls, Inc.
March 31, 2015
|
|
FORWARD-LOOKING STATEMENTS
This presentation contains statements that are forward looking within the meaning of the Private Securities Litigation Reform Act of 1995, including statements regarding the expected closing date of the acquisition, expected cost synergies and earnings accretion, expected tax benefits, expected financing sources for the transaction and the ability of the parties to successfully integrate the Global WorkPlace Solutions business with CBRE’s existing operations globally. These statements should be considered as estimates only and actual results may differ materially from these estimates. Factors that could cause actual results to differ include general business conditions and our ability to successfully execute our strategies, compete in and increase our share of material markets, a reduction by companies in outsourcing for their commercial real estate needs and our ability to acquire and integrate new businesses. Except to the extent required by applicable securities laws, we undertake no obligation to update or publicly revise any of the forward-looking statements that you may hear today. Please refer to our most recent annual report on Form 10-K, in particular, any discussion of risk factors or forward-looking statements, which is filed with the SEC and available at the SEC’s website (www.sec.gov), for a full discussion of the risks and other factors that may impact any forward-looking statements made.
2
|
|
CONFERENCE CALL PARTICIPANTS
Bob Sulentic
PRESIDENT AND
CHIEF EXECUTIVE OFFICER
Bill Concannon
CHIEF EXECUTIVE OFFICER, GLOBAL CORPORATE SERVICES
Jim Groch
CHIEF FINANCIAL OFFICER AND GLOBAL DIRECTOR OF CORPORATE DEVELOPMENT
Steve Iaco
INVESTOR RELATIONS AND CORPORATE COMMUNICATIONS
3
|
|
CBRE TO ACQUIRE GWS BUSINESS FROM JCI
CBRE has entered into a definitive agreement to acquire the Global WorkPlace Solutions (GWS) business from Johnson Controls, Inc. (JCI) for $1.475 billion in cash
GWS is a leading provider of Integrated Facilities Management solutions GWS will become part of our occupier outsourcing, or Global Corporate Services (GCS), business Acquisition fits well with our strategy:
Having a full suite of services – delivered by top talent – in key markets globally
Growing relationships with leading occupiers and creating outcomes for them that are hard for others to replicate
Maintaining a balanced business
Prudently managing our balance sheet
M&A capabilities continue to be a powerful differentiator for CBRE 4
|
|
TRANSACTION OVERVIEW
Transaction expected to be materially accretive to CBRE adjusted earnings per share in 2016
Anticipate to fund the transaction through cash and proceeds from incurrence of debt Expect to close in late Q3 or early Q4 2015 Purchase price of $1.475 billion, or $1.3 billion net of the present value of estimated tax benefits
Expected cost synergies of $35 million
Approximately 8x multiple1 of net purchase price to GWS 2014 calendar year adjusted EBITDA with run-rate synergies
See slide 15 for footnotes.
5
|
|
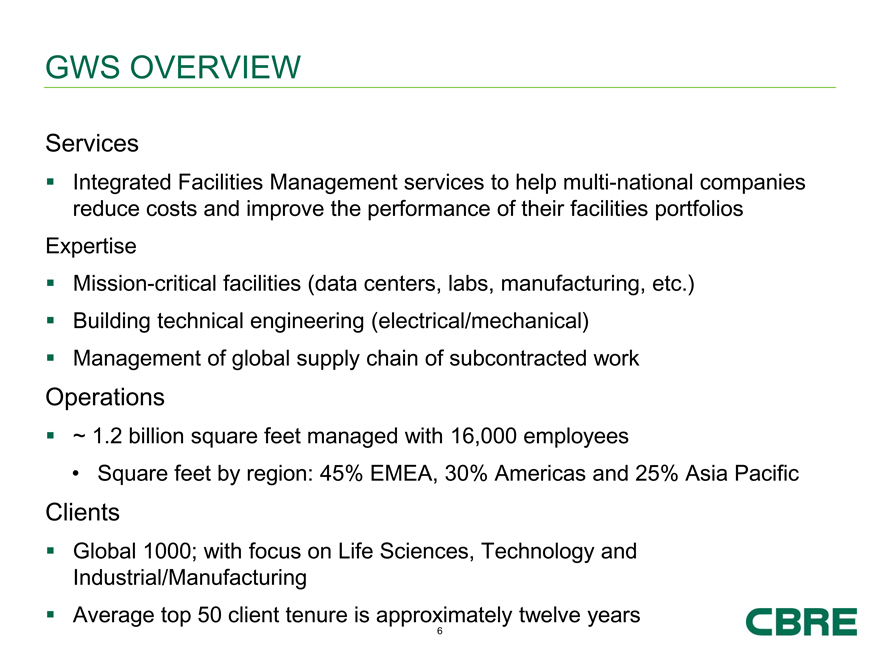
GWS OVERVIEW
Services
Integrated Facilities Management services to help multi-national companies reduce costs and improve the performance of their facilities portfolios
Expertise
Mission-critical facilities (data centers, labs, manufacturing, etc.) Building technical engineering (electrical/mechanical) Management of global supply chain of subcontracted work
Operations
~ 1.2 billion square feet managed with 16,000 employees
Square feet by region: 45% EMEA, 30% Americas and 25% Asia Pacific
Clients
Global 1000; with focus on Life Sciences, Technology and Industrial/Manufacturing Average top 50 client tenure is approximately twelve years
6
|
|
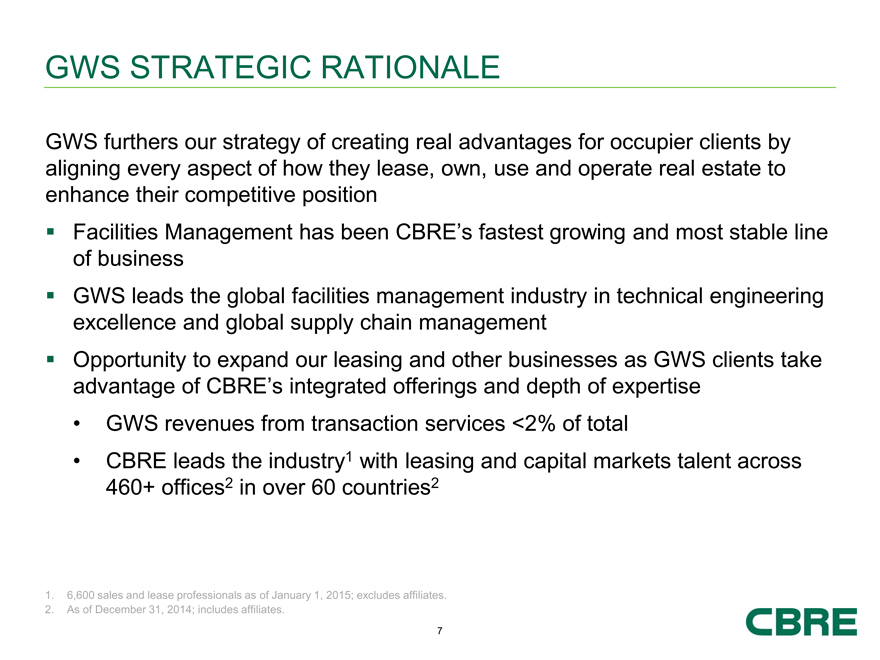
GWS STRATEGIC RATIONALE
GWS furthers our strategy of creating real advantages for occupier clients by aligning every aspect of how they lease, own, use and operate real estate to enhance their competitive position
Facilities Management has been CBRE’s fastest growing and most stable line of business GWS leads the global facilities management industry in technical engineering excellence and global supply chain management Opportunity to expand our leasing and other businesses as GWS clients take advantage of CBRE’s integrated offerings and depth of expertise
GWS revenues from transaction services <2% of total
CBRE leads the industry1 with leasing and capital markets talent across 460+ offices2 in over 60 countries2
1. 6,600 sales and lease professionals as of January 1, 2015; excludes affiliates.
2. As of December 31, 2014; includes affiliates.
7
|
|
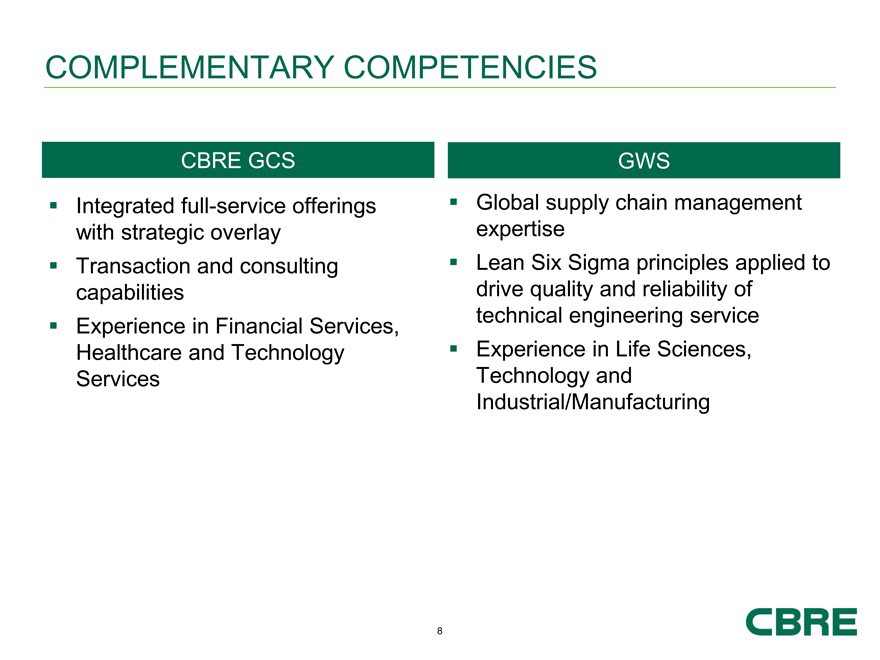
COMPLEMENTARY COMPETENCIES
CBRE GCS
Integrated full-service offerings with strategic overlay Transaction and consulting capabilities Experience in Financial Services, Healthcare and Technology Services
GWS
Global supply chain management expertise Lean Six Sigma principles applied to drive quality and reliability of technical engineering service Experience in Life Sciences, Technology and Industrial/Manufacturing
8
|
|
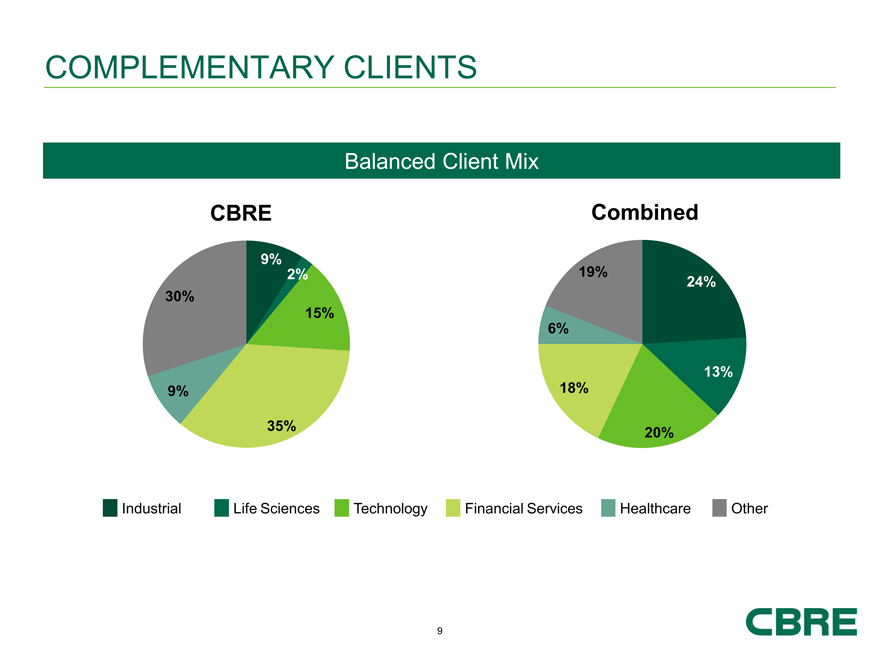
COMPLEMENTARY CLIENTS
Balanced Client Mix
CBRE
9% 2% 30% 15%
9%
35%
Combined
19%
24%
6%
13% 18%
20%
Industrial Life Sciences Technology Financial Services Healthcare Other
|
|
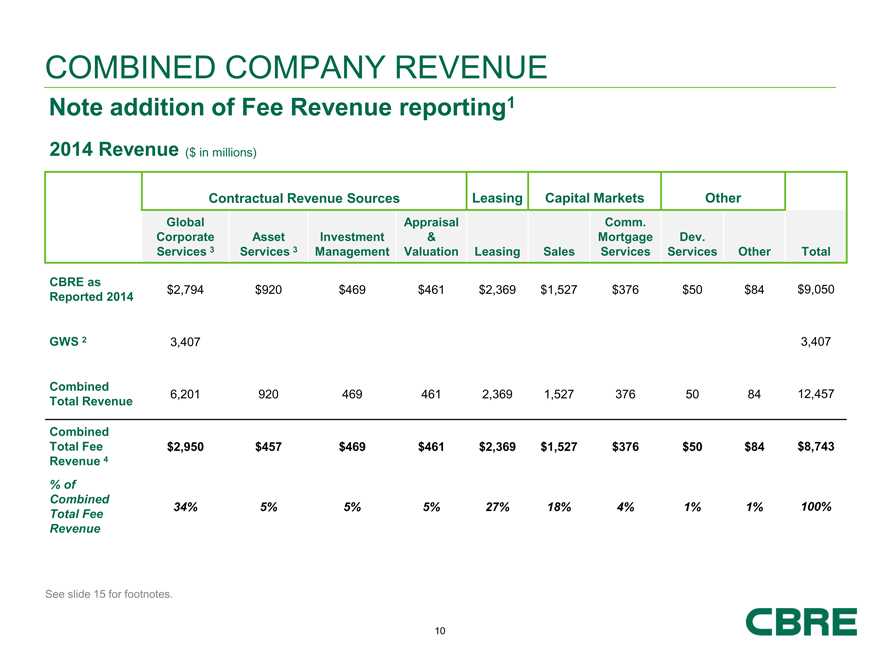
COMBINED COMPANY REVENUE
Note addition of Fee Revenue reporting1
2014 Revenue ($ in millions)
Contractual Revenue Sources Leasing Capital Markets Other
Global Appraisal Comm.
Corporate Asset Investment & Mortgage Dev.
Services 3 Services 3 Management Valuation Leasing Sales Services Services Other Total
CBRE as
Reported 2014 $2,794 $920 $469 $461 $2,369 $1,527 $376 $50 $84 $9,050
GWS 2 3,407 3,407
Combined
Total Revenue 6,201 920 469 461 2,369 1,527 376 50 84 12,457
Combined
Total Fee $2,950 $457 $469 $461 $2,369 $1,527 $376 $50 $84 $8,743
Revenue 4
% of
Combined
Total Fee 34% 5% 5% 5% 27% 18% 4% 1% 1% 100%
Revenue
See slide 15 for footnotes.
10
|
|
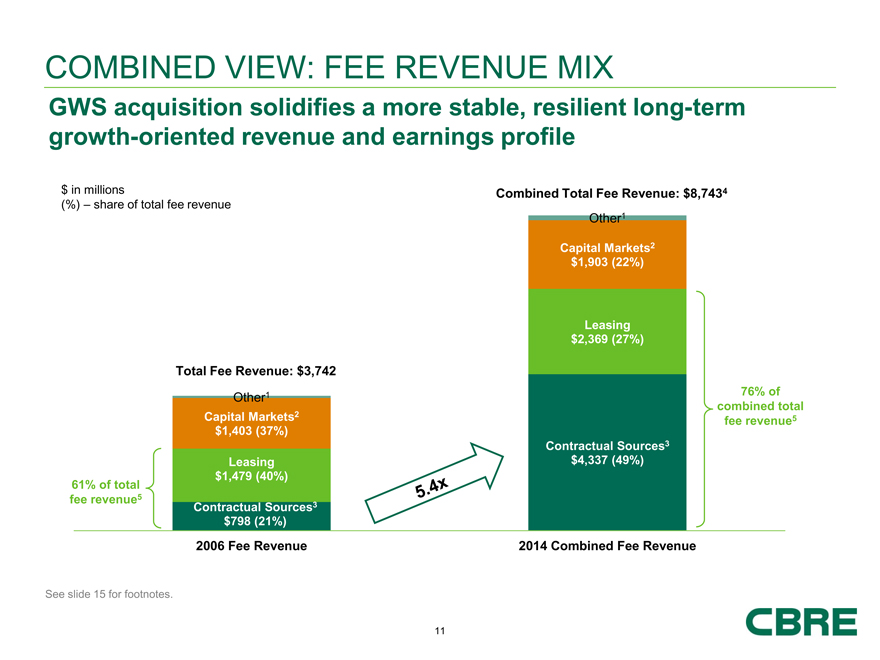
COMBINED VIEW: FEE REVENUE MIX
GWS acquisition solidifies a more stable, resilient long-term growth-oriented revenue and earnings profile
$ in millions
(%) – share of total fee revenue
Total Fee Revenue: $3,742
Other1
Capital Markets2 $1,403 (37%)
Leasing $1,479 (40%) 61% of total fee revenue5 3 Contractual Sources $798 (21%)
2006 Fee Revenue
See slide 15 for footnotes.
Combined Total Fee Revenue: $8,7434
Other1
Capital Markets2 $1,903 (22%)
Leasing $2,369 (27%)
76% of combined total fee revenue5
Contractual Sources3 $4,337 (49%)
2014 Combined Fee Revenue
11
|
|
GWS SYNERGIES
Expected to produce run-rate cost synergies of $35 million
Realization of run-rate synergies expected over eight to ten quarters due to required separation of services from JCI
Synergies expected from two key areas:
Combining geographic account management and operational models
Combining back office operations
12
|
|
KEY TAKEAWAYS
GWS Acquisition
GWS is a unique opportunity in the industry:
Big clients, 5 year contracts, 12 year average relationships
Scale, expertise and leadership in 50 countries
Fits a focused and highly defensible business strategy
Significantly augments a business line that is already our fastest growing and
most stable
Leverages our full-service platform to drive transaction revenues
Business mix is geared for greater stability and long-term secular growth
Transaction is expected to be materially accretive to CBRE adjusted earnings
per share in 2016
13
|
|
APPENDIX
14
|
|
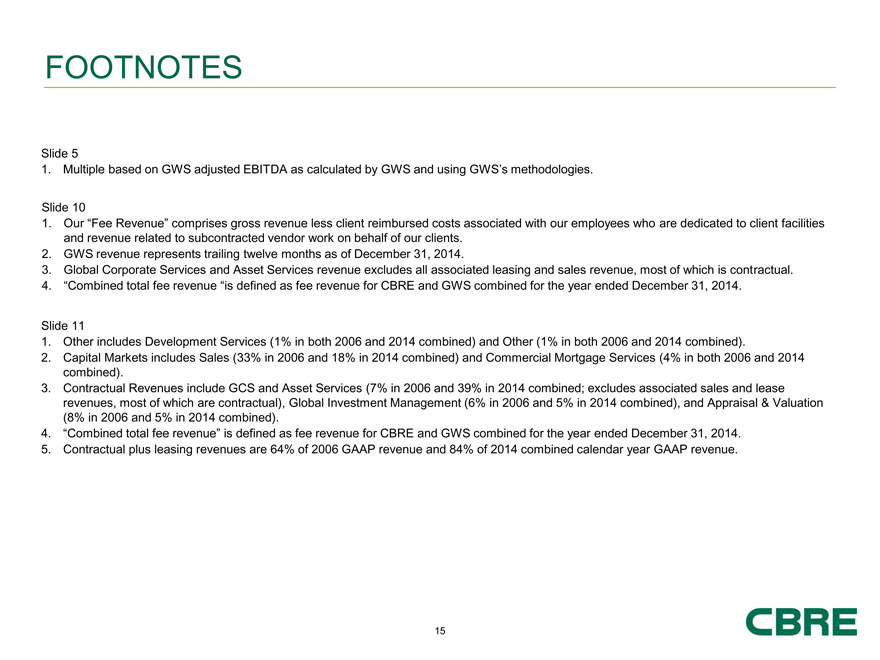
FOOTNOTES
Slide 5
1. Multiple based on GWS adjusted EBITDA as calculated by GWS and using GWS’s methodologies.
Slide 10
1. Our “Fee Revenue” comprises gross revenue less client reimbursed costs associated with our employees who are dedicated to client facilities and revenue related to subcontracted vendor work on behalf of our clients.
2. GWS revenue represents trailing twelve months as of December 31, 2014.
3. Global Corporate Services and Asset Services revenue excludes all associated leasing and sales revenue, most of which is contractual.
4. “Combined total fee revenue “is defined as fee revenue for CBRE and GWS combined for the year ended December 31, 2014.
Slide 11
1. Other includes Development Services (1% in both 2006 and 2014 combined) and Other (1% in both 2006 and 2014 combined).
2. Capital Markets includes Sales (33% in 2006 and 18% in 2014 combined) and Commercial Mortgage Services (4% in both 2006 and 2014 combined).
3. Contractual Revenues include GCS and Asset Services (7% in 2006 and 39% in 2014 combined; excludes associated sales and lease revenues, most of which are contractual), Global Investment Management (6% in 2006 and 5% in 2014 combined), and Appraisal & Valuation (8% in 2006 and 5% in 2014 combined).
4. “Combined total fee revenue” is defined as fee revenue for CBRE and GWS combined for the year ended December 31, 2014.
5. Contractual plus leasing revenues are 64% of 2006 GAAP revenue and 84% of 2014 combined calendar year GAAP revenue.
15