Attached files
| file | filename |
|---|---|
| EXCEL - IDEA: XBRL DOCUMENT - GI DYNAMICS, INC. | Financial_Report.xls |
| EX-32.2 - EX-32.2 - GI DYNAMICS, INC. | d854311dex322.htm |
| EX-23.1 - EX-23.1 - GI DYNAMICS, INC. | d854311dex231.htm |
| EX-31.2 - EX-31.2 - GI DYNAMICS, INC. | d854311dex312.htm |
| EX-32.1 - EX-32.1 - GI DYNAMICS, INC. | d854311dex321.htm |
| EX-10.1 - EX-10.1 - GI DYNAMICS, INC. | d854311dex101.htm |
| EX-31.1 - EX-31.1 - GI DYNAMICS, INC. | d854311dex311.htm |
Table of Contents
UNITED STATES
SECURITIES AND EXCHANGE COMMISSION
Washington, D.C. 20549
FORM 10-K
(Mark One)
| þ | ANNUAL REPORT PURSUANT TO SECTION 13 OR 15(d) OF THE |
| SECURITIES EXCHANGE ACT OF 1934 |
For the fiscal year ended December 31, 2014
OR
| ¨ | TRANSITION REPORT PURSUANT TO SECTION 13 OR 15(d) OF THE |
| SECURITIES EXCHANGE ACT OF 1934 |
For the transition period from to
Commission file number: 000-55195
GI DYNAMICS, INC.
(Exact name of registrant as specified in its charter)
| Delaware | 84-1621425 | |
| (State or other jurisdiction of | (I.R.S. Employer | |
| incorporation or organization) | Identification Number) | |
| 25 Hartwell Avenue | ||
| Lexington, Massachusetts | 02421 | |
| (Address of Principal Executive Offices) | (Zip Code) | |
(781) 357-3300
(Registrant’s telephone number, including area code)
Indicate by check mark whether the registrant: (1) has filed all reports required to be filed by Section 13 or 15(d) of the Securities Exchange Act of 1934 during the preceding 12 months (or for such shorter period that the registrant was required to file such reports), and (2) has been subject to such filing requirements for the past 90 days: Yes x No ¨
Indicate by check mark whether the registrant has submitted electronically and posted on its corporate Web site, if any, every Interactive Data File required to be submitted and posted pursuant to Rule 405 of Regulation S-T during the preceding 12 months (or for such shorter period that the registrant was required to submit and post such files): Yes x No ¨
Indicate by check mark whether the registrant is a large accelerated filer, an accelerated filer, a non-accelerated filer, or a smaller reporting company. See the definitions of “large accelerated filer,” “accelerated filer” and “smaller reporting company” in Rule 12b-2 of the Exchange Act. (Check one):
| Large accelerated filer ¨ | Accelerated filer ¨ | Non-accelerated filer x | Smaller reporting company ¨ | |||
| (Do not check if a smaller reporting company) |
Indicate by check mark whether the registrant is a shell company (as defined in Rule 12b-2 of the Exchange Act): ¨ Yes x No
The aggregate market value of the registrant’s common stock, in the form of CHESS Depositary Interests, or CDIs, held by non-affiliates of the registrant (without admitting that any person whose shares are not included in such calculation is an affiliate), computed by reference to the price at which the CDIs were last sold on June 30, 2014, the last business day of the registrant’s most recently completed second fiscal quarter, as reported on the Australian Securities Exchange, was $201,168,735 (A$213,554,920).
As of March 13, 2015 there were 94,846,733 shares of common stock outstanding.
DOCUMENTS INCORPORATED BY REFERENCE:
Portions of the definitive proxy statement for our 2015 Annual Meeting of Stockholders are incorporated by reference into Part III of this report.
Table of Contents
IMPLICATIONS OF BEING AN EMERGING GROWTH COMPANY
As a company with less than $1.0 billion in revenue during our most recently completed fiscal year, we qualify as an “emerging growth company” as defined in Section 2(a) of the Securities Act of 1933, as amended, which we refer to as the Securities Act, as modified by the Jumpstart Our Business Startups Act of 2012, or the JOBS Act. As an emerging growth company, we may take advantage of specified reduced disclosure and other requirements that are otherwise applicable, in general, to public companies that are not emerging growth companies. These provisions include:
| • | Reduced disclosure about our executive compensation arrangements; |
| • | No non-binding shareholder advisory votes on executive compensation or golden parachute arrangements; and |
| • | Exemption from the auditor attestation requirement in the assessment of our internal control over financial reporting. |
We may take advantage of these exemptions for up to five years or such earlier time that we are no longer an emerging growth company. We would cease to be an emerging growth company if we have more than $1.0 billion in annual revenues as of the end of a fiscal year, if we are deemed to be a large-accelerated filer under the rules of the Securities and Exchange Commission, or the SEC, or if we issue more than $1.0 billion of non-convertible debt over a three-year-period.
The JOBS Act permits an emerging growth company to take advantage of an extended transition period to comply with new or revised accounting standards applicable to public companies. We are choosing to “opt out” of this provision.
Table of Contents
NOTE REGARDING FORWARD-LOOKING STATEMENTS
This Annual Report on Form 10-K contains forward-looking statements concerning our business, operations, financial performance and condition as well as our plans, objectives and expectations for our business, operations and financial performance and condition. Any statements contained in this Annual Report on Form 10-K that are not of historical facts may be deemed to be forward-looking statements. The forward-looking statements are contained principally in the section entitled “Management’s Discussion and Analysis of Financial Condition and Results of Operations.” Forward-looking statements include, but are not limited to, statements about:
| • | our expectations with respect to regulatory submissions and approvals; |
| • | our expectations with respect to our clinical trials, including enrollment in our clinical trials; |
| • | our expectations with respect to our intellectual property position; |
| • | our ability to commercialize our products; |
| • | our ability to develop and commercialize new products; |
| • | our expectation with regard to inventory and; |
| • | our estimates regarding our capital requirements and our need for additional financing. |
In some cases, you can identify forward-looking statements by terms such as “may,” “will,” “should,” “could,” “would,” “expects,” “plans,” “anticipates,” “believes,” “estimates,” “projects,” “predicts,” “potential,” “aims,” “assumes,” “goal,” “intends,” “objective,” “potential,” “positioned,” “target,” “continue,” “seek” and similar expressions intended to identify forward-looking statements.
These forward-looking statements are based on current expectations, estimates, forecasts and projections about our business and the industry in which we operate and our management’s beliefs and assumptions. These forward-looking statements are not guarantees of future performance or development and involve known and unknown risks, uncertainties and other factors that are in some cases beyond our control. As a result, any or all of our forward-looking statements in this Annual Report on Form 10-K may later become inaccurate. We may not actually achieve the plans, intentions or expectations disclosed in our forward-looking statements, and actual results or events could differ materially from the plans, intentions and expectations disclosed in the forward-looking statements we make. We have included important factors in the cautionary statements included in this Annual Report on Form 10-K, particularly in the “Risk Factors” section, that could cause actual results or events to differ materially from the forward-looking statements that we make.
You are urged to consider these factors carefully in evaluating the forward-looking statements and are cautioned not to place undue reliance on the forward-looking statements. You should read this Annual Report on Form 10-K and the documents that we have filed as exhibits to our Form 10-K completely and with the understanding that our actual future results may be materially different from what we expect. These forward-looking statements speak only as at the date of this Annual Report on Form 10-K. Unless required by law, we do not intend to publicly update or revise any forward-looking statements to reflect new information or future events or otherwise. You should, however, review the factors and risks we describe in the reports we will file from time to time with the SEC after the date of this Annual Report on Form 10-K.
Table of Contents
GI DYNAMICS, INC.
ANNUAL REPORT ON FORM 10-K
FOR THE YEAR ENDED DECEMBER 31, 2014
| Page | ||||
| PART I | ||||
| Item 1. |
6 | |||
| Item 1A. |
21 | |||
| Item 1B. |
35 | |||
| Item 2. |
35 | |||
| Item 3. |
35 | |||
| Item 4. |
35 | |||
| PART II | ||||
| Item 5. |
36 | |||
| Item 6. |
38 | |||
| Item 7. |
Management’s Discussion and Analysis of Financial Condition and Results of Operations |
39 | ||
| Item 7A. |
52 | |||
| Item 8. |
53 | |||
| Item 9. |
Changes in and Disagreements with Accountants on Accounting and Financial Disclosure |
53 | ||
| Item 9A. |
53 | |||
| Item 9B. |
54 | |||
| PART III | ||||
| Item 10. |
55 | |||
| Item 11. |
72 | |||
| Item 12. |
Security Ownership of Certain Beneficial Owners and Management and Related Stockholder Matters |
73 | ||
| Item 13 |
Certain Relationships and Related Transactions, and Director Independence |
73 | ||
| Item 14 |
73 | |||
| PART IV | ||||
| Item 15. |
74 | |||
| 75 | ||||
| F-1 | ||||
Table of Contents
References
Unless the context requires otherwise, references in this Annual Report on Form 10-K to “GI Dynamics,” “the Company,” “we,” “us” and “our” refer to GI Dynamics, Inc. and its consolidated direct and indirect subsidiaries.
Currency
Unless indicated otherwise in this Annual Report on Form 10-K, all references to “$”, “U.S.$” or “dollars” refer to United States dollars, the lawful currency of the United States of America. References to “A$” refer to Australian dollars, the lawful currency of the Commonwealth of Australia. References to “€” or “Euros” means Euros, the single currency of Participating Member States of the European Union, or E.U.
Trademarks
EndoBarrier® and various company logos are the trademarks of the Company, in the United States and other countries. All other trademarks and trade names mentioned in this Annual Report on Form 10-K are the property of their respective owners.
Table of Contents
PART I
| ITEM 1. | BUSINESS |
Overview
We are a medical device company headquartered in Lexington, Massachusetts, that is dedicated to restoring health and improving quality of life, through the design and application of device and management solutions for treatment of metabolic disease. Our near-term vision is to establish EndoBarrier® Therapy as a valued treatment option for patients suffering from type 2 diabetes and obesity by restoring more manageable blood sugar levels and reducing body weight. EndoBarrier is the only incision-free, non-anatomy altering solution designed to specifically mimic the duodenal-jejunal exclusion created by gastric bypass surgery.
GI Dynamics, Inc. was incorporated in Delaware in 2003. In September 2011, we completed an initial public offering, or IPO, and listed on the Australian Stock Exchange, or ASX. In July and August of 2013 and May 2014, we completed follow-on offerings. Strategic investors include a global medical device company, Medtronic, Inc., and a corporate, strategic investor, Johnson & Johnson Development Corporation. The rights of our shareholders are governed by the Delaware General Corporation Law. We have five subsidiaries: GI Dynamics Securities Corporation, a Massachusetts-incorporated non-trading entity; GID Europe Holding B.V., a Netherlands-incorporated non-trading, holding company; GID Europe B.V., a Netherlands-incorporated company that conducts certain of our European business operations; GID Germany GmbH, a German-incorporated company that conducts certain of our European business operations; and GI Dynamics Australia Pty Ltd, an Australia-incorporated company that conducts our Australian business operations. For the year ended December 31, 2014, we had revenues of approximately $2.8 million and our net loss was approximately $48.2 million. Our accumulated deficit as of December 31, 2014 was approximately $199.9 million.
The EndoBarrier Value Proposition
EndoBarrier is a duodenal-jejunal bypass liner that provides patients living with type 2 diabetes and obesity with the only incision-free, endoscopic solution for immediate glycemic control and weight reduction, giving them the opportunity to change the course of their disease.
The EndoBarrier duodenal-jejunal bypass liner is a unique, endoscopically-delivered and removable device specifically designed to mimic the duodenal-jejunal exclusion created by gastric bypass surgery. EndoBarrier Therapy exerts robust improvements in glycemic control and weight loss in patients who have failed to manage their metabolic condition with lifestyle modification and pharmacotherapy. When implanted, EndoBarrier exerts its effects for a predictable treatment period while circumventing the non-compliance that patients are unable to overcome with lifestyle modification and pharmacotherapy approaches. EndoBarrier is associated with gastrointestinal intolerance in some that is overcome in most by simple dietary measures. There is also a low frequency of more serious complications that are managed by prompt device removal. On balance, the metabolic improvement elicited by the EndoBarrier is beyond what is achievable by lifestyle modification and pharmacotherapy. It approximates that observed with bariatric surgery, but without the more serious and permanent side effects associated with surgery. EndoBarrier is an important device treatment alternative with a favorable risk-benefit profile.
Clinical Unmet Needs in the Treatment of Type 2 Diabetes and Obesity
According to the World Health Organization, more than 500 million men (200 million) and women (300 million) are considered obese (BMI ³30). The International Diabetes Federation estimates a worldwide total of 382 million people with diabetes, 85% - 95% of who have type 2 diabetes. Diabetes-associated morbidity includes heart disease, peripheral vascular disease, stroke, kidney disease, retinopathy, neuropathy and premature death. With currently available treatment options, only 57% of patients with diabetes achieve acceptable glycemic control. Type 2 diabetes and obesity therefore represent two of the largest health care market opportunities in the world, with significant unmet needs requiring alternative treatment options.
6
Table of Contents
Challenges with Current Therapeutic Options for Type 2 Diabetes
Three years after initial diagnosis, half of patients with type 2 diabetes require multiple drug therapies. At 10 years most patients, despite insulin use in many, struggle to reach their hemoglobin A1c, or HbA1c, goal. HbA1c is a glycosylated hemoglobin molecule found in the bloodstream that is formed when red blood cells are exposed to blood glucose and it has become the generally accepted biomarker gold standard for measuring levels of diabetes control in clinical practice and in human trials. We believe new innovative therapies are needed to:
| • | target complementary pathophysiological pathways; |
| • | improve glycemia while avoiding hypoglycemia; and |
| • | address the root of the relationship between obesity and diabetes. |
The Key Problems We Solve
EndoBarrier Therapy significantly lowers body weight. When pharmacotherapy has failed and surgery is not an option, EndoBarrier Therapy is the only solution that can break the pathogenic relationship between obesity and type 2 diabetes. Obesity exacerbates insulin resistance and worsens type 2 diabetes. EndoBarrier Therapy results in weight loss by inducing hormonal changes that parallel those seen with bariatric surgery by (1) increasing satiety gut hormones (GLP-1 and peptide YY, or PYY) levels, (2) reducing food intake, and (3) increasing bile acids levels.
EndoBarrier Therapy restores near normal glucose levels. Both fasting and postprandial levels are improved by (1) bypassing the duodenum which offsets the abnormal gastrointestinal physiology signals responsible for causing insulin resistance and type 2 diabetes, (2) delivering partially digested food to the lower gastrointestinal tract which stimulates secretion of important gut hormones, and (3) improves islet function in the pancreas (i.e., insulin and glucagon secretion).
EndoBarrier Therapy lowers cardiovascular related risk. Because of the >10% weight loss achieved with EndoBarrier Therapy, systolic and diastolic blood pressure are significantly reduced and lipids are improved which may translate to a reduction in cardiovascular risk. (see “Our Completed Clinical Trials – Safety and Efficacy Profile”).
Product and Procedure
The EndoBarrier system consists of three components:
| • | The implant — Also referred to as the EndoBarrier Gastrointestinal Liner, is a 60 cm long liner made of a thin, flexible, impermeable fluoropolymer, which is implanted non-surgically via endoscopy (through the mouth and without cutting any tissue) during a brief procedure. Once properly positioned in the patient’s upper intestine, just below the stomach, the EndoBarrier device is held in place by a proprietary anchoring mechanism and it remains in the body for up to 12 months until removal by endoscopy. The EndoBarrier device acts as a physical barrier between ingested food and the upper part of the intestine, preventing absorption and interaction of food with digestive enzymes and hormones in the first part of the intestine. In patients with type 2 diabetes who are obese (BMI ³ 30 kg/m2), the implanted EndoBarrier device remains in the body for as long as 12 months during which time it elicits powerful metabolic effects, namely a robust improvement in glycemic state (diabetes control) accompanied by weight loss. This effect occurs promptly after device placement and is sustained over the 12 month period, after which the EndoBarrier device is then removed in a brief non-surgical endoscopic procedure. A longer implant time may be possible following further research and testing. |
| • | Delivery system — The EndoBarrier device is delivered using our proprietary, single-use delivery system. This includes a sterile, custom-made catheter, which is about 300-cm long and is sufficiently flexible to track through the patient’s mouth, down through the stomach and into the intestine. The EndoBarrier device is packed inside a capsule at the end of the catheter until deployment. The delivery period is brief, during which time the patient is either anaesthetized or semi-sedated. |
7
Table of Contents
| • | Removal system — The EndoBarrier device is removed, typically after 12 months of implant, with our custom-made grasper that passes through a standard gastroscope. The grasper is used to pull one of two drawstrings on the anchor to collapse the anchor inwards so that the anchor barbs can be removed from the intestinal wall. Our retrieval hood, placed on the end of a gastroscope, is then positioned to cover the anchor barbs to allow the implant to be safely removed through the patient’s mouth. The EndoBarrier device is usually retrieved in a brief procedure during which time the patient is either anaesthetized or semi-sedated. |
In tandem with EndoBarrier Therapy, we also recommend that physicians offer and encourage patients treated with EndoBarrier Therapy to adopt, supportive nutritional and lifestyle management plans. We believe that diet, exercise, counseling and support are important components of a multi-faceted approach to patient care in treating type 2 diabetes and obesity and can enhance patient outcomes associated with the use of EndoBarrier.
How the Mechanism of Action is Believed to Function
Although the exact physiological mechanisms of how EndoBarrier works are not fully understood, clinical data suggest that once the impermeable EndoBarrier device is implanted into the duodenum and proximal jejunum ingested food, passing through the EndoBarrier device lumen as a result of the normal digestive process, is prevented from interacting with the epithelium, microbiota, mucus layer, or biliopancreatic secretions within the duodenum and proximal jejunum. The EndoBarrier device therefore acts as a physical barrier that prevents the interaction of food with pancreatic enzymes and bile, which pass outside the EndoBarrier device, and then mix with the food at the end of the liner, lower down the patient’s intestine where absorption ultimately takes place. Thus, the EndoBarrier device creates a functional — but reversible — bypass of the upper intestine similar to Roux-en-Y gastric bypass surgery. The EndoBarrier does not reproduce other components of Roux-en-Y gastric bypass, including modification of the stomach and exclusion of the distal stomach from the alimentary flow.
Additional findings have suggested that the exclusion of the proximal intestine (foregut theory) and increasing nutrient delivery to the distal small bowel (hindgut theory) created by EndoBarrier likely induces neurohormonal changes and nutrient sensing that impact energy balance and glucose homeostasis.
Elucidating EndoBarrier Mechanism of Action
Decreases calorie intake:
| • | studies have demonstrated that patients with EndoBarrier eat less and feel full longer, leading to a decrease in calorie intake. |
Excludes the duodenum:
| • | this may offset an abnormality of gastrointestinal physiology responsible for insulin resistance and type 2 diabetes. |
Increases nutrient delivery to the distal small bowel:
| • | likely induces neurohormonal changes and nutrient sensing that impact energy and glucose balance; |
| • | partially digested nutrients reach the distal ileum which stimulates the secretion of GLP-1 by L-cells located in this area; |
| • | increase in-gut hormones contribute to restoring energy and glucose homeostasis; and |
| • | GLP-1 and PYY levels are both elevated as soon as one-week post implant. Both are important satiety signals to decrease food intake. |
Changes in bile acids:
| • | stimulates thermogenesis and gut hormone secretions. |
Improves islet function:
| • | data suggests that pancreatic islet function is also improved, affecting both insulin and glucagon secretion, thereby positively impacting blood glucose levels; and |
8
Table of Contents
| • | this shift to more favorable pancreatic islet function may be explained, in part, by the increase in the incretin hormone GLP-1 (as noted above) as this beneficial effect has been well documented with this hormone (i.e., a fundamental mechanism of both DPP4 inhibitor and GLP-1 receptor agonist pharmacologies). |
Potentially alters intestinal flora.
One potential mechanism that appears not to be a contributor is malabsorption of ingested calories. EndoBarrier covers only 60 cm of duodenal and proximal jejunal mucosa, which represents less than 15% of the length of the small intestine and leaves almost the entire jejunum and ileum for digestion and absorption. There is no evidence of significant micro- or macro-nutrient malabsorption with the EndoBarrier device.
Business Situation, Goals and Objectives
Today we are engaged in market development and commercialization of EndoBarrier in select countries in Europe, South America, the Asia Pacific region and the Middle East. Because EndoBarrier Therapy is a novel therapeutic solution, in most markets the necessary multidisciplinary health care delivery pathways for the prescription and management of EndoBarrier Therapy; and associated reimbursement for EndoBarrier, the procedure, and the management and care of patients who would receive EndoBarrier Therapy do not exist. Development therefore of these factors is essential to the successful adoption of EndoBarrier Therapy as a standard of care and the commercial viability of our business.
Over the next several years, our goal is to make EndoBarrier Therapy a treatment option for type 2 diabetes and obesity by developing additional evidence and clinical experience that confirms and builds upon our current understanding of the mechanism of action and clinical utility. Evidence from controlled clinical trials coupled with broad user experience in a commercial setting will provide support and guidance for optimal use of EndoBarrier Therapy and justification for payment. To achieve these goals we are pursuing the following general objectives:
| • | Targeted commercialization of our lead product in Europe, South America, the Asia Pacific region and the Middle East. In selected countries, we intend to work with key opinion leaders in the fields of endocrinology, bariatric surgery and gastroenterology to make manifest the risk-benefit profile of EndoBarrier Therapy as a valued treatment option that bridges the gaps between intensive pharmacotherapy and bariatric surgery. We believe education about the current clinical experience, which is positive and highly relevant, represents one of our most important objectives in 2015. To this end, we intend to build and invest in our direct operations in Europe to affect this aim while relying elsewhere primarily on exclusive distribution partners. In all markets we will continue to prioritize refinement and improvement of our physician training and patient care protocols to improve patient outcomes and awareness. |
| • | Development of reimbursement for EndoBarrier Therapy. Lack of payment is a primary obstacle to use of EndoBarrier Therapy. Generally, obtaining state-sponsored or institutional payer reimbursement requires clinical evidence supportive of your claims as well as simultaneous broad demand by hospitals and physicians based on personal user experience within your currently approved indications for use. Based on these considerations, we are actively working to build reimbursement in Germany, The Netherlands, and Switzerland and have made considerable progress toward such in Germany by obtaining NUB Status 1 and OPS codes for EndoBarrier for a second year. While earlier in the reimbursement development process, we also continue to believe that successful outcomes from recently initiated, randomized, controlled trials in the United Kingdom and France have the potential to support favorable reimbursement decisions in those countries. In other countries where patients are more accustomed to paying for all or a majority of health care expenses, we will rely on distribution partners with experience accessing their respective self-pay market to develop reimbursement. |
| • | Achieve regulatory approval in the U.S. through a successful U.S. pivotal trial by demonstrating the safety and efficacy of EndoBarrier Therapy. In 2013, we commenced enrollment in our pivotal trial in the U.S. for the purposes of seeking regulatory approval from the U.S. Food and Drug Administration, or FDA. The multi-center, randomized, double-blinded, sham-controlled study, which |
9
Table of Contents
| we refer to as the ENDO Trial, plans to enroll 500 patients with both uncontrolled type 2 diabetes and obesity at 25 sites in the U.S. The primary endpoint is improvement in diabetes control as measured by HbA1c levels with secondary endpoints including weight loss, cholesterol reduction, and blood pressure reduction. At the end of 2014, there were 24 sites actively enrolling patients. On March 5, 2015, we announced that the FDA recommended discontinuing placement of any additional devices in our pivotal trial of EndoBarrier Therapy in the U.S., although monitoring and data collection of the 325 subjects currently enrolled in the ENDO Trial will continue. The FDA has requested additional information to further assess the risk-benefit profile of EndoBarrier in the ENDO Trial; and we are expeditiously working to submit the requested information to the FDA for their review in an effort to resume enrollment. We cannot commence sales in the large U.S. market until the ENDO Trial is completed and regulatory approval is obtained, the timing and success of which is uncertain. |
| • | Continued development of clinical evidence to support commercialization and reimbursement. In addition to the ENDO Trial, we are currently supporting nine investigator-initiated trials of which four are randomized controlled trials that will provide high-level evidence about the efficacy and safety of EndoBarrier. Additionally, the studies will further our understanding of the mechanisms responsible for the potent weight and glycemic effects observed with EndoBarrier. Among these studies, most are supported by research grants. It is notable that to date, every clinical study over our history has confirmed a positive and clinically relevant risk-benefit profile. |
| • | Continue to expand the approved uses of EndoBarrier. We plan to continue to expand our potential markets by seeking regulatory approvals to treat additional patient populations with EndoBarrier Therapy, such as patients with type 2 diabetes with lower body mass index, or BMI. |
| • | Improve our manufacturing efficiency and our margins. We currently assemble, test and package our EndoBarrier and the delivery and the retrieval system for the EndoBarrier system at our facility in Lexington, Massachusetts. We have the ability to scale up our manufacturing capacity from the current levels to meet our future commercial and investigational trial demand. We will also seek to add additional suppliers to reduce risk and drive efficiencies as we expand. |
Our Completed Clinical Trials - Safety and Efficacy Profile
We have tested and evaluated our technology in 13 clinical trials (12 outside of the U.S. and one in the U.S.), involving more than 500 patients, from which we believe the results demonstrate that in the aggregate that EndoBarrier technology shows a favorable efficacy profile for the treatment for type 2 diabetes and obesity. Our clinical trials have shown that the observed efficacy for both type 2 diabetes and obesity is desirable for this patient population. More specifically, our clinical trials have shown that EndoBarrier exerts an improvement in glycemic state such that the majority of patients are able to improve HbA1c levels to below the American Diabetes Association, or ADA, treatment target of 7%. Moreover, our clinical trials with our current commercial design have observed 10-20% absolute weight loss.
Of the 13 trials conducted in total, nine were directed at earlier product designs, performance improvement and shorter implant periods. Additionally, EndoBarrier has been evaluated in four premarket, company-sponsored clinical trials outside the U.S. where the relevant target population was treated for a 12-month implant period. EndoBarrier is also currently being evaluated in a worldwide clinical registry, as well as in a number of physician-sponsored clinical trials. This experience is coupled with a growing market experience that has been garnered since the device received the CE Mark in 2010. In these clinical trials, the majority of subjects studied were obese (average BMI 38.1 kg/m2) with a high incidence of accompanying comorbidities, namely hypertension and hyperlipidemia. Those subjects with diabetes had sub-optimal glycemic control prior to device placement (median HbA1c of 8.3%) and summary of efficacy data shows that EndoBarrier Therapy exerts an improvement in glycemic control, lowering HbA1c to 6.8% at 12 months. In subjects without diabetes, HbA1c was in the normal range at baseline and remained unchanged throughout the period of EndoBarrier Therapy. EndoBarrier Therapy also elicited an average of 12.6% decrease in body weight at 12 months after EndoBarrier placement. Additional analysis of the data also demonstrates encouraging changes in cardiovascular indices (total cholesterol, LDL cholesterol, triglycerides and blood pressure). The beneficial effects of
10
Table of Contents
EndoBarrier Therapy occur in the context of an overall favorable safety profile. The most commonly reported complications are gastrointestinal in nature. They include nausea, vomiting and upper abdominal pain of mild to moderate severity and are most prevalent in the early days and weeks following EndoBarrier placement. Other uncommon risks include infection (e.g., hepatic abscess), trauma (e.g. tissue tears), device migration and bleeding, any of which may result in endoscopic or surgical removal of the device. As with all endoscopic and/or implant procedures, serious injury or death can occur.
The current hold in further enrollment in the ENDO Trial results from four cases of hepatic abscess among the 325 subjects currently enrolled in the ENDO Trial. Hepatic abscess is a known event related to the use of EndoBarrier but has recently presented at a higher than anticipated rate in the ENDO Trial. Outside of the U.S., the incidence rate of hepatic abscess is approximately 1% based on experience with more than 2,900 units shipped commercially since 2009. We believe that EndoBarrier’s overall risk-benefit profile, as established outside of the U.S., remains favorable.
As a treatment option for obese patients with type 2 diabetes, EndoBarrier appears to provide a novel mechanism for improving glycemic control, while simultaneously achieving significant weight loss, with the potential to improve cardiovascular risk factors while the device is in place. These effects have also been accompanied by what we believe is an overall acceptable safety profile; and, taken together, we believe EndoBarrier exhibits a favorable risk-benefit profile.
Increased level of key hormones
Our technology has also been shown to have positive effects on two key gastrointestinal hormones known as GLP-1 and peptide YY, or PYY. In a 24-week study of 17 obese patients with type 2 diabetes, increased levels of both PYY and GLP-1 were reported one week after implantation with the EndoBarrier. As GLP-1 is known to regulate insulin secretion and action, and both hormones may play a role in body weight control, we believe the increased levels of these two hormones may explain in part the improvement in diabetic control and the weight loss observed in patients treated with EndoBarrier Therapy.
Ongoing benefits post removal of EndoBarrier
We continue to explore the apparent sustained metabolic effects observed in patients after removal of the EndoBarrier to determine the magnitude and importance of this effect. We have monitored the following patients for six months post removal of EndoBarrier:
| • | Fifty-five patients in our 12-month diabetes trials who completed the 12-month implant duration returned for a six-month post-explant visit. Diabetes control deteriorated only slightly (mean HbA1c rose by 0.2% in the post-implant phase) in these patients during the six-month follow-up period after removal of the EndoBarrier; and |
| • | These patients experienced significant weight loss (average10.5 kg) during the implant phase with only modest weight regain (~4.6kg) during the six-month period after removal of the EndoBarrier. |
To maximize the benefits to patients after removal, we believe that EndoBarrier Therapy should be an integral part of a comprehensive diabetes management and weight loss program including a diet and exercise regimen. We are continuing to monitor patients after device removal to better understand the long-term effects of EndoBarrier Therapy on glucose control and weight loss.
Key Benefits and Advantages of EndoBarrier Therapy
We believe that the key features and advantages of EndoBarrier Therapy include:
| • | One solution — To control glucose levels and foster weight loss with the same therapy: |
| • | Offers the benefit of providing both glucose control and weight reduction, simultaneously, which are necessary for effective treatment of the type 2 diabetes patient who is obese; |
| • | Most patients experience improved control of their glucose and may reduce or eliminate their need for diabetic medications during the implant period; |
11
Table of Contents
| • | EndoBarrier Therapy appears to provide a continual beneficial effect during the implant period in contrast to drugs where patients’ adherence or compliance with a given pharmacology will likely be incomplete; and |
| • | Most patients experience significant weight loss during the implant period, as well as the potential to improve cardiovascular risk factors such as cholesterol and blood pressure; |
| • | Incision-free procedure — A brief implant and removal process, not involving the cutting of any tissue, or the permanent alteration of the anatomy; and that is far less invasive than surgical procedures; |
| • | Well tolerated and easily removable — If complications arise, the implant can be easily removed; |
| • | Potential cost savings — For the patient and health care system: |
| • | Improved patient health and outcomes are likely to result in fewer hospital stays and expenses for complications from diabetes; |
| • | The cost of EndoBarrier Therapy, including the implant and removal procedure, is currently preferable to or competitive with surgical options for obesity, including gastric banding and gastric bypass surgery; and |
| • | We believe that the broader potential cost savings for the health care system could be significant, including savings on drugs, the treatment of other diseases associated with diabetes, and other diabetes devices such as blood glucose testing strips and meters. |
Comparison to pharmacology and surgical approaches
Our clinical trials to date have in aggregate shown that the efficacy observed with the EndoBarrier device for both type 2 diabetes and obesity is desirable for this patient population. Improvements in diabetic state (glycemic control) are at least equivalent with pharmacologic approaches (five major oral agent classes and two injectable agent classes) and similar or superior to those observed with some forms of bariatric surgery, such as a gastric band.
While it is difficult to make definitive comparative statements as a full array of head-to-head clinical trial comparisons with other treatment approaches have not been conducted, EndoBarrier Therapy appears to exert an HbA1c lowering effect (glycemic improvement) that is equivalent to or superior to the potency observed with other pharmacological approaches (including oral agents, e.g., metformin, sulphonylureas, thiazolidediones and DPP-IV inhibitors; and injectable therapies, e.g., insulin and GLP-1 receptor agonists). As isolated interventions, each pharmacology class struggles to get the majority (>50%) of treated patients to the ADA goal of 7% whereas EndoBarrier Therapy is able to get the majority to that goal. Stated in a different way, much of the pharmacology classes may lower average HbA1c in patients with diabetes to the 7-8% range; while in clinical trials, EndoBarrier Therapy lowered HbA1c on average from 8.3% to 6.8%. Weight loss effects in most patients appear more robust than those seen with pharmacology approaches and similar to that observed with some forms of bariatric surgery. More specifically, there are oral pharmacology agents available for the treatment of excess body weight without an indication for an anti-diabetes effect (i.e lorcaserin, phentamine/topiramate, sibutramine, orlistat); and these products tend to lower body weight in the region of 5-7%. This effect is inferior to the more robust effect observed with EndoBarrier Therapy, which in clinical trials reduced total body weight on average by 12.6%.
Bariatric surgery, in particular, Roux-en-Y gastric bypass, has demonstrated significant weight loss coupled with improvements in diabetic state. Bariatric surgery has evolved over more than twenty years and is now becoming more accepted as an alternative treatment option to the more conventional use of pharmacology for patients struggling with both type 2 diabetes and obesity. The two most popular bariatric procedures are Roux-en-Y gastric bypass and sleeve gastrectomy. However, broad-based adoption of bariatric surgery has been limited with less than 0.5% of the eligible U.S. population undergoing surgery, and a small but significant rate of post-surgery complications. There is also a resistance for patients to choose a permanent surgical solution for their metabolic disorder. An alternative surgical approach has been a restrictive approach, commonly known as the lap-band procedure. This approach has declined in recent years from less robust weight loss and glycemic efficacy coupled with post-surgical management complications.
12
Table of Contents
Other products in development or recently commercialized by our competitors include the temporary intra-gastric occlusion devices (balloons), a device designed to modify local gut neural stimulation (or pacing), a device to resurface the duodenal mucosa, an endoscopically placed gastric disk designed to induce satiety and fullness, and a gastric draining tube.
Safety and Potential Side Effects of EndoBarrier
Treatment of patients with medical devices or drugs may have potential side effects, which generally depend on the device or drug itself, or on the interaction of the device or drug with the disease or other diseases that a patient may have at the time of treatment. The most commonly reported complications are gastrointestinal in nature. They include nausea, vomiting and upper abdominal pain of mild to moderate severity and are most prevalent in the early days and weeks following EndoBarrier placement. Other uncommon risks include infection (e.g., hepatic abscess), trauma (e.g. tissue tears), device migration and bleeding, any of which may result in endoscopic or surgical removal of the device. As with all endoscopic and/or implant procedures, serious injury or death can occur.
More specifically, during our clinical trials, the most common reasons for early removal were (1) movement of the implant which can cause abdominal discomfort; (2) abdominal discomfort; (3) liner obstruction; and (4) intestinal bleeding. As of March 5, 2015, four cases of hepatic abscess were reported among the 325 subjects currently enrolled in our ENDO Trial, resulting in early removal. In our most recent round of clinical trial experience, early device removal was lowered through increased physician training and experience to less than 10% of early removals being device-related.
Further Development of Our Current Technology
As we develop our technology, we have continued to improve the durability of anchoring the device in the intestine. We believe that anchor stability is the key challenge for extending the duration of the EndoBarrier implant period. We have designed and are clinically testing further improvements to our anchor technology to enable implant durations beyond 12 months. These designs may also accommodate wider indications for use as well as serial use of EndoBarrier Therapy based on enhanced safety and simplicity.
We also conducted a clinical trial of patients with type 2 diabetes with a BMI as low as 23, which showed EndoBarrier Therapy improves diabetes and provides weight loss in lower BMI patients. Results like these are important in areas of the world where diabetes generally occurs at a lower BMI, such as in Asia.
Other products in development
As part of our business strategy, we seek to leverage our technology and expertise into additional product opportunities. To date, we have conducted research and development on the following products:
| • | EndoBarrier Liner with EndoBarrier Restrictor — This device combines our EndoBarrier liner with the EndoBarrier Restrictor. This combination is intended to treat diabetes and create greater weight loss than either device alone. We conducted a small, 10 patient clinical trial with this device that showed excess weight loss of 40 ± 3% (mean ± standard error) and a total weight loss of 16.7 ± 1.4 kg after a 12-week implant period. |
| • | EndoBarrier Restrictor — This device is targeted for short-term weight loss or weight loss in a patient who is not obese. The device employs the same anchoring technology as EndoBarrier, but has a cover with a small hole to slow emptying of the patient’s stomach and create a feeling of ‘fullness.’ |
| • | Next Generation EndoBarrier — This design may accommodate wider indications for use as well as serial use of EndoBarrier Therapy based on anchoring technique and ease of use. |
| • | Bariatric Surgery Solutions — These are product designs based on our anchoring and sleeve technology that may provide solutions for patients whose bariatric surgery is failing. |
In addition to these products, we are looking at other opportunities to leverage our technology and expertise. While each represent promising technologies, further development and testing will be required to support regulatory applications for these devices and there can be no assurance that any of these products will be further developed or commercialized.
13
Table of Contents
How We Make Our Products
Our manufacturing operations comprise 6,000 square feet of an approximately 33,000 square feet leased facility in Lexington, Massachusetts. The facility includes a controlled environment assembly room and an engineering laboratory. We perform final assembly and packaging of our products, as well as all research and development in this facility. We believe that we are in compliance with FDA’s quality systems regulation; and we have an ISO compliant Quality Management System that has been certified to the ISO 13485:2003 and 13485:2012 medical device standard.
We assemble our products at our facility from components and sub-assemblies that are outsourced, including:
| • | implant components such as the liner material, nitinol wire, drawstrings and radiopaque markers; and |
| • | delivery and retrieval catheter components, including injection molded and extruded components, wires and tubing. |
Once the delivery system is complete, we insert the EndoBarrier liner into the delivery system. We then package and label the delivery and retrieval systems separately before sending them to be sterilized by our approved sterilization suppliers.
We currently produce approximately 2,000 EndoBarrier systems per year. We can increase this capacity by additional outsourcing of some of the less critical sub-assemblies to well-established component assemblers which possess the capabilities to manufacture significantly increased volumes. If needed, we are also able to add staff and additional equipment in our current facility that would enable us to increase our manufacturing capacity to approximately 60,000 EndoBarrier systems per year without requiring additional manufacturing space. We believe that the necessary staff and equipment can be added in a relatively short time frame to support our commercial and clinical activities and meet anticipated market demand. It is also our intention to have a second supplier for key components of our EndoBarrier system to reduce the potential risk of disruption to our business from reliance on any one supplier.
Sales & Marketing
We commenced commercial sales of our EndoBarrier in 2011 and are focused on executing our commercial strategy to secure favorable reimbursement in key direct markets over the long-term and to support our distribution partners in select self-pay markets for the near-term. We will stay focused in a limited number of countries and continue to build market awareness among patients and physicians. We will support increasing adoption of EndoBarrier Therapy at existing medical centers and train doctors in new medical centers. We are also pursuing reimbursement opportunities for EndoBarrier Therapy from health insurers and other third-party payers at a local and national level in Europe, and have recently achieved important reimbursement milestones in a number of markets in Europe and in Israel. It is the successful execution of this strategy that we believe will result in a reproducible, sustainable and scalable business.
Central to the execution of our sales and marketing strategy is the close engagement and alignment with key opinion leaders in the fields of endocrinology, bariatric surgery, and gastroenterology and with key influencers and decision makers in both the public/government and private payer infrastructure.
Our current commercial activities
In Europe, we commercially launched EndoBarrier in the second quarter of 2011. At the end of 2014, we had approximately 69 active centers in European countries that included Germany, the Netherlands, the United Kingdom, and France, with doctors and staff who have been trained in the implant procedure and have commenced implants of our EndoBarrier. Germany, with over 35 centers, has the largest concentration of centers in Europe.
We currently have approval for commercial sales in Israel, Saudi Arabia and the United Arab Emirates, and have commenced commercial operations. In Israel, we have five active centers and have received a favorable reimbursement decision by Clalit Health Services, the largest health maintenance organization in Israel. We have an office in Düsseldorf, Germany that is responsible for developing and supporting our European sales and marketing strategy and also supports activity in the Middle East.
14
Table of Contents
In South America, we received regulatory approval in Chile in 2010. Chile, which was originally an early clinical trial site, now has five active centers. We are currently seeking approval in Brazil and other countries.
In the Asia Pacific region, we received regulatory approval in Australia in 2011. We started with centers in Melbourne and Sydney and now have centers in most major cities. Australia has historically been a very strong market for various forms of bariatric surgery and has a strong self-pay market. We have an office in Australia that is responsible for developing and supporting our Australian sales and marketing activity.
Customers
Our customers include health care providers who treat type 2 diabetes and obesity, such as gastroenterologists, endocrinologists and bariatric surgeons, and distributors of medical devices. In certain countries in Europe, we sell directly to health care providers. In others, we distribute our product through local and regional distributors.
In the Middle East and South America, we distribute our products through local and regional distributors. In Australia we sell directly to health care providers.
HealthLink Europe B.V., based in the Netherlands, provides medical device warehousing and logistics, customer call center, and invoicing services to our customers in Europe. Logistics for customers in other regions of the world are served from our facility in Lexington, Massachusetts.
Reimbursement and Self-paying patients
Where reimbursement is required for broad-based use, we are endeavoring to secure such reimbursement. In other countries where patients are more accustomed to paying for all or a majority of health care expenses, we are growing our presence in such markets or pursuing regulatory approvals.
In geographies where reimbursement is necessary, such as in Europe, we are already receiving partial reimbursement in certain countries at local and national levels but we have not yet achieved full or national reimbursement in any market. Our goal is to obtain national reimbursement from national or private health insurers and other third party payers in order to expand our potential target patient population and increase further use of EndoBarrier. We are encouraged by the reimbursement milestones we have achieved to date, indicating we are on the path for national reimbursement:
| • | Germany - Hospitals are receiving partial reimbursement of the total cost of an EndoBarrier procedure. In October 2013, operations and procedures, or OPS, codes were assigned in Germany that allow the use of EndoBarrier to be tracked by the reimbursement system. In February 2014 and renewed in January 2015, we were granted by InEk, the German Institute for the Hospital Remuneration System, NUB (Neue Untersuchungs- und Behandlungsmethoden) Status 1 for EndoBarrier Therapy, which allows certain hospitals to negotiate for additional payment for a defined number of cases to cover the cost of implanting EndoBarrier. |
| • | Netherlands - The Dutch Health Care Authority (NZa) has designated a preliminary reimbursement code for EndoBarrier Therapy as part of a policy rule for new and innovative health care treatments. This applies between a particular hospital and insurance company but serves as a template to allow for additional hospitals and insurance companies to reach similar agreements. A new format of this innovation rule has been introduced in the 2014 health care reform. |
| • | Israel - Clalit Health Services, Israel’s largest health maintenance organization, established a reimbursement policy for EndoBarrier Therapy, whereby the 2.7 million people enrolled in a supplementary coverage option are entitled to receive partial coverage for the procedure. |
In Australia, France and the United Kingdom, we are in the earlier stages of the reimbursement process. We recently initiated randomized, controlled trials in the United Kingdom and France that have the potential to
15
Table of Contents
support favorable reimbursement decisions in those countries. We are also collecting data that we expect will demonstrate cost savings to health care systems and both clinical and social benefits from treating patients with type 2 diabetes and obesity with EndoBarrier Therapy.
Securing reimbursement coverage and payment is increasingly challenging in Europe as the reimbursement process differs by country and sometimes within countries. Central to our reimbursement strategy is the ongoing prioritization of those markets that are receptive to new technologies and are capable and willing to pay, as well as those that will be most influential with respect to reimbursement in other areas of Europe and Asia.
To date, our reimbursement activities have and will continue to include applying for reimbursement codes, establishing pricing and cost models, and gaining the support of surgical, gastroenterology and endocrine societies. We also recognize the importance of engaging and gaining the support of both national and regional diabetes and obesity societies.
We currently have self-paying patients who purchase EndoBarrier Therapy at a cost which does not exceed that of leading bariatric procedures in their markets; and we believe that this will remain an attractive opportunity in some countries. In self-pay markets, we are currently expanding both the number of centers, as well as seeking regulatory approval in countries that we believe will have a large self-pay population, such as Brazil.
Intellectual Property
We rely on a combination of patents, together with non-disclosure and confidentiality agreements, to establish and protect the proprietary rights in our technologies. Seedling Enterprises, LLC initially conceived and developed our technology. In 2003, Seedling Enterprises, LLC incorporated GI Dynamics, Inc. and transferred all of its intellectual property relating to EndoBarrier to us with no further claims or royalties in exchange for shares of our common stock, par value $0.01 per share, or Common Stock.
At December 31, 2014, our current patent portfolio was comprised of 120 issued and pending U.S. and non-U.S. patents. We have been issued 36 U.S. patents and have 12 pending U.S. patent applications. We have also sought intellectual property protection outside of the U.S. and have been issued 51 patents across Australia, Canada, the European Patent Convention region (including Austria, Belgium, France, Germany, Ireland, Italy, Netherlands, Spain, Sweden, Switzerland, Turkey and the United Kingdom), Hong Kong and Japan, and we have 21 pending foreign patent applications. Our patents and patent applications cover the following areas of our technology:
| • | the gastrointestinal liner and anchor; |
| • | delivery and removal systems; |
| • | placement of the device; |
| • | treatment alternatives; and |
| • | the restrictor device. |
Our current issued patents expire between 2023 and 2030. We also actively monitor our intellectual property by periodically reviewing new developments to identify extensions to our patent portfolio.
We entered into a Patent License Agreement with Crabb Co., LLC, or Crabb, in 2003, which was amended in 2005, for the in-license of certain intellectual property related to the anchoring of an intestinal liner, which is anchored in the pylorus. This license was obtained early in our history; and while we are not currently using this intellectual property, it may be useful in future implant designs. The royalty obligation begins with U.S. commercial sales of products, if any, as defined in the license. The royalty percentage may vary on products covered by the license but in any case, the royalties are not considered significant. We will cease paying royalties, if any, when the patent covered by the license expires in 2017.
We employ external patent attorneys to assist us in managing our intellectual property portfolio.
16
Table of Contents
In 2013, we settled litigation with the supplier of the liner material used to manufacture EndoBarrier, W.L. Gore & Associates, Inc., or Gore. Under the settlement, we retain exclusive ownership and control of our patent portfolio; and we and Gore have dismissed all claims against each other. We also granted Gore a non-exclusive, royalty-free license to use our patents, but only in the vasculature (i.e., blood vessels). Gore is not licensed to use our patents for any applications in the gastrointestinal tract, which is the area of the body in which our products are designed to be used. Neither we nor Gore are required to make any cash payments to the other, nor will any royalties be due.
Government Regulation of Medical Devices and EndoBarrier
Governmental authorities in the U.S., at the federal, state and local levels, and other countries extensively regulate, among other things, the research, development, testing, manufacture, labeling, promotion, advertising, distribution, marketing and export and import of products such as those we are commercializing and developing. Failure to obtain approval or clearance to market our products and products under development and to meet the ongoing requirements of these regulatory authorities could prevent us from continuing to market or develop our products and product candidates.
United States
Premarketing Regulation
In the U.S., medical devices are regulated by the FDA. Unless an exemption applies, a new medical device will require either prior 510(k) clearance or approval of a premarket approval application, or PMA, before it can be marketed in the U.S. The information required by the FDA in order to obtain clearance or approval to market a new medical device varies depending on how the FDA classifies the medical device. Medical devices are classified into one of three classes on the basis of the controls deemed necessary by the FDA to reasonably ensure their safety and effectiveness. Class I devices, which have the lowest level of associated risk, are subject to general controls, including labeling, premarket notification and adherence to the quality system regulation, or QSR, which sets forth device-specific good manufacturing practices. Class II devices are subject to general and special controls, including performance standards. Class III devices, which have the highest level of associated risk, are subject to most of the previously identified requirements, as well as to premarket approval. Most Class I devices and some Class II devices are exempt from the 510(k) requirement, although the manufacturers are still subject to registration, listing, labeling and QSR requirements. EndoBarrier is classified as a Class III device by the FDA and will require FDA approval for commercialization through the PMA application process described below.
A 510(k) premarket notification must demonstrate that the device in question is substantially equivalent to another legally marketed device, or predicate device, that did not require premarket approval. In evaluating the 510(k), the FDA determines whether the device has the same intended use as the predicate device, and (a) has the same technological characteristics as the predicate device or (b) has different technological characteristics, and (i) the data supporting the substantial equivalence contains information, including appropriate clinical or scientific data, if deemed necessary by the FDA, that demonstrates that the device is as safe and as effective as a legally marketed device, and (ii) does not raise different questions of safety and effectiveness than the predicate device. Most 510(k)s do not require clinical data for clearance but the FDA may request such data. The FDA’s goal is to review and act on each 510(k) within 90 days of submission but it may take longer based on requests for additional information. In addition, requests for additional data, including clinical data, will increase the time necessary to review the notice. If the FDA does not agree that the new device is substantially equivalent to the predicate device, the new device will be classified in Class III, and the manufacturer must submit a PMA. Since July 2012, however, with the enactment of the Food and Drug Administration Safety and Innovation Act, or FDASIA, a de novo pathway is directly available for certain low-to-moderate risk devices that do not qualify for the 510(k) pathway due to lack of a predicate device. Modifications to a 510(k)-cleared medical device may require the submission of another 510(k) or a PMA if the changes could significantly affect the safety or effectiveness or constitute a major change in the intended use of the device.
17
Table of Contents
The PMA process is more complex, costly and time consuming than the 510(k) clearance procedure. A PMA must be supported by extensive data including, but not limited to, technical, pre-clinical, clinical, manufacturing, control and labeling information to demonstrate to the FDA’s satisfaction the safety and effectiveness of the device for its intended use. After a PMA is submitted, the FDA has 45 days to determine whether it is sufficiently complete to permit a substantive review. If the PMA is complete, the FDA will file the PMA. The FDA is subject to performance goal review times for PMAs and may issue a decision letter as a first action on a PMA within 180 days of filing but if it has questions, it will likely issue a first major deficiency letter within 150 days of filing. It may also refer the PMA to an FDA advisory committee for additional review, and will conduct a preapproval inspection of the manufacturing facility to ensure compliance with the QSR, either of which could extend the 180-day response target. While the FDA’s ability to meet its performance goals has generally improved during the past few years, it may not meet these goals in the future. A PMA can take several years to complete and there is no assurance that any submitted PMA will ever be approved. Even when approved, the FDA may limit the indication for which the medical device may be marketed or to whom it may be sold. In addition, the FDA may request additional information or request the performance of additional clinical trials before it will reconsider the approval of the PMA or as a condition of approval, in which case the trials must be completed after the PMA is approved. Changes to the device, including changes to its manufacturing process, may require the approval of a supplemental PMA.
If a medical device is determined to present a “significant risk,” the manufacturer may not begin a clinical trial until it submits an investigational device exemption, or IDE, to the FDA and obtains approval of the IDE from the FDA. The IDE must be supported by appropriate data, such as animal and laboratory testing results and include a proposed clinical protocol. These clinical trials are also subject to the review, approval and oversight of an institutional review board, or IRB, at each institution at which the clinical trial will be performed. The clinical trials must be conducted in accordance with applicable regulations, including but not limited to the FDA’s IDE regulations and current good clinical practices. A clinical trial may be suspended by the FDA or the sponsor at any time for various reasons, including a belief that the risks to the study participants outweigh the benefits of participation in the trial. Even if a clinical trial is completed, the results may not demonstrate the safety and efficacy of a device, or may be equivocal or otherwise not be sufficient to obtain approval.
Post-Marketing Regulation
After a device is placed on the market, numerous regulatory requirements apply. These include:
| • | compliance with the QSR, which requires manufacturers to follow stringent design, testing, control, documentation, record maintenance, including maintenance of complaint and related investigation files, and other quality assurance controls during the manufacturing process; |
| • | labeling regulations, which prohibit the promotion of products for uncleared or unapproved or “off-label” uses and impose other restrictions on labeling; and |
| • | medical device reporting obligations, which require that manufacturers investigate and report to the FDA adverse events, including deaths or serious injuries that may have been or were caused by a medical device and malfunctions in the device that would likely cause or contribute to a death or serious injury if it were to recur. |
Failure to comply with applicable regulatory requirements can result in enforcement action by the FDA, which may include any of the following sanctions:
| • | operating restrictions, partial suspension or total shutdown of production; |
| • | refusal to grant 510(k) clearance or PMA approvals of new products; |
| • | withdrawal of 510(k) clearance or PMA approvals; and |
| • | criminal prosecution. |
18
Table of Contents
To ensure compliance with regulatory requirements, medical device manufacturers are subject to market surveillance and periodic, pre-scheduled and unannounced inspections by the FDA. These inspections may include the manufacturing facilities of our subcontractors.
International Regulation
International sales of medical devices are subject to foreign government regulations, which vary substantially from country to country. The time required to obtain approval by a foreign country may be longer or shorter than that required for FDA approval, and the requirements may differ. For example, the primary regulatory authority with respect to medical devices in Europe is that of the E.U. The E.U. consists of 28 countries and has a total population of over 500 million people. Norway, Iceland, Lichtenstein and Switzerland are not members of the E.U., but have transposed applicable European medical device laws into their national legislation. Thus, a device that is marketed in the E.U. may also be recognized and accepted in those four non-member European countries as well.
The E.U. has adopted numerous directives and standards regulating the design, manufacture, clinical trials, labeling and adverse event reporting for medical devices. Devices that comply with the requirements of relevant directives are entitled to bear CE conformity marking, indicating that the device conforms to the essential requirements of the applicable directives and, accordingly, can be commercially distributed throughout the E.U. Actual implementation of these directives, however, may vary on a country-by-country basis. The CE Mark is a mandatory conformity mark on medical devices distributed and sold in the E.U. and certifies that a medical device has met applicable requirements.
The method of assessing conformity varies, but normally involves a combination of self-assessment by the manufacturer and a third-party assessment by a “Notified Body.” Notified Bodies are independent testing houses, laboratories, or product certifiers authorized by the E.U. member states to perform the required conformity assessment tasks, such as quality system audits and device compliance testing. An assessment by a Notified Body based within the E.U. is required in order for a manufacturer to distribute the product commercially throughout the E.U. Medium and higher risk devices require the intervention of a Notified Body that is responsible for auditing the manufacturer’s quality system. The Notified Body will also determine whether or not the product conforms to the requirements of the applicable directives. Devices that meet the applicable requirements of E.U. law and have undergone the appropriate conformity assessment routes are granted CE “certification.”
EndoBarrier has CE Mark designation for the treatment of obese type 2 diabetes with BMI ³30 kg/m2, or obese patients with BMI ³30 kg/m2 with ³1 co-morbidities, or obese patients with BMI >35 kg/m2. EndoBarrier is indicated for a treatment period not to exceed 12 months. CE Marking requires demonstration of continued compliance with the directives, which apply to the continued safety and quality of the product. Our designated E.U. Notified Body regularly audits these parameters to ensure compliance with ISO 13485 certification. The CE Mark is mandatory for medical devices sold not only within the countries of the E.U. but more generally within all countries in Western Europe. As many of the European standards are converging with international standards, the CE Mark is often used on medical devices manufactured and sold outside of Europe (notably in Asia that exports many manufactured products to Europe). CE Marking gives companies easier access into not only the European market but also to Asian, Latin American and Middle Eastern markets, most of which recognize the CE Mark on medical devices as a mark of quality and adhering to international standards of consumer safety, health or environmental requirements.
In September 2012, the European Commission proposed a regulation which, if adopted, will change the way most medical devices are regulated in the E.U., and may subject our products to additional requirements.
In a number of international markets, regulatory approvals may be expedited once CE Mark approval has been received; although submissions are required in each country. EndoBarrier is commercially available in Chile, which recognizes CE Marking and certain countries in the Middle East which recognize CE Marking.
19
Table of Contents
In Australia, the Therapeutic Goods Administration, or TGA, is responsible for administering the Therapeutic Goods Act with EndoBarrier falling under the category of an implantable medical device. In July 2011, the TGA approved EndoBarrier for inclusion on the Australian Register of Therapeutic Goods. In Australia, EndoBarrier is approved for the treatment of obese type 2 diabetes with BMI ³30 kg/m2, or obese patients with BMI ³30 kg/m2 with ³1 co-morbidities, or obese patients with BMI >35 kg/m2. It is indicated for a treatment period not to exceed 12 months.
We have submitted regulatory applications in Brazil, where the Brazilian Health Surveillance Agency (Anvisa) has similar authority and regulation of medical devices, and other markets although the timing of approval is uncertain.
Health Care Reform
In the U.S. and foreign jurisdictions, there have been a number of legislative and regulatory changes to the health care system that could affect the future results of our operations. In particular, there have been and continue to be a number of initiatives at the U.S. federal and state levels that seek to reduce health care costs.
In March 2010, the President signed into law the Affordable Care Act, or ACA, a sweeping law intended to broaden access to health insurance, reduce or constrain the growth of health care spending, enhance remedies against health care fraud and abuse, add new transparency requirements for health care and health insurance industries, impose new taxes and fees on pharmaceutical and medical device manufacturers and impose additional health policy reforms. Among other things, the ACA imposes a 2.3% medical device excise tax on the sale of many medical devices in the U.S. This tax took effect on January 1, 2013. Substantial new provisions affecting compliance have also been enacted, which may affect our business practices with health care practitioners. A significant number of provisions are not yet, or have only recently become, effective. Although it is too early to determine the full effect of the ACA, the new law appears likely to place downward pressure on pricing of medical devices, especially under the Medicare program, and may also increase our regulatory burdens and operating costs.
We expect that the ACA, as well as other health care reform measures that have been and may be adopted in the future, may result in more rigorous coverage criteria and in additional downward pressure on the price that we receive for our products. Any reduction in reimbursement from Medicare or other government programs may result in a similar reduction in payments from private payers. The implementation of cost containment measures or other health care reforms may affect our ability to generate revenue and profits or commercialize our product candidates.
Third-Party Reimbursement
Because we typically receive payment directly from hospitals and health care facilities, we do not anticipate relying directly on payment for any of our products from third-party payers, such as Medicare, Medicaid, private insurers, and managed care companies. However, our business will be affected by policies administered by federal and state health care programs, such as Medicare and Medicaid, as well as private third-party payers, which often follow the policies of the state and federal health care programs. For example, our business will be indirectly impacted by the ability of a hospital or medical facility to obtain coverage and third-party reimbursement for procedures performed using our products. These third-party payers may deny reimbursement if they determine that a device used in a procedure was not medically necessary; was not used in accordance with cost-effective treatment methods, as determined by the third-party payer; or was used for an unapproved use. A national or local coverage decision denying Medicare coverage for one or more of our products could result in private insurers and other third party payers also denying coverage. Even if favorable coverage and reimbursement status is attained for our products, less favorable coverage policies and reimbursement rates may be implemented in the future. The cost containment measures that third-party payers and providers are instituting, both within the U.S. and abroad, could significantly reduce our potential revenues
20
Table of Contents
from the sale of our products and any product candidates. We cannot provide any assurances that we will be able to obtain and maintain third party coverage or adequate reimbursement for our products and product candidates in whole or in part.
For inpatient and outpatient procedures, including those that will involve use of our products, Medicare and many other third-party payers in the U.S. reimburse hospitals at a prospectively determined amount, generally based on one or more diagnosis related groups, or DRGs, associated with the patient’s condition for inpatient treatment and generally based on ambulatory payment classifications, or APCs, associated with the procedures performed during the patient’s stay, for outpatient treatment. Each DRG or APC is associated with a level of payment and may be adjusted from time to time, usually annually. Prospective payments are intended to cover most of the non-physician hospital costs incurred in connection with the applicable diagnosis and related procedures. However, the prospective payment amounts are typically set independently of a particular hospital’s actual costs associated with treating a particular patient and implanting a device. Therefore, the payment that a hospital would receive for a particular hospital visit would not typically take into account the cost of our products.
In international markets, health care payment systems vary significantly by country and many countries have instituted price ceilings on specific product lines. There can be no assurance that our products will be considered cost-effective by third-party payers, that reimbursement will be available or, if available, that the third-party payers’ reimbursement policies will not adversely affect our ability to sell our products profitably.
Member countries of the E.U. offer various combinations of centrally financed health care systems and private health insurance systems. The relative importance of government and private systems varies from country to country. Governments may influence the price of medical devices through their pricing and reimbursement rules and control of national health care systems that fund a large part of the cost of those products to consumers. Some jurisdictions operate positive and negative list systems under which products may only be marketed once a reimbursement price has been established. Some of these countries may require, as condition of obtaining reimbursement or pricing approval, the completion of clinical trials that compare the cost-effectiveness of a particular product candidate to currently available therapies. Some E.U. member states allow companies to fix their own prices for devices, but monitor and control company profits. The choice of devices is subject to constraints imposed by the availability of funds within the purchasing institution. Medical devices are most commonly sold to hospitals or health care facilities at a price set by negotiation between the buyer and the seller. A contract to purchase products may result from an individual initiative or as a result of a competitive bidding process. In either case, the purchaser pays the supplier, and payment terms vary widely throughout the E.U. Failure to obtain favorable negotiated prices with hospitals or health care facilities could adversely affect sales of our products.
Employees
As of December 31, 2014, we had 69 employees, of which all are full-time employees. None of our employees are represented by a labor union or covered by a collective bargaining agreement. We consider our relations with our employees to be good.
Our business faces many risks. We believe the risks described below are the material risks that we face. However, the risks described below may not be the only risks that we face. Additional unknown risks or risks that we currently consider immaterial, may also impair our business operations. If any of the events or circumstances described below actually occurs, our business, financial condition or results of operations could suffer, and the trading price of our CDIs could decline significantly. You should consider the specific risk factors discussed below, together with the cautionary statements under the caption “Forward-Looking Statements” and the other information and documents that we file from time to time with the Securities and Exchange Commission, or SEC.
21
Table of Contents
Risks Related to Our Business
We depend heavily on the success of our lead product, EndoBarrier, which is at its initial stage of commercialization in select markets in Europe, South America, the Asia Pacific Region and the Middle East.
Assuming that we can obtain the required regulatory approvals in the U.S. and certain other countries, we expect to derive substantially all of our revenue from sales of our lead product, EndoBarrier, which is at its initial stage of commercialization. Accordingly, our ability to generate revenues in the future relies on our ability to market and sell this product.
The degree of market acceptance for EndoBarrier will depend on a number of factors, including:
| • | the efficacy, ease of use and perceived advantages and disadvantages of EndoBarrier over other available treatments and technologies for managing type 2 diabetes and obesity; |
| • | the prevalence and severity of any adverse events or side effects of EndoBarrier; |
| • | the extent to which physicians adopt EndoBarrier (which may be influenced by our ability to provide additional clinical data regarding the potential long-term benefits provided by EndoBarrier and the strength of our sales and marketing initiatives); and |
| • | the price of EndoBarrier and the third-party coverage and reimbursement for procedures using EndoBarrier. |
Doctors may not accept EndoBarrier as a treatment option.
The commercial success of EndoBarrier will require acceptance by physicians, who may be slow to adopt our product for the following reasons (among others):
| • | lack of long-term clinical data supporting patient benefits or cost savings over existing alternative treatments; |
| • | lack of experience with EndoBarrier and training time required before it can be used driving preferences for other products or procedures; |
| • | lack of adequate payment to the physician for implanting the device or caring for the patient (driven by availability of adequate coverage and reimbursement for hospitals and implanting physicians); and |
| • | perceived liability risks associated generally with the use of new products and procedures. |
Although we have developed relationships with physicians who are key opinion leaders in certain countries, it cannot be assured that these existing relationships and arrangements can be maintained or that new relationships will be established in support of our products. If physicians do not consider our products to be adequate for the treatment of type 2 diabetes and obesity or if a sufficient number of physicians recommend and use competing products, it could harm our business and future revenues.
We have limited sales, marketing and distribution experience.
There can be no guarantee that we will be able to effectively commercialize our products. Developing direct sales, distribution and marketing capabilities will require the devotion of significant resources and require us to ensure compliance with all legal and regulatory requirements for sales, marketing and distribution. Failure
22
Table of Contents
to develop these capabilities and meet these requirements could jeopardize our ability to market our products or could subject us to substantial liability. In addition, for those countries where we commercialize our products through distributors or other third parties, we will rely heavily on the ability of our partners to effectively market and sell our products to physicians and other end users in those countries.
We compete against companies that have longer operating histories, more established or approved products, and greater resources than us, which may prevent us from achieving market penetration with our products.
Competition in the medical device industry is intense and EndoBarrier will compete in part against more established procedures and products for the treatment of type 2 diabetes and obesity. Bariatric surgery, including gastric bypass surgery and the gastric band, have been used for many years with extensive publication histories on clinical effectiveness. Large multinational medical device companies sell supplies for these procedures and are formidable competitors to us. In addition, certain drugs have been approved, and are used, for the treatment of type 2 diabetes and obesity. Pharmaceutical companies with significantly greater resources than us market these drugs, and we may be unable to compete effectively against these companies.
Many of our competitors have significantly greater sales, marketing, financial and manufacturing capabilities than us and have established reputations and/or significantly greater name recognition. Accordingly, there is no assurance that we will be able to win market share from these competitors or that these competitors will not succeed in developing products that are more effective or economic.
Additionally, we are likely to compete with companies offering new technologies in the future. We may also face competition from other medical therapies, which may focus on our target market as well as competition from manufacturers of pharmaceutical and other devices that have not yet been developed. Competition from these companies could adversely affect our business.
We do not have data regarding the long-term benefits of EndoBarrier.
An important factor that may be relevant to market acceptance of EndoBarrier is whether it improves or maintains glycemic control and facilitates weight loss, or whether there are any other side effects, following removal of the device. While we have tested and evaluated our technology in 13 clinical trials with more than 500 patients, which in aggregate have shown that, while implanted, EndoBarrier is an effective treatment for type 2 diabetes and obesity, we do not yet have sufficient data to demonstrate any longer-term benefits of our product in the treatment of type 2 diabetes and obesity following removal of the device from the patient.
We are continuing to monitor some patients who were implanted in our clinical trials after device removal to determine the ongoing effects and longevity of results, however, we do not currently have long-term data that supports the safety and efficacy of EndoBarrier. Accordingly, we cannot provide assurance that the long-term data, once obtained, will prove lower HbA1c levels compared to alternative treatment options for type 2 diabetes. If the results obtained from our clinical trials indicate that EndoBarrier is not as safe or effective as other treatment options or as effective as our current short-term data would suggest, EndoBarrier may not be approved, or its adoption may suffer and our business would be harmed.
If we fail to obtain and maintain adequate levels of reimbursement for our products by health insurers and other third-party payers, there may be no commercially viable markets for our products or the markets may be much smaller than expected.
Health care providers, including hospitals and physicians that purchase our products, generally rely on third-party payers, particularly government-sponsored health care and private health insurance providers, to pay for all or a portion of the costs of the procedures, including the cost of the products used in such procedures. Reimbursement and health care payment systems vary significantly by country. Third-party payers may attempt to limit coverage and the level of reimbursement of new therapeutic products.
23
Table of Contents
If we fail to obtain and maintain adequate levels of reimbursement for our products by health insurers and other third-party payers, there may be few commercially viable markets for our products or the markets may be much smaller than expected. Third-party payers may demand additional clinical data requiring new clinical trials or economic models showing the cost savings of using our product, each of which would consume resources and may delay the decision on reimbursement. If the results of such studies are not satisfactory to third-party payers, then reimbursement may not be received in an acceptable amount or at all. In addition, the efficacy, safety, performance and cost-effectiveness of our products in comparison to any competing products or therapies may determine the availability and level of reimbursement.
We believe that future reimbursement may be subject to increased restrictions both in the U.S. and in international markets. Future legislation, regulation or reimbursement policies of health insurers or third-party payers may adversely affect the demand for our current and future products or limit our ability to sell these products on a profitable basis.
We cannot predict the outcome and timing of our current and future human clinical trials of EndoBarrier products.
The results of our current and future human clinical trials cannot be predicted. If any EndoBarrier products or other new products that we are developing and testing cause serious adverse events in our current or future human clinical trials, then these trials may need to be delayed or halted. In addition, these clinical trials may not produce positive safety or efficacy results, or may produce results that are not as favorable as those seen in previous clinical trials.
Negative safety or efficacy results of current or future human clinical trials could require that we attempt to modify our products or technology to address these issues and there is no guarantee that any potential modifications would be able to be successfully developed.
If current or future human clinical trials of EndoBarrier products do not meet the required clinical specifications or cause serious adverse or unexpected events, then these results could also materially impact product sales and reimbursement where we are currently selling our product, and could affect regulatory approvals and adoption in countries where our product is being or has been introduced or regulatory approvals to seek to expand the use of EndoBarrier. If we are not able to adequately address any adverse or unexpected events through training, education, changes in product design or product claims, this may significantly impair the commercial prospects for EndoBarrier.
In order to commercialize our products in the U.S. and certain other countries, we will need to obtain regulatory and other approvals. If we are unable to achieve or are delayed in achieving such approvals, this could have a significant effect on the time it takes to commercialize our technology in the U.S. and certain other countries.
At present, our only product that is approved for marketing and sale is EndoBarrier, which has received CE Mark approval in the E.U. and has been approved for inclusion on the Australian Register of Therapeutic Goods. There is no guarantee that we will obtain the necessary approvals from regulatory bodies, including the FDA in the U.S., to commercialize EndoBarrier or any of our other products. In the U.S., there is no guarantee that the pivotal trial will be able to be completed in accordance with our anticipated timeline, that patients will be enrolled at acceptable rates or that clinical results obtained from the pivotal trial will be sufficient to obtain FDA approval to commercialize EndoBarrier in the U.S. The FDA could also request that we carry out additional lengthy and expensive clinical trials before the FDA allows us to submit for regulatory approval of EndoBarrier, or our other products. The regulatory authorities in other countries may also require additional clinical trials. Necessary regulatory approvals could also be delayed, which could significantly impact our ability to achieve our timeline and commercialize our technology in the U.S. and other countries.
24
Table of Contents
Our products are subject to extensive, dynamic and ongoing regulation in the E.U. and the other areas and countries where we sell EndoBarrier, which may impede or hinder the approval or sale of our products and, in some cases, may ultimately result in our inability to obtain approval of certain products or may result in the recall or seizure of previously approved products.
The medical device industry is regulated extensively by governmental authorities, principally the FDA and corresponding state and foreign regulatory agencies and authorities, such as the E.U., legislative bodies and the European Economic Area, or EEA, Member State Competent Authorities. Before we can market our products in the E.U., and in many other parts of the world, we must obtain CE Mark certification, which indicates that a product meets the essential requirements of applicable E.U. Directives and has been subject to the appropriate conformity assessment route. This conformity assessment procedure is often done through a self-certification, but depending on the type of product, may also require verification by an independent certification body, called a “Notified Body.” Notified Bodies will also periodically audit us to ensure that we remain in compliance with the applicable requirements. The CE Mark allows free movement of products in the E.U., the EEA and Switzerland although any of the member countries may require medical devices to be registered and also impose requirements relating to the language of the device information. Many non-European countries also recognize and accept the CE Mark. If we cannot support our performance claims and demonstrate continued compliance with the applicable E.U. requirements, we could lose our right to affix the CE Mark to our products, which would prevent us from selling our products within the territory and in other countries that recognize the CE Mark.
In addition, even after we receive regulatory approval of our products in existing markets, we are subject to ongoing regulatory requirements relating to our existing products in those markets. These include the requirement to timely file various reports with regulatory authorities in the countries in which we market our products, including reports of adverse events including events that may have caused or contributed to a death or serious injury and malfunctions that would likely cause or contribute to a death or serious injury if the malfunction were to recur. If these reports are not timely filed, regulators may impose sanctions, including temporarily suspending our market authorizations or CE Mark, and sales of EndoBarrier may suffer. In that case, we may be subject to product liability or regulatory enforcement actions, all of which could harm our business. Our failure to comply with EEA or other foreign regulations applicable in the countries where we operate could lead to the issuance of warning letters or untitled letters, the imposition of injunctions, suspensions or loss of regulatory clearance or approvals, product recalls, termination of distribution, product seizures or civil penalties. In the most extreme cases, criminal sanctions or closure of our manufacturing facilities are possible.
In some countries, we rely on our foreign distributors and agents to assist us in complying with foreign regulatory requirements, and we cannot be sure that they will always do so. If we or any of our suppliers, distributors, agents or customers fail to comply with applicable requirements, we may face:
| • | adverse publicity; |
| • | investigations by governmental authorities; |
| • | fines and prosecutions; |
| • | increased difficulty in obtaining required approvals; |
| • | losses of approvals already granted; |
| • | delays in purchasing decisions by customers or cancellation of existing orders; and |
| • | the inability to sell our products in or to import our products into such countries. |
Regulatory requirements affecting the development, manufacture and sale of medical devices are evolving and subject to future change. We cannot predict what impact, if any, those changes might have on our
25
Table of Contents
business. Failure to comply with regulatory requirements could have a material adverse effect on our business, financial condition and results of operations. Later discovery of previously unknown problems with a product or manufacturer could result in fines, delays or suspensions of regulatory approvals. The failure to receive product approval on a timely basis, or the withdrawal of product approval by regulatory agencies could have a material adverse effect on our business, financial condition or results of operations.
We have a history of net losses and we may never achieve or maintain profitability.
We are a medical device company with a limited history of operations and have only recently begun to commercialize our products. We have incurred net losses since our inception, including net losses of approximately $26.8 million, $35.6 million and $48.2 million for the fiscal years ended December 31, 2012, 2013 and 2014, respectively. As of December 31, 2014, our accumulated deficit was approximately $199.9 million. Although we have started to generate revenues from sales in Europe, South America, the Asia Pacific region and the Middle East, we expect to continue to incur operating losses for the foreseeable future as we incur costs, including those associated with building a sales and marketing organization to commercialize our products, conducting clinical trials to test our products, attempting to secure regulatory approvals for our products (in the U.S. and other countries) and increased costs associated with being a public company in the U.S. with equity securities listed on the Australian Securities Exchange, or ASX.
We cannot predict the extent of our future operating losses and accumulated deficit, and we may never generate sufficient revenues to achieve or sustain profitability.
Claims that our current or future products infringe or misappropriate the proprietary rights of others could adversely affect our ability to sell those products and cause us to incur additional costs.
If any third-party intellectual property claim against us is successful, we could be prevented from commercializing EndoBarrier or our other products.
There are numerous issued patents and pending patent applications in the U.S. and internationally that are owned by third parties and that contain patent claims in areas that are the focus of our product development efforts. We are aware of patents owned by third parties, to which we do not have licenses, that relate to, among other things, liner materials and anchoring. We have also employed individuals who were previously employed at other medical device companies, including competitors or potential competitors which may result in claims from third parties that we have inadvertently or otherwise used or disclosed alleged trade secrets or other proprietary information of former employers of our employees.
In addition, because patent applications can take many years to issue, there may be currently-pending applications, unknown to us, which may later result in issued patents that pose a material risk to us.
We expect that we could be subject to third-party infringement claims if our product sales increase, the number of competitors grows and the functionality of products and technology in different industry segments overlap. Third parties may currently have, or may eventually be issued, patents on which our current or future technologies may infringe.
If we are unable to obtain, maintain and enforce intellectual property protection covering our products, others may be able to make, use, or sell products substantially the same as ours, which could adversely affect our ability to compete in the market.
Our commercial success is dependent in part on obtaining, maintaining and enforcing intellectual property rights, including patents, covering EndoBarrier and our future products. If we are unable to obtain, maintain and enforce intellectual property protection covering our products, others may be able to make, use or sell products that are substantially the same as ours without incurring the sizeable development costs that we have incurred, which would adversely affect our ability to compete in the market.
26
Table of Contents
Even if our patents are determined by a court to be valid and enforceable, they may not be sufficiently broad to prevent others from marketing products similar to ours or designing around our patents, despite our patent rights, nor may they provide us with freedom to operate unimpeded by the patent rights of others.
In addition to patented technology, we rely on a combination of non-patented proprietary technology, trade secrets, processes, procedures, technical knowledge and know-how accumulated or acquired since inception. Any of our intellectual property rights could be challenged, invalidated, circumvented or misappropriated. In order to preserve and enforce our patent and other intellectual property rights, we may need to make claims or file lawsuits against third parties. This can entail significant costs and divert management’s attention from developing and commercializing EndoBarrier.
We rely on suppliers for certain key components in the manufacture of the EndoBarrier system.
We rely on suppliers for several key components of EndoBarrier, in particular the material used to manufacture the sleeve used in EndoBarrier. We do not presently have supply agreements with any of these suppliers. Our reliance on third-party suppliers subjects us to risks that could harm our business, particularly with respect to the supply of key components or processes. Although we believe that alternative suppliers are available, the process of identifying and qualifying new suppliers who can produce the components to our specifications could cause delays in the commercialization of our products.
The use, misuse or off-label use of our products by physicians may harm our image in the marketplace or result in injuries that lead to product liability.
We cannot prevent a physician from using EndoBarrier for purposes outside of its approved and intended use, which is known as off-label use. If physicians attempt to use our products off-label, there may be an increased risk of adverse events. Further, the use of our products for uses other than those uses for which our products have been approved may not effectively treat such conditions, which could harm our reputation in the marketplace among physicians and patients.
Physicians may also misuse our products or use improper techniques if they are not adequately trained, potentially leading to injury and an increased risk of product liability for us. Physicians may also treat patients from other countries where the product is not approved and the physician is then unable to properly monitor the patient’s progress. If we are deemed to have engaged in the promotion of any of our products for off-label use, we could be subject to action by regulatory authorities and the imposition of sanctions, which could also affect our reputation and position within the industry.
We may need substantial additional funding and may be unable to raise capital when needed.
As we have only recently commenced commercial sales of our products, we are only generating a small amount of revenue and are not cash flow positive or profitable. Our net revenue from product sales was approximately $2.8 million for the year ended December 31, 2014. To the extent that our existing capital is insufficient to meet our requirements (including the costs of commercializing our products, conducting clinical trials, obtaining regulatory approvals and investing in the expansion of our manufacturing capacity) and cover any losses, we will need to raise additional funds through financings or borrowings. Failure to raise additional funds could delay, reduce or halt our commercialization and clinical trial efforts.
There is no assurance that additional funding will be available to us in the future or be secured on acceptable terms. If adequate funding is not available, we may be required to significantly reduce our operations, including our commercial activities and research and development programs. If adequate funds are not available, our business will be materially and adversely affected.
Product liability claims could damage our reputation or adversely affect our business or financial position.
We may be exposed to the risk of product liability claims, which are inherent in the design, manufacturing, marketing and use of medical devices and, in particular, implantable medical devices. We hold
27
Table of Contents
product liability insurance; however, adequate product liability insurance may not continue to be available on commercially-acceptable terms. Product liability claims may damage our reputation and, if our insurance coverage proves inadequate, may harm or destroy our business. Defending a suit, regardless of its merits, could be costly and could divert our management’s attention from our core business activities.
We have limited manufacturing capabilities and personnel and our manufacturing facilities are required to comply with regulatory requirements.
Completion of our current and future clinical trials and commercialization of our products require access to manufacturing facilities that meet applicable regulatory standards to manufacture a sufficient supply of our products. We currently manufacture EndoBarrier at our facility in Lexington. Our lease for this property expires in December 2016 and while we believe we can acquire suitable alternative space, a disruption to manufacturing could adversely affect our business.
Suppliers of components and products used to manufacture our products must also comply with applicable regulatory requirements. These often require significant time, resources, record-keeping and quality assurance efforts and subject us and our suppliers to potential regulatory inspections and stoppages. Compliance with applicable regulatory requirements is subject to continual review and is rigorously monitored by regulatory authorities. Failure by us to comply with regulatory requirements or failure to take satisfactory corrective action in response to an adverse inspection could result in enforcement actions that could disrupt manufacturing or sales of EndoBarrier.
In order to manufacture EndoBarrier in the quantities that we anticipate will be required to meet our clinical trial needs and market demand, we will need to increase production capacity and efficiency over current levels. There are significant technical and regulatory challenges to increasing production capacity and efficiency, and developing commercial-scale manufacturing facilities will require the investment of additional funds and hiring and retaining additional management and technical personnel who have the necessary manufacturing experience. If we are unable to manufacture a sufficient or consistent supply of EndoBarrier or any other product we are developing, or if we cannot do so efficiently, our revenue, business and financial prospects would be adversely affected.
We may be unable to effectively manage our anticipated growth.
To manage continued growth and to commercialize our products, we will need to expand our operations (research and development, product development, quality, regulatory, manufacturing, sales, marketing and administrative). This expansion will place a significant strain on our management, infrastructure and operational and financial resources. Specifically, we will need to manage relationships with various persons and entities participating in our clinical trials, quality systems, manufacturers, suppliers and other organizations, including various regulatory bodies in the U.S. and other jurisdictions. We may not be able to implement the required improvements in an efficient and timely manner and may discover deficiencies in existing systems and controls. The failure to accomplish any of these tasks could materially harm our business and our ability to commercialize EndoBarrier. As a result, our revenue, business and financial prospects would be adversely affected.
If we are unable to retain or hire key personnel, we may not be able to sustain or grow our business.
Our ability to operate successfully and manage our potential future growth depends significantly upon our ability to attract, retain and motivate highly-skilled and qualified research, technical, clinical, regulatory, sales, marketing, managerial and financial personnel. The competition for qualified employees in the medical device industry is intense and there are a limited number of persons with the necessary skills and experience.
Our performance is substantially dependent on our senior management and key technical staff to continue to develop and manage our operations. The loss or the inability to recruit and retain high-caliber staff could have a material adverse effect on us. We also rely on the technical and management abilities of certain key
28
Table of Contents
directors, key members of our executive team and employees, consultants and scientific advisers. The loss of any of these directors, members of the executive team, employees, consultants or scientific advisers could have an adverse effect on our business.
We will incur increased costs as a result of being a public company in the U.S. whose equity securities are listed on the Australian Securities Exchange and we have no experience as a public company.
As of December 31, 2013, as the number of holders of our shares exceeded the maximum number, we became subject to the periodic reporting requirements of the Securities Exchange Act of 1934, as amended (the “Exchange Act”). Although the existing listing of our Chess Depository Interests, or CDIs, on the ASX requires us to file financial information and make certain other filings with the ASX, our status as a reporting company under the Exchange Act will cause us to incur additional legal, accounting and other expenses that we have not previously incurred, including costs related to compliance with the requirements of the Sarbanes-Oxley Act of 2002. We have submitted an application for a listing on NASDAQ, which has its own rules and regulations with which we will need to comply. We expect all of these rules and regulations to increase our legal and financial compliance costs and to make some activities more time-consuming and costly. We also expect all of these rules and regulations may make it more difficult and more expensive for us to obtain director and officer liability insurance and we may be required to accept reduced policy limits and coverage or incur substantially higher costs to obtain the same or similar coverage. As a result, it may be more difficult for us to attract and retain qualified individuals to serve on our Board or as executive officers. We cannot predict or estimate the amount of additional costs we may incur or the timing of such costs.
Our shares of our Common Stock are publicly traded on the ASX in the form of CDIs. As a result, we must comply with the ASX Listing Rules. We have policies and procedures that we believe are designed to provide reasonable assurance of our compliance with the ASX Listing Rules. If, however, we do not follow those procedures and policies, or they are not sufficient to prevent non-compliance, we could be subject to liability, fines and lawsuits. These laws, regulations and standards are subject to varying interpretations and, as a result, their application in practice may evolve over time as new guidance is provided by regulatory and governing bodies. We intend to invest resources to comply with evolving laws, regulations and standards, and this investment may result in increased general and administrative expenses and a diversion of management’s time and attention from revenue-generating activities to compliance activities. If, notwithstanding our efforts to comply with new laws, regulations and standards, we fail to comply, regulatory authorities may initiate legal proceedings against us and our business may be harmed.
Investors could lose confidence in our financial reports, and the value of our CDIs and Common Stock may be adversely affected, if our internal controls over financial reporting are found not to be effective by management or by an independent registered public accounting firm or if we make disclosure of existing or potential significant deficiencies or material weaknesses in those controls.
As a public company in the U.S., we will be required, pursuant to Section 404 of the Sarbanes-Oxley Act of 2002, or Section 404, to furnish a report by management on, among other things, the effectiveness of our internal control over financial reporting as of the end of the fiscal year. Our first report on compliance with Section 404 will be furnished in connection with our financial statements for the year ended December 31, 2014. Additionally, our independent registered public accounting firm will be required to issue a report on management’s assessment of our internal control over financial reporting and a report on their evaluation of the operating effectiveness of our internal control over financial reporting. Our auditor’s first report on our compliance with Section 404 is expected to be in connection with our annual report on Form 10-K following the date on which we are no longer an emerging growth company. The controls and other procedures are designed to ensure that information required to be disclosed by us in the reports that we file with the SEC, is disclosed accurately and is recorded, processed, summarized and reported within the time periods specified in SEC rules and forms. We have been engaged in a process to document and evaluate our internal control over financial reporting to the requirements of Section 404. Despite our efforts, there is a risk that we will not be able to conclude, from time to time, that our internal control over financial reporting is effective as required by Section 404.
29
Table of Contents
We continue to evaluate our existing internal controls over financial reporting against the standards adopted by the Public Company Accounting Oversight Board. During the course of our ongoing evaluation of the internal controls, we may identify areas requiring improvement, and may have to design enhanced processes and controls to address issues identified through this review. Remediating any deficiencies, significant deficiencies or material weaknesses that we or our independent registered public accounting firm may identify may require us to incur significant costs and expend significant time and management resources. We cannot assure you that any of the measures we implement to remedy any such deficiencies will effectively mitigate or remedy such deficiencies. The existence of one or more material weaknesses could affect the accuracy and timing of our financial reporting. Investors could lose confidence in our financial reports, and the value of our CDIs and Common Stock may be adversely affected, if our internal controls over financial reporting are found not to be effective by management or by an independent registered public accounting firm or if we make disclosure of existing or potential significant deficiencies or material weaknesses in those controls.
Fluctuations in foreign currency exchange rates could adversely affect our financial results.
As our activities produce revenues and incur expenses in a variety of different currencies, we are exposed to exchange rate risk which may affect our financial performance and position. Furthermore, some of our funds may be held in Australian dollars or other currencies, while our functional currency is U.S. dollars. We are not currently hedging against exchange rate fluctuations, and consequently we will be at the risk of any adverse movement in the U.S. dollar exchange rate if we exchange funds held in one currency into another currency.
Our shares of Common Stock, in the form of CDIs, are listed on the ASX and priced in Australian dollars. However, our reporting currency is U.S. dollars. As a result, movements in foreign exchange rates may cause the price of our securities to fluctuate for reasons unrelated to our financial condition or performance and may result in a discrepancy between our actual results of operations and investors’ expectations of returns on our securities expressed in Australian dollars.
Risks Related to Our Industry
The medical device industry is subject to rapid technology change, which may result in obsolescence of our products.
The medical device industry is subject to rapid technology change. In order for us to remain competitive and to retain and build market share, we must continually develop new products as well as improve our existing ones. Accordingly, we must devote substantial resources to research, development and commercialization activities.
There can be no assurance that we will be successful in developing competitive new products and/or improving existing products so that such products remain competitive and avoid obsolescence. There can also be no assurance that any or all of our research and development projects for new products will result in commercial products, or that if such products are successfully designed and launched, they will be profitable.
Health care reform legislation could adversely affect our future revenue and financial condition.
In recent years, there have been numerous initiatives by governments throughout the world for comprehensive reforms affecting the delivery of and payment for health care. We cannot predict the changes that will be made and the effect such changes will have on the use of EndoBarrier. Decisions to increase or decrease treatments for type 2 diabetes and/or obesity could have a material impact on our business and results of operations.
New legislation in the U.S. has also been enacted that imposes additional reporting requirements, penalties and taxes on the medical device industry. While we have adopted comprehensive compliance programs to attempt to comply with these regulations, it is possible that some of our business activities could be subject to
30
Table of Contents
challenge under one or more of such laws. If our past or present operations, or those of our independent sales agents and distributors, are found to be in violation of any of such laws or any other applicable governmental regulations, we may be subject to penalties, including civil and criminal penalties, damages, fines or exclusion from health care reimbursement.
Pricing pressures in the health care industry could lead to further demands for price concessions, which could have an adverse effect on our business, financial condition or results of operations.
Due to the significant rise in health care costs over the past decade, numerous initiatives and reforms initiated by governments and third-party payers to curb these costs have resulted in difficulties in maintaining or raising the number and price of procedures. The increase in pricing pressure is driven by the competitive environment in the medical device industry as many larger companies cut prices as they struggle to retain market share.
The type 2 diabetes and obesity market has seen increasing resistance from payers with regard to local and national reimbursement coverage. We expect that market demand, government regulation, third-party reimbursement policies and societal pressures will continue to exert downward pressure on the prices of our products and may adversely impact our business, financial condition or results of operations.
International operations subject us to certain operating risks, which could adversely impact our net revenues, results of operations and financial condition.
While our products are manufactured in the U.S., sales of our products are currently only made in select markets in Europe, South America, the Asia Pacific region and the Middle East. As we seek to expand into the U.S. and additional foreign markets, we will be subject to new business risks, including failure to fulfill regulatory requirements on a timely basis, or at all, to market EndoBarrier or other future products; difficulties in managing foreign relationships and operations, including relationships we establish with foreign partners, distributors, or sales or marketing agents; adapting to the differing laws and regulations, business and clinical practices, and patient preferences in various countries; difficulty in collecting accounts receivable and longer collection periods; costs of enforcing contractual obligations in foreign jurisdictions; recessions in relevant foreign countries; political instability and unexpected changes in diplomatic and trade relationships, currency exchange fluctuations and potentially adverse tax consequences.
The sale and shipment of our products across international borders, as well as the purchase of components and products from international sources, could subject us to extensive U.S. and other governmental trade, import and export, and custom regulations and laws. Compliance with these regulations is costly and exposes us to penalties for non-compliance.
Other laws and regulations that can significantly impact us include various anti-bribery laws, including the U.S. Foreign Corrupt Practices Act, anti-boycott, anti-kickback, false claims and fraud laws, as well as laws protecting the confidentiality of patient health information. Any failure to comply with applicable legal and regulatory obligations could impact us in a variety of ways, including, but not limited to, civil and administrative penalties, denial of export privileges, seizure of shipments and restrictions on certain business activities.
Manufacturing facilities for medical devices must comply with applicable regulatory requirements.
Completion of our current and future clinical trials and commercialization of our products requires access to manufacturing facilities that meet applicable regulatory standards to manufacture a sufficient supply of our products. Suppliers of components and products used to manufacture our products must also comply with applicable regulatory requirements, which often require significant time, money, resources and record-keeping and quality assurance efforts and subject us and our suppliers to potential regulatory inspections and stoppages.
Compliance with applicable regulatory requirements is subject to continual review and is rigorously monitored through periodic inspections by regulatory authorities. Failure by us to comply with regulatory
31
Table of Contents
requirements or failure to take satisfactory corrective action in response to an adverse inspection could result in enforcement actions, including a public warning letter, a shutdown of, or restrictions on, our manufacturing operations, delays in approving or clearing a product, refusal to permit the import or export of our products or other enforcement action.
Risks Related to Our CDIs and Our Common Stock
There is no current trading market for our Common Stock in the U.S. and no such market may develop.
Although our CDIs are currently listed on the ASX in Australia, there is not any current trading market for our CDIs or the underlying shares of Common Stock in the U.S. We have submitted an application to list our shares on NASDAQ; however, there is no certainty that we will be successful in achieving a listing. As a result, no trading market for our Common Stock may develop in the U.S. and you may not be able to transfer or resell your CDIs at their fair value, or at all.
We are eligible to be treated as an “emerging growth company” as defined in the Jumpstart Our Business Startups Act of 2012, and we cannot be certain if the reduced disclosure requirements applicable to emerging growth companies will make our Common Stock less attractive to investors.
We are an “emerging growth company”, as defined in the JOBS Act. For as long as we continue to be an emerging growth company, we may take advantage of exemptions from various reporting requirements that are applicable to other public companies that are not emerging growth companies, including (1) not being required to comply with the auditor attestation requirements of Section 404 of the Sarbanes-Oxley Act of 2002, (2) reduced disclosure obligations regarding executive compensation in our periodic reports and proxy statements and (3) exemptions from the requirements of holding a nonbinding advisory vote on executive compensation and stockholder approval of any golden parachute payments not previously approved. We could be an emerging growth company until the last day of the fiscal year following the fifth anniversary of the date of the first sale of our common equity securities pursuant to an effective Securities Act registration statement, although circumstances could cause us to lose that status earlier, including if the market value of our Common Stock held by non-affiliates exceeds $700.0 million as of any June 30 before that time or if we have total annual gross revenue of $1.0 billion or more during any fiscal year before that time, in which cases we would no longer be an emerging growth company as of the following December 31 or, if we issue more than $1.0 billion in non-convertible debt during any three-year period before that time, we would cease to be an emerging growth company immediately. We cannot predict if investors will find our Common Stock less attractive because we may rely on these exemptions. If some investors find our Common Stock less attractive as a result, there may be a less active trading market for our Common Stock and our stock price may be more volatile.
Under the JOBS Act, emerging growth companies can also delay adopting new or revised accounting standards until such time as those standards apply to private companies. We have irrevocably elected not to avail ourselves of this exemption from new or revised accounting standards and, therefore, will be subject to the same new or revised accounting standards as other public companies that are not emerging growth companies.
Changes in economic conditions may adversely affect our business.
Changes in the general economic climate in which we operate may adversely affect our financial performance and the value of our assets. Factors that contribute to that general economic climate include:
| • | contractions in the world economy or increases in the rate of inflation; |
| • | international currency fluctuations; |
| • | changes in interest rates; |
32
Table of Contents
| • | new or increased government taxes or duties or changes in taxation laws; or |
| • | changes in government regulatory policy. |
Stock market fluctuations may adversely affect the price of our CDIs and Common Stock.
There are a number of risks associated with any stock market investment. Our CDIs have been traded on the ASX since September 7, 2011. The price of our CDIs has been, and is likely to continue to be, volatile, which means that it could decline substantially within a short period of time. For example, our closing price per CDI has ranged from A$0.20 to A$1.11 in the period from September 7, 2011 to December 31, 2014. The value of the CDIs will be determined by the stock market and will be subject to a range of factors beyond our control. These factors include movements in local and international stock exchanges, local interest rates and exchange rates, domestic and international economic and political conditions, government taxation, market supply, competition and demand and other legal, regulatory or policy changes. If we are successful in listing on NASDAQ, our Common Stock may be subject to fluctuations in price based on factors beyond our control and which may be different than those affecting our CDIs.
The trading volume of our CDIs is relatively low, which may result in reduced liquidity for our shareholders.
Our CDIs are only listed on the ASX and will not be listed for trading on any other securities exchanges in Australia, the U.S. or elsewhere. As such, there can be no guarantee that an active market in the CDIs will develop or continue, or that the market price of the CDIs will increase. If a market does not develop or is not sustained, it may be difficult for investors to sell their CDIs. Furthermore, the market price for the CDIs may fall or be made more volatile because of the relatively low volume of trading in our securities. When trading volume is low, significant price movement can be caused by trading in a relatively small number of shares.
Sales of a substantial number of CDIs, or the perception that these sales may occur, could cause the market price of our CDIs to decline. Sales by our current shareholders of a substantial number of CDIs, or the expectation that such sales may occur, could significantly reduce the market price of our CDIs. We may also offer additional CDIs in subsequent offerings, which may adversely affect the market price for the CDIs.
Some of our current shareholders can exert control over us and may not make decisions that are in the best interests of all shareholders.
As of March 13, 2015, seven shareholders and their affiliated entities owned approximately 59.3% of our outstanding shares of Common Stock, or CDIs representing Common Stock, in the aggregate. As a result, these shareholders, if they act together, would be able to exert a significant degree of influence over our management and affairs and over matters requiring shareholder approval, including the election of directors and approval of significant corporate transactions. This concentration of ownership may harm the market price of the CDIs by delaying or preventing a change in control, even if a change is in the best interests of our other shareholders.
Provisions of our Certificate of Incorporation, our Bylaws and Delaware law could make an acquisition of us more difficult.
Certain provisions of our Certificate of Incorporation and Bylaws could discourage, delay or prevent a merger, acquisition or other change of control that our shareholders may consider favorable, including transactions in which our shareholders might otherwise receive a premium for their CDIs. These provisions could also limit the price that investors might be willing to pay in the future for the CDIs, thereby depressing the market price of the CDIs. Shareholders who wish to participate in these transactions may not have the opportunity to do so. A summary of these provisions is set out in our Registration Statement on Form 10, filed with the SEC on April 30, 2014. In addition, we are incorporated in the State of Delaware and, as such, are governed by the provisions of Section 203 of the Delaware General Corporation Law, which may, unless certain criteria are met, prohibit large shareholders, in particular those owning 15% or more of the voting rights on our Common Stock, from merging or combining with us for a prescribed period of time.
33
Table of Contents
We do not intend to pay cash dividends on our Common Stock in the foreseeable future.
We have never declared or paid any cash dividends on our shares, and we currently do not anticipate paying any cash dividends in the foreseeable future. We intend to retain any earnings to finance the development and expansion of our products and business. Accordingly, our shareholders will not realize a return on their investment unless the trading price of our CDIs appreciates.
We may be subject to arbitrage risks.
Investors may seek to profit by exploiting the difference, if any, in the price of our CDIs on the ASX and the price of our Common Stock available for sale in the U.S., whether such sales would take place on a U.S. securities exchange or in the over-the-counter market or otherwise. Such arbitrage activities could cause our share price in the market with the higher value to decrease to the price set by the market with the lower value.
Our ability to use our net operating loss carryforwards and certain other tax attributes may be limited.
Our ability to utilize our federal net operating losses and federal tax credits may be limited under Sections 382 and 383 of the Internal Revenue Code. The limitations apply if an ownership change, as defined by Section 382, occurs. Generally, an ownership change occurs when certain shareholders increase their aggregated ownership by more than 50 percentage points over their lowest ownership percentage in a testing period (typically three years). We may already be subject to Section 382 limitations due to previous ownership changes. In addition, future changes in stock ownership may also trigger an ownership change and, consequently, a Section 382 limitation. Due to the significant complexity and cost associated with a change in control study, and the expectation of continuing to incur losses whereby the net operating losses and federal tax credits are not anticipated to be used in the foreseeable future, we have not assessed whether there have been changes in control since our formation. If we have experienced changes in control at any time since our formation, utilization of our net operating losses or research and development credit carryforwards would be subject to annual limitations under Section 382. Any limitation may result in expiration of a portion of the net operating loss or research and development credit carryforwards before utilization, which would reduce our gross deferred tax assets and corresponding valuation allowance. As a result, if we earn net taxable income, our ability to use our pre-change net operating loss carryforwards to offset U.S. federal taxable income may be subject to limitations, which could potentially result in increased future tax liability to us.
Other general risks.
Our future viability and profitability is also dependent on a number of other factors that affect the performance of all industries and not just the medical device industry, including (but not limited to) the following:
| • | financial failure or default by a party to any contract to which we are, or may become, a party; |
| • | insolvency or other managerial failure by any of the contractors that we use; |
| • | industrial disputes; |
| • | litigation; |
| • | natural disasters; and |
| • | acts of terrorism or an outbreak of international hostilities. |
34
Table of Contents
Item 1B. UNRESOLVED STAFF COMMENTS
None.
On May 23, 2013, we entered into a Sublease Agreement with Cambridge Technology, Inc., as sublandlord for the sublease of the premises located at 25 Hartwell Avenue, Lexington, Massachusetts that we occupy and use for our office, engineering laboratory and manufacturing operations. The subleased premises are approximately 33,339 square feet and have been designed by us for office, laboratory and manufacturing operations, including our controlled environment assembly room. These premises have also been certified to the ISO 13485:2003 medical device standard. The term of the sublease expires on December 31, 2016. There are no extension options. In the event that the lease is terminated early, and provided there is sufficient notice, we believe we could find suitable alternative premises with no interruption in operations. If the lease is terminated without notice or the premises are severely damaged there could be an impact on our operations and potentially an interruption in manufacturing, while we relocate and arrange for certification of the new premises. We believe that these premises are suitable and adequate for our needs now and for the foreseeable future.
None.
ITEM 4. MINE SAFETY DISCLOSURES
Not Applicable.
35
Table of Contents
PART II
ITEM 5. MARKET FOR REGISTRANT’S COMMON EQUITY, RELATED STOCKHOLDER MATTERS AND ISSUER PURCHASES OF EQUITY SECURITIES
Market Information
Our CDIs, each representing one-fifth of one share of our Common Stock, have been listed on the ASX under the trading symbol “GID” since September 7, 2011. Prior to such time there was no public market for our securities. Our high and low sales prices on the ASX for the respective periods are shown below, both in Australian dollars per CDI and in U.S. dollars per share of Common Stock. All currency conversions are based on the prevailing Australian dollar to U.S. dollar exchange rate applicable on the relevant date as reported by the Reserve Bank of Australia.
| Period |
High per CDI (A$) |
Low per CDI (A$) |
High per share (US$) |
Low per share (US$) | ||||
| Fiscal Year 2014: |
||||||||
| First Quarter |
0.91 | 0.54 | 3.99 | 2.48 | ||||
| Second Quarter |
0.65 | 0.48 | 3.01 | 2.24 | ||||
| Third Quarter |
0.60 | 0.40 | 2.74 | 1.85 | ||||
| Fourth Quarter |
0.50 | 0.20 | 2.09 | 0.79 | ||||
| Fiscal Year 2013: |
||||||||
| First Quarter |
0.83 | 0.56 | 4.36 | 2.90 | ||||
| Second Quarter |
0.70 | 0.55 | 3.69 | 2.57 | ||||
| Third Quarter |
0.98 | 0.55 | 4.57 | 2.52 | ||||
| Fourth Quarter |
0.86 | 0.64 | 4.15 | 2.84 |
On December 31, 2014, the last reported sale price of our CDIs was A$0.24 per CDI, or $0.98 per share of Common Stock.
As of December 31, 2014, 14,572,647 of our shares were subject to outstanding options and warrants to purchase shares of Common Stock.
Holders
As of March 13, 2015, we had 94,846,733 shares of Common Stock issued and outstanding with approximately 15 holders of record. The holders included CHESS Depositary Nominees Pty Limited, or CDN, which held 94,127,476 shares of our Common Stock in the form of CDIs on behalf of the CDI holders; there were approximately 1,236 registered owners of our CDIs on March 13, 2015.
Dividends
We have never declared or paid any dividends on our share capital and do not currently anticipate declaring or paying dividends in the foreseeable future. We currently intend to retain all of our future earnings, if any, to finance the operation and expansion of our business. Any future determination relating to our dividend policy will be made at the discretion of the Board and will depend on a number of factors, including future earnings, capital requirements, financial conditions, future prospects, contractual restrictions and covenants and other factors that the Board may deem relevant.
Equity Compensation Plan Information
The information required to be disclosed by Item 201(d) of Regulation S-K, “Securities Authorized for Issuance Under Equity Compensation Plans” is referenced under Item 12 of Part III of this Annual Report on Form 10-K.
36
Table of Contents
Corporate Performance Graph
The following performance graph and related information shall not be deemed to be “soliciting material” or to be “filed” with the SEC, nor shall such information be incorporated by reference into any future filing under the Securities Act of 1933, as amended, or the Exchange Act, except to the extent that we specifically incorporate it by reference into such filing.
The following performance graph compares the performance of our Common Stock from September 7, 2011 (the first day of trading of our CDIs) through December 31, 2014, after giving effect to the five-for-one CDI-to-Common Stock exchange ratio and after converting to U.S. dollars using the closing exchange rate applicable on the relevant date as reported by the Reserve Bank of Australia, to the performance of the NASDAQ Composite Index and the NASDAQ Medical Equipment Index from August 31, 2011 through December 31, 2014. The comparison assumes $100 was invested in our Common Stock after the market closed on September 7, 2011 and $100 was invested after the market closed on August 31, 2011 in each of the presented indices. Pursuant to applicable SEC rules, all values assume reinvestment of the full amount of all dividends, however no dividends have been declared on our Common Stock to date. The stockholder return shown on the performance graph below is not necessarily indicative of future performance, and we do not make or endorse any predictions as to future stockholder returns.
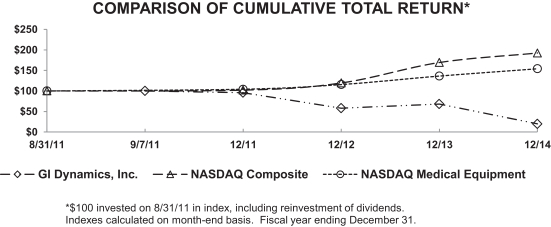
37
Table of Contents
ITEM 6. SELECTED CONSOLIDATED FINANCIAL DATA
You should read the following selected financial data together with our consolidated financial statements and the related notes appearing elsewhere in this Annual Report on Form 10-K. We have derived the consolidated statements of comprehensive loss data for the years ended December 31, 2014, 2013 and 2012 and the consolidated balance sheet data as of December 31, 2014 and 2013 from our audited financial statements included elsewhere in this Annual Report on Form 10-K. We have derived the consolidated statements of comprehensive loss data for the years ended December 31, 2011 and 2010 and the consolidated balance sheet data as of December 31, 2012, 2011 and 2010 from our audited financial statements not included in this Annual Report on Form 10-K. Our historical results for any prior period are not necessarily indicative of results to be expected in any future period.
| Years Ended December 31, | ||||||||||||||||||||
| 2014 | 2013 | 2012 | 2011 | 2010 | ||||||||||||||||
| (in thousands, except share and per share data) | ||||||||||||||||||||
| Consolidated Statement of Comprehensive Loss Data: |
||||||||||||||||||||
| Revenue |
$ | 2,828 | $ | 2,255 | $ | 668 | $ | 234 | $ | – | ||||||||||
| Cost of revenue |
4,089 | 2,492 | 1,358 | 709 | – | |||||||||||||||
|
|
|
|
|
|
|
|
|
|
|
|||||||||||
| Gross loss |
(1,261 | ) | (237 | ) | (690 | ) | (475 | ) | – | |||||||||||
| Operating expenses: |
||||||||||||||||||||
| Research and development |
26,654 | 14,676 | 11,469 | 8,558 | 9,587 | |||||||||||||||
| Sales and marketing |
10,023 | 11,011 | 7,886 | 5,017 | 1,795 | |||||||||||||||
| General and administrative |
10,252 | 8,932 | 10,085 | 10,055 | 3,334 | |||||||||||||||
|
|
|
|
|
|
|
|
|
|
|
|||||||||||
| Total operating expenses |
46,929 | 34,619 | 29,440 | 23,630 | 14,716 | |||||||||||||||
|
|
|
|
|
|
|
|
|
|
|
|||||||||||
| Loss from operations |
(48,190 | ) | (34,856 | ) | (30,130 | ) | (24,105 | ) | (14,716 | ) | ||||||||||
| Other income (expense): |
||||||||||||||||||||
| Interest income |
253 | 366 | 678 | 683 | 32 | |||||||||||||||
| Interest expense |
(1 | ) | (5 | ) | (8 | ) | (180 | ) | – | |||||||||||
| Foreign exchange (loss) gain |
(514 | ) | (955 | ) | 1,871 | (3,261 | ) | – | ||||||||||||
| Remeasurement of warrant liability |
317 | (32 | ) | 822 | 505 | – | ||||||||||||||
|
|
|
|
|
|
|
|
|
|
|
|||||||||||
| Other income (expense), net |
55 | (626 | ) | 3,363 | (2,253 | ) | 32 | |||||||||||||
|
|
|
|
|
|
|
|
|
|
|
|||||||||||
| Loss before income tax expense |
(48,135 | ) | (35,482 | ) | (26,767 | ) | (26,358 | ) | (14,684 | ) | ||||||||||
| Income tax expense |
70 | 96 | 19 | – | – | |||||||||||||||
|
|
|
|
|
|
|
|
|
|
|
|||||||||||
| Net loss |
$ | (48,205 | ) | $ | (35,578 | ) | $ | (26,786 | ) | $ | (26,358 | ) | $ | (14,684 | ) | |||||
|
|
|
|
|
|
|
|
|
|
|
|||||||||||
| Basic and diluted net loss per common share |
$ | (0.54 | ) | $ | (0.53 | ) | $ | (0.47 | ) | $ | (1.29 | ) | $ | (4.88 | ) | |||||
|
|
|
|
|
|
|
|
|
|
|
|||||||||||
| Weighted-average number of common shares used in basic and diluted net loss per common share |
89,977,549 | 67,676,938 | 57,015,561 | 20,388,841 | 3,006,219 | |||||||||||||||
|
|
|
|
|
|
|
|
|
|
|
|||||||||||
| Comprehensive loss |
$ | (48,205 | ) | $ | (35,578 | ) | $ | (26,786 | ) | $ | (26,358 | ) | $ | (14,684 | ) | |||||
|
|
|
|
|
|
|
|
|
|
|
|||||||||||
38
Table of Contents
| December 31, | ||||||||||||||||||||
| 2014 | 2013 | 2012 | 2011 | 2010 | ||||||||||||||||
| (in thousands) | ||||||||||||||||||||
| Consolidated Balance Sheet Data: |
||||||||||||||||||||
| Cash, cash equivalents and held to maturity securities |
$ | 51,191 | $ | 58,616 | $ | 41,481 | $ | 66,152 | $ | 14,279 | ||||||||||
| Working capital (excluding deferred revenue) |
49,583 | 62,110 | 42,080 | 66,541 | 13,351 | |||||||||||||||
| Total assets |
59,500 | 69,325 | 48,885 | 71,906 | 16,834 | |||||||||||||||
| Deferred revenue |
412 | 722 | 721 | 265 | – | |||||||||||||||
| Long-term debt, including current portion |
– | 58 | 125 | – | – | |||||||||||||||
| Warrants to purchase common stock |
9 | 326 | 294 | 1,116 | – | |||||||||||||||
| Total liabilities |
9,322 | 6,940 | 7,177 | 6,355 | 3,019 | |||||||||||||||
| Total stockholders’ equity |
50,178 | 62,385 | 41,708 | 65,551 | 13,815 | |||||||||||||||
ITEM 7. MANAGEMENT’S DISCUSSION AND ANALYSIS OF FINANCIAL CONDITION AND RESULTS OF OPERATION
The following discussion and analysis of our financial condition and results of operations should be read in conjunction with our consolidated financial statements and related notes to those financial statements appearing elsewhere in this Annual Report on Form 10-K. This discussion and analysis contains forward-looking statements that involve risks, uncertainties and assumptions. You should review the “Risk Factors” section of this Annual Report on Form 10-K for a discussion of important factors that could cause actual results to differ materially from the results described in or implied by the forward-looking statements described in the following discussion and analysis.
Overview
We are a medical device company headquartered in Lexington, Massachusetts, focused on the development and commercialization of effective, non-surgical approaches for the treatment of type 2 diabetes and obesity. We have commercially launched our lead product, EndoBarrier, which is now being sold in select markets in Europe, South America, the Asia Pacific region and the Middle East. In countries where reimbursement is required for broad-based use, we are endeavoring to secure such reimbursement. In other countries where patients are more accustomed to paying for all or a majority of health care expenses, we are growing such markets or pursuing regulatory approvals.
Currently, we are focused on the commercial rollout of EndoBarrier in selected countries in Europe, South America, the Asia Pacific region and the Middle East. We expect to continue to drive broad-based market awareness among patients and physicians in our commercial geographies, continue to support increasing adoption of EndoBarrier Therapy at existing medical centers, and train doctors in new medical centers. To achieve broad-based clinical acceptance and commercial uptake, reimbursement coverage by health care insurers will be required in many markets.
In certain geographies where reimbursement is necessary for clinical acceptance and commercial uptake, such as in Europe, we are already receiving partial reimbursement in certain markets at a local or national level, but we have not yet achieved full or national reimbursement in any market.
In self-pay markets where we have regulatory approval, we are currently focusing on expanding both the product use per center and the number of centers. We are also seeking regulatory approval in other countries that we believe will have a large self-pay population, such as Brazil, Colombia, Singapore and others.
On October 6, 2014, our Notified Body in the E.U. temporarily suspended our commercial product shipments labeled with a CE Mark, affecting all countries where we were currently selling EndoBarrier, pending an evaluation of the risk-benefit assessment by the Notified Body. Subsequent to this, on December 1, 2014, our Notified Body cleared the temporary suspension on our commercial product shipments as a result of a positive
39
Table of Contents
and acceptable risk-benefit profile with a recommendation to clarify the patient population in EndoBarrier’s Indication For Use. As a result of the temporary suspension of commercial product shipments, our revenue was adversely impacted in the fourth quarter of 2014.
In the U.S., we have received approval from the FDA to commence our pivotal trial, which we began in 2013. The multi-center, randomized, double-blinded study plans to enroll 500 patients with uncontrolled type 2 diabetes and obesity at 25 sites in the U.S. The primary endpoint is improvement in diabetes control as measured by HbA1c levels. As of December 31, 2014, 25 of a possible 25 clinical sites across the U.S. have initiated patient recruitment and a total of 299 patients have been enrolled in the study. Following completion of the trial, we intend to submit our results to the FDA seeking regulatory approval for commercial use in the U.S.
On March 5, 2015, we announced that the FDA recommended discontinuing placement of any additional devices in our pivotal trial of EndoBarrier Therapy in the U.S., although monitoring and data collection of patients currently enrolled in the ENDO Trial will continue. The decision to hold further enrollment resulted from four cases of hepatic abscess among the 325 subjects currently enrolled in the ENDO Trial. Hepatic abscess is a known event related to the use of EndoBarrier but has recently presented at a higher than anticipated rate in the ENDO Trial. The FDA has therefore requested additional information to further assess the risk-benefit profile of EndoBarrier in the ENDO Trial and the timing to complete this assessment is uncertain.
For financial reporting purposes, we have one reportable segment which designs, manufactures and markets medical devices for the treatment of type 2 diabetes and obesity.
To date, we have devoted substantially all of our efforts to product commercialization, research and development, business planning, recruiting management and technical staff, acquiring operating assets, and raising capital. We have incurred significant operating losses since our inception in 2003. As of December 31, 2014, we had an accumulated deficit of approximately $199.9 million. We expect to incur net losses for the foreseeable future as we continue our clinical trials, continue research and development into product improvements and next generation products, enhance our infrastructure and expand commercial markets.
We have raised net proceeds of approximately $231.5 million through sales of our equity. We generated $75.7 million in proceeds, net of expenses, through the sale of convertible preferred stock to a number of U.S. venture capital firms, two global medical device manufacturers and individuals. In September 2011, we raised approximately $72.5 million, net of expenses and repayment of $6.0 million of Convertible Term Promissory Notes, in our IPO in Australia and simultaneous private placement of CDIs to accredited investors in the U.S. In July and August 2013, we raised approximately $52.5 million, net of expenses, in an offering of our CDIs to sophisticated, professional and accredited investors in Australia, the U.S. and certain other jurisdictions. In May 2014, we raised approximately $30.8 million, net of expenses, in an offering of our CDIs to sophisticated, professional and accredited investors in Australia, Hong Kong, the United Kingdom and certain other jurisdictions. In connection with the IPO, all of our existing shares of preferred stock were converted into Common Stock.
In June 2011, we issued Convertible Term Promissory Notes to several of our shareholders totaling $6.0 million, which were repaid concurrent with the closing of our IPO with the associated gross proceeds.
Our corporate headquarters and manufacturing facility are located in Lexington, Massachusetts.
Critical Accounting Policies and Estimates
Our discussion and analysis of our financial condition and results of operations is based upon our consolidated financial statements prepared in accordance with generally accepted accounting principles in the U.S. The preparation of these financial statements requires us to make certain estimates and assumptions that may affect the reported amounts of assets and liabilities and the reported amounts of revenues and expenses
40
Table of Contents
during the reported periods and related disclosures. These estimates and assumptions, including those related to revenue recognition, inventory valuation, impairment of long-lived assets, income taxes including the valuation allowance for deferred tax assets, research and development expenses and stock-based compensation are monitored and analyzed by us for changes in facts and circumstances, and material changes in these estimates could occur in the future. We base our estimates on our historical experience and various other assumptions that are believed to be reasonable under the circumstances. Actual results may differ from our estimates under different assumptions or conditions.
We believe that our application of the following accounting policies, each of which require significant judgments and estimates on the part of management, are the most critical to aid in fully understanding and evaluating our reported financial results. Our significant accounting policies are more fully described in Note 2, “Summary of Significant Accounting Policies”, to our consolidated financial statements appearing elsewhere in this Annual Report on Form 10-K.
Revenue Recognition
We generate all of our revenue from sales of EndoBarrier to health care providers and third-party distributors who resell the product to health care providers.
We consider revenue to be realized or realizable and earned when all of the following criteria are met: persuasive evidence of a sales arrangement exists, delivery has occurred or services have been rendered, the price is fixed or determinable, and collectibility is reasonably assured. Revenue is recognized upon passage of title and risk of loss to customers, unless a consignment arrangement exists, and provided an estimate can be made for sales returns.
With respect to these criteria:
| ¡ | The evidence of an arrangement generally consists of a health care provider or distributor purchase order with the necessary approvals and acceptance by us. |
| ¡ | Transfer of title and risk and rewards of ownership are passed to the health care provider or third-party distributor upon delivery of the products. |
| ¡ | The selling prices for all sales are fixed and agreed with the health care provider or third-party distributor. Provisions for discounts and rebates to customers are established as a reduction to revenue in the same period the related sales are recorded. |
| ¡ | When doubt exists about collectibility from specific customers, we defer revenue from sales of products to those customers until payment is received. |
In certain circumstances we allow customers to return defective or nonconforming products for credit or replacement products. Defective or nonconforming products typically include those products that resulted in an unsuccessful implant procedure. We consider these transactions to be product returns and base our estimate for sales returns upon historical trends and record the amount as a reduction to revenue upon the initial sale of the product. In the event we are unable to reasonably estimate future returns, we recognize revenue when the right of return lapses. Prior to the fourth quarter of 2013, we did not have sufficient historical experience on which to base an estimate of returns, and therefore recognized revenue when the right of return lapsed. We determined this point to be when the product was implanted or otherwise consumed and payment was received from the customer, which indicated that we had no further obligations to the customer and that the sale was complete. As a result, starting in the fourth quarter of 2013, we began to recognize revenue at the time of delivery net of these return estimates. Prospectively, we will continue to evaluate whether we have sufficient data to determine return estimates as we enter new markets.
We have certain relationships in which title to delivered product passes to a buyer, but the substance of the transaction is that of a consignment arrangement. In these cases, we recognize revenue when the product is
41
Table of Contents
implanted or otherwise consumed and payment is received from the customer, which indicates that we have no further obligations to the customer and that sale is complete. For these transactions, revenue recognition is deferred until the sale is complete.
In addition, we have entered into consignment arrangements in which we deliver the product to the customer but retain title to the product until it is implanted or otherwise consumed. In these arrangements, we recognize revenue once we receive proof of third party purchase, usually in the form of a customer purchase order.
Inventory
We state inventory at the lower of first-in, first-out cost or market. We record a provision for excess, expired, and obsolete inventory based primarily on estimates of forecasted revenues. A significant change in the timing or level of demand for products as compared to forecasted amounts may result in recording additional provisions for excess, expired, and obsolete inventory in the future. When capitalizing inventory, we consider factors such as status of regulatory approval, alternative use of inventory, and anticipated commercial use of the product.
The valuation of inventory also requires us to estimate obsolete or excess inventory. We maintain reserves for excess and obsolete inventory based on forecasted product sales, new product introductions by us or our competitors, product expirations and historical experience. The inventory reserves we recognize are based on our estimates of how these factors are expected to impact the amount and value of inventory we expect to sell. The markets in which we operate are highly competitive and characterized by rapid product development and technological change, putting our products at risk of losing market share and/or becoming obsolete. Forecasting demand for EndoBarrier in a market in which there are few, if any, comparable approved devices and for which reimbursement from third-party payers is limited has been difficult. We monitor our inventory reserves on an ongoing basis, and although we consider our inventory reserves to be adequate, we may be required to recognize additional inventory reserves if future demand or market conditions are less favorable than we have estimated.
Research and Development Costs
Research and development costs are expensed when incurred. Research and development costs include costs of all basic research activities as well as other research, engineering, and technical effort required to develop a new product or service or make significant improvement to an existing product or manufacturing process. Research and development costs also include preapproval regulatory and clinical trial expenses.
Stock-Based Compensation
We account for stock-based compensation in accordance with the Financial Accounting Standards Board, or FASB, Accounting Standards Codification, or ASC, 718, Stock Compensation, or ASC 718, which requires that stock-based compensation be measured and recognized as an expense in the financial statements and that such expense be measured at the grant date fair value.
For awards that vest based on service conditions, we use the straight-line method to allocate compensation expense to reporting periods. The grant date fair value of options granted is calculated using the Black-Scholes option pricing model, which requires the use of subjective assumptions including volatility, expected term and the fair value of the underlying Common Stock, among others.
42
Table of Contents
The assumptions used in determining the fair value of stock-based awards represent management’s best estimates, but these estimates involve inherent uncertainties and the application of management judgment. As a result, if factors change, and we use different assumptions, our stock-based compensation could be materially different in the future. The risk-free interest rate used for each grant is based on a zero-coupon U.S. Treasury instrument with a remaining term similar to the expected term of the stock-based award. Because we do not have a sufficient history to estimate the expected term, we use the simplified method for estimating the expected term. The simplified method is based on the average of the vesting tranches and the contractual life of each grant. Because there was no public market for our Common Stock prior to our IPO, we lacked company-specific historical and implied volatility information. Therefore, we estimate our expected stock volatility based on that of publicly-traded peer companies, and we expect to continue to use this methodology until such time as we have adequate historical data regarding the volatility of our publicly-traded stock price. For purposes of identifying publicly-traded peer companies, we selected publicly-traded companies that develop, manufacture, and market medical devices, have operating businesses in the design and development of products that focus in the treatment of diabetes, and have sufficient trading history to derive a historic volatility rate. We have not paid and do not anticipate paying cash dividends on our shares of Common Stock; therefore, the expected dividend yield is assumed to be zero. We also recognize compensation expense for only the portion of options that are expected to vest. Accordingly, we have estimated expected forfeitures of stock options based on our historical forfeiture rate, adjusted for known trends, and used these rates in developing a future forfeiture rate. Our forfeiture rates were 5.0% as of December 31, 2014 and 2% as of December 31, 2013 and 2012. If our actual forfeiture rate varies from our historical rates and estimates, additional adjustments to compensation expense may be required in future periods.
We periodically issue performance-based awards. For these awards, vesting will occur upon the achievement of certain milestones. When achievement of the milestone is deemed probable, we expense the compensation of the respective stock award over the implicit service period.
Stock awards to non-employees are accounted for in accordance with ASC 505-50, Equity Based Payments to Non-Employees, or ASC 505-50. The measurement date for non-employee awards is generally the date performance of services required from the non-employee is complete. For non-employee awards that vest based on service conditions, we expense the value of the awards over the related service period, provided we expect the service condition to be met. We record the expense of services rendered by non-employees based on the estimated fair value of the stock option using the Black-Scholes option pricing model over the contractual term of the non-employee. The fair value of unvested non-employee awards are remeasured at each reporting period and expensed over the vesting term of the underlying stock options on a straight-line basis.
Foreign Currency Translation
The functional currency of GID Europe Holding B.V., GID Europe B.V., GID Germany GmbH and GI Dynamics Australia Pty Ltd is the U.S. dollar. Balance sheet accounts of our subsidiaries are translated into U.S. dollars using the exchange rate in effect at the balance sheet date while expenses are translated using the average exchange rate in effect during the period. Gains and losses arising from translation of our wholly owned subsidiaries’ financial statements are included in the determination of net loss.
Emerging Growth Company Status
The JOBS Act permits an “emerging growth company” such as us to take advantage of an extended transition period to comply with new or revised accounting standards applicable to public companies. We are choosing to “opt out” of this provision and, as a result, we will comply with new or revised accounting standards as required when they are adopted. This decision to opt out of the extended transition period under the JOBS Act is irrevocable.
43
Table of Contents
Results of Operations
The following is a description of significant components of our operations, including significant trends and uncertainties that we believe are important to an understanding of our business and results of operations.
| Years Ended December 31, | ||||||||||||
| 2014 | 2013 | 2012 | ||||||||||
| (in thousands) | ||||||||||||
| Revenue |
$ | 2,828 | $ | 2,255 | $ | 668 | ||||||
| Cost of revenue |
4,089 | 2,492 | 1,358 | |||||||||
|
|
|
|
|
|
|
|||||||
| Gross loss |
(1,261 | ) | (237 | ) | (690 | ) | ||||||
| Operating expenses: |
||||||||||||
| Research and development |
26,654 | 14,676 | 11,469 | |||||||||
| Sales and marketing |
10,023 | 11,011 | 7,886 | |||||||||
| General and administrative |
10,252 | 8,932 | 10,085 | |||||||||
|
|
|
|
|
|
|
|||||||
| Total operating expenses |
46,929 | 34,619 | 29,440 | |||||||||
|
|
|
|
|
|
|
|||||||
| Loss from operations |
(48,190 | ) | (34,856 | ) | (30,130 | ) | ||||||
| Other income (expense): |
||||||||||||
| Interest income |
253 | 366 | 678 | |||||||||
| Interest expense |
(1 | ) | (5 | ) | (8 | ) | ||||||
| Foreign exchange (loss) gain |
(514 | ) | (955 | ) | 1,871 | |||||||
| Remeasurement of warrant liability |
317 | (32 | ) | 822 | ||||||||
|
|
|
|
|
|
|
|||||||
| Other income (expense), net |
55 | (626 | ) | 3,363 | ||||||||
|
|
|
|
|
|
|
|||||||
| Loss before income tax expense |
(48,135 | ) | (35,482 | ) | (26,767 | ) | ||||||
| Income tax expense |
70 | 96 | 19 | |||||||||
|
|
|
|
|
|
|
|||||||
| Net loss |
$ | (48,205 | ) | $ | (35,578 | ) | $ | (26,786 | ) | |||
|
|
|
|
|
|
|
|||||||
Year Ended December 31, 2014 Compared to Year Ended December 31, 2013
| Years Ended December 31, |
Change | |||||||||||||||
| 2014 | 2013 | $ | % | |||||||||||||
| (dollars in thousands) | ||||||||||||||||
| Revenue |
$ | 2,828 | $ | 2,255 | $ | 573 | 25.4 | % | ||||||||
| Cost of revenue |
4,089 | 2,492 | 1,597 | 64.1 | % | |||||||||||
|
|
|
|
|
|
|
|||||||||||
| Gross loss |
$ | (1,261 | ) | $ | (237 | ) | $ | (1,024 | ) | 432.1 | % | |||||
|
|
|
|
|
|
|
|||||||||||
Revenue. The increase in revenue of approximately $0.6 million for the year ended December 31, 2014 compared to the year ended December 31, 2013 was primarily due to increases in sales volume in Europe, South America and the Asia Pacific region of approximately 27%, 38% and 29%, respectively, in those markets. As a result of the temporary suspension of commercial product shipments during the fourth quarter of 2014, we experienced a smaller increase in revenue than expected compared to the year ended December 31, 2013, with a corresponding decrease in gross profit. The suspension of shipments was lifted on December 1, 2014.
Cost of Revenue. The increase in cost of revenue of approximately $1.6 million for the year ended December 31, 2014 compared to the year ended December 31, 2013 was primarily related to a charge of
44
Table of Contents
approximately $1.6 million for raw material sleeve inventory in excess of our currently anticipated commercial requirements for future sales of EndoBarrier due to current evidence that the utility of certain amounts of the raw material sleeve inventory, as it was expected to be used, will be less than cost. Factors contributing to our recording the inventory write-down in the fourth quarter of 2014 which we believe relate to certain amounts of our raw material sleeve inventory that will not be utilized as originally intended and we will not be able to recover its cost included: the effect of the shipment hold on our inventory levels, the change in management and resulting changes to our commercial strategy, the expected timing of third-party payer reimbursement in our commercial markets, the uncertainty around the timing and success of our ENDO Trial and the historical accuracy of our demand forecasts. The sleeves were purchased in 2013 prior to the termination of our supply agreement with Gore. Excluding the excess inventory charge, the improvement in gross margin was the result of improved utilization of our manufacturing infrastructure. If our current estimate of future demand is inaccurate, we may need to increase the reserve related to excess raw material sleeve inventory by recording a charge to cost of revenue.
The decrease in the gross profit for the year ended December 31, 2014 compared to the year ended December 31, 2013 was primarily related to the charge associated with excess raw material sleeve inventory. We expect that our gross margin will vary, and may vary significantly, quarter to quarter and year to year due to our current stage of commercial development. Specifically, factors such as changes in volume of inventory production, utilization of our manufacturing capacity, changes in our manufacturing spending, changes in inventory reserve levels and overall economies of scale may vary as revenues change.
Operating Expenses
| Years Ended December 31, |
Change | |||||||||||||||
| 2014 | 2013 | $ | % | |||||||||||||
| (dollars in thousands) | ||||||||||||||||
| Research and development expense |
$ | 26,654 | $ | 14,676 | $ | 11,978 | 81.6 | % | ||||||||
| Sales and marketing expense |
10,023 | 11,011 | (988 | ) | (9.0 | )% | ||||||||||
| General and administrative expense |
10,252 | 8,932 | 1,320 | 14.8 | % | |||||||||||
|
|
|
|
|
|
|
|||||||||||
| Total Operating Expenses |
$ | 46,929 | $ | 34,619 | $ | 12,310 | 35.6 | % | ||||||||
|
|
|
|
|
|
|
|||||||||||
Research and Development Expense. The increase in research and development expense of approximately $12.0 million for the year ended December 31, 2014 compared to the year ended December 31, 2013 was primarily due to an increase of approximately $9.0 million in clinical trial and other clinical study related expenses, primarily third-party expenses related to our U.S. pivotal trial, such as those relating to our clinical research organization and to our clinical sites as we continued to enroll patients, and an increase of approximately $1.9 million in compensation and other employee related costs related to new hires made during 2013 and 2014 to support our research and development efforts, and an increase of approximately $1.1 million in consulting expenses.
In March 2015, the FDA placed a hold on enrollment in our U.S. pivotal trial. Monitoring and data collection involving patients currently enrolled in the U.S. pivotal trial will continue. The enrollment hold’s impact on the costs of the U.S. pivotal trial is uncertain. It is possible that in the short-term we may realize savings in patient recruiting expenses; however, the long-term costs associated with the risk mitigation strategies we implement are unknown at this time.
Sales and Marketing Expense. The decrease in sales and marketing expense of approximately $1.0 million for the year ended December 31, 2014 compared to the year ended December 31, 2013 was a result of a decrease
45
Table of Contents
of approximately $0.6 million in marketing related activities to support our commercialization efforts, as well as lower compensation and employee related expenses of approximately $0.2 million associated with a smaller number of sales and marketing employees, including the departure of our chief commercial officer.
General and Administrative Expense. The increase in general and administrative expense of approximately $1.3 million for the year ended December 31, 2014 compared to the year ended December 31, 2013 was primarily due to an increase of approximately $1.8 million in compensation, including stock-based compensation, and employee related expenses largely associated with the departure of our former chief executive officer and former chief financial officer and subsequent hiring of our current chief executive officer, partially offset by a decrease of approximately $0.2 million in legal fees primarily associated with the successful settlement of our lawsuit with Gore in January 2013 and a decrease in consulting charges of approximately $0.4 million.
Other Income (Expense), Net
| Years Ended December 31, |
Change | |||||||||||||||
| 2014 | 2013 | $ | % | |||||||||||||
| (dollars in thousands) | ||||||||||||||||
| Other income (expense): |
||||||||||||||||
| Interest income |
$ | 253 | $ | 366 | $ | (113 | ) | (30.9 | )% | |||||||
| Interest expense |
(1 | ) | (5 | ) | 4 | 80.0 | % | |||||||||
| Foreign exchange (loss) gain |
(514 | ) | (955 | ) | 441 | 46.2 | % | |||||||||
| Remeasurement of warrant liability |
317 | (32 | ) | 349 | 1,090.6 | % | ||||||||||
|
|
|
|
|
|
|
|||||||||||
| Total other income (expense), net |
$ | 55 | $ | (626 | ) | $ | 681 | 108.8 | % | |||||||
|
|
|
|
|
|
|
|||||||||||
Interest Income. The decrease in interest income of approximately $0.1 million for the year ended December 31, 2014 compared to the year ended December 31, 2013 was due to lower average interest rates, partially offset by higher average cash and cash equivalents balances.
Interest Expense. The decrease in interest expense of approximately $4,000 for the year ended December 31, 2014 compared to the year ended December 31, 2013 was the result of a reduction in debt due to payments made during the year. The debt was fully repaid in August 2014.
Foreign Exchange Loss (Gain). The decrease in foreign exchange loss of approximately $0.4 million for the year ended December 31, 2014 compared to the year ended December 31, 2013 was primarily the result of smaller relative depreciation of the Australian dollar versus the U.S. dollar.
Remeasurement of Warrant Liability. The change in the remeasurement of warrant liability of approximately $0.3 million for the year ended December 31, 2014 compared to the year ended December 31, 2013 was the result of the decrease in the fair value of the warrants issued in connection with our IPO primarily as a result of the decrease in the market value of the underlying shares of Common Stock.
Year Ended December 31, 2013 Compared to Year Ended December 31, 2012
| Years Ended December 31, |
Change | |||||||||||||||
| 2013 | 2012 | $ | % | |||||||||||||
| (dollars in thousands) | ||||||||||||||||
| Revenue |
$ | 2,255 | $ | 668 | $ | 1,587 | 237.6 | % | ||||||||
| Cost of revenue |
2,492 | 1,358 | 1,134 | 83.5 | % | |||||||||||
|
|
|
|
|
|
|
|||||||||||
| Gross loss |
$ | (237 | ) | $ | (690 | ) | $ | 453 | 65.7 | % | ||||||
|
|
|
|
|
|
|
|||||||||||
46
Table of Contents
Revenue. The increase in revenue of approximately $1.6 million for the year ended December 31, 2013 compared to the year ended December 31, 2012 was primarily due to increases in sales in Europe and South America of approximately 195% and 75%, respectively, in those markets. In these markets, the increase in sales was the result of increased unit volume. Additionally, in the year ended December 31, 2013 we had revenue from sales in Australia and Israel with no corresponding sales in these countries in the prior year. In the fourth quarter of 2013, we began to recognize revenue at the time of delivery, net of estimated future product returns. Of the approximately $1.6 million increase in revenue for the year ended December 31, 2013 compared to the year ended December 31, 2012, approximately $0.3 million of the increase is attributable to this change.
Cost of Revenue. The increase in cost of revenue of approximately $1.1 million for the year ended December 31, 2013 compared to the year ended December 31, 2012 was primarily related to the increase in sales in 2013 compared to 2012 and the expansion of manufacturing operations. The decrease in the gross loss for the year ended December 31, 2013 compared to the year ended December 31, 2012 was the result of improved utilization of our manufacturing infrastructure as we increased production volume two-fold to meet increased sales and clinical trial requirements.
Operating Expenses
| Years Ended December 31, |
Change | |||||||||||||||
| 2013 | 2012 | $ | % | |||||||||||||
| (dollars in thousands) | ||||||||||||||||
| Research and development expense |
$ | 14,676 | $ | 11,469 | $ | 3,207 | 28.0 | % | ||||||||
| Sales and marketing expense |
11,011 | 7,886 | 3,125 | 39.6 | % | |||||||||||
| General and administrative expense |
8,932 | 10,085 | (1,153 | ) | (11.4 | )% | ||||||||||
|
|
|
|
|
|
|
|||||||||||
| Total Operating Expenses |
$ | 34,619 | $ | 29,440 | $ | 5,179 | 17.6 | % | ||||||||
|
|
|
|
|
|
|
|||||||||||
Research and Development Expense. The increase in research and development expense of approximately $3.2 million for the year ended December 31, 2013 compared to the year ended December 31, 2012 was primarily due to an increase of approximately $2.7 million in third-party expenses related to our U.S. pivotal trial, such as to our clinical research organization and to our clinical sites as we began enrolling patients at the beginning of 2013, and an increase of approximately $1.3 million in employee related compensation and benefits costs related to new hires made during 2012 and 2013 to support the clinical trial effort. These increases were partially offset by a decrease of approximately $1.1 million in product development expense as we focused our efforts on the U.S. pivotal trial.
Sales and Marketing Expense. The increase in sales and marketing expense of approximately $3.1 million for the year ended December 31, 2013 compared to the year ended December 31, 2012 was a result of our investment in building our commercial infrastructure in the U.S., Europe and Australia, which includes sales, training, reimbursement and marketing. The increase was primarily a result of an increase of approximately $1.9 million in employee compensation and benefits costs, including stock-based compensation, related to new hires in the U.S., Europe and Australia and an increase of approximately $1.0 million in marketing related costs to support our commercialization efforts.
General and Administrative Expense. The decrease in general and administrative expense of approximately $1.2 million for the year ended December 31, 2013 compared to the year ended December 31, 2012 was primarily due to a decrease of approximately $2.9 million in legal fees incurred in 2012, primarily associated with the successful settlement of our lawsuit with Gore in January 2013. This decrease was partially offset by an increase of approximately $1.2 million in employee compensation and benefit costs, primarily related to stock-based compensation expense and approximately $0.6 million in professional and consulting costs.
47
Table of Contents
Other Income (Expense), Net
| Years Ended December 31, |
Change | |||||||||||||||
| 2013 | 2012 | $ | % | |||||||||||||
| (dollars in thousands) | ||||||||||||||||
| Other income (expense): |
||||||||||||||||
| Interest income |
$ | 366 | $ | 678 | $ | (312 | ) | (46.1 | )% | |||||||
| Interest expense |
(5 | ) | (8 | ) | 3 | 37.5 | % | |||||||||
| Foreign exchange (loss) gain |
(955 | ) | 1,871 | (2,826 | ) | (151.0 | )% | |||||||||
| Remeasurement of warrant liability |
(32 | ) | 822 | (854 | ) | (103.9 | )% | |||||||||
|
|
|
|
|
|
|
|||||||||||
| Total other income (expense), net |
$ | (626 | ) | $ | 3,363 | (3,989 | ) | (118.6 | )% | |||||||
|
|
|
|
|
|
|
|||||||||||
Interest Income. The decrease in interest income of approximately $0.3 million for the year ended December 31, 2013 compared to the year ended December 31, 2012 was due to lower average cash and cash equivalents balances combined with lower average interest rates.
Interest Expense. The decrease in interest expense of approximately $3,000 for the year ended December 31, 2013 compared to the year ended December 31, 2012 was primarily the result of a reduction in debt due to payments made during the year.
Foreign Exchange Loss (Gain). The decrease in foreign exchange gain of approximately $2.8 million for the year ended December 31, 2013 compared to the year ended December 31, 2012 was primarily the result of an approximately $0.8 million realized gain from the sale of Australian dollars for the year ended December 31, 2013 compared to an approximately $1.8 million realized gain from the sale of Australian dollars for the year ended December 31, 2012 and depreciation of the Australian dollar versus the U.S. dollar.
Remeasurement of Warrant Liability. The change in the remeasurement of warrant liability of approximately $0.9 million for the year ended December 31, 2013 compared to the year ended December 31, 2012 was the result of the increase in the fair value of the warrants issued in connection with our IPO, primarily as a result of the increase in the market value of the underlying shares of Common Stock.
Liquidity and Capital Resources
We have incurred losses since our inception in March 2003 and, as of December 31, 2014, we had an accumulated deficit of approximately $199.9 million. We have financed our operations from a combination of sales of equity securities and issuances of convertible term notes. In June 2011, we generated approximately $6.0 million in net proceeds from the issuance of our Convertible Term Promissory Notes. In September 2011, we generated approximately $72.5 million in proceeds, net of expenses and repayment of $6.0 million of Convertible Term Promissory Notes, from our IPO in Australia and simultaneous private placement in the U.S. In July and August 2013, we generated approximately $52.5 million in proceeds, net of expenses, from a private placement and share purchase plan of our CDIs. In May 2014, we generated approximately $30.8 million in proceeds, net of expenses, from a private placement of our CDIs. As of December 31, 2014, we had approximately $51.2 million of cash and cash equivalents.
During the year ended December 31, 2014, our cash balance decreased by approximately $7.4 million as a result of the funds utilized to support our operations, partially offset by our financing activities. We made payments related to, among other things, research and development, sales and marketing, and general and administrative expenses as we continued to invest in our continued commercialization of EndoBarrier. We also invested approximately $0.3 million in capital expenditures. These uses of cash were partially offset as we raised approximately $31.4 million during 2014, consisting of net proceeds from the sale of CDIs in our private placement in May 2014 of approximately $30.8 million and approximately $0.6 million in proceeds from the exercise of stock options.
48
Table of Contents
The following table sets forth the major sources and uses of cash for each of the periods set forth below:
| Years Ended December 31, | ||||||||||||
| 2014 | 2013 | 2012 | ||||||||||
| (in thousands) | ||||||||||||
| Net cash (used in) provided by: |
||||||||||||
| Operating activities |
$ | (38,522) | $ | (34,152) | $ | (24,557) | ||||||
| Investing activities |
(255) | (1,196) | (427) | |||||||||
| Financing activities |
31,352 | 52,483 | 313 | |||||||||
|
|
|
|
|
|
|
|||||||
| Net (decrease) increase in cash and cash equivalents |
$ | (7,425) | $ | 17,135 | $ | (24,671) | ||||||
|
|
|
|
|
|
|
|||||||
Cash Flows From Operating Activities
Net cash used in operating activities totaled approximately $38.5 million for the year ended December 31, 2014. The primary uses of cash were:
| • | to fund our net loss of approximately $48.2 million; |
| • | a net positive adjustment to cash flow from changes in working capital of approximately $3.2 million resulting primarily from an increase in accrued expenses related to restructuring charges and clinical trial accruals; and |
| • | a net positive adjustment to cash flow from non-cash items of approximately $6.5 million, primarily from stock-based compensation expense and increases in inventory reserves resulting from a charge of approximately $1.6 million for inventory in excess of our commercial requirements. |
The temporary suspension of our commercial shipments had an adverse effect on our cash flow from operating activities as a result of lower anticipated revenue in the fourth quarter of 2014. However, we do not believe our remediation efforts will have a material adverse impact on our cash flow from operations in the future.
Net cash used in operating activities totaled approximately $34.2 million for the year ended December 31, 2013. The primary uses of cash were:
| • | to fund our net loss of approximately $35.6 million; |
| • | a net negative adjustment to cash flow from changes in working capital of approximately $2.9 million resulting primarily from an increase in inventory and a decrease in accrued expenses; and |
| • | a net positive adjustment to cash flow from non-cash items of approximately $4.3 million, including approximately $3.7 million in stock-based compensation expense and approximately $0.4 million in depreciation and amortization expense. |
Net cash used in operating activities totaled approximately $24.6 million for the year ended December 31, 2012. The primary uses of cash were:
| • | to fund our net loss of approximately $26.8 million; |
| • | a net positive adjustment to cash flow from changes in working capital of approximately $0.1 million; and |
| • | a net positive adjustment to cash flow from non-cash items of approximately $2.1 million, including approximately $2.6 million in stock-based compensation expense and approximately $0.8 million in gain on remeasurement of warrant liability associated with the warrants issued in conjunction with our IPO. |
Cash Flows From Investing Activities
Cash used in investing activities for the year ended December 31, 2014 totaled approximately $0.3 million and resulted primarily from the purchase of property and equipment, principally manufacturing equipment and software.
49
Table of Contents
Cash used in investing activities for the year ended December 31, 2013 totaled approximately $1.2 million and resulted primarily from the purchase of property and equipment, principally leasehold improvements for our new facility in Lexington, MA and software to improve our information technology infrastructure.
Cash used in investing activities for the year ended December 31, 2012 totaled approximately $0.4 million and resulted primarily from the purchase of property and equipment, principally software to improve our information technology infrastructure.
Cash Flows From Financing Activities
Cash provided by financing activities for the year ended December 31, 2014 totaled approximately $31.4 million and resulted primarily from the net proceeds from our sale of CDIs in a private placement in May 2014, as well as from cash provided by stock option exercises.
Cash provided by financing activities for the year ended December 31, 2013 totaled approximately $52.5 million and resulted primarily from the net proceeds from our private placement and share purchase plan in the third quarter of 2013.
Cash provided by financing activities for the year ended December 31, 2012 totaled approximately $0.3 million and resulted primarily from cash provided by stock option exercises.
Funding Requirements
As of December 31, 2014 our primary source of liquidity was our cash and cash equivalents on hand of approximately $51.2 million. We believe our current cash balances, together with the net product revenues, will be sufficient to meet our anticipated cash requirements to fund our U.S. pivotal trial, further expand the commercialization of EndoBarrier, invest in our manufacturing and supply chain infrastructure, and to fund our currently contemplated research and development efforts through March 2016. However, it is likely that we will need to raise additional funding to continue to expand our commercial activities and fund our U.S. pivotal trial beyond that point in time.
Our forecast of the period of time through which our financial resources will be adequate to support our operations are forward-looking statements and involve risks and uncertainties, and actual results could vary materially and negatively as a result of a number of factors, including the factors discussed in the “Risk Factors” section of this Annual Report on Form 10-K. We have based these estimates on assumptions that may prove to be wrong, and we could utilize our available capital resources sooner than we currently expect.
Due to the numerous risks and uncertainties associated with the development and commercialization of EndoBarrier, we are unable to estimate precisely the amounts of capital outlays and operating expenditures necessary to complete the development of, and to obtain regulatory approval for, EndoBarrier (other than in select markets in Europe, South America, the Middle East and the Asia Pacific region) for the U.S. and other markets for which we believe EndoBarrier is suited. Our funding requirements will depend on many factors, including, but not limited to, the following:
| • | the rate of progress and cost of our commercialization activities; |
| • | the expenses we incur in marketing and selling EndoBarrier; |
| • | the timing and decisions of payer organizations related to reimbursement; |
| • | the revenue generated by sales of EndoBarrier; |
| • | the product performance from a safety and efficacy standpoint in addressing diabetes and obesity; |
| • | the success of our investment in our manufacturing and supply chain infrastructure; |
| • | the time and costs involved in obtaining regulatory approvals for EndoBarrier in new markets; |
| • | the success of our research and development efforts, including the U.S. pivotal trial; |
| • | the ability to ship CE marked products; |
| • | the emergence of competing or complementary developments; and |
| • | the costs of filing, prosecuting, defending and enforcing any patent claims and other intellectual property rights. |
50
Table of Contents
We may, from time to time, consider additional funding through a combination of collaborative arrangements, strategic alliances, and additional equity and debt financings or from other sources. We will continue to manage our capital structure and to consider all financing opportunities, whenever they may occur, that could strengthen our long-term liquidity profile. Any such capital transactions may or may not be similar to transactions in which we have engaged in the past. There can be no assurance that any such financing opportunities will also be available on acceptable terms, if at all.
Off–Balance Sheet Arrangements
We do not have any relationships with unconsolidated entities or financial partnerships, such as entities often referred to as structured finance or special purpose entities, that would have been established for the purpose of facilitating off-balance sheet arrangements (as that term is defined in Item 303(a)(4)(ii) of Regulation S-K) or other contractually narrow or limited purposes. As such, we are not exposed to any financing, liquidity, market or credit risk that could arise if we had engaged in those types of relationships. We enter into guarantees in the ordinary course of business related to the guarantee of our own performance and the performance of our subsidiaries.
Contractual Obligations and Commitments
Our most significant clinical trial expenditures are to our clinical research organizations. The contracts with clinical research organizations are cancellable, with notice, at our option and do not have any cancellation penalties. These items are not included in the table below.
Our commitments for operating leases relate to our lease of office, laboratory and manufacturing space in Lexington, Massachusetts and our leases for office space in Dusseldorf, Germany and in Baulkham Hills, Australia.
The following table summarizes our outstanding contractual obligations as of December 31, 2014:
| Total | Less Than 1 Year |
1-3 Years | 3-5 Years | More Than 5 Years | ||||||
| (in thousands) | ||||||||||
| Operating lease obligations |
$ 1,227 | $ 616 | $ 611 | $ — | $ — | |||||
Recent Accounting Pronouncements
For a discussion of recent accounting pronouncements please refer to Note 2, “Summary of Significant Accounting Policies”, to our consolidated financial statements included in this Annual Report on Form 10-K.
In May 2014, the FASB issued Accounting Standards Update, or ASU, No. 2014-09, Revenue from Contracts with Customers, or ASU 2014-09, which stipulates that an entity should recognize revenue to depict the transfer of promised goods or services to customers in an amount that reflects the consideration to which the entity expects to be entitled in exchange for those goods or services. To achieve this core principle, an entity should apply the following steps: (1) identify the contract(s) with a customer; (2) identify the performance obligations in the contract; (3) determine the transaction price; (4) allocate the transaction price to the performance obligations in the contract; and (5) recognize revenue when (or as) the entity satisfies a performance obligation. ASU 2014-09 will be effective for us for reporting periods beginning after December 15, 2016, with early adoption not permitted. We are currently evaluating the impact of the pending adoption of ASU 2014-09 on our consolidated financial statements.
In August 2014, the FASB issued ASU No. 2014-15, Presentation of Financial Statements-Going Concern: Disclosure of Uncertainties about an Entity’s Ability to Continue as a Going Concern, or ASU 2014-15. This new standard gives a company’s management the final responsibilities to decide whether there’s substantial doubt about the company’s ability to continue as a going concern and to provide related footnote disclosures. The standard provides guidance to management, with principles and definitions that are intended to reduce diversity in the timing and content of disclosures that companies commonly provide in their footnotes. Under the new standard, management must decide whether there are conditions or events, considered in the
51
Table of Contents
aggregate, that raise substantial doubt about the company’s ability to continue as a going concern within one year after the date that the financial statements are issued, or within one year after the date that the financial statements are available to be issued when applicable. This guidance is effective for annual reporting beginning after December 15, 2016, including interim periods within the year of adoption, with early application permitted. Accordingly, the standard is effective for us on January 1, 2017. The adoption of this guidance is not expected to have a material impact on our consolidated financial statements.
ITEM 7A. QUANTITATIVE AND QUALITATIVE DISCLOSURES ABOUT MARKET RISK
We develop, manufacture and sell EndoBarrier globally and our earnings and cash flows are exposed to market risk from changes in currency exchange rates and interest rates.
Interest Rate Sensitivity
Our cash and cash equivalents of $51.2 million at December 31, 2014 consisted of cash and money market funds, all of which will be used for working capital purposes. We do not enter into investments for trading or speculative purposes. The goals of our investment policy are preservation of capital, fulfillment of liquidity needs and fiduciary control of cash and investments. We also seek to maximize income from our investments without assuming significant risk. Our primary exposure to market risk is interest income sensitivity, which is affected by changes in the general level of interest rates in the U.S. and Australia. Because of the short-term nature of our cash and cash equivalents, we do not believe that we have any material exposure to changes in their fair values as a result of changes in interest rates. The continuation of historically low interest rates in the U.S. will limit our earnings on investments held in U.S. dollars.
We currently have no debt and the debt we previously held carried a fixed rate and therefore had minimal exposure to changes in interest rates.
Foreign Currency Risk
We conduct business in foreign countries. For U.S. reporting purposes, we translate all assets and liabilities of our non-U.S. entities at the period-end exchange rate and revenue and expenses at the average exchange rates in effect during the periods. The net effect of these translation adjustments is shown in the accompanying consolidated financial statements as a component of net loss.
We generate a significant portion of our revenue and collect receivables in foreign currencies. Fluctuations in the exchange rate of the U.S. dollar against major foreign currencies, including the Euro, British Pound and Australian dollar, can result in foreign currency exchange gains and losses that may significantly impact our financial results. These foreign currency transaction and translation gains and losses are presented as a separate line item on our consolidated statements of comprehensive loss. Continued fluctuation of these exchange rates could result in financial results that are not comparable from quarter to quarter. We do not currently utilize foreign currency contracts to mitigate the gains and losses generated by the re-measurement of non-functional currency assets and liabilities but do hold cash reserves in currencies in which those reserves are anticipated to be expended.
All of the proceeds from our 2011, 2013 and 2014 offerings were denominated in Australian dollars and as of December 31, 2014 we held approximately US$5.9 million denominated in Australian dollars. Accordingly, we have had and will continue to have exposure to foreign currency exchange rate fluctuations. A change of 10% or more in foreign currency exchange rates of the Australian dollar or the Euro would have a material impact on our financial position and results of operations if our revenue continues to be denominated in currencies other than the U.S. dollar or if we retain a substantial portion of our cash and cash equivalents in Australian dollars. For example during the twelve-month period ending December 31, 2014, the Australian dollar depreciated from US$0.8948 to US$0.8202 resulting in an unrealized foreign exchange loss of approximately $0.5 million.
Effects of Inflation
We do not believe that inflation and changing prices over the years ended December 31, 2014, 2013 and 2012 had a significant impact on our results of operations.
52
Table of Contents
ITEM 8. CONSOLIDATED FINANCIAL STATEMENTS AND SUPPLEMENTARY DATA
Our consolidated financial statements, together with the independent registered public accounting firm report thereon, appear at pages F-1 through F-31, of this Annual Report on Form 10-K.
ITEM 9. CHANGES IN AND DISAGREEMENTS WITH ACCOUNTANTS ON ACCOUNTING AND FINANCIAL DISCLOSURE
None.
ITEM 9A. CONTROLS AND PROCEDURES
Evaluation of Disclosure Controls and Procedures
As required by Rule 13a-15(b) of the Securities Exchange Act of 1934, or the Exchange Act, our management, including our principal executive officer and our principal financial officer, conducted an evaluation as of the end of the period covered by this Annual Report on Form 10-K of the effectiveness of the design and operation of our disclosure controls and procedures. Based on that evaluation, our principal executive officer and principal financial officer concluded that our disclosure controls and procedures are effective at the reasonable assurance level in ensuring that information required to be disclosed by us in the reports that we file or submit under the Exchange Act is recorded, processed, summarized and reported within the time periods specified in the SEC’s rules and forms. Disclosure controls and procedures include, without limitation, controls and procedures designed to ensure that information required to be disclosed by us in the reports we file under the Exchange Act is accumulated and communicated to our management, including our principal executive officer and principal financial officer, as appropriate to allow timely decisions regarding required disclosure.
Management’s Report on Internal Control Over Financial Reporting
Our management is responsible for establishing and maintaining adequate internal control over our financial reporting. Internal control over financial reporting is defined in Rules 13a-15(f) and 15d-15(f) under the Exchange Act as the process designed by, or under the supervision of, our Chief Executive Officer and effected by our board of directors, management and other personnel, to provide reasonable assurance regarding the reliability of our financial reporting and the preparation of our financial statements for external purposes in accordance with generally accepted accounting principles, and includes those policies and procedures that:
(1) pertain to the maintenance of records that, in reasonable detail, accurately and fairly reflect the transactions and dispositions of assets;
(2) provide reasonable assurance that transactions are recorded as necessary to permit preparation of financial statements in accordance with generally accepted accounting principles, and that receipts and expenditures are being made only in accordance with the authorizations of management and directors; and
(3) provide reasonable assurance regarding the prevention or timely detection of unauthorized acquisition, use or disposition of assets that could have a material effect on our financial statements.
Under the supervision and with the participation of our management, including our Chief Executive Officer, we conducted an evaluation of the effectiveness of our internal control over financial reporting based on the framework provided in Internal Control—Integrated Framework issued by the Committee of Sponsoring Organizations of the Treadway Commission. Based on this evaluation, our management concluded that our internal control over financial reporting was effective as of December 31, 2014.
Changes in Internal Control
As required by Rule 13a-15(d) of the Exchange Act, our management, including our principal executive officer and our principal financial officer, conducted an evaluation of the internal control over financial reporting
53
Table of Contents
to determine whether any changes occurred during the quarter ended December 31, 2014 that have materially affected, or are reasonably likely to materially affect, our internal control over financial reporting. Based on that evaluation, our principal executive officer and principal financial officer concluded no such changes during the quarter ended December 31, 2014 materially affected, or were reasonably likely to materially affect, our internal control over financial reporting.
Inherent Limitations on Controls and Procedures
Our management, including our principal executive officer and principal financial officer, does not expect that our disclosure controls and procedures or our internal control over financial reporting will prevent all error and all fraud. A control system, no matter how well designed and operated, can provide only reasonable, not absolute, assurance that the control system’s objectives will be met. Further, the design of a control system must reflect the fact that there are resource constraints, and the benefits of controls must be considered relative to their costs. Because of the inherent limitations in all control systems, no evaluation of controls can provide absolute assurance that all control issues and instances of fraud, if any, have been detected. Thus, misstatements due to error or fraud may occur and not be detected. These inherent limitations include the realities that judgments in decision-making can be faulty, and that breakdowns can occur because of simple error or mistake. Additionally, controls can be circumvented by the individual acts of some persons, by collusion of two or more people, or by management override of controls.
| ITEM 9B. | OTHER INFORMATION |
None.
54
Table of Contents
PART III
ITEM 10. DIRECTORS, EXECUTIVE OFFICERS AND CORPORATE GOVERNANCE
The other information required by this Item 10 related to our directors is incorporated by reference to the applicable information in our proxy statement for our 2015 Annual Meeting of Stockholders to be filed with the SEC.
Information regarding our executive officers required by this Item 10 is incorporated by reference to the applicable information in our proxy statement for our 2015 Annual Meeting of Stockholders to be filed with the SEC.
Code of Business Conduct and Ethics
We have adopted a code of business conduct and ethics applicable to our directors, executive officers and all other employees. A copy of that code is available on our corporate website at http://www.gidynamics.com. Any amendments to the code of business conduct and ethics, and any waivers thereto involving our executive officers, also will be available on our corporate website. A printed copy of these documents will be made available upon request. The content on our website is not incorporated by reference into this Annual Report on Form 10-K.
Directors of the Registrant
The following table sets forth the name, age and position of each of our directors as of March 13, 2015:
| Name |
Age | Position | ||||
| Jack E. Meyer3. |
71 | Non-executive Chairman of the Board | ||||
| Michael D. Dale. |
55 | President & Chief Executive Officer, Executive Director | ||||
| Timothy J. Barberich1, 2 |
67 | Non-executive Director | ||||
| Graham J. Bradley, AM1 |
66 | Non-executive Director | ||||
| Michael A. Carusi2, 3 |
49 | Non-executive Director | ||||
| Anne J. Keating1,3 |
61 | Non-executive Director | ||||
| Daniel J. Moore2 |
53 | Non-executive Director | ||||
1. Member of the audit committee.
2. Member of compensation committee.
3. Member of nominating and corporate governance committee.
Jack E. Meyer has served as a director of the Company since 2003 and as our chairman since June 2011. Mr. Meyer has nearly 40 years’ experience in the medical device, health care and medical technology industries including roles as chief executive officer and in sales and marketing, and has expertise in new medical technologies, commercialization, market expansion and corporate divestment, all of which make Mr. Meyer suited to serve on our board of directors.
Mr. Meyer was formerly the president and chief executive officer of Urologix, Inc., a NASDAQ-listed medical device company, from 1994 to 1998, where he was responsible for developing the company, entering into international distribution arrangements and completing several private and public financings. Mr. Meyer was also president and chief executive officer of Fiberoptic Sensor Technologies, Inc., which was acquired by C.R. Bard, from 1993 to 1994; president & chief executive officer of Carelink Corporation, which was acquired by Tokos Medical Corporation, from 1992 to 1993; executive vice president and chief operating officer of Quest Medical, Inc. from 1982 to 1991, and vice president sales and marketing of IVAC Corporation, which was acquired by Eli Lilly. Mr. Meyer also has served on the board of a number of private medical device companies and currently serves on the board of Minnetronix, Inc.
55
Table of Contents
Mr. Meyer holds a Bachelor of Science and a Masters of Business Administration, each from Drake University.
Michael D. Dale has served as our president and chief executive officer and a director since September 2014. Mr. Dale has nearly 25 years of experience of operational leadership and global commercialization experience, spanning multiple high technology, transformative medical device companies in the cardiovascular, neuromodulation and electrophysiology markets. Prior to joining the Company, from September 2012 to June 2014 Mr. Dale served as president and CEO of Helical Solutions, an early stage venture capital funded business dedicated to the treatment of atrial fibrillation. From October 2002 until its acquisition by Medtronic, Inc. in August 2010, Mr. Dale served as chief executive officer, president and chairman of the board of ATS Medical, Inc., a company that developed, manufactured, and marketed medical devices for the treatment of structural heart disease. From 1998 to 2002, Mr. Dale was Vice President of Worldwide Sales and Marketing at Endocardial Solutions, Inc., a company that developed and marketed an advanced cardiac mapping and catheter navigation system for the diagnosis and treatment of cardiac arrhythmias. From 1996 to 1998, Mr. Dale was Vice President of Global Sales for Cyberonics, Inc., a neuromodulation medical device company, and additionally was Managing Director of Cyberonics Europe S.A. From 1988 to 1996, Mr. Dale served in several capacities at cardiovascular medical device manufacturer and marketer St. Jude Medical, Inc., most recently as the Business Unit Director for St. Jude Medical Europe.
Mr. Dale currently serves on the board of directors of several private companies including Neuronetics, Inc., Preceptis Medical, Inc. and, NeoChord, Inc. Mr. Dale also serves on Purdue University’s Weldon School of Biomedical Engineering Advisory Board and the Advanced Medical Technology Association (AdvaMed) Board of Directors.
Mr. Dale holds a Bachelor of Science degree from California Polytechnic State University – San Luis Obispo.
Timothy J. Barberich has been a director of the Company since June 2011. Mr. Barberich has nearly 40 years’ experience in pharmaceutical and medical device companies, in technical, sales, marketing and management positions, including as chief executive officer and chairman of the board. Mr. Barberich is the founder and former president, chief executive officer and chairman of Sepracor, Inc., a NASDAQ-listed-pharmaceutical company based in Massachusetts, which was acquired by Dainippon Sumitomo Pharma Co., Ltd. in 2009. Mr. Barberich founded Sepracor in 1984 and served as its chief executive officer from 1984 to 2007 and chairman of the board from 1990 to 2007. From 2007 to 2008, Mr. Barberich served as executive chairman of Sepracor and then chairman of the board from 2008 to 2009. Mr. Barberich led Sepracor through its early-stage research and development, product approvals, commercialization, private financings and initial public offering, partnerships with major companies, several successful spin-outs and achievement of revenues in excess of $1 billion. Through his work at Sepracor, Mr. Barberich brings to our board invaluable knowledge and experience of leading a company in the health care industry through every stage of its life cycle. Prior to founding Sepracor, Mr. Barberich spent 10 years as a senior executive at Millipore Corporation, a company that provides separations products to the life science research, pharmaceutical, biotechnology and electronic markets. Mr. Barberich brings to our board the knowledge and experience of leading a company in the health care industry through every stage of its life cycle. We believe this experience and familiarity with the types of risks we may face, together with his broad medical device and pharmaceutical industry experience, makes Mr. Barberich uniquely suited to serve on our board.
Mr. Barberich is currently chairman of BioNevia Pharmaceuticals, Inc. and is a director of HeartWare International, Inc., a NASDAQ-listed medical device company and Verastem, Inc., a NASDAQ-listed biotechnology company. Mr. Barberich also serves on the board of several private companies including Tokai Pharmaceuticals, Inc. and Neurovance, Inc. Mr. Barberich was formerly a director of BioSphere Medical, Inc., a NASDAQ-listed biotechnology company and Gemin X Biotechnologies, Inc. and Resolvyx Pharmaceuticals, which were acquired in 2011 and 2010, respectively.
56
Table of Contents
Mr. Barberich holds a Bachelor of Science degree in Chemistry from Kings College in Pennsylvania and has taken graduate courses from the School of Chemistry at Rutgers University.
Graham J. Bradley has served as a director of the Company since June 2011. Mr. Bradley has had an extensive career spanning a range of industries across the Australian economy including banking and finance, residential and commercial property, insurance, telecommunications, mining services, minerals and energy, medical research and the arts. From 1995 to 2003, Mr. Bradley was managing director of leading listed investment management and financial services group Perpetual Limited and during his eight-year tenure, Perpetual became one of Australia’s leading listed funds management and financial services groups. Mr. Bradley’s strong financial background provides financial expertise to our board, including an understanding of financial statements, corporate finance, accounting and capital markets.
Mr. Bradley is currently chairman of ASX-listed companies Stockland Corporation Limited, where he was appointed to the board in 2004 and appointed Chairman in 2005, and Po Valley Energy Limited, where he was appointed to the board in 2004. Mr. Bradley also currently serves as chairman of HSBC Bank Australia Limited; Virgin Australia International Holdings Limited; chairman of the advisory board for Anglo American Australian Limited; a council member of the European Australian Business Council; the chairman and director of Energy Australia Holdings Limited and the chairman of Infrastructure New South Wales. From 2009 to 2011, Mr. Bradley served as the president of the Business Council of Australia, the preeminent business leadership organization in Australia representing some 120 of the largest businesses and employers. Mr. Bradley was a director of Garvan Institute for Medical Research, a leading Australian medical research organization, which includes a leading diabetes research group, for 10 years from 1999 to 2009 and also chaired the Garvan Foundation during this time. Mr. Bradley has held former roles including as chairman of Boart Longyear Limited and Proteome Systems Limited; and as a director of Singapore Telecommunications Limited, Queensland Investment Corporation and MBF Australia Limited. Prior to his role at Perpetual, Mr. Bradley was managing partner of the law firm Blake Dawson Waldron and a partner of McKinsey & Company.
Mr. Bradley holds a Bachelor of Arts and a Bachelor of Law with first class honours from the University of Sydney and a Masters of Law from Harvard University. Mr. Bradley is also a Fellow of the Australian Institute of Company Directors and was recognized as a Member of the Order of Australia in July 2009 for his services to business, the arts and medical research.
Michael A. Carusi has served as a director of the Company since 2003. Mr. Carusi has over 20 years’ experience in the life sciences and health care industry in business development, management consulting and venture capital roles. As a result of this experience, Mr. Carusi provides us financial and management experience. Since 2012, Mr. Carusi has been a general partner of Lightstone Ventures which is a venture capital firm focused on investments in the life sciences industry. Since October 1998, Mr. Carusi has been a general partner of Advanced Technology Ventures, or ATV, which is a venture capital firm focused on investments in the life sciences and technology sectors. In 2003, Mr. Carusi led the ATV investment in the Company.
Mr. Carusi is a director of private medical companies in which ATV has invested, including Altura Medical, Inc., EndoGastric Solutions, Inc., GluMetrics, Inc., PowerVision, Inc., Holaira, Inc., Second Genome, Inc., and Gynesonics, Inc. He is also a former director of ATV investee companies where he was responsible for investments and successful exits, including Ardian, Inc., which was acquired by Medtronic, Inc., Plexxikon, Inc., which was acquired by Daiichi Sankyo Co, Ltd, and MicroVention, which was acquired by Terumo Medical Corporation, and TranS1 (BAXS) which went public on NASDAQ in 2007. Prior to joining ATV, Mr. Carusi served as the director of business development for Inhale Therapeutic Systems, Inc., a pulmonary drug delivery company that listed on NASDAQ in 1994, where he led partnering activities in the US, Europe and Japan. Mr. Carusi was formerly a principal at The Wilkerson Group, a management consulting firm focused exclusively on health care. Mr. Carusi also serves as a lecturer at the Amos Tuck School of Business Administration at Dartmouth College where he also sits on the Tuck MBA Advisory Board. Previously, Mr. Carusi was a faculty member of the Stanford Biodesign Emerging Entrepreneurs Forum and an advisory board member of the UCSF/Berkeley Venture Innovation Program.
57
Table of Contents
Mr. Carusi holds a Masters of Business Administration from the Amos Tuck School of Business Administration at Dartmouth College and a Bachelors of Science in mechanical engineering from Lehigh University.
Anne J. Keating has served as a director of the Company since June 2011. Ms. Keating has had an extensive career in management and as a director of Australian companies, divisions of US companies and not-for-profit organizations. Her extensive business and governance experience makes her qualified to sit on our board of directors.
Ms. Keating is currently a director of a number of ASX-listed companies in a range of different industries, including REVA Medical, Inc., a US-based medical device company developing and commercializing bioresorbable stents for the treatment of coronary artery disease, and Goodman Group Limited.
Ms. Keating is also a director for the Garvan Institute of Medical Research (a leading research institute which studies diabetes and obesity among other diseases) and an Inaugural Governor for the Cerebral Palsy Alliance Research Foundation. Ms. Keating is a member of the Advisory Council of CIMB Australia. From 1993 to 2001, Ms. Keating held the position of general manager, Australia for United Airlines and from 1993 to 1998 she was also a governor for the American Chamber of Commerce. She was also a delegate to the Australian/American Leadership Dialogue for 14 years. Ms. Keating was an inaugural board member of the Victor Chang Cardiac Research Institute for 10 years and also served on the board of NRMA Pty Ltd, Insurance Australia Group (IAG) for 9 years and STW Ltd for 16 years. She has recently resigned as a director of Ardent Leisure Management Limited after a 15 year term. She has also held former directorships with Spencer Street Station Redevelopment Holdings Limited, Easy FM China Pty Ltd, Radio 2CH Pty Ltd and Workcover Authority of New South Wales.
Daniel J. Moore has served as a director of the Company since 2014. Mr. Moore’s extensive experience in domestic and international sales, management and operations in global medical device manufacturers makes him qualified to sit on our board of directors.
Mr. Moore has served as president, chief executive officer and director of Cyberonics, Inc., a medical technology company with core expertise in neuromodulation, since 2007. From 1989 to 2007, Mr. Moore held positions in sales, marketing, and senior management in the U.S. and in Europe at Boston Scientific Corporation, a diverse maker of minimally invasive medical products. His last position at Boston Scientific was President, International Distributor Management. Prior to that role, he held the position of President, Inter-Continental, the fourth largest business unit of Boston Scientific, with more than 1,000 global employees and revenues exceeding $700 million. Mr. Moore previously held senior management positions at several Boston Scientific U.S. and international divisions.
He currently serves as a member of the board of directors for the Epilepsy Foundation of America, the Medical Device Manufacturers Association (immediate past-Chair), and as a member of the boards or advisory boards for BioHouston, Inc. and the Weldon School of Biomedical Engineering at Purdue University. He currently serves on the board of directors of TriVascular Technologies, Inc., a publicly-traded medical technology company providing device solutions for endovascular aortic repair. He also serves on the board of privately-held BrainScope Company, Inc., a medical technology company focused on traumatic brain injury, where he serves as Chairman. Past board positions include Smiling Kids, Inc., the Epilepsy Foundation of Texas (past-Chair), the Epilepsy Foundation of Texas – Houston (past-President) and Topera, Inc. (acquired by Abbott).
By virtue of his being a director of Boston Scientific Argentina S.A. while he served as an officer for Boston Scientific, Mr. Moore is named as one of several defendants in a criminal proceeding filed in May 2011 in the Federal Court for Criminal and Correctional Matters No. 4 in Buenos Aires, Argentina. The proceeding pertains to alleged fraudulent conduct in connection with a public tender for the sale of cardiac stents in 2006. Mr. Moore has denied any knowledge of or culpability for the alleged fraudulent conduct and has urged dismissal of the charges. In December 2013, the Argentine federal court dismissed the charges, and the prosecutor appealed the dismissal. In June 2014, the court of appeals dismissed the appeal, concluding the matter as to Mr. Moore.
Mr. Moore holds a B.A. from Harvard University and earned an MBA from Boston University.
58
Table of Contents
Australian Disclosure Requirements
Because we are listed on the ASX, we are required to comply with various disclosure requirements as set out in the ASX Listing Rules. The following information is provided to comply with the ASX Listing Rules and is not intended to fulfill SEC information required by Part III of this Annual Report on Form 10-K.
Overview
Our securities are listed for quotation in the form of CHESS Depositary Interests, or CDIs, on the Australian Securities Exchange, or ASX, and trade under the symbol “GID.” Each share of our Common Stock is equivalent to five CDIs. The shareholder information below was applicable as at March 13, 2015.
Our share capital was as follows:
| Type of Security |
Number of Securities | Equivalent in CDIs | ||||||
| Common Stock |
719,257 | 3,596,285 | ||||||
| CDIs |
470,637,380 | 470,637,380 | ||||||
|
|
|
|||||||
| Total |
474,233,665 | |||||||
|
|
|
|||||||
| Options1 |
11,570,711 | 57,853,555 | ||||||
| Restricted stock units1 |
2,020,367 | 10,101,835 | ||||||
| Warrants |
500,000 | 2,500,000 | ||||||
|
|
|
|||||||
| Total |
70,455,390 | |||||||
|
|
|
|||||||
| 1. | As at March 13, 2015, an additional 6,248,840 shares of Common Stock were available for grant under our 2011 Employee, Director and Consultant Equity Incentive Plan. |
Substantial Holders
The number of CDIs held by our substantial shareholders (being shareholders who, together with their associates, have a relevant interest in at least 5% of our voting shares) assuming the conversion of Common Stock held by those shareholders into CDIs and based on the information in the substantial holder notices we received as of March 13, 2015, was as follows:
| Name of Holder |
Number of CDIs Held | % of Total CDIs | ||||||
| M&G and Affiliated Entities |
63,190,038 | 13.3 | % | |||||
| Hunter Hall Investment Management Limited and Affiliated Entities |
45,536,619 | 9.6 | % | |||||
| Capital Research Global Investors |
43,140,000 | 9.1 | % | |||||
| Medtronic, Inc. |
39,115,442 | 8.2 | % | |||||
| Advanced Technology Ventures and Affiliated Entities |
33,638,773 | 7.1 | % | |||||
| Greenlight Capital, Inc. and Affiliated Entities |
28,301,887 | 6.0 | % | |||||
| Johnson & Johnson Innovation – JJDC, Inc. |
28,278,460 | 6.0 | % | |||||
59
Table of Contents
Distribution of Equity Security Holders
There were a total of 94,846,733 shares of Common Stock on issue, 94,127,476 of which were held as CDIs (being 470,637,380 CDIs in total). The table below presents the number of shares of Common Stock and the number of CDIs on issue, as well as the number of options and warrants on issue by size of holding.
| Common Stock (unlisted) |
CDIs | Options (unlisted) |
Restricted Stock Units (unlisted) |
Warrants (unlisted) |
||||||||||||||||||||||||||||||||||||
| Number of Holders |
Number of Shares |
Number of Holders |
Number of CDIs |
Number of Holders |
Number of Shares |
Number of Holders |
Number of Shares |
Number of Holders |
Number of Shares |
|||||||||||||||||||||||||||||||
| 1 – 1,000 |
1 | 286 | 127 | 54,928 | — | — | — | — | — | — | ||||||||||||||||||||||||||||||
| 1,001 – 5,000 |
3 | 9,487 | 349 | 1,012,881 | 3 | 11,951 | — | — | — | — | ||||||||||||||||||||||||||||||
| 5,001 – 10,000 |
2 | 17,500 | 234 | 1,998,179 | 14 | 111,271 | — | — | — | — | ||||||||||||||||||||||||||||||
| 10,001 – 100,000 |
6 | 256,202 | 414 | 13,995,422 | 38 | 1,196,157 | 2 | 70,986 | 5 | 375,000 | ||||||||||||||||||||||||||||||
| 100,001 – and over |
2 | 435,782 | 112 | 453,575,970 | 24 | 10,251,332 | 1 | 1,949,381 | 1 | 125,000 | ||||||||||||||||||||||||||||||
|
|
|
|
|
|
|
|
|
|
|
|
|
|
|
|
|
|
|
|
|
|||||||||||||||||||||
| Total |
14 | 719,257 | 1,236 | 470,637,380 | 79 | 11,570,711 | 3 | 2,020,367 | 6 | 500,000 | ||||||||||||||||||||||||||||||
|
|
|
|
|
|
|
|
|
|
|
|
|
|
|
|
|
|
|
|
|
|||||||||||||||||||||
Unmarketable Parcels
As of March 13, 2015 the number of shareholders holding less than a marketable parcel (for the purposes of the ASX Listing Rules) was 374, based on the closing market price as at March 13, 2015.
60
Table of Contents
Top 20 Holders
Holders of CDIs Only
The table below provides a list of the top 20 holders of our CDIs. Related but separate legal entities are not aggregated.
| No. | Name of Holder |
Number of CDIs Held |
% of Total CDIs | |||
| 1. | HSBC Custody Nominees (Australia) Limited. | 156,706,302 | 33.3% | |||
| 2. | JP Morgan Nominees Australia Limited. | 60,542,328 | 12.9% | |||
| 3. | Medtronic, Inc. | 39,115,442 | 8.3% | |||
| 4. | HSBC Custody Nominees (Australia) Limited –GSCO ECA | 33,665,050 | 7.2% | |||
| 5. | Advanced Technology Ventures VII LP | 27,048,390 | 5.7% | |||
| 6. | Domain Partners V LP | 20,776,880 | 4.4% | |||
| 7. | Citicorp Nominees Pty Limited | 18,674,845 | 4.0% | |||
| 8. | Polaris Venture Partners IV LP | 17,198,468 | 3.7% | |||
| 9. | Merrill Lynch (Australia) Nominees Pty Limited | 10,916,888 | 2.3% | |||
| 10. | HSBC Custody Nominees (Australia) Limited –A/C 2 | 10,818,283 | 2.3% | |||
| 11. | BNP Paribas Noms Pty Ltd | 7,088,669 | 1.5% | |||
| 12. | National Nominees Limited | 5,503,260 | 1.2% | |||
| 13. | Advanced Technology Ventures VI LP | 4,517,209 | 1.0% | |||
| 14. | CHTP Funding LLC | 3,572,149 | 0.8% | |||
| 15. | Warman Investments Pty Ltd | 2,698,300 | 0.6% | |||
| 16. | Mr. Stuart Randle | 2,081,507 | 0.4% | |||
| 17. | Bellino Pty Ltd | 1,900,000 | 0.4% | |||
| 18. | Mr. Paul Cozzi | 1,600,000 | 0.3% | |||
| 19. | Moore Family Nominee Pty Ltd | 1,480,000 | 0.3% | |||
| 20. | ABN AMRO Clearing Sydney Nominees Pty Ltd. | 1,417,464 | 0.3% | |||
|
|
| |||||
| Total CDIs held by top 20 CDI holders |
427,321,434 | 90.9% | ||||
| Total CDIs held by all other CDI holders |
43,315,946 | 9.1% | ||||
61
Table of Contents
Holders of CDIs and Common Stock Combined
The table below provides a list of the top 20 holders of our securities taking into account securities held in the form of both Common Stock and CDIs. Information presented below is prepared on the assumption that all shares of Common Stock on issue are held as CDIs. Related but separate legal entities are not aggregated.
| No. |
Name of Holder |
Number of CDIs Held |
% of Total CDIs | |||
| 1. | HSBC Custody Nominees (Australia) Limited. | 156,706,302 | 33.0% | |||
| 2. | JP Morgan Nominees Australia Limited | 60,542,328 | 12.8% | |||
| 3. | Medtronic, Inc. | 39,115,442 | 8.2% | |||
| 4. | HSBC Custody Nominees (Australia) Limited –GSCO ECA. | 33,665,050 | 7.1% | |||
| 5. | Advanced Technology Ventures VII LP | 27,048,390 | 5.7% | |||
| 6. | Domain Partners V LP | 20,776,880 | 4.4% | |||
| 7. | Citicorp Nominees Pty Limited | 18,674,845 | 3.9% | |||
| 8. | Polaris Venture Partners IV LP | 17,198,468 | 3.6% | |||
| 9. | Merrill Lynch (Australia) Nominees Pty Limited | 10,916,888 | 2.3% | |||
| 10. | HSBC Custody Nominees (Australia) Limited – A/C 2 | 10,818,283 | 2.3% | |||
| 11. | BNP Paribas Noms Pty Ltd | 7,088,669 | 1.5% | |||
| 12. | National Nominees Limited | 5,503,260 | 1.2% | |||
| 13. | Advanced Technology Ventures VI LP | 4,517,209 | 1.0% | |||
| 14. | CHTP Funding LLC | 3,572,149 | 0.8% | |||
| 15. | Warman Investments Pty Ltd | 2,698,300 | 0.6% | |||
| 16. | Mr. Stuart Randle | 2,081,507 | 0.4% | |||
| 17. | Bellino Pty Ltd | 1,900,000 | 0.4% | |||
| 18. | Mr. Paul Cozzi | 1,600,000 | 0.3% | |||
| 19. | Moore Family Nominee Pty Ltd. | 1,480,000 | 0.3% | |||
| 20. | ABN AMRO Clearing Sydney Nominees Pty Ltd | 1,417,464 | 0.3% | |||
|
|
| |||||
| Total securities held by top 20 CDI holders |
427,321,434 | 90.1% | ||||
| Total securities held by all other CDI holders |
46,912,231 | 9.9% | ||||
Shares of Common Stock (not listed on ASX)
There were 719,257 shares of Common Stock on issue. These shares are held by 14 individuals.
Options (not listed on ASX)
There were 11,570,711 options on issue to purchase shares of Common Stock under the 2011 Employee, Director and Consultant Equity Incentive Plan and the 2003 Omnibus Stock Plan with varying exercise prices. These options are held by 79 individuals.
Restricted Stock Units (not listed on ASX)
There were 2,020,367 restricted stock units on issue for 2,020,367 shares of Common Stock under the 2011 Employee, Director and Consultant Equity Incentive Plan. These restricted stock units are held by three individuals.
Warrants (not listed on ASX)
There were eight warrants on issue to subscribe for in aggregate 500,000 shares of Common Stock at an exercise price of A$5.50 per share. These warrants are held by six entities.
62
Table of Contents
Restricted Securities
There were no restricted securities on issue.
Voting Rights
Our bylaws provide that each shareholder has one vote for every share of Common Stock entitled to vote held of record by such shareholder and a proportionate vote for each fractional share of Common Stock entitled to vote so held, unless otherwise provided by Delaware General Corporation Law or in the certificate of incorporation.
Holders of CDIs have one vote for every five CDIs held of record by such shareholder. If holders of CDIs wish to attend our general meetings, they will be able to do so. Under the ASX Listing Rules, the Company, as an issuer of CDIs, must allow CDI holders to attend any meeting of the holders of the underlying securities unless relevant U.S. law at the time of the meeting prevents CDI holders from attending those meetings.
In order to vote at such meetings, CDI holders have the following options:
| a) | Instructing CDN, as the legal owner, to vote the shares of Common Stock underlying their CDIs in a particular manner. The instruction form must be completed and returned to our share registry prior to the meeting; |
| b) | Informing us that they wish to nominate themselves or another person to be appointed as CDN’s proxy for the purposes of attending and voting at the general meeting; and |
| c) | Converting their CDIs into a holding of shares of Common Stock and voting these at the meeting (however, if thereafter the former CDI holder wishes to sell their investment on the ASX, it would be necessary to convert the shares of Common Stock back to CDIs). This must be done prior to the record date for the meeting. |
As holders of CDIs will not appear on our share register as the legal holders of shares of Common Stock, they will not be entitled to vote at our shareholder meetings unless one of the above steps is undertaken.
Proxy forms and details of these alternatives will be included in each notice of meeting we send to CDI holders.
Holders of restricted stock units, issued but unexercised options and warrants are not entitled to vote.
Required Statements
GI Dynamics, Inc. makes the following disclosures:
| a) | There is no current on-market buy-back of our securities. |
| b) | GI Dynamics, Inc. is incorporated in the state of Delaware in the United States of America. |
| c) | GI Dynamics, Inc. is not subject to Chapters 6, 6A, 6B or 6C of the Corporations Act 2001 (Cth) dealing with the acquisitions of shares (including substantial shareholdings and takeovers). |
| d) | Under the Delaware General Corporation Law, shares are generally freely transferable subject to restrictions imposed by U.S. federal or state securities laws, by our certificate of incorporation or bylaws, or by an agreement signed with the holders of the shares at issue. Our amended and restated certificate of incorporation and bylaws do not impose any specific restrictions on transfer. Section 203 of the Delaware General Corporation Law prohibits a publicly-held Delaware corporation from engaging in a “business combination” with an “interested shareholder” for a period of three years following the time the person became an interested shareholder, unless the business combination or acquisition of shares that resulted in a shareholder becoming an interested shareholder is approved in a prescribed manner. A “business combination” can include a merger, asset or share sale, or other |
63
Table of Contents
| transaction resulting in a financial benefit to an interested shareholder. Generally, an interested shareholder is a person who, together with its affiliates and associates, owns (or within three years prior to the determination of interested shareholder status did own) 15% or more of a corporation’s voting shares. The existence of this provision would be expected to have an anti-takeover effect with respect to transactions not approved in advance by the board of directors, including discouraging attempts that might result in a premium over the market price for the shares of Common Stock held by shareholders. As a general matter, Section 203 applies solely to corporations with a class of voting stock listed on a national securities exchange in the U.S. or held of record by 2,000 or more stockholders, neither of which currently apply to us, but may at any time in the future. |
| e) | We have used the cash (and assets in a form readily convertible to cash) that we had at the time of admission to the ASX in a manner consistent with our stated business objectives (as described in the Australian prospectus lodged with the Australian Securities and Investments Commission with respect to our IPO) from the time of our admission to the ASX through to December 31, 2014. |
| f) | The securities of GI Dynamics, Inc. are not quoted on any exchange other than the ASX. |
| g) | The name of our Secretary is Robert Solomon. |
| h) | The address and telephone number of our principal registered office in Australia is: |
C/O Hawkesbury Partners Pty Limited
Level 8, 17 – 19 Bridge Street
Sydney NSW 2000
Telephone: + 61 2 9325 9046
| i) | Registers of securities are held as follows: |
| 1. | for CDIs in Australia at: |
| Link Market Services Limited |
| Level 12, 680 George Street |
| Sydney NSW 2000 |
| Telephone:+61 1300 554 474 |
| 2. | for Common Stock in the United States at: |
American Stock Transfer & Trust Company, LLC
6201 15th Avenue
Brooklyn New York 11219
Telephone:+1 718 921 8124
Australian Corporate Governance Statement
The Company’s board of directors and employees are committed to developing, promoting and maintaining a strong culture of good corporate governance and ethical conduct.
The board of directors is pleased to confirm that the Company’s corporate governance framework is generally consistent with the ASX Corporate Governance Council’s “Corporate Governance Principles and Recommendations with 2010 amendments (2nd Edition)” (“ASX Governance Recommendations”), other than as set out below. To this end, the Company provides below a review of its corporate governance framework using the same numbering as adopted for the principles as set out in the ASX Governance Recommendations.
This corporate governance statement is current as at December 31, 2014, and has been approved by the board of the Company.
Copies of the Company’s codes and policies may be downloaded from the corporate governance section of the Company’s website at www.gidynamics.com.
64
Table of Contents
Principle 1 – Lay solid foundations for management and oversight
Recommendation 1.1 – Establish the functions reserved to the board of directors and those delegated to senior executives and disclose those functions.
The board’s responsibilities are recognized and documented by the charter of the board of directors, a copy of which is available on the Company’s website at www.gidynamics.com, and there is a clear delineation between the board’s responsibility for the Company’s strategy and activities, and the day-to-day management of operations conferred upon the Company’s officers.
Recommendation 1.2 – Disclose the process for evaluating the performance of senior executives.
Under the board charter, the directors of the Company are ultimately responsible for monitoring the performance of the senior management team and the compensation committee, in accordance with its charter, reviews and approves corporate and personal performance goals and objectives relevant to the compensation of all executive officers. At the end of each calendar year, the chief executive officer presents to the compensation committee his assessment of the performance during the year of each executive officer (other than himself) against pre-established performance objectives. The compensation committee considers this assessment and determines each executive officer’s (including the chief executive officer’s) compensation, including but not limited to salary, bonus, incentive compensation and equity awards based on such an evaluation. In addition, the compensation committee is responsible for regularly reviewing the Company’s compensation, recruitment, retention and termination policies for senior executives. In January 2015, a performance evaluation of the Company’s executive officers for the year ended December 31, 2014 was undertaken following which the Company’s compensation committee reviewed and approved changes to the compensation of the Company’s executive officers based on the individual levels of achievement against pre-established performance objectives. Further information regarding executive compensation for the year ended December 31, 2014, as required by Item 11 of this Annual Report on Form 10-K, is incorporated by reference to the applicable information in our proxy statement for our 2015 Annual Meeting of Stockholders, to be filed with the SEC and the ASX within 120 days of December 31, 2014. Such information is incorporated herein by reference.
Recommendation 1.3 – Disclosure of information indicated in the guide to reporting on Principle 1 of the ASX Governance Recommendations.
Reporting Requirement
The Company fully complied with ASX Governance Recommendations 1.1 to 1.3 during the year ended December 31, 2014.
Principle 2 – Structure the board to add value
Recommendation 2.1 – A majority of the board of directors should be independent.
Recommendation 2.2 – The chairman should be an independent director.
Recommendation 2.3 – The roles of chairman and chief executive officer should not be exercised by the same individual.
The board presently comprises seven directors, including five independent non-executive directors (including the chairman of the board), one non-independent, non-executive director and one executive director (being the chief executive officer).
The Company considers that a director is an independent director where that director is free from any interest and any business or other relationship which could, or could reasonably be perceived to, materially interfere with the director’s decisions relating to the Company or with the director’s ability to act in the best
65
Table of Contents
interests of the Company. The Company also assesses the independence of its directors regarding the requirements for independence set out under ASX Governance Recommendation 2.1. In compliance with the ASX Governance Recommendations, the roles of the chairman and the chief executive officer of the Company are not currently exercised by the same individual. However, the Company’s board charter does not specifically address whether or not the offices of chairman and chief executive officer should be vested in the same person or two different people, or whether the chairman should be an employee of the Company or should be elected from among the non-executive directors. The needs of the Company and the individuals available to serve in these roles may dictate different outcomes at different times, and the board believes that retaining flexibility in these decisions is in the best interest of the Company and its shareholders.
Information regarding the skills, experience and expertise relevant to each director is set out in the section titled “Directors of the Registrant” in this Item 10.
The current composition of the board of directors and length of tenure of each member is as follows:
| Committees | ||||||||||||
| Director |
Director Position |
Tenure1 | Independent | Audit | Compensation | Nominating and Corporate Governance | ||||||
| Jack E. Meyer |
Non-executive Chairman | 11.5 years | Yes | X | ||||||||
| Timothy J. Barberich |
Non-executive Director | 3.6 years | Yes | X | Chair | |||||||
| Graham J. Bradley, AM |
Non-executive Director | 3.6 years | Yes | Chair | ||||||||
| Michael A. Carusi2 |
Non-executive Director | 11.8 years | No | X | X | |||||||
| Anne J. Keating3 |
Non-executive Director | 3.6 years | Yes | X | Chair | |||||||
| Daniel J. Moore3 |
Non-executive Director | 0.3 years | Yes | X | ||||||||
| Michael D. Dale |
Executive Director; President & CEO | 0.3years | No | |||||||||
1 Calculated as of December 31, 2014
2 Independent director under the rules of NASDAQ and the SEC but not considered independent under the ASX.
3 On November 3, 2014, Ms. Keating resigned from the compensation committee and Mr. Moore joined the compensation committee.
The number of directors’ meetings (including meetings of committees) and number of meetings attended by each of the directors during the reporting period are as follows:
| Committee Meetings | ||||||||||||||||||||||||||||||||
| Directors’ Meetings | Audit Committee | Nominating and Corporate Governance |
Compensation Committee |
|||||||||||||||||||||||||||||
| Director |
A | B | A | B | A | B | A | B | ||||||||||||||||||||||||
| Jack E. Meyer |
9 | 9 | — | — | 3 | 3 | — | — | ||||||||||||||||||||||||
| Timothy J. Barberich |
9 | 9 | 5 | 5 | — | — | 3 | 3 | ||||||||||||||||||||||||
| Graham J. Bradley, AM |
9 | 9 | 4 | 5 | — | — | — | — | ||||||||||||||||||||||||
| Michael A. Carusi |
9 | 9 | — | — | 3 | 3 | 3 | 3 | ||||||||||||||||||||||||
| Anne J. Keating |
9 | 9 | 5 | 5 | 3 | 3 | 2 | 2 | ||||||||||||||||||||||||
| Daniel J. Moore |
2 | 2 | — | — | — | 1 | 1 | |||||||||||||||||||||||||
| Michael D. Dale |
2 | 2 | — | — | — | — | — | — | ||||||||||||||||||||||||
A – Number of meetings attended.
B – Number of meetings held during the time the director held office during the reporting period.
66
Table of Contents
Independent advice
At the Company’s expense, each member of the board and each member of a committee of the board is entitled to seek advice from independent external advisers in relation to any matter that is considered necessary to fulfil their relevant duties and responsibilities.
Recommendation 2.4 – The board should establish a nomination committee.
The members of the nominating and corporate governance committee are Michael A. Carusi, Anne J. Keating (Chair) and Jack E. Meyer. Ms. Keating and Mr. Meyer are considered independent directors for ASX, NASDAQ and SEC purposes and Mr. Carusi is not considered to be independent for ASX purposes, but is considered to be independent for NASDAQ and SEC purposes. A copy of the nominating and corporate governance committee charter is available on the corporate governance section of the Company’s website. The nominating and corporate governance committee met three times during 2014 with all committee members in attendance at all occasions.
The nominating and corporate governance committee is responsible for reviewing with the board from time to time the appropriate skills and characteristics required of board members in the context of the current make-up of the board and the Company’s business needs. This assessment includes, among other things, an individual’s business experience and skills (including skills in core areas such as operations, management, technology, medical device industry knowledge, accounting and finance, marketing, leadership, strategic planning and international markets), independence, judgment, integrity and ability to commit sufficient time and attention to the activities of the board, as well as the absence of any potential conflicts with the Company’s interests. The nominating and corporate governance committee considers these criteria in the context of an assessment of the perceived needs of the board as a whole and seeks to achieve diversity of occupational and personal backgrounds on the board.
Recommendation 2.5 – Disclose the process for evaluating the performance of the board, its committees and individual directors.
During the reporting period ended December 31, 2014, the board and each committee performed a self-evaluation. Each director provided their assessments of the effectiveness of the board and the committees on which they serve to the nominating and corporate governance committee. The individual assessments were summarized by the nominating and corporate governance committee and reported for discussion to the full board and the committees. The nominating and corporate governance committee completed its assessment of the board’s compliance with the principles set forth in the board charter and did not identify any areas in which the board or committees needed to improve performance and has reviewed and approved disclosures relating to any departures from the ASX Governance Recommendations. During the reporting period ended December 31, 2014, the nominating and corporate governance committee also evaluated individual directors in accordance with the criteria set by the nominating and corporate governance committee and the board from time to time. Based on such assessments, the nominating and corporate governance committee has determined that the board and its committees were effective.
Recommendation 2.6 – Disclosure of information indicated in the guide to reporting on Principle 2 of the ASX Governance Recommendations.
Reporting Requirement
The Company has fully complied with ASX Governance Recommendations 2.1 to 2.6 during the year ended December 31, 2014.
67
Table of Contents
Principle 3 – Promote ethical and responsible decision-making
Recommendation 3.1 – Establish a Code of Conduct and disclose the code or a summary of the code as to (a) the practices necessary to maintain confidence in the company’s integrity, (b) the practices necessary to take into account their legal obligations and the reasonable expectations of their stakeholders, and (c) the responsibility and accountability of individuals for reporting and investigating reports of unethical practices.
The Company has adopted a Code of Business Conduct and Ethics and an Insider Trading Policy, copies of which are available on the corporate governance section of the Company’s website.
Recommendation 3.2 – Establish a policy concerning diversity and disclose it. The policy should include requirements for the board to establish measurable objectives for achieving gender diversity and for the board to assess annually both the objectives and progress in achieving them.
The Company has adopted a Diversity Policy, a copy of which is available on the corporate governance section of the Company’s website. The Company’s Diversity Policy includes requirements for the board to establish measurable objectives to assist the Company in achieving diversity and to enable the Company’s progress.
Recommendation 3.3 – Disclosure of measurable objectives for achieving gender diversity set by the board in accordance with the Diversity Policy and progress towards achieving them.
The board continued to evaluate the gender diversity of the Company’s employees, its senior executives, and its board of directors during 2014. During 2014, as the board was considering measurable objectives for achieving gender diversity it concluded that because of the current stage of the Company’s development, the Company should continue to recruit the right employees from a diverse pool of talented candidates without regard to gender while continuing to focus on the necessary skills and experience to achieve the Company’s performance objectives. As a result, the Company did not set measurable objectives for achieving gender diversity in 2014 but used 2013 data as a baseline to measure gender diversity among its employees, senior executives and board of directors for 2014.
Recommendation 3.4 – Disclosure of the proportion of women employees in the whole organization, women in senior executive positions and women on the board.
At December 31, 2014, the proportion of women in the Company as a percentage of its total employees decreased from 43% (29 out of 67 in 2013) to 42% (29 out of 69 in 2014) based on data maintained by the Company’s human resources organization. In senior executive positions (vice president and above), the proportion of women decreased from 18% (2 out of 11 in 2013) to 10% (1 out of 10 in 2014). The proportion of women on the board of directors decreased from 17% (1 out of 6 in 2013) to 14% (1 out of 7 in 2014).
Recommendation 3.5 – Disclosure of information indicated in the guide to reporting on Principle 3 of the ASX Governance Recommendations.
Reporting Requirement
Except as disclosed above, the Company has fully complied with ASX Governance Recommendations 3.1 to 3.5 during the year ended December 31, 2014.
Principle 4 – Safeguard integrity in financial reporting
Recommendation 4.1 – The board should establish an audit committee.
The board of directors has established an audit committee to oversee the management of the Company’s financial and internal risks and reporting.
68
Table of Contents
Recommendation 4.2 – The audit committee should: (a) consist of non-executive directors only; (b) consist of a majority of independent directors; (c) be chaired by an independent chair who is not chair of the board; and (d) have at least three members.
The members of the audit committee are Timothy J. Barberich, Graham J. Bradley (Chair) and Anne J. Keating, all of whom are independent, non-executive directors. The audit committee is chaired by Graham J. Bradley who is an independent director and not chair of the board.
The members of the audit committee must be financially literate and have familiarity with financial and accounting matters, with at least one member a qualified accountant or other financial professional with appropriate expertise of financial and accounting matters. The qualifications of those appointed to the audit committee are set out in the section titled “Directors of the Registrant” in this Item 10.
The audit committee met five times during 2014, with Mr. Barberich and Ms. Keating attending on all five occasions and Mr. Bradley attending on four occasions.
Recommendation 4.3 – The audit committee should have a formal charter.
The audit committee is governed by the audit committee charter, a copy of which is available on the corporate governance section of the Company’s website.
In its audit committee charter the Company has disclosed its policy for the selection and appointment of the Company’s independent auditor and for the rotation of the lead audit partner having primary responsibility for the audit and the audit partner responsible for reviewing the audit every five years. The audit committee will regularly report to the board about committee activities, issues and related recommendations.
Recommendation 4.4 – Disclosure of information indicated in the guide to reporting on Principle 4 of the ASX Governance Recommendations.
Reporting Requirement
The Company has fully complied with Recommendations 4.1 to 4.4 during the year ended December 31, 2014.
Principle 5 – Make timely and balanced disclosure
Recommendation 5.1 – Establish written policies designed to ensure compliance with ASX Listing Rule disclosure requirements and to ensure accountability at a senior executive level for that compliance and disclose those policies.
The Company is committed to providing timely and balanced disclosure to the market in accordance with its continuous disclosure obligations. In accordance with its commitment to fully comply with its continuous disclosure obligations and to ensure accountability at a senior management level for that compliance, the Company has adopted a Continuous Disclosure Policy, together with other internal mechanisms and reporting requirements. A copy of the Company’s Continuous Disclosure Policy is available on the corporate governance section of the Company’s website. In addition, a copy of all of the Company’s ASX announcements, financial reports and related public information are also available on the Company’s website.
Recommendation 5.2 – Disclosure of information indicated in the guide to reporting on Principle 5 of the ASX Governance Recommendations.
Reporting Requirement
The Company has fully complied with Recommendations 5.1 to 5.2 during the year ended December 31, 2014.
69
Table of Contents
Principle 6 – Respect the rights of shareholders
Recommendation 6.1 – Design a communications policy for promoting effective communication with shareholders and encourage their participation at general meetings and disclose those policies.
The Company has adopted a Shareholder Communications Policy which supports effective two-way communication with its shareholders, a copy of which is available on the corporate governance section of the Company’s website. The Company seeks to utilize numerous modes of communication, including electronic communication, to ensure that its communication with shareholders is frequent, clear, and accessible.
The Company has implemented a number of measures to facilitate what it believes to be the effective and efficient exercise of the rights of shareholders. The Company communicates information to shareholders through a range of media including annual reports, public (ASX) announcements and via the Company’s website. Key financial and stock performance information is also available on the Company’s website. Shareholders can raise questions with the Company by contacting the Company via telephone, facsimile, post or email, with relevant contact details being available on the Company’s website.
All shareholders are invited to attend the Company’s annual meeting either in person or by proxy. The board regards the annual meeting as an excellent forum in which to discuss issues relevant to the Company and accordingly encourages full participation by shareholders. Shareholders have an opportunity to submit questions to the board and auditors. The meeting may also be audio cast and/or webcast to provide access to those shareholders who are unable to attend the annual general meeting in person.
Management maintains a record for internal use of significant presentations to analysts and investors, including conferences and individual briefings, as well as a general description of topics discussed.
Recommendation 6.2 – Disclosure of information indicated in the guide to reporting on Principle 6 of the ASX Governance Recommendations.
Reporting requirement
The Company has substantially complied with Recommendations 6.1 to 6.2 during the year ended December 31, 2014.
Principle 7 – Recognize and manage risk
Recommendation 7.1 – Establish policies for the oversight and management of material business risks and disclose a summary of those policies.
The risks that the Company faces are continually changing in line with the development of the Company. In simple terms, risk is inherent in all activities undertaken by the Company. Many of these risks are beyond the control of the Company and, as such, it is important that risk be mitigated on a continuous basis, particularly if the Company is to preserve shareholder value.
To ensure appropriate oversight and management of material business risks, the Company has adopted a Risk Management Policy that sets forth the process to identify, assess, and manage risk in the Company’s business operations. A copy of the policy is available on the corporate governance section of the Company’s website.
Recommendation 7.2 – Require management to design and implement the risk management and internal control system to manage the Company’s material business risks and report to it whether those risks are being managed effectively (and makes disclosures therein); disclose that management has reported to the board as to the effectiveness of the Company’s management of its material business risks.
70
Table of Contents
The board has conferred responsibility on senior management to develop and maintain a risk management program in light of the day-to-day needs of the Company. In addition to the above, the board has established three standing committees to provide focused support in key areas. Management provides the board with frequent updates on the state of the Company’s business, including the risks that the Company faces from time-to-time allowing the board to assess the Company’s management of its material business risks. These updates include up-to-date financial information, operational activity, clinical status and competitor updates. These updates are founded on internal communications that are fostered internally through weekly management meetings and other internal communications. These processes operate in addition to the Company’s system of internal controls over financial reporting, its quality system, complaint handling processes, employee policies and standard operating procedures, which are all designed to address various forms of risk.
The Risk Management Policy also requires that management report regularly to the board, primarily through the audit committee which has the responsibility for day-to-day oversight and management of the Company’s risk management program, the status and effectiveness of the risk management program.
In addition, the board holds regular meetings by teleconference as well as at the Company’s facility in Lexington, Massachusetts, for the purposes of discussing and reviewing operational developments and reviewing the effectiveness of the implementation of the Company’s risk management systems.
Recommendation 7.3 – Disclose whether the board has received assurance from the chief executive officer and the chief financial officer that the declaration under Section 295A of the Corporations Act is founded on a sound system of risk management and internal control and is operating effectively in all material respects in relation to financial reporting risks.
As the Company prepares and files its financial statements under United States accounting practices and laws, management is required to provide representations to the board on a wide range of issues, including the effectiveness of the Company’s disclosure controls and procedures as well as the design and operation of internal control over financial reporting. However, as the Company is incorporated in the State of Delaware, United States, it is not required to provide a declaration under section 295A of the Corporations Act 2001 (Cth). To this end, shareholders’ attention is drawn to Item 9A of this Annual Report on Form 10-K and the certifications provided by the principal executive officer and the principal financial officer at the end of the Annual Report on Form 10-K. As stated above, Item 9A discloses information regarding the Company’s controls and procedures and management’s evaluation of the effectiveness of our internal control over financial reporting.
Recommendation 7.4 – Disclosure of information indicated in the guide to reporting on Principle 7 of the ASX Governance Recommendations.
Reporting requirement
Except as disclosed above, the Company has fully complied with Recommendations 7.1 to 7.4 during the year ended December 31, 2014.
Principle 8 – Remunerate fairly and responsibly
Recommendation 8.1 – Establish a remuneration committee.
The board of directors has established a compensation committee to review and assess executive and director compensation. The compensation committee is governed by the Compensation Committee Charter, a copy of which is available on the corporate governance section of the Company’s website.
Recommendation 8.2 – The remuneration committee should be structured so that it: (a) consists of a majority of independent directors; (b) is chaired by an independent chair; and (c) has at least three members.
71
Table of Contents
The members of the compensation committee are Timothy J. Barberich (Chair), Michael A. Carusi and Daniel J. Moore. In November 2014 Mr. Moore succeeded Ms. Keating as a member of the compensation committee Mr. Barberich and Mr. Moore are considered independent directors for ASX, NASDAQ and SEC purposes. Mr. Carusi however, is not considered to be independent for ASX purposes, but is considered to be independent for NASDAQ and SEC purposes. The compensation committee therefore consists of a majority of independent directors and is also chaired by an independent director. The compensation committee met three times during 2014 with Messrs. Barberich and Carusi attending on all occasions and Ms. Keating and Mr. Moore attending all compensation committee meetings for which they were members of the compensation committee.
While the compensation committee reviews and reports compensation items to the board for both non-executive directors and executive management, including each individual’s skills, knowledge, and contributions to the Company, the compensation committee does not provide a separate report of compensation by gender.
Recommendation 8.3 – Clearly distinguish the structure of non-executive directors’ remuneration from that of executive directors and senior executives.
In accordance with its charter, the compensation committee is responsible for ensuring that the structure of non-executive and executive directors’ compensation is clearly distinguished.
The Company has adopted a non-executive director compensation policy pursuant to which non-executive directors are compensated for their services to the board including annual cash fees for serving as a member or the chair of the board of directors and for serving as a member or the chair of the board committees. In addition, the plan provides that our non-executive directors may receive grants of a fixed number of options upon their joining the board of directors and annual grants commencing in 2014 of a fixed number of options and restricted stock units, in each case subject to the terms of the non-executive director compensation policy as well as the approval of the shareholders.
The Company has adopted a separate executive compensation program that consists of base salary, equity-based incentives, performance-based cash bonuses, severance benefits, and other customary benefits such as health insurance on the same basis as provided to all other employees. None of the Company’s non-executive directors will be entitled to any retirement benefits.
Further information regarding the compensation committee, as required by Item10 of this Annual Report on Form 10-K, is incorporated by reference to the applicable information in our proxy statement for our 2015 Annual Meeting of Stockholders to be filed with the SEC and ASX.
The Company’s Insider Trading Policy provides a summary of the Company’s policy on prohibiting entering into transactions in associated products which limit the economic risk of participating in unvested entitlements under any equity-based remuneration schemes.
Recommendation 8.4 – Disclosure of information indicated in the guide to reporting on Principle 8 of the ASX Governance Recommendations.
Reporting requirement
Except as disclosed above, the Company has fully complied with Recommendations 8.1 to 8.4 during the year ended December 31, 2014.
This report is made in accordance with a resolution of the board of directors.
| ITEM 11. | EXECUTIVE COMPENSATION |
The information required by this Item 11 is incorporated by reference to the applicable information in our proxy statement for our 2015 Annual Meeting of Stockholders to be filed with the SEC and ASX.
72
Table of Contents
ITEM 12. SECURITY OWNERSHIP OF CERTAIN BENEFICIAL OWNERS AND MANAGEMENT AND RELATED STOCKHOLDER MATTERS
The information relating to security ownership of certain beneficial owners of our Common Stock and information relating to the security ownership of our management required by this Item 12 is incorporated by reference to the applicable information in our proxy statement for our 2015 Annual Meeting of Stockholders to be filed with the SEC and ASX.
The table below sets forth information with regard to shares authorized for issuance under our equity compensation plans as of December 31, 2014. As of December 31, 2014, we had two active equity compensation plans, each of which was approved by our stockholders:
| • | Our 2003 Omnibus Stock Plan; and |
| • | Our 2011 Employee, Director and Consultant Equity Incentive Plan. |
| Plan Category |
Number of shares to be issued upon exercise of outstanding options or vesting of restricted stock units |
Weighted-average exercise price of outstanding options |
Number of shares remaining available for future issuance under equity compensation plans1 |
|||||||||
| Equity compensation plans approved by security holders | 14,072,647 | $ | 2.64 | 1,983,802 | ||||||||
| Equity compensation plans not approved by security holders | — | — | — | |||||||||
|
|
|
|
|
|
|
|||||||
| Total |
14,072,647 | $ | 2.64 | 1,983,802 | ||||||||
|
|
|
|
|
|
|
|||||||
| 1. | Our 2011 Employee, Director and Consultant Equity Incentive Plan allows for an annual increase in the number of shares available for issue commencing on the first day of each fiscal year during the period beginning in fiscal year 2012 and ending in fiscal year 2020. The annual increase in the number of shares shall be equal to the lowest of: (i) 5 million shares; (ii) 4% of the number of common shares outstanding as of such date; and (iii) an amount determined by our board of directors or our compensation committee. |
ITEM 13. CERTAIN RELATIONSHIPS AND RELATED TRANSACTIONS, AND DIRECTOR INDEPENDENCE
The information required by this Item 13 is incorporated by reference to the applicable information in our proxy statement for our 2015 Annual Meeting of Stockholders to be filed with the SEC and ASX.
ITEM 14. PRINCIPAL ACCOUNTANT FEES AND SERVICES
The information required by this Item 14 is incorporated by reference to the applicable information in our proxy statement for our 2015 Annual Meeting of Stockholders to be filed with the SEC and ASX.
73
Table of Contents
PART IV
ITEM 15. EXHIBITS AND FINANCIAL STATEMENT SCHEDULES
| (a) | List of documents filed as part of this Annual Report on Form 10-K |
| (1) | Consolidated Financial Statements listed under Part II, Item 8 and included herein by reference. |
| (2) | Consolidated Financial Statement Schedules |
| No schedules are submitted because they are not applicable, not required or because the information is included in the Consolidated Financial Statements or Notes to Consolidated Financial Statements. |
| (3) | Exhibits |
| The exhibits listed in the accompanying Exhibit Index are filed or incorporated by reference as part of this Annual Report on Form 10-K. |
74
Table of Contents
Pursuant to the requirements of the Securities Exchange Act of 1934, the registrant has duly caused this report to be signed on its behalf by the undersigned, hereunto duly authorized.
| GI Dynamics, Inc. | ||||
| Date: March 30, 2015 |
By:
|
/s/ MICHAEL D. DALE | ||
| Name: | Michael D. Dale | |||
|
Title: |
President and Chief Executive Officer | |||
SIGNATURES
Pursuant to the requirements of the Securities Exchange Act of 1934, this report has been signed below by the following persons in the capacities and on the dates indicated.
| Signature | Title | Date | ||
| /s/ MICHAEL D. DALE Michael D. Dale |
President, Chief Executive Officer and Director (Principal Executive Officer)
|
March 30, 2015
| ||
| /s/ ROBERT M. SOLOMON Robert M. Solomon |
Vice President, Finance, Secretary and Treasurer (Principal Financial and Accounting Officer)
|
March 30, 2015
| ||
| /s/ JACK E. MEYER Jack E. Meyer |
Chairman and Director |
March 30, 2015 | ||
| /s/ TIMOTHY J. BARBERICH Timothy J. Barberich |
Director |
March 30, 2015 | ||
| /s/ GRAHAM J. BRADLEY, AM Graham J. Bradley, AM |
Director |
March 30, 2015 | ||
| /s/ MICHAEL A. CARUSI Michael A. Carusi |
Director |
March 30, 2015 | ||
| /s/ ANNE J. KEATING Anne J. Keating |
Director |
March 30, 2015 | ||
| /s/ DANIEL J. MOORE Daniel J. Moore |
Director |
March 30, 2015 | ||
75
Table of Contents
EXHIBIT INDEX
| Exhibit No: |
Description | |
| 3.1 | Certificate of Incorporation of GI Dynamics, Inc. incorporated by reference to Exhibit 3.1 of GI Dynamics, Inc.’s registration statement on Form 10, filed with the SEC on April 30, 2014 | |
| 3.2 | Bylaws of GI Dynamics, Inc. incorporated by reference to Exhibit 3.2 of GI Dynamics, Inc.’s registration statement on Form 10, filed with the SEC on April 30, 2014 | |
| 4.1 | Form of Warrant incorporated by reference to Exhibit 4.1 of GI Dynamics, Inc.’s registration statement on Form 10, filed with the SEC on April 30, 2014 | |
| 10.1†* | 2011 Employee, Director and Consultant Equity Incentive Plan | |
| 10.2† | 2003 Omnibus Stock Plan incorporated by reference to Exhibit 10.2 of GI Dynamics, Inc.’s registration statement on Form 10, filed with the SEC on April 30, 2014 | |
| 10.3† | Amended Letter of Employment, dated July 11, 2011, between GI Dynamics, Inc. and Stuart Randle incorporated by reference to Exhibit 10.3 of GI Dynamics, Inc.’s registration statement on Form 10, filed with the SEC on April 30, 2014 | |
| 10.4† | Letter of Employment, dated July 11, 2011, between GI Dynamics, Inc. and Robert Crane incorporated by reference to Exhibit 10.4 of GI Dynamics, Inc.’s registration statement on Form 10, filed with the SEC on April 30, 2014 | |
| 10.5† | Letter of Employment, dated March 25, 2013, between GI Dynamics, Inc. and David Maggs incorporated by reference to Exhibit 10.5 of GI Dynamics, Inc.’s registration statement on Form 10, filed with the SEC on April 30, 2014 | |
| 10.6† | Letter of Employment, dated November 28, 2011, between GI Dynamics, Inc. and Mark Twyman incorporated by reference to Exhibit 10.6 of GI Dynamics, Inc.’s registration statement on Form 10, filed with the SEC on April 30, 2014 | |
| 10.7 | Form of Indemnification Agreement incorporated by reference to Exhibit 10.4 of GI Dynamics, Inc.’s Quarterly Report on Form 10-Q, filed with the SEC on November 10, 2014 | |
| 10.8 | Sublease Agreement, dated May 23, 2013, between GI Dynamics, Inc. and Cambridge Technology, Inc. incorporated by reference to Exhibit 10.8 of GI Dynamics, Inc.’s registration statement on Form 10, filed with the SEC on April 30, 2014 | |
| 10.9 | Technology Transfer Agreement, dated May 27, 2003, between GI Dynamics, Inc. and Seedling Enterprises, LLC incorporated by reference to Exhibit 10.9 of GI Dynamics, Inc.’s registration statement on Form 10, filed with the SEC on June 13, 2014 | |
| 10.10† | Separation Agreement, dated August 28, 2014 between GI Dynamics, Inc. and Stuart A. Randle incorporated by reference to Exhibit 10.1 of GI Dynamics, Inc.’s Current Report on Form 8-K, filed with the SEC on August 29, 2014 | |
| 10.11† | Letter of Employment, dated August 28, 2014, between GI Dynamics, Inc. and Michael Dale incorporated by reference to Exhibit 10.2 of GI Dynamics, Inc.’s Current Report on Form 8-K, filed with the SEC on August 29, 2014 | |
| 10.12† | Non-Employee Director Compensation Policy incorporated by reference to Exhibit 10.1 of GI Dynamics, Inc.’s Current Report on Form 8-K, filed with the SEC on September 12, 2014 | |
| 10.13† | Separation Agreement, dated January 21, 2015 between GI Dynamics, Inc. and Robert W. Crane incorporated by reference to Exhibit 10.1 of GI Dynamics, Inc.’s Current Report on Form 8-K, filed with the SEC on January 29, 2015 | |
| 21.1 | Subsidiaries of the Registrant incorporated by reference to Exhibit 21.1 of GI Dynamics, Inc.’s registration statement on Form 10, filed with the SEC on April 30, 2014 | |
76
Table of Contents
| 23.1* | Consent of Ernst & Young LLP | |
| 31.1* | Certification of principal executive officer pursuant to Rules 13a-14 or 15d-14 of the Exchange Act | |
| 31.2* | Certification of principal financial officer pursuant to Rules 13a-14 or 15d-14 of the Exchange Act | |
| 32.1‡ | Certification of principal executive officer pursuant to Rules 13a-14(b) or 15d-14(b) of the Exchange Act and 18 U.S.C. Section 1350 | |
| 32.2‡ | Certification of principal financial officer pursuant to Rules 13a-14(b) or 15d-14(b) of the Exchange Act and 18 U.S.C. Section 1350 | |
| 101.INS | XBRL Instance Document | |
| 101.SCH | XBRL Taxonomy Extension Schema Document | |
| 101.CAL | XBRL Taxonomy Extension Calculation Linkbase Document | |
| 101.LAB | XBRL Taxonomy Extension Label Linkbase Database | |
| 101.PRE | XBRL Taxonomy Extension Presentation Linkbase Document | |
| 101.DEF | XBRL Taxonomy Extension Definition Linkbase Document | |
| * | Filed herewith. |
| ‡ | Furnished herewith. |
| † | Management contract or compensatory plan or arrangement. |
77
Table of Contents
GI Dynamics, Inc. and Subsidiaries
Index to Consolidated Financial Statements
F-1
Table of Contents
REPORT OF INDEPENDENT REGISTERED PUBLIC ACCOUNTING FIRM
The Board of Directors and Stockholders
GI Dynamics, Inc. and Subsidiaries
We have audited the accompanying consolidated balance sheets of GI Dynamics, Inc. and Subsidiaries (the “Company”) as of December 31, 2014 and 2013, and the related consolidated statements of comprehensive loss, stockholders’ equity, and cash flows for each of the three years in the period ended December 31, 2014. These financial statements are the responsibility of the Company’s management. Our responsibility is to express an opinion on these financial statements based on our audits.
We conducted our audits in accordance with the standards of the Public Company Accounting Oversight Board (United States). Those standards require that we plan and perform the audit to obtain reasonable assurance about whether the financial statements are free of material misstatement. We were not engaged to perform an audit of the Company’s internal control over financial reporting. Our audits included consideration of internal control over financial reporting as a basis for designing audit procedures that are appropriate in the circumstances, but not for the purpose of expressing an opinion on the effectiveness of the Company’s internal control over financial reporting. Accordingly, we express no such opinion. An audit also includes examining, on a test basis, evidence supporting the amounts and disclosures in the financial statements, assessing the accounting principles used and significant estimates made by management, and evaluating the overall financial statement presentation. We believe that our audits provide a reasonable basis for our opinion.
In our opinion, the financial statements referred to above present fairly, in all material respects, the consolidated financial position of GI Dynamics, Inc. and Subsidiaries, at December 31, 2014 and 2013, and the consolidated results of its operations and its cash flows for each of the three years in the period ended December 31, 2014, in conformity with U.S. generally accepted accounting principles.
/s/ Ernst & Young LLP
Boston, Massachusetts
March 30, 2015
F-2
Table of Contents
GI Dynamics, Inc. and Subsidiaries
(In thousands, except share and per share amounts)
| December 31, | ||||||||
| 2014 | 2013 | |||||||
| Assets |
||||||||
| Current assets: |
||||||||
| Cash and cash equivalents |
$ | 51,191 | $ | 58,616 | ||||
| Accounts receivable, net |
470 | 660 | ||||||
| Inventory |
5,488 | 7,271 | ||||||
| Prepaid expenses and other current assets |
1,165 | 1,288 | ||||||
|
|
|
|
|
|||||
| Total current assets |
58,314 | 67,835 | ||||||
| Property and equipment, net |
1,089 | 1,490 | ||||||
| Other long-term assets |
97 | — | ||||||
|
|
|
|
|
|||||
| Total assets |
$ | 59,500 | $ | 69,325 | ||||
|
|
|
|
|
|||||
| Liabilities and stockholders’ equity |
||||||||
| Current liabilities: |
||||||||
| Accounts payable |
$ | 882 | $ | 1,267 | ||||
| Accrued expenses |
7,674 | 4,400 | ||||||
| Deferred revenue |
412 | 722 | ||||||
| Current portion of long-term debt |
— | 58 | ||||||
| Other current liabilities |
175 | — | ||||||
|
|
|
|
|
|||||
| Total current liabilities |
9,143 | 6,447 | ||||||
| Deferred rent, net of current portion |
166 | 167 | ||||||
| Other liabilities |
4 | — | ||||||
| Warrants to purchase common stock |
9 | 326 | ||||||
| Commitments (Note 11) |
||||||||
| Stockholders’ equity: |
||||||||
| Preferred stock, $0.01 par value – 5,000,000 shares authorized; no shares issued and outstanding at December 31, 2014 and 2013 |
— | — | ||||||
| Common stock, $0.01 par value – 130,000,000 shares authorized; 94,836,733 shares issued and 94,801,733 shares outstanding at December 31, 2014 and 80,087,717 shares issued and outstanding at December 31, 2013 |
948 | 801 | ||||||
| Class B common stock, $0.01 par value – 10,000,000 shares authorized; no shares issued and outstanding at December 31, 2014 and 2013 |
— | — | ||||||
| Additional paid-in capital |
249,156 | 213,305 | ||||||
| Accumulated deficit |
(199,926 | ) | (151,721 | ) | ||||
|
|
|
|
|
|||||
| Total stockholders’ equity |
50,178 | 62,385 | ||||||
|
|
|
|
|
|||||
| Total liabilities and stockholders’ equity |
$ | 59,500 | $ | 69,325 | ||||
|
|
|
|
|
|||||
The accompanying notes are an integral part of these consolidated financial statements.
F-3
Table of Contents
GI Dynamics, Inc. and Subsidiaries
Consolidated Statements of Comprehensive Loss
(In thousands, except share and per share amounts)
| Years Ended December 31, | ||||||||||||
| 2014 | 2013 | 2012 | ||||||||||
| Revenue |
$ | 2,828 | $ | 2,255 | $ | 668 | ||||||
| Cost of revenue |
4,089 | 2,492 | 1,358 | |||||||||
|
|
|
|
|
|
|
|||||||
| Gross loss |
(1,261 | ) | (237 | ) | (690 | ) | ||||||
| Operating expenses: |
||||||||||||
| Research and development |
26,654 | 14,676 | 11,469 | |||||||||
| Sales and marketing |
10,023 | 11,011 | 7,886 | |||||||||
| General and administrative |
10,252 | 8,932 | 10,085 | |||||||||
|
|
|
|
|
|
|
|||||||
| Total operating expenses |
46,929 | 34,619 | 29,440 | |||||||||
|
|
|
|
|
|
|
|||||||
| Loss from operations |
(48,190 | ) | (34,856 | ) | (30,130 | ) | ||||||
| Other income (expense): |
||||||||||||
| Interest income |
253 | 366 | 678 | |||||||||
| Interest expense |
(1 | ) | (5 | ) | (8 | ) | ||||||
| Foreign exchange gain (loss) |
(514 | ) | (955 | ) | 1,871 | |||||||
| Remeasurement of warrant liability |
317 | (32 | ) | 822 | ||||||||
|
|
|
|
|
|
|
|||||||
| Other income (expense), net |
55 | (626 | ) | 3,363 | ||||||||
|
|
|
|
|
|
|
|||||||
| Loss before income tax expense |
(48,135 | ) | (35,482 | ) | (26,767 | ) | ||||||
| Income tax expense |
70 | 96 | 19 | |||||||||
|
|
|
|
|
|
|
|||||||
| Net loss |
$ | (48,205 | ) | $ | (35,578 | ) | $ | (26,786 | ) | |||
|
|
|
|
|
|
|
|||||||
| Basic and diluted net loss per common share |
$ | (0.54 | ) | $ | (0.53 | ) | $ | (0.47 | ) | |||
|
|
|
|
|
|
|
|||||||
| Weighted-average number of common shares used in basic and diluted net loss per common share |
89,977,549 | 67,676,938 | 57,015,561 | |||||||||
| Comprehensive loss |
$ | (48,205 | ) | $ | (35,578 | ) | $ | (26,786 | ) | |||
|
|
|
|
|
|
|
|||||||
The accompanying notes are an integral part of these consolidated financial statements.
F-4
Table of Contents
GI Dynamics, Inc. and Subsidiaries
Consolidated Statements of Stockholders’ Equity
(In thousands, except share amounts)
| Common Stock | Additional Paid-in Capital |
Accumulated Deficit |
Total Stockholders’ Equity |
|||||||||||||||||
| Shares | Par Value | |||||||||||||||||||
| Balance at December 31, 2011 |
56,192,811 | $ | 562 | $ | 154,346 | $ | (89,357 | ) | $ | 65,551 | ||||||||||
| Issuance of common stock upon exercise of stock options |
1,168,220 | 12 | 341 | — | 353 | |||||||||||||||
| Stock-based compensation expense |
— | — | 2,590 | — | 2,590 | |||||||||||||||
| Net loss |
— | — | — | (26,786 | ) | (26,786 | ) | |||||||||||||
|
|
|
|
|
|
|
|
|
|
|
|||||||||||
| Balance at December 31, 2012 |
57,361,031 | 574 | 157,277 | $ | (116,143 | ) | 41,708 | |||||||||||||
| Issuance of common stock upon exercise of stock options |
140,949 | 1 | 52 | — | 53 | |||||||||||||||
| Issuance of shares upon private placement and share purchase plan, net of issuance costs of approximately $2.1 million |
22,585,737 | 226 | 52,271 | — | 52,497 | |||||||||||||||
| Stock-based compensation expense |
— | — | 3,705 | — | 3,705 | |||||||||||||||
| Net loss |
— | — | — | (35,578 | ) | (35,578 | ) | |||||||||||||
|
|
|
|
|
|
|
|
|
|
|
|||||||||||
| Balance at December 31, 2013 |
80,087,717 | 801 | 213,305 | (151,721 | ) | 62,385 | ||||||||||||||
| Issuance of common stock upon exercise of stock options |
1,523,763 | 15 | 531 | — | 546 | |||||||||||||||
| Issuance of shares upon private placement, net of issuance costs of approximately $1.4 million |
13,190,253 | 132 | 30,650 | — | 30,782 | |||||||||||||||
| Stock-based compensation expense |
— | — | 4,670 | — | 4,670 | |||||||||||||||
| Net loss |
— | — | — | (48,205 | ) | (48,205 | ) | |||||||||||||
|
|
|
|
|
|
|
|
|
|
|
|||||||||||
| Balance at December 31, 2014 |
94,801,733 | $ | 948 | $ | 249,156 | $ | (199,926 | ) | $ | 50,178 | ||||||||||
|
|
|
|
|
|
|
|
|
|
|
|||||||||||
The accompanying notes are an integral part of these consolidated financial statements.
F-5
Table of Contents
GI Dynamics, Inc. and Subsidiaries
Consolidated Statements of Cash Flows
(In thousands)
| Years Ended December 31, | ||||||||||||
| 2014 | 2013 | 2012 | ||||||||||
| Operating activities |
||||||||||||
| Net loss |
$ | (48,205 | ) | $ | (35,578 | ) | $ | (26,786 | ) | |||
| Adjustments to reconcile net loss to net cash used in operating activities: |
||||||||||||
| Depreciation and amortization |
656 | 441 | 267 | |||||||||
| Stock-based compensation expense |
4,670 | 3,705 | 2,590 | |||||||||
| Remeasurement of warrant liability |
(317 | ) | 32 | (822 | ) | |||||||
| Gain on sale of property and equipment |
— | (1 | ) | — | ||||||||
| Change in inventory reserve |
1,527 | 149 | 59 | |||||||||
| Changes in operating assets and liabilities: |
||||||||||||
| Accounts receivable |
190 | (187 | ) | (313 | ) | |||||||
| Prepaid expenses and other current assets |
123 | (450 | ) | 327 | ||||||||
| Inventory |
256 | (2,061 | ) | (1,398 | ) | |||||||
| Other assets |
(97 | ) | — | — | ||||||||
| Accounts payable |
(385 | ) | 857 | (1,436 | ) | |||||||
| Accrued expenses |
3,214 | (1,296 | ) | 2,566 | ||||||||
| Deferred revenue |
(310 | ) | 1 | 456 | ||||||||
| Deferred rent |
59 | 236 | (67 | ) | ||||||||
| Other liabilities |
97 | — | — | |||||||||
|
|
|
|
|
|
|
|||||||
| Net cash used in operating activities |
(38,522 | ) | (34,152 | ) | (24,557 | ) | ||||||
| Investing activities |
||||||||||||
| Purchases of property and equipment |
(255 | ) | (1,230 | ) | (460 | ) | ||||||
| Proceeds from sale of property and equipment |
— | 1 | — | |||||||||
| Change in restricted cash |
— | 33 | 33 | |||||||||
|
|
|
|
|
|
|
|||||||
| Net cash used in investing activities |
(255 | ) | (1,196 | ) | (427 | ) | ||||||
| Financing activities |
||||||||||||
| Proceeds from exercise of stock options |
628 | 53 | 353 | |||||||||
| Proceeds from issuance of shares |
30,782 | 52,497 | — | |||||||||
| Payments on long-term debt |
(58 | ) | (67 | ) | (40 | ) | ||||||
|
|
|
|
|
|
|
|||||||
| Net cash provided by financing activities |
31,352 | 52,483 | 313 | |||||||||
|
|
|
|
|
|
|
|||||||
| Net (decrease) increase in cash and cash equivalents |
(7,425 | ) | 17,135 | (24,671 | ) | |||||||
| Cash and cash equivalents at beginning of period |
58,616 | 41,481 | 66,152 | |||||||||
|
|
|
|
|
|
|
|||||||
| Cash and cash equivalents at end of period |
$ | 51,191 | $ | 58,616 | $ | 41,481 | ||||||
|
|
|
|
|
|
|
|||||||
| Supplemental cash flow disclosures |
||||||||||||
| Borrowings under long-term debt |
$ | — | $ | — | $ | 165 | ||||||
| Cash paid for interest |
$ | 1 | $ | 5 | $ | 7 | ||||||
| Income taxes paid |
$ | 46 | $ | 69 | $ | 5 | ||||||
The accompanying notes are an integral part of these consolidated financial statements.
F-6
Table of Contents
GI Dynamics, Inc. and Subsidiaries
Notes to Consolidated Financial Statements
1. Nature of Business
GI Dynamics, Inc. (the “Company”) was incorporated on March 24, 2003, as a Delaware corporation, with operations based in Lexington, Massachusetts. The Company designs, develops, and markets medical devices for non-surgical approaches to treating type 2 diabetes and obesity. Since incorporation, the Company has devoted substantially all of its efforts to product commercialization, research and development, business planning, recruiting management and technical staff, acquiring operating assets, and raising capital. The Company currently operates in one reportable business segment which designs, manufactures and markets medical devices.
In 2011, the Company began commercial sales of its product, the EndoBarrier®, which is currently sold in select markets in Europe, South America, Australia and the Middle East.
In the U.S., the Company has received approval from the U.S. Food and Drug Administration (“FDA”), to commence its pivotal trial, the ENDO Trial, which the Company began in 2013. On March 5, 2015, the Company announced that the FDA recommended discontinuing placement of any additional devices in its ENDO Trial, although monitoring and data collection of the subjects currently enrolled in the ENDO Trial will continue. The FDA has requested additional information to further assess the risk-benefit profile of EndoBarrier in the ENDO Trial; and the Company is working expeditiously to submit the requested information to the FDA for their review in an effort to resume enrollment.
The Company is subject to a number of risks similar to other medical device companies, including, but not limited to, market acceptance of the Company’s products, development by its competitors of new technological innovations, safety and efficacy of the products in clinical trials, the regulatory approval process governing medical devices and protection of proprietary technology. In addition, the Company may require additional funding to support its long-term operations. Any such financing may or may not be similar to transactions in which it has engaged in the past and there can be no assurance that any such financing opportunities will also be available on acceptable terms, if at all.
The Company has incurred operating losses since inception and at December 31, 2014, had an accumulated deficit of approximately $199.9 million. At December 31, 2014, the Company had approximately $51.2 million in cash and cash equivalents, which it believes is sufficient to fund its operations through March 2016.
In September 2011, the Company completed its initial public offering (“IPO”) of common stock in the form of CHESS Depositary Interests (“CDIs”) in Australia. As a result of the IPO and simultaneous private placement in the U.S., the Company raised a total of approximately $72.5 million in proceeds, net of expenses and repayment of $6.0 million of the Company’s Convertible Term Promissory Notes. Additionally, in July and August 2013, the Company sold CDIs on the Australian Securities Exchange (“ASX”) through a private placement and Share Purchase Plan (“SPP”), which raised a total of approximately $52.5 million, net of expenses. In May 2014, the Company raised an additional approximately $30.8 million, net of expenses, when it sold CDIs on the ASX through a private placement.
2. Summary of Significant Accounting Policies and Basis of Presentation
Principles of Consolidation
The accompanying consolidated financial statements include the accounts of GI Dynamics, Inc. and its wholly owned subsidiaries. All intercompany transactions and balances are eliminated in consolidation.
The functional currency of GID Europe Holding B.V., GID Europe B.V., GID Germany GmbH and GI Dynamics Australia Pty Ltd is the U.S. dollar. Consolidated balance sheet accounts of the Company’s subsidiaries are translated into U.S. dollars using the exchange rate in effect at the consolidated balance sheet
F-7
Table of Contents
GI Dynamics, Inc. and Subsidiaries
Notes to Consolidated Financial Statements (continued)
2. Summary of Significant Accounting Policies (continued)
date while expenses are translated using the average exchange rate in effect during the period. Gains and losses arising from translation of the wholly owned subsidiaries’ financial statements are included in the determination of net loss.
Use of Estimates
The preparation of consolidated financial statements in accordance with generally accepted accounting principles in the U.S. requires the Company’s management to make estimates and judgments that may affect the reported amounts of assets, liabilities, revenues and expenses, and the related disclosure of contingent assets and liabilities. On an ongoing basis, the Company’s management evaluates its estimates, including those related to revenue recognition, allowance for doubtful accounts, inventory valuation including reserves for excess and obsolete inventory, impairment of long-lived assets, income taxes including the valuation allowance for deferred tax assets, research and development, contingencies, and stock-based compensation. The Company bases its estimates on historical experience and on various other assumptions that are believed to be reasonable, the results of which form the basis for making judgments about the carrying values of assets and liabilities. Actual results may differ from these estimates under different assumptions or conditions. Changes in estimates are reflected in reported results in the period in which they become known.
Cash and Cash Equivalents
The Company considers all highly liquid investment instruments with an original maturity when purchased of three months or less to be cash equivalents. Investments qualifying as cash equivalents primarily consist of money market funds and have a carrying amount that approximates fair value. The amount of cash equivalents included in cash and cash equivalents was approximately $38.5 million and $45.6 million at December 31, 2014 and 2013, respectively.
At December 31, 2014 and 2013, the Company had approximately $5.9 million and $7.4 million, respectively, of cash and cash equivalents denominated in Australian dollars that is subject to foreign currency gain and loss. At December 31, 2014 and 2013, the Company had approximately $1.3 million and $1.0 million, respectively, of cash and cash equivalents denominated in euros that is subject to foreign currency gain and loss.
Investments
The Company classifies all short-term investments with an original maturity when purchased of greater than three months as held-to-maturity as the Company has the intent and ability to hold these investments to maturity. The net carrying value of securities classified as held-to-maturity is adjusted for amortization of premiums and accretion of discounts to maturity. Such amortization is computed under the effective interest method and is included in interest income along with any declines in value judged to be other than temporary. The Company classifies all investments that mature in less than one year from the balance sheet date as short-term investments. Investments that mature in more than one year are classified as long-term, held-to-maturity investments within the consolidated balance sheets. The Company did not have any investments at December 31, 2014 or 2013.
To determine whether an other-than-temporary impairment exists, the Company considers whether it has the ability and intent to hold the investment until a market price recovery and whether evidence indicating the recoverability of the cost of the investment outweighs evidence to the contrary. There were no other-than-temporary impairments for the years ended December 31, 2014, 2013 and 2012.
F-8
Table of Contents
GI Dynamics, Inc. and Subsidiaries
Notes to Consolidated Financial Statements (continued)
2. Summary of Significant Accounting Policies (continued)
Property and Equipment
Property and equipment, including leasehold improvements, are recorded at cost and are depreciated when placed in service using the straight-line method based on their estimated useful lives as follows:
| Asset Description |
Estimated Useful Life (In Years) | |
| Laboratory and manufacturing equipment |
5 | |
| Computer equipment and software |
3 | |
| Office furniture and equipment |
5 |
Included in property and equipment are certain costs of software obtained for internal use. Costs incurred during the preliminary project stage are expensed as incurred, while costs incurred during the application development stage are capitalized and amortized over the estimated useful life of the software. The Company also capitalizes costs related to specific upgrades and enhancements when it is probable the expenditures will result in additional functionality. Maintenance and training costs related to software obtained for internal use are expensed as incurred.
Leasehold improvements are amortized over the shorter of the estimated useful life of the asset or the remaining lease term. Costs for capital assets not yet placed into service have been capitalized as construction in progress and will be depreciated in accordance with the above guidelines once placed into service. Maintenance and repair costs are expensed as incurred.
Revenue Recognition
The Company generates all of its revenue from sales of its EndoBarrier to health care providers and third-party distributors who resell the product to health care providers.
The Company considers revenue to be realized or realizable and earned when all of the following criteria are met: persuasive evidence of a sales arrangement exists, delivery has occurred or services have been rendered, the price is fixed or determinable, and collectibility is reasonably assured. Revenue is recognized upon passage of title and risk of loss to customers, unless a consignment arrangement exists and provided an estimate can be made for sales returns.
With respect to these criteria:
| • | The evidence of an arrangement generally consists of a health care provider or distributor purchase order with the necessary approvals and acceptance by the Company. |
| • | Transfer of title and risk and rewards of ownership are passed to the health care provider or third-party distributor upon delivery of the products. |
| • | The selling prices for all sales are fixed and agreed with the health care provider or third-party distributor. Provisions for discounts and rebates to customers are established as a reduction to revenue in the same period the related sales are recorded. |
| • | When doubt exists about collectibility from specific customers, the Company defers revenue from sales of products to those customers until payment is received. |
F-9
Table of Contents
GI Dynamics, Inc. and Subsidiaries
Notes to Consolidated Financial Statements (continued)
2. Summary of Significant Accounting Policies (continued)
In certain circumstances the Company allows customers to return defective or nonconforming products for credit or replacement products. Defective or nonconforming products typically include those products that resulted in an unsuccessful implant procedure. The Company considers these transactions to be product returns and bases its estimate for sales returns upon historical trends and records the amount as a reduction to revenue upon the initial sale of the product. In the event the Company is unable to reasonably estimate future returns, it recognizes revenue when the right of return lapses. Prior to the fourth quarter of 2013, the Company did not have sufficient historical experience on which to base an estimate of returns, and therefore recognized revenue when the right of return lapsed. The Company determined this point to be when the product was implanted or otherwise consumed and payment was received from the customer, which indicated that the Company had no further obligations to the customer and that the sale was complete. As a result, starting in the fourth quarter of 2013, the Company began to recognize revenue at the time of delivery net of these return estimates. Prospectively, the Company will continue to evaluate whether it has sufficient data to determine return estimates as it enters new markets.
The Company has certain relationships in which title to delivered product passes to a buyer, but the substance of the transaction is that of a consignment arrangement. In these cases, the Company recognizes revenue when the product is implanted or otherwise consumed and payment is received from the customer, which indicates that the Company has no further obligations to the customer and that the sale is complete. For these transactions, revenue recognition is deferred until the sale is complete.
At December 31, 2014 and 2013, the Company had deferred revenue of approximately $0.4 million and $0.7 million, respectively.
In addition, the Company has entered into consignment arrangements in which the Company delivers the product to the customer but retains title to the product until it is implanted or otherwise consumed. In these arrangements, the Company recognizes revenue once it receives proof of third party purchase, usually in the form of a customer purchase order.
Shipping and Handling Costs
Shipping and handling costs are included in costs of revenue.
Research and Development Costs
Research and development costs are expensed when incurred. Research and development costs include costs of all basic research activities as well as other research, engineering, and technical effort required to develop a new product or service or make significant improvement to an existing product or manufacturing process. Research and development costs also include pre-approval regulatory and clinical trial expenses.
Patent Costs
The Company expenses as incurred all costs, including legal expenses, associated with obtaining patents until the patented technology becomes feasible. All costs incurred after the patented technology is feasible will be capitalized as an intangible asset. As of December 31, 2014, no such costs had been capitalized since inception of the Company. The Company has expensed approximately $0.5 million, $0.4 million and $0.5 million of patent costs within general and administrative expenses in the consolidated statements of comprehensive loss for the years ended December 31, 2014, 2013 and 2012, respectively.
F-10
Table of Contents
GI Dynamics, Inc. and Subsidiaries
Notes to Consolidated Financial Statements (continued)
2. Summary of Significant Accounting Policies (continued)
Stock-Based Compensation
The Company accounts for stock-based compensation in accordance with the Financial Accounting Standards Board (“FASB”) Accounting Standards Codification (“ASC”) 718, Stock Compensation (“ASC 718”), which requires that stock-based compensation be measured and recognized as an expense in the financial statements and that such expense be measured at the grant date fair value.
For awards that vest based on service conditions, the Company uses the straight-line method to allocate compensation expense to reporting periods. The grant date fair value of options granted is calculated using the Black-Scholes option pricing model, which requires the use of subjective assumptions including volatility, expected term and the fair value of the underlying common stock, among others.
The Company periodically issues performance-based awards. For these awards, vesting will occur upon the achievement of certain milestones. When achievement of the milestone is deemed probable, the Company expenses the compensation of the respective stock award over the implicit service period.
Stock awards to non-employees are accounted for in accordance with ASC 505-50, Equity-Based Payments to Non-Employees (“ASC 505-50”). The measurement date for non-employee awards is generally the date performance of services required from the non-employee is complete. For non-employee awards that vest based on service conditions, the Company expenses the value of the awards over the related service period, provided they expect the service condition to be met. The Company records the expense of services rendered by non-employees based on the estimated fair value of the stock option using the Black-Scholes option pricing model over the contractual term of the non-employee. The fair value of unvested non-employee awards are remeasured at each reporting period and expensed over the vesting term of the underlying stock options on a straight-line basis.
The stock-based compensation plans provide that grantees may have the right to exercise an option prior to vesting. Shares purchased upon the exercise of unvested options will be subject to the same vesting schedule as the underlying options, and are subject to repurchase at the original exercise price by the Company should the grantee discontinue providing services to the Company for any reason, prior to becoming fully vested in such shares.
Impairment of Long-Lived Assets
The Company regularly reviews the carrying amount of its long-lived assets to determine whether indicators of impairment may exist that warrant adjustments to carrying values or estimated useful lives. If indications of impairment exist, projected future undiscounted cash flows associated with the asset are compared to the carrying amount to determine whether the asset’s value is recoverable. If the carrying value of the asset exceeds such projected undiscounted cash flows, the asset will be written down to its estimated fair value. To date, no such impairments have been recognized.
Comprehensive Income (Loss)
Comprehensive income (loss) is the change in equity of a company during a period from transactions and other events and circumstances, excluding transactions resulting from investments by owners and distributions to owners. The Company currently does not have any changes in equity from non-owner sources. As a result, comprehensive loss was equal to the net loss for all periods reported.
F-11
Table of Contents
GI Dynamics, Inc. and Subsidiaries
Notes to Consolidated Financial Statements (continued)
2. Summary of Significant Accounting Policies (continued)
Loss Contingencies
In accordance with ASC 450, Contingencies, the Company accrues anticipated costs of settlement, damages, and losses for loss contingencies based on historical experience or to the extent specific losses are probable and estimable. Otherwise, the Company expenses these costs as incurred. If the estimate of a probable loss is a range, and no amount within the range is more likely, the Company accrues the minimum amount of the range.
Income Taxes
The Company provides for income taxes under the liability method. The Company records deferred tax assets and liabilities for the expected future tax consequences of temporary differences between the Company’s financial reporting and the tax bases of assets and liabilities measured using the enacted tax rates expected to be in effect in the years in which the differences are expected to reverse. Deferred tax assets are reduced by a valuation allowance to reflect the uncertainty associated with their ultimate realization.
The Company accounts for uncertain tax positions recognized in the consolidated financial statements by applying a more-likely-than-not threshold for financial statement recognition and measurement of a tax position taken or expected to be taken in a tax return.
Guarantees
The Company has identified the guarantees described below as disclosable, in accordance with ASC 460, Guarantees.
As permitted under Delaware law, the Company indemnifies its officers and directors for certain events or occurrences while the officer or director is, or was, serving at the Company’s request in such capacity. The maximum potential amount of future payments the Company could be required to make is unlimited; however, the Company has directors’ and officers’ insurance coverage that should limit its exposure and enable it to recover a portion of any future amounts paid.
The Company is a party to a number of agreements entered into in the ordinary course of business that contain typical provisions that obligate the Company to indemnify the other parties to such agreements upon the occurrence of certain events. Such indemnification obligations are usually in effect from the date of execution of the applicable agreement for a period equal to the applicable statute of limitations. The aggregate maximum potential future liability of the Company under such indemnification provisions is uncertain.
The Company leases office space under several non-cancelable operating leases (Note 11). The Company has standard indemnification arrangements under these leases that require it to indemnify its landlords against all costs, expenses, fines, suits, claims, demands, liabilities, and actions directly resulting from any breach, violation, or nonperformance of any covenant or condition of the respective lease. The aggregate maximum potential future liability of the Company under such indemnification provisions is uncertain.
As of December 31, 2014 and 2013, the Company had not experienced any material losses related to these indemnification obligations, and no material claims with respect thereto were outstanding. The Company does not expect significant claims related to these indemnification obligations and, consequently, concluded that the fair value of these obligations is negligible. As a result, no related reserves have been established.
F-12
Table of Contents
GI Dynamics, Inc. and Subsidiaries
Notes to Consolidated Financial Statements (continued)
2. Summary of Significant Accounting Policies (continued)
Subsequent Events
The Company evaluates events occurring after the date of its consolidated balance sheet for potential recognition or disclosure in its consolidated financial statements. There have been no subsequent events that have occurred through the date the Company issued its consolidated financial statements that require disclosure in or adjustment to its consolidated financial statements.
Reclassifications
Certain reclassifications related to the presentation of income tax expense in the consolidated statements of comprehensive loss have been made to prior year amounts to conform with current year presentation. In prior years, income tax expense was included in operating expenses as the amounts were not material.
Additionally, certain reclassifications related to the presentation of the change in deferred rent expense and the change in inventory in the consolidated statements of cash flows have been made to prior year amounts to conform with current year presentation.
New Accounting Pronouncements
From time to time, new accounting pronouncements are issued by the FASB or other standard setting bodies that are adopted by the Company as of the specified effective date. Unless otherwise discussed, the Company believes that the effect of recently issued standards that are not yet effective will not have a material effect on its consolidated financial position or results of operations upon adoption.
In May 2014, the FASB issued Accounting Standards Update (“ASU”) No. 2014-09, Revenue from Contracts with Customers (“ASU 2014-09”), which stipulates that an entity should recognize revenue to depict the transfer of promised goods or services to customers in an amount that reflects the consideration to which the entity expects to be entitled in exchange for those goods or services. To achieve this core principle, an entity should apply the following steps: (1) identify the contract(s) with a customer; (2) identify the performance obligations in the contract; (3) determine the transaction price; (4) allocate the transaction price to the performance obligations in the contract; and (5) recognize revenue when (or as) the entity satisfies a performance obligation. ASU 2014-09 will be effective for the Company for reporting periods beginning after December 15, 2016. Early adoption is not permitted. Management is currently evaluating the impact of the pending adoption of ASU 2014-09 on the Company’s consolidated financial statements.
In August 2014, the FASB issued ASU No. 2014-15, Presentation of Financial Statements-Going Concern: Disclosure of Uncertainties about an Entity’s Ability to Continue as a Going Concern (“ASU 2014-15”). This new standard gives a company’s management the final responsibilities to decide whether there’s substantial doubt about the company’s ability to continue as a going concern and to provide related footnote disclosures. The standard provides guidance to management, with principles and definitions that are intended to reduce diversity in the timing and content of disclosures that companies commonly provide in their footnotes. Under the new standard, management must decide whether there are conditions or events, considered in the aggregate, that raise substantial doubt about the company’s ability to continue as a going concern within one year after the date that the financial statements are issued, or within one year after the date that the financial statements are available to be issued when applicable. This guidance is effective for annual reporting beginning after December 15, 2016, including interim periods within the year of adoption, with early application permitted. Accordingly, the standard is effective for the Company on January 1, 2017. The adoption of this guidance is not expected to have a material impact on the Company’s consolidated financial statements.
F-13
Table of Contents
GI Dynamics, Inc. and Subsidiaries
Notes to Consolidated Financial Statements (continued)
3. Net Loss per Common Share
Basic net loss per common share is computed by dividing net loss by the weighted-average number of common shares outstanding during the period. Potential common stock equivalents are determined using the treasury stock method. For diluted net loss per share purposes, the Company excludes stock options and other stock-based awards, including shares issued as a result of option exercises but which are subject to repurchase by the Company, whose effect would be anti-dilutive from the calculation. During each of the years ended December 31, 2014, 2013 and 2012, common stock equivalents were excluded from the calculation of diluted net loss per common share, as their effect was anti-dilutive due to the net loss incurred. Therefore, basic and diluted net loss per share was the same in all periods presented.
The following potentially dilutive securities have been excluded from the computation of diluted weighted-average shares outstanding as of December 31, 2014, 2013 and 2012, as they would be anti-dilutive:
| Years Ended December 31, | ||||||||||||
| 2014 | 2013 | 2012 | ||||||||||
| Warrants to purchase common stock |
500,000 | 500,000 | 500,000 | |||||||||
| Options to purchase common stock and other stock-based awards |
14,072,647 | 9,634,547 | 8,574,342 | |||||||||
|
|
|
|
|
|
|
|||||||
| Total |
14,572,647 | 10,134,547 | 9,074,342 | |||||||||
|
|
|
|
|
|
|
|||||||
4. Common Stock Warrants
In connection with the Company’s IPO in September 2011, the Company issued warrants in an aggregate amount of 500,000 shares of common stock at an exercise price of A$5.50 per share to the lead manager of the IPO and certain other investors. The warrants will expire on the fifth anniversary of their date of grant. The warrants may be converted on a cashless basis at the option of the holder. The Company has reserved 500,000 shares of common stock related to these warrants.
The Company accounts for the warrants under ASC 815, Derivatives and Hedging (“ASC 815”). In accordance with the guidance included in ASC 815, because the Company’s functional currency is the U.S. dollar and the exercise price of the warrants is in Australian dollars, the Company is exposed to currency exchange risk related to the warrants. As a result, the warrants are not considered indexed to the Company’s own stock, and therefore, the warrants are classified as a liability and the fair value of the warrants must be remeasured at each reporting period. At the time the warrants were issued, the Company estimated the fair value of the warrants using the Black-Scholes option pricing model. The Company remeasured the fair value of the warrants at each reporting period using current assumptions and current foreign exchange rates, with changes in value recorded as other income or expense (Note 5).
5. Fair Value of Financial Instruments
The tables below present information about the Company’s assets and liabilities that are measured at fair value on a recurring basis as of December 31, 2014 and 2013, and indicates the fair value hierarchy of the valuation techniques the Company used to determine such fair value. In general, fair values determined by Level 1 inputs utilize observable inputs such as quoted prices in active markets for identical assets or liabilities. Fair values determined by Level 2 inputs utilize data points that are either directly or indirectly observable, such as quoted prices, interest rates and yield curves. Fair values determined by Level 3 inputs utilize unobservable data points in which there is little or no market data, requiring the Company to develop its own assumptions for the asset or liability.
F-14
Table of Contents
GI Dynamics, Inc. and Subsidiaries
Notes to Consolidated Financial Statements (continued)
5. Fair Value of Financial Instruments (continued)
The following tables present the assets and liabilities the Company has measured at fair value on a recurring basis (in thousands):
| Fair Value Measurements at Reporting Date Using |
||||||||||||||||
| Description |
December 31, 2014 |
Quoted Prices in Active Markets for Identical Assets (Level 1) |
Significant Other Observable Inputs (Level 2) |
Significant Unobservable Inputs (Level 3) |
||||||||||||
| Assets |
||||||||||||||||
| Money market funds (included in cash and cash equivalents) |
$ | 38,454 | $ | 38,454 | $ | — | $ | — | ||||||||
|
|
|
|
|
|
|
|
|
|||||||||
| Total assets |
$ | 38,454 | $ | 38,454 | $ | — | $ | — | ||||||||
|
|
|
|
|
|
|
|
|
|||||||||
| Liabilities |
||||||||||||||||
| Warrants to purchase common stock |
$ | 9 | $ | — | $ | — | $ | 9 | ||||||||
|
|
|
|
|
|
|
|
|
|||||||||
| Total liabilities |
$ | 9 | $ | — | $ | — | $ | 9 | ||||||||
|
|
|
|
|
|
|
|
|
|||||||||
| Fair Value Measurements at Reporting Date Using |
||||||||||||||||
| Description |
December 31, 2013 |
Quoted Prices in Active Markets for Identical Assets (Level 1) |
Significant Other Observable Inputs (Level 2) |
Significant Unobservable Inputs (Level 3) |
||||||||||||
| Assets |
||||||||||||||||
| Money market funds (included in cash and cash equivalents) |
$ | 45,560 | $ | 45,560 | $ | — | $ | — | ||||||||
|
|
|
|
|
|
|
|
|
|||||||||
| Total assets |
$ | 45,560 | $ | 45,560 | $ | — | $ | — | ||||||||
|
|
|
|
|
|
|
|
|
|||||||||
| Liabilities |
||||||||||||||||
| Warrants to purchase common stock |
$ | 326 | $ | — | $ | — | $ | 326 | ||||||||
|
|
|
|
|
|
|
|
|
|||||||||
| Total liabilities |
$ | 326 | $ | — | $— | $ | 326 | |||||||||
|
|
|
|
|
|
|
|
|
|||||||||
The assumptions used in the Black-Scholes option pricing model to determine the fair value of the common stock warrants at December 31, 2014, 2013 and 2012 were as follows:
| December 31, | ||||||||||||
| 2014 | 2013 | 2012 | ||||||||||
| Exercise price (A$5.50 at the then current exchange rate) |
$ | 4.51 | $ | 4.92 | $ | 5.71 | ||||||
| Fair value of common stock |
$ | 0.98 | $ | 3.36 | $ | 2.86 | ||||||
| Expected volatility |
62.2 | % | 48.7 | % | 53.6 | % | ||||||
| Expected term (in years) |
1.7 | 2.7 | 3.7 | |||||||||
| Risk-free interest rate |
0.5 | % | 0.7 | % | 0.5 | % | ||||||
| Expected dividend yield |
— | % | — | % | — | % | ||||||
F-15
Table of Contents
GI Dynamics, Inc. and Subsidiaries
Notes to Consolidated Financial Statements (continued)
5. Fair Value of Financial Instruments (continued)
The following table rolls forward the fair value of the warrants, where fair value is determined by Level 3 inputs (in thousands):
| Balance at December 31, 2012 |
$ | 294 | ||
| Increase in fair value of warrants upon remeasurement included in other income (expense) |
32 | |||
|
|
|
|||
| Balance at December 31, 2013 |
326 | |||
| Decrease in fair value of warrants upon remeasurement included in other income (expense) |
(317 | ) | ||
|
|
|
|||
| Balance at December 31, 2014 |
$ | 9 | ||
|
|
|
Cash equivalents, accounts receivable, prepaid expenses and other current assets, accounts payable, accrued expenses and other current liabilities at December 31, 2014 and 2013 are carried at amounts that approximate fair value due to their short-term maturities and highly liquid nature of these instruments.
6. Concentrations of Credit Risk, Accounts Receivable and Related Valuation Account
Financial instruments that subject the Company to credit risk primarily consist of cash and cash equivalents and accounts receivable. The Company maintains its cash and cash equivalent balances with high quality financial institutions, and consequently, the Company believes that such funds are subject to minimal credit risk. The Company’s short-term investments potentially subject the Company to concentrations of credit risk. The Company has adopted an investment policy that limits the amounts the Company may invest in any one type of investment and requires all investments held by the Company to have a rating of not less than A, thereby reducing credit risk concentration.
Accounts receivable primarily consist of amounts due from customers, including distributors and health care providers in different countries. In light of the current economic state of many foreign countries, the Company continues to monitor the creditworthiness of its customers.
At December 31, 2014 and 2013, one distributor accounted for approximately 32% and 49%, respectively, of the Company’s accounts receivable. No other customer accounted for greater than 10% of the Company’s accounts receivable at December 31, 2014 and 2013.
The Company grants credit to customers in the normal course of business but generally does not require collateral or any other security to support its receivables. The Company makes judgments as to its ability to collect outstanding receivables and provides an allowance for receivables when collection becomes doubtful. Provisions are made based upon a specific review of all significant outstanding invoices and the overall quality and age of those invoices not individually reviewed. To date, the Company has not had any write-offs of bad debt; however, as of December 31, 2014, the Company had approximately $41,000 of accounts receivable where collection is deemed to be doubtful, and as such, the Company has established an allowance for doubtful accounts. There was no corresponding allowance for doubtful accounts as of December 31, 2013.
In certain circumstances the Company allows customers to return defective or nonconforming products for credit or replacement products. Defective or nonconforming products typically include those products that resulted in an unsuccessful implant procedure. The Company records an estimate for product returns based upon historical trends. The associated reserve for product returns is recorded as a reduction of the Company’s accounts receivable.
F-16
Table of Contents
GI Dynamics, Inc. and Subsidiaries
Notes to Consolidated Financial Statements (continued)
6. Concentrations of Credit Risk, Accounts Receivable and Related Valuation Account (continued)
The following table shows the components of the Company’s accounts receivable at December 31, 2014 and 2013 (in thousands):
| December 31, | ||||||||
| 2014 | 2013 | |||||||
| Accounts receivable |
$ | 555 | $ | 688 | ||||
| Less: allowance for doubtful accounts |
(41 | ) | — | |||||
| Less: allowance for sales returns |
(44 | ) | (28 | ) | ||||
|
|
|
|
|
|||||
| Total |
$ | 470 | $ | 660 | ||||
|
|
|
|
|
|||||
7. Inventory
The Company states inventory at the lower of first-in, first-out cost or market. The Company records a provision for excess, expired, and obsolete inventory based primarily on estimates of forecasted revenues. A significant change in the timing or level of demand for products as compared to forecasted amounts may result in recording additional provisions for excess, expired, and obsolete inventory in the future. When capitalizing inventory, the Company considers factors such as status of regulatory approval, alternative use of inventory, and anticipated commercial use of the product.
The determination of obsolete or excess inventory requires the Company to estimate the future demand for its products within appropriate time horizons. The estimated future demand is compared to inventory levels to determine the amount, if any, of obsolete and excess inventory. The demand forecast includes the Company’s estimates of market growth and various internal estimates, and is based on assumptions that are consistent with the plans and estimates the Company is using to manage its underlying business and short-term manufacturing plans. Forecasting demand for the EndoBarrier in a market in which there are few, if any, comparable approved devices and for which reimbursement from third-party payers is limited has been difficult. To the extent the Company’s demand forecast is less than its inventory on-hand, the Company could be required to record reserves for excess inventory.
In 2014, the Company performed an excess and obsolete inventory analysis due to current evidence that the utility of certain amounts of the raw material sleeve inventory, as it was expected to be used, will be less than cost. Factors contributing to the Company recording a provision in 2014 included: the effect of the shipment hold on the Company’s inventory levels, the change in management and resulting changes to the Company’s commercial strategy, the expected timing of third-party payer reimbursement in its commercial markets, the uncertainty around the timing and success of its ENDO Trial and the historical accuracy of its demand forecasts. As a result, the Company determined that its raw material sleeve inventory was in excess of its currently anticipated commercial demand for future sales. Accordingly, for the year ended December 31, 2014, the Company recorded a provision for excess inventory of approximately $1.6 million to reduce the carrying value of the raw material sleeve inventory.
Inventory at December 31, 2014 and 2013 was as follows (in thousands):
| December 31, | ||||||||
| 2014 | 2013 | |||||||
| Finished goods |
$ | 733 | $ | 1,010 | ||||
| Work-in-process |
2,401 | 1,208 | ||||||
| Raw materials |
2,354 | 5,053 | ||||||
|
|
|
|
|
|||||
| Total |
$ | 5,488 | $ | 7,271 | ||||
|
|
|
|
|
|||||
F-17
Table of Contents
GI Dynamics, Inc. and Subsidiaries
Notes to Consolidated Financial Statements (continued)
7. Inventory (continued)
The Company has entered into consignment arrangements in which the Company delivers product to the customer but retains title to the product until it is implanted or otherwise consumed. At December 31, 2014, approximately 4% of the finished goods inventory was at customer locations pursuant to these arrangements. At December 31, 2013, an immaterial amount of the finished goods inventory was at customer locations pursuant to consignment arrangements.
8. Property and Equipment
Property and equipment consisted of the following (in thousands):
| December 31, | ||||||||
| 2014 | 2013 | |||||||
| Laboratory and manufacturing equipment |
$ | 545 | $ | 387 | ||||
| Computer equipment and software |
1,125 | 1,032 | ||||||
| Office furniture and equipment |
221 | 270 | ||||||
| Construction in process |
48 | 95 | ||||||
| Leasehold improvements |
921 | 921 | ||||||
|
|
|
|
|
|||||
| 2,860 | 2,705 | |||||||
| Less accumulated depreciation and amortization |
(1,771 | ) | (1,215 | ) | ||||
|
|
|
|
|
|||||
| Total |
$ | 1,089 | $ | 1,490 | ||||
|
|
|
|
|
|||||
Depreciation and amortization expense of property and equipment was approximately $0.7 million, $0.4 million and $0.3 million for the years ended December 31, 2014, 2013, and 2012, respectively.
9. Accrued Expenses
Accrued expenses consisted of the following (in thousands):
| December 31, | ||||||||
| 2014 | 2013 | |||||||
| Clinical trials |
$ | 3,906 | $ | 1,526 | ||||
| Payroll and related liabilities |
2,629 | 1,576 | ||||||
| Professional fees |
634 | 630 | ||||||
| Deferred rent, current portion |
151 | 91 | ||||||
| Other |
354 | 577 | ||||||
|
|
|
|
|
|||||
| Total |
$ | 7,674 | $ | 4,400 | ||||
|
|
|
|
|
|||||
In 2014, the Company recorded approximately $1.5 million of separation related expenses of which approximately $1.3 million is included in payroll and related liabilities at December 31, 2014 and which will be paid out through March 2016.
10. Debt
In January 2012, the Company entered into an unsecured credit facility of approximately $0.2 million related to the Company’s acquisition of its enterprise resource planning system. The credit facility was fully repaid in August 2014. Prior to its repayment, interest on the borrowings under the credit facility was at an annual interest rate of 5.6%.
F-18
Table of Contents
GI Dynamics, Inc. and Subsidiaries
Notes to Consolidated Financial Statements (continued)
11. Commitments and Contingencies
Lease Commitments
In June 2013, the Company entered into a noncancelable agreement to sublease 33,339 square feet of office, laboratory and manufacturing space in Lexington, Massachusetts. The sublease commenced in June 2013 and expires in December 2016, subject to earlier termination under certain conditions. Base rent during the initial rent period is approximately $0.6 million per year and increases annually by approximately $17,000. The space was delivered to the Company in June 2013 and rent payments commenced in May 2014. The rent expense, inclusive of the escalating rent payments and free rent period, is recognized on a straight-line basis over the term of the sublease agreement. In accordance with the terms of the sublease agreement, the Company maintains an unsecured letter of credit of approximately $0.2 million securing its obligations under the sublease agreement.
In March 2012, the Company’s subsidiary, GID Germany GmbH, entered into a noncancelable operating lease for office space in Dusseldorf, Germany. The lease was renewed in September 2013 and again in January 2015 and was extended through April 2016. The agreement was extended under substantially the same terms as the original agreement and is subject to earlier termination based on certain terms and conditions. The rent expense, inclusive of the free rent periods, is recognized on a straight-line basis over the term of the current lease agreement.
In July 2013, the Company’s subsidiary, GI Dynamics Australia Pty Ltd, entered into a noncancelable operating lease for office space in Baulkham Hills, Australia. The initial term of the lease was for twelve months, which expired in July 2014. The Company exercised its option to renew the lease and extended the term through July 2015, subject to earlier termination under certain conditions.
Rent expense on noncancelable operating leases was approximately $0.5 million, $0.6 million and $0.3 million for the years ended December 31, 2014, 2013 and 2012, respectively.
Future minimum lease payments under noncancelable operating leases at December 31, 2014, are as follows (in thousands):
| Year Ending December 31, |
||||
| 2015 |
616 | |||
| 2016 |
611 | |||
|
|
|
|||
| Total |
$ | 1,227 | ||
|
|
|
License Agreement
In 2003, the Company entered into a license agreement (“License Agreement”) for certain intellectual property. The License Agreement required the Company to pay $75,000 at execution, make payments of $12,500 in 2004, and $25,000 each year thereafter, until the date of first commercial sale of the product, as defined in the License Agreement. In 2011, the Company began commercial sales of the product as defined in the License Agreement and as a result ceased making the yearly payments. The royalty obligation begins with U.S. commercial sales of products as defined in the License Agreement, if any. The royalty percentage may vary on products covered by the License Agreement, but in any case, the royalties are not considered significant. The Company will cease paying royalties, if any, at the time the patent covered by the License Agreement expires in 2017.
F-19
Table of Contents
GI Dynamics, Inc. and Subsidiaries
Notes to Consolidated Financial Statements (continued)
11. Commitments and Contingencies (continued)
Supply Agreement
In July 2013, the Company and W.L. Gore & Associates, Inc. (“Gore”) agreed to terminate their supply agreement (“Supply Agreement”). The Supply Agreement, entered into in 2004, was for the supply of a material used to manufacture the sleeve used in the Company’s products.
Litigation
On January 9, 2013, the Company reached a settlement of litigation brought by Gore in the United States District Court for the District of Arizona in June 2010. In the litigation, Gore sought essentially the following declarations: (1) that it was the co-owner of all of the Company’s patents and patent applications and (2) that the Supply Agreement (discussed above) was void. The Company strongly denied all of the claims made by Gore and also filed counterclaims against Gore alleging, among other claims, misuse and misappropriation by Gore of the Company’s trade secrets. The Company also sought declarations that Gore was not the co-inventor or co-owner of any of the Company’s patents.
Under the settlement, the Company retains exclusive ownership and control of its patent portfolio, and both parties have dismissed all claims against each other. The dismissed claims included Gore’s claim that the Supply Agreement was void. The Company granted to Gore, a non-exclusive, royalty-free license to use the Company’s patents, but only for application in the vasculature. Gore is not licensed to use the Company’s patents for any applications in the gastrointestinal tract, which is the area of the body in which the Company’s products are designed to be used. Neither side made any cash payments to the other, nor will any royalties be due.
12. Stockholders’ Equity
The authorized capital stock of the Company consists of 145,000,000 shares, of which 130,000,000 shares are designated as common stock, 10,000,000 shares are designated as Class B common stock, and 5,000,000 shares are designated as preferred stock.
Common Stock
In September 2011, in conjunction with the Company’s IPO, the Company amended its certificate of incorporation to authorize it to issue up to 130,000,000 shares of common stock, 10,000,000 shares of Class B common stock and 5,000,000 shares of preferred stock.
The Company authorized Class B common stock in order meet the Listing Rules of the ASX so far as they apply to escrowed securities. In the event that holders of common stock, who are subject to ASX-imposed escrow, breach the terms of their escrow agreement or the Listing Rules as they apply to escrowed securities, their common stock will be automatically converted into Class B common stock until the earlier to occur of the expiration of the escrow period or the breach being rectified. The Class B common stock is identical to and ranks equally with the common stock except that Class B common stock has no voting rights and is not entitled to any dividends.
In July and August 2013, the Company sold approximately 108.5 million CDIs at an issue price of A$0.53 per CDI in a private placement. In conjunction with the private placement, the Company initiated an SPP, in which eligible shareholders who held CDIs or shares of common stock in the Company at the record date were entitled to acquire up to A$15,000 worth of additional CDIs at an issue price of A$0.53 per CDI. The Company sold approximately 4.4 million CDIs in the SPP. As a result of the private placement and SPP, the Company raised approximately $52.5 million, net of expenses.
F-20
Table of Contents
GI Dynamics, Inc. and Subsidiaries
Notes to Consolidated Financial Statements (continued)
12. Stockholders’ Equity (continued)
In May 2014, the Company raised approximately $30.8 million, net of expenses, in an offering of the Company’s CDIs to sophisticated, professional and accredited investors in Australia, Hong Kong, the United Kingdom and certain other jurisdictions. The Company sold approximately 66.0 million CDI’s at an issue price of A$0.52 per CDI. The Company intends to use these proceeds to fund its U.S. pivotal clinical trial and for general working capital purposes.
13. Stock Plans
The Company has two stock-based compensation plans. The Board of Directors adopted the 2003 Omnibus Stock Plan (the “2003 Plan”), which provides for the grant of qualified incentive stock options and nonqualified stock options or other awards to the Company’s employees, officers, directors, advisors, and outside consultants to purchase up to an aggregate of 9,220,861 shares of the Company’s common stock.
In August 2011, the Board of Directors adopted the 2011 Employee, Director and Consultant Equity Incentive Plan (the “2011 Plan”, together with the 2003 Plan, the “Plans”) as the successor to the 2003 Plan. Under the 2011 Plan, the Company may grant incentive stock options, nonqualified stock options, restricted and unrestricted stock awards and other stock-based awards. The Company had initially reserved 4,500,000 shares of its common stock for issue under the 2011 Plan. Awards that are returned to the Company’s 2003 Plan as a result of their forfeiture, expiration or cancellation without delivery of common stock shares or that result in the forfeiture of shares back to the Company on or after August 1, 2011, the date the 2011 Plan became effective, are automatically made available for issuance under the 2011 Plan. At August 1, 2011, 802,350 shares available for grant under the 2003 Plan were transferred to the 2011 Plan. At December 31, 2014, 1,983,802 shares were available for grant under the 2011 Plan.
In addition, the 2011 Plan allows for an annual increase in the number of shares available for issue under the 2011 Plan commencing on the first day of each fiscal year during the period beginning in fiscal year 2012 and ending in fiscal year 2020. The annual increase in the number of shares shall be equal to the lowest of:
| • | 5 million shares; |
| • | 4% of the number of common shares outstanding as of such date; and |
| • | an amount determined by the Board of Directors or the Company’s compensation committee. |
Accordingly, during 2014 3,203,509 shares were added to the 2011 Plan.
Stock-Based Compensation
Stock-based compensation is reflected in the consolidated statements of comprehensive loss as follows for the years ended December 31, 2014, 2013 and 2012 (in thousands):
| Years Ended December 31, | ||||||||||||
| 2014 | 2013 | 2012 | ||||||||||
| Cost of revenue |
$ | 126 | $ | 69 | $ | 58 | ||||||
| Research and development |
1,179 | 679 | 534 | |||||||||
| Sales and marketing |
1,367 | 1,364 | 1,052 | |||||||||
| General and administrative |
1,998 | 1,593 | 946 | |||||||||
|
|
|
|
|
|
|
|||||||
| $ | 4,670 | $ | 3,705 | $ | 2,590 | |||||||
|
|
|
|
|
|
|
|||||||
F-21
Table of Contents
GI Dynamics, Inc. and Subsidiaries
Notes to Consolidated Financial Statements (continued)
13. Stock Plans (continued)
The stock options granted under the Plans generally vest over a four-year period and expire ten years from the date of grant. From time to time, the Company grants stock options to purchase common stock subject to performance-based milestones. The vesting of these stock options will occur upon the achievement of certain milestones. When achievement of the milestone is deemed probable, the Company expenses the compensation of the respective stock option over the implicit service period. At December 31, 2014, the Company had options for the purchase of 200,000 shares of common stock subject to performance-based milestone vesting. During the year ended December 31, 2014, the Company did not recognize any expense associated with options subject to performance-based milestones as the vesting of the underlying awards was not deemed probable. During the year ended December 31, 2013, an option granted in 2007, for the purchase of 130,000 shares of common stock, originally associated with a performance-based milestone, was modified by the Board of Directors to fully vest based upon services provided. The Company recorded approximately $0.4 million of expense associated with the modification and vesting of this option grant. No expense associated with performance-based milestone options was recognized during the year ended December 31, 2012.
Due to the absence of an active market for the Company’s common stock, prior to the Company’s IPO in September 2011, the Board of Directors was required to determine the fair value of the common stock for consideration in setting exercise prices for the options granted and in valuing the options granted. In determining the exercise prices for options granted, the Company’s Board of Directors considered both quantitative and qualitative factors including the results obtained from an independent third-party valuation, the Company’s financial position and historical financial performance, the status of technological developments within the Company’s products, the composition and ability of the current research and management team, achievement of enterprise milestones, an evaluation or benchmark of the Company’s competition, the current business climate in the marketplace, the illiquid nature of the common stock, arm’s-length sales of the Company’s capital stock (including convertible preferred stock), the effect of the rights and preferences of the preferred shareholders, and the prospects of a liquidity event, among others.
In calculating stock-based compensation costs, the Company estimated the fair value of stock options using the Black-Scholes option-pricing model. The Black-Scholes option-pricing model was developed for use in estimating the fair value of short-lived, exchange-traded options that have no vesting restrictions and are fully transferable. The Company estimates the number of awards that will be forfeited in calculating compensation costs. Such costs are then recognized over the requisite service period of the awards on a straight-line basis.
Determining the fair value of stock-based awards using the Black-Scholes option-pricing model requires the use of highly subjective assumptions, including the expected term of the award and expected stock price volatility. The weighted-average assumptions used to estimate the fair value of employee stock options using the Black-Scholes option-pricing model were as follows for the years ended December 31, 2014, 2013 and 2012:
| Years Ended December 31, | ||||||||||||
| 2014 | 2013 | 2012 | ||||||||||
| Expected volatility |
61.6 | % | 64.8 | % | 64.2 | % | ||||||
| Expected term (in years) |
6.05 | 6.05 | 6.05 | |||||||||
| Risk-free interest rate |
2.1 | % | 1.1 | % | 1.0 | % | ||||||
| Expected dividend yield |
— | % | — | % | — | % | ||||||
F-22
Table of Contents
GI Dynamics, Inc. and Subsidiaries
Notes to Consolidated Financial Statements (continued)
13. Stock Plans (continued)
Expected Volatility
Volatility measures the amount that a stock price has fluctuated or is expected to fluctuate during a period. As the Company was not publicly traded prior to September 2011 and therefore had no trading history, stock price volatility was estimated based on an analysis of historical and implied volatility of comparable public companies.
Expected Term
The Company has limited historical information to develop reasonable expectations about future exercise patterns and post-vesting employment termination behavior for its stock option grants. As a result, for stock option grants made during the years ended December 31, 2014, 2013 and 2012, the expected term was estimated using the “simplified method.” The simplified method is based on the average of the contractual term of the option and the weighted-average vesting period of the option. For options granted to non-employees, the Company used the remaining contractual life to estimate the expected term of non-employee awards for the years ended December 31, 2014, 2013 and 2012.
Risk-Free Interest Rate
The risk-free interest rate used for each grant is based on a zero-coupon U.S. Treasury instrument with a remaining term similar to the expected term of the stock-based award.
Expected Dividend Yield
The Company has not paid and does not anticipate paying cash dividends on its shares of common stock in the foreseeable future; therefore, the expected dividend yield is assumed to be zero.
Forfeitures
Forfeitures are estimated at the time of grant and revised, if necessary, in subsequent periods if actual forfeitures differ from the Company’s estimates. Subsequent changes in estimated forfeitures are recognized through a cumulative adjustment in the period of change and will also impact the amount of stock-based compensation expense in future periods. The Company uses historical data to estimate forfeiture rates. The Company’s estimated forfeiture rates were 5.0%, 2.0% and 2.0% as of December 31, 2014, 2013 and 2012, respectively.
F-23
Table of Contents
GI Dynamics, Inc. and Subsidiaries
Notes to Consolidated Financial Statements (continued)
13. Stock Plans (continued)
Stock Options
The following table summarizes share-based activity under the Company’s stock option plans:
| Shares of Common Stock Attributable to Options |
Weighted- Average Exercise Price |
Weighted- Average Contractual Life |
Aggregate Intrinsic Value |
|||||||||||||
| (in years) | (in thousands) | |||||||||||||||
| Outstanding at December 31, 2013 |
9,634,547 | $ | 2.59 | 6.66 | $ | 13,319 | ||||||||||
| Granted |
6,222,589 | $ | 2.66 | |||||||||||||
| Exercised |
(1,558,763 | ) | $ | 0.40 | ||||||||||||
| Cancelled |
(2,283,166 | ) | $ | 4.00 | ||||||||||||
|
|
|
|||||||||||||||
| Outstanding at December 31, 2014 |
12,015,207 | $ | 2.64 | 6.41 | $ | 1,406 | ||||||||||
|
|
|
|
|
|
|
|
|
|||||||||
| Vested or expected to vest at December 31, 2014 |
11,161,039 | $ | 2.58 | 6.62 | $ | 1,405 | ||||||||||
|
|
|
|
|
|
|
|
|
|||||||||
| Exercisable at December 31, 2014 |
5,323,391 | $ | 2.33 | 3.90 | $ | 1,401 | ||||||||||
|
|
|
|
|
|
|
|
|
|||||||||
As of December 31, 2014, there was approximately $8.9 million of unrecognized stock-based compensation, net of estimated forfeitures, related to unvested stock option grants having service-based vesting under the Plans which is expected to be recognized over a weighted-average period of 3.0 years. Additionally, there was approximately $0.4 million of unrecognized stock-based compensation, net of estimated forfeitures, related to stock option grants having performance-based milestone vesting. The total unrecognized stock-based compensation cost will be adjusted for future changes in estimated forfeitures.
The weighted-average grant date fair value of options granted during the years ended December 31, 2014, 2013 and 2012 was $1.52, $1.90 and $2.64, respectively. The total intrinsic value of options exercised during the years ended December 31, 2014, 2013 and 2012 was approximately $4.4 million, $0.5 million and $5.5 million, respectively. The intrinsic value represents the difference between the fair value of the Company’s common stock on the date of exercise and the exercise price of the stock option. Cash received from option exercises during the years ended December 31, 2014, 2013 and 2012 was approximately $0.6 million, $53,000 and $0.4 million, respectively. No tax benefits were realized from options and other stock-based payment arrangements during these periods.
The stock-based compensation plans provide that grantees may have the right to exercise an option prior to vesting. Shares purchased upon the exercise of unvested options will be subject to the same vesting schedule as the underlying options, and are subject to repurchase at the original exercise price by the Company should the grantee discontinue providing services to the Company for any reason, prior to becoming fully vested in such shares. At December 31, 2014, there were 35,000 shares of common stock issued pursuant to the exercise of unvested options that remain unvested and subject to repurchase by the Company. The exercise of these shares is not substantive and as a result, the cash paid for the exercise price is considered a deposit or prepayment of the exercise price and is recorded as a liability. Additionally, while the shares of common stock subject to repurchase are included in the legally issued shares, they are excluded from the calculation of outstanding shares. At December 31, 2013, there were no shares of common stock subject to repurchase by the Company.
F-24
Table of Contents
GI Dynamics, Inc. and Subsidiaries
Notes to Consolidated Financial Statements (continued)
13. Stock Plans (continued)
Restricted Stock Units
Each restricted stock unit (“RSU”) represents a contingent right to receive one share of the Company’s common stock. RSUs generally vest on a pro-rata basis on each anniversary of the issuance date over four years or vest in equal parts upon the achievement of a product revenue milestone and a regulatory milestone. There is no consideration payable on the vesting of RSUs issued under the plans. Upon vesting, the RSUs are exercised automatically and settled in shares of the Company’s common stock. During the year ended December 31, 2014, the Company awarded a total of 2,095,720 RSUs to employees of the Company.
The following table summarizes information related to the RSUs and activity during the year ended December 31, 2014:
| Number of Units | Weighted- Average Contractual Life |
Aggregate Intrinsic Value |
||||||||||
| (in years) | (in thousands) | |||||||||||
| Outstanding at December 31, 2013 |
— | — | $ | — | ||||||||
| Granted |
2,095,720 | |||||||||||
| Vested/Exercised |
— | |||||||||||
| Cancelled |
(38,280 | ) | ||||||||||
|
|
|
|||||||||||
| Outstanding at December 31, 2014 |
2,057,440 | 5.43 | $ | 2,016 | ||||||||
|
|
|
|
|
|
|
|||||||
The aggregate intrinsic value at December 31, 2014 noted in the table above represents the closing price of the Company’s common stock multiplied by the number of RSUs outstanding.
The fair value of each RSU award equals the closing price of the Company’s common stock on the date of grant. The weighted average grant date fair value per share of RSUs granted in the year ended December 31, 2014 was $2.26.
At December 31, 2014, 1,221,991 of the RSUs outstanding are subject to performance-based vesting criteria as described above. For these awards, the vesting will occur upon the achievement of a certain product revenue milestone and a certain regulatory milestone. When achievement of the milestone is deemed probable, the Company expenses the compensation of the respective stock award over the implicit service period. During the year ended December 31, 2014, stock-based compensation expense associated with RSUs was approximately $0.5 million, of which approximately $0.4 million is related to performance-based awards having milestones deemed probable of achievement and approximately $0.1 million is related to RSUs having service-based vesting.
As of December 31, 2014, there was approximately $2.5 million of unrecognized stock-based compensation expense, net of estimated forfeitures, related to non-vested RSU awards that have service-based vesting or have performance-based vesting criteria that are considered probable of achievement. This expense is expected to be recognized over a weighted average period of 2.5 years. The Company also has unrecognized stock-based compensation expense of approximately $1.3 million, net of estimated forfeitures, related to RSUs with performance-based vesting criteria that are not considered probable of achievement as of December 31, 2014; therefore the Company has not yet begun to recognize the expense on these awards.
F-25
Table of Contents
GI Dynamics, Inc. and Subsidiaries
Notes to Consolidated Financial Statements (continued)
13. Stock Plans (continued)
Non-employee awards
The Company accounts for non-employee awards in accordance with ASC 505-50. Stock-based compensation expense related to stock options granted to non-employees is recognized as services are rendered, generally on a straight-line basis. The Company believes that the fair value of the stock options is more reliably measurable than the fair value of the services rendered. The fair value of the stock options granted is remeasured at each reporting date using the Black-Scholes option pricing model as prescribed by ASC 718. During the year ended December 31, 2013, the Company granted options to purchase 300,000 shares of common stock to non-employees with an aggregate fair value of approximately $0.6 million. During the years ended December 31, 2014 and 2012, the Company did not grant any options for shares of common stock to non-employees.
During the years ended December 31, 2014 and 2013, the Company modified the terms of stock awards previously granted to certain employees upon their change in status from employee to non-employee. The modifications included an extension of the exercise period after the status change with respect to certain of the awards and the extension of the vesting of certain options through the end of the respective expected service to the Company. These modifications resulted in increases in stock-based compensation of an immaterial amount in the year ended December 31, 2014 and a reduction of approximately $0.2 million in the year ended December 31, 2013. The Company accounted for the modifications of stock awards in accordance with the provisions of ASC 718. Stock awards that are modified and continue to vest when an employee has a change in employment status are subject to periodic revaluation over their vesting terms.
The Company has recorded non-employee stock-based compensation expense in accordance with ASC 505-50 of approximately $0.2 million, $0.1 million and $0.2 million during the years ended December 31, 2014, 2013 and 2012, respectively, which is included in the total stock-based compensation expense.
14. Segment Reporting
Operating segments are components of an enterprise for which separate financial information is available and is evaluated regularly by the Company’s chief operating decision-maker in deciding how to allocate resources and in assessing performance. The Company has one reportable segment which designs, develops, manufactures and markets medical devices for non-surgical approaches to treating type 2 diabetes and obesity.
Geographic Reporting
All the Company’s revenue is attributable to customers outside the U.S. The Company is dependent on favorable economic and regulatory environments for its products. Products are sold to customers located in Europe, the Middle East, the Asia Pacific region and South America and sales are attributed to a country or region based on the location of the customer to whom the products are sold.
At December 31, 2014, long-lived assets, comprised of property and equipment, of approximately $1.1 million are primarily held in the U.S. Total long-lived assets held outside of the U.S. represent less than 1% of total long-lived assets.
F-26
Table of Contents
GI Dynamics, Inc. and Subsidiaries
Notes to Consolidated Financial Statements (continued)
14. Segment Reporting (continued)
Product sales by geographic location for the years ended December 31, 2014, 2013 and 2012 are listed in the table below (in thousands).
| December 31, | ||||||||||||
| 2014 | 2013 | 2012 | ||||||||||
| Europe |
$ | 1,687 | $ | 1,333 | $ | 463 | ||||||
| Middle East |
247 | 255 | 13 | |||||||||
| South America |
466 | 337 | 192 | |||||||||
| Asia Pacific |
428 | 330 | — | |||||||||
|
|
|
|
|
|
|
|||||||
| Total |
$ | 2,828 | $ | 2,255 | $ | 668 | ||||||
|
|
|
|
|
|
|
|||||||
Germany, Chile and Australia comprised a significant component of revenue in their respective regions for the year ended December 31, 2014. Germany, Netherlands, Chile and Australia comprised a significant component of revenue in their respective regions for the year ended December 31, 2013. Germany, Netherlands and Chile comprised a significant component of revenue in their respective regions for the year ended December 31, 2012.
Major Customers
For the year ended December 31, 2014, one distributor accounted for approximately 16% of the Company’s revenue. For the year ended December 31, 2013, one distributor accounted for approximately 15% of the Company’s revenue and one health care provider accounted for approximately 13% of the Company’s revenue. For the year ended December 31, 2012 one health care provider and one distributor each accounted for approximately 29% of the Company’s revenue. No other customer accounted for greater than 10% of the Company’s revenue during the years ended December 31, 2014, 2013 and 2012.
15. Retirement Plans
The Company has a 401(k) retirement and savings plan (“401(k) Plan”) covering all qualified U.S. employees. The 401(k) Plan is a defined contribution plan and allows each participant to contribute up to 100% of the participant’s base wages up to an amount not to exceed an annual statutory maximum. The Company has made discretionary contributions to the 401(k) Plan and recorded expenses of approximately $0.3 million, $0.2 million and $0.2 million for the years ended December 31, 2014, 2013 and 2012, respectively.
16. Income Taxes
Loss before provision for income taxes consisted of the following (in thousands):
| Years Ended December 31, | ||||||||||||
| 2014 | 2013 | 2012 | ||||||||||
| Domestic |
$ | (48,298 | ) | $ | (35,599 | ) | $ | (26,800 | ) | |||
| Foreign |
163 | 117 | 33 | |||||||||
|
|
|
|
|
|
|
|||||||
| Total |
$ | (48,135 | ) | $ | (35,482 | ) | $ | (26,767 | ) | |||
|
|
|
|
|
|
|
|||||||
F-27
Table of Contents
GI Dynamics, Inc. and Subsidiaries
Notes to Consolidated Financial Statements (continued)
16. Income Taxes (continued)
The provision for income taxes in the accompanying consolidated statements of comprehensive loss consisted of the following (in thousands):
| Years Ended December 31, | ||||||||||||
| 2014 | 2013 | 2012 | ||||||||||
| Current Provision: |
||||||||||||
| Federal |
$ | — | $ | — | $ | — | ||||||
| State |
3 | 39 | — | |||||||||
| Foreign |
90 | 57 | 19 | |||||||||
|
|
|
|
|
|
|
|||||||
| Total |
93 | 96 | 19 | |||||||||
|
|
|
|
|
|
|
|||||||
| Deferred Provision: |
||||||||||||
| Federal |
— | — | — | |||||||||
| State |
— | — | — | |||||||||
| Foreign |
(23 | ) | — | — | ||||||||
|
|
|
|
|
|
|
|||||||
| Total |
(23 | ) | — | — | ||||||||
|
|
|
|
|
|
|
|||||||
| Total provision |
$ | 70 | $ | 96 | $ | 19 | ||||||
|
|
|
|
|
|
|
|||||||
A reconciliation of income taxes from operations computed using the U.S. federal statutory rate of 34% to that reflected in operations follows (in thousands):
| Years Ended December 31, | ||||||||||||
| 2014 | 2013 | 2012 | ||||||||||
| Income tax benefit using U.S. federal statutory rate |
$ | (16,366 | ) | $ | (12,064 | ) | $ | (9,102 | ) | |||
| Permanent differences |
(60 | ) | 40 | (252 | ) | |||||||
| State income taxes, net of federal benefit |
(2,254 | ) | (1,612 | ) | (1,120 | ) | ||||||
| Stock compensation |
900 | 645 | 408 | |||||||||
| Tax credits |
(626 | ) | (306 | ) | (75 | ) | ||||||
| Foreign tax rate differential |
(11 | ) | (11 | ) | (3 | ) | ||||||
| Change in the valuation allowance |
18,500 | 13,841 | 10,083 | |||||||||
| Other |
(13 | ) | (437 | ) | 80 | |||||||
|
|
|
|
|
|
|
|||||||
| Total |
$ | 70 | $ | 96 | $ | 19 | ||||||
|
|
|
|
|
|
|
|||||||
F-28
Table of Contents
GI Dynamics, Inc. and Subsidiaries
Notes to Consolidated Financial Statements (continued)
16. Income Taxes (continued)
Components of the Company’s deferred tax assets and liabilities are as follows (in thousands):
| December 31, | ||||||||
| 2014 | 2013 | |||||||
| Deferred tax assets: |
||||||||
| Net operating loss carryforwards |
$ | 60,092 | $ | 43,167 | ||||
| Research and development credit carryforwards |
3,179 | 2,553 | ||||||
| Capitalized research and development costs |
3,140 | 4,168 | ||||||
| Capitalized start-up expenses |
5,621 | 6,137 | ||||||
| Depreciation and other |
6,854 | 4,339 | ||||||
|
|
|
|
|
|||||
| Total deferred tax assets |
78,886 | 60,364 | ||||||
| Valuation allowance |
(78,863 | ) | (60,364 | ) | ||||
|
|
|
|
|
|||||
| Net deferred tax asset |
$ | 23 | $ | — | ||||
|
|
|
|
|
|||||
Management of the Company has evaluated the positive and negative evidence bearing upon the realizability of the Company’s deferred tax assets and determined that it is more likely than not that the Company will not recognize the benefits of the deferred tax assets related to the U.S. As a result, a valuation allowance of approximately $78.9 million and $60.4 million was established at December 31, 2014 and 2013, respectively. The valuation allowance increased by approximately $18.5 million during the year ended December 31, 2014, primarily due to the increase in the Company’s net operating loss carryforwards.
At December 31, 2014, the Company had federal and state net operating loss carryforwards (excluding ASC 718 additional paid-in capital net operating losses) of approximately $154.3 million and $144.7 million, respectively. These operating loss carryforwards will expire at various times beginning in 2025 through 2034 for federal purposes and begin to expire in 2030 and will continue to expire through 2034 for state purposes. The Company has also recorded $4.6 million as a reduction to net operating losses carryforward that is attributable to excess stock option deductions as of December 31, 2014.
In addition, at December 31, 2014, the Company also has federal and state research and development tax credit carryforwards (excluding ASC 740, Income Taxes (“ASC 740”), reserve) of approximately $3.1 million and $1.8 million, respectively, to offset future income taxes. These tax credit carryforwards will expire at various times beginning in 2024 through 2034 for federal purposes and will expire at various times beginning in 2019 through 2029 for state purposes.
Utilization of net operating loss carryforwards and research and development credit carryforwards may be subject to a substantial annual limitation due to ownership change limitations that have occurred previously or that could occur in the future in accordance with Section 382 of the Internal Revenue Code of 1986 (“IRC Section 382”) and with Section 383 of the Internal Revenue Code of 1986, as well as similar state provisions. These ownership changes may limit the amount of net operating loss carryforwards and research and development credit carryforwards that can be utilized annually to offset future taxable income and taxes, respectively. In general, an ownership change, as defined by IRC Section 382, results from transactions increasing the ownership of certain stockholders or public groups in the stock of a corporation by more than 50 percentage points over a three-year period. The Company has completed several financings since its inception, which may have resulted in a change in control as defined by IRC Section 382 or could result in a change in
F-29
Table of Contents
GI Dynamics, Inc. and Subsidiaries
Notes to Consolidated Financial Statements (continued)
16. Income Taxes (continued)
control in the future. As of December 31, 2014, the Company has not, as yet, conducted an IRC Section 382 study, which could impact its ability to utilize net operating loss and tax credit carryforwards annually in the future to offset the Company’s taxable income, if any.
The Company applies ASC 740, which provides guidance on the accounting for uncertainty in income taxes recognized in financial statements and requires the impact of a tax position to be recognized in the financial statements if that position is more likely than not of being sustained by the taxing authority. As a result of the implementation of the new guidance, the Company recognized an immaterial adjustment for unrecognized income tax liability related to research and development credits. At December 31, 2014 and 2013, the Company had unrecognized tax liabilities of approximately $1.3 million and $1.0 million, respectively. Because the Company has a full valuation allowance against its U.S. deferred tax assets, there was no consolidated financial statement impact of the implementation of ASC 740.
The following is a rollforward of the Company’s unrecognized tax benefits (in thousands):
| December 31, | ||||||||
| 2014 | 2013 | |||||||
| Unrecognized tax benefit – as of the beginning of the year |
$ | 1,025 | $ | 777 | ||||
| Gross increases – tax positions of the prior periods |
— | — | ||||||
| Gross increases – current period tax positions |
227 | 248 | ||||||
|
|
|
|
|
|||||
| Unrecognized tax benefits – as of the end of the year |
$ | 1,252 | $ | 1,025 | ||||
|
|
|
|
|
|||||
The Company will recognize interest and penalties related to uncertain tax positions in income tax expense. As of December 31, 2014 and 2013, the Company had no accrued interest or penalties related to uncertain tax positions, and no amounts have been recognized in the Company’s consolidated statements of comprehensive loss.
The statute of limitations for assessment by the Internal Revenue Service (“IRS”) and state tax authorities is open for tax years ended December 31, 2014, 2013, 2012, and 2011, although carryforward attributes that were generated prior to tax year 2011 may still be adjusted upon examination by the IRS or state tax authorities if they either have been or will be used in a future period. The statute of limitations for assessment by foreign tax authorities is open for tax years ended December 31, 2014, 2013, 2012 and 2011. There are currently no federal or state audits in progress.
The Company has not, as yet, completed a study of its research and development credit carryforwards. Once completed, this study may result in an adjustment to the Company’s research and development credit carryforwards. A full valuation allowance has been provided against the Company’s research and development credits, and if an adjustment is required at the time the study is completed, this adjustment would be offset by an adjustment to the deferred tax asset established for the research and development credit carryforward and the valuation allowance.
F-30
Table of Contents
GI Dynamics, Inc. and Subsidiaries
Notes to Consolidated Financial Statements (continued)
17. Selected Quarterly Financial Information
| First Quarter | Second Quarter |
Third Quarter |
Fourth Quarter |
Total Year | ||||||||||||||||
| 2014 |
||||||||||||||||||||
| Revenue |
$ | 906 | $ | 840 | $ | 609 | $ | 473 | $ | 2,828 | ||||||||||
| Gross profit (loss)* |
3 | 290 | 216 | (1,770 | ) | (1,261 | ) | |||||||||||||
| Loss from operations |
(10,094 | ) | (12,641 | ) | (11,699 | ) | (13,756 | ) | (48,190 | ) | ||||||||||
| Net loss |
(9,681 | ) | (12,300 | ) | (12,130 | ) | (14,094 | ) | (48,205 | ) | ||||||||||
| Basic and diluted net loss per common share |
$ | (0.12 | ) | $ | (0.14 | ) | $ | (0.13 | ) | $ | (0.15 | ) | $ | (0.54 | ) | |||||
| First Quarter | Second Quarter |
Third Quarter |
Fourth Quarter |
Total Year | ||||||||||||||||
| 2013 |
||||||||||||||||||||
| Revenue |
$ | 356 | $ | 346 | $ | 493 | $ | 1,060 | $ | 2,255 | ||||||||||
| Gross profit (loss) |
(259 | ) | (115 | ) | 61 | 76 | (237 | ) | ||||||||||||
| Loss from operations |
(8,755 | ) | (8,557 | ) | (8,543 | ) | (9,001 | ) | (34,856 | ) | ||||||||||
| Net loss |
(8,714 | ) | (9,626 | ) | (8,127 | ) | (9,111 | ) | (35,578 | ) | ||||||||||
| Basic and diluted net loss per common share |
$ | (0.15 | ) | $ | (0.17 | ) | $ | (0.11 | ) | $ | (0.10 | ) | $ | (0.53 | ) | |||||
| * | In the fourth quarter of 2014, the Company recorded a charge to cost of revenue of approximately $1.6 million for excess raw material sleeve inventory. |
F-31