Attached files
| file | filename |
|---|---|
| EXCEL - IDEA: XBRL DOCUMENT - CYAN INC | Financial_Report.xls |
| EX-32.1 - EXHIBIT 32.1 - CYAN INC | ex-3211.htm |
| EX-10.11 - EXHIBIT 10.11 - CYAN INC | directorcompprogram2015-03.htm |
| EX-23.1 - EXHIBIT 23.1 - CYAN INC | ex-2311.htm |
| EX-32.2 - EXHIBIT 32.2 - CYAN INC | ex-3221.htm |
| EX-31.1 - EXHIBIT 31.1 - CYAN INC | ex-3111.htm |
| EX-31.2 - EXHIBIT 31.2 - CYAN INC | ex-3121.htm |
UNITED STATES
SECURITIES AND EXCHANGE COMMISSION
Washington, D.C. 20549
FORM 10-K
ý ANNUAL REPORT PURSUANT TO SECTION 13 OR 15(d) OF THE SECURITIES EXCHANGE ACT OF 1934
For the fiscal year ended December 31, 2014
OR
¨ TRANSITION REPORT PURSUANT TO SECTION 13 OR 15(d) OF THE SECURITIES EXCHANGE ACT OF 1934
Commission file number: 001-35904
Cyan, Inc.
(Exact name of registrant as specified in its charter)
Delaware | 20-5862569 | |
(State or Other Jurisdiction of Incorporation or Organization) | (I.R.S. Employer Identification Number) | |
1383 N. McDowell Blvd., Suite 300
Petaluma, California 94954
(Address of Principal Executive Offices including Zip Code)
(707) 735-2300
(Registrant’s Telephone Number, Including Area Code)
Securities Registered Pursuant to Section 12(b) of the Act:
Title of Each Class | Name of Each Exchange on Which Registered | |
Common Stock, $0.0001 Par Value | New York Stock Exchange | |
Securities Registered Pursuant to Section 12(g) of the Act:
None
Indicate by a check mark if the Registrant is a well-known seasoned issuer, as defined in Rule 405 of the Securities Act. Yes ¨ No ý
Indicate by check mark if the Registrant is not required to file reports pursuant to Section 13 or Section 15(d) of the Act. Yes ¨ No ý
Indicate by check mark whether the Registrant (1) has filed all reports required to be filed by Section 13 or 15(d) of the Securities Exchange Act of 1934 during the preceding 12 months (or for such shorter period that the Registrant was required to file such reports), and (2) has been subject to such filing requirements for the past 90 days. Yes ý No ¨
Indicate by check mark whether the Registrant has submitted electronically and posted on its corporate Web site, if any, every Interactive Data File required to be submitted and posted pursuant to Rule 405 of Regulation S-T (§232.405 of this chapter) during the preceding 12 months (or for such shorter period that the Registrant was required to submit and post such files). Yes ý No ¨
Indicate by check mark if disclosure of delinquent filers pursuant to Item 405 of Regulation S-K is not contained herein, and will not be contained, to the best of Registrant’s knowledge, in definitive proxy or information statements incorporated by reference in Part III of this Form 10-K or any amendment to this Form 10-K. ý
Indicate by check mark whether the registrant is a large accelerated filer, an accelerated filer, a non-accelerated filer, or a smaller reporting company. See the definitions of “large accelerated filer,” “accelerated filer” and “smaller reporting company” in Rule 12b-2 of the Exchange Act. (Check one):
Large accelerated filer | ¨ | Accelerated filer | ¨ | |||
Non-accelerated filer | ý | Smaller reporting company | ¨ | |||
Indicate by check mark whether the registrant is a shell company (as defined in Rule 12b-2 of the Exchange Act). Yes ¨ No ý
The aggregate market value of the common stock held by non-affiliates of the registrant was $86.6 million as of June 30, 2014, the last business day of the registrant’s most recently completed second fiscal quarter, based upon the closing sale price on The New York Stock Exchange reported for such date. Shares of common stock held by each officer and director and by each person that owned 5 percent or more of the Registrants outstanding Common Stock were excluded due to the fact that such persons may be deemed to be affiliates. This determination of affiliate status is not necessarily a conclusive determination for other purposes.
There were 48,281,375 shares of the registrant’s common stock issued and outstanding as of March 23, 2015.
Documents Incorporated by Reference
Portions of the registrant’s proxy statement relating to its 2015 annual meeting of stockholders are incorporated by reference into Part III of this Annual Report on Form 10-K where indicated.
Table of Contents
Page | ||
Part I. | ||
Item 1. | ||
Item 1A. | ||
Item 1B. | ||
Item 2. | ||
Item 3. | ||
Item 4. | ||
Part II. | ||
Item 5. | ||
Item 6. | ||
Item 7. | ||
Item 7A. | ||
Item 8. | ||
Item 9. | ||
Item 9A. | ||
Item 9B. | ||
Part III. | ||
Item 10. | ||
Item 11. | ||
Item 12. | ||
Item 13. | ||
Item 14. | ||
Part IV. | ||
Item 15. | ||
FORWARD-LOOKING INFORMATION
This Annual Report on Form 10-K, including the section titled “Management’s Discussion and Analysis of Financial Condition and Results of Operations” (“MD&A”) in Item 7, contains forward-looking statements within the meaning of Section 27A of the Securities Act of 1933, as amended (the “Securities Act”), and Section 21E of the Securities Exchange Act of 1934, as amended (the “Exchange Act”). Forward-looking statements generally relate to future events or our future financial or operating performance. In some cases you can identify forward-looking statements because they contain words such as “may,” “will,” “should,” “expects,” “plans,” “anticipates,” “could,” “intends,” “target,” “projects,” “contemplates,” “believes,” “estimates,” “predicts,” “potential” or “continue” or the negative of these words or other similar terms or expressions that concern our expectations, strategy, plans or intentions. Forward-looking statements contained in this Annual Report on Form 10-K include, but are not limited to, statements about:
• | our future financial performance, including our expectations regarding our revenue, cost of revenue, gross profit or gross margin, operating expenses, ability to generate cash flow, and ability to achieve and maintain future profitability; |
• | our dependence upon a concentrated base of customers and our efforts to diversify the customer base; |
• | our liquidity and working capital requirements, including our efforts to secure additional funding; |
• | the impact of seasonality on our business; |
• | anticipated trends, growth rates and challenges in our business and in the markets in which we operate; |
• | market acceptance of our Blue Planet solution and its effect on our product mix and financials; |
• | our ability to anticipate market needs and develop new and enhanced products and services to meet those needs, and our ability to successfully monetize them; |
• | the evolution of technology affecting our products, services and markets; |
• | our ability to sell our products and expand internationally; |
• | maintaining and expanding our customer base and our relationships with our channel partners; |
• | our reliance on our third-party manufacturers and component suppliers; |
• | our ability to adequately protect our intellectual property; |
• | our ability to hire necessary qualified employees to expand our operations; |
• | the future trading prices of our common stock and the impact of securities analysts’ reports on these prices; and |
• | the estimates and estimate methodologies used in preparing our consolidated financial statements and determining option exercise prices. |
• | our ability to stay abreast of new or modified laws and regulations that currently apply or become applicable to our business both in the United States and internationally; |
• | the estimates and estimate methodologies used in preparing our consolidated financial statements and determining option exercise prices; and |
• | our ability to sell our products and expand internationally. |
We caution you that the foregoing list may not contain all of the forward-looking statements made in this Annual Report on Form 10-K. You should not rely upon forward-looking statements as predictions of future events. We have based the forward-looking statements contained in this Annual Report on Form 10-K primarily on our current expectations and projections about future events and trends that we believe may affect our business, financial condition, operating results and growth prospects. The outcome of the events described in these forward-looking statements is subject to risks, uncertainties and other factors described in the section titled “Risk Factors” and elsewhere in this Annual Report on Form 10-K. Moreover, we operate in a very competitive and rapidly changing environment. New risks and uncertainties emerge from time to time, and it is not possible for us to predict all risks and uncertainties that could have an impact on the forward-looking statements contained in this Annual Report on Form 10-K. We cannot assure you that the results, events and circumstances reflected in the forward-looking statements will be achieved or occur, and actual results, events or circumstances could differ materially from those described in the forward-looking statements.
The forward-looking statements made in this Annual Report on Form 10-K relate only to events as of the date on which the statements are made. We undertake no obligation to update any forward-looking statements made in this Annual Report on Form 10-K to reflect events or circumstances after the date hereof or to reflect new information or the occurrence of unanticipated events, except as required by law. We may not actually achieve the plans, intentions or expectations disclosed in our forward-looking statements and you should not place undue reliance on our forward-looking statements. Our forward-looking statements do not reflect the potential impact of any future acquisitions, mergers, dispositions, joint ventures or investments we may make.
1
Part I.
Item 1. Business
Overview
We have pioneered innovative, carrier-grade networking solutions that transform disparate and inefficient legacy networks into open, high-performance networks. Our solutions include high-capacity, multi-layer switching and transport platforms as well as a carrier-grade software-defined networking platform for network virtualization and control. Our solutions enable network operators to virtualize their networks, accelerate service delivery and increase scalability and performance, while reducing costs. We have designed our solutions to enable a variety of existing and emerging applications, including business Ethernet, wireless backhaul, broadband backhaul, cloud connectivity, bandwidth on demand, and network functions virtualization (NFV). By deploying our solutions, network operators can transform legacy networks into open, multi-vendor, carrier-grade software-controlled networks. Our solutions not only reduce network operators’ ongoing capital and operating expenses, but also enable their networks to more flexibly support rapidly changing service requirements and new business models.
Network operators, which include service providers, cloud and content providers, data center operators and others, are facing immense pressure on their existing networks and business models. New applications and communications trends are driving tremendous growth in bandwidth demand, resulting in increased service requirements as well as dramatic shifts in overall network traffic patterns. In the telecommunications space, competition from traditional vendors as well as new market entrants such as cloud and over-the-top (OTT) content providers, is limiting service providers’ ability to sustain and grow revenue. As a result, service providers must upgrade their networks, and in particular their regional and metro or “middle mile” networks, both to handle the exponential scaling challenges driven by these trends as well as to profitably deliver the growing breadth of premium services demanded by their subscribers. The larger network operator community is also facing these scalability requirements while seeking to deliver new applications that improve the productivity and efficiency of their businesses. We designed our solutions to enable any network operator to address these challenges while scaling their networks and services efficiently.
We provide comprehensive solutions consisting of our family of Z-Series high-capacity, multi-layer switching and transport platforms, our Blue Planet carrier-grade software-defined network (SDN) and NFV orchestration platform and a range of professional services. Our Z-Series family of products has been designed to support the multiple concurrent technologies used in regional and metro networks, including both Ethernet-based services as well as optical services. Our Z-Series platforms are architected to transport traffic over the most efficient network layer, utilizing both electrical and optical domains, to enable network operators to maximize network capacity at the lowest cost per bit. Our solutions are designed to support a variety of use cases from traffic aggregation at the network edge to multi-terabit switching optimized for handoff at the network core.
The second element of our solution is our Blue Planet platform. Blue Planet is a carrier-grade SDN and NFV orchestration software platform built to address network operator requirements for network management, control and virtualization. Blue Planet is multi-function in that it is designed to simplify the management, deployment and orchestration of hardware and software elements from us or third-party vendors based on our customers' requirements. As a result Blue Planet enables our customers to make more efficient use of existing network assets, cost-effectively expand network capacity and significantly accelerate the delivery of premium, revenue-generating services to their customers. By deploying Blue Planet, our customers can also provide their subscribers with network-as-a-service (NaaS), allowing for real-time tailoring and customization of their network architecture and services to meet their end-customers’ specific needs.
We were founded in October 2006 to simplify network operations and accelerate innovation through a centralized, open, multi-vendor, software orchestration model. We launched our first Z-Series platform in September 2009. Since then, we have led emerging, carrier-grade SDN and NFV initiatives in the industry through our development of open, multi-vendor and multi-layer, management, orchestration and control software. In April 2010, we launched one of the first multi-layer network management solutions. In December 2012, we launched Blue Planet. In 2014, we introduced the ability to orchestrate virtual resources and functions and chain those to the physical network to streamline service creation and deployment.
Our customers range from service providers to high-performance cloud and content providers to data center operators and large, private network operators. We target our customers through our direct sales force and through channel partners. Our solutions have been deployed primarily across North America as well as in Asia and Europe by over 180 customers.
2
Corporate Information
We were incorporated in Delaware on October 25, 2006 under the name Cyan Optics, Inc. and we changed our name to Cyan, Inc. on November 9, 2011. Our principal executive offices are located at 1383 N. McDowell Blvd., Suite 300, Petaluma, California 94954, and our telephone number is (707) 735-2300. Our website is www.cyaninc.com. Information contained on, or that can be accessed through, our website is not incorporated by reference into this Annual Report.
Copies of annual reports on Form 10-K, quarterly reports on Form 10-Q, current reports on Form 8-K, and amendments to these reports filed or furnished pursuant to Section 13(a) or 15(d) of the Securities Exchange Act of 1934, as amended (Exchange Act) are available, free of charge, on our website as soon as reasonably practicable after we electronically file such material with or furnish it to the Securities and Exchange Commission (SEC). The SEC also maintains a website that contains our SEC filings. The address of the site is www.sec.gov.
Industry Background
Service providers are facing an imperative for significant network and business model transformation. Despite growing demand for bandwidth and expanded service offerings, service provider revenue has remained relatively flat, mainly due to competitive pressures and the growth of cloud and content providers whose businesses place tremendous demands on the service provider telecommunications infrastructure. Accordingly, service providers are increasingly challenged to deliver and scale their services in a cost-effective manner and to offer new services that drive additional revenue streams. In addition, due to the on-demand nature of cloud and content, the service provider business model is changing from one of deploying fixed bandwidth to one of dynamically provisioning services. However, the network equipment vendor-driven complexity and inflexible nature of existing network infrastructure makes dynamic provisioning of services and the management of the underlying networks cost-prohibitive. This is especially true in regional and metro networks through which the majority of traffic passes. Finally, a theme that’s true for all operators is the escalating cost of increasing network scalability and the subsequent inability to focus on truly innovative new services to improve the productivity and efficiency of their businesses.
Regional and metro networks sit between core networks—the networks that provide national connectivity—and access networks—the networks that provide the connection point to fixed and mobile business and consumer users. Regional and metro networks distribute the traffic from the core to the access networks and back, thereby enabling the end-to-end communications that connect content and applications to the enterprises and consumers who use them. These networks also typically serve as critical aggregation points, aggregating traffic for transport to other regional and metro networks via core networks.
Traditional regional and metro network architectures were built over decades, and were typically designed to deliver voice and legacy data services, such as frame relay, to business and residential subscribers that were primarily local or proximate to the specific regional or metro network. As services were added or offerings were scaled to serve more subscribers, network operators typically built, operated and managed segregated networks running in parallel. Network operators have historically used a variety of technologies to deliver reliable service at scale, including Ethernet as well as legacy optical technologies such as fixed DWDM and SONET/SDH, which has added to the complex and disparate nature of these legacy regional and metro networks. Given the limitations of legacy optical technology and network design practices, these dedicated and disparate networks are struggling to accommodate the explosion of services with high-bandwidth or strict service level agreement (SLA) requirements.
Technology Shifts are Pressuring Network Operators to Increase Bandwidth and Enhance Performance
Today’s networks require dramatic transformation to meet the service demands driven by significant technology shifts, including:
• | Proliferation of Mobile Devices. Users of all types are increasingly connecting to networks through powerful mobile devices ranging from smartphones to tablets. |
• | Rapid Adoption of Bandwidth-Intensive Applications. Innovation in consumer and enterprise applications has driven rapid adoption and increases in time spent online, both in mobile and fixed environments. Moreover, these new types of applications, such as video, social media, gaming and enterprise software-as-a-service, are increasingly bandwidth intensive and latency sensitive. |
• | Growth in Cloud Computing and Content Delivery. Enterprises and consumers are rapidly adopting cloud-based technologies to host an increasing number of applications, store their data, view and download content and leverage on-demand computing resources. |
As a result of these new applications the nature of data traffic has transformed from static, point-to-point, fixed connections to dynamically provisioned, on-demand networks offering an array of new services. As a result, network operators are being forced to upgrade their networks to profitably deliver these premium services as well as to handle the increased
3
demands of their end-customers, which include higher throughput and utilization, better performance and increased provisioning speed in order to deliver high-quality services cost-effectively.
Ethernet has Emerged as the Dominant Network Protocol
As network operators have sought to meet the demand for greater bandwidth and deliver a variety of services at lower costs, their networks increasingly have come under stress. To address these pressures, they have increasingly looked to deploy Ethernet-based technologies. Ethernet standards have evolved significantly and now support carrier-grade public network requirements. Moreover, Ethernet now supports high-bandwidth, carrier-grade environments at a significantly lower price per bit than traditional technologies. As subscribers have also been rapidly adopting Ethernet, transitioning to packet-based, Ethernet architectures affords network operators greater flexibility and efficiency in service delivery. As a result, we believe that network operators will shift more of their capital budgets towards purchasing Ethernet-based solutions.
Regional and Metro Networks Are Increasingly Critical to Network Operators’ Abilities to Scale and Provide Enhanced Services
As the demands on networks increase, regional and metro networks are becoming increasingly critical to network operators’ abilities to scale network capacity as well as aggregate, deliver and manage required services and content efficiently. Additionally, network operators are now seeking to offer new premium services with guaranteed service levels, as opposed to relying on traditional best-efforts service delivery models. Network operators desire to offer premium services for the following applications:
• | Business Ethernet. Providing scalable bandwidth and flexible Ethernet services to support business applications with high service level requirements. |
• | Cloud Connectivity and Content Delivery. Offering direct, high-speed links to cloud-based services and between data centers for business applications and/or content delivery. |
• | Broadband Backhaul. Transporting traffic for advanced services such as video between the core network and subscribers. |
• | Wireless Backhaul. Providing high-capacity transport services at strict service levels optimized for cellular networks. |
• | Wholesale Transport. Offering backbone infrastructure to deliver scalable services at low latency under high service levels. |
• | Private Networks. The ability to implement IP, Ethernet and optical-based private networks for secure and dedicated bandwidth services. |
Legacy Approaches are Inadequate to Address Network Growth and Performance Requirements
Regional and metro networks are highly capital intensive to build, operate and maintain. Historically, network operators have upgraded capacity only as technology and subscriber demands on their networks have changed. Although network operators must increase the scale of their complex networks to accommodate the increased demand for packet-based services, they must also maintain legacy services for subscribers over their existing networks. Legacy approaches to augmenting regional and metro networks suffer from multiple challenges, including limitations on scalability, performance, flexibility and ability to provision new services efficiently and cost-effectively. These legacy approaches include:
• | Adding Dedicated Networks. The historical practice of adding new dedicated and often disparate overlay networks has failed to cost-effectively scale. Deploying disparate overlay networks with hardware and software infrastructure from multiple vendors increases the operational and management complexity and expense associated with operating these networks. Moreover, the capital expense associated with scaling services to other areas of the network is burdensome. |
• | Deploying Router-Based Products. Routers have historically been deployed to forward traffic between network connections leveraging a variety of physical mediums and protocols. A router essentially processes every packet that it forwards using commonly available computer processors. Although innovation in router technology has improved processing performance over time, the approach of adding more routers to address continually increasing capacity requirements remains cost-prohibitive. Despite improvements in technology, it is impractical to scale a router-based architecture to address these increasing network requirements, such as 10 gigabit-per-second (10G) and 100 gigabit-per-second (100G) environments. While routers are required at select network locations, they would be cost-prohibitive to deploy throughout regional and metro transport networks. |
4
• | Modifying Existing Operations Support Systems. Core operations support systems (OSSs) were designed decades ago to support routine administrative tasks associated with network operations. They interact poorly with modern software systems, are not designed to address the higher level network planning, management and coordination functions necessary in today’s networks and do not provide holistic visibility over the entire network. Traditionally, network operators have implemented a patchwork of disparate software systems that run on top of legacy OSSs to augment their functionality. This creates difficulties coordinating between systems or network layers, increases maintenance costs and slows the provisioning of new services. |
Need for Network Transformation
We believe that the legacy approaches to designing and orchestrating regional and metro networks are inadequate to effectively handle next-generation service demands. Network operators require a new approach to drive network transformation, including new levels of scalability, software control, and service flexibility, while reducing their ongoing capital and operating expenses. They are seeking an open architecture that is conducive to deploying multi-vendor, best-of-breed networks and to supporting future innovations while enhancing network efficiency and performance. Moreover, to remain competitive, network operators need to evolve their networks to support higher-bandwidth requirements, introduce new revenue-generating, premium services and manage network traffic at the optimal layer in a low-latency, cost-optimized way using both the optical and Ethernet layers. Accordingly, we believe that network operators require new approaches to both their software and infrastructure to achieve network transformation.
• | Software Transformation. To virtualize their networks and realize the promise of NaaS, network operators must deploy SDNs. SDNs simplify networks and create a more open environment by removing proprietary control planes from legacy network elements and replacing them with a network control plane using protocols such as OpenFlow to orchestrate connections and services over cost-optimized, multi-vendor networks. Utilizing an SDN approach would enable network operators to customize and differentiate their networks and would allow for the development of third-party applications. |
Similar to the changes brought about by server virtualization in which IT managers can decouple applications and their environments from the underlying hardware, thus introducing greater levels of freedom and flexibility in the data center environment, SDNs decouple network logic and policies from the underlying switching hardware, bringing new flexibility into the wide-area networking environment. Network operators that virtualize their networks can partition subsets of their network resources to present a custom network to each enterprise customer, enabling the activation, control and provisioning of services on demand.
As important, many network functions that used to be hardware-based are being virtualized and turned into software network functions. This movement, which is complementary to SDN, is called network functions virtualization or NFV. NFV promises to significantly reduce the cost of installing and maintaining hardware devices by turning them into software elements or functions that reside on standard low-cost servers located in service provider data centers. In order for this to work, a software orchestrator is required to turn on, or instantiate the function, and then chain that function to network services such as Ethernet services. This is another major revolution happening in the telecommunications market that will drive greater cost efficiency and much faster time to revenue for service providers.
• | Infrastructure Transformation. Given the heterogeneous characteristics of regional and metro networks, network operators should embrace multi-layer platforms that provide embedded switching capabilities. These platforms would enable a more flexible network architecture, reducing the dependency on legacy technologies, such as routers, that do not scale cost-effectively. An optimal approach would leverage packet and optical technologies to transport and deliver network traffic over the most appropriate layer, thereby maximizing network capacity and minimizing the cost per bit of traffic. |
Network operators need a new approach that incorporates the benefits of SDNs, NFVs and multi-layer switching platforms. We believe that this transformation of network architecture would provide network operators with improved flexibility, increased scalability and performance, accelerated time to value from new services, delivery of a broad range of applications and lower total cost of ownership through decreased capital expenditure and operating expenses.
We believe that an innovative solution that meets capital budget constraints for both entirely new deployments and for upgrading existing network environments is imperative. We also believe that this type of solution would enable network operators to address a range of network upgrades associated with spending typically earmarked for products and markets including certain business support systems and operational support systems (BSS/OSS) functions, monolithic management systems, Ethernet services edge routing, access aggregation, metro WDM, multi-service provisioning platforms and packet-optical equipment. We believe that our solutions address a substantial portion of these requirements.
5
Our Solutions
We have pioneered innovative, carrier-grade networking solutions that transform disparate and inefficient legacy networks into open, high-performance networks. Our solutions include high-capacity, multi-layer switching and transport platforms, as well as a carrier-grade software-defined networking platform and applications.
We provide comprehensive solutions consisting of our family of Z-Series high-capacity, multi-layer switching and transport platforms, our Blue Planet carrier-grade SDN and NFV orchestration platform and a range of professional services. Our Z-Series family of products has been designed to support the multiple concurrent technologies used in regional and metro networks, including both Ethernet-based services as well as optical services. Our Z-Series platforms are architected to transport traffic over the most efficient network layer, utilizing both electrical and optical domains, to enable network operators to maximize network capacity at the lowest cost per bit. Our solutions are designed to support a variety of use cases from traffic aggregation at the network edge to multi-terabit switching optimized for handoff at the network core.
Customers may choose to deploy Blue Planet either on a standalone basis or integrated with our Z-Series platforms. By deploying our solutions, network operators can realize the following benefits:
• | Deliver Virtual Networks. Our solutions enable our customers to activate, control and modify network services through our centralized, software control plane. By deploying our Blue Planet platform, network operators can present a custom network to each enterprise customer and rapidly offer services based on packet, optical transport network (OTN) and wavelength selective switching (WSS) based wavelength aggregation and switching technologies. Additionally, our approach embraces a multi-vendor environment by integrating with third-party network devices or software elements and centralizing the visualization and management of the disparate network elements. Our solutions also integrate with open protocols, such as OpenStack, and northbound systems such as BSS/OSS through open application program interfaces (APIs) to enable end-to-end virtualization of networks and integration with legacy systems. |
• | Enhance Flexibility and Support Open Architectures. Our multi-layer solutions give network operators the flexibility to support a changing service mix and the ability to evolve their networks to a packet-based approach at their own pace. For example, our Z-Series platforms are modular and support any combination of Ethernet and legacy optical services that can be swapped or added at any time. Our solutions were designed for network-wide deployment and support a variety of use cases from aggregation at the network edge to multi-terabit platforms optimized for handoff at the network core. Our solutions have open APIs that our customers can use to develop custom business applications or integrate with third-party applications. |
• | Increase Capacity and Scalability. Our solutions are designed to scale in a distributed and highly available manner to manage large networks of thousands of network elements supporting tens of thousands of services. Moreover, our Z-Series family of high-capacity, multi-layer switching and transport platforms increase network capacity and optimize cost per bit by tailoring traffic transport to the appropriate network layer, leveraging both electrical and optical domains. Because aggregation may be performed at one layer and multiplexing and transport at others, networks that incorporate our solutions require fewer router ports and offer lower latency than legacy approaches. Additionally, our purpose-built Z-Series platforms support high-capacity networks using industry standard components, facilitating backplane and switch fabric interconnect rates in excess of 100G per line card slot, enabling an easy migration to future 40G and 100G Ethernet services. |
• | Accelerate Time to Value. Our Blue Planet platform includes advanced network and service planning applications enabling network operators to design multi-layer networks quickly and cost-effectively. Advanced algorithms and an intuitive user interface simplify and accelerate the network planning process. Advanced three-dimensional visualization tools combined with network virtualization technology enable on-demand provisioning and deployment of customized services to subscribers. Additionally, our carrier-grade SDN approach enables network operators to access network peripherals and software functions remotely thereby allowing them to rapidly extend the delivery of new services throughout their networks. Because network operators can deploy our software independently from our Z-Series platforms, we can offer valuable network operations services to our customers on an expedited basis. |
• | Enhance Performance and Intelligence. Our Blue Planet platform includes real-time and historical analytics to track network performance and assist in capacity planning. This intelligence is available through a centralized service portal that our customers can utilize and through which they can provide secure access to their customers in order to provide a differentiated service offering. This service portal not only provides the ability to verify compliance of SLAs and a variety of other metrics but can also be configured to allow end-user bandwidth changes for the contracted service and automatically provide this data to billing systems via APIs. Network operators and their end-customers can use Blue Planet extensively to troubleshoot network performance issues, to monitor and report on network SLAs and to make better business planning decisions. |
6
• | Offer a Broad Range of Premium Applications. Our solutions enable network operators to offer a wide range of applications in their regional and metro networks. Blue Planet enables network operators to deliver differentiated Ethernet services that enhance their end-customers’ experiences, allowing network operators to derive additional sources of revenue. For example, our customers frequently offer business Ethernet, wireless backhaul, broadband backhaul, cloud connectivity and wholesale transport. Our solution simplifies and accelerates the delivery of these services for all types of customers including multinational, regional, wholesale and retail service providers. Moreover, Blue Planet allows network operators to either develop their own custom applications, utilize our applications or seamlessly integrate third-party applications. |
• | Scale Networks Cost-Effectively. Our solutions enable network operators to reduce capital and operating expenses by minimizing the need for disparate legacy networks and related software. Moreover, our Z-Series platforms reduce the need for unnecessary routers and optimize cost per bit by transporting traffic over the appropriate network layer according to the needs of the application. Our platforms leverage industry standard components and are designed to be controlled by software, thereby reducing capital expenditures associated with deploying as well as operating expenses associated with monitoring and maintaining our products. The modular design of our solutions further reduces costs by enabling our customers to add services and functionality on a pay-as-you-grow basis as well as by limiting field technician dispatches. Our Blue Planet platform with flexible hosting models, including private, public and hybrid cloud options, significantly reduces costs and administrative burdens associated with network management, software updates, SLA monitoring and network planning. Additionally, our multi-layer approach to networks enhances long-term capital efficiency and reduces operating expenses by enabling our customers to migrate to packet-based networks over time. |
Our Strategy
Our goal is to establish our position as a leading provider of open, multi-vendor, carrier-grade networking solutions. The key elements of our strategy include:
• | Extend Our Technology Leadership in High-Performance, Carrier-Grade Networking. Our carrier-grade SDN solution is purpose-built for high-performance network requirements. We intend to leverage our technology leadership position by continuing to define the market requirements for carrier-grade SDN, NFVs and high-capacity, multi-layer switching and transport solutions. We also plan to continue to invest in sales and marketing resources to raise awareness of the full benefits of virtualizing high-performance networks. A key element of this strategy is to continue to develop Blue Planet as well as leverage third-party application development through our open APIs. |
• | Develop Innovative Products and Technology. We plan to continue to introduce new software and hardware products that enable our customers to more effectively offer new services and increase their profitability. For example, we are developing new applications that enhance the value of our Blue Planet platform as well as new line cards that augment our Z-Series platforms for new use cases. Our strong relationships with our customers provide us with valuable insights into deployment demands, market trends and end-user needs. We plan to leverage these relationships and insights to continue to develop and enhance our solutions. |
• | Expand Our Service Provider Customer Base. Because our approach enables service providers to improve the return on their existing networks while transitioning to packet-based networks over time, we target customers through multiple initial deployment opportunities. We have found that our solutions are well suited to deployments that involve green field network projects as well as helping our customers replace or evolve legacy architectures. Blue Planet can be purchased with or without deploying our Z-Series platforms, thus enabling network operators to deploy our network operations services quickly and efficiently in legacy networks. We intend to target new service provider, cloud and content provider, and data center operator customers by continuing to invest in our sales force, field operations and support functions as well as by deepening our engagement with our current partners. |
• | Sell Additional Solutions to Existing Customers. We intend to sell additional solutions to our growing installed base of existing customers. Our customers have historically purchased our solutions using an incremental approach that begins with a targeted product purchase to address specific services or portions of their networks and expands to additional product purchases as they experience the benefits of our solutions. Our solutions are well suited for a pay-as-you-grow approach. We intend to continue investing in our existing customer relationships to drive the adoption of additional products as our customers scale and evolve their network services over time. |
• | Extend Our Presence in New Geographies. We believe that international markets represent a significant growth opportunity for us. As of December 31, 2014, we had over 180 customers, primarily in North America. We have found that establishing relationships with recognized network operators in a new region enables us to win new business at other additional potential customers in the region more rapidly and at a lower acquisition cost. In Asia, Europe and Latin America, we plan to leverage our relationships with our existing customers to enhance our brand |
7
recognition and broaden deployment by other customers in the region. Additionally, we continue to engage channel partners in various regions outside of the United States and plan to continue growing our channel partner network as we continue our international expansion.
• | Expand in Emerging Customer Verticals. We have initially targeted our solutions to traditional service providers, such as local access service providers and regional transport providers. We plan to target emerging customer verticals with use cases well suited to the benefits of our solutions, including cloud and content providers, educational institutions, large data center networks, governments, cable MSOs as well as enterprises that build and operate large, private networks. |
Our Technology
The key strength of our solutions is the integration of our various packet, optical and software technologies across our range of products. Since our founding in October 2006, we have focused our efforts on developing solutions based on a centralized, open, multi-vendor software orchestration model. Our hardware solutions are comprised of the integration of commercially available network components into a robust packet-optical, high-capacity, multi-layer switching and transport platform. Our software has been designed to provide our customers with the benefits of our solutions regardless of whether deployed in conjunction with our hardware platforms or with third-party hardware platforms or third-party software functions. The differentiating elements of our proprietary technology include:
• | Scalability. While 10G Ethernet services are the dominant interface of choice in most current networks elements, 100G Ethernet is rapidly evolving and projected to be an increasingly dominant service interface over the next several years. Our Z-Series family of high-capacity, multi-layer switching and transport platforms provide for scalability and density, supporting well over 100G per card slot and hundreds of gigabits to terabits of non-blocking platform capacity. Our Z-Series platforms support 100G of card-to-card interconnectivity through ultra-high-capacity backplanes and switch fabrics providing a simple migration path to 100G Ethernet services. The non-blocking 100G grooming capability, combined with DWDM line cards, supports a mix of 10G and 100G wavelength services and provides a robust foundation to scale future services. Leveraging our Z-Series architectural scalability and software capabilities, Ethernet services of up to 100G are supported on current line cards, while the ability to support up to 200G of protected service capacity per line card slot will enable a seamless migration to 40G and 100G Ethernet line cards as those technologies become more broadly adopted. In addition, certain features and functionalities, including capacity upgrades, can be enabled remotely through our provisioning software. |
• | Multi-Layer Technology. Our Z-Series platforms, as controlled by our orchestration software, direct network traffic across the most appropriate and efficient network layer, including both electrical and optical paths. Our regional and metro network solutions encompass the Ethernet service layer, and other transport layers including connection-oriented Ethernet, SONET, SDH, G.709 OTN and wavelength transport technologies. Our Z-Series platforms facilitate the transition from legacy time-division multiplexing (TDM) to packet and/or DWDM. Our Z-Series platforms support a complete range of transport requirements across aggregation, transit and hub locations. |
• | Open Software Development Process. We have designed our technology to integrate with legacy networks and third-party vendor network infrastructure whether that infrastructure is software or hardware. The capabilities of our platforms allow our customers to continue to leverage their legacy network investments while migrating to more software-oriented, packet-based networks at their own pace. Additionally, our technology can be integrated into regional and metro networks currently utilizing decades-old OSS and provide our customers with a bridge to migrate from these antiquated systems to our Blue Planet and Z-Series solutions. Additionally, our open APIs allow our customers to custom build their own applications or integrate third-party applications, thereby diversifying the services they can offer and allowing our customers to tailor services to the specific needs of their end-user customers. |
• | Abstraction and Visualization. Through the abstraction and centralization of network control software, our technology allows network planning and control decisions to be made with full knowledge of all available network resources and all contractually committed services. These attributes also enable the virtualization of the network for NaaS and other dynamic service capabilities. High-performance networks are comprised of multiple technologies and a number of logical layers including fibers, DWDM wavelengths, TDM and packet transport technologies and services. We have developed technology that allows for an integrated view and software control of these network elements with unique three-dimensional network visualization. Our software provides end-to-end visibility and control over how circuits and services are groomed and routed as well as the ability to visualize the data path across the nodes, shelves, line cards and optical fibers across the different transport layers of the network. The visibility provided by our software increases the efficiency of network configurations and reduces errors when making additions or changes to the network. |
8
• | Network Functions Virtualization and Orchestration. Our software provides multi-domain and multi-vendor orchestration capabilities. Architected to be entirely modular and data and template-driven, our software is designed to accelerate service velocity by providing the intelligent allocation, creation and management of virtual and physical service resources—including networking, storage, compute, and applications—across the telco cloud and the WAN from a single-pane-of-glass. Our software architecture integrates NFV, cloud and multi-domain service orchestration capabilities into an open system ensuring interoperability with different OSS platforms, cloud management systems, SDN controllers, network elements and virtual network functions. |
Products and Solutions
We provide comprehensive solutions consisting of our family of Z-Series high-capacity, multi-layer switching and transport platforms, our Blue Planet carrier-grade SDN orchestration platform and applications and a range of professional services. Network operators can use our software solutions either on a standalone basis or integrated with our hardware solutions, to realize the benefits of our solutions and enable multi-vendor, best-of-breed networks.
We launched our first Z-Series platform in September 2009. Since then, we have led emerging SDN initiatives in the industry through our development of open, multi-vendor, multi-layer planning, management and verification software. In April 2010, we announced one of the industry’s first multi-layer network management solutions. Building on our continued expansion of our software offerings over time, in December 2012, we launched Blue Planet, a carrier-grade SDN platform for regional and metro networks that allows network operators of all types to virtualize networks and simplify the development, deployment and orchestration of scalable communications and business applications over high-performance networks.
Cyan Z-Series
Our Z-Series family of high-capacity, multi-layer switching and transport platforms is comprised of three different chassis that support interchangeable Z-Series line cards that network operators can deploy to allow for scalable solutions from the access edge of the network, across the metro and regional network to the core of the network. Each Z-Series platform is comprised of a chassis that supports a variety of interchangeable line cards to provide a wide range of applications for Ethernet services, TDM or wavelength aggregation, signal grooming and transport services. Our Z-Series platforms integrate with our software, including Blue Planet and our predecessor multi-layer network management solutions, to provide network operators with a range of software solutions.
Our Z-Series platforms are scalable with a backplane and switch fabric design that supports over 100G per line card slot. 100G services can be deployed across our Z-Series platforms via line cards and, in certain cases, software upgrades. Our Z-Series line cards can be software upgraded remotely for future features and functionality. We enable this functionality through our Blue Planet software and associated Z-Series software upgrades without the need for costly field technician deployment. The Z-Series platforms range in size and capability from the Z22 to the Z77, allowing our Z-Series products to be deployed from the edge to the core of the network as well as in high-performance networks of varying size and capacity. We also offer our Cyan Z-Series L-AMP, which is a fully self-contained line card that is a bi-directional mid-span optical amplifier/repeater. We currently offer approximately 25 different line cards that provide varying functionality to our Z-Series chassis, each of which can be utilized in all of our Z-Series chassis.
Our Z-Series platforms provide a level of integration that exceeds that available from legacy platforms. For example, a single Z-Series platform natively supports the transportation of packet, TDM and wavelength services with the option of supporting a reconfigurable optical add/drop multiplexer. The solution also supports the functionality and scale of Ethernet transport switches with connection oriented Ethernet transport standards and Metro Ethernet Forum-based services. The Z-Series platforms can be remotely provisioned using our Blue Planet operations app, which provides multi-layer, three-dimensional network visualization, simplifies provisioning and provides ongoing operations support for improved operational performance.
Certain features of our Z-Series platforms can be activated remotely utilizing Blue Planet or our previous network management solutions. For example, many of our Z-Series platforms contain multiple functionalities, some of which may not initially be utilized by our customers. Once a customer decides to implement these capabilities, they can be enabled through Blue Planet.
Cyan Blue Planet
Cyan Blue Planet is a carrier-grade SDN and NFV platform that provides network virtualization and service-enabling applications, including networks and service planning, operations and monitoring. This carrier-grade SDN platform includes a core management platform and a range of applications to meet diverse requirements of network virtualization and control
9
across the multiple layers of regional, metro and data center networks. Blue Planet allows network operators to virtualize their networks, make more efficient use of their network assets and accelerate delivery of services to their customers. The Blue Planet platform and apps provide our customers with visibility and centralized control over disparate network elements.
Blue Planet is the latest implementation of the network virtualization and management software that we first introduced in 2009 to work in combination with our Z-Series platforms. Blue Planet is available to customers using our Z-Series platforms as well as customers desiring to control networks that do not have any of our hardware deployed.
The Blue Planet software platform is comprised of three fundamental elements: a core operating system, or SDN orchestration layer; applications which provide the interface for and delivery of specific services, referred to as apps; and element adapters that allow customers using Blue Planet to control Cyan Z-Series platforms and to monitor and/or control a range of third-party network elements in their networks.
The core of Blue Planet is a carrier-grade SDN and NFV orchestration platform, which includes an operating system, a hypervisor, a messaging system, middleware and a web portal, all running on a scalable, distributed, computing environment. Blue Planet provides an open architecture with advanced clustering and database management to meet performance and availability requirements.
Blue Planet offers the capability to deploy an array of apps, including both our own Blue Planet apps, as well as apps built by third-party developers or our customers themselves, to monitor and control underlying network infrastructure and plan, manage, and verify networks and services. Blue Planet allows apps to interact not only with OpenFlow compliant network devices, but also with legacy devices deployed prior to the development of carrier-grade SDN, thereby providing our customers with added flexibility in network deployment. By allowing our customers to deploy their own apps or third-party apps on Blue Planet, we allow our customers to provide their own unique set of value-added service offerings.
We currently offer the following apps:
• | Planet Orchestrate. Functions within the service provider network that used to be driven by hardware are rapidly being virtualized and turned into software functions. As a result, software is required to orchestrate the deployment of those functions in data center and cloud resources. Planet Orchestrate is our multi-domain SDN and NFV orchestration application. It is architected to be entirely modular and data and template-driven. The software is designed to accelerate service velocity by providing the intelligent allocation, creation, and management of virtual and physical resources—including network, storage, compute, and software functions—across the telco cloud and the WAN from a single pane-of-glass. Planet Orchestrate is capable of interfacing and deploying software functions from many vendors and supports multiple cloud management systems such as OpenStack and VMware vCloud. |
• | Planet Design. As networks continue to expand in size, scope, and technological complexity, the process of planning new deployments, or expanding existing networks, becomes increasingly difficult. The Planet Design application allows network operators to design networks more quickly and cost-effectively, accelerating the deployment of new services. |
• | Planet Operate. Wide area networks consist of multiple independent network layers. Historically, each of these layers has been operated independently using separate, vendor-specific, management systems with no awareness of adjacent layers or network resources. The resulting complexity leads to operational inefficiencies, such as poor overall network utilization, configuration errors, delayed resolution of issues, and ultimately, to higher costs. Planet Operate is the industry's first SDN-enabled network management application providing end-to-end fault, configuration, accounting, provisioning, and security (FCAPS) capabilities and more, to simplify the operation of multi-vendor, multi-layer networks. |
• | Planet View. Service Level Agreements (SLAs) are a critical component of metro/business Ethernet, wireless backhaul, wholesale transport, and other network services. However, generating SLA compliance reports for end-customers is typically a manual, labor-intensive process that requires aggregating data from multiple different sources on a reactive basis. Planet View is our performance monitoring and SLA assurance application that allows the network operator to provide end-customers with real-time and historical visibility into the performance of their services via a customized web portal. |
• | Planet Inventory. Rapidly changing network demands are causing an increased emphasis on the performance and return on investment of network assets. As a result, many network operators are asking for a clear, multi-vendor view of what is in their network and how it is performing. The Planet Inventory application provides inventory reporting for multi-layer, multi-vendor packet-optical networks. Furthermore, Planet Inventory supports integration with existing inventory systems via APIs. Planet Inventory provides full-featured asset and circuit inventory reporting in multi-vendor networks for service providers. By simplifying inventory reporting and verification, Planet Inventory allows service providers to optimize network operations. Planet Inventory collates all network infrastructure data and |
10
keeps it up to date, helping to streamline processes that improve operational performance. These improvements are realized in an operator’s ability to manage network maintenance more efficiently as well as via increased service velocity because the asset and circuit data reported by Planet Inventory uses the network as the database. This eliminates the problem of off-line inventory data not being aligned with the network.
The third component of the Blue Planet platform is element adapters. These element adapters act as the control and communications interface between the Blue Planet orchestration platform and apps and the specific hardware installed in a network. In addition to providing element adapters for our own Z-Series platforms, we currently offer element adapters that enable monitoring and/or control of approximately 50 network devices from a number of network hardware manufacturers.
Customer Service, Support and Training
CyNOC Professional Services
CyNOC is our network operations center service that offers monitoring and managing of our customers’ services, providing our customers with an added layer of services and support for those that subscribe to this service. CyNOC expands on the power of our Blue Planet platform with network operations center services provided by our customer service engineers. CyNOC services are available in multiple service levels ranging from proactively monitoring to full scale managing of our customer’s Z-Series platforms and legacy network elements. We offer our customers partial or complete NOC services to manage their entire multi-vendor networks. Additionally, a number of our customers who maintain their own internal NOC leverage our services as a backup NOC. These services are typically sold to our customers for a one-year term at the time of the initial product sale, subject to annual renewals thereafter.
Maintenance, Support and Training Services
We offer professional services to provide ongoing technical support with our hardware and software products through a variety of service packages to meet the requirements of most network operators as well as customized packages to meet more specialized requirements. We provide this variety of customer service products and support through our technical support engineers as well as through our growing network of authorized and certified channel partners. Our customer support organization operates 24 hours a day and is available by phone, email and online through our customer portal and offers a single point of contact for technical assistance with hardware, software and network issues. Additionally, we offer our end-user customers access to ongoing software updates, upgrades, bug fixes and repairs when and if available. We also have a customer portal available through our website which allows our channel partners and our customers to manage support tickets, download software and search our online knowledge database. These services are sold to our customers typically for one-year terms at the time of the initial product sale, subject to annual or multi-year renewals thereafter.
We also offer a range of additional professional services to assist our customers in their operations, including network deployment and installation services. We offer an innovative suite of professional services to ensure successful network deployment that can be tailored to the needs of our customers and range from site surveys to test plan creation. In addition to complete engineer, furnish and install (EF&I) services, we also offer assistance with network design, integration and migration planning, network performance analysis, and installation of both our products as well as third-party equipment. These services are invoiced separately at the time of the initial product sale.
We also provide training services to educate our end-customers on the implementation, use, functionality and ongoing maintenance of our products. These training services can be provided at our facilities, on-site at the location of our customer’s choice or through a variety of multimedia resources based upon customer preference.
Customers
We sell our Z-Series and Blue Planet platforms and other services primarily to service providers and high performance data center and private network operators.
As of December 31, 2014, our solutions have been sold to over 180 customers. For the years ended December 31, 2014, 2013 and 2012, our largest customer was Windstream Corporation, which accounted for approximately 29%, 39% and 45% of our revenue. Additionally, Colt Technology Services Ltd. and its affiliated entity KVH Company, Ltd. (referred to together as Colt) collectively represented approximately 11% of our revenue for the year ended December 31, 2014 and Telephone and Data Systems, Inc. (TDS) represented approximately 11% of our revenue for the year ended December 31, 2013. No other customers represented more than 10% of our revenue for the years ended December 31, 2014, 2013 or 2012.
Revenue from customers located outside of the United States was approximately 22%, 9% and 5% of our revenue for the years ended December 31, 2014, 2013 and 2012.
11
Our sales, including sales to Windstream, are made primarily pursuant to purchase orders with our customers rather than pursuant to committed long-term supply contracts. At any given time, we have backlog orders for products that have not shipped. Our backlog consists of confirmed orders for products scheduled to be shipped to customers, generally within 30 to 90 days. Our backlog was approximately $13.1 million and $3.7 million as of December 31, 2014 and 2013. Our backlog fluctuates significantly from period to period and, because customers may cancel purchase orders or change delivery schedules without significant penalty, we believe that our backlog at any given date may not be a reliable indicator of future business.
Sales and Marketing
We sell our products and services in the United States through a direct sales force. During 2012 we began to direct a portion of our sales and marketing efforts to international markets, with particular focus on establishing a network of resellers to help us serve disparate markets. Although initial sales outside of the United States have been primarily been through our direct sales force, we expect a substantial portion of our international sales in future periods to be generated by our reseller network. As of December 31, 2014, we had 126 employees in our sales and marketing organization. Our direct sales teams are typically comprised of a combination of a sales representative and a systems engineer. Each sales team is responsible for a specific geographical territory, has responsibility for a number of major direct end-user customer accounts or has assigned accounts in a specific vertical market. Our direct sales force is primarily based in the U.S. with additional sales personnel in select locations including Australia, Dubai, Germany, Hong Kong, Japan, Mexico, the Netherlands, South Korea, Taiwan and the United Kingdom.
Our sales process entails planning discussions with prospective customers, analyzing their existing networks and identifying how these potential customers can leverage our solutions within their network. The sales cycle for the initial targeted product purchase, from the time of prospect qualification to the completion of the first sale, may span multiple quarters. Typically, after we have completed an initial sale with a customer, we experience shorter sales cycles for additional orders as a result of the customer having previously implemented our solutions.
We currently have channel partners in Asia, Europe and Latin America to whom we provide marketing assistance, technical training and support. In addition to their lead generation and sales activities, our channel partners perform installation services as well as some level of support to their customers.
Our marketing strategy is focused on building our brand, communicating product advantages and increasing customer awareness of our solutions, particularly our Blue Planet platform. We execute on this strategy through a variety of marketing vehicles, including trade shows, advertising, public relations, industry research, our website and collaborative relationships with technology vendors. Our marketing activities, including demand generation activities, are focused primarily on local access service providers, regional transport providers, data center operators, cable MSOs, private network operators and wholesale carriers. We also focus on ongoing account management for existing customers and the development of follow-on sales as our existing end-user customers continue to expand and enhance their demand for our products.
Research and Development
The intensely competitive nature of the industry in which we operate makes it critical that we continue to focus on investment in research and development. To this end, we utilize data-driven development methodologies to accelerate our time to market. Our research and development efforts focus primarily on improving and enhancing our existing hardware and software solutions as well as developing new products and additional features and functionality.
As of December 31, 2014, we had 109 employees in our research and development organization, the substantial majority of whom were located at our headquarters in Petaluma, California.
Manufacturing
We subcontract the manufacture of all of our hardware products to a leading contract manufacturer, Flextronics, which purchases components from our approved list of suppliers and builds our hardware appliances according to our specifications at its Milpitas, California facility. Our outsourcing of our hardware manufacturing extends from prototypes to full production and includes activities such as material procurement, software implementation, and final assembly and testing. Once the completed products are manufactured and tested, Flextronics ships our products directly or through our third-party distribution centers to our customers for installation. By utilizing this outsourcing strategy, we are able to optimize our operations by lowering costs and reducing time to market.
Our contract manufacturer generally manages the procurement of the components and parts used in our products. We also engage in direct sourcing of certain strategic components. While our preference is to select components and materials that
12
are available from multiple sources, we utilize a number of components that are available from only one source. Generally, neither we nor our contract manufacturer have written agreements with these sole-source component providers to guarantee the supply of the key components used in our hardware products. However, we regularly monitor the supply of components and the availability of qualified and approved alternative sources. We provide forecasts to Flextronics so that they can purchase key components in advance of their anticipated use, with the objective of maintaining an adequate supply of those components.
We have entered into a manufacturing services agreement with Flextronics, dated June 22, 2007, pursuant to which Flextronics manufactures, assembles and tests our products. This agreement permits Flextronics to procure materials and components required for the manufacture and testing of our products while also reserving our right to direct Flextronics to purchase specific materials and components from specified vendors. We also provide Flextronics with a list of preferred vendors from which it will attempt to source components first before seeking other sources of supply. The initial term of this agreement was five years, with the term automatically renewing for additional one-year terms, unless terminated by either party by giving 90 days or more written notice prior to the end of the then current term. Additionally, either party may terminate the agreement by giving written notice if the other party has materially breached its obligations under the agreement, subject to applicable cure periods.
Although the contract manufacturing services required to manufacture and assemble our products may be readily available from a number of established manufacturers, it is time consuming and costly to qualify and implement contract manufacturer relationships. As a result, if Flextronics or our sole-source component suppliers suffer an interruption in their businesses, or experience delays, disruptions or quality control problems in their manufacturing operations, or we have to change or add additional contract manufacturers or suppliers of our sole-sourced components, our ability to ship our products to our customers could be delayed, and our business, operating results and financial condition could be adversely affected.
Competition
The markets in which we compete are highly competitive and characterized by rapidly changing customer needs and continually evolving industry standards. We expect competition to intensify in the future as existing competitors and new market entrants introduce new products or enhance existing products. Our business will be adversely affected if we are unable to meet the demand for existing products and innovate to bring new products and solutions to market.
We compete either directly or indirectly with large networking and optical companies, such as Alcatel-Lucent SA, Ciena Corporation, Cisco Systems, Inc., Fujitsu Limited, Huawei Technologies Co. Limited and Juniper Networks, Inc., and specialized technology providers that offer point solutions that address a portion of the issues that we solve. In addition, we seek to replace legacy network control tools and processes that have already been purchased or were internally developed, and potential customers may be reluctant to adopt a solution that replaces or changes existing tools and processes in which they have made significant investments. The principal competitive factors applicable to our products include:
• | service breadth and functionality; |
• | performance, reliability and security; |
• | price; |
• | speed and ease of use and deployment; |
• | existing deployed base; and |
• | brand awareness and reputation within the market. |
Although we believe that we compete favorably with respect to the above factors, we expect competition and competitive pressure, from both new and existing competitors, to increase in the future. Additionally, some of our competitors have greater name recognition, longer operating histories, well-established relationships with customers or channel partners in our market and substantially greater financial, technical, personnel and other resources than we have. Our competitors may be able to anticipate, influence or adapt more quickly to new or emerging technologies and changes in customer requirements, devote greater resources to the promotion and sale of their products and services, initiate or withstand substantial price competition, take advantage of acquisitions or other opportunities more readily and develop and expand their product and service offerings more quickly than we can. In addition, competitors with substantially larger installed customer bases beyond the packet-optical solutions and NaaS markets may leverage their relationships based on other products or incorporate functionality into existing products in a manner that may discourage users from purchasing our solutions. These larger competitors may also have more diversified businesses that allow them to better withstand significant reduction in capital spending by end-user customers. Moreover, potential customers may also prefer to purchase from their existing providers rather than a new provider, regardless of product performance or features, because our solutions may require additional investment of time and funds to install. In addition, as a result of these transition costs, competition to secure contracts with potential customers is particularly intense. Some of our competitors may offer substantial discounts or rebates to win new customers. If
13
we are forced to reduce prices in order to secure customers, we may be unable to sustain gross margins at desired levels or achieve profitability. In the future, in selling Blue Planet we may also compete with companies that are focused on providing virtualization software solutions for other end-markets as they may try to adapt their solutions to meet the needs of network operators or compete with networking companies that develop or acquire SDN solutions. Some of our competitors have made acquisitions of businesses that may allow them to offer more directly competitive and comprehensive solutions than they had previously offered.
Intellectual Property
Our success as a company depends critically upon our ability to protect our core technology and intellectual property. To accomplish this, we rely on a combination of intellectual property rights, including trade secret laws, copyrights, patents and trademarks, as well as customary contractual protections. As of December 31, 2014, we had five issued U.S. patents set to expire between 2031 and 2034. We also had a number of applications pending for additional U.S. patents as well as patent applications pending in key international jurisdictions.
We generally control access to and use of our proprietary software and other confidential information through the use of internal and external controls, including contractual protections with employees, contractors, customers and partners, and our software is protected by U.S. and international copyright laws. We also incorporate certain generally available software programs into Blue Planet and our other software solutions pursuant to license agreements with third parties.
The steps we have taken to protect our intellectual property rights may not be adequate. Third parties may infringe or misappropriate our intellectual property rights. We may initiate claims against third parties that we believe are infringing our intellectual property rights if we are unable to resolve matters satisfactorily through negotiation. If we fail to protect our intellectual property rights adequately, our competitors could offer similar products, potentially harming our business.
Employees
As of December 31, 2014, we had 265 employees. None of our employees is represented by a labor union or is a party to any collective bargaining arrangement in connection with his or her employment with us and we consider our relations with our employees to be good.
Facilities
Our headquarters in Petaluma, California occupy approximately 39,000 square feet, increasing to approximately 58,000 square feet on or before August 1, 2016 under a lease that expire in 2025. We have also leased offices in San Francisco, California and Vancouver, Canada as well as additional offices for our sales and marketing personnel in certain locations. We believe that our current facilities are suitable and adequate to meet our current needs. We believe that suitable additional or substitute space will be available as needed to accommodate expansion of our operations.
14
Item 1A. Risk Factors
The risks and uncertainties described below are not the only ones facing us. Other events that we do not currently anticipate or that we currently deem immaterial also may affect our results of operations, cash flows and financial condition.
Risks Related to Our Business
We currently generate the majority of our revenue from a concentrated base of customers, including Windstream Corporation. Unless we can substantially expand our sales to other existing or new customers, our period-to-period revenue may be highly volatile and we will not be able to grow our revenue.
For the years ended December 31, 2014, 2013 and 2012, revenue from Windstream represented approximately 29%, 39% and 45% of our total revenue. In recent periods, sales to Windstream have been highly volatile from quarter to quarter. For example, sales to Windstream declined from $19.0 million, or 50% of total revenue, in the third quarter of 2013 to $2.3 million, or 11% of total revenue, in the fourth quarter of 2013 and to $1.1 million, or 6% of total revenue, in the first quarter of 2014. The unanticipated 88% decline in revenue from Windstream from the third to the fourth quarters of 2013 resulted in our overall revenue in the fourth quarter of 2013 being substantially lower than we or the market anticipated. In the third quarter of 2014, sales to Windstream decreased to $5.6 million or 21% of total revenue from $6.7 million, or 28% of total revenue in the second quarter of 2014, but increased to $15.8 million or 52% in the fourth quarter of 2014.
While our sales to Windstream have been volatile, and can be potentially highly volatile, from quarter to quarter, we nonetheless anticipate that a significant portion of our revenue in 2015 and beyond will continue to depend on sales to Windstream especially as we have been selected by Windstream for additional upgrades to its regional and metro networks across major markets to 100G capacity. If our sales to Windstream decrease materially in any period, our revenue and results of operations would be adversely affected.
During 2014 two customers accounted for greater than 10% of our revenue: Windstream, which accounted for approximately 29%, and Colt, which accounted for approximately 11% of our 2014 revenue. During 2013 two customers accounted for greater than 10% of revenue: Windstream, which accounted for approximately 39%, and Telephone and Data Systems, Inc., which accounted for approximately 11% of our 2013 revenue. Given the episodic nature of capital expenditures associated with network deployments, we may continue to derive a substantial amount of our revenue from a limited number of customers in any future period. Unless and until we substantially diversify our customer base, we may continue to experience significant volatility in our quarterly results, and may not be able to maintain or grow our revenues.
Sales of our solutions to our customers, including Windstream, are made pursuant to purchase orders, and not pursuant to long-term, committed-volume purchase contracts. As a result, we cannot assure you that we will be able to sustain or increase sales to any current or future customer from period to period, or that we will be able to offset the discontinuation of concentrated purchases by these customers with purchases by new or other existing customers. As a consequence of our customer concentration and the frequently concentrated nature of our customers’ purchases, our quarterly revenue and operating results may fluctuate substantially from quarter to quarter and are difficult to predict. The loss of, or a significant delay or reduction in purchases by, any of our significant customers has in the past and could in the future adversely affect our business and operating results.
15
We have a history of losses, and we may not be able to generate sufficient revenue to achieve or maintain profitability.
Since our inception, we have incurred net losses in each quarterly and annual period. For the year ended December 31, 2014 we incurred net losses of $59.2 million. As of December 31, 2014, we had an accumulated deficit of $186.5 million. Although our revenue grew in each of the years from our inception through the year ended December 31, 2013, our revenue for 2014 fell below the level attained in 2013. Our revenue may not grow, or may decline, in future periods as a result of a number of factors, including uncertain demand for our solutions, increasing competition or our failure to capitalize on potential growth opportunities. In addition, we anticipate that we will continue to incur losses until at least the end of 2015 as we continue to expend substantial resources on sales and marketing, including domestic and international expansion efforts, product and feature development, technology infrastructure and general administration. If we are unable to grow our revenue, improve our gross margin or manage our expenses, we may continue to incur significant losses beyond 2015 and may not be able to achieve or maintain profitability.
Our revenue, gross margin and other operating results may fluctuate significantly and be unpredictable, which makes our future operating results difficult to predict and could cause the trading price of our common stock to decline.
Our revenue and operating results may fluctuate from period to period due to a variety of factors, many of which are outside of our control, which makes it difficult for us to predict our future operating results. The timing and size of orders for our Z-Series and Blue Planet platforms and other solutions have been highly variable and difficult to predict, and we expect similar unpredictability for our N-Series platform, leading to uncertainty and limiting our ability to accurately forecast revenue and resulting in significant fluctuations in revenue from period to period. This variability has been compounded by our customer concentration and the frequently concentrated nature of our customers’ purchases, which are made pursuant to purchase orders and not pursuant to long-term committed-volume purchase contracts.
In addition to, or as elaborated in, other risks listed in this Risk Factors section, factors that may affect our operating results include:
• | the timing of orders from our customers and channel partners, including by our largest customer, Windstream; |
• | fluctuations in demand for our solutions; |
• | the capital spending patterns of network operators and any decrease or delay in capital spending by network operators due to economic, regulatory or other reasons; |
• | the inherent complexity, seasonality, length and associated unpredictability of our sales cycles for our solutions; |
• | the availability to our customers, particularly domestic customers, of government stimulus funding for network expansion activities, including for purchases of network systems such as our Z-Series, N-Series and Blue Planet platforms; |
• | changing market conditions, including network operator consolidation; |
• | changes in the competitive dynamics of our markets, new market entrants and any related discounting, bundling or financing of products or services; |
• | our ability to generate incremental business from our expanded international sales and marketing operations; |
• | our ability to control costs such as the costs of the components for our Z-Series and N-Series platforms; |
• | the ability of our contract manufacturer and component suppliers to timely meet our manufacturing and supply needs at acceptable prices, or at all; |
• | the timing and execution of product transitions, new product introductions or product upgrades by us or our competitors; |
• | the risk that new product announcements may cause existing or prospective customers to delay purchases of existing products pending availability of announced new products prior to such newer products being available for commercial shipment; |
• | our ability to timely and effectively develop, introduce and gain market acceptance for new solutions, products, technologies and services, such as Blue Planet, and anticipate future market demands that meet our customers’ requirements; |
16
• | our ability to successfully expand the Z-Series, N-Series, Blue Planet and professional service solutions we sell to existing customers; |
• | the interoperability of our solutions with service providers’ networks and the ability of our Blue Planet solutions to manage the broad range of equipment in such networks; |
• | technical challenges in network operators’ overall networks, unrelated to our solutions, which could delay adoption and installation of our solutions; |
• | decisions by potential customers to purchase alternative products and services from other providers and their willingness to deploy our solutions; |
• | any decision by us to increase or decrease operating expenses in response to changes in the marketplace or perceived marketplace opportunities; |
• | our ability to derive benefits from our investments in sales, marketing, engineering or other activities; |
• | our ability to build and manage our channel partner and distribution networks, and the effectiveness of any changes we make to our distribution model; and |
• | general economic conditions, both domestically and in international markets. |
Any one of the factors above or the cumulative effect of the factors above may result in significant fluctuations in our operating results from period to period.
This variability and unpredictability could result in our failure to meet our internal operating plan or the expectations of securities analysts or investors for any period. For example, in the fourth quarter of 2013 we provided guidance for the fourth quarter that did not meet analyst expectations and in the first quarter of 2014 we announced results for the fourth quarter that fell below our guidance and below analyst expectations, both of which events resulted in sharp declines in our stock price and resultant securities class action litigation. If we fail to meet such expectations in the future, the market price of our common stock could again fall substantially and we could face costly lawsuits, including securities class action litigation.
Our business depends on the capital spending patterns and financial capabilities of our service provider customers, and any decrease or delay in their capital spending may adversely affect our business and operating results.
Our revenue to date has been derived primarily from our service provider customers. Demand for our solutions depends on the amount and timing of capital spending by these customers as they construct, expand and upgrade their networks. In response to any future challenging economic conditions and decreased availability of capital, spending for network infrastructure projects could be delayed or cancelled by our customers. In addition, capital spending is cyclical in our industry and sporadic among individual service providers, and can change on short notice. As a result, we may not have visibility into changes in spending behavior until near the end of a given quarter. Further, infrastructure improvements may be further delayed or prevented by a variety of factors, including cost, regulatory obstacles, consolidation in the industry, lack of consumer demand and alternative technologies for service delivery. Specifically, we and many competitors experienced weakness in demand in North America in the third quarter of 2014 as service providers took a cautious approach towards capital spending. While we saw increased service provider revenue in the fourth quarter of 2014, many other industry participants continued to see weakness through the entire second half of 2014. Any reductions in capital expenditures by service providers in any future period could adversely affect our operating results and future growth.
Our revenue may become more volatile due to changes in historical seasonal patterns. We have experienced in the past, and may continue to experience, seasonal fluctuations in our revenue as a result of our customers’ spending patterns. For example, in years prior to 2013 and again in 2014, we experienced an increase in business activity as we approached December, due at least in part to some of our customers accelerating spending to use remaining capital budgets. Similarly, we have historically experienced a decrease in business activity in our first quarter as some of our customers delay spending until they
17
finalize their capital budgets and project initiatives become clarified. However, these historical patterns may not recur in any given period. For example, in the fourth quarter of 2013, we experienced a decrease in business activity as some of our customers had largely depleted their 2013 capital budgets by the end of the third quarter. In addition, from time to time, customers may place large orders that are unrelated to seasonality but may significantly affect what appear to be seasonal trends.
Furthermore, we may experience volatility in gross margin in any particular period as a result of factors including product mix sold, large initial deployments as well as other factors including adjustments to warranty accrual, inventory obsolescence charges and the level of revenue experienced in any particular period. Large initial deployments typically involve a lower margin product mix, as initial deployments are generally comprised of thinly configured chassis. As our customers expand their networks after the initial deployments, they typically purchase additional higher-margin line cards. For example, gross margin decreased by 1.5%, from 40.5% to 39.0%, for the three months ended March 31, 2014 compared to the three months ended December 31, 2013. The decrease in gross margin was driven primarily by the overall decreased revenue for the quarter which resulted in a higher percentage impact of overhead costs associated with our manufacturing operations. The decrease in gross margin was also impacted by initial network deployments by customers, which typically involve a lower margin product mix. We expect to continue to experience this volatility in gross margin from quarter-to-quarter, which could negatively affect our operating results and financial condition.
Our cost reduction plans may not produce anticipated benefits and may lead to charges that will adversely affect our results and operations.
In the fourth quarter of 2014, we implemented a cost reduction plan that was designed to reduce our operating expenses. These cost reduction efforts resulted in a restructuring charge of $0.6 million in the fourth quarter of 2014. Additionally, actual costs related to such efforts may exceed the amounts that we previously estimated or we may undertake additional restructuring efforts in the future, leading to additional charges as actual costs are incurred. Reducing our operating expenses will involve, among other things, reducing the number of people we employ. This reduction in personnel may lead to additional voluntary departures and may negatively impact our ability to achieve our near-term business objectives, including our product development and sales efforts, which could adversely affect out results of operations in the near term and our competitiveness in the longer term.
We have a limited operating history, which makes it difficult to evaluate our current business and future prospects.
We were incorporated in 2006, and began selling our solutions and generating revenue in 2009. Our limited operating history makes financial forecasting and evaluation of our business difficult. Moreover, we compete in markets characterized by rapid technological change, changing customer needs, evolving industry standards and frequent introductions of new products and services. We continue to increase the breadth and scope of our solutions and, correspondingly, the breadth and scope of our operations. For example, in December 2012, we released for general availability our Blue Planet carrier-grade software-defined networking platform. We have limited historical data and have had a relatively limited time period in which to implement and evaluate our business strategies as compared to companies with longer operating histories. As a result, it is difficult to forecast our future revenue growth, if any, and to plan our operating expenses appropriately, which in turn makes it difficult to predict our future operating results. In the course of our development efforts, we may experience design, manufacturing, marketing and other difficulties that could delay or prevent the development, introduction or marketing of new solutions, services and
18
enhancements, any of which could result in lower sales, which would harm our business, operating results and financial condition.
We currently generate the majority of our revenue from the sale of our Z-Series platforms and therefore a decrease in purchases of these platforms would adversely affect our revenue and our operating results.
Historically, our Z-Series platforms have accounted for substantially all of our revenue, and we expect to continue to derive a substantial majority of our revenue from sales of these platforms in the near term. As a result, our future financial performance will depend heavily on our ability to continue to sell existing, and to develop and sell enhanced, versions of our Z-Series platforms as well as our recently introduced N-Series platforms, both to existing and new customers. If current market demand for these products diminishes, or we fail to deliver product enhancements, new releases or new products that customers want, overall demand for our solutions and related services would decrease, and our operating results would be harmed.
If the SDN and NFV markets do not develop as we anticipate, or if we are unable to increase market awareness of our company and our solutions within those markets, demand for our Blue Planet solution may not grow, and our future results would be adversely affected.
Fundamental to our solution is our Blue Planet SDN and network functions virtualization NFV platform. As a result, our long-term success will depend to a significant extent on potential customers recognizing the benefits of our solutions over legacy systems and products, and the willingness of service providers and high-performance data center and other network operators to increase their use of SDN and NFV solutions in their networks. The market for SDN and NFV solutions is at an early stage and it is difficult to predict important trends, including the potential growth, if any, of this market.
If the market for SDN and NFV solutions does not evolve in the way we anticipate or if customers do not recognize the benefits of our solutions, we likely would not be able to increase sales of our Blue Planet platform. To date, some network operators have been reluctant to switch to SDN and NFV solutions because they have invested substantial resources to maintain and integrate legacy solutions into their networks. These network operators may continue allocating their network budgets to the maintenance and upgrading of their legacy systems and products and therefore not adopt our SDN or NFV solutions in addition to or as a replacement for these legacy systems and products. We also what appear to be delays in service provider purchasing decisions to traditional network equipment, including our Z-Series products, as the service providers pause to evaluate their plans for these technologies.
Even if the market for SDN and NFV solutions develops as we anticipate, market awareness of our SDN and NFV solutions will be essential to our long-term growth. We cannot assure you that network operators will accept the value proposition that we believe our solutions provide. If we are not successful in creating market awareness of our company and our full suite of SDN and NFV solutions, our business, financial condition and operating results would be adversely affected.
If our SDN platform, Blue Planet, or any other new solutions we develop face challenges for market acceptance, our revenue and operating results would be adversely affected.
We initially released Blue Planet in December 2012. Currently, our Blue Planet offering has an unproven revenue model and has accounted for an immaterial amount of our revenue. If network operators do not perceive the benefits of Blue Planet, the market for Blue Planet may not develop or may develop more slowly than we expect, either of which would
19
adversely affect our revenue growth prospects. The widespread acceptance of Blue Planet will require not only the recognition and adoption of SDN and NFV as a whole over legacy systems and products, but also the adoption of Blue Planet by our current and potential customers to meet their SDN and NFV requirements. We also face the risk of having a limited time to market in order to establish Blue Planet over any alternative solutions or technologies that network operators utilize for SDN, NFV and other network management. In addition, we have limited experience in pricing Blue Planet separately from our Z-Series platforms, which could result in underpricing that adversely affects our expected financial performance, or overpricing that inhibits our customer acceptance of Blue Planet. Moreover, many network equipment providers, including us, provide basic element management software at little or no additional cost to hardware customers. As a result, network operators are not accustomed to paying for software and may not be willing to pay meaningful amounts for such software regardless of the value it creates for them. Even if the initial development and commercial introduction of Blue Planet is successful, we cannot assure you that it will achieve widespread market acceptance or that any market acceptance will be sustainable over the longer term. If Blue Planet does not gain market acceptance at a sufficient rate of growth, our business and operating results would be adversely affected.
We operate in highly competitive markets, and competitive pressures from existing and new companies may adversely affect our business, operating results and market share.
The markets in which we operate are highly competitive and characterized by rapidly changing customer needs and evolving industry standards. We expect competition to intensify in the future as existing competitors and new market entrants introduce new products or enhance existing products. Our business will be adversely affected if we are unable to compete effectively to meet the demand for existing products as well as innovate to bring new products and solutions to market.
We compete either directly or indirectly with large networking and optical companies, such as Alcatel-Lucent SA, Ciena Corporation, Cisco Systems, Inc., Fujitsu Limited, Huawei Technologies Co. Limited and Juniper Networks, Inc., and specialized technology providers that offer solutions that address a portion of the issues that we address. In addition, we seek to replace legacy network control tools and processes that network operators have either already purchased or internally developed, and potential customers may be reluctant to adopt a solution that replaces or changes existing systems and processes in which they have made significant investments. In the future, in selling Blue Planet we may also compete with companies that are focused on providing virtualization software solutions for other end-markets as they may try to adapt their solutions to meet the needs of network operators or compete with networking companies that develop or acquire SDN or NFV solutions. Some of our competitors have made, or may make, acquisitions of businesses that may allow them to offer solutions that are more directly competitive and comprehensive than those they currently offer.
We expect competition and competitive pressure from both new and existing competitors to increase in the future. Additionally, many of our competitors have greater name recognition, longer operating histories, well-established relationships with customers or channel partners in our markets and substantially greater financial, technical, personnel and other resources than we have. Our competitors may be able to anticipate, influence or adapt more quickly to new or emerging technologies and changes in customer requirements, devote greater resources to the promotion and sale of their products and services, initiate or withstand substantial price competition, take advantage of acquisitions or other opportunities more readily and develop and expand their product and service offerings more quickly than we can. In addition, competitors with substantially larger installed customer bases may leverage their relationships and incorporate functionality into their existing products in a manner that may discourage customers from purchasing our solutions. These larger competitors may also have more diversified businesses that
20
allow them to better withstand significant reductions in capital spending by customers. Moreover, potential customers may also prefer to purchase from their existing providers rather than a new provider, regardless of product performance or features, because our solutions may require additional investment of time and funds to install the solutions and to train operations personnel. In addition, some of our competitors may offer substantial discounts, rebates or financing to win new or retain existing customers, or may bundle different products and services together in a package to their customers where they include products and services that directly compete with our solutions at very low prices or even for free. If we are unable to win customers, or if we are forced to reduce prices in order to secure customers, our business and operating results may be adversely affected.
We operate in a rapidly evolving market and if we are unable to develop and introduce new solutions or make enhancements to existing solutions that successfully respond to emerging technological trends and achieve market acceptance, our revenue and growth prospects would likely be adversely affected.
Our market is characterized by rapidly changing technology, changing customer needs, evolving industry standards and frequent introductions of new products and services. Our future success will depend significantly on our ability to effectively anticipate and timely adapt to such changes, and to develop and offer, on a timely and cost-effective basis, hardware and software solutions with features that meet changing customer demands, technology trends and industry standards. Our solutions have been developed to rely upon open standards for integration and functionality with legacy networks and third-party vendor network equipment and applications, and we cannot assure you that these standards will continue to receive market acceptance. Additionally, such open standard design could make it easier for competitors to more quickly and inexpensively develop and offer their own products and services based on the same technology. If our competitors introduce new products and services that compete with ours, we may be required to reposition our solutions or introduce new solutions in response to such competitive pressure. If we fail to develop new products or product enhancements, or our customers or potential customers do not perceive our solutions to have compelling advantages, our business, revenue and growth prospects would be adversely affected.
We intend to continue making significant investments in further developing and enhancing the functionality of our Blue Planet, Z-Series and N-Series platforms. Developing our solutions is expensive, complex and involves uncertainties. We intend to continue to dedicate a significant amount of resources to our research and development efforts to maintain our competitive position. However, we may not have sufficient resources to successfully manage these hardware and software development cycles, and these investments may take several years to generate positive returns, if ever.
The future growth of our business depends, in significant part, on increasing our international sales, and even if we are successful in expanding internationally, our business will be susceptible to risks associated with international operations.
We currently generate a significant majority of our sales from customers in the United States, and only in 2012 did we begin significant efforts to offer our solutions internationally. We have limited experience managing the sales, support and administrative aspects of a worldwide operation. For the year ended December 31, 2014 and 2013, revenue from customers outside of the United States was approximately 22% and 9%, respectively. The future growth of our business depends, in significant part, on increasing our international sales. We may not be successful in our efforts to expand our international operations, including as a result of not being able to increase or maintain international market demand for our solutions, and entry into additional international markets will require significant management attention and financial resources. Our failure to
21
successfully grow internationally could limit the future growth of our business and, consequently, affect our business, operating results and financial condition.
In the course of expanding our international operations and operating overseas, we will be subject to a variety of risks, directly and indirectly through our channel partners, including:
• | longer than expected sales cycles; |
• | international trade costs and restrictions, including trade laws, tariffs, export quotas, custom duties or other trade restrictions, affecting our sales; |
• | treatment of revenue from international sources and changes to tax codes, including being subject to foreign tax laws and responsibility for paying withholding income or other taxes in foreign jurisdictions; |
• | compliance with multiple, conflicting and changing governmental laws and regulations, including employment, tax, privacy, data protection, communications and Internet laws and regulations, and the risks and costs of non-compliance; |
• | compliance with U.S. laws and regulations applicable to foreign operations, including the Foreign Corrupt Practices Act, import and export control laws, tariffs, trade barriers, economic sanctions and other regulatory limitations on our ability to sell our solutions in certain foreign markets, and the risks and costs of non-compliance; |
• | challenges inherent in efficiently managing an increased number of employees over large geographic distances, including the need to implement appropriate systems, policies, compensation and benefits and compliance programs; |
• | difficulties in and the potentially high costs of staffing foreign operations; |
• | difficulties in enforcing contracts, longer accounts receivable payment cycles and the potential corresponding adverse impact on our days sales outstanding; |
• | the imperative to adapt our solutions to meet the differing standards of one or more other countries; |
• | the risk of change in political or economic conditions for foreign countries, and the potential for political unrest, acts of terrorism, hostilities or war; |
• | localization of products and services, including translation into foreign languages and associated expenses; |
• | differing laws and business practices, which may favor local competitors; |
• | foreign currency fluctuations and controls; and |
• | limited or unfavorable intellectual property protection in foreign jurisdictions. |
Each of these risks could have an adverse effect on our overall business, operating results and financial condition.
Our sales cycles can be long and unpredictable, and our sales efforts require considerable investment of time and expense. As a result, our sales and revenue are difficult to predict and may vary substantially from period to period, which may cause our operating results to fluctuate significantly.
Our sales process entails planning discussions with prospective customers, analyzing their existing networks and identifying how these potential customers can leverage our solutions within their networks. The sales cycle for a new customer deployment, from the time of prospect qualification to the completion of the first sale, may span multiple quarters. The sales cycles with larger carriers, potential customers in international markets and customers evaluating shifting from legacy hardware-based solutions to SDN and/or NFV based solutions can be even longer. We spend substantial time, effort and money in our sales efforts without any assurance that our efforts will produce any sales of our solutions. If we invest substantial resources pursuing unsuccessful sales opportunities, our business, operating results and financial condition would be harmed. In addition, purchases by network operators of our solutions are subject to budget constraints, multiple approvals and unplanned administrative, processing and other delays. If sales expected from a specific customer for a particular quarter are not realized in that quarter, or at all, we may not achieve our revenue expectations.
22
We engage channel partners to promote, sell, install and support our solutions internationally, and we intend to continue to expand our international channel partner network. Any failure to effectively develop and manage this distribution channel could adversely affect our business, operating results and market share.
We engage channel partners who provide sales and support services for our solutions to reach customers outside of the United States. If we do not properly identify, engage and train our channel partners to sell, install and service our solutions, or if a new channel partner is not able to execute on our sales strategy, our business, financial condition and operating results may suffer. The loss of a key channel partner or the failure of a channel partner to provide adequate customer service could have a negative effect on customer satisfaction and could cause harm to our business. Our use of channel partners and other third-party support partners, and the associated risks, are likely to increase as we seek to expand our international sales. Generally, our channel partners do not have long-term contractual commitments or exclusivity to us. We also compete with other network systems providers for our channel partners’ business as many of our channel partners market competing products. If a channel partner promotes a competitor’s products to the detriment of our solutions or otherwise fails to market our solutions effectively, we would lose market share.
Changes in government-sponsored programs, especially decreases in government funding, could affect the timing and buying patterns of certain of our customers, which would cause reduced sales of our solutions and fluctuations in our operating results.
Over the past several years, our customer base has included Independent Operating Companies (IOCs) and other telecommunications network providers that benefited from federal and state subsidies. Approximately 13% of our revenue for the years ended December 31, 2014 and 2013, was attributable to sales of our solutions to IOCs and other service providers that used government-supported loan programs or grants to fund purchases from us, such as those originating from the Rural Utility Service (RUS) program administered by the U.S. Department of Agriculture, and broadband stimulus programs under the American Recovery and Reinvestment Act of 2009. During 2014, while we recognized revenue as a result of acceptance of earlier stimulus-funded projects, our bookings of new stimulus-related projects were substantially lower than in prior years. While we expect stimulus-related investment to generally increase in 2015 over the 2014 level, there can be no assurance that IOCs that we serve will benefit from such programs or that even if benefiting, their spending will be targeted at the portions of the networks served by our products. To the extent that any of our customers have received grants or loans under these RUS and stimulus programs but no longer have access to such assistance, or to the extent that they are focusing on other elements of their networks, they may substantially reduce or curtail future purchases of our solutions.
Our business and operations have experienced rapid growth in recent periods, and if we are unable to effectively manage this growth and expansion, or if our business does not continue to grow as we expect, including with respect to our recruitment of qualified personnel, our operating results may suffer.
We experienced rapid growth and have significantly expanded our operations since our inception, which has placed a strain on our management, administrative, operational and financial infrastructure. Our success will depend in part upon our ability to manage our business effectively.
We believe that our future success will depend in large part upon our ability to identify, attract and retain highly qualified and skilled personnel, particularly engineers and sales personnel. Competition for skilled personnel is intense,
23
particularly for those specializing in network and software engineering and sales, and those located in the San Francisco Bay Area. In addition, our headquarters location in Petaluma, in the northern part of the San Francisco Bay Area, may make it more difficult to attract qualified personnel that live in other parts of the Bay Area. In addition, declines in the trading price of our common stock may make attracting and retaining our employees more difficult given the competitive compensatory environment we face recruiting technology employees in the San Francisco Bay Area. We cannot be certain that we will be successful in attracting and retaining qualified personnel, or that newly hired personnel will function effectively, both individually and as a group.
Our ability to manage our operations will further require us to refine our operational, financial and management controls, human resource policies, and reporting systems and procedures. If we fail to efficiently expand our sales force, engineering, operations, IT or financial systems, or otherwise manage our business, our costs and expenses may increase more than we plan and we may lose the ability to close customer opportunities, enhance our existing products and services, satisfy customer requirements, respond to competitive pressures or otherwise execute our business plan. These additional investments will increase our operating costs, which will make it more difficult for us to offset any future revenue shortfalls in the short term by reducing expenses. Moreover, if we fail to scale our operations successfully, our business and operating results could be adversely affected.
We do not have long-term, committed-volume purchase contracts with our customers for our products, and therefore have no guarantee of future revenue from any customer, which may cause our operating results to be adversely affected.
Sales of our Z-Series platforms are made, and we expect sales of our N-Series platforms to be made, pursuant to purchase orders, and we have not entered into long-term, committed-volume purchase contracts with our customers, including our largest customer, Windstream. As a result, any of our customers may cease to purchase our hardware solutions at any time. In addition, our customers may attempt to renegotiate their terms of purchase, including price and quantity, or may delay or cancel already submitted purchase orders. If any of our customers stop purchasing our hardware solutions for any reason, or purchase fewer solutions, our operating results and financial condition would be harmed.
We currently rely upon a single contract manufacturer to manufacture our hardware solutions, and if we encounter problems with the contract manufacturer, our operations could be disrupted, which would adversely affect our business, operating results, financial condition and customer relationships.
We contract with Flextronics International, Ltd., or Flextronics, as the sole manufacturer of all of our Z-Series and N-Series platforms. Our reliance on Flextronics makes us vulnerable to possible capacity constraints and reduced control over delivery schedules, manufacturing yields and costs. We have limited direct control over the quality and control systems of Flextronics, and therefore may not be able to ensure levels of quality suitable for our customers. The revenue that Flextronics generates from our orders represents a very small percentage of its revenue. As a result, fulfilling our orders may not be considered a priority by Flextronics. If Flextronics were unable or unwilling to continue manufacturing our Z-Series platforms or commence and maintain manufacturing of our N-Series platforms, in required volumes and at high quality levels, or if Flextronics significantly increased our costs to have them manufacture our products, we would have to identify, qualify and select an acceptable alternative contract manufacturer. Such alternatives may not be available to us when needed, may take a significant amount of time to contract with and establish manufacturing or supply relationships, and may not be in a position to timely satisfy our production requirements at commercially reasonable prices and quality. Any significant interruption in
24
manufacturing would require us to reduce the amount of Z-Series and N-Series platforms available to our customers, which in turn would reduce our revenue and adversely affect our business, operating results, financial condition and customer relationships.
If we fail to accurately forecast our manufacturing requirements or manage our inventory with our contract manufacturer, we could incur additional costs, lose revenue and harm our business, operating results, financial condition and customer relationships.
The suppliers of the components used in our Z-Series and N-Series platforms generally deliver the components directly to our contract manufacturer, Flextronics, but we bear the inventory risk under our arrangements with Flextronics. As of December 31, 2014 and 2013 we had commitments to Flextronics totaling $9.7 million and $7.9 million, respectively. Lead times for the materials and components that we order through Flextronics vary significantly and depend on numerous factors, including the specific supplier, contract terms and market demand for a component at a given time. The lead times for certain key materials and components could be lengthy depending on overall market demand, requiring us or Flextronics to order materials and components several months in advance of their use in manufacturing our products. If we overestimate our production requirements, Flextronics may purchase excess components and build excess inventory. If Flextronics purchases excess components or builds excess products, we could be required to pay for these excess components or products and recognize related inventory write-down costs. We also are required to reimburse Flextronics if our inventory is rendered obsolete for any reason. If we experience inventory write-downs associated with excess or obsolete inventory in any significant amount, this would have an adverse effect on our financial condition and operating results. Conversely, if we underestimate our product requirements, our contract manufacturer may maintain inadequate component inventory and be unable to manufacture our Z-Series and N-Series platforms in sufficient quantities to timely meet customer demand. Any shortfall in available products could result in delays or cancellation of orders by our customers, which could have an adverse effect on our business, operating results, financial condition and customer relationships.
Certain component parts used in the manufacture of our products are sourced from single or limited source suppliers. If we are unable to source these components on a timely basis, we will not be able to meet our customers’ product delivery requirements, which could adversely affect our business, operating results, financial condition and customer relationships.
We depend on certain sole-source and limited source suppliers for key components that Flextronics, our contract manufacturer, uses in the manufacture of our Z-Series and N-Series platforms. Any of the sole-source and limited source suppliers upon whom we rely could stop producing our components, cease operations or be acquired by, or enter into exclusive arrangements with, our competitors. In particular, our reliance on Broadcom Corporation for certain key semiconductors and other third parties for certain optical components used in our hardware solutions makes us vulnerable to shortages or pricing pressure on these important components. Neither we nor Flextronics generally has long-term supply agreements with component suppliers, and our purchase volumes currently may be considered too low for us to be a priority customer by many of such suppliers. As such, we cannot be guaranteed a continuous source of, or favorable pricing for, components from any of these suppliers. Furthermore, patent infringement lawsuits between semiconductor companies could have an adverse effect on our ability to acquire components that are sole sourced and integrated into our Z-Series and N-Series platforms, leading to production delays and additional engineering costs, potentially harming our business and customer relationships. Any such interruption or delay may force us to seek similar components or products from alternative sources, which may not be available on commercially reasonable terms, or at all. Switching suppliers may require that we redesign our Z-Series and/or N-Series
25
platforms to accommodate new components, and to re-qualify these solutions, which would be costly and time-consuming. Any interruption in the supply of sole-source or limited source components for our solutions would adversely affect our ability to meet scheduled product deliveries to our customers and could result in lost revenue or higher expenses, any of which would harm our business, operating results, financial condition and customer relationships.
Our future success depends in part on revenue from Blue Planet and our other services, and because we generally recognize revenue from Blue Planet over the term of the relevant contractual period, downturns or upturns in sales will not likely be reflected in full in our operating results for the period in which such downturns or upturns occur.
Sales of new or renewed term licenses, support and maintenance contracts, especially with respect to Blue Planet, may decline and fluctuate as a result of a number of factors, including our customers’ level of satisfaction with our solutions, the prices of our solutions, the prices of products and services offered by our competitors and reductions in our customers’ spending levels. If our sales of new or renewals of term licenses, support and maintenance contracts decline, our revenue and revenue growth will decline and our business will suffer. In addition, we generally recognize Blue Planet and service contract revenue ratably over the term of the relevant contractual period. As a result, much of the term license and service revenue that we report each quarter is the recognition of deferred revenue from term licenses and service contracts entered into during previous quarters. Accordingly, any decline in new or renewed term licenses or service contracts in any one quarter will not be fully reflected in revenue in that quarter but will negatively affect our revenue in future quarters. In addition, it may be difficult for us to rapidly increase our revenue through additional sales in any period, as Blue Planet revenue is generally recognized over the term of the contract.
Our solutions are highly complex and may contain undetected hardware errors or software bugs, which could harm our reputation and increase our warranty obligations and service costs.
Our solutions are highly technical and, when deployed, are critical to the operation of our customers’ networks. Our solutions have from time to time contained and may in the future contain undetected errors, bugs, defects or security vulnerabilities. Some errors in our solutions may only be discovered after a solution has been deployed and used by customers, and may in some cases only be detected under certain circumstances or after extended use. Any errors, bugs, defects or security vulnerabilities discovered in our solutions after commercial release could result in loss of our revenue or delay in revenue recognition, loss of customer goodwill and customer relationships, harm to our reputation and increased service costs, any of which would adversely affect our business, operating results and financial condition. Quality or performance problems related to our Z-Series or N-Series platforms that are covered under warranty could require us to repair or replace defective products at no additional cost to the customer. For example, in the second quarter of 2013, we experienced higher than expected failure rates with certain Z-Series line cards used by a number of our customers that were manufactured between 2010 and the spring of 2012. After extensive analysis of the root cause, we identified a line card power supply as the source of the failures. We elected to undertake a proactive warranty repair and replacement program for line cards we have determined to be at risk of early failure. While in this instance we were able to negotiate an agreement for the manufacturer of the defective components to reimburse us for a substantial portion of the costs of the repair and replacement program and we believe that our warranty reserve is sufficient to cover expected costs, including any unreimbursed costs, if we experience quality or performance problems in the future related to our Z-Series or N-Series platforms or other products that are covered under warranty, we could be required to repair or replace defective products without the benefit of manufacturer reimbursement, which could have a material adverse effect on our reputation and results of operations. In addition, any errors discovered in Blue Planet could cause
26
customers and potential customers to abandon or never adopt Blue Planet, which could adversely affect our ability to grow our business. Moreover, we could face claims for product liability, tort or breach of contract from our customers, or be required to indemnify our customers for damages and third-party claims for a variety of reasons. Any increased costs, liabilities and diversion of resources associated with a warranty or other claim related to errors or alleged errors in our solutions could adversely affect our business, operating results and financial condition.
Our solutions must interoperate with existing legacy and competitor software applications and hardware products found in our customers’ networks. If our solutions do not interoperate properly, future sales of our solutions could be negatively affected, which would harm our business.
Our solutions must interoperate with our customers’ existing and planned networks, which often have varied and complex specifications, utilize multiple protocol standards, software applications and products from multiple vendors and may contain multiple generations of products that have been added over time. Our solutions must communicate, manage and analyze networks and the traffic across these networks, often across differing legacy protocols and technologies. As a result, we have developed and are continuing to develop interfaces that enable our solutions to achieve the desired level of interoperability with these existing and planned networks and network components, including legacy networks that operate on technology originally designed several decades ago. To meet these interoperability requirements, we continuously engage in development efforts that require substantial resources. If we fail to develop or maintain compatibility with other software or equipment included in our customers’ existing and planned networks, our opportunity to sell our solutions may be adversely impacted and we may incur significant warranty, support and repair costs, cause significant customer relations problems and divert the attention of our engineering personnel from our product development efforts, and our business and operating results would be adversely affected. In addition, if our competitors, whose software or equipment incorporate these protocols and technologies, fail to make available to us on an ongoing basis the interfaces and other information we require to maintain the interoperability of our solutions with their software and equipment, our business and operating results would be adversely affected.
If we fail to comply with evolving network industry technical requirements and standards, sales of our existing and future solutions would be adversely affected, which could adversely affect our operating results and growth prospects.
The markets for our solutions are characterized by a significant number of standards, both domestic and international, which are evolving as new network technologies are deployed. Our solutions must comply with these standards in order to be widely marketable. In some cases and particularly in international markets, we may be required to obtain certifications or authorizations before our solutions can be introduced, marketed or sold in new markets or to new customers. In addition, our ability to expand our international operations and create international market demand for our solutions may be constrained by regulations or standards adopted by other countries that may require us to redesign our existing solutions or develop new products suitable for sale in those countries. We cannot assure you that we will be able to design our solutions to comply with evolving standards and regulations. The cost of complying with evolving standards and regulations, or our failure to obtain timely domestic or foreign regulatory approvals or certifications, may prevent us from selling our solutions where such standards or regulations apply, which could adversely affect our operating results and growth prospects.
27
Our ability to sell our solutions is highly dependent on the quality of our support and service offerings, and our failure to offer high quality support and services would have an adverse effect on our business, reputation and operating results.
Once our solutions are deployed within our customers’ networks, our customers depend on our support organization to quickly resolve any issues relating to those products. A high level of support is critical for the successful marketing and sale of our solutions. If we do not effectively assist our customers in deploying our solutions, succeed in helping them quickly resolve post-deployment issues or provide effective ongoing support, it could adversely affect our ability to sell our solutions to existing customers and harm our reputation with potential new customers, which would have an adverse effect on our business, reputation and operating results.
Uncertain global economic conditions may harm our industry, business, operating results and financial condition.
Our overall performance depends in large part on global economic conditions which have been challenging in recent periods and may continue to be challenging for the foreseeable future. Global financial developments seemingly unrelated to us or the network industry may harm our business by negatively affecting the demand for networking equipment. The United States, Europe and China have been adversely affected in the recent past, and continue to face economic uncertainty. These conditions can affect the rate of spending on network services, could adversely affect our customers’ ability or willingness to purchase our solutions and could delay prospective customers’ purchasing decisions. In addition, a prolonged economic downturn could affect the viability of our current business strategy. All of these factors could reduce our revenue and harm our business, operating results and financial condition.
Third parties may assert that we are infringing upon their intellectual property rights, which could harm our business, operating results, financial condition and growth prospects.
There is considerable patent and other intellectual property development activity, and litigation related to intellectual property rights, in the technology industry in general and the networking industry in particular. From time to time, our competitors, other third-party developers of technology, non-practicing entities and other third party intellectual property owners, commonly referred to as “patent trolls,” have and may claim that we are infringing upon their patent, trademark and other intellectual property rights. Regardless of the merit of any such claim, responding to such claims can be time consuming, divert management’s attention and resources and may cause us to incur significant expenses. We cannot assure you that we would be successful in defending against any such claims. In addition, patent applications in the United States and most other countries are confidential for a period of time before being published, so we cannot be certain that we were the first to conceive inventions covered by our patents or patent applications. Moreover, we cannot be certain that we are not infringing third parties’ patent or other intellectual property rights. An adverse outcome with respect to any intellectual property claim could invalidate our proprietary rights and/or force us to, among other things, do one or more of the following:
• | obtain from a third party claiming infringement a license to sell or use the relevant technology, which may not be available on reasonable terms, or at all; |
• | stop manufacturing, selling, or using our solutions that embody the asserted intellectual property and refund to customers all or a portion of the fees related to the purchase or license of such solutions; |
• | pay substantial monetary damages; |
• | indemnify our customers and/or commercial partners against third-party claims for intellectual property infringement pursuant to indemnification obligations under our contracts, generally without limit; |
• | expend significant resources to redesign our solutions that use the infringing technology and to develop or acquire non-infringing technology; or |
28
• | rebrand or rename our products and services in a manner that does not infringe third party trademark or other intellectual property rights, which could harm our brand recognition in the marketplace. |
Additionally, if we offer employment to personnel employed or formerly employed by competitors, we may become subject to claims of unfair hiring practices and/or breaches of confidentiality related to the intellectual property of such competitors, and incur substantial costs in defending ourselves against these claims, regardless of their merits. Any of these actions could adversely affect our business, operating results, financial condition and growth prospects.
If we are unable to successfully manage our use of “open source” software, our ability to sell our products and services could be harmed, which could result in competitive disadvantages, and subject us to possible litigation.
We incorporate open source software code in our proprietary software that is part of both our Z-Series and N-Series infrastructure platforms and our Blue Planet software platform. Use of open source software can lead to greater risks than the use of proprietary or third-party commercial software since open source licensors generally do not provide warranties or controls with respect to origin, functionality or other features of the software. Some open source software licenses require users who distribute open source software as part of their products to publicly disclose all or part of the source code in their software and make any derivative works of the open source code generally available in source code form for limited fees or at no cost. In addition, some customers may seek restrictions on the way in which we utilize open source software in solutions that would be deployed in their networks. Although we monitor our use of open source software, open source license terms may be ambiguous, and many of the risks associated with the use of open source software cannot be eliminated. If we were found to have inappropriately used open source software in our solutions, we may be required to release our proprietary source code, re-engineer our software, discontinue the sale of certain solutions in the event re-engineering cannot be accomplished on a timely basis, or take other remedial action. Furthermore, if we fail to comply with applicable open source licenses, we may be subject to costly claims of intellectual property infringement or demands for the public release of proprietary source code. Any of the foregoing could harm our business and put us at a competitive disadvantage.
If we are unable to protect our intellectual property rights, our competitive position, ability to protect our proprietary technology and our brand could be harmed or we could be required to incur significant expense to enforce our rights.
Our success depends in part on our ability to protect our core technology and intellectual property. We rely on a combination of intellectual property rights, including trade secret laws, copyrights, patents and trademarks, as well as customary contractual provisions. To date we have only five issued U.S. patents, and do not have any patents issued outside the United States. Moreover, our issued patents and the patent applications that we have filed may not cover important aspects of our technology, and may not be enforceable. We also license software from third parties for integration into our products, including open source software and other commercially available software. Furthermore, from time to time, we may enter into development arrangements with third parties where the resulting intellectual property is jointly owned. We generally control access to and use of our proprietary software and other confidential information through the use of internal and external controls, including contractual protections with employees, contractors, customers and partners. We also incorporate certain generally available software programs into Blue Planet and our other software solutions pursuant to license agreements with third parties. These agreements may be breached, and we may not have adequate remedies for any such breach. In addition, our trade secrets may otherwise become known or be independently developed by competitors.
29
The steps we have taken to protect our intellectual property rights may not be adequate. Third parties may infringe or misappropriate our intellectual property rights. We may initiate claims against third parties that we believe are infringing our intellectual property rights if we are unable to resolve matters satisfactorily through negotiation. If we fail to protect our intellectual property rights adequately, our competitors could offer similar products, potentially harming our business. In some cases, third parties with whom we may jointly own intellectual property rights may be able to use their joint ownership rights to compete with us. Our intellectual property rights may be challenged by others or invalidated through administrative process or litigation. Any litigation, whether or not it is resolved in our favor, could result in significant expense to us and divert the efforts of our technical and management personnel. Effective trademark, copyright, trade secret and patent protection may not be available to us in every country in which we provide our solutions. The laws of some foreign countries are not as protective of intellectual property rights as those in the United States, and mechanisms for enforcement of intellectual property rights in these jurisdictions may be inadequate. We may be required to spend significant resources to monitor and protect our intellectual property rights, and such monitoring may be insufficient to detect all misappropriation or infringement of our rights. In addition, in some instances, for cost-benefit reasons we may choose not to pursue, or to abandon, applications for certain patents, registered trademarks and other registered intellectual property in particular jurisdictions. We may initiate claims or litigation against third parties for infringement of our intellectual property rights or to establish the validity of such rights.
If we lose key members of our management or engineering teams or are unable retain executives and employees that we need to support our operations and growth, our business and operating results may be harmed.
Our success depends, in large part, on the continued contributions of our key management, engineering, sales personnel and other employees, many of whom are highly skilled and would be difficult to replace. None of our senior management or key technical or sales personnel is bound by a written employment contract to remain with us for a specified period. Moreover, any of our employees may terminate their employment at any time. Many of our key employees have become, or will soon become, vested in a substantial amount of their shares of common stock or stock options or are holding options with exercise prices above the recent trading price of our common stock. Employees may be more likely to leave us if the shares they own, or the shares underlying their stock options, have vested or are not viewed as competitive on a compensatory nature. In addition, we do not maintain key man life insurance covering our key personnel. The loss of the services of any of our key personnel may harm our business and operating results.
Our failure to comply with laws and regulations, including regulations affecting the import or export of products and anti-bribery laws, could harm our business.
Our business is subject to regulation by various federal, state, local and foreign governmental agencies, including agencies responsible for monitoring and enforcing employment and labor laws, workplace safety, product safety, environmental laws, consumer protection laws, anti-bribery laws, import/export controls, federal securities laws, and tax laws and regulations.
In certain jurisdictions, these regulatory requirements may be more stringent than those in the United States. Noncompliance with applicable regulations or requirements could subject us to investigations, sanctions, product recalls, enforcement actions, disgorgement of profits, fines, damages, civil and criminal penalties or injunctions. If any governmental sanctions are imposed, or if we do not prevail in any possible civil or criminal litigation, our business, operating results, and financial condition could be adversely affected. In addition, responding to any action will likely result in a significant diversion of management’s attention and resources and an increase in professional fees. Enforcement actions and sanctions could harm
30
our business, reputation, operating results and financial condition. Any change in laws, regulations or related legislation, shift in approach to the enforcement or scope of existing regulations, or change in the countries, persons or technologies targeted by such regulations, could negatively affect our ability to sell our solutions and could adversely affect our business, operating results and financial condition. Our recent international expansion creates additional regulatory challenges. Future international shipments of our solutions may require export licenses or export license exceptions. In addition, the import laws of other countries may limit our ability to distribute our solutions, or our customers’ ability to buy and use our solutions, in those countries. Changes in our solutions or changes in export and import regulations may create delays in the introduction of our solutions in international markets, prevent our customers with international operations from deploying our solutions or, in some cases, prevent the export or import of our solutions to certain countries altogether. We expect that our global operations will require us to import and export to and from several countries, resulting in additional compliance obligations.
The U.S. Foreign Corrupt Practices Act (FCPA) the United Kingdom Bribery Act 2010 (Bribery Act) and similar anti-bribery laws in other jurisdictions generally prohibit companies and their intermediaries from making improper payments to government officials and others for the purpose of obtaining or retaining business. Under these laws, companies are required to maintain records that accurately and fairly represent their transactions and have an adequate system of internal accounting controls. We are expanding to operate in areas of the world, including in conjunction with our channel partners, in which corruption may be more prevalent and in certain circumstances, compliance with anti-bribery laws may conflict with local customs and practices. In addition, network operators in various foreign countries are owned, in whole or in part, by foreign governments or instrumentalities. In such cases, the people with whom we engage in connection with our selling activities may be government officials. We cannot assure you that our employees, channel partners or other agents will not engage in prohibited conduct and render us responsible under the FCPA, the Bribery Act or any similar anti-bribery laws in another jurisdiction. If we are found to be in violation of the FCPA, the Bribery Act or other anti-bribery laws, either due to our nascent compliance system or the acts or omission of our employees, channel partners or other agents, we could suffer criminal or civil penalties or other sanctions, which could have an adverse effect on our business.
Changes in telecommunications and Internet laws, regulations, rules and tariffs could impede the growth in network activity or otherwise harm our customers, which could have a negative effect on our business and operating results.
Increased regulation of telecommunications and Internet network activity or access in the United States or any country in which we do business, particularly those that have the effect of impeding, or lessening the rate of growth in, network activity, could decrease demand for our solutions. New or increased access charges for telecommunications service providers and tariffs on certain communications services could negatively affect our customers’ businesses. Further, many of our customers are subject to the Federal Communications Commission (FCC) rate regulation of interstate telecommunications services, and are recipients of federal universal service fund payments, which are intended to subsidize telecommunications services in areas that are expensive to serve. In addition, many of our customers are subject to state regulation of intrastate telecommunications services, including rates for such services, and may also receive funding from state universal service funds. Changes in rate regulations or universal service funding rules, either at the federal or state level, could adversely affect such customers’ revenue and capital spending plans. Any adoption of new laws, regulations, rules or tariffs, or changes to existing laws, regulations, rules or tariffs, that negatively affects network activity or growth or otherwise adversely affects the business of our customers could harm our business and operating results. For example, while our business is not directly subject to regulation by the FCC, the FCC’s recent “Open Internet” or “Net Neutrality” rules may impact the business of our U.S. customers which, in turn, may negatively impact their capital spending, including their purchases from us.
31
Industry consolidation may lead to increased competition or a decreased customer base, which could harm our business and operating results.
Consolidation in the network equipment industry has been common. Some of our competitors have made acquisitions or entered into partnerships or other strategic relationships to offer a more comprehensive solution than they had offered individually. We expect this trend to continue as companies attempt to strengthen or maintain their market positions in an evolving industry are acquired for a variety of strategic reasons or are unable to continue operations. Consolidation in our industry may result in stronger competitors that may create more compelling product offerings, be able to offer greater pricing flexibility and or terms and conditions of sale, including providing customers with substantial financing, and be better able to compete as sole-source vendors for customers. This would make it more difficult for us to compete effectively, including on the basis of price, sales and marketing programs and breadth of technology or product offerings. In addition, companies with which we have strategic partnerships may acquire or form alliances with our competitors, thereby reducing their business with us. Furthermore, continued industry consolidation may adversely affect customers’ perceptions of the viability of smaller and even medium-sized technology companies such as us and, consequently, customers’ willingness to purchase from such companies.
In addition, consolidation of network operators may lead to a reduction in the number of potential customers, with the effect that the loss of any major customer could have a greater effect on operating results than in a customer marketplace composed of more numerous participants. Consolidation among our customers may also cause delays or reductions in their capital expenditure plans and increased competitive pricing pressures as the number of available customers declines and their relative purchasing power increases in relation to suppliers. Consolidation in the number of potential customers could lead to more variability in our operating results and could have an adverse effect on our business.
Unanticipated changes in effective tax rates or adverse outcomes resulting from examination of our income or other tax returns could adversely affect our operating results and financial condition.
We are subject to income taxes in the United States and various foreign jurisdictions, and our domestic and international tax liabilities will be subject to the allocation of expenses in differing jurisdictions. Our future effective tax rates could be subject to volatility or adversely affected by a number of factors, including:
• | changes in the valuation of our deferred tax assets and liabilities; |
• | expected timing and amount of the release of tax valuation allowances; |
• | expiration of, or detrimental changes in, research and development tax credit laws; |
• | expiration or non-utilization of net operating losses; |
• | tax effects of stock-based compensation; |
• | costs related to intercompany restructurings; |
• | changes in tax laws, regulations, accounting principles or interpretations thereof; or |
• | future earnings being lower than anticipated in countries where we have lower statutory tax rate and higher than anticipated earnings in countries where we have higher statutory tax rates. |
In addition, we may be subject to audits of our income and sales taxes by the Internal Revenue Service and other foreign and state tax authorities. Outcomes from these audits could have an adverse effect on our operating results and financial condition.
32
We may not be able to utilize a significant portion of our net operating loss or research and development tax credit carryforwards, which could adversely affect our operating results and financial condition.
As of December 31, 2014, we had $108.1 million of federal and $84.1 million of state net operating loss carryforwards available to reduce future taxable income. These net operating loss carryforwards begin to expire in 2026 for U.S. federal income tax and 2015 for state income tax purposes, and the research tax credit carryforwards begin to expire in 2027 for federal purposes, but do not expire for California purposes. U.S. federal and state income tax laws limit the amount of these carryforwards we can utilize in any given year upon a greater than 50% cumulative shift of stock ownership over a three-year period, including shifts due to the issuance of additional shares of our common stock, or securities convertible into our common stock. We may experience subsequent shifts in our stock ownership and, accordingly, there is a risk that our ability to use our existing carryforwards in the future could be limited and that existing carryforwards would be unavailable to offset future income tax liabilities, which could adversely affect our operating results and financial condition.
We are obligated to develop and maintain proper and effective internal control over financial reporting. We may not complete our analysis of our internal control over financial reporting in a timely manner, or these internal controls may not be determined to be effective, which may adversely affect investor confidence in the accuracy and completeness of our financial reports and the market price of our securities may be negatively affected.
Pursuant to Section 404 of the Sarbanes-Oxley Act, starting with this annual report for the year ended December 31, 2014 we are required to furnish a report by management on, among other things, the effectiveness of our internal control over financial reporting. In general, this assessment from year-to-year includes disclosure of any material weaknesses identified by our management in our internal control over financial reporting in compliance with Section 404. We have not identified any material weaknesses for the year ended December 31, 2014. For any given period, we may not be able to complete our evaluation, testing and any required remediation in a timely fashion. During the evaluation and testing process, if we identify one or more material weaknesses in our internal control over financial reporting, we will be unable to assert that our internal controls are effective. If we are unable to certify that our internal controls are effective, we could lose investor confidence in the accuracy and completeness of our financial reports, which would cause the price of our common stock to decline, and we may be subject to investigation or sanctions by the SEC. We will be required to disclose changes made in our internal control and procedures on a quarterly basis. However, our independent registered public accounting firm will not be required to report on the effectiveness of our internal control over financial reporting pursuant to Section 404 until the later of the year following our first annual report required to be filed with the SEC, or the date we are no longer an “emerging growth company” as defined in the Jumpstart our Business Startups, or JOBS Act, if we take advantage of the exemptions contained in the JOBS Act. At such time, our independent registered public accounting firm may issue a report that is adverse in the event it is not satisfied with the level at which our controls are documented, designed or operating. In addition, any remediation efforts we undertake may be costly and may not be successful or enable us to avoid a material weakness in the future.
We may expand through acquisitions of, or investments in, other companies, business or technologies which may divert our management’s attention and result in additional dilution to our stockholders, and we may be unable to integrate acquired businesses and technologies successfully or achieve the expected benefits of such acquisitions or investments.
While we have not consummated any acquisitions to date, we may evaluate and consider potential strategic transactions, including acquisitions of, or investments in, complementary businesses, technologies, services, products and other
33
assets in the future. We also may enter into relationships with other businesses to expand our product and service offerings, which could involve preferred or exclusive licenses, additional channels of distribution, discount pricing, investments in other companies or strategic or joint venture partnership agreements. Acquisitions may disrupt our business, divert our resources and require significant management attention that would otherwise be available for development of our existing business. The anticipated benefits of any acquisition, investment or business relationship may not be realized, or we may be exposed to risks or liabilities that were unknown at the time of the acquisition or that are different from those that faced our business prior to the acquisition. Negotiating and consummating these transactions can be time-consuming, difficult and expensive, and our ability to close these transactions may often be subject to approvals that are beyond our control. Consequently, these transactions, even if undertaken and announced, may not close. For one or more of those transactions, we may:
• | use cash that we may need in the future to operate our business; |
• | incur debt on terms unfavorable to us or that we are unable to repay; |
• | issue additional equity securities that would dilute our stockholders; |
• | increase our working capital requirements; |
• | incur substantial liabilities or large charges, such as impairment of goodwill or intangible assets, at the time of the transaction or for some period long after the transaction; |
• | encounter difficulties retaining key employees of the acquired company or integrating diverse solutions or business cultures; |
• | acquire companies with inadequate financial or operational reporting or control environments; and |
• | become subject to adverse tax consequences, substantial depreciation or deferred compensation charges. |
We may not be able to address these risks successfully, or at all, without incurring significant costs, delays or other operating problems that could disrupt our business and have an adverse effect on our operating results and financial condition.
Our business is subject to the risks of earthquakes, fire, floods and other natural catastrophic events, and to interruption by manmade problems such as network security breaches, computer viruses or terrorism.
Our corporate headquarters, the manufacturing facilities of some of our suppliers, as well as our contract manufacturer’s current manufacturing facility for our Z-Series and N-Series platforms, are all located in the San Francisco Bay Area, a region known for seismic activity. A significant natural disaster, such as an earthquake, a fire or a flood, occurring near our headquarters, or near the facilities of our suppliers or contract manufacturer, could have an adverse effect on our business, operating results and financial condition. Despite our implementation of network security measures, our networks and outside data center, by which we provide our Blue Planet platform, also may be vulnerable to computer viruses, break-ins and similar disruptions from unauthorized tampering with our products. In addition, natural disasters, acts of terrorism or war could cause disruptions in our or our customers’ businesses, our suppliers’ and contract manufacturers’ operations or the economy as a whole. We also rely on information technology systems to communicate among our workforce and with third parties. Any disruption to our communications, whether caused by a natural disaster or by manmade problems, such as power disruptions, could adversely affect our business. To the extent that any such disruptions result in delays or cancellations of customer orders or impede our suppliers’ and contract manufacturer’s ability to timely deliver our solutions and components, the deployment of our solutions and our business, operating results and financial condition would be adversely affected.
34
Risks Relating to Capitalization Matters
Our share price has been and may continue to be volatile.
Technology stocks, including those of companies in the network industry, have historically experienced high levels of volatility. The trading price of our common stock has been and is likely to continue to be highly volatile and could be subject to wide fluctuations in response to various factors, some of which are beyond our control and may not be related to our operating performance. The relatively small trading volume of our stock has in the past resulted in, and may in the future continue to result in small transactions having a large impact on our stock price. Such fluctuations could cause you to lose all or part of your investment in our common stock. Factors that may cause the market price of our common stock to fluctuate include:
• | actual or anticipated changes in our operating results or fluctuations in our operating results; |
• | actual or anticipated changes in the expectations of investors or securities analysts, and whether our operating results meet these expectations; |
• | price and volume fluctuations in the overall stock market from time to time; |
• | significant volatility in the market price and trading volume of technology companies in general, and of companies in the network industry in particular; |
• | new product or service introductions and market demand for these and our existing solutions; |
• | failure to meet investor expectations as a result of the timing of large customer orders; |
• | actual or anticipated developments in our competitors’ businesses or the competitive landscape generally; |
• | litigation involving us, our industry or both; |
• | regulatory developments in the United States, internationally or both; |
• | general economic conditions and trends; |
• | major catastrophic events; |
• | sales of large blocks of our stock; or |
• | departures of key personnel. |
In addition, if either the market for technology stocks or the stock market in general experiences a loss of investor confidence, the trading price of our common stock could decline for reasons unrelated to our business, operating results or financial condition. The trading price of our common stock might also decline in reaction to events that affect other companies in the network industry even if these events do not directly affect us.
In the past, following periods of volatility in the market price of a company’s securities, securities class action litigation has often been brought against that company. The price of our common stock since our initial public offering (IPO) in May 2013 has been highly volatile and, in April 2014 two law suits alleging violations of securities laws were filed against us, our directors and of our certain executive officers. This and any future shareholder litigation could result in substantial costs and divert our management’s attention and resources from our business, and this could have an adverse effect on our business, operating results and financial condition.
If securities analysts cease to publish research or reports about our business, or if they downgrade our stock, the price of our stock could decline.
The trading market for our common stock is influenced by any research and reports that securities or industry analysts publish about us or our business. In the event securities or industry analysts cover our company and one or more of these analysts downgrade our stock or publish unfavorable research about our business, our stock price, and the trading price of the notes, could decline. If one or more of these analysts cease coverage of our company or fail to publish reports on us regularly, demand for our stock could decrease, which could cause our stock price, price of the notes, and trading volume to decline.
35
The concentration of ownership among our existing directors, executive officers and principal stockholders provide them, collectively, with substantial control which could limit your ability to influence the outcome of key transactions, including a change of control.
Our directors, executive officers and their affiliates, in the aggregate, beneficially own approximately 46% of the outstanding shares of our common stock based on the number of shares outstanding as of December 31, 2014. As a result, these stockholders, if acting together, may be able to influence or control matters requiring approval by our stockholders, including the election of directors and the approval of mergers, acquisitions or other extraordinary transactions. They may also have interests that differ from yours and may vote in a way with which you disagree and which may be adverse to your interests. This concentration of ownership may have the effect of delaying, preventing or deterring a change of control of our company, could deprive our stockholders of an opportunity to receive a premium for their common stock as part of a sale of our company and might ultimately affect the market price of our common stock.
We use a significant amount of capital to meet our business objectives.
We require a significant amount of cash resources to operate our business. We used approximately $42.0 million of cash and cash equivalents in the year ended December 31, 2014 for operating activities. Our liquidity is affected by many factors including, among others, fluctuations in revenue, gross margin and operating expenses, as well as changes in operating assets and liabilities. Any future softening in the demand for our products and services may result in higher than anticipated losses in the future and require us to raise additional capital. We may also need to make changes to our operating model and capital expenditures to extend our available resources or we may have to significantly reduce our business activities which could adversely affect our ability to compete effectively in the markets in which we participate which could, in turn, adversely affect our results of operations. The indenture related to our 8.0% Convertible Notes Due 2019 includes certain restrictions on additional indebtedness. As a result, our capital raising options are limited. There can be no assurance that we would be able to raise additional capital on acceptable terms or at all.
As a public company we may be exposed to costly and time consuming securities class action suits.
As a public company, we face the risk of shareholder lawsuits, particularly if we experience sharp declines in the price of our common stock. For example, on April 1, 2014 a purported stockholder class action lawsuit was filed in the Superior Court of California, County of San Francisco, against our company, the members of our Board of Directors, our former Chief Financial Officer and the underwriters of our IPO. On April 30, 2014 a substantially similar lawsuit was filed in the same court against the same defendants. These two lawsuits have been consolidated under the caption Beaver County Employees Retirement Fund, et al. v. Cyan, Inc. et al., Case No. CGC-14-539008. We intend to defend this litigation vigorously. While we cannot predict the outcome of this litigation, defending this litigation-and any other lawsuits filed against us-will require us to expend significant time and money, and will distract management from its primary responsibilities. In addition, as a result of this litigation our director and officer insurance costs have increased significantly and may increase again the next time we renew such policies.
The requirements of being a public company subject us to increased costs and may strain our resources.
As a public company, we are subject to the reporting requirements of the Securities Exchange Act of 1934, as amended (Exchange Act) the Sarbanes-Oxley Act, the Dodd-Frank Act, the listing requirements of The New York Stock
36
Exchange and other applicable securities rules and regulations. Compliance with these rules and regulations has and will continue to increase our legal, accounting and financial compliance costs, make some activities more difficult, time-consuming or costly and increase demand on our systems and resources, particularly after we are no longer an “emerging growth company,” as defined in the JOBS Act.
The Exchange Act requires, among other things, that we file annual, quarterly and current reports with respect to our business and operating results. The Sarbanes-Oxley Act requires, among other things, that we maintain effective disclosure controls and procedures and internal control over financial reporting. In order to maintain and, if required, improve our disclosure controls and procedures and internal control over financial reporting to meet this standard, significant resources and management oversight will be required. As a result, management’s attention may be diverted from other business concerns, which could adversely affect our business and operating results. We will likely need to hire more employees in the future or engage outside consultants to comply with these regulations, which will increase our costs and expenses.
In addition, changing laws, regulations and standards relating to corporate governance and public disclosure are creating uncertainty for public companies, increasing legal and financial compliance costs and making some activities more time consuming. These laws, regulations and standards are subject to varying interpretations, in many cases due to their lack of specificity, and, as a result, their application in practice may evolve over time as new guidance is provided by regulatory and governing bodies. This could result in continuing uncertainty regarding compliance matters and higher costs necessitated by ongoing revisions to disclosure and governance practices. We intend to invest resources to comply with evolving laws, regulations and standards, and this investment may result in increased general and administrative expenses and a diversion of management’s time and attention from revenue-generating activities to compliance activities. If our efforts to comply with new laws, regulations and standards are unsuccessful or differ from the activities intended by regulatory or governing bodies due to ambiguities related to their application and practice, regulatory authorities may initiate legal proceedings against us and our business may be adversely affected.
We are an “emerging growth company” and we cannot be certain if the reduced disclosure requirements applicable to emerging growth companies will make our common stock less attractive to investors.
For as long as we remain an “emerging growth company” under the JOBS Act, we may take advantage of certain exemptions from various reporting requirements that are applicable to public companies that are not “emerging growth companies” including, but not limited to, not being required to comply with the auditor attestation requirements of Section 404, reduced disclosure obligations regarding executive compensation in our periodic reports and proxy statements, and exemptions from the requirements of holding a nonbinding advisory vote on executive compensation and shareholder approval of any golden parachute payments not previously approved. We may take advantage of these reporting exemptions until we are no longer an “emerging growth company.” We would cease to be an “emerging growth company” upon the earliest of:
• | January 1, 2019; |
• | the first fiscal year after our annual gross revenue is $1.0 billion or more; |
• | the date on which we have, during the previous three-year period, issued more than $1.0 billion in non-convertible debt securities; or |
• | the end of any fiscal year in which the market value of our common stock held by non-affiliates exceeded $700 million as of the end of the second quarter of that fiscal year. |
37
We cannot predict if investors will find our common stock less attractive because we may rely on these exemptions. If some investors find our common stock less attractive as a result, there may be a less active trading market for our common stock and our stock price may be more volatile.
In addition, under the JOBS Act, “emerging growth companies” can delay adopting new or revised accounting standards until such time as those standards apply to private companies. We have irrevocably elected not to avail ourselves of this exemption from new or revised accounting standards, and, therefore, we will be subject to the same new or revised accounting standards as other public companies that are not “emerging growth companies.”
We do not intend to pay dividends for the foreseeable future.
We have never declared or paid any dividends on our stock. We currently intend to retain any earnings to finance the operation and expansion of our business, and we do not anticipate paying any cash dividends for the foreseeable future. As a result, you may only receive a return on your investment in our common stock if the market price of our common stock increases.
Provisions in our amended and restated certificate of incorporation and amended and restated bylaws and under Delaware law might discourage, delay or prevent a change of control of our company or changes in our management and, therefore, depress the trading price of our common stock.
Our amended and restated certificate of incorporation and amended and restated bylaws contain provisions that could depress the trading price of our common stock by acting to discourage, delay or prevent a change of control of our company or changes in our management that the stockholders of our company may deem advantageous. These provisions:
• | establish a classified Board of Directors so that not all members of our Board of Directors are elected at one time; |
• | authorize the issuance of “blank check” preferred stock that our Board of Directors could issue to increase the number of outstanding shares to discourage a takeover attempt; |
• | prohibit stockholder action by written consent, which requires all stockholder actions to be taken at a meeting of our stockholders; |
• | prohibit stockholders from calling a special meeting of our stockholders; |
• | provide that the Board of Directors is expressly authorized to make, alter or repeal our bylaws; |
• | require that the Court of Chancery of the State of Delaware be the sole and exclusive forum for various legal actions related to fiduciary and corporate actions under Delaware law; and |
• | establish advance notice requirements for nominations for elections to our Board of Directors or for proposing matters that can be acted upon by stockholders at stockholder meetings. |
Additionally, we are subject to Section 203 of the Delaware General Corporation Law, which generally prohibits a Delaware corporation from engaging in any of a broad range of business combinations with any “interested” stockholder for a period of three years following the date on which the stockholder became an “interested” stockholder and which may discourage, delay or prevent a change of control of our company.
Any provision of our amended and restated certificate of incorporation or amended and restated bylaws or Delaware law that has the effect of delaying or deterring a change in control could limit the opportunity for our stockholders to receive a
38
premium for their shares of our common stock, and could also affect the price that some investors are willing to pay for our common stock.
Risks Related to our Outstanding 8.0% Convertible Notes Due 2019
We may not have sufficient cash flow from our business to pay our debt.
We have a significant amount of indebtedness and substantial debt service requirements. As of December 31, 2014, our aggregate principal amount of indebtedness for borrowed money was $50.0 million. Subject to certain conditions and limitations in the indenture, we may also incur additional indebtedness, including secured debt, to meet future financing needs. Our ability to make scheduled interest payments, including, if applicable, interest make-whole payments on, or to repay the principal or conversion value, as applicable of our outstanding convertible notes depends on our future performance, which is subject to economic, financial, competitive, regulatory and other factors beyond our control. Our business may not generate cash flow from operations sufficient to service our debt and make necessary capital expenditures. If we are unable to generate such cash flow, we may be required to adopt one or more alternatives, such as selling assets, restructuring debt or obtaining additional equity capital on terms that may be onerous or highly dilutive. Our ability to refinance our indebtedness will depend on the capital markets and our financial condition at such time. We may not be able to engage in any of these activities or engage in these activities on desirable terms, which could result in a default on our debt obligations.
Our significant level of indebtedness could adversely affect our business, financial condition and results of operations and prevent us from fulfilling our obligations under the notes.
We have a significant amount of indebtedness and substantial debt service requirements. As of December 31, 2014, our aggregate principal amount of indebtedness for borrowed money was $50.0 million. Subject to certain conditions and limitations in the indenture, we may also incur additional indebtedness, including secured debt, to meet future financing needs.
Our substantial indebtedness could have significant effects on our business, financial condition and results of operations. For example, it could among other effects:
• | make it more difficult for us to satisfy our financial obligations, including with respect to the notes; |
• | result in an event of default if we fail to comply with the covenants contained in the indenture or the related security documents related to the notes and any agreement governing our existing or future indebtedness, if any, which event of default could result in all of our debt becoming immediately due and payable; |
• | increase our vulnerability to general adverse economic, industry and competitive conditions; |
• | reduce the availability of our cash flow to fund working capital, capital expenditures, acquisitions and other general corporate purposes because we will be required to dedicate a substantial portion of our cash flow from operations to the payment of principal and interest on our indebtedness; |
• | subject us to increased sensitivity to interest rate increases on our existing and future indebtedness, if any, with variable interest rates; |
• | limit our flexibility in planning for, or reacting to, and increasing our vulnerability to changes in our business, the industry in which we operate and the general economy; |
39
• | prevent us from raising funds necessary to repay the notes at maturity, purchase notes tendered to us if there is a “fundamental change” or pay the interest make-whole payment that may be due in cash in connection with certain conversions of the notes under the indenture governing the notes; |
• | place us at a competitive disadvantage compared to our competitors that have less indebtedness or are less highly leveraged and that, therefore, may be able to take advantage of opportunities that our debt levels or leverage prevent us from exploiting; and |
• | limit our ability to obtain additional financing. |
Each of these factors may have a material and adverse effect on our business, financial condition and results of operations and our ability to meet our payment obligations under the notes and our future indebtedness, if any.
Our ability to make payments with respect to the notes and to satisfy any other debt obligations will depend on our future operating performance and our ability to generate significant cash flow in the future, which will be affected by prevailing economic conditions and financial, business, competitive, legislative and regulatory factors as well as other factors affecting our company and industry, many of which are beyond our control.
Our failure to obtain the requisite stockholder approvals could adversely affect our liquidity and may result in our auditor issuing a “going concern” opinion, which would question our ability to continue as a going concern and could impair revenue and our ability to raise additional capital.
The $50 million in principal amount of 8.0% convertible notes we issued December 2014 would be convertible into an aggregate of approximately 20.47 million shares of our common stock. The related warrants represent the right to purchase an additional 11.25 million shares of our common stock. Under applicable New York Stock Exchange, or NYSE, rules unless we obtain stockholder approval we will only be permitted to issue an aggregate of approximately 9.4 million shares of common stock to settle the conversion of the notes and exercise of the warrants. This limitation represents 19.99% of the number of shares of our common stock outstanding on the day the note offering was priced. Unless and until we have stockholder approval to issue the full number of shares issuable on conversion of the notes and exercise of the warrants, (i) we will be required to satisfy our conversion obligation with respect to the notes by delivering a combination of cash and shares of our common stock with a specified dollar amount per $1,000 principal amount of notes of at least $1,000 for all notes submitted for conversion, and (ii) if the number of shares of common stock deliverable for the settlement amount in excess of the specified dollar amount would result in the issuance of shares in excess of the conversion share cap, then we will pay cash in lieu of the shares that otherwise would have been deliverable. Of the $50 million in principal amount of notes issued, $17 million in principal amount were issued to affiliates. Unless and until we have obtained the requisite stockholder approvals, conversions of affiliate notes will be required to be settled entirely in cash. With respect to our outstanding warrants, unless and until we have obtained the requisite stockholder approvals, we will be required to cash settle any exercises of warrants determined according to the formula set forth in the warrants. Moreover, because the cash settlement amount of the notes and warrants increases if our stock price increases, increases in our stock price would result in an increase in the amount we would have to pay upon conversion of the notes and exercise of the warrants. For example, prior to obtaining stockholder approval-or if we don’t obtain stockholder approval if the price of our common stock used for purposes of measuring the settlement amount of the notes and warrants were $4.00 per share, we would be obligated to issue approximately 5.3 million shares of our common stock and pay cash of approximately $65.1 million to settle full conversion of the notes and exercise of the warrants. . If the
40
price of our common stock used for these calculations were $5.00 per share, the amounts would be approximately 6.9 million shares and $83.3 million in cash.
As a result, if we do not receive the requisite stockholder approvals, we will require a substantial amount of cash to settle the conversion of the notes and exercise of the warrants which we may not have, and we may not be able to secure financing to meet these obligations.
In addition, if we do not obtain the requisite stockholder approvals, our independent certified public accountant could issue a “going concern” qualified opinion given the potential for the cash settlement obligations related to the notes and warrants exceeding our available resources. A "going concern" opinion could impair our ability to raise funds and may adversely impact our revenue and business if customers delay or discontinue purchases from us due to concerns about our viability. There can be no assurance that we will be successful in obtaining the requisite stockholder approvals.
The indenture governing the notes contains restrictions that limit our operating flexibility, and we may incur additional debt in the future that may include similar or additional restrictions.
The indenture governing the notes contains covenants that, among other things, restrict our and our existing and future subsidiaries’ ability to take specific actions, even if we believe them to be in our best interest. These covenants include restrictions on our ability to:
• | incur additional indebtedness and issue certain types of preferred stock; and |
• | limit the transfer of intellectual property to non-subsidiary guarantors. |
In addition, the related security documents impose restrictions on our ability to incur liens, other than permitted liens. These covenants and restrictions limit our operational flexibility and could prevent us from taking advantage of business opportunities as they arise, growing our business or competing effectively.
A breach of any of these covenants or other provisions in our debt agreements could result in an event of default, which if not cured or waived, could result in the notes or such debt becoming immediately due and payable. This, in turn, could cause any of our other debt to become due and payable as a result of cross-default or cross-acceleration provisions contained in the agreements governing such other debt. In the event that some or all of our debt is accelerated and becomes immediately due and payable, we may not have the funds to repay, or the ability to refinance, such debt.
The accounting method for the notes and the warrants could have a material effect on our reported financial results.
Upon stockholder approval to issue the full number of shares issuable on conversion of the notes and exercise of the warrants, the notes will be subject to Accounting Standards Codification 470-20, Debt with Conversion and Other Options, which we refer to as ASC 470-20. Under ASC 470-20, an entity must separately account for the liability and equity components of convertible debt instruments that may be settled entirely or partially in cash upon conversion in a manner that reflects the issuer’s economic interest cost. ASC 470-20 requires the liability component to be initially recognized in an amount equal to the fair value of similar nonconvertible debt and the difference between the proceeds of the convertible debt and the value allocated to the liability component is recorded as the initial carrying amount of the equity component (i.e., the conversion option). The effect of ASC 470-20 on the accounting for the notes will be that the equity component would be required to be included in the additional paid-in capital section of stockholders’ equity on our consolidated balance sheet, and the value of the equity component will be treated as original issue discount for purposes of accounting for the debt component of the notes. As a result, we will be required to record a greater amount of non-cash interest expense in current periods presented as a result of the
41
amortization of the discounted carrying value of the notes to their face amount over the term of the notes. We will report lower net income in our financial results because ASC 470-20 would require interest to include both the current period’s amortization of the debt discount and the instrument’s coupon interest, which could adversely affect our reported or future financial results, the trading price of our common stock and the trading price of the notes.
In addition, prior to our receipt of the requisite stockholder approvals, we will be required to cash or partially cash settle conversions of the notes and cash settle exercises of the warrants. As a result, we will be required to account for the conversion option embedded in the notes and the warrants (and any interest make-whole payment) as derivatives, meaning we will be recording gain or loss on a quarterly basis with regard to the mark-to-market value of those securities. This accounting treatment could have a material impact on, and could result in significant volatility in, our quarterly results of operations.
Under certain circumstances, convertible debt instruments that may be settled entirely or partly in cash (as the notes will be) may be accounted for utilizing the treasury stock method, the effect of which is that the shares issuable upon conversion of such convertible debt instruments are not included in the calculation of diluted earnings per share except to the extent that the conversion value of such convertible debt instruments exceeds their principal amount. Under the treasury stock method, for diluted earnings per share purposes, the transaction is accounted for as if the number of shares of common stock that would be necessary to settle such excess, if we elected to settle such excess in shares, are issued. However, we cannot be sure that the accounting standards in the future will continue to permit our use of the treasury stock method. If we are unable to use the treasury stock method in accounting for the shares issuable upon conversion of the notes, then our diluted earnings per share would be adversely affected.
The conditional conversion feature of the notes, if triggered, may adversely affect our financial condition and operating results.
In the event the conditional conversion feature of the notes is triggered, holders of notes will be entitled to convert the notes at any time during specified periods at their option. In addition, we will in certain circumstances make an interest make-whole payment to converting holders payable in cash prior to our receipt of the requisite stockholder approvals and payable in cash or shares of our common stock at our election following the requisite stockholder approvals. If one or more holders elect to convert their notes prior to our receipt of the requisite stockholder approvals, (i) with respect to notes other than affiliate notes, we will be required to satisfy our conversion obligation by delivering a combination of cash and shares of our common stock with a specified dollar amount per $1,000 principal amount of notes of at least $1,000 for all notes submitted for conversion and (ii) with respect to affiliate notes, we will be required to pay cash for the settlement amount of all affiliate notes submitted for conversion, and pay any applicable interest make-whole payment through the payment of cash, which could adversely affect our liquidity. Once we have obtained the requisite stockholder approvals, unless we elect to satisfy our conversion obligation by delivering solely shares of our common stock (other than cash in lieu of any fractional share) and pay any applicable interest make-whole payment in shares of our common stock, we would be required to settle a portion or all of our conversion obligation and the interest make-whole payment, if applicable, through the payment of cash, which could adversely affect our liquidity. In addition, even if holders do not elect to convert their notes, we could be required under applicable accounting rules to reclassify all or a portion of the outstanding principal of the notes as a current rather than long-term liability, which may result in a material reduction of our net working capital.
42
Subject to certain conditions and limitations, the indenture governing the notes permits us to incur a certain amount of additional indebtedness, including secured debt, and does not require us to maintain financial ratios or specified levels of net worth or liquidity; if we incur substantial additional indebtedness it may adversely affect our ability to make payments on the notes.
Subject to certain conditions and limitations, the indenture governing the notes will permit us to incur a certain amount of additional indebtedness, including secured debt, and will not require us to maintain financial ratios or specified levels of net worth or liquidity. We and our future and existing subsidiaries may be able to incur substantial additional debt in the future. If we incur substantial additional indebtedness in the future, these higher levels of indebtedness may affect our ability to pay the principal of and interest on the notes, or any fundamental change purchase price or any cash due upon conversion, and our creditworthiness generally.
We may not be permitted, by the agreements governing our future indebtedness, to pay any interest make-whole payment upon conversion of the notes in cash, requiring us to issue shares for such amounts, which could result in significant dilution to our stockholders.
On or after January 15, 2016, if, for at least 20 trading days (whether or not consecutive) during the 30 consecutive trading day period ending within five trading days prior to a conversion date, the last reported sale price of our common stock exceeds the applicable conversion price on each such trading day, we will in addition to certain consideration paid under the notes, pay any converting holder an interest make-whole payment in cash or common stock for the notes being converted. Prior to receipt of the requisite stockholder approvals, we must pay any interest make-whole in cash. After receipt of the requisite stockholder approvals, we will have the option to issue our common stock to any converting holder in lieu of making the interest make-whole payment in cash. If we elect to issue our common stock for such payment, then the stock will be valued at 95% of the simple average of the daily volume weighted average price of our common stock for the 10 trading days ending on and including the trading day immediately preceding the conversion date. Agreements governing our future indebtedness may prohibit us from making cash payments in respect of the interest make-whole amount upon a conversion.
We may not have the ability to repay the principal amount of the notes at maturity, to raise the funds necessary to settle conversions of the notes or to purchase the notes upon a fundamental change, and instruments governing our future debt may contain limitations on our ability to pay cash upon conversion or purchase of the notes.
At maturity, the entire outstanding principal amount of the notes will become due and payable by us. Holders of the notes will also have the right to require us to purchase their notes upon the occurrence of a fundamental change at a purchase price equal to 100% of the principal amount of the notes to be purchased, plus accrued and unpaid interest. In addition, unless we have obtained the requisite stockholder approvals and elected to deliver solely shares of our common stock to settle such conversion (other than cash in lieu of any fractional share), we will be required to make cash payments in respect of the notes being converted. However, we may not have enough available cash or be able to obtain financing at the time we are required to repay the principal amount of the notes, make purchases of notes surrendered therefor or settle conversions of the notes.
In addition, our ability to purchase the notes or to pay cash upon conversions of the notes may be limited by law, by regulatory authority or by agreements governing our future indebtedness. Our failure to repay the principal amount of the notes, purchase notes at a time when the purchase is required by the indenture or to pay any cash payable on future conversions of the
43
notes as required by the indenture would constitute a default under the indenture. A default under the indenture or the fundamental change itself could also lead to a default under agreements governing our future indebtedness including the Loan and Security Agreement. If the repayment of the related indebtedness were to be accelerated after any applicable notice or grace periods, we may not have sufficient funds to repay the indebtedness and purchase the notes or make cash payments upon conversions thereof.
The fundamental change provisions may delay or prevent an otherwise beneficial takeover attempt of us.
The fundamental change purchase rights, which will allow holders to require us to purchase all or a portion of their notes upon the occurrence of a fundamental change, as defined in the indenture relating to the notes, and the provisions requiring an increase to the conversion rate for conversions in connection with a make-whole fundamental change may in certain circumstances delay or prevent a takeover of us and the removal of incumbent management that might otherwise be beneficial to investors.
We expect that the trading price of the notes will be significantly affected by the market price of our common stock, which may be volatile, as well as the general level of interest rates and our credit quality.
The stock market in recent years has experienced significant price and volume fluctuations that have often been unrelated to the operating performance of companies. The market price of our common stock could fluctuate significantly for many reasons, including in response to the risks described in this section or for reasons unrelated to our operations, such as reports by industry analysts, investor perceptions or negative announcements by our customers, competitors or suppliers regarding their own performance, as well as industry conditions and general financial, economic and political instability. A decrease in the market price of our common stock would likely adversely impact the trading price of the notes. The market price of our common stock could also be affected by possible sales of our common stock by investors who view the notes as a more attractive means of equity participation in us and by hedging or arbitrage trading activity that may develop involving our common stock. This trading activity could, in turn, affect the trading prices of the notes.
We also cannot predict whether interest rates will rise or fall. During the term of the notes, interest rates will be influenced by a number of factors, most of which are beyond our control. Interest rate movements may adversely affect the value of the embedded conversion option and the trading price of the notes.
In addition, our credit quality may vary substantially during the term of the notes and will be influenced by a number of factors, including variations in our cash flows and the amount of indebtedness we have outstanding. Any decrease in our credit quality would likely negatively impact the trading price of the notes.
Future sales of our common stock in the public market could lower the market price for our common stock and adversely impact the trading price of the notes.
In the future, we may sell additional shares of our common stock to raise capital. In addition, a substantial number of shares of our common stock are reserved for issuance upon the exercise of stock options, restricted stock units and other equity awards, in connection with certain deferred purchase price obligations, and upon conversion of the notes. We cannot predict the size of future issuances or the effect, if any, that they may have on the market price for our common stock. The issuance and sale of substantial amounts of shares of our common stock, or the perception that such issuances and sales may occur, could
44
adversely affect the trading price of the notes and the market price of our common stock and impair our ability to raise capital through the sale of additional equity securities.
Item 1B. Unresolved Staff Comments
None.
Item 2. Properties
Our headquarters in Petaluma, California occupy approximately 39,000 square feet, increasing to approximately 58,000 square feet on or before August 1, 2016 under a lease that expires in 2025. We have also leased offices in San Francisco, California and Vancouver, Canada as well as additional offices for our sales and marketing personnel in certain locations. We believe that our current facilities are suitable and adequate to meet our current needs. We believe that suitable additional or substitute space will be available as needed to accommodate expansion of our operations.
Item 3. Legal Proceedings
On April 1, 2014 a purported stockholder class action lawsuit was filed in the Superior Court of California, County of San Francisco, against the Company, the members of our Board of Directors, our former Chief Financial Officer and the underwriters of our IPO. On April 30, 2014 a substantially similar lawsuit was filed in the same court against the same defendants. The two cases have been consolidated under the caption Beaver County Employees Retirement Fund, et al. v. Cyan, Inc. et al., Case No. CGC-14-539008. The consolidated complaint alleges violations of federal securities laws on behalf of a purported class consisting of purchasers of our common stock pursuant or traceable to the registration statement and prospectus for our IPO, and seek unspecified compensatory damages and other relief. In July 2014, the defendants filed a demurrer (motion to dismiss) to the consolidated complaint. On October 22, 2014, the court overruled the demurrer and allowed the case to proceed. We intend to defend the litigation vigorously. Based on information currently available, we have determined that the amount of any possible loss or range of possible loss is not reasonably estimable.
From time to time, we may be involved in various legal proceedings arising from the normal course of our business activities.
Item 4. Mine Safety Disclosures
Not applicable.
45
Part II.
Item 5. Market for Registrant’s Common Equity, Related Stockholder Matters and Issuer Purchases of Equity Securities
Market Information
Our common stock is currently traded on The New York Stock Exchange under the symbol “CYNI” since our initial public offering on May 9, 2013.
Price Range of Our Common Stock
The following table sets forth, for the periods indicated, the high and low sales prices of our common stock as reported on The New York Stock Exchange.
2014 | 2013 | |||||||||||||||
High | Low | High | Low | |||||||||||||
First quarter | $ | 5.34 | $ | 3.19 | N/A | N/A | ||||||||||
Second quarter (1) | $ | 4.74 | $ | 3.18 | $ | 15.05 | $ | 9.50 | ||||||||
Third quarter | $ | 4.43 | $ | 3.00 | $ | 11.39 | $ | 7.85 | ||||||||
Fourth quarter | $ | 3.40 | $ | 2.02 | $ | 10.10 | $ | 3.61 | ||||||||
(1) The period reported for the second quarter of 2013 is from May 9, 2013 (the date our common stock commenced trading on the New York Stock Exchange) through June 30, 2013.
The reported sale price for our common stock on The New York Stock Exchange was $4.14 per share on March 23, 2015.
Dividend Policy
We have never paid any cash dividends on our common stock. Our board of directors currently intends to retain any future earnings to support operations and to finance the growth and development of our business and does not intend to pay cash dividends on our common stock for the foreseeable future. Any future determination related to our dividend policy will be made at the discretion of our board of directors.
Holders of Record
As of March 23, 2015 there were 70 holders of record of our common stock. Because many of our shares of common stock are held by brokers or other institutions on behalf of stockholders, we are unable to estimate the number of beneficial owners.
Company Stock Performance
The following shall not be deemed “filed” for purposes of Section 18 of the Exchange Act, or incorporated by reference into any of our other filings under the Exchange Act or the Securities Act of 1933, as amended, except to the extent we specifically incorporate it by reference into such filing.
The following graph shows a comparison from May 9, 2013 (the date our common stock commenced trading on the New York Stock Exchange) through December 31, 2014, of the cumulative total return for our common stock, the NASDAQ Composite Index and the NASDAQ Telecommunications Index, and assumes the reinvestment of any dividends. The comparisons shown in the graph below are based upon historical data and are not intended to suggest future performance.
46
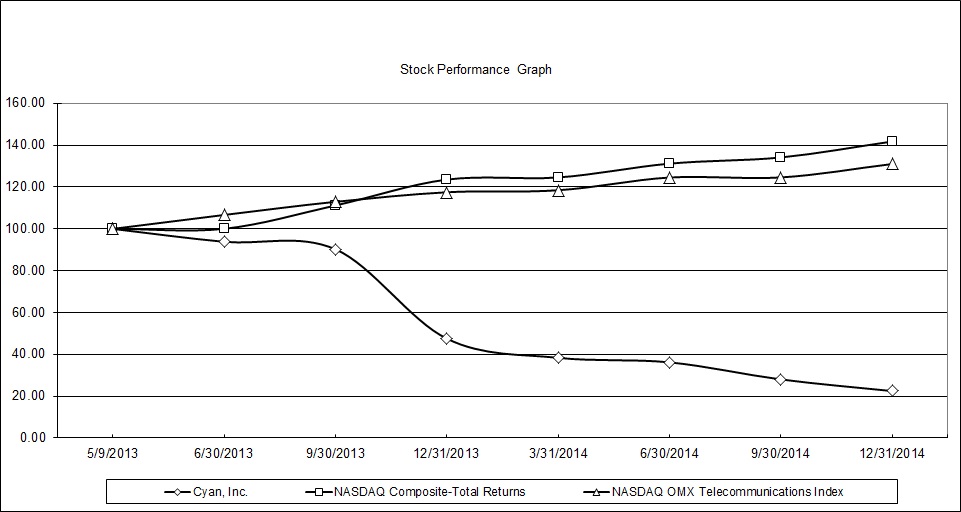
5/9/2013 | 6/30/2013 | 9/30/2013 | 12/31/2013 | 3/31/2014 | 6/30/2014 | 9/30/2014 | 12/31/2014 | |||||||||||||||||
Cyan, Inc. | $ | 100.00 | $ | 93.81 | $ | 90.22 | $ | 47.49 | $ | 38.33 | $ | 36.18 | $ | 28.01 | $ | 22.44 | ||||||||
NASDAQ Composite Index | $ | 100.00 | $ | 100.02 | $ | 111.22 | $ | 123.61 | $ | 124.57 | $ | 131.19 | $ | 134.13 | $ | 141.77 | ||||||||
NASDAQ Telecommunications Index | $ | 100.00 | $ | 106.65 | $ | 112.93 | $ | 117.48 | $ | 118.45 | $ | 124.54 | $ | 124.58 | $ | 131.01 | ||||||||
Sales of Unregistered Securities
In December 2014, we issued $50.0 million of 8.0% Convertible Senior Secured Notes due December 15, 2019 and related warrants to purchase up to an aggregate 11,250,000 shares of our common stock, in a private placement to qualified institutional buyers and accredited investors. For more information, please see Note 5 “Convertible Debt” of the Notes to the Consolidated Financial Statements included in Item 8 of this Annual Report on Form 10-K, which is incorporated herein by reference.
Use of Proceeds
In May, 2013, we closed our initial public offering (IPO) pursuant to which we sold 8,899,022 shares of our common stock, which includes 899,022 shares sold pursuant to the partial exercise by the underwriters of an over-allotment option, at a public offering price of $11.00 per share, resulting in net proceeds to us of approximately $87.2 million, after deducting underwriting discounts and commissions and offering expenses payable by us. Goldman, Sachs & Co., J.P. Morgan Securities LLC, Jefferies LLC, and Pacific Crest Securities LLC acted as underwriters. No payments were made by us to directors, officers or persons owning ten percent or more of our common stock or to their associates, or to our affiliates. We maintain the funds received in cash, cash equivalents and marketable securities. There has been no material change in the planned use of proceeds from our IPO as described in our final prospectus filed pursuant to Rule 424(b) with the Securities and Exchange Commission on May 9, 2013. From the effective date of the registration statement through December 31, 2014, we have used the net proceeds of the offering for working capital purposes and other general corporate purposes.
Purchases of Equity Securities by the Issuer and Affiliated Purchasers
None.
47
Item 6. Selected Financial Data
The following selected financial data should be read in conjunction with our audited consolidated financial statements and related notes thereto and with Management’s Discussion and Analysis of Financial Condition and Results of Operations, which are included in this Annual Report on Form 10-K. The consolidated statement of operations data for the years ended December 31, 2014, 2013 and 2012 and the selected consolidated balance sheet data as of December 31, 2014 and 2013 are derived from, and are qualified by reference to, the audited consolidated financial statements included in this Annual Report on Form 10-K. The consolidated statement of operations data for the year ended December 31, 2011 and 2010 and the consolidated balance sheet data as of December 31, 2012 and 2011 are derived from audited consolidated financial statements, which are not included in this Annual Report on Form 10-K. Our historical results are not necessarily indicative of the results that may be expected in the future.
Year Ended December 31, | |||||||||||||||||||
2014 | 2013 | 2012 | 2011 | 2010 | |||||||||||||||
(in thousands, except per share data) | |||||||||||||||||||
Revenue | $ | 100,483 | $ | 116,582 | $ | 95,872 | $ | 40,421 | $ | 23,484 | |||||||||
Cost of revenue (1) | 58,651 | 68,376 | 57,315 | 27,074 | 18,263 | ||||||||||||||
Gross profit | 41,832 | 48,206 | 38,557 | 13,347 | 5,221 | ||||||||||||||
Operating expenses (1): | |||||||||||||||||||
Research and development | 36,115 | 32,609 | 18,447 | 12,986 | 10,430 | ||||||||||||||
Sales and marketing | 43,565 | 40,102 | 25,243 | 12,825 | 7,919 | ||||||||||||||
General and administrative | 15,241 | 13,082 | 6,055 | 3,310 | 2,380 | ||||||||||||||
Restructuring charges | 627 | — | — | — | — | ||||||||||||||
Total operating expenses | 95,548 | 85,793 | 49,745 | 29,121 | 20,729 | ||||||||||||||
Loss from operations | (53,716 | ) | (37,587 | ) | (11,188 | ) | (15,774 | ) | (15,508 | ) | |||||||||
Other income (expense), net: | |||||||||||||||||||
Change in fair value of derivative and warrant liabilities | (4,710 | ) | — | — | — | — | |||||||||||||
Interest expense | (486 | ) | (367 | ) | (33 | ) | (419 | ) | (429 | ) | |||||||||
Other income (expense), net | (32 | ) | (2,635 | ) | (5,340 | ) | 322 | (406 | ) | ||||||||||
Total other income (expense), net | (5,228 | ) | (3,002 | ) | (5,373 | ) | (97 | ) | (835 | ) | |||||||||
Loss before provision for income taxes | (58,944 | ) | (40,589 | ) | (16,561 | ) | (15,871 | ) | (16,343 | ) | |||||||||
Provision for income taxes | 280 | 143 | 40 | 14 | 1 | ||||||||||||||
Net loss | $ | (59,224 | ) | $ | (40,732 | ) | $ | (16,601 | ) | $ | (15,885 | ) | $ | (16,344 | ) | ||||
Basic and diluted net loss per share (2) | $ | (1.26 | ) | $ | (1.32 | ) | $ | (6.60 | ) | $ | (6.63 | ) | $ | (7.54 | ) | ||||
Weighted-average number of shares used in computing basic and diluted net loss per share | 46,956 | 30,836 | 2,515 | 2,396 | 2,167 | ||||||||||||||
(1) Stock-based compensation included in the statements of operations data above was as follows (in thousands):
Year ended December 31, | ||||||||||||||||||||
2014 | 2013 | 2012 | 2011 | 2010 | ||||||||||||||||
Cost of revenue | $ | 378 | $ | 160 | $ | 57 | $ | 73 | $ | — | ||||||||||
Research and development | 3,800 | 2,348 | 745 | 338 | 57 | |||||||||||||||
Sales and marketing | 3,701 | 2,165 | 656 | 229 | 66 | |||||||||||||||
General and administrative | 2,674 | 2,576 | 639 | 125 | 72 | |||||||||||||||
Total stock-based compensation | $ | 10,553 | $ | 7,249 | $ | 2,097 | $ | 765 | $ | 195 | ||||||||||
(2) See Note 9 to our audited consolidated financial statements for an explanation of the calculations of our basic and diluted net loss per share of common stock.
48
Year ended December 31, | ||||||||||||||||
2014 | 2013 | 2012 | 2011 | |||||||||||||
Consolidated Balance Sheet Data | (in thousands) | |||||||||||||||
Cash and cash equivalents | $ | 47,740 | $ | 32,509 | $ | 20,221 | $ | 25,740 | ||||||||
Short-term restricted cash | 4,165 | — | — | — | ||||||||||||
Marketable securities | — | 31,639 | — | — | ||||||||||||
Working capital | 63,368 | 72,193 | 13,919 | 26,703 | ||||||||||||
Property and equipment, net | 11,896 | 11,155 | 6,485 | 3,791 | ||||||||||||
Long-term restricted cash | 7,868 | — | — | — | ||||||||||||
Total assets | 115,675 | 121,520 | 70,789 | 43,528 | ||||||||||||
Total debt | 18,498 | 5,000 | 12,563 | 45 | ||||||||||||
Total deferred revenue | 7,491 | 19,093 | 17,417 | 5,219 | ||||||||||||
Derivative and warrant liabilities | 36,280 | — | — | — | ||||||||||||
Preferred stock warrant liability | — | — | 6,254 | 900 | ||||||||||||
Redeemable convertible preferred stock | — | — | 98,133 | 98,133 | ||||||||||||
Total stockholders' equity (deficit) | 29,944 | 78,937 | (83,055 | ) | (68,675 | ) | ||||||||||
49
Item 7. MANAGEMENT’S DISCUSSION AND ANALYSIS OF FINANCIAL CONDITION AND RESULTS OF OPERATIONS
The following discussion contains forward-looking statements, including, without limitation, our expectations and statements regarding our outlook and future revenues, expenses, results of operations, liquidity, plans, strategies and objectives of management and any assumptions underlying any of the foregoing. Our actual results may differ significantly from those projected in the forward-looking statements. Our forward-looking statements and factors that might cause future actual results to differ materially from our recent results or those projected in the forward-looking statements include, but are not limited to, those discussed in the section titled “Forward-Looking Information” and “Risk Factors” of this Annual Report on Form 10-K. Except as required by law, we assume no obligation to update the forward-looking statements or our risk factors for any reason.
Overview
We have pioneered innovative, carrier-grade networking solutions that transform disparate and inefficient legacy networks into open, high-performance networks. Our solutions include high-capacity, multi-layer switching and transport platforms as well as a carrier-grade software-defined networking platform for network virtualization and control. Our solutions enable network operators to virtualize their networks, accelerate service delivery and increase scalability and performance, while reducing costs. We have designed our solutions to enable a variety of existing and emerging applications, including business Ethernet, wireless backhaul, broadband backhaul, cloud connectivity, bandwidth on demand and network functions virtualization (NFV).
Our Z-Series is a high-capacity, multi-layer switching and transport platform designed to support the multiple concurrent technologies used in regional and metro networks, including both Ethernet-based services as well as optical services. The Z-Series platform is architected to transport traffic over the most efficient network layer, utilizing both electrical and optical domains, to enable network operators to maximize network capacity at the lowest cost per bit. Our solutions are designed to support a variety of use cases from traffic aggregation at the network edge to multi-terabit switching optimized for handoff at the network core.
Our Blue Planet platform is a carrier-grade software-defined network (SDN) and NFV orchestration software platform built to address network operator requirements for network virtualization, management and control. Blue Planet is multi-function in that it is designed to simplify the management, deployment and orchestration of hardware and software elements from us or third-party vendors based on our customers’ requirements. To date, sales of our Z-Series platforms have accounted for substantially all of our revenue. Standalone sales of Blue Planet have accounted for an immaterial amount of our revenue and are expected to increase only modestly as a portion of our revenue in the near term. However, we expect that the portion of our revenue derived from standalone sales of Blue Planet will increase over the longer term.
Our customers range from service providers to high-performance data center and large, private network operators. Our solutions have been deployed primarily across North America, as well as in Asia and Europe.
Since inception, our revenue has been derived primarily from customers located in the United States. For the years ended December 31, 2014, 2013 and 2012 our largest customer was Windstream, which accounted for approximately 29%, 39% and 45% of our revenue. Additionally, Colt represented approximately 11% of our revenue for the year ended December 31, 2014 and TDS represented approximately 11% of our revenue for the year ended December 31, 2013. No other customers represented more than 10% of our revenue for the years ended December 31, 2014, 2013 and 2012.
In addition, approximately 13%, 13% and 9% of our revenue for the year ended December 31, 2014, 2013 and 2012 was attributable to Independent Operating Companies, (IOCs) and other telecommunications network providers that used government-supported loan programs or grants to fund purchases from us. Changes to or elimination of similar government programs have occurred in the past and are likely to occur in the future. To the extent that any of our customers have received grants or loans under government stimulus programs, but no longer have access to such assistance, they may substantially reduce or curtail future purchases of our solutions.
Revenue from customers located outside of the United States was approximately 22%, 9% and 5% of our revenue for the years ended December 31, 2014, 2013 and 2012. We expect the percentage of our revenue derived from international sales to fluctuate from period-to-period in the near term but to increase in the longer term.
Our customers have historically purchased our solutions using a pay-as-you-grow approach that begins with a targeted product purchase to address specific services or portions of their networks and expands over time to additional product purchases as they experience the benefits of our solutions. The sales cycle for a new customer deployment, from the time of
50
prospect qualification to the completion of the first sale, may span multiple quarters if not years. Typically, after we have completed an initial customer deployment, we experience much shorter sales cycles.
We have historically employed a direct sales model. During 2012, we began to transition to a mixed sales channel approach, complementing our direct sales force with a channel distribution strategy in international markets. We expect to generate an increasing portion of our international sales through this network of channel partners in future periods.
We intend to continue to invest in our sales force, field operations and support capacity, and deepen our engagement with channel partners and establish relationships with new channel partners to target our existing core markets. We plan to target emerging customer verticals with use cases well suited to the benefits of our solutions, including cloud and content providers, educational institutions, large data center networks, governments, cable MSOs as well as enterprises that build and operate large, private networks.
We outsource the manufacturing of our Z-Series platforms. Our outsourced manufacturing model allows us to scale our business without the significant capital investment and ongoing expenses required to establish and maintain manufacturing operations. Our Z-Series platforms leverage industry standard components, and we work closely with our contract manufacturer and key suppliers to manage the procurement, quality and cost of these components. We seek to maintain an optimal level of finished goods inventory to meet our forecasted sales and accommodate unanticipated shifts in sales volume and mix while at the same time minimizing cash outflow.
We believe that our technological advantages will continue to support our growth and demand for our solutions. However, our business may be affected by future challenging economic conditions, decreased availability of capital for network infrastructure projects, or failure of the market for Blue Planet to develop. In addition, capital spending in our industry is cyclical and sporadic, can change on short notice and can fluctuate in response to outside factors such as the availability of government stimulus assistance. As a result, changes in spending behavior in any given quarter or during any economic downturn can reduce our revenue. Spending on network construction, maintenance, expansion and upgrades is also affected by seasonality, delays in the purchasing cycles and reductions in budgets of network operators. Finally, we may face direct and indirect risks as a result of our international operations, including expenses of doing business in multiple jurisdictions, differing regulatory environments, foreign currency fluctuations and varying collection practices.
Liquidity and Capital Resources - 2014 Notes & Warrants Offering
We require a significant amount of cash resources to operate our business. For example, in the nine months ended September 2014, we used approximately $35.2 million of cash, cash equivalents and marketable securities, including $30.4 million used in operating activities. At September 30, 2014, we had cash, cash equivalents and marketable securities of $28.9 million. At the time of the offering, given our forecasted levels of revenue, expenses and capital expenditures, we believed that our existing cash, cash equivalents and marketable securities, together with our cash collections would be sufficient to meet our projected operating and capital expenditure requirements through the first quarter of 2015. We undertook the notes and warrants offering in the fourth quarter of 2014 in order to provide us with the working capital needed to continue to operate our business beyond the first quarter of 2015.
Based upon the successful offering of the notes and related warrants in December 2014, in addition to an improvement in our business environment for the fourth quarter of 2014 and into the first quarter of 2015, we believe that we have adequate capital resources for at least the next 12 months.
How We Generate Revenue
We generate revenue primarily from selling our Z-Series platforms, licensing our Blue Planet software-defined networking solutions and providing various professional services.
Cyan Z-Series
Our Z-Series hardware is a family of high-capacity, multi-layer switching and transport platforms. Each Z-Series platform is comprised of a chassis that supports a variety of interchangeable Z-Series line cards to provide a wide range of network applications. Our customers make an initial purchase of chassis and line cards to address their particular network deployment needs, then typically make subsequent purchases of line cards and/or larger chassis as the capacity and service needs of their networks evolve. The majority of our revenue is generated from sales of our Z-Series platforms. We generally recognize product revenue at the time of shipment provided that all other revenue recognition criteria have been met.
Cyan Blue Planet
In December 2012, we launched Blue Planet, our carrier-grade SDN and NFV platform that is designed to allow network operators of all types to manage their multi-vendor network and simplify the development, deployment and orchestration of scalable services over high-performance networks. In 2014 we introduced the ability to orchestrate virtual resources and functions and chain those to the physical network to streamline service creation and deployment. Blue Planet is available to customers regardless of whether they have deployed our Z-Series platforms in their networks. Customers may purchase Blue Planet using standard configurations to address common network needs or may customize their implementations by pairing the Blue Planet orchestration layer with their own selection of applications and element adapters. We offer Blue Planet on a variety of models. Where we sell Blue Planet on a term license basis or on a software-as-a-service (SaaS) basis deployed from the cloud, we invoice customers for the entire contract amount at the start of the contract term, which will lead to the majority of these invoiced amounts being treated as deferred revenue that will be recognized ratably over the term of the contract. While term-based licenses currently make up the majority of related revenues, we occasionally license software to customers on a perpetual basis with on-going support and maintenance services. Revenue from software that functions together with the tangible hardware elements to deliver the tangible products’ essential functionality is generally recognized upon shipment assuming all other revenue recognition criteria are met. Revenue from application software and related software elements which are not considered essential to the functionality of hardware is accounted for in accordance with software industry guidance, and therefore is recognized ratably over the longest service period for post-contract customer support (PCS) and professional services as we have not established VSOE for software or the related software elements.
CyNOC Professional Services
Our CyNOC offering is a network operations center service through which we monitor, and, in some cases, manage our customers’ multi-vendor networks. Additionally, a number of our customers which maintain their own internal NOC leverage our services as a backup NOC. These services are typically sold to our customers for a one-year term at the time of the initial product sale and renewed on an annual basis thereafter.
Maintenance, Support, Training and Professional Services
We offer a range of services, including hardware installation and software and hardware maintenance and support, to provide a variety of customer service products and support through our technical support engineers as well as through our growing network of authorized and certified channel partners. These services are sold to our customers at the time of the initial product sale, typically for one-year terms that customers may choose to renew for successive annual or multi-year periods. These services are invoiced separately at the time of the initial product sale.
We also provide training and other professional services to our end-customers, including services related to the implementation, use, functionality and ongoing maintenance of our products. These services are invoiced separately when the services are delivered.
Deferred Revenue
Our deferred revenue consists of amounts that have been invoiced but that have not yet been recognized as revenue as of the period end, pending completion of the revenue recognition process. Our deferred revenue was $7.5 million and $19.1 million as of December 31, 2014 and December 31, 2013. The majority of our deferred revenue at December 31, 2013 consisted of amounts related to sales of our Z-Series platforms, and related primarily to shipped and billed hardware awaiting customer acceptance. The remainder consisted primarily of term license, support and maintenance revenue that is recognized ratably over the contractual service period. At December 31, 2014, the majority of our deferred revenue related to term license, support and maintenance revenue that is recognized ratably over the contractual service period. We monitor our deferred revenue balance because it represents a significant portion of revenue to be recognized in future periods. Over the longer term, we expect that the proportion of our deferred revenue relating to Blue Planet will increase relative to Z-Series related deferred revenue. In most cases, we expect to invoice our customers at the start of the Blue Planet license term, which will lead to the majority of these invoiced amounts being treated as deferred revenue and recognized ratably over the term of the contract or the associated maintenance period.
Components of Operating Results
Revenue
Our revenue has historically grown rapidly since our inception, increasing from $40.4 million in the year ended December 31, 2011, to $116.6 million in the year ended December 31, 2013. However, our revenue for 2014 fell below the level attained in 2013 to $100.5 million due to a number of factors, the most significant of which was a reduction in spending by our largest customer Windstream.
51
Costs of Revenue
Cost of revenue primarily consists of manufacturing costs of our products payable to our contract manufacturer. Our cost of revenue also includes third-party manufacturing and supply chain logistics costs, provisions for excess and obsolete inventory, warranty costs, hosting costs, certain allocated costs for facilities, depreciation and other expenses associated with logistics and quality control. Additionally, it includes salaries, benefits and stock-based compensation for personnel directly involved with manufacturing, installation, and certain support services.
Gross Margin
Gross margin, or gross profit as a percentage of revenue, has been and will continue to be affected by a variety of factors. In the near term, we generally expect gross margin to remain relatively flat as our continued efforts and those of our contract manufacturer to manage our supply chain and raw materials pricing and scale efficiencies in our production model are offset against general marketplace price pressure. In the longer term, we expect that the market adoption of Blue Planet, and the resulting increase in Blue Planet revenue as a percentage of our revenue, will contribute to increases in gross margin. From time to time, however, we may experience lower gross margin in any particular period as a result of large initial deployments. These deployments typically include a significant proportion of lower-margin Z-Series chassis. As our customers expand their networks after large initial deployments, they typically purchase additional higher-margin line cards.
Operating Expenses
Operating expenses consist of research and development, sales and marketing, and general and administrative expenses. Personnel-related costs, including stock-based compensation, commission and bonus, are the most significant component of each of these expense categories. The timing and number of additional hires has and could materially affect our operating expenses, both in absolute dollars and as a percentage of revenue, in any particular period.
Research and Development. Research and development expense consists primarily of personnel and consultant costs. Research and development expense also includes costs for prototypes, lab supplies, product certification, travel, depreciation, recruiting and allocated costs for certain facilities costs.
Sales and Marketing. Sales and marketing expense consists primarily of personnel costs including commission costs. We expense commission costs as incurred. Sales and marketing expense also includes the costs of consultants, trade shows, marketing programs, promotional materials, demonstration equipment, travel, depreciation, recruiting and allocated costs for certain facilities costs.
General and Administrative. General and administrative expense consists of personnel costs, professional services costs as well as allocated costs for certain facilities costs. General and administrative personnel include our executive, finance, human resources, IT and legal organizations. Professional services consist primarily of legal, auditing, accounting, and other consulting costs.
Restructuring Charges. Restructuring charges relate to a restructuring plan announced in November 2014 aimed at reducing the Company's annual operating expenses by an amount in the range of $10 million to $13 million and reducing its operating loss. The restructuring activities primarily involved the elimination of certain full time and contract positions and the related severance costs. The majority of individuals impacted by the restructuring left the Company by December 31, 2014.
52
Stock-Based Compensation
Stock-based compensation expense was $10.6 million, $7.2 million and $2.1 million for the years ended December 31, 2014, 2013 and 2012. We expect to continue to incur significant stock-based compensation expense and anticipate further growth in stock-based compensation expense as we expect stock-based compensation to continue to play an important part in the overall compensation structure for our employees.
Stock-based compensation included in the statements of operations data above was as follows (in thousands):
Year ended December 31, | |||||||||||
2014 | 2013 | 2012 | |||||||||
Cost of revenue | $ | 378 | $ | 160 | $ | 57 | |||||
Research and development | 3,800 | 2,348 | 745 | ||||||||
Sales and marketing | 3,701 | 2,165 | 656 | ||||||||
General and administrative | 2,674 | 2,576 | 639 | ||||||||
Total stock-based compensation | $ | 10,553 | $ | 7,249 | $ | 2,097 | |||||
Significant Factors, Assumptions and Methodologies Used in Determining Fair Value
Prior to our initial public offering in May 2013, the fair values of the common stock underlying share-based payment awards had been determined by the board of directors, with input from management. In the absence of a publicly traded market for the Company's common stock, the board of directors determined the fair value of the common stock in accordance with the guidelines outlined in the American Institute of Certified Public Accountants Practice Guide, Valuation of Privately-Held-Company Equity Securities Issued as Compensation.
We determined a business enterprise value of our company by taking a weighted combination of the enterprise values calculated under two valuation approaches, an income approach and a market approach.
The income approach estimates the present value of future estimated debt-free cash flows, based upon forecasted revenue and costs. These discounted cash flows were added to the present value of our estimated enterprise terminal value, the multiple of which was derived from comparable company market data. These future cash flows were discounted to their present values using a rate corresponding to our estimated weighted average cost of capital. The discount rate was derived from an analysis of the weighted average cost of capital of our publicly-traded peer group as of the valuation date and was adjusted to reflect the risk inherent in our cash flows.
The market approach estimates the fair value of a company by applying to that company the market multiples of comparable publicly-traded companies. We calculated a multiple of key metrics implied by the enterprise values or acquisition values of our publicly-traded peers. Based on the range of these observed multiples, we applied judgment in determining an appropriate multiple to apply to our metrics in order to derive an indication of value.
Other income (expense), net
Change in fair value of derivative and warrant liabilities. In December 2014, the Company issued $50.0 million aggregate principal amount of 8.0% convertible senior notes due December 15, 2019 (the Notes). The Notes include a conversion option, including contingent conversion, a make-whole conversion adjustment, and certain interest features which are accounted for as a single compound embedded derivative (the Compound Embedded Derivative). In connection with the issuance of the notes we also issued certain warrants. We have classified the Compound Embedded Derivative Liability and warrants as derivative liabilities. They are recorded at fair value and are subject to re-measurement at each balance sheet date. We will recognize any change in fair value in our statements of operations.
Interest Expense. Interest expense consists of interest on our notes payable and convertible debt as well as amortization of loan fees. In December 2012, we established a loan facility consisting of a revolving loan facility and a term loan facility governed by a Loan and Security Agreement with Silicon Valley Bank (SVB). In December 2014, we paid the then outstanding balance of approximately $3.4 million under the SVB loan facility and terminated the facility.
Interest expense on our 8.0% notes represents the coupon interest together with the non-cash interest expense resulting from the accretion of the debt discount.
53
Other Income (Expense), Net. Prior to our IPO, other income (expense), net consisted primarily of the change in fair value of our preferred stock warrant liability offset in part by interest income. Upon the closing of the IPO, the preferred stock warrant liability was reclassified from current liabilities to additional paid-in capital. We performed the final re-measurement of the warrant in May 2013 in connection with completion of the IPO.
Provision for Income Taxes
Provision for income taxes consists primarily of state franchise and minimum taxes in the United States and income taxes in foreign jurisdictions in which we conduct business. Due to the uncertainty as to the realization of the benefits of our domestic deferred tax assets (including net operating loss carryforwards and research and development and other tax credits), we have a full valuation allowance reserved against such assets. We expect to maintain this full valuation allowance in the near term. We also expect our provision for income taxes to increase in future years.
Our corporate structure includes legal entities located in jurisdictions with income tax rates lower than the U.S. statutory tax rate. Our intercompany arrangements allocate income to such entities in accordance with arm’s-length principles and commensurate with functions performed, risks assumed and ownership of corporate assets. This includes the manner in which we develop and use our intellectual property as well as the transfer pricing of intercompany transactions.
As of December 31, 2014 we had $108.1 million of federal and $84.1 million of state net operating loss carryforwards available to reduce future taxable income. These net operating loss carryforwards begin to expire in 2026 for U.S. federal income tax and 2015 for state income tax purposes. Our ability to use our net operating loss carryforwards to offset any future taxable income may currently, or in the future be subject to limitations in the event that we experience a change of ownership as defined by Section 382 of the Internal Revenue Code of 1986, as amended, (Internal Revenue Code). We established a full valuation allowance to offset net deferred tax assets as of December 31, 2014, 2013 and 2012 due to the uncertainty of generating sufficient future taxable income.
Critical Accounting Policies and Estimates
Our consolidated financial statements are prepared in accordance with U.S. generally accepted accounting principles (GAAP). These accounting principles require us to make certain estimates and judgments that can affect the reported amounts of assets and liabilities as of the date of the consolidated financial statements, as well as the reported amounts of revenue and expenses during the periods presented. We believe that the estimates and judgments upon which we rely are reasonable based upon information available to us at the time that these estimates and judgments are made. To the extent there are material differences between these estimates and actual results, our consolidated financial statements could be adversely affected.
The accounting policies that reflect our more significant estimates, judgments and assumptions and which we believe are the most critical to aid in fully understanding and evaluating our reported financial results include the following: revenue recognition, lease receivables, inventory valuation, warranty, income taxes and stock-based compensation. Our critical accounting policies have been discussed with the Audit Committee of the Board of Directors.
Revenue Recognition — Revenue is recognized when all of the following criteria are met:
• | Persuasive evidence of an arrangement exists. Customer purchase orders, along with master purchase contracts, where applicable, are generally used to determine the existence of an arrangement. |
• | Delivery has occurred. Shipping documents and customer acceptance, when applicable, are used to verify delivery. |
• | The price is fixed or determinable. We assess whether the price is fixed or determinable based on the payment terms associated with the transaction and whether the sales price is subject to refund or adjustment. |
• | Collectability is reasonably assured. We assess collectability based primarily on the creditworthiness of the customer as determined by credit checks and analysis, as well as the customer’s payment history. |
We derive revenue primarily from the sales of our hardware and software products as well as professional services. Shipping charges billed to customers are included in revenue.
From time to time, we offer customers sales incentives, including discounts. Revenue is recorded net of these amounts.
Customer payment terms generally range from 30 to 90 days. We generally do not offer extended payment terms.
54
A portion of our sales in 2013 were made through multi-year lease agreements. These lease agreements included a bargain purchase option and met the criteria for treatment as sales-type leases. Under sales-type leases, we recognized revenue for our hardware products, net of post-installation product maintenance and technical support, at the net present value of the lease payment stream at the point in time the lessee had the right to use the underlying asset. We optimized our cash flows by selling a majority of these lease receivables to third party financing organizations on a non-recourse basis in the quarter they arose. Aside from our standard product warranty, which is provided in the normal course of business, we had no obligation to the third party financing organizations once the lease receivables were sold. The related lease receivables were derecognized upon their sale since we neither retained a substantial risk of default by the lessee nor did we provide any guarantee of residual value of the underlying leased equipment. At December 31, 2013 the lease receivable balance was $0.6 million and by the end of the first quarter of 2014 the remaining lease receivables were sold.
In general, our products and services qualify as separate units of accounting. Products are typically considered delivered upon shipment. In certain cases, our products are sold along with services, which include installation, training, remote network monitoring services, post-sales software support, software-as-a-service (SaaS) based subscriptions, and/or extended warranty services. Post-sales software support includes rights, on a when-and-if-available basis, to receive unspecified software product upgrades to embedded software or our management software; maintenance releases; and patches released during the term of the support contract. This type of transaction is considered a multiple-element arrangement. When accounting for multiple-element arrangements, GAAP requires us to allocate revenue to individual elements using vendor-specific objective evidence (VSOE), third-party evidence (TPE), or our best estimated selling price (BESP) of deliverables if VSOE or TPE cannot be determined.
Multiple-element arrangements can include any combination of products and services. When allocating consideration, we will first do so on the basis of the deliverables’ relative selling prices, without regard to any contingent consideration, and then subsequently determine whether the revenue that may be recognized is limited based on the amount of non-contingent revenue. To the extent that the stated contractual prices agree to our estimated selling price on a standalone basis, the allocation of the consideration is based on stated contractual prices. However, if the stated contractual price for any deliverable is outside a narrow range of the estimated selling price on a standalone basis, the allocation is adjusted using the “relative-selling-price method.” Generally, the individual products and services meet the criteria for separate units of accounting and we recognize revenue for each element upon delivery of the element.
We have not yet established VSOE for all deliverables in our arrangements with multiple elements. When VSOE cannot be established, we attempt to establish the selling price of each element based upon TPE by evaluating the pricing of similar and interchangeable competitor products or services in standalone arrangements. However, as our products contain a significant element of proprietary technology and offer substantially different features and functionality from competitors, we have not been able to obtain comparable standalone pricing information with respect to competitors’ products. Therefore, we have historically not been able to obtain reliable evidence of TPE.
When we are unable to establish a selling price using VSOE or TPE, we use BESP. The objective of BESP is to determine the price at which we would transact a sale if the element was sold on a standalone basis.
We determine BESP for an element by considering multiple factors, including, but not limited to, geographies, market conditions, competitive landscape, internal costs, gross margin objectives, characteristics of targeted customers, and pricing practices. The determination of BESP is made through consultation with and formal approval by management, taking into consideration the go-to-market strategy. We regularly review VSOE, TPE, and BESP and have a process for the establishment and updating of these estimates.
Post-sales software support revenue and extended warranty services revenue are deferred and recognized ratably over the period during which the services are to be performed. Installation and training service revenues are recognized upon delivery or completion of performance. These service arrangements are typically short-term in nature and are largely completed shortly after delivery of the product.
We also deliver Blue Planet to customers most frequently on a term license basis, with terms typically ranging from 12 to 36 months. While term-based licenses make up the majority of related revenues, we occasionally license software to customers on a perpetual basis with on-going support and maintenance services. Revenue from software that functions together with the tangible hardware elements to deliver the tangible products’ essential functionality is generally recognized upon shipment assuming all other revenue recognition criteria are met. Revenue from Blue Planet, which is not considered essential to the functionality of hardware, is accounted for in accordance with software industry guidance and therefore is recognized ratably over the longest service period for post-contract customer support (PCS) and professional services as we have not established VSOE for Blue Planet or the related software elements.
55
In instances where substantive acceptance provisions are specified in the customer agreement, revenue is deferred until all acceptance criteria have been met. Our arrangements generally do not include any provisions for cancellation, termination or refunds that would materially impact revenue recognition.
We enter into arrangements with certain customers who receive government supported loans and grants from the U.S. Department of Agriculture’s Rural Utility Service (RUS) to finance capital spending. Under the terms of an RUS equipment contract that includes installation services, the customer does not take possession and control and the title does not pass until formal acceptance is obtained from the customer. Under this type of arrangement, we do not recognize revenue until it has received formal acceptance from the customer and all other revenue recognition criteria have been met.
When our products have been delivered but the product revenue associated with the arrangement has been deferred as a result of not meeting the revenue recognition criteria, the related product costs are also deferred and included in deferred costs in the accompanying consolidated balance sheets.
Derivative liabilities — Our 8.0% Notes include a conversion option, including contingent conversion, a make-whole conversion adjustment, and certain interest features which are accounted for as a single compound embedded derivative (the Compound Embedded Derivative). We have determined that this feature is an embedded derivative and have recognized the fair value of this liability on our balance sheet, with subsequent changes to fair value recorded through earnings at each reporting period in our statements of operations as a change in fair value of derivative liabilities. The fair value of the Compound Embedded Derivative was determined based on a binomial lattice model.
We issued detachable warrants in conjunction with issuing the Notes. The warrants are classified as derivative liabilities and recorded at fair value. These derivative liabilities are subject to re-measurement at each balance sheet date and we recognize any change in fair value in our statements of operations. The fair value of each warrant is estimated by utilizing a Black-Scholes option-pricing model
Lease Receivables — During the year ended December 31, 2013 we provided lease arrangements for one customer. We classified these arrangements as lease receivables, which represented sales-type leases resulting from the sale of our products. Lease receivables consisted of arrangements with this customer, which generally have three-year terms. We retained title to the underlying assets for the term of the lease or until the point in time at which the lease receivable was sold to a third party financing organization. Aside from standard product warranty, which is provided in the normal course of business, we have no obligation to the third party financing organizations once the lease receivables have been sold. Pursuant to such a sale, if we retain no substantial risk of default by the lessee nor provide any guarantee of residual value of the underlying leased equipment, then the related lease receivables will be derecognized.
Inventories — Inventories consisting of finished goods purchased from the contract manufacturer are stated at the lower of cost or market value, with cost being determined using standard cost, which approximates actual cost, on a first-in, first-out basis. We regularly monitor inventory quantities on hand and on order and record write-downs as a component of cost of revenue for excess and obsolete inventories based on our estimate of the demand for our products, potential obsolescence of technology, product life cycles and whether pricing trends or forecasts indicate that the carrying value of inventory exceeds its estimated selling price. These factors are affected by market and economic conditions, technology changes, and new product introductions and require estimates that may include elements that are uncertain. This evaluation requires significant judgment and is based on the factors discussed above. Actual demand may differ from forecasted demand and may have a material effect on gross margins. If inventory is written down, a new cost basis will be established that cannot be increased in future periods.
Warranties — We generally offer limited warranties for our hardware products for periods of one to ten years. We recognize estimated costs related to warranty activities as a component of cost of revenue upon product shipment. The estimates are based upon historical product failure rates and historical costs incurred in correcting product failures. The recorded amount is adjusted from time to time for specifically identified warranty exposures. This evaluation requires significant judgment and is based on the factors discussed above. Actual warranty expenses are charged against our estimated warranty liability when incurred. Factors that affect our liability include the number of installed units, historical and anticipated rates of warranty claims and the cost per claim.
Additionally, we offer separately priced extended warranty contracts for coverage beyond the standard warranty period. We expense all warranty costs as incurred related to such extended warranty contracts.
Income Taxes — We use the asset and liability method of accounting for income taxes. Under this method, deferred tax assets and liabilities are determined based on the temporary differences between the financial reporting and tax basis of assets and liabilities using enacted tax rates in effect for the years in which the differences are expected to reverse. The effect on deferred tax assets and liabilities of a change in tax laws is recognized in the consolidated statement of operations in the
56
period that includes the enactment date. Valuation allowances are established when necessary to reduce deferred income tax assets to the amounts more-likely-than-not expected to be realized.
As part of the process of preparing the consolidated financial statements, we are required to estimate income tax expense and uncertain tax positions in each of the tax jurisdictions in which we operate. This process involves estimating current income tax expense together with assessing temporary differences in the treatment of items for tax purposes versus financial accounting purposes that may create net deferred tax assets and liabilities. We rely on estimates and assumptions in preparing our income tax provision.
We are subject to periodic audits by the Internal Revenue Service and other taxing authorities. We recognize the tax benefit of an uncertain tax position only if it is more-likely-than-not that the position is sustainable upon examination by the taxing authority based on the technical merits. The tax benefit recognized is measured as the largest amount of benefit which is greater than 50 percent likely to be realized upon settlement with the taxing authority. We recognize interest accrued and penalties related to unrecognized tax benefits in the income tax provision.
Stock–Based Compensation — We measure and recognize stock-based compensation expense in the financial statements for all share-based payment awards made to employees and directors based on the estimated fair values on the date of grant using the Black- Scholes option-pricing model.
Prior to our initial public offering in May 2013, the fair values of the common stock underlying share-based payment awards was determined by the board of directors, with input from management and a third-party valuation specialist. In the absence of a publicly traded market for our common stock, the board of directors determined the fair value of the common stock in accordance with the guidelines outlined in the American Institute of Certified Public Accountants Practice Guide, Valuation of Privately-Held-Company Equity Securities Issued as Compensation.
We determine the fair value of a share based payment award on the date of grant using the Black-Scholes option pricing model which is affected by assumptions regarding a number of subjective variables. These variables include our expected stock price volatility over the expected term of the awards, risk-free interest rates and expected dividends. The expected term represents the period that the award is expected to be outstanding. The expected term of stock options was estimated based on the simplified method that takes into consideration the vesting and contractual terms. Volatility is estimated based on the average of the historical volatilities of the common stock of our peer group in the industry in which we do business, with characteristics similar to those of ours. We use the U.S. Treasury yield for the risk-free interest rate and a dividend yield of zero, as we do not issue dividends.
In addition to assumptions used in the Black-Scholes option pricing model, we must also estimate a forfeiture rate to calculate the stock-based compensation of awards. The estimated forfeiture rate is based on an analysis of actual forfeitures and will continue to be evaluated based on actual forfeiture experience, analysis of employee turnover behavior and other factors. Further, to the extent that the actual forfeiture rate is different from this estimate, which could be material, stock-based compensation is adjusted accordingly.
New Accounting Pronouncements
In May 2014, the Financial Accounting Standards Board (FASB) issued Accounting Standards Update (ASU) No. 2014-09, Revenue from Contracts with Customers (Topic 606) (ASU 2014-09), which provides guidance for revenue recognition. ASU 2014-09 supersedes the revenue recognition requirements in Topic 605, Revenue Recognition, and most industry-specific guidance. Additionally, it supersedes some cost guidance included in Subtopic 605-35, Revenue Recognition-Construction-Type and Production-Type Contracts, and creates new Subtopic 340-40, Other Assets and Deferred Costs-Contracts with Customers. The standard’s core principle is that a company will recognize revenue when it transfers promised goods or services to customers in an amount that reflects the consideration to which the company expects to be entitled in exchange for those goods or services. In doing so, companies will need to use more judgment and make more estimates than under the previous guidance. These may include identifying performance obligations in the contract, estimating the amount of variable consideration to include in the transaction price and allocating the transaction price to each separate performance obligation. ASU 2014-09 requires retrospective application by either a “full retrospective” adoption in which the standard is applied to all of the periods presented or a “modified retrospective” adoption for fiscal years beginning after December 15, 2016. The standard will be effective for us in the first quarter of fiscal 2017. Early adoption is not permitted. We have not selected a transition method and are currently assessing the potential impact on our financial statements from adopting this new guidance.
In August 2014 the FASB issued ASU 2014-15, Disclosure of Uncertainties about an Entity’s Ability to Continue as a Going Concern. The ASU is intended to define management’s responsibility to evaluate whether there is substantial doubt
57
about an organization’s ability to continue as a going concern and to provide related footnote disclosures. For all entities, the ASU is effective for annual periods ending after December 15, 2016 and interim periods within annual periods beginning after December 15, 2016. The standard will be effective for us in the first quarter of fiscal 2017. Early adoption is permitted. We are currently assessing the potential impact on our financial statements from adopting this new guidance.
Results of Operations
The following tables set forth our results of operations for the periods presented and as a percentage of our revenue for those periods. The period-to-period comparison of our financial results is not necessarily indicative of our future results.
Year Ended December 31, | |||||||||||
2014 | 2013 | 2012 | |||||||||
(in thousands, except per share data) | |||||||||||
Revenue | $ | 100,483 | $ | 116,582 | $ | 95,872 | |||||
Cost of revenue | 58,651 | 68,376 | 57,315 | ||||||||
Gross profit | 41,832 | 48,206 | 38,557 | ||||||||
Operating expenses: | |||||||||||
Research and development | 36,115 | 32,609 | 18,447 | ||||||||
Sales and marketing | 43,565 | 40,102 | 25,243 | ||||||||
General and administrative | 15,241 | 13,082 | 6,055 | ||||||||
Restructuring charges | 627 | — | — | ||||||||
Total operating expenses | 95,548 | 85,793 | 49,745 | ||||||||
Loss from operations | (53,716 | ) | (37,587 | ) | (11,188 | ) | |||||
Other income (expense), net: | |||||||||||
Change in fair value of derivative and warrant liabilities | (4,710 | ) | — | — | |||||||
Interest expense | (486 | ) | (367 | ) | (33 | ) | |||||
Other income (expense), net | (32 | ) | (2,635 | ) | (5,340 | ) | |||||
Total other expense, net | (5,228 | ) | (3,002 | ) | (5,373 | ) | |||||
Loss before provision for income taxes | (58,944 | ) | (40,589 | ) | (16,561 | ) | |||||
Provision for income taxes | 280 | 143 | 40 | ||||||||
Net loss | $ | (59,224 | ) | $ | (40,732 | ) | $ | (16,601 | ) | ||
Basic and diluted net loss per share | $ | (1.26 | ) | $ | (1.32 | ) | $ | (6.60 | ) | ||
Weighted-average number of shares used in computing basic and diluted net loss per share | 46,956 | 30,836 | 2,515 | ||||||||
58
Year Ended December 31, | ||||||||
2014 | 2013 | 2012 | ||||||
Revenue | 100.0 | % | 100.0 | % | 100.0 | % | ||
Cost of revenue | 58.4 | % | 58.7 | % | 59.8 | % | ||
Gross profit | 41.6 | % | 41.3 | % | 40.2 | % | ||
Operating expenses: | ||||||||
Research and development | 35.9 | % | 28.0 | % | 19.2 | % | ||
Sales and marketing | 43.4 | % | 34.4 | % | 26.4 | % | ||
General and administrative | 15.2 | % | 11.2 | % | 6.3 | % | ||
Restructuring charges | 0.6 | % | — | % | — | % | ||
Total operating expenses | 95.1 | % | 73.6 | % | 51.9 | % | ||
Loss from operations | (53.5 | )% | (32.3 | )% | (11.7 | )% | ||
Other income (expense), net: | ||||||||
Change in fair value of derivative and warrant liabilities | (4.7 | )% | — | % | — | % | ||
Interest expense | (0.5 | )% | (0.3 | )% | — | |||
Other income (expense), net | — | % | (2.3 | )% | (5.6 | )% | ||
Total other expense, net | (5.2 | )% | (2.6 | )% | (5.6 | )% | ||
Loss before provision for income taxes | (58.7 | )% | (34.9 | )% | (17.3 | )% | ||
Provision for income taxes | 0.2 | % | 0.1 | % | — | |||
Net loss | (58.9 | )% | (35.0 | )% | (17.3 | )% | ||
Revenue
Year ended December 31, | |||||||||||
2014 | 2013 | 2012 | |||||||||
(dollars in thousands) | |||||||||||
Revenue | $ | 100,483 | $ | 116,582 | $ | 95,872 | |||||
Revenue decreased by $16.0 million, or 13.7%, from the year ended December 31, 2013 to the year ended December 31, 2014. The decline was primarily due to a $16.2 million decrease in revenue from our largest customer and our inability to offset a substantial majority of that decline with increases in revenue from other customers. Overall, our U.S. revenue declined by $27.7 million, or 26.1%, from 2013 to 2014. This decline was partially offset by an increase in our international revenue of $11.6 million or 114% from 2013 to 2014. Our revenue in 2014 and 2013 was substantially related to sales of our Z-Series platforms.
Revenue increased by $20.7 million, or 21.6%, from the year ended December 31, 2012 to the year ended December 31, 2013. This increase was primarily attributable to increased unit shipments of our Z-Series platforms.
Approximately 22%, 9% and 5% of our revenue for the years ended December 31, 2014, 2013 and 2012 were attributable to customers located outside the United States. We continue to expand into international locations and introduce our products in new markets and expect international revenue to increase in dollar amount over time.
We believe that the continued growth in bandwidth demand and increased acceptance of our software-defined networking technology and our high-capacity, multi-layer switching and transport platforms, as an alternative to router-based architecture, will drive our long-term revenue growth. We anticipate our first quarter 2015 revenue will be higher than the revenue we recorded in the fourth quarter of 2014 and that our revenue for 2015 as a whole will exceed the revenue we recorded for 2014 as a whole. Our revenue growth, however, is susceptible to quarter-to-quarter fluctuations. For example, revenue in the fourth quarter of 2013 declined by $16.8 million, or 45%, from the level achieved in the third quarter of 2013. This decline was primarily a result of decreased revenue from our largest customer as well as lower than anticipated revenue from other customers that had largely depleted their 2013 capital budgets.
59
Cost of Revenue, Gross Profit and Gross Margin
Year ended December 31, | |||||||||||
2014 | 2013 | 2012 | |||||||||
(dollars in thousands) | |||||||||||
Cost of Revenue | $ | 58,651 | $ | 68,376 | $ | 57,315 | |||||
Gross Profit | $ | 41,832 | $ | 48,206 | $ | 38,557 | |||||
Gross Margin | 41.6 | % | 41.3 | % | 40.2 | % | |||||
Cost of revenue decreased by $9.7 million, or 14.2%, and gross profit decreased by $6.4 million, or 13%, for the year ended December 31, 2014 from the year ended December 31, 2013, corresponding to the decreased revenue. Gross margin increased by 0.3% to 41.6% from 41.3%, for the year ended December 31, 2014 as compared to the year ended December 31, 2013.
Cost of revenue increased by $11.1 million, or 19.3%, and gross profit increased by $9.6 million, or 25.0%, for the year ended December 31, 2013 from the year ended December 31, 2012, corresponding to the increased revenue. Gross margin increased by 1.1% to 41.3% from 40.2%, for the year ended December 31, 2013 as compared to the year ended December 31, 2012.
We anticipate our gross margins will fluctuate from period to period depending on the product mix sold, large initial deployments as well as other factors including provisions for warranty, inventory excess and obsolescence charges and the level of revenue experienced in any particular period.
Research and Development
Year ended December 31, | |||||||||||
2014 | 2013 | 2012 | |||||||||
(dollars in thousands) | |||||||||||
Research and development | $ | 36,115 | $ | 32,609 | $ | 18,447 | |||||
Percent of total revenue | 35.9 | % | 28.0 | % | 19.2 | % | |||||
Research and development expense increased by $3.5 million, or 10.8%, from the year ended December 31, 2013 to the year ended December 31, 2014. The increase was primarily due to an increase in personnel-related costs of $3.1 million (including a $1.5 million increase in stock-based compensation) to support continued investment in Blue Planet and our Z-Series platforms. An additional component of the increase included an increase in depreciation of $0.9 million related to enhanced lab infrastructure, partially offset by decreases in prototype and lab supplies of $0.3 million and travel and entertainment expenses of $0.3 million.
Research and development expense increased by $14.2 million, or 76.8%, from the year ended December 31, 2012 to the year ended December 31, 2013. This increase was primarily due to an increase in personnel-related costs of $9.3 million (including a $1.6 million increase in stock-based compensation) resulting from an increase in headcount of 42, or 43%, primarily to support continued investment in Blue Planet and our Z-Series platforms. Additional components of the increase include an increase in consulting and outside services of $2.5 million.
In the near term, we expect our research and development expenses to be somewhat lower as a result of our restructuring efforts, both in absolute terms and as a percent of revenue.
60
Sales and Marketing
Year ended December 31, | |||||||||||
2014 | 2013 | 2012 | |||||||||
(dollars in thousands) | |||||||||||
Sales and Marketing | $ | 43,565 | $ | 40,102 | $ | 25,243 | |||||
Percent of total revenue | 43.4 | % | 34.4 | % | 26.4 | % | |||||
Sales and marketing expense increased by $3.5 million, or 8.6%, from the year ended December 31, 2013 to the year ended December 31, 2014 primarily due to an increase of $4.9 million (including a $1.5 million increase in stock-based compensation) in personnel-related expenses. We also experienced increases in marketing expenses of $0.3 million partially offset by decreases in professional services of $0.9 million, travel and related expenses of $0.3 million and bad debt expense of $0.6 million.
Sales and marketing expense increased by $14.9 million, or 58.9%, from the year ended December 31, 2012 to the year ended December 31, 2013 primarily due to an increase of $8.8 million (including a $1.5 million increase in stock-based compensation) in personnel-related expenses due to the expansion of our sales force. To drive increasing revenue, we increased our sales and marketing headcount by 48 from December 31, 2012 to December 31, 2013, representing an increase of 52%. We also experienced increases in marketing and advertising expenses of $1.7 million and travel and related expenses of $1.6 million as we continue to expand into international locations and introduce our products in new markets.
In the near term, we expect our sales and marketing expenses to be somewhat lower both in absolute terms and as a percent of revenue.
General and Administrative
Year ended December 31, | |||||||||||
2014 | 2013 | 2012 | |||||||||
(dollars in thousands) | |||||||||||
General and administrative | $ | 15,241 | $ | 13,082 | $ | 6,055 | |||||
Percent of total revenue | 15.2 | % | 11.2 | % | 6.3 | % | |||||
General and administrative expense increased by $2.2 million, or 16.5%, from the year ended December 31, 2013 to the year ended December 31, 2014. The increase was primarily due to a $0.8 million increase in accounting, legal, and outside services expenses. Additional components of the increase included personnel-related expenses of $0.7 million including a $0.1 million increase in stock-based compensation as well as increases in corporate expenses including insurance of $0.6 million.
General and administrative expense increased by $7.0 million, or 116.1%, from the year ended December 31, 2012 to the year ended December 31, 2013. The increase was primarily due to increased personnel-related expenses of $3.6 million (including a $1.9 million increase in stock-based compensation). We increased our general and administrative headcount by 6 from December 31, 2012 to December 31, 2013, representing an increase of 30%. This increase in general and administrative headcount related to hiring of additional executive and other administrative employees to support our growth and our public company reporting obligations. Additional components of the increase included increases in accounting, legal and consulting related expenses of $2.3 million.
We expect our general and administrative expenses to be somewhat lower in the near term both in absolute amount and as a percent of revenue.
61
Restructuring Charges
Year ended December 31, | |||||||||||
2014 | 2013 | 2012 | |||||||||
(dollars in thousands) | |||||||||||
Restructuring charges | $ | 627 | $ | — | $ | — | |||||
Percent of total revenue | 0.6 | % | — | % | — | % | |||||
Restructuring charges in the year ended December 31, 2014 relates to a restructuring plan announced in November 2014 aimed at reducing our annual operating expenses by an amount in the range of $10 million to $13 million as well as reducing our operating loss. The restructuring activities primarily involved the elimination of certain full time and contract positions. As substantially all affected employees had left the Company by December 31, 2014, we do not expect any additional charges related to these restructuring efforts.
Change in fair value of derivative and warrant liabilities
Year ended December 31, | |||||||||||
2014 | 2013 | 2012 | |||||||||
(dollars in thousands) | |||||||||||
Change in fair value of derivative and warrant liabilities | $ | (4,710 | ) | $ | — | $ | — | ||||
We have classified the Compound Embedded Derivative liability and warrants associated with our 8.0% Notes as derivative liabilities and recorded them at fair value. These derivative liabilities are subject to re-measurement at each balance sheet date and we recognize any change in fair value in our statements of operations. The change in the fair value of these derivative liabilities of $4.7 million for the year ended December 31, 2014 is due primarily to the increase in value of our common stock from the date the Company issued the 8.0% notes on December 12, 2014 or $2.30 to the balance sheet date of December 31, 2014 or $2.50.
In the future, the change in fair value of derivative and warrant liabilities resulting from changes in the fair market value of our common stock could be significant. For example, the fair market value of our common stock at December 31, 2014, was $2.50 which resulted in a charge of $4.7 million. If the fair market value on that date had been $3.50, the charge in the fourth quarter would have been $29.2 million.
Interest Expense
Year ended December 31, | |||||||||||
2014 | 2013 | 2012 | |||||||||
(dollars in thousands) | |||||||||||
Interest expense | $ | (486 | ) | $ | (367 | ) | $ | (33 | ) | ||
Interest expense for the year ended December 31, 2014 related to obligations under our revolving and term loans, which were entered into during December 2012, as well as the Notes entered into in December 2014. As of December 31, 2014, our revolving and term loans were fully repaid and the arrangements had been terminated. As of December 31, 2014, the company had $18.5 million outstanding of convertible debt, net of discount. The effective interest rate applicable to the debt balance is 48.9%. The difference between this interest rate and the Notes’ 8.0% coupon rate will be accreted to the debt balance over the 5-year term of the Notes.
Interest expense for the year ended December 31, 2013 related to obligations under or term loans. As of December 31, 2013 we had a $5.0 million term loan balance. This amount was fully repaid as of December 31, 2014. Interest expense for the years ended December 31, 2012 related to our notes payable, which matured and were fully repaid in the first quarter of 2012.
62
Other Income (Expense), Net
Year ended December 31, | |||||||||||
2014 | 2013 | 2012 | |||||||||
(dollars in thousands) | |||||||||||
Interest income | $ | 175 | $ | 79 | 33 | ||||||
Preferred stock warrant liabilities | — | (2,602 | ) | (5,354 | ) | ||||||
Foreign currency | (39 | ) | (82 | ) | (20 | ) | |||||
Other | (168 | ) | (30 | ) | 1 | ||||||
Other Income (expense), net | $ | (32 | ) | $ | (2,635 | ) | $ | (5,340 | ) | ||
Other income (expense), net decreased to an expense of $32 thousand for the year ended December 31, 2014 from an expense of $2.6 million for the year ended December 31, 2013. The decrease was primarily due to the absence in 2014 of preferred stock warrants, which upon completion of the Company's IPO in May 2013, were re-classed to additional paid-in capital.
Other income (expense), net changed to an expense of $2.6 million for the year ended December 31, 2013 from an expense of $5.3 million for the year ended December 31, 2012 primarily due to the change in value of the preferred stock warrant liabilities.
63
Quarterly Results of Operations
The following table sets forth our unaudited quarterly consolidated statement of operations data for each of the eight quarters ended December 31, 2014. In management’s opinion, the data has been prepared on the same basis as the audited consolidated financial statements included in this Annual Report on Form 10-K, and reflects all necessary adjustments, consisting only of normal recurring adjustments, necessary for a fair presentation of this data. This data should be read in conjunction with our audited consolidated financial statements and related notes included elsewhere in this Annual Report on Form 10-K. The results of historical periods are not necessarily indicative of the results of operations for a full year or any future period.
Three Months Ended | |||||||||||||||||||||||||||||||
Mar. 31, | June 30, | Sept. 30, | Dec. 31, | Mar. 31, | June 30, | Sept. 30, | Dec. 31, | ||||||||||||||||||||||||
2013 | 2013 | 2013 | 2013 | 2014 | 2014 | 2014 | 2014 | ||||||||||||||||||||||||
(in thousands, except per share data) | |||||||||||||||||||||||||||||||
Revenue | $ | 26,319 | $ | 31,686 | $ | 37,694 | $ | 20,883 | $ | 19,038 | $ | 24,392 | $ | 26,599 | $ | 30,454 | |||||||||||||||
Cost of revenue | 15,402 | 17,936 | 22,605 | 12,433 | 11,615 | 14,268 | 15,684 | 17,084 | |||||||||||||||||||||||
Gross profit | 10,917 | 13,750 | 15,089 | 8,450 | 7,423 | 10,124 | 10,915 | 13,370 | |||||||||||||||||||||||
Operating expenses: | |||||||||||||||||||||||||||||||
Research and development | 7,239 | 8,158 | 9,220 | 7,992 | 9,472 | 9,620 | 8,856 | 8,167 | |||||||||||||||||||||||
Sales and marketing | 8,017 | 10,821 | 10,518 | 10,746 | 11,029 | 11,331 | 10,515 | 10,690 | |||||||||||||||||||||||
General and administrative | 2,863 | 3,095 | 3,895 | 3,229 | 4,563 | 3,711 | 3,531 | 3,436 | |||||||||||||||||||||||
Restructuring charges | — | — | — | — | — | — | — | 627 | |||||||||||||||||||||||
Total operating expenses | 18,119 | 22,074 | 23,633 | 21,967 | 25,064 | 24,662 | 22,902 | 22,920 | |||||||||||||||||||||||
Loss from operations | (7,202 | ) | (8,324 | ) | (8,544 | ) | (13,517 | ) | (17,641 | ) | (14,538 | ) | (11,987 | ) | (9,550 | ) | |||||||||||||||
Other income (expense), net | (2,127 | ) | (743 | ) | (42 | ) | (90 | ) | (109 | ) | (91 | ) | 363 | (5,391 | ) | ||||||||||||||||
Loss before provision for income taxes | (9,329 | ) | (9,067 | ) | (8,586 | ) | (13,607 | ) | (17,750 | ) | (14,629 | ) | (11,624 | ) | (14,941 | ) | |||||||||||||||
Provision for income taxes | 21 | 21 | 25 | 76 | 50 | 43 | 88 | 99 | |||||||||||||||||||||||
Net loss | $ | (9,350 | ) | $ | (9,088 | ) | $ | (8,611 | ) | $ | (13,683 | ) | $ | (17,800 | ) | $ | (14,672 | ) | $ | (11,712 | ) | $ | (15,040 | ) | |||||||
Basic and diluted net loss per share | $ | (3.61 | ) | $ | (0.33 | ) | $ | (0.19 | ) | $ | (0.29 | ) | $ | (0.38 | ) | $ | (0.31 | ) | $ | (0.25 | ) | $ | (0.32 | ) | |||||||
Weighted-average number of shares used in computing basic and diluted net loss per share | 2,593 | 27,425 | 46,262 | 46,412 | 46,636 | 46,882 | 47,076 | 47,220 | |||||||||||||||||||||||
Stock-based compensation included in the statements of operations data above was as follows (in thousands):
Three Months Ended | |||||||||||||||||||||||||||||||
Mar. 31, | June 30, | Sept. 30, | Dec. 31, | Mar. 31, | June 30, | Sept. 30, | Dec. 31, | ||||||||||||||||||||||||
2013 | 2013 | 2013 | 2013 | 2014 | 2014 | 2014 | 2014 | ||||||||||||||||||||||||
Cost of revenue | $ | 29 | $ | 31 | $ | 61 | $ | 39 | $ | 60 | $ | 113 | $ | 96 | $ | 109 | |||||||||||||||
Research and development | 401 | 511 | 773 | 663 | 915 | 1,021 | 955 | 909 | |||||||||||||||||||||||
Sales and marketing | 313 | 560 | 571 | 721 | 798 | 957 | 1,008 | 938 | |||||||||||||||||||||||
General and administrative | 319 | 738 | 793 | 726 | 742 | 676 | 600 | 656 | |||||||||||||||||||||||
Total stock-based compensation | $ | 1,062 | $ | 1,840 | $ | 2,198 | $ | 2,149 | $ | 2,515 | $ | 2,767 | $ | 2,659 | $ | 2,612 | |||||||||||||||
Liquidity and Capital Resources
We had cash and cash equivalents of $47.7 million at December 31, 2014. Cash and cash equivalents consist of cash and money market funds. In addition we had $12.0 million in restricted cash at December 31, 2014 of which $7.9 million is classified as long term.
64
On December 12, 2014, we issued $50.0 million aggregate principal amount of 8.0% Convertible Senior Secured Notes due December 15, 2019 and related warrants. The notes bear interest at a rate of 8.0% per year, payable semi-annually in arrears on June 15 and December 15 of each year. The notes will mature on December 15, 2019, unless earlier converted, redeemed or purchased. The notes are convertible into shares of our common stock at a conversion price of $2.44 per share, which represents an 18% premium to our closing stock price on December 4, 2014, the date of pricing of the offering, pursuant to certain terms as specified in detail below. The notes are convertible at any time on and after January 15, 2016 subject to certain exceptions for specified corporate transactions as described below. Aggregate offering expenses in connection with the transaction, including the placement agent's fee of $2.3 million, were approximately $3.5 million, resulting in net proceeds of $46.5 million. We used approximately $3.4 million to repay in full borrowings under our then existing secured credit facility with SVB and terminated the facility. As part of the transaction, we deposited approximately $12.0 million of the aggregate principal amount of convertible notes sold pursuant to the offering into an escrow account to fund, when due, the first six interest payments on the notes, which are due on a semi-annual bases. The remainder of the net proceeds will be used for general corporate purposes, including for working capital and capital expenditures.
During the year ended December 31, 2013 we provided lease arrangements for one qualified end-user customer. We classified these arrangements as lease receivables, which represent sales-type leases resulting from the sale of our products. Lease receivables consist of arrangements with this customer and generally have three-year terms. As of December 31, 2014 and 2013, we had zero and $0.6 million of lease receivables.
From our inception through our initial public offering in May 2013, we financed our operations and capital expenditures primarily through private sales of redeemable convertible preferred stock for aggregate net proceeds of $98.1 million, as well as through a commercial credit facility and capital leases. In May 2013 we completed our initial public offering, generating net proceeds of $87.2 million.
We borrowed approximately $6.0 million under a commercial lender growth capital credit facility and various other promissory note agreements to finance hardware and software product development from 2008 to 2009. These borrowings were repaid at various dates through January 2012.
On December 21, 2012, we entered into a Loan and Security Agreement with Silicon Valley Bank. The agreement provided a revolving loan facility of up to $10.0 million and a term loan facility of up to $5.0 million, for a total loan facility of up to $15.0 million. Loans drawn under the Loan and Security Agreement were used for working capital and general corporate purposes. As of December 31, 2014, we had no outstanding debt from this agreement. As of December 31, 2013, we had drawn down $5.0 million as term loans and zero and as revolving loans. This loan balance was fully repaid during 2014 and we terminated the credit facility in December 2014.
We believe that our existing cash and cash equivalents, together with our expected cash flow from operations, will be sufficient to meet our projected operating and capital expenditure requirements for at least the next 12 months.
The following table summarizes our cash flows (in thousands):
Year ended December 31, | |||||||||||
2014 | 2013 | 2012 | |||||||||
Net cash used in operations | $ | (42,101 | ) | $ | (30,557 | ) | $ | (12,463 | ) | ||
Net cash provided by (used in) investing activities | 15,261 | (38,250 | ) | (5,698 | ) | ||||||
Net cash provided by financing activities | 42,156 | 81,160 | 12,634 | ||||||||
Effect of exchange rates on cash and cash equivalents | (85 | ) | (65 | ) | 8 | ||||||
Net increase (decrease) in cash and cash equivalents | $ | 15,231 | $ | 12,288 | $ | (5,519 | ) | ||||
Operating Activities
In the year ended December 31, 2014 we used cash in operations of $41.3 million. Cash used in operations resulted from a net loss of $59.2 million, which was partially offset by $10.6 million in non-cash stock-based compensation, a $4.7 million non-cash charge related to the change in fair value of derivative and warrant liabilities, and $3.6 million of depreciation and amortization. The net change in operating assets and liabilities at December 31, 2014 compared to December 31, 2013 was $2.3 million. This included an $8.2 million decrease in our inventory balance as we were successful in our efforts to better utilize our inventory to fulfill our sales volume during the year. Accounts payable and accrued expenses increased by approximately $4.7 million, primarily as a result of timing of payments to our contract manufacturer. This was offset by a
65
decrease in deferred revenue net of deferred costs of $4.6 million in 2014 compared to 2013 primarily related to acceptance being received from customers with contracts under federal broadband stimulus programs and a $9.0 million increase in accounts receivable related to the increase in revenue in the fourth quarter of 2014 compared to the fourth quarter of 2013.
In the year ended December 31, 2013, we used cash in operations of $30.6 million primarily as a result of a net loss of $40.7 million, partially offset by $12.6 million in non-cash depreciation and amortization, stock-based compensation and revaluation of preferred stock warrants. The net change in operating assets and liabilities at December 31, 2013 compared to December 31, 2012 was $2.7 million. This included an increase in inventories of $7.7 million as we prepared to meet anticipated customer demand, a portion of which did not materialize in the fourth quarter of 2013. Accounts payable decreased by approximately $2.8 million, primarily as a result of timing of payments to our contract manufacturer. This was partially offset by an increase in deferred revenue of $1.7 million which primarily relates to shipped and billed hardware awaiting formal acceptance from customers with contracts under federal broadband stimulus programs. Accounts receivable decreased by approximately $4.6 million mainly due to decreased revenue in the fourth quarter of 2013, as well as to the collection of a large receivable in the fourth quarter of 2013. Additionally, accrued compensation increased by $1.2 million as we increased total headcount.
In the year ended December 31, 2012, we used cash in operations of $12.5 million primarily as a result of a net loss of $16.6 million, partially offset by $9.3 million in non-cash depreciation and amortization, stock-based compensation and revaluation of preferred stock warrants. In addition, we experienced increases in a majority of our working capital accounts, primarily due to significant increases in our operations as a result of growth in the business. Accounts receivable increased $12.7 million, primarily due to the significant increase in shipments and billings and inventories increased $8.2 million as we prepared for increases in shipments to customers based on demand for our products. These changes were partially offset by an increase in deferred revenue of $12.2 million, partially offset by an increase in deferred costs of $5.9 million related to such deferred revenue. In addition, accounts payable and accrued liabilities increased approximately $7.6 million, primarily as a result of significant inventory purchases and timing of payments of invoices from our contract manufacturer. Additionally, accrued compensation increased by $2.3 million as we increased total headcount.
Investing Activities
In the year ended December 31, 2014, cash used in investing activities primarily related to purchases of marketable securities and capital expenditures, such as lab equipment, tooling and computer hardware to support our business. Marketable securities consist of U.S. treasury securities, U.S. government-sponsored agency securities, commercial paper, corporate bonds and municipal bonds. Generally, our marketable securities have maturity dates up to two years from our date of purchase, and active markets for these securities exist. Cash provided by investing activities in the year ended December 30, 2014 was $15.3 million and primarily related to $31.7 million proceeds from the maturity and sale of marketable securities, net of purchases, partially offset by capital expenditures of $4.3 million. In addition, at December 31, 2014, we had a restricted cash balance of $12.0 million related the Notes.
In the year ended December 31, 2013, we used $31.6 million to purchase marketable securities and $6.1 million for capital expenditures, for total cash used for investing activities of $38.3 million.
In the year ended December 31, 2012, we used $5.7 million in cash for investing activities primarily related to the purchase of lab equipment, tooling and computer hardware to support our growth.
Financing Activities
In the year ended December 31, 2014, cash provided by financing activities was $42.2 million. In December 2014, the convertible debt offering provided $47.7 million of net proceeds. During the year we paid off our term loan of $5.0 million and used $0.7 million to pay taxes on restricted stock units that were net-share settled. This cash usage was partially offset by $0.5 million in proceeds from the exercise of stock options.
In the year ended December 31, 2013, cash provided by financing activities was $81.2 million. In May 2013, we completed our initial public offering which generated aggregate net proceeds of $87.2 million, net of underwriting discounts and commissions and offering costs. This was partially offset by repayment of $7.6 million outstanding under our revolving loan facility. Additionally, we received $1.4 million proceeds from the exercise of stock options and preferred stock warrants during the year ended December 31, 2013.
66
In the year ended December 31, 2012, cash provided by financing activities reflected proceeds of $12.6 million related to a $7.6 million draw on our newly established revolving loan facility, a $5.0 million draw on our newly established term loan facility and $116,000 from the exercise of stock options.
Contractual Obligations and Commitments
We lease our headquarters in Petaluma, California and other locations worldwide under non-cancelable operating leases that expire at various dates through 2025. In addition, we subcontract with other companies to manufacture and supply components for our products. During the normal course of business, our contract manufacturer procures components from suppliers based on our forecasts. If we cancel all or part of the orders, we will be liable to our contract manufacturer for the cost of the components purchased by the subcontractors to manufacture our products. We periodically review this potential liability and, as of December 31, 2014, we had no significant related accruals recorded. Our financial position and results of operations could be negatively impacted if we are required to compensate our contract manufacturer for any unrecorded liabilities incurred.
In April 2007 we entered into a lease for our headquarters facility in Petaluma, California. As amended to date, the 2007 lease provides for the lease of 18,895 square feet and expires in 2025. As of December 31, 2014, our total remaining obligations under the 2007 lease were $6.0 million. In July 2013, we entered into a lease for an additional 20,005 square feet of space in Petaluma, California, increasing by a further 18,773 square feet in 2016. The 2013 lease expires concurrently with the 2007 lease in 2025. Total remaining obligations under the 2013 lease are $11.5 million with payments starting in 2015. We have an option to extend the term of both leases for an additional five-year period.
In December 2014, we issued $50.0 million aggregate principal amount of 8.0% Convertible Senior Secured Notes due December 15, 2019, as described above.
The following table summarizes our fixed and determinable contractual obligations at December 31, 2014 including leases:
Total | Less Than 1 Year | 1-3 Years | 3-5 Years | More Than 5 Years | |||||||||||||||
(in thousands) | |||||||||||||||||||
Operating lease obligations | $ | 18,064 | $ | 1,294 | $ | 3,217 | $ | 3,603 | $ | 9,950 | |||||||||
Convertible debt (1) | 70,825 | 4,165 | 8,330 | 58,330 | — | ||||||||||||||
Purchase commitments (2) | 9,706 | 9,706 | — | — | — | ||||||||||||||
Total | $ | 98,595 | $ | 15,165 | $ | 11,547 | $ | 61,933 | $ | 9,950 | |||||||||
(1) Represents repayment of principal and interest over the five-year term of the convertible debt.
(2) Consists of minimum purchase commitments with our contract manufacturer.
Prior to obtaining-or if we do not obtain-stockholder approval to fully settle the conversion of our convertible notes and exercise of the related warrants, we would be required to settle these obligations in cash. Because the cash settlement amount of the notes and warrants increases if our stock price increases, increases in our stock price would result in an increase in the amount we would have to pay upon conversion of the notes and exercise of the warrants. For example, prior to obtaining stockholder approval-or if we don’t obtain stockholder approval if the price of our common stock used for purposes of measuring the settlement amount of the notes and warrants were $4.00 per share, we would be obligated to issue approximately 5.3 million shares of our common stock and pay cash of approximately $65.1 million to settle full conversion of the notes and exercise of the warrants. If the price of our common stock used for these calculations were $5.00 per share, the amounts would be approximately 6.9 million shares and $83.3 million in cash.
Future Capital Requirements
We believe that our existing cash and cash equivalents, together with our expected cash flow from operations, will be sufficient to meet our projected operating and capital expenditure requirements for at least the next 12 months. To the extent that our cash, cash equivalents and operating cash flows are insufficient to fund our future activities and requirements, we may need to raise additional funds through public or private equity or debt financing. If we issue equity securities in order to raise additional funds, substantial dilution to existing stockholders may occur. If we raise cash through the issuance of indebtedness, we may be subject to additional contractual restrictions on our business. We cannot assure you that we will be able to raise additional funds on favorable terms, or at all.
67
Guaranties, Warranties and Indemnifications
We generally offer hardware warranties on our products for one to ten years based on a tiered structure as determined by the type of customer. In accordance with the Financial Accounting Standards Board’s (FASB’s) Accounting Standards Codification (ASC 450-20) Loss Contingencies, we record an accrual when we believe it is estimable and probable based upon historical experience. We record a provision for estimated future warranty work in cost of goods sold upon recognition of revenue and we review the resulting accrual regularly and periodically adjust it to reflect changes in warranty estimates.
From time to time, we enter into certain types of contracts that contingently require us to indemnify various parties against claims from third parties. These contracts primarily relate to (i) certain real estate leases, under which we may be required to indemnify property owners for environmental and other liabilities, and other claims arising from our use of the applicable premises; (ii) certain agreements with our officers, directors, and employees, under which we be required to indemnify such persons for liabilities arising out of their relationship with us; (iii) contracts under which we may be required to indemnify customers against third-party claims that our product infringes a patent, copyright, or other intellectual property right; and (iv) procurement or license agreements, under which we may be required to indemnify licensors or vendors for certain claims that may be brought against us arising from our acts or omissions with respect to the supplied products or technology.
Generally, a maximum obligation under these contracts is not explicitly stated. Because the obligated amounts associated with these types of agreements are not explicitly stated, the overall maximum amount of the obligation cannot be reasonably estimated. Historically, we have not been required to make any payments under these obligations, and no liabilities have been recorded for these obligations in our consolidated balance sheets.
Off-Balance Sheet Arrangements
We have not entered into any off-balance sheet arrangements as defined in Item 303 of SEC Regulation S-K and we do not have any holdings in variable interest entities.
68
Item 7A. Quantitative and Qualitative Disclosures About Market Risk
We are exposed to market risks in the ordinary course of our business, primarily related to interest rate, inflation and foreign currency risks. We also are exposed to risks relating to changes in the general economic conditions that affect our business. To reduce certain of these risks, we monitor the financial condition of our customers and manage our contract manufacturer and suppliers. In addition, our investment strategy has been to invest in cash, cash equivalents and marketable securities. To date, we have not used derivative instruments to mitigate any market risk exposures. We have not used, nor do we intend to use, derivatives for trading or speculative purposes. We do not believe that these risks have been material to date.
We had cash and cash equivalents of $47.7 million at December 31, 2014. Cash and cash equivalents consist of cash and money market funds. The primary objectives of our investment activities are the preservation of capital, the fulfillment of liquidity needs and the fiduciary control of cash and cash equivalents. We do not enter into marketable securities for trading or speculative purposes.
We do not believe that inflation has had a material effect on our business, financial condition or results of operations. However, if our costs, in particular salaries and manufacturing costs were to become subject to significant inflationary pressures, we may not be able to fully offset such higher costs through price increases. Our inability or failure to do so could harm our business, operating results and financial condition.
Historically, as our operations and sales, including all of our manufacturing, have been primarily in the United States, we have not faced any significant foreign currency risk. As our international operations grow, our risks associated with fluctuation in currency rates will become greater, and we will continue to reassess our approach to managing this risk. In addition, currency fluctuations or a weakening U.S. dollar can increase the costs of our international expansion efforts. Conversely, a strengthening U.S. dollar could make it more difficult for us to compete in markets outside of the United States.
Changes in our stock price can have a material impact on the costs associated with our convertible notes and related warrants. Prior to obtaining-or if we do not obtain-stockholder approval to fully settle the conversion of our convertible notes and exercise of the related warrants, we would be required to settle these obligations in cash. Because the cash settlement amount of the notes and warrants increases if our stock price increases, increases in our stock price would result in an increase in the amount we would have to pay upon conversion of the notes and exercise of the warrants. For example, prior to obtaining stockholder approval-or if we don’t obtain stockholder approval if the price of our common stock used for purposes of measuring the settlement amount of the notes and warrants were $4.00 per share, we would be obligated to issue approximately 5.3 million shares of our common stock and pay cash of approximately $65.1 million to settle full conversion of the notes and exercise of the warrants. If the price of our common stock used for these calculations were $5.00 per share, the amounts would be approximately 6.9 million shares and $83.3 million in cash. In addition, changes in the price of our common stock result in changes in the fair value of the derivative liabilities associated with the convertible notes and warrants and could cause our charges for these liabilities to change significantly from period to period. For example, the fair market value of our common stock at December 31, 2014, which resulted in a charge of $4.7 million, was $2.50. If the fair market value on that date had been $3.50, the charge in the fourth quarter would have been $29.2 million.
69
Item 8. Financial Statements and Supplementary Data
Cyan, Inc.
Index to Consolidated Financial Statements
Page | |
70
Report of Independent Registered Public Accounting Firm
The Board of Directors and Stockholders
Cyan, Inc.
We have audited the accompanying consolidated balance sheets of Cyan, Inc. as of December 31, 2014 and 2013, and the related consolidated statements of operations, comprehensive loss, redeemable convertible preferred stock and stockholders' equity (deficit), and cash flows for each of the three years in the period ended December 31, 2014. These financial statements are the responsibility of the Company's management. Our responsibility is to express an opinion on these financial statements based on our audits.
We conducted our audits in accordance with the standards of the Public Company Accounting Oversight Board (United States). Those standards require that we plan and perform the audit to obtain reasonable assurance about whether the financial statements are free of material misstatement. We were not engaged to perform an audit of the Company’s internal control over financial reporting. Our audits included consideration of internal control over financial reporting as a basis for designing audit procedures that are appropriate in the circumstances, but not for the purpose of expressing an opinion on the effectiveness of the Company’s internal control over financial reporting. Accordingly, we express no such opinion. An audit also includes examining, on a test basis, evidence supporting the amounts and disclosures in the financial statements, assessing the accounting principles used and significant estimates made by management, and evaluating the overall financial statement presentation. We believe that our audits provide a reasonable basis for our opinion.
In our opinion, the financial statements referred to above present fairly, in all material respects, the consolidated financial position of Cyan, Inc. at December 31, 2014 and 2013, and the consolidated results of its operations and its cash flows for each of the three years in the period ended December 31, 2014, in conformity with U.S. generally accepted accounting principles.
/s/ Ernst & Young LLP
San Francisco, California
March 27, 2015
71
Cyan, Inc.
Consolidated Balance Sheets
(In thousands, except share and per share amounts)
December 31, 2014 | December 31, 2013 | ||||||
Assets | |||||||
Current assets: | |||||||
Cash and cash equivalents | $ | 47,740 | $ | 32,509 | |||
Restricted cash | 4,165 | — | |||||
Marketable securities | — | 31,639 | |||||
Accounts receivable (net of allowance for doubtful accounts of $227 and $147 at December 31, 2014 and 2013) | 23,511 | 14,558 | |||||
Short-term lease receivable | — | 201 | |||||
Inventories | 12,362 | 20,746 | |||||
Deferred costs | 1,317 | 8,286 | |||||
Prepaid expenses and other | 3,079 | 1,378 | |||||
Total current assets | 92,174 | 109,317 | |||||
Long-term restricted cash | 7,868 | — | |||||
Long-term lease receivable | — | 403 | |||||
Property and equipment, net | 11,896 | 11,155 | |||||
Other assets | 3,737 | 645 | |||||
Total assets | $ | 115,675 | $ | 121,520 | |||
Liabilities, and stockholders’ equity | |||||||
Current liabilities: | |||||||
Accounts payable | $ | 12,058 | $ | 8,474 | |||
Accrued liabilities | 6,775 | 3,786 | |||||
Accrued compensation | 4,146 | 4,895 | |||||
Term loan, current portion | — | 1,604 | |||||
Deferred revenue | 5,646 | 17,516 | |||||
Deferred rent | 181 | 115 | |||||
Other liabilities | — | 734 | |||||
Total current liabilities | 28,806 | 37,124 | |||||
Convertible debt, net of discount | 18,498 | — | |||||
Derivative and warrant liabilities | 36,280 | — | |||||
Term loan, non-current portion | — | 3,396 | |||||
Deferred revenue | 1,845 | 1,577 | |||||
Deferred rent | 302 | 486 | |||||
Total liabilities | 85,731 | 42,583 | |||||
Commitments and contingencies (Note 6) | |||||||
Stockholders’ equity: | |||||||
Preferred stock, $0.0001 par value, 20,000,000 shares authorized and no shares issued or outstanding as of December 31, 2014 and 2013. | — | — | |||||
Common stock, $0.0001 par value: 1,000,000,000 authorized as of December 31, 2014 and 2013; 47,305,129 and 46,536,436 shares issued and outstanding as of December 31, 2014 and December 31, 2013. | 5 | 5 | |||||
Additional paid in-capital | 216,607 | 206,300 | |||||
Accumulated other comprehensive loss | (162 | ) | (86 | ) | |||
Accumulated deficit | (186,506 | ) | (127,282 | ) | |||
Total stockholders’ equity | 29,944 | 78,937 | |||||
Total liabilities and stockholders’ equity | $ | 115,675 | $ | 121,520 | |||
See accompanying Notes to Consolidated Financial Statements.
72
Cyan, Inc.
Consolidated Statements of Operations
(In thousands, except per share amounts)
Year Ended December 31, | |||||||||||
2014 | 2013 | 2012 | |||||||||
Revenue | $ | 100,483 | $ | 116,582 | $ | 95,872 | |||||
Cost of revenue | 58,651 | 68,376 | 57,315 | ||||||||
Gross profit | 41,832 | 48,206 | 38,557 | ||||||||
Operating expenses: | |||||||||||
Research and development | 36,115 | 32,609 | 18,447 | ||||||||
Sales and marketing | 43,565 | 40,102 | 25,243 | ||||||||
General and administrative | 15,241 | 13,082 | 6,055 | ||||||||
Restructuring charges | 627 | — | — | ||||||||
Total operating expenses | 95,548 | 85,793 | 49,745 | ||||||||
Loss from operations | (53,716 | ) | (37,587 | ) | (11,188 | ) | |||||
Other income (expense), net: | |||||||||||
Change in fair value of derivative and warrant liabilities | (4,710 | ) | — | — | |||||||
Interest expense | (486 | ) | (367 | ) | (33 | ) | |||||
Other income (expense), net | (32 | ) | (2,635 | ) | (5,340 | ) | |||||
Total other expense, net | (5,228 | ) | (3,002 | ) | (5,373 | ) | |||||
Loss before provision for income taxes | (58,944 | ) | (40,589 | ) | (16,561 | ) | |||||
Provision for income taxes | 280 | 143 | 40 | ||||||||
Net loss | $ | (59,224 | ) | $ | (40,732 | ) | $ | (16,601 | ) | ||
Basic and diluted net loss per share | $ | (1.26 | ) | $ | (1.32 | ) | $ | (6.60 | ) | ||
Weighted-average number of shares used in computing basic and diluted net loss per share | 46,956 | 30,836 | 2,515 | ||||||||
See accompanying Notes to Consolidated Financial Statements.
73
Cyan, Inc.
Consolidated Statements of Comprehensive Loss
(In thousands)
Year Ended December 31, | |||||||||||
2014 | 2013 | 2012 | |||||||||
Net loss | $ | (59,224 | ) | $ | (40,732 | ) | $ | (16,601 | ) | ||
Other comprehensive income (loss): | |||||||||||
Foreign currency translation adjustments | (60 | ) | (83 | ) | 8 | ||||||
Unrealized gains (losses) on available for sale securities and reclassification to realized gains and losses, net of tax | (16 | ) | 16 | — | |||||||
Total other comprehensive income (loss) | (76 | ) | (67 | ) | 8 | ||||||
Comprehensive loss | $ | (59,300 | ) | $ | (40,799 | ) | $ | (16,593 | ) | ||
See accompanying Notes to Consolidated Financial Statements.
74
Cyan, Inc.
Consolidated Statements of Redeemable Convertible Preferred Stock and Stockholders’ Equity (Deficit)
(In thousands, except share amounts)
Redeemable Convertible Preferred Stock | Common Stock | Additional Paid-In Capital | Accumulated Other Comprehensive Loss | Accumulated Deficit | Total Stockholders' Equity (Deficit) | |||||||||||||||||||||||||
Shares | Amount | Shares | Amount | |||||||||||||||||||||||||||
Balances at January 1, 2012 | 33,897,005 | $ | 98,133 | 2,440,771 | $ | — | $ | 1,301 | $ | (27 | ) | $ | (69,949 | ) | $ | (68,675 | ) | |||||||||||||
Issuance of common stock under employee stock plans | — | — | 134,449 | — | 116 | — | — | 116 | ||||||||||||||||||||||
Stock-based compensation | — | — | — | — | 2,097 | — | — | 2,097 | ||||||||||||||||||||||
Foreign currency translation adjustment | — | — | — | — | — | 8 | — | 8 | ||||||||||||||||||||||
Net loss | — | — | — | — | — | — | (16,601 | ) | (16,601 | ) | ||||||||||||||||||||
Balances at December 31, 2012 | 33,897,005 | 98,133 | 2,575,220 | — | 3,514 | (19 | ) | (86,550 | ) | (83,055 | ) | |||||||||||||||||||
Issuance of common stock under employee stock plans | — | — | 289,479 | — | 412 | — | — | 412 | ||||||||||||||||||||||
Issuance of common stock upon initial public offering (IPO), net of issuance costs of $3,854 | — | — | 8,899,022 | 2 | 87,183 | — | — | 87,185 | ||||||||||||||||||||||
Conversion of convertible preferred stock to common stock upon IPO | (33,897,005 | ) | (98,133 | ) | 33,897,005 | 3 | 98,130 | — | — | 98,133 | ||||||||||||||||||||
Reclassification of preferred stock warrant liability upon IPO | — | — | 469,717 | — | 8,856 | — | — | 8,856 | ||||||||||||||||||||||
Exercise of preferred stock warrants upon IPO | — | — | 405,993 | — | 975 | — | — | 975 | ||||||||||||||||||||||
Unrealized gains on available for sale securities | — | — | — | — | — | 16 | — | 16 | ||||||||||||||||||||||
Stock-based compensation | — | — | — | — | 7,230 | — | — | 7,230 | ||||||||||||||||||||||
Foreign currency translation adjustment | — | — | — | — | — | (83 | ) | — | (83 | ) | ||||||||||||||||||||
Net loss | — | — | — | — | — | — | (40,732 | ) | (40,732 | ) | ||||||||||||||||||||
Balances at December 31, 2013 | — | — | 46,536,436 | 5 | 206,300 | (86 | ) | (127,282 | ) | 78,937 | ||||||||||||||||||||
Issuance of common stock under employee stock plans | — | — | 1,005,777 | — | 495 | — | — | 495 | ||||||||||||||||||||||
Unrealized loss on available for sale securities | — | — | — | — | — | (16 | ) | — | (16 | ) | ||||||||||||||||||||
Stock-based compensation | — | — | — | — | 10,553 | — | — | 10,553 | ||||||||||||||||||||||
Payroll taxes withheld related to vested restricted stock units | — | — | (237,084 | ) | — | (741 | ) | — | — | (741 | ) | |||||||||||||||||||
Foreign currency translation adjustment | — | — | — | — | — | (60 | ) | — | (60 | ) | ||||||||||||||||||||
Net loss | — | — | — | — | — | — | (59,224 | ) | (59,224 | ) | ||||||||||||||||||||
Balances at December 31, 2014 | — | $ | — | 47,305,129 | $ | 5 | $ | 216,607 | $ | (162 | ) | $ | (186,506 | ) | $ | 29,944 | ||||||||||||||
See accompanying Notes to Consolidated Financial Statements.
75
Cyan, Inc.
Consolidated Statements of Cash Flows
(In thousands)
Year Ended December 31, | ||||||||||||
2014 | 2013 | 2012 | ||||||||||
Operating activities | ||||||||||||
Net loss | $ | (59,224 | ) | $ | (40,732 | ) | $ | (16,601 | ) | |||
Adjustments to reconcile net loss to net cash used in operating activities: | ||||||||||||
Depreciation and amortization | 3,589 | 2,721 | 1,801 | |||||||||
Provision for doubtful accounts | 80 | 643 | — | |||||||||
Stock-based compensation | 10,553 | 7,249 | 2,097 | |||||||||
Change in fair value of derivative and warrant liabilities | 4,710 | 2,602 | 5,354 | |||||||||
Non-cash interest expense | 313 | — | — | |||||||||
Loss on extinguishment of debt | 10 | — | — | |||||||||
Loss on disposal of assets | 195 | — | — | |||||||||
Changes in operating assets and liabilities: | ||||||||||||
Accounts receivable | (9,033 | ) | 3,999 | (12,674 | ) | |||||||
Lease receivable | 604 | (604 | ) | — | ||||||||
Inventories | 8,233 | (7,733 | ) | (8,162 | ) | |||||||
Deferred costs | 6,969 | (58 | ) | (5,924 | ) | |||||||
Prepaid expenses and other assets | (1,355 | ) | (448 | ) | (586 | ) | ||||||
Accounts payable | 3,109 | (2,846 | ) | 6,483 | ||||||||
Accrued and other liabilities | 1,605 | 1,478 | 1,133 | |||||||||
Accrued compensation | (739 | ) | 1,152 | 2,337 | ||||||||
Deferred revenue | (11,602 | ) | 1,676 | 12,198 | ||||||||
Deferred rent | (118 | ) | 344 | 81 | ||||||||
Net cash used in operating activities | (42,101 | ) | (30,557 | ) | (12,463 | ) | ||||||
Investing activities | ||||||||||||
Purchases of property and equipment | (4,345 | ) | (6,111 | ) | (5,698 | ) | ||||||
Purchase of available for sale securities | (14,259 | ) | (31,639 | ) | — | |||||||
Purchase of other investment | — | (500 | ) | — | ||||||||
Maturity of available for sale securities | 27,772 | — | — | |||||||||
Sale of available for sale securities | 18,126 | — | — | |||||||||
Change in restricted cash | (12,033 | ) | — | — | ||||||||
Net cash provided by (used in) investing activities | 15,261 | (38,250 | ) | (5,698 | ) | |||||||
Financing activities | ||||||||||||
Proceeds from initial public offering (IPO), net of issuance costs | — | 88,369 | — | |||||||||
Proceeds from convertible debt offering | 50,000 | — | — | |||||||||
Issuance costs related to convertible debt offering | (2,558 | ) | — | — | ||||||||
Repayments of borrowings under term loan | (5,000 | ) | — | — | ||||||||
Proceeds from stock-based compensation programs | 495 | 412 | 116 | |||||||||
Repayments of revolving loan and borrowings under notes payable | — | (7,563 | ) | (45 | ) | |||||||
Borrowings under revolving loan and term loan facilities | — | — | 12,563 | |||||||||
Taxed paid related to net-share settlements of restricted stock units | (741 | ) | — | — | ||||||||
Payments on capital leases | (40 | ) | (58 | ) | — | |||||||
Net cash provided by financing activities | 42,156 | 81,160 | 12,634 | |||||||||
Effect of exchange rate changes on cash and cash equivalents | (85 | ) | (65 | ) | 8 | |||||||
Net increase (decrease) in cash and cash equivalents | 15,231 | 12,288 | (5,519 | ) | ||||||||
Cash and cash equivalents at beginning of period | 32,509 | 20,221 | 25,740 | |||||||||
Cash and cash equivalents at end of period | $ | 47,740 | $ | 32,509 | $ | 20,221 | ||||||
Supplemental disclosures of cash flow information | ||||||||||||
Cash paid for interest | $ | 288 | $ | 361 | $ | 43 | ||||||
Cash paid for taxes | $ | 243 | $ | 32 | $ | 27 | ||||||
Non-cash investing and financing activities | ||||||||||||
Property and equipment included in accounts payable | $ | 27 | $ | 1,183 | $ | 832 | ||||||
Issuance of common stock warrants with convertible debt financing | $ | 4,605 | $ | — | $ | — | ||||||
Debt issuance related costs in accounts payable and other accrued liabilities | $ | 925 | $ | — | $ | — | ||||||
Deferred offering costs in accounts payable and accrued liabilities | $ | — | $ | — | $ | 1,537 | ||||||
Conversion of convertible preferred stock into common stock upon IPO | $ | — | $ | 98,133 | $ | — | ||||||
Reclassification of preferred stock warrant liability upon IPO | $ | — | $ | 8,856 | $ | — | ||||||
76
1. Organization and Significant Accounting Policies
Description of the Business — Cyan, Inc. (Cyan or the Company) was incorporated on October 25, 2006, in the state of Delaware and its principal executive offices are located in Petaluma, California. The Company has pioneered innovative, carrier-grade networking solutions that transform disparate and inefficient legacy networks into open, high-performance networks. The Company’s solutions include high-capacity, multi-layer switching and transport platforms as well as a carrier-grade software-defined networking platform and applications. The Company’s solutions enable its customers to virtualize their networks, accelerate service delivery and increase scalability and performance while reducing costs. The Company designed its solutions to provide a variety of existing and emerging premium applications including business Ethernet, wireless backhaul, broadband backhaul and cloud connectivity. The Company’s customers range from service providers to high-performance data center and large, private network operators.
Initial Public Offering — In May 2013, the Company closed its initial public offering (IPO) whereby 8,899,022 shares of common stock were sold to the public, including 899,022 shares of common stock issued pursuant to the partial exercise of an overallotment option granted to the underwriters. The aggregate net proceeds received by the Company from the offering were $87.2 million, net of underwriting discounts and commissions and issuance expenses. Upon the closing of the IPO, all previously outstanding shares of the Company’s outstanding convertible preferred stock automatically converted into 33,897,005 shares of common stock. In addition, warrants to purchase shares of convertible preferred stock were exercised resulting in the issuance of 792,361 shares of common stock and the remaining outstanding warrants to purchase convertible preferred stock were converted into warrants to purchase 115,001 shares of common stock. In November 2013, the remaining warrants to purchase common stock were net exercised resulting in the issuance of 83,349 shares of common stock.
Principles of Consolidation — The Company's consolidated financial statements include its accounts and the accounts of its wholly-owned subsidiaries. Intercompany transactions and balances have been eliminated.
Fiscal Periods — The Company operates on fiscal periods ending on the last day of the respective calendar quarter.
Use of Estimates — The preparation of financial statements in accordance with Generally Accepted Accounting Principles (GAAP) requires management to make estimates and assumptions that affect the reported amounts of assets and liabilities and disclosure of contingent assets and liabilities at the date of the financial statements and the reported amounts of revenue and expenses for the reporting period. For the Company, these estimates include, but are not limited to, allowances for doubtful accounts, inventory valuation, excess and obsolete inventory, allowances for obligations to its contract manufacturer, useful lives assigned to long-lived assets, sales returns reserve, the fair value of stock awards, the fair value of a contingent conversion feature, a make-whole conversion adjustment, and certain interest features related to the Company's 8.0% convertible senior notes issued in December 2014 and due December 15, 2019 (the “Notes”) which are accounted for as a single compound embedded derivative (the “Compound Embedded Derivative”) and warrants associated the Notes. Notes, warranty costs, contingencies, accounting for income taxes, including the determination of the timing of the establishment or release of the Company's valuation allowance related to the Company's deferred tax asset balances and reserves for uncertain tax positions, and prior to the Company's initial public offering, the fair value of common and redeemable convertible preferred stock and related warrants. Actual results could differ from those estimates, and such differences could be material to the Company’s consolidated financial position and results of operations.
Cash and Cash Equivalents — The Company considers all highly liquid investments with an original or remaining maturity of three months or less, when purchased, to be cash equivalents. At December 31, 2014 and 2013 cash equivalents consist primarily of money market funds, the cost of which approximates fair value.
Credit Risk and Concentrations — Financial instruments that potentially subject the Company to significant concentrations of credit risk consist primarily of cash and cash equivalents, marketable securities, trade receivables and lease receivables.
Cash and cash equivalents consist of cash and money market funds that are invested through financial institutions in the United States. Such deposits may, at times, exceed federally insured limits. The Company has not experienced any losses in such accounts.
Available for sale marketable securities include U.S. treasury securities, U.S. government-sponsored agency securities, commercial paper, corporate bonds and municipal bonds. Investment policies have been implemented that limit the purchase of marketable securities to investment grade securities. Marketable securities that are downgraded after purchase are evaluated on a case by case basis by management to determine if they should be held or sold. Generally, the Company's marketable securities have maturity dates up to two years from the date of purchase and active markets for these securities exist.
77
Management believes that the financial institutions that hold the Company’s cash, cash equivalents and marketable securities are financially sound and, accordingly, minimal credit risk exists with respect to these cash, cash equivalents and marketable securities.
Concentrations of credit risk with respect to trade receivables exist to the full extent of amounts presented in the financial statements. The Company performs ongoing credit evaluations of its customers and generally does not require collateral from its customers to secure trade receivables. Trade receivables are derived from sales to customers located in the United States as well as those in international locations. The Company maintains an allowance for doubtful accounts for estimated losses resulting from the inability of its customers to make required payments. The Company records a specific allowance based on an analysis of individual past-due balances, including evaluations of its customers’ financial condition. Additionally, based on its historical write-offs and collections experience, the Company records an additional allowance based on a percentage of outstanding receivables. These evaluations require significant judgment and are based on a variety of factors, including, but not limited to, current economic trends, payment history and financial review of the customer. Actual collection losses may differ from management’s estimates, and such differences could be material to the Company’s consolidated financial position and results of operations. The Company had $0.2 million and $0.1 million allowance for doubtful accounts recorded as of December 31, 2014 and 2013, respectively.
The Company provides leasing arrangements for certain qualified end-user customers. The Company classifies these arrangements as lease receivables, which represent sales-type leases resulting from the sale of the Company’s products. Lease receivables consist of arrangements with the Company's customers, which generally have three year terms. As of December 31, 2014 and 2013 the Company had $0 million and $0.6 million of lease receivables and no allowance for credit losses as of that date.
The Company depends on its contract manufacturer for its finished goods inventory. The Company operates under a manufacturing services agreement with its contract manufacturer pursuant to which the Company is to provide a rolling quarterly forecast indicating the Company’s monthly production requirements. While the Company seeks to maintain sufficient inventory on hand, the Company’s business and results of operations could be adversely affected by a stoppage or delay in receiving such products, the receipt of defective parts, an increase in the price of such products, or the Company’s inability to obtain lower prices from its contract manufacturer and suppliers in response to competitive pressures.
Inventories — Inventories consisting of finished goods purchased from the contract manufacturer are stated at the lower of cost or market value, with cost being determined using standard cost, which approximates actual cost, on a first-in, first-out basis. The Company regularly monitors inventory quantities on hand and on order and records write-downs for excess and obsolete inventories as a component of cost of revenue. Write downs are recorded if the Company determines that demand for its products, potential obsolescence of technology, product life cycles, or pricing trends or forecasts indicate that the carrying value of inventory exceeds its estimated selling price. These factors are affected by market and economic conditions, technology changes, and new product introductions and require estimates that may include elements that are uncertain. Actual demand may differ from forecasted demand and may have a material effect on future gross margins. If inventory is written down, a new cost basis is established that cannot be increased in future periods.
Foreign Currency Translation — The Company’s revenue contracts are denominated in U.S. dollars, but certain operating expenses are incurred in various foreign currencies. Generally, the functional currency of the Company’s foreign operations is the local country’s currency. For those entities where the functional currency is the local country's currency, the expenses of operations outside the U.S. are translated into U.S. dollars using average exchange rates for the period reported, while assets and liabilities of operations outside the U.S. are translated into U.S. dollars using the end-of-period exchange rates.
Foreign currency translation adjustments not affecting net loss are included in stockholders’ deficit as a component of accumulated other comprehensive loss in the accompanying consolidated balance sheets.
The revaluation effect of foreign currency fluctuations is recorded as foreign currency gain (loss) and included in other income (expense) in the accompanying consolidated statements of operations.
Property and Equipment, Net — Property and equipment are stated at cost less accumulated depreciation and are depreciated on a straight-line basis over the estimated useful lives of the assets, generally three to five years. Leasehold improvements are amortized over the shorter of their estimated useful life, generally five to ten years, or the related remaining lease term. The costs of repairs and maintenance are expensed when incurred, while expenditures for refurbishments and improvements that significantly add to the productive capacity or extend the useful life of an asset are capitalized. When assets
78
are retired or sold, the asset cost and related accumulated depreciation are eliminated, with any remaining gain or loss reflected in the accompanying consolidated statements of operations.
Impairment of Long-Lived Assets — The Company periodically evaluates long-lived assets for impairment whenever events or changes in circumstances indicate that a potential impairment may have occurred. If such events or changes in circumstances arise, the Company compares the carrying amount of the long-lived assets to the estimated future undiscounted cash flows expected to be generated by the long-lived assets. If the estimated aggregate, undiscounted cash flows are less than the carrying amount of the long-lived assets, an impairment charge, calculated as the amount by which the carrying amount of the asset exceeds the fair value of the assets, is recorded. Through December 31, 2014 no impairment losses have been identified.
Revenue Recognition — Revenue is recognized when all of the following criteria are met:
• | Persuasive evidence of an arrangement exists. Customer purchase orders, along with master purchase contracts, where applicable, are generally used to determine the existence of an arrangement. |
• | Delivery has occurred. Shipping documents and customer acceptance, when applicable, are used to verify delivery. |
• | The price is fixed or determinable. The Company assesses whether the price is fixed or determinable based on the payment terms associated with the transaction and whether the sales price is subject to refund or adjustment. |
• | Collectability is reasonably assured. The Company assesses collectability based primarily on the creditworthiness of the customer as determined by credit checks and analysis, as well as the customer’s payment history. |
The Company derives revenue primarily from the sales of its hardware and software products as well as professional services. Shipping charges billed to customers are included in revenue.
From time to time, the Company offers customers sales incentives, including discounts. Revenue is recorded net of these amounts. Customer payment terms generally range from 30 to 90 days. The Company generally does not offer extended payment terms.
In 2013, a portion of the Company’s sales were made through multi-year lease agreements. These lease agreements included a bargain purchase option and meet the criteria for treatment as sales-type leases. Under sales-type leases, the Company recognized revenue for its hardware products, net of post-installation product maintenance and technical support, at the net present value of the lease payment stream. The Company sought to optimize its cash flows by selling a majority of its lease receivables to third party financing organizations on a non-recourse basis. Aside from its standard product warranty which is provided in the normal course of business, the Company has no obligation to the third party financing organizations once the lease receivables were sold.
In general, the Company’s products and services qualify as separate units of accounting. Products are typically considered delivered upon shipment. In certain cases, the Company’s products are sold along with services, which include installation, training, remote network monitoring services, post-sales software support, software-as-a-service (SaaS) based subscriptions, and/or extended warranty services. Post-sales software support includes rights, on a when-and-if-available basis, to receive unspecified software product upgrades to embedded software or the Company’s management software; maintenance releases; and patches released during the term of the support contract. This type of transaction is considered a multiple-element arrangement. When accounting for multiple-element arrangements, GAAP requires the Company to allocate revenue to individual elements using vendor-specific objective evidence (VSOE), third-party evidence (TPE), or its best estimated selling price (BESP) of deliverables if VSOE or TPE cannot be determined.
Multiple-element arrangements can include any combination of products and services. When allocating consideration, the Company will first do so on the basis of the deliverables’ relative selling prices, without regard to any contingent consideration, and then subsequently determine whether the revenue that may be recognized is limited based on the amount of non-contingent revenue. To the extent that the stated contractual prices agree to the Company’s estimated selling price on a standalone basis, the allocation of the consideration is based on stated contractual prices. However, if the stated contractual price for any deliverable is outside a narrow range of the estimated selling price on a standalone basis, the allocation is adjusted using the “relative-selling-price method.” Generally, the individual products and services meet the criteria for separate units of accounting and the Company recognizes revenue for each element upon delivery of the element.
The Company has not yet established VSOE for all deliverables in its arrangements with multiple elements. When VSOE cannot be established, the Company attempts to establish the selling price of each element based upon TPE by evaluating the pricing of similar and interchangeable competitor products or services in standalone arrangements. However, as
79
the Company’s products contain a significant element of proprietary technology and offer substantially different features and functionality from competitors, the Company has not been able to obtain comparable standalone pricing information with respect to competitors’ products. Therefore, the Company has historically not been able to obtain reliable evidence of TPE.
When the Company is unable to establish a selling price using VSOE or TPE, the Company uses BESP. The objective of BESP is to determine the price at which the Company would transact a sale if the element was sold on a standalone basis.
The Company determines BESP for an element by considering multiple factors, including, but not limited to, geographies, market conditions, competitive landscape, internal costs, gross margin objectives, characteristics of targeted customers, and pricing practices. The determination of BESP is made through consultation with and formal approval by the Company’s management, taking into consideration the go-to-market strategy. The Company regularly reviews VSOE, TPE, and BESP and has a process for the establishment and updating of these estimates.
Post-sales software support revenue and extended warranty services revenue are deferred and recognized ratably over the period during which the services are to be performed. Installation and training service revenues are recognized upon delivery or completion of performance. These service arrangements are typically short-term in nature and are largely completed shortly after delivery of the product.
The Company also delivers software-defined networking solutions to customers most frequently on a term license basis, with terms typically ranging from 12 to 36 months. While term-based licenses make up the majority of related revenues, the Company occasionally licenses software to customers on a perpetual basis with on-going support and maintenance services. Revenue from software that functions together with the tangible hardware elements to deliver the tangible products’ essential functionality is generally recognized upon shipment assuming all other revenue recognition criteria are met. Revenue from application software and related software elements which are not considered essential to the functionality of hardware is accounted for in accordance with software industry guidance, and therefore is recognized ratably over the longest service period for post-contract customer support (PCS) and professional services as the Company has not established VSOE for software or the related software elements.
In instances where substantive acceptance provisions are specified in the customer agreement, revenue is deferred until all acceptance criteria have been met. The Company’s arrangements generally do not include any provisions for cancellation, termination or refunds that would materially impact revenue recognition.
The Company enters into arrangements with certain of its customers who receive government supported loans and grants from the U.S. Department of Agriculture’s Rural Utility Service (RUS) to finance capital spending. Under the terms of an RUS equipment contract that includes installation services, the customer does not take possession and control and the title does not pass until formal acceptance is obtained from the customer. Under this type of arrangement, the Company does not recognize revenue until it has received formal acceptance from the customer and all other revenue recognition criteria have been met.
When the Company’s products have been delivered but the product revenue associated with the arrangement has been deferred as a result of not meeting the revenue recognition criteria, the related product costs are also deferred and included in deferred costs in the accompanying consolidated balance sheets.
Advertising Costs — Advertising costs, which are expensed and included in sales and marketing expense when incurred, were $0.3 million, $0.3 million and $0.2 million for the years ended December 31, 2014, 2013 and 2012.
Cost of Revenue — Cost of revenue primarily consists of product manufacturing costs incurred with the Company’s contract manufacturer. Cost of revenue also includes third-party manufacturing and supply chain logistics costs, provisions for excess and obsolete inventory, warranty, hosting costs, certain allocated costs for facilities, depreciation and other expenses associated with logistics and quality control. Additionally, it includes salaries, benefits and stock-based compensation for personnel directly involved with manufacturing installation, maintenance and support services and the provision of the Company’s service offerings.
Research and Development — Research and development costs primarily include salaries and other personnel-related expenses, contractor fees, facility costs, supplies, and depreciation of equipment associated with the design and development of new products prior to the establishment of their technological feasibility. Such costs are charged to research and development expense as incurred.
80
Development costs related to software incorporated in the Company’s products incurred subsequent to the establishment of technological feasibility and prior to the product being released would be capitalized and amortized over the estimated useful lives of the related products. Technological feasibility is established upon completion of a working model. Through December 31, 2014 all software development costs have been charged to research and development expense in the accompanying consolidated statements of operations.
Warranties — The Company generally offers limited warranties for its hardware products for periods of one to ten years. The Company recognizes estimated costs related to warranty activities as a component of cost of revenue upon product shipment. The estimates are based upon historical product failure rates and historical costs incurred in correcting product failures. The recorded amount is adjusted from time to time for specifically identified warranty exposures. Actual warranty expenses are charged against the Company’s estimated warranty liability when incurred. Factors that affect the Company’s liability include the number of installed units, historical and anticipated rates of warranty claims and the cost per claim.
Additionally, the Company offers separately priced extended warranty contracts for coverage beyond the standard warranty period. The Company expenses all warranty costs as incurred related to such extended warranty contracts.
Income Taxes — The Company uses the asset and liability method of accounting for income taxes. Under this method, deferred tax assets and liabilities are determined based on the temporary differences between the financial reporting and tax basis of assets and liabilities using enacted tax rates in effect for the years in which the differences are expected to reverse. The effect on deferred tax assets and liabilities of a change in tax laws is recognized in the consolidated statement of operations in the period that includes the enactment date. Valuation allowances are established when necessary to reduce deferred income tax assets to the amounts more-likely-than-not expected to be realized.
As part of the process of preparing the consolidated financial statements, the Company is required to estimate income tax expense and uncertain tax positions in each of the tax jurisdictions in which the Company operates. This process involves estimating current income tax expense together with assessing temporary differences in the treatment of items for tax purposes versus financial accounting purposes that may create net deferred tax assets and liabilities. The Company relies on estimates and assumptions in preparing its income tax provision.
The Company is subject to periodic audits by the Internal Revenue Service and other taxing authorities. The Company recognizes the tax benefit of an uncertain tax position only if it is more-likely-than-not that the position is sustainable upon examination by the taxing authority based on the technical merits. The tax benefit recognized is measured as the largest amount of benefit which is greater than 50 percent likely to be realized upon settlement with the taxing authority. The Company recognizes interest accrued and penalties related to unrecognized tax benefits in the income tax provision.
Stock–Based Compensation — The Company measures and recognizes stock-based compensation expense in the financial statements for all share-based payment awards made to employees and directors based on the estimated fair values on the date of grant using the Black-Scholes option-pricing model.
Prior to the Company's initial public offering in May 2013, the fair values of the common stock underlying share-based payment awards was determined by the board of directors, with input from management and a third-party valuation specialist. In the absence of a publicly traded market for the Company's common stock, the board of directors determined the fair value of the common stock in accordance with the guidelines outlined in the American Institute of Certified Public Accountants Practice Guide, Valuation of Privately-Held-Company Equity Securities Issued as Compensation.
The Company’s determination of the fair value of a share based payment award on the date of grant using the Black-Scholes option pricing model is affected by assumptions regarding a number of subjective variables. These variables include the Company’s expected stock price volatility over the expected term of the awards, risk-free interest rates and expected dividends. The expected term represents the period that the award is expected to be outstanding. The expected term of stock options was estimated based on the simplified method that takes into consideration the vesting and contractual terms. Volatility is estimated based on the average of the historical volatilities of the common stock of the Company’s peer group in the industry in which the Company does business, with characteristics similar to those of the Company. The Company uses the U.S. Treasury yield for its risk-free interest rate and a dividend yield of zero, as it does not issue dividends.
In addition to assumptions used in the Black-Scholes option pricing model, the Company must also estimate a forfeiture rate to calculate the stock-based compensation of its awards. The estimated forfeiture rate is based on an analysis of actual forfeitures and will continue to be evaluated based on actual forfeiture experience, analysis of employee turnover behavior and other factors. Further, to the extent the Company’s actual forfeiture rate is different from this estimate, which could be material, stock-based compensation is adjusted accordingly.
81
New Accounting Pronouncements — In May 2014, the Financial Accounting Standards Board (FASB) issued Accounting Standards Update (ASU) No. 2014-09, Revenue from Contracts with Customers (Topic 606) (ASU 2014-09), which provides guidance for revenue recognition. ASU 2014-09 supersedes the revenue recognition requirements in Topic 605, Revenue Recognition, and most industry-specific guidance. Additionally, it supersedes some cost guidance included in Subtopic 605-35, Revenue Recognition-Construction-Type and Production-Type Contracts, and creates new Subtopic 340-40, Other Assets and Deferred Costs-Contracts with Customers. The standard’s core principle is that a company will recognize revenue when it transfers promised goods or services to customers in an amount that reflects the consideration to which the company expects to be entitled in exchange for those goods or services. In doing so, companies will need to use more judgment and make more estimates than under the previous guidance. These may include identifying performance obligations in the contract, estimating the amount of variable consideration to include in the transaction price and allocating the transaction price to each separate performance obligation. ASU 2014-09 requires retrospective application by either a “full retrospective” adoption in which the standard is applied to all of the periods presented or a “modified retrospective” adoption for fiscal years beginning after December 15, 2016. The standard will be effective for the Company in the first quarter of fiscal 2017. Early adoption is not permitted. The Company has not selected a transition method and is currently assessing the potential impact on its financial statements from adopting this new guidance.
In August 2014 the FASB issued ASU 2014-15, Disclosure of Uncertainties about an Entity’s Ability to Continue as a Going Concern. The ASU is intended to define management’s responsibility to evaluate whether there is substantial doubt about an organization’s ability to continue as a going concern and to provide related footnote disclosures. For all entities, the ASU is effective for annual periods ending after December 15, 2016 and interim periods within annual periods beginning after December 15, 2016. The standard will be effective for the Company in the first quarter of fiscal 2017. Early adoption is permitted. The Company is currently assessing the potential impact on its financial statements from adopting this new guidance.
2. Fair Value Disclosure
Assets and liabilities recorded at fair value in the consolidated financial statements are categorized based upon the level of judgment associated with the inputs used to measure their fair value. The Company categorizes its financial instruments into a fair value hierarchy that prioritizes the inputs to valuation techniques used to measure fair value. The hierarchy gives the highest priority to unadjusted quoted prices in active markets for identical assets or liabilities (Level 1 measurements) and the lowest priority to unobservable inputs (Level 3 measurements).
A financial instrument’s level within the fair value hierarchy is based on the lowest level of any input that is significant to the fair value measurement. Hierarchical levels that are directly related to the amount of subjectivity associated with the inputs to the valuation of these assets or liabilities are as follows:
Level 1: Inputs are unadjusted quoted prices in active markets for identical assets or liabilities at the measurement date.
Level 2: Inputs (other than quoted market prices included in Level 1) are either directly or indirectly observable for the asset or liability through correlation with market data at the measurement date and for the duration of the instrument’s anticipated life.
Level 3: Inputs reflect management’s best estimate of what market participants would use in pricing the asset or liability at the measurement date. Consideration is given to the risk inherent in the valuation technique and the risk inherent in the inputs to the model.
Cash Equivalents
Where quoted prices are available in an active market, cash equivalents are classified within Level 1 of the valuation hierarchy. Cash equivalents classified in Level 1 at December 31, 2014 and December 31, 2013 include money market funds. The valuation of these instruments is determined using a market approach and is based upon unadjusted quoted prices for identical assets in active markets.
Marketable Securities
Available for sale marketable securities are carried at fair value, with any unrealized gains and losses, net of tax, reported as a separate component of stockholders’ equity. Marketable securities consist of U.S treasury securities, U.S.
82
government-sponsored agency securities, municipal bonds, corporate bonds and commercial paper. The Company held no marketable securities as of December 31, 2014.
The fair value of the Company's marketable securities is determined as the exit price in the principal market in which it would transact. Level 1 instruments are valued based on quoted market prices in active markets and include U.S treasury securities. Level 2 instruments are valued based on quoted prices in markets that are not active, broker or dealer quotations, or alternative pricing sources with reasonable levels of price transparency and include U.S. government-sponsored agency securities, municipal bonds, corporate bonds and commercial paper. Level 3 instruments are valued based on unobservable inputs that are supported by little or no market activity and reflect the Company's own assumptions in measuring fair value. As of December 31, 2013, the Company had no marketable securities classified within Level 3 of the fair value hierarchy.
Preferred Stock Warrant Liability
Prior to the Company's IPO in May 2013, the Company estimated the fair value of preferred stock warrants at the respective balance sheet dates using the Black-Scholes option-pricing model based on the fair value of the underlying redeemable convertible preferred stock at the valuation measurement date, the remaining contractual term of the warrant, risk-free rates, expected dividends and the expected volatility of the price of the underlying redeemable convertible preferred stock. Because this model includes significant unobservable inputs, preferred stock warrant liabilities were classified within Level 3 of the valuation hierarchy.
The company performed the final re-measurement of the convertible preferred stock warrant liability in connection with the completion of its IPO in May 2013 at which time the warrants remaining outstanding became exercisable for common stock, and reclassified the warrant liability from other current liabilities to additional paid-in capital.
Derivative Liabilities
In December 2014, the Company issued $50 million aggregate principal amount of 8.0% convertible senior notes due December 15, 2019 (the “Notes”). The Notes include a conversion option, including contingent conversion, a make-whole conversion adjustment, and certain interest features which are accounted for as a single compound embedded derivative (the “Compound Embedded Derivative”). The fair value of the Compound Embedded Derivative was determined based on a binomial lattice model. The liability is classified within Level 3 as the volatility assumption was based on the weighting of observable and implied volatilities and the estimated weighting and implied volatility are unobservable inputs used to value the Compound Embedded Derivative.
In December 2014, the Company issued detachable warrants, in conjunction with issuing the Notes. The fair value of each warrant is estimated by utilizing a Black-Scholes option-pricing model. The liability is classified within Level 3 as the volatility assumption was based on the weighting of observable and implied volatilities and the estimated weighting and implied volatility are unobservable inputs used to value the Compound Embedded Derivative.
Fair Value Hierarchy
The following tables set forth by level, within the fair value hierarchy, the Company’s assets and liabilities at fair value as of December 31, 2014 (in thousands):
Level 1 | Level 2 | Level 3 | Total | |||||||||||||
Assets: | ||||||||||||||||
Cash Equivalents: | ||||||||||||||||
Money Market Funds | $ | 4,110 | $ | — | $ | — | $ | 4,110 | ||||||||
Liabilities: | ||||||||||||||||
Derivative Liabilities | $ | — | $ | — | $ | 36,280 | $ | 36,280 | ||||||||
83
The following tables set forth by level, within the fair value hierarchy, the Company’s assets and liabilities at fair value as of December 31, 2013 (in thousands):
Level 1 | Level 2 | Level 3 | Total | |||||||||||||
Assets: | ||||||||||||||||
Cash Equivalents: | ||||||||||||||||
Money Market Funds | $ | 13,452 | $ | — | $ | — | $ | 13,452 | ||||||||
Marketable Securities: | ||||||||||||||||
Commercial paper | $ | — | $ | 19,687 | $ | — | $ | 19,687 | ||||||||
Corporate bonds | — | 4,857 | — | 4,857 | ||||||||||||
Municipal bonds | — | 1,026 | — | 1,026 | ||||||||||||
U.S. government-sponsored agency securities | — | 2,031 | — | 2,031 | ||||||||||||
U.S. treasury securities | 4,038 | — | — | 4,038 | ||||||||||||
Total marketable securities | $ | 4,038 | $ | 27,601 | $ | — | $ | 31,639 | ||||||||
There were no transfers of assets or liabilities measured at fair value between levels within the fair value hierarchy during the years ended December 31, 2014 and 2013.
The following table summarizes the changes in liabilities classified in Level 3 for the year ended December 31, 2014. Gains and losses reported in this table include changes in fair value that are attributable to both observable and unobservable inputs (in thousands):
Year Ended December 31, 2014 | ||||
Beginning balance | $ | — | ||
Issuance of derivative liabilities and warrants with Notes | $ | 31,570 | ||
Change in fair value of derivative liabilities | 4,710 | |||
Ending balance | $ | 36,280 | ||
The following table shows the Company’s available-for-sale securities amortized cost, gross unrealized gains, gross unrealized losses and fair value as of December 31, 2013 (in thousands):
Amortized Cost | Gross Unrealized Gains | Gross Unrealized Losses | Fair Value | ||||||||||||
Marketable securities: | |||||||||||||||
Commercial paper | $ | 19,683 | $ | 5 | $ | 1 | $ | 19,687 | |||||||
Corporate bonds | 4,854 | 4 | 1 | 4,857 | |||||||||||
Municipal bonds | 1,027 | — | 1 | 1,026 | |||||||||||
U.S. government-sponsored agency securities | 2,029 | 2 | — | 2,031 | |||||||||||
U.S. treasury securities | 4,030 | 8 | — | 4,038 | |||||||||||
Total marketable securities | $ | 31,623 | $ | 19 | $ | 3 | $ | 31,639 | |||||||
The Company held no marketable securities at December 31, 2014. The unrealized gains and losses at December 31, 2013 reflected in the table above were reversed, or reclassified as realized, as the securities matured or were sold.
When held, the Company regularly reviewed its marketable securities portfolio to identify and evaluate instruments for indications of possible impairment.
As of December 31, 2013 no marketable securities were in a continuous unrealized loss position for more than twelve months. The gross unrealized loss was primarily due to changes in interest rates. The gross unrealized loss on all available-for-sale marketable securities as of December 31, 2013 were considered temporary in nature. Factors considered in determining
84
whether a loss is temporary include, but are not limited to, the length of time and extent to which fair value has been less than the cost basis and the financial condition and near-term prospects of the investee.
The Company evaluated its marketable securities portfolio as of December 31, 2013 and has determined that none of its marketable securities were impaired.
3. Balance Sheet Components
Cash and Cash Equivalents
Cash and cash equivalents consisted of the following (in thousands):
December 31, 2014 | December 31, 2013 | ||||||
Cash | $ | 43,630 | $ | 19,057 | |||
Money market funds | 4,110 | 13,452 | |||||
Total cash and cash equivalents | $ | 47,740 | $ | 32,509 | |||
Restricted cash related to the Notes is held at a depository institution.
Allowance for Doubtful Accounts
The table below presents the changes in the allowance for doubtful accounts for the years ended December 31, 2014 and 2013 (in thousands):
Year Ended December 31, 2014 | Year Ended December 31, 2013 | ||||||
Opening balance | $ | 147 | $ | — | |||
Provision for doubtful accounts | 80 | 643 | |||||
Write offs | — | (496 | ) | ||||
Closing balance | $ | 227 | $ | 147 | |||
Prior to the year ended December 31, 2013, the Company had recorded no provision for doubtful accounts or accounts receivable write offs.
Lease Receivables
The Company held no lease receivables at December 31, 2014. At December 31, 2013, lease receivables consisted of the following (in thousands):
December 31, 2013 | |||
Net minimum lease payments to be received | $ | 639 | |
Less unearned interest income portion | 35 | ||
Total lease receivable | 604 | ||
Less short-term lease receivable | 201 | ||
Long-term lease receivable | $ | 403 | |
In the three months ended December 31, 2013 the Company sold $9.2 million of its lease receivables to a third party financing organization at par value for total cash proceeds of $9.2 million. The Company sold the remaining balance of $0.6 million in the three months ended March 31, 2014. Pursuant to these sales, the Company retained no substantial risk of default by the lessee nor provided any guarantee of residual value of the underlying leased equipment, except for standard product warranty that is provided in the normal course of business. Consequently, the Company met the requirements for de-recognition of the related lease receivables.
85
Inventory
Inventories consisted of finished goods purchased from the contract manufacturer and are stated at the lower of cost (on a first-in, first-out basis) or market value. Inventory consisted of the following (in thousands):
December 31, 2014 | December 31, 2013 | ||||||
Raw materials | $ | 1,202 | $ | 748 | |||
Finished goods | 11,160 | 19,998 | |||||
Total Inventory | $ | 12,362 | $ | 20,746 | |||
During the year ended December 31, 2014 and 2013, the Company recorded a write-down for excess and obsolete inventory of $1.2 million and $1.0 million, respectively. These write-downs were included as a component of cost of revenue in the year in which it was recorded.
Property and Equipment, Net
Property and equipment, net consisted of the following (in thousands):
December 31, 2014 | December 31, 2013 | ||||||
Lab equipment and tooling | $ | 18,303 | $ | 14,743 | |||
Software | 628 | 667 | |||||
Leasehold improvements | 1,569 | 1,595 | |||||
Furniture and fixtures | 987 | 974 | |||||
Computer equipment | 720 | 979 | |||||
Property and equipment, gross | 22,207 | 18,958 | |||||
Less accumulated depreciation and amortization | (10,311 | ) | (7,803 | ) | |||
Property and equipment, net | $ | 11,896 | $ | 11,155 | |||
For the years ended December 31, 2014, 2013 and 2012, depreciation and amortization expense on property and equipment was $3.6 million, $2.7 million and $1.8 million.
Accrued Liabilities
Accrued liabilities consisted of the following (in thousands):
December 31, 2014 | December 31, 2013 | ||||||
Inventory-in-transit | $ | 1,516 | $ | 344 | |||
Warranty reserve (1) | 2,564 | 1,374 | |||||
Sales returns reserve (2) | 370 | 198 | |||||
Professional fees | 1,137 | 862 | |||||
Sales and use taxes | 201 | 497 | |||||
Other | 987 | 511 | |||||
Total accrued liabilities | $ | 6,775 | $ | 3,786 | |||
86
(1) | The table below presents the changes in warranty reserve for the years ended December 31, 2014 ,2013 and 2012 (in thousands): |
Year Ended December 31, | |||||||||||
2014 | 2013 | 2012 | |||||||||
Beginning balance | $ | 1,374 | $ | 1,266 | $ | 783 | |||||
Charge to cost of sales | 1,388 | 1,553 | 1,106 | ||||||||
Incremental warranty recoverable from component manufacturer | 1,567 | — | — | ||||||||
Costs incurred | (1,765 | ) | (1,445 | ) | (623 | ) | |||||
Closing balance | $ | 2,564 | $ | 1,374 | $ | 1,266 | |||||
During the three months ended June 30, 2014, the Company and a component manufacturer reached an agreement whereby the component manufacturer agreed to reimburse the Company for certain costs, up to an agreed maximum, associated with replacing defective products sold to customers. As of December 31, 2014, $1.2 million remains recoverable from this component manufacturer. This amount is classified within prepaid expenses and other on the consolidated balance sheets.
(2) The table below presents the changes in the sales returns reserve for the years ended December 31, 2014 and 2013 (in thousands):
Year Ended December 31, 2014 | Year Ended December 31, 2013 | ||||||
Opening balance | $ | 198 | $ | — | |||
Provision for sales returns | 386 | 910 | |||||
Sales returns | (214 | ) | (712 | ) | |||
Closing balance | $ | 370 | $ | 198 | |||
Prior to the year ended December 31, 2013 the Company had recorded no sales returns reserve or sales returns.
4. Debt
Loan and Security Agreement
On December 21, 2012, the Company entered into a Loan and Security Agreement with Silicon Valley Bank (“SVB”). The agreement provided for a revolving loan facility of up to $10.0 million and a term loan facility of up to $5.0 million, for a total loan facility of up to $15.0 million. As of December 31, 2013, the Company had outstanding principal of $5.0 million as term loans and zero as revolving loans. As of December 31, 2013 the Company was in compliance with all covenants. The Company repaid the outstanding balance under the SVB credit facility and terminated the agreement in December 2014.
5. Convertible Debt
On December 12, 2014, the Company issued $50.0 million aggregate principal amount of 8.0% Convertible Senior Secured Notes due December 15, 2019 (the “Notes”) and related warrants to purchase up to an aggregate 11.25 million shares of the Company’s common stock, par value $0.0001 per share (the “Warrants”), in a private placement to qualified institutional buyers and accredited investors.
Aggregate offering expenses in connection with the transaction, including the placement agent's fee of $2.3 million, were $3.5 million, resulting in net proceeds of $46.5 million. $12.0 million of the offering proceeds were deposited into an escrow account which the Company will use to pay the first six scheduled semi-annual interest payments on the Notes.
The Company issued the Notes under an Indenture, dated December 12, 2014 (the “Indenture”), between the Company and U.S. Bank National Association, as Trustee and Collateral Agent. The Notes provide 8.0% interest per annum, payable semi-annually in arrears on June 15 and December 15 of each year, with interest beginning to accrue from December 12, 2014. The Notes will mature on December 15, 2019, unless earlier converted, redeemed or repurchased by the Company. The Notes are convertible into the Company’s common stock as described below.
87
The Notes are secured by a first-priority lien, subject only to certain permitted liens and certain excluded assets, on substantially all of the Company’s and the subsidiary guarantors’ assets, whether now owned or hereafter acquired, including license agreements, general intangibles, accounts instruments, investment property, intellectual property and any proceeds of the foregoing. The guarantees of each subsidiary guarantor will be a senior secured obligation of such subsidiary guarantor and will have the same ranking with respect to indebtedness of such subsidiary guarantor as the Notes will have with respect to the Company’s indebtedness. At December 31, 2014, there are no subsidiary guarantors.
The Notes are the Company’s senior secured obligation and will rank senior in right of payment to any of the Company’s indebtedness that is expressly subordinated in right of payment to the Notes; will rank effectively senior to any of the Company’s unsecured indebtedness to the extent of the value of the collateral securing the Notes; will rank equal in right of payment to the Company’s existing and future liabilities that is not so subordinated to the Notes; and will rank structurally junior to all indebtedness and other liabilities (including trade payable) of the Company’s existing and future subsidiaries that do not guarantee the Notes.
The initial conversion rate for the Notes is 409.3998 shares of common stock per $1,000 principal amount of Notes, which is equivalent to an initial conversion price of approximately $2.44 per share. Except in the case of certain specified corporate events, the Notes will not be convertible prior to January 15, 2016. Thereafter, until the close of business on June 15, 2019, the Notes will only be convertible under certain circumstances. On and after June 15, 2019, the Notes may be converted at any time prior to maturity. Unless and until the Company obtains stockholder approval to issue additional shares, it will be required (i) to settle Notes purchased by existing stockholders and officers and any other Notes settled on the same date solely in cash and (ii) to settle all conversions of Notes (other than those purchased by existing stockholders and officers and only if settled on a date different from the date of settlement of the Notes purchased by existing stockholders and officers) by paying cash in an amount of at least the principal amount of Notes converted and any combination of cash or shares of common stock for the conversion value in excess of the principal amount, if any, subject to a share cap. Upon conversion, in certain circumstances, the Company will also make an interest make-whole payment.
The Company may not redeem the Notes prior to December 20, 2017. On or after December 20, 2017, the Company may redeem the Notes at a redemption price equal to the principal amount of the Notes to be redeemed, plus accrued and unpaid interest, to, but excluding, the redemption date if the last reported sale price of its common stock for at least 20 trading days (whether or not consecutive) during the 30 consecutive trading day period ending within three trading days prior to the date notice of redemption is delivered is at least 140% of the conversion price of the Notes on each applicable trading day.
In the event that the Company undergoes a fundamental change, the holders may require the Company to purchase for cash all or any portion of the Notes at a purchase price equal to the principal amount of the Notes to be purchased plus accrued and unpaid interest to, but excluding, the fundamental change purchase date. The Company will also increase the conversion rate, in certain circumstances, if a holder elects to convert Notes in connection with a fundamental change or a redemption of the Notes.
In addition to the Notes, the Company also issued warrants to purchase 225 shares of the Company's common stock for each $1,000 principal amount of Notes issued, resulting in issuing warrants exercisable for an aggregate of 11.25 million shares of common stock. The exercise price per share of common stock purchasable upon exercise of the Warrants is $3.62 per share of common stock. The exercise price is subject to appropriate anti-dilution adjustment in the event of certain stock dividends and distributions, stock splits, stock combinations, reclassifications or similar events affecting the Company’s common stock and also upon any distributions of assets, including cash, stock or other property to the Company’s stockholders.
The warrants are exercisable at any time on and after January 15, 2016 and expire on December 15, 2017. The warrants will be exercisable, at the option of each holder, in whole or in part by delivering to the Company a duly executed exercise notice and either by payment in full in immediately available funds for the number of shares of common stock purchased upon such exercise or through a cashless exercise, in which case the holder would receive upon such exercise the net number of shares of common stock determined according to the formula set forth in the warrant. No fractional shares of common stock will be issued in connection with the exercise of a warrant. In lieu of fractional shares, the Company will pay the holder an amount in cash equal to the fractional amount multiplied by the exercise price. Notwithstanding the foregoing, unless and until the Company has obtained the requisite stockholder approvals, the Company will be required to cash settle any exercises of the warrants according to the net value formula set forth in the warrants.
The conversion option and certain interest rate features, including contingent conversion and the make-whole interest, are embedded derivatives. These features are accounted for as a single compound embedded derivative (the “Compound Embedded Derivative”). The conversion option and warrants are not subject to the equity scope exception since explicit net cash settlement is required prior to receipt of approval of the shareholders to settle in shares. As such the Compound Embedded Derivative and warrants are accounted for at fair value with changes in fair value recorded in the Company’s consolidated statement of operations.
88
The fair value of the Compound Embedded Derivative was computed using a Binomial Lattice approach of a similar note with and without the Compound Embedded Derivative. The Warrants were valued using the Black-Scholes Option-pricing model.
The initial discounted value of the Notes of $18.4 million (after allocation of proceeds to the warrants and bifurcation of the Compound Embedded Derivative) is accreted to its $50.0 million principal amount over the term of the Notes under the effective interest rate method. The aggregate amount of issuance costs is deferred and amortized to interest expense under the effective interest method over the term of the Notes. The effective interest rate is 48.9%.
The table below summarizes the issuance of the Notes as reflected in the balance sheet at December 31, 2014 (in thousands):
December 31, 2014 | |||
Gross Proceeds | $ | 50,000 | |
Initial value of Compound Embedded Derivative reported as debt discount | (26,965 | ) | |
Initial value of common stock warrants reported as debt discount | (4,605 | ) | |
Amortization of debt discount | 68 | ||
Ending balance | $ | 18,498 | |
At December 31, 2014, the balance of unamortized debt issuance costs was $3.4 million.
6. Commitments and Contingencies
Facility Lease
In April 2007 the Company entered into a lease for the Company's headquarters facility in Petaluma, California. As amended to date, the 2007 lease provides for the lease of 18,895 square feet and expires in 2025. As of December 31, 2014, the Company's total remaining obligations under the 2007 lease were $6.0 million. In July 2013, the Company entered into a lease for an additional 20,005 square feet of space in Petaluma, California, increasing by a further 18,773 square feet in 2016. The 2013 lease expires concurrently with the 2007 lease in 2025. Total remaining obligations under the 2013 lease are $11.5 million with payments starting in 2015. The Company has an option to extend the term of both leases for an additional five-year period.
In relation to these lease agreements, an executive officer, who is also a member of the Company’s board of directors, owns approximately 40% of the limited liability company from which the Company is leasing the office premises. As of December 31, 2014 and December 31, 2013 no amounts were included in accounts payable or accrued expenses under these agreements.
As of December 31, 2014 and December 31, 2013 total deferred rent was $0.5 million and $0.6 million. For the years ended December 31, 2014, 2013 and 2012 rent expense was $1.1 million, $0.8 million and $0.5 million.
Future minimum annual obligations under non-cancellable lease agreements as of December 31, 2014 are as follows (in thousands):
Year ending December 31: | |||
2015 | 1,294 | ||
2016 | 1,449 | ||
2017 | 1,768 | ||
2018 | 1,804 | ||
2019 | 1,799 | ||
Thereafter | 9,950 | ||
Total | $ | 18,064 | |
Contingencies
From time to time, The Company may be involved in various legal proceedings arising from the normal course of business. On April 1, 2014 a purported stockholder class action lawsuit was filed in the Superior Court of California, County of San Francisco, against the Company, the members of the Company's Board of Directors, the Company's former Chief Financial
89
Officer and the underwriters of the Company's IPO. On April 30, 2014 a substantially similar lawsuit was filed in the same court against the same defendants. The two cases have been consolidated under the caption Beaver County Employees Retirement Fund, et al. v. Cyan, Inc. et al., Case No. CGC-14-539008. The consolidated complaint alleges violations of federal securities laws on behalf of a purported class consisting of purchasers of the Company's common stock pursuant or traceable to the registration statement and prospectus for the Company's IPO, and seek unspecified compensatory damages and other relief. In July 2014, the defendants filed a demurrer to (motion to dismiss) the consolidated complaint. On October 22, 2014, the court overruled the demurrer and allowed the case to proceed. The Company intends to defend the litigation vigorously. Based on information currently available, the Company has determined that the amount of any possible loss or range of possible loss is not reasonably estimable.
Guarantees
The Company from time to time enters into certain types of contracts that contingently require it to indemnify various parties against claims from third parties. These contracts primarily relate to (i) certain real estate leases, under which the Company may be required to indemnify property owners for environmental and other liabilities, and other claims arising from the Company’s use of the applicable premises; (ii) certain agreements with the Company’s officers, directors, and employees, under which the Company may be required to indemnify such persons for liabilities arising out of their relationship with the Company; (iii) contracts under which the Company may be required to indemnify customers against third-party claims that a Company product infringes a patent, copyright, or other intellectual property right; and (iv) procurement or license agreements, under which the Company may be required to indemnify licensors or vendors for certain claims that may be brought against them arising from the Company’s acts or omissions with respect to the supplied products or technology.
Generally, a maximum obligation under these contracts is not explicitly stated. Because the obligated amounts associated with these types of agreements are not explicitly stated, the overall maximum amount of the obligation cannot be reasonably estimated. Historically, the Company has not been required to make payments under these obligations, and no liabilities have been recorded for these obligations in the Company’s consolidated balance sheet.
Contract Manufacturer
As of December 31, 2014 and December 31, 2013 the Company has commitments to its contract manufacturer of $9.7 million and $7.9 million. These commitments include raw materials, work in progress and scheduled future orders. Should the Company be required to pay under this guarantee, the Company has the right to obtain and liquidate the related inventory to recover amounts paid under the guarantee.
7. Redeemable Convertible Preferred Stock and Warrants
On various dates throughout 2007, 2008 and 2009, the Company issued warrants to purchase 12,806 shares of the Company’s Series A Preferred Stock and 102,195 shares of the Company’s Series B Preferred Stock at exercise prices of $1.30 and $2.45 per share. These warrants were exercisable on various dates throughout 2013, 2014 and 2015.
Upon closing of the IPO, warrants to purchase 894,596 shares of convertible preferred stock were net exercised resulting in the issuance of 792,361 shares of common stock. Warrants to purchase 115,001 shares of convertible preferred stock were converted into warrants to purchase common stock at the original exercise price per share. In November 2013, the remaining warrants to purchase common stock were net exercised resulting in the issuance of 83,349 shares of common stock.
Prior to the closing of the IPO, the Company re-measured the fair value of the preferred stock warrants at each balance sheet date. The fair value of the outstanding warrant was classified within current liabilities on the consolidated balance sheets, and any changes in fair value were recognized as a component of other income (expenses), net in the consolidated statements of operations.
Upon the closing of the IPO, the preferred stock warrant liability was reclassified from current liabilities to stockholders’ equity and the Company will no longer record any mark-to-market changes in the fair value of the remaining outstanding common stock warrants. The Company performed the final re-measurement of the warrant in connection with the completion of the IPO in May 2013.
The fair value of the outstanding preferred stock warrants was determined using the Black-Scholes-Merton option-pricing model. The fair value of the preferred stock warrant was estimated using the following assumptions for the periods presented below:
90
Year Ended December 31, | |||||
2013 | 2012 | ||||
Expected term (years) | 0.48-3.24 | 0.80-3.49 | |||
Volatility | 55 | % | 55 | % | |
Risk-free interest rate | 0.22-0.68% | 0.25-0.36% | |||
Dividend yield | — | — | |||
The change in the fair value of the convertible preferred stock warrant liability during the periods presented is summarized below (in thousands):
Year Ended December 31, | |||||||
2013 | 2012 | ||||||
Opening balance | $ | 6,254 | $ | 900 | |||
Increase (decrease) in fair value | 2,602 | 5,354 | |||||
Reclassification of warrant liability to additional paid-in capital | (8,856 | ) | — | ||||
Closing balance | $ | — | $ | 6,254 | |||
Upon the closing of the IPO in May 2013, all outstanding shares of convertible preferred stock were converted into shares of common stock on a one-for-one basis.
8. Common Stock
Initial Public Offering
In May 2013, the Company completed its initial public offering of its common stock to the public whereby 8,899,022 shares of common stock were sold by the Company, including 899,022 shares of common stock issued upon the partial exercise of the overallotment option granted to the underwriters. The public offering price of the shares sold in the offering was $11.00 per share.
The total gross proceeds from the offering to the Company were $97.9 million. After deducting underwriters’ discounts and commissions and offering expenses, the aggregate net proceeds received by the Company totaled $87.2 million. Immediately prior to the closing of the IPO, all shares of the Company’s outstanding redeemable convertible preferred stock automatically converted into 33,897,005 shares of common stock. On December 31, 2014 the Company had 47,305,129 shares of common stock issued and outstanding.
Change in Authorized Stock
In March 2013, the Company’s board of directors and stockholders approved an amended and restated certificate of incorporation that became effective in connection with the completion of the IPO. Upon completion of the IPO, the authorized common stock was 1,000,000,000 shares and authorized undesignated preferred stock was 20,000,000 shares.
Stock-Based Compensation Awards
In 2006, the board of directors adopted the 2006 Stock Incentive Plan (2006 Plan). The 2006 Plan provided for the granting of incentive stock options and nonstatutory options to employees, officers, directors, and consultants of the Company. Generally, stock options granted under the 2006 Plan had terms of 10 years and vested over a period of four years. The 2006 Plan was terminated upon the adoption of the 2013 Equity Incentive Plan (2013 Plan) at the time of the Company’s IPO. Options outstanding under the 2006 Plan were unaffected by the termination of the plan. The shares of common stock reserved for issuance under the 2006 Stock Plan at the termination of the 2006 Plan/adoption of the 2013 were added to the initial reserve under the 2013 Plan. In addition, any shares of common stock reserved for issuance upon exercise of any options issued under the 2006 Plan that are forfeited, canceled or terminated (other than by exercise) subsequent to adoption of the 2013 Plan, up to an aggregate of 11,400,000 shares, roll over from the 2006 Plan to the 2013 Plan.
In March 2013, the Company’s board of directors and stockholders approved the 2013 Plan. The 2013 Plan provides for the issuance of stock options, restricted stock and restricted stock units (RSUs) and other compensatory equity award types.
91
Through December 31, 2014, the Company had issued only stock options and RSUs (performance and time-based) under the 2013 Plan.
A total of 3,600,000 shares of common stock were initially reserved for future issuance under the 2013 Plan. An additional 204,730 shares rolled over from the 2006 Plan to the 2013 Plan at the time of the initial public offering. Through December 31, 2014, an aggregate of 1,378,050 shares were added to the 2013 Plan as a result of the termination of options originally issued under the 2006 Plan. The 2013 Plan also provides for an automatic annual increase in shares reserved for issuance under the 2013 Plan on January 1 of each year in amount equal to the least of (i) 5,000,000 shares, (ii) four and one half percent (4.5%) of the outstanding shares on the last day of the immediately preceding fiscal year or (iii) such number of shares determined by the Board. On January 1, 2014, an additional 2,094,194 shares of common stock were reserved for future issuance under the 2013 Plan in accordance with the annual increase provision of the plan.
The following table shows the outstanding award balances and shares available for future issuance under the equity incentive plans at December 31, 2014:
At December 31, 2014 | ||
Options outstanding under 2006 Plan | 10,234,590 | |
Options outstanding under 2013 Plan | 1,097,039 | |
RSUs outstanding under 2013 Plan | 3,067,728 | |
Shares reserved for future issuance under 2013 Plan | 1,877,240 | |
Restricted Stock Units
In the years ended December 31, 2014 and 2013 the Compensation Committee of the Board of Directors awarded RSUs to employees. The RSUs generally vest quarterly over a four year period. The stock-based compensation expense related to RSUs is recognized on a ratable basis over the requisite service period of the grant. The fair value of RSUs is determined using the fair value of the Company’s common stock on the date of grant.
In the year ended December 31, 2014 the Compensation Committee of the Board of Directors awarded RSUs and performance based RSUs (PBRSUs) to members of the executive team. The performance based awards were subject to performance-based requirements as well as additional time based vesting requirements. The fair value of RSUs and PBRSUs is determined using the fair value of the Company’s common stock on the date of grant. The performance requirements related to the 2014 PBRSU grants were not met and the PBRSUs lapsed with no shares being issuable on December 31, 2014.
The following table shows a summary of RSU activity, which includes PBRSUs, for the year ended December 31, 2014:
Shares | Weighted-Average Grant Date Fair Value | |||||
Unvested as of December 31, 2013 | 42,500 | $ | 11.00 | |||
Granted | 4,784,704 | $ | 3.48 | |||
Vested | (662,195 | ) | $ | 4.49 | ||
Forfeited | (1,097,281 | ) | $ | 3.88 | ||
Unvested as of December 31, 2014 | 3,067,728 | |||||
The aggregate intrinsic value of RSUs outstanding was $9.9 million as of December 31, 2014. The Company recorded stock-based compensation expense related to RSUs of $3.3 million for the year ended December 31, 2014. As of December 31, 2014, there was $9.0 million of total unrecognized compensation expense related to RSUs, which is expected to be recognized over a weighted-average period of 1.1 years.
92
Employee Stock Options
In the years ended December 31, 2014 and 2013, the Compensation Committee of the Board of Directors awarded options to employees. Stock options generally have a term of 10 years and vest over a period of four years.
A summary of the activity and changes during the year ended December 31, 2014 and a summary of information related to options exercisable and vested and expected to vest are presented below:
Number of Shares Outstanding | Weighted Average Exercise Price | Weighted Average Remaining Contractual Life (Years) | Aggregate Intrinsic Value (in thousands) | |||||||||
Balance at December 31, 2013 | 12,957,942 | $ | 4.33 | 7.78 | $ | 27,629 | ||||||
Options granted | 1,050,105 | $ | 3.87 | |||||||||
Options exercised | (348,264 | ) | $ | 1.38 | ||||||||
Options forfeited | (1,518,154 | ) | $ | 7.38 | ||||||||
Balance at December 31, 2014 | 12,141,629 | $ | 3.99 | 6.57 | $ | 3,499 | ||||||
Options vested and expected to vest - December 31, 2014 | 12,055,621 | $ | 3.99 | 6.56 | $ | 3,497 | ||||||
Options exercisable - December 31, 2014 | 7,816,201 | $ | 3.27 | 5.81 | $ | 3,483 | ||||||
The fair value of options granted to employees during the years ended December 31, 2014, 2013 and 2012 was $1.7 million, $18.4 million and $13.3 million. The Company determined the fair value of each option grant on the date of grant using the Black-Scholes option-pricing model using the following factors:
Year Ended December 31, | |||||||||
2014 | 2013 | 2012 | |||||||
Expected term (years) | 6.08 | 6.08 | 6.08 | ||||||
Volatility | 41-44% | 46-55% | 55 | % | |||||
Risk-free interest rate | 1.49-1.95% | 0.70-1.75% | 0.62-1.02% | ||||||
Dividend yield | — | — | — | ||||||
The weighted-average fair value per share of options granted was $1.60, $4.99 and $2.15 for the years ended December 31, 2014, 2013 and 2012. The intrinsic value of employee options exercised for the years ended December 31, 2014, 2013 and 2012 was $0.7 million, $1.5 million and $0.3 million.
The following table summarizes the allocation of stock-based compensation in the accompanying consolidated statements of operations (in thousands):
Year ended December 31, | ||||||||||||
2014 | 2013 | 2012 | ||||||||||
Cost of revenue | $ | 378 | $ | 160 | $ | 57 | ||||||
Research and development | 3,800 | 2,348 | 745 | |||||||||
Sales and marketing | 3,701 | 2,165 | 656 | |||||||||
General and administrative | 2,674 | 2,576 | 639 | |||||||||
Total stock-based compensation | $ | 10,553 | $ | 7,249 | $ | 2,097 | ||||||
At December 31, 2014, the total unamortized stock-based compensation expense of $12.4 million, is to be recognized over a weighted-average period of 2.2 years.
93
9. Net Loss Per Share
The following table presents the calculation of basic and diluted net loss per share (in thousands, except per share data:
Year ended December 31, | ||||||||||||
2014 | 2013 | 2012 | ||||||||||
Net loss | $ | (59,224 | ) | $ | (40,732 | ) | $ | (16,601 | ) | |||
Weighted-average shares used to compute basic and diluted net loss per share | 46,956 | 30,836 | 2,515 | |||||||||
Basic and diluted net loss per share | $ | (1.26 | ) | $ | (1.32 | ) | $ | (6.60 | ) | |||
The following securities were excluded from the calculation of diluted net loss per share attributable to common stockholders because their effect would have been anti-dilutive for the periods presented (in thousands):
Year Ended December 31, | |||||||||
2014 | 2013 | 2012 | |||||||
Redeemable convertible preferred stock | — | — | 33,897 | ||||||
Employee stock options | 12,142 | 12,958 | 10,213 | ||||||
Restricted stock units | 3,149 | 43 | — | ||||||
Convertible preferred stock warrants | — | — | 1,010 | ||||||
Shares underlying the Notes | 20,470 | — | — | ||||||
Common stock warrants | 11,250 | — | — | ||||||
Total | 47,011 | 13,001 | 45,120 | ||||||
10. Income Taxes
The following table presents domestic and foreign components of loss before provision for income taxes (in thousands):
Year Ended December 31, | |||||||||||
2014 | 2013 | 2012 | |||||||||
United States | $ | (44,385 | ) | $ | (39,068 | ) | $ | (16,725 | ) | ||
Foreign | (14,559 | ) | (1,521 | ) | 164 | ||||||
Total | $ | (58,944 | ) | $ | (40,589 | ) | $ | (16,561 | ) | ||
The components of the provision for income taxes are as follows (in thousands):
Year Ended December 31, | |||||||||||
2014 | 2013 | 2012 | |||||||||
Current: | |||||||||||
Federal | $ | — | $ | — | $ | — | |||||
State | 18 | 20 | 6 | ||||||||
Foreign | 251 | 156 | 34 | ||||||||
Total current | 269 | 176 | 40 | ||||||||
Deferred: | |||||||||||
Federal | — | — | — | ||||||||
State | — | — | — | ||||||||
Foreign | 11 | (33 | ) | — | |||||||
Total deferred | 11 | (33 | ) | — | |||||||
Total provision | $ | 280 | $ | 143 | $ | 40 | |||||
94
The following table presents a reconciliation of the statutory federal rate and the Company’s effective tax rate for the periods presented:
Year Ended December 31, | ||||||||
2014 | 2013 | 2012 | ||||||
Federal income tax at statutory rate | 34.0 | % | 34.0 | % | 34.0 | % | ||
State income tax, net of federal benefit | 2.0 | 2.0 | 5.2 | |||||
Foreign taxes at less than statutory rate | (8.9 | ) | (1.6 | ) | 0.1 | |||
Intercompany transactions | — | (21.4 | ) | — | ||||
Nondeductible stock-based compensation | (1.9 | ) | (2.9 | ) | (3.0 | ) | ||
Nondeductible warrant/derivative fair value adjustment | (2.7 | ) | (2.2 | ) | (11.0 | ) | ||
Other permanent differences | 0.1 | (0.4 | ) | — | ||||
Tax credits generated in current year | 1.9 | 4.1 | — | |||||
Valuation allowance change | (24.0 | ) | (12.0 | ) | (25.5 | ) | ||
Total | 0.5 | % | (0.4 | )% | (0.2 | )% | ||
As a result of the Company’s history of net operating losses, the domestic provision for income taxes relates to accruals for state minimum and capital base income taxes and the foreign provision for income taxes are associated with non-U.S. operations.
The Company had unrecorded excess stock option tax benefits of $0.4 million and $0.2 million as of December 31, 2014 and 2013. These amounts will be credited to additional paid-in capital when such amounts reduce cash taxes payable.
Deferred income taxes reflect the net tax effects of temporary differences between the carrying amounts of assets and liabilities for financial reporting purposes and the amounts used for income tax purposes. The following table presents significant components of the Company’s deferred tax assets (in thousands):
December 31, | |||||||
2014 | 2013 | ||||||
Deferred tax assets: | |||||||
Deferred revenue | $ | 1,046 | $ | 2,417 | |||
Accrued expenses and reserves | 7,292 | 4,319 | |||||
Loss carryforwards | 37,118 | 27,687 | |||||
Tax credit carryforwards | 7,767 | 5,870 | |||||
Contribution carryforwards | 1 | 1 | |||||
Gross deferred tax assets | 53,224 | 40,294 | |||||
Valuation allowance | (53,061 | ) | (38,937 | ) | |||
Net deferred tax assets | 163 | 1,357 | |||||
Deferred tax liabilities: | |||||||
Basis difference for fixed assets | (145 | ) | (1,326 | ) | |||
Total deferred tax liabilities | (145 | ) | (1,326 | ) | |||
Net deferred tax assets | $ | 18 | $ | 31 | |||
A valuation allowance is provided when it is more likely than not that the deferred tax assets will not be realized. The Company established a full valuation allowance to offset domestic net deferred tax assets as of December 31, 2014 and 2013 due to the uncertainty of realizing future tax benefits from its net operating loss (“NOL”) carryforwards and other deferred tax assets. The valuation allowance increased by $14.1 million and $4.9 million during the years ended December 31, 2014 and 2013.
As of December 31, 2014, the Company had $108.1 million of federal and $84.1 million of state net operating loss carryforwards and $5.9 million of federal and $6.6 million of California research tax credit carryforwards available to reduce
95
future taxable income. These net operating loss carryforwards begin to expire in 2026 for U.S. federal income tax and 2015 for state income tax purposes, and the research tax credit carryforwards begin to expire in 2027 for federal purposes, but do not expire for California purposes.
Under Section 382 of the Tax Reform Act of 1986 and similar state provisions, the amounts of benefits from NOL and tax credit carryforwards may be impaired or limited on an annual basis in the event that the Company has a cumulative ownership change of more than 50%, as defined, over a three-year period. The annual limitation may result in the expiration of the NOL and tax credit carryforwards before utilization. The impact of any limitation that may be imposed due to current or future issuances of equity securities, including issuances with respect to acquisitions, has not been determined.
The Company has not provided for U.S. taxes on its foreign earnings, which are intended to be indefinitely reinvested outside the U.S. As of December 31, 2014 the Company had cumulative undistributed earnings of foreign subsidiaries of $0.6 million, which are intended to be reinvested outside the U.S and for which no U.S. income or foreign withholding taxes have been recorded. Determination of the amount of unrecognized deferred tax liability with respect to such earnings is not practicable. The additional taxes on the earnings of foreign subsidiaries, if remitted, would be partially offset by U.S. tax credits for foreign taxes already paid.
The Company has total unrecognized tax benefits as of December 31, 2014, 2013 and 2012 of $7.4 million, $6.6 million and $1.4 million. No amount of the unrecognized tax benefits, if recognized, would reduce the Company’s annual effective tax rate because the benefits are in the form of deferred tax assets for which a full valuation allowance has been recorded. The Company does not anticipate a significant change to its unrecognized tax benefits over the next twelve months. The following table reflects changes in the unrecognized tax benefits (in thousands):
December 31, | |||||||||||
2014 | 2013 | 2012 | |||||||||
Unrecognized tax benefits as of the beginning of the year | $ | 6,626 | $ | 1,444 | $ | 1,212 | |||||
Increase related to prior year tax provisions | — | 202 | — | ||||||||
Decrease related to prior year tax provisions | 749 | — | — | ||||||||
Increase related to current year tax provisions | — | 4,980 | 232 | ||||||||
Unrecognized tax benefits as of the end of the year | $ | 7,375 | $ | 6,626 | $ | 1,444 | |||||
The Company recognizes interest accrued and penalties related to unrecognized tax benefits in the income tax provision. As of December 31, 2014 and 2013, the Company accrued no interest and penalties in the statement of financial position. Total interest and penalties included in the statements of operations for the years ended December 31, 2014, 2013 and 2012 are each zero. The Company does not expect the amount of existing unrecognized tax benefits to change significantly within the next 12 months.
The Company files income tax returns in the United States, various states and certain foreign jurisdictions. The tax periods 2006 through 2013 remain open in most jurisdictions. The Company is not currently under examination by income tax authorities in federal, state or other foreign jurisdiction.
11. Employee Benefit Plan
The Company provides a defined contribution savings plan under Section 401(k) of the Internal Revenue Code. This plan covers substantially all employees who meet minimum age and service requirements and allows participants to defer a portion of their annual compensation on a pre-tax basis. Company contributions to the plan may be made at the discretion of the board of directors. There were no employer contributions under this plan for the years ended December 31, 2014, 2013 or 2012.
96
12. Concentration
Customers with a receivables balance of 10% or greater of the total receivables, which includes accounts receivable and lease receivables, and customers with revenue of 10% or greater of the total revenue are as follows:
Year Ended December 31, | As of December 31, | |||||||||||||
2014 | 2013 | 2012 | 2014 | 2013 | ||||||||||
Percentage of Revenue | Percentage of Receivables | |||||||||||||
Windstream | 29 | % | 39 | % | 45 | % | 59 | % | * | |||||
Colt Technology Services Ltd. and its affiliated entity KVH Company, Ltd. | 11 | % | * | * | * | * | ||||||||
TDS | * | 11 | % | * | * | * | ||||||||
*Represents less than 10%
13. Segment Information
The Company considers operating segments to be components of the Company in which separate financial information is available and is evaluated regularly by the Company’s chief operating decision maker in deciding how to allocate resources and in assessing performance. The chief operating decision maker ("CODM") for the Company is the Chief Executive Officer.
The Company operates as a single operating segment. This reflects the fact that the Company's CODM evaluates the Company’s financial information and resources, and assesses the performance of these resources on a consolidated basis. Since the Company operates as one operating segment, all required financial segment is included in the consolidated financial statements.
Revenue information by location is presented below (in thousands):
Year Ended December 31, | |||||||||||
2014 | 2013 | 2012 | |||||||||
United States | $ | 78,608 | $ | 106,341 | $ | 91,078 | |||||
Other | 21,875 | 10,241 | 4,794 | ||||||||
Total revenue | $ | 100,483 | $ | 116,582 | $ | 95,872 | |||||
Property and equipment, net by location is presented below (in thousands):
December 31, 2014 | December 31, 2013 | ||||||
United States | $ | 11,623 | $ | 10,977 | |||
Other | 273 | 178 | |||||
Total property and equipment, net | $ | 11,896 | $ | 11,155 | |||
14. Related Parties
A venture capital firm that is a greater than 10% stockholder of the Company is a subsidiary of the financial institution that managed the Company's portfolio of marketable securities. The managing partner of this particular venture capital firm is also a member of the Company's board of directors.
Certain parties affiliated with the Company purchased $17.0 million in aggregate principal amount of Notes and related Warrants. Mark Floyd, chief executive officer of the Company and chairman of the Company’s board of directors (the “Board”) purchased $2.0 million in aggregate principal amount of Notes and related Warrants, Michael Hatfield, president of the Company and a member of the Board purchased $4.0 million in aggregate principal amount of Notes and related Warrants, and affiliated funds of Norwest Venture Partners, with whom Promod Haque, a member of the Board, is affiliated, purchased $11.0 million in aggregate principal amount of Notes and related Warrants.
97
Item 9. Changes in and Disagreements with Accountants on Accounting and Financial Disclosure
None.
Item 9A. Controls and Procedures
Evaluation of Disclosure Controls and Procedures
Our management has evaluated, under the supervision and with the participation of our Chief Executive Officer and Chief Financial Officer, the effectiveness of our disclosure controls and procedures (as defined in Rules 13a-15(e) and 15d-15(e) under the Securities Exchange Act of 1934, as amended (Exchange Act) as of December 31, 2014. Based on their evaluation as of December 31, 2014, our Chief Executive Officer and Chief Financial Officer have concluded that our disclosure controls and procedures were effective at the reasonable assurance level to ensure that the information required to be disclosed by us in this Annual Report on Form 10K was (i) recorded, processed, summarized and reported within the time periods specified in the SEC’s rules and regulations and (ii) accumulated and communicated to our management, including our Chief Executive Officer and Chief Financial Officer, to allow timely decisions regarding required disclosure.
Management’s Annual Report on Internal Control over Financial Reporting
Our management is responsible for establishing and maintaining adequate internal control over financial reporting, as such term is defined in Exchange Act Rules 13a-15(f) and 15d-15(f). Our internal control over financial reporting is designed to provide reasonable assurance regarding the reliability of financial reporting and the preparation of financial statements for external purposes in accordance with generally accepted accounting principles. Under the supervision and with the participation of our Chief Executive Officer and Chief Financial Officer, our management evaluated the effectiveness of our internal control over financial reporting based on the framework set forth in “Internal Control - Integrated Framework (2013)” issued by the Committee of Sponsoring Organizations of the Treadway Commission. Based on this evaluation, our management concluded that our internal control over financial reporting was effective as of December 31, 2014. Our management reviewed the results of this evaluation with the audit committee of our board of directors.
This Annual Report on Form 10-K does not include an attestation report of our registered public accounting firm on our internal control over financial reporting due to an exemption established by the JOBS Act for “emerging growth companies.”
Changes in Internal Control over Financial Reporting
There was no change in our internal control over financial reporting identified in connection with the evaluation required by Rule 13a-15(d) and 15d-15(d) of the Exchange Act that occurred during the three months ended December 31, 2014 that has materially affected, or is reasonably likely to materially affect, our internal control over financial reporting.
Inherent Limitations on Effectiveness of Controls
Our management, including our Chief Executive Officer and Chief Financial Officer, believes that our disclosure controls and procedures and internal control over financial reporting are designed to provide reasonable assurance of achieving their objectives and are effective at the reasonable assurance level. However, our management does not expect that our disclosure controls and procedures or our internal control over financial reporting will prevent all errors and all fraud. A control system, no matter how well conceived and operated, can provide only reasonable, not absolute, assurance that the objectives of the control system are met. Further, the design of a control system must reflect the fact that there are resource constraints, and the benefits of controls must be considered relative to their costs. Because of the inherent limitations in all control systems, no evaluation of controls can provide absolute assurance that all control issues and instances of fraud, if any, have been detected. These inherent limitations include the realities that judgments in decision making can be faulty, and that breakdowns can occur because of a simple error or mistake. Additionally, controls can be circumvented by the individual acts of some persons, by collusion of two or more people or by management override of the controls. The design of any system of controls also is based in part upon certain assumptions about the likelihood of future events, and there can be no assurance that any design will succeed in achieving its stated goals under all potential future conditions; over time, controls may become inadequate because of changes in conditions, or the degree of compliance with policies or procedures may deteriorate. Because of the inherent limitations in a cost-effective control system, misstatements due to error or fraud may occur and not be detected.
98
Item 9B. Other information
None.
Item 10. Directors, Executive Officers and Corporate Governance
The information required by Item 10 of this Annual Report on Form 10-K is included under the captions “Election of Directors,” “Executive Officers,” “Section 16(a) Beneficial Ownership Reporting Compliance” and “Corporate Governance” in our Proxy Statement for the 2015 Annual Meeting of Stockholders (the "2015 Proxy Statement") to be filed within 120 days after the end of the year to which this report relates and is incorporated herein by reference.
Item 11. Executive Compensation
The information required by Item 11 of this Annual Report on Form 10-K is included under the caption “Compensation of Executive Officers” in our 2015 Proxy Statement and is incorporated herein by reference.
Item 12. Security Ownership of Certain Beneficial Owners and Management and Related Stockholder Matters
The information required by Item 12 of this Annual Report on Form 10-K is included under the captions “Equity Compensation Plan Information” and “Security Ownership of Certain Beneficial Owners and Management” in our 2015 Proxy Statement and is incorporated herein by reference.
Item 13. Certain Relationships and Related Transactions, and Director Independence
The information required by Item 13 of this Annual Report on Form 10-K is included under the captions “Review, Approval or Ratification of Transactions with Related Persons” and “Corporate Governance” in our 2015 Proxy Statement and is incorporated herein by reference.
Item 14. Principal Accounting Fees and Services
The information required by Item 14 of this Annual Report on Form 10-K is incorporated under the captions “Independent Registered Public Accounting Firm’s Fees” and “Pre-Approval Policies and Procedures” in our 2015 Proxy Statement and is incorporated herein by reference.
Part IV.
Item 15. Exhibits and Financial Statement Schedules
(1) Consolidated Financial Statements
See Index to Consolidated Financial Statements at Item 8 herein.
(2) Financial Statement Schedules
Schedules not listed have been omitted because the information required to be set forth therein is not applicable or is shown in the Consolidated Financial Statements or notes herein.
(3) Exhibits
See the Exhibit Index immediately following the signature page of this Annual Report on Form 10-K.
99
SIGNATURES
Pursuant to the requirements of Section 13 or 15(d) of the Securities Exchange Act of 1934, the Registrant has duly caused this Annual Report on Form 10-K to be signed on its behalf by the undersigned, thereunto duly authorized, on March 27, 2015.
CYAN, INC. | ||
By: | /s/ Mark A. Floyd | |
Mark A. Floyd | ||
Chief Executive Officer and | ||
Chairman of the Board of Directors | ||
(Principal Executive Officer) | ||
By: | /s/ Jeffrey G. Ross | |
Jeffrey G. Ross | ||
Vice President and Chief Financial Officer | ||
(Principal Accounting and Financial Officer) | ||
Pursuant to the requirements of the Securities Exchange Act of 1934, this Annual Report on Form 10-K has been signed below by the following persons on behalf of the Registrant and in the capacities and on the dates indicated.
Signature | Title | Date | ||
/s/ Mark A. Floyd | Chief Executive Officer and | |||
Mark A. Floyd | Chairman of the Board of Directors | March 27, 2015 | ||
(Principal Executive Officer) | ||||
/s/ Jeffrey G. Ross | Vice President and Chief Financial | |||
Jeffrey G. Ross | Officer (Principal Accounting and Financial Officer) | March 27, 2015 | ||
/s/ Michael L. Hatfield | ||||
Michael L. Hatfield | President and Director | March 27, 2015 | ||
/s/ Paul A. Ferris | ||||
Paul A. Ferris | Director | March 27, 2015 | ||
/s/ Promod Haque | ||||
Promod Haque | Director | March 27, 2015 | ||
/s/ M. Niel Ransom | ||||
M. Niel Ransom | Director | March 27, 2015 | ||
/s/ Michael J. Boustridge | ||||
Michael J. Boustridge | Director | March 27, 2015 | ||
/s/ Robert E. Switz | ||||
Robert E. Switz | Director | March 27, 2015 | ||
100
Exhibit Index
Incorporated by Reference Herein | |||||
Exhibit Number | Exhibit Description | Filed Herewith | Form / File No. | Exhibit | Exhibit Filing Date |
3.1 | Amended and Restated Certificate of Incorporation of the Registrant. | Annual Report on Form 10-K | 3.1 | March 25, 2014 | |
3.2 | Amended and Restated Bylaws of the Registrant. | Annual Report on Form 10-K | 3.2 | March 25, 2014 | |
4.1 | Indenture, dated as of December 12, 2014, by and between Cyan, Inc. and U.S. Bank National Association, as trustee and collateral agent. | Current Report on Form 8-K | 4.1 | December 17, 2014 | |
4.2 | Form of 2014 Common Stock Warrant Agreement | Current Report on Form 8-K | 4.2 | December 17, 2014 | |
4.3 | Amended and Restated Investors’ Rights Agreement, dated December 12, 2014, by and among Cyan. Inc. and certain of its stockholders. | Current Report on Form 8-K | 4.3 | December 17, 2014 | |
10.1+ | Form of Indemnification Agreement between the Registrant and each of its directors and executive officers. | Form S-1 (No. 333-187732) | 10.1 | April 4, 2013 | |
10.2.1+ | 2006 Stock Plan. | Form S-1 (No. 333-187732) | 10.2.1 | April 4, 2013 | |
10.2.2+ | Form of Option Grant Notice and Option Agreement for 2006 Stock Plan: New Hire U.S. Executive. | Form S-1 (No. 333-187732) | 10.2.2 | April 4, 2013 | |
10.2.3+ | Form of Option Grant Notice and Option Agreement for 2006 Stock Plan: New Hire U.S. Non-Executive. | Form S-1 (No. 333-187732) | 10.2.3 | April 4, 2013 | |
10.2.4+ | Form of Option Grant Notice and Option Agreement for 2006 Stock Plan: U.S. Director. | Form S-1 (No. 333-187732) | 10.2.4 | April 4, 2013 | |
10.2.5+ | Form of Option Grant Notice and Option Agreement for 2006 Stock Plan: Refresh Grant U.S. Executive. | Form S-1 (No. 333-187732) | 10.2.5 | April 4, 2013 | |
10.2.6+ | Form of Option Grant Notice and Option Agreement for 2006 Stock Plan: Refresh Grant U.S. Non-Executive. | Form S-1 (No. 333-187732) | 10.2.6 | April 4, 2013 | |
10.2.7+ | Form of Option Grant Notice and Option Agreement for 2006 Stock Plan: New Hire Non-U.S. Non-Executive. | Form S-1 (No. 333-187732) | 10.2.7 | April 4, 2013 | |
10.3.1+ | 2013 Equity Incentive Plan | Form S-1 (No. 333-187732) | 10.3.1 | April 4, 2013 | |
10.3.2+ | Form of U.S. Stock Option Award Agreement for 2013 Equity Incentive Plan. | Form S-1 (No. 333-187732) | 10.1.2 | April 4, 2013 | |
10.3.3+ | Form of U.S. Restricted Stock Unit Agreement for 2013 Equity Incentive Plan. | Form S-1 (No. 333-187732) | 10.3.3 | April 4, 2013 | |
10.3.4+ | Form of Non-U.S. Stock Option Award Agreement for 2013 Equity Incentive Plan. | Form S-1 (No. 333-187732) | 10.3.4 | April 4, 2013 | |
10.3.5+ | Form of Non-U.S. Restricted Stock Unit Agreement for 2013 Equity Incentive Plan. | Form S-1 (No. 333-187732) | 10.3.5 | April 4, 2013 | |
10.4+ | Offer Letter by and between the Registrant and Mark Floyd, dated May 4, 2012. | Form S-1 (No. 333-187732) | 10.4 | April 4, 2013 | |
10.5+ | Offer Letter by and between the Registrant and Norm Foust, dated January 8, 2007. | Form S-1 (No. 333-187732) | 10.6 | April 4, 2013 | |
10.6+ | Offer Letter by and between the Registrant and James A. Hamilton, dated February 18, 2013. | Form S-1 (No. 333-187732) | 10.7 | April 4, 2013 | |
10.7+ | Offer Letter by and between the Registrant and Scott Pradels, dated November 2, 2006. | Form S-1 (No. 333-187732) | 10.8 | April 4, 2013 | |
10.8+ | Offer Letter by and between the Registrant and Kenneth Siegel, dated August 23, 2012. | Form S-1 (No. 333-187732) | 10.9 | April 4, 2013 | |
10.9+ | Offer Letter by and between the Registrant and Jeff Ross, dated March 25, 2014. | Current Report on Form 8-K | 10.1C | March 27, 2014 | |
10.10+ | Form of Severance and Change in Control Agreement between the Registrant and each of its executive officers. | Form S-1 (No. 333-187732) | 10.11 | April 4, 2013 | |
10.11+ | Non-Employee Director Compensation Program as amended March 2015 | X | |||
10.12+ | Non-Sales Incentive Compensation Plan | Form 8-K (No. 333-188467) | 10.1 | May 28, 2013 | |
10.13.1 | Full Service Lease by and between the Registrant and Redwood Technology Center, LLC, and Redwood Business Center 1, LLC as successor in interest, dated April 25, 2007, as amended September 4, 2012. | Form S-1 (No. 333-187732) | 10.13 | April 4, 2013 | |
10.13.2 | Fourth Amendment to Full Service Lease by and between the Registrant and Redwood Technology Center, LLC, and Redwood Business Center 1, LLC, dated March 1, 2013. | Form 10-Q | 10.1 | August 13, 2013 | |
10.13.3 | Fifth Amendment to Full Service Lease by and between the Registrant and Redwood Technology Center, LLC, and Redwood Business Center 1, LLC, dated July 2, 2013. | Form 10-Q | 10.2 | August 13, 2013 | |
10.13.4 | Sixth Amendment to Full Service Lease by and between the Registrant and Redwood Technology Center, LLC, and Redwood Business Center 1, LLC, dated July 29, 2013. | Form 10-Q | 10.3 | August 13, 2013 | |
10.14.1 | Full Service Lease by and among the Registrant and Redwood Business Center 1 LLC and Amerivine Town Center LLC, dated July 2, 2013. | Form 10-Q | 10.4 | August 13, 2013 | |
10.14.2 | First Amendment dated July 29, 2013 to Full Service Lease by and among the Registrant and Redwood Business Center 1 LLC and Amerivine Town Center LLC, dated July 29, 2013. | Form 10-Q | 10.5 | August 13, 2013 | |
10.15.1† | Flextronics Manufacturing Services Agreement by and between the Registrant and Flextronics Telecom Systems Ltd., dated June 22, 2007, as amended. | Form S-1 (No. 333-187732) | 10.12 | April 4, 2013 | |
10.15.2 | Amended & Restated Master Lease by and between the Registrant and Windstream Supply LLC, dated September 27, 2013. | Form 10-Q | 10.1 | November 13, 2013 | |
10.15.3 | Amended & Restated Master Equipment Lease Commitment Agreement by and between the Registrant and Windstream Supply LLC, dated September 27, 2013. | Form 10-Q | 10.2 | November 13, 2013 | |
10.15.4 | Continuing Guaranty agreement by and between the Registrant and Windstream Supply LLC, dated August 27, 2013. | Form 10-Q | 10.3 | November 13, 2013 | |
10.16 | Security and Pledge Agreement, dated as of December 12, 2014, by and between Cyan, Inc. and U.S. Bank National Association, as collateral agent. | Current Report on 8-K | 10.2 | December 17, 2014 | |
21.1 | List of Subsidiaries | Annual Report on Form 10-K | 21.1 | March 25, 2014 | |
23.1 | Consent of Independent Registered Public Accounting Firm. | X | |||
24.1 | Power of Attorney (attached to the signature page of this Annual Report on Form 10-K). | X | |||
31.1 | Certification of Principal Executive Officer Required Under Rule 13a-14(a) and 15d-14(a) of the Securities Exchange Act of 1934, as amended. | X | |||
31.2 | Certification of Principal Financial Officer Required Under Rule 13a-14(a) and 15d-14(a) of the Securities Exchange Act of 1934, as amended. | X | |||
32.1(1) | Certification of the Chief Executive Officer pursuant to 18 U.S.C. Section 1350, as adopted pursuant to Section 906 of the Sarbanes-Oxley Act of 2002 | X | |||
32.2(1) | Certification of the Chief Financial Officer pursuant to 18 U.S.C. Section 1350, as adopted pursuant to Section 906 of the Sarbanes-Oxley Act of 2002 | X | |||
101.INS | XBRL Instance Document | X | |||
101.SCH | XBRL Taxonomy Extension Schema Document | X | |||
101.CAL | XBRL Taxonomy Extension Calculation Linkbase Document | X | |||
101.DEF | XBRL Taxonomy Extension Definition Linkbase Document | X | |||
101.LAB | XBRL Taxonomy Extension Label Linkbase Document | X | |||
101.PRE | XBRL Taxonomy Extension Presentation Linkbase Document | X | |||
+ | Indicates a management contract or compensatory plan. |
† | Registrant has omitted portions of the relevant exhibit and filed such exhibit separately with the Securities and Exchange Commission pursuant to a request for confidential treatment under Rule 406 under the Securities Act of 1933, as amended. |
(1) This certification is deemed not filed for purpose of section 18 of the Exchange Act or otherwise subject to the liability of that section, nor shall it be deemed incorporated by reference into any filing under the Securities Act or the Exchange Act.