Attached files
| file | filename |
|---|---|
| 8-K - CURRENT REPORT OF MATERIAL EVENTS OR CORPORATE CHANGES - Monogram Residential Trust, Inc. | a15-7697_18k.htm |
| EX-99.1 - EX-99.1 - Monogram Residential Trust, Inc. | a15-7697_1ex99d1.htm |
Exhibit 99.2
|
|
Monogram Residential Trust, Inc. Supplemental Financial Information Fourth Quarter and Full Year 2014 |
|
|
Forward–Looking Statements 3 Financial Information Consolidated Balance Sheets 4 Proportionate Balance Sheet Information 5 Consolidated Statements of Operations 7 Funds from Operations, Core FFO and Adjusted Core Funds from Operations 8 Proportionate Operating Information and Reconciliation to FFO 9 EBITDA Reconciliation 11 Portfolio Overview Geographic Regions 12 Summary of Number of Units and Communities 13 Summary of Operating Communities 14 Summary of Proportionate Share of Notes Receivable 17 Operating Performance Consolidated Net Operating Income 18 Reconciliation of Consolidated Net Operating Income 19 Consolidated QTD Net Operating Income and Other Operating Metrics 20 Proportionate Share QTD Net Operating Income and Other Operating Metrics 21 Consolidated YTD Net Operating Income and Other Operating Metrics 22 Proportionate Share YTD Net Operating Income and Other Operating Metrics 23 Consolidated QTD and YTD Comparisons of Same Store Operating Expenses 24 Proportionate Share QTD General Administrative and Corporate Property Management Expenses 25 Capital Deployment Summary of Developments 26 Acquisition and Disposition Summary 27 Capital Expenditures - Same Store 28 Capitalization Debt Summary 29 Debt Detail by Multifamily Community 31 Sources of Funds Available 33 Equity Capitalization Preferred Stock, Common Stock and Common Stock Equivalents 34 Net Asset Value Road Map to Net Asset Value 35 Co-Investment Venture Partners Information on Joint Ventures 37 Definitions and other Explanatory Information 38 Table of Contents Fourth Quarter and Full Year 2014 © 2015 Monogram Residential Trust, Inc. 2 |
|
|
Forward– Looking Statements Fourth Quarter and Full Year 2014 This supplemental package contains certain statements that may be considered forward-looking statements within the meaning of Section 27A of the Securities Act of 1933 and Section 21E of the Securities Exchange Act of 1934. Such forward-looking statements can generally be identified by our use of forward-looking terminology such as “may,” “will,” “expect,” “intend,” “anticipate,” “estimate,” “believe,” “continue,” or other similar words. Readers are cautioned not to place undue reliance on these forward-looking statements, which speak only as of the date this supplemental package is published, and which are subject to certain risks and uncertainties which could cause actual results to differ materially from those projected or anticipated. The following are some of the factors that could cause our actual results and its expectations to differ materially from those described in our forward-looking statements: we may abandon or defer development opportunities for a number of reasons, including changes in local market conditions which make development less desirable, increases in costs of development, increases in the cost of capital or lack of capital availability, resulting in losses; construction costs of a community may exceed our original estimates; we may not complete construction and lease-up of communities under development or redevelopment on schedule, resulting in increased interest costs and construction costs and a decrease in our expected rental revenues; occupancy rates and market rents may be adversely affected by competition and local economic and market conditions which are beyond our control; financing may not be available on favorable terms or at all, and our cash flows from operations and access to cost effective capital may be insufficient for the development of our pipeline which could limit our pursuit of opportunities; our cash flows may be insufficient to meet required payments of principal and interest, and we may be unable to refinance existing indebtedness or the terms of such refinancing may not be as favorable as the terms of existing indebtedness; and we may be unsuccessful in managing changes in our portfolio composition. Other important risk factors regarding our company are included under the caption “Risk Factors” in our Annual Report on Form 10-K for the year ended December 31, 2014 and may be discussed in subsequent filings with the SEC. We do not intend to publicly update or revise any forward-looking statements, whether as a result of new information, future events, or otherwise. © 2015 Monogram Residential Trust, Inc. 3 |
|
|
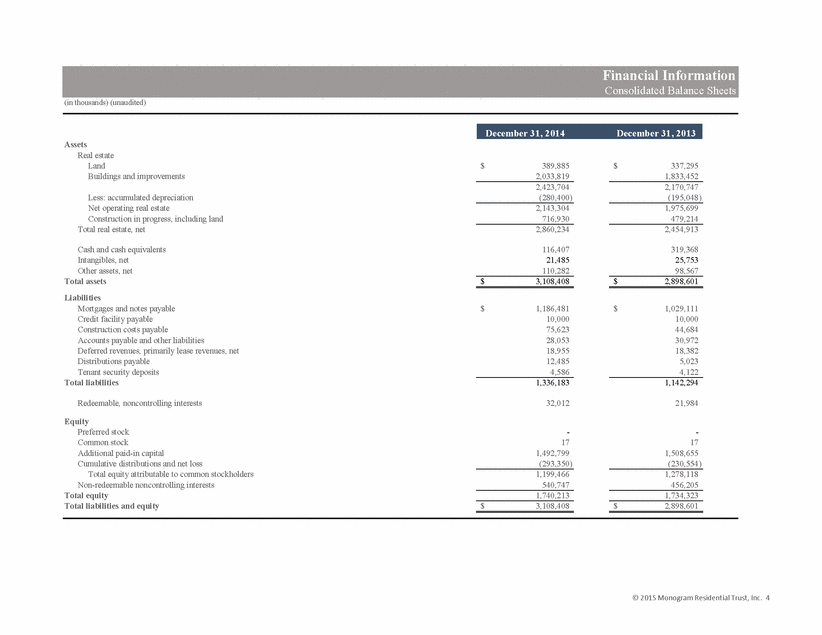
(in thousands) (unaudited) December 31, 2014 December 31, 2013 Assets Real estate Land 389,885 $ 337,295 $ Buildings and improvements 2,033,819 1,833,452 2,423,704 2,170,747 Less: accumulated depreciation (280,400) (195,048) Net operating real estate 2,143,304 1,975,699 Construction in progress, including land 716,930 479,214 Total real estate, net 2,860,234 2,454,913 Cash and cash equivalents 116,407 319,368 Intangibles, net 21,485 25,753 Other assets, net 110,282 98,567 Total assets 3,108,408 $ 2,898,601 $ Liabilities Mortgages and notes payable 1,186,481 $ 1,029,111 $ Credit facility payable 10,000 10,000 Construction costs payable 75,623 44,684 Accounts payable and other liabilities 28,053 30,972 Deferred revenues, primarily lease revenues, net 18,955 18,382 Distributions payable 12,485 5,023 Tenant security deposits 4,586 4,122 Total liabilities 1,336,183 1,142,294 Redeemable, noncontrolling interests 32,012 21,984 Equity Preferred stock - - Common stock 17 17 Additional paid-in capital 1,492,799 1,508,655 Cumulative distributions and net loss (293,350) (230,554) Total equity attributable to common stockholders 1,199,466 1,278,118 Non-redeemable noncontrolling interests 540,747 456,205 Total equity 1,740,213 1,734,323 Total liabilities and equity 3,108,408 $ 2,898,601 $ Financial Information Consolidated Balance Sheets © 2015 Monogram Residential Trust, Inc. 4 |
|
|
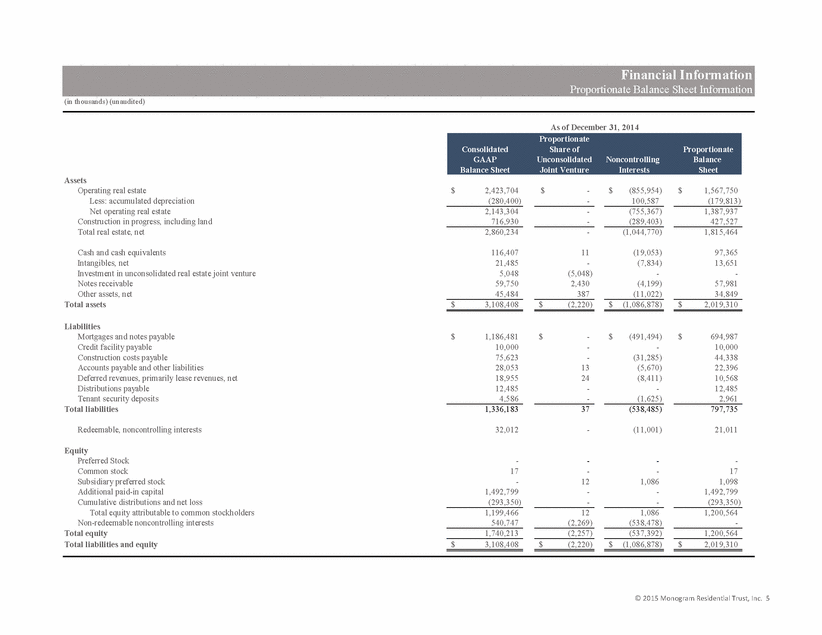
(in thousands) (unaudited) Proportionate Consolidated Share of Proportionate GAAP Unconsolidated Noncontrolling Balance Balance Sheet Joint Venture Interests Sheet Assets Operating real estate 2,423,704 $ - $ (855,954) $ 1,567,750 $ Less: accumulated depreciation (280,400) - 100,587 (179,813) Net operating real estate 2,143,304 - (755,367) 1,387,937 Construction in progress, including land 716,930 - (289,403) 427,527 Total real estate, net 2,860,234 - (1,044,770) 1,815,464 Cash and cash equivalents 116,407 11 (19,053) 97,365 Intangibles, net 21,485 - (7,834) 13,651 Investment in unconsolidated real estate joint venture 5,048 (5,048) - - Notes receivable 59,750 2,430 (4,199) 57,981 Other assets, net 45,484 387 (11,022) 34,849 Total assets 3,108,408 $ (2,220) $ (1,086,878) $ 2,019,310 $ Liabilities Mortgages and notes payable 1,186,481 $ - $ (491,494) $ 694,987 $ Credit facility payable 10,000 - - 10,000 Construction costs payable 75,623 - (31,285) 44,338 Accounts payable and other liabilities 28,053 13 (5,670) 22,396 Deferred revenues, primarily lease revenues, net 18,955 24 (8,411) 10,568 Distributions payable 12,485 - - 12,485 Tenant security deposits 4,586 - (1,625) 2,961 Total liabilities 1,336,183 37 (538,485) 797,735 Redeemable, noncontrolling interests 32,012 - (11,001) 21,011 Equity Preferred Stock - - - - Common stock 17 - - 17 Subsidiary preferred stock - 12 1,086 1,098 Additional paid-in capital 1,492,799 - - 1,492,799 Cumulative distributions and net loss (293,350) - - (293,350) Total equity attributable to common stockholders 1,199,466 12 1,086 1,200,564 Non-redeemable noncontrolling interests 540,747 (2,269) (538,478) - Total equity 1,740,213 (2,257) (537,392) 1,200,564 Total liabilities and equity 3,108,408 $ (2,220) $ (1,086,878) $ 2,019,310 $ Financial Information Proportionate Balance Sheet Information As of December 31, 2014 © 2015 Monogram Residential Trust, Inc. 5 |
|
|
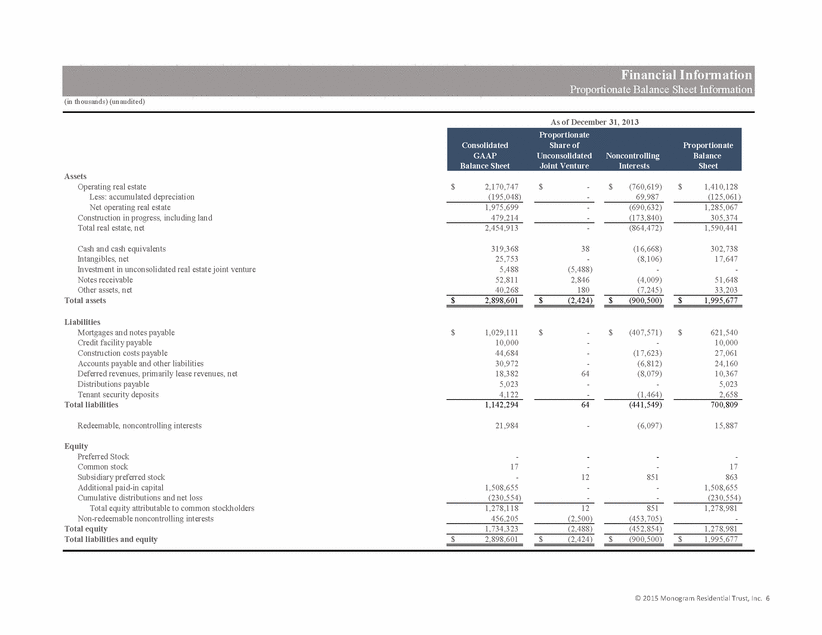
(in thousands) (unaudited) Proportionate Consolidated Share of Proportionate GAAP Unconsolidated Noncontrolling Balance Balance Sheet Joint Venture Interests Sheet Assets Operating real estate 2,170,747 $ - $ (760,619) $ 1,410,128 $ Less: accumulated depreciation (195,048) - 69,987 (125,061) Net operating real estate 1,975,699 - (690,632) 1,285,067 Construction in progress, including land 479,214 - (173,840) 305,374 Total real estate, net 2,454,913 - (864,472) 1,590,441 Cash and cash equivalents 319,368 38 (16,668) 302,738 Intangibles, net 25,753 - (8,106) 17,647 Investment in unconsolidated real estate joint venture 5,488 (5,488) - - Notes receivable 52,811 2,846 (4,009) 51,648 Other assets, net 40,268 180 (7,245) 33,203 Total assets 2,898,601 $ (2,424) $ (900,500) $ 1,995,677 $ Liabilities Mortgages and notes payable 1,029,111 $ - $ (407,571) $ 621,540 $ Credit facility payable 10,000 - - 10,000 Construction costs payable 44,684 - (17,623) 27,061 Accounts payable and other liabilities 30,972 - (6,812) 24,160 Deferred revenues, primarily lease revenues, net 18,382 64 (8,079) 10,367 Distributions payable 5,023 - - 5,023 Tenant security deposits 4,122 - (1,464) 2,658 Total liabilities 1,142,294 64 (441,549) 700,809 Redeemable, noncontrolling interests 21,984 - (6,097) 15,887 Equity Preferred Stock - - - - Common stock 17 - - 17 Subsidiary preferred stock - 12 851 863 Additional paid-in capital 1,508,655 - - 1,508,655 Cumulative distributions and net loss (230,554) - - (230,554) Total equity attributable to common stockholders 1,278,118 12 851 1,278,981 Non-redeemable noncontrolling interests 456,205 (2,500) (453,705) - Total equity 1,734,323 (2,488) (452,854) 1,278,981 Total liabilities and equity 2,898,601 $ (2,424) $ (900,500) $ 1,995,677 $ Financial Information Proportionate Balance Sheet Information As of December 31, 2013 © 2015 Monogram Residential Trust, Inc. 6 |
|
|
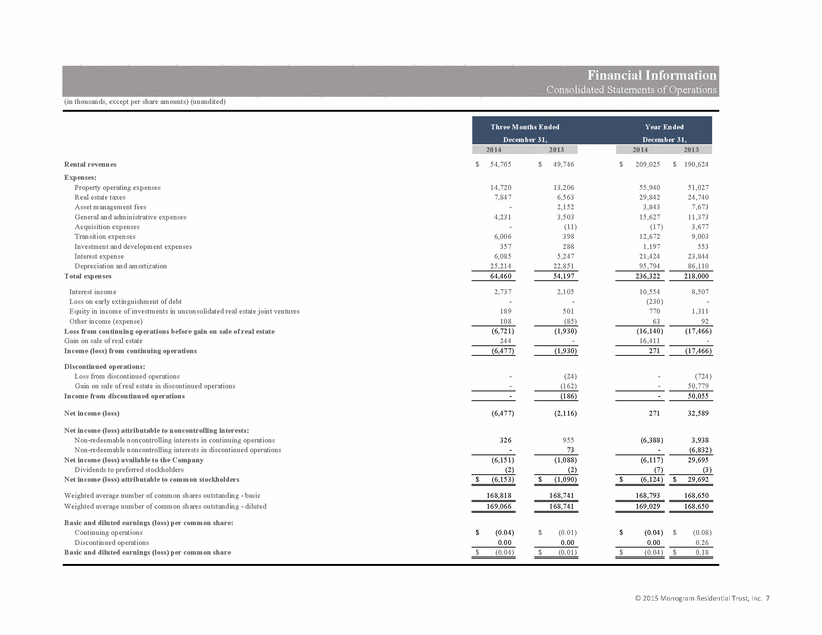
(in thousands, except per share amounts) (unaudited) 2014 2013 2014 2013 Rental revenues 54,705 $ 49,746 $ 209,025 $ 190,624 $ Expenses: Property operating expenses 14,720 13,206 55,940 51,027 Real estate taxes 7,847 6,563 29,842 24,740 Asset management fees - 2,152 3,843 7,673 General and administrative expenses 4,231 3,503 15,627 11,373 Acquisition expenses - (11) (17) 3,677 Transition expenses 6,006 398 12,672 9,003 Investment and development expenses 357 288 1,197 553 Interest expense 6,085 5,247 21,424 23,844 Depreciation and amortization 25,214 22,851 95,794 86,110 Total expenses 64,460 54,197 236,322 218,000 Interest income 2,737 2,105 10,554 8,507 Loss on early extinguishment of debt - - (230) - Equity in income of investments in unconsolidated real estate joint ventures 189 501 770 1,311 Other income (expense) 108 (85) 63 92 Loss from continuing operations before gain on sale of real estate (6,721) (1,930) (16,140) (17,466) Gain on sale of real estate 244 - 16,411 - Income (loss) from continuing operations (6,477) (1,930) 271 (17,466) Discontinued operations: Loss from discontinued operations - (24) - (724) Gain on sale of real estate in discontinued operations - (162) - 50,779 Income from discontinued operations - (186) - 50,055 Net income (loss) (6,477) (2,116) 271 32,589 Net income (loss) attributable to noncontrolling interests: Non-redeemable noncontrolling interests in continuing operations 326 955 (6,388) 3,938 Non-redeemable noncontrolling interests in discontinued operations - 73 - (6,832) Net income (loss) available to the Company (6,151) (1,088) (6,117) 29,695 Dividends to preferred stockholders (2) (2) (7) (3) Net income (loss) attributable to common stockholders (6,153) $ (1,090) $ (6,124) $ 29,692 $ Weighted average number of common shares outstanding - basic 168,818 168,741 168,793 168,650 Weighted average number of common shares outstanding - diluted 169,066 168,741 169,029 168,650 Basic and diluted earnings (loss) per common share: Continuing operations (0.04) $ (0.01) $ (0.04) $ (0.08) $ Discontinued operations 0.00 0.00 0.00 0.26 Basic and diluted earnings (loss) per common share (0.04) $ (0.01) $ (0.04) $ 0.18 $ Financial Information Consolidated Statements of Operations December 31, Year Ended December 31, Three Months Ended © 2015 Monogram Residential Trust, Inc. 7 |
|
|
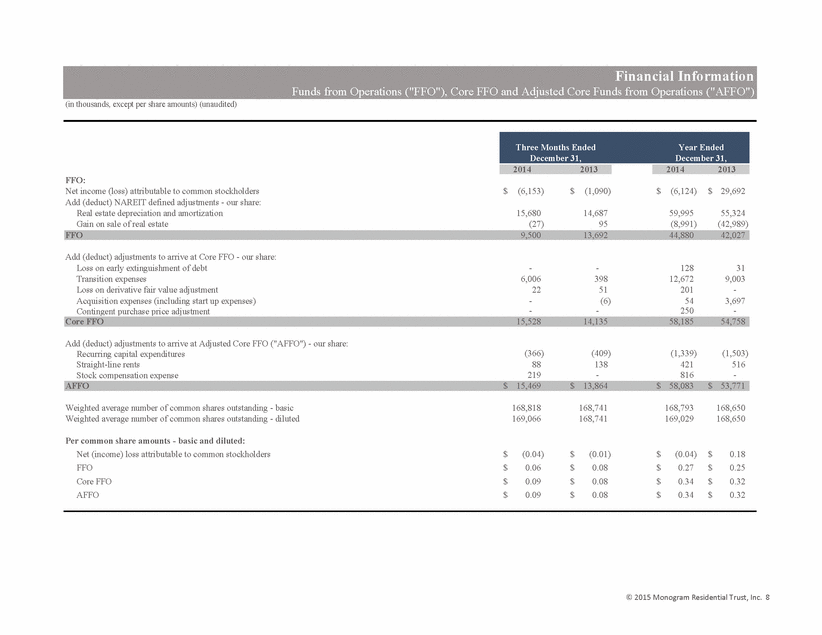
(in thousands, except per share amounts) (unaudited) 2014 2013 2014 2013 FFO: Net income (loss) attributable to common stockholders (6,153) $ (1,090) $ (6,124) $ 29,692 $ Add (deduct) NAREIT defined adjustments - our share: Real estate depreciation and amortization 15,680 14,687 59,995 55,324 Gain on sale of real estate (27) 95 (8,991) (42,989) FFO 9,500 13,692 44,880 42,027 Add (deduct) adjustments to arrive at Core FFO - our share: Loss on early extinguishment of debt - - 128 31 Transition expenses 6,006 398 12,672 9,003 Loss on derivative fair value adjustment 22 51 201 - Acquisition expenses (including start up expenses) - (6) 54 3,697 Contingent purchase price adjustment - - 250 - Core FFO 15,528 14,135 58,185 54,758 Add (deduct) adjustments to arrive at Adjusted Core FFO ("AFFO") - our share: Recurring capital expenditures (366) (409) (1,339) (1,503) Straight-line rents 88 138 421 516 Stock compensation expense 219 - 816 - AFFO 15,469 $ 13,864 $ 58,083 $ 53,771 $ Weighted average number of common shares outstanding - basic 168,818 168,741 168,793 168,650 Weighted average number of common shares outstanding - diluted 169,066 168,741 169,029 168,650 Per common share amounts - basic and diluted: Net (income) loss attributable to common stockholders (0.04) $ (0.01) $ (0.04) $ 0.18 $ FFO 0.06 $ 0.08 $ 0.27 $ 0.25 $ Core FFO 0.09 $ 0.08 $ 0.34 $ 0.32 $ AFFO 0.09 $ 0.08 $ 0.34 $ 0.32 $ December 31, December 31, Financial Information Three Months Ended Year Ended Funds from Operations ("FFO"), Core FFO and Adjusted Core Funds from Operations ("AFFO") © 2015 Monogram Residential Trust, Inc. 8 |
|
|
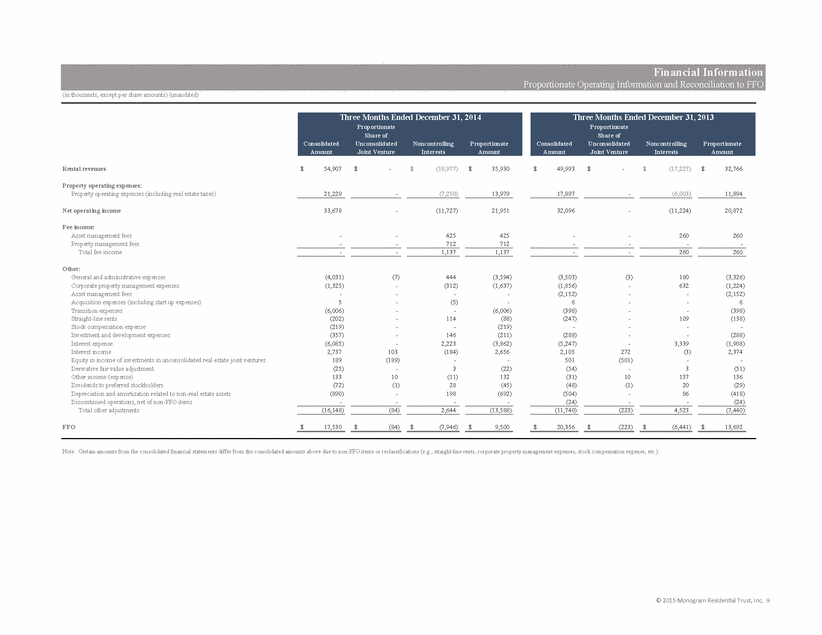
(in thousands, except per share amounts) (unaudited) Proportionate Proportionate Share of Share of Consolidated Unconsolidated Noncontrolling Proportionate Consolidated Unconsolidated Noncontrolling Proportionate Amount Joint Venture Interests Amount Amount Joint Venture Interests Amount Rental revenues 54,907 $ - $ (18,977) $ 35,930 $ 49,993 $ - $ (17,227) $ 32,766 $ Property operating expenses: Property operating expenses (including real estate taxes) 21,229 - (7,250) 13,979 17,897 - (6,003) 11,894 Net operating income 33,678 - (11,727) 21,951 32,096 - (11,224) 20,872 Fee income: Asset management fees - - 425 425 - - 260 260 Property management fees - - 712 712 - - - - Total fee income - - 1,137 1,137 - - 260 260 Other: General and administrative expenses (4,031) (7) 444 (3,594) (3,503) (3) 180 (3,326) Corporate property management expenses (1,325) - (312) (1,637) (1,856) - 632 (1,224) Asset management fees - - - - (2,152) - - (2,152) Acquisition expenses (including start up expenses) 5 - (5) - 6 - - 6 Transition expenses (6,006) - - (6,006) (398) - - (398) Straight-line rents (202) - 114 (88) (247) - 109 (138) Stock compensation expense (219) - - (219) - - - - Investment and development expenses (357) - 146 (211) (288) - - (288) Interest expense (6,085) - 2,223 (3,862) (5,247) - 3,339 (1,908) Interest income 2,737 103 (184) 2,656 2,105 272 (3) 2,374 Equity in income of investments in unconsolidated real estate joint ventures 189 (189) - - 501 (501) - - Derivative fair value adjustment (25) - 3 (22) (54) - 3 (51) Other income (expense) 133 10 (11) 132 (31) 10 157 136 Dividends to preferred stockholders (72) (1) 28 (45) (48) (1) 20 (29) Depreciation and amortization related to non-real estate assets (890) - 198 (692) (504) - 86 (418) Discontinued operations, net of non-FFO items - - - - (24) - - (24) Total other adjustments (16,148) (84) 2,644 (13,588) (11,740) (223) 4,523 (7,440) FFO 17,530 $ (84) $ (7,946) $ 9,500 $ 20,356 $ (223) $ (6,441) $ 13,692 $ Note: Certain amounts from the consolidated financial statements differ from the consolidated amounts above due to non-FFO items or reclassifications (e.g., straight-line rents, corporate property management expenses, stock compensation expense, etc.). Three Months Ended December 31, 2014 Three Months Ended December 31, 2013 Financial Information Proportionate Operating Information and Reconciliation to FFO © 2015 Monogram Residential Trust, Inc. 9 |
|
|
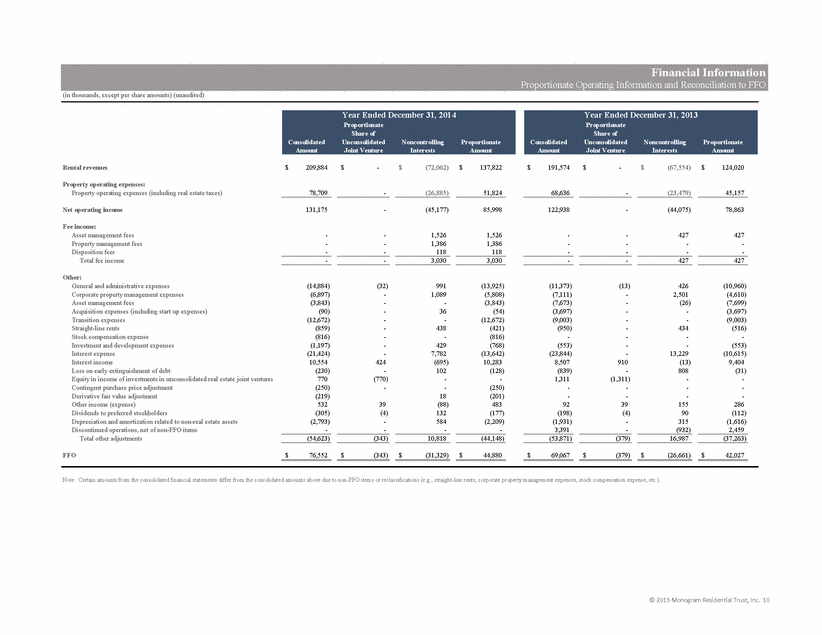
(in thousands, except per share amounts) (unaudited) Proportionate Proportionate Share of Share of Consolidated Unconsolidated Noncontrolling Proportionate Consolidated Unconsolidated Noncontrolling Proportionate Amount Joint Venture Interests Amount Amount Joint Venture Interests Amount Rental revenues 209,884 $ - $ (72,062) $ 137,822 $ 191,574 $ - $ (67,554) $ 124,020 $ Property operating expenses: Property operating expenses (including real estate taxes) 78,709 - (26,885) 51,824 68,636 - (23,479) 45,157 Net operating income 131,175 - (45,177) 85,998 122,938 - (44,075) 78,863 Fee income: Asset management fees - - 1,526 1,526 - - 427 427 Property management fees - - 1,386 1,386 - - - - Disposition fees - - 118 118 - - - - Total fee income - - 3,030 3,030 - - 427 427 Other: General and administrative expenses (14,884) (32) 991 (13,925) (11,373) (13) 426 (10,960) Corporate property management expenses (6,897) - 1,089 (5,808) (7,111) - 2,501 (4,610) Asset management fees (3,843) - - (3,843) (7,673) - (26) (7,699) Acquisition expenses (including start up expenses) (90) - 36 (54) (3,697) - - (3,697) Transition expenses (12,672) - - (12,672) (9,003) - - (9,003) Straight-line rents (859) - 438 (421) (950) - 434 (516) Stock compensation expense (816) - - (816) - - - - Investment and development expenses (1,197) - 429 (768) (553) - - (553) Interest expense (21,424) - 7,782 (13,642) (23,844) - 13,229 (10,615) Interest income 10,554 424 (695) 10,283 8,507 910 (13) 9,404 Loss on early extinguishment of debt (230) - 102 (128) (839) - 808 (31) Equity in income of investments in unconsolidated real estate joint ventures 770 (770) - - 1,311 (1,311) - - Contingent purchase price adjustment (250) - - (250) - - - - Derivative fair value adjustment (219) 18 (201) - - - - Other income (expense) 532 39 (88) 483 92 39 155 286 Dividends to preferred stockholders (305) (4) 132 (177) (198) (4) 90 (112) Depreciation and amortization related to non-real estate assets (2,793) - 584 (2,209) (1,931) - 315 (1,616) Discontinued operations, net of non-FFO items - - - - 3,391 - (932) 2,459 Total other adjustments (54,623) (343) 10,818 (44,148) (53,871) (379) 16,987 (37,263) FFO 76,552 $ (343) $ (31,329) $ 44,880 $ 69,067 $ (379) $ (26,661) $ 42,027 $ Note: Certain amounts from the consolidated financial statements differ from the consolidated amounts above due to non-FFO items or reclassifications (e.g., straight-line rents, corporate property management expenses, stock compensation expense, etc.). Financial Information Proportionate Operating Information and Reconciliation to FFO Year Ended December 31, 2014 Year Ended December 31, 2013 © 2015 Monogram Residential Trust, Inc. 10 |
|
|
(in thousands) (unaudited) 2014 2013 2014 2013 Reconciliation of loss from continuing operations to Adjusted EBITDA: Loss from continuing operations before gain on sale of real estate - Consolidated (6,721) $ (1,930) $ (16,140) $ (17,466) $ Depreciation and amortization 25,458 23,095 96,768 87,084 Interest expense 5,465 4,627 18,966 21,385 Loss on early extinguishment of debt - - 230 839 Acquisition expenses - (11) (17) 3,677 Transition expenses 6,006 398 12,672 9,003 Contingent purchase price adjustment - - 250 - Loss on derivative fair value adjustment 25 54 219 - Adjusted EBITDA - Consolidated 30,233 $ 26,233 $ 112,948 $ 104,522 $ Loss from continuing operations before gain on sale of real estate - Proportionate Share (6,395) $ (975) $ (15,217) $ (13,528) $ Depreciation and amortization 16,685 15,249 63,375 55,597 Interest expense 3,242 1,288 11,184 8,156 Loss on early extinguishment of debt - - 128 31 Acquisition expenses - (11) (17) 3,677 Transition expenses 6,006 398 12,672 9,003 Contingent purchase price adjustment - - 250 - Loss on derivative fair value adjustment 22 51 201 - Adjusted EBITDA - Proportionate Share 19,560 $ 16,000 $ 72,576 $ 62,936 $ December 31, December 31, Financial Information EBITDA Reconciliation Three Months Ended Year Ended © 2015 Monogram Residential Trust, Inc. 11 |
|
|
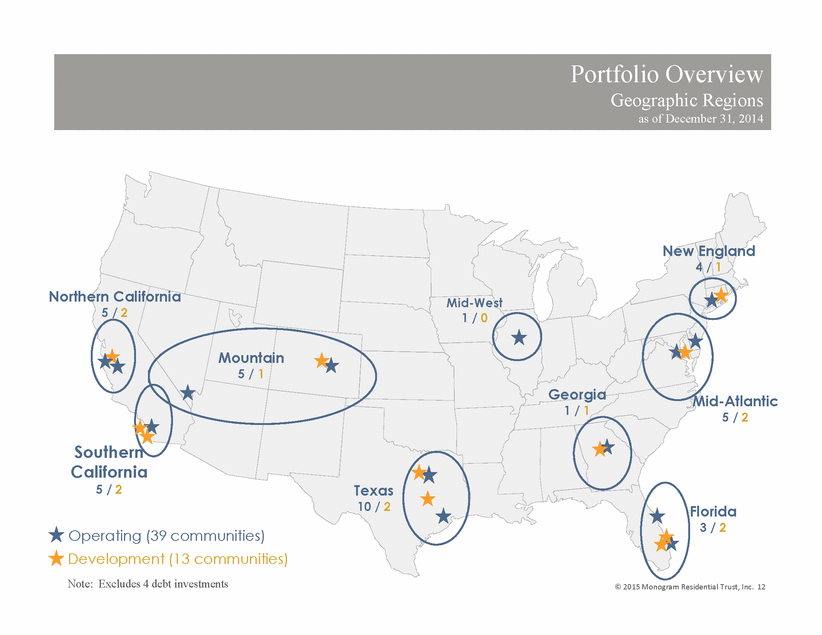
Southern California 5 / 2 Northern California 5 / 2 Texas 10 / 2 Mountain 5 / 1 Florida 3 / 2 New England 4 / 1 Georgia 1 / 1 Mid-West 1 / 0 Operating (39 communities) Development (13 communities) Portfolio Overview Geographic Regions as of December 31, 2014 Mid-Atlantic 5 / 2 Note: Excludes 4 debt investments ©2015Monogram Residential Trust, Inc. 12 |
|
|
December 31, 2014 December 31, 2013 December 31, 2014 December 31, 2013 Equity Investments: Stabilized Wholly owned 1,971 1,769 7 6 Consolidated joint ventures 7,413 7,190 27 26 Total Stabilized 9,384 8,959 34 32 Lease up (including operating communities and developments in lease up) Wholly owned - 202 - 1 Consolidated joint ventures 1,457 180 6 1 Total Lease up (including developments in lease up) 1,457 382 6 2 Developments under Construction and Pre-development Consolidated joint ventures 3,772 4,827 11 16 Total Developments under Construction and Pre-development 3,772 4,827 11 16 Land Held for Future Development Consolidated Joint Venture N/A N/A 1 1 Total Communities - Equity Investments 14,613 14,168 52 51 Debt Investments: Mezzanine Loans - Development/Lease up/Stabilized Wholly Owned 1,069 1,069 3 3 Unconsolidated joint venture 444 444 1 1 Total Communities - Debt Investments 1,513 1,513 4 4 Total Communities - Equity and Debt Investments 16,126 15,681 56 55 Total Wholly Owned 3,040 3,040 10 10 Total Consolidated Joint Ventures 12,642 12,197 45 44 Total Unconsolidated Joint Ventures 444 444 1 1 Total Communities - Equity and Debt Investments 16,126 15,681 56 55 Portfolio Overview Summary of Number of Units and Communities Total Communities Total Units © 2015 Monogram Residential Trust, Inc. 13 |
|
|
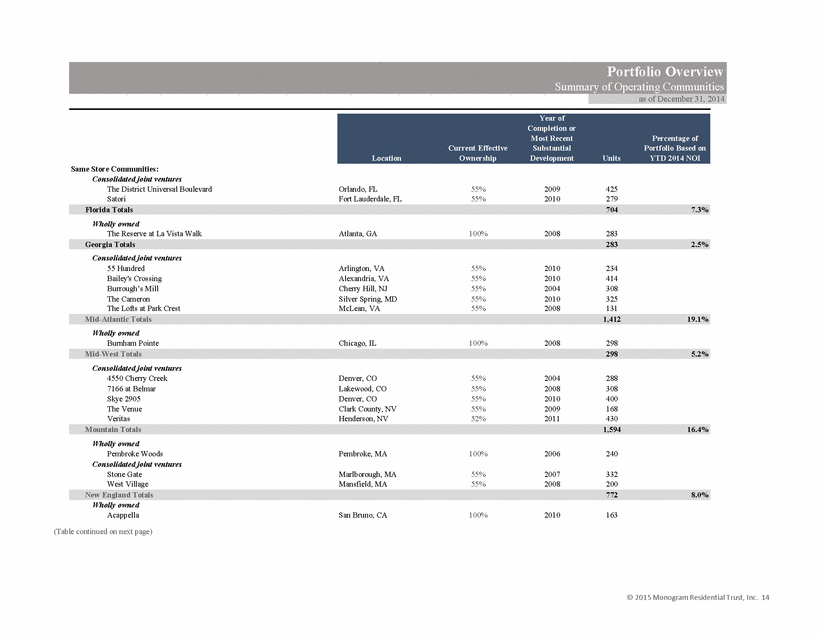
Location Current Effective Ownership Year of Completion or Most Recent Substantial Development Units Percentage of Portfolio Based on YTD 2014 NOI Same Store Communities: Consolidated joint ventures The District Universal Boulevard Orlando, FL 55% 2009 425 Satori Fort Lauderdale, FL 55% 2010 279 Florida Totals 704 7.3% Wholly owned The Reserve at La Vista Walk Atlanta, GA 100% 2008 283 Georgia Totals 283 2.5% Consolidated joint ventures 55 Hundred Arlington, VA 55% 2010 234 Bailey's Crossing Alexandria, VA 55% 2010 414 Burrough’s Mill Cherry Hill, NJ 55% 2004 308 The Cameron Silver Spring, MD 55% 2010 325 The Lofts at Park Crest McLean, VA 55% 2008 131 Mid-Atlantic Totals 1,412 19.1% Wholly owned Burnham Pointe Chicago, IL 100% 2008 298 Mid-West Totals 298 5.2% Consolidated joint ventures 4550 Cherry Creek Denver, CO 55% 2004 288 7166 at Belmar Lakewood, CO 55% 2008 308 Skye 2905 Denver, CO 55% 2010 400 The Venue Clark County, NV 55% 2009 168 Veritas Henderson, NV 52% 2011 430 Mountain Totals 1,594 16.4% Wholly owned Pembroke Woods Pembroke, MA 100% 2006 240 Consolidated joint ventures Stone Gate Marlborough, MA 55% 2007 332 West Village Mansfield, MA 55% 2008 200 New England Totals 772 8.0% Wholly owned Acappella San Bruno, CA 100% 2010 163 (Table continued on next page) Portfolio Overview Summary of Operating Communities as of December 31, 2014 © 2015 Monogram Residential Trust, Inc. 14 |
|
|
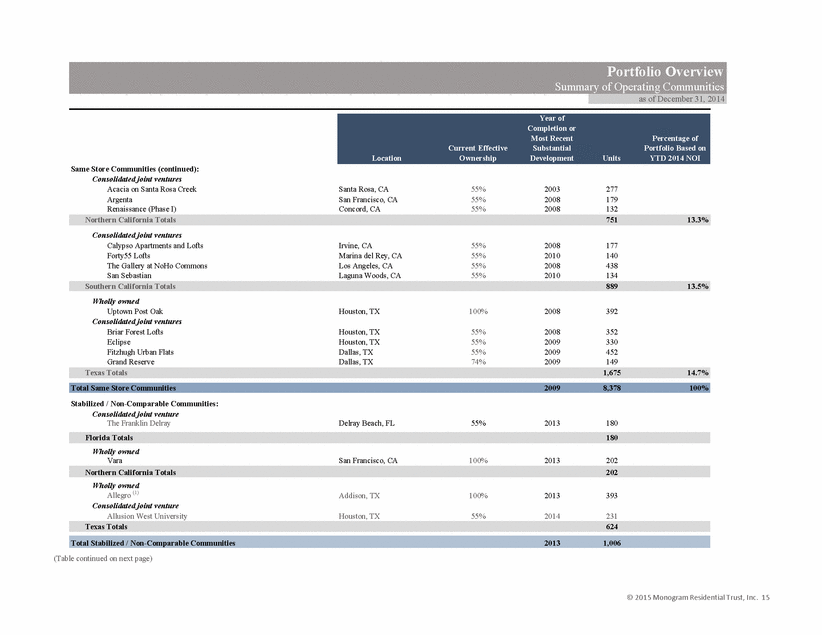
Location Current Effective Ownership Year of Completion or Most Recent Substantial Development Units Percentage of Portfolio Based on YTD 2014 NOI Portfolio Overview Summary of Operating Communities as of December 31, 2014 Same Store Communities (continued): Consolidated joint ventures Acacia on Santa Rosa Creek Santa Rosa, CA 55% 2003 277 Argenta San Francisco, CA 55% 2008 179 Renaissance (Phase I) Concord, CA 55% 2008 132 Northern California Totals 751 13.3% Consolidated joint ventures Calypso Apartments and Lofts Irvine, CA 55% 2008 177 Forty55 Lofts Marina del Rey, CA 55% 2010 140 The Gallery at NoHo Commons Los Angeles, CA 55% 2008 438 San Sebastian Laguna Woods, CA 55% 2010 134 Southern California Totals 889 13.5% Wholly owned Uptown Post Oak Houston, TX 100% 2008 392 Consolidated joint ventures Briar Forest Lofts Houston, TX 55% 2008 352 Eclipse Houston, TX 55% 2009 330 Fitzhugh Urban Flats Dallas, TX 55% 2009 452 Grand Reserve Dallas, TX 74% 2009 149 Texas Totals 1,675 14.7% Total Same Store Communities 2009 8,378 100% Stabilized / Non-Comparable Communities: Consolidated joint venture The Franklin Delray Delray Beach, FL 55% 2013 180 Florida Totals 180 Wholly owned Vara San Francisco, CA 100% 2013 202 Northern California Totals 202 Wholly owned Allegro (1) Addison, TX 100% 2013 393 Consolidated joint venture Allusion West University Houston, TX 55% 2014 231 Texas Totals 624 Total Stabilized / Non-Comparable Communities 2013 1,006 (Table continued on next page) © 2015 Monogram Residential Trust, Inc. 15 |
|
|
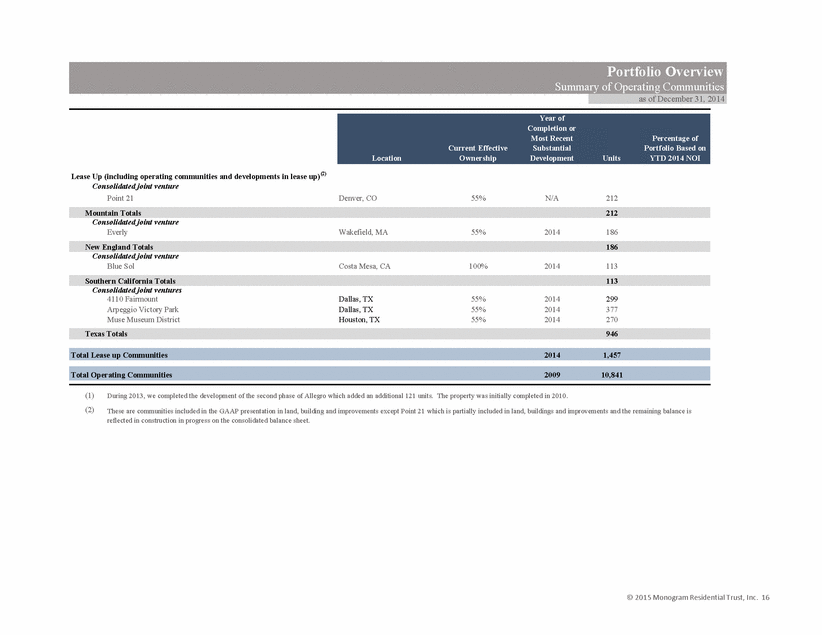
Location Current Effective Ownership Year of Completion or Most Recent Substantial Development Units Percentage of Portfolio Based on YTD 2014 NOI Portfolio Overview Summary of Operating Communities as of December 31, 2014 Lease Up (including operating communities and developments in lease up)(2) Consolidated joint venture Point 21 Denver, CO 55% N/A 212 Mountain Totals 212 Consolidated joint venture Everly Wakefield, MA 55% 2014 186 New England Totals 186 Consolidated joint venture Blue Sol Costa Mesa, CA 100% 2014 113 Southern California Totals 113 Consolidated joint ventures 4110 Fairmount Dallas, TX 55% 2014 299 Arpeggio Victory Park Dallas, TX 55% 2014 377 Muse Museum District Houston, TX 55% 2014 270 Texas Totals 946 Total Lease up Communities 2014 1,457 Total Operating Communities 2009 10,841 (1) During 2013, we completed the development of the second phase of Allegro which added an additional 121 units. The property was initially completed in 2010. (2) These are communities included in the GAAP presentation in land, building and improvements except Point 21 which is partially included in land, buildings and improvements and the remaining balance is reflected in construction in progress on the consolidated balance sheet. © 2015 Monogram Residential Trust, Inc. 16 |
|
|
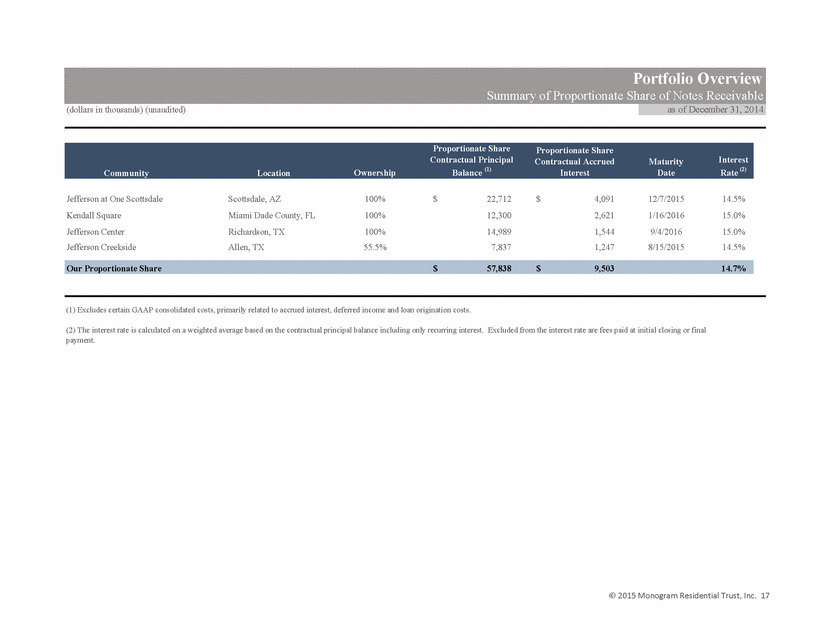
(dollars in thousands) (unaudited) Community Location Ownership Proportionate Share Contractual Principal Balance (1) Proportionate Share Contractual Accrued Interest Maturity Date Interest Rate (2) Jefferson at One Scottsdale Scottsdale, AZ 100% 22,712 $ 4,091 $ 12/7/2015 14.5% Kendall Square Miami Dade County, FL 100% 12,300 2,621 1/16/2016 15.0% Jefferson Center Richardson, TX 100% 14,989 1,544 9/4/2016 15.0% Jefferson Creekside Allen, TX 55.5% 7,837 1,247 8/15/2015 14.5% Our Proportionate Share 57,838 $ 9,503 $ 14.7% (1) Excludes certain GAAP consolidated costs, primarily related to accrued interest, deferred income and loan origination costs. Portfolio Overview Summary of Proportionate Share of Notes Receivable as of December 31, 2014 (2) The interest rate is calculated on a weighted average based on the contractual principal balance including only recurring interest. Excluded from the interest rate are fees paid at initial closing or final payment. © 2015 Monogram Residential Trust, Inc. 17 |
|
|
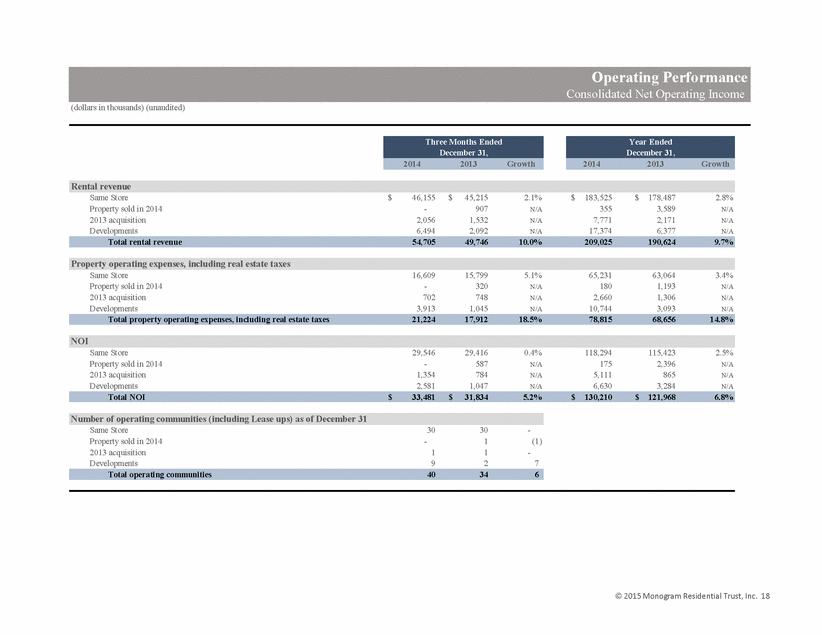
(dollars in thousands) (unaudited) 2014 2013 Growth 2014 2013 Growth Rental revenue Same Store 46,155 $ 45,215 $ 2.1% 183,525 $ 178,487 $ 2.8% Property sold in 2014 - 907 N/A 355 3,589 N/A 2013 acquisition 2,056 1,532 N/A 7,771 2,171 N/A Developments 6,494 2,092 N/A 17,374 6,377 N/A Total rental revenue 54,705 49,746 10.0% 209,025 190,624 9.7% Property operating expenses, including real estate taxes Same Store 16,609 15,799 5.1% 65,231 63,064 3.4% Property sold in 2014 - 320 N/A 180 1,193 N/A 2013 acquisition 702 748 N/A 2,660 1,306 N/A Developments 3,913 1,045 N/A 10,744 3,093 N/A Total property operating expenses, including real estate taxes 21,224 17,912 18.5% 78,815 68,656 14.8% NOI Same Store 29,546 29,416 0.4% 118,294 115,423 2.5% Property sold in 2014 - 587 N/A 175 2,396 N/A 2013 acquisition 1,354 784 N/A 5,111 865 N/A Developments 2,581 1,047 N/A 6,630 3,284 N/A Total NOI 33,481 $ 31,834 $ 5.2% 130,210 $ 121,968 $ 6.8% Number of operating communities (including Lease ups) as of December 31 Same Store 30 30 - Property sold in 2014 - 1 (1) 2013 acquisition 1 1 - Developments 9 2 7 Total operating communities 40 34 6 Operating Performance Consolidated Net Operating Income Three Months Ended December 31, Year Ended December 31, © 2015Monogram Residential Trust, Inc. 18 |
|
|
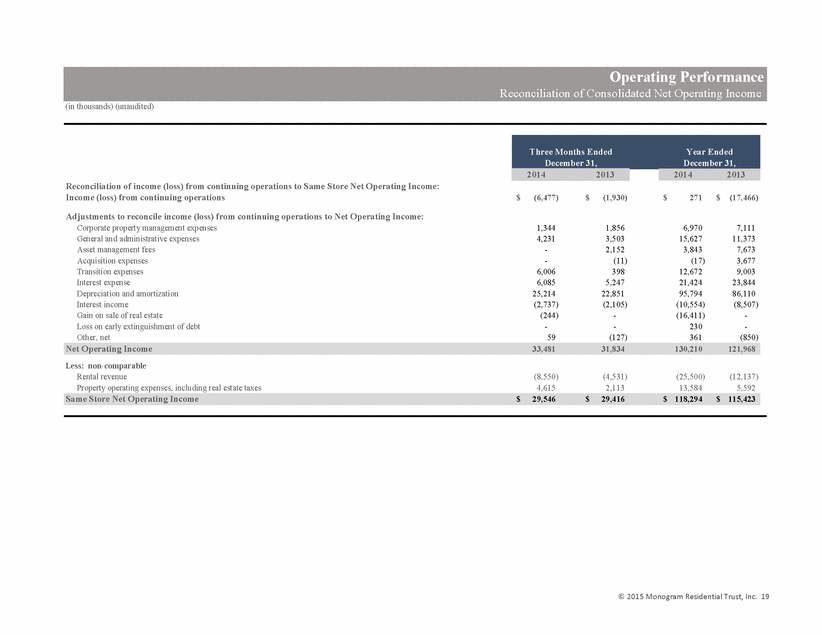
(in thousands) (unaudited) 2014 2013 2014 2013 Reconciliation of income (loss) from continuing operations to Same Store Net Operating Income: Income (loss) from continuing operations (6,477) $ (1,930) $ 271 $ (17,466) $ Adjustments to reconcile income (loss) from continuing operations to Net Operating Income: Corporate property management expenses 1,344 1,856 6,970 7,111 General and administrative expenses 4,231 3,503 15,627 11,373 Asset management fees - 2,152 3,843 7,673 Acquisition expenses - (11) (17) 3,677 Transition expenses 6,006 398 12,672 9,003 Interest expense 6,085 5,247 21,424 23,844 Depreciation and amortization 25,214 22,851 95,794 86,110 Interest income (2,737) (2,105) (10,554) (8,507) Gain on sale of real estate (244) - (16,411) - Loss on early extinguishment of debt - - 230 - Other, net 59 (127) 361 (850) Net Operating Income 33,481 31,834 130,210 121,968 Less: non-comparable Rental revenue (8,550) (4,531) (25,500) (12,137) Property operating expenses, including real estate taxes 4,615 2,113 13,584 5,592 Same Store Net Operating Income 29,546 $ 29,416 $ 118,294 $ 115,423 $ December 31, December 31, Operating Performance Three Months Ended Year Ended Reconciliation of Consolidated Net Operating Income © 2015 Monogram Residential Trust, Inc. 19 |
|
|
(dollars in thousands) (unaudited) QTD QTD % QTD QTD % QTD QTD % QTD QTD QTD QTD QTD QTD 4Q 2014 4Q 2013 Change 4Q 2014 4Q 2013 Change 4Q 2014 4Q 2013 Change 4Q 2014 4Q 2013 4Q 2014 4Q 2013 4Q 2014 4Q 2013 Consolidated Same Store Florida 3,381 $ 3,364 $ 0.5% 1,224 $ 1,210 $ 1.2% 2,157 $ 2,154 $ 0.1% 63.8% 64.0% 92.2% 94.5% 1,574 $ 1,549 $ Georgia 1,307 1,214 7.7% 636 498 27.7% 671 716 -6.3% 51.3% 59.0% 97.5% 96.5% 1,409 1,380 Mid-Atlantic 8,817 9,006 -2.1% 3,347 3,153 6.2% 5,470 5,853 -6.5% 62.0% 65.0% 90.7% 94.5% 2,016 2,053 Mid-West 2,320 2,218 4.6% 762 753 1.2% 1,558 1,465 6.3% 67.2% 66.1% 92.6% 93.6% 2,473 2,411 Mountain 7,113 6,843 3.9% 2,170 2,200 -1.4% 4,943 4,643 6.5% 69.5% 67.9% 94.0% 93.2% 1,466 1,419 New England 3,698 3,633 1.8% 1,346 1,294 4.0% 2,352 2,339 0.6% 63.6% 64.4% 94.3% 95.7% 1,593 1,518 Northern California 5,925 5,530 7.1% 1,854 1,806 2.7% 4,071 3,724 9.3% 68.7% 67.3% 96.4% 95.2% 2,592 2,437 Southern California 6,053 5,825 3.9% 1,956 1,789 9.3% 4,097 4,036 1.5% 67.7% 69.3% 94.4% 94.9% 2,156 2,116 Texas 7,541 7,582 -0.5% 3,314 3,096 7.0% 4,227 4,486 -5.8% 56.1% 59.2% 94.4% 95.6% 1,525 1,485 Total Same Store 46,155 45,215 2.1% 16,609 15,799 5.1% 29,546 29,416 0.4% 64.0% 65.1% 93.7% 94.7% 1,799 1,759 Stabilized Non-Comparable Florida 996 377 N/A 383 251 N/A 613 126 N/A 61.5% N/A 96.1% N/A 1,815 N/A Northern California 2,056 1,532 N/A 702 748 N/A 1,354 784 N/A 65.9% N/A 97.0% N/A 3,408 N/A Texas 2,783 1,713 N/A 1,232 707 N/A 1,551 1,006 N/A 55.7% N/A 92.1% N/A 1,639 N/A Total Stabilized Non-Comparable 5,835 3,622 61% 2,317 1,706 36% 3,518 1,916 84% 60.3% N/A 93.8% N/A 2,026 N/A Mountain 5 - N/A 94 - N/A (89) - N/A N/A N/A 6.1% N/A N/A N/A New England 74 - N/A 196 - N/A (122) - N/A N/A N/A 22.6% N/A N/A N/A Southern California 202 - N/A 238 - N/A (36) - N/A N/A N/A 54.0% N/A N/A N/A Texas 2,428 - N/A 1,658 66 N/A 770 (66) N/A N/A N/A 68.7% N/A N/A N/A Total Lease up 2,709 - N/A 2,186 66 N/A 523 (66) N/A N/A N/A 52.6% N/A N/A N/A 6 909 N/A 112 341 N/A (106) 568 N/A Total Portfolio 54,705 $ 49,746 $ 10.0% 21,224 $ 17,912 $ 18.5% 33,481 $ 31,834 $ 5.2% Note: Certain amounts from the Proportionate Operating Information and FFO differ from the amounts above due to adjustments for non-FFO items (e.g., straight-line rents and start up expenses). Dispositions and other non-lease up developments Lease up (includes operating and development communities) Property Operating Expenses Rental Revenue Operating Performance Net Operating Income Operating Margin Occupancy Monthly Rental Rate Per Unit Consolidated QTD Net Operating Income and Other Operating Metrics © 2015Monogram Residential Trust, Inc. 20 |
|
|
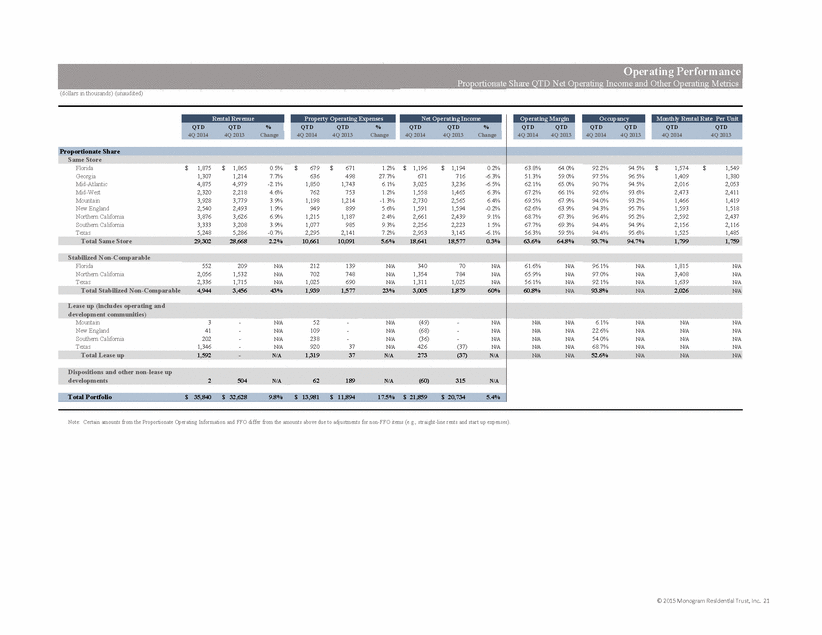
(dollars in thousands) (unaudited) QTD QTD % QTD QTD % QTD QTD % QTD QTD QTD QTD QTD QTD 4Q 2014 4Q 2013 Change 4Q 2014 4Q 2013 Change 4Q 2014 4Q 2013 Change 4Q 2014 4Q 2013 4Q 2014 4Q 2013 4Q 2014 4Q 2013 Proportionate Share Same Store Florida 1,875 $ 1,865 $ 0.5% 679 $ 671 $ 1.2% 1,196 $ 1,194 $ 0.2% 63.8% 64.0% 92.2% 94.5% 1,574 $ 1,549 $ Georgia 1,307 1,214 7.7% 636 498 27.7% 671 716 -6.3% 51.3% 59.0% 97.5% 96.5% 1,409 1,380 Mid-Atlantic 4,875 4,979 -2.1% 1,850 1,743 6.1% 3,025 3,236 -6.5% 62.1% 65.0% 90.7% 94.5% 2,016 2,053 Mid-West 2,320 2,218 4.6% 762 753 1.2% 1,558 1,465 6.3% 67.2% 66.1% 92.6% 93.6% 2,473 2,411 Mountain 3,928 3,779 3.9% 1,198 1,214 -1.3% 2,730 2,565 6.4% 69.5% 67.9% 94.0% 93.2% 1,466 1,419 New England 2,540 2,493 1.9% 949 899 5.6% 1,591 1,594 -0.2% 62.6% 63.9% 94.3% 95.7% 1,593 1,518 Northern California 3,876 3,626 6.9% 1,215 1,187 2.4% 2,661 2,439 9.1% 68.7% 67.3% 96.4% 95.2% 2,592 2,437 Southern California 3,333 3,208 3.9% 1,077 985 9.3% 2,256 2,223 1.5% 67.7% 69.3% 94.4% 94.9% 2,156 2,116 Texas 5,248 5,286 -0.7% 2,295 2,141 7.2% 2,953 3,145 -6.1% 56.3% 59.5% 94.4% 95.6% 1,525 1,485 Total Same Store 29,302 28,668 2.2% 10,661 10,091 5.6% 18,641 18,577 0.3% 63.6% 64.8% 93.7% 94.7% 1,799 1,759 Stabilized Non-Comparable Florida 552 209 N/A 212 139 N/A 340 70 N/A 61.6% N/A 96.1% N/A 1,815 N/A Northern California 2,056 1,532 N/A 702 748 N/A 1,354 784 N/A 65.9% N/A 97.0% N/A 3,408 N/A Texas 2,336 1,715 N/A 1,025 690 N/A 1,311 1,025 N/A 56.1% N/A 92.1% N/A 1,639 N/A Total Stabilized Non-Comparable 4,944 3,456 43% 1,939 1,577 23% 3,005 1,879 60% 60.8% N/A 93.8% N/A 2,026 N/A Mountain 3 - N/A 52 - N/A (49) - N/A N/A N/A 6.1% N/A N/A N/A New England 41 - N/A 109 - N/A (68) - N/A N/A N/A 22.6% N/A N/A N/A Southern California 202 - N/A 238 - N/A (36) - N/A N/A N/A 54.0% N/A N/A N/A Texas 1,346 - N/A 920 37 N/A 426 (37) N/A N/A N/A 68.7% N/A N/A N/A Total Lease up 1,592 - N/A 1,319 37 N/A 273 (37) N/A N/A N/A 52.6% N/A N/A N/A 2 504 N/A 62 189 N/A (60) 315 N/A Total Portfolio 35,840 $ 32,628 $ 9.8% 13,981 $ 11,894 $ 17.5% 21,859 $ 20,734 $ 5.4% Note: Certain amounts from the Proportionate Operating Information and FFO differ from the amounts above due to adjustments for non-FFO items (e.g., straight-line rents and start up expenses). Dispositions and other non-lease up developments Lease up (includes operating and development communities) Monthly Rental Rate Per Unit Rental Revenue Property Operating Expenses Net Operating Income Operating Margin Occupancy Operating Performance Proportionate Share QTD Net Operating Income and Other Operating Metrics © 2015Monogram Residential Trust, Inc. 21 |
|
|
(dollars in thousands) (unaudited) YTD YTD % YTD YTD % YTD YTD % YTD YTD YTD YTD YTD YTD 4Q 2014 4Q 2013 Change 4Q 2014 4Q 2013 Change 4Q 2014 4Q 2013 Change 4Q 2014 4Q 2013 4Q 2014 4Q 2013 4Q 2014 4Q 2013 Consolidated Same Store Florida 13,615 $ 13,411 $ 1.5% 4,983 $ 4,886 $ 2.0% 8,632 $ 8,525 $ 1.3% 63.4% 63.6% 92.2% 94.5% 1,574 $ 1,549 $ Georgia 5,143 4,847 6.1% 2,138 1,951 9.6% 3,005 2,896 3.8% 58.4% 59.7% 97.5% 96.5% 1,409 1,380 Mid-Atlantic 35,795 35,977 -0.5% 13,188 12,352 6.8% 22,607 23,625 -4.3% 63.2% 65.7% 90.7% 94.5% 2,016 2,053 Mid-West 9,265 8,959 3.4% 3,157 3,197 -1.3% 6,108 5,762 6.0% 65.9% 64.3% 92.6% 93.6% 2,473 2,411 Mountain 28,030 27,050 3.6% 8,683 8,643 0.5% 19,347 18,407 5.1% 69.0% 68.0% 94.0% 93.2% 1,466 1,419 New England 14,751 14,216 3.8% 5,247 5,336 -1.7% 9,504 8,880 7.0% 64.4% 62.5% 94.3% 95.7% 1,593 1,518 Northern California 22,990 21,456 7.1% 7,260 6,971 4.1% 15,730 14,485 8.6% 68.4% 67.5% 96.4% 95.2% 2,592 2,437 Southern California 23,634 22,724 4.0% 7,688 7,310 5.2% 15,946 15,414 3.5% 67.5% 67.8% 94.4% 94.9% 2,156 2,116 Texas 30,302 29,847 1.5% 12,887 12,418 3.8% 17,415 17,429 -0.1% 57.5% 58.4% 94.4% 95.6% 1,525 1,485 Total Same Store 183,525 178,487 2.8% 65,231 63,064 3.4% 118,294 115,423 2.5% 64.5% 64.7% 93.7% 94.7% 1,799 1,759 Stabilized Non-Comparable Florida 3,698 421 N/A 1,436 419 N/A 2,262 2 N/A 61.2% N/A 96.1% N/A 1,815 N/A Northern California 7,771 2,171 N/A 2,660 1,306 N/A 5,111 865 N/A 65.8% N/A 97.0% N/A 3,408 N/A Texas 9,407 5,936 N/A 4,438 2,523 N/A 4,969 3,413 N/A 52.8% N/A 92.1% N/A 1,639 N/A Total Stabilized Non-Comparable 20,876 8,528 N/A 8,534 4,248 N/A 12,342 4,280 N/A 59.1% N/A 93.8% N/A 2,026 N/A Mountain 4 - N/A 107 - N/A (103) - N/A N/A N/A 6.1% N/A N/A N/A New England 77 - N/A 300 - N/A (223) - N/A N/A N/A 22.6% N/A N/A N/A Southern California 206 - N/A 333 - N/A (127) - N/A N/A N/A 54.0% N/A N/A N/A Texas 3,977 - N/A 3,882 68 N/A 95 (68) N/A N/A N/A 68.7% N/A N/A N/A Total Lease up 4,264 - N/A 4,622 68 N/A (358) (68) N/A N/A N/A 52.6% N/A N/A N/A 360 3,609 N/A 428 1,276 N/A (68) 2,333 N/A Total Portfolio 209,025 $ 190,624 $ 9.7% 78,815 $ 68,656 $ 14.8% 130,210 $ 121,968 $ 6.8% Note: Certain amounts from the Proportionate Operating Information and FFO differ from the amounts above due to adjustments for non-FFO items (e.g., straight-line rents and start up expenses). Dispositions and other non-lease up developments Lease up (includes operating and development communities) Monthly Rental Rate Per Unit Rental Revenue Property Operating Expenses Net Operating Income Operating Margin Occupancy Operating Performance Consolidated YTD Net Operating Income and Other Operating Metrics © 2015 Monogram Residential Trust, Inc. 22 |
|
|
(dollars in thousands) (unaudited) YTD YTD % YTD YTD % YTD YTD % YTD YTD YTD YTD YTD YTD 4Q 2014 4Q 2013 Change 4Q 2014 4Q 2013 Change 4Q 2014 4Q 2013 Change 4Q 2014 4Q 2013 4Q 2014 4Q 2013 4Q 2014 4Q 2013 Proportionate Share Same Store Florida 7,549 $ 7,436 $ 1.5% 2,763 $ 2,709 $ 2.0% 4,786 $ 4,727 $ 1.2% 63.4% 63.6% 92.2% 94.5% 1,574 $ 1,549 $ Georgia 5,143 4,847 6.1% 2,138 1,951 9.6% 3,005 2,896 3.8% 58.4% 59.7% 97.5% 96.5% 1,409 1,380 Mid-Atlantic 19,791 19,892 -0.5% 7,291 6,827 6.8% 12,500 13,065 -4.3% 63.2% 65.7% 90.7% 94.5% 2,016 2,053 Mid-West 9,265 8,959 3.4% 3,157 3,197 -1.3% 6,108 5,762 6.0% 65.9% 64.3% 92.6% 93.6% 2,473 2,411 Mountain 15,477 14,937 3.6% 4,793 4,771 0.5% 10,684 10,166 5.1% 69.0% 68.1% 94.0% 93.2% 1,466 1,419 New England 10,120 9,738 3.9% 3,674 3,730 -1.5% 6,446 6,008 7.3% 63.7% 61.7% 94.3% 95.7% 1,593 1,518 Northern California 15,034 14,049 7.0% 4,758 4,576 4.0% 10,276 9,473 8.5% 68.4% 67.4% 96.4% 95.2% 2,592 2,437 Southern California 13,015 12,514 4.0% 4,234 4,027 5.1% 8,781 8,487 3.5% 67.5% 67.8% 94.4% 94.9% 2,156 2,116 Texas 21,097 20,797 1.4% 8,884 8,582 3.5% 12,213 12,215 0.0% 57.9% 58.7% 94.4% 95.6% 1,525 1,485 Total Same Store 116,491 113,169 2.9% 41,692 40,370 3.3% 74,799 72,799 2.7% 64.2% 64.3% 93.7% 94.7% 1,799 1,759 Stabilized Non-Comparable Florida 2,050 233 N/A 796 232 N/A 1,254 1 N/A 61.2% N/A 96.1% N/A 1,815 N/A Northern California 7,771 2,171 N/A 2,660 1,306 N/A 5,111 865 N/A 65.8% N/A 97.0% N/A 3,408 N/A Texas 8,434 5,939 N/A 3,763 2,503 N/A 4,671 3,436 N/A 55.4% N/A 92.1% N/A 1,639 N/A Total Stabilized Non-Comparable 18,255 8,343 N/A 7,219 4,041 N/A 11,036 4,302 N/A 60.5% N/A 93.8% N/A 2,026 N/A Mountain 2 - N/A 60 - N/A (58) - N/A N/A N/A 6.1% N/A N/A N/A New England 43 - N/A 167 - N/A (124) - N/A N/A N/A 22.6% N/A N/A N/A Southern California 206 - N/A 333 - N/A (127) - N/A N/A N/A 54.0% N/A N/A N/A Texas 2,205 - N/A 2,151 37 N/A 54 (37) N/A N/A N/A 68.7% N/A N/A N/A Total Lease up 2,456 - N/A 2,711 37 N/A (255) (37) N/A N/A N/A 52.6% N/A N/A N/A 199 1,992 N/A 238 709 N/A (39) 1,283 N/A Total Portfolio 137,401 $ 123,504 $ 11.3% 51,860 $ 45,157 $ 14.8% 85,541 $ 78,347 $ 9.2% Note: Certain amounts from the Proportionate Operating Information and FFO differ from the amounts above due to adjustments for non-FFO items (e.g., straight-line rents and start up expenses). Dispositions and other non-lease up developments Lease up (includes operating and development communities) Monthly Rental Rate Per Unit Rental Revenue Property Operating Expenses Net Operating Income Operating Margin Occupancy Operating Performance Proportionate Share YTD Net Operating Income and Other Operating Metrics © 2015 Monogram Residential Trust, Inc. 23 |
|
|
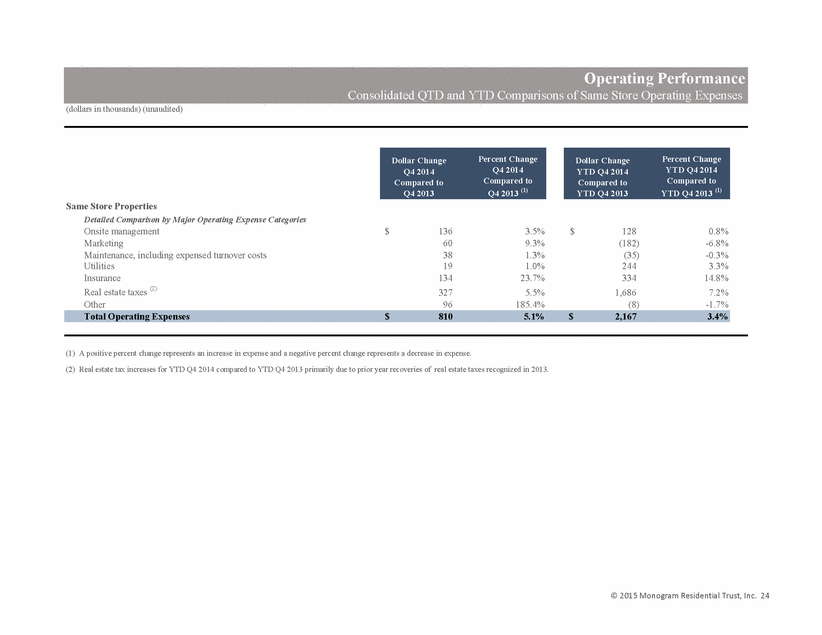
(dollars in thousands) (unaudited) Same Store Properties Detailed Comparison by Major Operating Expense Categories Onsite management 136 $ 3.5% 128 $ 0.8% Marketing 60 9.3% (182) -6.8% Maintenance, including expensed turnover costs 38 1.3% (35) -0.3% Utilities 19 1.0% 244 3.3% Insurance 134 23.7% 334 14.8% Real estate taxes (2) 327 5.5% 1,686 7.2% Other 96 185.4% (8) -1.7% Total Operating Expenses 810 $ 5.1% 2,167 $ 3.4% (1) A positive percent change represents an increase in expense and a negative percent change represents a decrease in expense. (2) Real estate tax increases for YTD Q4 2014 compared to YTD Q4 2013 primarily due to prior year recoveries of real estate taxes recognized in 2013. Operating Performance Dollar Change Q4 2014 Compared to Q4 2013 Percent Change Q4 2014 Compared to Q4 2013 (1) Dollar Change YTD Q4 2014 Compared to YTD Q4 2013 Percent Change YTD Q4 2014 Compared to YTD Q4 2013 (1) Consolidated QTD and YTD Comparisons of Same Store Operating Expenses © 2015 Monogram Residential Trust, Inc. 24 |
|
|
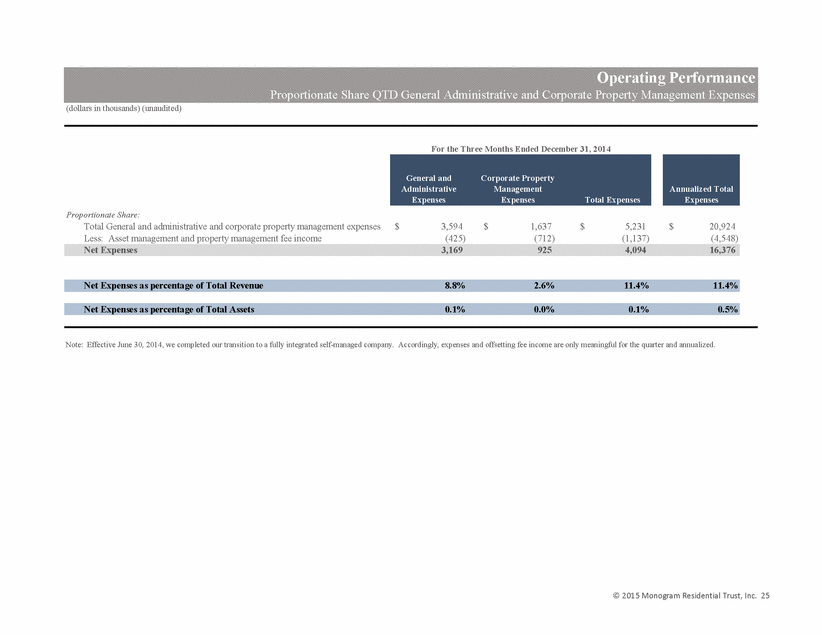
(dollars in thousands) (unaudited) Proportionate Share: Total General and administrative and corporate property management expenses 3,594 $ 1,637 $ 5,231 $ 20,924 $ Less: Asset management and property management fee income (425) (712) (1,137) (4,548) Net Expenses 3,169 925 4,094 16,376 Net Expenses as percentage of Total Revenue 8.8% 2.6% 11.4% 11.4% Net Expenses as percentage of Total Assets 0.1% 0.0% 0.1% 0.5% Note: Effective June 30, 2014, we completed our transition to a fully integrated self-managed company. Accordingly, expenses and offsetting fee income are only meaningful for the quarter and annualized. For the Three Months Ended December 31, 2014 Operating Performance Proportionate Share QTD General Administrative and Corporate Property Management Expenses General and Administrative Expenses Corporate Property Management Expenses Total Expenses Annualized Total Expenses © 2015 Monogram Residential Trust, Inc. 25 |
|
|
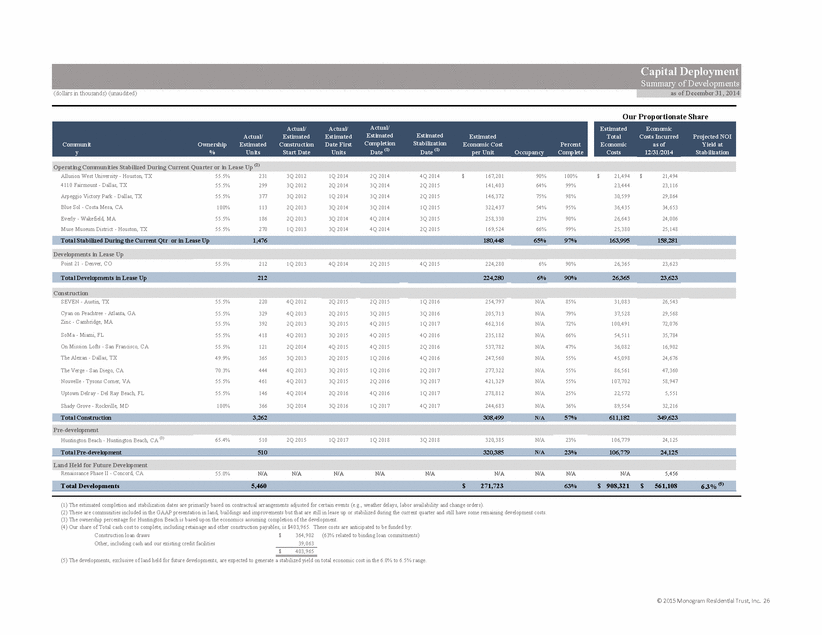
(dollars in thousands) (unaudited) Communit y Ownership % Actual/ Estimated Units Actual/ Estimated Construction Start Date Actual/ Estimated Date First Units Actual/ Estimated Completion Date (1) Estimated Stabilization Date (1) Estimated Economic Cost per Unit Occupancy Percent Complete Estimated Total Economic Costs Economic Costs Incurred as of 12/31/2014 Projected NOI Yield at Stabilization Operating Communities Stabilized During Current Quarter or in Lease Up (2) Allusion West University - Houston, TX 55.5% 231 3Q 2012 1Q 2014 2Q 2014 4Q 2014 167,201 $ 90% 100% 21,494 $ 21,494 $ 55.5% 299 3Q 2012 2Q 2014 3Q 2014 2Q 2015 141,403 64% 99% 23,444 23,116 55.5% 377 3Q 2012 1Q 2014 3Q 2014 2Q 2015 146,372 75% 98% 30,599 29,864 100% 113 2Q 2013 3Q 2014 3Q 2014 1Q 2015 322,437 54% 95% 36,435 34,653 55.5% 186 2Q 2013 3Q 2014 4Q 2014 3Q 2015 258,330 23% 90% 26,643 24,006 55.5% 270 1Q 2013 3Q 2014 4Q 2014 2Q 2015 169,524 66% 99% 25,380 25,148 Total Stabilized During the Current Qtr or in Lease Up 1,476 180,448 65% 97% 163,995 158,281 Developments in Lease Up 55.5% 212 1Q 2013 4Q 2014 2Q 2015 4Q 2015 224,280 6% 90% 26,365 23,623 Total Developments in Lease Up 212 224,280 6% 90% 26,365 23,623 Construction 55.5% 220 4Q 2012 2Q 2015 2Q 2015 1Q 2016 254,797 N/A 85% 31,083 26,543 55.5% 329 4Q 2013 2Q 2015 3Q 2015 3Q 2016 205,713 N/A 79% 37,528 29,568 55.5% 392 2Q 2013 3Q 2015 4Q 2015 1Q 2017 462,316 N/A 72% 100,491 72,076 55.5% 418 4Q 2013 3Q 2015 4Q 2015 4Q 2016 235,182 N/A 66% 54,511 35,784 55.5% 121 2Q 2014 4Q 2015 4Q 2015 2Q 2016 537,782 N/A 47% 36,082 16,902 49.9% 365 3Q 2013 2Q 2015 1Q 2016 4Q 2016 247,560 N/A 55% 45,098 24,676 70.3% 444 4Q 2013 3Q 2015 1Q 2016 2Q 2017 277,322 N/A 55% 86,561 47,360 55.5% 461 4Q 2013 3Q 2015 2Q 2016 3Q 2017 421,329 N/A 55% 107,702 58,947 Uptown Delray - Del Ray Beach, FL 55.5% 146 4Q 2014 2Q 2016 4Q 2016 1Q 2017 278,812 N/A 25% 22,572 5,551 Shady Grove - Rockville, MD 100% 366 3Q 2014 3Q 2016 1Q 2017 4Q 2017 244,683 N/A 36% 89,554 32,216 Total Construction 3,262 308,499 N/A 57% 611,182 349,623 Pre-development 65.4% 510 2Q 2015 1Q 2017 1Q 2018 3Q 2018 320,385 N/A 23% 106,779 24,125 Total Pre-development 510 320,385 N/A 23% 106,779 24,125 Land Held for Future Development 55.0% N/A N/A N/A N/A N/A N/A N/A N/A N/A 5,456 Total Developments 5,460 271,723 $ 63% 908,321 $ 561,108 $ 6.3%(5) (1) The estimated completion and stabilization dates are primarily based on contractual arrangements adjusted for certain events (e.g., weather delays, labor availability and change orders). (3) The ownership percentage for Huntington Beach is based upon the economics assuming completion of the development. (4) Our share of Total cash cost to complete, including retainage and other construction payables, is $403,965. These costs are anticipated to be funded by: Construction loan draws 364,902 $ (63% related to binding loan commitments) Other, including cash and our existing credit facilities 39,063 403,965 $ (5) The developments, exclusive of land held for future developments, are expected to generate a stabilized yield on total economic cost in the 6.0% to 6.5% range. Arpeggio Victory Park - Dallas, TX 4110 Fairmount - Dallas, TX The Verge - San Diego, CA Point 21 - Denver, CO Muse Museum District - Houston, TX Everly - Wakefield, MA Blue Sol - Costa Mesa, CA (2) These are communities included in the GAAP presentation in land, buildings and improvements but that are still in lease up or stabilized during the current quarter and still have some remaining development costs. Capital Deployment Our Proportionate Share Summary of Developments as of December 31, 2014 Huntington Beach - Huntington Beach, CA (3) Renaissance Phase II - Concord, CA SEVEN - Austin, TX Cyan on Peachtree - Atlanta, GA Zinc - Cambridge, MA SoMa - Miami, FL On Mission Lofts - San Francisco, CA The Alexan - Dallas, TX Nouvelle - Tysons Corner, VA © 2015Monogram Residential Trust, Inc. 26 |
|
|
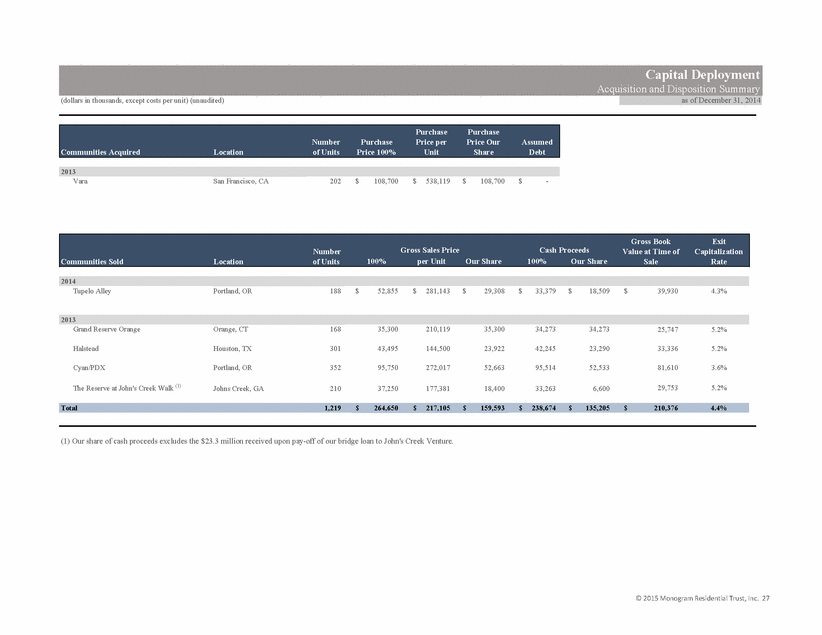
(dollars in thousands, except costs per unit) (unaudited) Location Vara San Francisco, CA 202 108,700 $ 538,119 $ 108,700 $ - $ Location 100% per Unit Our Share 100% Our Share Tupelo Alley Portland, OR 188 52,855 $ 281,143 $ 29,308 $ 33,379 $ 18,509 $ 39,930 $ 4.3% Grand Reserve Orange Orange, CT 168 35,300 210,119 35,300 34,273 34,273 25,747 5.2% Halstead Houston, TX 301 43,495 144,500 23,922 42,245 23,290 33,336 5.2% Cyan/PDX Portland, OR 352 95,750 272,017 52,663 95,514 52,533 81,610 3.6% The Reserve at John's Creek Walk (1) Johns Creek, GA 210 37,250 177,381 18,400 33,263 6,600 29,753 5.2% Total 1,219 264,650 $ 217,105 $ 159,593 $ 238,674 $ 135,205 $ 210,376 $ 4.4% (1) Our share of cash proceeds excludes the $23.3 million received upon pay-off of our bridge loan to John's Creek Venture. 2014 2013 Communities Sold Communities Acquired 2013 Cash Proceeds Capital Deployment Acquisition and Disposition Summary Gross Book Value at Time of Sale Exit Capitalization Rate as of December 31, 2014 Assumed Debt Number of Units Number of Units Purchase Price Our Share Purchase Price 100% Purchase Price per Unit Gross Sales Price © 2015 Monogram Residential Trust, Inc. 27 |
|
|
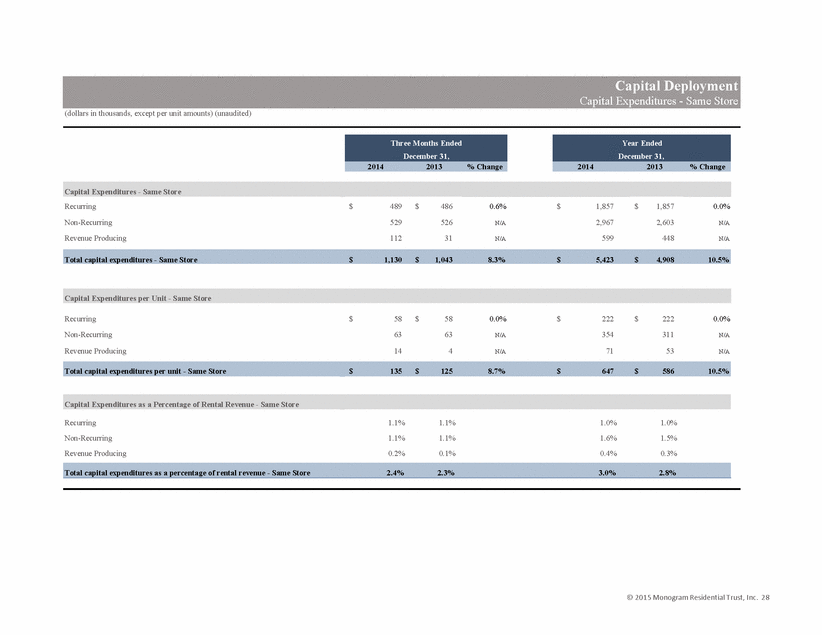
(dollars in thousands, except per unit amounts) (unaudited) 2014 2013 % Change 2014 2013 % Change Capital Expenditures - Same Store Recurring 489 $ 486 $ 0.6% 1,857 $ 1,857 $ 0.0% Non-Recurring 529 526 N/A 2,967 2,603 N/A Revenue Producing 112 31 N/A 599 448 N/A Total capital expenditures - Same Store 1,130 $ 1,043 $ 8.3% 5,423 $ 4,908 $ 10.5% Capital Expenditures per Unit - Same Store Recurring 58 $ 58 $ 0.0% 222 $ 222 $ 0.0% Non-Recurring 63 63 N/A 354 311 N/A Revenue Producing 14 4 N/A 71 53 N/A Total capital expenditures per unit - Same Store 135 $ 125 $ 8.7% 647 $ 586 $ 10.5% Capital Expenditures as a Percentage of Rental Revenue - Same Store Recurring 1.1% 1.1% 1.0% 1.0% Non-Recurring 1.1% 1.1% 1.6% 1.5% Revenue Producing 0.2% 0.1% 0.4% 0.3% Total capital expenditures as a percentage of rental revenue - Same Store 2.4% 2.3% 3.0% 2.8% Three Months Ended December 31, Capital Deployment Capital Expenditures - Same Store Year Ended December 31, © 2015 Monogram Residential Trust, Inc. 28 |
|
|
(dollars in thousands) (unaudited) Total Consolidated Balance (1) (2) Weighted Average Time to Maturity Weighted Average Contractual Interest Rate Proportionate Share of Contractual Balance (4) Percent of Total Debt Company Level Debt Fixed Rate - Mortgages Payable 87,250 $ 5.2 years 3.95% 87,250 $ 12.1% Variable Rate - Construction Notes Payable - Recourse Debt (3) 32,956 3.3 years 2.32% 32,956 4.6% Credit Facility 10,000 2.3 years 2.24% 10,000 1.4% Total Company Level Debt 130,206 4.5 years 3.41% 130,206 18.1% Co-Investment Venture Level Debt Fixed Rate - Mortgages Payable 832,005 3.1 years 3.73% 461,138 64.1% Variable Rate - Mortgages Payable 11,932 2.3 years 2.52% 6,562 0.9% Fixed Rate - Construction Notes Payable 57,041 2.5 years 4.16% 30,079 4.2% Variable Rate - Construction Notes Payable 165,297 3.0 years 2.30% 91,930 12.8% Total Co-Investment Venture Level Debt 1,066,275 3.0 years 3.52% 589,709 81.9% Total Debt 1,196,481 $ 3.2 years 3.50% 719,915 $ 100.0% Aggregate Debt Maturities by Year 2015 4.13% 46,245 $ 2016 4.00% 102,824 2017 3.10% 162,961 2018 3.44% 187,079 2019 3.20% 126,072 Thereafter 3.69% 94,734 Total Debt Maturities 3.50% 719,915 $ (2) All of the Company's debt is secured debt. (3) The portion for which the Company has provided recourse guarantees. Non-guaranteed portion is included in Co-Investment Venture level. (4) Excludes certain GAAP consolidated costs, primarily related to unamortized adjustments from business combinations. Capitalization Debt Summary As of December 31, 2014 Weighted Average Rate on Debt Maturities Proportionate Share of Contractual Balance (4) (1) The amounts listed below are the contractual amounts on each loan at 100% regardless of the Companys's ownership plus the unamortized adjustments from business combinations included in the GAAP amounts listed on the consolidated balance sheet. Debt Maturities As of December 31, 2014 © 2015 Monogram Residential Trust, Inc. 29 |
|
|
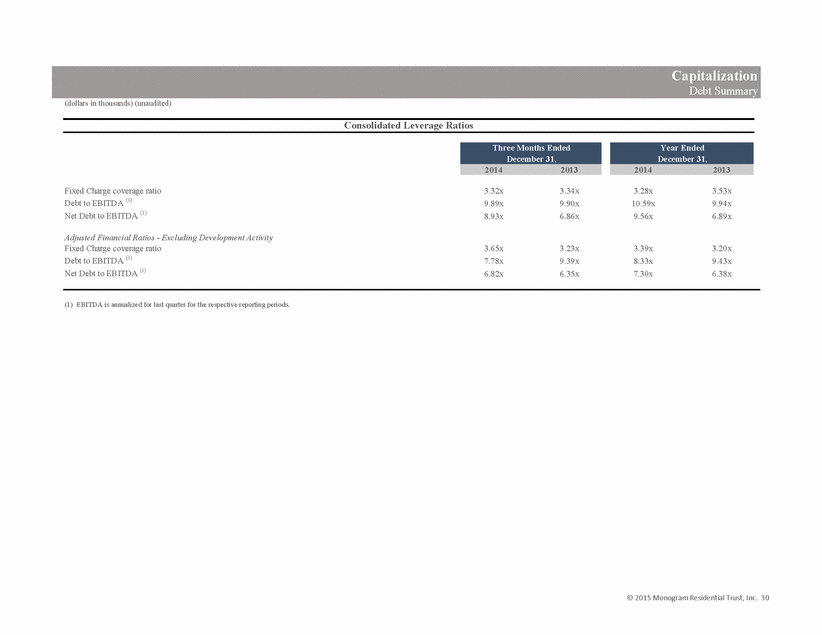
(dollars in thousands) (unaudited) Capitalization Debt Summary 2014 2013 2014 2013 Fixed Charge coverage ratio 3.32x 3.34x 3.28x 3.53x Debt to EBITDA (1) 9.89x 9.90x 10.59x 9.94x Net Debt to EBITDA (1) 8.93x 6.86x 9.56x 6.89x Adjusted Financial Ratios - Excluding Development Activity Fixed Charge coverage ratio 3.65x 3.23x 3.39x 3.20x Debt to EBITDA (1) 7.78x 9.39x 8.33x 9.43x Net Debt to EBITDA (1) 6.82x 6.35x 7.30x 6.38x (1) EBITDA is annualized for last quarter for the respective reporting periods. Consolidated Leverage Ratios Three Months Ended December 31, Year Ended December 31, © 2015 Monogram Residential Trust, Inc. 30 |
|
|
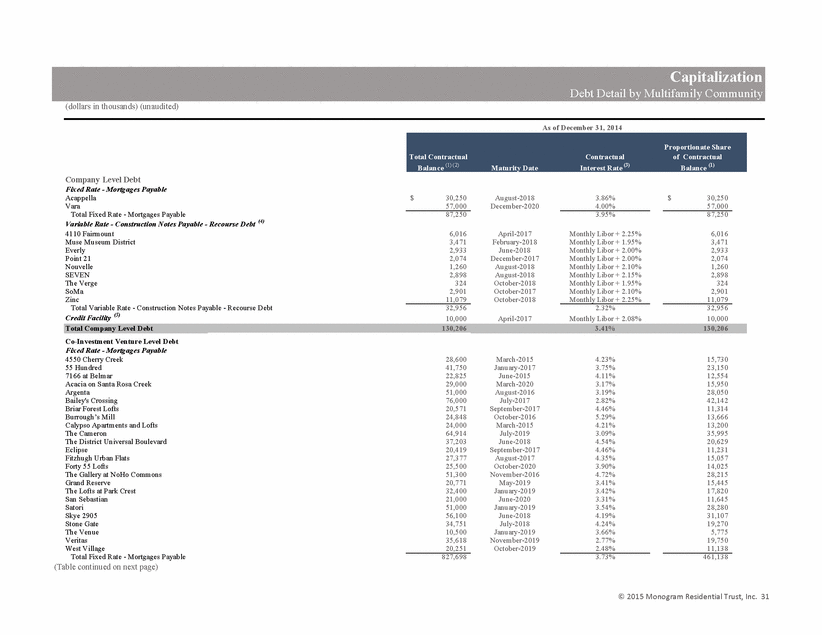
(dollars in thousands) (unaudited) Total Contractual Balance (1) (2) Maturity Date Contractual Interest Rate (3) Proportionate Share of Contractual Balance (1) Company Level Debt Fixed Rate - Mortgages Payable Acappella 30,250 $ August-2018 3.86% 30,250 $ Vara 57,000 December-2020 4.00% 57,000 Total Fixed Rate - Mortgages Payable 87,250 3.95% 87,250 Variable Rate - Construction Notes Payable - Recourse Debt (4) 4110 Fairmount 6,016 April-2017 Monthly Libor + 2.25% 6,016 Muse Museum District 3,471 February-2018 Monthly Libor + 1.95% 3,471 Everly 2,933 June-2018 Monthly Libor + 2.00% 2,933 Point 21 2,074 December-2017 Monthly Libor + 2.00% 2,074 Nouvelle 1,260 August-2018 Monthly Libor + 2.10% 1,260 SEVEN 2,898 August-2018 Monthly Libor + 2.15% 2,898 The Verge 324 October-2018 Monthly Libor + 1.95% 324 SoMa 2,901 October-2017 Monthly Libor + 2.10% 2,901 Zinc 11,079 October-2018 Monthly Libor + 2.25% 11,079 Total Variable Rate - Construction Notes Payable - Recourse Debt 32,956 2.32% 32,956 Credit Facility (5) 10,000 April-2017 Monthly Libor + 2.08% 10,000 Total Company Level Debt 130,206 3.41% 130,206 Co-Investment Venture Level Debt Fixed Rate - Mortgages Payable 4550 Cherry Creek 28,600 March-2015 4.23% 15,730 55 Hundred 41,750 January-2017 3.75% 23,150 7166 at Belmar 22,825 June-2015 4.11% 12,554 Acacia on Santa Rosa Creek 29,000 March-2020 3.17% 15,950 Argenta 51,000 August-2016 3.19% 28,050 Bailey's Crossing 76,000 July-2017 2.82% 42,142 Briar Forest Lofts 20,571 September-2017 4.46% 11,314 Burrough’s Mill 24,848 October-2016 5.29% 13,666 Calypso Apartments and Lofts 24,000 March-2015 4.21% 13,200 The Cameron 64,914 July-2019 3.09% 35,995 The District Universal Boulevard 37,203 June-2018 4.54% 20,629 Eclipse 20,419 September-2017 4.46% 11,231 Fitzhugh Urban Flats 27,377 August-2017 4.35% 15,057 Forty 55 Lofts 25,500 October-2020 3.90% 14,025 The Gallery at NoHo Commons 51,300 November-2016 4.72% 28,215 Grand Reserve 20,771 May-2019 3.41% 15,445 The Lofts at Park Crest 32,400 January-2019 3.42% 17,820 San Sebastian 21,000 June-2020 3.31% 11,645 Satori 51,000 January-2019 3.54% 28,280 Skye 2905 56,100 June-2018 4.19% 31,107 Stone Gate 34,751 July-2018 4.24% 19,270 The Venue 10,500 January-2019 3.66% 5,775 Veritas 35,618 November-2019 2.77% 19,750 West Village 20,251 October-2019 2.48% 11,138 Total Fixed Rate - Mortgages Payable 827,698 3.73% 461,138 (Table continued on next page) Capitalization Debt Detail byMultifamily Community As of December 31, 2014 © 2015 Monogram Residential Trust, Inc. 31 |
|
|
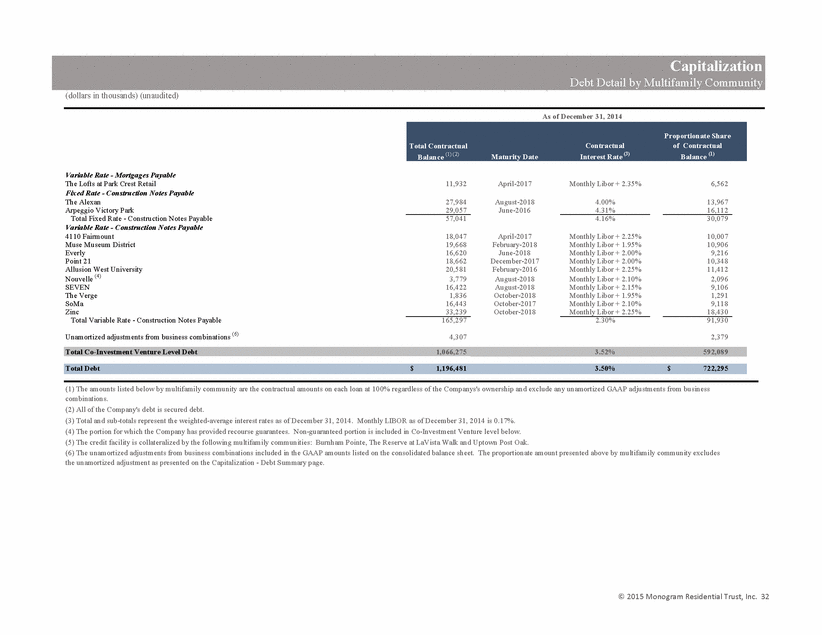
(dollars in thousands) (unaudited) Total Contractual Balance (1) (2) Maturity Date Contractual Interest Rate (3) Proportionate Share of Contractual Balance (1) Capitalization Debt Detail byMultifamily Community As of December 31, 2014 Variable Rate - Mortgages Payable The Lofts at Park Crest Retail 11,932 April-2017 Monthly Libor + 2.35% 6,562 Fixed Rate - Construction Notes Payable The Alexan 27,984 August-2018 4.00% 13,967 Arpeggio Victory Park 29,057 June-2016 4.31% 16,112 Total Fixed Rate - Construction Notes Payable 57,041 4.16% 30,079 Variable Rate - Construction Notes Payable 4110 Fairmount 18,047 April-2017 Monthly Libor + 2.25% 10,007 Muse Museum District 19,668 February-2018 Monthly Libor + 1.95% 10,906 Everly 16,620 June-2018 Monthly Libor + 2.00% 9,216 Point 21 18,662 December-2017 Monthly Libor + 2.00% 10,348 Allusion West University 20,581 February-2016 Monthly Libor + 2.25% 11,412 Nouvelle (4) 3,779 August-2018 Monthly Libor + 2.10% 2,096 SEVEN 16,422 August-2018 Monthly Libor + 2.15% 9,106 The Verge 1,836 October-2018 Monthly Libor + 1.95% 1,291 SoMa 16,443 October-2017 Monthly Libor + 2.10% 9,118 Zinc 33,239 October-2018 Monthly Libor + 2.25% 18,430 Total Variable Rate - Construction Notes Payable 165,297 2.30% 91,930 Unamortized adjustments from business combinations (6) 4,307 2,379 Total Co-Investment Venture Level Debt 1,066,275 3.52% 592,089 Total Debt 1,196,481 $ 3.50% 722,295 $ (2) All of the Company's debt is secured debt. (3) Total and sub-totals represent the weighted-average interest rates as of December 31, 2014. Monthly LIBOR as of December 31, 2014 is 0.17%. (4) The portion for which the Company has provided recourse guarantees. Non-guaranteed portion is included in Co-Investment Venture level below. (5) The credit facility is collateralized by the following multifamily communities: Burnham Pointe, The Reserve at LaVista Walk and Uptown Post Oak. (1) The amounts listed below by multifamily community are the contractual amounts on each loan at 100% regardless of the Companys's ownership and exclude any unamortized GAAP adjustments from business combinations. (6) The unamortized adjustments from business combinations included in the GAAP amounts listed on the consolidated balance sheet. The proportionate amount presented above by multifamily community excludes the unamortized adjustment as presented on the Capitalization - Debt Summary page. © 2015 Monogram Residential Trust, Inc. 32 |
|
|
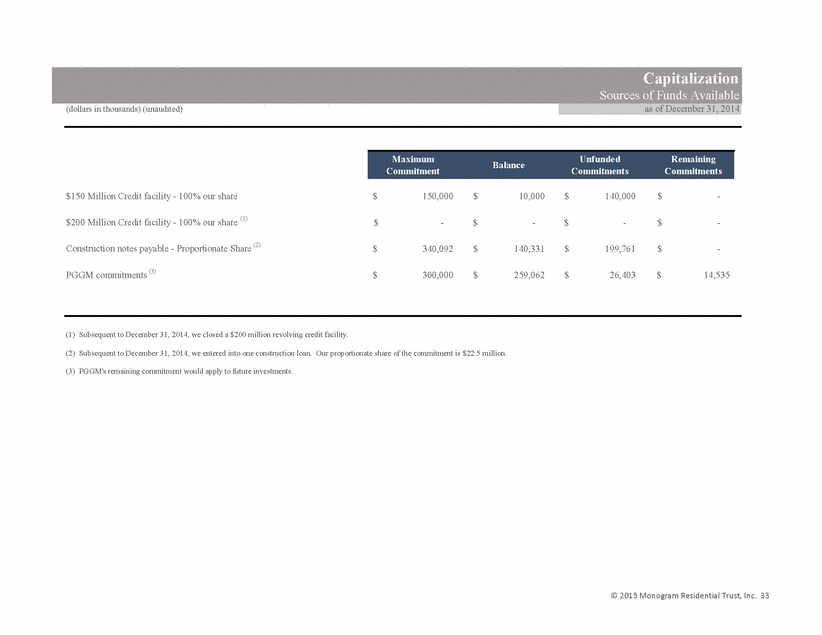
(dollars in thousands) (unaudited) Maximum Commitment Balance Unfunded Commitments Remaining Commitments $150 Million Credit facility - 100% our share 150,000 $ 10,000 $ 140,000 $ - $ $200 Million Credit facility - 100% our share (1) - $ - $ - $ - $ Construction notes payable - Proportionate Share (2) 340,092 $ 140,331 $ 199,761 $ - $ PGGM commitments (3) 300,000 $ 259,062 $ 26,403 $ 14,535 $ (1) Subsequent to December 31, 2014, we closed a $200 million revolving credit facility. (2) Subsequent to December 31, 2014, we entered into one construction loan. Our proportionate share of the commitment is $22.5 million. (3) PGGM's remaining commitment would apply to future investments. Capitalization Sources of Funds Available as of December 31, 2014 © 2015 Monogram Residential Trust, Inc. 33 |
|
|
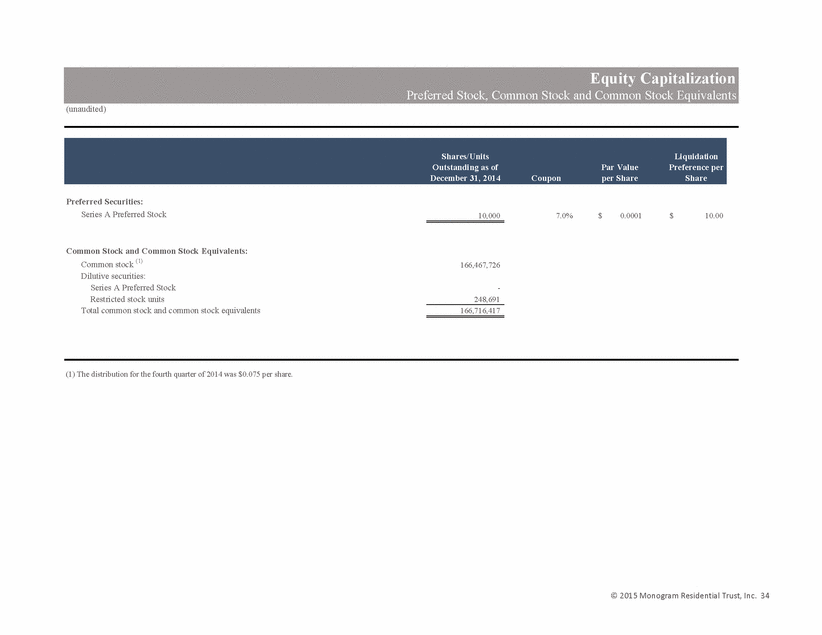
(unaudited) Shares/Units Outstanding as of December 31, 2014 Coupon Par Value per Share Liquidation Preference per Share Preferred Securities: Series A Preferred Stock 10,000 7.0% 0.0001 $ 10.00 $ Common Stock and Common Stock Equivalents: Common stock (1) 166,467,726 Dilutive securities: Series A Preferred Stock - Restricted stock units 248,691 Total common stock and common stock equivalents 166,716,417 Equity Capitalization Preferred Stock, Common Stock and Common Stock Equivalents (1) The distribution for the fourth quarter of 2014 was $0.075 per share. © 2015 Monogram Residential Trust, Inc. 34 |
|
|
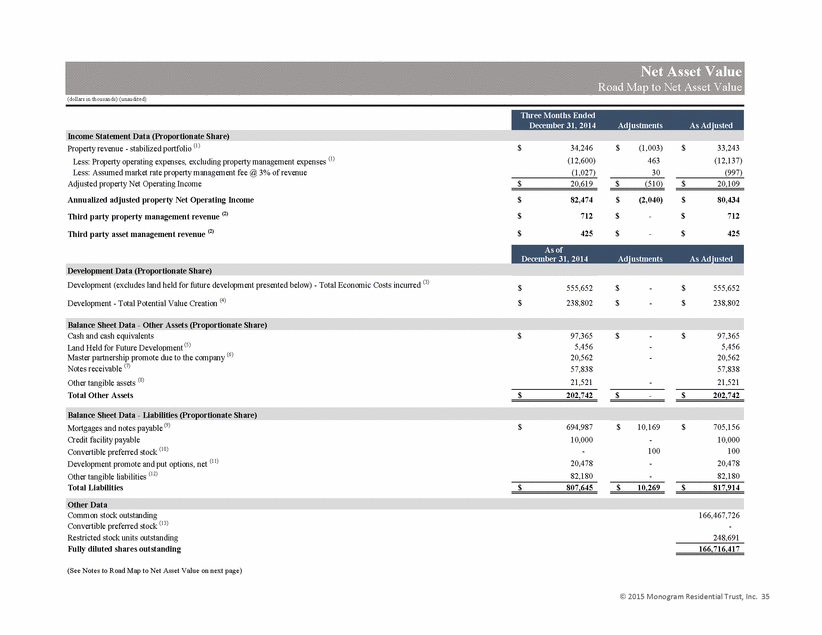
(dollars in thousands) (unaudited) Three Months Ended December 31, 2014 Adjustments As Adjusted Income Statement Data (Proportionate Share) Property revenue - stabilized portfolio (1) 34,246 $ (1,003) $ 33,243 $ Less: Property operating expenses, excluding property management expenses (1) (12,600) 463 (12,137) Less: Assumed market rate property management fee @ 3% of revenue (1,027) 30 (997) Adjusted property Net Operating Income 20,619 $ (510) $ 20,109 $ Annualized adjusted property Net Operating Income 82,474 $ (2,040) $ 80,434 $ Third party property management revenue (2) 712 $ - $ 712 $ Third party asset management revenue (2) 425 $ - $ 425 $ As of December 31, 2014 Adjustments As Adjusted Development Data (Proportionate Share) Development - Total Potential Value Creation (4) 238,802 $ - $ 238,802 $ Balance Sheet Data - Other Assets (Proportionate Share) Cash and cash equivalents 97,365 $ - $ 97,365 $ Land Held for Future Development (5) 5,456 - 5,456 Master partnership promote due to the company (6) 20,562 - 20,562 Notes receivable (7) 57,838 57,838 Other tangible assets (8) 21,521 - 21,521 Total Other Assets 202,742 $ - $ 202,742 $ Balance Sheet Data - Liabilities (Proportionate Share) Mortgages and notes payable (9) 694,987 $ 10,169 $ 705,156 $ Credit facility payable 10,000 - 10,000 Convertible preferred stock (10) - 100 100 Development promote and put options, net (11) 20,478 - 20,478 Other tangible liabilities (12) 82,180 - 82,180 Total Liabilities 807,645 $ 10,269 $ 817,914 $ Other Data Common stock outstanding 166,467,726 Convertible preferred stock (13) - Restricted stock units outstanding 248,691 Fully diluted shares outstanding 166,716,417 (See Notes to Road Map to Net Asset Value on next page) Net Asset Value Road Map to Net Asset Value Development (excludes land held for future development presented below) - Total Economic Costs incurred (3) 555,652 $ - $ 555,652 $ © 2015 Monogram Residential Trust, Inc. 35 |
|
|
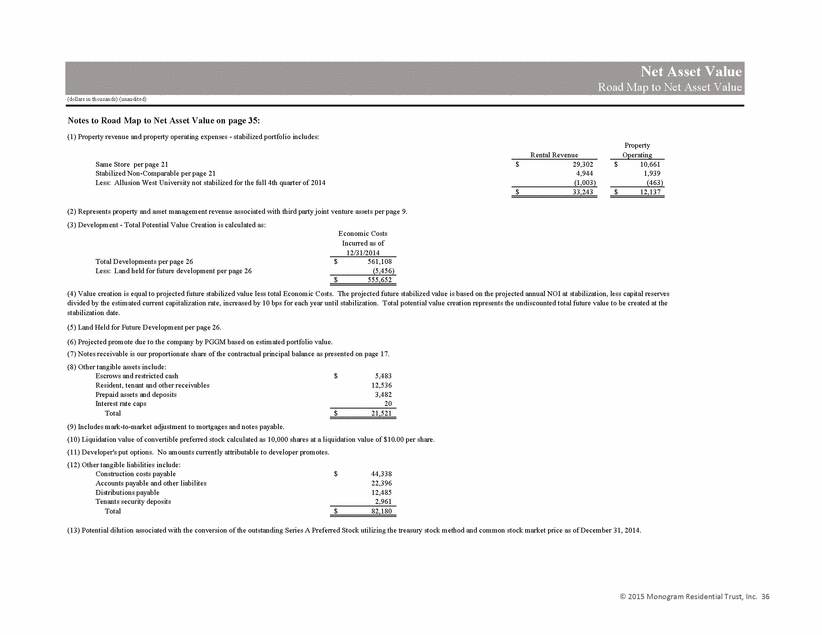
(dollars in thousands) (unaudited) Net Asset Value Road Map to Net Asset Value Notes to Road Map to Net Asset Value on page 35: (1) Property revenue and property operating expenses - stabilized portfolio includes: Rental Revenue Property Operating Same Store per page 21 29,302 $ 10,661 $ Stabilized Non-Comparable per page 21 4,944 1,939 Less: Allusion West University not stabilized for the full 4th quarter of 2014 (1,003) (463) 33,243 $ 12,137 $ (2) Represents property and asset management revenue associated with third party joint venture assets per page 9. (3) Development - Total Potential Value Creation is calculated as: Economic Costs Incurred as of 12/31/2014 Total Developments per page 26 561,108 $ Less: Land held for future development per page 26 (5,456) 555,652 $ (6) Projected promote due to the company by PGGM based on estimated portfolio value. (7) Notes receivable is our proportionate share of the contractual principal balance as presented on page 17. (8) Other tangible assets include: Escrows and restricted cash 5,483 $ Resident, tenant and other receivables 12,536 Prepaid assets and deposits 3,482 Interest rate caps 20 Total 21,521 $ (9) Includes mark-to-market adjustment to mortgages and notes payable. (10) Liquidation value of convertible preferred stock calculated as 10,000 shares at a liquidation value of $10.00 per share. (11) Developer's put options. No amounts currently attributable to developer promotes. (12) Other tangible liabilities include: Construction costs payable 44,338 $ Accounts payable and other liabilites 22,396 Distributions payable 12,485 Tenants security deposits 2,961 Total 82,180 $ (5) Land Held for Future Development per page 26. (4) Value creation is equal to projected future stabilized value less total Economic Costs. The projected future stabilized value is based on the projected annual NOI at stabilization, less capital reserves divided by the estimated current capitalization rate, increased by 10 bps for each year until stabilization. Total potential value creation represents the undiscounted total future value to be created at the stabilization date. (13) Potential dilution associated with the conversion of the outstanding Series A Preferred Stock utilizing the treasury stock method and common stock market price as of December 31, 2014. © 2015 Monogram Residential Trust, Inc. 36 |
|
|
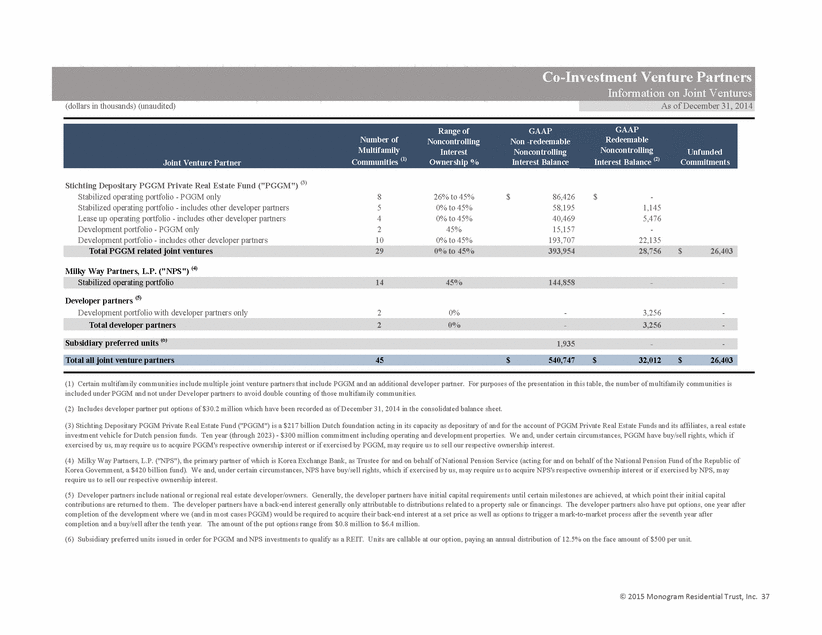
(dollars in thousands) (unaudited) Number of Multifamily Communities (1) Range of Noncontrolling Interest Ownership % GAAP Non -redeemable Noncontrolling Interest Balance GAAP Redeemable Noncontrolling Interest Balance (2) Unfunded Commitments Stichting Depositary PGGM Private Real Estate Fund ("PGGM") (3) Stabilized operating portfolio - PGGM only 8 26% to 45% 86,426 $ - $ Stabilized operating portfolio - includes other developer partners 5 0% to 45% 58,195 1,145 Lease up operating portfolio - includes other developer partners 4 0% to 45% 40,469 5,476 Development portfolio - PGGM only 2 45% 15,157 - Development portfolio - includes other developer partners 10 0% to 45% 193,707 22,135 Total PGGM related joint ventures 29 0% to 45% 393,954 28,756 26,403 $ Milky Way Partners, L.P. ("NPS") (4) Stabilized operating portfolio 14 45% 144,858 - - Developer partners (5) Development portfolio with developer partners only 2 0% - 3,256 - Total developer partners 2 0% - 3,256 - Subsidiary preferred units (6) 1,935 - - Total all joint venture partners 45 540,747 $ 32,012 $ 26,403 $ (6) Subsidiary preferred units issued in order for PGGM and NPS investments to qualify as a REIT. Units are callable at our option, paying an annual distribution of 12.5% on the face amount of $500 per unit. Co-Investment Venture Partners (4) MilkyWay Partners, L.P. ("NPS"), the primary partner of which is Korea Exchange Bank, as Trustee for and on behalf of National Pension Service (acting for and on behalf of the National Pension Fund of the Republic of Korea Government, a $420 billion fund). We and, under certain circumstances, NPS have buy/sell rights, which if exercised by us, may require us to acquire NPS's respective ownership interest or if exercised by NPS, may require us to sell our respective ownership interest. (5) Developer partners include national or regional real estate developer/owners. Generally, the developer partners have initial capital requirements until certain milestones are achieved, at which point their initial capital contributions are returned to them. The developer partners have a back-end interest generally only attributable to distributions related to a property sale or financings. The developer partners also have put options, one year after completion of the development where we (and in most cases PGGM) would be required to acquire their back-end interest at a set price as well as options to trigger a mark-to-market process after the seventh year after completion and a buy/sell after the tenth year. The amount of the put options range from $0.8 million to $6.4 million. Information on Joint Ventures (3) Stichting Depositary PGGM Private Real Estate Fund ("PGGM") is a $217 billion Dutch foundation acting in its capacity as depositary of and for the account of PGGM Private Real Estate Funds and its affiliates, a real estate investment vehicle for Dutch pension funds. Ten year (through 2023) - $300 million commitment including operating and development properties. We and, under certain circumstances, PGGM have buy/sell rights, which if exercised by us, may require us to acquire PGGM's respective ownership interest or if exercised by PGGM, may require us to sell our respective ownership interest. Joint Venture Partner (1) Certain multifamily communities include multiple joint venture partners that include PGGM and an additional developer partner. For purposes of the presentation in this table, the number of multifamily communities is included under PGGM and not under Developer partners to avoid double counting of those multifamily communities. (2) Includes developer partner put options of $30.2 million which have been recorded as of December 31, 2014 in the consolidated balance sheet. As of December 31, 2014 © 2015 Monogram Residential Trust, Inc. 37 |
|
|
Capital Expenditures Community Classifications Debt Classifications Definitions and other Explanatory Information Recurring Amounts capitalized in accordance with GAAP that help preserve but generally not increase the value and functionality of the community, such as replacements for appliances, carpeting and floorings, HVAC equipment and individual unit turnover costs. Repairs and maintenance amounts are expensed as incurred. Revenue Producing Amounts capitalized in accordance with GAAP that are expected to directly increase rental rates, such as major renovations and rehabilitations of units and common areas, improvements to leasable areas, retail tenant improvements and leasing. Costs related to developments and entire community rehabilitations are not included in Revenue Producing. Construction A multifamily community is considered under development and construction once we have signed a general contractors agreement and vertical construction has begun and ends once lease up has started. Communities under construction are classified as construction in progress for GAAP presentation. Land Held for Future Development Land held with no current significant development activity but may include development in the future is considered land held for future development. Stabilized We consider a property to be Stabilized generally once achieving 90% occupancy. Stabilized communities that are not Same Store are described as stabilized non-comparable. Co-Investment Venture Level Debt Co-Investment Venture level debt is defined as debt that is an obligation of the joint venture and is not an obligation or contingency for us but does allow us to increase our access to capital. Company Level Debt Company level debt is defined as debt that is a direct or indirect obligation of the Company or its wholly owned subsidiaries. Recourse Debt The portion for which the Company has provided recourse guarantees. The non-guaranteed portion is separately presented, usually as Co-Investment Venture Level. Normal “bad boy” provisions, e.g. bankruptcy, environmental, are not included as Recourse Debt. Non-Recurring Amounts capitalized in accordance with GAAP related to property upgrades and building improvements, such as remodeling, investments in longer-lived assets and infrequent or unscheduled expenditures that are not considered Revenue Producing such as roofs, lobby renovations and parking lots. Lease up A multifamily community is considered in lease up when the community has begun leasing. A temporary certificate of occupancy may be obtained as units are completed in phases, and accordingly, lease up may occur prior to final completion of the building. Lease up communities are generally classified in construction in progress for GAAP presentation prior to substantial completion and are generally classified in land, buildings and improvements once substantially complete. Operating A multifamily community is considered operating when substantially constructed and capable of generating all significant revenue sources. At such time, the community is classified as land, buildings and improvements for GAAP presentation. Pre-development A multifamily community is considered in pre-development during finalization of budgets, permits and plans and ends once a general contractor agreement has been signed and vertical construction has begun. Same Store Our Same Store multifamily communities are defined as those that are stabilized and comparable for both the current and the prior reporting year. © 2015 Monogram Residential Trust, Inc. 38 |
|
|
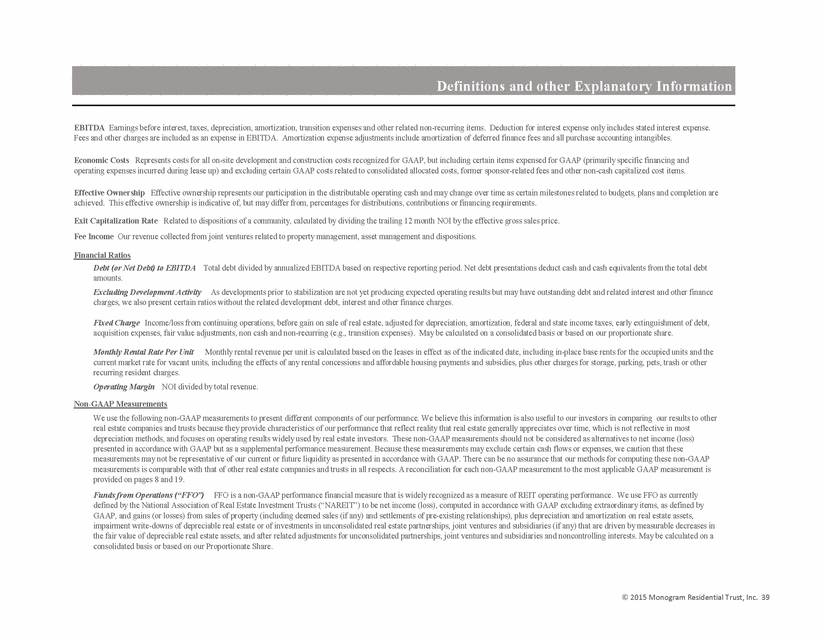
Definitions and other Explanatory Information Financial Ratios Operating Margin NOI divided by total revenue. Non-GAAP Measurements Funds from Operations (“FFO”) FFO is a non-GAAP performance financial measure that is widely recognized as a measure of REIT operating performance. We use FFO as currently defined by the National Association of Real Estate Investment Trusts (“NAREIT”) to be net income (loss), computed in accordance with GAAP excluding extraordinary items, as defined by GAAP, and gains (or losses) from sales of property (including deemed sales (if any) and settlements of pre-existing relationships), plus depreciation and amortization on real estate assets, impairment write-downs of depreciable real estate or of investments in unconsolidated real estate partnerships, joint ventures and subsidiaries (if any) that are driven by measurable decreases in the fair value of depreciable real estate assets, and after related adjustments for unconsolidated partnerships, joint ventures and subsidiaries and noncontrolling interests. May be calculated on a consolidated basis or based on our Proportionate Share. Fixed Charge Income/loss from continuing operations, before gain on sale of real estate, adjusted for depreciation, amortization, federal and state income taxes, early extinguishment of debt, acquisition expenses, fair value adjustments, non cash and non-recurring (e.g., transition expenses). May be calculated on a consolidated basis or based on our proportionate share. Monthly Rental Rate Per Unit Monthly rental revenue per unit is calculated based on the leases in effect as of the indicated date, including in-place base rents for the occupied units and the current market rate for vacant units, including the effects of any rental concessions and affordable housing payments and subsidies, plus other charges for storage, parking, pets, trash or other recurring resident charges. EBITDA Earnings before interest, taxes, depreciation, amortization, transition expenses and other related non-recurring items. Deduction for interest expense only includes stated interest expense. Fees and other charges are included as an expense in EBITDA. Amortization expense adjustments include amortization of deferred finance fees and all purchase accounting intangibles. We use the following non-GAAP measurements to present different components of our performance. We believe this information is also useful to our investors in comparing our results to other real estate companies and trusts because they provide characteristics of our performance that reflect reality that real estate generally appreciates over time, which is not reflective in most depreciation methods, and focuses on operating results widely used by real estate investors. These non-GAAP measurements should not be considered as alternatives to net income (loss) presented in accordance with GAAP but as a supplemental performance measurement. Because these measurements may exclude certain cash flows or expenses, we caution that these measurements may not be representative of our current or future liquidity as presented in accordance with GAAP. There can be no assurance that our methods for computing these non-GAAP measurements is comparable with that of other real estate companies and trusts in all respects. A reconciliation for each non-GAAP measurement to the most applicable GAAP measurement is provided on pages 8 and 19. Exit Capitalization Rate Related to dispositions of a community, calculated by dividing the trailing 12 month NOI by the effective gross sales price. Fee Income Our revenue collected from joint ventures related to property management, asset management and dispositions. Debt (or Net Debt) to EBITDA Total debt divided by annualized EBITDA based on respective reporting period. Net debt presentations deduct cash and cash equivalents from the total debt amounts. Excluding Development Activity As developments prior to stabilization are not yet producing expected operating results but may have outstanding debt and related interest and other finance charges, we also present certain ratios without the related development debt, interest and other finance charges. Economic Costs Represents costs for all on-site development and construction costs recognized for GAAP, but including certain items expensed for GAAP (primarily specific financing and operating expenses incurred during lease up) and excluding certain GAAP costs related to consolidated allocated costs, former sponsor-related fees and other non-cash capitalized cost items. Effective Ownership Effective ownership represents our participation in the distributable operating cash and may change over time as certain milestones related to budgets, plans and completion are achieved. This effective ownership is indicative of, but may differ from, percentages for distributions, contributions or financing requirements. © 2015 Monogram Residential Trust, Inc. 39 |
|
|
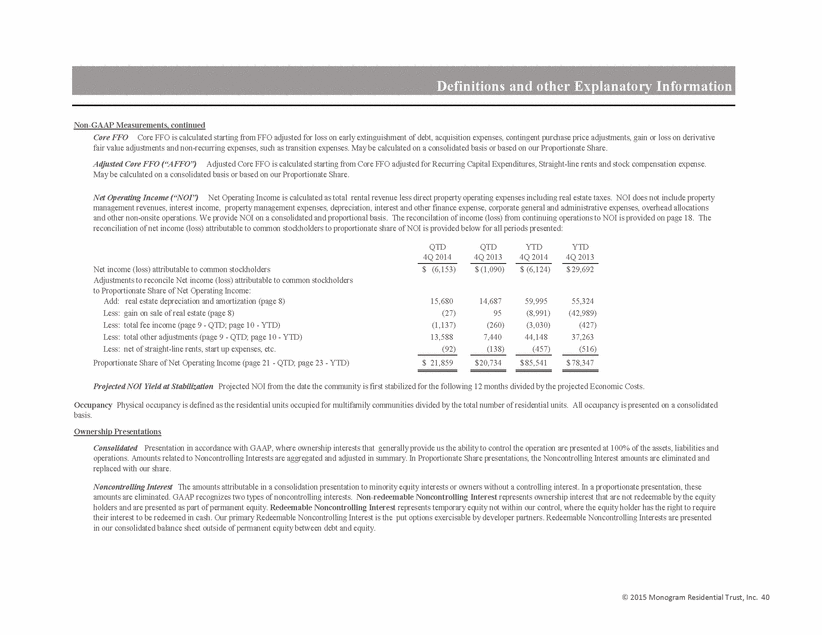
Definitions and other Explanatory Information Non-GAAP Measurements, continued QTD 4Q 2014 QTD 4Q 2013 YTD 4Q 2014 YTD 4Q 2013 Net income (loss) attributable to common stockholders (6,153) $ (1,090) $ (6,124) $ 29,692 $ Adjustments to reconcile Net income (loss) attributable to common stockholders to Proportionate Share of Net Operating Income: Add: real estate depreciation and amortization (page 8) 15,680 14,687 59,995 55,324 Less: gain on sale of real estate (page 8) (27) 95 (8,991) (42,989) Less: total fee income (page 9 - QTD; page 10 - YTD) (1,137) (260) (3,030) (427) Less: total other adjustments (page 9 - QTD; page 10 - YTD) 13,588 7,440 44,148 37,263 Less: net of straight-line rents, start up expenses, etc. (92) (138) (457) (516) Proportionate Share of Net Operating Income (page 21 - QTD; page 23 - YTD) 21,859 $ 20,734 $ 85,541 $ 78,347 $ Ownership Presentations Core FFO Core FFO is calculated starting from FFO adjusted for loss on early extinguishment of debt, acquisition expenses, contingent purchase price adjustments, gain or loss on derivative fair value adjustments and non-recurring expenses, such as transition expenses. May be calculated on a consolidated basis or based on our Proportionate Share. Adjusted Core FFO (“AFFO”) Adjusted Core FFO is calculated starting from Core FFO adjusted for Recurring Capital Expenditures, Straight-line rents and stock compensation expense. May be calculated on a consolidated basis or based on our Proportionate Share. Net Operating Income (“NOI”) Net Operating Income is calculated as total rental revenue less direct property operating expenses including real estate taxes. NOI does not include property management revenues, interest income, property management expenses, depreciation, interest and other finance expense, corporate general and administrative expenses, overhead allocations and other non-onsite operations. We provide NOI on a consolidated and proportional basis. The reconcilation of income (loss) from continuing operations to NOI is provided on page 18. The reconciliation of net income (loss) attributable to common stockholders to proportionate share of NOI is provided below for all periods presented: Projected NOI Yield at Stabilization Projected NOI from the date the community is first stabilized for the following 12 months divided by the projected Economic Costs. Occupancy Physical occupancy is defined as the residential units occupied for multifamily communities divided by the total number of residential units. All occupancy is presented on a consolidated basis. Consolidated Presentation in accordance with GAAP, where ownership interests that generally provide us the ability to control the operation are presented at 100% of the assets, liabilities and operations. Amounts related to Noncontrolling Interests are aggregated and adjusted in summary. In Proportionate Share presentations, the Noncontrolling Interest amounts are eliminated and replaced with our share. Noncontrolling Interest The amounts attributable in a consolidation presentation to minority equity interests or owners without a controlling interest. In a proportionate presentation, these amounts are eliminated. GAAP recognizes two types of noncontrolling interests. Non-redeemable Noncontrolling Interest represents ownership interest that are not redeemable by the equity holders and are presented as part of permanent equity. Redeemable Noncontrolling Interest represents temporary equity not within our control, where the equity holder has the right to require their interest to be redeemed in cash. Our primary Redeemable Noncontrolling Interest is the put options exercisable by developer partners. Redeemable Noncontrolling Interests are presented in our consolidated balance sheet outside of permanent equity between debt and equity. © 2015 Monogram Residential Trust, Inc. 40 |
|
|
Definitions and other Explanatory Information Ownership Presentations, continued Percent Complete To provide one measure of development status, calculated as Economic Costs incurred divided by total Economic Costs. PGGM Stichting Depositary PGGM Private Real Estate Fund ("PGGM"), a $217 billion Dutch foundation. Year Built The date the community is substantially completed or renovated and ready for its intended use. Proportionate Share A non-GAAP presentation of financial amounts at our effective cash share based on our participation in distributable operating cash. The amounts include our share of Unconsolidated Joint Ventures and excludes Noncontrolling Interest in consolidated joint ventures. Proportionate share presentations may be useful in analyzing our financial information by providing revenues, expenses, assets and liabilities attributable only to our shareholders. Unconsolidated Joint Venture In accordance with GAAP, investments in joint venture that are presented on the equity method of accounting, reporting net assets as a single net investment and operations as a single equity in earnings. In Proportionate Share presentations, the investment and the equity in earnings are eliminated and replaced with our share. Straight-line rents In accordance with GAAP, rental revenues are recorded evenly over the contractual period, irrespective of the timing of cash collections. The difference between the amount actually collected for a period and the straight-line amount is referred to as the Straight-line rent adjustment. This adjustment amount is reversed in presenting AFFO. Transition expenses Transition expenses include expenses related to our transition to self-management, primarily including legal, financial advisors, consultants, costs of the Company’s special committee of the board of directors, comprised of all of the Company’s independent directors (the “Special Committee”), general transition services (primarily related to staffing, name change, notices, transition-related insurance, information technology and facilities), expenses related to a listing on a national securities exchange and payments to our former advisor in connection with the transition to self-management. In accordance with GAAP, transition expenses not related to assets with a recoverable value are expensed as the service is performed. Unfunded Commitments Amounts under a contractual commitment that have not been funded. Unfunded Commitments do not include amounts related to fundings that are contingent on future events that are within our control. © 2015 Monogram Residential Trust, Inc. 41 |

