Attached files
| file | filename |
|---|---|
| 8-K - 8-K - CARBO CERAMICS INC | d895538d8k.htm |
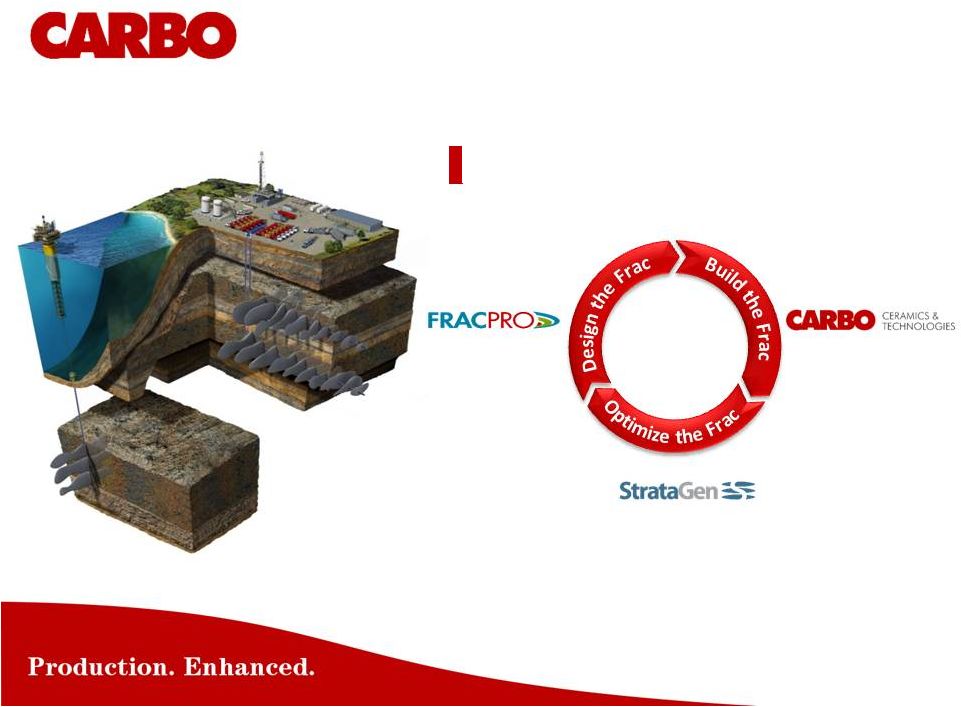 Production
Enhancement ....provides industry leading technology for:
Scotia Howard Weil 43
rd
Annual Energy Conference
March 25
th
, 2015
Higher
Production
& EUR
Exhibit 99.1 |
 Forward Looking
Statements The Private Securities Litigation Reform Act of 1995 provides a "safe
harbor" for forward-looking statements. Any written or oral statements made by
the Company or on behalf of the Company in conjunction with this presentation may
include forward-looking statements which reflect the Company's current views with respect to
future events and financial performance. These forward-looking statements are subject to
certain risks and uncertainties that could cause actual results to differ materially
from such statements. This document contains forward-looking statements within the
meaning of the Private Securities Litigation Reform Act of 1995 concerning, among other
things, the Company's prospects, developments and business strategies for its operations, all of
which are subject to certain risks, uncertainties and assumptions. These risks and
uncertainties include, but are not limited to, changes in overall economic conditions,
changes in the cost of raw materials and natural gas used in manufacturing our
products, changes in demand and prices charged for our products, changes in the demand
for, or price of, oil and natural gas, risks of increased competition, technological,
manufacturing, distribution and product development risks, loss of key customers,
changes in government regulations, foreign and domestic political and legislative
risks, the risks of war and international and domestic terrorism, risks associated with
foreign operations and foreign currency exchange rates and controls, weather-related risks
and other risks and uncertainties described in our publicly available filings with the
Securities and Exchange Commission. The words "believe,”
"expect,” "anticipate,” "project" and similar expressions identify forward-looking statements.
Participants are cautioned not to place undue reliance on these forward-looking
statements, each of which speaks only as of the date the statement was made. The
Company undertakes no obligation to publicly update or revise any forward-looking
statements, whether as a result of new information, future events or otherwise, except
as required by law.
2 |
 •
Frac Conductivity &
Durability
•
Production Assurance
•
Flow Enhancement
•
Fracture Evaluation
•
Well Site Supervision
•
Frac Diagnostics & Optimization
•
Field Development Optimization
•
Reservoir & Formation Analysis
•
Frac Design
•
Economic Optimization
•
Reservoir Performance
•
Post Job Analysis
….a leading production enhancement company
Higher
Production &
EUR |
 Managing Through
The Down-Cycle Actions |
 In the near
term, we focus on being cash positive: –
–
CARBO Down-Cycle Actions and Focus
CARBO will manage through this down-cycle, and will continue with
its long term strategy
Reduce discretionary spending, and seek reduction in costs from our suppliers
Capex expenditures and dividend reductions implemented as part of cash
preservation
Reducing the workforce. First quarter will include severance costs.
Right-size the organization to the industry’s activity levels
Mothballing, idling and slowing down production at our manufacturing facilities.
This results in under-absorbed / period costs (depreciation, natural gas
commitments, fixed facility charges, etc.) that will burden the income statement.
Reduce inventory levels |
 Managing The
Company For The Long Term Improving Well Production and EUR with Technology
|
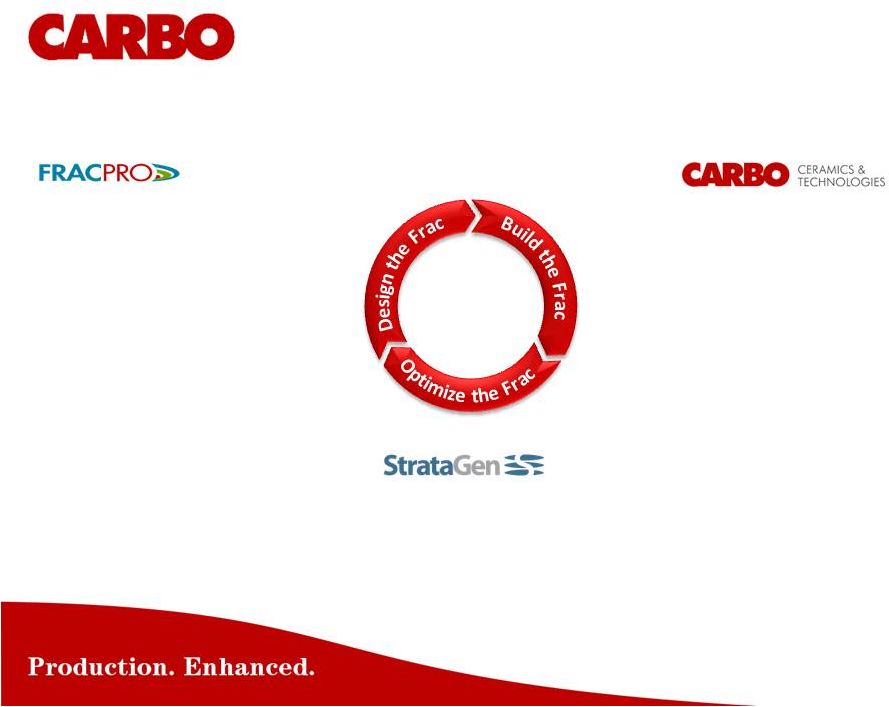
 Differentiate
with
Design-Build-Optimize
The
Frac
technology
strategy.
Our
multi-year effort to develop industry leading technology is starting to pay off.
–
KRYPTOSPHERE
is a “game-changer”
proppant, Offshore E&P orders are growing
–
SCALEGUARD, NRT, RPM, save
money
for
E&P
and
are
growing
in
client
base
–
Other platform technologies are currently in field test
–
StrataGen
leads as a “trusted advisor”
to E&P. Developing reputation as having
the best people to increase well Production and EUR by using technology.
–
Fracpro
continues to lead as the industry’s frac design software
Focus on growing ceramic proppant market share
Grow our sand business
Continue Falcon transition into products-based sales
Long Term Strategy and Focus
Longer term, we continue actions that keep us as the industry leader:
|
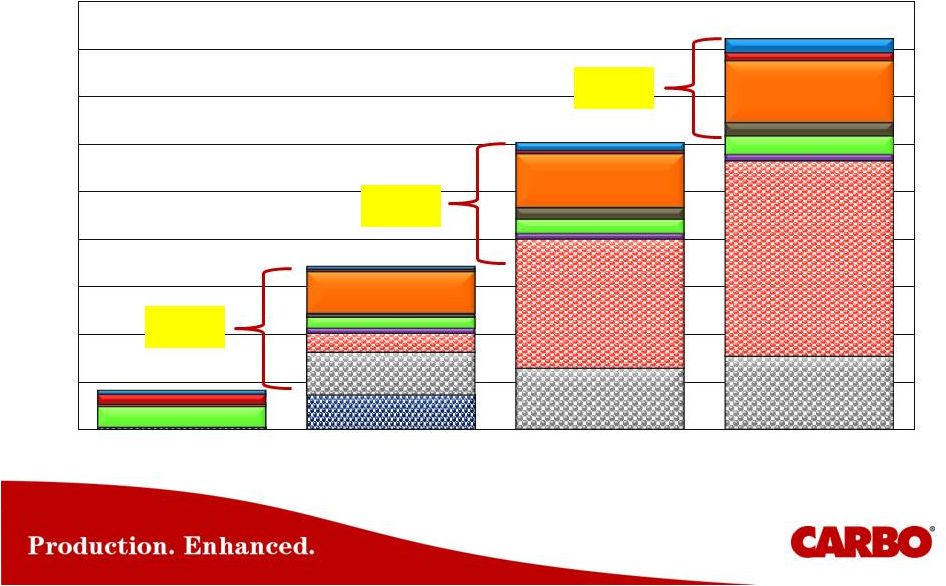 New Technology
Growth Targets Product Revenue
330%
75%
35%
2014
2015
2016
2017
$0
$10
$20
$30
$40
$50
$60
$70
$80
$90 |
 9
Our technology is 100% focused on improving
Production and EUR
•
Frac with the right technology the first time, to maximize ROI
–
Re-fracs are a costly example
of not doing it right the first time
•
Technology
developed
for
“life
of
the
well”
to
maximize
EUR
•
Technology developed for quick payback (months not years)
•
Proppant-delivered platforms greatly improve the effectiveness of
the technologies, and lowers the cost
•
Improves F&D costs $$/BOE……….and Lease Operating Expense (LOE)
|
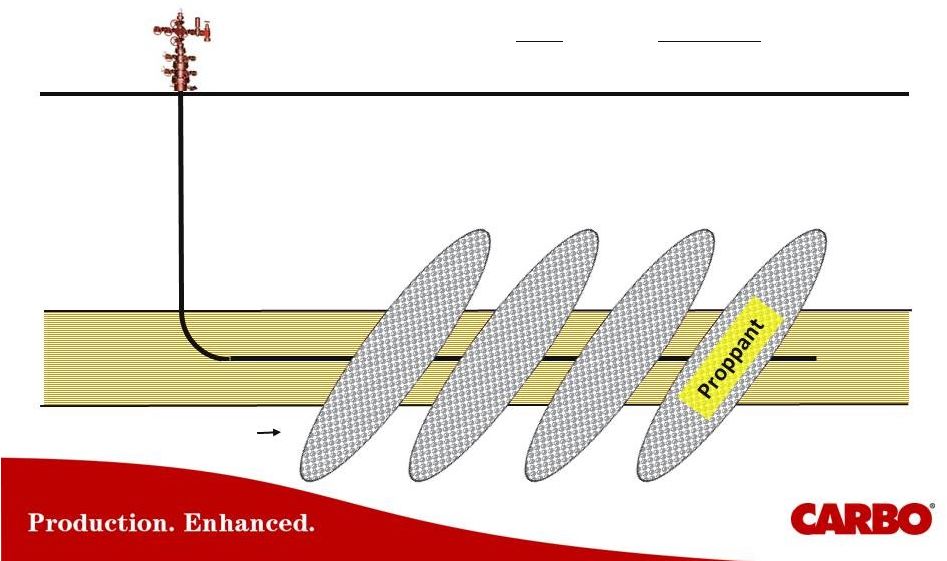 Oil &
Gas Multiple transverse fractures
Wellhead
“Built To Last The Life Of The Well”
…..when we are done, the only thing left
is the well
and the proppant, make sure
it has a long productive life.
Reservoir |
 Proppant
Delivered
Technology
Platforms
Proppant
Delivered
Production
Assurance
Proppant
Delivered
Flow
Enhancement
Proppant
Delivered
Fracture
Evaluation
Higher
EUR
Production
R.O.I.
Infused Chemical
Delivery System
Resin Coated Products
CARBOBOND
Ceramics |
 •
Chemically infused porous proppant with
controlled release of scale inhibitor, into
the production stream
•
Industry’s most effective scale inhibition
due to controlled release
•
Increases Production and EUR, and
lowers LOE
for E&P Operators
-
Provides production protection for
months/years
-
Reduces costly work-overs & pump
repairs
-
Prevent scaling damage from forming in
the frac
Production Assurance -
SCALEGUARD
Tubing with scale,
restricting production |
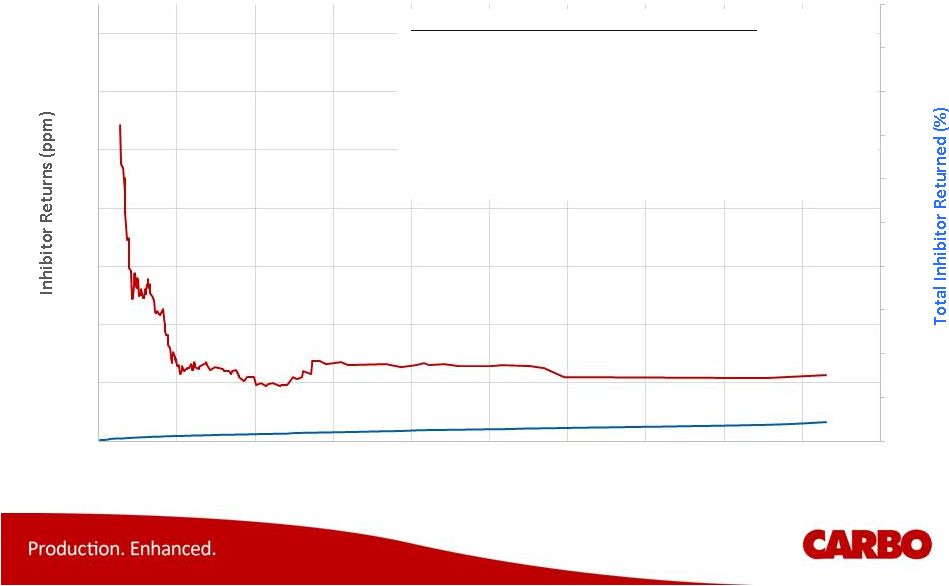 SCALEGUARD - Long Life
Protection •
No production loss due to scaling, and lowers LOE
•
Controlled release working as designed
•
After 8 months, no scaling problems
•
Maintain scale control above an engineered
minimum inhibitor concentration
•
Projecting several years of inhibition
Uinta Basin Scale Inhibition Success
0
10
20
30
40
50
60
70
80
90
100
0
20
40
60
80
100
120
140
0
2000
4000
6000
8000
10000
12000
14000
16000
18000
20000
Cumulative Water Produced (bbl) |
 •
Reliable / controlled release of scale inhibitor from proppant pack
•
Remediate scale build up near perforations and wellbore
•
8 months without Scaling in tubulars / proppant pack
•
Eliminated workover operations @ $25,000 / quarter
•
Removed need for continuous chemical injection @ $2,500 / month
SCALEGUARD –
Lowers LOE |
 Flow Enhancement
- CARBORPM
•
Increases Production and EUR
by
improving the permeability to
hydrocarbons in the propped fracture
•
Minimize capillary pressures in propped
fracture with neutral wettability
•
Increase effective fracture conductivity
–
Improve fracture clean-up
–
Reduce multiphase flow effects
•
Recent activity in Permian basin for several
operators has shown favorable results |
 16
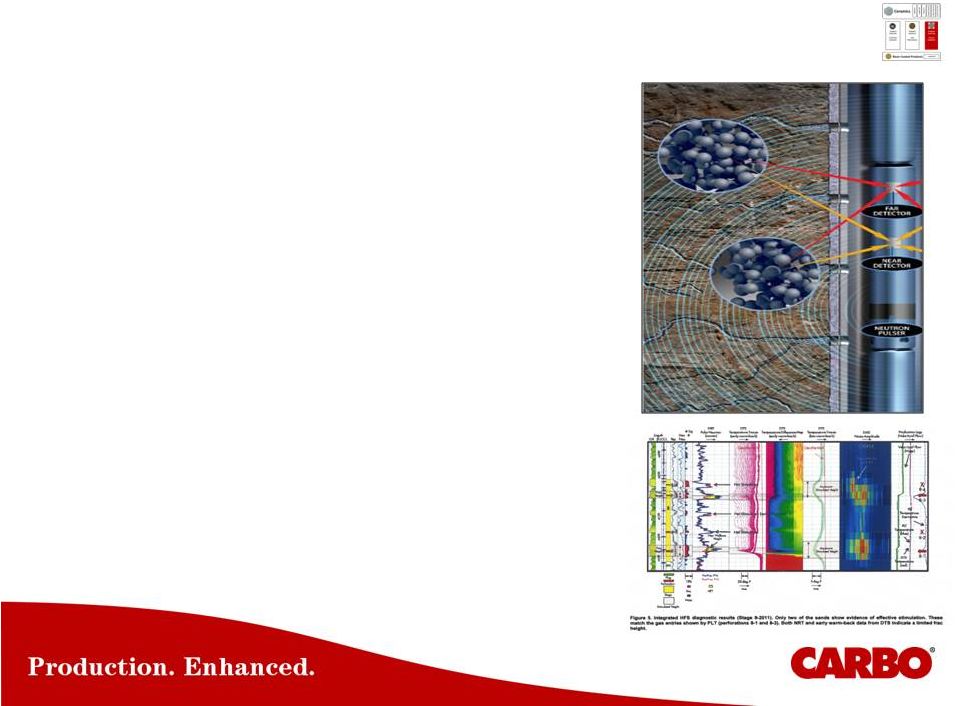
Fracture Evaluation -
CARBONRT
•
Identifying proppant placement, helps
identify production improvement
•
Non-radioactive tagged proppant
–
Environmentally friendly, manufactured into
proppant grains
–
Direct measurement of proppant placement
•
In vertical wells, measurement of
fracture height allows estimate of
fracture geometry
•
In horizontal wells, helps determine
stage spacing and coverage
•
Integrate with other measurements
–
Surface & downhole microseismic
–
Fiber optic temperature & acoustics
SPE 168603, Shell Pinedale |
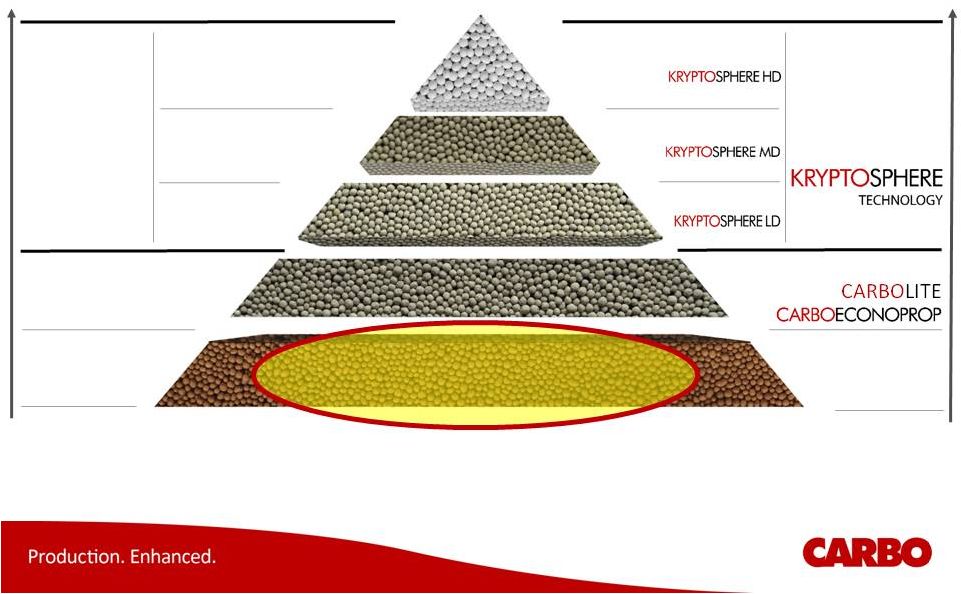
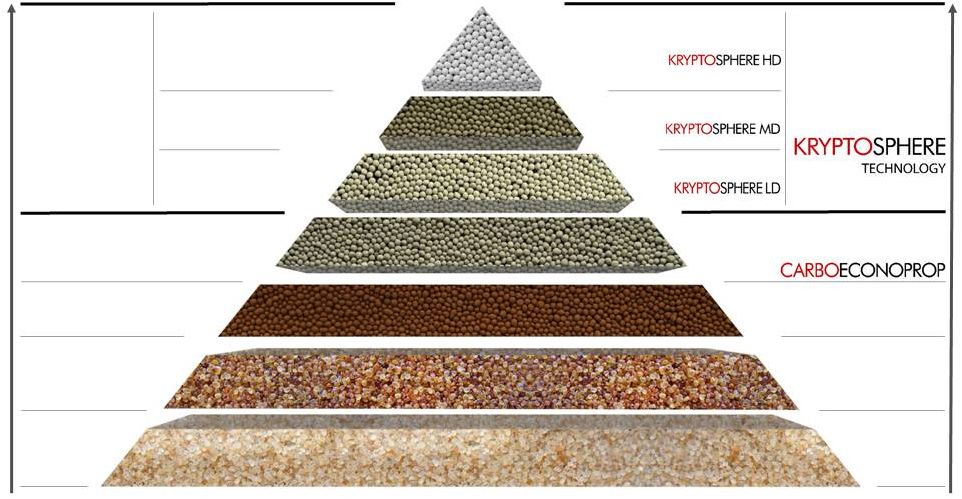 Well Production
- Hierarchy of Proppant Value
Chart prepared by and
property of CARBO Ceramics Inc.
Highest Conductivity
Highest Production, EUR, ROI
Mono-sized
Spherical
Smooth surface
Low beta
Low steel erosivity
Quality Ceramic
Standard Ceramic
Chinese, Russian, Brazilian
Ultra-conductivity
More uniform flow path
More durability
Precision-engineered
Variable conductivity
Poor Quality
Conductivity
=
Permeability
of
the
frac
x
width
of
the
frac
=
K
frac
x
W
frac
Low density
Ultimate-high strength
Ultra-high strength
Very-high strength
High conductivity
Medium density
High density
Medium strength
Irregular size & shape
Medium conductivity
Resin-coated Sand
Low strength
Irregular size
& shape
Low conductivity
Sand
CARBOLITE |
 Originally
developed for deep water and ultra-high stress formations.
Have since developed it into a family of
products to address other reservoir
conditions.
Ultra-conductive ultra-high strength
proppant technology |
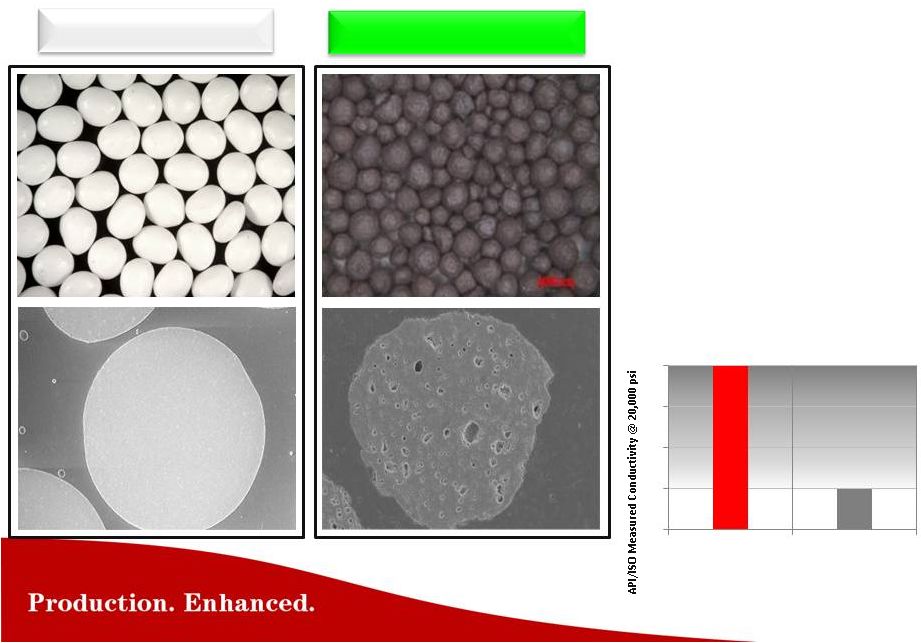 KRYPTOSPHERE HD KRYPTOSPHERE
is a paradigm shift in improved Conductivity
Competitors Bauxite
•
Superior Shape, Surface,
Microstructure, and Durability
•
KRYPTOSPHERE
HD
is the
strongest, highest conductivity
Proppant commercially available
today for the industry’s deepest,
highest stress wells
•
Tested successfully @30,000 psi
(industry API RP19C crush test)
•
KRYPTOSPHERE
HD
has 4 times
the conductivity of competitors
Bauxite Proppant @20,000 psi
4 times the
conductivity
after cyclic
loading
0
1
2
3
4
KRYPTOSPHERE
HD25
Competitors
Bauxite |
 “Proppant
is one of the biggest factors in determining Production and EUR in fracture
stimulated wells. It is important that E&P
Operators know what proppant is being
used in their wells. Make sure you are
getting the Conductivity and Quality you are
paying for.” |
 Do You Know What
Proppant Is Going In Your Well? Chart prepared by and
property of CARBO Ceramics Inc.
Highest Conductivity
Highest Production, EUR, ROI
Mono-sized
Spherical
Smooth surface
Low beta
Low erosivity
Quality Ceramic
Standard Ceramic
Chinese, Russian,
Brazilian
Ultra-conductivity
More uniform flow path
More durability
Precision-engineered
Variable conductivity
Poor quality
Conductivity
=
Permeability
of
the
frac
x
width
of
the
frac
=
K
frac
x
W
frac
Low density
Ultimate-high strength
Ultra-high strength
Very-high strength
High conductivity
Medium density
High density
Are you getting what you
paid for here? |
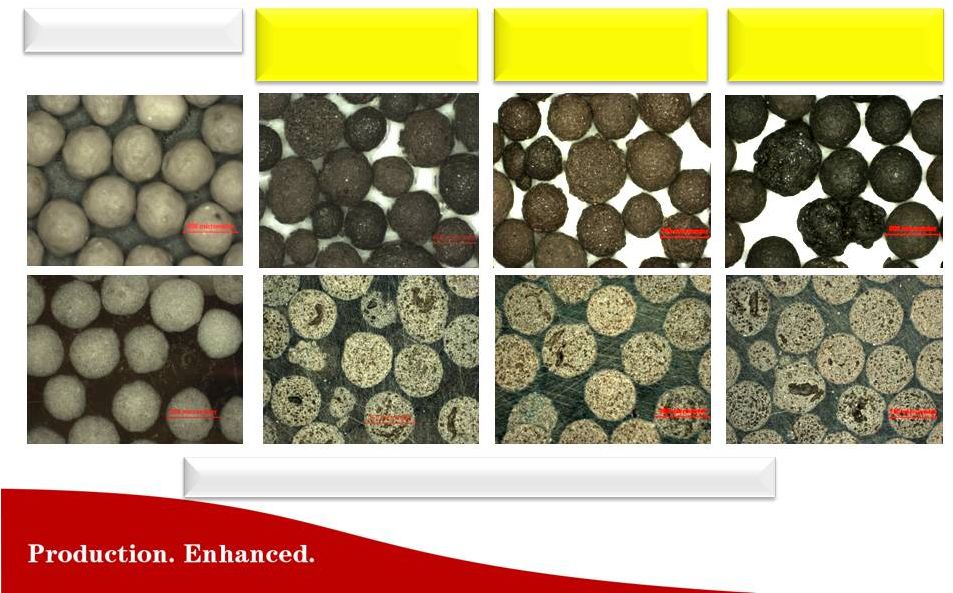
 Production
&
EUR
is
sacrificed
using
low
quality
Chinese
ceramic
Three Bakken field samples of low quality Chinese ceramic:
IDC = Intermediate Density Ceramic
Production & EUR
Loss due to Poor
Quality:
•
Irregular Size &
Shape reducing
flowrates
•
Rough Surface
reducing flowrates
•
High Internal Porosity
leads to Low
Strength & Crushing
as Closure Stress
Increases
•
All lead to Reduced
Frac Conductivity
Bottom Row Represents Whole Pellet Cross Sections
Chinese 20/40 IDC
Supplier A
Chinese 20/40 IDC
Supplier B
Chinese 20/40 IDC
Supplier C |
 CARBOLITE versus Chinese Ceramic
Three Bakken field samples of low quality Chinese ceramic:
IDC = Intermediate Density Ceramic
Bottom Row Represents Whole Pellet Cross Sections
CARBOLITE
20/40
Chinese 20/40 IDC
Supplier A
Chinese 20/40 IDC
Supplier B
Chinese 20/40 IDC
Supplier C |
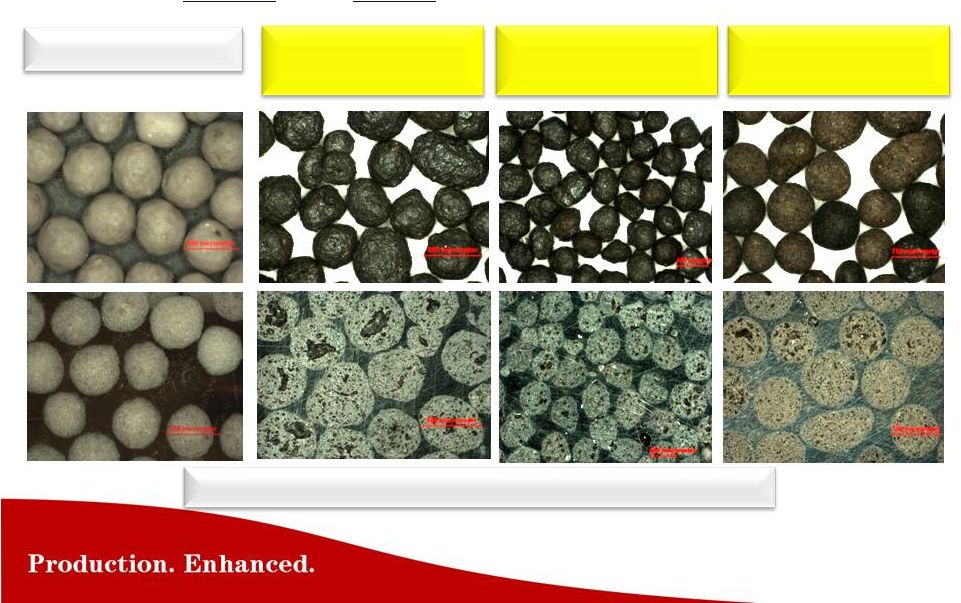 CARBOLITE versus Brazilian & Russian Ceramic
Two Brazilian
& one Russian
field samples of low quality ceramic proppant:
Field Samples #B1 taken in South Texas;
#B2, #R1 taken in North Dakota
LDC = Low Density Ceramic
Bottom Row Represents Whole Pellet Cross Sections
CARBOLITE
20/40
Brazilian 20/40 LDC
# B1
Brazilian 20/40 LDC
# B2
Russian 20/40 LDC
# R1 |
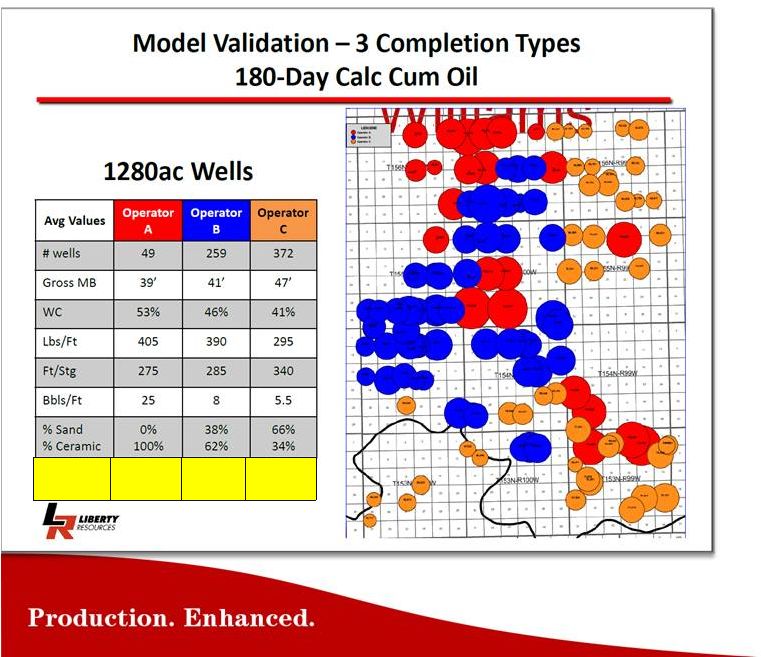
 25
Bakken
Operator
CARBO
vs Chinese
30 Day Cum Oil
*EUR
6 wells with
CARBOECONOPROP
low
density ceramic (LDC)
4 wells with Chinese
intermediate density
ceramic (IDC)
Frac Design
(per well)
~ 24 stages
~ 3 million lbs
*Operator projected EUR
from early time data
+20%
+120,000
bbl Oil
ECONOPROP
Average
Chinese IDC
Average
Chinese IDC
Average
ECONOPROP
Average
0
2
4
6
8
10
12 |
 Stakeholder
Value
Measurement
American Made
Ceramic Proppant
Low Quality Chinese
Ceramic Proppant
E&P Operators
Production & EUR
Higher
Lower
Less BOE produced,
due to poor quality
of proppant
E&P Operators
Natural Gas
Consumption
Higher
Zero
Due to being
manufactured in
China
USA
American Jobs
Higher
Made in AL, AR, GA, LA
Zero
Made in China
26
America’s Energy Renaissance …..“Made in America”
|
 “Over 150
SPE papers have been written documenting the benefits of increased conductivity
on well Production and EUR. Generally, the payout
on the additional Proppant investment is less than
3 -
6 months, and increases Production and EUR in a
range of 20% to 100%.”
Case Histories |
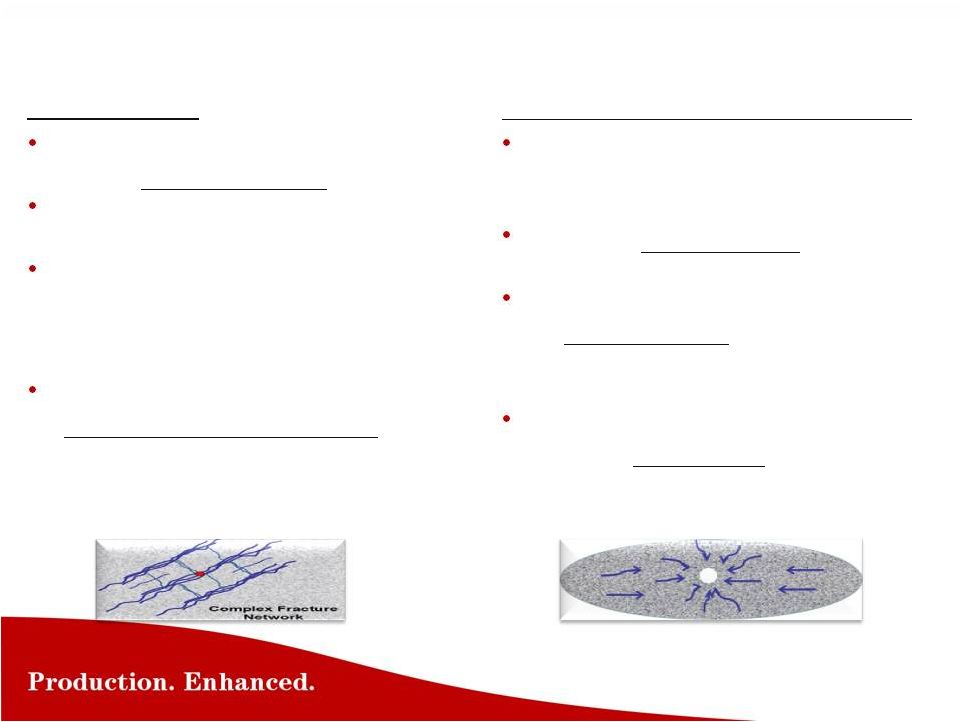 Contact
Area More Stimulated Reservoir Volume = Higher EUR
Convergent Flow, High Velocity & Delta P
To be economical, low perm reservoirs
require
large
contact
areas
to
drain
Create
many
transverse
fracs,
in
a
horizontal well
Create
complex
fractures
by
using
tech
niques such as slickwater, more stages,
& more perf density to enable more
frac initiation points
Complex
network
fracture
creation
is
dependent
on
formation
factors,
including brittleness
Convergent
Flow
from
Transverse
Fracs
creates enormous flow velocity near
wellbore, and choke points
Overcome
convergent
flow
issues
with
high
conductivity
tail-in
proppant
Overcome
the
reduced
flowrates
caused
by
multi-phase
flow
in
these
liquid
rich
reservoirs,
with
high
conductivity
proppant
The
proppant
needs
to
be
durable
to
with
stand
the
closure
stress
and
cyclic
loading
Conductivity
…for
“Life
of
Well” |
 Is Your Well
Built On Sand Foundations? |
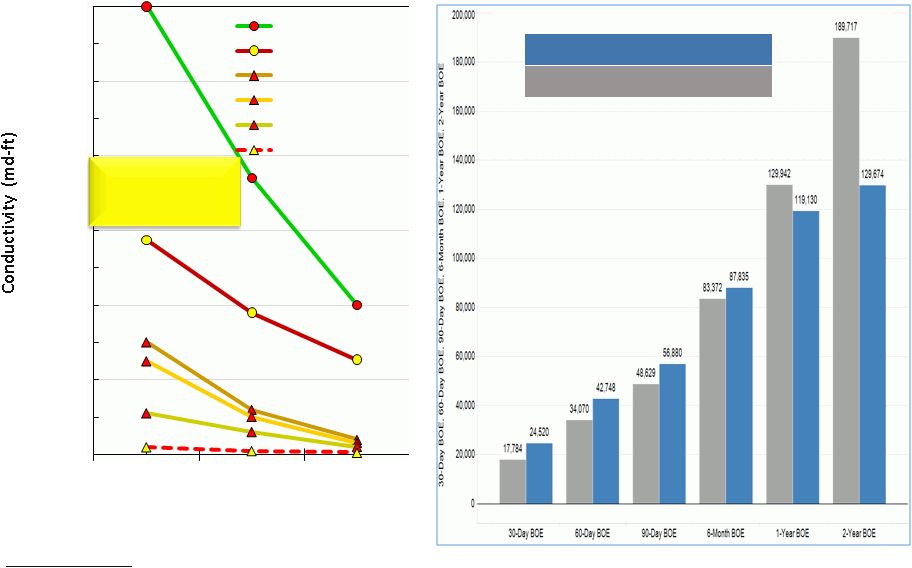 Closure
Stress (psi) Reference conductivity
-
does not include effects of non-darcy flow, multi-phase
flow, gel damage, etc.
Smaller mesh size
proppant, has much
lower Conductivity
Small-Mesh Operators
Other Operators
Eagle Ford –
Small Mesh Sand Evaluation
…..100 mesh sand can reduce EUR
Source: Public Production Database –
Eagle Ford Basin
0
1,000
2,000
3,000
4,000
5,000
6,000
6,000
8,000
10,000
CARBOLITE 20/40
CARBOLITE 30/50
White Sand 20/40
White Sand 30/50
White Sand 40/70
100 Mesh Sand |
 Permian Basin
- Wolfcamp Operators, Ward County
Ceramic wells
out produce
offset RCS
wells by 45%
Note:
Production
Only –
1 yr
Ceramic
Production
Gains
Net $ Gain
@ $40 Oil,
$3 Gas
Ceramic vs
Sand
74,870 bbls
$2,560,000
Ceramic vs
RCS
56,610 bbls
$1,855,000
183,097
126,482
108,229
0
20,000
40,000
60,000
80,000
100,000
120,000
140,000
160,000
180,000
200,000
0
2
4
6
8
10
12
Time (months)
Low Density Ceramic -
7 Wells
RCS -
9 Wells
Sand -
21 Wells |
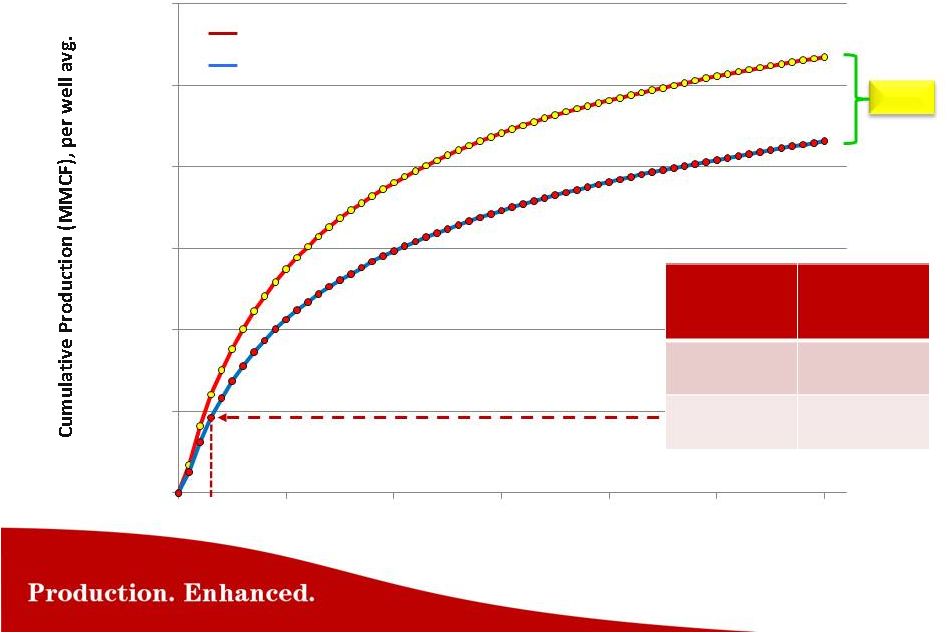
 Permian Basin
- Bone Spring Operators, Lea County
Ceramic wells
out produce
offset Sand
wells by 42%
Note: Oil
Production
Only -
14 mo
Ceramic
Production
Gains
Net $ Gain
@ $75 Oil
Ceramic vs
Sand
21,980 bbls
$1,650,000
Ceramic vs
RCS
32,110 bbls
$2,410,000
74,682
42,571
52,702
0
10,000
20,000
30,000
40,000
50,000
60,000
70,000
80,000
90,000
100,000
0
2
4
6
8
10
12
14
Time (months)
CARBOLITE/CARBOECONOPROP (3 wells)
RCS (4 wells)
Sand (19 wells) |
 Permian Basin
- Bone Spring Operators, Lea County
Ceramic wells
out produce
offset Sand
wells by 32%
Note:
Production
Only -
6 mo
Ceramic
Production
Gains
Net $ Gain
@ $40 Oil,
$3 Gas
Ceramic vs
Sand
18,391 bbls
$675,000
Ceramic vs
RCS
42,286 bbls
$1,560,000
76,522
34,236
58,131
0
10,000
20,000
30,000
40,000
50,000
60,000
70,000
80,000
90,000
0
1
2
3
4
5
6
7
Time (months)
Low Density Ceramic -
11 Wells
RCS -
6 Wells
Sand -
16 Wells |
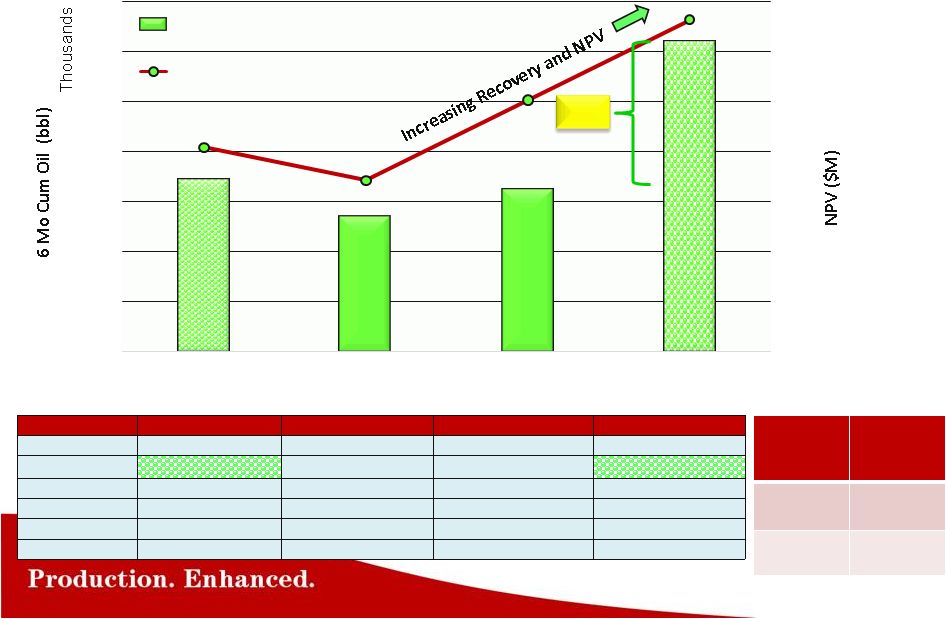 Initial
Wells Tested Sand
Tested More Stages
Today’s Design
Stages
20
20
30
30
Proppant Type
Ceramic
Sand
Sand
Ceramic
Well Cost
$5.5M
$5.0M
$5.4M
$6.7M
Model EUR
409 MBO
359 MBO
469 MBO
605 MBO
Pay Out
14.8 mo
15.5 mo
12.6 mo
12.5 mo
Well Count
5
63
42
8
Bakken Operator –
Optimizing Completion Design
6 Month
Production
Gain
~ 30,000
bbl oil per
well
Net $ Gain
@ $50 oil
$1,500,000
Payout on
Conductivity
~ 5 Months
92%
34
27
32
62
$0
$2
$4
$6
$8
$10
$12
$14
$16
0
10
20
30
40
50
60
70
Conductivity
Low Cost
Contact Area
Contact & Conductivity
6 Mo Cum Oil
NPV ($M) |
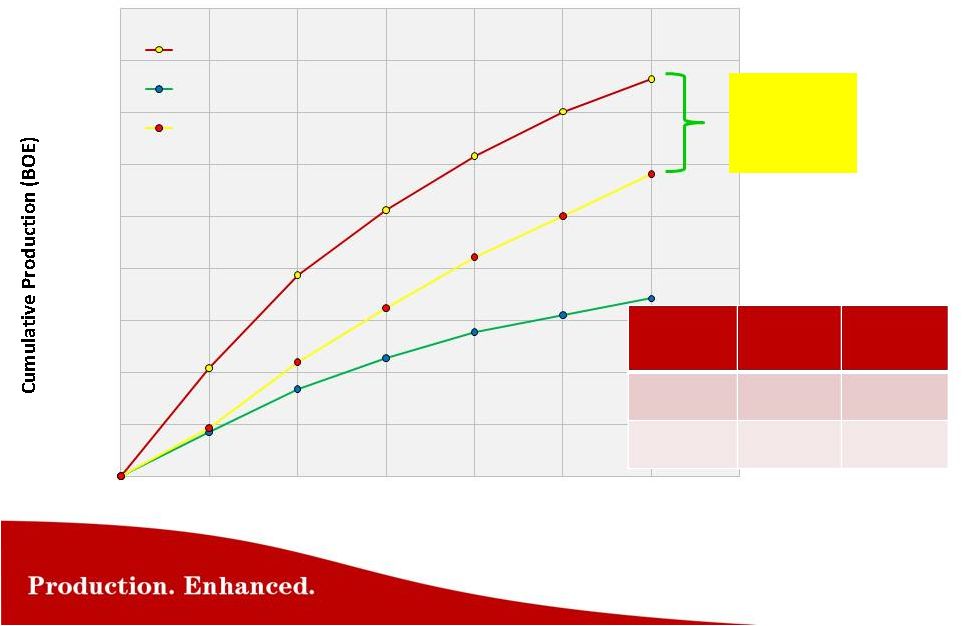
 Bakken
-
Statoil
Mountrail County
Note: Oil
Production
Only
Production
Gains
Net $ Gain
@ $75 Oil
6 Months
54,000 bbls
$4,050,000
36 Months
92,000 bbls
$6,900,000
Ceramic wells
out produce
offset Sand
wells by 42%
SPE Paper
134595
&
146376
–
Brigham
Exp/Statoil
Conductivity investment payback < 4 mo
118,992
309,781
65,064
217,824
0
50,000
100,000
150,000
200,000
250,000
300,000
350,000
0
6
12
18
24
30
36
Months
White Sand (12 wells)
CARBO
ECONOPROP (7
wells) |
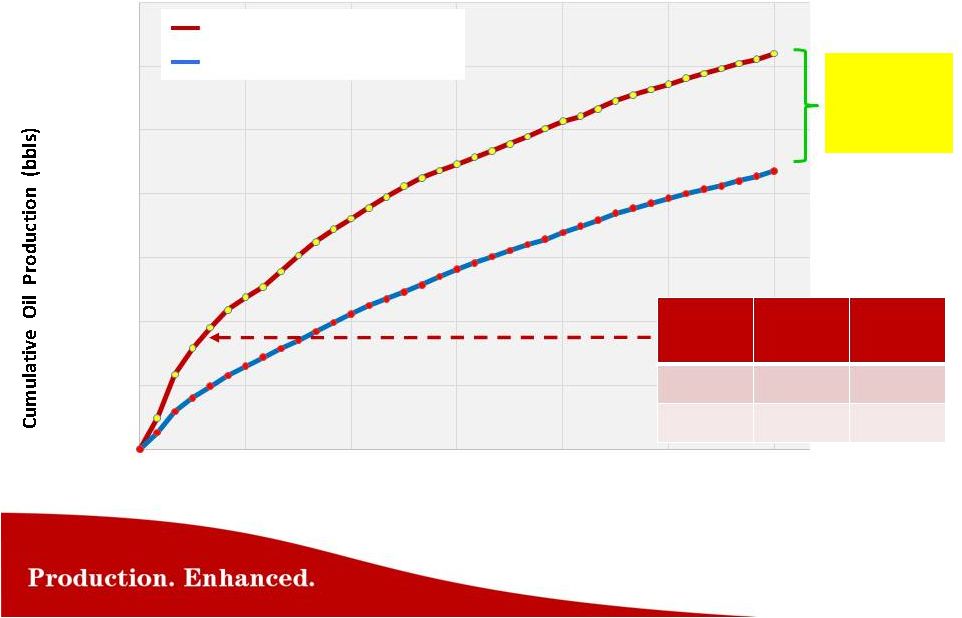
 Bakken
- Liberty Resources
Williams County Source: Bakken/Three Forks American Business Conference
180 Day
Cum Oil
81,000
73,000
56,500
•
Liberty Resources has
lead the way in
increasing Contact
Area
and
Conductivity
•
Higher well
production results
compared to offset
wells, has verified the
technical success of
their completions |
 Eagle
Ford
Operator
–
Optimizing
Completion
Design
Original Design
Incr Length, Stages, Sand
Incr Length, Stages, Ceramic
Avg # Stages
19
25
29
Proppant Type
Ceramic
Sand
Ceramic
Lbs Prop/Feet of lateral
1,312
2,533
1,402
Well Count
13
3
2
* Public production data
28,860
35,100
66,300
0
10,000
20,000
30,000
40,000
50,000
60,000
70,000
Conductivity Design (Ceramic)
Increased Contact Design (Sand)
Increased Contact & Conductivity
(Ceramic)
90 Day Cum Oil
Significant uplift to optimizing
contact and conductivity |
 Haynesville
– High Stress Reservoirs Need Ceramic
SPE Paper 160206
3
CARBOHYDROPROP
40%
Tail-in
(20
wells)
Resin
Coated
Sand
40%
Tail-in
(33
wells)
* Public production data
48 Month
Production
Gain
0.52 BCF
per well
Net $ Gain @
$4.00 NG
$2,070,000
Payout on
Conductivity
< 3 Months
24%
0
500,000
1,000,000
1,500,000
2,000,000
2,500,000
3,000,000
0
10
20
30
40
50
60
603,445
2,672,809
462,783
2,155,748
Months After Initial Production |
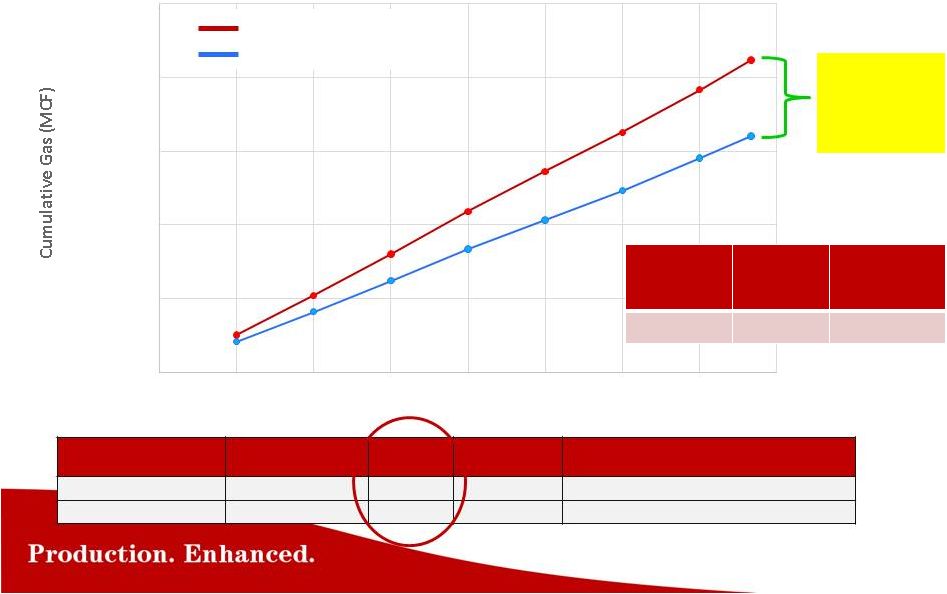 CARBOECONOPROP White Sand (Normalized)
2.4 x increase in sand/ft lateral yields 32% less Production
Ceramic well
out produces
offset Sand
well by 32%
Lateral Length
(feet)
Proppant
(Million lbs)
Frac Stages
Number
Cumulative Gas
Normalized on 6,800 Lateral
CARBOECONOPROP
6,800
5.5
27
2.12 BCF
White Sand
9,000
17.0
38
1.61 BCF
Cost Neutral Design….Ceramic outperforms Sand
NorthEast, Belmont County
0
500,000
1,000,000
1,500,000
2,000,000
2,500,000
0
1
2
3
4
5
6
7
8
Months
Gas
Production
Only
Production
Gains
Net $ Gain
@ $3/MCF
8 months
0.51 BCF
$1,530,000 |
 The Industry
Down-Cycle Business Impacts Industry Impact On Our Results
|
 Industry
Down-Cycle Business Impacts With oil price down ~50%, and natural gas pricing
expected to remain low: The decline in rig count has been very large, and very
fast. Lower 48 down ~ 50%
E&P
Operators
are
not
completing
(fracturing)
all
the
wells
they
are
drilling
–
Backlog of drilled but uncompleted wells growing
E&P
Operators
are
doing
every
thing
they
can
to
lower
well
cost.
Some
have
stopped using ceramic and are using sand for completions to lower cost,
regardless of the negative impact on well production.
With the over-supply of all proppant in the market, pricing is under pressure.
This includes ceramic, resin-coated sand, and sand.
Ceramic
sales
are
impacted
in
excess
of
the
decline
in
rig
count |
 CARBO
Down-Cycle Actions and Focus In the near term, we focus on being cash positive:
Reduce inventory levels
–
Mothballing, idling and slowing down production at our manufacturing
facilities. This results in under-absorbed / period costs (depreciation, natural
gas commitments, fixed facility charges, etc.) that will burden the income
statement.
Right-size the organization to the industry’s activity levels
–
Reducing the workforce. First quarter will include severance costs.
Capex expenditures and dividend reductions implemented as part of cash
preservation
Reduce discretionary spending, and seek reduction in costs from our
suppliers
CARBO will manage through this down-cycle, and will continue with its long
term strategy |
 “We are
building an enduring company that withstands the large industry
cycles, by focusing on improving well
Production and EUR through
continuous development of industry
leading technology.” |