Attached files
| file | filename |
|---|---|
| EX-32.1 - EX-32.1 - US FOODS, INC. | d852911dex321.htm |
| EX-31.2 - EX-31.2 - US FOODS, INC. | d852911dex312.htm |
| EX-32.2 - EX-32.2 - US FOODS, INC. | d852911dex322.htm |
| EX-31.1 - EX-31.1 - US FOODS, INC. | d852911dex311.htm |
Table of Contents
UNITED STATES
SECURITIES AND EXCHANGE COMMISSION
Washington, D.C. 20549
FORM 10-K/A
(Amendment No. 1)
| x | ANNUAL REPORT PURSUANT TO SECTION 13 OR 15(d) OF THE SECURITIES EXCHANGE ACT OF 1934 |
For the fiscal year ended December 27, 2014
OR
| ¨ | TRANSITION REPORT PURSUANT TO SECTION 13 OR 15(d) OF THE SECURITIES EXCHANGE ACT OF 1934 |
Commission File No. 333-185732

US Foods, Inc.
(Exact name of registrant as specified in its charter)
| Delaware | 36-3642294 | |
| (State or other jurisdiction of incorporation or organization) |
(I.R.S. Employer Identification Number) |
9399 W. Higgins Road, Suite 500
Rosemont, IL 60018
(847) 720-8000
(Address, including Zip Code, and telephone number, including area code, of registrant’s principal executive offices)
Securities registered pursuant to Section 12(b) of the Act: None
Securities registered pursuant to Section 12(g) of the Act: None
Indicate by check mark if the registrant is a well-known seasoned issuer, as defined in Rule 405 of the Securities Act. Yes ¨ No x
Indicate by check mark if the registrant is not required to file reports pursuant to Section 13 or Section 15(d) of the Act. Yes x No ¨
Indicate by check mark whether the registrant (1) has filed all reports required to be filed by Section 13 or 15(d) of the Securities Exchange Act of 1934 during the preceding 12 months (or for such shorter period that the registrant was required to file such reports), and (2) has been subject to such filing requirements for the past 90 days. Yes ¨ No x
Indicate by check mark whether the registrant has submitted electronically and posted on its corporate Web site, if any, every Interactive Data File required to be submitted and posted pursuant to Rule 405 of Regulation S-T during the preceding 12 months (or for such shorter period that the registrant was required to submit and post such files). Yes ¨ No x
Indicate by check mark if disclosure of delinquent filers pursuant to Item 405 of Regulation S-K is not contained herein, and will not be contained, to the best of registrant’s knowledge, in definitive proxy or information statements incorporated by reference in Part III of this Form 10-K or any amendment to this Form 10-K. x
Indicate by check mark whether the registrant is a large accelerated filer, an accelerated filer, a non-accelerated filer, or a smaller reporting company. See the definitions of “large accelerated filer,” “accelerated filer” and “smaller reporting company” in Rule 12b-2 of the Exchange Act.
| Large accelerated filer | ¨ | Accelerated filer | ¨ | |||
| Non-accelerated filer | x (Do not check if a smaller reporting company) | Smaller reporting company | ¨ | |||
Indicate by check mark whether the registrant is a shell company (as defined in Rule 12b-2 of the Exchange Act). Yes ¨ No x
The registrant is a privately held corporation and its equity shares are not publicly traded. At March 20, 2015, 1,000 shares of the registrant’s common stock were outstanding, all of which were owned by USF Holding Corp.
Table of Contents
EXPLANATORY NOTE
This Amendment No. 1 to the Annual Report on Form 10-K of US Foods, Inc. (the “Company”), amends the Company’s Annual Report on Form 10-K for the year ended December 27, 2014, which was filed with the Securities and Exchange Commission on March 20, 2015 (the “Original Filing”). The Company is filing this Amendment No. 1 solely to correct the date of its fiscal year end in each of Exhibit 32.1 and Exhibit 32.2, which were included in the Original Filing.
No other changes have been made to the Original Filing other than as described above. We have repeated the entire text of the Original Filing in this Amendment No. 1. This Amendment No. 1 does not amend or update in any way the disclosures made in the Original Filing.
Table of Contents
US Foods, Inc.
Annual Report on Form 10-K
| Page No. | ||||||
| Item 1. |
1 | |||||
| Item 1A. |
6 | |||||
| Item 1B. |
14 | |||||
| Item 2. |
15 | |||||
| Item 3. |
16 | |||||
| Item 4. |
17 | |||||
| Item 5. |
18 | |||||
| Item 6. |
18 | |||||
| Item 7. |
Management’s Discussion and Analysis of Financial Condition and Results of Operations |
21 | ||||
| Item 7A. |
38 | |||||
| Item 8. |
39 | |||||
| Item 9. |
Changes in and Disagreements with Accountants on Accounting and Financial Disclosure |
89 | ||||
| Item 9A. |
89 | |||||
| Item 9B. |
90 | |||||
| Item 10. |
91 | |||||
| Item 11. |
96 | |||||
| Item 12. |
Security Ownership of Certain Beneficial Owners and Management and Related Stockholder Matters |
132 | ||||
| Item 13. |
Certain Relationships and Related Transactions, and Director Independence |
134 | ||||
| Item 14. |
135 | |||||
| Item 15. |
136 | |||||
| 137 | ||||||
| 138 | ||||||
Table of Contents
| Item 1. | Business |
US Foods, Inc. and its consolidated subsidiaries is referred to here as “we,” “our,” “us,” “the Company,” or “US Foods.” We are a 100% owned subsidiary of USF Holding Corp. (“USF Holding”).
Our Company
We are a leading foodservice distributor in the United States, with about $23 billion in net sales for fiscal 2014. The Company provides an important link between over 5,000 suppliers and our 200,000 foodservice customers nationwide. We offer an innovative array of fresh, frozen and dry food, and non-food products, with approximately 350,000 stock-keeping units (“SKUs”). US Foods provides value-added services that meet specific customer needs. We believe the Company has one of the most extensive private label product portfolios in foodservice distribution. For the latest fiscal year, this represented about 30,000 SKUs, and over $7 billion in net sales. Many customers benefit from our support, such as product selection, menu preparation and costing strategies.
A sales force of approximately 4,000 associates market our products to a diverse customer base. Our principal customers include independently owned single and multi-location restaurants, regional concepts, national chains, hospitals, nursing homes, hotels and motels, country clubs, fitness centers, government and military organizations, colleges and universities, and retail locations. We have standardized our operations across the country that allows us to manage the business as a single operating segment with 61 divisions nationwide. We support our business with one of the largest private refrigerated fleets in the U.S., with roughly 6,000 trucks traveling an average of approximately 200 million miles each year. For business segment information, see Note 24 to the Audited Consolidated Financial Statements included in this Annual Report on Form 10-K.
Our vision, “To create a great American food company focused solely on foodservice.” This statement serves as a guide for our corporate strategy, summarized in four words: food, food people, and easy.
Food: To be a great American food company, our strategy focuses on offering customers great brands and innovative products, supported by an industry-leading category management capability. We strive to be the first to market with meaningful advances in product taste, quality, affordability or ease of use. We are building a cost-competitive, differentiated and efficient product assortment in every market, which corresponds to the needs of each individual customer category.
Food People: Our business model emphasizes local relationships with customers. To support this, our selling and marketing approach enables salespeople to easily share our wide assortment, and help customers select the products that fit their needs. They also are able to present value-added services that allow customers to better operate their businesses.
Easy: We offer customers a variety of tools and services so they can succeed in a competitive and challenging market. For example, our mobile and Internet-enabled ordering tools allow customers to place orders, track shipments, and quickly and efficiently see product details.
We have also focused on making the Company more efficient. That resulted in significant improvements in centralizing our operations and organizing them along functional lines. This includes customer-facing areas (such as category management and merchandising functions) as well as support functions (such as finance).
Our investments in the business reflect these strategic priorities. In 2015, we plan to enhance our category management and merchandising initiatives, and to optimize supply chain management. We continue to look for opportunities to provide our customers with new and innovative products and services.
Corporate History
US Foods’ roots date back over 150 years to a number of heritage companies, including Monarch Foods, founded in 1853, and White Swan, founded in 1872. During the 20th Century, through acquisitions and organic growth, three organizations emerged that would eventually become US Foods. These companies were US Foodservice, PYA/Monarch, and Alliant Foodservice. In 2000, Koninklijke Ahold N.V. (“Ahold”) entered the U.S. foodservice distribution industry, embarking on a period of rapid growth through acquisition. Ahold purchased US Foods and PYA/Monarch in April and December of 2000, respectively. In November 2001, Ahold acquired Alliant Foodservice. With this acquisition, US Foods established itself as the second largest broadline foodservice distribution company in the U.S. In 2007, USF Holding—formed and controlled by investment funds associated with or managed by Clayton, Dubilier & Rice, Inc. (“CD&R”), and Kohlberg Kravis Roberts & Co. (“KKR”) (collectively, the “Sponsors”)—acquired all the outstanding common shares of US Foods.
1
Table of Contents
Sysco/US Foods Merger
USF Holding is our parent company, which owns substantially all of our outstanding shares of common stock. On December 8, 2013, USF Holding entered into an Agreement and Plan of Merger (the “Merger Agreement”) with Sysco Corporation, a Delaware corporation (“Sysco”); Scorpion Corporation I, Inc., a Delaware corporation and a wholly owned subsidiary of Sysco; and Scorpion Company II, LLC, a Delaware limited liability company and a wholly owned subsidiary of Sysco. Under the Merger Agreement, Sysco will acquire USF Holding (the “Acquisition”) based on the terms and subject to the conditions in the Merger Agreement. The Acquisition is subject to customary conditions, including the expiration or termination of the applicable waiting period under the Hart-Scott-Rodino Antitrust Improvements Act of 1976, as amended (the “HSR Act”). The Merger Agreement could have been terminated by USF Holding or Sysco if the closing did not occur by March 8, 2015; provided that if all of the conditions to closing, other than termination of the waiting period of the HSR Act, have been satisfied, either party may extend the termination date in 60 day intervals to September 8, 2015 (such termination date is referred to as the “Merger Termination Date”). If the Merger Agreement is terminated because the required antitrust approvals cannot be obtained, in certain circumstances Sysco will be required to pay USF Holding, our parent, a termination fee of $300 million. On March 6, 2015, Sysco notified USF Holding of its decision to extend the termination date of the Merger Agreement for 60 days, from the then current termination date of March 8, 2015, to May 7, 2015.
On February 2, 2015, USF Holding, US Foods and certain of our subsidiaries and Sysco entered into an asset purchase agreement (the “Asset Purchase Agreement”) with Performance Food Group, Inc. (“PFG”), through which PFG agreed to purchase, subject to the terms and conditions of the Asset Purchase Agreement, eleven US Foods distribution centers located in the Cleveland, Ohio; Corona, California; Denver, Colorado; Kansas City, Kansas; Las Vegas, Nevada; Minneapolis, Minnesota; Phoenix, Arizona (including the Phoenix Stock Yards business); Salt Lake City, Utah; San Diego, California (including the San Diego Stock Yards business); San Francisco, California and Seattle, Washington markets, and related assets and liabilities, in connection with (and subject to) the closing of the Acquisition. The Asset Purchase Agreement contains certain termination rights, including the right for PFG to terminate if the transaction has not closed by the earlier of September 9, 2015 and the Merger Termination Date (subject to PFG’s right to extend under certain circumstances), and automatically terminates in the event the Merger Agreement terminates. The Asset Purchase Agreement provides that, upon termination under certain circumstances, PFG will be entitled to receive an aggregate termination fee of $25 million if termination occurs after May 2, 2015 and on or prior to July 6, 2015 and $50 million after July 6, 2015, with each of Sysco and US Foods responsible for one half of such aggregate termination fee.
On February 19, 2015, the U.S. Federal Trade Commission (“FTC”) voted by a margin of 3-2 to seek to block the Merger by filing a federal district court action in the District of Columbia for a preliminary injunction to prevent the parties from closing the Acquisition until after a full trial is conducted by a FTC Administrative Law Judge in a separate administrative action that was filed concurrently by the FTC. In addition, the District of Columbia and state attorney generals from 10 states have joined the FTC’s complaint for a preliminary injunction. Sysco issued a press release, announcing that it will contest the FTC’s attempt to block the proposed Acquisition. The preliminary injunctive hearing in federal court is scheduled to commence on May 5, 2015 and conclude no later than May 13, 2015. The FTC administrative trial is scheduled to commence on July 21, 2015.
In connection with the Merger Agreement, on December 10, 2013, we solicited the consents (the “Consent Solicitation”) of holders of our 8.5% unsecured Senior Notes (“Senior Notes”) due June 30, 2019 to amend the indenture with respect to the Senior Notes to modify certain definitions contained in the indenture for the Senior Notes, so that the Acquisition would not constitute a “Change of Control” under the indenture, and US Foods will not be required to make a “Change of Control Offer” to holders of the Senior Notes in connection with the Acquisition. On December 19, 2013, we received the required consents in connection with the consent solicitation and entered into a supplemental indenture with respect to these amendments.
Pursuant to the terms of the supplemental indenture, if either 1) the Merger Agreement is terminated in accordance with its terms or 2) the Acquisition is not consummated by a date as specified in the Merger Agreement, the indenture will revert to its prior form as if the amendments proposed in the consent solicitation had never become operative.
Although we have been advised by Sysco that, if any of our Senior Notes remain outstanding following the consummation of the Acquisition, Sysco intends to fully and unconditionally guarantee the obligations of US Foods under the indenture for the Senior Notes—Sysco is under no contractual or legal obligation to do so.
See “Item 7. Management’s Discussion and Analysis of Financial Condition and Results of Operations” for more information about the Acquisition and its impact on our business, and “Item 1A. Risk Factors” for risks associated with the Acquisition.
Industry Overview
The annual United States foodservice distribution industry that we can serve is estimated at about $240 billion. It is very fragmented, with about 15,000 foodservice distributors nationwide. These range from businesses selling a single product category (such as produce) to large broadline distributors with many divisions and thousands of products across many categories.
2
Table of Contents
This means customers have many choices. They often purchase concurrently from several foodservice distributors, including national distributors, regional distributors, local distributors and specialty distributors. In addition, they frequently buy from wholesale outlets (such as Restaurant Depot), and retailers (including Wal-Mart, Sam’s Club and Costco). With the rise of eCommerce, and low barriers to entry, Amazon.com and other Internet-oriented businesses also have entered the market. It is expected that wholesale outlets, large retailers and Internet-based suppliers will continue to expand their presence in the food distribution industry and seek to take market share from traditional foodservice distributors.
Based upon data provided by the USDA Economic Research Service, for over 25 years and prior to 2008, the U.S. foodservice industry was characterized by stable, predictable growth in total food purchases by dollar value. In 2008, however, the market was hit by the economic recession and the dislocation in the financial markets. That led to significant declines for large and small operators. Since 2010, the industry has shown signs of stabilization. This reflects improvements in the macroeconomic environment, consumer confidence, and stronger discretionary spending. However, growth remains well below historical averages.
The combination of high fragmentation, competition from all types and sizes of distributors, adjacent completion such as cash and carry and club stores, new market entrants, and low demand growth make this market very competitive.
Customers and Products
Our sales force of approximately 4,000 associates serves a diverse group of customers. These include independently owned single and multi-location restaurants, regional concepts, national chains, hospitals, nursing homes, hotels and motels, country clubs, fitness centers, government and military organizations, colleges and universities, and retail locations. In fiscal 2014, no individual customer represented more than 4% of total customer sales. Sales to our top 50 customers and group purchasing organizations (“GPOs”) represented approximately 43% of our net sales in fiscal year 2014.
Our customers rely on us for support in many areas, including product expertise and selection, menu preparation, recipe ideas and pricing strategies. They also benefit from nationally branded and private label products, value-added offerings, and customer service. Our customers typically purchase products from multiple foodservice distributors.
We have relationships with GPOs that act as agents for their members, negotiating pricing, delivery, and other terms. Some of our customers who are members of GPOs purchase their products directly from us pursuant to the terms negotiated by their GPOs. In fiscal 2014, about 23% of our total customer purchases came from customers pursuant to terms negotiated by GPOs. GPOs primarily focus on healthcare, hospitality, education, government/military and restaurant chains.
This table presents the sales mix for our principal product categories for the years ended December 27, 2014, December 28, 2013 and December 29, 2012:
| 2014 | 2013 | 2012 | ||||||||||
| Meats and seafood |
36 | % | 34 | % | 34 | % | ||||||
| Dry grocery products |
18 | % | 19 | % | 19 | % | ||||||
| Refrigerated and frozen grocery products |
15 | % | 16 | % | 16 | % | ||||||
| Equipment, disposables and supplies |
9 | % | 10 | % | 10 | % | ||||||
| Dairy |
11 | % | 10 | % | 10 | % | ||||||
| Beverage products |
6 | % | 6 | % | 6 | % | ||||||
| Produce |
5 | % | 5 | % | 5 | % | ||||||
|
|
|
|
|
|
|
|||||||
| 100 | % | 100 | % | 100 | % | |||||||
|
|
|
|
|
|
|
|||||||
Merchandising
Our Merchandising Group manages procurement and our portfolio of products, including private label and national brands. It is responsible for setting and executing product and category strategies and working with each division to ensure our category vision is implemented. It concentrates on optimizing product assortment, economies of scale and leveraging our purchasing scale. We implemented a strategic vendor management process to ensure our supplier partners provide the most effective combination of quality, service and price over the long term. This allows us to use a national marketing calendar to more effectively reach our diverse customer base.
The Merchandising Group’s test kitchen facilitates product research and development. A team of chefs and product developers works closely with our category managers and supplier partners to develop products that only are available from us, and serve to differentiate our offerings. This product innovation and marketing program is a centerpiece of our strategy of becoming a leading food company. The Merchandising Group also uses extensive food safety and quality assurance resources to ensure consistency, integrity, and high standards of excellence in the products we distribute.
3
Table of Contents
Logistics
Our Logistics Group focuses on increasing company-managed inbound freight, freight reduction and freight optimization initiatives. This group includes national operations and logistics support teams in Rosemont, IL, and a field-based logistics team. The national logistics team handles the building, tracking and execution of inbound transportation loads using our centralized transactional processing. The logistics support team works with operations and divisions to identify opportunities, reduce costs, and manage broader strategic initiatives associated with managing inbound freight. The logistics support team also manages carrier and vendor relationships, such as the inbound freight component of a vendor relationship, versus the product cost component—which is managed by our Merchandising Group. The Logistic Group’s goal is to improve overall service levels and reduce inbound freight expenses, as well as investigate and implement network-wide opportunities.
Suppliers
We purchase from over 5,000 individual suppliers, none of which accounted for more than 10% of our aggregate purchases in fiscal year 2014. Our supplier base consists generally of large corporations, selling national brand name and private label products. Additionally, regional suppliers support targeted geographic initiatives and private label programs requiring regional distribution. We generally negotiate supplier agreements on a centralized basis.
Product Brands and Other Intellectual Property
To meet the needs of our customers, we offer a broad assortment of categories and brands. In many categories, we offer products under our own brands and trademarks.
Our brands are positioned in a variety of ways, primarily to support the requirements of our customers. Some are value brands, which offer a wide variety of lower cost products for customers who demand consistent quality and superior value. Others are positioned to match or exceed the quality of comparable manufacturer brand products. We increasingly focus on bringing unique, innovative products with exclusive, differentiated brands to our customers. We have registered the trademarks US Foods, Food Fanatics, and Chef’Store—in connection with our overall US Foods brand strategy and with our new retail outlets. We have also registered or applied to register the following trademarks in the United States in connection with our brand portfolio: Chef’s Line, Rykoff Sexton, Stock Yards and Metro Deli in our Best tier; Monarch, Monogram, Molly’s Kitchen and Glenview Farms, among others, in our Better tier; and Valu+Plus and Harvest Value in our Good Tier. Other than the US Foods trademark, and the trademarks for our brand portfolio, we do not believe that trademarks, patents, copyrights or trade secrets are material to our business.
Competition
The foodservice distribution industry is highly competitive and fragmented. We believe that about 15,000 foodservice distributors participate in the food away from home marketplace. Competition consists of national distributors and many regional and local distributors. These companies align themselves with other local and regional players through purchasing cooperatives and marketing groups. This allows them to expand their geographic markets, private label offerings, overall purchasing power, and ability to meet customers’ distribution requirements.
A number of other adjacent competitors also serve the commercial foodservice market. These include cash and carry operations, commercial wholesale outlets (such as Restaurant Depot), club stores (such as Sam’s Club and Costco), and grocery stores. Recently, we have begun to experience competition from online direct food wholesalers, including e-commerce companies such as Amazon.com.
Our customers are accustomed to purchasing from multiple suppliers. Product needs, service requirements and price are just a few of the factors they evaluate when deciding where to purchase. Customers can choose from many broadline foodservice distributors, specialty distributors that focus on specific categories such as produce, meat or seafood, club stores, grocery stores and a myriad of new online retailers. Since switching costs are very low, customers can make supplier and channel changes very quickly. There are few barriers to market entry. Existing foodservice competitors can extend their shipping distances, and add truck routes and warehouses relatively quickly to serve new markets or customers.
4
Table of Contents
US Foods differentiates itself from its competition through management and sales expertise (better service), purchasing scale (better price) and logistics expertise (better delivery). We serve a diverse customer base, and our sales force of approximately 4,000 associates is well equipped to meet evolving customer demands. We have increased our category management capabilities, while remaining focused on innovation and differentiation in our exclusive brand portfolio. We leveraged our investment in information technology to make the customer experience easy. We face many challenges, such as the foodservice market’s sensitivity to national and regional conditions, and the foodservice distribution industry’s low margins.
Working Capital
Our operations and strategic objectives require continuing capital investment, and our resources include cash provided by operations, as well as access to capital from bank borrowings, various types of debt and other financing arrangements. See the discussion in “Item 7. Management’s Discussion and Analysis of Financial Condition and Results of Operations” regarding our liquidity and capital resources.
Regulation
As a marketer and distributor of food products in the United States, US Foods is subject to regulation by numerous federal, state and local regulatory agencies. At the federal level, we are subject to the Federal Food, Drug and Cosmetic Act, the Bioterrorism Act and regulations promulgated by the U.S. Food and Drug Administration (the “FDA”). The FDA regulates manufacturing and holding requirements for foods, specifies the standards of identity for certain foods, and prescribes the format and content of certain information required to appear on food product labels. For certain product lines, we are also subject to the Federal Meat Inspection Act, the Poultry Products Inspection Act, the Perishable Agricultural Commodities Act, the Country of Origin Labeling Act, and regulations promulgated under the U.S. Department of Agriculture (the “USDA”). The USDA imposes standards for product quality and sanitation, including the inspection and labeling of meat and poultry products and the grading and commercial acceptance of produce shipments from our vendors.
We and our products are also subject to state and local regulation through such measures as the licensing of our facilities, enforcement by state and local health agencies of state and local standards for our products and facilities, and regulation of our trade practices in connection with the sale of our products.
Our premises are generally inspected at least annually by federal and/or state authorities. These facilities are also subject to inspections and regulations issued pursuant to the Occupational Safety and Health Act by the U.S. Department of Labor, which require us to comply with certain manufacturing, health and safety standards to protect our employees from accidents, and to establish hazard communication programs to transmit information about the hazards of certain chemicals present in some of the products we distribute.
We are also subject to regulation by numerous federal, state and local regulatory agencies. In particular, among other things, we service the federal government—including the Department of Defense and Department of Veterans Affairs facilities—as well as certain state and local entities. This subjects us to government contractor regulation at those respective levels. Our operations are subject to zoning, environmental and building regulations, as well as laws that prohibit discrimination in employment on the basis of disability—including the Americans with Disabilities Act—and other laws relating to accessibility and the removal of barriers. Our workers’ compensation self-insurance is subject to regulation by the jurisdictions in which we operate.
Environmental, Health and Safety Matters
Our operations are subject to a broad range of federal, state and local laws and regulations, including those governing environmental issues (e.g., discharges to air, soil and water, the handling and disposal of solid and hazardous wastes, and the investigation and remediation of contamination resulting from releases of petroleum products and other regulated substances), employee health and safety and fleet safety. Compliance with environmental, health and safety laws and/or regulations is not currently requiring us to incur material expenditures. However, the discovery of currently unknown conditions, new laws or regulations or changes in the enforcement of existing requirements, could require us to incur additional costs or result in unexpected liabilities that could be significant.
Seasonality
Our business does not fluctuate significantly from quarter to quarter and, as a result, is not considered seasonal.
5
Table of Contents
Research and Development
As noted above, the Merchandising Group’s test kitchen facilitates product research and development, with a focus on exclusive product development and product performance attributes. The cost of these activities is not considered material to our operations.
Employees
We employ a large and diverse workforce, of which approximately 65% are non-exempt employees. As of December 27, 2014, we had approximately 25,000 employees. Our non-exempt employee base is primarily comprised of warehouse and driver labor, consisting of approximately 16,000 non-exempt employees. Approximately 4,700 of our employees were members of local unions associated with the International Brotherhood of Teamsters and other labor organizations. In fiscal year 2014, 11 agreements covering approximately 1,500 employees were renegotiated. In fiscal year 2015, 15 agreements covering approximately 1,200 employees will be subject to renegotiation. We believe we have good relations with both union and non-union employees and we are well-regarded in the communities in which we operate.
Available Information
You may read and copy any documents that we file at the SEC’s public reference room at 100 F Street, N.E., Washington, D.C. 20549 at prescribed rates. You may call the SEC at 1-800-SEC-0330 to obtain further information about the public reference room. In addition, the SEC maintains an Internet website (www.sec.gov) that contains reports, proxy and information statements and other information about issuers that file electronically with the SEC, including US Foods, Inc. The SEC’s website address is included in this Annual Report on Form 10-K as an inactive textual reference only. We also maintain a website, www.usfood.com, which does not contain investor information at this time due to the proposed Acquisition, but does provide additional information about our locations, products and services, brands, and leadership and provides additional contact information for US Foods.
We have agreed under the terms of the indenture governing our Senior Notes that from the time we first became subject to the reporting requirements of Section 13(a) or Section 15(d) of the Exchange Act, and for so long as any of our Senior Notes remain outstanding, we will file with the SEC (unless such filing is not permitted under the Exchange Act or by the SEC), the annual reports, information, documents and other reports that we are required to file with the SEC pursuant to such Section 13(a) or Section 15(d), or would be so required to file if we were subject to the filing requirements of Section 13(a) or Section 15(d).
You may also obtain a copy of this Annual Report on Form 10-K and other information that we file with the SEC at no cost by calling us or writing to us at the following address: US Foods, Inc., 9399 W. Higgins Road, Suite 600, Rosemont, IL 60018, (847) 720-8000.
| Item 1A. | Risk Factors |
We are subject to many risks and uncertainties including, without limitation, our results of operations and cash flows. Some of these risks and uncertainties may cause our financial performance, business or operations to vary, or they may materially or adversely affect our financial performance. These are discussed below. The risks and uncertainties described in this Annual Report on Form 10-K are not the only ones we face. Others—which are not currently known to us, or that we believe are immaterial—also may adversely affect our financial performance, business or operations.
Risks Relating to the Proposed Acquisition by Sysco
There can be no assurance that Sysco will assume the Senior Notes. There also can be no assurance as to the credit worthiness of the obligors under the indenture for the Senior Notes after the Acquisition.
There can be no assurance as to the credit worthiness of the obligors under the indenture for the Senior Notes after the Acquisition has been completed. At that time, US Foods and the subsidiary guarantors of the Senior Notes will all become indirect subsidiaries of Sysco. Sysco has advised us that if any of our Senior Notes remain outstanding following the Acquisition, it intends to fully and unconditionally guarantee those obligations. However, Sysco is under no contractual or legal obligation to do this under the indenture, the Merger Agreement or otherwise or to redeem or refinance the Senior Notes. If Sysco assumes the Senior Notes, there is no assurance it will have the same credit worthiness that it does now, or that it will continue to maintain that credit worthiness after it integrates US Foods and its subsidiaries. If Sysco does not assume the Senior Notes—and we and the subsidiary guarantors continue to be obligors under the indenture—there can be no assurances on the credit worthiness or operational plans of US Foods or the subsidiary guarantors after they have been acquired by Sysco. Further, pursuant to the consent of the holders of the Senior Notes, the Acquisition will not be deemed to be a change of control under the indenture, and Sysco will not need to make a change of control offer.
6
Table of Contents
The proposed Acquisition is subject to receiving consents and approvals from government entities with the power to impose conditions that could have an adverse effect on us, or could delay or prevent the Acquisition.
Completion of the Acquisition is conditioned upon, among other things, the expiration or termination of applicable waiting periods under the HSR Act. In addition, we must receive other regulatory approvals, each as described in the Merger Agreement. On February 19, 2015, the FTC voted by a margin of 3-2 to seek to block the Merger by filing a federal district court action in the District of Columbia for a preliminary injunction to prevent the parties from closing the Acquisition until after a full trial is conducted by a FTC Administrative Law Judge in a separate administrative action that was filed concurrently by the FTC. In addition, the District of Columbia and the following state attorneys general have joined the FTC’s complaint for a preliminary injunction: California, Illinois, Iowa, Maryland, Minnesota, Nebraska, Ohio, Pennsylvania, Tennessee, and Virginia. Sysco issued a press release, announcing that it will contest the FTC’s attempt to block the proposed Acquisition. These legal proceedings may cause extensive delays in the consummation of the Acquisition or may prevent the Acquisition from occurring at all. In connection with the negotiations with the FTC, Sysco, USF Holding, US Foods, and certain of our subsidiaries have entered into the Asset Purchase Agreement with PFG which provides for the sale to PFG of US Foods facilities in 11 markets upon consummation of the Acquisition. These facilities represent approximately $4.6 billion in annual sales. There is no assurance that US Foods and Sysco will obtain the governmental approvals necessary for the Acquisition and if the Acquisition is allowed to proceed, additional restrictions or conditions could be imposed. Any further delay in completing the Acquisition could diminish its anticipated benefits, or result in additional transaction costs, loss of revenue, or other negative effects associated with uncertainty about the situation.
Sysco’s failure to acquire us could adversely affect our business.
There is no assurance the Acquisition or any other transaction will occur. Consummation of the Acquisition is subject to various conditions, including the consents or approvals of government authorities noted above. We will have incurred significant costs—including the diversion of management resources—for which we will receive little or no benefit if the Acquisition does not close. The Merger Agreement is subject to termination by either party if the Acquisition is not completed on or before May 7, 2015. The Merger Agreement also is subject to further extension by either party to allow for clearance under the HSR Act, but not past September 8, 2015. In addition, the Merger Agreement contains certain other termination rights for both USF Holding and Sysco. A failed transaction may result in negative publicity. Any of these events—individually or in combination—could have an adverse effect on our results of operations and financial condition.
Our pending Acquisition could adversely affect our business, financial results and operations, including our relationships with customers, vendors and employees.
The proposed Acquisition could cause material disruptions in and create uncertainty surrounding our business. This could affect our relationships with customers, vendors and employees, which could have an adverse effect on our business, financial results and operations. In particular, we could lose important personnel if some employees decide to leave in light of the proposed Acquisition. We could potentially lose customers or suppliers, or our customers or suppliers could modify their relationships with us in an adverse manner. In addition, we have devoted—and will continue to devote—significant management resources to complete the Acquisition. This may cause our business and operating results to suffer.
The Merger Agreement also places restrictions on how we conduct our business before the Acquisition is completed. These restrictions could result in our inability to respond effectively, and in a timely manner, to competitive pressures, industry developments and future opportunities. This could harm our business, financial results and operations. See “Item 7. Management’s Discussion and Analysis of Financial Condition and Results of Operations” for more information about the proposed Acquisition and its impact on our business, including restrictive covenants relating to our operations.
Risks Related to Our Business
Ours is a low-margin business, and our profitability is directly affected by cost inflation, commodity volatility and other factors.
Foodservice distribution is characterized by relatively high inventory turnover with relatively low profit margins. We make a significant portion of our sales at prices that are based on the cost of products we sell, plus a percentage margin. As a result, our profit levels may be negatively affected during periods of product cost deflation, even though our gross profit percentage may
7
Table of Contents
remain relatively constant. Prolonged periods of product cost inflation also may reduce our profit margins and earnings, if product cost increases cannot be passed on to customers because they resist paying higher prices. In addition, periods of rapid inflation may have a negative effect on our business. There may be a lag between the time of the price increase and the time at which we are able to pass it along, as well as the impact it may have on discretionary spending by consumers.
Competition in our industry is intense, and we may not be able to compete successfully.
Foodservice distribution is highly competitive. This includes a large number of local and regional distributors. These companies often align themselves with other smaller distributors through purchasing cooperatives and marketing groups. The goal is to enhance their geographic reach, private label offerings, overall purchasing power, cost efficiencies, and ability to meet customer distribution requirements. These suppliers also rely on local presence as a source of competitive advantage, and they may have lower costs and other competitive advantages due to geographic proximity. Additionally, adjacent competition—such as cash and carry operations, commercial wholesale outlets, club stores and grocery stores—continue to serve the commercial foodservice market. We also experience competition from online direct food wholesalers, such as Amazon.com. We generally do not have exclusive service agreements with our customers, and they may switch to others that offer lower prices, differentiated products or customer service that is perceived to be superior. We believe most purchasing decisions in the foodservice distribution industry are based on the quality and price of the product, plus a distributor’s ability to completely and accurately fill orders and provide timely deliveries.
Increased competition has caused the foodservice distribution industry to change, as distributors seek to lower costs, further increasing pressure on the industry’s profit margins. Heightened competition among our suppliers, significant pricing initiatives or discount programs established by competitors, new entrants, and trends toward vertical integration could create additional competitive pressures that reduce margins and adversely affect our business, financial condition and results of operations.
We rely on third-party suppliers, and our business may be affected by interruption of supplies or increases in product costs.
We get substantially all of our foodservice and related products from third-party suppliers. We typically do not have long-term contracts with suppliers. Although our purchasing volume can provide leverage when dealing with suppliers, they may not provide the foodservice products and supplies we need in the quantities and at the prices requested. We do not control the actual production of the products we sell. This means we are also subject to delays caused by interruption in production and increases in product costs based on conditions outside our control. These conditions include work slowdowns, work interruptions, strikes or other job actions by employees of suppliers; severe weather; crop conditions; product recalls; transportation interruptions; unavailability of fuel or increases in fuel costs; competitive demands; and natural disasters or other catastrophic events (including, but not limited to, the outbreak of food-borne illnesses in the U.S.). Our inability to obtain adequate supplies of foodservice and related products because of any of these or other factors could mean that we could not fulfill our obligations to our customers and, as a result, our customers may turn to other distributors.
Significant increases in fuel costs could hurt our business.
The high cost of fuel can negatively affect consumer confidence and discretionary spending. As a result, this reduces the frequency and amount spent by consumers for food prepared away from home. In addition, the high cost of fuel can also increase the price we pay for products, as well and the costs we incur to deliver products to our customers. These factors in turn negatively affect our sales, margins, operating expenses and operating results. Additionally, from time to time, we enter into forward purchase commitments for some of our fuel requirements—at prices equal to the then-current market price. If fuel prices decrease significantly, these forward purchases may prove ineffective and result in us paying higher than market costs for part of our fuel. As of December 27, 2014, we had diesel fuel forward purchase commitments totaling $177 million through December 2016, which locked in approximately 53% of our projected diesel fuel purchase needs for the contracted period. A 10% change in diesel prices would cause our uncommitted diesel fuel costs through December 2016 to change by less than $20 million. See “Item 7A. Quantitative and Qualitative Disclosures about Market Risk” for further discussion of market risks relating to diesel fuel.
An economic downturn, or other factors affecting consumer confidence, could reduce the amount of food prepared and consumed away from home, which could harm our business.
The foodservice market is sensitive to national and regional economic conditions. The general U.S. economic slowdown in the recent years, the uncertainty in the financial markets, and slow job growth affected consumer confidence and discretionary spending. Inflation, a renewed decline in economic activity, and other factors affecting consumer confidence—and the frequency and amount spent by consumers for food prepared away from home—may reduce our sales and operating results in the future. Additionally, prolonged periods of product cost inflation may have a negative impact on our profit margins and
8
Table of Contents
earnings, if the product cost increases cannot be passed on to customers who resist paying higher prices or negatively affect consumer spending. Our operating results are also sensitive to, and may be adversely affected by, other factors. These include difficulties collecting accounts receivable, competitive price pressures, severe weather conditions, and unexpected increases in fuel or other transportation-related costs that are beyond our control. There can be no assurance that one or more of these factors will not reduce future operating results.
We face risks related to labor relations and the availability of qualified labor.
On December 27, 2014, we had approximately 25,000 employees. About 4,700 were members of local unions associated with the International Brotherhood of Teamsters and other labor organizations. In fiscal year 2014, 11 agreements covering approximately 1,500 employees were renegotiated. In fiscal 2015, 15 agreements covering approximately 1,200 employees will be subject to renegotiation. Failure to effectively renegotiate any of these contracts could result in work stoppages. We may be subject to increased efforts to subject us to a multi-location labor dispute, as an individual labor agreements expire. This would place us at greater risk of being materially adversely affected by labor disputes. We also believe we have satisfactory relationships with our employees, including the unions that represent some of our employees. However, a work stoppage due to our failure to renegotiate union contracts could have a significant negative effect on us. So could any shortage of qualified labor. We do extensive contingency planning in advance of all negotiations. Our goal is to ensure that we are able to operate a facility that may be affected by a work stoppage. Recruiting and retention efforts, and actions to increase productivity may not be successful, and we could encounter a shortage of qualified drivers in the future. This kind of shortage would decrease our ability to effectively serve customers. It would also likely lead to higher wages for employees and a corresponding reduction in our profitability.
A change in our relationships with Group Purchasing Organizations could negatively affect our relationships with customers, which could reduce our profitability.
No single customer represented more than 4% of our total customer sales in fiscal 2014. However, some of our customers purchase their products under arrangements with Group Purchasing Organizations (“GPOs”). GPOs act as agents on behalf of their members by negotiating pricing, delivery, and other terms with us. Our customers who are members of GPOs purchase products directly from us on the terms negotiated by their GPO. GPOs use the combined purchasing power of their members to lower the prices paid by their members, and we have experienced some pricing pressure from customers who associate with GPOs. Approximately 23% of our net sales in fiscal 2014 were made by customers under terms negotiated by GPOs. To the extent our customers are able to independently negotiate competitive pricing or become members of GPOs, we may be forced to lower our prices so they will remain customers, which would negatively affect operating margins. In addition, if we are unable to maintain our relationships with GPOs—or if GPOs are able to negotiate more favorable terms for their members with our competitors—we could lose some or all of that business. This could adversely affect our future operating profits.
If we fail to increase or maintain our sales to independent restaurant customers, our profitability may suffer.
Our most profitable customers are independent restaurants. We typically provide a higher level of services to these customers and are able to earn a higher operating margin on sales. Our ability to continue to gain market share of independent customers is critical to achieving increased operating profits. Changes in the buying practices of independent customers or decreases in our sales to this type of customer could have a material negative impact on our profitability.
Changes in industry pricing practices could negatively affect our profitability.
Promotional allowances have traditionally generated a significant percentage of foodservice distribution gross margins. These payments from suppliers are based upon the efficiencies that the distributor provides by volume purchasing, and marketing and merchandising expertise. Promotional allowances are a standard industry practice and represent a significant source of profitability for our competitors and us. Any change in industry practices that reduced or eliminated purchasing allowances—without corresponding increases in sales margin—could be disruptive to us and the industry as a whole, and could have a material negative effect on our profitability.
If our competitors implement a lower cost structure, they may be able to offer reduced prices to customers. We may be unable to adjust our cost structure to compete profitably.
Over the last several decades, the food retail industry has undergone a significant change. Companies such as Wal-Mart and Costco have developed a lower cost structure, so they can provide their customers with an everyday low-cost product offering. In addition, commercial wholesale outlets, such as Restaurant Depot, offer an additional low-cost option in the markets they serve. As a large-scale foodservice distributor, we have similar strategies to remain competitive in the marketplace by reducing
9
Table of Contents
our cost structure. However, to the extent more of our competitors adopt an everyday low price strategy, we would potentially be pressured to lower prices to our customers. That would require us to achieve additional cost savings to offset these reductions. We may be unable to change our cost structure and pricing practices rapidly enough to successfully compete in that environment.
Our business may be subject to significant environmental, health and safety costs.
Our operations face a broad range of federal, state and local laws and regulations. These include environmental issues, such as discharges to air, soil and water; the handling and disposal of hazardous substances; the investigation and remediation of contamination resulting from releasing petroleum products and other hazardous substances; employee health and safety; and fleet safety. In the course of our operations, we use and dispose of limited volumes of hazardous substances, and we store fuel in on-site aboveground and underground storage tanks. At several current and former facilities, we are investigating and remediating known or suspected contamination from releases of fuel and other hazardous substances. We cannot be sure that compliance with existing or future environmental, health and safety laws—such as those related to remediation obligations—will not adversely affect future operating results.
We are subject to extensive governmental regulation, the enforcement of which could adversely affect our business, financial condition and results of operations.
Our operations are subject to a number of complex and stringent food safety, transportation, labor, employment and other laws and regulations. These laws and regulations generally require us to maintain and comply with a wide variety of certificates, permits, licenses and other approvals. (See “Business—Regulation.”) Regulatory authorities have broad powers with respect to our operations. They may revoke, suspend, condition or limit our licenses or ability to conduct business. Our failure to maintain required certificates, permits or licenses—or to comply with applicable laws, ordinances or regulations—could result in substantial fines or possible revocation of our authority to conduct our operations. We cannot be sure that existing laws or regulations will not be revised, or that new laws or regulations—which could have an adverse impact on our operations—will not be adopted or become applicable to us. We also cannot be sure that we will be able to recover any or all increased costs of compliance from our customers, or that our business and financial condition will not be materially and adversely affected by future changes in applicable laws and regulations.
We rely heavily on technology, and any disruption in existing or delay in implementing new technology could adversely affect our business.
Our ability to control costs and maximize profits, as well as to serve customers most effectively, depends on the reliability of our information technology systems and related data entry processes in our transaction intensive business. We rely on software and other technology systems to manage significant aspects of our business. These include to make purchases, process orders, manage our warehouses, load trucks in the most efficient manner, and to optimize the use of storage space. Any disruption to these information systems could negatively affect our customer service, decrease the volume of our business, and result in increased costs. We have invested and continue to invest in technology security initiatives, business continuity, and disaster recovery plans. However, these measures cannot fully insulate us from technology disruption that could impair operations and profits. Information technology systems evolve rapidly. To compete effectively, we are required to integrate new technologies in a timely and cost-effective manner. If competitors implement new technologies before we do, allowing them to provide lower priced or enhanced services of superior quality compared to those we provide, our operations and profits could be affected.
A cybersecurity incident and other technology disruptions could negatively affect our business and our relationships with customers.
We rely upon information technology networks and systems to process, transmit and store electronic information, and to manage or support virtually all of our business processes and activities. We also use mobile devices, social networking and other online activities to connect with our employees, suppliers, business partners and our customers. These uses give rise to cybersecurity risks, including security breach, espionage, system disruption, theft and inadvertent release of information. Our business involves the storage and transmission of numerous classes of sensitive and/or confidential information and intellectual property, including customers’ and suppliers’ personal information, private information about employees, and financial and strategic information about the Company and its business partners. Further, the Company is also expanding and improving its information technologies, resulting in a larger technological presence and corresponding increased exposure to cybersecurity risk. Additionally, while we have implemented measures to prevent security breaches and cyber incidents, our preventative measures and incident response efforts may not be entirely effective. The theft, destruction, loss, misappropriation, or release of sensitive and/or confidential information or intellectual property—or interference with our information technology systems or the technology systems of third parties on which we rely—could result in business disruption, negative publicity, brand damage, violation of privacy laws, loss of customers, potential liability and competitive disadvantage.
10
Table of Contents
We may be subject to or affected by liability claims related to products we distribute.
We—as any seller of food—may be exposed to liability claims in the event that the products we sell cause injury or illness. We believe we have sufficient primary or excess umbrella liability insurance to cover product liability claims. However, our current insurance may not continue to be available at a reasonable cost or, if available, may not be adequate to cover all of our liabilities. We generally seek contractual indemnification and insurance coverage from parties supplying products to us. But this indemnification or insurance coverage is limited, as a practical matter, to the creditworthiness of the indemnifying party and the insured limits of any insurance provided by suppliers. If we do not have adequate insurance or contractual indemnification available, the liability related to defective products could adversely affect our results of operations.
Any negative media exposure or other event that harms our reputation could hurt our business.
Maintaining a good reputation is critical to our business, particularly in selling our private label products. Any event that damages our reputation, justified or not, could quickly affect our revenues and profits. This includes adverse publicity about the quality, safety or integrity of our products. Reports—whether or not they are true—of food-borne illnesses (such as e. coli, avian flu, bovine spongiform encephalopathy, hepatitis A, trichinosis or salmonella) and injuries caused by food tampering could severely injure our reputation. If patrons of our national chain and local restaurant customers become ill from food-borne illnesses, the customers could be forced to temporarily close restaurant locations and our sales would correspondingly decrease. In addition, instances of food-borne illnesses or food tampering or other health concerns—even those unrelated to our products—can result in negative publicity about the food service distribution industry and dramatically reduce our sales.
We have been the subject of governmental investigations.
We have received a subpoena from the State of Florida’s Department of Financial Services regarding a contract we have with the Florida Department of Corrections, as well as a request for information from the Office of the Attorney General of the State of California seeking information regarding transactions with our California customers from 2001 to present. In each respective instance, we are cooperating with the investigation. We are further aware of two qui tam actions filed in Florida courts against us. However, because each suit is sealed, we do not have any further information about the nature of the claims alleged or remedies sought. At this stage, we cannot determine the likelihood of success of any of the above claims or the potential liability if they are successful and therefore there can be no assurance that adverse determination with respect to either matter would not have a material adverse effect on our financial condition.
Our retirement benefits could give rise to significant expenses and liabilities in the future.
We sponsor defined benefit pension and other postretirement plans. Pension and postretirement obligations give rise to significant expenses that are dependent on assumptions discussed in Note 17 to the Audited Consolidated Financial Statements included in this Annual Report on Form 10-K.
Pension and postretirement expense for fiscal 2014 was $21 million. The amount by which the present value of projected benefit obligations of our pension and other postretirement plans exceeded the market value of plan assets of our plans, as of December 27, 2014, was $228 million. We review our pension and postretirement plan assumptions regularly. We participate in various “multi-employer” pension plans administered by labor unions representing some of our employees. We make periodic contributions to these plans to allow them to meet their pension benefit obligations to their participants. In the event that we withdraw from participating in one of these plans, then-applicable law could require us to make withdrawal liability payments to the plan, and we would have to reflect that on our balance sheet. Our withdrawal liability for any multi-employer plan would depend on the extent of the plan’s funding of vested benefits. In connection with the closing of a distribution facility in 2011, we incurred a withdrawal liability of approximately $40 million, to be paid in installments, including interest, through 2031. In 2012, we incurred an $18 million settlement charge resulting from lump-sum payments to former employees participating in several Company-sponsored pension plans. In the ordinary course of our renegotiation of collective bargaining agreements with labor unions that maintain these plans, we could decide to discontinue participation in a plan. In that event, we could face a withdrawal liability. We could also be treated as withdrawing from participation in one of these plans, if the number of our employees participating in these plans is reduced to a certain degree over certain periods of time. Such reductions in the number of employees participating in these plans could occur as a result of changes in our business operations, such as facility closures or consolidations. Some multi-employer plans, including ones in which we participate, are reported to have significant underfunded liabilities. Such underfunding could increase the size of our potential withdrawal liability. For a detailed description of our retirement plans, see Note 17 to the Audited Consolidated Financial Statements included in this Annual Report on Form 10-K.
11
Table of Contents
Failure to maintain effective systems over internal control over financial reporting and disclosure controls and procedures could cause a loss of confidence in our financial reporting and adversely affect the value and liquidity of our indebtedness.
There is no guarantee that our disclosure controls and procedures or internal control over financial reporting will be effective in future years. Any failure to implement required new or improved controls, or difficulties encountered in their implementation, could harm our operating results or cause us to fail to meet our reporting obligations. If we are unable to conclude that we have effective internal control over financial reporting, investors could lose confidence in the reliability of our financial statements, which could result in a decrease in value and liquidity of our indebtedness, including the Senior Notes, and make it more difficult for us to raise capital in the future. Failure to comply with the Sarbanes-Oxley Act of 2002 or applicable rules and regulations of the SEC could potentially subject us to sanctions or investigations by the SEC, or other regulatory authorities.
We must effectively integrate the businesses we acquire.
Historically, a portion of our growth has come through acquisitions. If we are unable to integrate acquired businesses successfully—or realize anticipated economic, operational and other benefits and synergies in a timely manner—our profitability may decrease. Integrating acquired businesses may be more difficult in a region or market in which we have limited expertise. A significant expansion of our business and operations, in terms of geography or magnitude, could strain our administrative and/or operational resources. Significant acquisitions may also require incurring additional debt. This could increase our interest expense, and make it difficult for us to get favorable financing for other acquisitions or capital investments in the future.
We may be unable to achieve some or all of the benefits that we expect from our cost savings initiatives.
We may not be able to realize some or all of our expected cost savings in the future. A variety of factors could cause us not to realize some of the expected cost savings. These include, among others, delays in the anticipated timing of activities related to our cost savings initiatives, lack of sustainability in cost savings over time, and unexpected costs associated with operating our business. All of these factors could negatively affect our profitability and competitiveness.
Risks Related to Our Substantial Indebtedness
We have substantial debt, which could adversely affect our financial health, and our ability to obtain financing in the future, react to changes in our business, and make payments on our debt.
As of December 27, 2014 we have had an aggregate principal amount of $4,733 million of outstanding debt, excluding $15 million of unamortized premium. Our substantial debt could have important consequences to holders of the Senior Notes, including the following:
| • | Our ability to obtain additional financing for working capital, capital expenditures, acquisitions, debt service requirements, acquisitions or general corporate purposes, and our ability to satisfy our obligations with respect to our indebtedness, including the Senior Notes, may be impaired in the future |
| • | A substantial portion of our cash flow from operations must be dedicated to the payment of principal and interest on our indebtedness, thereby reducing the funds available to us for other purposes (for example, approximately $280 million was dedicated to the payment of interest for the fiscal year ended December 27, 2014) |
| • | We are exposed to the risk of increased interest rates because a substantial portion of our borrowings are at variable rates of interest |
| • | It may be more difficult for us to satisfy our obligations to our lenders, resulting in possible defaults on and acceleration of such indebtedness |
| • | We may be more vulnerable to general adverse economic and industry conditions |
| • | We may be at a competitive disadvantage compared to our competitors with less debt or comparable debt at more favorable interest rates and they, as a result, may be better positioned to withstand economic downturns |
| • | Our ability to refinance indebtedness may be limited or the associated costs may increase |
12
Table of Contents
| • | Our flexibility to adjust to changing market conditions and ability to withstand competitive pressures could be limited, or we may be prevented from carrying out capital spending that is necessary or important to our growth strategy and efforts to improve operating margins or our business |
Despite our indebtedness levels, we and our subsidiaries may be able to incur substantially more debt, including secured debt. This could further exacerbate the risks associated with our substantial indebtedness.
We and our subsidiaries may be able to incur substantial additional indebtedness in the future. The terms of our debt agreements do not fully prohibit us or our subsidiaries from doing so. As of December 27, 2014, we had commitments for additional borrowings under our asset-based senior secured revolving loan ABL Facility and our 2012 ABS Facility of $929 million (of which approximately $829 million was available based on our borrowing base), all of which were secured. All of those borrowings and any other secured indebtedness permitted under the agreements governing such credit facilities and indentures are effectively senior to the unsecured Senior Notes to the extent of the value of the assets securing such indebtedness. If new debt is added to our current debt levels, the related risks that we now face would increase and we may not be able to meet all our debt obligations, including the repayment of the Senior Notes. In addition, the Indenture does not prevent us from incurring obligations that do not constitute indebtedness.
The agreements and instruments governing our debt contain restrictions and limitations that could significantly impact our ability to operate our business.
Our credit facilities and the indentures contain covenants that, among other things, restrict our ability to do the following:
| • | Dispose of assets |
| • | Incur additional indebtedness (including guarantees of additional indebtedness) |
| • | Pay dividends and make certain payments |
| • | Make voluntary prepayments on the Senior Notes or make amendments to the terms thereof |
| • | Create liens on assets |
| • | Make investments (including joint ventures) |
| • | Engage in mergers, consolidations or sales of all or substantially all of our assets |
| • | Engage in certain transactions with affiliates |
| • | Change the business conducted by us |
| • | Amend specific debt agreements |
In addition, if borrowing availability under the ABL Facility—plus the amount of cash and cash equivalents held by us—falls below a specified threshold of $100 million, the borrowers are required to comply with a minimum fixed charge coverage ratio of 1 to 1. In addition, if our borrowing availability under the ABL Facility falls below $110 million, additional reporting responsibilities are triggered under the ABL Facility and the 2012 ABS Facility.
Our ability to comply with these provisions in future periods will depend on our ongoing financial and operating performance, which in turn will be subject to economic conditions and to financial, market and competitive factors, many of which are beyond our control. Our ability to comply with these provisions in future periods will also depend substantially on the pricing of our products, our success at implementing cost reduction initiatives and our ability to successfully implement our overall business strategy.
The restrictions under the terms of our credit facilities may prevent us from taking actions that we believe would be in the best interest of our business, and may make it difficult for us to successfully execute our business strategy or effectively compete with companies that are not similarly restricted. We may also incur future debt obligations that might subject us to additional restrictive covenants that could affect our financial and operational flexibility. We cannot assure you that we will be granted waivers or amendments to these agreements if for any reason we are unable to comply with these agreements or that we will be able to refinance our debt on terms acceptable to us, or at all.
Our ability to comply with the covenants and restrictions contained in our credit facilities may be affected by economic, financial and industry conditions beyond our control. The breach of any of these covenants or restrictions could result in a default under our credit facilities that would permit the applicable lenders or note holders, as the case may be, to declare all amounts outstanding thereunder to be due and payable, together with accrued and unpaid interest. If we are unable to repay
13
Table of Contents
debt, lenders having secured obligations, the lenders could proceed against the collateral securing the debt. In any such case, we may be unable to borrow under and may not be able to repay the amounts due under our credit facilities. This could have serious consequences to our financial condition and results of operations and could cause us to become bankrupt or insolvent.
Our ability to generate the significant amount of cash needed to pay interest and principal on our debt facilities and our ability to refinance all or a portion of our indebtedness or obtain additional financing depends on many factors beyond our control.
Our ability to make scheduled payments on, or to refinance our obligations under our debt will depend on our financial and operating performance. This, in turn, will be subject to prevailing economic and competitive conditions and to the financial and business factors, many of which may be beyond our control, as described under “Risk Factors—Risks Relating to Our Business” above.
If our cash flow and capital resources are insufficient to fund our debt service obligations, we may be forced to reduce or delay capital expenditures, sell assets, seek to obtain additional equity capital or restructure our debt. In the future, our cash flow and capital resources may not be sufficient for payments of interest on and principal of our debt, and such alternative measures may not be successful and may not permit us to meet our scheduled debt service obligations.
The 2012 ABS Facility will mature in 2016. The ABL Facility will mature in 2016. The Amended 2011 Term Facility will mature in 2019. The CMBS Fixed Rate Loan will mature in 2017. The Senior Notes will mature in 2019. We cannot assure you that we will be able to refinance any of our indebtedness or obtain additional financing, particularly because of our anticipated high levels of debt and the debt incurrence restrictions imposed by the agreements governing our debt, as well as prevailing market conditions. In the absence of such operating results and resources, we could face substantial liquidity problems and might be required to dispose of material assets or operations to meet our debt service and other obligations. Our credit facilities and indentures restrict our ability to dispose of assets and use the proceeds from any such dispositions. As a result, we cannot assure you we will be able to consummate those sales, or if we do, what the timing of the sales will be, or whether the proceeds that we realize will be adequate to meet the debt service obligations when due.
An increase in interest rates would increase the cost of servicing our debt and could reduce our profitability.
A significant portion of our outstanding debt bears interest at variable rates. As a result, an increase in interest rates—whether because of an increase in market interest rates or a decrease in our creditworthiness—would increase the cost of servicing our debt and could materially reduce our profitability and cash flows. The impact of such an increase would be more significant for us than it would be for some other companies because of our substantial debt.
| Item 1B. | Unresolved Staff Comments |
None.
14
Table of Contents
| Item 2. | Properties |
As of February 18, 2015, we maintained 76 primary operating facilities used in our divisions, of which approximately 78% were owned and 22% were leased. In addition to the operating facilities, our real estate includes general corporate facilities in Rosemont, IL, and Tempe, AZ. The Rosemont, IL and Tempe, AZ facilities are leased. The portfolio also includes a number of local sales offices, truck “drop-sites” and vacant land. Additionally, there is a minimal amount of surplus owned or leased property. Leases with respect to our leased facilities expire at various dates from 2015 to 2026, exclusive of renewal options.
The table below sets out the number of distribution facilities occupied by us in each state and the aggregate square footage of such facilities. The table reflects single divisions that may contain multiple locations or buildings. The table does not include retail sales locations, such as cash and carry or US Foods Culinary Equipment & Supply outlet locations, closed locations, vacant properties, or ancillary use owned and leased properties—such as temporary storage, remote sales offices or parking lots. In addition the table shows the square footage of our Rosemont, IL Headquarters and Tempe, AZ Shared Services Center:
| Number of | ||||||||||||
| Location |
Facilities | Square Feet | ||||||||||
| Alabama |
1 | 371,744 | ||||||||||
| Arizona |
3 | 329,431 | ||||||||||
| Arkansas |
1 | 135,009 | ||||||||||
| California |
5 | 1,261,588 | ||||||||||
| Colorado |
1 | 314,883 | ||||||||||
| Connecticut |
1 | 239,899 | ||||||||||
| Florida |
5 | 1,406,084 | ||||||||||
| Georgia |
2 | 703,852 | ||||||||||
| Illinois |
3 | 558,743 | ||||||||||
| Indiana |
1 | 233,784 | ||||||||||
| Iowa |
1 | 114,250 | ||||||||||
| Kansas |
1 | 350,859 | ||||||||||
| Maryland |
1 | 356,000 | ||||||||||
| Massachusetts |
1 | 188,000 | ||||||||||
| Michigan |
1 | 276,003 | ||||||||||
| Minnesota |
3 | 414,963 | ||||||||||
| Missouri |
3 | 602,947 | ||||||||||
| Nebraska |
1 | 112,070 | ||||||||||
| Nevada |
4 | 941,001 | ||||||||||
| New Jersey |
3 | 1,073,375 | ||||||||||
| New Mexico |
1 | 133,486 | ||||||||||
| New York |
3 | 388,683 | ||||||||||
| North Carolina |
3 | 954,736 | ||||||||||
| North Dakota |
2 | 221,314 | ||||||||||
| Ohio |
2 | 404,815 | ||||||||||
| Oklahoma |
1 | 308,307 | ||||||||||
| Pennsylvania |
6 | 1,179,319 | ||||||||||
| South Carolina |
2 | 1,148,887 | ||||||||||
| Tennessee |
3 | 700,920 | ||||||||||
| Texas |
4 | 927,453 | ||||||||||
| Utah |
1 | 267,180 | ||||||||||
| Virginia |
2 | 629,318 | ||||||||||
| Washington |
2 | 228,500 | ||||||||||
| West Virginia |
1 | 137,337 | ||||||||||
| Wisconsin |
1 | 172,826 | ||||||||||
|
|
|
|
|
|||||||||
| Total |
76 | 17,787,566 | ||||||||||
|
|
|
|
|
|||||||||
| Owned | 13,910,122 | 78 | % | |||||||||
|
|
|
|
|
|||||||||
| Leased | 3,877,444 | 22 | % | |||||||||
|
|
|
|
|
|||||||||
| Headquarters: Rosemont, IL |
297,944 | |||||||||||
|
|
|
|||||||||||
| Shared Services Center: Tempe, AZ |
133,225 | |||||||||||
|
|
|
|||||||||||
15
Table of Contents
As of February 18, 2015, we also had certain properties held for sale with a carrying value of $4 million. We believe our facilities are suitable and adequate for our business and have sufficient capacity for the purposes for which they are currently intended.
Indemnification by Ahold for Certain Matters
In connection with the 2007 sale of US Foods to USF Holding Corp., a corporation formed and controlled by investment funds associated with or managed by CD&R and KKR, by Ahold in 2007 (the “2007 Transaction”), Ahold committed to indemnify and hold us harmless from and against damages (which includes losses, liabilities, obligations, and claims of any kind) and litigation costs (including attorneys’ fees and expenses) suffered, incurred or paid after the 2007 Transaction closing date related to certain matters described in the Pricing Litigation section below. More information is available in Note 21 to the Audited Consolidated Financial Statements included in this Annual Report on Form 10-K.
2006 Pricing Litigation
In October 2006, two customers filed a putative class action against Ahold and us. In December 2006, an amended complaint named a third plaintiff. The complaint focuses on certain of our pricing practices in contracts with some customers. In February 2007, we filed a motion to dismiss the complaint. In August 2007, two additional customers filed punitive class action complaints. These two additional lawsuits are based upon the pricing practices at issue in the October 2006 case.
In November 2007, the Judicial Panel on Multidistrict Litigation ordered the transfer of the two additional lawsuits to the jurisdiction in which the first lawsuit was filed—the U.S. District Court for the District of Connecticut—for consolidated or coordinated proceedings. In June 2008, the plaintiffs filed their consolidated and amended class action complaint. We moved to dismiss this complaint. In August 2009, the plaintiffs filed a motion for class certification. In December 2009, the court issued a ruling on our motion to dismiss. It dismissed Ahold from the case and also dismissed certain of the plaintiffs’ claims.
On November 30, 2011, the court issued its ruling granting the plaintiffs motion to certify the class. On April 4, 2012, the U.S. Court of Appeals for the Second Circuit granted our request to appeal the District Court’s decision which granted class certification. Oral argument was held and the court upheld the grant of class certification. We filed a writ of certiorari to the U.S. Supreme Court which was denied on April 29, 2014.
In December 2014, the United States District Court of Connecticut finalized the settlement agreement under which Ahold paid $297 million to the settlement fund and we were released from all claims. Ahold had indemnified us in regards to this matter and, as a consequence, payment of the settlement by Ahold did not impact our financial position, results of operations or cash flows.
Florida State Pricing Subpoena
On May 5, 2011, the State of Florida Department of Financial Services issued a subpoena to the Company requesting a broad range of information regarding vendor information, logistics/freight as well as pricing, allowances, and rebates that the Company obtained from the sale of products and services for the term of the contract. The subpoena focuses on all pricing and rebates earned during this period relative to the Florida Department of Corrections. We learned of two qui tam suits, filed in Florida state court, against the Company, one of which was filed by a former official in the Florida Department of Corrections. The complaints are sealed and no additional information is presently available about the nature of either suit, the claims alleged or remedies sought.
We have engaged in ongoing discussions to seek resolution of this matter and continue to cooperate with the State of Florida by providing the requested documentation. We do not believe at this time that an unfavorable outcome from this matter is probable and, accordingly, no such liability has been recorded. Due to the inherent uncertainty of legal proceedings, it is reasonably possible we could suffer a loss as a result of this matter; however, an estimate of a possible loss or range of loss from this matter cannot be made at this time.
16
Table of Contents
Other Pricing Related Matters
We have received a request for information from the Office of the Attorney General of the State of California seeking information regarding our California customers from 2001 to present. We are cooperating with the investigation.
We do not believe at this time that an unfavorable outcome from this matter is probable and, accordingly, no such liability has been recorded. Due to the inherent uncertainty of legal proceedings, it is reasonably possible we could suffer a loss as a result of this matter; however, an estimate of a possible loss or range of loss from this matter cannot be made at this time.
At this stage, we cannot determine the likelihood of success of any of the above pricing related claims or the potential liability if they are successful and therefore there can be no assurance that an adverse determination with respect to any pricing related matter would not have a material adverse effect on our financial condition.
Eagan Labor Dispute
In 2008, we closed our Eagan, Minnesota and Fairfield, Ohio divisions, and recorded a liability of approximately $40 million for the related multiemployer pension withdrawal liability. In 2010, we received formal notice and demand for payment of a $40 million withdrawal liability, which is payable in monthly installments through November 2023. During the 2011 fiscal third quarter, we were assessed an additional $17 million multiemployer pension withdrawal liability for the Eagan facility. The parties agreed to arbitrate this matter, and discovery began during the fiscal third quarter of 2012. The parties engaged in good faith settlement negotiations during the fiscal third and fourth quarters of 2013. The arbitration and related discovery were stayed pending settlement negotiations. The negotiations reached an unexpected impasse and ceased in December 2013. The arbitrator ruled that the only contested issue is a legal question and ordered the parties to submit cross motions for summary judgment. The parties submitted stipulated facts and cross motions for summary judgment in January 2015. After review, the arbitrator will issue an interim award. Discovery is stayed pending the arbitrator’s ruling. We believe we have meritorious defenses against the assessment for the additional pension withdrawal liability. We do not believe, at this time, that a loss from such obligation is probable and, accordingly, no liability has been recorded. However, it is reasonably possible we may ultimately be required to pay an amount up to $17 million.
Other Legal Proceedings
In addition to those described above, the Company and its subsidiaries are parties to a number of other legal proceedings arising from the normal course of business. These legal proceedings—whether pending, threatened or unasserted—if decided adversely to or settled by us, may result in liabilities material to our financial position, results of operations, or cash flows. We have recognized provisions with respect to the proceedings where appropriate. These are reflected in our Consolidated Balance Sheets. It is possible that we could be required to make expenditures in excess of the established provisions, in amounts we cannot reasonably estimate. However, we believe that the ultimate resolution of these proceedings will not have a material adverse effect on our consolidated financial position, results of operations, or cash flows. It is our policy to expense attorney fees as incurred.
| Item 4. | Mine Safety Disclosures |
None.
17
Table of Contents
| Item 5. | Market for Registrant’s Common Equity, Related Stockholder Matters and Issuer Purchases of Equity Securities |
We are a wholly owned subsidiary of USF Holding Corp. (“USF Holding”). USF Holding was formed and controlled by investment funds associated with or managed by Clayton, Dubilier & Rice, Inc. (“CD&R”), and Kohlberg Kravis Roberts & Co, (“KKR”) (collectively the “Sponsors” ), which own substantially all of the outstanding common stock of USF Holding. There is no established public trading market of our common stock or the common stock of USF Holding. See Part III—Item 12. Security Ownership of Certain Beneficial Owners and Management and Related Stockholder Matters for additional information about USF Holding ownership.
| Item 6. | Selected Financial Data |
We operate on a 52-53 week fiscal year, with all periods ending on Saturday. When a 53-week fiscal year occurs, we report the additional week in the fourth fiscal quarter. All years presented were 52 weeks. The following table presents selected consolidated financial data for the last five fiscal years:
| Fiscal Year | ||||||||||||||||||||
| 2014 | 2013 | 2012 | 2011 | 2010 | ||||||||||||||||
| (Dollars in millions) | ||||||||||||||||||||
| Consolidated Statements of Operations Data: |
||||||||||||||||||||
| Net sales |
$ | 23,020 | $ | 22,297 | $ | 21,665 | $ | 20,345 | $ | 18,862 | ||||||||||
| Cost of goods sold |
19,222 | 18,474 | 17,972 | 16,840 | 15,452 | |||||||||||||||
|
|
|
|
|
|
|
|
|
|
|
|||||||||||
| Gross profit |
3,798 | 3,823 | 3,693 | 3,505 | 3,410 | |||||||||||||||
| Operating expenses: |
||||||||||||||||||||
| Distribution, selling and administrative costs |
3,546 | 3,494 | 3,350 | 3,194 | 3,055 | |||||||||||||||
| Restructuring and tangible asset impairment charges |
— | 8 | 9 | 72 | 11 | |||||||||||||||
|
|
|
|
|
|
|
|
|
|
|
|||||||||||
| Total operating expenses |
3,546 | 3,502 | 3,359 | 3,266 | 3,066 | |||||||||||||||
|
|
|
|
|
|
|
|
|
|
|
|||||||||||
| Operating income |
252 | 321 | 334 | 239 | 344 | |||||||||||||||
| Interest expense—net |
289 | 306 | 312 | 307 | 341 | |||||||||||||||
| Loss on extinguishment of debt |
— | 42 | 31 | 76 | — | |||||||||||||||
|
|
|
|
|
|
|
|
|
|
|
|||||||||||
| Income (loss) before income taxes |
(37 | ) | (27 | ) | (9 | ) | (144 | ) | 3 | |||||||||||
| Income tax provision (benefit) |
36 | 30 | 42 | (42 | ) | 16 | ||||||||||||||
|
|
|
|
|
|
|
|
|
|
|
|||||||||||
| Net loss |
$ | (73 | ) | $ | (57 | ) | $ | (51 | ) | $ | (102 | ) | $ | (13 | ) | |||||
|
|
|
|
|
|
|
|
|
|
|
|||||||||||
| Other Data: |
||||||||||||||||||||
| Cash flows from operating activities |
$ | 402 | $ | 322 | $ | 316 | $ | 419 | $ | 481 | ||||||||||
| Cash flows from investing activities |
(118 | ) | (187 | ) | (380 | ) | (338 | ) | (258 | ) | ||||||||||
| Cash flows from financing activities |
(120 | ) | (197 | ) | 103 | (301 | ) | (30 | ) | |||||||||||
| Capital expenditures |
147 | 191 | 294 | 304 | 272 | |||||||||||||||
| EBITDA(a) |
664 | 667 | 659 | 506 | 652 | |||||||||||||||
| Adjusted EBITDA(a) |
866 | 845 | 841 | 812 | 736 | |||||||||||||||
| Balance Sheet Date: |
||||||||||||||||||||
| Cash and cash equivalents |
$ | 344 | $ | 180 | $ | 242 | $ | 203 | $ | 423 | ||||||||||
| Total assets |
9,057 | 9,186 | 9,263 | 8,916 | 9,054 | |||||||||||||||
| Total debt |
4,748 | 4,770 | 4,814 | 4,641 | 4,855 | |||||||||||||||
| Shareholder’s equity |
1,665 | 1,882 | 1,815 | 1,861 | 1,942 | |||||||||||||||
| (a) | Management uses EBITDA and Adjusted EBITDA to measure operating performance. EBITDA is defined as Net loss, plus Interest expense—net, Income tax (provision) benefit, and depreciation and amortization. Adjusted EBITDA is defined as |
18
Table of Contents
| EBITDA adjusted for 1) Sponsor fees; 2) Restructuring and tangible asset impairment charges; 3) share-based compensation expense; 4) business transformation costs; 5) Acquisition related costs; 6) other gains, losses, or charges as specified under our debt agreements; and 7) the non-cash impact of net LIFO adjustments. EBITDA and Adjusted EBITDA, are supplemental measures of our performance. They are not required by—or presented in accordance with—accounting principles generally accepted in the United States of America (“GAAP”). They are not measurements of our performance under GAAP. In addition, they should not be considered as alternatives to net income (loss) or any other performance measures derived in accordance with GAAP, or as alternatives to cash flows from operating activities as measures of our liquidity. See additional information for the use of these measures and non-GAAP reconciliations below. |
Non-GAAP Reconciliations
EBITDA and Adjusted EBITDA are not measures of our financial condition, liquidity or profitability. They should not be considered as a substitute for net income (loss) from continuing operations, operating profit or any other performance measures derived in accordance with GAAP, nor are they a substitute for cash flow from operating activities as a measure of our liquidity. Additionally, EBITDA and Adjusted EBITDA are not intended to be measures of free cash flow, as they do not take into account items such as interest and principal payments on our indebtedness, working capital needs, tax payments and capital expenditures.
We present EBITDA because we consider it an important supplemental measure of our performance. It also is frequently used by securities analysts, investors and other interested parties to evaluate companies in our industry. We present Adjusted EBITDA because it excludes items that are not related to our ongoing performance. This makes it easier to compare our performance between periods and to similar companies. Adjusted EBITDA is the key metric used by our Chief Operating Decision Maker to assess operating performance. We believe these non-GAAP financial measures provide meaningful supplemental information about our operating performance because they exclude amounts that our management and board of directors do not consider part of core operating results. Our management uses these non-GAAP financial measures to evaluate the Company’s historical financial performance, establish future operating and capital budgets, and determine variable compensation for management and employees.
Our debt agreements specify items that should be added to EBITDA in arriving at Adjusted EBITDA. These include Sponsor fees, share-based compensation expense, impairment charges, restructuring charges, the non-cash impact of net LIFO adjustments, and gains and losses on debt transactions. When there are other small, specified costs to add to EBITDA to arrive at Adjusted EBITDA, we combine those items under Other.
The charges resulting from lump-sum payment settlements to retirees and former employees participating in several Company-sponsored pension plans, and direct and incremental costs related to the Acquisition, were also added back to EBITDA to arrive at Adjusted EBITDA. Costs to optimize our business were also added back to EBITDA to arrive at Adjusted EBITDA. These business transformation costs include third party and duplicate or incremental internal costs. Those items are related to functionalization, and significant process and systems redesign in the Company’s replenishment, finance, category management and human resources functions; company rebranding; cash & carry retail store strategy; and implementation and process and system redesign related to the Company’s sales model.
These items are added to EBITDA to arrive at Adjusted EBITDA as part of the Company’s debt agreements. Accordingly, our management includes those adjustments when assessing our operating performance. We caution readers that amounts presented in accordance with our definitions of EBITDA and Adjusted EBITDA may not be comparable to similar measures used by other companies, because not all companies and analysts calculate EBITDA and Adjusted EBITDA in the same manner.
19
Table of Contents
The following table reconciles Adjusted EBITDA to the most directly comparable GAAP financial performance measure, which is Net loss, for the last five fiscal years:
| 2014 | 2013 | 2012 | 2011 | 2010 | ||||||||||||||||
| (Dollars in millions) | ||||||||||||||||||||
| Net loss |
$ | (73 | ) | $ | (57 | ) | $ | (51 | ) | $ | (102 | ) | $ | (13 | ) | |||||
| Interest expense—net |
289 | 306 | 312 | 307 | 341 | |||||||||||||||
| Income tax provision (benefit) |
36 | 30 | 42 | (42 | ) | 16 | ||||||||||||||
| Depreciation and amortization expense |
412 | 388 | 356 | 343 | 308 | |||||||||||||||
|
|
|
|
|
|
|
|
|
|
|
|||||||||||
| EBITDA |
664 | 667 | 659 | 506 | 652 | |||||||||||||||
| Adjustments: |
||||||||||||||||||||
| Sponsor fees(1) |
10 | 10 | 10 | 10 | 11 | |||||||||||||||
| Restructuring and tangible asset impairment charges(2) |
— | 8 | 9 | 72 | 11 | |||||||||||||||
| Share-based compensation expense(3) |
12 | 8 | 4 | 15 | 3 | |||||||||||||||
| Net LIFO reserve change(4) |
60 | 12 | 13 | 59 | 30 | |||||||||||||||
| Loss on extinguishment of debt(5) |
— | 42 | 31 | 76 | — | |||||||||||||||
| Pension settlement(6) |
2 | 2 | 18 | — | — | |||||||||||||||
| Business transformation costs(7) |
54 | 61 | 75 | 45 | 18 | |||||||||||||||
| Acquisition related costs(8) |
38 | 4 | — | — | — | |||||||||||||||
| Other(9) |
26 | 31 | 22 | 29 | 11 | |||||||||||||||
|
|
|
|
|
|
|
|
|
|
|
|||||||||||
| Adjusted EBITDA |
$ | 866 | $ | 845 | $ | 841 | $ | 812 | $ | 736 | ||||||||||
|
|
|
|
|
|
|
|
|
|
|
|||||||||||
| (1) | Consists of management fees paid to the Sponsors. |
| (2) | Primarily consists of facility closing, severance and related costs and tangible asset impairment charges. |
| (3) | Share-based compensation expense represents costs recorded for vesting of USF Holding stock option awards, restricted stock and restricted stock units. |
| (4) | Consists of net changes in the LIFO reserve. |
| (5) | Includes fees paid to debt holders, third party costs, early redemption premium, and the write off of old debt facility unamortized debt issuance costs. See Note 11—Debt in the Notes to the Audited Consolidated Financial Statements for a further description of debt refinancing transactions. |
| (6) | Consists of charges resulting from lump-sum payment settlements to retirees and former employees participating in several Company sponsored pension plans. |
| (7) | Consists primarily of costs related to functionalization and significant process and systems redesign. |
| (8) | Consists of direct and incremental costs related to the Acquisition. |
| (9) | Other includes gains, losses or charges as specified under the Company’s debt agreements, including $16 million of costs subject to coverage under the Company’s insurance policies. |
20
Table of Contents
| Item 7. | Management’s Discussion and Analysis of Financial Condition and Results of Operations |
The following discussion of our results includes certain financial measures not required by—or presented in accordance with—accounting principles generally accepted in the United States of America (“GAAP”). We believe these non-GAAP financial measures provide meaningful supplemental information about our operating performance, because they exclude amounts that our management and board of directors do not consider part of core operating results when assessing our performance and underlying trends. More information on the rationale for these measures is discussed in non-GAAP Reconciliations below.
Overview
We are a leading foodservice distributor in the United States, with about $23 billion in net sales for fiscal 2014. The Company provides an important link between over 5,000 suppliers and our 200,000 foodservice customers nationwide. We offer an innovative array of fresh, frozen and dry food, and non-food products, with approximately 350,000 stock-keeping units (“SKUs”). US Foods provides value-added services that meet specific customer needs. We believe the Company has one of the most extensive private label product portfolios in foodservice distribution. For the latest fiscal year, this represented about 30,000 SKUs, and approximately $7 billion in net sales. Many customers benefit from our support services, such as product selection, menu preparation and costing strategies.
A sales force of approximately 4,000 associates market our food products to a diverse customer base. Our principal customers include independently owned single and multi-location restaurants, regional concepts, national chains, hospitals, nursing homes, hotels and motels, country clubs, fitness centers, government and military organizations, colleges and universities, and retail locations. We support our business with one of the largest private refrigerated fleets in the U.S., with roughly 6,000 trucks traveling an average of 200 million miles each year. We have standardized our operations across the country. That allows us to manage the business as a single operating segment with 61 divisions nationwide.
Strategic Transformation
Our vision, “To create a great American food company focused solely on foodservice.” This statement serves as a guide for our corporate strategy, summarized in four words: food, food people, and easy.
Food: To be a great American food company, our strategy focuses on offering customers great brands and innovative products, supported by an industry-leading category management capability. We strive to be the first to market with meaningful advances in product taste, quality, affordability or ease of use. We are building a cost-competitive, differentiated and efficient product assortment in every market, which corresponds to the needs of each individual customer category.
Food People: Our business model emphasizes local relationships with customers. To support this, our selling and marketing approach enables salespeople to easily share our wide assortment, and to help customers select the products that fit their needs. They also are able to present value-added services that allow customers to better operate their businesses.
Easy: We offer customers a variety of tools and services so they can succeed in a competitive and challenging market. For example, our mobile and Internet-enabled ordering tools allow customers to place orders, track shipments, and quickly and efficiently see product details.
We also have focused on making the Company more efficient and effective. This involved centralizing certain operations, including most non-customer-facing activities such as finance and human resources. At the same time, we organized other operations along functional lines, in areas such as category management, where key decisions are made as close to the customer as possible.
Our investments in the business reflect these strategic priorities. In 2015, we continue to look for opportunities to provide our customers with new and innovative products and services. We also plan to enhance our category management and merchandising initiatives, and to optimize supply chain operations.
Outlook
The foodservice market is affected by general economic conditions, consumer confidence, and continued pressure on consumer disposable income. During 2014, we experienced inflationary pressures in several product categories. Periods of prolonged product cost inflation may have a negative impact on our profit margins and earnings to the extent such product cost increases are not able to be passed on to customers due to resistance to higher prices or having a negative impact on consumer spending.
21
Table of Contents
The foodservice market is highly competitive and fragmented, with intense competition and modest demand growth. During 2015, we expect continued pressures on consumer spending and competition. Because we do not anticipate any material improvement in the demand for foodservice, we will likely see modest demand growth. We will remain focused on executing our growth strategies, adding value for and differentiating ourselves with our customers, and driving continued operational improvement in the business.
Proposed Acquisition by Sysco
Merger Agreement
USF Holding is our parent company, which owns substantially all of our outstanding shares of common stock. On December 8, 2013, it entered into a merger agreement (the “Merger Agreement”) with Sysco Corporation (“Sysco”); Scorpion Corporation I, Inc., a Delaware corporation and a wholly owned subsidiary of Sysco (“Merger Sub One”); and Scorpion Company II, LLC, a Delaware limited liability company and a wholly owned subsidiary of Sysco (“Merger Sub Two”), pursuant to which Sysco will acquire USF Holding (the “Acquisition”) on the terms and subject to the conditions set forth in the Merger Agreement.
The Merger Agreement provides that the Acquisition will take place in two steps. First, Merger Sub One will merge with and into USF Holding, which will make USF Holding a wholly owned subsidiary of Sysco. Second, immediately following the initial merger, US Holding Corp. will merge with and into Merger Sub Two. Then Merger Sub Two will survive as a wholly owned subsidiary of Sysco. Following the Acquisition, US Foods will be a wholly owned subsidiary of Merger Sub Two, making it an indirect, wholly owned subsidiary of Sysco. The Merger Agreement contains customary representations, warranties and covenants and is subject to the customary conditions, including the expiration or termination of the applicable waiting period under the Hart-Scott-Rodino Antitrust Improvements Act of 1976, as amended (the “HSR Act”). The Merger Agreement generally requires each party to take all actions necessary to resolve objections to the Acquisition under any antitrust law. However, Sysco is not required to take any action to obtain antitrust approvals that would require it to divest assets of 1) Sysco, 2) US Holding Corp., or 3) any of their subsidiaries representing—in the aggregate—revenues in excess of $2 billion. On February 19, 2015, the FTC voted by a margin of 3-2 to seek to block the Merger by filing a federal district court action in the District of Columbia for a preliminary injunction to prevent the parties from closing the Acquisition until after a full trial is conducted by a FTC Administrative Law Judge in a separate administrative action that was filed concurrently by the FTC. In addition, the District of Columbia and the following state attorneys general have joined the FTC’s complaint for a preliminary injunction: California, Illinois, Iowa, Maryland, Minnesota, Nebraska, Ohio, Pennsylvania, Tennessee, and Virginia. Sysco issued a press release, announcing that it will contest the FTC’s attempt to block the proposed Acquisition. The preliminary injunctive hearing in federal court is scheduled to commence on May 5, 2015 and conclude no later than May 13, 2015. The FTC administrative trial is scheduled to commence on July 21, 2015. In connection with the negotiations with the FTC, Sysco, USF Holding, US Foods, and certain of our subsidiaries have entered into the Asset Purchase Agreement with Performance Food Group, Inc. (“PFG”), which provides for the sale to PFG of US Foods facilities in 11 markets upon consummation of the Acquisition. These facilities, represent approximately $4.6 billion in annual sales.
The Merger Agreement may be terminated by either party if the Acquisition has not closed prior to May 7, 2015. However, if all of the conditions for closing of the Acquisition—other than receiving clearance under the HSR Act—are satisfied or able to be satisfied by that date, the Merger Termination Date may be extended by either party for 60 day intervals, up to a date not beyond September 8, 2015 (the “Outside Date”). On March 6, 2015, Sysco notified USF Holding of its decision to extend the termination date of the Merger Agreement for 60 days, from the then current termination date of March 8, 2015, to May 7, 2015. If the Merger Agreement is terminated because the required antitrust approvals cannot be obtained, in certain circumstances Sysco will be required to pay USF Holding, a termination fee of $300 million.
See “Item 1A. Risk Factors” for Risks Related to the Proposed Acquisition by Sysco.
Divestiture
On February 2, 2015, USF Holding, US Foods and certain of our subsidiaries and Sysco entered into an asset purchase agreement (the “Asset Purchase Agreement”) with PFG, pursuant to which PFG agreed to purchase, subject to the terms and conditions of the Asset Purchase Agreement, eleven US Foods distribution centers located in the Cleveland, Ohio; Corona, California; Denver, Colorado; Kansas City, Kansas; Las Vegas, Nevada; Minneapolis, Minnesota; Phoenix, Arizona (including the Phoenix Stock Yards business); Salt Lake City, Utah; San Diego, California (including the San Diego Stock Yards business); San Francisco, California and Seattle, Washington markets and related assets and liabilities (collectively, the “Divested Business”), in connection with (and subject to) the closing of the Acquisition.
The Asset Purchase Agreement contains customary representations, warranties and covenants. In addition, the Asset Purchase Agreement contains certain termination rights, including the right for PFG to terminate if the Acquisition has not closed by the earlier of September 9, 2015 and the Outside Date (subject to PFG’s right to extend under certain circumstances), and automatically terminates in the event the Merger Agreement terminates. The Asset Purchase Agreement provides that, upon termination under certain circumstances, PFG will be entitled to receive an aggregate termination fee of $25 million if termination occurs after May 2, 2015 and on or prior to July 6, 2015 and $50 million after July 6, 2015, with each of Sysco and US Foods responsible for one half of such aggregate fee.
22
Table of Contents
Impact of the Acquisition on Holders of Senior Notes
In connection with the Merger Agreement, on December 10, 2013, we solicited the consents (the “Consent Solicitation”) of holders of our 8.5% unsecured Senior Notes (“Senior Notes”) due June 30, 2019 to amend the indenture with respect to the Senior Notes to modify certain definitions contained in the indenture for the Senior Notes, so that the Acquisition would not constitute a “Change of Control” under the indenture, and US Foods will not be required to make a “Change of Control Offer” to holders of the Senior Notes in connection with the Acquisition. On December 19, 2013, we received the required consents in connection with the consent solicitation and entered into a supplemental indenture with respect to these amendments.
Pursuant to the terms of the supplemental indenture, if either 1) the Merger Agreement is terminated in accordance with its terms or 2) the Acquisition is not consummated by a date as specified in the Merger Agreement, the indenture will revert to its prior form as if the amendments proposed in the consent solicitation had never become operative.
Although we have been advised by Sysco that, if any of our Senior Notes remain outstanding following the consummation of the Acquisition, Sysco intends to fully and unconditionally guarantee the obligations of US Foods under the indenture for the Senior Notes—Sysco is under no contractual or legal obligation to do so.
Impact of the Acquisition on the Business
The Merger Agreement and Asset Purchase Agreement have some restrictive covenants that limit our ability to take certain actions until the Acquisition closes or the Merger Agreement and Asset Purchase Agreement terminates.
Under the Merger Agreement, we must use commercially reasonable efforts to operate our business as we ordinarily would, and consistent with past practice in all material respects, and to preserve our business and assets. Without the consent of Sysco (not to be unreasonably withheld, conditioned or delayed), we may not (with limited exceptions) take, authorize, agree or commit to do certain actions outside of the ordinary course of business, including the following:
| • | Amending or otherwise changing our organizational documents in any material respect |
| • | Selling assets having a value in excess of $1 million, or selling a series of assets that total more than $5 million |
| • | Making any material modifications to employee or executive compensation or benefits |
| • | Changing our capital structure; taking certain actions related to equity interests or voting securities; or engaging in a dissolution, merger, consolidation, restructuring, recapitalization or other reorganization |
| • | Incurring any additional indebtedness, other than 1) borrowings and other extensions of credit under existing credit facilities, and other financing arrangements to fund working capital expenses in the ordinary course of business; 2) indebtedness in a principal amount not in excess of $20 million; or 3) inter-company debt |
| • | Creating or incurring certain liens on assets |
| • | Engaging in certain mergers, acquisitions or dispositions |
| • | Entering into, modifying or terminating material contracts |
| • | Making material loans, investments, or capital contributions to or in third parties |
| • | Disposing of certain real estate assets |
| • | Making material changes to accounting methods, policies or practices, except as required by GAAP or applicable law |
| • | Making certain material tax-related changes |
| • | Making capital expenditures or commitments for capital expenditures outside of the annual operating plan, or entering into fleet capital leases in excess of $100 million per year |
| • | Forgiving, canceling or compromising any material debt or claim, or waiving, releasing or assigning rights or claims of material value |
| • | Entering into any settlement, compromise or release contemplating or involving any admission of wrongdoing or misconduct, or providing for any relief or settlement other than the payment of money not in excess of $5 million individually or $25 million in total |
23
Table of Contents
Under the Asset Purchase Agreement, we must conduct the Divested Business as we ordinarily would, and use commercially reasonable efforts to preserve intact the Divested Business and related assets and relationships in all material respects. Without the consent of PFG (not to be unreasonably withheld, conditioned or delayed) we may not take, authorize, agree or commit to do certain actions related to the Divested Business, including the following:
| • | Grant increased benefits other than in the ordinary course of business, consistent with past practices and applying uniformly to similar situated employees |
| • | Make certain transfers of employees or assets into or out of the Divested Business |
| • | Enter into contracts for the option, purchase, or lease of real property |
| • | Enter into, modifying or terminating material contracts |
| • | Settle proceedings related to the Divested Business other than for solely money damages to be paid by us |
| • | Enter into contracts that would restrict PFG from engaging or competing in any line of business |
| • | Purchase or order inventory outside the ordinary course of business |
Results of Operations
Accounting Periods
We operate on a 52-53 week fiscal year, with all periods ending on Saturday. When a 53-week fiscal year occurs, we report the additional week in the fourth quarter. Fiscal 2014, 2013 and 2012 all consisted of 52 weeks. The following table presents selected consolidated results of operations of our business for the last three fiscal years:
| 2014 | 2013 | 2012 | ||||||||||
| (in millions) | ||||||||||||
| Consolidated Statements of Operations: |
||||||||||||
| Net sales |
$ | 23,020 | $ | 22,297 | $ | 21,665 | ||||||
| Cost of goods sold |
19,222 | 18,474 | 17,972 | |||||||||
|
|
|
|
|
|
|
|||||||
| Gross profit |
3,798 | 3,823 | 3,693 | |||||||||
| Operating expenses: |
||||||||||||
| Distribution, selling and administrative costs |
3,546 | 3,494 | 3,350 | |||||||||
| Restructuring and tangible asset impairment charges |
— | 8 | 9 | |||||||||
|
|
|
|
|
|
|
|||||||
| Total operating expenses |
3,546 | 3,502 | 3,359 | |||||||||
|
|
|
|
|
|
|
|||||||
| Operating income |
252 | 321 | 334 | |||||||||
| Interest expense - net |
289 | 306 | 312 | |||||||||
| Loss on extinguishment of debt |
— | 42 | 31 | |||||||||
|
|
|
|
|
|
|
|||||||
| Loss before income taxes |
(37 | ) | (27 | ) | (9 | ) | ||||||
| Income tax provision |
36 | 30 | 42 | |||||||||
|
|
|
|
|
|
|
|||||||
| Net loss |
$ | (73 | ) | $ | (57 | ) | $ | (51 | ) | |||
|
|
|
|
|
|
|
|||||||
| Percentage of Net Sales: |
||||||||||||
| Gross profit |
16.5 | % | 17.1 | % | 17.0 | % | ||||||
| Distribution, selling and administrative costs |
15.4 | % | 15.7 | % | 15.5 | % | ||||||
| Operating expense |
15.4 | % | 15.7 | % | 15.5 | % | ||||||
| Operating income |
1.1 | % | 1.4 | % | 1.5 | % | ||||||
| Net loss |
(0.3 | )% | (0.3 | )% | (0.2 | )% | ||||||
| Other Data: |
||||||||||||
| EBITDA (1) |
$ | 664 | $ | 667 | $ | 659 | ||||||
| Adjusted EBITDA (1) |
$ | 866 | $ | 845 | $ | 841 | ||||||
24
Table of Contents
| (1) | EBITDA and Adjusted EBITDA are measures used by management to measure operating performance. EBITDA is defined as Net income (loss), plus Interest expense – net, Income tax provision (benefit) and depreciation and amortization. Adjusted EBITDA is defined as EBITDA adjusted for 1) Sponsor fees; 2) Restructuring and tangible asset impairment charges; 3) share-based compensation expense; 4) business transformation costs; 5) Acquisition related costs; 6) other gains, losses, or charges as specified under our debt agreements; and 7) the non-cash impact of net LIFO adjustments. EBITDA and Adjusted EBITDA, as presented in this Annual Report on Form 10-K, are supplemental measures of our performance that are not required by—or presented in accordance with—accounting principles GAAP. They are not measurements of our performance under GAAP and should not be considered as alternatives to Net income (loss) or any other performance measures derived in accordance with GAAP or as alternatives to cash flows from operating activities as measures of our liquidity. |
See additional information for the use of these measures and non-GAAP reconciliations below.
Non-GAAP Reconciliations
We believe these non-GAAP financial measures provide an important supplemental measure of our operating performance. This is because they exclude amounts that our management and board of directors do not consider part of core operating results when assessing Company performance. Our management uses these non-GAAP financial measures to evaluate the Company’s historical financial performance, establish future operating and capital budgets, and determine variable compensation for management and employees. Accordingly, our management includes those adjustments when assessing the business’ operating performance.
Our debt agreements specify items that should be added to EBITDA in arriving at Adjusted EBITDA. These include, among other things, Sponsor fees, share-based compensation expense, impairment charges, restructuring charges, the non-cash impact of net LIFO adjustments, and gains and losses on debt transactions. Where there are other small, specified costs to add to EBITDA to arrive at Adjusted EBITDA, we combine those items under Other.
The charges resulting from lump-sum payment settlements to former employees participating in several Company-sponsored pension plans were also added to EBITDA in arriving at Adjusted EBITDA. Costs to optimize our business were also added back to EBITDA to arrive at Adjusted EBITDA. These business transformation costs included third party and duplicate or incremental internal costs. Those items are related to functionalization, and significant process and systems redesign in the Company’s replenishment, finance, category management and human resources functions; company rebranding; cash & carry retail store strategy; and implementation and process and system redesign related to the Company’s sales model.
All of the items just mentioned are specified as additions to EBITDA to arrive at Adjusted EBITDA, per the Company’s debt agreements. We caution readers that amounts presented in accordance with our definitions of EBITDA and Adjusted EBITDA may not be the same as similar measures used by other companies. Not all companies and analysts calculate EBITDA or Adjusted EBITDA in the same manner.
We present EBITDA because it is an important supplemental measure of our performance. We also know that it is frequently used by securities analysts, investors and other interested parties to evaluate companies in our industry. We present Adjusted EBITDA as it is the key operating performance metric used by our Chief Operating Decision Maker to assess operating performance.
25
Table of Contents
The following table reconciles Adjusted EBITDA to the most directly comparable GAAP financial performance measure, which is Net loss, for the last three fiscal years:
| 2014 | 2013 | 2012 | ||||||||||
| (in millions) | ||||||||||||
| Net loss |
$ | (73 | ) | $ | (57 | ) | $ | (51 | ) | |||
| Interest expense—net |
289 | 306 | 312 | |||||||||
| Income tax provision |
36 | 30 | 42 | |||||||||
| Depreciation and amortization expense |
412 | 388 | 356 | |||||||||
|
|
|
|
|
|
|
|||||||
| 664 | 667 | 659 | ||||||||||
| Adjustments: |
||||||||||||
| Sponsor fees (1) |
10 | 10 | 10 | |||||||||
| Restructuring and tangible asset impairment charges (2) |
— | 8 | 9 | |||||||||
| Share-based compensation expense (3) |
12 | 8 | 4 | |||||||||
| Net LIFO reserve change (4) |
60 | 12 | 13 | |||||||||
| Loss on extinguishment of debt (5) |
— | 42 | 31 | |||||||||
| Pension settlement (6) |
2 | 2 | 18 | |||||||||
| Business transformation costs (7) |
54 | 61 | 75 | |||||||||
| Acquisition related costs (8) |
38 | 4 | — | |||||||||
| Other (9) |
26 | 31 | 22 | |||||||||
|
|
|
|
|
|
|
|||||||
| $ | 866 | $ | 845 | $ | 841 | |||||||
|
|
|
|
|
|
|
|||||||
| (1) | Consists of management fees paid to the Sponsors. |
| (2) | Primarily consists of facility closing, severance and related costs and tangible asset impairment charges. |
| (3) | Share-based compensation expense represents costs recorded for vesting of USF Holding Corp. stock option awards, restricted stock and restricted stock units. |
| (4) | Consists of net changes in the LIFO reserve. |
| (5) | Includes fees paid to debt holders, third party costs, early redemption premium, and the write off of old debt facility unamortized debt issuance costs. See Note 11—Debt in the Notes to the Audited Consolidated Financial Statements for a further description of debt refinancing transactions. |
| (6) | Consists of charges resulting from lump-sum payment settlements to retirees and former employees participating in several Company sponsored pension plans. |
| (7) | Consists primarily of costs related to functionalization and significant process and systems redesign. |
| (8) | Consists of direct and incremental costs related to the Acquisition. |
| (9) | Other includes gains, losses or charges as specified under the Company’s debt agreements, including $16 million of costs subject to coverage under the Company’s insurance policies. |
Highlights
This is a comparison of results between fiscal 2014 and 2013:
| • | Net sales increased $723 million, or 3.2%, to $23,020 million. |
| • | Operating income, as a percentage of net sales, was 1.1% in 2014 as compared to 1.4% in 2013. Fiscal 2014 operating income included Acquisition related costs of $38 million. |
| • | Adjusted EBITDA increased 2.5% or $21 million, to $866 million. |
Fiscal Years Ended December 27, 2014 and December 28, 2013
Net Sales
Net sales increased $723 million, or 3.2%, to $23,020 million in 2014 versus $22,297 million in 2013. The improvement was primarily due to increased sales to independent restaurants, healthcare and hospitality customers, and was partially offset by lower sales to national chain customers. Case volume decreased 1.2% or $250 million from the prior year. Higher product cost favorably impacted net sales in 2014 as a significant portion of our business is based on percentage markups over actual cost.
26
Table of Contents
Gross Profit
Gross profit decreased $25 million, or 0.6%, to $3,798 million in 2014, from $3,823 million in 2013. Gross profit as a percentage of net sales decreased by 0.6% to 16.5% in 2014, as compared to 17.1% in 2013. Lower gross profit reflected commodity pricing pressures and competitive market conditions, partially offset by merchandising initiatives.
Distribution, Selling and Administrative Costs
Distribution, selling and administrative expenses increased $52 million, or 1.5%, to $3,546 million in 2014 from $3,494 million in 2013. As a percentage of net sales, Distribution, selling and administrative costs decreased 0.3% to 15.4% from 15.7% last year. Increases in Distribution, selling and administrative costs were due primarily to $38 million of 2014 direct and incremental costs related to the pending Acquisition, and a $24 million increase in Depreciation and amortization expense, primarily due to investments in technology and fleet.These increases were partially offset by $9 million lower marketing and branding related costs. Year over year salary inflation increases were offset by lower headcount and a $20 million decrease in Company sponsored benefit plans’ pension costs.
Restructuring and Tangible Asset Impairment Charges
During 2014, certain Assets held for sale were adjusted to equal their estimated fair value, less cost to sell, resulting in tangible asset impairment charges of $2 million. These charges were offset by the favorable impacts of changes in estimated provisions for unused leases and severance costs of $2 million.
During 2013, we recognized Restructuring and tangible asset impairment charges of $8 million. We closed three distribution facilities that ceased operating in 2014. This resulted in $4 million of severance and related costs. Certain Assets held for sale in 2013 were adjusted down to their estimated fair value, less costs to sell. That resulted in tangible asset impairment charges of $2 million. We also incurred $2 million of other severance costs, including $1 million for a multiemployer pension withdrawal liability.
Operating Income
Operating income decreased $68 million or 21.2% to $253 million in 2014, compared to $321 million in 2013. Operating income as a percentage of net sales decreased 0.3% to 1.1% in 2014 from 1.4% in 2013. The operating income changes were primarily due to the factors discussed above.
Interest Expense-Net
Interest expense –net decreased $17 million to $289 million in 2014 from $306 million in 2013. Lower overall borrowing costs as a result of the 2013 debt refinancing transactions and a decrease in average borrowings on our revolving credit facility, were partially offset by interest expense attributable to capital lease additions.
Loss on Extinguishment of Debt
The 2013 loss on extinguishment of debt consists of a write-off of unamortized debt issuance costs, as well as loan fees and third party costs relating to the Amended 2011 Term Loan and an early redemption premium and a write-off of unamortized debt issuance costs relating to the redemption of our 11.25% Senior Subordinated Notes (“Senior Subordinated Notes”). For a detailed description of our Senior Subordinated Notes redemption transaction, see Note 11—Debt in the Notes to the Audited Consolidated Financial Statements.
Income Taxes
We recorded an income tax provisions of $36 million and $30 million for 2014 and 2013, respectively. The effective tax rate of 97% for 2014 was primarily affected by a $55 million increase in the valuation allowance related to intangible assets, and an $8 million increase in deferred tax assets related to additional income tax credits. The effective tax rate of 109% for 2013 was primarily affected by a $32 million increase in the valuation allowance related to intangible assets, and a $5 million decrease in deferred tax assets for stock awards settled. See Note 19—Income Taxes in the Notes to the Audited Consolidated Financial Statements for a reconciliation of our effective tax rates to the statutory rate.
27
Table of Contents
Net Loss
Net loss increased $16 million to $73 million in 2014, as compared to net loss of $57 million in 2013. The higher net loss was due to the factors discussed above.
Fiscal Years Ended December 28, 2013 and December 29, 2012
Net Sales
Net sales increased $632 million, or 2.9%, to $22,297 million in 2013 versus $21,665 million in 2012. The improvement was primarily due to increased sales to independent restaurants, healthcare and hospitality customers. Case volume grew 1.2%, or $280 million, over the prior year. Approximately $350 million of the net sales increase came from higher product cost, as a significant portion of our business is based on percentage markups over actual cost. Less than 1% of the 2013 sales growth was attributable to acquisitions.
Gross Profit
Gross profit increased $130 million, or 3.5%, to $3,823 million in 2013, from $3,693 million in 2012. Gross profit as a percentage of net sales rose by 0.1% to 17.1% in 2013, as compared to 17.0% in 2012. Higher gross profit reflected favorable product cost due to merchandising initiatives, and higher case volume, partially offset by commodity pricing pressures.
Distribution, Selling and Administrative Costs
Distribution, selling and administrative costs increased $144 million, or 4.3%, to $3,494 million in 2013, compared to $3,350 million in 2012. Distribution, selling and administrative costs as a percentage of net sales grew by 0.2% to 15.7% for 2013 versus 15.5% for 2012. The 2013 increase in Distribution, selling and administrative expenses was primarily due to a $111 million increase in payroll and related costs, driven by higher incentive compensation costs from a year ago, higher wages related to year-over-year wage inflationary increases, and increased sales volume.
Other increases in Distribution, selling and administrative expenses included 1) a $23 million increase in Depreciation and amortization expense, due to recent capital expenditures for fleet replacement and investments in technology; 2) $9 million increase in amortization of intangible assets resulting from our 2012 business acquisitions; 3) a $23 million increase in self-insurance costs due to less favorable business insurance experience in 2013; and 4) a $9 million increase in bad debt costs. These increases were offset by productivity improvements from the Company’s selling and distribution activities initiatives, and business transformation costs that were $14 million lower in 2013 than in the prior year. Pension expense decreased $15 million in 2013 from a year ago, primarily due to a 2012 settlement charge resulting from lump-sum payments to retirees and former employees participating in several Company-sponsored pension plans.
Restructuring and Tangible Asset Impairment Charges
During 2013, we recognized Restructuring and tangible asset impairment charges of $8 million. We closed three distribution facilities that ceased operating in 2014. This resulted in $4 million of severance and related costs. Certain Assets held for sale in 2013 were adjusted down to their estimated fair value, less costs to sell. That resulted in tangible asset impairment charges of $2 million. We also incurred $2 million of other severance costs, including $1 million for a multiemployer pension withdrawal liability.
During 2012, we recognized Restructuring and tangible asset impairment charges of $9 million. We closed four facilities, including three distribution centers and one administrative support office. The closed facilities were consolidated into other Company operations. These actions resulted in $5 million of tangible asset impairment charges and minimal severance and related costs. In 2012, we recognized $3 million of net severance and related costs for initiatives to optimize and transform our business processes and systems. Also, certain Assets held for sale were adjusted to their estimated fair value, less costs to sell. This created tangible asset impairment charges of $2 million. Additionally, we reversed $2 million of liabilities for unused leased facilities.
Operating Income
Operating income decreased $13 million or 3.9% to $321 million in 2013, compared to $334 million in 2012. Operating income as a percentage of net sales decreased 0.1% to 1.4% in 2013 from 1.5% in 2012. The operating income changes were primarily due to the factors discussed above.
28
Table of Contents
Interest Expense-Net
Interest expense-Net decreased $6 million to $306 million in 2013 from $312 million in 2012. Lower overall borrowing costs as a result of the Company’s debt refinancing transactions were partially offset by an increase in average borrowings.
Loss on Extinguishment of Debt
During 2013 and 2012, we entered into a series of debt refinancing transactions to extend debt maturities or lower borrowing costs. The 2013 Loss on extinguishment of debt was $42 million. It consisted of a $20 million premium related to the early redemption of our 11.25% Senior Subordinated Notes (“Senior Subordinated Notes”), a write-off of $13 million of unamortized debt issuance costs related to the old debt facilities, and $9 million of lender fees and third party costs related to these transactions.
The 2012 Loss on extinguishment of debt was $31 million. This included $12 million of lender fees and third party costs related to the transactions, a write off of $10 million of unamortized debt issuance costs related to the old debt facilities, and a $9 million premium from the early redemption of our Senior Subordinated Notes. For a detailed description of our debt refinancing transactions, see Note 11—Debt in the Notes to the Audited Consolidated Financial Statements.
Income Taxes
We recorded income tax provisions of $30 million and $42 million for 2013 and 2012, respectively. The effective tax rate of 109% for 2013 was primarily affected by a $32 million increase in the valuation allowance related to intangible assets, and a $5 million decrease in deferred tax assets for stock awards settled. The effective tax rate of 487% for 2012 was primarily affected by a $44 million increase in the valuation allowance related to intangible assets. See Note 19—Income Taxes in the Notes to the Audited Consolidated Financial Statements for a reconciliation of our effective tax rates to the statutory rate.
Net Loss
Net loss increased $6 million to $57 million in 2013, as compared to net loss of $51 million in 2012. The 2013 increase in net loss was primarily due to the factors discussed above.
Liquidity and Capital Resources
Our operations and strategic objectives require continuing capital investment. Company resources include cash provided by operations, as well as access to capital from bank borrowings, various types of debt, and other financing arrangements. However, in connection with the Merger Agreement, we have agreed to several debt-related terms. These include our agreement 1) not to incur indebtedness in excess of $20 million other than to fund working capital expenses in the ordinary course of business and certain other agreed-upon expenditures, and 2) not to make any capital expenditures or commitments—or enter into fleet capital leases in excess of $100 million per year—other than in the ordinary course of business consistent with past practice.
The Merger Agreement provides for restrictive covenants that limit our ability to take certain actions. These include raising capital and conducting other financing activities. However, we do not believe these restrictions will prevent us from meeting our debt service obligations, ongoing costs of operations, working capital needs, and capital expenditure requirements for the next 12 months.
Indebtedness
We are highly leveraged, with significant scheduled debt maturities during the next five years. A substantial portion of our liquidity needs arise from debt service requirements, and from the ongoing costs of operations, working capital and capital expenditures. As of December 27, 2014, we had $4,733 million in aggregate indebtedness outstanding. We had commitments for additional borrowings under our asset-based senior secured revolving loan ABL Facility (“ABL Facility”) and our 2012 ABS Facility (“2012 ABS Facility”) of $929 million (of which $829 million was available based on our borrowing base), all of which were secured.
Our primary financing sources for working capital and capital expenditures are our asset-backed senior secured revolving loan facility ABL Facility and our accounts receivable financing facility 2012 ABS Facility.
The ABL Facility provides for loans of up to $1,100 million, with its capacity limited by borrowing base calculations. As of December 27, 2014, we had no outstanding borrowings, but had issued Letters of Credit totaling $335 million under the ABL Facility. There was available capacity on the ABL Facility of $765 million at December 27, 2014, based on the borrowing base calculation.
29
Table of Contents
Under the 2012 ABS Facility, the Company and certain subsidiaries sell, on a revolving basis, their eligible receivables to a 100% owned, special purpose, bankruptcy remote subsidiary of the Company. This subsidiary, in turn, grants to the administrative agent for the benefit of the lenders a continuing security interest in all of its rights, title and interest in the eligible receivables (as defined by the 2012 ABS Facility). See Note 5—Accounts Receivable Financing Program in the Notes to the Audited Consolidated Financial Statements, for a further description of this program. The maximum capacity under the 2012 ABS Facility is $800 million, with its capacity limited by borrowing base calculations. Borrowings under the 2012 ABS Facility were $636 million at December 27, 2014. The Company, at its option, can request additional 2012 ABS Facility borrowings up to the maximum commitment, provided sufficient eligible receivables are available as collateral. There was available capacity on the 2012 ABS Facility of $64 million at December 27, 2014, based on the borrowing base calculation. On August 8, 2014, the 2012 ABS Facility was amended whereby the maturity date was extended from August 27, 2015 to the earlier of August 5, 2016, or the termination date of the ABL Facility, currently May 11, 2016. The interest rate on outstanding borrowings was reduced 25 basis points. The Company incurred less than $1 million of costs and fees related to the 2012 ABS Facility amendment.
The Company has $1,350 million of 8.5% unsecured Senior Notes due June 30, 2019 outstanding as of December 27, 2014. On December 19, 2013, the indenture for the Senior Notes (the “Senior Note Indenture”) was amended so that the Acquisition by Sysco will not constitute a “Change of Control.” This was authorized through the consent of the holders of our Senior Notes. In the event of a “Change of Control,” the holders of the Senior Notes would have the right to require the Company to repurchase all or any part of their notes at a price equal to 101% of the principal amount, plus accrued and unpaid interest to the date of repurchase. If the Acquisition is terminated under the terms of the Merger Agreement, or is not completed by September 8, 2015, the Senior Note Indenture will revert to its original terms. Holders of the Senior Notes received fees of $3.4 million as consideration for agreeing to the amendment. Under the Merger Agreement, Sysco funded the payment of the consent fees to the holders in December 2013.
Due to the debt refinancing transactions completed in recent years, $3.4 billion of our debt facilities will not mature until 2019. Our remaining $1.3 billion of debt facilities mature at various dates, including $684 million in 2016 and $522 million in 2017. As economic conditions permit, and as permitted under the Merger Agreement terms, we will consider further opportunities to repurchase, refinance or otherwise reduce our debt obligations on favorable terms. Any further potential debt reduction or refinancing could require significant use of our liquidity and capital resources. For a detailed description of our indebtedness, see Note 11—Debt in the Notes to the Audited Consolidated Financial Statements.
We believe that the combination of cash generated from operations—together with availability under our debt agreements and other financing arrangements—will be adequate to permit us to meet our debt service obligations, ongoing costs of operations, working capital needs, and capital expenditure requirements for the next 12 months. Our future financial and operating performance, ability to service or refinance our debt, and ability to comply with covenants and restrictions contained in our debt agreements will be subject to 1) future economic conditions, 2) the financial health of our customers and suppliers, and 3) financial, business and other factors—many of which are beyond our control.
Every quarter, we perform a review of all of our lenders that have a continuing obligation to provide funding to us by reviewing rating agency changes. We are not aware of any facts that indicate our lender banks will not be able to comply with the contractual terms of their agreements with us. We continue to monitor the credit markets generally and the strength of our lender counterparties.
The Company, its Sponsors or their affiliates may, from time-to-time, repurchase or otherwise retire our debt and take other steps to reduce our debt or otherwise improve our balance sheet. These actions may include open market repurchases, negotiated repurchases, and other retirements of outstanding debt. The amount of debt that may be repurchased or otherwise retired, if any, will depend on market conditions, trading levels of our debt, our cash position, and other considerations. Our Sponsors or their affiliates may also purchase our debt from time-to-time, through open market purchases or other transactions. In these cases, our debt is not retired, and we would continue to pay interest in accordance with the terms of the debt.
Our credit facilities, loan agreements and indentures contain customary covenants. These include, among other things, covenants that restrict our ability to incur certain additional indebtedness, create or permit liens on assets, pay dividends, or engage in mergers or consolidations. Certain debt agreements also contain various and customary events of default with respect to the loans. Those include, without limitation, the failure to pay interest or principal when this is due under the agreements, cross default provisions, the failure of representations and warranties contained in the agreements to be true, and certain insolvency events. If a default event occurs and continues, the principal amounts outstanding—plus unpaid interest and other amounts owed—may be declared immediately due and payable to the lenders. If this happened, we would be forced to seek new financing that may not be as favorable as our current facilities. Our ability to refinance indebtedness on favorable terms, or at all, is directly affected by the current economic and financial conditions. In addition, our ability to incur secured indebtedness
30
Table of Contents
(which may enable us to achieve more favorable terms than the incurrence of unsecured indebtedness) depends on the strength of our cash flows, results of operations, economic and market conditions and other factors. As of December 27, 2014, we were in compliance with all of our debt agreements.
Cash Flows
This table presents condensed highlights from the cash flow statements for the last three fiscal years:
| 2014 | 2013 | 2012 | ||||||||||
| (in millions) | ||||||||||||
| Net loss |
$ | (73 | ) | $ | (57 | ) | $ | (51 | ) | |||
| Changes in operating assets and liabilities, net of acquisitions of businesses |
(11 | ) | (123 | ) | (101 | ) | ||||||
| Other adjustments |
486 | 502 | 468 | |||||||||
|
|
|
|
|
|
|
|||||||
| Net cash provided by operating activities |
402 | 322 | 316 | |||||||||
| Net cash used in investing activities |
(118 | ) | (187 | ) | (380 | ) | ||||||
| Net cash (used in) provided by financing activities |
(120 | ) | (197 | ) | 103 | |||||||
|
|
|
|
|
|
|
|||||||
| Net (decrease) increase in cash and cash equivalents |
164 | (62 | ) | 39 | ||||||||
| Cash and cash equivalents, beginning of period |
180 | 242 | 203 | |||||||||
|
|
|
|
|
|
|
|||||||
| Cash and cash equivalents, end of period |
$ | 344 | $ | 180 | $ | 242 | ||||||
|
|
|
|
|
|
|
|||||||
Cash flows provided by operating activities were $402 million in 2014, compared to $322 million in 2013 and $316 million in 2012. Cash flows provided by operating activities increased $80 million in 2014 from 2013. Lower Inventories were partially offset by an increase in Accounts receivable and lower Accrued expenses and other liabilities. Cash flows provided by operating activities increased $6 million in 2013 from 2012. Decreases in Accounts receivable and Inventories, and an increase in Accrued expenses and other liabilities, were partially offset by lower Accounts payable and lower Operating income.
Cash flows provided by operating activities in 2014 were unfavorably affected by changes in operating assets and liabilities—including an increase in Accounts receivable and decreases in Accounts payable and Accrued expenses and other liabilities, partially offset by a decrease in Inventories. Cash flows from operating activities include $10 million of insurance recoveries related to tornado damage to a distribution facility. Cash flows provided by operating activities in 2013 were unfavorably affected by changes in operating assets and liabilities. This included higher Inventories and Accounts receivable and lower Accounts payable. Cash flows provided by operating activities in 2012 were unfavorably affected by changes in operating assets and liabilities, including increases in Inventories and Accounts receivable and a decrease in Accrued expenses and other liabilities, partially offset by an increase in Accounts payable and improved operating results.
Investing Activities
Cash flows used in investing activities in 2014 included purchases of property and equipment of $147 million, proceeds from sales of property and equipment of $25 million and $4 million of insurance recoveries related to property and equipment of a distribution facility damaged by a tornado. Cash flows used in investing activities in 2013 included purchases of property and equipment of $191 million, and proceeds from sales of property and equipment of $15 million. Cash flows used in investing activities for 2012 included purchases of property plant and equipment of $293 million, and proceeds from sales of property and equipment of $20 million.
Capital expenditures in 2014, 2013 and 2012 included fleet replacement and investments in information technology to improve our business, as well as new construction and/or expansion of distribution facilities. Additionally, we entered into $97 million, $101 million and $22 million of capital lease obligations in 2014, 2013 and 2012, respectively. The 2014 capital lease obligations included $70 million for fleet replacement and $27 million for a distribution facility addition. The 2013 capital lease obligations were primarily for fleet replacement. Our 2012 capital lease obligation was for a shared services center.
We expect cash capital expenditures in 2015 to be approximately $200 million. The expenditures will focus on information technology, warehouse equipment and facility construction and/or expansion. We expect to also enter into approximately $100 million of fleet capital leases in 2015. We expect to fund our 2015 capital expenditures with available cash balances or cash generated from operations.
31
Table of Contents
Cash flows used in investing activities during 2013 included the acquisition of one foodservice distributor for $14 million in cash, plus a contingent consideration of $2 million. We also had a purchase price adjustment of $2 million in 2013 related to two 2012 acquisitions. In 2012, Cash flows used in investing activities included business acquisitions of five foodservice distributors for $106 million in cash, plus a contingent consideration of $6 million. These acquisitions have been integrated into our foodservice distribution network.
Financing Activities
Cash flows used in financing activities of $120 million in 2014 resulted from $50 million of net payments on our 2012 ABS Facility, $20 million of net payments on our ABL Facility, $24 million of scheduled payments on other debt facilities, $24 million related to capital lease obligations and $2 million of contingent consideration related to a 2013 business acquisition.
Cash flows used in financing activities of $197 million in 2013 primarily resulted from net payments on debt facilities, and costs and fees paid related to our 2013 debt refinancing transactions.
In June 2013, we refinanced our term loan facilities into a new $2,100 million term facility. Lenders exchanged $1,634 million in principal under our previous term loan facilities for a like amount of principal in the new facility. We received proceeds of $466 million from continuing and new lenders purchasing additional principal in the new term loan facility. The cash proceeds were used to pay down $457 million in principal of the previous term loan facilities. In January 2013, we used proceeds of $388 million from Senior Note issuances primarily to redeem $355 million in principal of our Senior Subordinated Notes, plus an early redemption premium of $20 million. We incurred total cash costs of $29 million in connection with the 2013 debt refinancing transactions, including costs to register our Senior Notes. Additionally, we made net payments on our ABL Facility of $150 million as well as $27 million of scheduled payments on other debt facilities. In 2013, we paid $6 million of contingent consideration related to 2012 business acquisitions. In 2013, we paid $8 million to repurchase common shares of our parent company, USF Holding Corp., from employees who left the Company. The shares were acquired through the management stockholder’s agreement associated with our stock incentive plan.
Cash flows from financing activities of $103 million in 2012 primarily resulted from net borrowings on debt facilities, partially offset by transaction costs and fees paid related to our 2012 debt refinancing transactions. We used proceeds of $584 million from Senior Note issuances largely to repay $249 million of 2007 Term Loan principal due July 3, 2014, and redeem $166 million in principal of our Senior Subordinated Notes, plus an early redemption premium of $9 million. Our CMBS floating rate loan matured on July 9, 2012. Its outstanding borrowings, totaling $163 million, were repaid with proceeds from our ABL Facility. Scheduled repayments on debt and capital leases were $18 million. We incurred total cash costs of $35 million in connection with 2012 debt refinancing transactions. In 2012, we received proceeds of $1 million from certain Company employees who purchased shares of common stock of our parent company, USF Holding Corp., through a management stockholder’s agreement associated with the Company’s stock incentive plan. We also paid $4 million to repurchase shares of common stock of USF Holding Corp. from employees who left the Company.
Retirement Plans
We maintain several qualified retirement plans and a nonqualified retirement plan (“Retirement Plans”) that pay benefits to certain employees at retirement, using formulas based on a participant’s years of service and compensation. In addition, we maintain a postemployment health and welfare plan for certain employees. Management is responsible for the assumptions used by the actuaries it engages to calculate the Retirement Plans projected and accumulated benefit obligations and the annual expense recognized for these plans. The assumptions used in developing the required estimates primarily include discount rates, expected return on plan assets, compensation increase rates, retirement rates, mortality rates and, for postretirement benefits, health care cost trend rates.
In determining the discount rate, we use a hypothetical portfolio of high-quality fixed-income investments, for which the timing and amount of cash outflows approximates the estimated pension plan payouts. The use of a different discount rate would impact net pension and postretirement benefit costs and benefit obligations. The expected long-term rate of return on plan assets is derived from a mathematical asset model that incorporates assumptions on the various asset class returns, reflecting a combination of historical performance analysis and the forward-looking views of the financial markets regarding the yield on long-term bonds and the historical returns of the major stock markets. The use of a different rate of return would impact net pension costs.
A one-half percentage point change in the assumed discount rate and return on plan asset rate would have the following effects (in millions):
| Increase (Decrease) in | ||||||||||||
| Percentage Change |
2015 Net Periodic Pension Cost |
2014 Projected Benefit Obligation |
||||||||||
| Pension Benefits: |
||||||||||||
| Discount rate |
0.5% increase | $ | (11 | ) | $ | (76 | ) | |||||
| Discount rate |
0.5% decrease | 12 | 87 | |||||||||
| Expected return on plan assets |
0.5% increase | 4 | — | |||||||||
| Expected return on plan assets |
0.5% decrease | (4 | ) | — | ||||||||
Standard actuarial tables are used to estimate mortality rates. We adopted the new mortality tables published by the Society of Actuaries used to determine the 2014 projected benefit obligation.
Results that differ from these assumptions are accumulated and amortized over future periods and, therefore, generally affect the net benefit cost of future periods. The sensitivity of assumptions reflects the impact of changing one assumption at a time and is specific to conditions at the end of 2014. Economic factors and conditions could affect multiple assumptions simultaneously, and the effects of changes in assumptions are not necessarily linear.
We contributed $49 million, $49 million and $47 million to the Retirement Plans in fiscal years 2014, 2013 and 2012, respectively. Estimated required and discretionary contributions expected to be contributed to the Retirement Plans in 2015 total $49 million.
For a further discussion of our Retirement plans, see Note 17—Retirement Plans in the Notes to the Audited Consolidated Financial Statements.
32
Table of Contents
We also contribute to various multiemployer benefit plans under collective bargaining agreements. Our contributions to these plans were $32 million, $31 million and $28 million in fiscal years 2014, 2013 and 2012, respectively. At December 27, 2014, we had $51 million of multiemployer pension withdrawal liabilities related to closed facilities, payable in monthly installments through 2031, at effective interest rates of 5.9% to 6.7%. As discussed in Note 21—Commitments and Contingencies in the Notes to the Audited Consolidated Financial Statements, we were assessed an additional $17 million multiemployer pension withdrawal liability for a facility closed in 2008. We believe we have meritorious defenses against this assessment and intend to vigorously defend ourselves against the claim. At this time, we do not believe that paying this obligation is probable and, accordingly, have recorded no related liability. However, it is reasonably possible the Company may ultimately be required to pay an amount up to $17 million.
Additionally, employees are eligible to participate in a Company-sponsored defined contribution 401(k) plan. This plan provides that, under certain circumstances, we may make matching contributions of up to 50% of the first 6% of a participant’s compensation. We made contributions to this plan of $26 million, $25 million and $25 million in fiscal years 2014, 2013 and 2012, respectively.
Pricing Litigation
As described in Note 21—Commitments and Contingencies in the Notes to the Audited Consolidated Financial Statements, in December 2014, a pricing practices class action complaint against the Company relating to periods prior to the 2007 acquisition of the Company by its Sponsors, was settled. Under the settlement agreement, Ahold paid $297 million to the settlement fund and the Company was released from all claims. Ahold had indemnified the Company in regards to this matter and, as a consequence, payment of the settlement by Ahold did not impact the Company’s financial position, results of operations or cash flows.
Insurance Recoveries – Tornado Loss
As described in Note 21—Commitments and Contingencies in the Notes to the Audited Consolidated Financial Statements, on April 28, 2014, a tornado damaged a distribution facility and its contents, including building improvements, equipment and inventory. In order to service customers, business from the damaged facility was reassigned to other distribution facilities. We have insurance coverage on the distribution facility and its contents, as well as business interruption insurance. Our insurance policies provide for recoveries of the damaged property at replacement value and the damaged inventory at the greater of 1) expected selling price less unincurred selling costs or 2) cost plus 10%. Discussions are underway with the insurance carrier regarding the Company’s claims on the loss of the building and its contents, and the loss related to the business interruption. Anticipated insurance recoveries related to losses and incremental costs incurred are recognized when receipt is probable. Anticipated insurance recoveries in excess of net book value of the damaged property and inventory will not be recorded until all contingencies relating to the claim have been resolved. The timing of and amounts of ultimate insurance recoveries is not known at this time.
As a result of the tornado damage, we recorded a tangible asset impairment charge of $3 million and a net charge to cost of goods sold of $14 million for damaged inventory. In addition, we have incurred costs of $3 million in 2014, including debris removal and clean-up costs, subject to coverage under our insurance policies. At December 27, 2014, these charges are offset by $14 million of initial advance payments received from insurance carriers and a receivable for insurance recoveries of $6 million that the Company has deemed as probable of recovery. We have classified the $4 million of insurance recoveries related to the damaged distribution facility assets as cash flows from investing activities and the $10 million of insurance recoveries related to damaged inventory and other costs incurred as cash flows from operating activities in our Consolidated Statement of Cash Flows.
In addition, we have incurred costs of $16 million in 2014 subject to coverage under our insurance policies.
Retention and Transaction Bonuses
As part of the Merger Agreement, the Company was given rights to offer retention and transaction bonuses to certain current employees that are integral to the successful completion of the transaction. The Company was approved to offer a maximum of $31.5 million and $10 million of retention bonuses and transaction bonuses, respectively. Additionally, the Company’s Chief Executive Officer (“CEO”) has agreed to reduce his continuation of base salary and bonus amounts by $3 million to be allocated at his discretion as bonuses to current employees (other than himself). The retention, transaction and other bonus payments are subject to consummation of the Acquisition and are payable on or after the transaction date. As of December 27, 2014, the Company has not and is not required to record a liability for these bonuses until the Acquisition is consummated.
In February 2015, the Company approved payment of transaction and retention bonuses at specific future dates even if the Acquisition is not consummated. The Company will record compensation costs beginning in February 2015.
33
Table of Contents
Contractual Obligations
The following table includes information about contractual obligations as of December 27, 2014 that affect our liquidity and capital needs. The table includes information about payments due under specified contractual obligations and is aggregated by type of contractual obligation. It includes the maturity profile of our consolidated debt, operating leases and other long-term liabilities.
| Payments Due by Period (in millions) | ||||||||||||||||||||
| Less Than | More Than | |||||||||||||||||||
| Total | 1 Year | 1-3 Years | 3-5 Years | 5 Years | ||||||||||||||||
| Recorded Contractual Obligations: |
||||||||||||||||||||
| Long-term debt, including capital lease obligations |
$ | 4,733 | $ | 52 | $ | 1,205 | $ | 3,431 | $ | 45 | ||||||||||
| Multiemployer pension withdrawal obligations(1) |
51 | 6 | 9 | 10 | 26 | |||||||||||||||
| Uncertain tax positions, including interest and penalties(2) |
5 | — | — | 5 | — | |||||||||||||||
| Pension plans and other post-retirement benefits contributions(3) |
49 | 49 | ||||||||||||||||||
| Unrecorded Contractual Obligations: |
||||||||||||||||||||
| Interest payments on debt(4) |
1,022 | 254 | 475 | 290 | 3 | |||||||||||||||
| Operating leases |
184 | 35 | 56 | 41 | 52 | |||||||||||||||
| Purchase obligations(5) |
833 | 771 | 62 | — | — | |||||||||||||||
|
|
|
|
|
|
|
|
|
|
|
|||||||||||
| Total contractual cash obligations |
$ | 6,877 | $ | 1,167 | $ | 1,807 | $ | 3,777 | $ | 126 | ||||||||||
|
|
|
|
|
|
|
|
|
|
|
|||||||||||
| (1) | The amount shown represents multiemployer pension withdrawal obligations payable primarily in monthly installments through 2031. |
| (2) | The liabilities shown represent uncertain tax positions related to temporary differences and include $3 million in interest and penalties. |
| (3) | Pension plans and other postretirement benefits contributions are based on estimates for 2015. We do not have minimum funding requirement estimates under ERISA guidelines for the plans beyond 2015. |
| (4) | The amounts shown in the table include future interest payments on variable rate debt at current interest rates. |
| (5) | Purchase obligations include agreements for purchases of product in the normal course of business, for which all significant terms have been confirmed. |
Off-Balance Sheet Arrangements
We entered into a $83 million letter of credit in favor of Ahold to secure their contingent exposure under guarantees of our obligations with respect to certain leases. Additionally, we entered into letters of credit of $242 million in favor of certain commercial insurers securing our obligations with respect to our self-insurance programs, and letters of credit of $10 million for other obligations.
Except as disclosed above, we have no off-balance sheet arrangements that currently have or are reasonably likely to have a material effect on our consolidated financial condition, changes in financial condition, results of operations, liquidity, capital expenditures or capital resources.
Critical Accounting Policies and Estimates
We have prepared the financial information in this report in accordance with GAAP. Preparing these consolidated financial statements requires us to make estimates and assumptions that affect the reported amounts of assets and liabilities, and the disclosure of contingent assets and liabilities at the date of the financial statements, and the reported amounts of revenues and expenses during these reporting periods. We base our estimates and judgments on historical experience and other factors we believe are reasonable under the circumstances. These assumptions form the basis for making judgments about the carrying value of assets and liabilities that are not readily apparent from other sources. The most critical accounting policies and estimates pertain to the valuation of goodwill and other intangible assets, property and equipment, vendor consideration, self-insurance programs, and income taxes.
Valuation of Goodwill and Other Intangible Assets
Goodwill and other intangible assets include the cost of the acquired business in excess of the fair value of the net assets recorded in Goodwill. Other intangible assets include customer relationships, the brand names comprising our portfolio of exclusive brands, and trademarks. As required, we assess goodwill and other intangible assets with indefinite lives for impairment each year—or more frequently, if events or changes in circumstances indicate an asset may be impaired. For goodwill and indefinite-lived intangible
34
Table of Contents
assets, our policy is to assess for impairment at the beginning of each fiscal third quarter. For other intangible assets with definite lives, we assess for impairment only if events occur that indicate that the carrying amount of an asset may not be recoverable. All goodwill is assigned to the consolidated Company as the reporting unit.
For goodwill, the reporting unit used in assessing impairment is our one business segment as described in Note 24—Business Segment Information in the Notes to the Audited Consolidated Financial Statements. Our assessment for impairment of goodwill utilized a combination of discounted cash flow analysis, comparative market multiples and comparative market transaction multiples. The results from each of the models are then weighted and combined into a single estimate of fair value for our reporting unit. The Company uses a weighting of 50%, 35% and 15% for the discounted cash flow analysis, comparative market multiples and comparative market transaction multiples, respectively, to determine the fair value of the reporting unit for comparison to the corresponding carrying value. If the carrying value of the reporting unit exceeds its fair value, we must then perform a comparison of the implied fair value of goodwill with its carrying value. If the carrying value of the goodwill exceeds its implied fair value, an impairment loss is recognized in an amount equal to the excess. Based upon our fiscal 2014 annual goodwill impairment analysis, we believe the fair value of the Company’s reporting unit exceeded its carrying value.
Our fair value estimates of the brand name and trademark indefinite-lived intangible assets are based on a relief from royalty method. Similar to goodwill, the fair value of the intangible asset is determined for comparison to the corresponding carrying value. If the carrying value of the asset exceeds its fair value, an impairment loss is recognized in an amount equal to the excess. Based upon our fiscal 2014 annual impairment analysis, we believe the fair value of the Company’s brand name and trademark indefinite-lived intangible assets exceeded their carrying values.
Due to the many variables inherent in estimating fair value and the relative size of the recorded indefinite-lived intangible assets, differences in assumptions may have a material effect on the results of our impairment analysis.
Property and Equipment
Property and equipment held and used by us are tested for recoverability whenever events or changes in circumstances indicate that the carrying amount of an asset or asset group may not be recoverable. For purposes of evaluating the recoverability of property and equipment, we compare the carrying value of the asset or asset group to the estimated, undiscounted future cash flows expected to be generated by the long-lived asset or asset group. If the future cash flows do not exceed the carrying value, the carrying value is compared to the fair value of the asset. If the carrying value exceeds the fair value, an impairment charge is recorded for the excess. We also assess the recoverability of our closed facilities actively marketed for sale. If a facility’s carrying value exceeds its fair value, less an estimated cost to sell, an impairment charge is recorded for the excess. Assets held for sale are not depreciated. Impairments are recorded as a component of Restructuring and tangible asset impairment charges in the Consolidated Statements of Comprehensive Income (Loss), as well as a reduction of the assets’ carrying value in the Consolidated Balance Sheets.
Vendor Consideration
We participate in various rebate and promotional incentives with our suppliers, primarily through purchase-based programs. Consideration earned under these incentives is recorded as a reduction of inventory cost, as the Company’s obligations under the programs are fulfilled primarily when products are purchased. Consideration is typically received in the form of invoice deductions, or less often in the form of cash payments. Changes in the estimated amount of incentives earned are treated as changes in estimates and are recognized in the period of change.
Self-Insurance Programs
We accrue estimated liability amounts for claims covering general liability, fleet liability, workers’ compensation and group medical insurance programs. The amounts in excess of certain levels are fully insured. We accrue our estimated liability for the self-insured medical insurance program. This includes an estimate for claims that are incurred but not reported, based on known claims and past claims history. We accrue an estimated liability for the general liability, fleet liability and workers’ compensation programs, that is based on an assessment of exposure related to claims that are known and incurred but not reported, as applicable. The inherent uncertainty of future loss projections could cause actual claims to differ from our estimates.
35
Table of Contents
Income Taxes
We account for income taxes under the asset and liability method, which requires the recognition of deferred tax assets and liabilities for the expected future tax consequences of events that have been included in the consolidated financial statements. Under this method, deferred tax assets and liabilities are determined based on the differences between the consolidated financial statements and tax basis of assets and liabilities using enacted tax rates in effect for the year in which the differences are expected to reverse. The effect of a change in tax rates on deferred tax assets and liabilities is recognized in income in the period that includes the enactment date. We record net deferred tax assets to the extent we believe these assets will more likely than not be realized.
An uncertain tax position is recognized when it is more likely than not that the position will be sustained upon examination, including resolutions of any related appeals or litigation processes, based on the technical merits. Uncertain tax positions are recorded at the largest amount that is more likely than not to be sustained. We adjust the amounts recorded for uncertain tax positions when our judgment changes as a result of the evaluation of new information not previously available. These differences are reflected as increases or decreases to income tax expense in the period in which they are determined.
Recent Accounting Pronouncements
In August 2014, the Financial Accounting Standards Board (“FASB”) issued Accounting Standards Update (“ASU”) No. 2014-15, Disclosure of Uncertainties About an Entity’s Ability to Continue as a Going Concern. This ASU provides guidance on determining when and how to disclose going-concern uncertainties in the financial statements. The new standard requires management to perform interim and annual assessments of an entity’s ability to continue as a going concern within one year of the date the financial statements are issued. An entity must provide certain disclosures if conditions or events raise substantial doubt about the entity’s ability to continue as a going concern. This guidance is effective for fiscal years—and interim periods within those fiscal years—beginning after December 15, 2016, with early adoption permitted. The Company is currently reviewing the provisions of the new standard.
In May 2014, the FASB issued ASU No. 2014-09 Revenue from Contracts with Customers, which will be introduced into the FASB’s Accounting Standards Codification as Topic 606. Topic 606 replaces the previous guidance on revenue recognition in Topic 605. The core principle of the new standard is for companies to recognize revenue to depict the transfer of goods or services to customers in amounts that reflect the consideration (that is, payment) to which the company expects to be entitled in exchange for those goods or services. The new standard also will result in enhanced disclosures about revenue, provide guidance for transactions that were not previously addressed comprehensively (for example, service revenue and contract modifications) and improve guidance for multiple-element arrangements. The standard will be effective for us in the first quarter of 2017, with early adoption not permitted. The new standard permits two implementation approaches, one requiring retrospective application of the new standard with restatement of prior years and one requiring prospective application of the new standard with disclosure of results under old standards. We are currently evaluating the impact of this ASU and have not yet selected an implementation approach.
In April 2014, the FASB issued ASU No. 2014-8, Presentation of Financial Statements (Topic 205) and Property, Plant, and Equipment (Topic 360): Reporting Discontinued Operations and Disclosures of Disposals of Components of an Entity. This update changes the criteria for reporting discontinued operations and modifies related disclosure requirements. Under the new guidance, a discontinued operation is defined as a disposal of a component or group of components that is disposed of or is classified as held for sale and “represents a strategic shift that has (or will have) a major effect on an entity’s operations and financial results.” The update states that a strategic shift could include a disposal of (i) a major geographical area of operations, (ii) a major line of business, (iii) or a major equity method investment. The new guidance also requires disclosure of the pre-tax income attributable to a disposal of a significant part of an organization that does not qualify for discontinued operations reporting. The amendments in the ASU are effective in the first quarter of 2015 for public organizations with calendar year ends, with early adoption permitted. Our adoption of this guidance in the first quarter of 2014 had no impact on our financial position, results of operations or cash flows.
In July 2013, the FASB issued ASU No. 2013-11, Income Taxes (Topic 740): Presentation of an Unrecognized Tax Benefit When a Net Operating Loss Carryforward, a Similar Tax Loss, or a Tax Credit Carryforward Exist. This update requires an entity to present an unrecognized tax benefit—or a portion of an unrecognized tax benefit—in the financial statements as a reduction to a deferred tax asset for a net operating loss (“NOL”) carryforward, a similar tax loss, or a tax credit carryforward except when 1) an NOL carryforward, a similar tax loss, or a tax credit carryforward is not available as of the reporting date under the governing tax law to settle taxes that would result from the disallowance of the tax position; and 2) the entity does not intend to use the deferred tax asset for this purpose (provided that the tax law permits a choice). If either of these conditions exists, an entity should present an unrecognized tax benefit in the financial statements as a liability and should not net the unrecognized tax benefit with a deferred tax asset. Additional recurring disclosures are not required, because this ASU does not affect the recognition, measurement or tabular disclosure of uncertain tax positions. This guidance is effective for fiscal years—and interim periods within those fiscal years—beginning after December 15, 2013. Our adoption of this guidance in the first quarter of 2014 had no impact on our financial position, results of operations or cash flows.
36
Table of Contents
Forward-Looking Statements
Some information in this report includes “forward-looking statements.” These statements are made under the safe harbor provisions of the Private Securities Litigation Reform Act of 1995, as amended. Forward-looking statements include information concerning our liquidity and our possible or assumed future results of operations, including descriptions of our business strategies. These statements often include words such as “believe,” “expect,” “project,” “anticipate,” “intend,” “plan,” “estimate,” “seek,” “will,” “may,” “would,” “should,” “could,” “forecasts” or similar expressions. The statements are based on assumptions that we have made, based on our experience in the industry as well as our perceptions of historical trends, current conditions, expected future developments, and other factors we think are appropriate. We believe these judgments are reasonable. However, you should understand that these statements are not guarantees of performance or results. Our actual results could differ materially from those expressed in the forward-looking statements. This is due to a variety of important factors—both positive and negative—including, without limitation, the risks and uncertainties described in Item 1A—Risk Factors in Part I of this Annual Report on Form 10-K.
Here are some important factors, among others, that could affect our actual results:
| • | Our ability to remain profitable during times of cost inflation, commodity volatility, and other factors |
| • | Industry competition and our ability to successfully compete |
| • | Our reliance on third-party suppliers, including the impact of any interruption of supplies or increases in product costs |
| • | Shortages of fuel and increases or volatility in fuel costs |
| • | Any declines in the consumption of food prepared away from home, including as a result of changes in the economy or other factors affecting consumer confidence |
| • | Costs and risks associated with labor relations and the availability of qualified labor |
| • | Any change in our relationships with GPOs |
| • | Our ability to increase sales to independent customers |
| • | Changes in industry pricing practices |
| • | Changes in competitors’ cost structures |
| • | Costs and risks associated with government laws and regulations, including environmental, health, safety, food safety, transportation, labor and employment, laws and regulations, and changes in existing laws or regulations |
| • | Technology disruptions and our ability to implement new technologies |
| • | Liability claims related to products we distribute |
| • | Our ability to maintain a good reputation |
| • | Costs and risks associated with litigation |
| • | Our ability to manage future expenses and liabilities associated with our retirement benefits |
| • | Our ability to successfully integrate future acquisitions |
| • | Our ability to achieve the benefits that we expect from our cost savings programs |
| • | Risks related to our indebtedness, including our substantial amount of debt, our ability to incur substantially more debt, and increases in interest rates |
| • | Our ability to consummate the Acquisition with Sysco |
| • | Other factors discussed in this report |
| • | Risks related to the impending Acquisition by Sysco could adversely affect our business, financial results and operations, including our relationships with customers, vendors and employees. |
37
Table of Contents
In light of these risks, uncertainties and assumptions, the forward-looking statements in this report might not prove to be accurate, and you should not place undue reliance on them. All forward-looking statements attributable to us—or people acting on our behalf—are expressly qualified in their entirety by the cautionary statements above. All of these statements speak only as of the date made, and we undertake no obligation to publicly update or revise any forward-looking statements, whether because of new information, future events or otherwise.
| Item 7A. | Quantitative and Qualitative Disclosures about Market Risk |
We are exposed to certain risks arising from both our business operations and overall economic conditions. We principally manage our exposures to a wide variety of business and operational risks through managing of our core business activities. We manage economic risks—including interest rate, liquidity, and credit risk—primarily by managing the amount, sources, and duration of our debt funding. While we have held derivative financial instruments in the past to assist in managing our exposure to variable interest rate terms on certain of our borrowings, we are not currently party to any derivative contracts.
Interest Rate Risk
Market risk is the possibility of loss from adverse changes in market rates and prices, such as interest rates and commodity prices. A substantial portion of our debt facilities bear interest at floating rates, based on London Inter Bank Offered Rate (“LIBOR”) or the prime rate. Accordingly, we will be exposed to fluctuations in interest rates. A 1% change in LIBOR and the prime rate would cause the interest expense on our $2.7 billion of floating rate debt facilities to change by approximately $27 million per year. This change does not consider the LIBOR floor of 1.0% on $2 billion in principal of our variable rate term loans.
Commodity Price Risk
We are also exposed to risk due to fluctuations in the price and availability of diesel fuel. Increases in the cost of diesel fuel can negatively affect consumer spending, raise the price we pay for product purchases, and increase the costs we incur to deliver products to our customers. To minimize fuel-related risks, we enter into forward purchase commitments for a portion of our projected diesel fuel requirements. As of December 27, 2014, we had diesel fuel forward purchase commitments totaling $177 million through December 2016. These locked in approximately 53% of our projected diesel fuel purchase needs for the contracted periods. A 10% change in diesel prices would cause our uncommitted diesel fuel costs through December 2016 to change by approximately $20 million.
38
Table of Contents
| Item 8. | Financial Statements And Supplementary Data |
INDEX TO CONSOLIDATED FINANCIAL STATEMENTS
| Page No. | ||||
| Audited Consolidated Financial Statements |
||||
| 40 | ||||
| Consolidated Balance Sheets as of December 27, 2014 and December 28, 2013 |
41 | |||
| 42 | ||||
| 43 | ||||
| 44 | ||||
| 45 | ||||
39
Table of Contents
REPORT OF INDEPENDENT REGISTERED PUBLIC ACCOUNTING FIRM
To the Board of Directors and Shareholder of
US Foods, Inc.
Rosemont, Illinois
We have audited the accompanying consolidated balance sheets of US Foods, Inc. and subsidiaries (the “Company”) as of December 27, 2014 and December 28, 2013, and the related consolidated statements of comprehensive income (loss), shareholder’s equity, and cash flows for each of the three fiscal years in the period ended December 27, 2014. These financial statements are the responsibility of the Company’s management. Our responsibility is to express an opinion on the financial statements based on our audits.
We conducted our audits in accordance with the standards of the Public Company Accounting Oversight Board (United States). Those standards require that we plan and perform the audit to obtain reasonable assurance about whether the financial statements are free of material misstatement. The Company is not required to have, nor were we engaged to perform, an audit of its internal control over financial reporting. Our audits included consideration of internal control over financial reporting as a basis for designing audit procedures that are appropriate in the circumstances, but not for the purpose of expressing an opinion on the effectiveness of the Company’s internal control over financial reporting. Accordingly, we express no such opinion. An audit also includes examining, on a test basis, evidence supporting the amounts and disclosures in the financial statements, assessing the accounting principles used and significant estimates made by management, as well as evaluating the overall financial statement presentation. We believe that our audits provide a reasonable basis for our opinion.
In our opinion, such consolidated financial statements present fairly, in all material respects, the financial position of US Foods, Inc. and subsidiaries as of December 27, 2014 and December 28, 2013, and the results of their operations and their cash flows for each of the three fiscal years in the period ended December 27, 2014, in conformity with accounting principles generally accepted in the United States of America.
/s/ DELOITTE & TOUCHE LLP
Chicago, Illinois
March 20, 2015
40
Table of Contents
US FOODS, INC.
AS OF DECEMBER 27, 2014 AND DECEMBER 28, 2013
(in thousands, except for share data)
| December 27, | December 28, | |||||||
| 2014 | 2013 | |||||||
| ASSETS |
||||||||
| CURRENT ASSETS: |
||||||||
| Cash and cash equivalents |
$ | 343,659 | $ | 179,744 | ||||
| Accounts receivable, less allowances of $24,989 and $25,151 |
1,252,738 | 1,225,719 | ||||||
| Vendor receivables, less allowances of $2,802 and $2,661 |
97,668 | 97,361 | ||||||
| Inventories — net |
1,050,898 | 1,161,558 | ||||||
| Prepaid expenses |
67,791 | 75,604 | ||||||
| Deferred taxes |
— | 13,557 | ||||||
| Assets held for sale |
5,360 | 14,554 | ||||||
| Other current assets |
11,799 | 6,644 | ||||||
|
|
|
|
|
|||||
| Total current assets |
2,829,913 | 2,774,741 | ||||||
| PROPERTY AND EQUIPMENT — Net |
1,726,583 | 1,748,495 | ||||||
| GOODWILL |
3,835,477 | 3,835,477 | ||||||
| OTHER INTANGIBLES — Net |
602,827 | 753,840 | ||||||
| DEFERRED FINANCING COSTS |
26,144 | 39,282 | ||||||
| OTHER ASSETS |
36,170 | 33,742 | ||||||
|
|
|
|
|
|||||
| TOTAL ASSETS |
$ | 9,057,114 | $ | 9,185,577 | ||||
|
|
|
|
|
|||||
| LIABILITIES AND SHAREHOLDER’S EQUITY |
||||||||
| CURRENT LIABILITIES: |
||||||||
| Bank checks outstanding |
$ | 178,912 | $ | 185,369 | ||||
| Accounts payable |
1,159,160 | 1,181,452 | ||||||
| Accrued expenses and other current liabilities |
435,638 | 423,635 | ||||||
| Current portion of long-term debt |
51,877 | 35,225 | ||||||
|
|
|
|
|
|||||
| Total current liabilities |
1,825,587 | 1,825,681 | ||||||
| LONG-TERM DEBT |
4,696,273 | 4,735,248 | ||||||
| DEFERRED TAX LIABILITIES |
420,319 | 408,153 | ||||||
| OTHER LONG-TERM LIABILITIES |
450,219 | 334,808 | ||||||
|
|
|
|
|
|||||
| Total liabilities |
7,392,398 | 7,303,890 | ||||||
|
|
|
|
|
|||||
| COMMITMENTS AND CONTINGENCIES (See Note 21) |
||||||||
| SHAREHOLDER’S EQUITY: |
||||||||
| Common stock, $1.00 par value — authorized, issued, and outstanding, 1,000 shares |
1 | 1 | ||||||
| Additional paid-in capital |
2,336,528 | 2,325,223 | ||||||
| Accumulated deficit |
(513,772 | ) | (440,858 | ) | ||||
| Accumulated other comprehensive loss |
(158,041 | ) | (2,679 | ) | ||||
|
|
|
|
|
|||||
| Total shareholder’s equity |
1,664,716 | 1,881,687 | ||||||
|
|
|
|
|
|||||
| TOTAL LIABILITIES AND SHAREHOLDER’S EQUITY |
$ | 9,057,114 | $ | 9,185,577 | ||||
|
|
|
|
|
|||||
See Notes to Consolidated Financial Statements.
41
Table of Contents
US FOODS, INC.
CONSOLIDATED STATEMENTS OF COMPREHENSIVE INCOME (LOSS)
FOR THE FISCAL YEARS ENDED DECEMBER 27, 2014, DECEMBER 28, 2013 AND DECEMBER 29, 2012
(in thousands)
| 2014 | 2013 | 2012 | ||||||||||
| NET SALES |
$ | 23,019,801 | $ | 22,297,178 | $ | 21,664,921 | ||||||
| COST OF GOODS SOLD |
19,222,092 | 18,474,039 | 17,971,949 | |||||||||
|
|
|
|
|
|
|
|||||||
| Gross profit |
3,797,709 | 3,823,139 | 3,692,972 | |||||||||
| OPERATING EXPENSES: |
||||||||||||
| Distribution, selling and administrative costs |
3,545,453 | 3,494,254 | 3,349,539 | |||||||||
| Restructuring and tangible asset impairment charges |
— | 8,386 | 8,923 | |||||||||
|
|
|
|
|
|
|
|||||||
| Total operating expenses |
3,545,453 | 3,502,640 | 3,358,462 | |||||||||
|
|
|
|
|
|
|
|||||||
| OPERATING INCOME |
252,256 | 320,499 | 334,510 | |||||||||
| INTEREST EXPENSE—Net |
289,202 | 306,087 | 311,812 | |||||||||
| LOSS ON EXTINGUISHMENT OF DEBT |
— | 41,796 | 31,423 | |||||||||
|
|
|
|
|
|
|
|||||||
| Loss before income taxes |
(36,946 | ) | (27,384 | ) | (8,725 | ) | ||||||
| INCOME TAX PROVISION |
35,968 | 29,822 | 42,448 | |||||||||
|
|
|
|
|
|
|
|||||||
| NET LOSS |
(72,914 | ) | (57,206 | ) | (51,173 | ) | ||||||
| OTHER COMPREHENSIVE INCOME (LOSS): |
||||||||||||
| Changes in retirement benefit obligations, net of income tax |
(155,362 | ) | 122,963 | (14,160 | ) | |||||||
| Changes in interest rate swap derivative, net of income tax |
— | 542 | 17,570 | |||||||||
|
|
|
|
|
|
|
|||||||
| COMPREHENSIVE INCOME (LOSS) |
$ | (228,276 | ) | $ | 66,299 | $ | (47,763 | ) | ||||
|
|
|
|
|
|
|
|||||||
See Notes to Consolidated Financial Statements.
42
Table of Contents
US FOODS, INC.
CONSOLIDATED STATEMENTS OF SHAREHOLDER’S EQUITY
FOR THE FISCAL YEARS ENDED DECEMBER 27, 2014, DECEMBER 28, 2013 AND DECEMBER 29, 2012
(in thousands, except for share data)
| Accumulated Other Comprehensive Income (Loss) |
||||||||||||||||||||||||||||||||
| Number of Common Shares |
Common Shares at Par Value |
Additional Paid-In Capital |
Accumulated Deficit |
Retirement Benefit Obligation |
Interest Rate Swap Derivative |
Total | Total Shareholder’s Equity |
|||||||||||||||||||||||||
| BALANCE—December 31, 2011 |
1,000 | $ | 1 | $ | 2,323,052 | $ | (332,479 | ) | $ | (111,482 | ) | $ | (18,112 | ) | $ | (129,594 | ) | $ | 1,860,980 | |||||||||||||
| Proceeds from parent company common stock sales |
— | — | 761 | — | — | — | — | 761 | ||||||||||||||||||||||||
| Parent company common stock repurchased |
— | — | (3,734 | ) | — | — | — | — | (3,734 | ) | ||||||||||||||||||||||
| Share-based compensation expense |
— | — | 4,312 | — | — | — | — | 4,312 | ||||||||||||||||||||||||
| Changes in retirement benefit obligations, net of income tax |
— | — | — | — | (14,160 | ) | — | (14,160 | ) | (14,160 | ) | |||||||||||||||||||||
| Changes in interest rate swap derivative, net of income tax |
— | — | — | — | — | 17,570 | 17,570 | 17,570 | ||||||||||||||||||||||||
| Net loss |
— | — | — | (51,173 | ) | — | — | — | (51,173 | ) | ||||||||||||||||||||||
|
|
|
|
|
|
|
|
|
|
|
|
|
|
|
|
|
|||||||||||||||||
| BALANCE—December 29, 2012 |
1,000 | 1 | 2,324,391 | (383,652 | ) | (125,642 | ) | (542 | ) | (126,184 | ) | 1,814,556 | ||||||||||||||||||||
| Proceeds from parent company common stock sales |
— | — | 1,850 | — | — | — | — | 1,850 | ||||||||||||||||||||||||
| Parent company common stock repurchased |
— | — | (9,424 | ) | — | — | — | — | (9,424 | ) | ||||||||||||||||||||||
| Share-based compensation expense |
— | — | 8,406 | — | — | — | — | 8,406 | ||||||||||||||||||||||||
| Changes in retirement benefit obligations, net of income tax |
— | — | — | — | 122,963 | — | 122,963 | 122,963 | ||||||||||||||||||||||||
| Changes in interest rate swap derivative, net of income tax |
— | — | — | — | — | 542 | 542 | 542 | ||||||||||||||||||||||||
| Net loss |
— | — | — | (57,206 | ) | — | — | — | (57,206 | ) | ||||||||||||||||||||||
|
|
|
|
|
|
|
|
|
|
|
|
|
|
|
|
|
|||||||||||||||||
| BALANCE—December 28, 2013 |
1,000 | 1 | 2,325,223 | (440,858 | ) | (2,679 | ) | — | (2,679 | ) | 1,881,687 | |||||||||||||||||||||
| Proceeds from parent company common stock sales |
— | — | 197 | — | — | — | — | 197 | ||||||||||||||||||||||||
| Parent company common stock repurchased |
— | — | (628 | ) | — | — | — | — | (628 | ) | ||||||||||||||||||||||
| Share-based compensation expense |
— | — | 11,736 | — | — | — | — | 11,736 | ||||||||||||||||||||||||
| Changes in retirement benefit obligations, net of income tax |
— | — | — | — | (155,362 | ) | — | (155,362 | ) | (155,362 | ) | |||||||||||||||||||||
| Net loss |
— | — | — | (72,914 | ) | — | — | — | (72,914 | ) | ||||||||||||||||||||||
|
|
|
|
|
|
|
|
|
|
|
|
|
|
|
|
|
|||||||||||||||||
| BALANCE—December 27, 2014 |
1,000 | $ | 1 | $ | 2,336,528 | $ | (513,772 | ) | $ | (158,041 | ) | $ | — | $ | (158,041 | ) | $ | 1,664,716 | ||||||||||||||
|
|
|
|
|
|
|
|
|
|
|
|
|
|
|
|
|
|||||||||||||||||
See Notes to Consolidated Financial Statements.
43
Table of Contents
US FOODS, INC.
CONSOLIDATED STATEMENTS OF CASH FLOWS
FOR THE FISCAL YEARS ENDED DECEMBER 27, 2014, DECEMBER 28, 2013 AND DECEMBER 29, 2012
(in thousands)
| 2014 | 2013 | 2012 | ||||||||||
| CASH FLOWS FROM OPERATING ACTIVITIES: |
||||||||||||
| Net loss |
$ | (72,914 | ) | $ | (57,206 | ) | $ | (51,173 | ) | |||
| Adjustments to reconcile net loss to net cash provided by operating activities: |
||||||||||||
| Depreciation and amortization |
411,549 | 388,188 | 355,892 | |||||||||
| Gain on disposal of property and equipment, net |
(7,688 | ) | (1,909 | ) | (1,493 | ) | ||||||
| Loss on extinguishment of debt |
— | 41,796 | 31,423 | |||||||||
| Tangible asset impairment charges |
1,580 | 1,860 | 7,530 | |||||||||
| Amortization of deferred financing costs |
18,014 | 18,071 | 18,052 | |||||||||
| Amortization of Senior Notes original issue premium |
(3,330 | ) | (3,330 | ) | — | |||||||
| Deferred tax provision |
35,803 | 29,603 | 42,142 | |||||||||
| Share-based compensation expense |
11,736 | 8,406 | 4,312 | |||||||||
| Provision for doubtful accounts |
18,559 | 19,481 | 10,701 | |||||||||
| Changes in operating assets and liabilities, net of acquisitions of businesses: |
||||||||||||
| Increase in receivables |
(47,347 | ) | (26,581 | ) | (56,639 | ) | ||||||
| (Increase) decrease in inventories |
105,256 | (65,427 | ) | (214,998 | ) | |||||||
| (Increase) decrease in prepaid expenses and other assets |
1,016 | (16,486 | ) | (758 | ) | |||||||
| Increase (decrease) in accounts payable and bank checks outstanding |
(35,649 | ) | (32,411 | ) | 198,227 | |||||||
| Increase (decrease) in accrued expenses and other liabilities |
(34,395 | ) | 18,197 | (27,299 | ) | |||||||
|
|
|
|
|
|
|
|||||||
| Net cash provided by operating activities |
402,190 | 322,252 | 315,919 | |||||||||
|
|
|
|
|
|
|
|||||||
| CASH FLOWS FROM INVESTING ACTIVITIES: |
||||||||||||
| Acquisition of businesses, net |
— | (11,369 | ) | (106,041 | ) | |||||||
| Proceeds from sales of property and equipment |
25,054 | 14,608 | 19,685 | |||||||||
| Purchases of property and equipment |
(147,094 | ) | (191,131 | ) | (293,456 | ) | ||||||
| Insurance recoveries related to property and equipment |
4,000 | — | — | |||||||||
|
|
|
|
|
|
|
|||||||
| Net cash used in investing activities |
(118,040 | ) | (187,892 | ) | (379,812 | ) | ||||||
|
|
|
|
|
|
|
|||||||
| CASH FLOWS FROM FINANCING ACTIVITIES: |
||||||||||||
| Proceeds from debt refinancing |
— | 854,485 | 1,269,625 | |||||||||
| Proceeds from other borrowings |
898,450 | 1,644,000 | 2,031,000 | |||||||||
| Payment for debt financing costs and fees |
(421 | ) | (29,376 | ) | (35,088 | ) | ||||||
| Principal payments on debt and capital leases |
(1,016,033 | ) | (2,278,311 | ) | (2,983,567 | ) | ||||||
| Repurchase of senior subordinated notes |
— | (375,144 | ) | (175,338 | ) | |||||||
| Contingent consideration paid for acquisitions of businesses |
(1,800 | ) | (6,159 | ) | — | |||||||
| Proceeds from parent company common stock sales |
197 | 1,850 | 761 | |||||||||
| Parent company common stock repurchased |
(628 | ) | (8,418 | ) | (3,734 | ) | ||||||
|
|
|
|
|
|
|
|||||||
| Net cash provided by (used in) financing activities |
(120,235 | ) | (197,073 | ) | 103,659 | |||||||
|
|
|
|
|
|
|
|||||||
| NET INCREASE (DECREASE) IN CASH AND CASH EQUIVALENTS |
163,915 | (62,713 | ) | 39,766 | ||||||||
| CASH AND CASH EQUIVALENTS—Beginning of year |
179,744 | 242,457 | 202,691 | |||||||||
|
|
|
|
|
|
|
|||||||
| CASH AND CASH EQUIVALENTS—End of year |
$ | 343,659 | $ | 179,744 | $ | 242,457 | ||||||
|
|
|
|
|
|
|
|||||||
| SUPPLEMENTAL DISCLOSURES OF CASH FLOW INFORMATION: |
||||||||||||
| Cash paid during the year for: |
||||||||||||
| Interest (net of amounts capitalized) |
$ | 278,474 | $ | 298,915 | $ | 286,420 | ||||||
| Income taxes paid (refunded)—net |
(30 | ) | 209 | 369 | ||||||||
| Property and equipment purchases included in accounts payable |
26,620 | 19,719 | 25,137 | |||||||||
| Capital lease additions |
96,756 | 100,804 | 21,810 | |||||||||
| Contingent consideration payable for acquisitions of businesses |
— | 1,800 | 5,500 | |||||||||
| Payable for repurchase of parent company common stock |
— | 1,006 | — | |||||||||
See Notes to Consolidated Financial Statements.
44
Table of Contents
US FOODS, INC.
NOTES TO CONSOLIDATED FINANCIAL STATEMENTS
| 1. | OVERVIEW AND BASIS OF PRESENTATION |
US Foods, Inc. and its consolidated subsidiaries is referred to here as “we,” “our,” “us,” “the Company,” or “US Foods.” We are a 100% owned subsidiary of USF Holding Corp. (“USF Holding”).
Ownership —On July 3, 2007 (the “Closing Date”), USF Holding, through a wholly owned subsidiary, acquired all of our predecessor company’s common stock and certain related assets from Koninklijke Ahold N.V. (“Ahold”) for approximately $7.2 billion. Through a series of related transactions, USF Holding became our direct parent company. USF Holding is a corporation formed and controlled by investment funds associated with or designated by Clayton, Dubilier & Rice, Inc. (“CD&R”), and Kohlberg Kravis Roberts & Co. (“KKR”), (collectively the “Sponsors”).
Proposed Acquisition by Sysco —On December 8, 2013, our parent company USF Holding, entered into an Agreement and Plan of Merger (the “Merger Agreement”) with Sysco Corporation, a Delaware corporation (“Sysco”); Scorpion Corporation I, Inc., a Delaware corporation and a wholly owned subsidiary of Sysco (“Merger Sub One”); and Scorpion Company II, LLC, a Delaware limited liability company and a wholly owned subsidiary of Sysco, through which Sysco will acquire USF Holding (the “Acquisition”) on the terms and subject to the conditions set forth in the Merger Agreement. The aggregate purchase price will consist of $500 million in cash and approximately $3 billion in Sysco’s common stock, subject to possible downward adjustment pursuant to the Merger Agreement. The closing is subject to customary conditions, including the expiration or termination of the applicable waiting period under the Hart-Scott-Rodino Antitrust Improvements Act of 1976, as amended (the “HSR Act”). On February 18, 2014, US Foods and Sysco received a request for additional information and documentary materials from the U.S. Federal Trade Commission (the “FTC”) in connection with the Acquisition and the companies continue to work closely and cooperatively with the FTC as it conducts its review of the proposed merger. If the Merger Agreement is terminated because the required antitrust approvals cannot be obtained, or if the Acquisition does not close by a date as specified in the Merger Agreement, in certain circumstances Sysco will be required to pay our parent company, USF Holding, a termination fee of $300 million.
On February 2, 2015, USF Holding, US Foods and certain of its subsidiaries and Sysco entered into an asset purchase agreement (the “Asset Purchase Agreement”) with Performance Food Group, Inc. (“PFG”), through which PFG agreed to purchase, subject to the terms and conditions of the Purchase Agreement, eleven US Foods distribution centers located in the Cleveland, Ohio; Corona, California; Denver, Colorado; Kansas City, Kansas; Las Vegas, Nevada; Minneapolis, Minnesota; Phoenix, Arizona (including the Phoenix Stock Yards business); Salt Lake City, Utah; San Diego, California (including the San Diego Stock Yards business); San Francisco, California and Seattle, Washington markets, and related assets and liabilities, in connection with (and subject to) the closing of the Acquisition. The Asset Purchase Agreement contains certain termination rights, including the right for PFG to terminate if the transaction has not closed by the earlier of September 9, 2015 and the Merger Termination Date (subject to PFG’s right to extend under certain circumstances), and automatically terminates in the event the Merger Agreement terminates. The Asset Purchase Agreement provides that, upon termination under certain circumstances, PFG will be entitled to receive an aggregate termination fee of $25 million if termination occurs after May 2, 2015 and on or prior to July 6, 2015 and $50 million after July 6, 2015, with each of Sysco and US Foods responsible for one half of such aggregate termination fee.
On February 19, 2015, the FTC voted by a margin of 3-2 to seek to block the Merger by filing a federal district court action in the District of Columbia for a preliminary injunction to prevent the parties from closing the Acquisition until after a full trial is conducted by a FTC Administrative Law Judge in a separate administrative action that was filed concurrently by the FTC. Sysco issued a press release, announcing that it will contest the FTC’s attempt to block the proposed Acquisition. The preliminary injunctive hearing in federal court is scheduled to commence on May 5, 2015 and conclude no later than May 13, 2015. The FTC administrative trial is scheduled to commence on July 21, 2015.
On March 6, 2015, Sysco notified USF Holding of its decision to extend the termination date of the Merger Agreement for sixty days, from the then current termination date of March 8, 2015, to May 7, 2015. Provided all of the conditions to closing, other than termination of the waiting period of the HSR Act, have been satisfied, either party may extend the termination date in 60 day intervals from May 7, 2015 to September 8, 2015.
Business Description—US Foods markets and distributes fresh, frozen and dry food and non-food products to foodservice customers throughout the United States. These include independently owned single and multi-location restaurants, regional concepts, national chains, hospitals, nursing homes, hotels and motels, country clubs, fitness centers, government and military organizations, colleges and universities, and retail locations.
Basis of Presentation—The Company operates on a 52-53 week fiscal year, with all periods ending on a Saturday. When a 53-week fiscal year occurs, we report the additional week in the fourth quarter. The fiscal years ended December 27, 2014, December 28, 2013 and December 29, 2012, are also referred to herein as fiscal years 2014, 2013 and 2012, respectively. The consolidated financial statements representing the 52-week fiscal year 2014 are for the period of December 29, 2013 through December 27, 2014. The consolidated financial statements representing the 52-week fiscal year 2013 are for the period of December 30, 2012 through December 28, 2013. The consolidated financial statements representing the 52-week fiscal year 2012 are for the period of January 1, 2012 through December 29, 2012.
45
Table of Contents
Public Filer Status— During the second quarter of 2013, the Company completed the registration of $1,350 million aggregate principal amount of 8.5% Senior Notes due 2019 (“Senior Notes”) in exchange offers for a like principal amount of the Company’s outstanding 8.5% Senior Notes due 2019 and became subject to rules and regulations of the SEC, including periodic and current reporting requirements under the Securities Exchange Act of 1934, as amended, and the rules and regulations promulgated thereunder. The Company did not receive any proceeds from the registration of these exchange offers. Presently, the Company files periodic reports as a voluntary filer pursuant to contractual obligations in the indenture governing the Senior Notes.
| 2. | SUMMARY OF SIGNIFICANT ACCOUNTING POLICIES |
Principles of Consolidation—Consolidated financial statements include the accounts of US Foods and its 100% owned subsidiaries. All intercompany transactions have been eliminated in consolidation.
Use of Estimates—Consolidated financial statements are prepared in accordance with accounting principles generally accepted in the United States of America (“GAAP”). This requires management to make estimates and assumptions that affect the reported amounts of assets and liabilities and disclosure of contingent assets and liabilities at the date of the financial statements and the reported amounts of revenues and expenses during the reporting period. Actual results could differ from these estimates. The most critical estimates used in the preparation of the Company’s consolidated financial statements pertain to the valuation of goodwill and other intangible assets, property and equipment, accounts receivable-related allowance, vendor consideration, self-insurance programs, and income taxes.
Cash and Cash Equivalents—The Company considers all highly liquid investments purchased with a maturity of three or fewer months to be cash equivalents.
Accounts Receivable—Accounts receivable primarily represent amounts due from customers in the ordinary course of business and are recorded at the invoiced amount and do not bear interest. Receivables are presented net of the allowance for doubtful accounts in the accompanying Consolidated Balance Sheets. The Company evaluates the collectability of its accounts receivable and determines the appropriate reserve for doubtful accounts based on a combination of factors. When we are aware of a customer’s inability to meet its financial obligation, a specific allowance for doubtful accounts is recorded, reducing the receivable to the net amount we reasonably expect to collect. In addition, allowances are recorded for all other receivables based on analyzing historic collection trends, write-offs and the aging of receivables. The Company uses specific criteria to determine uncollectible receivables to be written off, including bankruptcy, accounts referred to outside parties for collection, and accounts past due over specified periods. If the financial condition of the Company’s customers were to deteriorate, additional allowances may be required.
Vendor Consideration and Receivables —The Company participates in various rebate and promotional incentives with its suppliers, primarily through purchase-based programs. Consideration earned under these incentives is recorded as a reduction of inventory cost, as the Company’s obligations under the programs are fulfilled primarily when products are purchased. Consideration is typically received in the form of invoice deductions, or less often in the form of cash payments. Changes in the estimated amount of incentives earned are treated as changes in estimates and are recognized in the period of change.
Vendor consideration is typically deducted from invoices or collected in cash within 30 days of being earned, if not sooner. Vendor receivables primarily represent the uncollected balance of the vendor consideration. Due to the process of primarily collecting the consideration by deducting it from the amounts due to the vendor, the Company does not experience significant collectability issues. The Company evaluates the collectability of its vendor receivables based on specific vendor information and vendor collection history.
Inventories —The Company’s inventories—consisting mainly of food and other foodservice-related products—are considered finished goods. Inventory costs include the purchase price of the product and freight charges to deliver it to the Company’s warehouses, and are net of certain cash or non-cash consideration received from vendors (see “Vendor Consideration and Receivables”). The Company assesses the need for valuation allowances for slow-moving, excess and obsolete inventories by estimating the net recoverable value of such goods based upon inventory category, inventory age, specifically identified items and overall economic conditions.
The Company records inventories at the lower of cost or market using the last-in, first-out (“LIFO”) method. The base year values of beginning and ending inventories are determined using the inventory price index computation method. This “links” current costs to original costs in the base year when the Company adopted LIFO. During 2014, inventory quantities were reduced resulting in the liquidation of certain quantities carried at lower costs in prior years. As a result of this LIFO liquidation, cost of sales decreased $7 million in 2014. There were no LIFO inventory liquidations in 2013 and 2012.
46
Table of Contents
At December 27, 2014 and December 28, 2013, the LIFO balance sheet reserves were $208 million and $148 million, respectively. As a result of net changes in LIFO reserves, cost of goods sold increased $60 million, $12 million and $13 million for fiscal years 2014, 2013 and 2012, respectively. For 2014, the $60 million increase in cost of goods sold due to the 2014 change in LIFO reserves is net of the $7 million decrease in cost of goods sold resulting from the LIFO liquidation.
Property and Equipment—Property and equipment are stated at cost. Depreciation of property and equipment is calculated using the straight-line method over the estimated useful lives of the assets, which range from three to 40 years. Property and equipment under capital leases and leasehold improvements are amortized on a straight-line basis over the shorter of the remaining terms of the leases or the estimated useful lives of the assets.
Routine maintenance and repairs are charged to expense as incurred. Applicable interest charges incurred during the construction of new facilities or development of software for internal use are capitalized as one of the elements of cost and are amortized over the useful life of the respective assets.
Property and equipment held and used by the Company are tested for recoverability whenever events or changes in circumstances indicate that the carrying amount of an asset or asset group may not be recoverable. For purposes of evaluating the recoverability of property and equipment, the Company compares the carrying value of the asset or asset group to the estimated, undiscounted future cash flows expected to be generated by the long-lived asset or asset group. If the future cash flows included in a long-lived asset recoverability test do not exceed the carrying value, the carrying value is compared to the fair value of such asset. If the carrying value exceeds the fair value, an impairment charge is recorded for the excess.
The Company also assesses the recoverability of its closed facilities actively marketed for sale. If a facility’s carrying value exceeds its fair value, less an estimated cost to sell, an impairment charge is recorded for the excess. Assets held for sale are not depreciated.
Impairments are recorded as a component of Restructuring and tangible asset impairment charges in the Consolidated Statements of Comprehensive Income (Loss), as well as in a reduction of the assets’ carrying value in the Consolidated Balance Sheets. See Note 13 – Restructuring and Tangible Asset Impairment Charges for a discussion of our long-lived asset impairment charges.
Goodwill and Other Intangible Assets—Goodwill and Other intangible assets include the cost of the acquired business in excess of the fair value of the net tangible assets recorded in connection with acquisitions. Other intangible assets include customer relationships, the brand names comprising our portfolio of exclusive brands, and trademarks. As required, we assess Goodwill and Other intangible assets with indefinite lives for impairment annually, or more frequently if events occur that indicate an asset may be impaired. For goodwill and indefinite-lived intangible assets, our policy is to assess for impairment at the beginning of each fiscal third quarter. For other intangible assets with finite lives, we assess for impairment only if events occur that indicate that the carrying amount of an asset may not be recoverable. All goodwill is assigned to the consolidated Company as the reporting unit.
Self-Insurance Programs—The Company accrues estimated liability amounts for claims covering general liability, fleet liability, workers’ compensation, and group medical insurance programs. The amounts in excess of certain levels are fully insured. The Company accrues its estimated liability for the self-insured medical insurance program, including an estimate for incurred but not reported claims, based on known claims and past claims history. The Company accrues an estimated liability for the general liability, fleet liability and workers’ compensation programs. This is based on an assessment of exposure related to known claims and incurred but not reported claims, as applicable. The inherent uncertainty of future loss projections could cause actual claims to differ from our estimates. These accruals are included in Accrued expenses and Other long-term liabilities in the Consolidated Balance Sheets.
Share-Based Compensation—Certain employees participate in the 2007 Stock Incentive Plan for Key Employees of USF Holding and its Affiliates, as amended (“Stock Incentive Plan”), which allows purchases of shares of USF Holding common stock, grants of restricted stock and restricted stock units of USF Holding, and grants of options exercisable in USF Holding common stock. The Company measures compensation expense for stock-based option awards at fair value at the date of grant, and it recognizes compensation expense over the service period for stock-based awards expected to vest. USF Holding contributes shares to the Company for employee purchases and upon exercise of options or grants of restricted stock and restricted stock units.
Business Acquisitions—The Company accounts for business acquisitions under the acquisition method, in which assets acquired and liabilities assumed are recorded at fair value as of the date of acquisition. The operating results of the acquired companies are included in the Company’s consolidated financial statements from the date of acquisition.
Revenue Recognition — The Company recognizes revenue from the sale of product when title and risk of loss passes and the customer accepts the goods, which generally occurs at delivery. The Company grants certain customers sales incentives —such as rebates or discounts—and treats these as a reduction of sales at the time the sale is recognized. Sales taxes invoiced to customers and remitted to governmental authorities are excluded from net sales.
47
Table of Contents
Cost of Goods Sold — Cost of goods sold includes amounts paid to manufacturers for products sold—net of vendor consideration—plus the cost of transportation necessary to bring the products to the Company’s distribution facilities. Cost of goods sold excludes depreciation and amortization —as the Company acquires its inventories generally in a complete and salable state— and excludes warehousing related costs which are presented in Distribution, selling and administrative costs. The amounts presented for Cost of goods sold may not be comparable to similar measures disclosed by other companies because not all companies calculate Cost of goods sold in the same manner. See Inventories section above for discussion of LIFO impact on Cost of goods sold.
Shipping and Handling Costs—Shipping and handling costs—which include costs related to the selection of products and their delivery to customers—are recorded as a component of Distribution, selling and administrative costs. Shipping and handling costs were $1.5 billion for each of the 2014, 2013 and 2012 fiscal years.
Income Taxes—The Company accounts for income taxes under the asset and liability method. This requires the recognition of deferred tax assets and liabilities for the expected future tax consequences of events that have been included in the consolidated financial statements. Under this method, deferred tax assets and liabilities are determined based on the differences between the consolidated financial statements and tax basis of assets and liabilities, using enacted tax rates in effect for the year in which the differences are expected to reverse. The effect of a change in tax rates on deferred tax assets and liabilities is recognized in income during the period that includes the enactment date. Net deferred tax assets are recorded to the extent the Company believes these assets will more likely than not be realized.
An uncertain tax position is recognized when it is more likely than not that the position will be sustained upon examination, including resolutions of any related appeals or litigation processes, based on the technical merits. Uncertain tax positions are recorded at the largest amount that is more likely than not to be sustained. The Company adjusts the amounts recorded for uncertain tax positions when its judgment changes, as a result of evaluating new information not previously available. These differences are reflected as increases or decreases to income tax expense in the period in which they are determined.
Variable Interest Entity —In April 2014, the Company entered into a sublease and subsequent purchase of a distribution facility. Under the agreement, the facility will be purchased in May 2018, commensurate with the sublease termination date. The distribution facility is the only asset owned by an investment trust, the landlord to the original lease. The Company has determined the trust is a variable interest entity (“VIE”) for which it is the primary beneficiary.
Despite ongoing efforts, the Company was unable to obtain the information necessary to include the accounts and activities of the trust in its consolidated financial statements. As such, the Company has opted to invoke the scope exception available under VIE accounting guidance and will not consolidate the VIE in its financial statements. Since the Company will not be able to consolidate the trust under VIE guidance, applicable lease guidance has been applied to the transaction itself. The Company has concluded that the sublease and purchase agreements, together, qualify for capital lease treatment. Accordingly, the Company recorded a capital asset and related lease and purchase obligation totaling $27 million. This amount approximates the net present value of the purchase price and sublease commitment. In addition, the Company is depreciating the asset balance over its estimated useful life and reduces the capital lease and purchase obligation as payments are made.
Derivative Financial Instruments—The Company has used interest rate swap agreements in the past to manage its exposure to interest rate movements on its variable-rate term loan obligation. It is not currently party to any interest rate swap agreements.
In the normal course of business, the Company enters into forward purchase agreements to procure fuel, electricity and product commodities related to its business. These agreements often meet the definition of a derivative. However, in these cases, the Company has elected to apply the normal purchase and sale exemption available under derivatives accounting literature, and these agreements are not recorded at fair value.
Concentration Risks—Financial instruments that subject the Company to concentrations of credit risk consist primarily of cash equivalents and accounts receivable. The Company’s cash equivalents are invested primarily in money market funds at major financial institutions. Credit risk related to accounts receivable is dispersed across a larger number of customers located throughout the United States. The Company attempts to reduce credit risk through initial and ongoing credit evaluations of its customers’ financial condition. There were no receivables from any one customer representing more than 5% of our consolidated gross accounts receivable at December 27, 2014 and December 28, 2013.
48
Table of Contents
| 3. | RECENT ACCOUNTING PRONOUNCEMENTS |
In August 2014, the Financial Accounting Standards Board (“FASB”) issued Accounting Standards Update (“ASU”) No. 2014-15, Disclosure of Uncertainties About an Entity’s Ability to Continue as a Going Concern. This ASU provides guidance on determining when and how to disclose going-concern uncertainties in the financial statements. The new standard requires management to perform interim and annual assessments of an entity’s ability to continue as a going concern within one year of the date the financial statements are issued. An entity must provide certain disclosures if conditions or events raise substantial doubt about the entity’s ability to continue as a going concern. This guidance is effective for fiscal years—and interim periods within those fiscal years—beginning after December 15, 2016, with early adoption permitted. The Company is currently reviewing the provisions of the new standard.
In May 2014, the FASB issued ASU No. 2014-09 Revenue from Contracts with Customers, which will be introduced into the FASB’s Accounting Standards Codification as Topic 606. Topic 606 replaces Topic 605, the previous revenue recognition guidance. The new standard core principle is for companies to recognize revenue to depict the transfer of goods or services to customers in amounts that reflect the consideration (that is, payment) to which the company expects to be entitled in exchange for those goods or services. The new standard also will result in enhanced disclosures about revenue, provide guidance for transactions that were not previously addressed comprehensively (for example, service revenue and contract modifications) and improve guidance for multiple-element arrangements. The new standard will be effective for USF in the first quarter of 2017, with early adoption not permitted. The new standard permits two implementation approaches, one requiring retrospective application of the new standard with restatement of prior years, and one requiring prospective application of the new standard with disclosure of results under old standards. The Company is currently evaluating the impact of this ASU and has not yet selected an implementation approach.
In April 2014, the FASB issued ASU No. 2014-8, Presentation of Financial Statements (Topic 205) and Property, Plant, and Equipment (Topic 360): Reporting Discontinued Operations and Disclosures of Disposals of Components of an Entity. This update changes the criteria for reporting discontinued operations and modifies related disclosure requirements. Under the new guidance, a discontinued operation is defined as a disposal of a component or group of components that is disposed of or is classified as held for sale and “represents a strategic shift that has (or will have) a major effect on an entity’s operations and financial results.” The update states that a strategic shift could include a disposal of 1) a major geographical area of operations, 2) a major line of business, or 3) a major equity method investment. The new guidance also requires disclosure of the pre-tax income attributable to a disposal of a significant part of an organization that does not qualify for discontinued operations reporting. The amendments in the ASU are effective in the first quarter of 2015 for public organizations with calendar year ends, with early adoption permitted. The Company’s adoption of this guidance in the first quarter of 2014 had no impact on the Company’s financial position, results of operations or cash flows.
In July 2013, the FASB issued ASU No. 2013-11, Income Taxes (Topic 740): Presentation of an Unrecognized Tax Benefit When a Net Operating Loss Carryforward, a Similar Tax Loss, or a Tax Credit Carryforward Exist. This update requires an entity to present an unrecognized tax benefit—or a portion of an unrecognized tax benefit—in the financial statements as a reduction to a deferred tax asset for a net operating loss (“NOL”) carryforward, a similar tax loss, or a tax credit carryforward except when 1) an NOL carryforward, a similar tax loss, or a tax credit carryforward is not available as of the reporting date under the governing tax law to settle taxes that would result from the disallowance of the tax position; and 2) the entity does not intend to use the deferred tax asset for this purpose (provided that the tax law permits a choice). If either of these conditions exists, an entity should present an unrecognized tax benefit in the financial statements as a liability and should not net the unrecognized tax benefit with a deferred tax asset. Additional recurring disclosures are not required, because this ASU does not affect the recognition, measurement or tabular disclosure of uncertain tax positions. This guidance is effective for fiscal years—and interim periods within those fiscal years—beginning after December 15, 2013. The Company’s adoption of this guidance in the first quarter of 2014 had no impact on the Company’s financial position, results of operations or cash flows.
49
Table of Contents
| 4. | FAIR VALUE MEASUREMENTS |
The Company follows the accounting standards for fair value, whereas fair value is a market-based measurement, not an entity-specific measurement. The Company’s fair value measurements are based on the assumptions that market participants would use in pricing the asset or liability. As a basis for considering market participant assumptions in fair value measurements, fair value accounting standards establish a fair value hierarchy which prioritizes the inputs used in measuring fair value as follows:
| • | Level 1—observable inputs, such as quoted prices in active markets |
| • | Level 2—observable inputs other than those included in Level 1, such as quoted prices for similar assets and liabilities in active or inactive markets that are observable either directly or indirectly, or other inputs that are observable or can be corroborated by observable market data |
| • | Level 3—unobservable inputs in which there is little or no market data, which require the reporting entity to develop its own assumptions. |
Any transfers of assets or liabilities between Level 1, Level 2, and Level 3 of the fair value hierarchy will be recognized as of the end of the reporting period in which the transfer occurs. There were no transfers between fair value levels in any of the periods presented below.
The Company’s assets and liabilities measured at fair value on a recurring and nonrecurring basis as of December 27, 2014 and December 28, 2013, aggregated by the level in the fair value hierarchy within which those measurements fall, are as follows (in thousands):
| Description | Level 1 | Level 2 | Level 3 | Total | ||||||||||||
| Recurring fair value measurements: |
||||||||||||||||
| Money market funds |
$ | 231,600 | $ | — | $ | — | $ | 231,600 | ||||||||
|
|
|
|
|
|
|
|
|
|||||||||
| Balance at December 27, 2014 |
$ | 231,600 | $ | — | $ | — | $ | 231,600 | ||||||||
|
|
|
|
|
|
|
|
|
|||||||||
| Recurring fair value measurements: |
||||||||||||||||
| Money market funds |
$ | 64,100 | $ | — | $ | — | $ | 64,100 | ||||||||
|
|
|
|
|
|
|
|
|
|||||||||
| Balance at December 28, 2013 |
$ | 64,100 | $ | — | $ | — | $ | 64,100 | ||||||||
|
|
|
|
|
|
|
|
|
|||||||||
| Nonrecurring fair value measurements: |
||||||||||||||||
| Assets held for sale |
$ | — | $ | — | $ | 4,800 | $ | 4,800 | ||||||||
|
|
|
|
|
|
|
|
|
|||||||||
| Balance at December 27, 2014 |
$ | — | $ | — | $ | 4,800 | $ | 4,800 | ||||||||
|
|
|
|
|
|
|
|
|
|||||||||
| Nonrecurring fair value measurements: |
||||||||||||||||
| Assets held for sale |
$ | — | $ | — | $ | 10,930 | $ | 10,930 | ||||||||
|
|
|
|
|
|
|
|
|
|||||||||
| Balance at December 28, 2013 |
$ | — | $ | — | $ | 10,930 | $ | 10,930 | ||||||||
|
|
|
|
|
|
|
|
|
|||||||||
Recurring Fair Value Measurements
Money Market Funds
Money market funds include highly liquid investments with an original maturity of three or fewer months. They are valued using quoted market prices in active markets and are classified under Level 1 within the fair value hierarchy. The Company had money market funds of $231 million and $64 million at December 27, 2014 and December 28, 2013, respectively.
Nonrecurring Fair Value Measurements
Property and Equipment
Property and equipment held and used by the Company are tested for recoverability whenever events or changes in circumstances indicate that the carrying amount of an asset or asset group may not be recoverable. The Company estimates the fair value of various properties for purposes of recording necessary impairment charges. The Company estimates fair value based on information received from real estate brokers. In the second quarter of 2014, the Company recorded a tangible asset impairment charge of $3 million, offset by insurance recoveries, as a result of tornado damage to a distribution facility. See Note 21—Commitments and Contingencies. No impairments to the Company’s Property and equipment – net were recognized during 2013.
50
Table of Contents
Assets Held for Sale
The Company is required to record Assets held for sale at the lesser of the depreciated carrying amount or estimated fair value less cost to sell. Certain Assets held for sale were adjusted to equal their estimated fair value, less cost to sell, resulting in tangible asset impairment charges of $2 million in each of the 2014 and 2013 fiscal years. Fair value of properties was estimated by the Company based on information received from real estate brokers.
The amounts included in the tables above, classified under Level 3 within the fair value hierarchy, represent the estimated fair values of those properties that became the new carrying amounts at the time the impairments were recorded.
Other Fair Value Measurements
The carrying value of cash, restricted cash, accounts receivable, bank checks outstanding, trade accounts payable, and accrued expenses approximate their fair values, due to their short-term maturities.
The fair value of total debt approximated $4.8 billion and $4.9 billion as compared to its aggregate carrying value of $4.7 billion and $4.8 billion as of December 27, 2014 and December 28, 2013, respectively. Fair value of the Company’s debt is primarily classified under Level 3 of the fair value hierarchy, with fair value estimated based upon a combination of the cash flows expected under these debt facilities, interest rates that are currently available to the Company for debt with similar terms, and estimates of the Company’s overall credit risk. The fair value of the Company’s 8.5% Senior Notes, classified under Level 2 of the fair value hierarchy, was $1.4 billion and $1.5 billion at December 27, 2014 and December 28, 2013, respectively. Fair value was based upon the closing market price at the end of the reporting period. See Note 11—Debt for a further description of the Senior Notes.
| 5. | ALLOWANCE FOR DOUBTFUL ACCOUNTS |
A summary of the activity in the allowance for doubtful accounts for the last three fiscal years is as follows (in thousands):
| 2014 | 2013 | 2012 | ||||||||||
| Balance at beginning of year |
$ | 25,151 | $ | 25,606 | $ | 35,100 | ||||||
| Charged to costs and expenses |
18,559 | 19,481 | 10,701 | |||||||||
| Customer accounts written off—net of recoveries |
(18,721 | ) | (19,936 | ) | (20,195 | ) | ||||||
|
|
|
|
|
|
|
|||||||
| Balance at end of year |
$ | 24,989 | $ | 25,151 | $ | 25,606 | ||||||
|
|
|
|
|
|
|
|||||||
This table does not include the vendor receivable related allowance for doubtful accounts of $3 million, $3 million and $4 million at December 27, 2014, December 28, 2013 and December 29, 2012, respectively.
| 6. | ACCOUNTS RECEIVABLE FINANCING PROGRAM |
Under its accounts receivable financing program (“2012 ABS Facility”), the Company and certain of its subsidiaries sell—on a revolving basis—their eligible receivables to a 100% owned, special purpose, bankruptcy remote subsidiary (the “Receivables Company”). This subsidiary, in turn, grants a continuing security interest in all of its rights, title and interest in the eligible receivables to the administrative agent for the benefit of the lenders (as defined by the 2012 ABS Facility). The Company consolidates the Receivables Company and, consequently, the transfer of the receivables is a transaction internal to the Company and the receivables have not been derecognized from the Company’s Consolidated Balance Sheets. On a daily basis, cash from accounts receivable collections is remitted to the Company as additional eligible receivables are sold to the Receivables Company. If, on a weekly settlement basis, there are not sufficient eligible receivables available as collateral, the Company is required to either provide cash collateral to cover the shortfall or, in lieu of providing cash collateral to cover the shortfall, it can pay down its borrowings on the 2012 ABS Facility. Due to sufficient eligible receivables available as collateral, no cash collateral was held at December 27, 2014 or December 28, 2013.
The maximum capacity under the 2012 ABS Facility is $800 million. Borrowings under the 2012 ABS Facility were $636 million and $686 million at December 27, 2014 and December 28, 2013, respectively. Included in the Company’s accounts receivable balance as of December 27, 2014 and December 28, 2013 were $941 million and $930 million, respectively, of receivables held as collateral in support of the 2012 ABS Facility. See Note 11—Debt for a further description of the 2012 ABS Facility.
51
Table of Contents
| 7. | RESTRICTED CASH |
The Company had $6 million and $7 million of restricted cash included in the Company’s Consolidated Balance Sheets in Other assets at December 27, 2014 and December 28, 2013, respectively. This restricted cash primarily represents security deposits and escrow amounts related to certain properties collateralizing the commercial mortgage-backed securities loan facility (“CMBS Fixed Facility”). See Note 11—Debt for a further description of the CMBS Fixed Facility.
| 8. | PROPERTY AND EQUIPMENT |
Property and equipment consisted of the following (in thousands):
| December 27, 2014 |
December 28, 2013 |
Range of Useful Lives | ||||||||
| Land |
$ | 291,871 | $ | 287,385 | ||||||
| Buildings and building improvements |
1,055,936 | 1,052,355 | 10–40 years | |||||||
| Transportation equipment |
651,184 | 586,376 | 5–10 years | |||||||
| Warehouse equipment |
300,760 | 278,732 | 5–12 years | |||||||
| Office equipment, furniture and software |
622,296 | 532,389 | 3–7 years | |||||||
| Construction in process |
117,125 | 104,717 | ||||||||
|
|
|
|
|
|||||||
| 3,039,172 | 2,841,954 | |||||||||
| Less accumulated depreciation and amortization |
(1,312,589 | ) | (1,093,459 | ) | ||||||
|
|
|
|
|
|||||||
| Property and equipment—net |
$ | 1,726,583 | $ | 1,748,495 | ||||||
|
|
|
|
|
|||||||
Transportation equipment included $163 million and $94 million of capital lease assets at December 27, 2014, and December 28, 2013, respectively. Buildings and building improvements included $33 million of capital lease assets at December 27, 2014 and December 28, 2013. Accumulated amortization of capital lease assets was $36 million and $14 million at December 27, 2014 and December 28, 2013, respectively. Interest capitalized was $2 million in 2014 and 2013.
Depreciation and amortization expense of property and equipment—including amortization of capital lease assets—was $261 million, $240 million and $217 million for the fiscal years 2014, 2013 and 2012, respectively.
| 9. | GOODWILL AND OTHER INTANGIBLES |
Goodwill and Other intangible assets include the cost of acquired businesses in excess of the fair value of the tangible net assets recorded in connection with acquisitions. Other intangible assets include customer relationships, the brand names comprising our portfolio of exclusive brands, and trademarks. Brand names and trademarks are indefinite-lived intangible assets and, accordingly, are not subject to amortization.
Customer relationship intangible assets have definite lives, so they are carried at the acquired fair value less accumulated amortization. Customer relationship intangible assets are amortized on a straight-line basis over the estimated useful lives (four to 10 years) and amortization expense was $151 million, $147 million and $139 million for the fiscal years ended 2014, 2013 and 2012, respectively. The weighted-average remaining useful life of all customer relationship intangibles was approximately two years at December 27, 2014. Amortization of these customer relationship assets is estimated to be $146 million in 2015, $140 million in 2016, and $63 million in 2017.
52
Table of Contents
Goodwill and other intangibles, net, consisted of the following (in thousands):
| December 27, 2014 |
December 28, 2013 |
|||||||
| Goodwill |
$ | 3,835,477 | $ | 3,835,477 | ||||
|
|
|
|
|
|||||
| Customer relationships—amortizable: |
||||||||
| Gross carrying amount |
$ | 1,376,094 | $ | 1,377,663 | ||||
| Accumulated amortization |
(1,026,680 | ) | (877,396 | ) | ||||
|
|
|
|
|
|||||
| Net carrying value |
349,414 | 500,267 | ||||||
|
|
|
|
|
|||||
| Noncompete agreement—amortizable: |
||||||||
| Gross carrying amount |
800 | 800 | ||||||
| Accumulated amortization |
(187 | ) | (27 | ) | ||||
|
|
|
|
|
|||||
| Net carrying value |
613 | 773 | ||||||
|
|
|
|
|
|||||
| Brand names and trademarks—not amortizing |
252,800 | 252,800 | ||||||
|
|
|
|
|
|||||
| Total other intangibles—net |
$ | 602,827 | $ | 753,840 | ||||
|
|
|
|
|
|||||
The 2014 decrease in the gross carrying amount of customer relationships is attributable to the write off of fully amortized intangible assets relating to a 2008 business acquisition.
As required, the Company assesses Goodwill and Other intangible assets with indefinite lives for impairment annually, or more frequently if events occur that indicate an asset may be impaired. For Goodwill and indefinite-lived intangible assets, the Company’s policy is to assess for impairment at the beginning of each fiscal third quarter. For Other intangible assets with definite lives, we assess for impairment only if events occur that indicate that the carrying amount of an asset may not be recoverable.
The Company completed its most recent annual impairment assessment for goodwill and its portfolio of brand names and trademarks, the indefinite-lived intangible assets on June 30, 2014—the first day of its fiscal 2014 third quarter—with no impairments noted.
For goodwill, the reporting unit used in assessing impairment is our one business segment as described in Note 24—Business Segment Information. The Company’s assessment for impairment of goodwill utilized a combination of discounted cash flow analysis, comparative market multiples and comparative market transaction multiples. The results from each of the models are then weighted and combined into a single estimate of fair value for our reporting unit. The Company uses a weighting of 50%, 35% and 15% for the discounted cash flow analysis, comparative market multiples and comparative market transaction multiples, respectively, to determine the fair value of the reporting unit for comparison to the corresponding carrying value. If the carrying value of the reporting unit exceeds its fair value, the Company must then perform a comparison of the implied fair value of goodwill with its carrying value. If the carrying value of the goodwill exceeds its implied fair value, an impairment loss is recognized in an amount equal to the excess. Based upon its fiscal 2014 annual goodwill impairment analysis, the Company believes the fair value of its reporting unit exceeded its carrying value.
The Company’s fair value estimates of the brand name and trademark indefinite-lived intangible assets are based on a relief from royalty method. The fair value of the intangible asset is determined for comparison to the corresponding carrying value. If the carrying value of the asset exceeds its fair value, an impairment loss is recognized in an amount equal to the excess. Based upon its fiscal 2014 annual impairment analysis, the Company believes the fair value of its brand name and trademark indefinite-lived intangible assets exceeded their carrying values.
Due to the many variables inherent in estimating fair value and the relative size of the recorded indefinite-lived intangible assets, differences in assumptions may have a material effect on the results of our impairment analysis.
| 10. | ASSETS HELD FOR SALE |
The Company classifies its closed facilities as Assets held for sale at the time management commits to a plan to sell the facility and it is unlikely the plan will be changed, the facility is actively marketed and available for immediate sale, and the sale is expected to be completed within one year. Due to market conditions, certain facilities may be classified as Assets held for sale for more than one year as the Company continues to actively market the facilities at reasonable prices. For all properties held for sale, the Company has exited operations from the facilities and, thus, the properties are no longer productive assets. Further, the Company has no history of changing its plan to dispose of a facility once the decision has been made. At December 27, 2014 and December 28, 2013, $3 million and $10 million, respectively, of closed facilities were included in Assets held for sale for more than one year.
53
Table of Contents
The changes in Assets held for sale for fiscal years 2014 and 2013 were as follows (in thousands):
| 2014 | 2013 | |||||||
| Balance at beginning of year |
$ | 14,554 | $ | 23,193 | ||||
| Transfers in |
6,700 | 4,193 | ||||||
| Assets sold |
(14,314 | ) | (10,972 | ) | ||||
| Tangible asset impairment charges |
(1,580 | ) | (1,860 | ) | ||||
|
|
|
|
|
|||||
| Balance at end of the year |
$ | 5,360 | $ | 14,554 | ||||
|
|
|
|
|
|||||
During 2014, four distribution facilities were closed and reclassified to Assets held for sale. Additionally five facilities classified as Assets held for sale were sold for proceeds of $19 million. The Company recognized a net gain of $5 million on sold facilities in 2014.
During 2013, the Company reclassified an idle facility to Assets held for sale. Additionally, it sold four facilities previously classified as Assets held for sale for net proceeds of $11 million, which approximated their carrying values.
As discussed in Note 4—Fair Value Measurements, during 2014 and 2013, certain Assets held for sale were adjusted to equal their estimated fair value, less costs to sell. This resulted in tangible asset impairment charges of $2 million in fiscal 2014 and 2013.
In the first quarter of fiscal 2015, a distribution facility held for sale at December 27, 2014 was sold for a minimal gain.
| 11. | DEBT |
The Company’s debt consisted of the following (in thousands):
| Contractual Maturity |
Interest Rate at December 27, 2014 |
December 27, 2014 |
December 28, 2013 |
|||||||||||
| Debt Description |
||||||||||||||
| ABL Facility |
May 11, 2016 | — | $ | — | $ | 20,000 | ||||||||
| 2012 ABS Facility |
May 11, 2016 | 1.21 | % | 636,000 | 686,000 | |||||||||
| Amended 2011 Term Loan |
March 31, 2019 | 4.50 | 2,073,750 | 2,094,750 | ||||||||||
| Senior Notes |
June 30, 2019 | 8.50 | 1,350,000 | 1,350,000 | ||||||||||
| CMBS Fixed Facility |
August 1, 2017 | 6.38 | 472,391 | 472,391 | ||||||||||
| Obligations under capital leases |
2018–2025 | 3.34 - 6.25 | 189,232 | 116,662 | ||||||||||
| Other debt |
2018–2031 | 5.75 - 9.00 | 11,795 | 12,359 | ||||||||||
|
|
|
|
|
|||||||||||
| Total debt |
4,733,168 | 4,752,162 | ||||||||||||
| Add unamortized premium |
14,982 | 18,311 | ||||||||||||
| Less current portion of long-term debt |
(51,877 | ) | (35,225 | ) | ||||||||||
|
|
|
|
|
|||||||||||
| Long-term debt |
$ | 4,696,273 | $ | 4,735,248 | ||||||||||
|
|
|
|
|
|||||||||||
As of December 27, 2014, $2,024 million of the total debt was at a fixed rate and $2,709 million was at a floating rate.
54
Table of Contents
Principal payments to be made on outstanding debt as of December 27, 2014, were as follows (in thousands):
| 2015 |
$ | 51,877 | ||
| 2016 |
683,907 | |||
| 2017 |
521,645 | |||
| 2018 |
63,659 | |||
| 2019 |
3,367,439 | |||
| Thereafter |
44,641 | |||
|
|
|
|||
| $ | 4,733,168 | |||
|
|
|
Revolving Credit Agreement
The Company’s asset backed senior secured revolving loan facility (“ABL Facility”) provides for loans of up to $1,100 million, with its capacity limited by borrowing base calculations. As of December 27, 2014, the Company had no outstanding borrowings, but had issued Letters of Credit totaling $335 million under the ABL Facility. Outstanding Letters of Credit included 1) $83 million issued in favor of Ahold to secure their contingent exposure under guarantees of our obligations with respect to certain leases, 2) $242 million issued in favor of certain commercial insurers securing our obligations with respect to our self-insurance program, and 3) letters of credit of $10 million for other obligations. There was available capacity on the ABL Facility of $765 million at December 27, 2014, according to the borrowing base calculation. As of December 27, 2014, on borrowings up to $75 million, the Company can periodically elect to pay interest at Prime plus 2.25% or LIBOR plus 3.25%. On borrowings in excess of $75 million, the Company can periodically elect to pay interest at Prime plus 1.00% or LIBOR plus 2.00%. The ABL facility also carries letter of credit fees of 2.00% and an unused commitment fee of 0.25%. The weighted-average interest rate for the ABL Facility was 3.69% for 2014 and 3.50% for 2013.
Accounts Receivable Financing Program
Under the 2012 ABS Facility, the Company and certain of its subsidiaries sell—on a revolving basis—their eligible receivables to a 100% owned, special purpose, bankruptcy remote subsidiary of the Company (the “Receivables Company”). This subsidiary, in turn, grants a continuing security interest in all of its rights, title and interest in the eligible receivables to the administrative agent for the benefit of the lenders (as defined by the 2012 ABS Facility). The maximum capacity under the 2012 ABS Facility is $800 million. Borrowings under the 2012 ABS Facility were $636 million and $686 million at December 27, 2014 and December 28, 2013, respectively. The Company, at its option, can request additional borrowings up to the maximum commitment, provided sufficient eligible receivables are available as collateral. There was available capacity on the 2012 ABS Facility of $64 million at December 27, 2014 based on eligible receivables as collateral. The portion of the loan held by the lenders who fund the loan with commercial paper bears interest at the lender’s commercial paper rate, plus any other costs associated with the issuance of commercial paper, plus 1% and an unused commitment fee of 0.35%. The portion of the loan held by lenders that do not fund the loan with commercial paper bears interest at LIBOR plus 1% and an unused commitment fee of 0.35%. See Note 6—Accounts Receivable Financing Program for a further description of the Company’s Accounts Receivable Financing Program. The weighted-average interest rate for the 2012 ABS Facility was 1.43% for 2014 and 1.55% for 2013. The 2012 ABS Facility replaced the Company’s former ABS facility. See “Debt Refinancing Transactions” discussed below.
On August 8, 2014, the 2012 ABS Facility was amended whereby the maturity date was extended from August 27, 2015 to the earlier of August 5, 2016, or the termination date of the ABL Facility, currently May 11, 2016. The interest rate on outstanding borrowings was reduced 25 basis points. There were no other significant changes to the 2012 ABS Facility. The Company incurred less than $1 million of costs and fees related to the 2012 ABS Facility amendment. See Note 6—Accounts Receivable Financing Program for a further description of the Company’s Accounts Receivable Financing Program.
Term Loan Agreement
The Company’s senior secured term loan (“Amended 2011 Term Loan”) consisted of a senior secured term loan with outstanding borrowings of $2,074 million at December 27, 2014. The Amended 2011 Term Loan bears interest equal to Prime plus 2.5%, or LIBOR plus 3.5%, with a LIBOR floor of 1.0%, based on a periodic election of the interest rate by the Company. Principal repayments of $5 million are payable quarterly with the balance at maturity. The Amended 2011 Term Loan may require mandatory repayments if certain assets are sold, or based on excess cash flow generated by the
55
Table of Contents
Company, as defined in the agreement. At December 27, 2014, entities affiliated with KKR held $284 million of the Company’s Amended 2011 Term Loan debt. The interest rate for all borrowings on the Amended 2011 Term Loan was 4.5%—the LIBOR floor of 1.0% plus 3.5%—for all periods in 2014 and 2013.
The term loan agreement was amended during 2013 and 2012. See “Debt Refinancing Transactions” discussed below.
Senior Notes
The unsecured Senior Notes, with outstanding principal of $1,350 million at December 27, 2014, bear interest at 8.5%. There was unamortized issue premium associated with the Senior Notes issuances of $15 million at December 27, 2014. The premium is amortized as a decrease to Interest expense over the remaining life of the debt facility. At December 27, 2014, entities affiliated with KKR held $2 million of the Company’s Senior Notes. In February 2015, the Company purchased all of the Senior Notes held by the entities affiliated with KKR, as further discussed in Note 14—Related Party Transactions.
Effective December 19, 2013, upon consent of the note holders, the Senior Notes Indenture was amended so that the proposed Acquisition will not constitute a “Change of Control,” as defined in the Indenture. In the event of a “Change of Control,” the holders of the Senior Notes would have the right to require the Company to repurchase all or any part of their notes at a price equal to 101% of the principal amount, plus accrued and unpaid interest to the date of repurchase. If the Acquisition is terminated under terms of the Merger Agreement—or not completed by September 8, 2015—the Senior Notes Indenture will revert to its original terms. See Note 14—Related Party Transactions for a discussion of Senior Notes Indenture amendment fees paid by Sysco.
Other Debt
The CMBS Fixed Facility provides financing of $472 million and is currently secured by mortgages on 34 properties, consisting of distribution centers. The CMBS Fixed Facility bears interest at 6.38%. Obligations under capital leases consist of amounts due for transportation equipment and building leases.
Other debt consists of industrial revenue bonds and miscellaneous debt obligations.
Debt Refinancing Transactions
In 2013 and 2012, the Company entered into a series of transactions to refinance debt facilities and extend debt maturity dates, including the following transactions:
2013 Refinancing
| • | In June 2013, the Company refinanced its term loan agreements. The aggregate principal outstanding of the 2011 Term Loan was increased to $2,100 million, and the maturity date of the loan facility was extended from March 31, 2017 to March 31, 2019. The Amended 2011 Term Loan facility refinanced an aggregate of $2,091 million in principal under the Company’s Amended 2007 Term Loan and 2011 Term Loan facilities. Continuing lenders refinanced an aggregate of $1,634 million in principal of Term Loan debt. They also purchased $371 million in principal of Term Loan debt from lenders electing not to participate in, or electing to decrease their holdings in, the Amended 2011 Term Loan facility. Additionally, the Company sold $95 million in principal of the Amended 2011 Term Loan to new lenders. |
The Company performed an analysis by creditor to determine if the terms of the Amended 2011 Term Loan were substantially different from the previous term loan facilities. Based upon the analysis, it was determined that continuing lenders holding a significant portion of the Amended 2011 Term Loan had terms that were substantially different from their original loan agreements. As a result, this portion of the transaction was accounted for as an extinguishment of debt and the contemporaneous acquisition of new debt. Lenders holding the remaining portion of the Amended 2011 Term Loan had terms that were not substantially different from their original loan agreements and, as a consequence, this portion of the transaction was accounted for as a debt modification as opposed to an extinguishment of debt.
| • | In January 2013, the Company redeemed the remaining $355 million in aggregate principal amount of its 11.25% Senior Subordinated Notes (“Senior Subordinated Notes”) due June 30, 2017. This was done at a price equal to 105.625% of the principal amount of the Senior Subordinated Notes, plus accrued and unpaid interest to the redemption date. An entity affiliated with CD&R held all of the redeemed Senior Subordinated Notes. To fund the redemption of these notes, the Company issued $375 million in principal amount of its Senior Notes at a price equal to 103.5% of the principal amount, for gross proceeds of $388 million. |
56
Table of Contents
The 2013 refinancing resulted in a loss on extinguishment of debt of $42 million. That consisted of a $20 million Senior Subordinated Notes early redemption premium, a write-off of $13 million of unamortized debt issuance costs related to the old debt facilities, and $9 million of lender fees and third party costs related to these transactions. Unamortized debt issuance costs of $6 million related to the portion of the Term Loan refinancing accounted for as a debt modification will be carried forward and amortized through March 31, 2019—the maturity date of the Amended 2011 Term Loan.
2012 Refinancing
| • | In 2012, the Company entered into two transactions to amend its 2007 Term Loan, originally scheduled to mature on July 3, 2014. Holders of $1,691 million in principal of the 2007 Term Loan consented to extend the maturity date from July 3, 2014, to March 31, 2017. The Company repaid $249 million in principal of the 2007 Term Loan to lenders not consenting to extend their term loan holdings. The transactions did not require repayment and the receipt of new proceeds for the $1,691 million of extended 2007 Term Loan principal. |
We performed an analysis by creditor to determine if the terms of the Amended 2007 Term Loan were substantially different from the previous facility. Continuing lenders holding a significant portion of the Amended 2007 Term Loan had terms that were substantially different from their original loan agreements. As a result, this portion of the transaction was accounted for as an extinguishment of debt and the contemporaneous acquisition of new debt. Lenders holding the remaining portion of the Amended 2007 Term Loan had terms that were not substantially different from their original loan agreements. As a consequence, this portion of the transaction was accounted for as a debt modification as opposed to an extinguishment of debt.
| • | In December 2012, the Company redeemed $166 million in principal of its Senior Subordinated Notes with proceeds from the issuance of $175 million in principal of Senior Notes. The Senior Notes were issued at 101.5% for gross proceeds of $178 million. An entity affiliated with CD&R held all of the redeemed Senior Subordinated Notes. |
| • | In August 2012, the Company entered into a new ABS loan facility— the 2012 ABS Facility. The Company borrowed $686 million under the 2012 ABS Facility and used the proceeds to repay all amounts due on its previous ABS Facility. A portion of the lenders under the 2012 ABS Facility were also lenders under the previous ABS Facility. Since the terms of the 2012 ABS Facility were not substantially different from the previous facility, the portion of the 2012 ABS Facility pertaining to those continuing lenders was accounted for as a debt modification versus an extinguishment of debt. |
The 2012 refinancing resulted in a loss on extinguishment of debt of $31 million. This consisted of $12 million of lender fees and third party costs related to the transactions, a write-off of $10 million of unamortized debt issuance costs related to the old debt facilities, and a $9 million Senior Subordinated Notes early redemption premium.
Refinancing Transaction Costs
The Company incurred transaction costs of $29 million and $35 million related to the 2013 and 2012 debt refinancing transactions, respectively. Transaction costs primarily consisted of loan fees, arrangement fees, rating agency fees and legal fees.
Security Interests
Substantially all of our assets are pledged under the various debt agreements. Debt under the 2012 ABS Facility is secured by certain designated receivables and, in certain circumstances, by restricted cash. The ABL Facility is secured by certain other designated receivables not pledged under the 2012 ABS Facility, inventories and tractors and trailers owned by the Company. The CMBS Fixed Facility is collateralized by mortgages on 34 related properties. Our obligations under the Amended 2011 Term Loan are secured by all of the capital stock of our subsidiaries, each of the direct and indirect 100% owned domestic subsidiaries (as defined in the agreements), and are secured by substantially all assets of the Company and its subsidiaries not pledged under the 2012 ABS Facility or the CMBS Fixed Facility. The Amended 2011 Term Loan has priority over certain collateral securing the ABL Facility, and it has second priority to collateral securing the ABL Facility. As of December 27, 2014, nine properties remain in a special purpose, bankruptcy remote subsidiary, and are not pledged as collateral under any of the Company’s debt agreements.
Restrictive Covenants
Our credit facilities, loan agreements and indentures contain customary covenants. These include, among other things, covenants that restrict our ability to incur certain additional indebtedness, create or permit liens on assets, pay dividends, or engage in mergers or consolidations. Certain debt agreements also contain various and customary events of default
57
Table of Contents
with respect to the loans. Those include, without limitation, the failure to pay interest or principal when it is due under the agreements, cross default provisions, the failure of representations and warranties contained in the agreements to be true, and certain insolvency events. If a default event occurs and continues, the principal amounts outstanding—together with all accrued unpaid interest and other amounts owed—may be declared immediately due and payable by the lenders. Were such an event to occur, the Company would be forced to seek new financing that may not be on as favorable terms as its current facilities. The Company’s ability to refinance its indebtedness on favorable terms—or at all—is directly affected by the current economic and financial conditions. In addition, the Company’s ability to incur secured indebtedness (which may enable it to achieve more favorable terms than the incurrence of unsecured indebtedness) depends in part on the value of its assets. This, in turn, relies on the strength of its cash flows, results of operations, economic and market conditions and other factors.
| 12. | ACCRUED EXPENSES AND OTHER LONG-TERM LIABILITIES |
Accrued expenses and other long-term liabilities consisted of the following (in thousands):
| December 27, 2014 |
December 28, 2013 |
|||||||
| Accrued expenses and other current liabilities: |
||||||||
| Salary, wages and bonus expenses |
$ | 129,887 | $ | 110,427 | ||||
| Operating expenses |
46,845 | 61,500 | ||||||
| Workers’ compensation, general liability and fleet liability |
45,264 | 42,204 | ||||||
| Group medical liability |
20,183 | 20,379 | ||||||
| Customer rebates and other selling expenses |
65,052 | 63,038 | ||||||
| Restructuring |
9,792 | 13,184 | ||||||
| Property and sales tax |
19,224 | 22,526 | ||||||
| Interest payable |
69,465 | 70,702 | ||||||
| Deferred tax liabilities |
10,079 | — | ||||||
| Other |
19,847 | 19,675 | ||||||
|
|
|
|
|
|||||
| Total accrued expenses and other current liabilities |
$ | 435,638 | $ | 423,635 | ||||
|
|
|
|
|
|||||
| Other long-term liabilities: |
||||||||
| Workers’ compensation, general liability and fleet liability |
$ | 115,640 | $ | 111,364 | ||||
| Accrued pension and other postretirement benefit obligations |
227,106 | 100,393 | ||||||
| Restructuring |
47,089 | 58,034 | ||||||
| Unfunded lease obligation |
31,422 | 33,404 | ||||||
| Other |
28,962 | 31,613 | ||||||
|
|
|
|
|
|||||
| Total Other long-term liabilities |
$ | 450,219 | $ | 334,808 | ||||
|
|
|
|
|
|||||
Self-Insured Liabilities—The Company has a self-insurance program for general liability, fleet liability and workers’ compensation claims. Claims in excess of certain levels are fully insured. The self-insurance liabilities, included in the table above under “Workers’ compensation, general liability and fleet liability,” are recorded at discounted present value. This table summarizes self-insurance liability activity for the last three fiscal years (in thousands):
| 2014 | 2013 | 2012 | ||||||||||
| Balance at beginning of the year |
$ | 153,568 | $ | 159,469 | $ | 175,891 | ||||||
| Charged to costs and expenses |
65,025 | 56,526 | 37,763 | |||||||||
| Payments |
(57,689 | ) | (62,427 | ) | (54,185 | ) | ||||||
|
|
|
|
|
|
|
|||||||
| Balance at end of the year |
$ | 160,904 | $ | 153,568 | $ | 159,469 | ||||||
|
|
|
|
|
|
|
|||||||
58
Table of Contents
| 13. | RESTRUCTURING AND TANGIBLE ASSET IMPAIRMENT CHARGES |
The Company periodically closes distribution facilities, because it has built new ones or to consolidate operations. Additionally, as part of its ongoing efforts to reduce costs and improve operating efficiencies, the Company continues to implement its plan to migrate from a decentralized to a functionalized organization, with more processes and technologies standardized and centralized across the Company. During all periods presented, the Company incurred restructuring costs as a result of these activities.
2014 Activities—During 2014, certain Assets held for sale were adjusted to equal their estimated fair value, less cost to sell, resulting in tangible asset impairment charges of $2 million. These charges were offset by the favorable impacts of changes in estimated provisions for unused leases and severance costs of $2 million.
2013 Activities—During 2013, the Company recognized Restructuring and tangible asset impairment charges of $8 million. The Company announced the closing of three distribution facilities that ceased operations in 2014. These actions resulted in $4 million of severance and related costs. Also during 2013, certain Assets held for sale were adjusted to equal their estimated fair value, less costs to sell, resulting in tangible asset impairment charges of $2 million. In addition, the Company incurred $2 million of other severance costs, including $1 million for a multiemployer pension withdrawal liability.
2012 Activities—During 2012, the Company recognized Restructuring and tangible asset impairment charges of $9 million. The Company announced the closing of four facilities, including three distribution facilities and one administrative support facility. The closed facilities ceased operations in 2012 and were consolidated into other Company locations. The closing of the four facilities resulted in $5 million of tangible asset impairment charges to property and equipment, and minimal severance and related costs.
During 2012, the Company recognized $3 million of net severance and related costs for initiatives to reorganize our business along functional lines and optimize processes and systems. Also, certain Assets held for sale were adjusted to equal their estimated fair value, less costs to sell, resulting in tangible asset impairment charges of $2 million. Additionally, the Company reversed $2 million of liabilities for unused leased facilities.
Changes in the restructuring liabilities for the last three fiscal years were as follows (in thousands):
| Severance and Related Costs |
Facility Closing Costs |
Total | ||||||||||
| Balance at December 31, 2011 |
$ | 85,400 | $ | 5,593 | $ | 90,993 | ||||||
| Current period charges |
4,703 | 51 | 4,754 | |||||||||
| Change in estimate |
(1,575 | ) | (1,786 | ) | (3,361 | ) | ||||||
| Payments and usage—net of accretion |
(14,407 | ) | (681 | ) | (15,088 | ) | ||||||
|
|
|
|
|
|
|
|||||||
| Balance at December 29, 2012 |
74,121 | 3,177 | 77,298 | |||||||||
| Current period charges |
7,308 | 328 | 7,636 | |||||||||
| Change in estimate |
(480 | ) | (630 | ) | (1,110 | ) | ||||||
| Payments and usage—net of accretion |
(11,877 | ) | (729 | ) | (12,606 | ) | ||||||
|
|
|
|
|
|
|
|||||||
| Balance at December 28, 2013 |
69,072 | 2,146 | 71,218 | |||||||||
| Current period charges |
106 | — | 106 | |||||||||
| Change in estimate |
(584 | ) | (1,152 | ) | (1,736 | ) | ||||||
| Payments and usage—net of accretion |
(12,144 | ) | (563 | ) | (12,707 | ) | ||||||
|
|
|
|
|
|
|
|||||||
| Balance at December 27, 2014 |
$ | 56,450 | $ | 431 | $ | 56,881 | ||||||
|
|
|
|
|
|
|
|||||||
The $56 million of restructuring liabilities as of December 27, 2014, for severance and related costs included $51 million of multiemployer pension withdrawal liabilities related to closed facilities. This is payable in monthly installments through 2031 at effective interest rates of 5.9% to 6.7%.
59
Table of Contents
| 14. | RELATED PARTY TRANSACTIONS |
The Company pays a monthly management fee of $0.8 million to investment funds associated with or designated by the Sponsors. For each of the fiscal years 2014, 2013 and 2012, the Company recorded $10 million in management fees and related expenses reported as Distribution, selling and administrative costs in the Consolidated Statements of Comprehensive Income (Loss). Entities affiliated with KKR received transaction fees of $2 million and $3 million, respectively, for services related to the 2013 and the 2012 debt refinancing transactions. During the fiscal years 2013 and 2012, the Company purchased, $12 million and $19 million of food products, respectively, from a former affiliate of one of its Sponsors.
As discussed in Note 11—Debt, entities affiliated with the Sponsors hold various positions in some of our debt facilities and participated in our 2013 and 2012 refinancing transactions. At December 27, 2014, and December 28, 2013, entities affiliated with KKR held $286 million and $289 million, respectively in aggregate principal of the Company’s debt facilities. At December 27, 2014 and December 28, 2013, entities affiliated with CD&R had no holdings of the Company’s debt facilities. At December 29, 2012, entities affiliated with CD&R held $355 million in aggregate principal of the Company’s Senior Subordinated Notes, which were redeemed in January 2013.
In February 2015, the Company purchased all of the $2 million of Senior Notes held by the entities affiliated with KKR at market, for a cost of $2 million, including accrued interest.
Also as discussed in Note 11—Debt, upon consent of the noteholders, the Senior Note Indenture was amended so that the proposed Acquisition by Sysco will not constitute a “Change of Control,” that would have granted the holders of the Senior Notes the right to require the Company to repurchase all or any part of their notes at a premium equal to 101% of the principal amount, plus accrued and unpaid interest. Sysco paid $3.4 million in consent fees to the holders of the Senior Notes in December 2013 on behalf of the Company in connection with this amendment.
| 15. | SHARE-BASED COMPENSATION AND USF HOLDING COMMON STOCK ISSUANCES |
The Stock Incentive Plan, as amended (“Stock Incentive Plan”) provides for the sale of USF Holding common stock to US Foods’ named executive officers and other key employees and directors. It also grants 1) stock options to purchase shares of common stock, 2) stock appreciation rights, and 3) restricted stock and restricted stock units of USF Holding to certain individuals. The Board of Directors of USF Holding, or the Compensation Committee of the Board of USF Holding, is authorized to select the officers, employees and directors eligible to participate in the Stock Incentive Plan. Either the USF Holding board of directors or the Compensation Committee may determine the specific number of shares to be offered, or options, stock appreciation rights or restricted stock to be granted to an employee or director.
In May 2013, the Stock Incentive Plan was amended to, among other things, increase the number of shares of common stock of USF Holding available for grant—from approximately 31.5 million shares to approximately 53.2 million shares.
The Company measures compensation expense for share-based equity awards at fair value at the date of grant, and it recognizes compensation expense over the service period for share-based awards expected to vest. Total compensation expense related to share-based payment arrangements was $12 million, $8 million and $4 million for fiscal years 2014, 2013 and 2012, respectively. No share-based compensation cost was capitalized as part of the cost of an asset during those years. The total income tax benefit recorded in the Consolidated Statement of Comprehensive Income (Loss) was $4 million, $3 million, and $1 million during fiscal years 2014, 2013 and 2012, respectively.
USF Holding contributes shares to the Company for employee purchases, and upon exercise of options or grants of restricted shares and restricted stock units. Each participant in the Stock Incentive Plan has the right to require the Company to repurchase all of his or her restricted shares or shares issued or issuable pursuant to their awards in the event of a termination of employment due to death or disability. The Company also has the right—but not the obligation—to require employees to sell purchased shares back to the Company when they leave employment.
Generally, instruments with put rights upon death or disability are classified as equity awards until such puttable conditions become probable (i.e. upon termination due to death or disability). Once an award meets the puttable conditions, it is accounted for as an award modification and is required to be liability-classified. The Company records an incremental expense measured as the excess, if any, of the fair value of the modified award over the amount previously recognized when the award retained equity classification. These liability awards are remeasured at their fair market value as of each reporting period through the date of settlement, which is generally the first fiscal quarter following termination. There were no 2014 terminations that met the criteria for liability treatment. As such, there was no impact on current fiscal year stock-based compensation costs.
As discussed in Note 1—Proposed Acquisition by Sysco, the Acquisition will constitute a “Change of Control” under the Stock Incentive Plan, which will accelerate vesting of all stock options, equity appreciation rights, restricted stock, and restricted stock units.
60
Table of Contents
USF Holding Common Stock Issuances—Certain US Foods employees have purchased shares of USF Holding common stock, pursuant to a management stockholder’s agreement associated with the Stock Incentive Plan. These shares are subject to the terms and conditions (including certain restrictions) of each management stockholder’s agreement, other documents signed at the time of purchase, as well as transfer limitations under the applicable law. The related shares and net proceeds of the employee share purchases are contributed to the Company by USF Holding. The Company measures fair value of USF Holding shares on a quarterly basis, using the combination of a market approach and an income approach. The share price determined for a particular quarter end is the price at which employee purchases and company repurchases are made for the following quarter.
In 2014, there were no employee purchases or Company repurchases USF Holding common stock held by employees. In 2013, employees bought stock at $6.00 per share. The shares were purchased by employees in 2012 at prices of $5.00 to $6.00 per share. At December 27, 2014, there were 6.0 million shares of USF Holding held by employees for net proceeds of $28.6 million, including loan proceeds of $0.2 million received in 2014.
Stock Option Awards—The Company granted to certain employees Time Options and Performance Options (collectively the “Options”) to purchase common shares of USF Holding. These Options are subject to the restrictions set forth in the Stock Option Agreements. Shares purchased pursuant to option exercises would be governed by the restrictions in the Stock Incentive Plan and management stockholder’s agreements.
The Time Options vest and become exercisable ratably over periods of four to five years. This happens either on the anniversary date of the grant or the last day of each fiscal year, beginning with the fiscal year issued.
The Performance Options also vest and become exercisable ratably over four to five years, either on the anniversary date of the grant or the last day of each fiscal year (beginning with the fiscal year issued), provided that the Company achieves an annual operating performance target as defined in the applicable stock option agreements (“Stock Option Agreements”). The Stock Option Agreements also provide for “catch-up vesting” of the Performance Options, if an annual operating performance target is not achieved, but a cumulative operating performance target is achieved. During 2012, the Company changed its policy for granting Performance Options. The award agreements no longer included performance targets for all years covered by the agreement. Instead, the Company established annual and cumulative targets for each year at the beginning of each respective fiscal year. In this case, the grant date under GAAP is not determined until the performance target for the related options is known.
The 2012 annual operating performance target was modified in 2013, and the Company recorded a compensation charge of $2 million in 2013 for the Performance Options relating to 2012. The Company did not achieve the performance target in 2013. The Company achieved the performance target in 2014 and recorded a compensation charge of $4 million in 2014 for the Performance Options relating to 2014.
The Options are nonqualified options, with exercise prices equal to the estimated value of a share of USF Holdings stock at the date of the grant. The Options have exercise prices of $4.50 to $6.00 per share and generally have a 10-year life. The fair value of each option award is estimated as of the date of grant using a Black-Scholes option-pricing model.
The weighted-average assumptions for options granted for in fiscal years 2013 and 2012 are included in the following table. No options were granted in fiscal year 2014.
| 2013 | 2012 | |||||||
| Expected volatility |
35.0 | % | 35.0 | % | ||||
| Expected dividends |
0.0 | % | 0.0 | % | ||||
| Risk-free rate |
1.0 | % | 0.9 | % | ||||
| Expected term (in years) 10-year options |
6.3 | 6.7 | ||||||
Expected volatility is calculated based on the historical volatility of public companies similar to USF Holding. The risk-free interest rate is the implied zero-coupon yield for U.S. Treasury securities having a maturity approximately equal to the expected term, as of the grant dates. The assumed dividend yield is zero, because the Company has not historically paid dividends and does not have any current plans to pay dividends. Due to a lack of relevant historical data, the simplified approach was used to determine the expected term of the options.
The summary of options outstanding and changes during fiscal year 2014 presented below is based on the Company’s determination of legally outstanding option awards.
61
Table of Contents
| Time Options |
Performance Options |
Total Options |
Weighted- Average Fair Value |
Weighted- Average Exercise Price |
Weighted - Average Remaining Contractual Years |
|||||||||||||||||||
| Outstanding at December 28, 2013 |
12,399,555 | 12,399,555 | 24,799,110 | $ | 2.04 | $ | 5.20 | |||||||||||||||||
| Granted |
— | — | — | — | — | |||||||||||||||||||
| Exercised |
(12,000 | ) | (10,000 | ) | (22,000 | ) | $ | 1.63 | $ | 5.00 | ||||||||||||||
| Forfeited |
(94,842 | ) | (114,562 | ) | (209,404 | ) | $ | 2.13 | $ | 5.93 | ||||||||||||||
|
|
|
|
|
|
|
|||||||||||||||||||
| Outstanding at December 27, 2014 |
12,292,713 | 12,274,993 | 24,567,706 | $ | 1.97 | $ | 5.19 | 6 | ||||||||||||||||
|
|
|
|
|
|
|
|
|
|||||||||||||||||
| Vested and exercisable at December 27, 2014 |
9,395,838 | 7,622,773 | 17,018,611 | $ | 1.93 | $ | 4.99 | 6 | ||||||||||||||||
|
|
|
|
|
|
|
|
|
|||||||||||||||||
As described above, under GAAP, the performance target for Performance Options must be set for a grant date to have occurred and for the Performance Options to be considered for accounting recognition. In the above table, only 8.4 million of Performance Options outstanding at December 27, 2014 have had performance targets set. Only 8.4 million of outstanding Performance Options had performance targets set as of December 28, 2013. Exercised and Forfeited Performance Options during 2014 would have been materially unchanged. If a change in control were to occur, all options shown in the table above, including options for which performance targets were not yet set, would immediately vest.
The weighted-average grant date fair value of options granted in 2013 and 2012 was $2.22 and $2.05, respectively. In fiscal years 2014, 2013 and 2012, the Company recorded $7 million, $4 million and $2 million, respectively, in compensation expense related to the Options. The stock compensation expense—representing the fair value of stock options vested during the year—is reflected in our Consolidated Statements of Comprehensive Income (Loss) in Distribution, selling and administrative costs. During 2014, 12,000 Time Options and 10,000 Performance Options were exercised by terminating employees for a minimal cash outflow, representing the excess of fair value over exercise price. During 2013, 1,233,972 Time Options and 1,233,972 Performance Options were exercised by terminating employees for a cash outflow of $2 million, representing the excess of fair value over exercise price. During 2012, 425,550 Time Options and 425,550 Performance Options were exercised by terminating employees for a cash outflow of $0.9 million, representing the excess of fair value over exercise price.
Based on the table above, as of December 27, 2014, there was $7 million of total unrecognized compensation costs related to 7.5 million nonvested options expected to vest under the Stock Option Agreements. That cost is expected to be recognized over a weighted-average period of two years. As of December 27, 2014, there was $2 million of total unrecognized compensation costs related to 2.5 million nonvested options expected to vest under the Stock Option Agreements for which performance targets were set. That cost is expected to be recognized over a weighted-average period of six months.
Restricted Shares—Certain employees of the Company received 375,001 and 481,702 Restricted Shares of USF Holding in 2013 and 2012, respectively. (“Restricted Shares”). No Restricted Shares were issued in 2014. These shares were granted under the Stock Incentive Plan. Restricted Shares vest and become exercisable ratably over periods of primarily two to five years.
The summary of nonvested Restricted Shares outstanding and changes during fiscal year 2014 is presented below:
| Restricted Shares |
Weighted- Average Fair Value |
|||||||
| Nonvested at December 28, 2013 |
372,764 | $ | 6.00 | |||||
| Granted |
— | |||||||
| Vested |
(191,250 | ) | 6.00 | |||||
| Forfeited |
(6,124 | ) | 6.00 | |||||
|
|
|
|||||||
| Nonvested at December 27, 2014 |
175,390 | $ | 6.00 | |||||
|
|
|
|||||||
62
Table of Contents
The weighted-average grant date fair values for Restricted Shares granted in 2013 and 2012 were $6.00 and $6.00, respectively. The 2014 expense related to the Restricted Shares of $1 million was offset by an adjustment of prior year expense. Expense of $3 million and $2 million related to the Restricted Shares was recorded in Distribution, selling and administrative costs during fiscal 2013 and 2012, respectively. At December 27, 2014, there was $2 million of unrecognized compensation cost related to the Restricted Shares that we expect to recognize over a weighted-average period of two years.
Restricted Stock Units—Beginning in 2013, certain employees of the Company received Time Restricted Stock Units and Performance Restricted Stock Units of USF Holding (collectively the “RSUs”) granted pursuant to the Stock Incentive Plan. Time RSUs generally vest and become exercisable ratably over four years, starting on the anniversary date of grant. Performance RSUs also vest and become exercisable ratably over four years either on the anniversary date of the grant or the last day of each fiscal year (beginning with the fiscal year issued), provided that the Company achieves an annual operating performance target as defined in the applicable restricted stock unit agreements (“Restricted Stock Unit Agreements”). The Restricted Stock Unit Agreements also provide for “catch-up vesting” of the Performance RSU’s if an annual operating performance target is not achieved, but a cumulative operating performance target is achieved. Similar to options, the RSU award agreements do not include performance targets for all years covered by the agreement. Instead, the Company established annual targets for each year at the beginning of each fiscal year. In this case, the grant date under GAAP is not determined until the performance target for the related Performance RSU is known. The Company achieved the annual operating performance target in 2014 and recorded a compensation charge of $3 million in 2014 for the Performance RSU’s. The Company did not achieve the annual operating performance target for 2013 and, accordingly, did not record a compensation charge for the Performance RSU’s in 2013. Prior to 2013, there were no RSUs issued or outstanding under the Stock Incentive Plan.
The summary of nonvested Restricted Stock Units as of December 27, 2014, and changes during the fiscal year then ended presented below is based on the Company’s determination of legally outstanding RSUs.
| Time Restricted Stock Units |
Performance Restricted Stock Units |
Total Restricted Stock Units |
Weighted- Average Fair Value |
|||||||||||||
| Nonvested at December 28, 2013 |
1,264,583 | 1,097,916 | 2,362,499 | $ | 6.00 | |||||||||||
| Granted |
166,667 | — | 166,667 | $ | 6.00 | |||||||||||
| Vested |
(264,998 | ) | — | (264,998 | ) | $ | 6.00 | |||||||||
| Forfeited |
(59,887 | ) | (67,208 | ) | (127,095 | ) | $ | 6.00 | ||||||||
|
|
|
|
|
|
|
|||||||||||
| Nonvested at December 27, 2014 |
1,106,365 | 1,030,708 | 2,137,073 | $ | 6.00 | |||||||||||
|
|
|
|
|
|
|
|||||||||||
As described above, under GAAP, the performance targets for Performance RSUs must be set for a grant to have occurred and for Performance Options to be considered for accounting recognition. In the above table, only 0.5 million of nonvested Performance RSUs outstanding at December 27, 2014 have had a performance target set. If a change in control were to occur, all RSUs shown in the table above, including Performance RSUs for which targets have not yet been set, would immediately vest.
The weighted-average grant date fair values for Restricted Stock Units granted in 2014 was $6.00. Expense of $5 million and $1 million related to the Restricted Stock Units was recorded in Distribution, selling and administrative costs during 2014 and 2013, respectively. Based on the table above, at December 27, 2014, there was $9 million of unrecognized compensation cost related to 2 million Restricted Stock Units that we expect to recognize over a weighted-average period of two years. As of December 27, 2014, there was $1 million of total unrecognized compensation cost related to 0.5 million nonvested RSUs for which performance targets were set. That cost is expected to be recognized over a weighted-average period of six months.
Equity Appreciation Rights—The Company has an Equity Appreciation Rights (“EAR”) Plan for certain employees. Each EAR represents one phantom share of USF Holding common stock. The EARs become vested and payable, primarily, at the time of a qualified public offering of equity shares or a change in control. EARs are forfeited upon termination of the participant’s employment with the Company. The EARs will be settled in cash upon vesting and, accordingly, are considered liability instruments. No EARs were granted during 2014 and 2013. As of December 27, 2014, there were a total of 1,566,800 EARs outstanding with a weighted average exercise price of $4.98 per share.
63
Table of Contents
As the EARs are liability instruments, the fair value of the awards is re-measured each reporting period until the award is settled. Since vesting is contingent upon performance conditions currently not considered probable, no compensation costs have been recorded to date for the EARs.
| 16. | LEASES |
The Company leases various warehouse and office facilities and certain equipment under operating and capital lease agreements that expire at various dates and in some instances contain renewal provisions. The Company expenses operating lease costs, including any scheduled rent increases, rent holidays or landlord concessions—on a straight-line basis over the lease term. The Company also has an unfunded lease obligation on its Perth Amboy, New Jersey distribution facility through 2023.
Future minimum lease payments under the above mentioned noncancelable lease agreements, together with contractual sublease income, as of December 27, 2014, are as follows (in thousands):
| Unfunded Lease Obligation |
Capital Leases |
Operating Leases |
Sublease Income |
Net | ||||||||||||||||
| 2015 |
$ | 4,172 | $ | 33,124 | $ | 36,692 | ($ | 1,298 | ) | $ | 72,690 | |||||||||
| 2016 |
4,269 | 33,190 | 31,594 | (1,038 | ) | 68,015 | ||||||||||||||
| 2017 |
4,269 | 33,257 | 26,228 | (778 | ) | 62,976 | ||||||||||||||
| 2018 |
4,269 | 51,131 | 20,822 | (6 | ) | 76,216 | ||||||||||||||
| 2019 |
4,663 | 29,469 | 19,975 | — | 54,107 | |||||||||||||||
| Thereafter |
19,237 | 38,954 | 51,773 | — | 109,964 | |||||||||||||||
|
|
|
|
|
|
|
|
|
|
|
|||||||||||
| Total minimum lease payments (receipts) |
40,879 | 219,125 | $ | 187,084 | $ | (3,120 | ) | $ | 443,968 | |||||||||||
|
|
|
|
|
|
|
|||||||||||||||
| Less amount representing interest |
(11,895 | ) | (29,893 | ) | ||||||||||||||||
|
|
|
|
|
|||||||||||||||||
| Present value of minimum lease payments |
$ | 28,984 | $ | 189,232 | ||||||||||||||||
|
|
|
|
|
|||||||||||||||||
Total lease expense, included in Distribution, selling and administrative costs in the Company’s Consolidated Statements of Comprehensive Income (Loss), for operating leases for fiscal years 2014, 2013 and 2012, was $44 million, $44 million and $50 million, respectively.
| 17. | RETIREMENT PLANS |
The Company has defined benefit and defined contribution retirement plans for its employees. We also contribute to various multiemployer plans under collective bargaining agreements, and provide certain health care benefits to eligible retirees and their dependents.
Company Sponsored Defined Benefit Plans—The Company maintains several qualified retirement plans and a nonqualified retirement plan (“Retirement Plans”) that pay benefits to certain employees at retirement, using formulas based on a participant’s years of service and compensation. In addition, the Company maintains a postemployment health and welfare plan for certain employees, of which components are included in the tables below under Other postretirement plans. Amounts related to defined benefit plans recognized in the consolidated financial statements are determined on an actuarial basis.
64
Table of Contents
The components of net pension and other postretirement benefit costs for the last three fiscal years were as follows (in thousands):
| 2014 | Pension Benefits 2013 |
2012 | ||||||||||
| Components of net periodic pension cost: |
||||||||||||
| Service cost |
$ | 27,729 | $ | 32,773 | $ | 25,819 | ||||||
| Interest cost |
37,468 | 33,707 | 38,404 | |||||||||
| Expected return on plan assets |
(47,396 | ) | (42,036 | ) | (41,621 | ) | ||||||
| Amortization of prior service cost |
198 | 198 | 102 | |||||||||
| Amortization of net loss |
2,294 | 13,288 | 14,572 | |||||||||
| Settlements |
2,370 | 1,778 | 17,840 | |||||||||
|
|
|
|
|
|
|
|||||||
| Net periodic pension costs |
$ | 22,663 | $ | 39,708 | $ | 55,116 | ||||||
|
|
|
|
|
|
|
|||||||
| Other Postretirement Plans |
||||||||||||
| 2014 | 2013 |
2012 | ||||||||||
| Components of net periodic postretirement benefit costs: |
||||||||||||
| Service cost |
$ | 79 | $ | 153 | $ | 140 | ||||||
| Interest cost |
318 | 431 | 512 | |||||||||
| Amortization of prior service cost |
(334 | ) | — | — | ||||||||
| Amortization of net (gain) loss |
(75 | ) | 112 | 34 | ||||||||
| Curtailment |
(2,096 | ) | — | — | ||||||||
|
|
|
|
|
|
|
|||||||
| Net periodic other post-retirement benefit costs (credits) |
$ | (2,108 | ) | $ | 696 | $ | 686 | |||||
|
|
|
|
|
|
|
|||||||
Net period pension expense for fiscal years 2014, 2013 and 2012 includes $2 million, $2 million and $18 million, respectively, of settlement charges resulting from lump-sum payments to former employees participating in several Company sponsored pension plans. The net periodic other postretirement benefit credits for fiscal year 2014 includes a $2 million curtailment gain resulting from a labor negotiation that eliminated postretirement medical coverage for substantially all active participants in one plan.
65
Table of Contents
Changes in plan assets and benefit obligations recorded in Other comprehensive income (loss) for pension and Other postretirement benefits for the last three fiscal years were as follows (in thousands):
| Pension Benefits | ||||||||||||
| 2014 | 2013 | 2012 | ||||||||||
| Changes recognized in other comprehensive loss: |
||||||||||||
| Actuarial gain (loss) |
$ | (160,345 | ) | $ | 112,816 | $ | (54,059 | ) | ||||
| Prior service cost |
— | — | (620 | ) | ||||||||
| Amortization of prior service cost |
198 | 198 | 102 | |||||||||
| Amortization of net loss |
2,294 | 13,288 | 14,572 | |||||||||
| Settlements |
2,370 | 1,778 | 17,840 | |||||||||
|
|
|
|
|
|
|
|||||||
| Net amount recognized |
$ | (155,483 | ) | $ | 128,080 | $ | (22,165 | ) | ||||
|
|
|
|
|
|
|
|||||||
| Other Postretirement Plans | ||||||||||||
| 2014 | 2013 | 2012 | ||||||||||
| Changes recognized in other comprehensive loss: |
||||||||||||
| Actuarial gain (loss) |
$ | (986 | ) | $ | 2,198 | $ | (661 | ) | ||||
| Prior service cost |
3,612 | — | — | |||||||||
| Amortization of prior service cost |
(334 | ) | — | — | ||||||||
| Amortization of net (gain) loss |
(75 | ) | 112 | 34 | ||||||||
| Curtailment |
(2,096 | ) | — | — | ||||||||
|
|
|
|
|
|
|
|||||||
| Net amount recognized |
$ | 121 | $ | 2,310 | $ | (627 | ) | |||||
|
|
|
|
|
|
|
|||||||
66
Table of Contents
The funded status of the defined benefit plans for the last three fiscal years was as follows (in thousands):
| Pension Benefits | ||||||||||||
| 2014 | 2013 | 2012 | ||||||||||
| Change in benefit obligation: |
||||||||||||
| Benefit obligation at beginning of period |
$ | 733,752 | $ | 795,989 | $ | 762,771 | ||||||
| Service cost |
27,729 | 32,773 | 25,819 | |||||||||
| Interest cost |
37,468 | 33,707 | 38,404 | |||||||||
| Actuarial (gain) loss |
199,807 | (98,962 | ) | 82,840 | ||||||||
| Plan amendments |
— | — | 620 | |||||||||
| Settlements |
(11,517 | ) | (13,186 | ) | (68,627 | ) | ||||||
| Benefit disbursements |
(16,770 | ) | (16,569 | ) | (45,838 | ) | ||||||
|
|
|
|
|
|
|
|||||||
| Benefit obligation at end of period |
970,469 | 733,752 | 795,989 | |||||||||
|
|
|
|
|
|
|
|||||||
| Change in plan assets: |
||||||||||||
| Fair value of plan assets at beginning of period |
641,749 | 566,768 | 564,651 | |||||||||
| Return on plan assets |
86,857 | 55,890 | 70,403 | |||||||||
| Employer contribution |
48,847 | 48,846 | 46,179 | |||||||||
| Settlements |
(11,517 | ) | (13,186 | ) | (68,627 | ) | ||||||
| Benefit disbursements |
(16,770 | ) | (16,569 | ) | (45,838 | ) | ||||||
|
|
|
|
|
|
|
|||||||
| Fair value of plan assets at end of period |
749,166 | 641,749 | 566,768 | |||||||||
|
|
|
|
|
|
|
|||||||
| Net amount recognized |
$ | (221,303 | ) | $ | (92,003 | ) | $ | (229,221 | ) | |||
|
|
|
|
|
|
|
|||||||
| Other Postretirement Plans | ||||||||||||
| 2014 | 2013 | 2012 | ||||||||||
| Change in benefit obligation: |
||||||||||||
| Benefit obligation at beginning of period |
$ | 9,375 | $ | 11,357 | $ | 10,653 | ||||||
| Service cost |
79 | 153 | 140 | |||||||||
| Interest cost |
318 | 431 | 512 | |||||||||
| Employee contributions |
215 | 219 | 297 | |||||||||
| Actuarial (gain) loss |
986 | (2,198 | ) | 661 | ||||||||
| Curtailment |
(3,612 | ) | — | — | ||||||||
| Benefit disbursements |
(572 | ) | (587 | ) | (906 | ) | ||||||
|
|
|
|
|
|
|
|||||||
| Benefit obligation at end of period |
6,789 | 9,375 | 11,357 | |||||||||
|
|
|
|
|
|
|
|||||||
| Change in plan assets: |
||||||||||||
| Fair value of plan assets at beginning of period |
— | — | — | |||||||||
| Employer contribution |
357 | 369 | 609 | |||||||||
| Employee contributions |
215 | 219 | 297 | |||||||||
| Benefit disbursements |
(572 | ) | (587 | ) | (906 | ) | ||||||
|
|
|
|
|
|
|
|||||||
| Fair value of plan assets at end of period |
— | — | — | |||||||||
|
|
|
|
|
|
|
|||||||
| Net amount recognized |
$ | (6,789 | ) | $ | (9,375 | ) | $ | (11,357 | ) | |||
|
|
|
|
|
|
|
|||||||
For the defined benefit pension plans, the 2014 actuarial loss of $200 million was primarily due to a decrease in the discount rates and the adoption of the new mortality tables published by the Society of Actuaries used to determine the projected benefit obligation.
67
Table of Contents
| Pension Benefits | ||||||||||||
| 2014 | 2013 | 2012 | ||||||||||
| Amounts recognized in the consolidated balance sheets consist of the following: |
||||||||||||
| Accrued benefit obligation—current |
$ | (453 | ) | $ | (401 | ) | $ | (401 | ) | |||
| Accrued benefit obligation—noncurrent |
(220,850 | ) | (91,602 | ) | (228,820 | ) | ||||||
|
|
|
|
|
|
|
|||||||
| Net amount recognized in the consolidated balance sheets |
$ | (221,303 | ) | $ | (92,003 | ) | $ | (229,221 | ) | |||
|
|
|
|
|
|
|
|||||||
| Amounts recognized in accumulated other comprehensive income (loss) consist of the following: |
||||||||||||
| Prior service cost |
$ | (634 | ) | $ | (832 | ) | $ | (1,030 | ) | |||
| Net loss |
(231,446 | ) | (75,765 | ) | (203,647 | ) | ||||||
|
|
|
|
|
|
|
|||||||
| Net gain (loss) recognized in accumulated other comprehensive income (loss) |
$ | (232,080 | ) | $ | (76,597 | ) | $ | (204,677 | ) | |||
|
|
|
|
|
|
|
|||||||
| Additional information: |
||||||||||||
| Accumulated benefit obligation |
$ | 888,937 | $ | 679,225 | $ | 733,626 | ||||||
| Unfunded (prepaid) accrued pension cost |
10,777 | (15,406 | ) | (24,544 | ) | |||||||
| Other Postretirement Plans | ||||||||||||
| 2014 | 2013 | 2012 | ||||||||||
| Amounts recognized in the consolidated balance sheets consist of the following: |
||||||||||||
| Accrued benefit obligation—current |
$ | (533 | ) | $ | (583 | ) | $ | (628 | ) | |||
| Accrued benefit obligation—noncurrent |
(6,256 | ) | (8,792 | ) | (10,729 | ) | ||||||
|
|
|
|
|
|
|
|||||||
| Net amount recognized in the consolidated balance sheets |
$ | (6,789 | ) | $ | (9,375 | ) | $ | (11,357 | ) | |||
|
|
|
|
|
|
|
|||||||
| Amounts recognized in accumulated other comprehensive income (loss) consist of the following: |
||||||||||||
| Net gain (loss) |
$ | 1,368 | $ | 1,247 | $ | (1,063 | ) | |||||
|
|
|
|
|
|
|
|||||||
| Net gain (loss) recognized in accumulated other comprehensive income (loss) |
$ | 1,368 | $ | 1,247 | $ | (1,063 | ) | |||||
|
|
|
|
|
|
|
|||||||
| Additional information—unfunded accrued benefit cost |
$ | (8,157 | ) | $ | (10,622 | ) | $ | (10,294 | ) | |||
|
|
|
|
|
|
|
|||||||
| Pension Benefits |
Other Postretirement Benefits |
|||||||
| Amounts expected to be amortized from accumulated other comprehensive loss in the next fiscal year: |
||||||||
| Net loss |
$ | 14,053 | $ | 14 | ||||
| Prior service cost (credit) |
195 | (62 | ) | |||||
|
|
|
|
|
|||||
| Net expected to be amortized |
$ | 14,248 | $ | (48 | ) | |||
|
|
|
|
|
|||||
68
Table of Contents
Weighted average assumptions used to determine benefit obligations at period-end and net pension costs for the last three fiscal years were as follows:
| Pension Benefits | ||||||||||||
| 2014 | 2013 | 2012 | ||||||||||
| Benefit obligation: |
||||||||||||
| Discount rate |
4.25 | % | 5.19 | % | 4.29 | % | ||||||
| Annual compensation increase |
3.60 | % | 3.60 | % | 3.60 | % | ||||||
| Net cost: |
||||||||||||
| Discount rate |
5.19 | % | 4.29 | % | 5.08 | % | ||||||
| Expected return on plan assets |
7.25 | % | 7.25 | % | 7.25 | % | ||||||
| Annual compensation increase |
3.60 | % | 3.60 | % | 4.00 | % | ||||||
| Other Postretirement Plans | ||||||||||||
| 2014 | 2013 | 2012 | ||||||||||
| Benefit obligation—discount rate |
4.05 | % | 4.80 | % | 3.90 | % | ||||||
| Net cost—discount rate |
4.80 | % | 3.90 | % | 4.95 | % | ||||||
The measurement dates for the pension and other postretirement benefit plans were December 27, 2014, December 28, 2013 and December 29, 2012.
A health care cost trend rate is used in the calculations of postretirement medical benefit plan obligations. The assumed healthcare trend rates for the last three fiscal years were as follows:
| 2014 | 2013 | 2012 | ||||||||||
| Immediate rate |
7.10 | % | 7.30 | % | 7.50 | % | ||||||
| Ultimate trend rate |
4.50 | % | 4.50 | % | 4.50 | % | ||||||
| Year the rate reaches the ultimate trend rate |
2028 | 2028 | 2028 | |||||||||
A 1% change in the rate would result in a change to the postretirement medical plan obligation of less than $1 million. Retirees covered under these plans are responsible for the cost of coverage in excess of the subsidy, including all future cost increases.
For guidance in determining the discount rate, the Company determines the implied rate of return on a hypothetical portfolio of high-quality fixed-income investments, for which the timing and amount of cash outflows approximates the estimated pension plan payouts. The discount rate assumption is reviewed annually and revised as appropriate.
The expected long-term rate of return on plan assets is derived from a mathematical asset model. This model incorporates assumptions on the various asset class returns, reflecting a combination of historical performance analysis and the forward-looking views of the financial markets regarding the yield on long-term bonds and the historical returns of the major stock markets. The rate of return assumption is reviewed annually and revised as deemed appropriate.
The investment objective for our Company sponsored plans is to provide a common investment platform. Investment managers—overseen by our Retirement Administration Committee—are expected to adopt and maintain an asset allocation strategy for the plans’ assets designed to address the Retirement Plans’ liability structure. The Company has developed an asset allocation policy and rebalancing policy. We review the major asset classes, through consultation with investment consultants, at least quarterly to determine if the plan assets are performing as expected. The Company’s 2014 strategy targeted a mix of 50% equity securities and 50% long-term debt securities and cash equivalents. The actual mix of investments at December 27, 2014, was 49% equity securities and 51% long-term debt securities and cash equivalents. The Company plans to manage the actual mix of investments to achieve its target mix.
69
Table of Contents
The following table (in thousands) sets forth the fair value of our defined benefit plans’ assets by asset fair value hierarchy level. See Note 4—Fair Value Measurements for a detailed description of the three-tier fair value hierarchy.
| Asset Fair Value as of December 27, 2014 | ||||||||||||||||
| Level 1 | Level 2 | Level 3 | Total | |||||||||||||
| Cash and cash equivalents |
$ | 5,800 | $ | — | $ | — | $ | 5,800 | ||||||||
| Common collective trust funds: |
||||||||||||||||
| Cash equivalents |
— | 3,897 | — | 3,897 | ||||||||||||
| Domestic equities |
— | 259,627 | — | 259,627 | ||||||||||||
| International equities |
— | 48,774 | — | 48,774 | ||||||||||||
| Mutual funds: |
||||||||||||||||
| Domestic equities |
32,348 | — | — | 32,348 | ||||||||||||
| International equities |
23,199 | — | — | 23,199 | ||||||||||||
| Long-term debt securities: |
||||||||||||||||
| Corporate debt securities: |
||||||||||||||||
| Domestic |
— | 199,500 | — | 199,500 | ||||||||||||
| International |
— | 25,633 | — | 25,633 | ||||||||||||
| U.S. government securities |
— | 136,048 | — | 136,048 | ||||||||||||
| Government agencies securities |
— | 10,270 | — | 10,270 | ||||||||||||
| Other |
— | 4,070 | — | 4,070 | ||||||||||||
|
|
|
|
|
|
|
|
|
|||||||||
| $ | 61,347 | $ | 687,819 | $ | — | $ | 749,166 | |||||||||
|
|
|
|
|
|
|
|
|
|||||||||
| Asset Fair Value as of December 28, 2013 | ||||||||||||||||
| Level 1 | Level 2 | Level 3 | Total | |||||||||||||
| Cash and cash equivalents |
$ | 14,624 | $ | — | $ | — | $ | 14,624 | ||||||||
| Common collective trust funds: |
||||||||||||||||
| Cash equivalents |
— | 3,407 | — | 3,407 | ||||||||||||
| Domestic equities |
— | 228,638 | — | 228,638 | ||||||||||||
| International equities |
— | 48,112 | — | 48,112 | ||||||||||||
| Mutual funds: |
||||||||||||||||
| Domestic equities |
31,368 | — | — | 31,368 | ||||||||||||
| International equities |
23,926 | — | — | 23,926 | ||||||||||||
| Long-term debt securities: |
||||||||||||||||
| Corporate debt securities: |
||||||||||||||||
| Domestic |
— | 163,831 | — | 163,831 | ||||||||||||
| International |
— | 20,916 | — | 20,916 | ||||||||||||
| U.S. government securities |
— | 94,891 | — | 94,891 | ||||||||||||
| Government agencies securities |
— | 8,306 | — | 8,306 | ||||||||||||
| Other |
— | 3,730 | — | 3,730 | ||||||||||||
|
|
|
|
|
|
|
|
|
|||||||||
| $ | 69,918 | $ | 571,831 | $ | — | $ | 641,749 | |||||||||
|
|
|
|
|
|
|
|
|
|||||||||
A description of the valuation methodologies used for assets measured at fair value is as follows:
| • | Cash and cash equivalents are valued at original cost plus accrued interest. |
| • | Common collective trust funds are valued at the net asset value of the shares held at the end of the reporting period. This class represents investments in actively managed, common collective trust funds that invest primarily in equity securities, which may include common stocks, options and futures. Investments are valued at the net asset value per share, multiplied by the number of shares held as of the measurement date. |
| • | Mutual funds are valued at the closing price reported on the active market on which individual funds are traded. |
| • | Long-term debt securities are valued at the estimated price a dealer will pay for the individual securities. |
70
Table of Contents
Estimated future benefit payments, under Company sponsored plans as of December 27, 2014, were as follows (in thousands):
| Pension Benefits |
Postretirement Plans |
|||||||
| 2015 |
$ | 33,122 | $ | 533 | ||||
| 2016 |
35,379 | 544 | ||||||
| 2017 |
37,841 | 529 | ||||||
| 2018 |
37,387 | 530 | ||||||
| 2019 |
41,279 | 505 | ||||||
| Subsequent five years |
231,496 | 2,319 | ||||||
Estimated required and discretionary contributions expected to be contributed by the Company to the Retirement Plans in 2015 total $49 million.
Other Company Sponsored Benefit Plans—Employees are eligible to participate in a defined contribution 401(k) plan which provides that under certain circumstances the Company may make matching contributions of up to 50% of the first 6% of a participant’s compensation. The Company’s contributions to this plan were $26 million, $25 million and $25 million in fiscal years 2014, 2013 and 2012, respectively. The Company, at its discretion, may make additional contributions to the 401(k) Plan. The Company made no discretionary contributions under the 401(k) plan in fiscal years 2014, 2013 and 2012.
Multiemployer Pension Plans—The Company contributes to numerous multiemployer pension plans under the terms of collective bargaining agreements that cover certain of its union-represented employees. The Company does not administer these multiemployer pension plans.
The risks of participating in multiemployer pension plans differ from traditional single-employer defined benefit plans as follows:
| • | Assets contributed to a multiemployer pension plan by one employer may be used to provide benefits to the employees of other participating employers |
| • | If a participating employer stops contributing to a multiemployer pension plan, the unfunded obligations of the plan may be borne by the remaining participating employers |
| • | If the Company elects to stop participation in a multiemployer pension plan, it may be required to pay a withdrawal liability based upon the underfunded status of the plan |
The Company’s participation in multiemployer pension plans for the year ended December 27, 2014, is outlined in the tables below. The Company considers significant plans to be those plans to which the Company contributed more than 5% of total contributions to the plan in a given plan year, or for which the Company believes its estimated withdrawal liability—should it decide to voluntarily withdraw from the plan—may be material to the Company. For each plan that is considered individually significant to the Company, the following information is provided:
| • | The EIN/Plan Number column provides the Employee Identification Number (“EIN”) and the three-digit plan number (“PN”) assigned to a plan by the Internal Revenue Service. |
| • | The most recent Pension Protection Act (“PPA”) zone status available for 2014 and 2013 is for the plan years beginning in 2014 and 2013, respectively. The zone status is based on information provided to participating employers by each plan and is certified by the plan’s actuary. A plan in the red zone has been determined to be in critical status, based on criteria established under the Internal Revenue Code (the “Code”), and is generally less than 65% funded. A plan in the yellow zone has been determined to be in endangered status, based on criteria established under the Code, and is generally less than 80% but more than 65% funded. A plan in the green zone has been determined to be neither in critical status nor in endangered status, and is generally at least 80% funded. |
| • | The FIP/RP Status Pending/Implemented column indicates plans for which a financial improvement plan (“FIP”) or a rehabilitation plan (“RP”) is either pending or has been implemented. In addition to regular plan contributions, participating employers may be subject to a surcharge if the plan is in the red zone. |
| • | The Surcharge Imposed column indicates whether a surcharge has been imposed on participating employers contributing to the plan. |
| • | The Expiration Dates column indicates the expiration dates of the collective-bargaining agreements to which the plans are subject. |
71
Table of Contents
| Pension Fund | EIN/ Plan Number |
PPA Zone Status |
FIP/RP Status Pending/ Implemented |
Surcharge Imposed |
Expiration Dates | |||||||
| 2014 | 2013 | |||||||||||
| Central States, Southeast and Southwest Areas Pension Fund |
36-6044243/001 | Red | Red | Implemented | No | 5/10/14(2) to 4/30/16 | ||||||
| Western Conference of Teamsters Pension Trust Fund(1) |
91-6145047/001 | Green | Green | N/A | No | 3/31/2015 to 09/30/20 | ||||||
| Minneapolis Food Distributing Industry Pension Plan(1) |
41-6047047/001 | Green | Green | Implemented | No | 4/1/17 | ||||||
| Teamster Pension Trust Fund of Philadelphia and Vicinity(1) |
23-1511735/001 | Yellow | Yellow | Implemented | No | 2/10/18 | ||||||
| Truck Drivers & Helpers Local 355 Pension Fund(1) |
52-0951433/001 | Yellow | Yellow | Implemented | No | 3/15/15 | ||||||
| Local 703 I.B. of T. Grocery and Food Employees’ Pension Plan |
36-6491473/001 | Green | Green | N/A | No | 6/30/18 | ||||||
| United Teamsters Trust Fund A |
13-5660513/001 | Yellow | Red | Implemented | No | 5/30/15 | ||||||
| Warehouse Employees Local 169 and Employers Joint Pension Fund(1) |
23-6230368/001 | Red | Red | Implemented | No | 2/10/18 | ||||||
| Warehouse Employees Local No. 570 Pension Fund(1) |
52-6048848/001 | Green | Green | N/A | No | 3/15/15 | ||||||
| Local 705 I.B. of T. Pension Trust Fund(1) |
36-6492502/001 | Red | Red | Implemented | Yes | 12/29/18 | ||||||
| (1) | The plan has elected to utilize special amortization provisions provided under the Preservation of Access to Care for Medicare Beneficiaries and Pension Relief Act of 2010. |
| (2) | The collective bargaining agreement for this pension fund is operating under an extension. |
72
Table of Contents
The following table provides information about the Company’s contributions to its multiemployer pension plans. For plans that are not individually significant to the Company, the total amount of USF contributions is aggregated.
| Pension Fund | USF Contribution(1)(2) (in thousands) |
USF Contributions Exceed 5% of Total Plan Contributions(3) | ||||||||||||||
| 2014 | 2013 | 2012 | 2013 | 2012 | ||||||||||||
| Central States, Southeast and Southwest Areas Pension Fund |
$ | 3,930 | $ | 3,908 | $ | 3,389 | No | No | ||||||||
| Western Conference of Teamsters Pension Trust Fund |
9,761 | 9,249 | 8,309 | No | No | |||||||||||
| Minneapolis Food Distributing Industry Pension Plan |
5,026 | 4,565 | 4,235 | Yes | Yes | |||||||||||
| Teamster Pension Trust Fund of Philadelphia and Vicinity |
3,163 | 2,939 | 2,808 | No | No | |||||||||||
| Truck Drivers and Helpers Local 355 Pension Fund |
1,373 | 1,428 | 1,491 | Yes | Yes | |||||||||||
| Local 703 I.B. of T. Grocery and Food Employees’ Pension Plan |
1,282 | 1,036 | 1,017 | Yes | Yes | |||||||||||
| United Teamsters Trust Fund A |
1,537 | 1,816 | 1,144 | Yes | Yes | |||||||||||
| Warehouse Employees Local 169 and Employers Joint Pension Fund |
907 | 981 | 961 | Yes | Yes | |||||||||||
| Warehouse Employees Local No. 570 Pension Fund |
863 | 929 | 969 | Yes | Yes | |||||||||||
| Local 705 I.B. of T. Pension Trust Fund |
2,479 | 2,189 | 2,077 | No | No | |||||||||||
| Other Funds |
1,723 | 1,818 | 1,858 | — | — | |||||||||||
|
|
|
|
|
|
|
|||||||||||
| $ | 32,044 | $ | 30,858 | $ | 28,258 | |||||||||||
|
|
|
|
|
|
|
|||||||||||
| (1) | Contributions made to these plans during the Company’s fiscal year, which may not coincide with the plans’ fiscal years. |
| (2) | Contributions do not include payments related to multiemployer pension withdrawals as described in Note 13—Restructuring and Tangible Asset Impairment Charges. |
| (3) | Indicates whether the Company was listed in the respective multiemployer plan Form 5500 for the applicable plan year as having made more than 5% of total contributions to the plan. |
If the Company elected to voluntarily withdraw from a multiemployer pension plan, it would be responsible for its proportionate share of the plan’s unfunded vested liability. Based on the latest information available from plan administrators, the Company estimates its aggregate withdrawal liability from the multiemployer pension plans in which it participates to be approximately $300 million as of December 27, 2014. This estimate excludes $51 million of multiemployer pension plan withdrawal liabilities recorded in the Company’s Consolidated Balance Sheet related to closed facilities as of December 27, 2014, and as further described in Note 13—Restructuring and Tangible Asset Impairment Charges. Actual withdrawal liabilities incurred by the Company—if it were to withdraw from one or more plans—could be materially different from the estimates noted here, based on better or more timely information from plan administrators or other changes affecting the respective plan’s funded status.
73
Table of Contents
| 18. | CHANGES IN ACCUMULATED OTHER COMPREHENSIVE LOSS |
The following table presents changes in Accumulated Other Comprehensive Income (Loss) by component for the last three fiscal years, (in thousands):
| 2014 | 2013 | 2012 | ||||||||||
| Accumulated Other Comprehensive Loss Components |
||||||||||||
| Defined benefit retirement plans: |
||||||||||||
| Balance at beginning of period(1) |
$ | (2,679 | ) | $ | (125,642 | ) | $ | (111,482 | ) | |||
|
|
|
|
|
|
|
|||||||
| Other comprehensive income (loss) before reclassifications |
(161,331 | ) | 115,014 | (55,340 | ) | |||||||
| Current year prior service cost |
3,612 | — | — | |||||||||
| Amortization of prior service cost (credit) (2) (3) |
(136 | ) | 198 | 102 | ||||||||
| Amortization of net loss(2) (3) |
2,219 | 13,400 | 14,606 | |||||||||
| Settlements(2) (3) |
2,370 | 1,778 | 17,840 | |||||||||
| Curtailment (2) (3) |
(2,096 | ) | — | — | ||||||||
|
|
|
|
|
|
|
|||||||
| Total before income tax |
(155,362 | ) | 130,390 | (22,792 | ) | |||||||
| Income tax provision (benefit) |
— | 7,427 | (8,632 | ) | ||||||||
|
|
|
|
|
|
|
|||||||
| Current period comprehensive income (loss), net of tax |
(155,362 | ) | 122,963 | (14,160 | ) | |||||||
|
|
|
|
|
|
|
|||||||
| Balance at end of period(1) |
$ | (158,041 | ) | $ | (2,679 | ) | $ | (125,642 | ) | |||
|
|
|
|
|
|
|
|||||||
| Interest rate swap derivative cash flow hedge(4): |
||||||||||||
| Balance at beginning of period(1) |
$ | — | $ | (542 | ) | $ | (18,112 | ) | ||||
|
|
|
|
|
|
|
|||||||
| Other comprehensive loss before reclassifications |
(653 | ) | (2,387 | ) | ||||||||
| Amounts reclassified from Other comprehensive income(5) |
— | 2,042 | 30,683 | |||||||||
|
|
|
|
|
|
|
|||||||
| Total before income tax |
— | 1,389 | 28,296 | |||||||||
| Income tax provision |
— | 847 | 10,726 | |||||||||
|
|
|
|
|
|
|
|||||||
| Current period comprehensive income, net of tax |
— | 542 | 17,570 | |||||||||
|
|
|
|
|
|
|
|||||||
| Balance at end of period(1) |
$ | — | $ | — | $ | (542 | ) | |||||
|
|
|
|
|
|
|
|||||||
| (1) | Amounts are presented net of tax. |
| (2) | Included in the computation of net periodic benefit costs. See Note—17 Retirement Plans for additional information. |
| (3) | Included in Distribution, selling and administration expenses in the Consolidated Statements of Comprehensive Income (Loss). |
| (4) | The interest rate swap derivative expired in January 2013. |
| (5) | Included in Interest Expense-Net in the Consolidated Statements of Comprehensive Income (Loss). |
74
Table of Contents
| 19. | INCOME TAXES |
The Income tax provision (benefit) for the last three fiscal years consisted of the following (in thousands):
| 2014 | 2013 | 2012 | ||||||||||
| Current: |
||||||||||||
| Federal |
$ | (146 | ) | $ | (64 | ) | $ | 7 | ||||
| State |
311 | 283 | 299 | |||||||||
|
|
|
|
|
|
|
|||||||
| Current Income tax provision (benefit) |
165 | 219 | 306 | |||||||||
|
|
|
|
|
|
|
|||||||
| Deferred: |
||||||||||||
| Federal |
34,168 | 28,824 | 37,635 | |||||||||
| State |
1,635 | 779 | 4,507 | |||||||||
|
|
|
|
|
|
|
|||||||
| Deferred Income tax provision (benefit) |
35,803 | 29,603 | 42,142 | |||||||||
|
|
|
|
|
|
|
|||||||
| Total Income tax provision (benefit) |
$ | 35,968 | $ | 29,822 | $ | 42,448 | ||||||
|
|
|
|
|
|
|
|||||||
The Company’s effective income tax rates for the fiscal years ended December 27, 2014, December 28, 2013 and December 29, 2012 and were 97%, 109% and 487%, respectively. The determination of the Company’s overall effective tax rate requires the use of estimates. The effective tax rate reflects the income earned and taxed in U.S. federal and various state jurisdictions. Tax law changes, increases and decreases in permanent differences between book and tax items, changes in valuation allowances, tax credits and the Company’s change in income from each jurisdiction all affect the overall effective tax rate.
The reconciliation of the provisions for income taxes from continuing operations at the U.S. federal statutory income tax rate of 35% to the Company’s income taxes for the last three fiscal is as follows (in thousands):
| 2014 | 2013 | 2012 | ||||||||||
| Federal income tax benefit computed at statutory rate |
$ | (12,931 | ) | $ | (9,585 | ) | $ | (3,054 | ) | |||
| State income taxes—net of federal income tax benefit |
(1,532 | ) | (2,415 | ) | (24 | ) | ||||||
| Statutory rate and apportionment change |
(321 | ) | 406 | (1,000 | ) | |||||||
| Stock-based compensation |
131 | 5,342 | — | |||||||||
| Non-deductible expenses |
2,592 | 2,153 | 2,215 | |||||||||
| Return to accrual reconciliation |
12 | (335 | ) | 29 | ||||||||
| Change in the valuation allowance for deferred tax assets |
54,571 | 32,445 | 43,748 | |||||||||
| Net operating loss expirations |
2,019 | 1,653 | 634 | |||||||||
| Tax credits |
(8,179 | ) | — | — | ||||||||
| Other |
(394 | ) | 158 | (100 | ) | |||||||
|
|
|
|
|
|
|
|||||||
| Total Income tax provision |
$ | 35,968 | $ | 29,822 | $ | 42,448 | ||||||
|
|
|
|
|
|
|
|||||||
75
Table of Contents
Temporary differences and carryforwards that created significant deferred tax assets and liabilities were as follows (in thousands):
| December 27, | December 28, | |||||||
| 2014 | 2013 | |||||||
| Deferred tax assets: |
||||||||
| Allowance for doubtful accounts |
$ | 10,794 | $ | 10,838 | ||||
| Accrued employee benefits |
30,689 | 28,931 | ||||||
| Restructuring reserves |
29,500 | 36,649 | ||||||
| Workers’ compensation, general liability and auto liabilities |
62,493 | 59,845 | ||||||
| Deferred income |
539 | 1,287 | ||||||
| Deferred financing costs |
9,466 | 9,362 | ||||||
| Pension liability |
72,747 | 22,616 | ||||||
| Net operating loss carryforwards |
217,960 | 215,177 | ||||||
| Other accrued expenses |
25,300 | 16,447 | ||||||
|
|
|
|
|
|||||
| Total gross deferred tax assets |
459,488 | 401,152 | ||||||
| Less valuation allowance |
(232,163 | ) | (117,227 | ) | ||||
|
|
|
|
|
|||||
| Total net deferred tax assets |
227,325 | 283,925 | ||||||
|
|
|
|
|
|||||
| Deferred tax liabilities: |
||||||||
| Property and equipment |
(152,622 | ) | (148,976 | ) | ||||
| Inventories |
(17,166 | ) | (13,657 | ) | ||||
| Intangibles |
(487,935 | ) | (515,888 | ) | ||||
|
|
|
|
|
|||||
| Total deferred tax liabilities |
(657,723 | ) | (678,521 | ) | ||||
|
|
|
|
|
|||||
| Net deferred tax liability |
$ | (430,398 | ) | $ | (394,596 | ) | ||
|
|
|
|
|
|||||
The net deferred tax liability presented in the Consolidated Balance Sheets was as follows (in thousands):
| December 27 2014 |
December 28, 2013 |
|||||||
| Current deferred tax asset (liability) |
$ | (10,079 | ) | $ | 13,557 | |||
| Noncurrent deferred tax liability |
(420,319 | ) | (408,153 | ) | ||||
|
|
|
|
|
|||||
| Net deferred tax liability |
$ | (430,398 | ) | $ | (394,596 | ) | ||
|
|
|
|
|
|||||
As of December 27, 2014, the Company had tax affected federal and state net operating loss carryforwards of $129 million and $89 million, respectively, which will expire at various dates from 2015 to 2034.
The Company’s net operating loss carryforwards expire as follows (in millions):
| Federal | State | Total | ||||||||||
| 2015-2019 |
$ | 8 | $ | 14 | $ | 22 | ||||||
| 2020-2024 |
— | 46 | 46 | |||||||||
| 2025-2029 |
94 | 22 | 116 | |||||||||
| 2030-2034 |
27 | 7 | 34 | |||||||||
|
|
|
|
|
|
|
|||||||
| $ | 129 | $ | 89 | $ | 218 | |||||||
|
|
|
|
|
|
|
|||||||
The Company also has federal minimum tax credit carryforwards of approximately $1 million, research and development credit carryforwards of $6 million and other state credit carryforwards of $1 million.
76
Table of Contents
The federal and state net operating loss carryforwards in the income tax returns filed included unrecognized tax benefits taken in prior years. The net operating losses for which a deferred tax asset is recognized for financial statement purposes in accordance with ASC 740 are presented net of these unrecognized tax benefits.
Because of the change of ownership provisions of the Tax Reform Act of 1986, use of a portion of the Company’s domestic net operating losses and tax credit carryforwards may be limited in future periods. Further, a portion of the carryforwards may expire before being applied to reduce future income tax liabilities.
The Company believes that it is more likely than not that the benefit from certain federal and state net operating loss carryforwards will not be realized. In recognition of this risk, as of December 27, 2014, the Company has provided a valuation allowance of $139 million and $93 million for federal and state net operating loss carryforwards, respectively, based upon expected future utilization relating to these federal and state net operating loss carryforwards. If the Company’s assumptions change and the Company determines it will be able to realize these net operating losses, the tax benefits relating to any reversal of the valuation allowance on deferred tax assets as of December 27, 2014, will be accounted for as follows: approximately $142 million will be recognized as a reduction of income tax expense and $90 million will be recorded as an increase in equity.
A summary of the activity in the valuation allowance for the last three fiscal years is as follows (in thousands):
| 2014 | 2013 | 2012 | ||||||||||
| Balance at beginning of period |
$ | 117,227 | $ | 128,844 | $ | 85,685 | ||||||
| Charged to expense |
54,571 | 32,445 | 43,748 | |||||||||
| Other comprehensive income |
60,340 | (43,079 | ) | — | ||||||||
| Other |
25 | (983 | ) | (589 | ) | |||||||
|
|
|
|
|
|
|
|||||||
| Balance at end of period |
$ | 232,163 | $ | 117,227 | $ | 128,844 | ||||||
|
|
|
|
|
|
|
|||||||
Changes in tax laws and rates may affect recorded deferred tax assets and liabilities and the Company’s effective tax rate in the future.
The calculation of the Company’s tax liabilities involves dealing with uncertainties in the application of complex tax laws and regulations in federal and state jurisdictions. ASC 740 states that a tax benefit from an uncertain tax position may be recognized when it is more likely than not that the position will be sustained upon examination, including resolutions of any related appeals or litigation processes, on the basis of the technical merits.
The Company 1) records unrecognized tax benefits as liabilities in accordance with ASC 740, and 2) adjusts these liabilities when the Company’s judgment changes because of the evaluation of new information not previously available. Because of the complexity of some of these uncertainties, the ultimate resolution may result in a payment that is materially different from the current estimate of unrecognized tax benefit liabilities. These differences will be reflected as increases or decreases to income tax expense in the period in which new information is available.
77
Table of Contents
The Company recognizes an uncertain tax position when it is more likely than not that the position will be sustained upon examination—including resolutions of any related appeals or litigation processes—based on the technical merits.
Reconciliation of the beginning and ending amount of unrecognized tax benefits as of fiscal years 2014, 2013, and 2012 was as follows (in thousands):
| Balance at December 31, 2011 |
$ | 60,398 | ||
| Gross decreases due to positions taken in prior years |
(333 | ) | ||
| Gross increases due to positions taken in current year |
71 | |||
| Decreases due to lapses of statute of limitations |
(73 | ) | ||
| Decreases due to changes in tax rates |
(436 | ) | ||
|
|
|
|||
| Balance at December 29, 2012 |
59,627 | |||
| Gross increases due to positions taken in prior years |
46 | |||
| Gross increases due to positions taken in current year |
76 | |||
| Decreases due to lapses of statute of limitations |
(207 | ) | ||
| Decreases due to changes in tax rates |
(251 | ) | ||
|
|
|
|||
| Balance at December 28, 2013 |
59,291 | |||
| Gross decreases due to positions taken in prior years |
(11,392 | ) | ||
| Gross increases due to positions taken in current year |
63 | |||
| Decreases due to lapses of statute of limitations |
(362 | ) | ||
| Decreases due to changes in tax rates |
(1,016 | ) | ||
|
|
|
|||
| Balance at December 27, 2014 |
$ | 46,584 | ||
|
|
|
We do not believe it is reasonably possible that a significant increase in unrecognized tax benefits related to state exposures may be necessary in the coming year. In addition, the Company believes that it is reasonably possible that an insignificant amount of its currently remaining unrecognized tax benefits may be recognized by the end of 2014 as a result of a lapse of the statute of limitations. As of December 28, 2013, the Company did not believe that it was reasonably possible that a significant decrease in unrecognized tax benefits related to state tax exposures would have occurred during fiscal 2014. During the year ended December 27, 2014, unrecognized tax benefits related to those state exposures actually decreased by $0.4 million, as illustrated in the table above.
Included in the balance of unrecognized tax benefits at the ends of fiscal 2014, 2013 and 2012 was $41 million, $53 million and $53 million, respectively, of tax benefits that, if recognized, would affect the effective tax rate. Also included in the balance of unrecognized tax benefits as of those periods was $39 million, $51 million, and $51 million, respectively, of tax benefits that, if recognized, would result in adjustments to other tax accounts—primarily deferred taxes.
The Company recognizes interest and penalties related to uncertain tax positions in Interest expense—net in the Consolidated Statements of Comprehensive Income (Loss). As of December 27, 2014, the Company had approximately $2 million of accrued interest and penalties related to uncertain tax positions.
The Company files U.S. federal and state income tax returns in jurisdictions with varying statutes of limitations. Our 2007 through 2013 U.S. federal tax years, and various state tax years from 2000 through 2013, remain subject to income tax examinations by the relevant taxing authorities. Ahold has indemnified the Company for 2007 Transaction pre-closing consolidated federal and certain combined state income taxes, and the Company is responsible for all other taxes, and interest and penalties.
On September 13, 2013 the U.S. Treasury Department and the IRS issued final regulations that address costs incurred in acquiring, producing, or improving tangible property (the “tangible property regulations”). The tangible property regulations are generally effective for tax years beginning on or after January 1, 2014. The Company’s adoption of the tangible property regulations in the first quarter of 2014 had no impact on the Company’s financial position, results of operations or cash flows.
| 20. | BUSINESS ACQUISITIONS |
During 2013, the Company purchased a foodservice distributor for cash of $14 million, plus contingent consideration of $2 million that was paid in 2014. During 2012, the Company purchased five foodservice distributors for cash of $106 million, plus contingent consideration of $6 million that was paid in 2013. The Company also received a $2 million purchase price adjustment in 2013 related to two 2012 acquisitions. The acquisitions, made in order to expand the
78
Table of Contents
Company’s presence in certain geographic areas, were purchases which have been integrated into our foodservice distribution network. There were no business acquisitions in 2014. The following table summarizes the purchase price allocations for the 2013 and 2012 business acquisitions as follows (in thousands):
| 2013 | 2012 | |||||||
| Accounts receivable |
$ | 3,894 | $ | 24,261 | ||||
| Inventories |
3,638 | 26,076 | ||||||
| Property and equipment |
125 | 21,107 | ||||||
| Goodwill |
— | 17,389 | ||||||
| Other intangible assets |
8,348 | 44,755 | ||||||
| Accounts payable |
(2,120 | ) | (17,584 | ) | ||||
| Accrued expenses and other current liabilities |
(130 | ) | (8,930 | ) | ||||
| Other long-term liabilities |
— | (3,419 | ) | |||||
|
|
|
|
|
|||||
| Cash used in acquisitions |
$ | 13,755 | $ | 103,655 | ||||
|
|
|
|
|
|||||
The 2013 and 2012 acquisitions, individually and in the aggregate, did not materially affect the Company’s results of operations or financial position. Actual net sales and operating earnings of the businesses acquired in both periods were less than 2% of the Company’s consolidated results and, therefore, pro forma information has not been provided.
| 21. | COMMITMENTS AND CONTINGENCIES |
Purchase Commitments—The Company enters into purchase orders with vendors and other parties in the ordinary course of business. Additionally, the Company has a limited number of purchase contracts with certain vendors that require it to buy a predetermined volume of products, which are not recorded in the Consolidated Balance Sheets. As of December 27, 2014, the Company’s purchase orders and purchase contracts with vendors, all to be delivered in 2015, were $646 million.
To minimize the Company’s fuel cost risk, it enters into forward purchase commitments for a portion of our projected diesel fuel requirements. At December 27, 2014, the Company had diesel fuel forward purchase commitments totaling $177 million through December 2016. The Company also enters into forward purchase agreements for procuring electricity. At December 27, 2014, the Company had electricity forward purchase commitments totaling $10 million through December 2016. The Company does not measure its forward purchase commitments for fuel and electricity at fair value as the amounts contracted for are used in its operations.
Retention and Transaction Bonuses—As part of the Merger Agreement described in Note 1—Overview and Basis of Presentation, Proposed Acquisition by Sysco, the Company was given rights to offer retention and transaction bonuses to certain current employees that are integral to the successful completion of the transaction. The Company was approved to offer a maximum of $31.5 million and $10 million of retention bonuses and transaction bonuses, respectively. Additionally, the Company’s Chief Executive Officer (“CEO”) has agreed to reduce his continuation of base salary and bonus amounts by $3 million to be allocated at his discretion as bonuses to current employees (other than himself). The retention, transaction and other bonus payments are subject to consummation of the Acquisition and are payable on or after the transaction date. As of December 27, 2014, the Company has not and is not required to record a liability for these bonuses until the Acquisition is consummated.
In February 2015, the Company approved payment of transaction and retention bonuses at specific future dates even if the Acquisition is not consummated. The Company will record compensation costs beginning in February 2015.
Indemnification by Ahold for Certain Matters–In connection with the 2007 sale of US Foods to USF Holding, a corporation formed and controlled by investment funds associated with or managed by CD&R and KKR, by Ahold in 2007 (the “2007 Transaction”), Ahold committed to indemnify and hold harmless the Company from and against damages (which includes losses, liabilities, obligations, and claims of any kind) and litigation costs (including attorneys’ fees and expenses) suffered, incurred or paid after the 2007 Transaction closing date related to certain matters (see discussion of “2006 Pricing Litigation”).
2006 Pricing Litigation–In October 2006, two customers filed a putative class action against the Company and Ahold. In December 2006, an amended complaint named a third plaintiff. The complaint focuses on certain pricing practices of the Company in contracts with some customers. In February 2007, the Company filed a motion to dismiss the complaint. In August 2007, two additional customers filed punitive class action complaints. These two additional lawsuits are based upon the pricing practices at issue in the October 2006 case.
In November 2007, the Judicial Panel on Multidistrict Litigation ordered the transfer of the two additional lawsuits to the jurisdiction in which the first lawsuit was filed—the U.S. District Court for the District of Connecticut—for consolidated or coordinated proceedings. In June 2008, the Plaintiffs filed their consolidated and amended class action complaint. The Company moved to dismiss this complaint. In August 2009, the Plaintiffs filed a motion for class certification. In December 2009, the court issued a ruling on the Company’s motion to dismiss. It dismissed Ahold from the case and also dismissed certain of the plaintiffs’ claims.
On November 30, 2011, the court issued its ruling granting the plaintiffs’ motion to certify the class. On April 4, 2012, the U.S. Court of Appeals for the Second Circuit granted the Company’s request to appeal the district court’s decision which granted class certification. Oral argument was held and the court upheld the grant of class certification. The Company filed a writ of certiorari to the U.S. Supreme Court which was denied on April 29, 2014.
In December 2014, the United States District Court of Connecticut finalized the settlement agreement under which Ahold paid $297 million to the settlement fund and the Company was released from all claims. Ahold had indemnified the Company in regards to this matter and, as a consequence, payment of the settlement by Ahold did not impact the Company’s financial position, results of operations or cash flows.
Florida State Pricing Subpoena–On May 5, 2011, the State of Florida Department of Financial Services issued a subpoena to the Company requesting a broad range of information regarding vendor information, logistics/freight as well as pricing, allowances, and rebates that the Company obtained from the sale of products and services for the term of the contract. The subpoena focuses on all pricing and rebates earned during this period relative to the Florida Department of Corrections. The Company also learned of two qui tam suits, filed in Florida state court, against the Company, one of which was filed by a former official in the Florida Department of Corrections. The complaints are sealed and no additional information is presently available about the nature of either suit, the claims alleged or remedies sought.
The Company has engaged in ongoing discussions to seek resolution of this matter and continues to cooperate with the State of Florida by providing the requested documentation. The Company does not believe at this time that an unfavorable outcome from this matter is probable and, accordingly, no such liability has been recorded. Due to the inherent uncertainty of legal proceedings, it is reasonably possible the Company could suffer a loss as a result of this matter; however, an estimate of a possible loss or range of loss from this matter cannot be made at this time.
79
Table of Contents
Other Pricing Related Matters–The Company has received a request for information from the Office of the Attorney General of the State of California seeking information regarding our California customers from 2001 to present. The Company is cooperating with the investigation.
The Company does not believe at this time that an unfavorable outcome from this matter is probable and, accordingly, no such liability has been recorded. Due to the inherent uncertainty of legal proceedings, it is reasonably possible the Company could suffer a loss as a result of this matter; however, an estimate of a possible loss or range of loss from this matter cannot be made at this time.
At this stage, the Company cannot determine the likelihood of success of any of the above pricing related claims or the potential liability if they are successful and therefore there can be no assurance that an adverse determination with respect to any pricing related matter would not have a material adverse effect on our financial condition.
Eagan Labor Dispute–In 2008, the Company closed its Eagan, Minnesota and Fairfield, Ohio divisions, and recorded a liability of approximately $40 million for the related multiemployer pension withdrawal liability. In 2010, the Company received formal notice and demand for payment of a $40 million withdrawal liability, which is payable in monthly installments through November 2023. During the 2011 fiscal third quarter, the Company was assessed an additional $17 million multiemployer pension withdrawal liability for the Eagan facility. The parties agreed to arbitrate this matter, and discovery began during the fiscal third quarter of 2012. The parties engaged in good faith settlement negotiations during the fiscal third and fourth quarters of 2013. The arbitration and related discovery were stayed pending settlement negotiations. The negotiations reached an unexpected impasse and ceased in December 2013. The arbitrator ruled that the only contested issue is a legal question and ordered the parties to submit cross motions for summary judgment. The parties submitted stipulated facts and cross motions for summary judgment in January 2015. After review, the arbitrator will issue an interim award. Discovery is stayed pending the arbitrator’s ruling. The Company believes it have meritorious defenses against the assessment for the additional pension withdrawal liability. The Company does not believe, at this time, that a loss from such obligation is probable and, accordingly, no liability has been recorded. However, it is reasonably possible the Company may ultimately be required to pay an amount up to $17 million.
Other Legal Proceedings–In addition to those described above, the Company and its subsidiaries are parties to a number of other legal proceedings arising from the normal course of business. These legal proceedings—whether pending, threatened or unasserted—if decided adversely to or settled by the Company, may result in liabilities material to its financial position, results of operations, or cash flows. The Company has recognized provisions with respect to the proceedings where appropriate. These are reflected in the Consolidated Balance Sheets. It is possible that the Company could be required to make expenditures in excess of the established provisions, in amounts that cannot be reasonably estimated. However, the Company believes that the ultimate resolution of these proceedings will not have a material adverse effect on its consolidated financial position, results of operations, or cash flows. It is the Company’s policy to expense attorney fees as incurred.
Insurance Recoveries—Tornado Loss—On April 28, 2014, a tornado damaged a distribution facility and its contents, including building improvements, equipment and inventory. In order to service customers, business from the damaged facility was reassigned to other Company distribution facilities. The Company has insurance coverage on the distribution facility and its contents, as well as business interruption insurance. The Company’s insurance policies provide for recoveries of the damaged property at replacement value and the damaged inventory at the greater of 1) expected selling price less unincurred selling costs or 2) cost plus 10%. Discussions are underway with the insurance carrier regarding the Company’s claims on the loss of the building and its contents, and the loss related to the business interruption. Anticipated insurance recoveries related to losses and incremental costs incurred are recognized when receipt is probable. Anticipated insurance recoveries in excess of net book value of the damaged property and inventory will not be recorded until all contingencies relating to the claim have been resolved. The timing of and amounts of ultimate insurance recoveries is not known at this time.
As a result of the tornado damage, the Company recorded a tangible asset impairment charge of $3 million and a net charge to cost of goods sold of $14 million for damaged inventory. In addition, the Company has incurred costs of $3 million for the 52-weeks ended December 27, 2014, including debris removal and clean-up costs, subject to coverage under its insurance policies. At December 27, 2014, these charges are offset by $14 million of initial advance payments received from insurance carriers and a receivable for insurance recoveries of $6 million that the Company has deemed as probable of recovery. The Company has classified the $4 million of insurance recoveries related to the damaged distribution facility assets as cash flows from investing activities and the $10 million of insurance recoveries related to damaged inventory and other costs incurred as cash flows from operating activities in its consolidated statement of cash flows.
In addition, the Company has incurred costs of $16 million for the 52-weeks ended December 27, 2014 subject to coverage under the Company’s insurance policies.
80
Table of Contents
| 22. | GUARANTOR AND NON-GUARANTOR CONDENSED CONSOLIDATING FINANCIAL INFORMATION |
The following consolidating schedules present condensed financial information of 1) the Company, and 2) certain of its subsidiaries (Guarantors) that guarantee certain Company obligations (the Senior Notes, the ABL Facility, and the Amended 2011 Term Loan), and 3) its other subsidiaries (Non-Guarantors). The Guarantors under the Senior Notes are identical to the Guarantors under the ABL Facility and the Amended 2011 Term Loan. Separate financial statements and other disclosures with respect to the Guarantor subsidiaries have not been provided. This is because the Company believes the following information is sufficient, as the Guarantor subsidiaries are 100% owned by the Company, and all guarantees under the Senior Notes are full and unconditional and joint and several, subject to certain release provisions that the Company has concluded are customary and, therefore, consistent with the Company’s ability to present condensed financial information of the Guarantors. Under the Senior Notes, a Guarantor subsidiary’s guarantee may be released when any of the following occur: 1) the sale of the Guarantor subsidiary or all of its assets, 2) a merger or consolidation of the Guarantor subsidiary with and into the Company or another Guarantor subsidiary, 3) upon the liquidation of the Guarantor subsidiary following the transfer of all of its assets to the Company or another Guarantor subsidiary, 4) the rating on the securities is changed to investment grade, 5) the requirements for legal defeasance or covenant defeasance or discharge of the obligation have been satisfied, 6) the Guarantor subsidiary is declared unrestricted for covenant purposes, or 7) the Guarantor subsidiary’s guarantee of other indebtedness is terminated or released.
Notwithstanding these customary release provisions under the Senior Notes, 1) each subsidiary guarantee is in place throughout the life of the Senior Notes, and no Guarantor may elect to opt out or cancel its guarantee solely at its option; 2) there are no restrictions, limitations or caps on the guarantees; and 3) there are no provisions that would delay the payments that would be required of the Guarantors under the guarantees.
Condensed Consolidating Balance Sheet
December 27, 2014
(in thousands)
| US Foods, Inc. | Guarantors | Non-Guarantors | Eliminations | Consolidated | ||||||||||||||||
| Accounts receivable—net |
$ | 295,467 | $ | 32,047 | $ | 925,224 | $ | — | $ | 1,252,738 | ||||||||||
| Inventories—net |
995,175 | 55,723 | — | — | 1,050,898 | |||||||||||||||
| Other current assets |
441,681 | 7,680 | 76,916 | — | 526,277 | |||||||||||||||
| Property and equipment—net |
913,109 | 85,790 | 727,684 | — | 1,726,583 | |||||||||||||||
| Goodwill |
3,835,477 | — | — | — | 3,835,477 | |||||||||||||||
| Other intangibles—net |
602,827 | — | — | — | 602,827 | |||||||||||||||
| Investments in subsidiaries |
1,360,497 | — | — | (1,360,497 | ) | — | ||||||||||||||
| Intercompany receivables |
— | 647,466 | — | (647,466 | ) | — | ||||||||||||||
| Other assets |
54,317 | 10 | 31,187 | (23,200 | ) | 62,314 | ||||||||||||||
|
|
|
|
|
|
|
|
|
|
|
|||||||||||
| Total assets |
$ | 8,498,550 | $ | 828,716 | $ | 1,761,011 | $ | (2,031,163 | ) | $ | 9,057,114 | |||||||||
|
|
|
|
|
|
|
|
|
|
|
|||||||||||
| Accounts payable |
$ | 1,118,298 | $ | 40,862 | $ | — | $ | — | $ | 1,159,160 | ||||||||||
| Other current liabilities |
645,659 | 17,594 | 3,174 | 666,427 | ||||||||||||||||
| Long-term debt |
3,557,470 | 30,412 | 1,108,391 | — | 4,696,273 | |||||||||||||||
| Intercompany payables |
624,413 | — | 23,053 | (647,466 | ) | — | ||||||||||||||
| Other liabilities |
887,994 | — | 5,744 | (23,200 | ) | 870,538 | ||||||||||||||
| Shareholder’s equity |
1,664,716 | 739,848 | 620,649 | (1,360,497 | ) | 1,664,716 | ||||||||||||||
|
|
|
|
|
|
|
|
|
|
|
|||||||||||
| Total liabilities and shareholder’s equity |
$ | 8,498,550 | $ | 828,716 | $ | 1,761,011 | $ | (2,031,163 | ) | $ | 9,057,114 | |||||||||
|
|
|
|
|
|
|
|
|
|
|
|||||||||||
81
Table of Contents
Condensed Consolidating Balance Sheet
December 28, 2013
(in thousands)
| US Foods, Inc. | Guarantors | Non-Guarantors | Eliminations | Consolidated | ||||||||||||||||
| Accounts receivable—net |
$ | 281,242 | $ | 30,023 | $ | 914,454 | $ | — | $ | 1,225,719 | ||||||||||
| Inventories—net |
1,103,180 | 58,378 | — | — | 1,161,558 | |||||||||||||||
| Other current assets |
299,053 | 6,989 | 81,422 | — | 387,464 | |||||||||||||||
| Property and equipment—net |
881,110 | 88,150 | 779,235 | — | 1,748,495 | |||||||||||||||
| Goodwill |
3,835,477 | — | — | — | 3,835,477 | |||||||||||||||
| Other intangibles—net |
753,840 | — | — | — | 753,840 | |||||||||||||||
| Investments in subsidiaries |
1,341,633 | — | — | (1,341,633 | ) | — | ||||||||||||||
| Intercompany receivables |
— | 614,377 | — | (614,377 | ) | — | ||||||||||||||
| Other assets |
63,461 | 10 | 32,753 | (23,200 | ) | 73,024 | ||||||||||||||
|
|
|
|
|
|
|
|
|
|
|
|||||||||||
| Total assets |
$ | 8,558,996 | $ | 797,927 | $ | 1,807,864 | $ | (1,979,210 | ) | $ | 9,185,577 | |||||||||
|
|
|
|
|
|
|
|
|
|
|
|||||||||||
| Accounts payable |
$ | 1,145,381 | $ | 36,071 | $ | — | $ | — | $ | 1,181,452 | ||||||||||
| Other current liabilities |
624,189 | 16,212 | 3,828 | — | 644,229 | |||||||||||||||
| Long-term debt |
3,554,812 | 22,045 | 1,158,391 | — | 4,735,248 | |||||||||||||||
| Intercompany payables |
592,482 | — | 21,895 | (614,377 | ) | — | ||||||||||||||
| Other liabilities |
760,445 | — | 5,716 | (23,200 | ) | 742,961 | ||||||||||||||
| Shareholder’s equity |
1,881,687 | 723,599 | 618,034 | (1,341,633 | ) | 1,881,687 | ||||||||||||||
|
|
|
|
|
|
|
|
|
|
|
|||||||||||
| Total liabilities and shareholder’s equity |
$ | 8,558,996 | $ | 797,927 | $ | 1,807,864 | $ | (1,979,210 | ) | $ | 9,185,577 | |||||||||
|
|
|
|
|
|
|
|
|
|
|
|||||||||||
Condensed Consolidating Statement of Comprehensive Income (Loss)
Fiscal Year Ended December 27, 2014
(in thousands)
| US Foods, Inc. | Guarantors | Non-Guarantors | Eliminations | Consolidated | ||||||||||||||||
| Net sales |
$ | 22,409,960 | $ | 609,841 | $ | 95,594 | $ | (95,594 | ) | $ | 23,019,801 | |||||||||
| Cost of goods sold |
18,736,044 | 486,048 | — | — | 19,222,092 | |||||||||||||||
|
|
|
|
|
|
|
|
|
|
|
|||||||||||
| Gross profit |
3,673,916 | 123,793 | 95,594 | (95,594 | ) | 3,797,709 | ||||||||||||||
| Operating expenses: |
||||||||||||||||||||
| Distribution, selling and administrative costs |
3,515,516 | 94,782 | 50,116 | (114,961 | ) | 3,545,453 | ||||||||||||||
|
|
|
|
|
|
|
|
|
|
|
|||||||||||
| Total operating expenses |
3,515,516 | 94,782 | 50,116 | (114,961 | ) | 3,545,453 | ||||||||||||||
|
|
|
|
|
|
|
|
|
|
|
|||||||||||
| Operating income |
158,400 | 29,011 | 45,478 | 19,367 | 252,256 | |||||||||||||||
| Interest expense—net |
242,872 | 1,655 | 44,675 | — | 289,202 | |||||||||||||||
| Other expense (income)—net |
107,442 | (19,367 | ) | (107,442 | ) | 19,367 | — | |||||||||||||
|
|
|
|
|
|
|
|
|
|
|
|||||||||||
| Income (loss) before income taxes |
(191,914 | ) | 46,723 | 108,245 | — | (36,946 | ) | |||||||||||||
| Income tax provision |
4,584 | — | 31,384 | — | 35,968 | |||||||||||||||
| Equity in earnings of subsidiaries |
123,584 | — | — | (123,584 | ) | — | ||||||||||||||
|
|
|
|
|
|
|
|
|
|
|
|||||||||||
| Net income (loss) |
(72,914 | ) | 46,723 | 76,861 | (123,584 | ) | (72,914 | ) | ||||||||||||
| Other comprehensive loss |
(155,362 | ) | — | — | — | (155,362 | ) | |||||||||||||
|
|
|
|
|
|
|
|
|
|
|
|||||||||||
| Comprehensive income (loss) |
$ | (228,276 | ) | $ | 46,723 | $ | 76,861 | $ | (123,584 | ) | $ | (228,276 | ) | |||||||
|
|
|
|
|
|
|
|
|
|
|
|||||||||||
82
Table of Contents
Condensed Consolidating Statement of Comprehensive Income (Loss)
Fiscal Year Ended December 28, 2013
(in thousands)
| US Foods, Inc. | Guarantors | Non-Guarantors | Eliminations | Consolidated | ||||||||||||||||
| Net sales |
$ | 21,733,839 | $ | 563,339 | $ | 94,337 | $ | (94,337 | ) | $ | 22,297,178 | |||||||||
| Cost of goods sold |
18,028,018 | 446,021 | — | — | 18,474,039 | |||||||||||||||
|
|
|
|
|
|
|
|
|
|
|
|||||||||||
| Gross profit |
3,705,821 | 117,318 | 94,337 | (94,337 | ) | 3,823,139 | ||||||||||||||
| Operating expenses: |
||||||||||||||||||||
| Distribution, selling and administrative costs |
3,454,223 | 92,710 | 59,572 | (112,251 | ) | 3,494,254 | ||||||||||||||
| Restructuring and tangible asset impairment charges |
6,996 | — | 1,390 | — | 8,386 | |||||||||||||||
|
|
|
|
|
|
|
|
|
|
|
|||||||||||
| Total operating expenses |
3,461,219 | 92,710 | 60,962 | (112,251 | ) | 3,502,640 | ||||||||||||||
|
|
|
|
|
|
|
|
|
|
|
|||||||||||
| Operating income |
244,602 | 24,608 | 33,375 | 17,914 | 320,499 | |||||||||||||||
| Interest expense—net |
260,939 | 768 | 44,380 | — | 306,087 | |||||||||||||||
| Loss on extinguishment of debt |
41,796 | — | — | — | 41,796 | |||||||||||||||
| Other expense (income)—net |
107,433 | (17,914 | ) | (107,433 | ) | 17,914 | — | |||||||||||||
|
|
|
|
|
|
|
|
|
|
|
|||||||||||
| Income (loss) before income taxes |
(165,566 | ) | 41,754 | 96,428 | — | (27,384 | ) | |||||||||||||
| Income tax provision |
1,719 | — | 28,103 | — | 29,822 | |||||||||||||||
| Equity in earnings of subsidiaries |
110,079 | — | — | (110,079 | ) | — | ||||||||||||||
|
|
|
|
|
|
|
|
|
|
|
|||||||||||
| Net income (loss) |
(57,206 | ) | 41,754 | 68,325 | (110,079 | ) | (57,206 | ) | ||||||||||||
| Other comprehensive income |
123,505 | — | — | — | 123,505 | |||||||||||||||
|
|
|
|
|
|
|
|
|
|
|
|||||||||||
| Comprehensive income (loss) |
$ | 66,299 | $ | 41,754 | $ | 68,325 | $ | (110,079 | ) | $ | 66,299 | |||||||||
|
|
|
|
|
|
|
|
|
|
|
|||||||||||
Condensed Consolidating Statement of Comprehensive Income (Loss)
Fiscal Year Ended December 29, 2012
(in thousands)
| US Foods, Inc. | Guarantors | Non-Guarantors | Eliminations | Consolidated | ||||||||||||||||
| Net sales |
$ | 21,087,568 | $ | 577,353 | $ | 94,387 | $ | (94,387 | ) | $ | 21,664,921 | |||||||||
| Cost of goods sold |
17,503,932 | 468,017 | — | — | 17,971,949 | |||||||||||||||
|
|
|
|
|
|
|
|
|
|
|
|||||||||||
| Gross profit |
3,583,636 | 109,336 | 94,387 | (94,387 | ) | 3,692,972 | ||||||||||||||
| Operating expenses: |
||||||||||||||||||||
| Distribution, selling and administrative costs |
3,306,527 | 95,300 | 58,883 | (111,171 | ) | 3,349,539 | ||||||||||||||
| Restructuring and tangible asset impairment charges |
6,158 | — | 2,765 | — | 8,923 | |||||||||||||||
|
|
|
|
|
|
|
|
|
|
|
|||||||||||
| Total operating expenses |
3,312,685 | 95,300 | 61,648 | (111,171 | ) | 3,358,462 | ||||||||||||||
|
|
|
|
|
|
|
|
|
|
|
|||||||||||
| Operating income |
270,951 | 14,036 | 32,739 | 16,784 | 334,510 | |||||||||||||||
| Interest expense—net |
265,719 | 19 | 46,074 | — | 311,812 | |||||||||||||||
| Loss on extinguishment of debt |
30,627 | — | 796 | — | 31,423 | |||||||||||||||
| Other expense (income)—net |
100,078 | (16,784 | ) | (100,078 | ) | 16,784 | — | |||||||||||||
|
|
|
|
|
|
|
|
|
|
|
|||||||||||
| Income (loss) before income taxes |
(125,473 | ) | 30,801 | 85,947 | — | (8,725 | ) | |||||||||||||
| Income tax provision |
13,767 | — | 28,681 | — | 42,448 | |||||||||||||||
| Equity in earnings of subsidiaries |
88,067 | — | — | (88,067 | ) | — | ||||||||||||||
|
|
|
|
|
|
|
|
|
|
|
|||||||||||
| Net income (loss) |
(51,173 | ) | 30,801 | 57,266 | (88,067 | ) | (51,173 | ) | ||||||||||||
| Other comprehensive income |
3,410 | — | — | — | 3,410 | |||||||||||||||
|
|
|
|
|
|
|
|
|
|
|
|||||||||||
| Comprehensive income (loss) |
$ | (47,763 | ) | $ | 30,801 | $ | 57,266 | $ | (88,067 | ) | $ | (47,763 | ) | |||||||
|
|
|
|
|
|
|
|
|
|
|
|||||||||||
83
Table of Contents
Condensed Consolidating Statement of Cash Flows
Fiscal Year Ended December 27, 2014
(in thousands)
| US Foods, Inc. | Guarantors | Non-Guarantors | Consolidated | |||||||||||||
| Net cash provided by operating activities |
$ | 362,140 | $ | 13,623 | $ | 26,427 | $ | 402,190 | ||||||||
|
|
|
|
|
|
|
|
|
|||||||||
| Cash flows from investing activities: |
||||||||||||||||
| Proceeds from sales of property and equipment |
8,908 | — | 16,146 | 25,054 | ||||||||||||
| Purchases of property and equipment |
(138,670 | ) | (8,387 | ) | (37 | ) | (147,094 | ) | ||||||||
| Insurance recoveries related to property and equipment |
4,000 | — | — | 4,000 | ||||||||||||
|
|
|
|
|
|
|
|
|
|||||||||
| Net cash provided by (used in) investing activities |
(125,762 | ) | (8,387 | ) | 16,109 | (118,040 | ) | |||||||||
|
|
|
|
|
|
|
|
|
|||||||||
| Cash flows from financing activities: |
||||||||||||||||
| Proceeds from debt borrowings |
898,410 | — | 40 | 898,450 | ||||||||||||
| Payment for debt financing costs and fees |
— | — | (421 | ) | (421 | ) | ||||||||||
| Principal payments on debt and capital leases |
(1,010,909 | ) | (5,034 | ) | (90 | ) | (1,016,033 | ) | ||||||||
| Contingent consideration paid for acquisitions of businesses |
(1,800 | ) | — | — | (1,800 | ) | ||||||||||
| Capital contributions (distributions) |
42,063 | — | (42,063 | ) | — | |||||||||||
| Proceeds from parent company common stock sales |
197 | — | — | 197 | ||||||||||||
| Parent company common stock repurchased |
(628 | ) | — | — | (628 | ) | ||||||||||
|
|
|
|
|
|
|
|
|
|||||||||
| Net cash used in financing activities |
(72,667 | ) | (5,034 | ) | (42,534 | ) | (120,235 | ) | ||||||||
|
|
|
|
|
|
|
|
|
|||||||||
| Net increase in cash and cash equivalents |
163,711 | 202 | 2 | 163,915 | ||||||||||||
| Cash and cash equivalents—beginning of year |
178,872 | 872 | — | 179,744 | ||||||||||||
|
|
|
|
|
|
|
|
|
|||||||||
| Cash and cash equivalents—end of year |
$ | 342,583 | $ | 1,074 | $ | 2 | $ | 343,659 | ||||||||
|
|
|
|
|
|
|
|
|
|||||||||
Condensed Consolidating Statement of Cash Flows
Fiscal Year Ended December 28, 2013
(in thousands)
| US Foods, Inc. | Guarantors | Non-Guarantors | Consolidated | |||||||||||||
| Net cash provided by operating activities |
$ | 289,245 | $ | 6,902 | $ | 26,105 | $ | 322,252 | ||||||||
|
|
|
|
|
|
|
|
|
|||||||||
| Cash flows from investing activities: |
||||||||||||||||
| Acquisition of businesses |
(11,369 | ) | — | — | (11,369 | ) | ||||||||||
| Proceeds from sales of property and equipment |
7,018 | — | 7,590 | 14,608 | ||||||||||||
| Purchases of property and equipment |
(185,673 | ) | (5,448 | ) | (10 | ) | (191,131 | ) | ||||||||
|
|
|
|
|
|
|
|
|
|||||||||
| Net cash provided by (used in) investing activities |
(190,024 | ) | (5,448 | ) | 7,580 | (187,892 | ) | |||||||||
|
|
|
|
|
|
|
|
|
|||||||||
| Cash flows from financing activities: |
||||||||||||||||
| Proceeds from debt refinancing |
854,485 | — | — | 854,485 | ||||||||||||
| Proceeds from debt borrowings |
1,644,000 | — | — | 1,644,000 | ||||||||||||
| Payment for debt financing costs and fees |
(29,376 | ) | — | — | (29,376 | ) | ||||||||||
| Principal payments on debt and capital leases |
(2,276,174 | ) | (2,137 | ) | — | (2,278,311 | ) | |||||||||
| Repurchase of senior subordinated notes |
(375,144 | ) | — | — | (375,144 | ) | ||||||||||
| Contingent consideration paid for acquisitions of businesses |
(6,159 | ) | — | — | (6,159 | ) | ||||||||||
| Capital contributions (distributions) |
33,685 | — | (33,685 | ) | — | |||||||||||
| Proceeds from parent company common stock sales |
1,850 | — | — | 1,850 | ||||||||||||
| Parent company common stock repurchased |
(8,418 | ) | — | — | (8,418 | ) | ||||||||||
|
|
|
|
|
|
|
|
|
|||||||||
| Net cash used in financing activities |
(161,251 | ) | (2,137 | ) | (33,685 | ) | (197,073 | ) | ||||||||
|
|
|
|
|
|
|
|
|
|||||||||
| Net decrease in cash and cash equivalents |
(62,030 | ) | (683 | ) | — | (62,713 | ) | |||||||||
| Cash and cash equivalents—beginning of year |
240,902 | 1,555 | — | 242,457 | ||||||||||||
|
|
|
|
|
|
|
|
|
|||||||||
| Cash and cash equivalents—end of year |
$ | 178,872 | $ | 872 | $ | — | $ | 179,744 | ||||||||
|
|
|
|
|
|
|
|
|
|||||||||
84
Table of Contents
Condensed Consolidating Statement of Cash Flows
Fiscal Year Ended December 29, 2012
(in thousands)
| US Foods, Inc. | Guarantors | Non-Guarantors | Consolidated | |||||||||||||
| Net cash provided by operating activities |
$ | 250,365 | $ | 34,832 | $ | 30,722 | $ | 315,919 | ||||||||
|
|
|
|
|
|
|
|
|
|||||||||
| Cash flows from investing activities: |
||||||||||||||||
| Acquisition of businesses |
(106,041 | ) | — | — | (106,041 | ) | ||||||||||
| Proceeds from sales of property and equipment |
12,264 | — | 7,421 | 19,685 | ||||||||||||
| Purchases of property and equipment |
(258,566 | ) | (34,876 | ) | (14 | ) | (293,456 | ) | ||||||||
|
|
|
|
|
|
|
|
|
|||||||||
| Net cash provided by (used in) investing activities |
(352,343 | ) | (34,876 | ) | 7,407 | (379,812 | ) | |||||||||
|
|
|
|
|
|
|
|
|
|||||||||
| Cash flows from financing activities: |
||||||||||||||||
| Proceeds from debt refinancing |
583,625 | — | 686,000 | 1,269,625 | ||||||||||||
| Proceeds from other borrowings |
2,031,000 | — | — | 2,031,000 | ||||||||||||
| Payment for debt financing costs |
(31,648 | ) | — | (3,440 | ) | (35,088 | ) | |||||||||
| Principal payments on debt and capital leases |
(2,129,041 | ) | — | (854,526 | ) | (2,983,567 | ) | |||||||||
| Repurchase of senior subordinated notes |
(175,338 | ) | — | — | (175,338 | ) | ||||||||||
| Capital (distributions) contributions |
(133,837 | ) | — | 133,837 | — | |||||||||||
| Proceeds from parent company common stock sales |
761 | — | — | 761 | ||||||||||||
| Parent company common stock repurchased |
(3,734 | ) | — | — | (3,734 | ) | ||||||||||
|
|
|
|
|
|
|
|
|
|||||||||
| Net cash provided by (used in) financing activities |
141,788 | — | (38,129 | ) | 103,659 | |||||||||||
|
|
|
|
|
|
|
|
|
|||||||||
| Net increase (decrease) in cash and cash equivalents |
39,810 | (44 | ) | — | 39,766 | |||||||||||
| Cash and cash equivalents—beginning of year |
201,092 | 1,599 | — | 202,691 | ||||||||||||
|
|
|
|
|
|
|
|
|
|||||||||
| Cash and cash equivalents—end of year |
$ | 240,902 | $ | 1,555 | $ | — | $ | 242,457 | ||||||||
|
|
|
|
|
|
|
|
|
|||||||||
85
Table of Contents
| 23. | QUARTERLY FINANCIAL INFORMATION (Unaudited) |
Financial information for each quarter in the fiscal years ended December 27, 2014 and December 28, 2013, is set forth below (in thousands):
| First | Second | Third | Fourth | |||||||||||||||||
| Quarter | Quarter | Quarter | Quarter | Total | ||||||||||||||||
| (in thousands) | ||||||||||||||||||||
| Fiscal year ended December 27, 2014 |
||||||||||||||||||||
| Net sales |
$ | 5,456,635 | $ | 5,897,944 | $ | 5,911,490 | $ | 5,753,732 | $ | 23,019,801 | ||||||||||
| Cost of goods sold(1) |
4,561,948 | 4,933,697 | 4,950,661 | 4,775,786 | 19,222,092 | |||||||||||||||
|
|
|
|
|
|
|
|
|
|
|
|||||||||||
| Gross profit |
894,687 | 964,247 | 960,829 | 977,946 | 3,797,709 | |||||||||||||||
| Operating expenses(2) |
877,570 | 899,926 | 903,640 | 864,317 | 3,545,453 | |||||||||||||||
| Interest expense—net |
73,178 | 73,626 | 71,432 | 70,966 | 289,202 | |||||||||||||||
|
|
|
|
|
|
|
|
|
|
|
|||||||||||
| Income (loss) before income taxes |
(56,061 | ) | (9,305 | ) | (14,243 | ) | 42,663 | (36,946 | ) | |||||||||||
| Income tax provision (benefit) |
9,163 | 9,360 | 22,628 | (5,183 | ) | 35,968 | ||||||||||||||
|
|
|
|
|
|
|
|
|
|
|
|||||||||||
| Net income (loss) |
$ | (65,224 | ) | $ | (18,665 | ) | $ | (36,871 | ) | $ | 47,846 | $ | (72,914 | ) | ||||||
|
|
|
|
|
|
|
|
|
|
|
|||||||||||
| First Quarter |
Second Quarter |
Third Quarter |
Fourth Quarter |
Total | ||||||||||||||||
| (in thousands) | ||||||||||||||||||||
| Fiscal year ended December 28, 2013 |
||||||||||||||||||||
| Net sales |
$ | 5,404,922 | $ | 5,658,748 | $ | 5,686,712 | $ | 5,546,796 | $ | 22,297,178 | ||||||||||
| Cost of goods sold(1) |
4,495,783 | 4,686,933 | 4,716,253 | 4,575,070 | 18,474,039 | |||||||||||||||
|
|
|
|
|
|
|
|
|
|
|
|||||||||||
| Gross profit |
909,139 | 971,815 | 970,459 | 971,726 | 3,823,139 | |||||||||||||||
| Operating expenses(2) |
885,762 | 871,623 | 881,600 | 863,655 | 3,502,640 | |||||||||||||||
| Interest expense—net |
81,826 | 78,522 | 72,778 | 72,961 | 306,087 | |||||||||||||||
| Loss on extinguishment of debt(3) |
23,967 | 17,829 | — | — | 41,796 | |||||||||||||||
|
|
|
|
|
|
|
|
|
|
|
|||||||||||
| Income (loss) before income taxes |
(82,416 | ) | 3,841 | 16,081 | 35,110 | (27,384 | ) | |||||||||||||
| Income tax provision (benefit) |
12,292 | (12,167 | ) | (6,358 | ) | 36,055 | 29,822 | |||||||||||||
|
|
|
|
|
|
|
|
|
|
|
|||||||||||
| Net income (loss) |
$ | (94,708 | ) | $ | 16,008 | $ | 22,439 | $ | (945 | ) | $ | (57,206 | ) | |||||||
|
|
|
|
|
|
|
|
|
|
|
|||||||||||
| (1) | Cost of goods sold is net of related vendor considerations, and excludes depreciation and amortization expense. |
| (2) | Operating expenses include depreciation and amortization expense, restructuring and tangible asset impairment charges. |
| (3) | Loss on extinguishment of debt includes fees paid to debt holders, third party costs, early redemption premiums and the write off of old debt facility unamortized debt issuance costs. See Note 11—Debt for a further description of the Company’s debt refinancing transactions. |
| 24. | BUSINESS SEGMENT INFORMATION |
The Company operates in one business segment based on how the Chief Operating Decision Maker (“CODM”)—the CEO—views the business for purposes of evaluating performance and making operating decisions. The Company markets and distributes fresh, frozen and dry food and non-food products to foodservice customers throughout the United States.
We use a centralized management structure, and Company strategies and initiatives are implemented and executed consistently across the organization to maximize value to the organization as a whole. We use shared resources for sales, procurement, and general and administrative activities across each of our distribution centers. Our distribution centers form a single network to reach our customers; it is common for a single customer to make purchases from several different distribution centers. Capital projects—whether for cost savings or generating incremental revenue—are evaluated based on estimated economic returns to the organization as a whole (e.g., net present value, return on investment).
86
Table of Contents
The measure used by the CODM to assess operating performance is Adjusted EBITDA. Adjusted EBITDA is defined as Net income (loss), plus Interest expense – net, Income tax provision (benefit), and depreciation and amortization and adjusted for 1) Sponsor fees; 2) Restructuring and tangible asset impairment charges; 3) share-based compensation expense; 4) business transformation costs; 5) Acquisition related costs; 6) other gains, losses or charges as specified under the Company’s debt agreements; and 7) the non-cash impact of net LIFO adjustments. Costs to optimize and transform our business are noted as business transformation costs in the table below and are added to EBITDA in arriving at Adjusted EBITDA as permitted under the Company’s debt agreements. Business transformation costs include costs related to functionalization and significant process and systems redesign in the Company’s replenishment, finance, category management and human resources functions; company rebranding; cash & carry retail store strategy; and implementation and process and system redesign related to the Company’s sales model.
The aforementioned items are specified as items to add to EBITDA in arriving at Adjusted EBITDA per the Company’s debt agreements and, accordingly, our management includes such adjustments when assessing the operating performance of the business.
The following is a reconciliation for the last three fiscal years of Adjusted EBITDA to the most directly comparable GAAP financial performance measure, which is Net loss:
| 2014 | 2013 | 2012 | ||||||||||
| (in thousands) | ||||||||||||
| Adjusted EBITDA |
$ |
866,237 |
|
$ | 845,393 | $ | 840,750 | |||||
| Adjustments: |
||||||||||||
| Sponsor fees(1) |
(10,438 | ) | (10,302 | ) | (10,242 | ) | ||||||
| Restructuring and tangible asset impairment charges(2) |
50 | (8,386 | ) | (8,923 | ) | |||||||
| Share-based compensation expense(3) |
(11,736 | ) | (8,406 | ) | (4,312 | ) | ||||||
| Net LIFO reserve change(4) |
(60,321 | ) | (11,925 | ) | (13,213 | ) | ||||||
| Loss on extinguishment of debt(5) |
— | (41,796 | ) | (31,423 | ) | |||||||
| Pension settlement(6) |
(2,370 | ) | (1,778 | ) | (17,840 | ) | ||||||
| Business transformation costs(7) |
(54,135 | ) | (60,800 | ) | (74,900 | ) | ||||||
| Acquisition related costs(8) |
(37,905 | ) | (3,522 | ) | — | |||||||
| Other(9) |
(25,577 | ) | (31,587 | ) | (20,918 | ) | ||||||
|
|
|
|
|
|
|
|||||||
| EBITDA |
663,805 | 666,891 | 658,979 | |||||||||
| Interest expense, net |
(289,202 | ) | (306,087 | ) | (311,812 | ) | ||||||
| Income tax (provision) benefit |
(35,968 | ) | (29,822 | ) | (42,448 | ) | ||||||
| Depreciation and amortization expense |
(411,549 | ) | (388,188 | ) | (355,892 | ) | ||||||
|
|
|
|
|
|
|
|||||||
| Net loss |
$ | (72,914 | ) | $ | (57,206 | ) | $ | (51,173 | ) | |||
|
|
|
|
|
|
|
|||||||
| (1) | Consists of management fees paid to the Sponsors. |
| (2) | Primarily consists of facility closing, severance and related costs and tangible asset impairment charges. |
| (3) | Share-based compensation expense represents costs recorded for vesting of USF Holding stock option awards, restricted stock and restricted stock units. |
| (4) | Consists of net changes in the LIFO reserve. |
| (5) | Includes fees paid to debt holders, third party costs, early redemption premium, and the write off of old debt facility unamortized debt issuance costs. See Note 11—Debt for a further description of debt refinancing transactions. |
| (6) | Consists of charges resulting from lump-sum payment settlements to retirees and former employees participating in several Company sponsored pension plans. |
| (7) | Consists primarily of costs related to functionalization and significant process and systems redesign. |
| (8) | Consists of direct and incremental costs related to the Acquisition. |
| (9) | Other includes gains, losses or charges as specified under the Company’s debt agreements, including $16 million of costs subject to coverage under the Company’s insurance policies. |
87
Table of Contents
The following table presents the sales mix for the Company’s principal product categories for the last three fiscal years:
| 2014 | 2013 | 2012 | ||||||||||
| (in thousands) | ||||||||||||
| Meats and seafood |
$ | 8,326,191 | $ | 7,684,396 | $ | 7,445,636 | ||||||
| Dry grocery products |
4,152,682 | 4,275,669 | 4,214,890 | |||||||||
| Refrigerated and frozen grocery products |
3,463,411 | 3,446,308 | 3,373,764 | |||||||||
| Dairy |
2,555,362 | 2,332,346 | 2,221,986 | |||||||||
| Equipment, disposables and supplies |
2,132,044 | 2,133,899 | 2,075,323 | |||||||||
| Beverage products |
1,263,965 | 1,309,303 | 1,322,961 | |||||||||
| Produce |
1,126,146 | 1,115,257 | 1,010,361 | |||||||||
|
|
|
|
|
|
|
|||||||
| $ | 23,019,801 | $ | 22,297,178 | $ | 21,664,921 | |||||||
|
|
|
|
|
|
|
|||||||
No single customer accounted for more than 4% of the Company’s consolidated net sales for 2014, 2013 and 2012. However, customers purchasing through one group purchasing organization accounted for approximately 12%, 12%, and 11% of consolidated Net sales in 2014, 2013 and 2012, respectively.
88
Table of Contents
| Item 9. | Changes in and Disagreements with Accountants on Accounting and Financial Disclosure |
None.
| Item 9A. | Controls and Procedures |
Disclosure Controls and Procedures
US Foods maintains disclosure controls and procedures, as defined in Rules 13a-15(e) and 15d-15(e) under the Securities Exchange Act of 1934, as amended (the “Exchange Act”) that are designed to ensure that information required to be disclosed in its reports filed or submitted under the Exchange Act is processed, recorded, summarized and reported within the time periods specified in the SEC’s rules and forms, and that such information is accumulated and communicated to the Company’s management, including its Chief Executive Officer and Chief Financial Officer, as appropriate, to allow for timely decisions regarding required disclosure. In designing and evaluating the disclosure controls and procedures, management recognizes that any controls and procedures, no matter how well designed and operated, can provide only reasonable assurance of achieving the desired control objectives.
As required by SEC Rule 13a-15(b), the Company carried out an evaluation, under the supervision and with the participation of management, including its Chief Executive Officer and Chief Financial Officer, of the effectiveness of the design and operation of the Company’s disclosure controls and procedures as of the end of the period covered by this Annual Report on Form 10-K. Based on this evaluation, the Company’s Chief Executive Officer and Chief Financial Officer concluded that the Company’s disclosure controls and procedures were effective as of December 27, 2014.
Management’s Annual Report on Internal Control Over Financial Reporting
Our management is responsible for establishing and maintaining effective internal control over financial reporting as defined in Rules 13a-15(f) and 15d-15(f) under the Exchange Act. This system is designed to provide reasonable assurance regarding the reliability of our financial reporting and the preparation of financial statements for external purposes in accordance with generally accepted accounting principles.
Management performed an assessment of the effectiveness of our internal control over financial reporting at December 27, 2014, the end of our fiscal year. Management based its assessment on criteria established in the Internal Control—Integrated Framework issued by the Committee of Sponsoring Organizations of the Treadway Commission (COSO) (2013). The objective of this assessment was to determine whether our internal control over financial reporting was effective at December 27, 2014. Based on management’s assessment, we have concluded that our internal control over financial reporting was effective at December 27, 2014.
As a result of the enactment in July 2010 of the Dodd-Frank Wall Street Reform and Consumer Protection Act, “Exemption for Non-accelerated Filers,” and in accordance with Section 989G of that act, we are not required to provide an attestation report of our independent registered public accounting firm regarding internal control over financial reporting for this fiscal year or thereafter, until such time as we are no longer eligible for the exemption set forth therein.
Limitations on the Effectiveness of Controls
Our management, including our CEO and CFO, does not expect that our Disclosure Controls or our internal controls will prevent all error and all fraud. A control system, no matter how well designed and operated, can provide only reasonable, not absolute, assurance that the control system’s objectives will be met. Further, the design of a control system must reflect the fact that there are resource constraints, and the benefits of controls must be considered relative to their costs. Because of the inherent limitations in all control systems, no evaluation of controls can provide absolute assurance that all control issues and instances of fraud, if any, within US Foods have been detected. These inherent limitations include the realities that judgments in decision-making can be faulty, and that breakdowns can occur because of simple error or mistake.
Controls can also be circumvented by the individual acts of some persons, by collusion of two or more people, or by management override of the controls. The design of any system of controls is based in part upon certain assumptions about the likelihood of future events, and there can be no assurance that any design will succeed in achieving its stated goals under all potential future conditions. Over time, controls may become inadequate because of changes in conditions or deterioration in the degree of compliance with associated policies or procedures. Because of the inherent limitations in a cost-effective control system, misstatements due to error or fraud may occur and not be detected.
89
Table of Contents
Changes In Internal Control Over Financial Reporting
There were no changes in our internal controls over financial reporting during the most recent fiscal quarter that have materially affected, or are reasonably likely to materially affect, our internal control over financial reporting.
CEO and CFO Certifications
The certifications of the CEO and the CFO required by Rule 13a-14 of the Securities Exchange Act of 1934, as amended, or the “Rule 13a-14 Certifications” are filed as Exhibits 31.1 and 31.2 of this annual report on Form 10-K. This Part II, Item 9A of the annual report on Form 10-K should be read in conjunction with the Rule 13a-14 Certifications for a more complete understanding of the topics presented.
| Item 9B. | Other Information |
None.
90
Table of Contents
| Item 10. | Directors, Executive Officers and Corporate Governance |
The following table sets forth the names, ages and positions of the executive officers of US Foods, and the members of the board of directors of each of US Foods and USF Holding Corp. (“USF Holding”), our parent company. Investment funds associated with or managed by the Sponsors currently beneficially own, in the aggregate, approximately 98.46% of the outstanding shares of USF Holding common stock. These funds are party to a stockholders agreement under which each of the funds has agreed to vote in favor of the other funds’ nominees to the USF Holding board of directors. This means the Sponsors control USF Holding and, through their control of USF Holding’s board of directors, indirectly control our board of directors and, as a result, control our management and policies.
| Name |
Age |
Number of |
Position | |||
| John A. Lederer |
59 | 4 | President, Chief Executive Officer and Director of USF Holding and US Foods | |||
| Fareed Khan |
49 | 1 | Chief Financial Officer and Director of US Foods | |||
| Stuart Schuette |
50 | 26 | Chief Operating Officer | |||
| Juliette W. Pryor |
50 | 9 | Executive Vice President, General Counsel and Chief Compliance Officer and Director of US Foods | |||
| Dave Esler |
48 | 16 | Chief Human Resources Officer | |||
| David Schreibman |
47 | 9 | Executive Vice President, Strategy | |||
| Pietro Satriano |
52 | 4 | Chief Merchandising Officer | |||
| Keith Rohland |
47 | 3 | Chief Information Officer | |||
| Mark Scharbo |
51 | 2 | Chief Supply Chain Officer | |||
| Edward M. Liddy |
69 | — | Chairman of the Board of Directors of USF Holding | |||
| Michael M. Calbert |
52 | — | Director of USF Holding | |||
| Richard J. Schnall |
45 | — | Director of USF Holding | |||
| Nathan K. Sleeper |
41 | — | Director of USF Holding | |||
| Nathaniel H. Taylor |
38 | — | Director of USF Holding |
| (1) | Includes years of service at companies we have acquired. |
Mr. Lederer has served as President, Chief Executive Officer, one of our directors and a director of USF Holding since September 2010. Previously, Mr. Lederer was Chairman and Chief Executive Officer of Duane Reade, a New York-based pharmacy retailer acquired by Walgreens in 2010. Mr. Lederer joined Duane Reade in 2008 and led a company-wide revitalization effort. Prior to Duane Reade, he spent 30 years at Loblaw Companies Limited, Canada’s largest grocery retailer and wholesale food distributor. Mr. Lederer held a number of leadership roles at Loblaw, including President from 2000 to 2006. Mr. Lederer currently serves as a director of Tim Hortons, Inc. He was chosen as a director because of his extensive experience in the food industry. Mr. Lederer is a Sponsor Nominee to the USF Holding board of directors, designated jointly by the Sponsors, under the terms of the Management Stockholders Agreement described under “Certain Relationships and Related Party Transactions—Management Stockholders Agreement.”
Mr. Khan has served as Chief Financial Officer and one of our directors since September 2013. Previously, Mr. Khan had been Senior Vice President and Chief Financial Officer of United Stationers Inc. since July 2011. Prior to United Stationers, he spent 12 years with USG Corporation, where he most recently served as Executive Vice President, Finance and Strategy. Before joining USG in 1999, Mr. Khan was a consultant with McKinsey & Company, where he served global clients on a variety of projects including acquisition analysis, supply chain optimization, and organization redesign.
91
Table of Contents
Mr. Schuette has served as Chief Operating Officer since January 2009. Previously, he was Region President, Broadline North Region. From November 2003 to November 2005, he worked for Martin-Brower, where his last position was Executive Vice President for the Reinhart FoodService Division. Mr. Schuette joined Kraft Foods in June 1989 and, until 1997, worked in finance positions for both the retail and foodservice businesses of Kraft. In 1997, he moved into a general management position at Alliant Foodservice, a successor company to Kraft Foodservice.
Ms. Pryor has served as Executive Vice President, General Counsel and Chief Compliance Officer of US Foods and one of our directors since March 2009. Since joining US Foods in May 2005, Ms. Pryor has held several executive positions, including Senior Vice President, Deputy General Counsel and Chief Diversity Officer. Prior to joining US Foods, she was in private practice in the Washington, D.C. office of Skadden, Arps, Slate, Meagher & Flom.
Mr. Esler has served as Chief Human Resources Officer since October 2007. During his 16-year career at US Foods, he has held a number of executive positions, including Senior Vice President for Field Human Resources. Before joining US Foods, he served in a senior human resources role at Grainger Industrial Supply.
Mr. Schreibman has served as Executive Vice President, Strategy since early 2007. He joined US Foods in November 2005 as Senior Vice President, Strategy and was a consultant to the company since early 2004. Previously, he served as Vice President, Secretary and General Counsel of Specialty Foods Corporation. From 1995 to 1998, Mr. Schreibman was Chief Counsel, Mergers and Acquisitions for Sara Lee Corporation. He began his career at Sidley Austin LLP, practicing corporate and securities law. He serves on the board of directors of the International Foodservice Distributor Association.
Mr. Satriano has served as Chief Merchandising Officer since February 2011. Prior to joining US Foods, Mr. Satriano was president of LoyaltyOne from 2009 to 2011. From 2002 to 2008, he served in a number of leadership positions at Loblaw Companies, including Executive Vice President, Loblaw Brands, and Executive Vice President, Food Segment. Mr. Satriano began his career in strategy consulting, first with The Boston Consulting Group in Toronto and then with the Monitor Company in Milan, Italy.
Mr. Rohland joined US Foods as Chief Information Officer in April 2011. Before this, Mr. Rohland had several leadership positions at Citigroup, including Managing Director of Risk and Program Management from March 2007 until April 2011. Prior to joining Citigroup, Mr. Rohland was Chief Information Officer for Volvo Car Corporation of Sweden from November 2005 to March 2007. He also held a number of leadership positions at Ford Motor Company.
Mr. Scharbo joined US Foods as Chief Supply Officer in March 2013. Before this, he was Group Vice President—Inventory Strategy at Walgreens. Previously, he was Senior Vice President, Supply Chain at Duane Reade, from 2008 until its acquisition by Walgreens in 2010. From 2005 until 2008, Mr. Scharbo was Chief Operating Officer of Case-Mate.
Mr. Liddy has been the Chairman the board of directors of USF Holding since April 2010. Mr. Liddy has served as a Partner at CD&R since returning to CD&R in 2010. Mr. Liddy joined CD&R initially in 2008 and served from April 2008 to September 2008 as Partner. At the request of the U.S. Secretary of the Treasury, Mr. Liddy served as interim Chairman and Chief Executive Officer of American International Group, Inc. from September 2008 to August 2009. Mr. Liddy worked with The Allstate Corporation for many years as Chairman and Chief Executive Officer and in other senior executive positions beginning in August 1994 until his retirement in April 2008. Previously, he served as Senior Vice President and Chief Financial Officer and Senior Vice President— Operating of Sears, Roebuck and Co., and as Chief Financial Officer of G. D. Searle & Co. Mr. Liddy currently is a director of 3M Company, Abbott Laboratories, the Boeing Company, AbbVie, and the Allstate Corporation. He previously was a director of ServiceMaster Global Holdings, Inc., American International Group, Inc. from 2008 to 2009, and Goldman Sachs Group, Inc. from 2003 to 2008. Mr. Liddy was chosen as a director because of his extensive management, financial and operational expertise. He a Sponsor Nominee designated by CD&R, under the terms of the Management Stockholders Agreement described in “Certain Relationships and Related Party Transactions—Management Stockholders Agreement.”
92
Table of Contents
Mr. Calbert has been a USF Holding director since 2007. He is a former member of KKR, which he joined in 2000. Previously, Mr. Calbert served as the Chief Financial Officer of Randall’s Food Markets. He started his professional career as a consultant with Arthur Anderson Worldwide. Mr. Calbert is currently on the board of directors of Dollar General and Academy Sports and Outdoors . He was chosen based on his expertise in the food industry, his extensive experience in private equity, and his financial expertise. Mr. Calbert is a Sponsor Nominee designated by KKR, under the terms of the Management Stockholders Agreement described in “Certain Relationships and Related Party Transactions—Management Stockholders Agreement.”
Mr. Schnall has been a director of USF Holding since 2007. He is a financial partner of CD&R. Prior to joining CD&R in 1996, he worked in the Investment Banking Division of Donaldson, Lufkin & Jenrette, Inc. and Smith Barney & Co. Mr. Schnall serves as a director of Healogics, David’s Bridal, Envision Healthcare Corporation, and PharMEDium. He was a director of Sally Beauty Holdings, Inc. from 2006 to 2012 and AssuraMed, Inc. from 2010 to 2013. Mr. Schnall was chosen as a director based on his financial and business expertise. He is a Sponsor Nominee designated by CD&R, under the terms of the Management Stockholders Agreement described in “Certain Relationships and Related Party Transactions—Management Stockholders Agreement.”
Mr. Sleeper has been a USF Holding director since 2007. He is a financial principal of CD&R, which he joined in 2000. Before this, he worked in the Investment Banking Division of Goldman, Sachs & Co. and at the investment firm Tiger Management Corp. Mr. Sleeper serves as a director of Hussmann International, Inc., Wilsonart International, Roofing Supply Group, Inc., Brand Energy Services, Inc., Atkore International, Inc., NCI Building Systems, Inc., and Citi Group Ltd. He was chosen as a director because of his in-depth experience with investments and financial expertise. Mr. Sleeper is a Sponsor Nominee designated by CD&R, under the terms of the Management Stockholders Agreement described in “Certain Relationships and Related Party Transactions—Management Stockholders Agreement.”
Mr. Taylor has been a director of USF Holding since March 2011. He joined KKR in 2005. Mr. Taylor currently sits on the board of directors of Aricent, Academy Sports and Outdoors, and Toys ‘R’ Us. Before joining KKR, Mr. Taylor was with Bain Capital where he was involved in the execution of investments in the retail, health care and technology sectors. He was chosen as a director based on his significant expertise in private equity and extensive business knowledge. Mr. Taylor is a Sponsor Nominee designated by KKR under the terms of the Management Stockholders Agreement described in “Certain Relationships and Related Party Transactions—Management Stockholders Agreement.”
Composition of our Board of Directors
Our board is composed of three directors who were elected by our direct parent company, USF Holding. Our business and affairs are managed under the direction of the board of directors of USF Holding. The USF Holding board of directors is composed of seven directors, one of whom is our Chief Executive Officer. As of the date of this report, there are only six directors on the USF Holding board of directors, with one seat vacant.
The stockholders agreement with our Sponsors entitle investment funds affiliated with the Sponsors to elect (or cause to be elected) all of USF Holding’s directors. The directors include three designees of investment funds affiliated with CD&R (one of whom shall serve as the Chairman of the USF Holding board of directors), and three designees of investment funds affiliated with KKR (one of whom shall serve as Chairman of the Executive Committee of the USF Holding board of directors and one of whom shall serve as Chairman of the Compensation Committee of the USF Holding board of directors), subject to adjustment if the percentage of USF Holding shares owned by investment funds affiliated with or managed by the applicable Sponsor decrease by more than a specified amount. The stockholders agreement also grants to investment funds affiliated with the Sponsors special governance rights. These include rights of approval over certain corporate and other transactions such as a merger, consolidation, acquisition, incurrence of indebtedness or payment of dividends, and the rights to approve the selection, hiring and termination of our Chief Executive Officer. These rights are in place for so long as they and other funds affiliated with or managed by the applicable Sponsor maintain at least 10 percent (10%) of the outstanding shares of common stock of USF Holding.
93
Table of Contents
Director Independence
Neither US Foods nor our parent company, USF Holding, is listed on a national securities exchange. As a result, they are not subject to the director independence requirements of any exchange. Neither our organizational documents nor those of USF Holding require that a majority of the directors of either entity be independent.
Investment funds associated with or managed by the Sponsors currently beneficially own, in the aggregate, most of the outstanding shares of USF Holding’s common stock. These funds are party to a stockholders agreement, under which each of the funds has agreed to vote in favor of the other funds’ nominees to USF Holding’s board of directors. This means the Sponsors control USF Holding’s and—through their control of USF Holding’s board of directors—indirectly control our board of directors as well as our management and policies. All of the directors of USF Holding were appointed according to the terms of the stockholders agreement and are employed by or agents of US Foods or the Sponsors. As such, the directors of USF Holding would not be considered “independent” as defined in the federal securities laws or the rules of the New York Stock Exchange or the Nasdaq Stock Market.
Non-Employee Director Compensation
All members of the board of directors of US Foods and USF Holding are entitled to be reimbursed for reasonable out-of-pocket expenses incurred in attending all board and other committee meetings. Directors who are our employees or are employees of CD&R do not receive remuneration for serving on the Boards of Directors of US Foods or USF Holding. Non-employee directors receive a quarterly retainer of $10,000. The fees earned or paid in cash by us to non-employee directors for service as directors for the fiscal year 2013 were as follows:
| Name |
Fees Earned or Paid in Cash |
Other Compensation |
Total | |||||||||
| Mr. Calbert |
$ | 40,000 | $ | 0 | $ | 40,000 | ||||||
| Mr. Taylor |
40,000 | 0 | 40,000 | |||||||||
| Mr. Liddy |
0 | 0 | 0 | |||||||||
| Mr. Schnall |
0 | 0 | 0 | |||||||||
| Mr. Sleeper |
0 | 0 | 0 | |||||||||
Section 16(a) Beneficial Ownership Reporting Compliance
As our equity securities are not registered pursuant to Section 12 of the Securities Exchange Act of 1934, as amended (the “Exchange Act”), none of our directors, officers or 10% holders were subject to Section 16(a) of the Exchange Act for the past fiscal year or the filing requirements thereof.
Code of Conduct
US Foods has a Code of Conduct that applies to the Chief Executive Officer, Chief Financial Officer and Principal Accounting Officer and Controller, and persons performing similar functions, as well as to all of the Company’s directors, officers and employees. The Code of Conduct addresses matters such as conflicts of interest, confidentiality, fair dealing and compliance with laws and regulations. A Copy of the Code of Conduct has been filed as an exhibit to this Annual Report on Form 10-K and is also available in print, without charge, to any person who requests it in writing to the General Counsel and Chief Compliance Officer at the following address: US Foods, Inc., 9399 W. Higgins Road, Suite 600, Rosemont, IL 60018, (847) 720-8000.
Audit Committee
The USF Holding board of directors has established an Audit Committee. Two directors currently comprise the Audit Committee: Messrs. Sleeper and Taylor. The Audit Committee recommends the annual appointment of auditors with whom the Audit Committee reviews the scope of audit and non-audit assignments and related fees, accounting principles we use in financial reporting, internal auditing procedures and the adequacy of our internal
94
Table of Contents
control procedures. Though not formally considered by our board of directors or the USF Holding board of directors, given that our securities are not traded on any national securities exchange, we do not believe that the members of the Audit Committee would be considered independent as defined by SEC rules or the rules of the New York Stock Exchange or NASDAQ.
Because our equity and the equity of our parent, USF Holding, is privately held and in the absence of a public listing or trading market for our common stock or the commons stock of USF Holding, neither our board of directors nor the USF Holding board of directors has designated any member of the Audit Committee as an “audit committee financial expert.”
95
Table of Contents
| Item 11. | Executive Compensation |
Compensation Discussion and Analysis
In this section, we provide an overview of our philosophy and the objectives of our executive compensation program, and describe the material components of our executive compensation program for our Named Executive Officers (“NEOs”) whose compensation is set forth in the 2014 Summary Compensation Table and other compensation tables in this report:
| • | John A. Lederer, our President and Chief Executive Officer |
| • | Fareed Khan, our Chief Financial Officer |
| • | Pietro Satriano, our Chief Merchandising Officer |
| • | Stuart S. Schuette, our Chief Operating Officer |
| • | Keith Rohland, our Chief Information Officer |
In addition, we explain how and why the Compensation Committee of the USF Holding board of directors (the “Compensation Committee”) arrives at compensation policies and decisions involving the NEOs.
Executive Summary
Our long-term success depends on our ability to attract, retain and motivate highly talented individuals who are committed to our vision and strategy. A key objective of our executive compensation program is to link such individuals’ pay to their performance and their advancement of our overall annual and long-term performance and business strategies. Another objective of our compensation program is to encourage high-performing executives to remain with US Foods over the course of their careers.
We believe that the amount of compensation for each NEO reflects extensive management experience, continued high performance and exceptional service to us. We also believe that our compensation strategies have been effective in attracting executive talent and promoting performance and retention.
Changes in Fiscal Year 2014
2014 Discretionary Bonus
The Compensation Committee chose to award a special discretionary bonus at year-end 2014 to 17 company executives. This award was granted to recognize the extraordinary efforts of the leadership team in their management of the company through the exceptional circumstances that existed in 2014, including the protracted Acquisition process that did not complete in 2014. While not the primary factor, a secondary consideration in making the awards for the CEO direct reports was the deferral of the annual merit base salary increases that would have otherwise taken place in July. Recipients of this award included all nine direct reports to the CEO and the eight Regional Presidents with award amounts determined on an individual basis in view of each executive’s contributions and extra responsibilities caused by the Acquisition process. The CEO was not provided with a discretionary award. NEO recipients of the bonus included:
| Name |
Bonus Amount | |||
| Stuart Schuette |
$ | 200,000 | ||
| Pietro Satriano |
$ | 200,000 | ||
| Fareed Khan |
$ | 100,000 | ||
| Keith Rohland |
$ | 100,000 | ||
96
Table of Contents
Changes to our Executive Compensation Program
US Foods is committed to providing and maintaining a competitive executive compensation program; however, in light of the Acquisition and restrictions imposed under the merger agreement, much of our executive compensation program remained static and some programs were suspended. Changes to the executive compensation programs approved by the Compensation Committee in 2014 involved the suspension of the annual equity grants in 2014 due to the proposed Acquisition, and the execution of a program of targeted Retention Agreements and Transaction Bonuses. (These programs had been approved by the Committee in December 2013).
Specific changes included the following:
| Component | Change | Rationale | ||
| Annual Incentive Plan (AIP) | • Suspended the Individual Performance Factor multiplier for all participating employees. |
• Focuses incentive pay on financial metrics, which are more practical to use should the performance period be less than a year due to the proposed Acquisition. | ||
| Long-Term Incentive Plan | • Suspended the 2014 annual equity grants. |
• This change was required in light of proposed Acquisition and its uncertain timing. | ||
| Other Incentive Elements | • Provided Retention Agreements and Transaction Bonuses to targeted individuals. |
• Provides compelling compensation to secure key employees and provide management continuity during the transition phase after the Acquisition closes. | ||
| Merit Increases | • Suspended the merit increase program for CEO direct reports. |
• This change was required in light of proposed Acquisition and its uncertain timing. | ||
Philosophy of Executive Compensation Program
US Foods provides reward strategies and programs that attract, retain and motivate the right talent, in the right places, at the right time. We strive to provide a total compensation package that is competitive with comparable employers who compete with us for talent, and that is equitable among our internal workforce.
Historically, our executive compensation plans have directly linked a substantial portion of annual executive compensation to US Foods’ performance. These plans are designed to deliver superior compensation for superior company performance. Likewise, when our performance falls short of expectations, these programs deliver lower levels of compensation.
However, the Compensation Committee tries to balance pay-for-performance objectives with retention considerations. This means even during temporary downturns in the economy and the foodservice distribution industry, the programs continue to ensure that successful, high-performing employees stay committed to increasing US Foods’ long-term value.
Guiding Principles
We use the following guiding principles as the basis of our executive compensation philosophy to attract, develop and retain talent, who will drive financial and strategic growth and build long-term value:
97
Table of Contents
| • | Establish and support a link between pay and performance—both at the broad US Foods’ level and at individual levels |
| • | Differentiate pay for superior performers that recognizes and rewards contributions to US Foods’ success |
| • | Appropriately balance short-term and long-term compensation opportunities with US Foods’ short- and long-term goals and priorities |
| • | Focus our leadership on long-term value creation by providing equity ownership incentives to executives |
| • | Offer cost-efficient programs that ensure accountability in meeting US Foods’ performance goals and are easily understood by participants |
Components and Objectives of Executive Compensation Program
The Compensation Committee built the executive compensation program upon a framework that includes the components and objectives found in the following table. Each of these is described in greater detail later in this Compensation Discussion and Analysis. The Compensation Committee reviews each component of the executive compensation program to see how it affects target total pay levels. It generally targets total cash compensation at the median of the target total pay ranges for similar executive positions among our peer group.
| Component |
Description |
Objective of Component | ||||
| Annual Compensation |
Base Salary | Fixed amount based on level of responsibility, experience, tenure and qualifications. For a further discussion see “How We Make Compensation Decisions” below. | • Support talent attraction and retention.
• Consistent with competitive pay practice. Based on our external market comparison, generally targeted at the median of total cash compensation for similar executives. | |||
| Annual Incentive Plan Award |
The Annual Incentive Plan is designed to encourage and reward executive officers for achieving annual financial performance goals. Under the Annual Incentive Plan, we pay annual incentive awards in cash with payments made in the first quarter of the fiscal year for bonuses earned with respect to performance in the prior fiscal year. Payment of the Annual Incentive Plan award is based on satisfaction of key financial performance criteria: 1) Adjusted EBITDA and 2) Cash Flow — Net Debt. The Adjusted EBITDA metric is required by the Annual Incentive Plan to be increased to the extent that amounts that were accrued for the Incentive Plan Awards — but are no longer expected to be paid — are reduced. For more, see “Overview of the 2014 Executive Compensation Program — Overview of Annual Incentive Plan Award.” | • Links pay and performance.
• Drives the achievement of short-term business objectives.
• Based on our external market comparison, generally targeted at the median of the annual incentive ranges for similar executive positions.
• EBITDA is defined as Net income or loss, plus Interest expense — net, Income tax (provision) benefit, and depreciation and amortization. Adjusted EBITDA is defined as EBITDA adjusted for 1) Sponsor fees; 2) Restructuring and tangible, and Intangible asset impairment charges; 3) share-based compensation expense; 4) other gains, losses, or charges as specified under our debt agreements; and 5) the non-cash impact of LIFO adjustments. | ||||
| Discretionary Cash Bonuses | The Compensation Committee may provide special cash bonuses to select individuals on a discretionary basis. | • Recognize extraordinary efforts of individuals | ||||
98
Table of Contents
| Long-Term Incentives | Equity Investment Program | Key management employees, including our NEOs, had an opportunity to invest in our parent, USF Holding. For their investment, participants receive 1) an investment stock option grant equal to the fair market value of their investment level, plus 2) an investment stock option grant based on a multiple of their investment level (1.00x to 5.00x).
There was no equity investment activity in 2014. |
• Designed to focus our key management employees on long-term value creation by providing a significant financial reward for operational success.
• Promotes an “owner” mentality by providing incentives to management. | |||
| Investment Stock Options | Investment stock options granted to our NEOs are directly related to the level of their participation in the equity investment program. For a further discussion of the program see “Equity Investments” below.
50% of the investment stock options vest based on time: vesting in equal portions over four or five years. The remaining 50% of the investment stock options vest equally over four or five years, subject to achieving annual or cumulative Adjusted EBITDA performance targets.
In light of the proposed Acquisition, there was no equity grant activity in 2014. |
• Supports long-term value creation by providing a significant financial reward for operational success. | ||||
| Restricted Stock and RSUs | Special grants of restricted stock or RSUs are provided on a rare and selective basis.
All restricted stock grants vest over time, although the time periods vary.
RSU grants can vest over time or based on performance.
In light of the proposed Acquisition, there was no annual equity grant activity in 2014. |
• Special restricted stock and RSU grants are generally designed to enhance retention of key management employees through the vesting requirements. | ||||
99
Table of Contents
| Annual Equity Grant | The Annual Equity Grant program works much like plans at large, publicly traded companies.
The Annual Equity Grant program was suspended for 2014 pending the completion of the Acquisition.
Historically, eligible participants, including the NEOs, receive grants of both RSUs and stock options. The total value of the Annual Equity Grant award is based on the competitive practices of long-term incentive awards for similar positions. The “mix” of equity awards varies depending on the participant’s role within US Foods. For our NEOs, 75% of the Annual Equity Grant award is delivered in stock options and 25% in RSUs.
50% of the Annual Equity Grant award vests based on time, vesting in equal portions over four years (25% per year). The remaining 50% vests equally over four years (25% per year) subject to reaching annual or cumulative Adjusted EBITDA performance targets.
For more, see “Annual Equity Grant” below. |
• Designed to support US Foods’ multiyear transformation initiative by providing participants with an ownership stake in the Company as well as an opportunity to build future wealth.
• Based on our external market comparison, generally targeted at the median of the long-term incentive value ranges for similar executive positions. | ||||
| Retirement, Other Benefit Programs and Perquisites |
Retirement Benefits | Retirement benefits are provided through the 401(k) Retirement Savings Plan. This plan is a long- term investment savings plan in which participants and the Company contribute money on a pre-tax basis.
Additionally, a traditional defined benefit pension plan—which provides a regular monthly income after retirement — remains in place for certain NEOs. With respect to the participating NEOs, the defined benefit plan is frozen so that there can be no further accruals. |
• Designed as a long-term investment savings vehicle. | |||
100
Table of Contents
| Other Benefits and Perquisites |
Our NEOs participate in the same benefit programs that are offered to other salaried and hourly employees.
The NEOs are eligible for enhanced Long Term Disability (LTD) and life insurance coverage. The LTD benefit amount for NEOs is increased from 60% of monthly earnings to 66 2/3% of monthly earnings. The basic life insurance for NEOs is subject to a greater maximum coverage amount of $1.5 million, and the supplemental life/AD&D insurance is subject to a greater maximum coverage amount of $3.5 million. |
• Designed to provide market competitive benefits to protect employees’ and their covered dependents’ health and welfare. | ||||
| Additionally, our NEOs participate in the Executive Perquisite Allowance Plan. This provides an annual allowance to defray the cost of services normally provided as executive perquisites, such as financial or legal planning, club memberships, or executive physicals. Each of our eligible executives, including our NEOs, is provided an annual payment of $12,000 ($25,000 in the case of Mr. Lederer), on an after-tax basis, which is paid during the first quarter of each calendar year. | • The Executive Perquisite Allowance is not viewed as a significant element of our compensation structure, but it is useful in attracting, motivating and retaining high caliber executive talent. | |||||
| Severance Agreements | Each of our NEOs has entered into a Severance Agreement with the Company. Structured as “severance” rather than “employment” agreements, these agreements outline compensation considerations in the event that 1) the executive’s employment is terminated by the Company other than for cause, and 2) employment is ended by the executive with good reason. | • Designed to provide standard protection to both the executive and to US Foods to ensure continuity, and aid in retention. | ||||
101
Table of Contents
How We Make Compensation Decisions
The Compensation Committee, in consultation with management and its independent compensation consultant—Meridian Compensation Partners (“Meridian”)—focuses on ensuring that our executive compensation programs reinforce our pay for performance philosophy and enhance longer-term value creation.
After reviewing the compensation program and in light of the proposed Acquisition, the Compensation Committee determined that, other than the elimination of the Individual Performance Factor, the compensation program was an effective design to meet our objectives. Each NEO’s target total direct compensation (base salary, target Annual Incentive Plan award and Annual Equity Grant award, if any) provides the executive with an appropriate compensation opportunity, and each NEO’s total direct compensation is generally appropriate in light of US Foods’ overall performance, the executive’s personal performance and the proposed Acquisition.
Committee Oversight
The Compensation Committee—comprised of non-employee directors of USF Holding, designated by our Sponsors—is responsible for overseeing our executive compensation program. The Compensation Committee determines and approves all compensation for our NEOs.
Although the entire board of directors of USF Holding meets to discuss our CEO’s goals and performance in achieving those goals each fiscal year, the Compensation Committee solely approves all compensation awards and payout levels.
The Compensation Committee develops and oversees programs designed to compensate our NEOs and other executive officers, as well as the presidents of our operating divisions. The Compensation Committee is also authorized to approve all equity investments, grants of restricted stock, restricted stock units, stock options, stock appreciation rights and other awards under our equity-based incentive plans for US Foods employees.
102
Table of Contents
The Compensation Committee has several resources and analytical tools it uses in making decisions related to executive compensation. The table below discusses the key tools.
| Compensation Committee Resources | ||
| Independent Committee Consultant — Meridian | Meridian is available to provide independent advice to the Compensation Committee in connection with matters pertaining to executive compensation. The scope of Meridian’s services generally includes 1) attending, as requested, select Compensation Committee meetings and associated preparation work; 2) guiding the Compensation Committee’s decision-making with respect to executive compensation matters; 3) providing advice on our compensation peer group; 4) providing competitive market studies; and 5) updating the Compensation Committee on emerging best practices and changes in the regulatory and governance environment.
Meridian did not provide any services to US Foods in 2014 that were unrelated to executive compensation. | |
| US Foods’ Human Resources Department | US Foods’ Chief Human Resources Officer and the Human Resources Department provide benchmarking data (comprised of peer group analysis and supplemental external compensation survey data analysis) and recommendations with respect to 2014 annual base salary, annual incentive plan, and long-term incentive compensation decisions. US Foods’ Human Resources Department works with Meridian to gather and analyze relevant competitive data and to identify and evaluate various alternatives for executive compensation. | |
| CEO | For other NEOs, the CEO makes individual recommendations to the Compensation Committee on base salary and annual incentive award and long-term incentive compensation opportunities. The CEO also provides initial recommendation for Annual Incentive Plan performance targets for the Compensation Committee to consider.
Although the Compensation Committee values and welcomes input from management, it retains and exercises sole authority to make decisions regarding NEO compensation. No member of management, including the CEO, has a role in determining his or her own compensation. | |
Role of CEO in Determining Executive Compensation
As described in the table above, our CEO, Mr. Lederer, assists the Compensation Committee by providing his evaluation of the performance of the other NEOs and recommends compensation levels for them. In forming his recommendations, he is advised by US Foods’ Human Resources Department, as described above. The Human Resources Department assesses the design of, and makes recommendations related to, our compensation and benefits programs.
Mr. Lederer also consults with other NEOs for recommendations related to the appropriate financial performance measures used in our Annual Incentive Plan. In developing recommendations for the Compensation Committee, Mr. Lederer and the Human Resources Department consult benchmarking and other market surveys from Meridian and other compensation consultants, as described elsewhere in this Compensation Discussion and Analysis, and follow the philosophy and pursue the objectives described in “Philosophy of Executive Compensation Program.”
103
Table of Contents
The Compensation Committee determines each element of compensation for Mr. Lederer. With input from Meridian, the Human Resources Department and Mr. Lederer, the Compensation Committee determines each element of compensation for the other NEOs. The Compensation Committee is under no obligation to take these recommendations.
Use of Competitive Data
We believe US Foods must pay compensation that is competitive with the external market for executive talent. This will allow us to attract, retain and motivate executives, including the NEOs, who will enhance our long-term business results. For the NEOs, we generally construct external market comparison points by examining 1) peer group proxy data and 2) compensation market survey data.
Peer Group Data
Since 2009, the Compensation Committee has used a peer group of companies for benchmarking purposes. The methodology used to construct the peer group involved identifying peer companies based on the following:
| • | Industry Attributes: similarly-sized food distributors, plus distribution companies with similar operations and size but not focused on food distribution |
| • | Financial Performance: similar financial performance, regardless of industry classification; focused on key ratios and financial metrics |
The final peer group was determined based on how well each company matched US Foods’ size, performance and capital structure, using these parameters:
| • | Market capitalization |
| • | Enterprise value and revenue |
| • | Profitability (gross profit margin and EBITDA margin) |
| • | Growth (one year revenue and EBITDA growth) |
| • | Leverage (as measured by debt/EBITDA) |
For each parameter, an acceptable range of values was defined and weights were assigned to reflect their relative importance. Those companies that scored above the average for each parameter were included in our peer group.
Periodically, Meridian will work with our Human Resources Department to review the construction of the peer group, to ensure the peer group continues to reflect companies whose business size and complexity are similar to US Foods and with which the Company competes for top executive talent. The methodology used in constructing the proposed peer group included:
| • | For data availability purposes, the group of available companies included publicly traded US companies plus other companies who file with the Securities and Exchange Commission (SEC). |
| • | The group of available companies was narrowed to |
| (1) | Food distributors (in the Global Industrial Classification Standard “GICS” Consumer Staples sector) |
| (2) | Non-food distributors in high-volume/low-margin businesses (in four explicit GICS categories: trading companies and distributors (Materials sector), retail distributors (Consumer Discretionary sector), health care distributors (Health Care sector), and technology distributors (Information Technology sector)) |
104
Table of Contents
| (3) | Other food/staples retailers (also in the Consumer Staples sector) |
| (4) | Food products companies (added for food focus). |
| • | The potential peers were screened based on 1) revenues—for food distribution included all companies with revenues greater than $3 billion and for others included all companies with revenues that ranged from $6 billion to $60 billion—and 2) EBITDA margin in the range of 2% to 8%. |
In July 2012, the Compensation Committee approved the inclusion of the following companies in the peer group executive pay and program benchmarking:
| Food Distributors | Food Retail | Food Products | Technology Distributors | |||
| • Sysco Corp
• Andersons Inc
• Nash Finch
• United Natural Foods Inc. |
• Safeway Inc
• Whole Foods Market Inc |
• Campbell Soup Co
• Dean Foods Co
• Dole Foods Company Inc
• Heinz (HJ) Co
• Smithfield Foods Inc
• Tyson Foods Inc |
• Arrow Electronics Inc
• Avnet
• Synnex Corp
• Tech Data Corp | |||
| Trading & Distribution | Healthcare Distributors | Other Distributors | ||||
| • Grainger (W W) Inc
• Wesco International Inc |
• Owens & Minor Inc
• Schein (Henry) Inc |
• Genuine Parts Co |
||||
We made no changes to the peer group in 2014. However, in light of recent ownership changes in Dole Foods Company Inc, H J Heinz Co., Smithfield Foods Inc., Safeway Inc., and Nash Finch, the Compensation Committee may consider reviewing the components of the peer group in 2015.
Constructing the Market Compensation Comparisons
In 2014, we did not conduct a formal market comparison for the NEOs, given the proposed Acquisition and our decision to suspend the annual equity grant program.
Use of Performance Evaluations
The Compensation Committee does an annual assessment of Mr. Lederer’s performance. Mr. Lederer assesses the performance of each other NEO to determine each executive’s success in meeting our operating priorities or exhibiting the core attributes on which all employees are evaluated. These evaluations are subjective; no objective criteria or relative weighting is assigned to any individual factor.
The Compensation Committee uses the performance evaluations as an eligibility threshold for annual base salary increases.
The performance evaluation results may affect the amount of a NEO’s annual base salary increase. Any NEO who receives a “Meets Expectations” or “Exceeds Expectations” performance rating is given a percentage base salary increase. This reflects the following factors:
| • | The NEO’s performance relative to the other Named Executive Officers, and/or |
| • | The median base salary of the market comparator group, and/or |
105
Table of Contents
| • | Any additional or exceptional event that occurs, such as an internal equity adjustment, a promotion or a change in responsibilities |
| • | The overall budgeted increase for our salaried employee population |
The merit increase program for NEOs was suspended in 2014.
Actual annual base salary determinations are discussed under “Base Salary.”
In order to be eligible for an Annual Equity Grant award, a Named Executive Officer must be actively employed in good standing on the date of the grant. For a further discussion of the program see “Annual Equity Grant” below.
Internal Analysis
With respect to annual salary, Annual Incentive Plan awards and Annual Equity Grant awards available to NEOs, the Compensation Committee does not perform a formal internal equity analysis. However, it does consider the internal equity of the compensation awarded by using comparisons within US Foods.
For the annual salary review, this analysis involves comparing merit increase-based awards for the NEOs (in aggregate and on an individual basis) to the aggregate merit increase awards for the exempt US Foods employees.
The Annual Incentive Plan awards review analysis involves comparing the formula-determined bonus plan award for the NEOs to the formula-determined bonus plan awards for the Company’s divisions.
The analysis involved in the Annual Equity Grant awards was not done in 2014, given the decision to suspend the program for 2014.
Business Performance and Impact on Pay
US Foods’ executive compensation program directly links a substantial portion of executive compensation to the Company’s performance, through annual and long-term incentives. In developing our pay for performance policies, the Compensation Committee generally reviews elements of pay for each executive position against the market comparison data points for similar executive positions at other companies. The external market comparison data points include 1) peer group compensation proxy-reported data (50% weight) and 2) external comparison market survey data (50% weight).
However, the Compensation Committee has not historically used an exact formula for allocating between fixed and variable, cash and non-cash, or short- and longer-term compensation. This approach allows the committee to incorporate flexibility into our annual and longer-term compensation programs and adjust for the evolving business environment.
The Target Compensation Mix charts below includes 1) current base salary, 2) Annual Incentive Plan award targets, and 3) grant date value of stock options and RSUs granted in 2014.
106
Table of Contents
Target Compensation Mix—FY 2014
(Consists of base salary, Annual Incentive Plan award target and 2014 equity grant value)
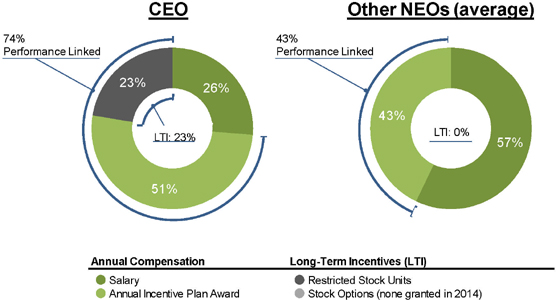
The Actual Compensation Paid chart below includes 1) base salary paid in fiscal 2014, 2) the Annual Incentive Plan award amounts paid to the NEOs related to fiscal 2014, and 3) the grant date value of stock options and restricted stock units (RSUs) award granted
Actual Compensation Paid—FY 2014
(Consists of base salary, Annual Incentive Plan award and 2014 equity grant value)
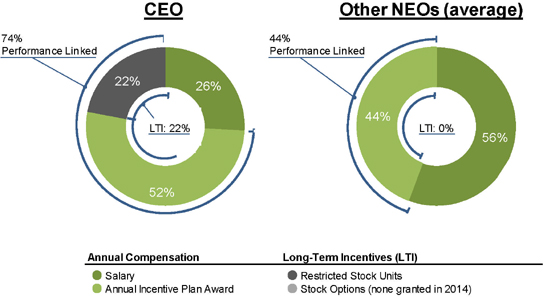
107
Table of Contents
Overview of the 2014 Executive Compensation Program
Base Salary
We pay base salaries to attract and retain talented executives and to provide a fixed base of cash compensation. The table below shows the base salaries of each NEO that were approved by the Compensation Committee. These salaries were in effect for all of 2014.
| Named Executive Officer |
2014 Base Salary | |||
| John A. Lederer |
$ | 1,175,000 | ||
| Fareed Khan |
600,000 | |||
| Pietro Satriano |
500,000 | |||
| Stuart S. Schuette |
600,000 | |||
| Keith Rohland |
475,000 | |||
No 2014 Adjustments to Base Salary
Due to the proposed Acquisition, the base salaries of the NEOs remained the same in 2014 as they were in 2013.
Overview of Annual Incentive Plan Award
The Annual Incentive Plan (or AIP) is designed to offer opportunities for cash compensation tied directly to Company performance. Under the AIP, we pay the Annual Incentive Plan award in cash, with payments made in the first quarter of the fiscal year for bonuses earned based on performance in the prior fiscal year. Each year, the Compensation Committee approves the incentive plan framework for each NEO. In December 2013, the Compensation Committee approved the Annual Incentive Plan framework for fiscal year 2014.
The framework for the 2014 Annual Incentive Plan for the Named Executive Officers was based on the following:

108
Table of Contents
The possible payout range of 2014 Annual Incentive Plan awards is 0.0% to 147%.
The performance measures relate to performance completed for fiscal 2014. The Compensation Committee determines and pays AIP awards within 90 days following the end of the fiscal year for which the award was earned.
Eligible Earnings is equal to the participant’s base salary earnings during the incentive plan year.
AIP Target Percentage is the individual Annual Incentive Plan target percentage. The individual target percentages are based on market-competitive data and are established as a percentage of base pay.
At the beginning of each plan year, the Compensation Committee designates individual AIP target percentages for each of our NEOs. For 2014, the individual AIP target percentages for our NEOs were generally positioned at the calculated median market short-term incentive target value.
The 2014 Annual Incentive Plan individual targets for our NEOs were as follows:
| Named Executive Officer |
2014 Annual Incentive Plan Target | |||
| John A. Lederer |
110 | % | ||
| Fareed Khan |
75 | % | ||
| Pietro Satriano |
75 | % | ||
| Stuart S. Schuette |
75 | % | ||
| Keith Rohland |
75 | % | ||
The Business Performance Factor is calculated based on the following financial objectives.
The various levels of performance targets to reach threshold, target and maximum payouts for the 2014 Annual Incentive Plan are described in the table below:
Business Performance Factor Targets—FY 2014
| Adjusted EBITDA |
Adjusted EBITDA (payout scale) |
Cash Flow — Net Debt |
Cash Flow — Net Debt (payout scale) |
|||||||||||||
| Threshold |
$ | 812,250,000 | 37.50 | % | $ | 4,766,790,000 | 37.50 | % | ||||||||
| Target |
$ | 855,000,000 | 100.00 | % | $ | 4,539,800,000 | 100.00 | % | ||||||||
| Maximum |
$ | 997,187,000 | 150.00 | % | $ | 4,471,700,000 | 120.00 | % | ||||||||
It is important to note that the financial performance measures are independent of each other. Performance against the Adjusted EBITDA measure is determined independently from performance against the Cash Flow—Net Debt measure. The final Business Performance Factor is calculated by adding the resulting payout percentage for Adjusted EBITDA with the resulting payout percentage for Cash Flow—Net Debt. As a result, it is possible that the payout for either measure—or both measures—could be zero.
109
Table of Contents
The Business Performance Factor is calculated in the table below:
Calculating the Business Performance Factor
| Performance Metric |
Potential Payment | Weighting | x | 2014 Performance(1) (%) |
= | Payout (%) | ||||||||
| Adjusted EBITDA |
0% - 150% | 90 | % | 37.50% - 150.00% | 33.75% - 135.00% | |||||||||
| Cash Flow—Net Debt |
0% - 120% | 10 | % | 37.50% - 120.00% | 3.75% - 12.00% | |||||||||
| TOTAL |
0% - 147% | 100 | % | |||||||||||
| (1) | Assumes the threshold is met. See “FY2014 Annual Incentive Awards” below for 2014 actual payout amounts. |
The 2014 Annual Incentive Plan (AIP) placed a strong emphasis on incenting financial performance—with 90% of the total weighting based on Adjusted EBITDA. The remaining 10% was based on the the average of the end of month Cash Flow—Net Debt throughout the year. The 2014 AIP target was purposefully set to reward Adjusted EBITDA performance equal to our annual operation plan, with a 100% of target AIP award. Our 2014 annual operating plan target range was set with the maximum goals that provided the opportunity to pay AIP awards above the 100% of target bonus level.
In order to provide any AIP award under the Adjusted EBITDA performance metric, we historically set an achievement threshold amount of Adjusted EBITDA equal to 95% of the established AIP Adjusted EBITDA target. For the 2014 AIP, the Adjusted EBITDA achievement threshold was set at $812,250,000.
During each fiscal year, we accrue a bonus expense for the projected amount of the aggregate AIP awards to be paid to employees that are part of the NEO bonus plan (the “Bonus Pool”). If at any time during the year, management determines it is no longer probable that we will meet our established AIP Adjusted EBITDA target, it will reduce the amount to be accrued or reduce the Bonus Pool to more accurately reflect the expected payout. If we have not met the AIP Adjusted EBITDA threshold for the year, and amounts remain in the Bonus Pool (accrued for expected payouts), management is required by the AIP and by applicable accounting practices, to reduce the Bonus Pool by the amount no longer expected to be paid. This, in turn, will increase Adjusted EBITDA (i.e., each dollar that has been accrued to fund the Bonus Pool reduced the Adjusted EBITDA amount by $1, so each dollar removed from the Bonus Pool will increase Adjusted EBITDA by $1).
If the amount by which the threshold exceeds the actual Adjusted EBITDA is greater than the accruals remaining in the Bonus Pool, no AIP award will be paid. The percentage difference between the amount of award payments to be paid to employees if the Company had met the Adjusted EBITDA threshold and the amount remaining in the Bonus Pool that will not reduce the Adjusted EBITDA amount below the threshold, is the “Haircut Reduction.” Under the AIP, the Company will not pay any incentive plan award if the Haircut Reduction equals 100% (i.e., the Company does not meet the threshold set at the beginning of the year). For example, if $5 million were accrued in the Bonus Plan at the end of 2014 (the amount that was accrued and expected to be paid as bonuses) and the Adjusted EBITDA threshold was $5 million more than the actual Adjusted EBITDA, no bonus would be paid (i.e., the Haircut Reduction would equal 100%).
110
Table of Contents
Annual Incentive Plan Awards—2014 Payouts
The Compensation Committee believes that the threshold and target levels of performance represent challenging but obtainable US Foods performance. The maximum target level represents exemplary and extremely challenging performance.
The individual AIP target percentages for our NEOs were generally positioned at the median market short-term incentive target value. The 2014 AIP was purposefully set to reward performance at the annual operating plan level, with a 100% of target AIP award. We set the fiscal year 2014 annual operating plan with maximum goals that provided the opportunity to pay AIP awards beyond the 100% bonus level.
Basing AIP target percentages on the median market short-term incentive target values, and setting the reward level for performance at the annual operating plan level with a 100% of target, the AIP award ensures that total cash compensation does not significantly exceed the median—unless we reach outstanding levels of performance.
The following table reflects the actual performance levels for each of the 2014 Business Performance Factor metrics that pertain to the NEOs.
FY 2014 Annual Incentive Award
Calculating the Business Performance Factor
| Performance Metric |
Potential Payment | Weighting | x | 2014 Performance (%) |
= | Payout (%) |
||||||||||||
| Adjusted EBITDA(1) |
0% - 150% | 90 | % | 101.82 | % | 94.93 | % | |||||||||||
| Cash Flow—Net Debt(2) |
0% - 120% | 10 | % | 100.89 | % | 11.17 | % | |||||||||||
| TOTAL |
0% - 147% | 100 | % | 106.10 | % | |||||||||||||
| Haircut Reduction % |
0.00 | % | ||||||||||||||||
| TOTAL |
106.10 | % | ||||||||||||||||
| (1) | For purposes of the 2014 Annual Incentive Plan, the Adjusted EBITDA target was $855 million and actual Adjusted EBITDA was $866 million. Adjusted EBIDTA is defined as EBITDA ($664 million for the fiscal year ended December 27, 2014) adjusted for 1) Sponsor fees ($10 million); 2) share-based compensation expense ($12 million); 3) pension ($2 million); 4) business transformation costs ($54 million); 5) Sysco Acquisition related costs ($38 million) and 6) the non-cash impact of LIFO adjustment ($60 million) and 7) gains, losses, or charges as specified by the Company’s debt agreements ($26 million). |
| (2) | For the purposes of the 2014 Annual Incentive Plan, Cash Flow – Net Debt is determined by calculating the average of the end of month Cash Flow—Net Debt throughout the year. Cash Flow—Net Debt is defined as long-term debt plus the current portion of long-term debt ($4,770 million as of December 28, 2013 and $4,748 million as of December 27, 2014) net of 1) restricted cash held on deposit in accordance with our credit agreements ($7 million as of December 28, 2013, and $6 million as of December 27, 2014) and 2) total cash and cash equivalents remaining on the balance sheet at year-end ($180 million as of December 28, 2013, and $344 million as of December 27, 2014). We had a reduction of the Cash Flow—Net Debt amount in 2014 (Cash Flow—Net Debt $4,583 million as of December 28, 2013, Cash Flow—Net Debt $4,398 million as of December 27, 2014). The 2014 Annual Incentive Plan Business Performance Factor is 106.10%. |
111
Table of Contents
Based on the approved 2014 Business Performance Factor, the actual 2014 Annual Incentive Plan award for each NEO was as follows:
Summary of Awards
| Name | Eligible Earnings |
x | Target % |
x | Business Performance Factor |
+ | Special AOP Bonus |
= | Award for FY2014 Performance |
|||||||||||||||||||
| John A. Lederer |
$ | 1,175,000 | 110 | % | 106.10 | % | $ | 1,000,000 | $ | 2,371,328 | ||||||||||||||||||
| Fareed Khan |
$ | 600,000 | 75 | % | 106.10 | % | $ | 477,445 | ||||||||||||||||||||
| Pietro Satriano |
$ | 500,000 | 75 | % | 106.10 | % | $ | 397,871 | ||||||||||||||||||||
| Stuart S. Schuette |
$ | 600,000 | 75 | % | 106.10 | % | $ | 477,445 | ||||||||||||||||||||
| Keith Rohland |
$ | 475,000 | 75 | % | 106.10 | % | $ | 377,977 | ||||||||||||||||||||
The Compensation Committee intends that the fiscal year 2014 Annual Incentive Plan awards be subject to a “claw back.” This would happen if there were a restatement of our financial results—other than one due to a change in accounting policy—within 36 months of the award being paid. The restatement would result in the payment of a reduced award, if the award was recalculated using the restated financial results. The Compensation Committee has the sole discretion to determine the form and timing of any such repayment.
Overview of Long-term Equity Incentives
Long-term equity incentives help provide a balanced focus on both short-term and long-term goals for participating employees, including our NEOs. These incentives are important to recruiting, retention and motivation. They are designed to compensate our NEOs for their long-term commitment to US Foods, while motivating sustained increases in our financial performance and shareholder value.
Equity awards are made under our 2007 Stock Incentive Plan. They are always granted in USF Holding equity securities, with a per share exercise price equal to the “fair market value” of one share of USF Holding common stock on the date of grant.
The fair market value of one share of USF Holding common stock is determined at the close of each quarter. Fair market value is determined reasonably and in good faith by the USF Holding board of directors, taking into account the determination of an independent, third party appraisal of the fair market value of one share of USF Holding common stock.
Our long-term equity incentives include 1) the ability to make an equity investment and 2) grants of stock options, stock appreciation rights (Equity Appreciation Rights), restricted stock and restricted stock units, and other stock-based awards.
We have an Annual Equity Grant program designed to 1) improve the market competitiveness of the Long-Term Incentive Plan and 2) provide an opportunity for wealth creation tied to US Foods’ long-term performance. The Annual Equity Grant program improves the alignment of the long-term incentive opportunities with similar opportunities provided by the companies with whom we compete for talent. It also strengthens the focus on creating long-term value by providing financial rewards for operational success.
112
Table of Contents
In 2014, we suspended the equity grant program in light of the proposed Acquisition.
Equity Investments
Key management employees, including our NEOs, have an opportunity to invest side-by-side with our Sponsors. There are 127 management employees participating as equity investors. The ability to invest in our parent, USF Holding, focuses our key management on long-term value creation by providing a significant financial reward for operational success. The goal of this incentive is to promote an ownership mentality in management.
The NEOs have specific minimum investment level requirements to meet. For their investment, participants receive 1) investment shares equal to the value of their investment plus 2) an investment stock option grant based on a multiple of their investment level (1.00x to 5.00x). Each of the NEOs satisfied the minimum investment levels and, in many cases, invested beyond the specified investment requirement. The downside risk to investors is limited to their initial investment. The upside potential is linked directly to the USF Holding share price appreciation.
All of our NEOs have previously invested in USF Holding. The following table depicts the level of investment of each of our Named Executive Officers.
| Named Executive Officer |
Investment Level |
Investment Shares |
Stock Option Multiple |
Investment Stock Options |
||||||||||||
| John A. Lederer |
$ | 3,500,000 | 777,778 | 5.00 | x | 3,888,892 | ||||||||||
| Fareed Khan |
375,000 | 62,500 | 4.00 | x | 250,000 | |||||||||||
| Pietro Satriano |
850,000 | 170,000 | 4.00 | x | 680,000 | |||||||||||
| Stuart S. Schuette |
600,000 | 124,445 | 4.30 | x | 531,114 | |||||||||||
| Keith Rohland |
400,000 | 80,000 | 3.50 | x | 280,000 | |||||||||||
The investment level of each of the Named Executive Officers as a multiple of base salary is depicted below.
| Named Executive Officer |
Investment Level |
Multiple of Base Salary |
||||||
| John A. Lederer |
$ | 3,500,000 | 2.98 | x | ||||
| Fareed Khan |
375,000 | 0.63 | x | |||||
| Pietro Satriano |
850,000 | 1.70 | x | |||||
| Stuart S. Schuette |
600,000 | 1.00 | x | |||||
| Keith Rohland |
400,000 | 0.84 | x | |||||
Investment Stock Options
As stated in “Equity Investments” above, key management employees who participate as equity investors in USF Holding, including our NEOs, receive an investment stock option grant based on a multiple of their investment level. In 2014 none of our NEOs invested additional amounts in USF Holding or were granted investment stock options.
According to the terms of the 2007 Stock Incentive Plan, the exercise price of investment stock options may not be less than the fair market value on the date of the grant. For each award of investment stock options, half of the investment stock options granted are time-based, vesting in equal increments in either four years (25% per year) or five years (20% per year). The other half is performance-based, vesting in equal increments over either four years (25% per year) or five years (20% per year). This is based on a comparison of actual Adjusted EBITDA against pre-set goals for Adjusted EBITDA. The combination of time-based and performance-based vesting criteria is designed to compensate participating management employees—including our NEOs—for their long-term commitment to US Foods, while motivating sustained increases in our financial performance.
113
Table of Contents
Performance-based investment stock options are vested using two criteria. First, they are subject to the person remaining employed with US Foods during the entire performance period. Second, the USF Holding board of directors must determine that we have achieved the annual performance target, based on Adjusted EBITDA, for each of the relevant fiscal years. If a performance target for a given fiscal year is not met, the performance-based investment stock options may still vest and become exercisable on a catch-up basis if, at the end of a subsequent fiscal year, a specified cumulative Adjusted EBITDA performance target is achieved. The annual and cumulative Adjusted EBITDA performance targets are based on our long-term financial plans in existence at the time of the grant. These targets are reviewed and approved on a yearly basis. Accordingly, in each case at the time of grant, we believed those levels—while attainable—would require strong performance and execution. The Adjusted EBITDA performance target for 2014 was $855,000,000 and actual Adjusted EBITDA was $866,237,000.
For purposes of calculating the achievement of the EBITDA-based performance target, “EBITDA” means earnings before interest, taxes, depreciation and amortization, plus transaction, management and/or similar fees paid to our Sponsors and/or affiliates. In addition, the USF Holding board of directors adjusts the calculation of EBITDA. This is done to reflect certain events that were not contemplated in our financial plan. Generally, the board of directors of USF Holding has made identical adjustments to EBITDA for purposes of calculating our long-term equity incentive program as for other purposes, including the covenants contained in our principal financial agreements.
Annual Equity Grant
In 2013, we introduced a new Annual Equity Grant (AEG) program designed to 1) improve the market competitiveness of the Long-Term Incentive Plan and 2) provide an opportunity for wealth creation tied to US Foods’ long-term performance. The AEG program both improves the alignment of the long-term incentive opportunities with similar opportunities provided by the companies with whom we compete for talent and strengthens the focus on long-term value creation by providing financial rewards for operational success.
The AEG program works much like plans at large, publicly traded companies. The grant date for the 2013 AEG was June 3, 2013 and additional grants under this program were suspended in 2014 due to the proposed Acquisition.
Restricted Stock/Restricted Stock Units (RSUs)
The 2007 Stock Incentive Plan allows for granting of restricted stock and RSU awards. We grant restricted stock on a rare and selective basis. Restricted stock and RSU grants are designed to enhance retention of key management through specific time and/or performance vesting requirements.
For each award of RSUs under the Annual Equity Grant Program, half of the grant is time-based, vesting in equal increments in four years (25% per year). The other half is performance-based, vesting in equal increments over four years (25% per year). This is based on a comparison of actual Adjusted EBITDA against pre-set goals for Adjusted EBITDA. The combination of time-based and performance-based vesting criteria is designed to compensate participating management employees—including our NEOs—for their long-term commitment to US Foods, while motivating sustained increases in our financial performance.
On August 1, 2013, the Compensation Committee reached an agreement with Mr. Lederer on the terms of his employment arrangement through 2015. The committee’s prior compensation arrangement with Mr. Lederer did not extend past 2013. In addition to base salary, annual incentive, and annual equity grant, the Compensation Committee approved the following special compensation for Mr. Lederer:
| • | $1,000,000 cash bonus if the Company achieves its 2014 Adjusted EBITDA target (paid in January 2015) |
| • | $1,000,000 cash bonus if the Company achieves its 2015 Adjusted EBITDA target (to be paid March 2016) |
| • | $1,000,000 grant of time-vested RSUs in 2013, which vested on December 31, 2014 |
| • | $1,000,000 grant of time-vested RSUs in 2014, which vest on December 31, 2015 |
114
Table of Contents
As part of that agreement, Mr. Lederer was granted RSUs valued at $1,000,000 in 2013 (which vested 100% on December 31, 2014) and was granted RSUs valued at $1,000,000 on December 10, 2014, which will vest 100% on December 31, 2015, subject to his continued employment. With respect to the RSU grant, the Compensation Committee also granted Mr. Lederer a “put” right, which gives him the ability to sell his RSUs back to the Company on July 1, 2015, if no liquidity event has occurred before that date. The RSU grant was granted under the 2007 Stock Incentive Plan.
Compensation Equity Awards
| Name |
Grant Date | Number of Shares of Stock (#) |
Fair Market Value Price on Date of Grant ($) |
Grant Date Fair Value of Stock and Option Awards |
||||||||||||
| John A. Lederer |
12/10/2014 | (1) | 166,667 | 6.00 | 1,000,002 | (2) | ||||||||||
| (1) | With respect to Mr. Lederer, we granted restricted stock units (RSUs) under the 2007 Stock Incentive Plan as part of a 2014 equity grant. The vesting of this grant is contingent upon the executive’s continued service with the company. The grant vests 100% on December 31, 2015 |
| (2) | The RSU grant is valued at $6.00 per share, being the fair market value price of our common stock as of December 27, 2014. |
Other Equity-Based Awards
The Compensation Committee may grant other types of equity-based upon the common stock of USF Holding, including deferred stock, bonus stock, unrestricted stock and dividend equivalent rights. To date, the Compensation Committee has not granted any other type of equity-based awards to our NEOs.
Transaction and Retention Awards
In 2013, the Compensation Committee approved Transaction and Retention bonuses for select NEOs, to recognize contribution and encourage retention up to, during, and after the closing of the Acquisition.
| Named Executive Officer |
Transaction Award |
Retention Award |
||||||
| John A. Lederer |
$ | 0 | $ | 0 | ||||
| Fareed Khan |
$ | 250,000 | $ | 600,000 | ||||
| Pietro Satriano |
$ | 1,000,000 | $ | 500,000 | ||||
| Stuart S. Schuette |
$ | 1,000,000 | $ | 600,000 | ||||
| Keith Rohland |
$ | 750,000 | $ | 475,000 | ||||
In 2015, the Compensation Committee approved payment of the Transaction and Retention bonus amounts at specific dates even if the transaction is not consummated.
Retirement Benefits
We historically provided retirement plan benefits to corporate employees and most of our non-union operating company employees under the broad-based tax qualified US Foods, Inc. Defined Benefit Pension Plan, which we refer to as the “pension plan.” However, effective September 15, 2004, pension plan benefits are no longer provided to salaried employees. The only remaining retirement benefits for salaried employees are those provided under the tax-qualified US Foods 401(k) Retirement Savings Plan.
115
Table of Contents
Executive Perquisites and Other Benefits
NEOs participate in the same benefit programs that are offered to other salaried and hourly employees. Our comprehensive benefits program offers medical coverage, prescription drug coverage, dental plans, vision plan, life insurance and disability plans and a 401(k) savings plan. These programs are designed to provide market competitive benefits to protect employees’ and their covered dependents’ health and welfare. Although our executives—including our NEOs—are eligible to participate in US Foods’ group medical and dental coverage, we adjust employees’ contributions toward the cost of this coverage according to salary level. As a result, executives pay a higher percentage of the cost of these benefits than do non-executives.
The NEOs are eligible for enhanced Long Term Disability (LTD) and life insurance coverage levels. The LTD benefit amount for NEOs is increased from 60% to 66 2/3% of monthly earnings. The basic life insurance is subject to a maximum coverage amount of $3,500,000.
Additionally, our NEOs participate in the Executive Perquisite Allowance Plan. This provides an annual allowance to defray the cost of services normally provided as executive perquisites, such as financial or legal planning, club memberships or executive physicals. Each of our eligible executives—including our NEOs—is entitled to an annual payment of $12,000 ($25,000 in the case of Mr. Lederer), plus a tax gross-up, which is paid during the first quarter of each calendar year.
The Executive Perquisite Allowance is not viewed as a significant element of our compensation structure, but it is useful in attracting, motivating and retaining high caliber executive talent.
US Foods also utilizes a Relocation Assistance program that is designed to minimize the inconvenience, time loss, and personal or financial burden created by the relocation of our employees. The provisions outlined in our Relocation Assistance program are intended to establish a fair and equitable system for reimbursing most reasonable and normal expenses. In addition, the Relocation Assistance program outlines a relocation package designed to facilitate and encourage a timely move to the new location.
Effect of a Change In Control
In the event of a Change in Control of US Foods, the Compensation Committee will likely have the authority to vest outstanding awards, and/or provide for their cancellation in exchange for cash or substitution of outstanding awards under the 2007 Stock Incentive Plan. A more complete explanation of the effect of a Change in Control is found under “Payments after a Change in Control.”
Executive Compensation
The following discussion—as well as the Compensation Discussion and Analysis contained here—contain references to target performance levels for our long-term incentive compensation. These targets and goals are discussed in the limited context of US Foods’ compensation programs and should not be interpreted as management’s expectations or estimates of results or other guidance. We specifically caution against applying these statements to other contexts.
Report of the Compensation Committee
The Compensation Committee has reviewed and discussed the Compensation Discussion and Analysis required by Item 402(b) of Regulation S-K with management. Based on these reviews and discussions, the Compensation Committee recommended to the boards of directors of USF Holding and US Foods that the Compensation Discussion and Analysis for the year ended December 27, 2014 be included in this Annual Report on Form 10-K.
COMPENSATION COMMITTEE
Michael Calbert (Chairman)
Edward M. Liddy
Nathaniel H. Taylor
Richard Schnall
116
Table of Contents
Summary Compensation Table
The following table sets forth information on each of the NEOs—our Chief Executive Officer, our Chief Financial Officer, and the three most highly compensated of the other executives of US Foods—at the end of fiscal year 2014. In determining the most highly compensated executives, we excluded the amounts shown under “Change in Pension Value and Nonqualified Deferred Compensation.”
Summary Compensation Table
| Name and Principal Position |
Fiscal Year |
Salary | Bonus | Stock Awards |
Option Awards |
Non- Equity Incentive Plan Compensation |
Change in Pension Value and Nonqualified Deferred Compensation |
All Other Compensation |
Total | |||||||||||||||||||||||||||
| John A. Lederer |
2014 | 1,175,000 | 0 | 1,000,002 | (1) | 0 | 2,371,328 | (2) | 0 | (3) | 505,139 | (4) | 5,051,469 | |||||||||||||||||||||||
| President and Chief Executive Officer |
2013 | 1,162,603 | 0 | 1,750,002 | (5) | 2,250,014 | (5) | 1,017,086 | (6) | 0 | (7) | 263,428 | (8) | 6,443,133 | ||||||||||||||||||||||
| Fareed Khan |
2014 | 600,000 | 0 | 0 | 0 | 477,445 | (2) | 0 | (3) | 19,800 | (4) | 1,097,245 | ||||||||||||||||||||||||
| Chief Financial Officer |
2013 | 187,397 | 650,000 | (9) | 1,000,002 | (9) | 547,500 | (9) | 150,000 | (6) | 0 | (7) | 1,385 | (8) | 2,536,284 | |||||||||||||||||||||
| Stuart S. Schuette |
2014 | 600,000 | 0 | 0 | 0 | 477,445 | (2) | 3,576 | (3) | 19,800 | (4) | 1,100,821 | ||||||||||||||||||||||||
| Chief Operating Officer |
2013 | 592,562 | 0 | 187,536 | (5) | 562,512 | (5) | 353,451 | (6) | (1,521 | )(7) | 26,896 | (8) | 1,721,436 | ||||||||||||||||||||||
| Pietro Satriano |
2014 | 500,000 | 0 | 0 | 0 | 397,871 | (2) | 0 | (3) | 19,800 | (4) | 917,671 | ||||||||||||||||||||||||
| Chief Merchandising Officer |
2013 | 490,082 | 0 | 937,536 | (5) | 562,512 | (5) | 292,324 | (6) | 0 | (7) | 26,896 | (8) | 2,309,350 | ||||||||||||||||||||||
| Keith Rohland |
2014 | 475,000 | 0 | 0 | 0 | 377,977 | (2) | 0 | (3) | 19,800 | (4) | 872,777 | ||||||||||||||||||||||||
| Chief Information Officer |
2013 | 467,562 | 0 | 150,000 | (5) | 450,003 | (5) | 278,891 | (6) | 0 | (7) | 33,392 | (8) | 1,379,848 | ||||||||||||||||||||||
| (1) | This amount relates to an equity grant of RSUs made in 2014. The grant value is calculated using the fair market value of USF Holding common stock on the grant date as determined by the USF Holding board of directors in accordance with FASB ASC Topic 718. |
| (2) | These amounts consist of the 2014 cash awards under the Annual Incentive Plan. |
| (3) | The amounts reported in the Change in Pension Value column reflect the actuarial increase in the present value of the Named Executive Officers’ benefits—under all pension plans maintained by US Foods—determined using interest rate and mortality assumptions consistent with those used in US Foods financial statements. (Data provided by Mercer Consulting) |
The following table shows the change in the actuarial present value of benefits under all pension plans maintained by US Foods for each NEO,:
Change in Pension Value
| Named Executive Officer | Change in Pension Value | |||
| John A. Lederer |
— | |||
| Fareed Khan |
— | |||
| Pietro Satriano |
— | |||
| Stuart S. Schuette |
$ | 3,576 | ||
| Keith Rohland |
— | |||
117
Table of Contents
| (4) | These amounts include: |
| (a) | Perquisite allowance (See Executive Perquisites and Other Benefits discussion above). |
| (b) | Company matching contribution in the 401(k) plan: Mr. Lederer = $0; Mr. Khan = $7,800; |
Mr. Satriano = $7,800; Mr. Schuette = $7,800, Mr. Rohland = $7,800.
With regards to Mr. Lederer, reimbursement for the cost of personal travel in 2014 was $480,139, which includes a tax gross up payment of $225,425.
| (5) | These amounts relate to equity grants of RSUs and stock options made in 2013. The grant values are calculated using 1) for RSUs, the fair market value of USF Holding common stock on the grant date as determined by the USF Holding board of directors and 2) for stock options, the calculated Black-Scholes value of USF Holding common stock on the grant date computed in accordance with FASB ASC Topic 718 and assume that all performance targets are met. |
| (6) | These amounts consist of the 2013 cash awards under the Annual Incentive Plan award. |
| (7) | The amounts reported in the Change in Pension Value column reflect the actuarial decrease in the present value of the NEOs’ benefits under all pension plans maintained by US Foods. This was determined using interest rate and mortality assumptions consistent with those used in US Foods financial statements. (Data provided by Mercer Consulting.) |
The following table shows the change in the actuarial present value of benefits under all pension plans maintained by US Foods for each NEO:
Change in Pension Value
| Named Executive Officer | Change in Pension Value | |||
| John A. Lederer |
— | |||
| Fareed Khan |
— | |||
| Pietro Satriano |
— | |||
| Stuart S. Schuette |
$ | (1,521 | ) | |
| Keith Rohland |
— | |||
| (8) | These amounts include: |
| (a) | Perquisite allowance. |
| (b) | Company matching contribution in the 401(k) plan: Mr. Lederer = $0; Mr. Kahn = $1,385; Mr. Schuette = $7,650; Mr. Satriano = $7,650, Mr. Rohland = $7,650. |
With regards to Mr. Lederer, reimbursement for the cost of personal travel in 2013 was $223,332, which includes a tax gross up payment of $104,854.
| (9) | Mr. Khan joined US Foods on September 9, 2013, as Chief Financial Officer. As additional compensation in 2013, Mr. Khan received: |
| (a) | A sign-on cash bonus of $650,000 (to be repaid by Mr. Khan in decreasing amounts before the third anniversary of his start date, if his employment ends other than by death, disability, by the Company without cause, or by Mr. Khan for good reason). |
| (b) | A 2013 annual incentive plan guarantee of a minimum of $150,000. |
| (c) | A sign-on restricted stock award valued at $1,000,000, with vesting to occur ratably over a three-year period on each of December 31, 2013, 2014, and 2015, subject to his continued employment. |
| (d) | Stock options on a number of shares of USF Holding common stock equal to four-times the number of shares that Mr. Khan purchases through his mandatory equity investment of $375,000 in USF Holding common stock. For this he received 62,500 investment shares. He also received 250,000 investment options. 50% of the granted stock options will vest ratably over four years, based upon reaching corporate Adjusted EBITDA targets, and 50% will vest ratably over four years, based upon Mr. Khan’s time in as an employee of the Company. Because the Company did not meet the Adjusted EBITDA 2013 annual or cumulative target, none of the performance-based stock options vested in 2013. Performance-based options will vest if (i) the Acquisition is consummated; (ii) a change of control occurred and specified returns are achieved by our Sponsors; or (iii) at the discretion of the Sponsors upon a change of control. Time-based options will vest upon a change of control. |
118
Table of Contents
Outstanding Equity Awards at Fiscal Year-End
The following table provides information on each NEO’s stock option, restricted stock and RSUs grants outstanding as of December 31, 2014:
| Outstanding Equity Awards at Fiscal Year-End |
||||||||||||||||||||||||||||
| Name |
Date Granted |
Number of Securities Underlying Unexercised Options Exercisable (#) |
Number of Securities Underlying Unexercised Options Unexercisable (#) |
Option Exercise Price ($) |
Option Expiration Date |
Number of Shares or Units of Stock That Have Not Vested (#) |
Market Value of Shares or Units of Stock That Have Not Vested ($)(1) |
|||||||||||||||||||||
| John A. Lederer |
12/10/2014 | 166,667 | 1,000,002 | |||||||||||||||||||||||||
| 6/3/2013 | (2) | 126,690 | 886,830 | 6.00 | 6/3/2023 | 109,375 | 656,250 | |||||||||||||||||||||
| 12/20/2010 | 500,000 | 55,556 | (3) | 4.50 | 12/20/2020 | |||||||||||||||||||||||
| 9/08/2010 | 3,000,002 | 333,334 | (3) | 4.50 | 9/28/2020 | |||||||||||||||||||||||
| Fareed Khan |
10/1/2013 | 93,750 | 156,250 | (4) | 6.00 | 10/1/2023 | 55,556 | (5) | 333,334 | |||||||||||||||||||
| Pietro Satriano |
6/3/2013 | (2) | 31,673 | 221,711 | 6.00 | 6/3/2023 | 27,349 | 164,094 | ||||||||||||||||||||
| 4/1/2011 | 476,000 | 204,000 | (7) | 5.00 | 4/1/2021 | 22,222 | (6) | 133,333 | ||||||||||||||||||||
| Stuart S. Schuette |
6/3/2013 | (2) | 31,673 | 221,711 | 6.00 | 6/3/2023 | 27,349 | 164,094 | ||||||||||||||||||||
| 12/20/2010 | 40,000 | 4,444 | (3) | 4.50 | 12/20/2020 | |||||||||||||||||||||||
| 10/21/2010 | 222,003 | 24,667 | (3) | 4.50 | 10/21/2020 | |||||||||||||||||||||||
| 9/17/2008 | 40,000 | 0 | 5.00 | 9/17/2018 | ||||||||||||||||||||||||
| 11/16/2007 | 280,000 | 0 | 5.00 | 11/16/2017 | ||||||||||||||||||||||||
| Keith Rohland |
6/3/2013 | (2) | 25,338 | 177,366 | 6.00 | 6/3/2013 | 21,875 | 131,250 | ||||||||||||||||||||
| 5/27/2011 | 196,000 | 84,000 | 5.00 | 5/27/2021 | ||||||||||||||||||||||||
| (1) | The aggregate dollar value is calculated using $6.00, the projected fair market value of US Foods common stock on December 27, 2014. |
| (2) | As part of the 2013 annual equity grant, we granted restricted stock units (RSUs) and stock options under the 2007 Stock Incentive Plan. The vesting of these grants is as follows and is contingent upon the executive’s continued service with the company. |
| • | 50% of the RSUs vest by time over four years in equal installments, starting on the first anniversary of the grant date. |
| • | 50% of the RSUs vest over the same four-year period, but only if specific performance metrics are achieved. |
| • | 50% of the stock options vest by time over four years in equal installments, starting on the first anniversary of the grant date. |
| • | 50% of the stock options vest over the same four-year period, but only if specific performance metrics are achieved. |
| (3) | Vesting of options is contingent upon continued employment of the individual by the Company or it Subsidiaries through the applicable vesting date. The original grant, comprised 50% of time options and 50% performance options, was scheduled to vest in equal increments on December 31 of 2010, 2011, 2012, 2013, and 2014, based on conditions explained in this note. The outstanding time options vested on December 31, 2014. The outstanding performance options would have vested on December 31, 2014, so long as the company, on a consolidated basis, achieved its annual or cumulative EBITDA performance targets. If neither the annual or cumulative EBITDA targets are met, the performance options will not vest that fiscal year, but could vest in a subsequent fiscal year if the cumulative EBITDA target is met at the end of the subsequent fiscal year(s). Also, if after a Qualified Public Offereing, the investors achieve liquidity on any percentage of the Aggregate Investment that is in excess of the percentage of the performance Options that could have become vested as mentioned above, then the performance options shall become vested, to the extent not already vested, up to the same percentage of performance option that could have become vested in respect of any previously completed fiscal |
119
Table of Contents
| years. In the event of a Change in Control, (i) any outstanding time options shall become immediately exercisable; (ii) any outstanding performance options shall become immediately exercisable if as a result of the Change in Control, the Investors achieve Liquidity on the entire Aggregate Investment; and (iii) in the event of a grantee’s employment terminates due to death or permanent disability, a pro rata portion of the time options would have vested on December 31 of that year and a pro rata portion of the performance options will also vest on December 31 of that year only if and to the extent that the performance option would have vested under conditions according to the option agreement. |
| (4) | Vesting of options is contingent upon continued employment of the individual by the Company or it Subsidiaries through the applicable vesting date. The original grant, comprised 50% of time options and 50% performance options, is scheduled to vest in equal increments on December 31 of 2013, 2014, 2015, and 2016, based on conditions explained in this note. The outstanding time options will vest in equal increments on December 31, 2015 and 2016. The outstanding performance options will vest in equal increments on December 31, 2015 and 2016 so long as the company, on a consolidated basis, achieves its annual or cumulative EBITDA performance targets. If neither the annual or cumulative EBITDA targets are met, the performance options will not vest that fiscal year, but could vest in a subsequent fiscal year if the cumulative EBITDA target is met at the end of the subsequent fiscal year(s). Also, if after a Qualified Public Offering, the investors achieve liquidity on any percentage of the Aggregate Investment that is in excess of the percentage of the performance Options that could have become vested as mentioned above, then the performance options shall become vested, to the extent not already vested, up to the same percentage of performance option that could have become vested in respect of any previously completed fiscal years. In the event of a Change in Control, (i) any outstanding time options shall become immediately exercisable; (ii) any outstanding performance options shall become immediately exercisable if as a result of the Change in Control, the Investors achieve Liquidity on the entire Aggregate Investment; and (iii) in the event of a grantee’s employment terminates due to death or permanent disability, a pro rata portion of the time options would have vested on December 31 of that year and a pro rata portion of the performance options will also vest on December 31 of that year only if and to the extent that the performance option would have vested under conditions according to the option agreement. |
| (5) | So long as the grantee continues to be employed by the Company or its Subsidiaries through the applicable vesting date: (i) the Restricted Stock shall vest in increments of 33 1⁄3% of such shares on each December 31 of 2013, 2014 and 2015; and (ii) all Restricted Stock shall become vested as to 100% of such shares upon the occurrence of a Change in Control that occurs prior to December 31, 2015. |
| (6) | So long as the grantee continues to be employed by the Company or its Subsidiaries through the applicable vesting date: (i) the Restricted Stock shall vest as to one-fifth of the shares on each December 31 of 2011, 2012, 2013, 2014, and 2015; and (ii) all Restricted Stock shall become vested as to 100% of such shares upon the occurrence of a Change in Control that occurs prior to December 31, 2015. |
| (7) | Vesting of options is contingent upon continued employment of the individual by the Company or it Subsidiaries through the applicable vesting date. The original grant, comprised 50% of time options and 50% performance options, is scheduled to vest in equal increments on December 31 of 2011, 2012, 2013, 2014, and 2015, based on conditions explained in this note. The outstanding time options will vest in equal portions on December 31 of 2011, 2012, 2013, 2014 and 2015. The outstanding performance options will vest in equal portions on December 31 of 2011, 2012, 2013, 2014 and 2015, so long as the company, on a consolidated basis, achieves its annual or cumulative EBITDA performance targets. If neither the annual or cumulative EBITDA targets are met, the performance options will not vest that fiscal year, but could vest in a subsequent fiscal year if the cumulative EBITDA target is met at the end of the subsequent fiscal year(s). Also, if after a Qualified Public Offering, the investors achieve liquidity on any percentage of the Aggregate Investment that is in excess of the percentage of the performance Options that could have become vested as mentioned above, then the performance options shall become vested, to the extent not already vested, up to the same percentage of performance option that could have become vested in respect of any previously completed fiscal years. In the event of a Change in Control, (i) any outstanding time options shall become immediately exercisable; (ii) any outstanding performance options shall become immediately exercisable if as a result of the Change in Control, the Investors achieve Liquidity on the entire Aggregate Investment; and (iii) in the event a grantee’s employment terminates due to death or permanent disability, a pro rata portion of the time options would have vested on December 31 of that year and a pro rata portion of the performance options would also vest on December 31 of that year only if and to the extent that the performance option would have vested under conditions according to the option agreement. |
120
Table of Contents
Option Exercises and Stock Vested
The following table provides information with respect to aggregate stock option exercises and the vesting of stock awards during the fiscal year of 2014 for each of the NEOs.
| Option Exercises and Stock Vested |
||||||||||||
| Option Awards | Stock Awards | |||||||||||
| Name |
Number of Shares Acquired on Exercise (#) |
Value Realized on Exercise ($) |
Number of Shares Acquired on Vesting (#)(1) |
Value Realized on Vesting ($) |
||||||||
| John A. Lederer |
182,292 | 1,093,752 | (2) | |||||||||
| Fareed Khan |
55,555 | 333,336 | (2) | |||||||||
| Pietro Satriano |
26,129 | 156,774 | (2) | |||||||||
| Stuart S. Schuette |
21,685 | 130,110 | (2) | |||||||||
| Keith Rohland |
3,125 | 18,750 | (2) | |||||||||
| (1) | These numbers include restricted shares that vested on December 31, 2014. The number of restricted shares that vested for each individual: Mr. Lederer, 166,667; Mr. Khan, 55,555; Mr. Satriano, 22,222; and Mr. Schuette 17,777; Mr. Rohland, 0. |
| (2) | The value realized upon vesting is calculated by multiplying the number of shares of stock that vested by $6.00, the most recent good faith determination of the fair market value of USF Holdings common stock made by the board of directors as of December 27, 2014. |
Pension Benefits
With respect to our NEOs, the defined benefit plans (as described and defined below) were frozen so that there can be no further benefits accruals.
Under the US Foods, Inc. Defined Benefits Pension Plan (frozen to NEOs as of September 15, 2004), a participant’s annual benefit is based on final average compensation and years of benefit service. For this purpose, compensation generally includes salary and bonus. The annual benefit is 1% times the final average compensation times the years of benefit service. Upon normal retirement (first day or the month following the later of age 65 or five years of vesting service), the normal form of payment in the case of a married participant is 50% joint and survivor annuity. Participants become vested in their benefit after completing five years of vesting service.
| Name |
Plan Name | Number of Years Credited Service (#) |
Present Value of Accumulated Benefit ($) |
|||||||||
| John A. Lederer |
— | — | — | |||||||||
| Fareed Khan |
— | — | — | |||||||||
| Pietro Satriano |
— | — | — | |||||||||
| Stuart S. Schuette |
|
US Foods, Inc. Defined Benefit Pension Plan |
|
0.811 | 11,457 | |||||||
| Keith Rohland |
— | — | — | |||||||||
We calculated the present value of the accumulated pension plan benefits based upon an estimated discount rate of 4.40% for the US Foods, Inc. Defined Benefit Pension Plan, and 4.05% for the Alliant Foodservice, Inc. Pension Plan, with a post-retirement mortality assumption based on the RP 2014 generational mortality table projected by Scale MP 2014.
121
Table of Contents
Following are the estimated accrued benefits through fiscal year 2014 for the pension plan. These annual amounts would be payable at the earliest unreduced age shown.
| Name |
Plan Name | Earliest Unreduced Retirement Age (#) |
Expected Years of Payment (#) |
Estimated Annual Benefit ($) |
||||||||||||
| John A. Lederer |
— | — | — | — | ||||||||||||
| Fareed Khan |
— | — | — | — | ||||||||||||
| Pietro Satriano |
— | — | — | — | ||||||||||||
| Stuart S. Schuette |
|
US Foods, Inc. Defined Benefit Pension Plan |
|
65 | 22 | 1,622 | ||||||||||
| Keith Rohland |
— | — | — | — | ||||||||||||
The pension plans—which are intended to be tax-qualified—are funded through an irrevocable tax-exempt master trust and covered approximately 19,000 eligible employees at the end of fiscal 2014. In general, a participant’s accrued benefit is equal to 1% times final average compensation times years of benefit service.
Benefits provided under any pension plan are based upon compensation up to a limit: $260,000 for calendar year 2014, under the Internal Revenue Code. In addition, annual benefits provided under the pension plans may not exceed a limit—$210,000 for calendar year 2014—under the Internal Revenue Code.
Potential Payments upon Termination, Change in Control or Public Offering
Severance Agreements
Each of our NEOs has entered into a severance agreement with the Company. Structured as “severance” agreements rather than “employment” agreements, these agreements outline additional compensation considerations in the event of 1) the executive’s termination by the Company other than for cause, and 2) termination by the executive with Good Reason (as defined under the relevant agreements, as discussed below under “Payments Upon Voluntary Termination”). The severance agreements are designed to provide standard protections to both the executive and to US Foods and are viewed as a help to ensure continuity and an aid in retention.
These are the key terms of the severance agreements:
| • | General Employment Terms. The covered executive is employed “at will.” The executive has agreed to provide 45 days notice of termination. The severance agreements are silent regarding compensation and benefits during the term. The severance agreements allow for automatic renewal for successive one-year periods, absent notice of non-renewal of at least 90 days prior to end of term. |
| • | Severance Triggers. The severance agreement is triggered in the event of 1) the covered executive’s termination by the Company other than for Cause, and 2) termination by the covered executive with Good Reason. Company notice of non-renewal of the severance agreement during the last 90 days of the term gives the covered executive the right to terminate with Good Reason. |
| • | Severance Benefits. If the covered executive signs a release, he or she will be entitled to severance benefits described below in “Voluntary Termination for Good Reason.” |
| • | Restrictions. For the applicable severance period (24 months for Mr. Lederer, 18 months for the other NEOs), the covered executive cannot 1) compete in the foodservice distribution industry, 2) solicit any employees of the Company, and 3) disparage the Company in any way. Additionally, the covered executive cannot use Company confidential information at any time. |
| • | Clawback of Severance Benefits. The covered executive’s severance benefits will be “clawed back” if he or she violates the non-compete/non-solicit or in the event of a material financial restatement attributable to the covered executive’s fraud. |
122
Table of Contents
We believe that reasonable severance benefits are appropriate to protect the NEOs against circumstances over which he or she does not have control, and as consideration for the promises of non-disclosure, non-competition, non-solicitation and non-interference that we require in our Severance Agreements.
A Change in Control, by itself, does not trigger any severance provision applicable to our NEOs, except for the provisions related to long-term equity incentives under our 2007 Stock Incentive Plan.
Impact of a Public Offering
A “Public Offering,” is defined in the management’s stockholders agreement as the sale of shares of USF Holding common stock to the public on the New York Stock Exchange or the Nasdaq National Market or other nationally recognized stock exchange or listing system pursuant to a registration statement which has been declared effective by the SEC (other than a registration statement on Form S-4, S-8 or any other similar form). The Public Offering has no automatic acceleration impact on the vesting of stock options, but it will accelerate vesting of certain grants of restricted stock and Restricted Stock Units. If the Sponsors have sold at least 35% of their aggregate investment and have achieved certain other financial milestones, certain equity—to the extent not already vested—will vest.
A Public Offering does not trigger severance benefits under the Severance Agreements with our Named Executive Officers.
Payments Upon Termination Due to Death or Permanent Disability
Under our equity award agreement, in the event of death or permanent disability, with respect to each NEO:
| • | The portion of the time-based equity that would have become exercisable on the next scheduled vesting date if the NEO had remained employed with us through that date will become vested and exercisable. |
| • | The portion of the performance-based equity that would have become exercisable during the fiscal year in which the NEO’s employment ends—if the NEO had remained employed with us through that date—will remain outstanding through the date we determine whether the applicable performance targets are met for that fiscal year. If such performance targets are met, such portion of the performance-based equity will become exercisable on such performance-vesting determination date. Otherwise, such portion will be forfeited. |
| • | All otherwise unvested equity will be forfeited. Vested equity generally may be exercised (by the employee’s survivor in the case of death) for a period of one year from the service termination date, unless we purchase the vested equity in total at the fair market value of the shares underlying the vested equity and, in the case of stock options, less the aggregate exercise price of the vested stock options. |
In the event of death, each NEO’s beneficiary will receive payments under our basic life insurance program in an amount up to a maximum of $1,500,000. If a NEO chose to participate in the supplemental life/AD&D insurance program, that person’s beneficiary will receive payments up to a maximum of $3,500,000.
We have included amounts that the NEO would receive under our enhanced Long Term Disability (LTD) insurance program. The LTD benefit is increased from 60% of monthly earnings to 66 2/3% of monthly earnings.
For purposes of the NEOs’ severance agreements, “permanent disability” shall be deemed to exist if the executive becomes eligible to receive long-term disability benefits under any long-term disability plan or program maintained by US Foods for its employees.
Payments Upon Termination Due to Retirement
Retirement is not treated differently from any other voluntary termination without Good Reason under any of our plans or agreements for NEOs. None of the NEOs qualified for retirement at December 27, 2014.
123
Table of Contents
Payments Upon Voluntary Termination
Under the Severance Agreements with our NEOs, the payments to be made upon voluntary termination vary depending upon whether the NEO resigns with or without Good Reason, or after our failure to offer to renew, extend or replace his or her Severance Agreement under certain circumstances. Good Reason is deemed to exist in these cases:
| • | There is a material diminution in title and/or duties, responsibilities or authority, including a change in reporting responsibilities |
| • | US Foods changes the geographic location of the NEO’s principal place of business to a location that is at least 50 miles away from the geographic location prior to the change |
| • | There is a willful failure or refusal by US Foods to perform any material obligation under the Severance Agreement |
| • | There is a reduction in the NEO’s annual rate of base salary or annual bonus target percentage of base salary—other than a reduction which is part of a general cost reduction affecting at least 90% of the executives holding positions of comparable levels of responsibility—and which does not exceed 10% of the NEO’s annual base salary and target bonus percentage, in the aggregate, when combined with any such prior reductions |
In case of any event described above, the NEO will have 90 days from the date the triggering event arises to provide written notice of the grounds for a Good Reason termination, and US Foods will have 30 days to cure the claimed event. Resignation by the NEO following US Foods’ cure, or before the expiration of the 30-day cure period, constitutes a voluntary resignation and not a termination for Good Reason.
Voluntary Termination with Good Reason
If any NEO resigns with Good Reason, all then unvested stock option grants, restricted stock grants and Restricted Stock Units grants held by that person will be forfeited.
Unless we purchase any then vested equity in total at a price equal to the fair market value of the shares underlying the vested equity and, in the case of vested stock options, less the aggregate exercise price, the NEO generally may exercise vested equity for a period of 180 days from the termination date.
In the event any NEO resigns under the circumstances described below, that person’s equity will be treated as described under this “Voluntary Termination with Good Reason.”
Additionally, if the NEO 1) resigns with Good Reason or 2) resigns within 60 days of our failure to offer to renew, extend or replace his or her Severance Agreement before or at the end of the Severance Agreement’s term, then in each case the NEO will receive the following benefits after termination of employment, but contingent upon the execution and effectiveness of a release of certain claims against us and our affiliates in the form attached to the Severance Agreement:
| • | All accrued but unpaid base salary through the date of the NEO’s termination of active employment |
| • | Current year Annual Incentive Plan award pro-rated to the date of the NEO’s termination of active employment and based on actual performance of the current year Annual Incentive Plan |
| • | Continuation of base salary—as in effect immediately before the termination—for 18 months (24 months in the case for Mr. Lederer) payable in accordance with our normal payroll cycle and procedures (lump sum payment in the case for Mr. Lederer) |
| • | Fixed bonus paid in equal installments for 18 months (24 months in the case for Mr. Lederer) based on the two-year average attainment of Annual Incentive Plan performance applied to the NEO’s current Annual Incentive Plan target and base salary amounts, multiplied by 1 1/2 (multiplied by 2 in the case of Mr. Lederer) |
124
Table of Contents
| • | Continuation of medical and dental coverage through COBRA, paid for the NEO and his or her covered dependents (with tax gross-up) for 18 months (lump sum payment equal to 24 months in the case for Mr. Lederer) |
| • | Lump sum payment for unused vacation accrued during the calendar year of the NEO’s Executive Officer’s termination |
| • | 12 months of career transition and outplacement services |
| • | Tax gross-up if payments trigger excess parachute payment excise tax. |
During the time-period in which the NEO is receiving benefits under the Severance Agreement, the NEO cannot do the following:
| • | Compete in the foodservice distribution industry—for purposes of the Severance Agreement, “competition” means becoming directly or indirectly involved with an entity located in the United States that competes directly or indirectly with US Foods |
| • | Solicit to hire any US Foods employees |
| • | Make any statements that disparage or defame US Foods in any way |
Additionally, the NEO must maintain the confidentiality of, and refrain from disclosing or using, our 1) trade secrets for any period of time as the information remains a trade secret under applicable law, and 2) confidential information at all times.
The NEO’s severance benefits will be recovered, and any unpaid benefits will be forfeited if the person violates the non-compete/non-solicit, or in the event of a material financial restatement attributable to the NEO’s fraud.
Voluntary Termination Without Good Reason
If the NEO resigns without Good Reason, he or she will forfeit all unvested equity grants. The NEO will be paid all 1) accrued but unpaid base salary and 2) accrued but unused vacation through the date of the NEO’s termination of active employment.
Payment Upon Involuntary Termination
The payments to be made to a NEO upon involuntary termination vary depending upon whether the termination is with or without “cause.” Cause is deemed to exist in these cases:
| • | The Company determines in good faith and following a reasonable investigation that the NEO has committed fraud, theft or embezzlement from the Company |
| • | The NEO pleads guilty or nolo contendere to or is convicted of any felony or other crime involving moral turpitude, fraud, theft or embezzlement |
| • | The NEO willfully fails or refuses to perform any material obligation under his or her Severance Agreement, or to carry out the reasonable directives of his or her supervisor (or the Board in the case for Mr. Lederer), and the NEO fails to cure the same within a period of 30 days after written notice of such failure is provided |
| • | The NEO has engaged in on-the-job conduct that violates US Foods’ written Code of Ethics or Company policies, and which is materially detrimental to US Foods |
The NEO’s resignation in advance of an anticipated termination for cause shall constitute a termination for cause.
Involuntary Termination for Cause
If the NEO is involuntarily terminated for cause, he or she will forfeit all unvested equity grants, as well as all vested but unexercised equity.
125
Table of Contents
Involuntary Termination without Cause
If the NEO is involuntarily terminated without cause, the person’s equity grants will be treated, and severance payments and benefits will be paid, in the same manner as described under “Voluntary Termination with Good Reason” above.
Payments After a Change in Control
For purposes of equity treatment and treatment under our Severance Agreements, a “Change in Control” means, in one or a series of transactions:
| • | The sale of all or substantially all of the assets of USF Holding to any person, or group of persons acting in concert, other than to (x) the Sponsors or their affiliates or (y) any employee benefit plan maintained by USF Holding or its affiliates |
| • | A sale by USF Holding, the Sponsors or any of their respective affiliates to a person, or group of persons acting in concert, of USF Holding common stock, or a merger, consolidation or similar transaction involving USF Holdings that results in more than 50% of the USF Holding common stock being held by a person or group of persons acting in concert that does not include an affiliated person |
| • | Which results in the Sponsors and their affiliates ceasing to hold the ability to elect a majority of the members of the board of directors of USF Holding |
A Change in Control, by itself, does not trigger any severance provision applicable to our NEOs, except for the provisions related to long-term equity incentives under our 2007 Stock Incentive Plan. The Severance Agreements covering our NEOs are a binding obligation of US Foods and any successor of US Foods.
In the event of a Change in Control of USF Holding, the Compensation Committee will likely have the authority to vest outstanding equity awards, and/or provide for the cancellation in exchange for cash or substitution of outstanding equity awards under the plan, regardless of whether the NEO’s employment ends and regardless of how vesting would otherwise be treated under the 2007 stock incentive plan.
Under the 2007 Stock Incentive Plan:
| (1) | All time-vested equity will vest and become immediately exercisable on 100% of the shares subject to such equity immediately prior to a Change in Control |
| (2) | All performance-vested equity will vest and become immediately exercisable on 100% of the shares subject to such equity immediately prior to a Change in Control if, as a result of the Change in Control, a) the Sponsors achieve an Investor internal rate of return of at least 20% of their aggregate investment and b) the Sponsors earn an investor return of at least 3.0 times the base price of their aggregate investment |
If the NEO is involuntarily terminated without cause or resigns for Good Reason following a Change in Control, he or she will receive the same severance payments and benefits as described above under “Voluntary Termination with Good Reason.”
If any payments or benefits in connection with a Change in Control (as defined in Section 280G of the Internal Revenue Code) would be subject to the “golden parachute” excise tax under federal income tax rules, we will pay an additional amount to the NEO to cover the excise tax and any other excise and income taxes resulting from this payment.
The Acquisition will constitute a Change of Control, which will accelerate vesting of all stock options, stock appreciation rights, restricted stock, and restricted stock units. In addition, other than Mr. Lederer, each of the NEOs has entered into Retention Award Agreements whereby such NEOs receive cash bonuses if the Acquisition is consummated and (a) the NEO remains employed by US Foods or Sysco after the closing of the Acquisition through the later of December 31, 2014 and six months after the closing of the Acquisition (the “Retention Date”) or (b) NEO remains employed by US Foods or Sysco after the closing of the Acquisition, and US Foods or Sysco, as
126
Table of Contents
applicable, determines that the NEO effectively transitioned his duties prior to the Retention Date. In addition, each of the NEOs (other than Mr. Lederer) will receive a cash transaction bonus provided that the NEO remains employed by the Company through the closing date of the Acquisition. This provision is not yet defined for the CEO.
Potential Payments Upon Termination or Change in Control Tables
The tables below reflect potential payments to each of our NEOs in various terminations and change in control scenarios. This is based on compensation, benefit, and equity levels in effect on, and assuming the scenario will be effective as of, December 27, 2014.
For stock valuations in the following tables, we have used $6.00 per share as the fair market value price of USF Holding common stock as determined by the USF Holding board of directors. The tables report only amounts that are increased, accelerated or otherwise paid or owed as a result of the applicable scenario. The table assumes that all performance—based stock options will vest as a result of the applicable scenario. As a result, this excludes stock options, restricted stock and restricted stock units that had vested on the employment termination date.
The tables also exclude any amounts that are available generally to all salaried employees and do not discriminate in favor of our NEOs. The amounts shown are merely estimates. We cannot determine actual amounts to be paid until a termination or change in control scenario occurs.
John A. Lederer
President and Chief Executive Officer
| Voluntary Termination | Total and Permanent Disability or Death ($) |
Involuntary Termination | ||||||||||||||||||||||
| Executive Benefits and Payments Upon Termination |
Good Reason ($) |
Retirement(1) ($) |
For Cause ($) |
Not For Cause ($) |
Change in Control ($) |
|||||||||||||||||||
| Compensation |
||||||||||||||||||||||||
| Severance(2) |
2,350,000 | — | — | — | 2,350,000 | — | ||||||||||||||||||
| Annual Incentive(3) |
2,399,253 | — | — | — | 2,399,253 | — | ||||||||||||||||||
| Long-term Incentives |
||||||||||||||||||||||||
| Stock Options |
— | — | — | — | — | 583,335 | ||||||||||||||||||
| (Unvested and Accelerated or Continued Vesting)(4) |
||||||||||||||||||||||||
| Restricted Stock and Restricted Stock Units |
— | — | 187,500 | — | — | 1,656,252 | ||||||||||||||||||
| (Unvested and Accelerated or Continued Vesting)(5) |
||||||||||||||||||||||||
| Benefits and Perquisites |
||||||||||||||||||||||||
| Life Insurance Payment(6) |
— | — | — | — | — | — | ||||||||||||||||||
| LTD Insurance Payment(7) |
— | — | — | — | — | — | ||||||||||||||||||
| Health and Welfare Benefits Continuation(8) |
21,463 | — | — | — | 21,463 | — | ||||||||||||||||||
| Excise Tax Gross Up |
— | — | — | — | — | — | ||||||||||||||||||
|
|
|
|
|
|
|
|
|
|
|
|
|
|||||||||||||
| TOTAL |
4,770,716 | — | 187,500 | — | 4,770,716 | 2,239,587 | ||||||||||||||||||
|
|
|
|
|
|
|
|
|
|
|
|
|
|||||||||||||
127
Table of Contents
Fareed Khan
Chief Financial Officer
| Voluntary Termination | Total and Permanent Disability or Death ($) |
Involuntary Termination | ||||||||||||||||||||||
| Executive Benefits and Payments Upon Termination |
Good Reason ($) |
Retirement(1) ($) |
For Cause ($) |
Not For Cause ($) |
Change in Control ($) |
|||||||||||||||||||
| Compensation |
||||||||||||||||||||||||
| Severance(9) |
900,000 | — | — | — | 900,000 | — | ||||||||||||||||||
| Annual Incentive(10) |
626,497 | — | — | — | 626,497 | — | ||||||||||||||||||
| Long-term Incentives |
||||||||||||||||||||||||
| Stock Options |
— | — | — | — | — | — | ||||||||||||||||||
| (Unvested and Accelerated or Continued Vesting)(4) |
||||||||||||||||||||||||
| Restricted Stock and Restricted Stock Units |
— | — | — | — | — | 333,336 | ||||||||||||||||||
| (Unvested and Accelerated or Continued Vesting)(5) |
||||||||||||||||||||||||
| Benefits and Perquisites |
||||||||||||||||||||||||
| Life Insurance Payment(6) |
— | — | — | — | — | — | ||||||||||||||||||
| LTD Insurance Payment(11) |
— | — | 1,696,000 | — | — | — | ||||||||||||||||||
| Health and Welfare Benefits Continuation(8) |
34,518 | — | — | 34,518 | — | |||||||||||||||||||
| Excise Tax Gross Up |
— | — | — | — | — | — | ||||||||||||||||||
|
|
|
|
|
|
|
|
|
|
|
|
|
|||||||||||||
| TOTAL |
1,561,015 | — | 1,696,000 | — | 1,561,015 | 333,336 | ||||||||||||||||||
|
|
|
|
|
|
|
|
|
|
|
|
|
|||||||||||||
Pietro Satriano
Chief Merchandising Officer
| Voluntary Termination | Total and Permanent Disability or Death ($) |
Involuntary Termination | ||||||||||||||||||||||
| Executive Benefits and Payments Upon Termination |
Good Reason ($) |
Retirement(1) ($) |
For Cause ($) |
Not For Cause ($) |
Change in Control ($) |
|||||||||||||||||||
| Compensation |
||||||||||||||||||||||||
| Severance(9) |
750,000 | — | — | — | 750,000 | — | ||||||||||||||||||
| Annual Incentive(10) |
522,081 | — | — | — | 522,081 | — | ||||||||||||||||||
| Long-term Incentives |
||||||||||||||||||||||||
| Stock Options |
— | — | — | — | — | 204,000 | ||||||||||||||||||
| (Unvested and Accelerated or Continued Vesting)(4) |
||||||||||||||||||||||||
| Restricted Stock and Restricted Stock Units |
— | — | 46,884 | — | — | 297,426 | ||||||||||||||||||
| (Unvested and Accelerated or Continued Vesting)(5) |
||||||||||||||||||||||||
| Benefits and Perquisites |
||||||||||||||||||||||||
| Life Insurance Payment(6) |
— | — | — | — | — | — | ||||||||||||||||||
| LTD Insurance Payment(11) |
— | — | 1,440,000 | — | — | — | ||||||||||||||||||
| Health and Welfare Benefits Continuation(8) |
36,890 | — | — | — | 36,890 | — | ||||||||||||||||||
| Excise Tax Gross Up |
— | — | — | — | — | — | ||||||||||||||||||
|
|
|
|
|
|
|
|
|
|
|
|
|
|||||||||||||
| TOTAL |
1,308,971 | — | 1,486,884 | — | 1,308,971 | 501,426 | ||||||||||||||||||
|
|
|
|
|
|
|
|
|
|
|
|
|
|||||||||||||
128
Table of Contents
Stuart S. Schuette
Chief Operating Officer
| Voluntary Termination | Total and Permanent Disability or Death ($) |
Involuntary Termination | ||||||||||||||||||||||
| Executive Benefits and Payments Upon Termination |
Good Reason ($) |
Retirement(1) ($) |
For Cause ($) |
Not For Cause ($) |
Change in Control ($) |
|||||||||||||||||||
| Compensation |
||||||||||||||||||||||||
| Severance(9) |
900,000 | — | — | — | 900,000 | — | ||||||||||||||||||
| Annual Incentive(10) |
626,497 | — | — | — | 626,497 | — | ||||||||||||||||||
| Long-term Incentives |
||||||||||||||||||||||||
| Stock Options |
— | — | — | — | — | 31,333 | ||||||||||||||||||
| (Unvested and Accelerated or Continued Vesting)(4) |
||||||||||||||||||||||||
| Restricted Stock and Restricted Stock Units |
— | — | 46,884 | — | — | 164,094 | ||||||||||||||||||
| (Unvested and Accelerated or Continued Vesting)(5) |
||||||||||||||||||||||||
| Benefits and Perquisites |
||||||||||||||||||||||||
| Life Insurance Payment(6) |
— | — | — | — | — | — | ||||||||||||||||||
| LTD Insurance Payment(11) |
— | — | 1,600,000 | — | — | — | ||||||||||||||||||
| Health and Welfare Benefits Continuation(8) |
36,133 | — | — | — | 36,133 | — | ||||||||||||||||||
| Excise Tax Gross Up |
— | — | — | — | — | — | ||||||||||||||||||
|
|
|
|
|
|
|
|
|
|
|
|
|
|||||||||||||
| TOTAL |
1,562,630 | — | 1,646,884 | — | 1,562,630 | 195,427 | ||||||||||||||||||
|
|
|
|
|
|
|
|
|
|
|
|
|
|||||||||||||
Keith Rohland
Chief Information Officer
| Voluntary Termination | Total and Permanent Disability or Death ($) |
Involuntary Termination | ||||||||||||||||||||||
| Executive Benefits and Payments Upon Termination |
Good Reason ($) |
Retirement(1) ($) |
For Cause ($) |
Not For Cause ($) |
Change in Control ($) |
|||||||||||||||||||
| Compensation |
||||||||||||||||||||||||
| Severance(9) |
712,500 | — | — | — | 712,500 | — | ||||||||||||||||||
| Annual Incentive(10) |
495,977 | — | — | — | 495,977 | — | ||||||||||||||||||
| Long-term Incentives |
||||||||||||||||||||||||
| Stock Options |
— | — | — | — | — | 84,000 | ||||||||||||||||||
| (Unvested and Accelerated or Continued Vesting)(4) |
||||||||||||||||||||||||
| Restricted Stock and Restricted Stock Units |
— | — | 37,500 | — | — | 131,250 | ||||||||||||||||||
| (Unvested and Accelerated or Continued Vesting)(5) |
||||||||||||||||||||||||
| Benefits and Perquisites |
||||||||||||||||||||||||
| Life Insurance Payment(6) |
— | — | — | — | — | — | ||||||||||||||||||
| LTD Insurance Payment(11) |
— | — | 1,904,000 | — | — | — | ||||||||||||||||||
| Health and Welfare Benefits Continuation(8) |
23,345 | — | — | — | 23,345 | — | ||||||||||||||||||
| Excise Tax Gross Up |
— | — | — | — | — | — | ||||||||||||||||||
|
|
|
|
|
|
|
|
|
|
|
|
|
|||||||||||||
| TOTAL |
1,231,822 | — | 1,941,500 | — | 1,231,822 | 215,250 | ||||||||||||||||||
|
|
|
|
|
|
|
|
|
|
|
|
|
|||||||||||||
129
Table of Contents
| (1) | None of the NEOs is eligible for retirement as of December 27, 2015. |
| (2) | Assuming that Mr. Lederer executes (and does not later revoke) a release agreement, his severance payment is equal to 24 months of his annual base salary and shall be paid in equal installments over 24 months. In the event Mr. Lederer’s termination of employment falls within 24 months following a change in control, the severance amount shall be paid in a lump sum on the 60th day after the date of termination, assuming Mr. Lederer executes (and does not later revoke) a release agreement. This amount does not include the value of any outplacement benefit. |
| (3) | This amount is in addition to the 2014 Annual Incentive Award. Subject to execution (without revocation) of a release agreement, this amount shall equal the product of (a) the NEO’s average target achievement, which is calculated as the sum of the NEO’s target bonus percentage actually earned the annual incentive program for each of the two most recently completed calendar years for which annual cash bonus earnings have been finally determined as of the date of termination, and divided by two; (b) the NEO’s current target bonus percentage, multiplied by (c) the NEO’s current Annual Base salary, multiplied by (d) two. This amount shall be paid in equal installments over 24 months. In the event Mr. Lederer’s termination of employment falls within 24 months following a change in control, this amount will be paid in a lump sum on the on the 60th day after the date of termination, assuming Mr. Lederer executes (and does not later revoke) a release agreement. |
| (4) | The amounts shown include the difference between the exercise prices of the unvested options that would accelerate due to a change in control, and $6.00, the most recent good faith determination of the fair market value of USF Holdings common stock made by the board of directors as of December 27, 2014, multiplied by the number of these options outstanding. This value is calculated based on the assumption that the investors achieve liquidity on the entire aggregate investment, so the outstanding performance options vest. |
| (5) | These amounts reflect the outstanding RSUs that would vest upon a change in control, multiplied by $6.00, the most recent good faith determination of the fair market value of USF Holdings common stock made by the board of directors as of December 27, 2014. |
| (6) | No NEO has basic and supplemental life insurance coverage (Company provided or purchased) beyond the $1.5 million maximum benefit amount for employees (excluding executive officers or region presidents). |
| (7) | Mr. Lederer has not elected Long Term Disability insurance coverage provided by US Foods. |
| (8) | Assuming the NEO elects to enroll in COBRA for medical and dental coverage, this amount includes the estimated grossed up lump sum payment to be paid to the NEO under the severance agreement, to cover the COBRA premiums for 24 months for Mr. Lederer and 18 months for the other NEOs, who currently have US Foods medical and/or dental insurance. These amounts assume that the NEOs do not have unused vacation. |
| (9) | Assuming the NEO executes (and does not later revoke) a Release Agreement, the amount of severance is equal to 18 months of the respective annual base salary and shall be paid in equal installments over the period of 18 months. This amount does not include the value of outplacement benefits. |
| (10) | This amount is in addition to the 2014 Annual Incentive Award. Subject to execution (without revocation) of the Release Agreement, this amount shall equal the product of a) the executive’s average target achievement, which is calculated as the sum of the executive’s target bonus percentage actually earned by the person under the Company’s annual incentive program for each of the two most recently completed calendar years for which annual cash bonus earnings have been finally determined, as of the date of termination, and divided by two; b) the executive’s current target bonus percentage, multiplied by c) the executive’s current Annual Base salary, multiplied by d) one and one- half. This amount shall be paid in equal installments over a period of 18 months. |
| (11) | Each NEO who has elected Long Term Disability Insurance coverage would exceed the monthly maximum benefit amount of $20,000 under the Executive Long Term Disability plan. So this amount reflects the difference between the maximum benefit amounts between the Long Term Disability plan and the Executive Long Term Disability plan ($8,000), multiplied the number of months until retirement age under the Social Security Act, where retirement depends on the year of birth. |
Executive Compensation Recoupment Policy
While no official policy exists, in the event of a restatement of our financial results—other than a restatement due to a change in accounting policy—the Compensation Committee intends to review all incentive payments made to Annual Incentive Plan participants, including our NEOs, within the 36-month period prior to the restatement. This will be done on the basis of having met or exceeded specific performance targets in Annual Incentive Plan awards or equity incentive grants.
130
Table of Contents
If the incentive payments would have been lower had they been calculated based on the restated results, the Compensation Committee intends—to the extent permitted by applicable law—to seek to recoup any excess payments for the benefit of US Foods. The committee anticipates that future Annual Incentive Plan awards and equity incentive grants will contain a contractual provision binding the grantee to this recovery right.
The Compensation Committee has the sole discretion—subject to applicable law—to determine the form and timing of the recoupment. This may include repayment from the Annual Incentive Plan participant and/or equity incentive grant participant, or an adjustment to the payout of a future incentive award.
Tax Impact on Compensation
Income Deduction Limitations (Section 162(m) of the Internal Revenue Code)
Section 162(m) of the Internal Revenue Code, which applies to any publicly held corporation, generally sets a limit of $1 million on the amount of non-performance-based compensation that companies may deduct for federal income tax purposes in any given year, with respect to the compensation of each of the NEOs other than the Chief Financial Officer. Because neither our parent nor we have publicly-held equity, we are not subject to Section 162(m). Going forward, we will continue to consider the impact of Section 162(m).
Section 409A of the Internal Revenue Code
Section 409A of the Internal Revenue Code deals specifically with the taxation of non-qualified deferred compensation arrangements. We designed all of our executive benefit plans—including our Severance Agreements and the 2007 Stock Incentive Plan—so they are exempt from, or otherwise comply with, the requirements of Section 409A of the Internal Revenue Code.
Compensation Risk Analysis
In consultation with the Compensation Committee, members of the Human Resources, Legal and Finance organizations assessed whether our compensation policies and practices encourage excessive or inappropriate risk taking by our employees, including those other than our NEOs. As a result of the assessment, we concluded that our plans and policies do not encourage excessive or inappropriate risk taking and determined these policies or practices are not reasonably likely to have a material adverse effect on us.
Compensation Committee Interlocks and Insider Participation
The members of the Compensation Committee of USF Holding are Michael Calbert, Nathaniel H. Taylor, Edward M. Liddy, and Richard Schnall. The Compensation Committee is responsible for overseeing our executive compensation. No compensation committee interlock relationship existed in 2014.
Director Compensation
See “Item 10. Directors, Executive Officers and Corporate Governance” for information about the compensation of the directors of USF Holding Corp. All of the directors of US Foods are our employees, and they do not receive additional compensation for their service on our board.
131
Table of Contents
| Item 12. | Security Ownership of Certain Beneficial Owners and Management and Related Stockholder Matters |
Security Beneficial Ownership
The following table includes information as of February 28, 2015, on the ownership of the common stock of USF Holding Corp. in these ways:
| • | Each person known to own beneficially more than 5% of the common stock of USF Holding Corp. |
| • | Each of the directors of USF Holding Corp. |
| • | Each of our Named Executive Officers |
| • | All of our executive officers and directors of USF Holding Corp. as a group. |
The amounts and percentages of shares beneficially owned are reported on the basis of SEC regulations governing the determination of beneficial ownership of securities. Under SEC rules, a person is deemed a “beneficial owner” of a security if that person has or shares voting power or investment power, which includes the power to dispose of or to direct the disposition of the security. A person is also deemed a beneficial owner of any securities of which that person has a right to acquire beneficial ownership within 60 days. Securities that can be acquired this way are deemed to be outstanding for purposes of computing a person’s ownership percentage, but not for purposes of computing any other person’s percentage. Under these rules, more than one person may be deemed a beneficial owner of the same securities, and a person may be deemed a beneficial owner of securities to which that person has no economic interest. As of February 28, 2015, there were 457,410,976 shares of common stock of USF Holding Corp. outstanding.
Except as otherwise indicated in the footnotes to this table, each of the beneficial owners listed has, to our knowledge, sole voting and investment power for the indicated shares of common stock. Unless otherwise noted, the address for each individual listed below is c/o US Foods, Inc., 9399 W. Higgins Road, Suite 500, Rosemont, IL 60018.
| Name and Address of Beneficial Holder(1) |
Number | Percent | ||||||
| Investment Funds Associated With or Managed By Clayton, Dubilier & Rice, LLC(2)(3) |
225,000,000 | 49.19 | % | |||||
| Clayton, Dubilier & Rice Fund VII, L.P. |
120,000,000 | 26.23 | % | |||||
| Clayton, Dubilier & Rice Fund VII (Co-Investment), L.P. |
35,000,000 | 7.65 | % | |||||
| CD&R Parallel Fund VII, L.P. |
854,416 | * | ||||||
| CDR USF Co-Investor, L.P. |
49,145,584 | 10.74 | % | |||||
| CDR USF Co-Investor No. 2, L.P. |
20,000,000 | 4.37 | % | |||||
| Investment Funds Associated With Kohlberg Kravis Roberts & Co., L.P.(3)(4) |
225,000,000 | 49.19 | % | |||||
| KKR 2006 Fund L.P. |
199,530,000 | 43.62 | % | |||||
| KKR PEI Investments, L.P. |
16,000,000 | 3.50 | % | |||||
| KKR Partners III, L.P. |
3,670,000 | * | ||||||
| OPERF Co-Investment LLC |
1,800,000 | * | ||||||
| ASF Walter Co-Invest L.P. |
4,000,000 | * | ||||||
| Directors and Named Executive Officers |
||||||||
| Edward M. Liddy(5) |
— | — | ||||||
| Richard J. Schnall(5) |
— | — | ||||||
| Nathan K. Sleeper(5) |
— | — | ||||||
| Michael Calbert(6) |
— | — | ||||||
| Nathaniel H. Taylor(6) |
— | — | ||||||
| John A. Lederer(7)(8) |
4,878,224 | 1.07 | % | |||||
| Fareed Khan(8) |
194,430 | * | ||||||
| Stuart S. Schuette(8) |
827,061 | * | ||||||
| Pietro Satriano(8) |
823,555 | * | ||||||
| Keith Rohland(8) |
345,844 | * | ||||||
| All directors and executive officers as a group (14 people) |
9,149,846 | 2.00 | % | |||||
| * | less than 1% |
132
Table of Contents
| (1) | This table represents shares of common stock of USF Holding Corp., our direct parent, which owns all of the outstanding shares of US Foods, Inc. As set forth in this table, investment funds associated with or managed by the Sponsors currently beneficially own, in the aggregate, a majority of the outstanding shares of USF Holding Corp. common stock. |
| (2) | Represents shares held by the following investment funds associated with or managed by Clayton, Dubilier & Rice, LLC (“CD&R”): a) 120,000,000 shares of common stock held by Clayton, Dubilier & Rice Fund VII, L.P., whose general partner is CD&R Associates VII, Ltd., whose sole stockholder is CD&R Associates VII, L.P., whose general partner is CD&R Investment Associates VII, Ltd.; b) 35,000,000 shares of common stock held by Clayton, Dubilier & Rice Fund VII (Co-Investment), L.P., whose general partner is CD&R Associates VII (Co-Investment), Ltd., whose sole stockholder is CD&R Associates VII, L.P.; c) 854,416 shares of common stock held by CD&R Parallel Fund VII, L.P., whose general partner is CD&R Parallel Fund Associates VII, Ltd.; d) 49,145,584 shares of common stock held by CDR USF Co-Investor, L.P. whose general partner is CDR USF Co-Investor GP Limited, whose sole stockholder is Clayton, Dubilier & Rice Fund VII, L.P., and e) 20,000,000 shares of common stock held by CDR USF Co-Investor No. 2, L.P. whose general partner is CDR USF Co-Investor GP No. 2, Limited, whose sole stockholder is CD&R Associates VII, L.P. (collectively, the “CD&R Funds”). CD&R Investment Associates VII, Ltd. and CD&R Parallel Fund Associates VII, Ltd. are each managed by a two-person board of directors. Donald J. Gogel and Kevin J. Conway as the directors of CD&R Investment Associates VII, Ltd. and CD&R Parallel Fund Associates VII, Ltd., may be deemed to share beneficial ownership of the shares shown as beneficially owned by the funds associated with CD&R. Such persons disclaim such beneficial ownership. Investment and voting decisions with respect to shares held by each of the CD&R Funds are made by an investment committee of limited partners of CD&R Associates VII, L.P., currently consisting of more than 10 individuals (the “Investment Committee”). All members of the Investment Committee disclaim beneficial ownership of the shares shown as beneficially owned by the investment funds managed by CD&R. The address for each of Clayton, Dubilier & Rice Fund VII, L.P., CD&R Parallel Fund VII, L.P., Clayton, Dubilier & Rice Fund VII (Co-Investment), L.P., CD&R Associates VII, Ltd., CD&R Associates VII, L.P., CD&R Parallel Fund Associates VII, Ltd., CD&R Associates VII (Co-Investment), Ltd. and CD&R Investment Associates VII, Ltd. is c/o Maples Corporate Services Limited, P.O. Box 309, Ugland House, Grand Cayman, KY1-1104, Cayman Islands. The address for CD&R is 375 Park Avenue, 18th Floor, New York, NY 10152. |
| (3) | USF Holding Corp. and US Foods, Inc. are a party to the Stockholders’ Agreement, among each of them and the Sponsors. Among other things, USF Holding Corp. and each stockholder that is a party to the Stockholders’ Agreement, is required to take all necessary action to cause the Board nominees that the Sponsors have chosen to be elected. These actions include recommending the nominees of the Sponsors to our Board for inclusion in the slate of nominees recommended by the Board to stockholders for election. (See “Certain Relationships and Related Party Transactions—Stockholders’ Agreement”). |
| (4) | Represents shares held by the following investment funds associated with Kohlberg Kravis Roberts & Co., L.P.: a) 199,530,000 shares of common stock held by KKR 2006 Fund L.P., b) 16,000,000 shares of common stock held by KKR PEI Investments, L.P.; c) 3,670,000 shares of common stock held by KKR Partners III, L.P.; d) 1,800,000 shares of common stock held by OPERF Co-Investment LLC; and e) 4,000,000 shares of common stock held by ASF Walter Co-Invest L.P. (collectively, the “KKR Funds”). The sole general partner of the KKR 2006 Fund L.P. is KKR Associates 2006 L.P., and the sole general partner of KKR Associates 2006 L.P. is KKR 2006 GP LLC. The designated member of KKR 2006 GP LLC is KKR Fund Holdings L.P. The sole general partner of KKR PEI Investments, L.P. is KKR PEI Associates, L.P., and the sole general partner of KKR PEI Associates, L.P. is KKR PEI GP Limited. The sole shareholder of KKR PEI GP Limited is KKR Fund Holdings L.P. Messrs. Henry Kravis and George Roberts have also been designated as managers of KKR 2006 GP LLC by KKR Fund Holdings L.P. KKR III GP LLC is the sole general partner of KKR Partners III, L.P. The managers of KKR III GP LLC are Messrs. Kravis and Roberts. The manager of OPERF Co-Investment LLC is KKR Associates 2006 L.P. The general partner of ASF Walter Co-Invest L.P. is ASF Walter Co-Invest GP Limited. The general partners of KKR Fund Holdings L.P. are KKR Fund Holdings GP Limited and KKR Group Holdings L.P. The sole shareholder of KKR Fund Holdings GP Limited is KKR Group Holdings L.P. The sole general partner of KKR Group Holdings L.P. is KKR Group Limited. The sole shareholder of KKR Group Limited is KKR & Co. L.P. The sole general partner of KKR & Co. L.P. is KKR Management LLC. The designated members of KKR Management LLC are Messrs. Kravis and Roberts. Each of the KKR entities and Messrs. Kravis and Roberts may be deemed to share voting and investment power with respect to the shares beneficially owned by the KKR Funds, but each has disclaimed beneficial ownership of such shares, except to the extent directly held. The address for all entities noted above and for Mr. Kravis is c/o Kohlberg Kravis Roberts & Co. L.P., 9 West 57th Street, Suite 4200, New York, NY 10019. The address for Mr. Roberts is c/o Kohlberg Kravis Roberts & Co. L.P., 2800 Sand Hill Road, Suite 200, Menlo Park, CA 94025. |
| (5) | Does not include 225,000,000 shares of common stock held by investment funds associated with or managed by CD&R. Messrs. Liddy, Schnall, and Sleeper are directors of USF Holding Corp. and executives of CD&R. They disclaim beneficial ownership of the shares held by investment funds associated with or managed by CD&R. |
133
Table of Contents
| (6) | Does not include 225,000,000 shares of common stock held by investment funds associated with Kohlberg Kravis Roberts & Co., L.P. Messrs. Calbert and Taylor are directors of USF Holding Corp. and executives of KKR. They disclaim beneficial ownership of the shares held by investment funds associated with KKR. |
| (7) | Does not include 450,000,000 shares of common stock held by investment funds associated with or managed by the Sponsors. Mr. Lederer is a director of USF Holding Corp. and is a Sponsor Nominee designated jointly by the Sponsors. Mr. Lederer disclaims beneficial ownership of the shares held by investment funds associated with or managed by the Sponsors. |
| (8) | Includes restricted stock, shares that were purchased pursuant to USF Holding Corp.’s employee stock purchase plan, and vested options exercisable within 60 days. This does not include unvested restricted stock units or unvested options. No unvested restricted stock units or unvested options are scheduled to vest within 60 days. |
| Item 13. | Certain Relationships and Related Transactions, and Director Independence |
Director Independence
Neither US Foods nor its parent company, USF Holding, are listed on a national securities exchange, and therefore they are not subject to the director independence requirements of any such exchange. Neither our organizational documents nor those of USF Holding require that a majority of the directors of such company be independent directors.
Investment funds associated with or managed by the Sponsors currently beneficially own, in the aggregate, a majority of the outstanding shares of USF Holding’s common stock. These funds are party to a stockholders agreement pursuant to which each of the funds has agreed to vote in favor of the other funds’ nominees to USF Holding’s board of directors. Therefore, the Sponsors control USF Holding’s and, through their control of USF Holding’s board of directors, indirectly control our board of directors and as a result control our management and policies. All of the directors of USF Holding were appointed pursuant to the terms of the stockholders agreement and are employed by US Foods or the Sponsors. As such, the directors of USF Holding would not be considered “independent” as defined in the federal securities laws or the rules of the New York Stock Exchange or the Nasdaq Stock Market.
Agreements with Sponsor Investors
Following the 2007 Transactions, investment funds affiliated with or managed by each of the Sponsors own approximately one-half of all of the outstanding capital stock of our ultimate parent company, USF Holding Corp. Certain members of management also own common stock of USF Holding Corp. USF Holding Corp. entered into a stockholders agreement with its stockholders simultaneous with the closing of the 2007 Transactions.
This stockholders agreement entitles investment funds affiliated with both of the Sponsors to elect (or cause to be elected) all of USF Holding Corp.’s directors. The directors include three designees of investment funds affiliated with CD&R (one of whom shall serve as the chairman), and three designees of investment funds affiliated with KKR (one of whom shall serve as chairman of the Executive Committee and one of whom shall serve as chairman of the Compensation Committee), subject to adjustment if the ownership percentage of shares of USF Holding Corp. owned by investment funds affiliated with or managed by the applicable Sponsor decrease by more than a specified amount of their shareholdings in USF Holding Corp. The stockholders agreement also grants to investment funds affiliated with the Sponsors’ special governance rights. These include rights of approval over certain corporate and other transactions, and certain rights regarding the appointment and removal of our Chief Executive Officer, for so long as they and other investment funds affiliated with or managed by the applicable Sponsor maintain certain specified minimum levels of shareholdings in USF Holding Corp. This stockholders agreement gives investment funds affiliated with the Sponsors’ preemptive rights with respect to certain issuances of equity securities of USF Holding Corp. and its subsidiaries, including us, subject to certain exceptions. It also contains restrictions on the transfer of shares of USF Holding Corp., as well as tag-along rights, drag-along rights and rights of first offer.
Consulting Agreements and Indemnification Agreements
Upon completion of the 2007 Transactions, USF Holding Corp. and we entered into a consulting agreement with both of the Sponsors (or one of their affiliates), under which such Sponsor or its affiliate provides USF Holding Corp., us and our subsidiaries with financial advisory and management consulting services. We pay a combined monthly management fee of $0.8 million to the Sponsors (or their affiliates) for these services, plus expenses, unless the Sponsors unanimously agree to a higher amount, and may pay to them a fee for certain types of transactions that USF Holding Corp. or we complete. For the fiscal year ended December 27, 2014, we paid $10 million in management fees and related expenses. We also entered into indemnification agreements with USF Holding Corp., the Sponsors, and USF Holding Corp. stockholders affiliated with the Sponsors. Under these agreements, USF Holding Corp. and we indemnify the Sponsors, the USF Holding Corp. stockholders affiliated with the Sponsors, and their respective affiliates, directors, officers, partners, members, employees, agents, representatives and controlling persons, against certain liabilities arising out of performance of the consulting agreement and certain other claims and liabilities.
USF Holding Corp. and the Company have in the past received financial and management services from an affiliate of one of the Sponsors. No such services were received by us in fiscal 2014 and no payments for such services were made in 2014.
Management Stockholders Agreements
In connection with the purchase of stock of USF Holding Corp., certain of our executive officers entered into agreements with USF Holding Corp. and the Sponsors. These included management stockholder’s agreements, sale and participation agreements, and subscription agreements, under which our executives purchased common stock (and were granted additional options to acquire common stock) of USF Holding Corp. These agreements contain, among other things, restrictions on the transfer of shares of USF Holding Corp., as well as tag-along rights, drag- along rights and rights of first offer. On May 28, 2013, the board of directors of USF Holding, parent of US Foods, adopted an amended form of management stockholder’s agreement.
134
Table of Contents
Certain Payments in Connection with Refinancings
Affiliates of KKR received approximately $1.4 million in underwriting discounts and fees in connection with the January 2013 private placement of our Senior Notes.
In connection with the June 2013 Refinancing, we paid affiliates of KKR approximately $0.4 million in transaction fees.
Financing Arrangements
Entities affiliated with our Sponsors are lenders on some of our debt facilities. As of December 27, 2014, KKR-PBPR Capital Partners L.P. and KKR Corporate Credit Partners L.P. entities affiliated with KKR, one of our sponsors, held approximately $2 million of our Senior Notes and $284 million of our Amended 2011 Term Loan. In February 2015, the Company purchased all of the $2 million of our Senior Notes held by the entities affiliated with KKR. Entities affiliated with KKR are also lenders on the Senior ABL Facility. As of December 27, 2014, there were no outstanding borrowings under this facility. We used a portion of the proceeds from issuing Senior Notes in December 2012 and issuing Senior Notes in January 2013 and cash on hand to repurchase $166 million and $355 million, respectively, in aggregate principal amount of Senior Subordinated Notes, which were owned by an affiliate of CD&R, at a price equal to 105.625% of the principal amount of the Senior Subordinated Notes, plus accrued and unpaid interest to the purchase date. See Note 11—Debt in the Notes to the Audited Consolidated Financial Statements for more detailed descriptions of these facilities and the repurchase of Senior Subordinated Notes.
Policy and Procedures For Reviewing Related Party Transactions
We have not formally adopted a written policy and procedure governing the review, approval or ratification of related party transactions.
| Item 14. | Principal Accounting Fees and Services |
The board selected Deloitte & Touche, LLP, as our independent auditors for 2014. The Audit Committee pre-approves all auditing services and non-audit services to be provided by our independent auditors.
With respect to fiscal 2014 and fiscal 2013, the aggregate fees billed by Deloitte & Touche LLP, as applicable, were as follows:
| 2014 | 2013 | |||||||
| Audit fees(1) |
$ | 2,833,350 | $ | 2,962,100 | ||||
| Audit related fees(1) |
96,540 | 123,510 | ||||||
| Tax fees(2) |
280,500 | 108,750 | ||||||
| All other fees |
30,000 | 25,000 | ||||||
|
|
|
|
|
|||||
| $ | 3,240,390 | $ | 3,219,360 | |||||
|
|
|
|
|
|||||
| (1) | For fiscal 2014 and fiscal 2013, audit fees included aggregate fees billed by Deloitte & Touche, LLP for the audit of the Company’s consolidated financial statements and fees billed for the review of the Company’s interim financial statements. In connection with Sysco Corporation’s proposed acquisition of our parent, USF Holding Corp., fiscal 2014 audit fees also included fees billed for the audit of the consolidated financial statements of USF Holding Corp. and review of Sysco’s registration statement on Form S-4 and Form S-3 prospectus supplement. For fiscal 2013, audit fees also included fees billed in connection with the US Foods, Inc. registration statements on Form S-4 and Form S-1 and 144A offerings for the issuance of the Company’s Senior Notes. |
| (2) | For fiscal 2014 and 2013, tax fees consisted of a variety of tax consultation services. |
135
Table of Contents
| Item 15. | Exhibits and Financial Statement Schedules |
| (a) | 1. Financial Statements: |
The following financial statements of US Foods, Inc. and subsidiaries are included in Item 8:
| Report of Independent Registered Public Accounting Firm |
||
| Consolidated Balance Sheets as of December 27, 2014 and December 28, 2013 |
||
| Consolidated Statements of Comprehensive Loss for the Fiscal Years Ended December 27, 2014, December 28, 2013 and December 29, 2012 |
||
| Consolidated Statements of Shareholder’s Equity for the Fiscal Years Ended December 27, 2014, December 28, 2013 and December 29, 2012 |
||
| Consolidated Statements of Cash Flows for the Fiscal Years Ended December 27, 2014, December 28, 2013 and December 29, 2012 |
| 2. | Financial Statement Schedules |
Schedules have been omitted because they are inapplicable, not required, or the information is included elsewhere in the financial statements or notes thereto.
| 3. | Exhibits |
The exhibits listed on the accompanying Exhibit Index are incorporated in this Annual Report on Form 10-K by this reference and filed as part of this report.
136
Table of Contents
Pursuant to the requirements of Section 13 or 15(d) of the Securities Exchange Act of 1934, the registrant has duly caused this report to be signed on its behalf by the undersigned, thereunto duly authorized.
Date: March 24, 2015
| US FOODS, INC. (Registrant) | ||
| By: | /s/ JOHN A. LEDERER | |
| Name: | John A. Lederer | |
| Title: | President and Chief Executive Officer | |
| (Principal Executive Officer) | ||
137
Table of Contents
Exhibits
| Exhibit |
Document Description | |
| 2.1 | Agreement and Plan of Merger, dated as of December 8, 2013, by and among USF Holding Corp., Sysco Corporation, Scorpion Corporation I, Inc. and Scorpion Company II, LLC., incorporated herein by reference to Exhibit 2.1 to the Current Report on Form 8-K (File No. 333- 185732) of US Foods, Inc. filed December 9, 2013. | |
| 2.2 | Asset Purchase Agreement, dated as of February 2, 2015, by and among Performance Food Group, Inc., US Foods, Inc., E&H Distributing LLC, RS Funding, Inc., USF Propco I, LLC, USF Propco II LLC, and Trans- Porte, Inc., USF Holding Corp., and Sysco Corporation incorporated herein by reference to Exhibit 2.1 to the Current Report on Form 8-K (File No. 333-185732) of US Foods, Inc. filed February 5, 2015. | |
| 3.1.1 | Restated Articles of Incorporation of US Foods, Inc. (f/k/a U.S. Foodservice, Inc. f/k/a JP Foodservice Distributors, Inc.), incorporated herein by reference to Exhibit 3.1.1 to the Registration Statement on Form S-4 (File No. 333-185732) of US Foods, Inc. filed December 28, 2012. | |
| 3.1.2 | Certificate of Amendment of Certificate of Incorporation of US Foods, Inc. (f/k/a U.S. Foodservice, Inc. f/k/a JP Foodservice Distributors, Inc.) with respect to the name change from JB Foodservice Distributors, Inc. to U.S. Foodservice, Inc., incorporated herein by reference to Exhibit 3.1.2 to the Registration Statement on Form S-4 (File No. 333-185732) of US Foods, Inc. filed December 28, 2012. | |
| 3.1.3 | Certificate of Amendment of Certificate of Incorporation of US Foods, Inc. (f/k/a U.S. Foodservice, Inc.) with respect to the name change from U.S. Foodservice, Inc. to US Foods, Inc., incorporated herein by reference to Exhibit 3.1.3 to the Registration Statement on Form S-4 (File No. 333-185732) of US Foods, Inc. filed December 28, 2012. | |
| 3.2 | Amended and Restated By-Laws of US Foods, Inc., incorporated herein by reference to Exhibit 3.2 to the Registration Statement on Form S-4 (File No. 333-185732) of US Foods, Inc. filed December 28, 2012. | |
| 3.3 | Articles of Formation of E&H Distributing, LLC, incorporated herein by reference to Exhibit 3.3 to the Registration Statement on Form S-4 (File No. 333-185732) of US Foods, Inc. filed December 28, 2012. | |
| 3.4 | Limited Liability Company Agreement of E&H Distributing, LLC, incorporated herein by reference to Exhibit 3.4 to the Registration Statement on Form S-4 (File No. 333-185732) of US Foods, Inc. filed December 28, 2012. | |
| 3.5 | Amended and Restated Certificate of Incorporation of Trans-Porte, Inc., incorporated herein by reference to Exhibit 3.5 to the Registration Statement on Form S-4 (File No. 333-185732) of US Foods, Inc. filed December 28, 2012. | |
| 3.6 | Amended and Restated By-Laws of Trans-Porte, Inc., incorporated herein by reference to Exhibit 3.6 to the Registration Statement on Form S-4 (File No. 333-185732) of US Foods, Inc. filed December 28, 2012. | |
| 3.7.1 | Certificate of Formation of Great North Imports, LLC (f/k/a USF NDG, LLC), incorporated herein by reference to Exhibit 3.7.1 to the Registration Statement on Form S-4 (File No. 333-185732) of US Foods, Inc. filed December 28, 2012. | |
| 3.7.2 | Certificate of Amendment to the Certificate of Formation of Great North Imports, LLC (f/k/a USF NDG, LLC), incorporated herein by reference to Exhibit 3.7.2 to the Registration Statement on Form S-4 (File No. 333-185732) of US Foods, Inc. filed December 28, 2012. | |
| 3.8 | Amended and Restated Limited Liability Company Agreement of Great North Imports, LLC (f/k/a USF NDG, LLC), incorporated herein by reference to Exhibit 3.8 to the Registration Statement on Form S-4 (File No. 333-185732) of US Foods, Inc. filed December 28, 2012. | |
138
Table of Contents
| Exhibit |
Document Description | |
| 3.9.1 | Certificate of Formation of US Foods Culinary Equipment & Supplies, LLC (f/k/a Next Day Gourmet, LLC), incorporated herein by reference to Exhibit 3.9.1 to the Registration Statement on Form S-4 (File No. 333-185732) of US Foods, Inc. filed December 28, 2012. | |
| 3.9.2 | Certificate of Amendment to the Certificate of Formation of US Foods Culinary Equipment & Supplies, LLC (f/k/a Next Day Gourmet, LLC), incorporated herein by reference to Exhibit 3.9.2 to the Registration Statement on Form S-4 (File No. 333-185732) of US Foods, Inc. filed December 28, 2012. | |
| 3.10 | Amended and Restated Limited Liability Company Agreement of US Foods Culinary Equipment & Supplies, LLC (f/k/a Next Day Gourmet, LLC), incorporated herein by reference to Exhibit 3.10 to the Registration Statement on Form S-4 (File No. 333-185732) of US Foods, Inc. filed December 28, 2012. | |
| 4.1.1 | Indenture, dated as of May 11, 2011, among US Foods, Inc. (f/k/a U.S. Foodservice, Inc.), as Issuer, the Subsidiary Guarantors party thereto, and Wilmington Trust, National Association (f/k/a Wilmington FSB), as Trustee, incorporated herein by reference to Exhibit 4.1.1 to the Registration Statement on Form S-4 (File No. 333-185732) of US Foods, Inc. filed December 28, 2012. | |
| 4.1.2 | First Supplemental Indenture, dated December 6, 2012, among US Foods, Inc. (f/k/a U.S. Foodservice, Inc.), as Issuer, the Subsidiary Guarantors party thereto, and Wilmington Trust, National Association (f/k/a Wilmington FSB), as Trustee, incorporated herein by reference to Exhibit 4.1.2 to the Registration Statement on Form S-4 (File No. 333-185732) of US Foods, Inc. filed December 28, 2012. | |
| 4.1.3 | Second Supplemental Indenture, dated December 27, 2012, among US Foods, Inc. (f/k/a U.S. Foodservice, Inc.), as Issuer, the Subsidiary Guarantors party thereto, and Wilmington Trust, National Association (f/k/a Wilmington FSB), as Trustee, incorporated herein by reference to Exhibit 4.1.3 to the Registration Statement on Form S-4 (File No. 333-185732) of US Foods, Inc. filed December 28, 2012. | |
| 4.1.4 | Third Supplemental Indenture, dated January 16, 2013, among US Foods, Inc. (f/k/a U.S. Foodservice, Inc.), as Issuer, the Subsidiary Guarantors party thereto, and Wilmington Trust, National Association (f/k/a Wilmington FSB), as Trustee, incorporated herein by reference to Exhibit 4.1.4 to Amendment No. 1 to the Registration Statement on Form S-4 (File No. 333-185732) of US Foods, Inc. filed February 8, 2013. | |
| 4.1.5 | Fourth Supplemental Indenture, dated as of December 19, 2013, among US Foods, Inc. (f/k/a U.S. Foodservice, Inc.), as Issuer, the Subsidiary Guarantors party thereto, and Wilmington Trust, National Association (f/k/a Wilmington FSB), as Trustee, incorporated herein by reference to Exhibit 4.1 to the Current Report on Form 8-K (File No. 333-185732) of US Foods, Inc. filed December 19, 2013. | |
| 4.2 | Exchange and Registration Rights Agreement, dated as of May 11, 2011, by and among US Foods, Inc., the Guarantors party thereto, and Deutsche Bank Securities Inc., as the representative of the initial purchasers, incorporated herein by reference to Exhibit 4.2 to the Registration Statement on Form S-4 (File No. 333-185732) of US Foods, Inc. filed December 28, 2012. | |
| 4.3 | Exchange and Registration Rights Agreement, dated as of December 6, 2012, by and among US Foods, Inc., the Guarantors party thereto, and Deutsche Bank Securities Inc., as the representative of the initial purchasers, incorporated herein by reference to Exhibit 4.3 to the Registration Statement on Form S-4 (File No. 333-185732) of US Foods, Inc. filed December 28, 2012. | |
| 4.4 | Exchange and Registration Rights Agreement, dated as of December 27, 2012, by and among US Foods, Inc., the Guarantors party thereto, and Deutsche Bank Securities Inc., as the representative of the initial purchasers, incorporated herein by reference to Exhibit 4.4 to the Registration Statement on Form S-4 (File No. 333-185732) of US Foods, Inc. filed December 28, 2012. | |
| 4.5 | Exchange and Registration Rights Agreement, dated as of January 16, 2013, by and among US Foods, Inc., the Guarantors party thereto, and Deutsche Bank Securities Inc., as the representative of the initial purchasers, incorporated herein by reference to Exhibit 4.5 to Amendment No. 1 to the Registration Statement on Form S-4 (File No. 333-185732) of US Foods, Inc. filed February 8, 2013. | |
139
Table of Contents
| Exhibit |
Document Description | |
| 4.6 | Form of 8.5% Senior Notes due 2019 (included in Exhibit 4.1.1). | |
| 10.1 | Stockholders Agreement of USF Holding Corp., dated as of July 3, 2007, among USF Holding Corp., US Foods, Inc. (f/k/a U.S. Foodservice, Inc.), and each of the stockholders whose name appears on the signature pages thereof or who subsequently becomes a stockholder thereby, incorporated herein by reference to Exhibit 10.1 to the Registration Statement on Form S-4 (File No. 333-185732) of US Foods, Inc. filed December 28, 2012. | |
| 10.2 | Letter Agreement, dated as of November 23, 2009, amending and restating Original Consulting Agreement among US Foods, Inc. (f/k/a U.S. Foodservice, Inc.) and Kohlberg Kravis Roberts & Co. L.P., incorporated herein by reference to Exhibit 10.2 to the Registration Statement on Form S-4 (File No. 333-185732) of US Foods, Inc. filed December 28, 2012.§ | |
| 10.3 | Letter Agreement, dated as of November 23, 2009, amending and restating Original Consulting Agreement among US Foods, Inc. (f/k/a U.S. Foodservice, Inc.) and Clayton, Dubilier & Rice, LLC (successor in interest to Clayton, Dubilier & Rice, Inc.), incorporated herein by reference to Exhibit 10.3 to the Registration Statement on Form S-4 (File No. 333-185732) of US Foods, Inc. filed December 28, 2012.§ | |
| 10.4 | Amended and Restated Indemnification Agreement, dated as of November 23, 2009, by and among USF Holding Corp., US Foods, Inc. (f/k/a U.S. Foodservice, Inc.), KKR 2006 Fund, L.P., KKR PEI Investments, L.P., KKR Partners III L.P., OPERF Co-Investment LLC, and Kohlberg Kravis Roberts & Co. L.P., incorporated herein by reference to Exhibit 10.4 to the Registration Statement on Form S-4 (File No. 333-185732) of US Foods, Inc. filed December 28, 2012. | |
| 10.5 | Amended and Restated Indemnification Agreement, dated as of November 23, 2009, by and among USF Holding Corp., US Foods, Inc. (f/k/a U.S. Foodservice, Inc.), Clayton, Dubilier & Rice Fund VII, L.P., Clayton, Dubilier & Rice Fund VII (Co-Investment), L.P., CD&R Parallel Fund VII, L.P., CDR USF Co-Investor No.2, L.P., Clayton, Dubilier & Rice, Inc., Clayton, Dubilier & Rice, LLC and Clayton, Dubilier & Rice Holdings, L.P., incorporated herein by reference to Exhibit 10.5 to the Registration Statement on Form S-4 (File No. 333-185732) of US Foods, Inc. filed December 28, 2012. | |
| 10.6 | Indemnification Priority and Information Sharing Agreement, dated as of April 15, 2010, among the funds managed by Clayton, Dubilier & Rice, LLC, set forth on Annex 1, CDR Manager, Clayton, Dubilier & Rice Holdings, L.P., Clayton, Dubilier & Rice, Inc. and US Foods, Inc. (f/k/a U.S. Foodservice, Inc.), incorporated herein by reference to Exhibit 10.6 to the Registration Statement on Form S-4 (File No. 333-185732) of US Foods, Inc. filed December 28, 2012. | |
| 10.7 | Indemnification Priority and Information Sharing Agreement, dated as of April 15, 2010, among the funds managed by Kohlberg Kravis Roberts & Co. L.P., KKR, and US Foods, Inc. (f/k/a U.S. Foodservice Inc.), incorporated herein by reference to Exhibit 10.7 to the Registration Statement on Form S-4 (File No. 333-185732) of US Foods, Inc. filed December 28, 2012. | |
| 10.8 | Form of Management Stockholder’s Agreement, incorporated herein by reference to Exhibit 10.8 to the Registration Statement on Form S-4 (File No. 333-185732) of US Foods, Inc. filed December 28, 2012.§ | |
| 10.9 | Form of Sale Participation Agreement, incorporated herein by reference to Exhibit 10.9 to the Registration Statement on Form S-4 (File No. 333-185732) of US Foods, Inc. filed December 28, 2012.§ | |
| 10.10 | Form of Subscription Agreement, incorporated herein by reference to Exhibit 10.10 to the Registration Statement on Form S-4 (File No. 333-185732) of US Foods, Inc. filed December 28, 2012.§ | |
| 10.11 | Annual Incentive Plan of US Foods, Inc. (f/k/a U.S. Foodservice, Inc.), incorporated herein by reference to Exhibit 10.11 to Amendment No. 2 to the Registration Statement on Form S-4 (File No. 333-185732) of US Foods, Inc. filed March 15, 2013.§ | |
| 10.12 | 2007 Stock Incentive Plan of US Foods, Inc. (f/k/a U.S. Foodservice, Inc.), incorporated herein by reference to Exhibit 10.12 to the Registration Statement on Form S-4 (File No. 333-185732) of US Foods, Inc. filed December 28, 2012.§ | |
140
Table of Contents
| Exhibit |
Document Description | |
| 10.13 | Form of Stock Option Agreement, incorporated herein by reference to Exhibit 10.13 to Amendment No. 2 to the Registration Statement on Form S-4 (File No. 333-185732) of US Foods, Inc. filed March 15, 2013. § | |
| 10.14 | Form of 2012 Restricted Stock Unit Agreement, incorporated herein by reference to Exhibit 10.14 to Amendment No. 2 to the Registration Statement on Form S-4 (File No. 333-185732) of US Foods, Inc. filed March 15, 2013. § | |
| 10.15 | Form of Restricted Stock Award Agreement, incorporated herein by reference to Exhibit 10.15 to Amendment No. 2 to the Registration Statement on Form S-4 (File No. 333-185732) of US Foods, Inc. filed March 15, 2013. § | |
| 10.16 | 2013 Annual Incentive Plan of US Foods, Inc., incorporated herein by reference to Exhibit 10.16 to Amendment No. 2 to the Registration Statement on Form S-4 (File No. 333-185732) of US Foods, Inc. filed March 15, 2013.§ | |
| 10.17 | Severance Agreement, dated September 21, 2010, by and between US Foods, Inc. (f/k/a U.S. Foodservice Inc.) and John A. Lederer, incorporated herein by reference to Exhibit 10.17 to the Registration Statement on Form S-4 (File No. 333-185732) of US Foods, Inc. filed December 28, 2012.§ | |
| 10.18 | Severance Agreement, dated June 12, 2009, by and between and between US Foods, Inc. (f/k/a U.S. Foodservice Inc.) and Allan Swanson, incorporated herein by reference to Exhibit 10.18 to the Registration Statement on Form S-4 (File No. 333-185732) of US Foods, Inc. filed December 28, 2012.§ | |
| 10.19 | Severance Agreement, dated August 10, 2009, by and between and between US Foods, Inc. (f/k/a U.S. Foodservice Inc.) and Stuart Schuette, incorporated herein by reference to Exhibit 10.19 to the Registration Statement on Form S-4 (File No. 333-185732) of US Foods, Inc. filed December 28, 2012.§ | |
| 10.20 | Severance Agreement, dated April 1, 2011, by and between and between US Foods, Inc. (f/k/a U.S. Foodservice Inc.) and Pietro Satriano, incorporated herein by reference to Exhibit 10.20 to the Registration Statement on Form S-4 (File No. 333-185732) of US Foods, Inc. filed December 28, 2012.§ | |
| 10.21 | Severance Agreement, dated June 12, 2009, by and between and between US Foods, Inc. (f/k/a U.S. Foodservice Inc.) and David Esler, incorporated herein by reference to Exhibit 10.21 to the Registration Statement on Form S-4 (File No. 333-185732) of US Foods, Inc. filed December 28, 2012.§ | |
| 10.22.1 | Term Loan Credit Agreement (2007 Term Facility), dated July 3, 2007, among US Foods, Inc. (f/k/a U.S. Foodservice, Inc.), as Borrower, the several Lenders from time to time party thereto, Citicorp North America, Inc., as Administrative Agent and Term Collateral Agent, Deutsche Bank Securities Inc., as Syndication Agent, and Natixis, as Senior Managing Agent, incorporated herein by reference to Exhibit 10.22.1 to the Registration Statement on Form S-4 (File No. 333-185732) of US Foods, Inc. filed December 28, 2012. | |
| 10.22.2 | Amendment No. 1, dated June 6, 2012, to the 2007 Term Facility, entered into among US Foods, Inc. (f/k/a U.S. Foodservice, Inc.), each of the other Loan Parties as defined therein, Citicorp North America, Inc., as administrative agent for the lenders, and the Lenders party thereto, incorporated herein by reference to Exhibit 10.22.2 to the Registration Statement on Form S-4 (File No. 333-185732) of US Foods, Inc. filed December 28, 2012. | |
| 10.22.3 | Amendment No. 2, dated December 6, 2012, to the 2007 Term Facility, entered into among US Foods, Inc., each of the other Loan Parties as defined therein, Citicorp North America, Inc., as administrative agent for the lenders, and the Lenders party thereto, incorporated herein by reference to Exhibit 10.22.3 to the Registration Statement on Form S-4 (File No. 333-185732) of US Foods, Inc. filed December 28, 2012. | |
| 10.23 | Guarantee and Collateral Agreement, dated July 3, 2007, by US Foods, Inc. (f/k/a U.S. Foodservice, Inc.), as Borrower and certain of its Subsidiaries in favor of Citicorp North America, Inc., as Administrative Agent and as Term Collateral Agent, incorporated herein by reference to Exhibit 10.23 to the Registration Statement on Form S-4 (File No. 333-185732) of US Foods, Inc. filed December 28, 2012. | |
141
Table of Contents
| Exhibit |
Document Description | |
| 10.24 | Revolving Credit Agreement, dated as of July 3, 2007, among US Foods, Inc. (f/k/a U.S. Foodservice, Inc.), as the Parent Borrower, certain Subsidiaries of the Parent Borrower signatory thereto, the several Lenders from time to time party thereto, Citicorp North America, Inc., as Administrative Agent, Revolving Collateral Agent, and Issuing Lender, Deutsche Bank Securities Inc., as Syndication Agent, and Natixis, as Senior Managing Agent, incorporated herein by reference to Exhibit 10.24 to the Registration Statement on Form S-4 (File No. 333-185732) of US Foods, Inc. filed December 28, 2012. | |
| 10.25 | Revolving Guarantee and Collateral Agreement, dated as of July 3, 2007, made by US Foods, Inc. (f/k/a U.S. Foodservice, Inc.), as Borrower and certain of its Subsidiaries in favor of Citicorp North America, Inc., as Administrative Agent and as Revolving Collateral Agent, incorporated herein by reference to Exhibit 10.25 to the Registration Statement on Form S-4 (File No. 333-185732) of US Foods, Inc. filed December 28, 2012. | |
| 10.26.1 | ABL Credit Agreement (Senior ABL Facility), dated July 3, 2007, among US Foods, Inc. (f/k/a U.S. Foodservice, Inc.), as the Parent Borrower, certain Subsidiaries of the Parent Borrower signatory thereto, the several Lenders from time to time party thereto, Citicorp North America, Inc., as Administrative Agent, ABL Collateral Agent, and Issuing Lender, Deutsche Bank Securities Inc., as Syndication Agent, and Natixis, as Senior Managing Agent, incorporated herein by reference to Exhibit 10.26.1 to the Registration Statement on Form S-4 (File No. 333-185732) of US Foods, Inc. filed December 28, 2012. | |
| 10.26.2 | Amendment No. 1, dated May 11, 2011 to the Senior ABL Facility, among US Foods, Inc. (f/k/a U.S. Foodservice, Inc.), as the Parent Borrower, certain Subsidiaries of the Parent Borrower signatory thereto, the several Lenders from time to time party thereto, Citicorp North America, Inc., as Administrative Agent, ABL Collateral Agent, and Issuing Lender, incorporated herein by reference to Exhibit 10.26.2 to the Registration Statement on Form S-4 (File No. 333-185732) of US Foods, Inc. filed December 28, 2012. | |
| 10.26.3 | Amendment No. 2, dated November 28, 2011 to the Senior ABL Facility, among US Foods, Inc. (f/k/a U.S. Foodservice, Inc.), as the Parent Borrower, certain Subsidiaries of the Parent Borrower signatory thereto, the several Lenders from time to time party thereto, Citicorp North America, Inc., as Administrative Agent, ABL Collateral Agent, and Issuing Lender, incorporated herein by reference to Exhibit 10.26.3 to the Registration Statement on Form S-4 (File No. 333-185732) of US Foods, Inc. filed December 28, 2012. | |
| 10.26.4 | Amendment No. 3, dated August 15, 2012 to the Senior ABL Facility, among US Foods, Inc. (f/k/a U.S. Foodservice, Inc.), as the Parent Borrower, certain Subsidiaries of the Parent Borrower signatory thereto, the several Lenders from time to time party thereto, Citicorp North America, Inc., as Administrative Agent, ABL Collateral Agent, and Issuing Lender, incorporated herein by reference to Exhibit 10.26.4 to the Registration Statement on Form S-4 (File No. 333-185732) of US Foods, Inc. filed December 28, 2012. | |
| 10.27 | ABL Guarantee and Collateral Agreement, dated as of July 3, 2007, made by US Foods, Inc. (f/k/a U.S. Foodservice, Inc.), as the Parent Borrower and the several Subsidiary Borrowers signatory thereto, in favor of Citicorp North America, Inc., as Administrative Agent and as ABL Collateral Agent, incorporated herein by reference to Exhibit 10.27 to the Registration Statement on Form S-4 (File No. 333-185732) of US Foods, Inc. filed December 28, 2012. | |
| 10.28.1 | Credit Agreement (2011 Term Facility), dated May 11, 2011, among US Foods, Inc. (f/k/a/ U.S. Foodservice, Inc.), as the Borrower, the several Lenders from time to time party thereto, and Citicorp North America, Inc., as Administrative Agent and Collateral Agent, incorporated herein by reference to Exhibit 10.28 to the Registration Statement on Form S-4 (File No. 333-185732) of US Foods, Inc. filed December 28, 2012. | |
| 10.28.2 | First Amendment, dated as of June 7, 2013, to the 2011 Term Facility, among US Foods, Inc., as the Borrower, the other Loan Parties thereto, Citicorp North America, Inc., as administrative agent and collateral agent and the Lenders and other financial institutions party thereto, incorporated by reference to Exhibit 28.2 to Amendment No. 1 to the Registration Statement on Form S-1 (File No. 333- 333-189142) of US Foods, Inc. filed July 12, 2013. | |
| 10.29 | Guarantee and Collateral Agreement, dated as of May 11, 2011, among U.S. Foods, Inc. (f/k/a/ U.S. Foodservice, Inc.), as Borrower and certain of its Subsidiaries in favor of Citicorp North America, Inc., as Administrative Agent and as Term Collateral Agent, incorporated herein by reference to Exhibit 10.29 to the Registration Statement on Form S-4 (File No. 333-185732) of US Foods, Inc. filed December 28, 2012. | |
142
Table of Contents
| Exhibit |
Document Description | |
| 10.30 | 2007 Stock Incentive Plan for Key Employees of USF Holdings Corp. as amended, incorporated herein by reference to Exhibit 10.1 to the Current Report on Form 8-K (File No. 333-185732) of US Foods, Inc. filed May 30, 2013.§ | |
| 10.31 | Form of Management Stockholder’s Agreement, incorporated herein by reference to Exhibit 10.2 to the Current Report on Form 8-K (File No. 333-185732) of US Foods, Inc. filed May 30, 2013.§ | |
| 10.32 | Form of Sale Participation Agreement, incorporated herein by reference to Exhibit 10.3 to the Current Report on Form 8-K (File No. 333-185732) of US Foods, Inc. filed May 30, 2013.§ | |
| 10.33 | Form of Stock Option Agreement, incorporated herein by reference to Exhibit 10.4 to the Current Report on Form 8-K (File No. 333-185732) of US Foods, Inc. filed May 30, 2013.§ | |
| 10.34 | Form of Restricted Stock Unit Agreement, incorporated herein by reference to Exhibit 10.5 to the Current Report on Form 8-K (File No. 333-185732) of US Foods, Inc. filed May 30, 2013.§ | |
| 10.35 | Form of Restricted Stock Award Agreement, incorporated herein by reference to Exhibit 10.6 to the Current Report on Form 8-K (File No. 333-185732) of US Foods, Inc. filed May 30, 2013.§ | |
| 10.36 | Offer letter, dated August 15, 2013, by and between Fareed A. Kahn and US Foods, Inc., incorporated herein by reference to Exhibit 10.1 to the Current Report on Form 8-K (File No. 333-185732) of US Foods, Inc. filed November 7, 2013.§ | |
| 10.37 | Restricted Stock Unit Agreement, dated as of October 1, 2013, by and between John A. Lederer and US Foods, Inc., incorporated herein by reference to Exhibit 10.37 to the Annual Report on Form 10-K (File No. 333-185732) of US Foods, Inc. filed March 20, 2014.§ | |
| 10.38 | Severance Agreement, dated September 26, by and between US Foods, Inc. and Fareed A. Khan, incorporated herein by reference to Exhibit 10.38 to the Annual Report on Form 10-K (File No. 333-185732) of US Foods, Inc. filed March 20, 2014.§ | |
| 10.39 | Severance Agreement, dated April 5, 2013, by and between US Foods, Inc. and Mark Scharbo, incorporated herein by reference to Exhibit 10.39 to the Annual Report on Form 10-K (File No. 333-185732) of US Foods, Inc. filed March 20, 2014.§ | |
| 10.40 | Form Amendment to Severance Agreement, December 20, 2013 by and between US Foods, Inc. and each of Fareed A. Khan, Petro Satriano, Stuart S. Schuette and Mark Scharbo, incorporated herein by reference to Exhibit 10.40 to the Annual Report on Form 10-K (File No. 333-185732) of US Foods, Inc. filed March 20, 2014.§ | |
| 10.41 | Stockholders Agreement, dated as of December 8, 2013, by and among Sysco Corporation, Clayton Dubilier & Rice LLC, Kohlberg, Kravis Roberts & Co. L.P. and the stockholders named therein, incorporated herein by reference to Exhibit 10.41 to the Annual Report on Form 10-K (File No. 333-185732) of US Foods, Inc. filed March 20, 2014. | |
| 10.42 | Transaction Bonus Agreement, dated February 24, 2014 by and between US Foods, Inc. and Fareed Khan, incorporated herein by reference to Exhibit 10.42 to the Current Report on Form 10-Q (File No. 333-185732) of US Foods, Inc. filed May 12, 2014.§ | |
| 10.43 | Retention Award Agreement, dated February 24, 2014 by and between US Foods, Inc. and Fareed Khan, incorporated herein by reference to Exhibit 10.43 to the Current Report on Form 10-Q (File No. 333-185732) of US Foods, Inc. filed May 12, 2014.§ | |
| 10.44 | Transaction Bonus Agreement, dated February 24, 2014 by and between US Foods, Inc. and Stuart S. Schuette, incorporated herein by reference to Exhibit 10.44 to the Current Report on Form 10-Q (File No. 333-185732) of US Foods, Inc. filed May 12, 2014.§ | |
| 10.45 | Retention Award Agreement, dated February 24, 2014 by and between US Foods, Inc. and Stuart S. Schuette, incorporated herein by reference to Exhibit 10.45 to the Current Report on Form 10-Q (File No. 333-185732) of US Foods, Inc. filed May 12, 2014.§ | |
| 10.46 | Transaction Bonus Agreement, dated February 24, 2014 by and between US Foods, Inc. and Pietro Satriano, incorporated herein by reference to Exhibit 10.46 to the Current Report on Form 10-Q (File No. 333-185732) of US Foods, Inc. filed May 12, 2014.§ | |
143
Table of Contents
| Exhibit |
Document Description | |
| 10.47 | Retention Award Agreement, dated February 24, 2014 by and between US Foods, Inc. and Pietro Satriano, incorporated herein by reference to Exhibit 10.47 to the Current Report on Form 10-Q (File No. 333-185732) of US Foods, Inc. filed May 12, 2014.§ | |
| 10.48 | Transaction Bonus Agreement, dated February 24, 2014 by and between US Foods, Inc. and Mark W. Scharbo, incorporated herein by reference to Exhibit 10.48 to the Current Report on Form 10-Q (File No. 333-185732) of US Foods, Inc. filed May 12, 2014.§ | |
| 10.49 | Retention Award Agreement, dated February 24, 2014 by and between US Foods, Inc. and Mark W. Scharbo, incorporated herein by reference to Exhibit 10.49 to the Current Report on Form 10-Q (File No. 333-185732) of US Foods, Inc. filed May 12, 2014.§ | |
| 10.50 | Letter Agreement, dated December 8, 2013, by and between US Foods, Inc. and John Lederer, incorporated herein by reference to Exhibit 10.50 to the Current Report on Form 10-Q (File No. 333-185732) of US Foods, Inc. filed August 12, 2014.§ | |
| 10.51**§ | Restricted Stock Unit Agreement, dated as of December 10, 2014, by and between John A. Lederer and US Foods, Inc. | |
| 12.1** 14.1** |
Statements re Computation of Ratio of Earnings to Fixed Charges. Code of Conduct of US Foods. Inc. | |
| 21.1** | Subsidiaries of US Foods, Inc. | |
| 31.1* | Section 302 Certification of the Chief Executive Officer Pursuant to Rule 13a-14(a) of the Securities Exchange Act of 1934, as adopted pursuant to Section 302 of the Sarbanes-Oxley Act of 2002. | |
| 31.2* | Section 302 Certification of the Chief Financial Officer Pursuant to Rule 13a-14(a) of the Securities Exchange Act of 1934, as adopted pursuant to Section 302 of the Sarbanes-Oxley Act of 2002. | |
| 32.1† | Certification of the Chief Executive Officer Pursuant to 18 U.S.C. Section 1350, As Adopted Pursuant to Section 906 of the Sarbanes-Oxley Act of 2002. | |
| 32.2† | Certification of the Chief Financial Officer Pursuant to 18 U.S.C. Section 1350, As Adopted Pursuant to Section 906 of the Sarbanes-Oxley Act of 2002. | |
| 101** | Interactive Data File. | |
| * | Filed herewith. |
| ** | Previously filed with the Annual Report on Form 10-K filed with the SEC on March 20, 2015, which is being amended hereby. |
| † | Furnished with this Report. |
| § | Indicates a management contract or compensatory plan or arrangement required to be filed pursuant to Item 15(b) of Form 10-K. |
144