Attached files
| file | filename |
|---|---|
| 8-K - 8-K - TIDEWATER INC | d896286d8k.htm |
 Scotia
Howard Weil 43
rd
Annual
Energy Conference
March 23, 2015
Joseph M. Bennett
EVP & Chief Investor Relations Officer
Exhibit 99.1 |
 FORWARD-LOOKING STATEMENTS
In
accordance
with
the
safe
harbor
provisions
of
the
Private
Securities
Litigation
Reform
Act
of
1995,
the
Company
notes
that
certain
statements
set
forth
in
this
presentation
provide
other
than
historical
information
and
are
forward
looking.
The
actual
achievement
of
any
forecasted
results,
or
the
unfolding
of
future
economic
or
business
developments
in
a
way
anticipated
or
projected
by
the
Company,
involve
numerous
risks
and
uncertainties
that
may
cause
the
Company’s
actual
performance
to
be
materially
different
from
that
stated
or
implied
in
the
forward-looking
statement.
Among
those
risks
and
uncertainties,
many
of
which
are
beyond
the
control
of
the
Company,
include,
without
limitation,
fluctuations
in
worldwide
energy
demand
and
oil
and
gas
prices;
fleet
additions
by
competitors
and
industry
overcapacity;
changes
in
capital
spending
by
customers
in
the
energy
industry
for
offshore
exploration,
development
and
production;
changing
customer
demands
for
different
vessel
specifications,
which
may
make
some
of
our
older
vessels
technologically
obsolete
for
certain
customer
projects
or
in
certain
markets;
uncertainty
of
global
financial
market
conditions
and
difficulty
accessing
credit
or
capital;
acts
of
terrorism
and
piracy;
significant
weather
conditions;
unsettled
political
conditions,
war,
civil
unrest
and
governmental
actions,
such
as
expropriation
or
enforcement
of
customs
or
other
laws
that
are
not
well-developed
or
consistently
enforced,
especially
in
higher
political
risk
countries
where
we
operate;
foreign
currency
fluctuations;
labor
changes
proposed
by
international
conventions;
increased
regulatory
burdens
and
oversight;
and
enforcement
of
laws
related
to
the
environment,
labor
and
foreign
corrupt
practices.
Readers
should
consider
all
of
these
risks
factors,
as
well
as
other
information
contained
in
the
Company’s
form
10-K’s
and
10-Q’s.
Phone:
504.568.1010
|
Fax:
504.566.4580
Web site address:
www.tdw.com
Email:
connect@tdw.com
TIDEWATER 601 Poydras Street, Suite 1500, New Orleans, LA 70130
2
Scotia Howard Weil 43rd Annual Energy Conference |
 Safe, efficient
and compliant operations New vessels that service all water depths
Solid balance sheet and financial flexibility
Geographic diversity
3
Scotia Howard Weil 43rd Annual Energy Conference
What’s Important in a Challenged Market
Strong customer base and relationships
Reasonable CAPX expectations
-
Reasonable financial leverage
-
Sufficient liquidity
Return capital to shareholders through dividends and
opportunistic share repurchases |
 4
Scotia Howard Weil 43rd Annual Energy Conference
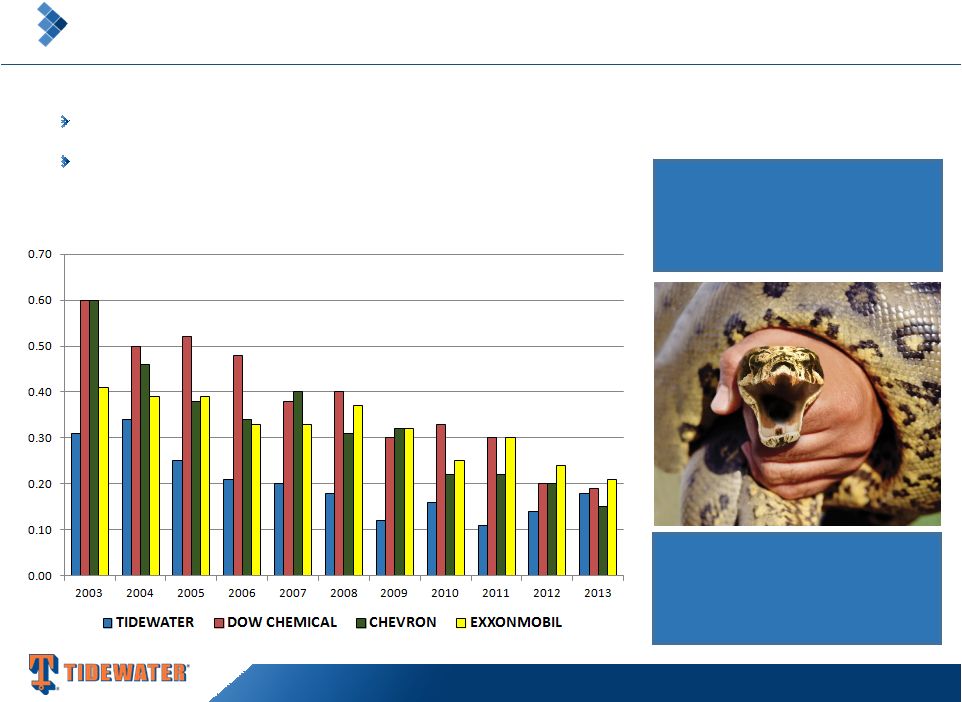
Safe Operations is Priority #1
Stop Work Obligation
Safety performance is 25% of mgt. incentive comp
TOTAL RECORDABLE INCIDENT RATES
Operating safely offshore is
like holding a snake by its head.
It's a task that can't be turned
loose not for a microsecond or an
accident will strike without pity. |
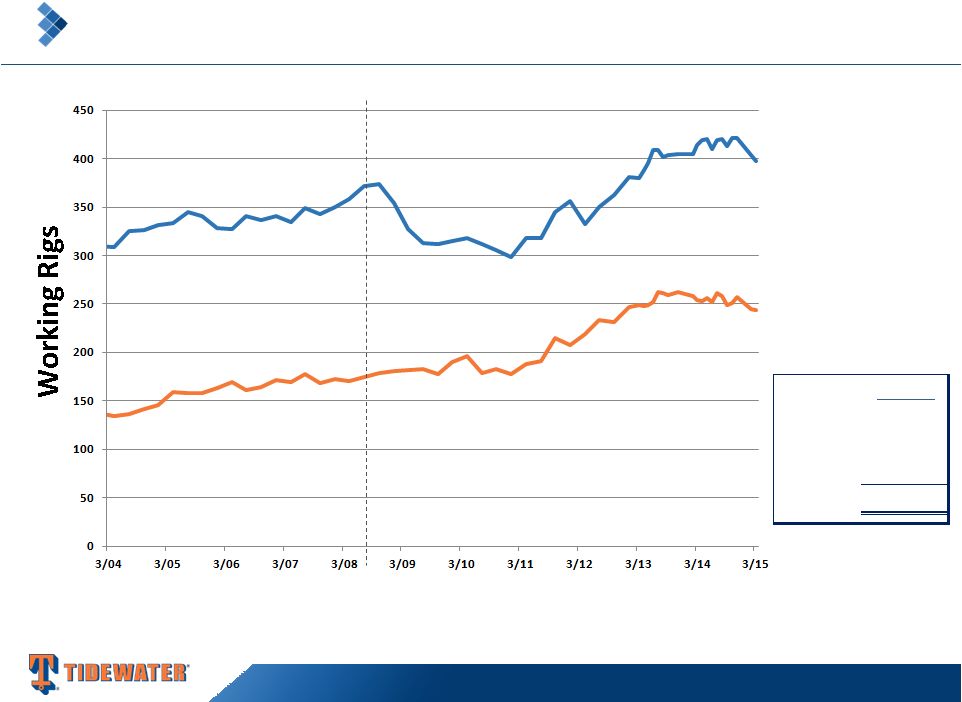 Source: ODS-Petrodata
Note: 37 “Other”
rigs, along with the Jackups and Floaters, provide a total working rig count of 679
in March 2015. 398
244
Prior peak (summer 2008)
Jackups
Floaters
5
Scotia Howard Weil 43rd Annual Energy Conference
Too Many Offshore Rigs, but Activity Levels Drive OSV Demand
Rig CIP
Jackups
123
Floaters
85
Other
9
217 |
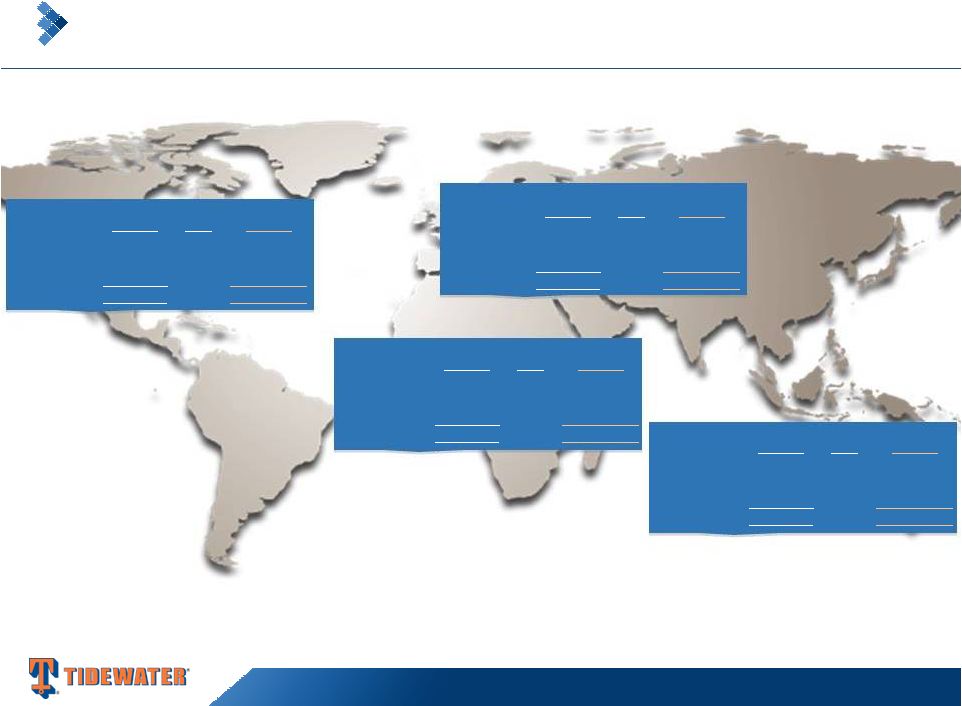
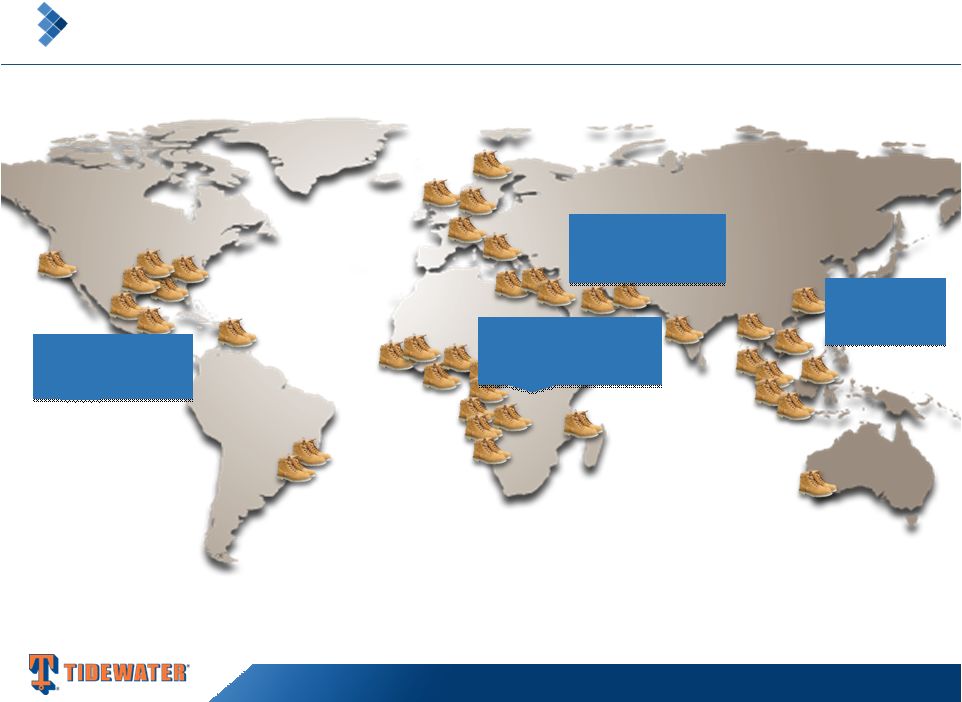         Americas
71(27%)
SS Africa/Europe
117(45%)
MENA
46(18%)
Asia/Pac
26(10%)
6
Scotia Howard Weil 43rd Annual Energy Conference
Geographic Diversity –
Vessel Count by Region
(Excludes stacked vessels –
as of 12/31/14) |
 New
Avg.
Traditional
Vessels
NBV
Vessels
Deepwater
11
$26.4M
0
Towing Supply
14
$11.6M
0
Other
1
$6.5M
0
26
0
New
Avg.
Traditional
Vessels
NBV
Vessels
Deepwater
33
$28.5M
0
Towing Supply
41
$12.3M
2
Other
36
$1.8M
5
110
7
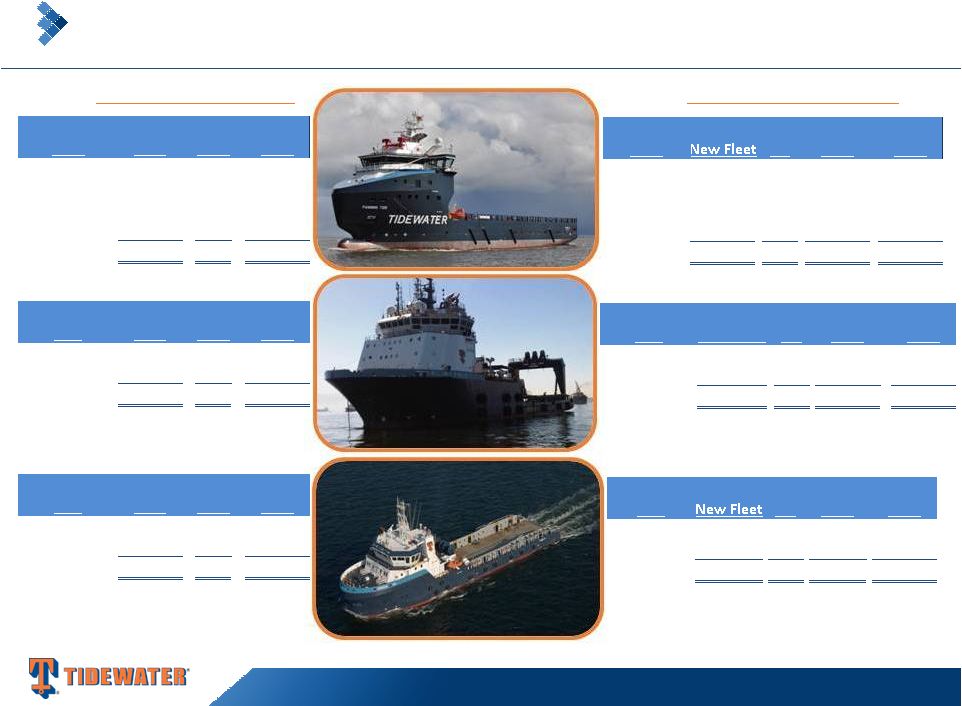
7
Scotia Howard Weil 43rd Annual Energy Conference
A New Fleet that Services All Water Depths
(Excludes stacked vessels –
as of 12/31/14)
New
Avg.
Traditional
Vessels
NBV
Vessels
Deepwater
35
20.6M
0
Towing Supply
19
$9.8M
4
Other
9
$3.2M
4
63
8
New
Avg.
Traditional
Vessels
NBV
Vessels
Deepwater
12
$17.5M
1
Towing Supply
31
$11.8M
0
Other
0
0
2
43
3
Americas
SSAE
MENA
Asia/Pac
Vessel count info is as of 12/31/14, and includes leased vessels. Avg NBV excludes
the impact of leased vessels which have no NBV. Average NBV of the total 18
Traditional vessels is $0.91M at 12/31/14. |
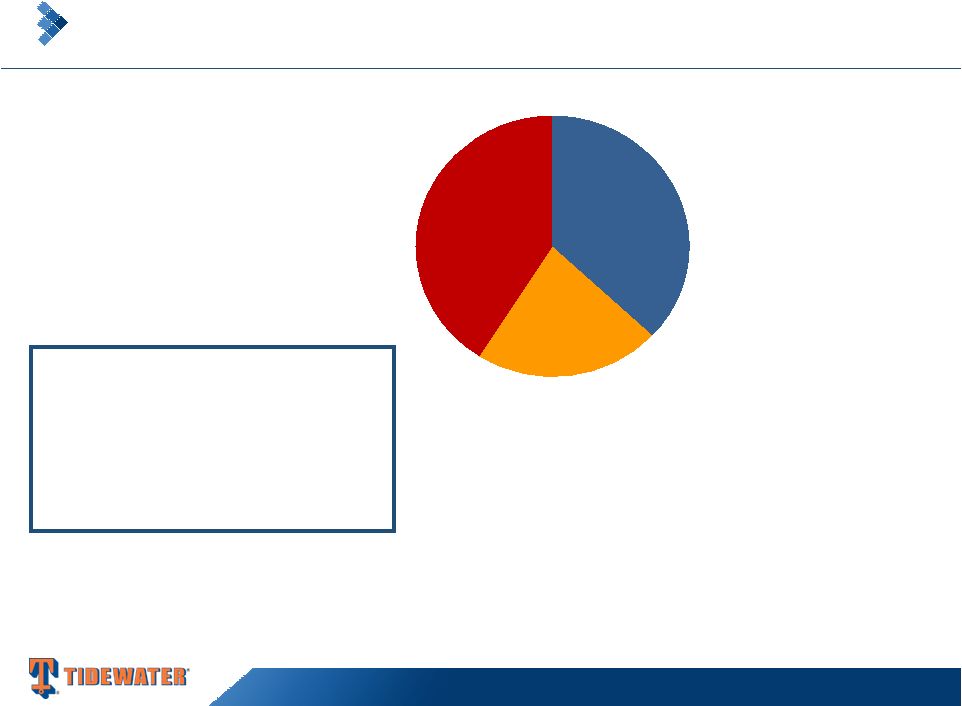 Super Majors
37%
NOC's
22%
Others
41%
Our top 10 customers in Fiscal 2014 (4 Super Majors, 4 NOC’s,
1 IOC’s and 1 independent) accounted for 62% of our revenue
8
Scotia Howard Weil 43rd Annual Energy Conference
Strong Customer Base
Current Revenue Mix
Approximately 60% of our
revenue is derived from drilling
support activity and 40% from
non-drilling related activity, such
as support of production and
construction activity |
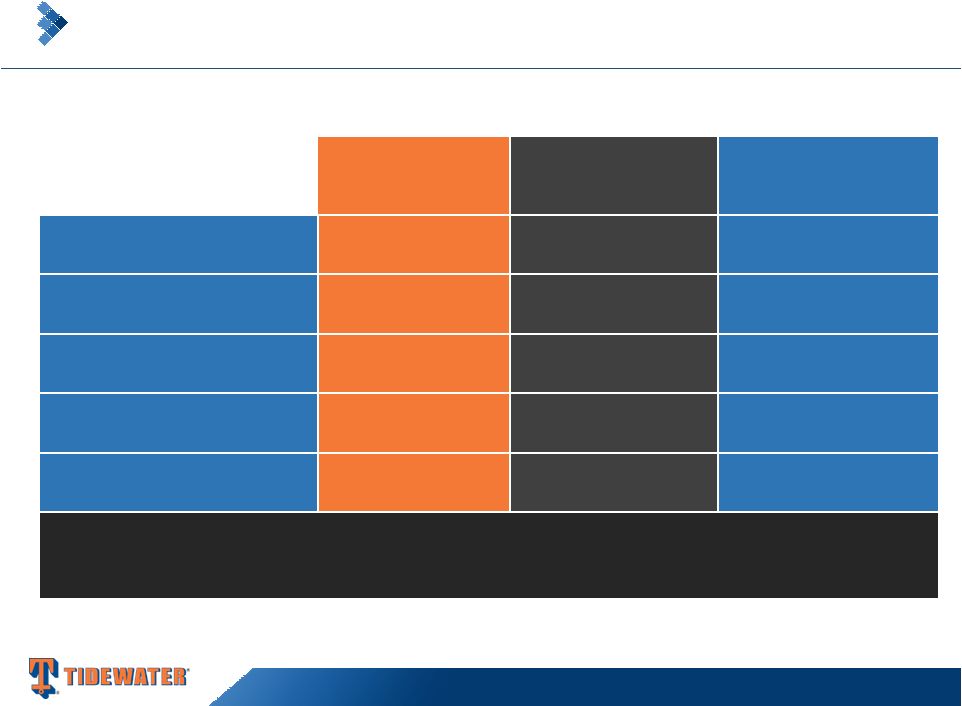 Vessel Count (2) Total Cost (2)
Average Cost
per Vessel
Deepwater PSVs
102
$2,900m
$28.4m
Deepwater AHTSs
12
$387m
$32.3m
Towing Supply/Supply
111
$1,667m
$15.0m
Other
53
$227m
$4.3m
TOTALS:
278
$5,181m
(1)
$18.6m
.
At 12/31/14, 250 new vessels were in our fleet with ~6.8 year average age
Vessel Commitments
Jan. ’00 –
December ‘14
(1)
~$4.68b (90%) funded through 12/31/14
(2)
Vessel count and total cost is net of 26 vessel dispositions ($243M of original
cost), and includes 28 vessels under construction (21 Deepwater PSVs, 6 Towing
Supply vessels and 1 “Other”) (2)
Vessel count and total cost is net of 25 vessel dispositions ($227m of original
cost) 9
Scotia Howard Weil 43rd Annual Energy Conference
The Largest Modern OSV Fleet in the Industry |
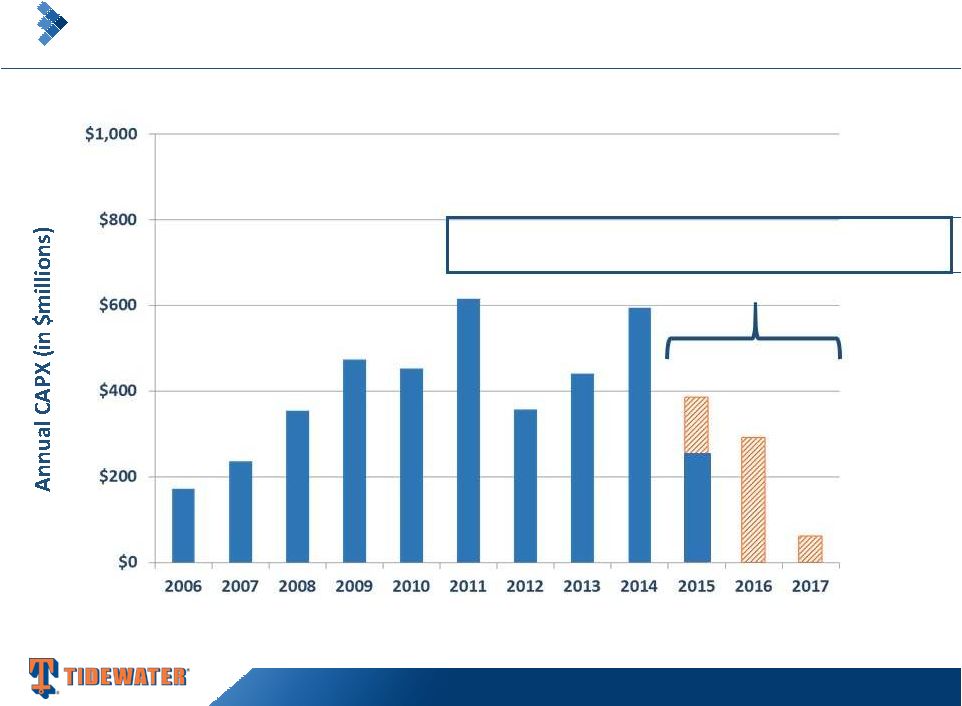 10
Scotia Howard Weil 43rd Annual Energy Conference
CAPX is Decreasing from Recent High Levels
Fiscal Year
Fiscal 2014 is exclusive of Troms acquisition
Amounts in Fiscal 2015-2017 represent known CAPX on only the
28 vessels and 2 ROVs under construction as of 12/31/14. |
 As of December
31, 2014 Cash & Cash Equivalents
$77 million
Total Debt
$1,491 million
Shareholders Equity
$2,503 million
Net Debt / Net Capitalization
36%
Total Debt / Capitalization
37%
~$675 million of available liquidity as of 12/31/14, including $600 million
of unused capacity under the company’s revolving credit facility.
11
Scotia Howard Weil 43rd Annual Energy Conference
Solid Balance Sheet and Financial Flexibility
Our Financial Position Provides Us Strategic Optionality |
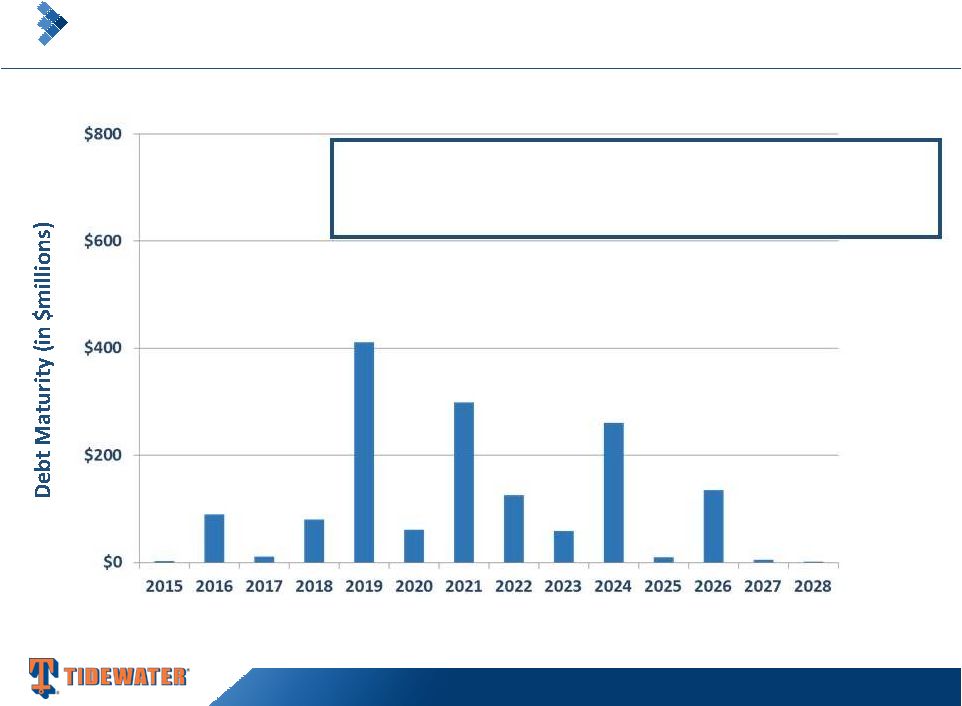 12
Scotia Howard Weil 43rd Annual Energy Conference
Debt Maturities and Covenants as of 12/31/14
Maturities Limited for Several Years
Fiscal Year
Debt Covenants:
1)
Debt/Total Capitalization Ratio of not greater than 55%
2)
EBITDA/Interest coverage of not less than 3.0X |
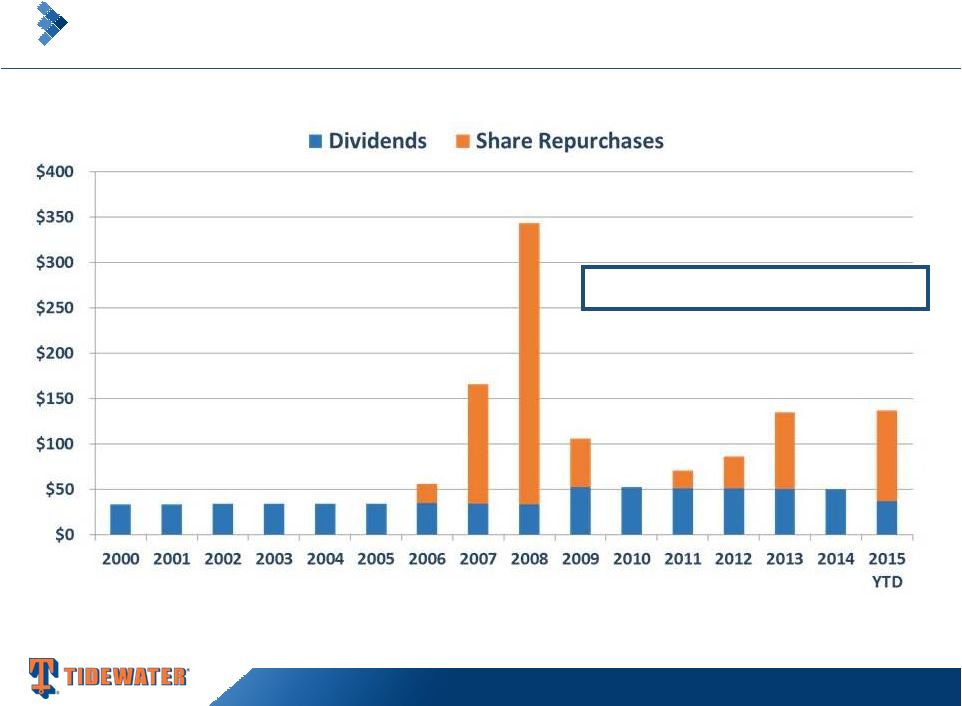 13
Scotia Howard Weil 43rd Annual Energy Conference
Return Capital to Shareholders
Consistent Dividends and Opportunistic Share Repurchases
(in millions)
Fiscal Years
~4.5% Current Dividend Yield |
 Continue to
improve upon stellar safety and compliance programs Maintain solid balance sheet and
financial flexibility to deal with industry uncertainties and seize opportunities when
presented Return capital to shareholders through dividends and
opportunistic share repurchases
14
Scotia Howard Weil 43rd Annual Energy Conference
Tidewater’s Strategy
Stay close to our customers
Monitor industry developments to adjust our playbook accordingly
-
Cost reduction initiatives
-
Maintain/protect liquidity |
 NEW ORLEANS,
LOUISIANA Worldwide Headquarters
Tidewater Inc.
Pan American Life Center
601 Poydras Street, Suite 1500
New Orleans, Louisiana 70130
P: +1 504 568 1010
HOUSTON, TEXAS
Tidewater Marine, L.L.C.
6002 Rogerdale Road
Suite 600
Houston, Texas 77072-1655
P: +1 713 470 5300
www.tdw.com |
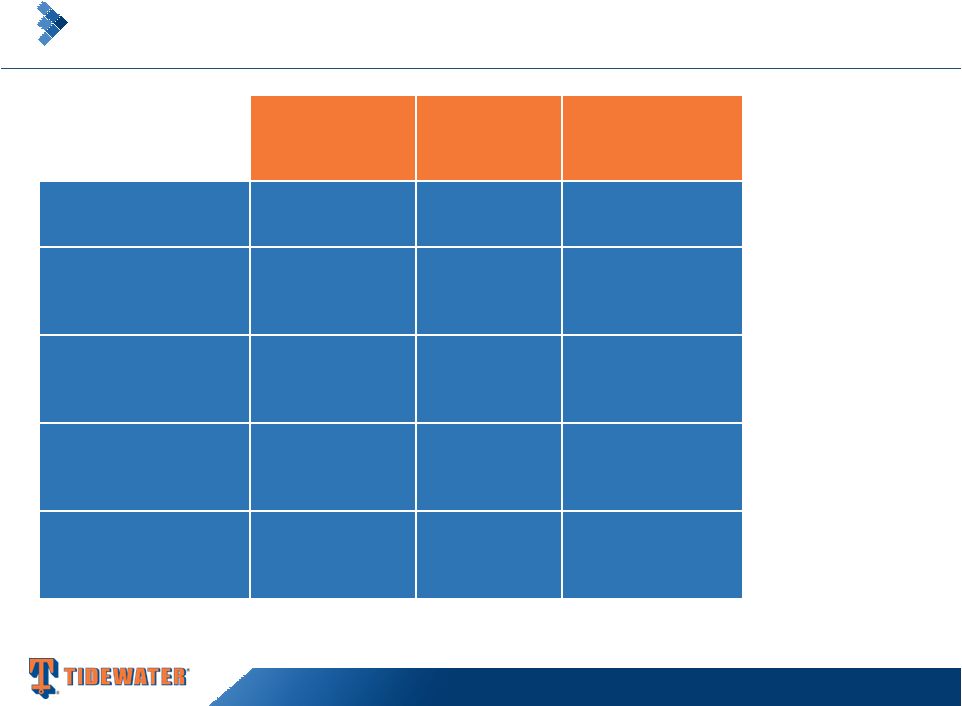 Source: ODS-Petrodata and Tidewater
July 2008
(Peak)
Jan. 2011
(Trough)
March
2015
Working Rigs
603
538
679
Rigs Under
Construction
186
118
217
OSV Global
Population
2,033
2,599
3,267
OSV’s Under
Construction
736
367
437
OSV/Rig Ratio
3.37
4.83
4.81
16
Scotia Howard Weil 43rd Annual Energy Conference
Drivers of our Business “Peak to Present” |
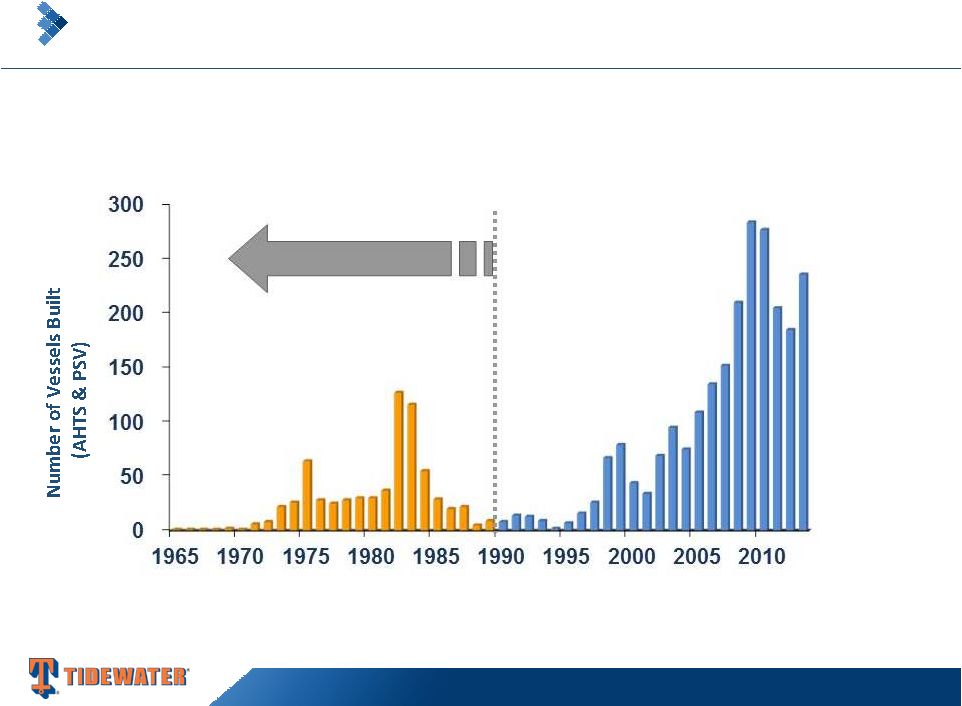 Source: ODS-Petrodata and Tidewater
As of March 2015, there are approximately 437 additional AHTS
and PSV’s (~14% of the global fleet) under construction.
Global fleet is estimated at 3,267 vessels, including ~700
vessels that are 25+ yrs old (22%). 17
Scotia Howard Weil 43rd Annual Energy Conference
The Worldwide OSV Fleet
(Includes AHTs and PSVs only) Estimated as of March 2015
Vessels > 25 years old today |
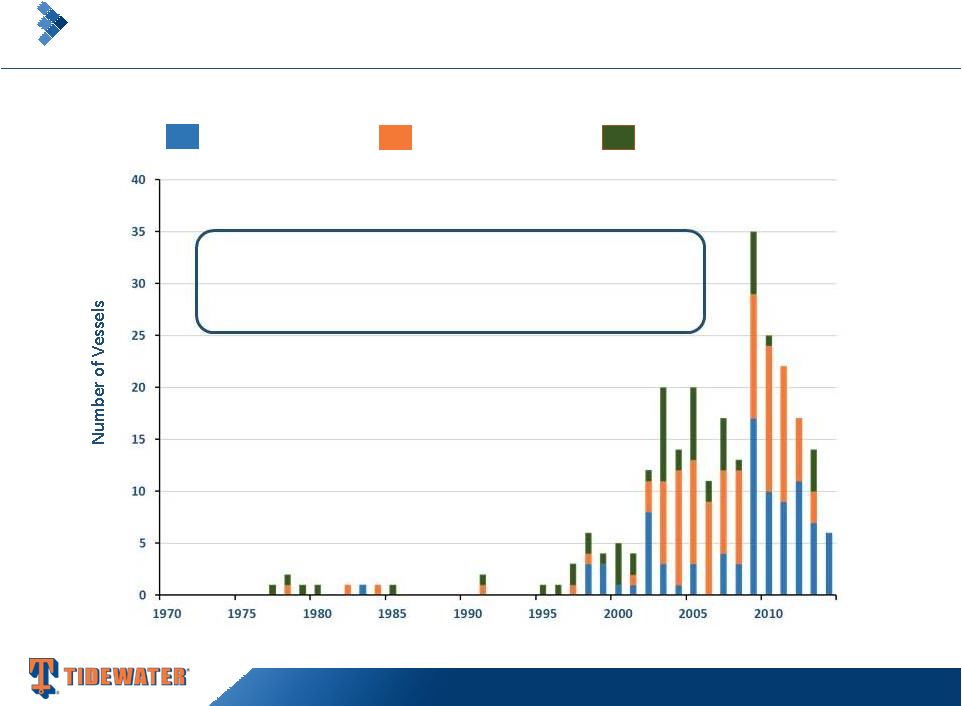 Year
Built Deepwater vessels
Towing Supply/Supply
Other vessels
242 “New”
vessels –
6.6 avg yrs
18 “Traditional”
vessels –
25.8 avg yrs
(only 7 OSVs)
18
Scotia Howard Weil 43rd Annual Energy Conference
Tidewater’s Active Fleet
As of December 31, 2014 |
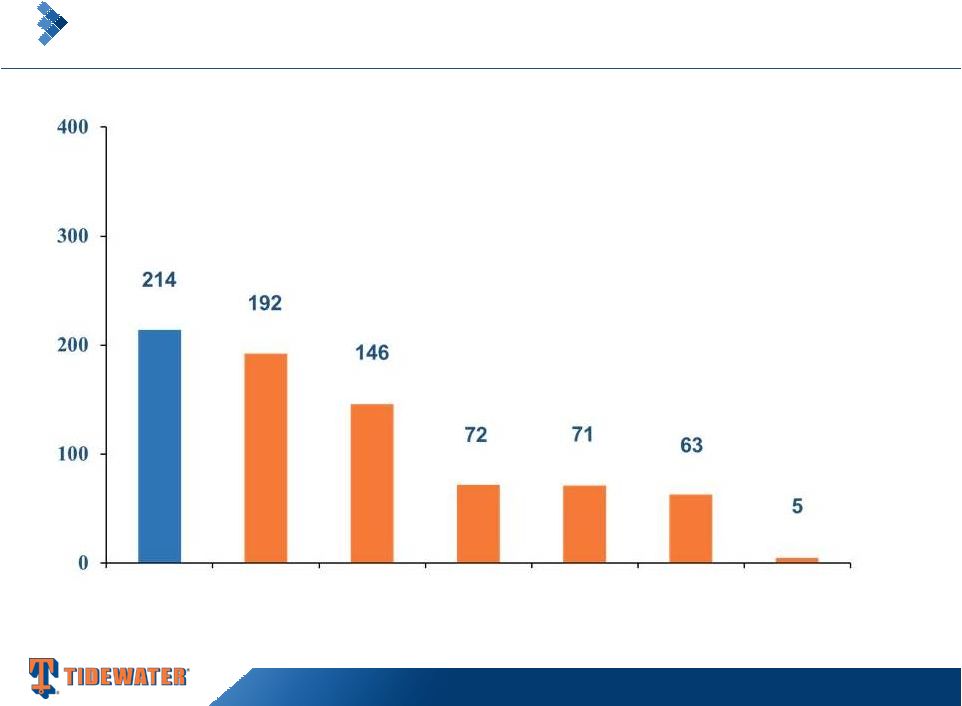 Source: ODS-Petrodata and Tidewater
Tidewater
Competitor #2
Competitor #3
Competitor #4
Competitor # 5
Competitor #1
Avg.
All Others (2,509 total
vessels for
400+ owners)
19
Scotia Howard Weil 43rd Annual Energy Conference
Vessel Population by Owner
(AHTs and PSVs only) Estimated as of March 2015 |
 20
Scotia Howard Weil 43rd Annual Energy Conference
The Upgrading of the Tidewater Fleet
(A 10 Year Review)
Deepwater PSV
Deepwater PSV
Deepwater AHTS
Deepwater AHTS
Towing Supply
Towing Supply
Fleet information includes active vessels only.
CIP=Construction in Process.
New Fleet is defined as vessels built or acquired since 2000.
Current
Future
Vintage
DWT
CIP
Fleet
Fleet
5,000-6,000
16
5
21
0
4,000-4,999
14
12
26
0
3,000-3,999
44
4
48
0
<3,000
5
0
5
1
79
21
100
1
Current
Future
Vintage
BHP
New Fleet
CIP
Fleet
Fleet
25,000+
5
0
5
0
13,500-16,500
7
0
7
0
12
0
12
0
Current
Future
Vintage
BHP
CIP
Fleet
Fleet
7,000-10,000
36
6
42
0
3,000-6,999
69
0
69
6
105
6
111
6
New
Vintage
Total
DWT
Fleet
Fleet
Fleet
5,000-6,000
0
0
0
4,000-4,999
4
0
4
3,000-3,999
12
2
14
<3,000
6
4
10
22
6
28
New
Vintage
Total
BHP
Fleet
Fleet
Fleet
25,000+
1
0
1
13,500-16,500
6
3
9
7
3
10
New
Vintage
Total
BHP
Fleet
Fleet
Fleet
7,000-10,000
5
25
30
3,000-6,999
23
146
169
28
171
199
3/31/05 Snapshot
12/31/14 Snapshot |
 Count
Deepwater PSVs
21
Deepwater AHTSs
-
Towing Supply/Supply
6
Other
1
Total
28
Vessels Under Construction*
As of December 31, 2014
Estimated
delivery
schedule
–
4
remaining
in
FY
’15,
18
in
FY
‘16
and
6
thereafter.
CAPX of $153m remaining in FY ’15, $257m in FY ‘16 and $61m
thereafter. 21
Scotia Howard Weil 43rd Annual Energy Conference
…and More to Come |
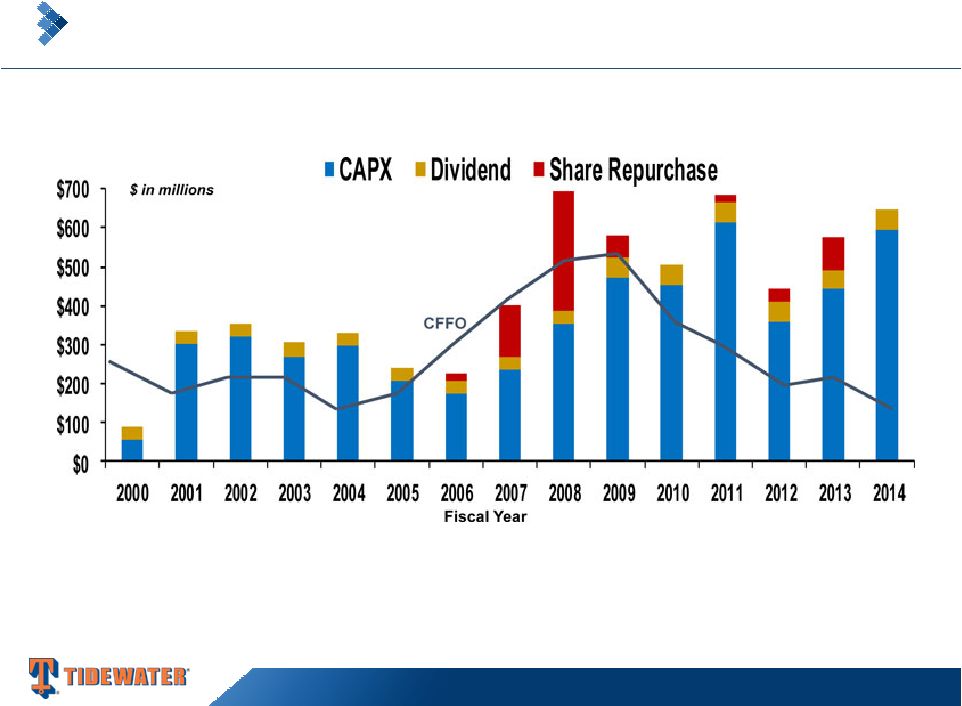 Over
a 15-year period, Tidewater has invested ~$5.2 billion in CapEx, and paid out ~$1.3 billion through
dividends and share repurchases. Over the same period, CFFO and
proceeds from dispositions were ~$3.9
billion and ~$800 million, respectively.
22
Scotia Howard Weil 43rd Annual Energy Conference
Fleet Renewal & Expansion Largely Funded by CFFO |
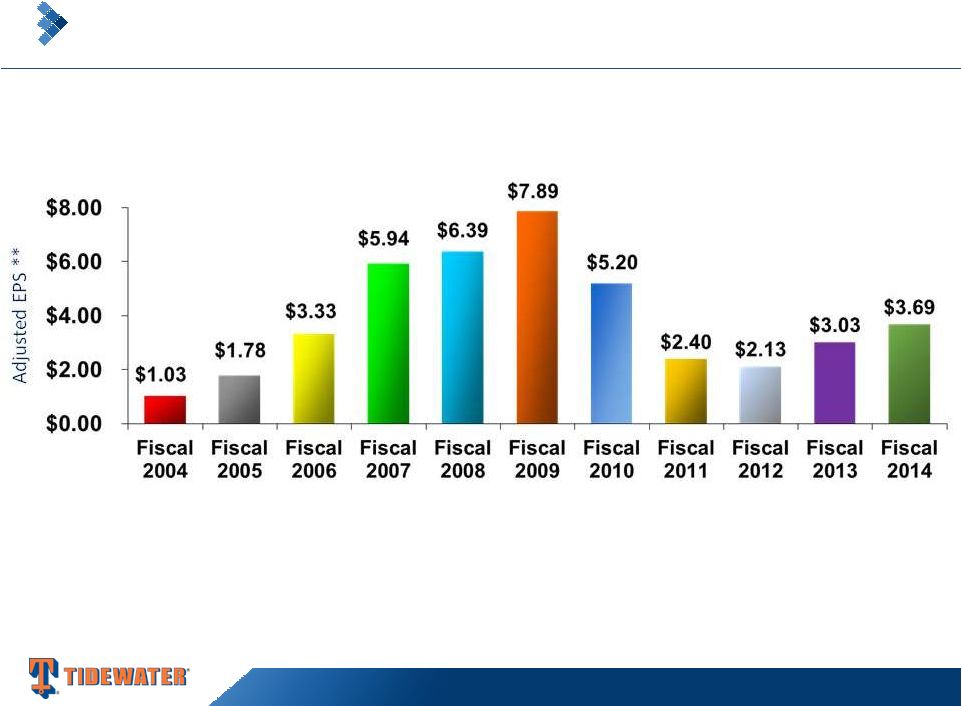 **
EPS in Fiscal 2004 is exclusive of the $.30 per share after tax impairment
charge. EPS in Fiscal 2006 is exclusive of the $.74 per share after tax gain from the
sale of six KMAR vessels. EPS in Fiscal 2007 is exclusive of $.37 per share of after
tax gains from the sale of 14 offshore tugs. EPS in Fiscal 2010 is
exclusive of $.66 per share Venezuelan provision, a $.70 per share tax benefit
related to favorable resolution of tax litigation and a $0.22 per share charge for
the proposed settlement with the SEC of the company’s FCPA matter. EPS in Fiscal
2011 is exclusive of total $0.21 per share charges for settlements with DOJ
and Government of Nigeria for FCPA matters, a $0.08 per share charge related to participation in a multi-company U.K.-based pension plan and a $0.06
per share impairment charge related to certain vessels. EPS in Fiscal 2012 is
exclusive of $0.43 per share goodwill impairment charge. EPS in Fiscal 2014 is
exclusive of $0.87 per share goodwill impairment charge.
Adjusted Return
On Avg. Equity 4.3% 7.2%
12.4%
18.9% 18.3%
19.5% 11.4% 5.0%
4.3% 5.9% 7.0%
Adjusted EPS**
Adjusted EPS**
23
Scotia Howard Weil 43rd Annual Energy Conference
History of Solid Earnings and Returns on a Through-Cycle Basis |
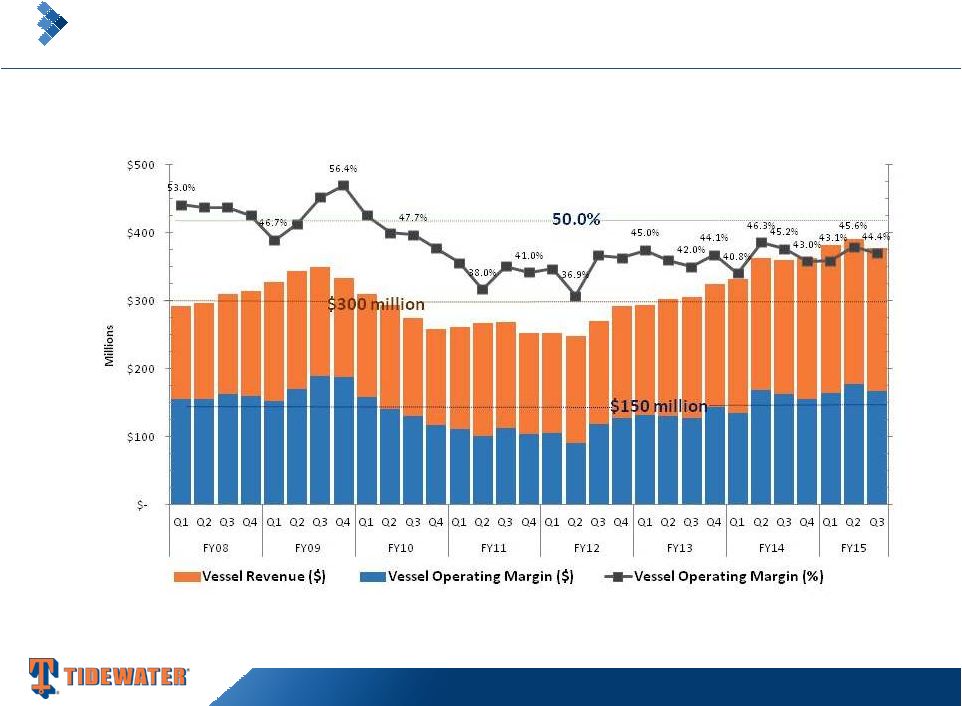 Note: Vessel operating margin is defined as vessel revenue less
vessel operating expenses
Prior peak period (FY2009)
averaged quarterly revenue of
$339M, quarterly operating
margin of $175.6M at 51.8%
24
Scotia Howard Weil 43rd Annual Energy Conference
Total Revenue and Margin
Fiscal 2008-2015 |
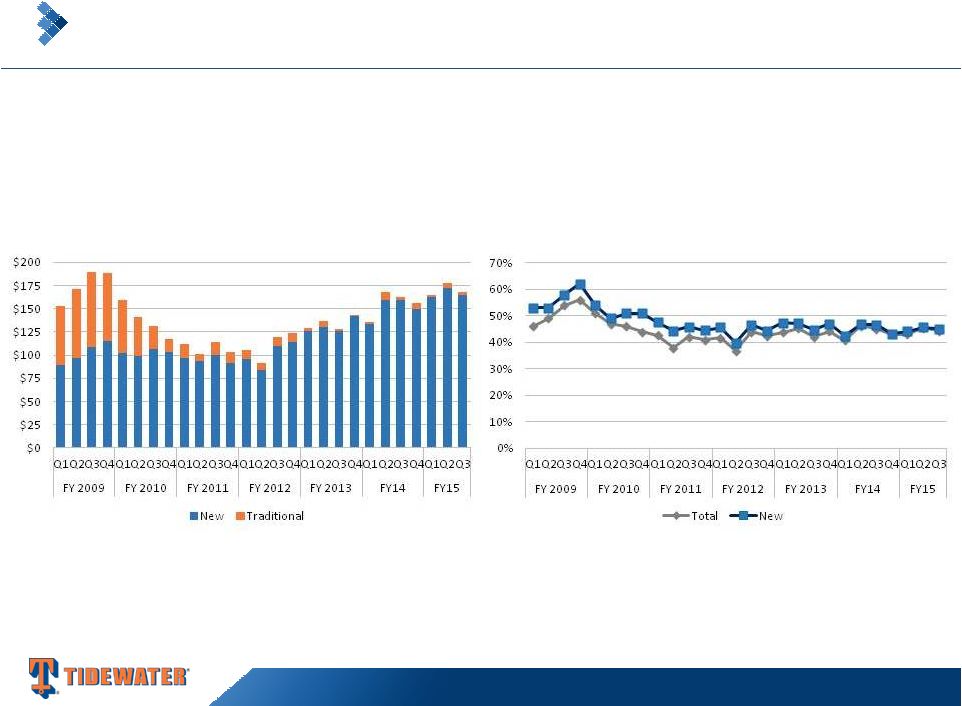 Vessel Cash Operating Margin ($)
Vessel Cash Operating Margin (%)
$168 million Vessel Margin in Q3
FY2015 (98% from New Vessels)
Q3 FY2015 Vessel Margin: 44%
25
Scotia Howard Weil 43rd Annual Energy Conference
Historical Vessel Cash Operating Margins |
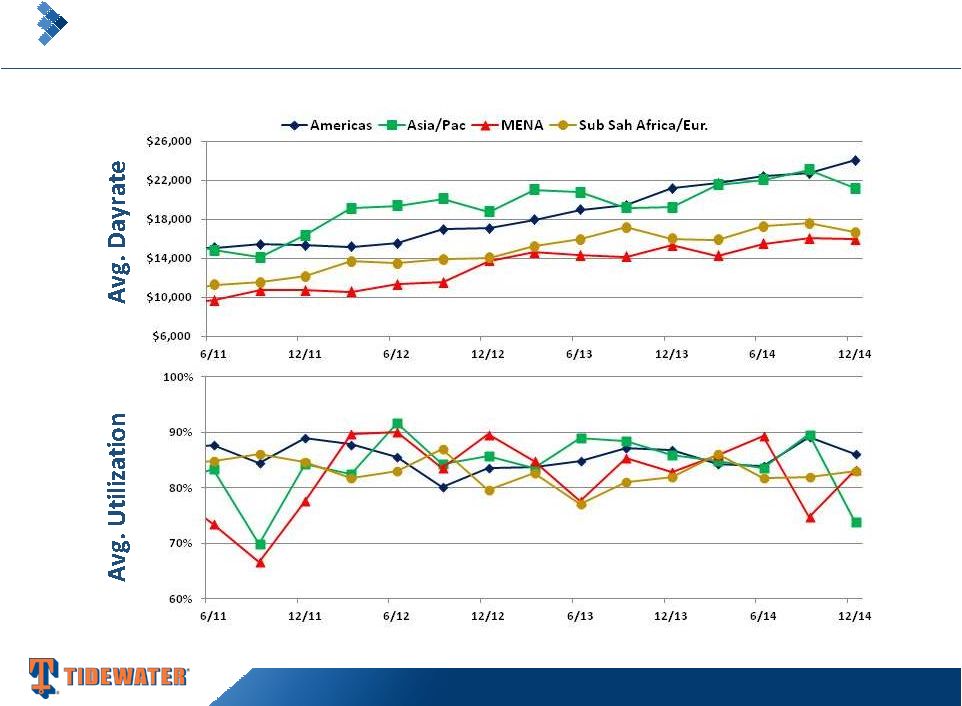 Utilization
stats exclude stacked vessels. 26
Scotia Howard Weil 43rd Annual Energy Conference
Active Vessel Dayrates & Utilization by Segment |
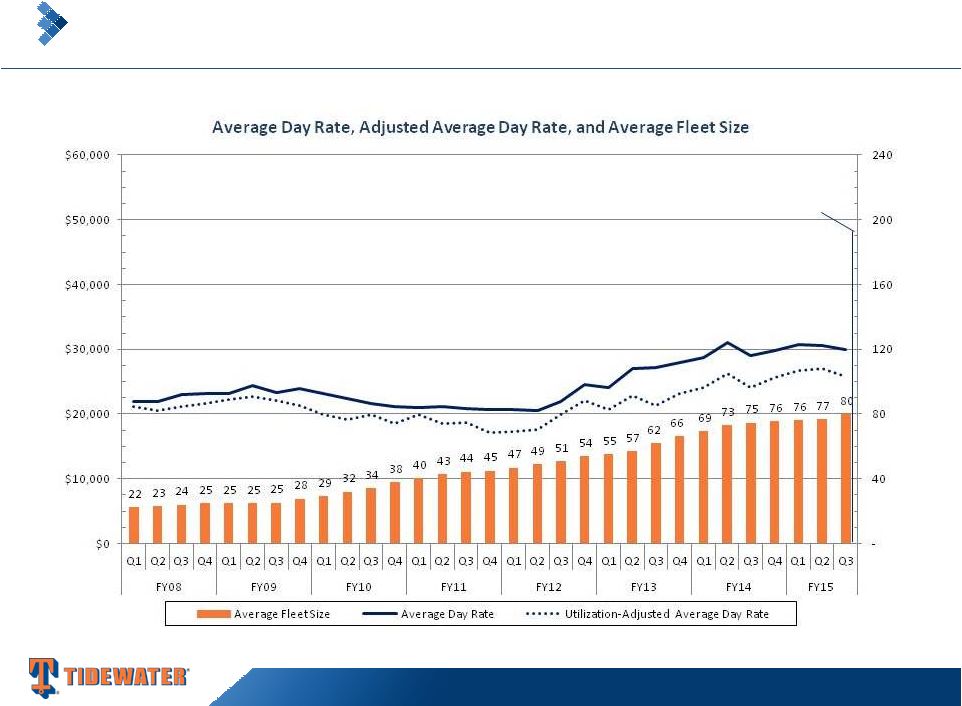 Q3
Fiscal 2015 Avg Day Rate: $29,929
Utilization: 86.1%
$189 million, or 50%, of Vessel Revenue in Q3 Fiscal 2015
27
Scotia Howard Weil 43rd Annual Energy Conference
New Vessel Trends by Vessel Type
Deepwater PSVs |
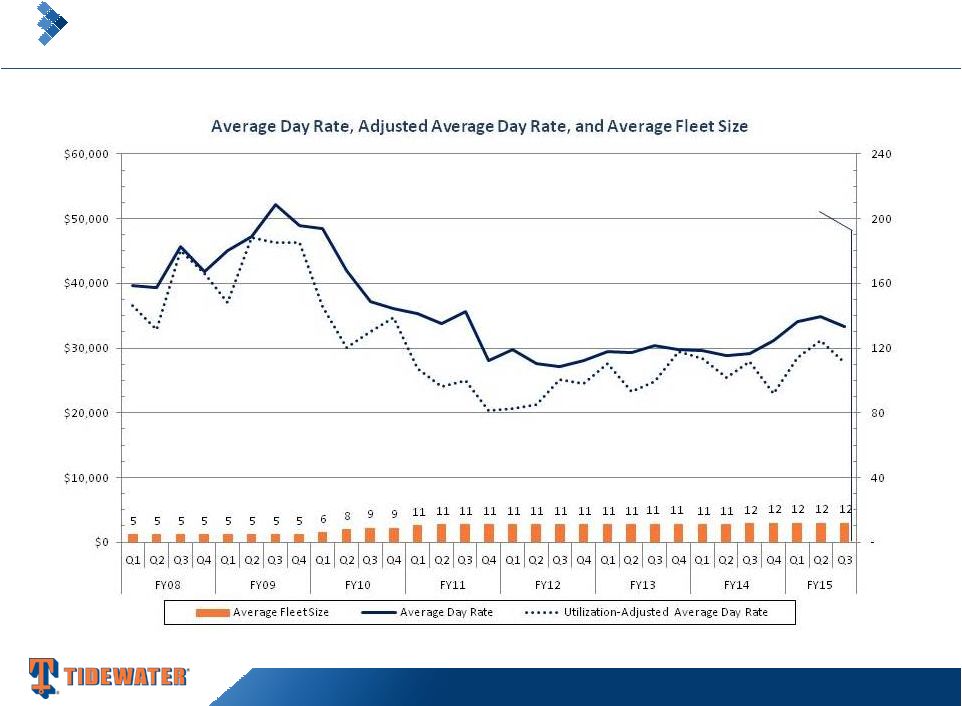 Q3
Fiscal 2015 Avg Day Rate: $33,375
Utilization: 83.0%
$31 million, or 8%, of Vessel Revenue in Q3 Fiscal 2015
28
Scotia Howard Weil 43rd Annual Energy Conference
New Vessel Trends by Vessel Type
Deepwater AHTS |
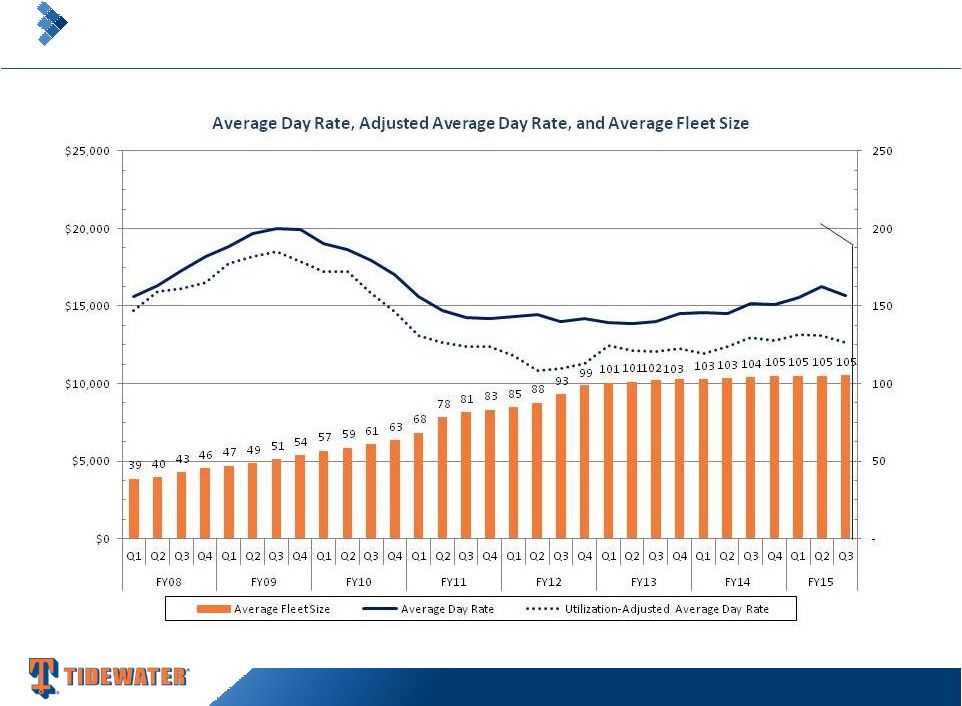 Q3
Fiscal 2015 Avg Day Rate: $15,647
Utilization: 80.8%
$122 million, or 32%, of Vessel Revenue in Q3 Fiscal 2015
29
Scotia Howard Weil 43rd Annual Energy Conference
New Vessel Trends by Vessel Type
Towing Supply/Supply Vessels |
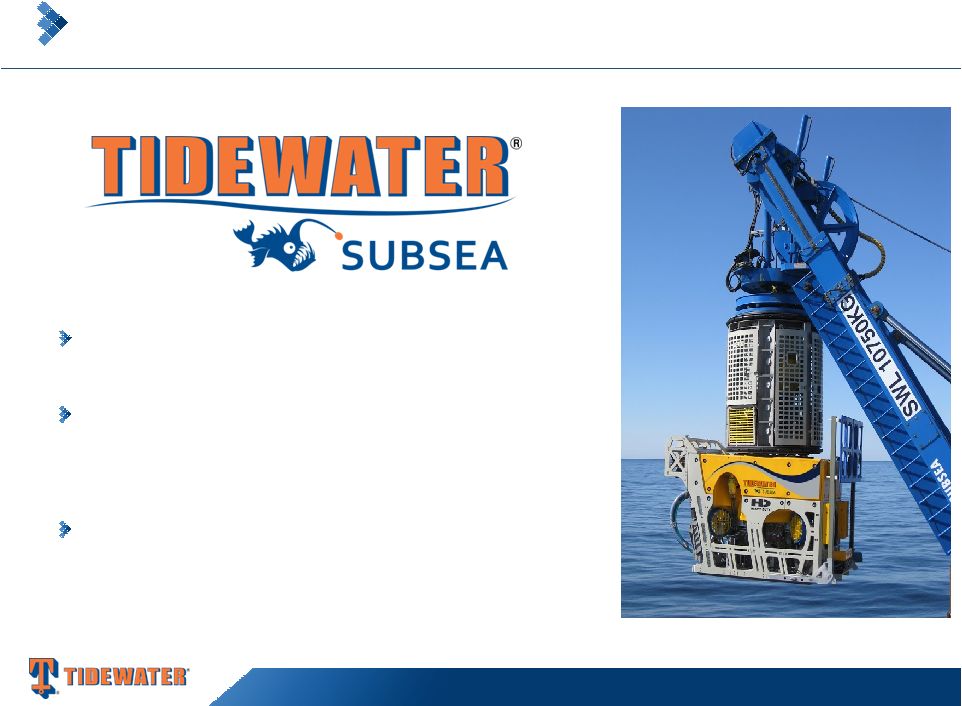 Six
work-class ROV’s in current fleet and two more on order
Commercial operations underway with
additional opportunities in Americas,
SSAE and Asia/Pac
ROV capabilities generating potential
for OSV pull through
30
Scotia Howard Weil 43rd Annual Energy Conference
Tidewater’s New Subsea Business |