Attached files
| file | filename |
|---|---|
| 8-K - 8-K - BBVA USA Bancshares, Inc. | bbvacompass8-k20150324.htm |
Fourth Quarter 2014 Fixed Income Investor Meetings
“Safe Harbor” Forward Looking Statements The following should be read in conjunction with the financial statements, notes and other information contained in BBVA Compass Bancshares, Inc.’s (BBVA Compass) Annual Report on Form 10-K, Quarterly Reports on Form 10-Q and Current Reports on Form 8-K. This presentation includes non-GAAP financial measures to describe BBVA Compass’ performance. Reconciliation of those non- GAAP measures are provided within or in the appendix of this presentation. Additionally, certain ratios are presented on an annualized basis for comparison, which is the preferred industry standard. Certain statements in this presentation may contain forward-looking statements about BBVA Compass and its industry that involve substantial risks and uncertainties. Statements other than statements of current or historical fact, including statements regarding our future financial condition, results of operations, business plans, liquidity, cash flows, projected costs, and the impact of any laws or regulations applicable to BBVA Compass, constitute forward-looking statements as defined by the Private Securities Litigation Reform Act of 1995. Words such as “anticipates,” “believes,” “estimates,” “expects,” “forecasts,” “intends,” “plans,” “projects,” “may,” “will,” “should,” and other similar expressions are intended to identify these forward-looking statements. These forward-looking statements reflect BBVA Compass’ views regarding future events and financial performance. Such statements are subject to risks, uncertainties, assumptions and other important factors, many of which may be beyond BBVA Compass’ control, that could cause actual results to differ materially from anticipated results. If BBVA Compass’ assumptions and estimates are incorrect, or if BBVA Compass becomes subject to significant limitations as the result of litigation or regulatory action, then BBVA Compass’ actual results could vary materially from those expressed or implied in these forward-looking statements. The forward-looking statements are and will be based on BBVA Compass’ then current views and assumptions regarding future events and speak only as of their dates made. BBVA Compass assumes no obligation to update any forward-looking statement, whether as a result of new information, future events or otherwise, except as required by securities law. For further information regarding risks and uncertainties associated with BBVA Compass’ business, please refer to the “Risk Factors” section of BBVA Compass’ Annual Report on Form 10-K filed with the U.S. Securities and Exchange Commission on March 11, 2015, as updated by BBVA Compass’ subsequent SEC filings. 2
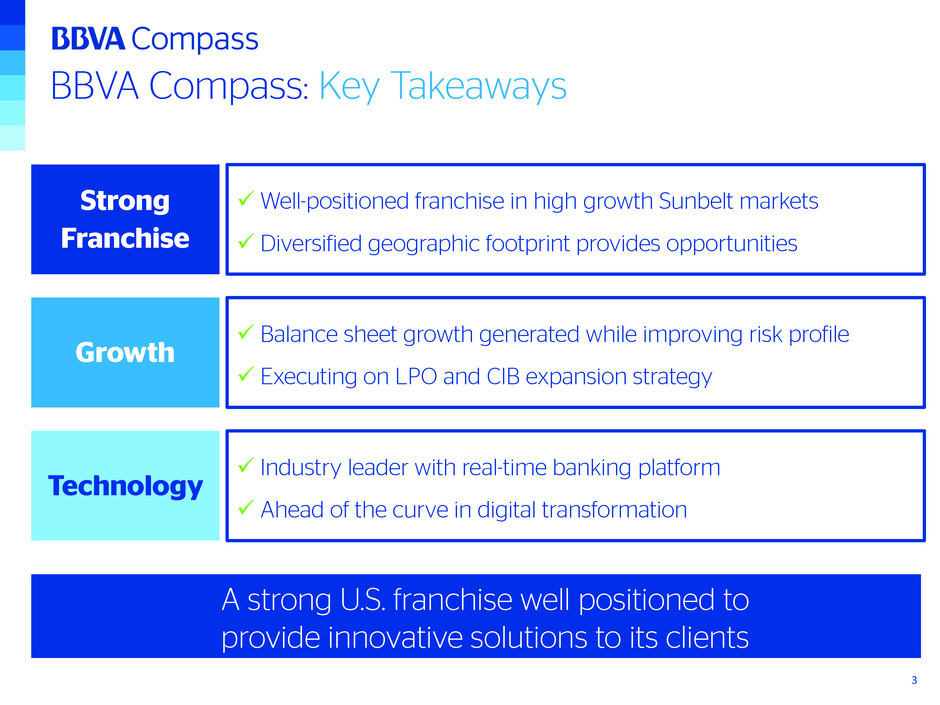
BBVA Compass: Key Takeaways Strong Franchise Well-positioned franchise in high growth Sunbelt markets Diversified geographic footprint provides opportunities Growth Balance sheet growth generated while improving risk profile Executing on LPO and CIB expansion strategy Technology Industry leader with real-time banking platform Ahead of the curve in digital transformation A strong U.S. franchise well positioned to provide innovative solutions to its clients 3
Sections 1 Appendix: GAAP Reconcilement 2 Financial Performance 3 Loan Portfolio Overview4 Asset Quality Metrics 5 7 Capital and Capital Planning BBVA Compass Strategic Overview 6 Liquidity and Funding 4
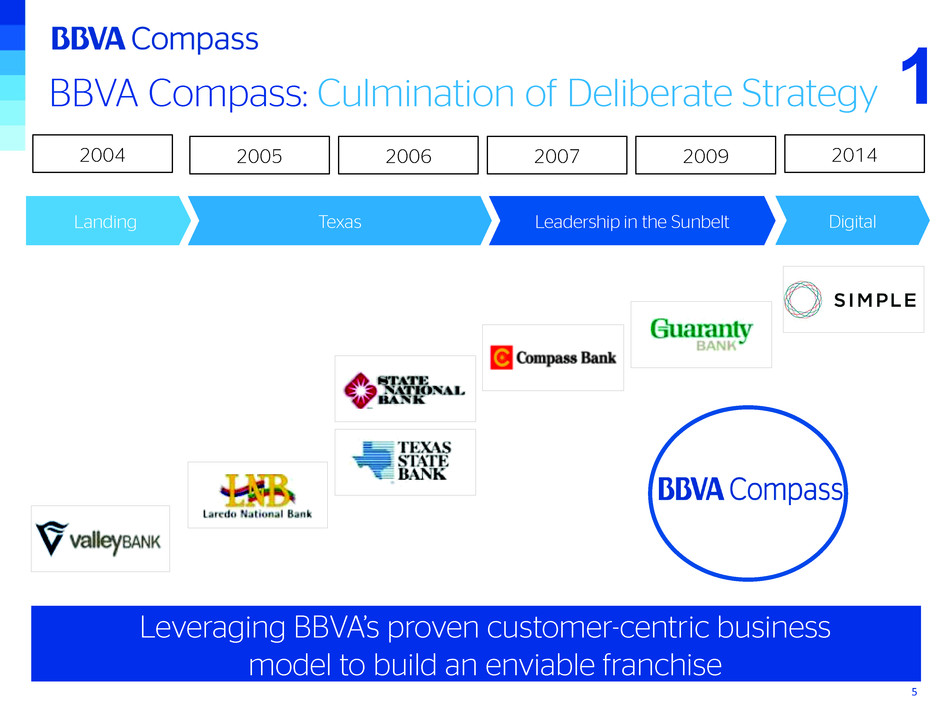
Landing 2006 2007 20092005 DigitalTexas Leadership in the Sunbelt BBVA Compass: Culmination of Deliberate Strategy Leveraging BBVA’s proven customer-centric business model to build an enviable franchise 2004 2014 1 5
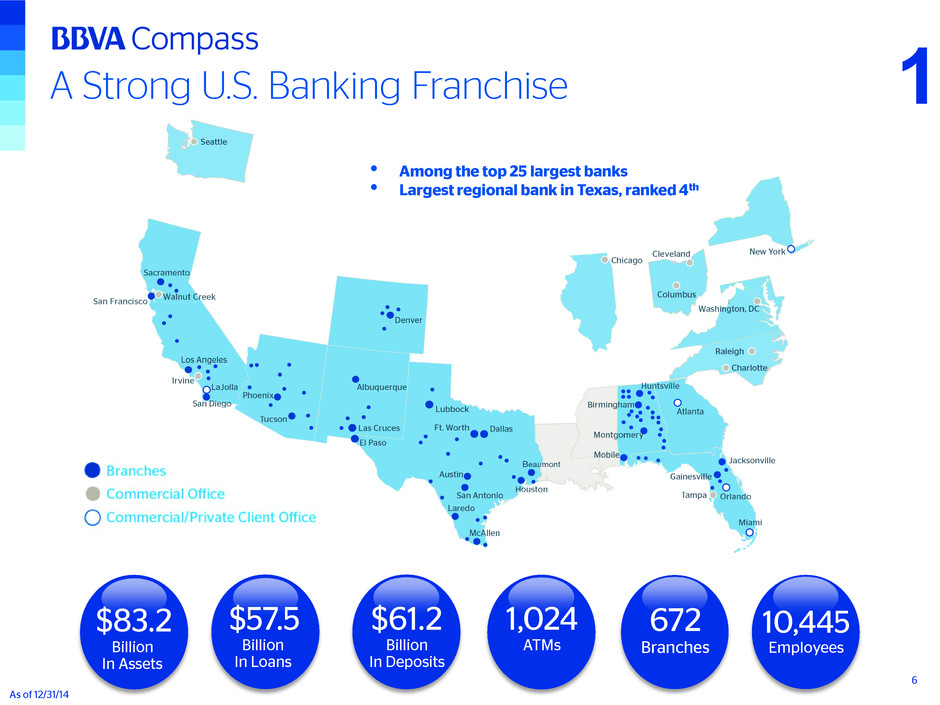
A Strong U.S. Banking Franchise 672 Branches $61.2 Billion In Deposits $57.5 Billion In Loans 10,445 Employees $83.2 Billion In Assets As of 12/31/14 6 1,024 ATMs 1 • Among the top 25 largest banks • Largest regional bank in Texas, ranked 4th
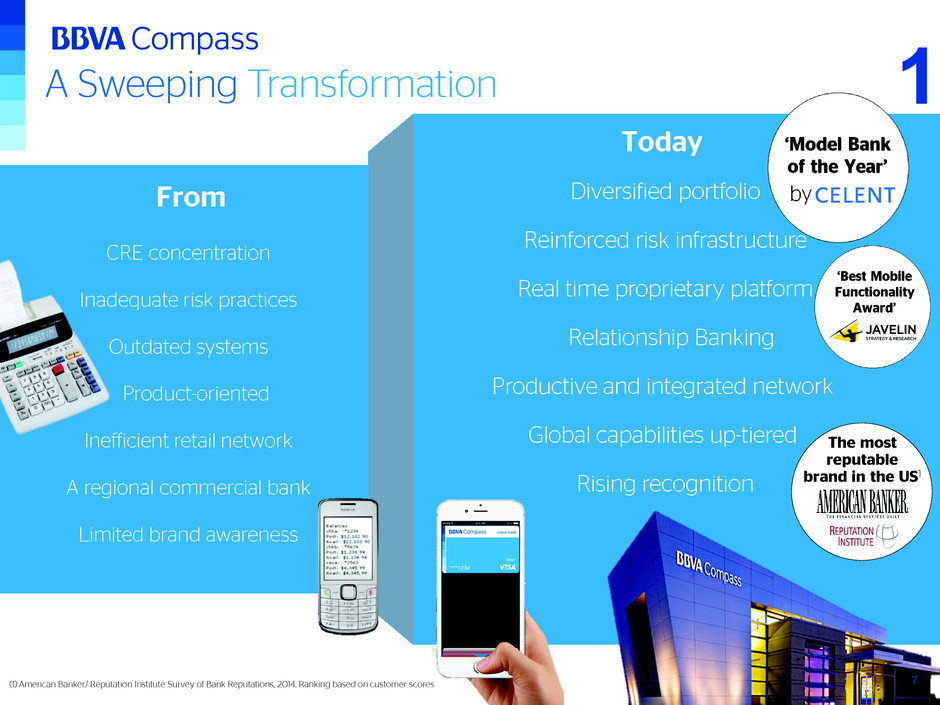
A Sweeping Transformation CRE concentration Product-oriented Inadequate risk practices Outdated systems Limited brand awareness Inefficient retail network A regional commercial bank From Today Diversified portfolio Relationship Banking Reinforced risk infrastructure Real time proprietary platform Rising recognition Productive and integrated network Global capabilities up-tiered The most reputable brand in the US1 (1) American Banker/ Reputation Institute Survey of Bank Reputations, 2014. Ranking based on customer scores 1 7
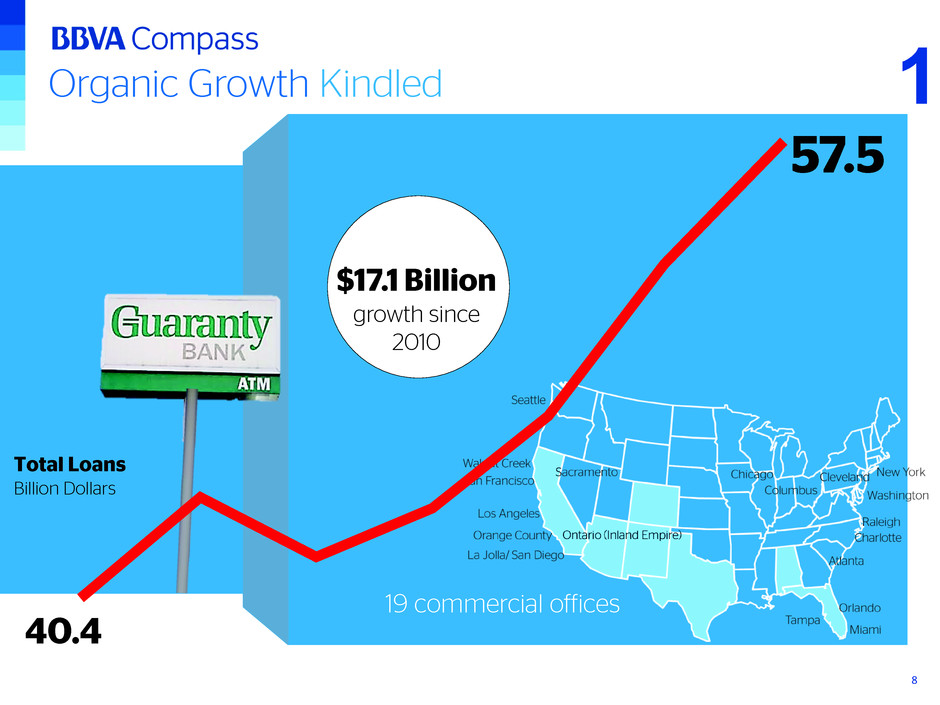
57.5 Organic Growth Kindled 40.4 $17.1 Billion growth since 2010 19 commercial offices Total Loans Billion Dollars 1 82008 2009 2010 2011 2012 2013 2014
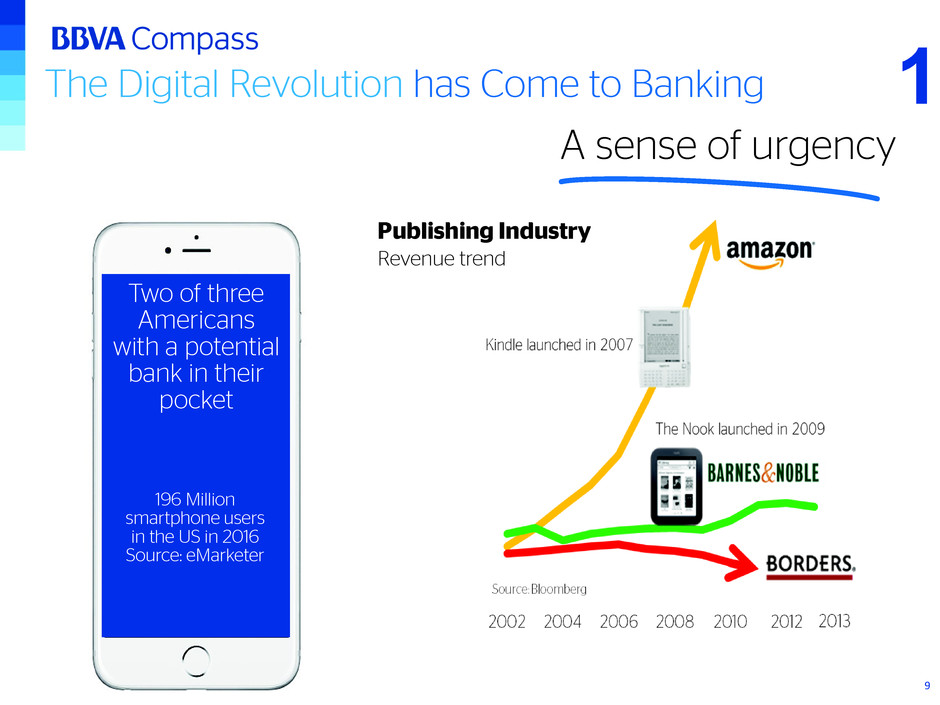
The Digital Revolution has Come to Banking Two of three Americans with a potential bank in their pocket 196 Million smartphone users in the US in 2016 Source: eMarketer A sense of urgency Publishing Industry Revenue trend 1 9

One of the Largest Mobile Platforms 1 10
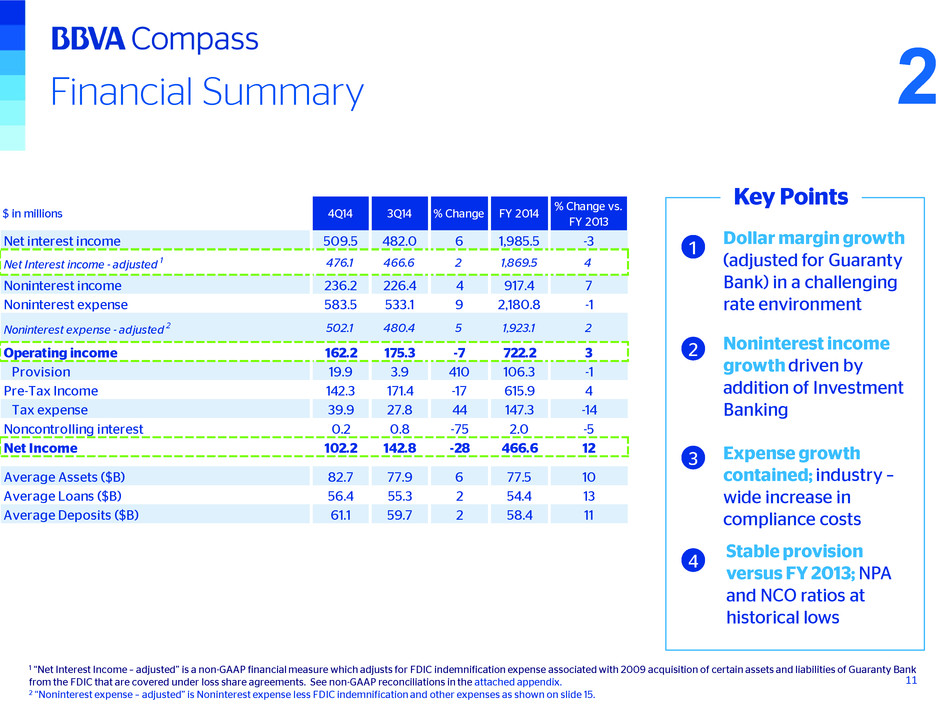
Financial Summary Dollar margin growth (adjusted for Guaranty Bank) in a challenging rate environment Stable provision versus FY 2013; NPA and NCO ratios at historical lows Noninterest income growth driven by addition of Investment Banking Key Points Expense growth contained; industry – wide increase in compliance costs 1 2 3 4 1 “Net Interest Income – adjusted” is a non-GAAP financial measure which adjusts for FDIC indemnification expense associated with 2009 acquisition of certain assets and liabilities of Guaranty Bank from the FDIC that are covered under loss share agreements. See non-GAAP reconciliations in the attached appendix. 2 “Noninterest expense – adjusted” is Noninterest expense less FDIC indemnification and other expenses as shown on slide 15. 11 2 $ in millions 4Q14 3Q14 % Change FY 2014 % Change vs. FY 2013 Net interest income 509.5 482.0 6 1,985.5 -3 Net Interest income - adjusted 1 476.1 466.6 2 1,869.5 4 Noninterest income 236.2 226.4 4 917.4 7 Noninterest expense 583.5 533.1 9 2,180.8 -1 Noninterest expense - adjusted 2 502.1 480.4 5 1,923.1 2 Operating income 162.2 175.3 -7 722.2 3 Provision 19.9 3.9 410 106.3 -1 Pre-Tax Income 142.3 171.4 -17 615.9 4 Tax expense 39.9 27.8 44 147.3 -14 Noncontrolling interest 0.2 0.8 -75 2.0 -5 Net Income 102.2 142.8 -28 466.6 12 Average Assets ($B) 82.7 77.9 6 77.5 10 Average Loans ($B) 56.4 55.3 2 54.4 13 Average Deposits ($B) 61.1 59.7 2 58.4 11
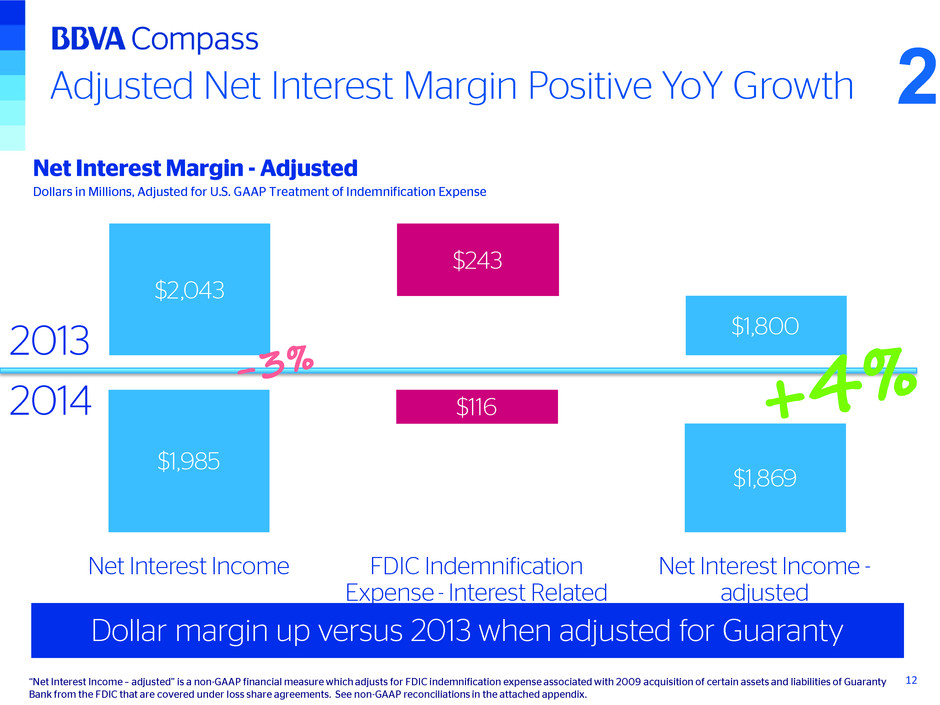
$1,985 $1,869 $116 Net Interest Income FDIC Indemnification Expense - Interest Related Net Interest Income - adjusted $2,043 $1,800 $243 Adjusted Net Interest Margin Positive YoY Growth Dollar margin up versus 2013 when adjusted for Guaranty 12 Net Interest Margin - Adjusted Dollars in Millions, Adjusted for U.S. GAAP Treatment of Indemnification Expense 2014 2013 “Net Interest Income – adjusted” is a non-GAAP financial measure which adjusts for FDIC indemnification expense associated with 2009 acquisition of certain assets and liabilities of Guaranty Bank from the FDIC that are covered under loss share agreements. See non-GAAP reconciliations in the attached appendix. 2
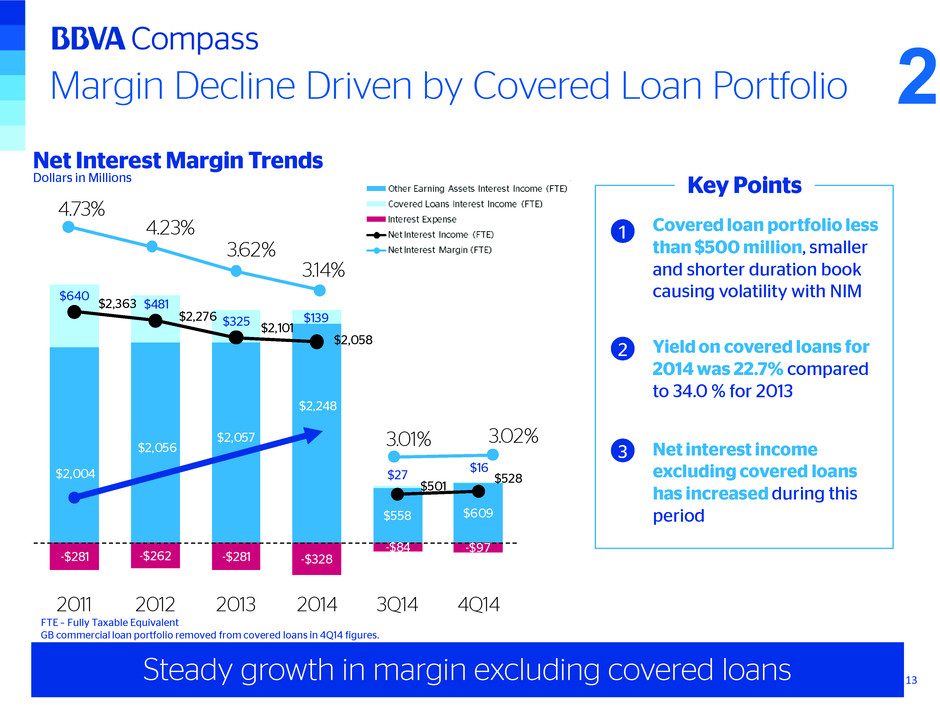
Margin Decline Driven by Covered Loan Portfolio Covered loan portfolio less than $500 million, smaller and shorter duration book causing volatility with NIM Key Points Net interest income excluding covered loans has increased during this period 1 2 Steady growth in margin excluding covered loans 13 Net Interest Margin Trends Dollars in Millions FTE – Fully Taxable Equivalent GB commercial loan portfolio removed from covered loans in 4Q14 figures. Yield on covered loans for 2014 was 22.7% compared to 34.0 % for 2013 3 2 $2,004 $2,056 $2,057 $2,248 $558 $609 $640 $481 $325 $139 $27 $16 -$281 -$262 -$281 -$328 -$84 -$97 $2,363 $2,276 $2,101 $2,058 $501 $528 2011 2012 2013 2014 3Q14 4Q14 4.73% 4.23% 3.62% 3.14% 3.01% 3.02%
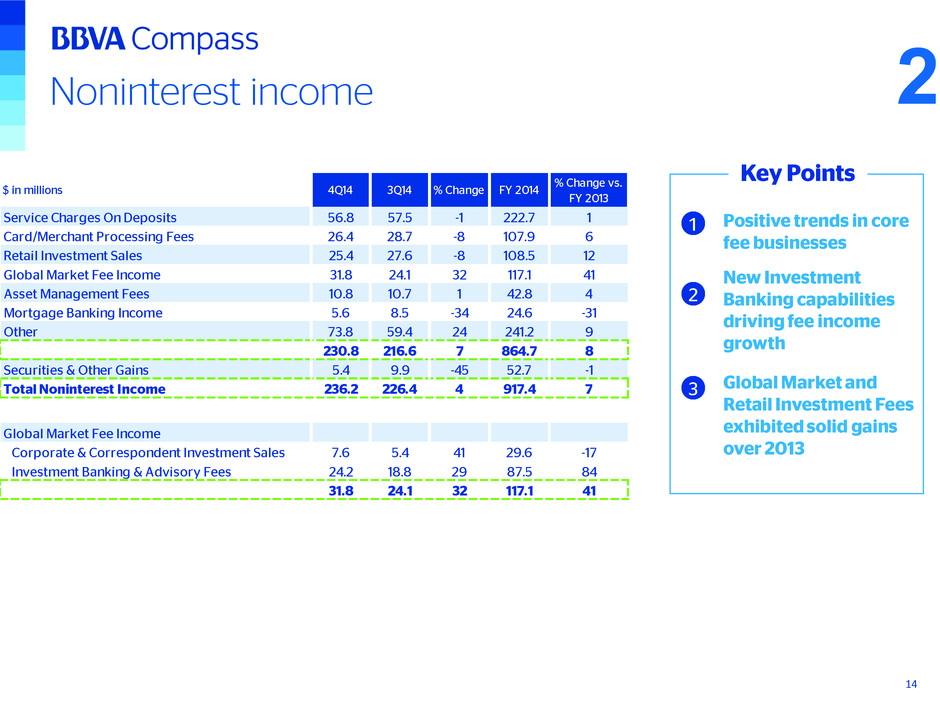
Noninterest income • Positive trends in core fee businesses • Global Market and Retail Investment Fees exhibited solid gains over 2013 Key Points 1 3 14 • New Investment Banking capabilities driving fee income growth 2 2 $ in millions 4Q14 3Q14 % Change FY 2014 % Change vs. FY 2013 Service Charges On Deposits 56.8 57.5 -1 222.7 1 Card/Merchant Processing Fees 26.4 28.7 -8 107.9 6 Retail Investment Sales 25.4 27.6 -8 108.5 12 Global Market Fee Income 31.8 24.1 32 117.1 41 Asset Management Fees 10.8 10.7 1 42.8 4 Mortgage Banking Income 5.6 8.5 -34 24.6 -31 Other 73.8 59.4 24 241.2 9 230.8 216.6 7 864.7 8 Securities & Other Gains 5.4 9.9 -45 52.7 -1 Total Noninterest Income 236.2 226.4 4 917.4 7 Global Market Fee Income Corporate & Correspondent Investment Sales 7.6 5.4 41 29.6 -17 Investment Banking & Advisory Fees 24.2 18.8 29 87.5 84 31.8 24.1 32 117.1 41
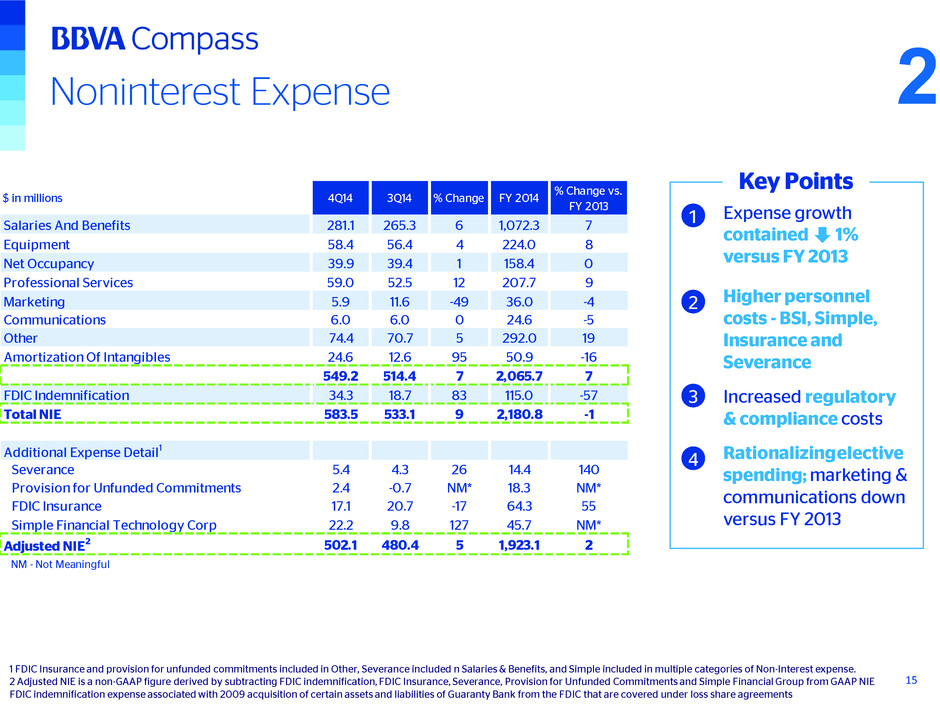
Noninterest Expense • Expense growth contained 1% versus FY 2013 • Rationalizingelective spending; marketing & communications down versus FY 2013 • Higher personnel costs - BSI, Simple, Insurance and Severance Key Points • Increased regulatory & compliance costs 1 FDIC Insurance and provision for unfunded commitments included in Other, Severance included n Salaries & Benefits, and Simple included in multiple categories of Non-Interest expense. 2 Adjusted NIE is a non-GAAP figure derived by subtracting FDIC indemnification, FDIC Insurance, Severance, Provision for Unfunded Commitments and Simple Financial Group from GAAP NIE FDIC indemnification expense associated with 2009 acquisition of certain assets and liabilities of Guaranty Bank from the FDIC that are covered under loss share agreements 1 2 3 4 15 2 $ in millions 4Q14 3Q14 % Change FY 2014 % Change vs. FY 2013 Salaries And Benefits 281.1 265.3 6 1,072.3 7 Equipment 58.4 56.4 4 224.0 8 Net Occupancy 39.9 39.4 1 158.4 0 Professional Services 59.0 52.5 12 207.7 9 Marketing 5.9 11.6 -49 36.0 -4 Communications 6.0 6.0 0 24.6 -5 Other 74.4 70.7 5 292.0 19 Amortization Of Intangibles 24.6 12.6 95 50.9 -16 549.2 514.4 7 2,065.7 7 FDIC Indemnification 34.3 18.7 83 115.0 -57 Total NIE 583.5 533.1 9 2,180.8 -1 Additional Expense Detail1 Severance 5.4 4.3 26 14.4 140 Provision for Unfunded Commitments 2.4 -0.7 NM* 18.3 NM* FDIC Insurance 17.1 20.7 -17 64.3 55 Simple Financial Technology Corp 22.2 9.8 127 45.7 NM* Adjusted NIE2 502.1 480.4 5 1,923.1 2 NM - Not Meaningful
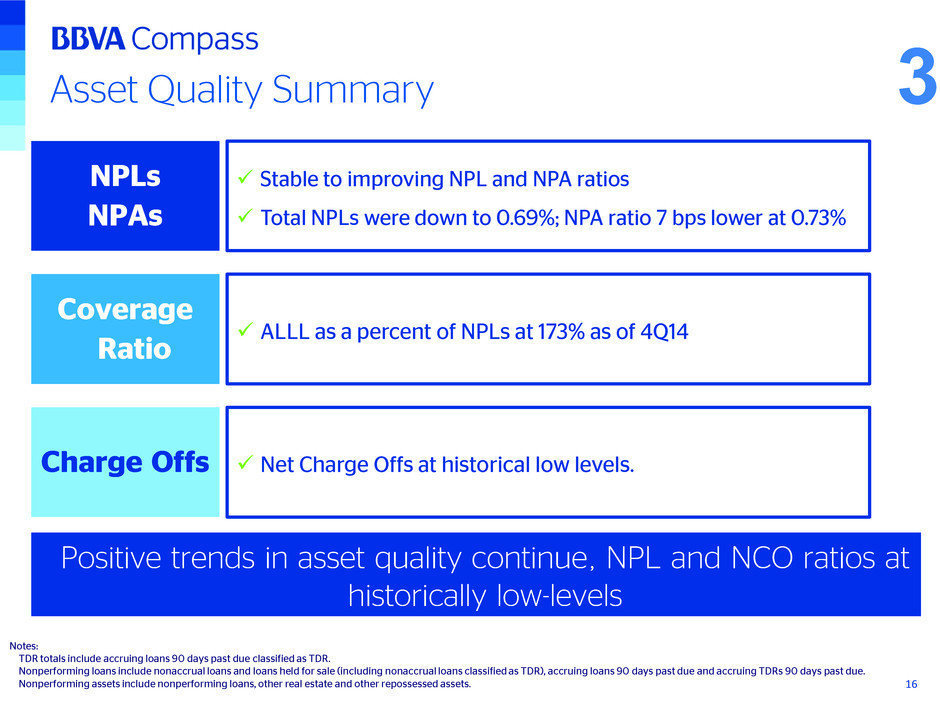
Asset Quality Summary NPLs NPAs Stable to improving NPL and NPA ratios Total NPLs were down to 0.69%; NPA ratio 7 bps lower at 0.73% Coverage Ratio ALLL as a percent of NPLs at 173% as of 4Q14 Charge Offs Net Charge Offs at historical low levels. Positive trends in asset quality continue, NPL and NCO ratios at historically low-levels Notes: TDR totals include accruing loans 90 days past due classified as TDR. Nonperforming loans include nonaccrual loans and loans held for sale (including nonaccrual loans classified as TDR), accruing loans 90 days past due and accruing TDRs 90 days past due. Nonperforming assets include nonperforming loans, other real estate and other repossessed assets. 16 3
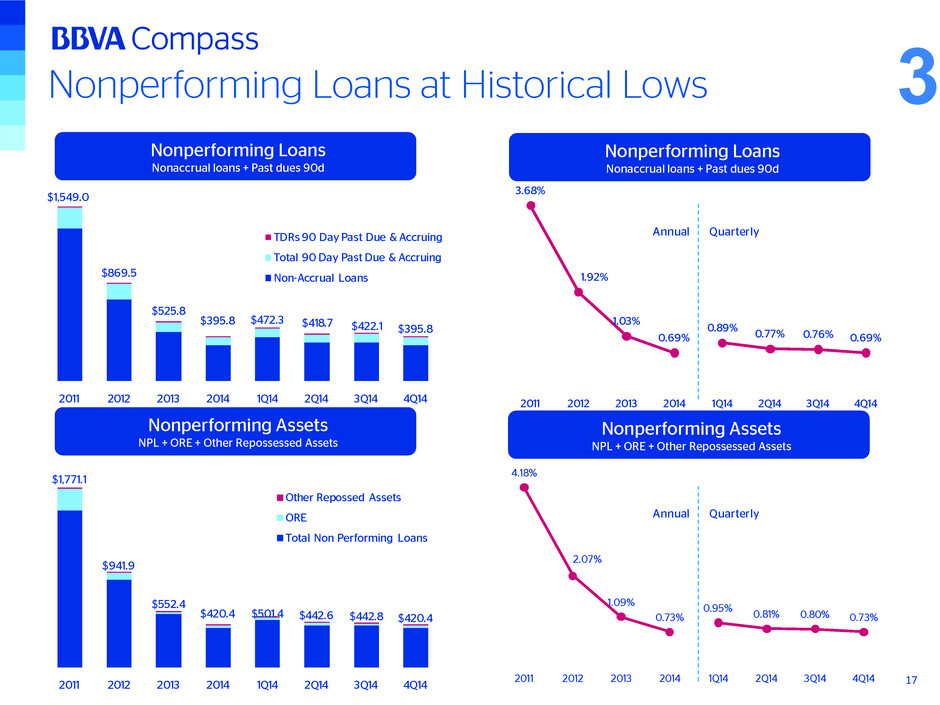
4.18% 2.07% 1.09% 0.73% 0.95% 0.81% 0.80% 0.73% 2011 2012 2013 2014 1Q14 2Q14 3Q14 4Q14 3.68% 1.92% 1.03% 0.69% 0.89% 0.77% 0.76% 0.69% 2011 2012 2013 2014 1Q14 2Q14 3Q14 4Q14 $1,771.1 $941.9 $552.4 $420.4 $501.4 $442.6 $442.8 $420.4 2011 2012 2013 2014 1Q14 2Q14 3Q14 4Q14 Other Repossed Assets ORE Total Non Performing Loans $1,549.0 $869.5 $525.8 $395.8 $472.3 $418.7 $422.1 $395.8 2011 2012 2013 2014 1Q14 2Q14 3Q14 4Q14 TDRs 90 Day Past Due & Accruing Total 90 Day Past Due & Accruing Non-Accrual Loans Nonperforming Loans at Historical Lows 17 Nonperforming Loans Nonaccrual loans + Past dues 90d Nonperforming Assets NPL + ORE + Other Repossessed Assets Nonperforming Assets NPL + ORE + Other Repossessed Assets Nonperforming Loans Nonaccrual loans + Past dues 90d 3 Annual Quarterly Annual Quarterly
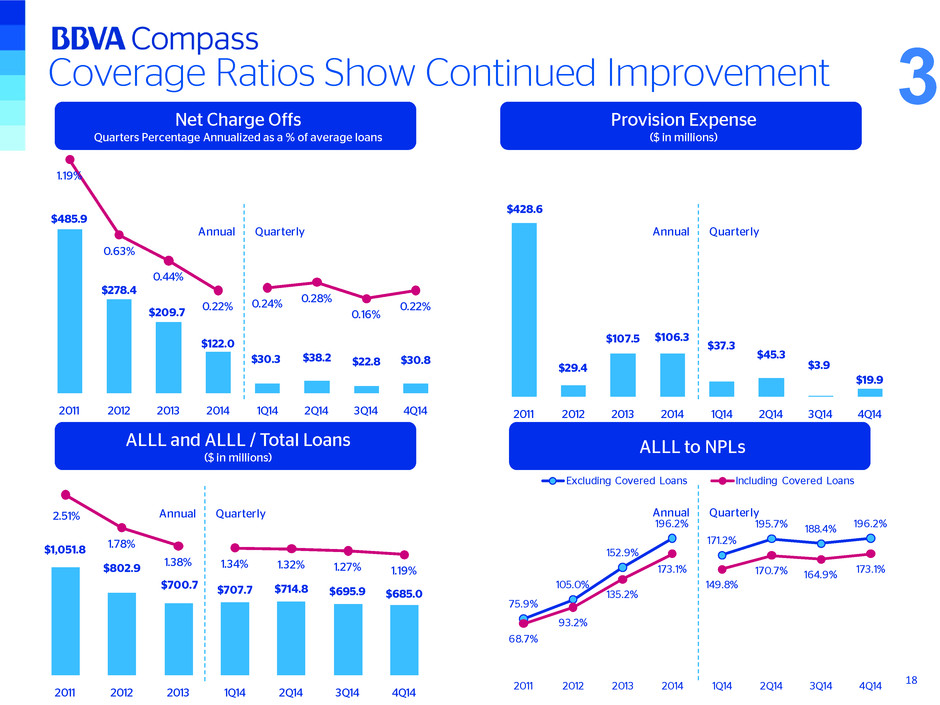
75.9% 105.0% 152.9% 196.2% 171.2% 195.7% 188.4% 196.2% 68.7% 93.2% 135.2% 173.1% 149.8% 170.7% 164.9% 173.1% 2011 2012 2013 2014 1Q14 2Q14 3Q14 4Q14 Excluding Covered Loans Including Covered Loans $428.6 $29.4 $107.5 $106.3 $37.3 $45.3 $3.9 $19.9 2011 2012 2013 2014 1Q14 2Q14 3Q14 4Q14 $1,051.8 $802.9 $700.7 $707.7 $714.8 $695.9 $685.0 2011 2012 2013 1Q14 2Q14 3Q14 4Q14 $485.9 $278.4 $209.7 $122.0 $30.3 $38.2 $22.8 $30.8 2011 2012 2013 2014 1Q14 2Q14 3Q14 4Q14 Coverage Ratios Show Continued Improvement Net Charge Offs Quarters Percentage Annualized as a % of average loans Provision Expense ($ in millions) 18 ALLL to NPLsALLL and ALLL / Total Loans ($ in millions) 3 Annual Quarterly Annual Quarterly 1.19% 0.63% 0.44% 0.22% 0.24% 0.28% 0.16% 0.22% 2.51% 1.78% 1.38% 1.34% 1.32% 1.27% 1.19% Annual QuarterlyAnnual Quarterly
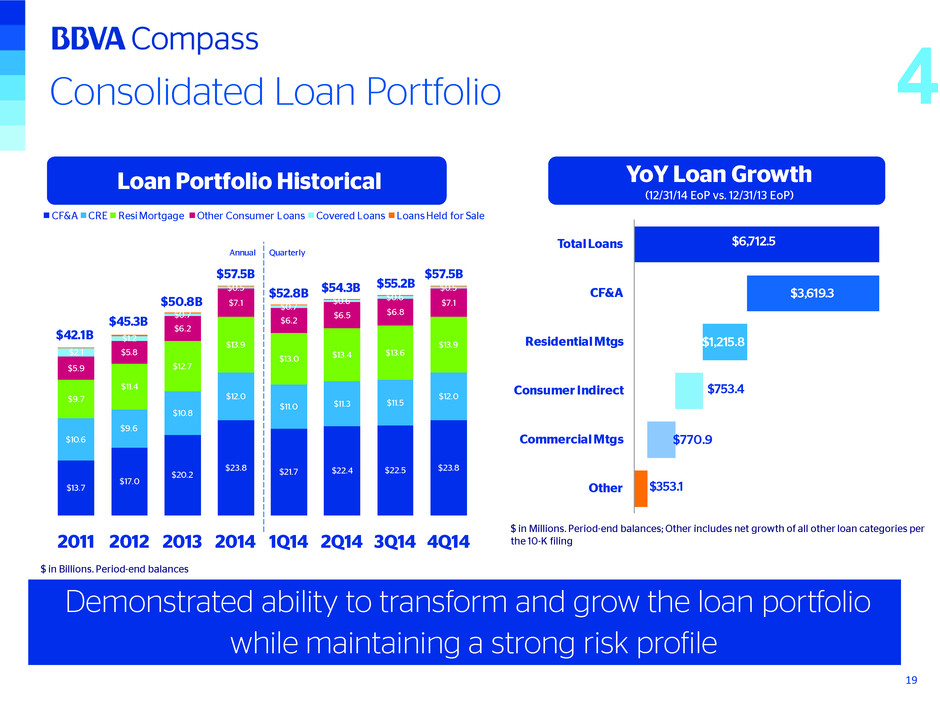
$6,712.5 $353.1 $770.9 $753.4 $1,215.8 $3,619.3 $0.0 $1,000.0 $2,000.0 $3,000.0 $4,000.0 $5,000.0 $6,000.0$7,000.0 Total Loans CF&A Residential Mtgs Consumer Indirect Commercial Mtgs Other Loan Portfolio Historical $ in Billions. Period-end balances YoY Loan Growth (12/31/14 EoP vs. 12/31/13 EoP) Consolidated Loan Portfolio Demonstrated ability to transform and grow the loan portfolio while maintaining a strong risk profile $ in Millions. Period-end balances; Other includes net growth of all other loan categories per the 10-K filing 19 4 $13.7 $17.0 $20.2 $23.8 $21.7 $22.4 $22.5 $23.8 $10.6 $9.6 $10.8 $12.0 $11.0 $11.3 $11.5 $12.0$9.7 $11.4 $12.7 $13.9 $13.0 $13.4 $13.6 $13.9 $5.9 $5.8 $6.2 $7.1 $6.2 $6.5 $6.8 $7.1 $2.1 $1.2 $0.7 $0.5 $0.7 $0.6 $0.6 $0.5 2011 2012 2013 2014 1Q14 2Q14 3Q14 4Q14 CF&A CRE Resi Mortgage Other Consumer Loans Covered Loans Loans Held for Sale $45.3B $50.8B $52.8B $54.3B $55.2B $57.5B $57.5B $42.1B QuarterlyAnnual
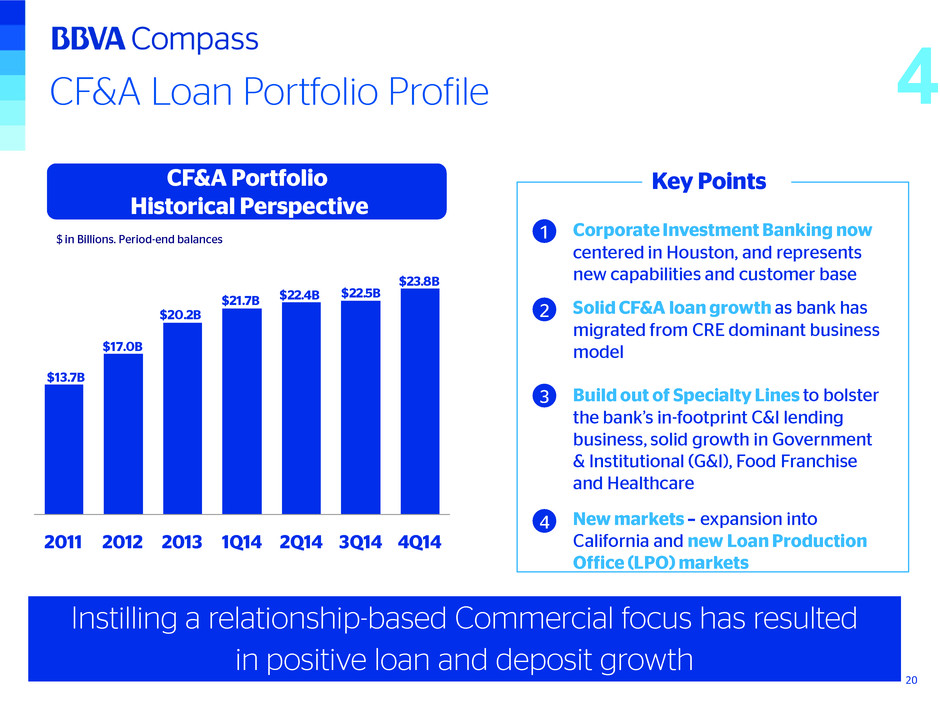
2011 2012 2013 1Q14 2Q14 3Q14 4Q14 $17.0B $20.2B $21.7B $22.4B $13.7B $22.5B $23.8B CF&A Loan Portfolio Profile CF&A Portfolio Historical Perspective $ in Billions. Period-end balances • Corporate Investment Banking now centered in Houston, and represents new capabilities and customer base • New markets – expansion into California and new Loan Production Office (LPO) markets • Solid CF&A loan growth as bank has migrated from CRE dominant business model Key Points • Build out of Specialty Lines to bolster the bank’s in-footprint C&I lending business, solid growth in Government & Institutional (G&I), Food Franchise and Healthcare Instilling a relationship-based Commercial focus has resulted in positive loan and deposit growth 1 2 3 4 20 4
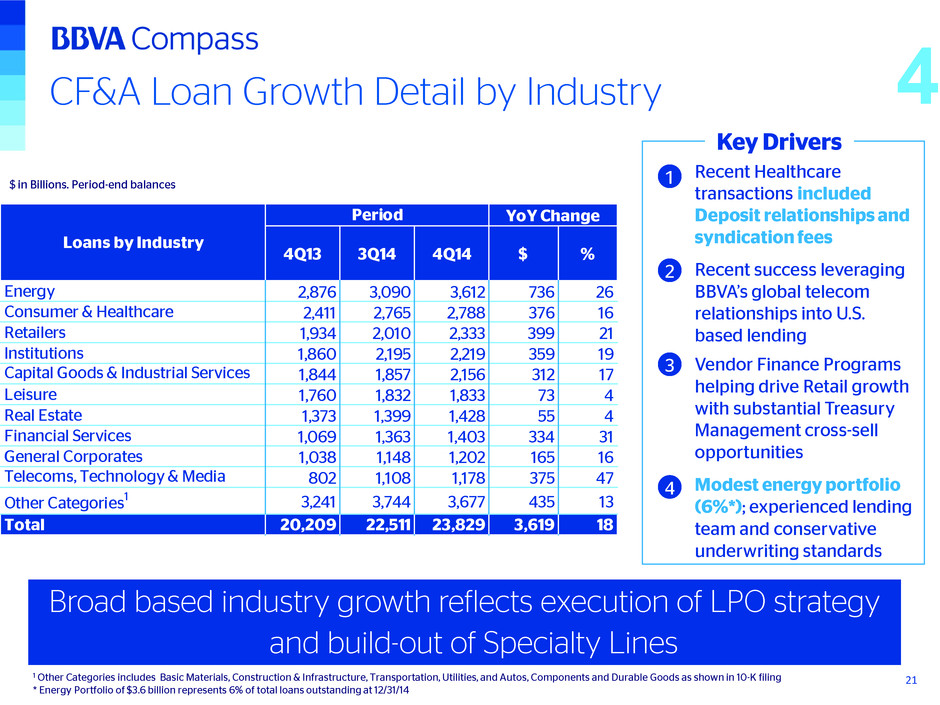
CF&A Loan Growth Detail by Industry $ in Billions. Period-end balances Key Drivers Broad based industry growth reflects execution of LPO strategy and build-out of Specialty Lines 1 2 3 21 Recent Healthcare transactions included Deposit relationships and syndication fees Recent success leveraging BBVA’s global telecom relationships into U.S. based lending Vendor Finance Programs helping drive Retail growth with substantial Treasury Management cross-sell opportunities 1 Other Categories includes Basic Materials, Construction & Infrastructure, Transportation, Utilities, and Autos, Components and Durable Goods as shown in 10-K filing * Energy Portfolio of $3.6 billion represents 6% of total loans outstanding at 12/31/14 4 Modest energy portfolio (6%*); experienced lending team and conservative underwriting standards 4 4Q13 3Q14 4Q14 $ % Energy 2,876 3,090 3,612 736 26 Consumer & Healthcare 2,411 2,765 2,788 376 16 Retailers 1,934 2,010 2,333 399 21 Institutions 1,860 2,195 2,219 359 19 Capital Goods & Industrial Services 1,844 1,857 2,156 312 17 Leisure 1,760 1,832 1,833 73 4 Real Estate 1,373 1,399 1,428 55 4 Financial Services 1,069 1,363 1,403 334 31 General Corporates 1,038 1,148 1,202 165 16 Telecoms, Technology & Media 802 1,108 1,178 375 47 Other Categories1 3,241 3,744 3,677 435 13 Total 20,209 22,511 23,829 3,619 18 YoY ChangePeriod Loans by Industry
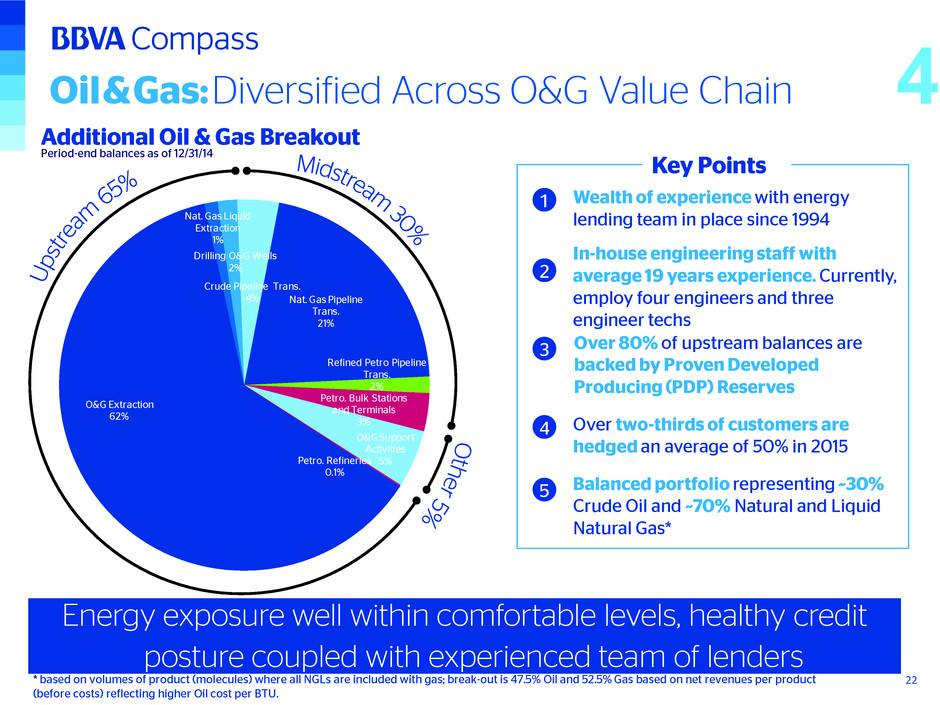
O&G Extraction 62% Nat. Gas Liquid Extraction 1% Drilling O&G Wells 2% Crude Pipeline Trans. 4% Nat. Gas Pipeline Trans. 21% Refined Petro Pipeline Trans. 2% Petro. Bulk Stations and Terminals 3% O&G Support Activities 5%Petro. Refineries 0.1% Oil&Gas:Diversified Across O&G Value Chain Energy exposure well within comfortable levels, healthy credit posture coupled with experienced team of lenders 22 • Balanced portfolio representing ~30% Crude Oil and ~70% Natural and Liquid Natural Gas* • Over two-thirds of customers are hedged an average of 50% in 2015 Key Points • Over 80% of upstream balances are backed by Proven Developed Producing (PDP) Reserves 1 2 3 4 * based on volumes of product (molecules) where all NGLs are included with gas; break-out is 47.5% Oil and 52.5% Gas based on net revenues per product (before costs) reflecting higher Oil cost per BTU. Period-end balances as of 12/31/14 4 Additional Oil & Gas Breakout In-house engineering staff with average 19 years experience. Currently, employ four engineers and three engineer techs Wealth of experience with energy lending team in place since 1994 5
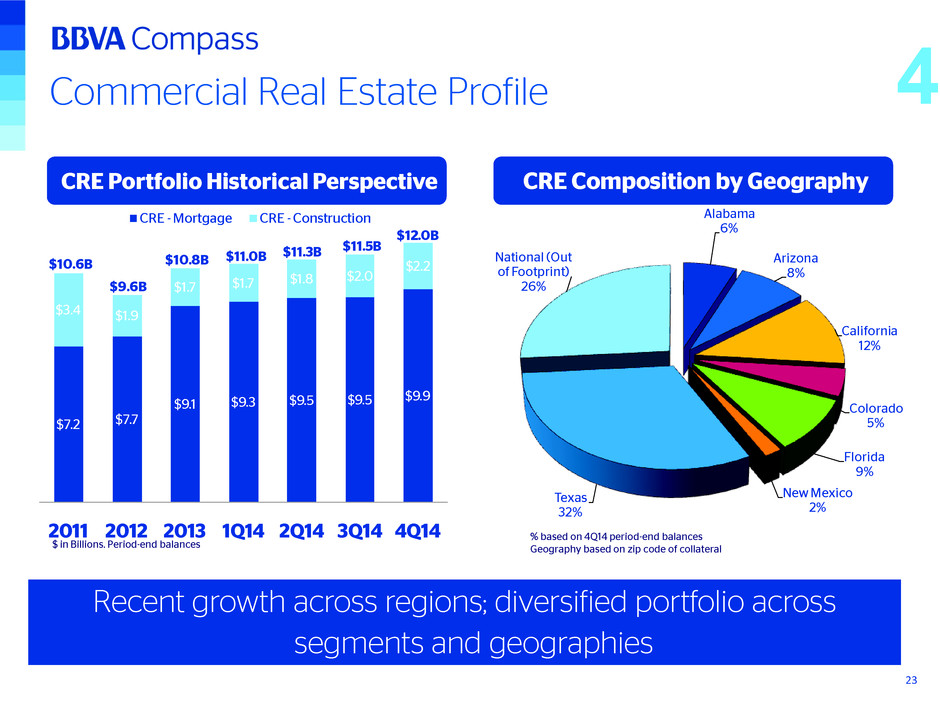
Alabama 6% Arizona 8% California 12% Colorado 5% Florida 9% New Mexico 2% Texas 32% National (Out of Footprint) 26% $7.2 $7.7 $9.1 $9.3 $9.5 $9.5 $9.9 $3.4 $1.9 $1.7 $1.7 $1.8 $2.0 $2.2 2011 2012 2013 1Q14 2Q14 3Q14 4Q14 CRE - Mortgage CRE - Construction $9.6B $10.8B $11.0B$10.6B $11.3B $11.5B $12.0B CRE Composition by Geography Commercial Real Estate Profile CRE Portfolio Historical Perspective $ in Billions. Period-end balances % based on 4Q14 period-end balances Geography based on zip code of collateral Recent growth across regions; diversified portfolio across segments and geographies 23 4
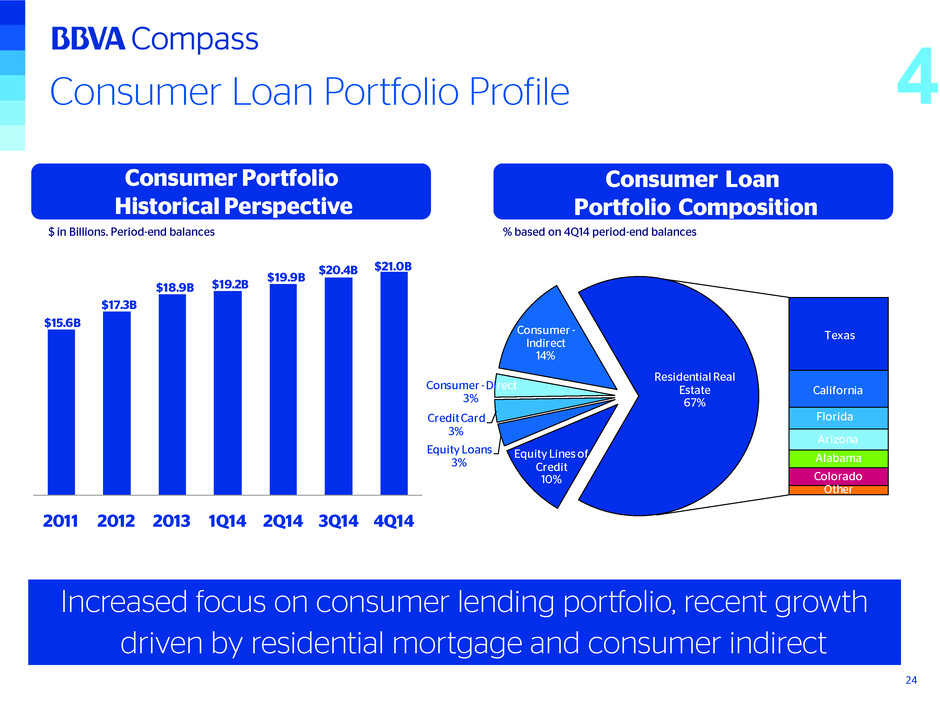
2011 2012 2013 1Q14 2Q14 3Q14 4Q14 $17.3B $18.9B $19.2B $15.6B $19.9B $20.4B $21.0B Equity Lines of Credit 10% Equity Loans 3% Credit Card 3% Consumer - Direct 3% Consumer - Indirect 14% Texas California Florida Arizona Alabama Colorado Other Residential Real Estate 67% Consumer Loan Portfolio Composition Consumer Portfolio Historical Perspective $ in Billions. Period-end balances % based on 4Q14 period-end balances Consumer Loan Portfolio Profile Increased focus on consumer lending portfolio, recent growth driven by residential mortgage and consumer indirect 24 4
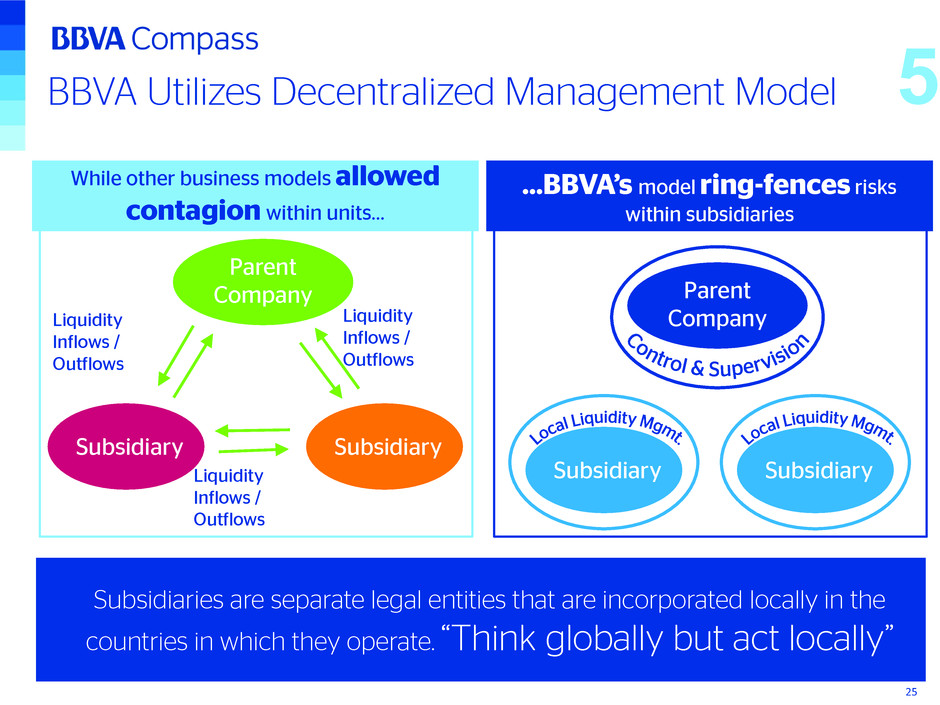
Subsidiaries are separate legal entities that are incorporated locally in the countries in which they operate. “Think globally but act locally” While other business models allowed contagion within units… …BBVA’s model ring-fences risks within subsidiaries Parent Company SubsidiarySubsidiary Liquidity Inflows / Outflows Liquidity Inflows / Outflows Liquidity Inflows / Outflows Parent Company SubsidiarySubsidiary BBVA Utilizes Decentralized Management Model 25 5
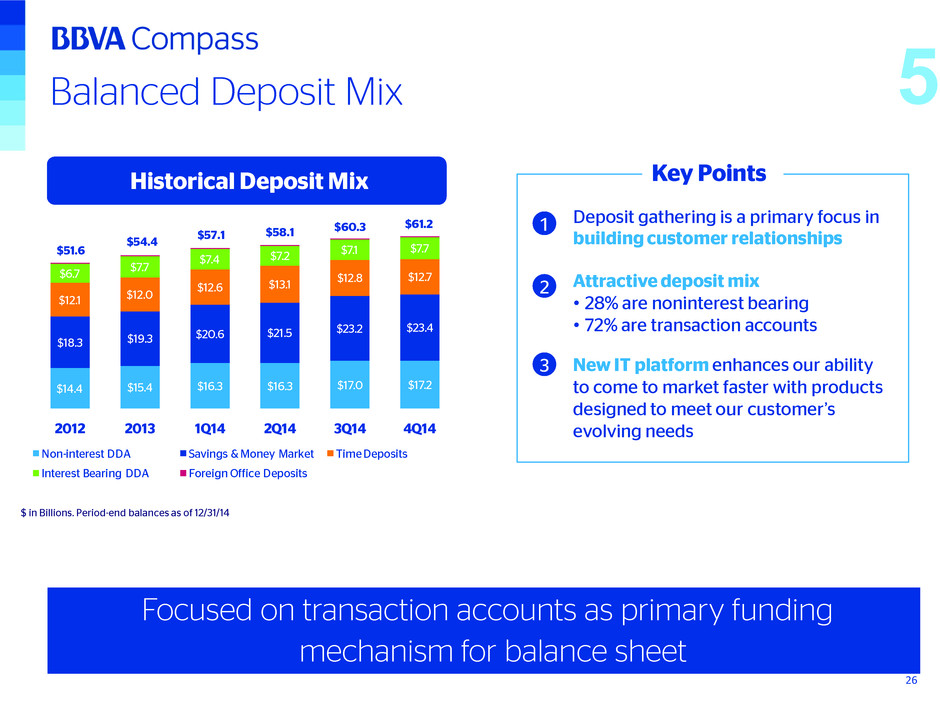
$14.4 $15.4 $16.3 $16.3 $17.0 $17.2 $18.3 $19.3 $20.6 $21.5 $23.2 $23.4 $12.1 $12.0 $12.6 $13.1 $12.8 $12.7$6.7 $7.7 $7.4 $7.2 $7.1 $7.7 2012 2013 1Q14 2Q14 3Q14 4Q14 Non-interest DDA Savings & Money Market Time Deposits Interest Bearing DDA Foreign Office Deposits $60.3 $51.6 $54.4 $57.1 $58.1 $61.2 Balanced Deposit Mix Historical Deposit Mix $ in Billions. Period-end balances as of 12/31/14 • Attractive deposit mix • 28% are noninterest bearing • 72% are transaction accounts • New IT platform enhances our ability to come to market faster with products designed to meet our customer’s evolving needs Key Points • Deposit gathering is a primary focus in building customer relationships Focused on transaction accounts as primary funding mechanism for balance sheet 2 1 3 26 5
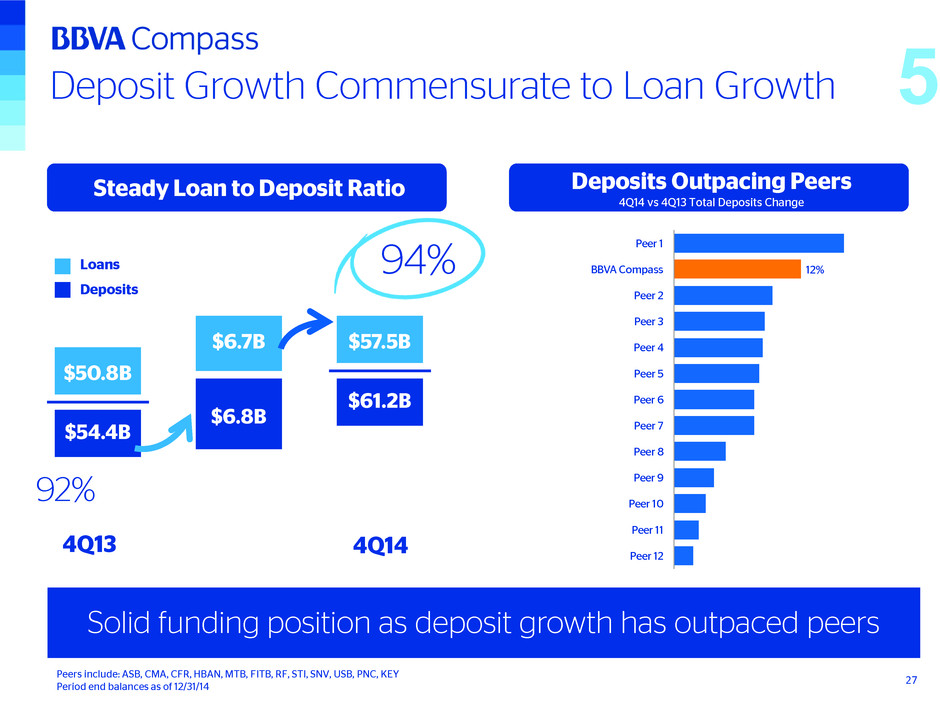
12% Peer 12 Peer 11 Peer 10 Peer 9 Peer 8 Peer 7 Peer 6 Peer 5 Peer 4 Peer 3 Peer 2 BBVA Compass Peer 1 Deposit Growth Commensurate to Loan Growth Steady Loan to Deposit Ratio Solid funding position as deposit growth has outpaced peers Deposits Outpacing Peers 4Q14 vs 4Q13 Total Deposits Change 92% 94% $50.8B $54.4B $6.7B $6.8B $57.5B $61.2B Loans Deposits 27 4Q13 4Q14 5 Peers include: ASB, CMA, CFR, HBAN, MTB, FITB, RF, STI, SNV, USB, PNC, KEY Period end balances as of 12/31/14
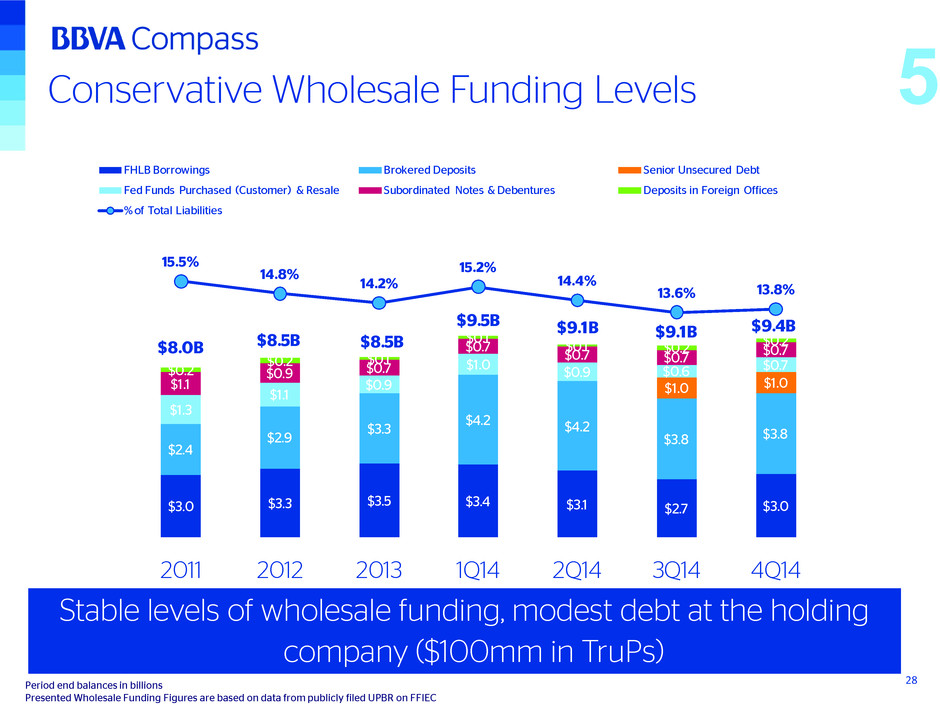
Conservative Wholesale Funding Levels Period end balances in billions Presented Wholesale Funding Figures are based on data from publicly filed UPBR on FFIEC Stable levels of wholesale funding, modest debt at the holding company ($100mm in TruPs) 28 5 $3.0 $3.3 $3.5 $3.4 $3.1 $2.7 $3.0 $2.4 $2.9 $3.3 $4.2 $4.2 $3.8 $3.8 $1.0 $1.0 $1.3 $1.1 $0.9 $1.0 $0.9 $0.6 $0.7 $1.1 $0.9 $0.7 $0.7 $0.7 $0.7 $0.7 $0.2 $0.2 $0.1 $0.1 $0.1 $0.2 $0.2 15.5% 14.8% 14.2% 15.2% 14.4% 13.6% 13.8% $0.00 $0.02 $0.04 $0.06 $0.08 $0.10 $0.12 $0.14 $0.16 $0.18 $0.0 $2.0 $4.0 $6.0 $8.0 $10.0 $12.0 $14.0 2011 2012 2013 1Q14 2Q14 3Q14 4Q14 FHLB Borrowings Brokered Deposits Senior Unsecured Debt Fed Funds Purchased (Customer) & Resale Subordinated Notes & Debentures Deposits in Foreign Offices % of Total Liabilities $8.0B $8.5B $8.5B $9.5B $9.1B $9.1B $9.4B
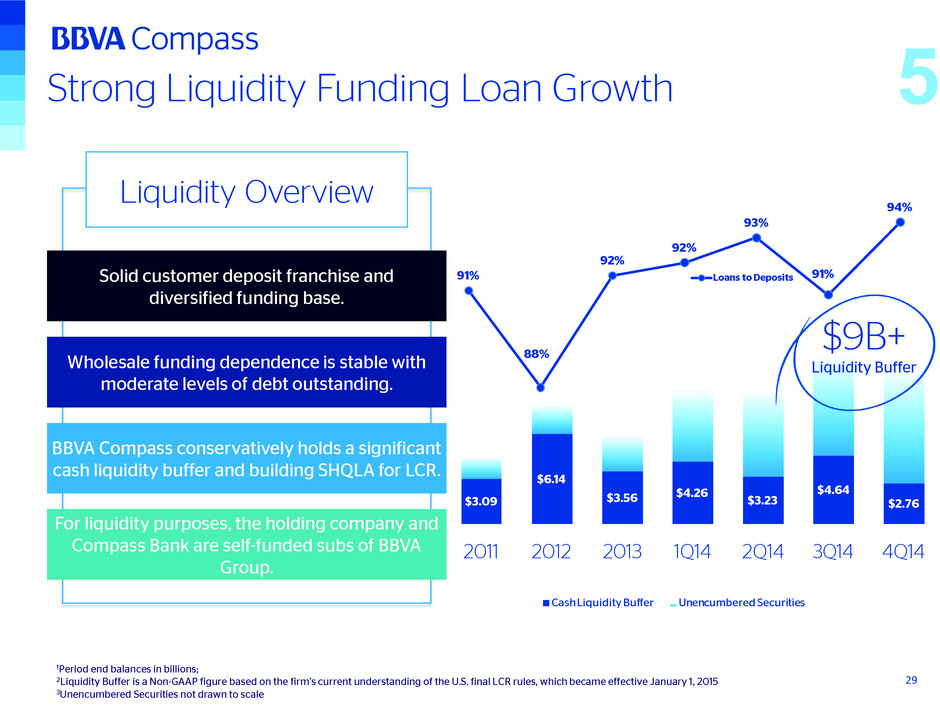
$3.09 $6.14 $3.56 $4.26 $3.23 $4.64 $2.76 $0.00 $2.00 $4.00 $6.00 $8.00 $10.00 $12.00 $14.00 $16.00 $18.00 $20.00 2011 2012 2013 1Q14 2Q14 3Q14 4Q14 Cash Liquidity Buffer Unencumbered Securities 91% 88% 92% 92% 93% 91% 94% 84% 85% 86% 87% 88% 89% 90% 91% 92% 93% 94% 95% Loans to Deposits Strong Liquidity Funding Loan Growth Liquidity Overview Solid customer deposit franchise and diversified funding base. Wholesale funding dependence is stable with moderate levels of debt outstanding. BBVA Compass conservatively holds a significant cash liquidity buffer and building SHQLA for LCR. For liquidity purposes, the holding company and Compass Bank are self-funded subs of BBVA Group. $9B+ Liquidity Buffer 1Period end balances in billions; 2Liquidity Buffer is a Non-GAAP figure based on the firm’s current understanding of the U.S. final LCR rules, which became effective January 1, 2015 3Unencumbered Securities not drawn to scale 29 5
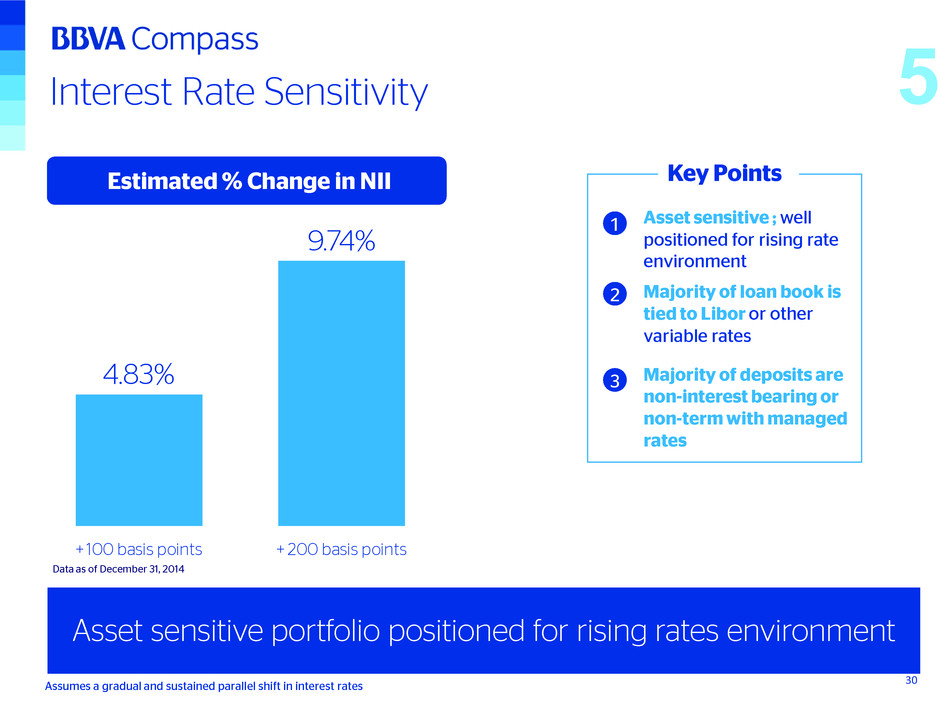
4.83% 9.74% + 100 basis points + 200 basis points Interest Rate Sensitivity Estimated % Change in NII Data as of December 31, 2014 • Assumes a gradual and sustained parallel shift in interest rates Key Points • Asset sensitive ; well positioned for rising rate environment Asset sensitive portfolio positioned for rising rates environment 2 1 30 Majority of loan book is tied to Libor or other variable rates 3 Majority of deposits are non-interest bearing or non-term with managed rates 5
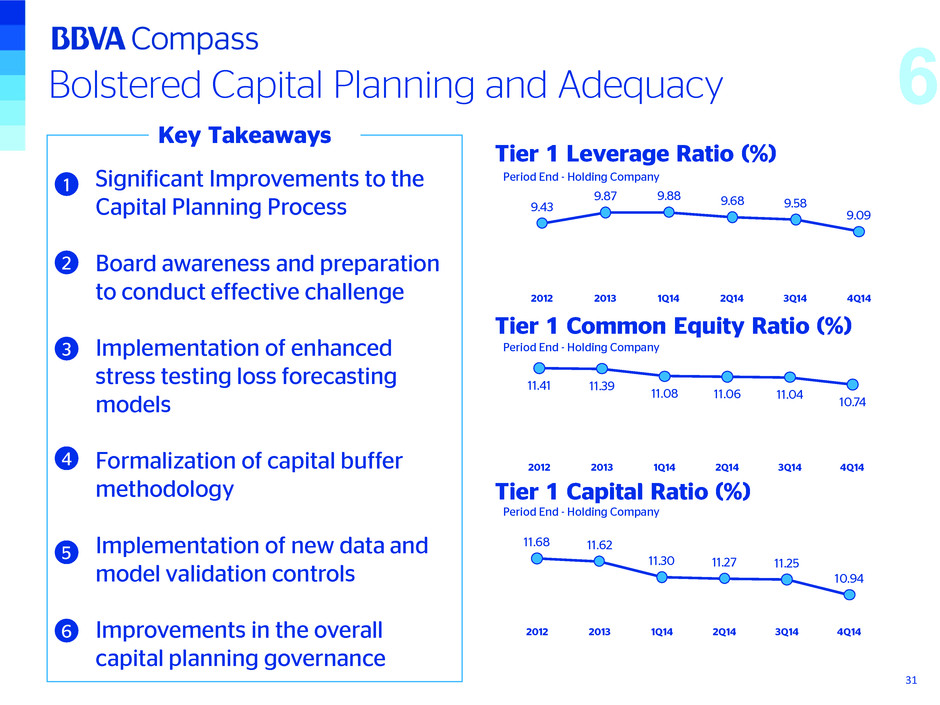
11.41 11.39 11.08 11.06 11.04 10.74 2012 2013 1Q14 2Q14 3Q14 4Q14 11.68 11.62 11.30 11.27 11.25 10.94 2012 2013 1Q14 2Q14 3Q14 4Q14 9.43 9.87 9.88 9.68 9.58 9.09 2012 2013 1Q14 2Q14 3Q14 4Q14 Bolstered Capital Planning and Adequacy Tier 1 Leverage Ratio (%) Tier 1 Common Equity Ratio (%) Tier 1 Capital Ratio (%) c Significant Improvements to the Capital Planning Process Board awareness and preparation to conduct effective challenge Implementation of enhanced stress testing loss forecasting models Formalization of capital buffer methodology Implementation of new data and model validation controls Improvements in the overall capital planning governance Key Takeaways 1 2 3 4 5 6 Period End - Holding Company Period End - Holding Company Period End - Holding Company 31 6
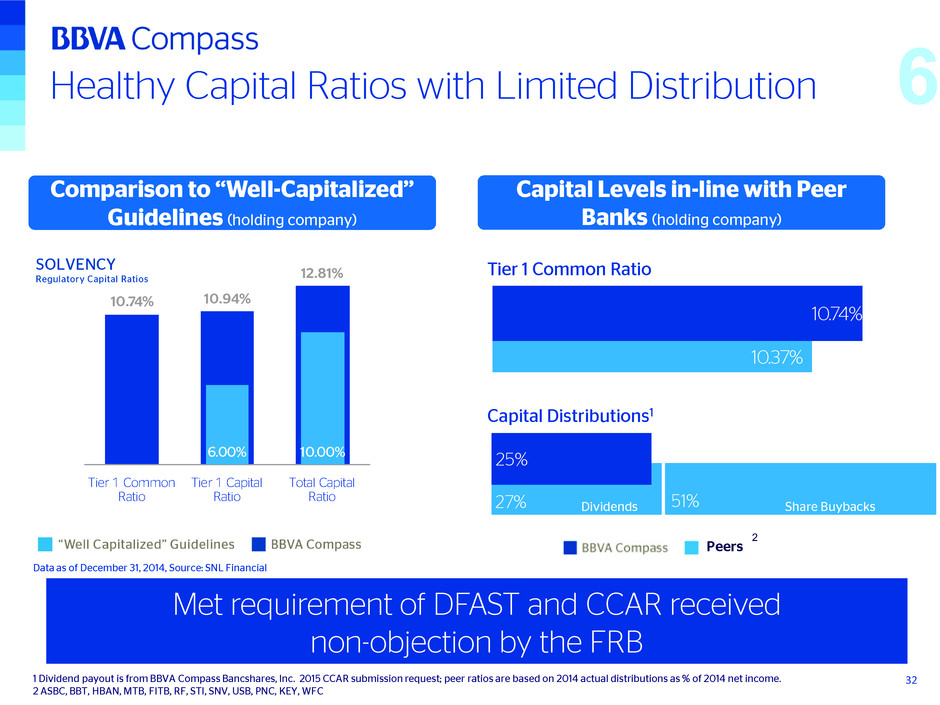
27% 51% 25% 10.37% 10.74% Capital Levels in-line with Peer Banks (holding company) Comparison to “Well-Capitalized” Guidelines (holding company) Healthy Capital Ratios with Limited Distribution Met requirement of DFAST and CCAR received non-objection by the FRB Data as of December 31, 2014, Source: SNL Financial 2 1 Dividend payout is from BBVA Compass Bancshares, Inc. 2015 CCAR submission request; peer ratios are based on 2014 actual distributions as % of 2014 net income. 2 ASBC, BBT, HBAN, MTB, FITB, RF, STI, SNV, USB, PNC, KEY, WFC Tier 1 Common Ratio Capital Distributions1 Dividends Share Buybacks Peers 32 10.74% 10.94% 12.81% Tier 1 Common Ratio Tier 1 Capital Ratio Total Capital Ratio 6.00% 10.00% 6
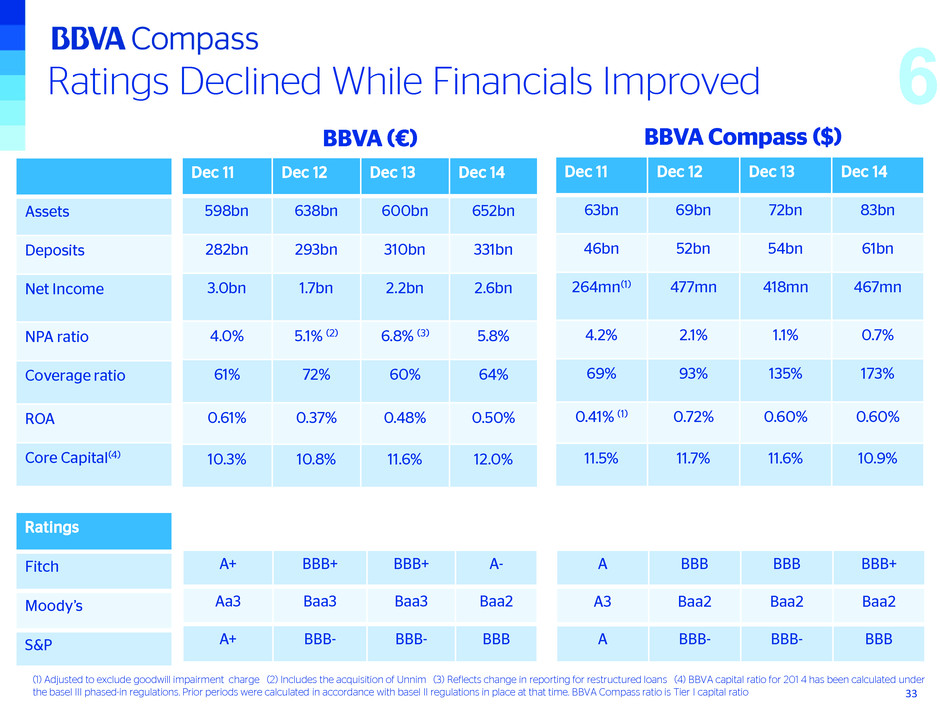
Ratings Declined While Financials Improved Dec 11 Dec 12 Dec 13 Dec 14 598bn 638bn 600bn 652bn 282bn 293bn 310bn 331bn 3.0bn 1.7bn 2.2bn 2.6bn 4.0% 5.1% (2) 6.8% (3) 5.8% 61% 72% 60% 64% 0.61% 0.37% 0.48% 0.50% 10.3% 10.8% 11.6% 12.0% BBVA (€) BBVA Compass ($) Assets Deposits Net Income NPA ratio Coverage ratio ROA Core Capital(4) Dec 11 Dec 12 Dec 13 Dec 14 63bn 69bn 72bn 83bn 46bn 52bn 54bn 61bn 264mn(1) 477mn 418mn 467mn 4.2% 2.1% 1.1% 0.7% 69% 93% 135% 173% 0.41% (1) 0.72% 0.60% 0.60% 11.5% 11.7% 11.6% 10.9% Ratings Fitch Moody’s S&P . A+ BBB+ BBB+ A- Aa3 Baa3 Baa3 Baa2 A+ BBB- BBB- BBB A BBB BBB BBB+ A3 Baa2 Baa2 Baa2 A BBB- BBB- BBB (1) Adjusted to exclude goodwill impairment charge (2) Includes the acquisition of Unnim (3) Reflects change in reporting for restructured loans (4) BBVA capital ratio for 201 4 has been calculated under the basel III phased-in regulations. Prior periods were calculated in accordance with basel II regulations in place at that time. BBVA Compass ratio is Tier I capital ratio 6 33
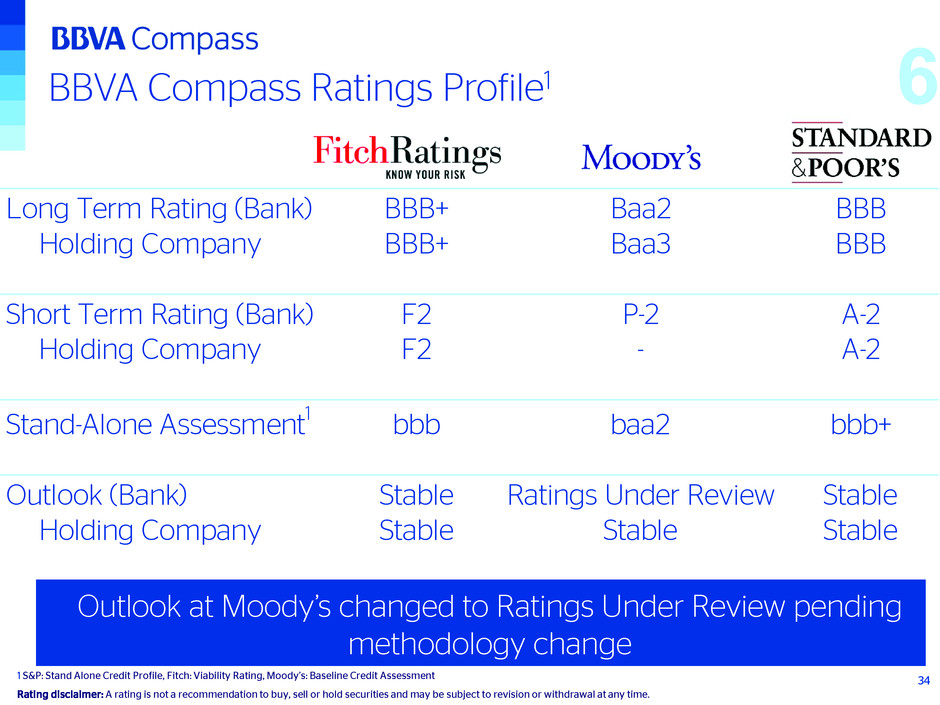
BBVA Compass Ratings Profile1 1 S&P: Stand Alone Credit Profile, Fitch: Viability Rating, Moody’s: Baseline Credit Assessment Rating disclaimer: A rating is not a recommendation to buy, sell or hold securities and may be subject to revision or withdrawal at any time. Outlook at Moody’s changed to Ratings Under Review pending methodology change 34 6 Long Term Rating (Bank) BBB+ Baa2 BBB Holding Company BBB+ Baa3 BBB Short Term Rating (Bank) F2 P-2 A-2 Holding Company F2 - A-2 Stand-Alone Assessment1 bbb baa2 bbb+ Outlook (Bank) Stable Ratings Under Review Stable Holding Company Stable Stable Stable
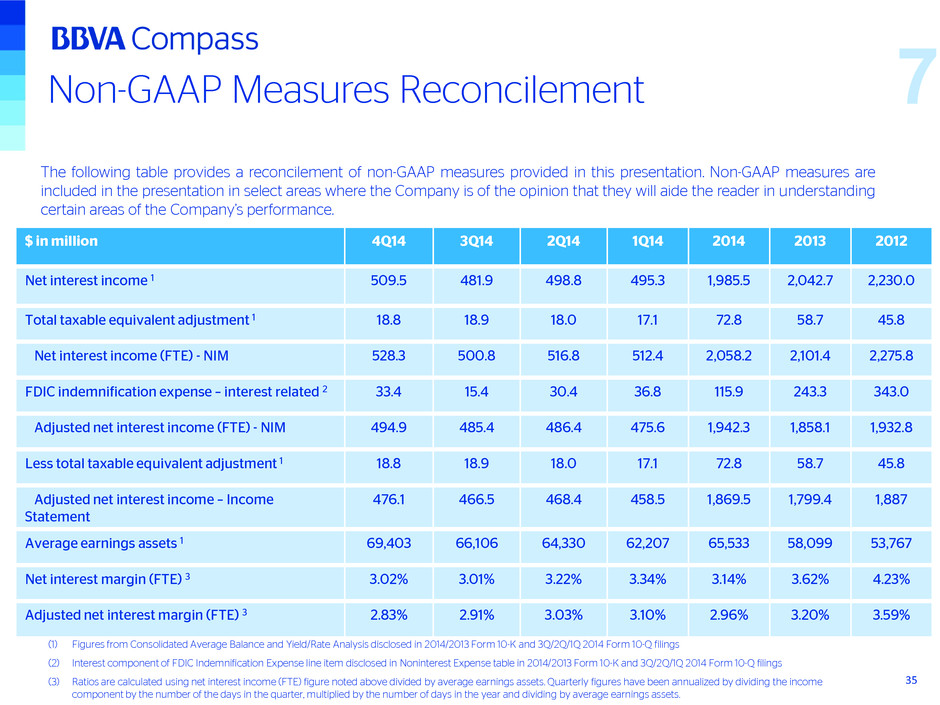
Non-GAAP Measures Reconcilement The following table provides a reconcilement of non-GAAP measures provided in this presentation. Non-GAAP measures are included in the presentation in select areas where the Company is of the opinion that they will aide the reader in understanding certain areas of the Company’s performance. $ in million 4Q14 3Q14 2Q14 1Q14 2014 2013 2012 Net interest income 1 509.5 481.9 498.8 495.3 1,985.5 2,042.7 2,230.0 Total taxable equivalent adjustment 1 18.8 18.9 18.0 17.1 72.8 58.7 45.8 Net interest income (FTE) - NIM 528.3 500.8 516.8 512.4 2,058.2 2,101.4 2,275.8 FDIC indemnification expense – interest related 2 33.4 15.4 30.4 36.8 115.9 243.3 343.0 Adjusted net interest income (FTE) - NIM 494.9 485.4 486.4 475.6 1,942.3 1,858.1 1,932.8 Less total taxable equivalent adjustment 1 18.8 18.9 18.0 17.1 72.8 58.7 45.8 Adjusted net interest income – Income Statement 476.1 466.5 468.4 458.5 1,869.5 1,799.4 1,887 Average earnings assets 1 69,403 66,106 64,330 62,207 65,533 58,099 53,767 Net interest margin (FTE) 3 3.02% 3.01% 3.22% 3.34% 3.14% 3.62% 4.23% Adjusted net interest margin (FTE) 3 2.83% 2.91% 3.03% 3.10% 2.96% 3.20% 3.59% (1) Figures from Consolidated Average Balance and Yield/Rate Analysis disclosed in 2014/2013 Form 10-K and 3Q/2Q/1Q 2014 Form 10-Q filings (2) Interest component of FDIC Indemnification Expense line item disclosed in Noninterest Expense table in 2014/2013 Form 10-K and 3Q/2Q/1Q 2014 Form 10-Q filings (3) Ratios are calculated using net interest income (FTE) figure noted above divided by average earnings assets. Quarterly figures have been annualized by dividing the income component by the number of the days in the quarter, multiplied by the number of days in the year and dividing by average earnings assets. 35 7
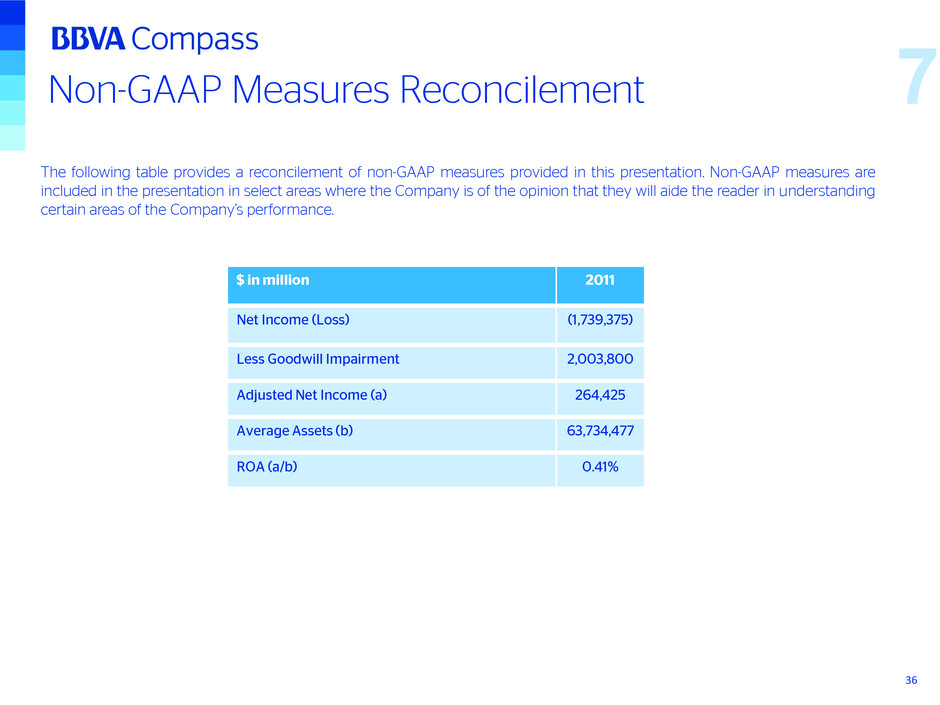
Non-GAAP Measures Reconcilement The following table provides a reconcilement of non-GAAP measures provided in this presentation. Non-GAAP measures are included in the presentation in select areas where the Company is of the opinion that they will aide the reader in understanding certain areas of the Company’s performance. $ in million 2011 Net Income (Loss) (1,739,375) Less Goodwill Impairment 2,003,800 Adjusted Net Income (a) 264,425 Average Assets (b) 63,734,477 ROA (a/b) 0.41% 36 7
Fourth Quarter 2014 Fixed Income Investor Meetings
