Attached files
| file | filename |
|---|---|
| 8-K - 8-K - AXIALL CORP/DE/ | a15-7562_18k.htm |
Exhibit 99.1
|
|
Goldman Sachs Chemical Intensity Day March 2015 |
|
|
Forward-Looking Statements This presentation contains certain statements relating to future events and our intentions, beliefs, expectations, and predictions for the future. Any such statements other than statements of historical fact are forward-looking statements within the meaning of the Securities Act of 1933 and the Securities Exchange Act of 1934. Words or phrases such as “anticipate,” “believe,” “plan,” “estimate,” “project,” “may,” “will,” “intend,” “target,” “expect,” “would” or “could” (including the negative variations thereof) or similar terminology used in connection with any discussion of future plans, actions or events generally identify forward-looking statements. These statements relate to, among other things: prices for our products, including those related to ECU values; our operating rates; our maintenance costs; our raw materials and energy costs; domestic and global demand for our products; the cost advantage of being a North American producer; foreign currency exchange rates; expected growth of our businesses and products; our results of operations; our financial and operational performance, our business prospects and opportunities and other statements of expectations concerning matters that are not historical facts. These statements are based on the current expectations of our management. There are a number of risks and uncertainties that could cause our actual results to differ materially from the forward-looking statements included in this presentation. These risks and uncertainties include, among other things: changes, seasonality and/or cyclicality in the industries in which our products are sold and changes in demand for our products or increases in overall industry capacity that could affect production volumes and/or pricing; the costs and operating restrictions associated with compliance with current and future environmental, health and safety laws and regulations; the availability and pricing of energy and raw materials; risks, hazards and potential liabilities associated with manufacturing and transporting chemicals and building products; changes in the general economy, including the impacts of the current, and any potential future, economic uncertainties in the housing and construction markets; fluctuations in foreign currency exchange and interest rates; our level of indebtedness and debt service obligations and ability to continue to comply with the covenants in our asset-based and term loan credit agreements and the indentures governing our 4.875 percent senior notes due 2023 and 4.625 percent senior notes due 2021; our reliance on a limited number of suppliers for specified feedstock and services; our reliance on third-party transportation; risks, costs, liabilities, pension and post-retirement welfare benefit obligations, competition within our industry; complications resulting from our multiple enterprise resource planning (“ERP”) systems and the implementation of our new ERP systems, including an integrated SAP system implementation we are undertaking; strikes and work stoppages relating to the workforce under collective bargaining agreements; any impairment of goodwill, indefinite-lived intangible assets or other intangible assets; the failure to realize the benefits of, and/or disruptions resulting from, any asset dispositions, asset acquisitions, joint ventures, business combinations or other transactions we may undertake; shared control of our joint ventures with unaffiliated third parties, including the ability of such joint venture partners to fulfill their obligations; and the failure to adequately protect our data and technology systems. In light of these risks, uncertainties, assumptions, and factors, the forward-looking events discussed in this presentation may not occur. Other unknown or unpredictable factors could also have a material adverse effect on Axiall’s actual future results, performance, or achievements. For a further discussion of these and other risks and uncertainties applicable to Axiall and its business, see Axiall’s Annual Report on Form 10-K for the fiscal year ended December 31, 2014, and subsequent filings with the SEC. As a result of the foregoing, readers are cautioned not to place undue reliance on these forward-looking statements, which speak only as of the date of this presentation. Axiall does not undertake, and expressly disclaims, any duty to update any forward-looking statement whether as a result of new information, future events, or changes in its expectations, except as required by law. |
|
|
Agenda Axiall Overview Global Chlor-alkali and Vinyls Summary |
|
|
Axiall Overview |
|
|
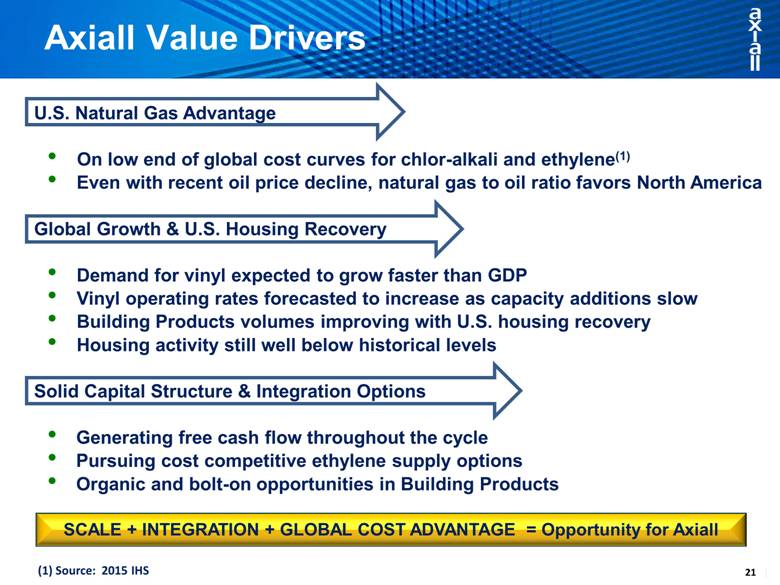
SCALE + INTEGRATION + GLOBAL COST ADVANTAGE = Opportunity for Axiall Axiall Value Drivers U.S. Natural Gas Advantage On low end of global cost curves for chlor-alkali and ethylene(1) Even with recent oil price decline, natural gas to oil ratio favors North America Global Growth & U.S. Housing Recovery Demand for vinyl expected to grow faster than GDP Vinyl operating rates forecasted to increase as capacity additions slow Building Products volumes improving with U.S. housing recovery Housing activity still well below historical levels Solid Capital Structure & Integration Options Generating free cash flow throughout the cycle Pursuing cost competitive ethylene supply options Organic and bolt-on opportunities in Building Products (1) Source: 2015 IHS |

|
|
Axiall 2014 Sales Cumene Phenol Acetone Caustic Soda Chlorine PVC Resin Compounds Siding Pipe Windows/Doors Mouldings |
|
|
Chlorine Merchant Resin VCM Electricity Building Products Chlorovinyls – Building Products Integration Merchant Chlorine Merchant Caustic Salt Natural Gas Ethane Derivatives Compounds Caustic Chlor-alkali Ethylene Vinyl Resins Vinyl Compounds Cogen Facilities |

|
|
North American Competitors and Capacity ('000s short tons) ECU 1) VCM (intermediate) Resin (’000s short tons) (’000s short tons) Source:2014 IHS 1) ECU defined as combination of 1 unit of chlorine and 1.1 units of caustic |
|
|
Diverse Product Portfolio Creates Optionality Chlorine Downstream Vinyl Downstream 60% internally consumed by a broad mix of chlorine derivatives Downstream growth opportunities Gulf Coast logistics provide excellent access to export markets Housing recovery = Organic growth expected in Building Products VCM/Vinyl 45% Merchant Up to 40% Derivatives 15% Domestic Merchant 52% Export 15% Compound 16% Building Products 17% Source: Axiall based on 2014 capacity |
|
|
Building Products Sales Mix & Drivers Key Drivers: Canada - Single Family homes - Repair & Remodel U.S. - NE & Midwest Repair & Remodel - NE & Midwest Single Family homes - Minimal exposure to South & West End Use Mix Sales Geography Source: 2014 AXLL data |
|
|
Accessories Shutters Columns Siding Shakes Soffit Corner Post Shutters Corners Windows Surrounds Decking Mouldings Fascia Building Products Portfolio Pipe & Fittings |
|
|
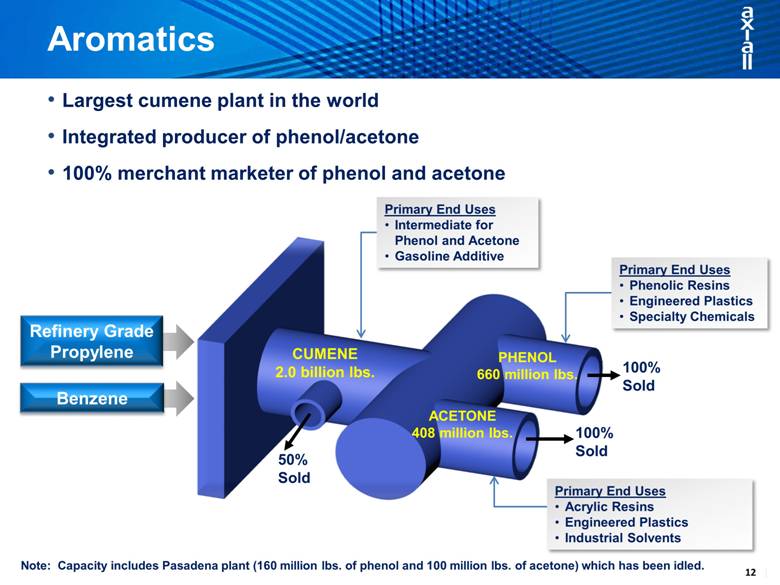
CUMENE 2.0 billion lbs. PHENOL 660 million lbs. ACETONE 408 million lbs. 100% Sold 50% Sold 100% Sold Largest cumene plant in the world Integrated producer of phenol/acetone 100% merchant marketer of phenol and acetone Note: Capacity includes Pasadena plant (160 million lbs. of phenol and 100 million lbs. of acetone) which has been idled. Aromatics Primary End Uses Acrylic Resins Engineered Plastics Industrial Solvents Primary End Uses Intermediate for Phenol and Acetone Gasoline Additive Primary End Uses Phenolic Resins Engineered Plastics Specialty Chemicals Refinery Grade Propylene Benzene |
|
|
Global Chlor-alkali and Vinyls |
|
|
Axiall 3rd Largest Global ECU Player 2014 Global Capacity Over 90 Million ECU/Year Source: IHS (CMAI) and Axiall marketing, in metric tons |
|
|
Global Chlor-Alkali Manufacturing Costs Source: 2015 IHS, Axiall marketing, www.energy.eu, sunsirs.com % Global Capacity 17% 42% 12% 4% US Remains advantaged over other exporting regions |
|
|
Chlor-alkali Capacity Growth < Demand Capacity growth in Northeast Asia slowing dramatically 2014-2019 capacity growth expected to be well below demand growth Western Europe expected to consolidate capacity, especially mercury Source: 2015 IHS |
|
|
Chlorine Operating Rates Have Bottomed Source: 2015 IHS 2014 North American operating rates projected to rise |
|
|
Source: Alvarez & Marsal (2013) PVC Per Capita Consumption - lbs PVC consumption in export markets anticipated to grow as they develop water infrastructure |
|
|
PVC Capacity Growth Now < Demand Capacity growth in Northeast Asia slowing dramatically Global operating rates expected to rise North America in best position to add capacity to meet world demand Source: IHS |
|
|
PVC Operating Rates Have also Bottomed Source: 2015 IHS 2014 All Major Regions expected to rise |
|
|
SCALE + INTEGRATION + GLOBAL COST ADVANTAGE = Opportunity for Axiall Axiall Value Drivers U.S. Natural Gas Advantage On low end of global cost curves for chlor-alkali and ethylene(1) Even with recent oil price decline, natural gas to oil ratio favors North America Global Growth & U.S. Housing Recovery Demand for vinyl expected to grow faster than GDP Vinyl operating rates forecasted to increase as capacity additions slow Building Products volumes improving with U.S. housing recovery Housing activity still well below historical levels Solid Capital Structure & Integration Options Generating free cash flow throughout the cycle Pursuing cost competitive ethylene supply options Organic and bolt-on opportunities in Building Products (1) Source: 2015 IHS |
|
|
Q&A |