Attached files
| file | filename |
|---|---|
| 8-K - FORM 8-K - Veritiv Corp | v405211_8k.htm |
| EX-99.1 - EXHIBIT 99.1 - Veritiv Corp | v405211_ex99-1.htm |

Veritiv Corporation Fourth Quarter and Full Year 2014 Financial Results March 23, 2015 Exhibit 99.2
Safe Harbor Provision Certain statements contained in this presentation regarding Veritiv Corporation’s (the “Company”) future operating results, performance, business plans, prospects, guidance and any other statements not constituting historical fact are “forward - looking statements” subject to the safe harbor created by the Private Securities Litigation Reform Act of 1995 . Where possible, the words “believe,” “expect,” “anticipate,” “intend,” “should,” “will,” “would,” “planned,” “estimated,” “potential,” “goal,” “outlook,” “may,” “predicts,” “could,” or the negative of such terms, or other comparable expressions, as they relate to the Company or its management, have been used to identify such forward - looking statements . All forward - looking statements reflect only the Company’s current beliefs and assumptions with respect to future operating results, performance, business plans, prospects, guidance and other matters, and are based on information currently available to the Company . Accordingly, the statements are subject to significant risks, uncertainties and contingencies, which could cause the Company’s actual operating results, performance or business plans or prospects to differ materially from those expressed in, or implied by, these statements . Factors that could cause actual results to differ materially from current expectations include risks and other factors described in the Company’s publicly available reports filed with the Securities and Exchange Commission (“SEC”), which contain a discussion of various factors that may affect the Company’s business or financial results . Such risks and other factors, which in some instances are beyond the Company’s control, include : the industry - wide decline in demand for paper and related products ; procurement and other risks in obtaining packaging, paper and facility products from our suppliers for resale to our customers ; increased competition, from existing and non - traditional sources ; loss of significant customers ; our ability to collect trade receivables from customers to whom we extend credit ; successful integration of the legacy Unisource and xpedx businesses and realization and timing of the expected synergy and other cost savings from the merger ; fuel cost increases ; inclement weather, anti - terrorism measures and other disruptions to the transportation network ; our ability to generate sufficient cash to service our debt ; our ability to comply with the covenants contained in our debt agreements ; our ability to refinance or restructure our debt on reasonable terms and conditions as might be necessary from time to time ; our ability to put in place in a timely manner the Sarbanes - Oxley procedures necessary as a public company ; increasing interest rates ; foreign currency fluctuations ; changes in accounting standards and methodologies ; regulatory changes and judicial rulings impacting our business ; adverse results from litigation, governmental investigations or audits, or tax related proceedings or audits ; the effects of work stoppages, union negotiations and union disputes ; our reliance on third - party vendors for various services ; and other events of which we are presently unaware or that we currently deem immaterial that may result in unexpected adverse operating results . The Company is not responsible for updating the information contained in this presentation beyond the published date, or for changes made to this document by wire services or Internet service providers . This presentation is being furnished to the SEC through a Form 8 - K . The Company’s Annual Report on Form 10 - K for the period ended December 31 , 2014 to be filed with the SEC may contain updates to the information included in this release . We reference non - GAAP financial measures in this presentation . Please see the appendix for reconciliations of non - GAAP measures to the most comparable GAAP measures . 2

Mary Laschinger, Chairman & CEO 3
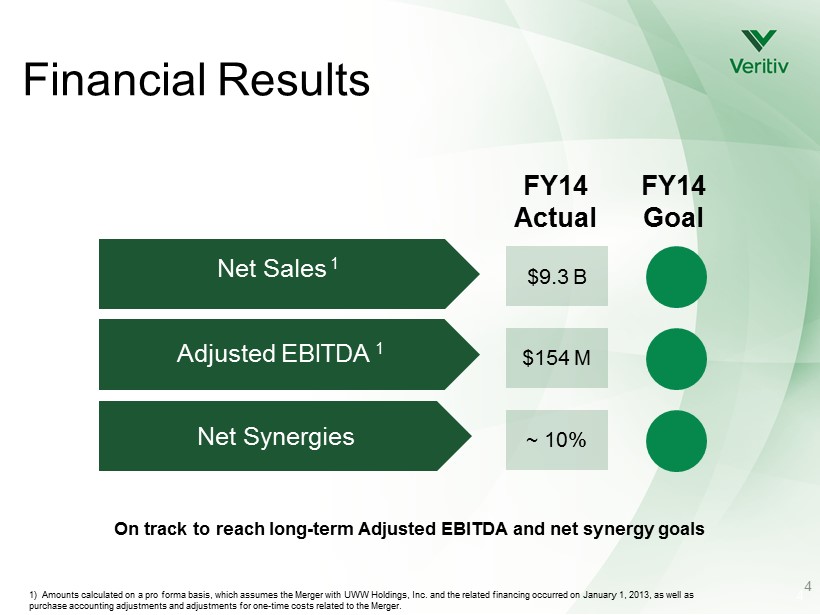
4 FY14 Actual FY14 Goal $9.3 B Print Publishing Net Sales 1 Net Synergies ~ 10% $154 M Adjusted EBITDA 1 Financial Results On track to reach long - term Adjusted EBITDA and net synergy goals 1) Amounts calculated on a pro forma basis, which assumes the Merger with UWW Holdings, Inc. and the related financing occurred on January 1, 2013, as well as purchase accounting adjustments and adjustments for one - time costs related to the Merger. 4
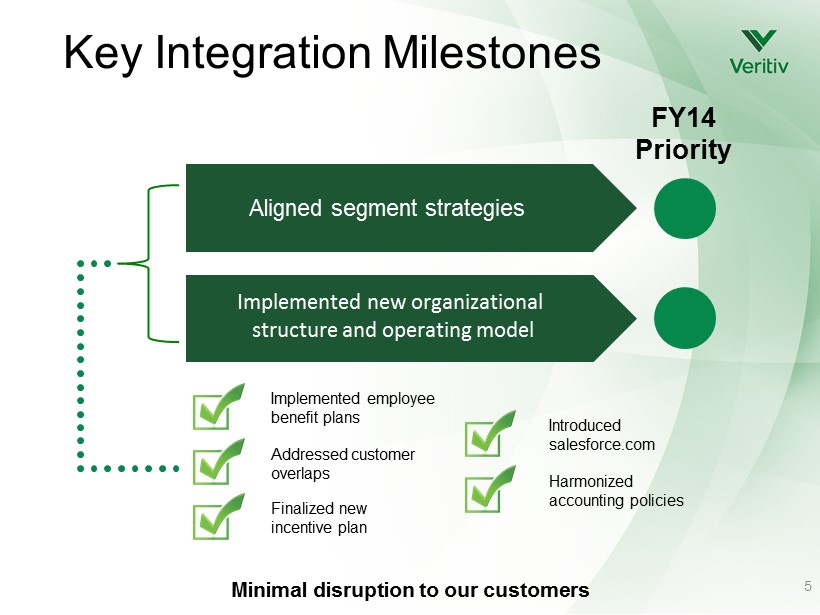
Key Integration Milestones FY14 Priority Print Aligned segment strategies Implemented new organizational structure and operating model Addressed customer overlaps Finalized new incentive plan Implemented employee benefit plans Harmonized accounting policies Introduced salesforce.com Minimal disruption to our customers 5

Steve Smith, CFO 6
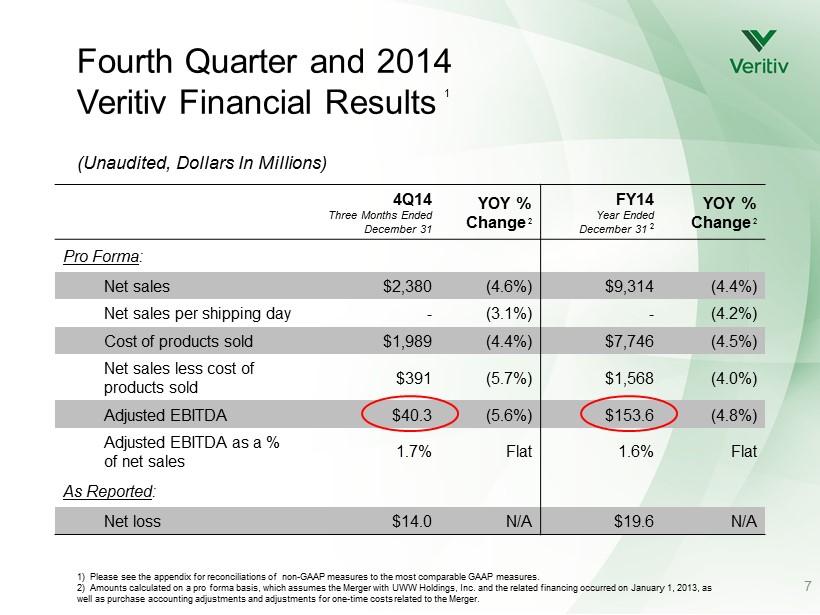
Fourth Quarter and 2014 Veritiv Financial Results 7 1) Please see the appendix for reconciliations of non - GAAP measures to the most comparable GAAP measures. 2) Amounts calculated on a pro forma basis, which assumes the Merger with UWW Holdings, Inc. and the related financing occur red on January 1, 2013, as well as purchase accounting adjustments and adjustments for one - time costs related to the Merger. (Unaudited, Dollars In Millions) 4Q14 Three Months Ended December 31 YOY % Change 2 FY14 Year Ended December 31 2 YOY % Change 2 Pro Forma : Net sales $2,380 (4.6%) $9,314 (4.4%) Net sales per shipping day - (3.1%) - (4.2%) Cost of products sold $1,989 (4.4%) $7,746 (4.5%) Net sales less cost of products sold $391 (5.7%) $1,568 (4.0%) Adjusted EBITDA $40.3 (5.6%) $153.6 (4.8%) Adjusted EBITDA as a % of net sales 1.7% Flat 1.6% Flat As Reported : Net loss $14.0 N/A $19.6 N/A 1
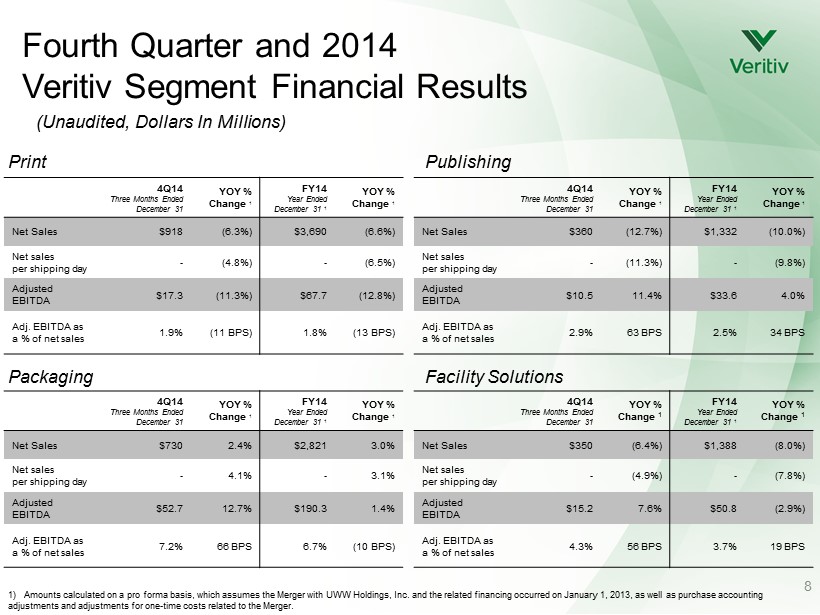
1 ) Amounts calculated on a pro forma basis, which assumes the Merger with UWW Holdings, Inc. and the related financing occur red on January 1, 2013, as well as purchase accounting adjustments and adjustments for one - time costs related to the Merger. Fourth Quarter and 2014 Veritiv Segment Financial Results 8 (Unaudited, Dollars In Millions) Print Publishing Packaging Facility Solutions 4Q14 Three Months Ended December 31 YOY % Change 1 FY14 Year Ended December 31 1 YOY % Change 1 Net Sales $360 (12.7%) $1,332 (10.0%) Net sales per shipping day - (11.3%) - (9.8%) Adjusted EBITDA $10.5 11.4% $33.6 4.0% Adj. EBITDA as a % of net sales 2.9% 63 BPS 2.5% 34 BPS 4Q14 Three Months Ended December 31 YOY % Change 1 FY14 Year Ended December 31 1 YOY % Change 1 Net Sales $730 2.4% $2,821 3.0% Net sales per shipping day - 4.1% - 3.1% Adjusted EBITDA $52.7 12.7% $190.3 1.4% Adj. EBITDA as a % of net sales 7.2% 66 BPS 6.7% (10 BPS) 4Q14 Three Months Ended December 31 YOY % Change 1 FY14 Year Ended December 31 1 YOY % Change 1 Net Sales $350 (6.4%) $1,388 (8.0%) Net sales per shipping day - (4.9%) - (7.8 %) Adjusted EBITDA $15.2 7.6% $50.8 (2.9%) Adj. EBITDA as a % of net sales 4.3% 56 BPS 3.7% 19 BPS 4Q14 Three Months Ended December 31 YOY % Change 1 FY14 Year Ended December 31 1 YOY % Change 1 Net Sales $918 (6.3%) $3, 690 (6.6%) Net sales per shipping day - (4.8%) - (6.5%) Adjusted EBITDA $17.3 (11.3 %) $67.7 (12.8 %) Adj. EBITDA as a % of net sales 1.9% (11 BPS) 1.8% (13 BPS)
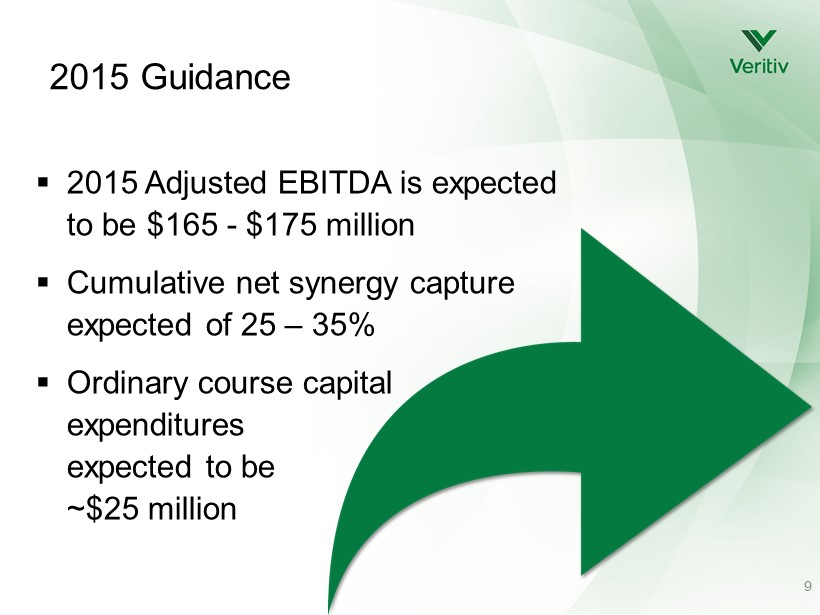
2015 Guidance ▪ 2015 Adjusted EBITDA is expected to be $165 - $175 million ▪ Cumulative net synergy capture expected of 25 – 35% ▪ Ordinary course capital expenditures expected to be ~$25 million 9
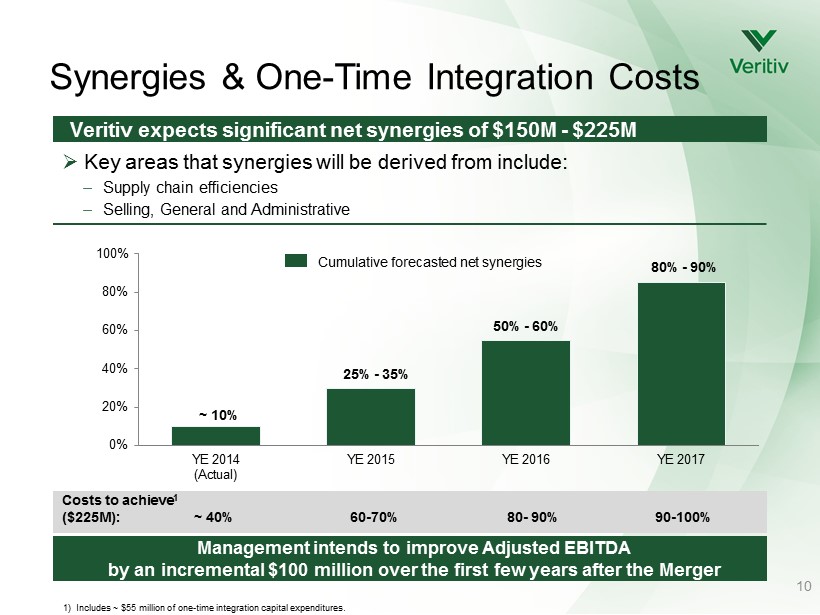
10 Veritiv expects significant net synergies of $150M - $225M » Key areas that synergies will be derived from include: – Supply chain efficiencies – Selling, General and Administrative 0% 20% 40% 60% 80% 100% YE 2014 (Actual) YE 2015 YE 2016 YE 2017 Cumulative forecasted net synergies Costs to achieve 1 ($225M): ~ 40 % 60 - 70% 80 - 90% 90 - 100% 1) Includes ~ $55 million of one - time integration capital expenditures. Synergies & One - Time Integration Costs 2 5% - 35% 50% - 60% 80% - 90% ~ 10% Management intends to improve Adjusted EBITDA by an incremental $100 million over the first few years after the Merger
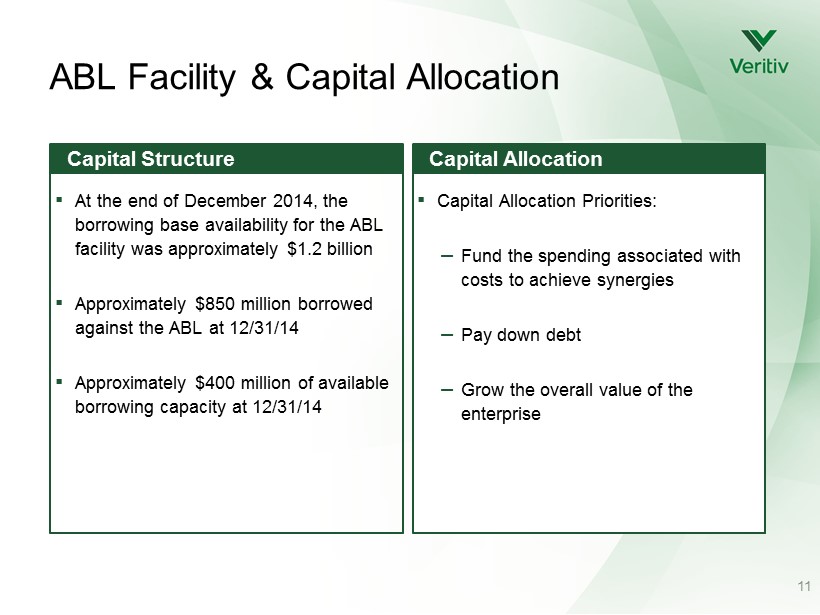
11 Capital Structure Capital Allocation ▪ Capital Allocation Priorities : – Fund the spending associated with costs to achieve synergies – Pay down debt – Grow the overall value of the enterprise ▪ A t the end of December 2014 , the borrowing base availability for the ABL facility was approximately $1.2 billion ▪ Approximately $850 million borrowed against the ABL at 12/31/14 ▪ Approximately $400 million of available borrowing capacity at 12/31/14 ABL Facility & Capital Allocation
Appendix: Non - GAAP Measures 12 We supplement our financial information prepared in accordance with GAAP with Adjusted EBITDA (earnings before interest, income taxes, depreciation and amortization, restructuring charges (income), non - restructuring stock - based compensation expense, LIFO (income) expense, asset impairment charge, non - restructuring severance charges, gain on sale of joint venture, Merger and integration expenses, (income) loss from discontinued operations, net of income taxes, fair value adjustments on the contingent liability associated with the Tax Receivable Agreement ("TRA") and certain other adjustments) and Free Cash Flow because we believe investors commonly use Adjusted EBITDA and Free Cash Flow as important components of valuing companies such as ours. In addition, the credit agreement governing our ABL Facility permits us to exclude these and other charges in calculating “Consolidated EBITDA” pursuant to such credit agreement. Adjusted EBITDA and Free Cash Flow are not measurements of financial performance under GAAP. Non - GAAP measures do not have definitions under GAAP and may be defined differently by and not be comparable to, similarly titled measures used by other companies. As a result, we consider and evaluate non - GAAP measures in connection with a review of the most directly comparable measure calculated in accordance with GAAP. We caution investors not to place undue reliance on such non - GAAP measures, but also to consider them with the most directly comparable GAAP measure. These measures have limitations as analytical tools and should not be considered in isolation or as a substitute for analyzing our results as reported under GAAP. Please see the following schedules and related footnotes for reconciliations of non - GAAP measures to the most comparable GAAP measures.
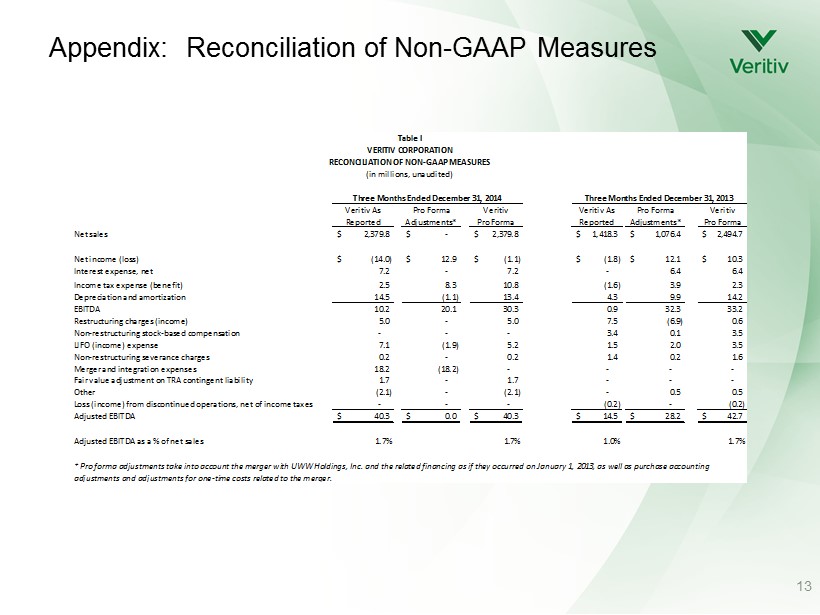
Appendix: Reconciliation of Non - GAAP Measures 13 Table I VERITIV CORPORATION RECONCILIATION OF NON-GAAP MEASURES (in millions, unaudited) Veritiv As Reported Pro Forma Adjustments* Veritiv Pro Forma Veritiv As Reported Pro Forma Adjustments* Veritiv Pro Forma Net sales 2,379.8$ -$ 2,379.8$ 1,418.3$ 1,076.4$ 2,494.7$ Net income (loss) (14.0)$ 12.9$ (1.1)$ (1.8)$ 12.1$ 10.3$ Interest expense, net 7.2 - 7.2 - 6.4 6.4 Income tax expense (benefit) 2.5 8.3 10.8 (1.6) 3.9 2.3 Depreciation and amortization 14.5 (1.1) 13.4 4.3 9.9 14.2 EBITDA 10.2 20.1 30.3 0.9 32.3 33.2 Restructuring charges (income) 5.0 - 5.0 7.5 (6.9) 0.6 Non-restructuring stock-based compensation - - - 3.4 0.1 3.5 LIFO (income) expense 7.1 (1.9) 5.2 1.5 2.0 3.5 Non-restructuring severance charges 0.2 - 0.2 1.4 0.2 1.6 Merger and integration expenses 18.2 (18.2) - - - - Fair value adjustment on TRA contingent liability 1.7 - 1.7 - - - Other (2.1) - (2.1) - 0.5 0.5 Loss (income) from discontinued operations, net of income taxes - - - (0.2) - (0.2) Adjusted EBITDA 40.3$ 0.0$ 40.3$ 14.5$ 28.2$ 42.7$ Adjusted EBITDA as a % of net sales 1.7% 1.7% 1.0% 1.7% Three Months Ended December 31, 2013Three Months Ended December 31, 2014 * Pro forma adjustments take into account the merger with UWW Holdings, Inc. and the related financing as if they occurred on January 1, 2013, as well as purchase accounting adjustments and adjustments for one-time costs related to the merger.
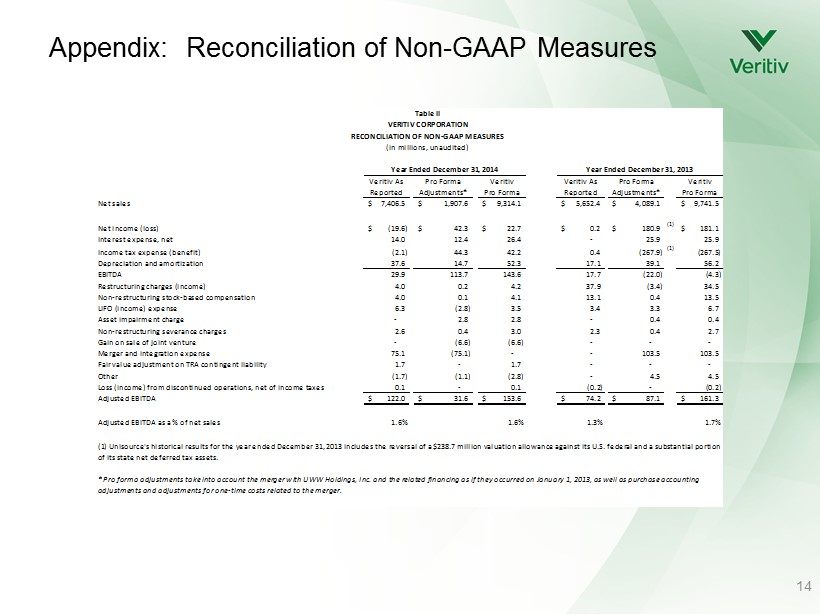
Appendix: Reconciliation of Non - GAAP Measures 14 Table II VERITIV CORPORATION RECONCILIATION OF NON-GAAP MEASURES (in millions, unaudited) Veritiv As Reported Pro Forma Adjustments* Veritiv Pro Forma Veritiv As Reported Pro Forma Adjustments* Veritiv Pro Forma Net sales 7,406.5$ 1,907.6$ 9,314.1$ 5,652.4$ 4,089.1$ 9,741.5$ Net income (loss) (19.6)$ 42.3$ 22.7$ 0.2$ 180.9$ (1) 181.1$ Interest expense, net 14.0 12.4 26.4 - 25.9 25.9 Income tax expense (benefit) (2.1) 44.3 42.2 0.4 (267.9) (1) (267.5) Depreciation and amortization 37.6 14.7 52.3 17.1 39.1 56.2 EBITDA 29.9 113.7 143.6 17.7 (22.0) (4.3) Restructuring charges (income) 4.0 0.2 4.2 37.9 (3.4) 34.5 Non-restructuring stock-based compensation 4.0 0.1 4.1 13.1 0.4 13.5 LIFO (income) expense 6.3 (2.8) 3.5 3.4 3.3 6.7 Asset impairment charge - 2.8 2.8 - 0.4 0.4 Non-restructuring severance charges 2.6 0.4 3.0 2.3 0.4 2.7 Gain on sale of joint venture - (6.6) (6.6) - - - Merger and integration expense 75.1 (75.1) - - 103.5 103.5 Fair value adjustment on TRA contingent liability 1.7 - 1.7 - - - Other (1.7) (1.1) (2.8) - 4.5 4.5 Loss (income) from discontinued operations, net of income taxes 0.1 - 0.1 (0.2) - (0.2) Adjusted EBITDA 122.0$ 31.6$ 153.6$ 74.2$ 87.1$ 161.3$ Adjusted EBITDA as a % of net sales 1.6% 1.6% 1.3% 1.7% Year Ended December 31, 2013Year Ended December 31, 2014 (1) Unisource's historical results for the year ended December 31, 2013 includes the reversal of a $238.7 million valuation allowance against its U.S. federal and a substantial portion of its state net deferred tax assets. * Pro forma adjustments take into account the merger with UWW Holdings, Inc. and the related financing as if they occurred on January 1, 2013, as well as purchase accounting adjustments and adjustments for one-time costs related to the merger.
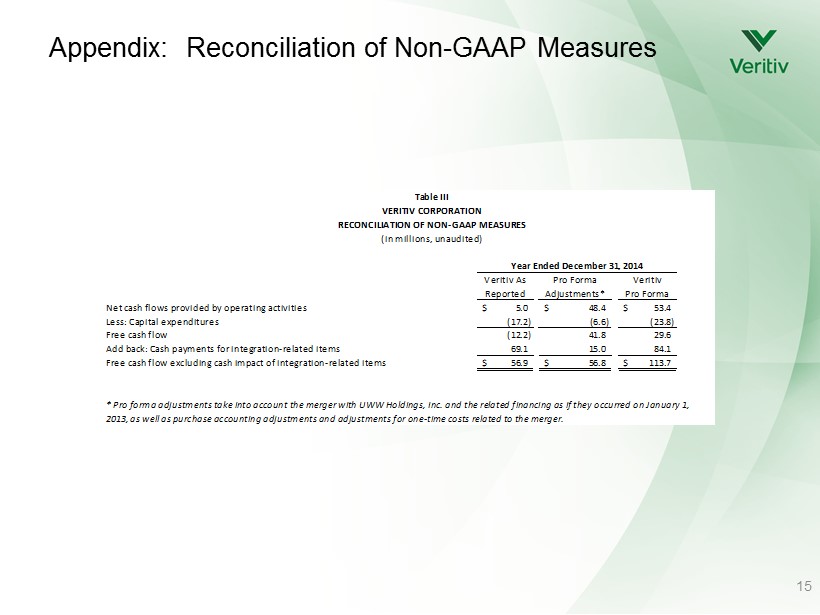
Appendix: Reconciliation of Non - GAAP Measures 15 Table III VERITIV CORPORATION RECONCILIATION OF NON-GAAP MEASURES (in millions, unaudited) Veritiv As Reported Pro Forma Adjustments* Veritiv Pro Forma Net cash flows provided by operating activities 5.0$ 48.4$ 53.4$ Less: Capital expenditures (17.2) (6.6) (23.8) Free cash flow (12.2) 41.8 29.6 Add back: Cash payments for integration-related items 69.1 15.0 84.1 Free cash flow excluding cash impact of integration-related items 56.9$ 56.8$ 113.7$ Year Ended December 31, 2014 * Pro forma adjustments take into account the merger with UWW Holdings, Inc. and the related financing as if they occurred on January 1, 2013, as well as purchase accounting adjustments and adjustments for one-time costs related to the merger.

16

Mary Laschinger, Chairman & CEO 17

March 23, 2015 Veritiv Corporation Fourth Quarter and Full Year 2014 Financial Results