Attached files
| file | filename |
|---|---|
| EX-21 - EX-21 - PFSWEB INC | pfsw-ex21_201412319.htm |
| EX-31.1 - EX-31.1 - PFSWEB INC | pfsw-ex311_201412318.htm |
| EX-31.2 - EX-31.2 - PFSWEB INC | pfsw-ex312_201412316.htm |
| EX-23.1 - EX-23.1 - PFSWEB INC | pfsw-ex231_2014123110.htm |
| EXCEL - IDEA: XBRL DOCUMENT - PFSWEB INC | Financial_Report.xls |
| EX-32.1 - EX-32.1 - PFSWEB INC | pfsw-ex321_201412317.htm |
UNITED STATES
SECURITIES AND EXCHANGE COMMISSION
Washington, D.C. 20549
Form 10-K
|
x |
ANNUAL REPORT PURSUANT TO SECTION 13 OR 15(d) OF THE SECURITIES EXCHANGE ACT OF 1934 |
|
|
For the fiscal year ended December 31, 2014 |
or
|
¨ |
TRANSITION REPORT PURSUANT TO SECTION 13 OR 15(d) OF THE SECURITIES EXCHANGE ACT OF 1934 |
|
|
For the transition period from to |
Commission file number 000-28275
PFSWEB, INC.
(Exact name of registrant as specified in its charter)
|
Delaware |
|
75-2837058 |
|
(State or other jurisdiction of incorporation or organization) |
|
(I.R.S. Employer Identification Number) |
|
505 Millennium Drive, Allen, Texas |
|
75013 |
|
(Address of principal executive offices) |
|
(Zip code) |
Registrant’s telephone number, including area code:
972-881-2900
Securities registered pursuant to Section 12(b) of the Act: None
Securities registered pursuant to Section 12(g) of the Act:
Common Stock, par value $.001 per share
Indicate by check mark if the registrant is a well-known seasoned issuer, as defined in Rule 405 of the Securities Act. Yes ¨ No x
Indicate by check mark if the registrant is not required to file reports pursuant to Section 13 or 15(d) of the Act. Yes ¨ No x
Indicate by check mark whether the registrant (1) has filed all reports required to be filed by Section 13 or 15(d) of the Securities Exchange Act of 1934 during the preceding 12 months (or for such shorter period that the registrant was required to file such reports), and (2) has been subject to such filing requirements for the past 90 days. Yes x No ¨
Indicate by checkmark whether the registrant has submitted electronically and posted on its corporate website, if any, every Interactive Data File required to be submitted and posted pursuant to Rule 405 of Regulation S-T (§ 232.405 of this chapter) during the preceding 12 months (or for such shorter period that the registrant was required to submit and post such files). Yes x No ¨
Indicate by check mark if disclosure of delinquent filers pursuant to Item 405 of Regulation S-K is not contained herein, and will not be contained, to the best of registrant’s knowledge, in definitive proxy or information statements incorporated by reference in Part III of this Form 10-K or any amendment to this Form 10-K. ¨
Indicate by check mark whether the registrant is a large accelerated filer, an accelerated filer or a non-accelerated filer or a smaller reporting company. See definition of “large accelerated filer”, “accelerated filer” and “smaller reporting company” in Rule 12b-2 of the Exchange Act.
|
Large accelerated filer |
|
¨ |
|
Accelerated filer |
|
x |
|
|
|
|
|
|||
|
Non-accelerated filer |
|
¨ (Do not check if a Smaller reporting company) |
|
Smaller reporting company |
|
x |
Indicated by check mark whether the registrant is a shell company (as defined in Rule 12b-2 of the Act). Yes ¨ No x
The aggregate market value of the voting stock held by non-affiliates of the registrant as of June 30, 2014 (based on the closing price as reported by the National Association of Securities Dealers Automated Quotation System) was $107,165,218.
At March 11, 2015, there were 17,230,628 shares of the registrant’s Common Stock issued, $.001 par value.
DOCUMENTS INCORPORATED BY REFERENCE
The information required by Part III of this Annual Report, to the extent not set forth herein, is incorporated herein by reference from the registrant’s definitive proxy statement relating to the annual meeting of shareholders, which definitive proxy statement shall be filed with the Securities and Exchange Commission within 120 days after the end of the fiscal year to which this Annual Report relates.
INDEX
|
|
|
|
Page |
|
|
|
|
|
|
|
|
Item 1. |
|
1 |
||
|
Item 1A. |
|
14 |
||
|
Item 1B. |
|
24 |
||
|
Item 2. |
|
24 |
||
|
Item 3. |
|
24 |
||
|
Item 4. |
|
24 |
||
|
|
|
|
|
|
|
Item 5. |
|
25 |
||
|
Item 6. |
|
25 |
||
|
Item 7. |
|
Management’s Discussion and Analysis of Financial Condition and Results of Operations |
26 |
|
|
Item 7A. |
|
37 |
||
|
Item 8. |
|
38 |
||
|
Item 9. |
|
Changes in and Disagreements with Accountants on Accounting and Financial Disclosure |
66 |
|
|
Item 9A. |
|
66 |
||
|
Item 9B. |
|
67 |
||
|
|
|
|
|
|
|
Item 10. |
|
67 |
||
|
Item 11. |
|
67 |
||
|
Item 12. |
|
Security Ownership of Certain Beneficial Owners and Management and Related Shareholder Matters |
67 |
|
|
Item 13. |
|
Certain Relationships and Related Transactions and Director Independence |
67 |
|
|
Item 14. |
|
67 |
||
|
|
|
|
|
|
|
Item 15. |
|
68 |
||
|
79 |
||||
Unless otherwise indicated, all references to “PFSweb,” “the Company,” “we,” “us” and “our” refer to PFSweb, Inc., a Delaware corporation, and its subsidiaries; references to “PFS” refer to our wholly-owned subsidiaries, Priority Fulfillment Services, Inc., Priority Fulfillment Services of Canada, PFSweb BV (Belgium), REV Solutions, Inc., REVTECH Solutions India Private Limited and LiveAreaLabs, Inc.; references to “Supplies Distributors” refer to our wholly-owned subsidiary Supplies Distributors, Inc. and its subsidiaries; and references to “Retail Connect” refers to our wholly-owned subsidiary PFSweb Retail Connect, Inc.
General
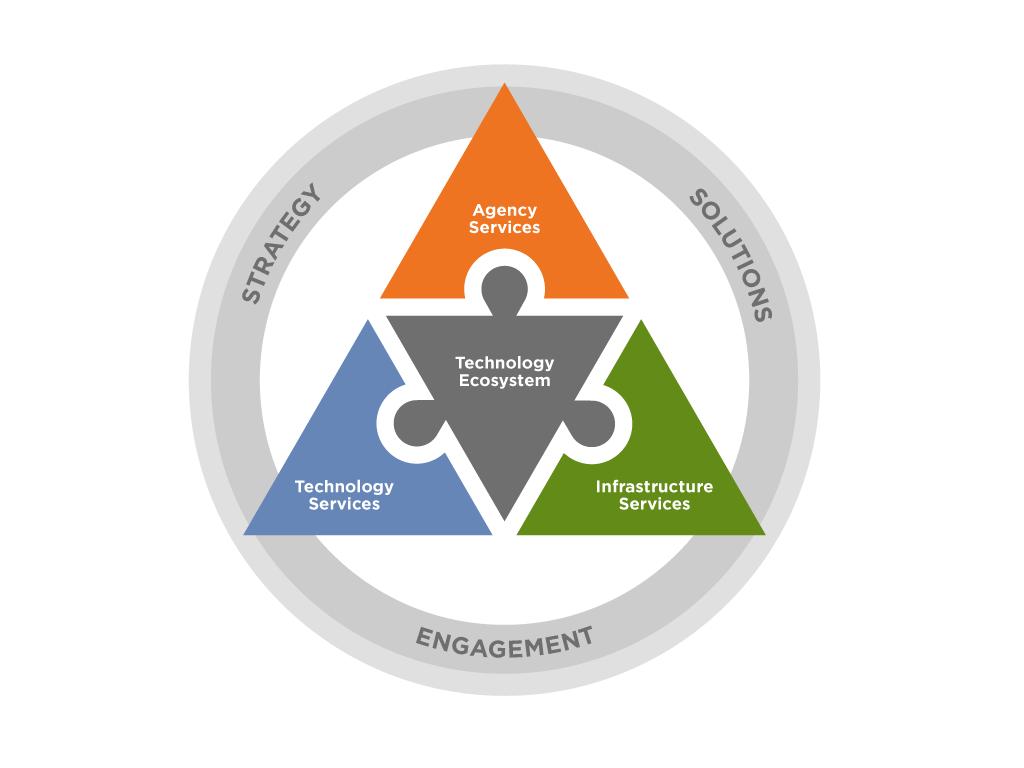
PFSweb is a global provider of omni-channel commerce solutions supporting major brands and other companies seeking to optimize and enhance their online and traditional business channels. Comprised of technology, critical infrastructure, and professional services, we provide our clients with best-of-breed capabilities offered as a complete end-to-end solution or on an à la carte basis. Marketed as PFSweb’s End2End eCommerce® solution and PFSweb Infinite Commerce®, or iCommerceSM, the services we offer are organized into the following categories:
|
● |
Digital Agency Services |
|
● |
Technology Services |
|
● |
Infrastructure Services |
|
● |
Technology Ecosystem |
Our solutions support direct-to-consumer (“DTC”), business-to-business (“B2B”), and retail sales channels. The majority of our clients are the merchants of record for the orders we process through our infrastructure on their behalf. For these clients, we do not own the inventory or the resulting accounts receivable, but provide ecommerce solutions and other services for these client-owned assets.
For some of our clients, we are the merchant of record for the orders we process through our infrastructure. Depending on the terms under these arrangements, we record either product revenue or service fee revenue, may own the accounts receivable and inventory and we may be compensated for all or a portion of our services through the resulting profit margin. In some of these client relationships, we purchase the inventory as the product is delivered to our facility. In other of these client relationships, the client retains ownership of inventory in our facility and we purchase the inventory immediately prior to each individual customer sales transaction. In all of these cases, we seek inventory financing from our clients in the form of extended terms, working capital programs or marketing funds to help offset the working capital requirements that follow accounts receivable and inventory ownership.
1
We are headquartered in Allen, Texas where our executive and administrative offices and our primary technology operations and hosting facilities are located, and certain professional services including digital agency and technology services are performed. We operate state-of-the-art call centers from our U.S. facility located in Dallas, Texas and from our international facilities located in Richmond Hill, Ontario, Canada and Liège, Belgium. We lease or manage warehouse facilities of approximately 1.6 million square feet, many containing highly automated and state of the art material handling and communications equipment in Memphis, Tennessee, Southaven, Mississippi, Grapevine, Texas, Richmond Hill and Markham, Ontario, Canada and Liège, Belgium, allowing us to provide global distribution solutions. Additionally, we engage in business development activities and provide additional digital agency services and/or technology services from our offices in Minneapolis, New York City, Seattle, London, Munich, and Bangalore.
PFSWEB’S END2END ECOMMERCE® SOLUTIONS
PFSweb serves as the “brand behind the brand” for companies seeking to increase efficiencies, enter new markets or launch optimized sales channels. As an eCommerce development firm, digital agency and business process outsourcer, we offer scalable and cost-effective solutions for brand manufacturers, online retailers, and distributors across a wide range of industry segments. We provide our clients with seamless and transparent solutions to support their business strategies, allowing them to focus on their core competencies. Leveraging PFSweb’s technology, expertise and proven methodologies, we enable clients to develop and deploy new products and implement new business strategies or address new distribution channels rapidly and efficiently through our optimized solutions. Our clients engage us both as a consulting partner to assist them in the design of a business solution as well as a virtual and physical infrastructure partner to provide the mission critical operations required to build and manage their business solution. Together, we not only help our clients define new ways of doing business, but also provide them the technology, physical infrastructure and professional resources necessary to quickly implement their business model. We allow our clients to quickly and dramatically change how they “go-to-market.”
Each client has a unique business model and unique strategic objectives that often require highly customized solutions. PFSweb can support clients in a wide array of industries, including fashion apparel and accessories, fragrance and beauty products, consumer packaged goods, home furnishings and housewares, collectibles and toys, consumer electronics, office technology and network connectivity products and aviation spare parts. These clients turn to PFSweb for help in addressing a variety of business needs that include eCommerce creative design and development, customer satisfaction and retention, time-definite logistics, vendor managed inventory and integration, supply chain compression, cost model realignments, transportation management and international expansion, among others. We also act as a constructive agent of change, providing clients the ability to alter their current distribution model, establish direct relationships with end-customers, and reduce the overall time and costs associated with existing distribution channel strategies. Our clients are seeking solutions that will provide them with dynamic supply chain and multi-channel marketing efficiencies, while ultimately delivering a world-class customer service experience.
Our value proposition is to become a seamless, well integrated extension of our clients’ enterprises by delivering superior solutions that drive optimal customer experiences. On behalf of the brands we serve, we strive to increase and enhance sales and market growth, bolster customer satisfaction and customer retention, and drive costs out of the business through operations and technology related efficiencies. As both a virtual and a physical infrastructure for our clients’ businesses, we embrace their brand values and strategic objectives. By utilizing our services, our clients are able to:
Quickly Capitalize on Market Opportunities. Our solutions empower clients to rapidly implement their supply chain and eCommerce strategies and take advantage of opportunities without lengthy integration and implementation efforts. We have readily available advanced technology and physical infrastructure that is flexible in its design, which facilitates quick integration and implementation. The PFSweb solution is designed to allow our clients to deliver consistent quality service as transaction volumes grow and also to handle daily and seasonal peak periods. Through our international locations, our clients can sell their products broadly throughout the world.
Improve the Customer Experience. We enable our clients to provide their customers with a high-touch, positive buying experience thereby maintaining and promoting brand loyalty. Through our use of advanced technology, we can respond directly to customer inquiries by e-mail, voice or data communication and assist them with online ordering and product information. We believe we offer our clients a “world-class” level of service, including Web-enabled customer care service centers, detailed Customer Relationship Management (“CRM”) reporting and exceptional order accuracy. We have significant experience in the development of eCommerce storefronts that allows us to recommend features and functions easily navigated and understood by our clients’ customers. Our technology platform is designed to ensure high levels of reliability and fast response times for our clients’ customers. Because of our technology, our clients benefit from being able to offer the latest in customer communication and response conveniences to their customers.
2
Minimize Investment and Improve Operating Efficiencies. One of the most significant benefits outsourcing provides is the ability to transform fixed costs into variable costs. By eliminating the need to invest in a fixed capital infrastructure, our clients’ costs typically become more directly correlated with volume increases or declines. Further, as volume increases drive the demand for greater infrastructure or capacity, we are able to quickly deploy additional resources. We provide services to multiple clients, which enables us to offer our clients economies of scale, and resulting cost efficiency, that they may not have been able to obtain on their own. Additionally, because of the large number of daily transactions we process, we have been able to justify investments in levels of automation, security surveillance, quality control processes and transportation carrier interfaces that are typically outside the scale of investment that our clients might be able to cost justify on their own. These additional capabilities can provide our clients the benefits of enhanced operating performance and efficiency, reduced inventory shrinkage, and expanded customer service options.
Access a Sophisticated Technology Ecosystem. We provide our clients with access to a Technology Ecosystem featuring best-of-breed eCommerce technologies together in a single, integrated, PCI certified offering. Powered by leading enterprise-class software solutions, our platform is seamlessly integrated into PFSweb's back-end operations to provide an end-to-end eCommerce solution. Built to accelerate the implementation process, the Technology Ecosystem allows for flexible integrations with other technology providers and client systems.
Our Technology Ecosystem also extends beyond the digital world and into physical commerce channels. Brands and retailers today require flexible technology to control customer shopping experiences regardless of where they shop. Deploying ship from store, in-store pick up, or mobile point of sale capabilities are just a few examples of how PFSweb can enable brands to create a dynamic and unique omni-channel shopping experience.
We believe our highest value proposition is achieved when our clients engage our full suite of services from all of the categories included in PFSweb’s End2End eCommerce® solutions. However, we provide our clients with the opportunity to customize their solution by selecting only certain services from our offering in à la carte fashion if they prefer. We believe this flexibility and willingness to create a customized solution for each client differentiates us from our competition.
Digital Agency Services
Our Digital Agency Services provide the key strategy, design, and digital marketing expertise required by leading brands with high expectations. We utilize proven business strategies, agency-based innovation, usability expertise, and eCommerce best practices to harmonize and produce visual ingenuity and tangible results.
We help brands succeed in the digital space by using a comprehensive set of strategy and services, including targeted campaigns and personalized communications, that are designed to attract customers, convert browsers to buyers, and nurture the customer relationship. With various degrees of client engagement, we bring industry expertise to every solution. Our experience in providing end-to-end solutions gives us a 360 degree view of the entire customer experience. These services can be bundled together in unique packages that help drive results through all shopping channels.
Creative Services. Powered by our subsidiary LiveAreaLabs, Inc., a digital creative agency and eCommerce systems integrator acquired in 2014, we collaborate with our clients and partner with other key stakeholders to create online experiences that engage our clients’ customers, drive conversion, and maximize revenue. We focus on user-centered design methodologies to incorporate powerful emotional and visual components.
User Experience. Regardless of device, we understand how our clients’ customers interact with the client brand and how to deploy the best on-site practices to increase conversion rates.
Digital Strategy. We gain an understanding of our clients’ goals, their brand, and their customers to develop digital marketing strategies that deliver results. We specialize in understanding the changing market, emerging digital technologies, and developing comprehensive marketing plans that engage at every touch point.
Search Engine Optimization (SEO) and Paid Search. We use sophisticated and current search engine optimization best practices to drive organic traffic along with expert-driven paid search and retargeting campaigns.
Affiliate Marketing. We build powerful relationships with the influencers promoting our clients’ sites and drive incremental sales for our clients through alternate channels attributing revenue appropriately and tracking and reporting commissions.
Product Merchandising. We create engaging and personalized on-site shopping experiences through dynamic product merchandising. Promotion set-up, on-site search optimization, and A/B testing help convert shoppers into buyers.
3
Comparison Shopping Engines. We have experience creating and managing comparison shopping feeds that will increase brand visibility in a competitive landscape while driving sales for our clients. We use the comparison shopping engine channel to enhance the search engine marketing initiatives and power mobile applications.
Conversion Optimization. We combine industry expertise with best-in-breed technology to increase conversion and increase customers’ average order size. Our team of experts offers services in on-site merchandising, recommendations, personalization, on-site search, and promotion management and support.
Digital Analytics. Through powerful reporting techniques and expert analysis, we provide the key insights and actionable recommendations needed to aid in the growth of our clients’ brands online.
Email Marketing. Our data focused approach to email marketing seeks to increase our clients’ ROI. We test and design emails for custom segments to get the right message to our clients’ customers.
Social Engagement. Our social tactics help facilitate discussions and pull key learnings from social chatter to support and evaluate brand initiatives.
Learning Lab. Our methodology is to plan, execute, and learn while capturing valuable insights. Using our unique learning lab experience, brands can understand meaningful consumer interactions that drive revenue growth. By building a personalized and optimized experience through all customer touch points, brands can improve customer loyalty and brand engagement.
Technology Services
PFSweb's Technology Services build world-class eCommerce websites that are designed to maximize revenue opportunities. Built by a seasoned group of professionals, we combine strategy and technology to create innovative user experiences. From high-fashion apparel to consumer packaged goods, our portfolio consists of brands that accept only the highest quality shopping websites.
We use a proven methodology to deliver quality implementations to meet some of the strictest brand requirements in the industry. Our project teams are comprised of industry-leading professionals that bring eCommerce and web development best practices to our clients’ custom solutions. Once live, our team applies the same level of excellence to ongoing development, site maintenance, and solutions support.
Direct-to-Consumer eCommerce (“DTC”). PFSweb’s End2End eCommerce® solution for the DTC online channel features Demandware eCommerce, a leading third party Software-as-a-Service (“SaaS”) eCommerce platform. As a Demandware Strategic Solution and End-to-End Partner, we are one of the premier Demandware development organizations. Following the establishment of our Demandware partnership in 2008, we have become one of the largest international Demandware development teams in the world and maintain a talented team of Demandware certified developers who create world-class user experiences for some of the world's leading brands. We have fully integrated Demandware with the rest of our world-class technology platform, including other best-of-breed technology partners to create a PFSweb reference application that provides our clients with a very high-function DTC online store out-of-the-box. We are able to use the PFSweb reference application as a starting point to quickly create a completely customized online store for our DTC clients. Designed specifically for DTC brands, our comprehensive offering redefines end-to-end eCommerce by enabling retailers and branded consumer goods manufacturers with the ability to employ a total outsourcing solution customized to their particular eCommerce strategy, without the loss of site or brand control associated with earlier end-to-end outsourcing solutions.
Through the 2014 acquisition of REV Solutions, Inc., an eCommerce systems integrator, we enhanced our Demandware practice and broadened the portfolio of technology services with the addition of Oracle ATG. As an Oracle Gold Partner, we launch commerce initiatives for major brands. Oracle Commerce (which now includes ATG Commerce) is a leading platform consisting of commerce applications to provide seamless customer experiences across multiple touch points. We continue to innovate with Oracle Commerce to drive sales, reduce cycle times, decrease costs, and improve service levels for our clients.
eCommerce Development. With one of the most experienced teams of Demandware and Oracle developers, our staff is ready to build custom eCommerce solutions for our clients. We employ a proven development methodology, led by a highly-qualified team of solutions architects, web developers, project managers, and Quality Assurance (“QA”) testers. When paired with our Agency Services, we can provide an entire suite of services that spans strategy, creative, project management, web development, and quality assurance.
Platform Support. Our work doesn't stop when we launch an eCommerce site. Our Platform Support team provides real-time management and monitoring to ensure our clients’ sites are always operating at peak performance. We provide Level 1/2/3 technical, business, and solutions support for optimal issue management.
4
Quality Assurance. Whether it's a new site build or ongoing development, our team of QA experts employ a full-service test suite that includes quality assurance scripting and testing, regression, load testing, and automation.
Training. We provide on-site, personalized platform training from experienced subject-matter experts. Our training team empowers our clients’ business and merchandising staff with the knowledge they need to operate and optimize their eCommerce sites. Core training includes platform essentials, advanced merchandising, front-end design, and developer training.
Business-to-Business eCommerce (“B2B”). PFSweb’s End2End eCommerce® solution for the B2B online channel features our GlobalMerchant Commerceware service that provides a complete eCommerce website solution for our B2B clients. We engage collaboratively with our clients to design, build, host, and manage fully branded, fully customized and fully integrated eCommerce web applications for B2B channels. We offer a broad range of hosting and support plans that can be tailored to fit the needs of each client. Utilizing Microsoft’s .NET Technologies and our proprietary GlobalMerchant Commerceware platform, we maintain a robust hosting environment for our hosted client B2B web sites.
Omni-Channel Order Management
Order Management Interfaces. Our order management system (OMS), based on the Oracle JD Edwards ERP suite, is a scalable solution built for DTC and B2B order processing. We also offer a distributed order management solution utilizing the Shopatron Retailer software that is tightly integrated with our internal OMS. This solution provides retailers with a complete technology solution for integrating both online and offline channels. Our order management technology solutions provide interfaces that allow for real-time information retrieval, including information on inventory, sales orders, shipments, delivery, purchase orders, warehouse receipts, customer history, accounts receivable and credit lines. These solutions are seamlessly integrated with our web-enabled customer contact centers, allowing for the processing of orders through shopping cart, phone, fax, mail, email, web chat, and other order receipt methods. As the information backbone for our total supply chain solution, order management services can be used on a stand-alone basis or in conjunction with our other business infrastructure offerings, including customer contact, financial or distribution services. In addition, for the B2B market, our technology platform provides a variety of order receipt methods that facilitate commerce within various stages of the supply chain. Our systems provide the ability for both our clients and their customers to track the status of orders at any time. Our services are transparent to our clients’ customers and are seamlessly integrated with our clients’ internal system platforms and web sites. By synchronizing these activities, we can capture and provide critical customer information, including:
|
● |
Statistical measurements critical to creating a quality customer experience, containing real-time order status, order exceptions, back order tracking, allocation of product based on timing of online purchase and business rules, the ratio of customer inquiries to purchases, average order sizes and order response time; |
|
● |
B2B supply chain management information critical to evaluating inventory positioning, for the purpose of improving inventory turns, and assessing product flow-through and end-user demand; |
|
● |
Reverse logistics information, including customer response and reason for the return or rotation of product and desired customer action; |
|
● |
Detailed marketing information about what was sold and to whom it was sold, by location and preference; and |
|
● |
Web traffic reporting showing the number of visits (“hits”) received, areas visited, and products and information requested. |
Product Content Management. PFSweb's iCommerce PCM solution provides a comprehensive set of tools for creating, integrating, mastering, and syndicating product content efficiently across an entire organization. Leveraging enterprise-class product information management (PIM) software powered by Riversand Technologies, we provide a SaaS-based solution that enables brands to maximize the selling value of their product content across all commerce channels.
Technology Collaboration. We have created a suite of technology services that enable buyers and suppliers to fully automate their business transactions within their supply chain using the order management interfaces. Our collaboration technologies operate in an open systems environment and feature the use of industry-standard XML and SOA web services, enabling customized eCommerce solutions with minimal changes to a client’s systems or our Enterprise Resource Planning (“ERP”) systems. The result is a faster implementation process. We also support information exchange methods such as AS2, FTP, SFTP, EDI, MQ Series, ALE, HTTP, and HTTPS.
5
Information Management. We have the ability to communicate with and transfer information to and from our clients through a wide variety of technology services, including real-time web service enabled data interfaces, file transfer methods and electronic data interchange. Our systems are designed to capture, store and electronically forward to our clients critical information regarding customer inquiries and orders, product shipments, inventory status (for example, levels of inventory on hand, on backorder, on purchase order and inventory due dates to our warehouse), product returns and other information. Our systems are capable of providing our clients with customer inventory and order information for use in analyzing sales and marketing trends and introducing new products. We also offer customized reports and data analyses based upon specific client needs to assist them in their budgeting and business decision process. We are managing this information while securing data and complying with various privacy regulations.
Infrastructure Services
Our infrastructure services provide the operational activities required and expected of the world's leading brands. We have DTC and B2B experience in customizing solutions to meet the unique nuances of our clients’ internal finance, customer care, and supply chain operations. With more than 1.6 million square feet of leased or managed distribution space and approximately 1,000 call center seats across two continents, we have the global infrastructure to meet the operational needs of our eCommerce and traditional B2B clients.
As the operational backbone of the online and B2B shopping experience, we focus on three core actions: to deliver, to communicate, and to fulfill the promise behind each brand we support.
Order Fulfillment
We design advanced pick-pack-ship operations that streamline our clients’ supply chain process and offer a flexible fulfillment distribution model. Our fulfillment team understands the value of the delivery experience by specializing in creating branded solutions with gift wrap and other branded services. Our distribution centers are located in the Memphis area, Toronto, and Belgium to provide centrally located fulfillment throughout North America and Europe.
Advanced Distribution Facilities and Infrastructure. An integral part of our solution is the warehousing and distribution of our clients’ inventory. We currently have more than 1.6 million square feet of leased or managed warehouse distribution space domestically and internationally to store and process our own and our clients’ inventory. We receive inventory in our distribution centers, verify shipment accuracy, unpack and audit packages (a process that includes spot-checking a percentage of the inventory to validate piece counts and check for damages that may have occurred during shipping, loading and unloading). Upon request, we inspect for other damages or defects, which may include checking fabric, stitching and zippers for soft goods, or ‘testing’ power-up capabilities for electronic items as well as product specifications. We generally stock for sale within one business day of unloading. We pick, pack and ship customer orders and can provide customized packaging, customized monogramming, personalized laser engraving, capabilities of high volume shrink packaging, inserts and promotional literature for distribution with customer orders. For many clients, we provide gift-wrapping services including line level gifting, customized gift-wrapping paper, ribbon, gift-box and gift-messaging.
Our distribution facilities contain computerized sortation equipment, flexible mobile pick-to-light carts, powered material handling equipment, scanning and bar-coding systems and automated conveyors and in-line scales. Our distribution facilities include several advanced technology enhancements, such as radio frequency technology in product receiving processing to ensure accuracy, as well as an automated package routing and a pick-to-light paperless order fulfillment system. Our advanced distribution systems provide us with the capability to warehouse an extensive number of stock keeping units (SKUs), ranging from large high-end electronics to small cosmetic compacts. Our facilities are flexibly configured to process B2B and DTC orders from the same central location.
In addition to our advanced distribution systems, our pick-to-light carts, stationary pick-to-light areas and conveyor system controls provide real time productivity reporting, thereby providing our management team with the tools to implement productivity standards. This combination of computer-controlled equipment provides the seamless integration of our pick-to-light systems and mass sortation capabilities. This unique combination of technologies ensures high order accuracy for each and every customer order.
We are able to take advantage of a variety of shipping and delivery options, which range from next day service to zone skipping, to optimize transportation costs. Our facilities and systems are equipped with multi-carrier functionality, allowing us to integrate with all leading package carriers and provide a comprehensive freight and transportation management offering.
We offer reverse logistics management services, including issuing return authorizations, return carrier shipping labels, receipt of product, crediting customer accounts and disposition of returned product. We also leverage strategic partnerships to provide our
6
clients with access to distributed returns centers that collect, consolidate, report on and forward to our central facilities returned product allowing us to accelerate credits to our clients’ customers, reduce freight costs for our client, improve customer service and reduce complexity and cost in our facilities from handling inbound returns.
Our domestic facilities provide trained security professionals from our security headquarters in Memphis, Tennessee and Southaven, Mississippi. Continual validation and the use of current and retired law enforcement professionals ensures that we employ the latest in security processes and procedures to further enhance our surveillance and detection capabilities.
Facility Operations and Management. Our facilities management service offering includes distribution facility design and optimization, business process reengineering and ongoing staffing and management. Along with our multi-brand operations in Mississippi and Tennessee, we also manage dedicated client-owned/leased facilities on behalf of two of our clients: an aircraft parts distribution center in Grapevine, Texas and a DTC facility in Memphis, Tennessee for a major retailer. Our expertise in supply chain management, logistics and customer-centric fulfillment operations extends through our management of client-owned/leased facilities, resulting in cost reductions, process improvements and technology-driven efficiencies.
Kitting and Assembly Services. Our expanded kitting and assembly services enable our clients to reduce the time and costs associated with managing multiple suppliers, warehousing hubs, and light manufacturing partners. As a single source provider, we provide the advantage of convenience, accountability and speed. Our kitting and assembly services include light assembly, specialized kitting and supplier-consigned inventory hub either in our distribution facilities or co-located elsewhere. We also offer customized light manufacturing and supplier relationship management (“SRM”).
We work with clients to re-sequence certain supply chain activities to aid in an inventory postponement strategy. We can provide kitting and assembly services and build-to-stock thousands of units daily to stock in a Just-in-Time (“JIT”) environment. This service, for example, can entail the procurement of packaging materials including retail boxes, foam inserts and anti-static bags. These raw material components may be shipped to us from domestic or overseas manufacturers, and we will build the finished SKUs to stock for the client. Also included is the custom configuration of high-end printers and servers. This strategy allows manufacturers to make a smaller investment in base unit inventory while meeting changing customer demand for highly customizable products.
Our standard capabilities include: build-to-order, build-to-stock, expedited orders, passive and active electrostatic discharge (“ESD”) controls, product labeling, serial number generation, marking and/or capture, lot number generation, asset tagging, bill of materials (“BOM”) or computer automated design (“CAD”) engineering change processing, SKU-level pricing and billing, manufacturing and metrics reporting, first article approval processes, and comprehensive quality controls.
Kitting and inventory hub services enable clients to collapse supply chains into the minimal steps necessary to prepare product for distribution to any channel, including wholesale, mass merchant retail, or direct to consumer. Clients no longer have to employ multiple providers or require suppliers to consign multiple inventory caches for each channel. We offer our clients the opportunity to consolidate operations from a channel standpoint, as well as from a geographic perspective. Our integrated, global information systems and international locations support business needs worldwide.
Product Management and Inspection Services. We also operate a coupon management system and product management program. Coupons are managed and activated by a unique serial number, thus significantly reducing fraudulent activity. Our capabilities also extend into salvage operations, allowing our clients to reclaim valuable raw materials and components from discontinued or obsolete inventory.
We operate a test and repair center where we visually inspect items for cosmetic defects. These items are put through rigorous testing that includes: functionality, durability, accessory inspection and packaging. Items that pass the testing are repackaged and resold with a noted exception of “open-box” merchandise. Items that fail the inspection are disassembled and working spare parts are saved for future use in repairs.
7
High Compliance Distribution Related to Food and Cosmetic Products. We also operate a Food and Drug Administration (“FDA”) compliant facility, which meets the Consolidated Standards for Inspection along with regulatory developments required by the FDA under the Food Safety Modernization Act and other industry best practices.
Customer Care
Our internal call center operations are focused on providing essential services such as order entry, returns authorization, and order tracking. These operations also include our iCommerce Agent (“iCA”), a customizable web-based application featuring powerful customer service tools for accessing all required customer information. Our unique multi-lingual capabilities are possible through our strategically placed locations in Dallas, Belgium, Toronto, and our partner location in Hungary.
Customer Relationship Management. Through our web enabled CRM platform, iCA, our unique technology leverages the client’s website investment by wrapping CRM capabilities around the existing website. Through iCA, agents provide customer service functions, such as placing orders, checking order status, facilitating returns, gathering “voice of the customer” information, initiating upsell and cross sell, and managing escalations. iCA is fully integrated into the client’s website front end and our data analytics platform and order processing system, allowing full visibility into customer history and customer trends. Through each of our customer touch-points, information can be analyzed and processed for current or future use in business evaluation, product effectiveness and positioning, and supply chain planning. Through this fully integrated system, we are able to provide a complete customer care solution in a PFSweb customer care center or on a license basis to our clients’ owned or outsourced customer care centers.
Customer Assistance. An important feature of evolving commerce is the ability for the customer to speak with a live customer service representative. Our experience has been that many consumers tell us they visited the web location for information, but not all of those consumers chose to place their order online. Our customer care services utilize features that integrate voice, e-mail, standard mail, fax, data and Internet chat communications to respond to and handle customer inquiries. Our customer care representatives answer various questions, acting as virtual representatives of our clients’ organization, regarding order status, shipping, billing, returns and product information and availability as well as a variety of other questions. Our web-enabled customer care technology identifies each customer contact automatically and routes it to the appropriate customer care representative who is individually trained in the clients’ business and products.
Our web-enabled customer care centers are flexibly designed so that our customer care representatives can handle either several different clients and products in a shared agent environment, thereby creating economy of scale benefits for our clients, or through a highly customized dedicated agent support model that provides the ultimate customer experience and brand reinforcement.
Quality Monitoring. Quality is essential in our client solutions. As representatives of our clients, our customer care representatives must adhere to the unique quality standards of each client. We continually monitor the quality of our customer care representatives against each client quality standard and use the results to provide agent-level feedback to continually improve the customer care experience. Clients may participate in the quality process by remotely listening to calls, assisting in the grading of recorded calls, and providing ongoing direction to improve quality standards.
Customer Self-Help. With the need for efficiency and cost optimization for many of our clients, we have integrated interactive voice response (“IVR”) as another option for customer contacts. IVR creates an “electronic workforce” with virtual agents that can assist customers with vital information at any time of the day or night. IVR allows for our clients’ customers to deal interactively with our system to handle basic customer inquiries, such as account balance, order status, shipment status, catalog requests, product and price inquiries, and routine order entry for established customers. The inclusion of IVR in our service offering allows us to offer a cost effective way to handle high volume, low complexity calls.
Financial Services
Protecting our clients’ brand with secure payment processing and fraud management services is critical to a successful operation. We also provide flexible global payment options as well as gift cards, B2B invoicing, and VAT services.
Our financial services are divided into two major areas: 1) billing, credit, collection and cash application services for B2B clients and 2) fraud review, chargeback management and processing and settlement of credit card services for DTC clients.
Business-to-Business Financial Management. For B2B clients, we offer full-service accounts receivable management and collection capabilities, including the ability to generate customized computer-generated invoices in our clients’ names. We assist clients in reducing accounts receivable and days sales outstanding, while minimizing costs associated with maintaining an in-house
8
collections staff. We offer electronic credit services in the format of EDI and XML communications direct from our clients to their vendors, suppliers and retailers.
Direct-to-Consumer Financial Management. For DTC clients, we offer secure credit card processing related services for orders made via a client web site or through our customer contact center. We offer manual credit card order review as an additional level of fraud protection. We also calculate sales taxes, goods and services taxes or value added taxes, if applicable, for numerous taxing authorities and on a variety of products. Using third-party leading-edge fraud protection services and risk management systems, we can offer high levels of security and reduce the level of risk for client transactions.
Professional Consulting Services
As part of the tailored solution for our clients, we offer a full team of experts specifically designated to focus on our clients’ businesses. Team members play a consultative role, providing constructive evaluation, analysis and recommendations for the client’s business. This team creates customized solutions and devises plans that will increase efficiencies and produce benefits for the client when implemented.
Comprised of industry experts from top-tier consulting firms and industry market leaders, our team of professional consultants provides client service focus and eCommerce, customer care, logistics and distribution expertise. They have built solutions for Fortune 1000 and Global 2000 market leaders in a wide range of industries, including multi-channel retailers, apparel, technology, telecommunications, cosmetics, aviation, housewares, high-value collectibles, sporting goods, pharmaceuticals and several more. Focusing on the evolving infrastructure needs of major corporations and their business initiatives, our team has a solid track record providing consulting services in the areas of interactive marketing eCommerce, supply chain management, distribution and fulfillment, technology interfacing, logistics and customer support.
SELLER SERVICES FINANCIAL MODELS
Service Fee Model
We refer to the standard PFS seller services financial model as the “Service Fee” model. In this model, our clients own the inventory and are the merchants of record and engage us to provide various business outsourcing services in support of their business operations. We provide ecommerce website services, inventory and order management, customer service, payment processing, and operations reports such as product sales, sales tax, and inventory management reports. In this model, we provide infrastructure and services and the clients are responsible for all financial operations and reporting related to the sales transactions.
The Service Fee model is designed to generate margins for our clients consistent with other retailers in our clients’ product category and provide bottom line financial results for our clients similar to other retailers in their space. We report service fee revenues from clients in this model in our traditional PFSweb service fee segment.
Agent (Flash) Financial Model
As an additional service, we offer an “Agent”, or “Flash” model, in which our clients maintain ownership of the product inventory stored at our locations. When a customer orders the product from our clients, a “flash” sale transaction passes product ownership to us for each order and we in turn immediately re-sell the product to the customer. The “flash” ownership exchange establishes us as the merchant of record, which enables us to use our existing merchant infrastructure to process sales to end customers, removing the need for clients to establish these business processes internally, but permitting them to control the sales process to end customers. In this model, based on the terms of our current client arrangements, we record product revenue net of cost of product revenue as a component of service fee revenue in our consolidated statement of operations.
Retail Financial Model
In addition to the Service Fee and the Agent models, we also offer a “Retail” model. Under the Retail model, a PFSweb subsidiary purchases inventory from the client. In the Retail model, we place the initial and replenishment purchase orders with the client and take ownership of the product upon delivery to our facility.
Because we are the product owner as well as the merchant of record, we work closely with the client to plan sales and promotional activities. Under the Retail model, depending upon the product category and sales characteristics, we may require the client to provide product price protection as well as product purchase payment terms, right of return, and obsolescence protection appropriate to the product sales profile as well as potential reimbursement for uncollectible customer accounts receivable balances. Since we purchase and own the inventory and accounts receivable, this business model may require significant working capital requirements for which we have credit available either through credit terms provided by our clients or under senior credit facilities.
9
Depending on the terms of our client arrangements in the Retail model, we record either: 1) gross revenue - product revenue or 2) net revenue - product revenue net of cost of product revenue as a component of service fee revenue in our consolidated statement of operations.
The costs of all standard PFSweb services normally billed on a transaction basis under the Service Fee model, as well as certain credit risks, may be covered by the selling margin under the Retail model arrangement. The bottom line financial results for our client should be similar to the financial benefits from the retail channel, although unlike the traditional retail channel, our clients generally control the presentation and branding of the web site and own all the customer data from the eCommerce activities.
In general, we seek to structure client relationships in our Retail model under the net revenue approach, although we have one client still utilizing the gross revenue approach. We use our Retail model to enable our Supplies Distributors subsidiary to serve as a global distributor of printer supplies for Ricoh Infoprint Solutions Company (“IPS”), a wholly-owned subsidiary of Ricoh Company Ltd. (“Ricoh”). In this model, the product revenues are reported in our Business and Retail Connect segment.
INDUSTRY INFORMATION AND COMPETITIVE LANDSCAPE
Industry Overview
Business activities in the public and private sectors continue to operate in an environment of rapid technological advancement, increasing competition and continuous pressure to improve operating and supply chain efficiency while decreasing costs. We currently see the following trends within the industry:
|
● |
Manufacturers strive to restructure their supply chains to maximize efficiency and reduce costs in both B2B and DTC markets, and to create a variable-cost supply chain able to support the multiple, unique needs of each of their initiatives, including traditional and electronic commerce. |
|
● |
Companies in a variety of industries seek outsourcing as a method to address one or more business functions that are not within their core business competencies, to reduce operating costs or to improve the speed or cost of implementation. |
|
● |
Retailers, both traditional and e-commerce only, partner with end to end providers to provide a turnkey solution to support their e-commerce channels. Providers with a global presence provide additional value to companies pursuing an international expansion strategy. |
Supply Chain Management Trend
As companies maintain focus on improving their businesses and balance sheet financial ratios, significant efforts and investments continue to be made identifying ways to maximize supply chain efficiency and extend supply chain processes. Working capital financing, vendor managed inventory, supply chain visibility software solutions, distribution channel skipping, direct to consumer eCommerce sales initiatives, and complex upstream supply chain collaborative technology are products that manufacturers seek to help them achieve greater supply chain efficiency.
A key business challenge facing many manufacturers and retailers as they evaluate their supply chain efficiency is in determining how the trend toward increased DTC business activity will impact their traditional B2B and DTC commerce business models. Order management and small package fulfillment and distribution capabilities are becoming increasingly important processes as this trend evolves. We believe manufacturers will look to outsource their non-core competency functions to support this modified business model. We believe companies will continue to strategically plan for the impact that eCommerce and other new technology advancements will have on their traditional commerce business models and their existing technology and infrastructure capabilities.
Manufacturers, as buyers of materials, are also imposing new business practices and policies on their supplier partners to shift the normal supply chain costs and risks associated with inventory ownership away from their own balance sheets. Through techniques like Vendor Managed Inventory or Consigned Inventory Programs (“CIP”), manufacturers are asking their suppliers, as a part of the supplier selection process, to provide capabilities where the manufacturer need not own, or even possess, inventory prior to the exact moment that unit of inventory is required as a raw material component or for shipping to a customer. To be successful for all parties, business models such as these often require a sophisticated collection of technological capabilities that allow for complete integration and collaboration of the information technology environments of both the buyer and supplier. For example, for an inventory unit to arrive at the precise required moment in the manufacturing facility, it is necessary for the Manufacturing Resource Planning systems of the manufacturer to integrate with the CRM systems of the supplier. When hundreds of supplier partners are involved, this process can become quite complex and technologically challenging. Buyers and suppliers are seeking solutions that utilize XML based protocols and traditional EDI standards to ensure an open systems platform that promote easier technology integration in these collaborative solutions.
10
Outsourcing Trend
In response to growing competitive pressures and technological innovations, we believe many companies, both large and small, are focusing their critical resources on the core competencies of their business and utilizing eCommerce and infrastructure services to accelerate their business plans in a cost-effective manner and perform non-core business functions. Outsourcing can provide many key benefits, including the ability to:
|
● |
Enter new business markets or geographic areas rapidly; |
|
● |
Increase flexibility to meet changing business conditions and demand for products and services; |
|
● |
Enhance customer satisfaction and gain competitive advantage; |
|
● |
Reduce capital and personnel investments and convert fixed investments to variable costs; |
|
● |
Improve operating performance and efficiency; and |
|
● |
Capitalize on skills, expertise and technology infrastructure that would otherwise be unavailable or expensive given the scale of the business. |
Typically, many outsourcing service providers are focused on a single function, such as information technology, call center management, credit card processing, warehousing or package delivery. This focus creates several challenges for companies looking to outsource more than one of these functions, including the need to manage multiple outsourcing service providers, to share information with service providers and to integrate that information into their internal systems. Additionally, the delivery of these multiple services must be transparent to the customer and enable the client to maintain brand recognition and customer loyalty. Furthermore, traditional commerce outsourcers are frequently providers of domestic-only services versus international solutions. As a result, companies requiring global solutions must establish additional relationships with other outsourcing parties.
Another vital point for major brand name companies seeking to outsource is the protection of their brand. When looking for an outsourcing partner to provide infrastructure solutions, brand name companies must find a company that can provide the same quality performance and superior experience their customers expect from their brands. Working with an outsourcing partner requires finding a partner that can maintain the consistency of their brand image, which is one of the most valuable intangible assets that recognized brand name companies possess.
Competition
We face competition from many different sources depending upon the type and range of services requested by a potential client. Many other companies offer one or more of the same services we provide on an individual basis. Our competitors include vertical outsourcers, which are companies that offer a single function solution. We compete with transportation logistics providers, known in the industry as 3PL’s and 4PL’s (third or fourth party logistics providers), who offer product management functions as an ancillary service to their primary transportation services. We also compete against other eCommerce and infrastructure service providers, who perform various services similar to our solution offerings. Additionally, we see competition from agencies providing creative, commerce strategy and system integration services.
In many instances, we compete with the in-house operations of our potential clients themselves. Occasionally, the operations departments of potential clients believe they can perform the same services we do, at similar quality levels and costs, while others are reluctant to outsource business functions that involve direct customer contact. We cannot be certain we will be able to compete successfully against these or other competitors in the future.
Although many of our competitors offer one or more of our services, we believe our primary competitive advantage is our ability to offer a full array of customized services marketed as PFSweb’s End2End eCommerce® solutions, thereby eliminating any need for our clients to coordinate these services from many different providers. We believe we can differentiate ourselves by offering our clients a very broad range of eCommerce and business process services that address, in many cases, the entire value chain, from demand to delivery.
11
We also compete on the basis of many other important additional factors, including:
|
● |
experience supporting a specific product vertically; |
|
● |
operating performance and reliability; |
|
● |
ease of implementation and integration; |
|
● |
experience of the people required to successfully and efficiently design and implement solutions; |
|
● |
experience operating similar solutions dynamically; |
|
● |
leading edge technology capabilities; |
|
● |
global reach; and |
|
● |
price. |
We believe we can compete favorably with respect to many of these factors. However, the market for our services is competitive and continually evolving, and we may not be able to compete successfully against current and future competitors.
Competitive Landscape
End-to-end Commerce. In North America, we compete with full service commerce providers such as eBay Enterprise, Trade Global and OneStop, as well as other providers such as Speed Commerce and Newgistics. In the European market, we compete with companies such as Yoox and other geographically focused providers in Western Europe.
Agency Services and Technology Services. We compete with a wide range of digital agency and system integration firms, each with varying degrees of experience with Demandware or Oracle ATG, including SapientNitro, OSF, Accenture (Acquity), and Lyons Consulting Group.
Infrastructure Services. Our infrastructure business competes with eCommerce focused order fulfillment providers such as Innotrac and OHL, as well as, depending on the client’s retail and/or supply chain strategy, Excel Logistics, UPS Logistics, and other “pure-play” fulfillment or call center providers.
COMPANY INFORMATION
Clients and Marketing
Our target clients include traditional retailers, online retailers and leading technology and consumer goods brands looking to quickly and efficiently implement or enhance business initiatives, adapt their go-to-market strategies, or introduce new products, programs or geographies, without the burden of modifying or expanding their technology, customer care, supply chain and logistics infrastructure. Our solutions are applicable to a multitude of industries and company types and we have provided solutions for such companies as:
Procter & Gamble (consumer packaged goods), L’Oréal (health & beauty), LEGO Brand Retail (toys), T.J. Maxx (apparel and home fashion), Columbia Sportswear (active outdoor apparel), Diageo (premium beverages), Roots Canada Ltd. (apparel), BCBGMAXAZRIA (high fashion), Ricoh (printer supplies), Xerox (printers and printer supplies) and Hawker Beechcraft Corp. (facilities management and time-definite logistics supporting parts distribution) among many others.
We target potential clients through an extensive integrated marketing program comprised of a variety of direct marketing techniques, email marketing initiatives, trade event participation, search engine marketing, public relations, social media and a sophisticated outbound tele-sales lead generation model. We have also developed global business development methodology which allows us to effectively showcase our various eCommerce and infrastructure service solutions and products. We also pursue strategic marketing alliances with consulting firms, software manufacturers and other logistics providers to increase market awareness and generate referrals and customer leads.
Because of the highly complex nature of the solutions we provide, our clients demand significant competence and experience from a variety of different business disciplines during the sales cycle. As such, we often utilize a member of our executive team to lead the design and proposal development of each potential new client we choose to pursue. The executive is supported by a select group of highly experienced individuals from our professional services group with specific industry knowledge of, or experience with, the solutions development process. We employ a team of highly trained implementation managers whose responsibilities include the oversight and supervision of client projects and maintaining high levels of client satisfaction during the transition process between the various stages of the sales cycle and steady state operations.
12
Technology
We maintain advanced management information systems and have automated key business functions using online, real-time or batch systems. These systems enable us to provide information concerning sales, inventory status, customer payments and other operations essential for us and our clients to efficiently manage electronic commerce and supply chain business programs. Our systems are designed to scale rapidly to handle the transaction processing demands of our clients and our growth.
Many internal infrastructures are not sufficient to support the explosive growth in e-business, e-marketplaces, supply chain compression, distribution channel realignment and the corresponding demand for real-time information necessary for strategic decision-making and product fulfillment. To address this need, we have created PFSweb’s End2End eCommerce® platform to enable companies with little or no eCommerce infrastructure to speed their time to market and minimize resource investment and risk, and to allow all companies involved to improve the efficiency of their supply chain.
Using the various components of our collaboration technology suite, we can assist our clients in easily integrating their web sites or ERP systems to our systems for real-time web service enabled transaction processing without regard for their hardware platform or operating system. This high-level of systems integration allows our clients to automatically process orders, customer data and other eCommerce information. We also can track information sent to us by the client as it moves through our systems in the same manner a carrier would track a package throughout the delivery process. Our systems enable us to track, at a detailed level, information received, transmission timing, any errors or special processing required and information sent back to the client.
We have invested in advanced telecommunications, computer telephony, electronic mail and messaging, automated fax technology, IVR technology, barcode scanning, wireless technology, fiber optic network communications and automated inventory management systems. We have also developed and utilize telecommunications technology that provides for automatic customer call recognition and customer profile recall for inbound customer service representatives.
The primary responsibility of our systems development team of IT professionals is directed at implementing custom solutions for new clients and maintaining existing client relationships. Our development team can also produce proprietary systems infrastructure to expand our capabilities in circumstances where we cannot purchase standard solutions from commercial providers. We also utilize temporary and/or contract resources when needed for additional capacity.
Our information technology operations and infrastructure are built on the premise of reliability and scalability. We maintain diesel generators and un-interruptible power supply equipment to provide constant availability to computer rooms, call centers and warehouses. Multiple internet service providers and redundant web servers provide for a high degree of availability to web sites that interface with our systems. Capacity planning and upgrading is performed regularly to allow for quick implementation of new clients and avoid time-consuming infrastructure upgrades that could slow growth rates. In the event of a disastrous situation, we also have a disaster recovery plan that provides geographically separated and comparably equipped data centers that are able to recover stored data in a reasonable and effective manner.
Employees
As of December 31, 2014, we had approximately 1,700 employees, of which approximately 1,100 were located in the United States. We have never suffered an interruption of business as a result of a labor dispute. We consider our relationship with our employees to be good. In the U.S., Canada and India, we are not a party to any collective bargaining agreements and while our European subsidiaries are not a party to a collective-bargaining agreement, they are required to comply with certain rules agreed upon by their employee Works Councils.
Our success in recruiting, hiring and training large numbers of skilled employees and obtaining large numbers of hourly employees and temporary staff during peak periods for distribution and call center operations is critical to our ability to provide high quality distribution and support services. Call center representatives and distribution personnel receive feedback on their performance on a regular basis and, as appropriate, are recognized for superior performance or given additional training. Generally, our clients provide specific product training for our customer service representatives and, in certain instances, on-site client personnel to provide specific technical support. To maintain good employee relations and to minimize employee turnover, we strive to offer competitive pay, hire primarily full-time employees who are eligible to receive a full range of employee benefits, and provide employees with clear, visible career paths.
13
Internet Access to Reports
We maintain an Internet website, www.pfsweb.com. Our annual reports on Form 10-K, quarterly reports on Form 10-Q, and current reports on Form 8-K (and amendments, if any, to those reports filed or furnished pursuant to Section 13(a) or 15(d) of the Securities Exchange Act of 1934) are made available, free of charge, through the investor relations section of this website as soon as reasonably practicable after we electronically file such material with, or furnish it to, the Securities and Exchange Commission. The information on this website is not incorporated in this report.
Government Regulation
We are subject to federal, state, local and foreign consumer protection laws, including laws protecting the privacy of our customers’ personally identifiable information and other non-public information and regulations prohibiting unfair and deceptive trade practices. Furthermore, the growth and demand for online commerce has and may continue to result in more stringent consumer protection laws that impose additional compliance burdens and greater penalties on online companies. Moreover, there is a trend toward regulations requiring companies to provide consumers with greater information regarding, and greater control over, how their personal data is used, and requiring notification when unauthorized access to such data occurs. For example, many states currently require us to notify each of our customers who are affected by any data security breach in which an unauthorized person, such as a computer hacker, obtains such customer’s name and one or more of the customer’s social security number, driver’s license number, credit or debit card number or other similar personal information. In addition, several jurisdictions, including foreign countries, have adopted privacy-related laws that restrict or prohibit unsolicited email promotions, commonly known as “spam,” and that impose significant monetary and other penalties for violations. One such law, the CAN-SPAM Act of 2003 and the recent anti-spam legislation passed in Canada impose complex, burdensome and often ambiguous requirements in connection with our sending commercial email to our customers and potential customers. Moreover, in an effort to comply with these laws, Internet service providers may increasingly block legitimate marketing emails. These consumer protection laws may become more stringent in the future and could result in substantial compliance costs and could interfere with the conduct of our business.
Our business, financial condition and operating results could be adversely affected by any or all of the following factors, in which event the trading price of our common stock could decline, and you could lose part or all of your investment.
Risks Related to Our Business
We operate with significant levels of indebtedness and are required to comply with certain financial and non-financial covenants; we are required to maintain a minimum level of subordinated loans to our subsidiary Supplies Distributors; and we have guaranteed certain indebtedness and obligations of our subsidiaries.
As of December 31, 2014, our total credit facilities outstanding, including debt, capital lease obligations and our vendor accounts payable related to financing of Ricoh product inventory, was approximately $19 million. Certain of the credit facilities have maturity dates in calendar year 2016 or beyond, but are classified as current liabilities in our consolidated financial statements given the underlying nature of the credit facility. We cannot provide assurance that our credit facilities will be renewed by the lending parties. Additionally, these credit facilities include both financial and non-financial covenants, many of which also include cross default provisions applicable to other agreements. These covenants also restrict our ability to transfer funds among our various subsidiaries, which may adversely affect the ability of our subsidiaries to operate their businesses or comply with their respective loan covenants. We cannot provide assurance that we will be able to maintain compliance with these covenants. A non-renewal, default under or acceleration of any of our credit facilities could have a material adverse impact upon our business and financial condition. In addition, we have provided $2.5 million of subordinated indebtedness to Supplies Distributors as of December 31, 2014. The maximum level of this subordinated indebtedness to Supplies Distributors that may be provided without approval from our lenders is $5.0 million. The restrictions on increasing this amount without lender approval may limit our ability to comply with certain loan covenants or further grow and develop Supplies Distributors’ business. We have guaranteed most of the indebtedness of Supplies Distributors. Furthermore, we are obligated to repay any over-advance made to Supplies Distributors by its lenders to the extent Supplies Distributors is unable to do so.
14
Our business and future growth depend on our continued access to bank and commercial financing.
Our business and future growth currently depend on our ability to access bank, vendor and commercial lines of credit. We currently depend on line of credit facilities provided by various banks and commercial lenders that provided for an aggregate of up to approximately $58 million in available financing as of December 31, 2014. These lines of credit currently mature at various dates through April 2016 and are secured by substantially all our assets. Our ability to renew our lines of credit depends upon various factors, including the availability of bank loans and commercial credit in general, as well as our financial condition and prospects. Therefore, we cannot guarantee that these credit facilities will continue to be available beyond their current maturities on reasonable terms or at all. Our inability to renew or replace our credit facilities or find alternative financing would materially adversely affect our business, financial condition, operating results and cash flow.
We are uncertain about the availability of additional capital.
We may require additional capital to take advantage of opportunities, including strategic alliances and acquisitions, and to fund capital expenditures, or to respond to changing business conditions and unanticipated competitive pressures. We may also require additional funds to finance operating losses. Should these circumstances arise, our existing cash balance and credit facilities may be insufficient and we may need to raise additional funds either by borrowing money or issuing additional equity or both. We cannot assure you that such resources will be adequate or available for all of our future financing needs. Our inability to finance our growth, either internally or externally, may limit our growth potential and our ability to execute our business strategy. If we are successful in completing an additional equity financing, this could result in further dilution to our shareholders’ ownership or reduce the market value of our common stock.
We anticipate incurring significant expenses in the foreseeable future, which may reduce our ability to achieve or maintain profitability.
To reach our business growth objectives, we currently expect to increase our operating and marketing expenses, as well as capital expenditures. To offset these expenses, we will need to generate additional profitable business. If our revenue declines or grows slower than either we anticipate or our clients’ projections indicate, or if our operating and marketing expenses exceed our expectations or cannot be reduced to an appropriate level, we may not generate sufficient revenue to be profitable or be able to sustain or increase profitability on a quarterly or annual basis in the future. Additionally, if our revenue grows slower than either we anticipate or our clients’ projections indicate, we may incur unnecessary or redundant costs and our operating results could be adversely affected.
Our service fee revenue and gross margin are dependent upon our clients’ business and transaction volumes and our costs. A reduction in our clients’ ecommerce business or our inability to grow our business or increase service fee revenue from new or existing clients could negatively impact our operating results.
Our service fee revenue is primarily transaction and project based and fluctuates with the volume of transactions or level of sales of the products by our clients for whom we provide infrastructure services and the size and scope of projects for clients for whom we perform technology and digital agency services. If we are unable to retain existing clients or attract new clients, or if we dedicate significant resources to clients whose business does not generate revenues at projected levels or sufficient revenues, or whose products do not generate substantial customer sales, our business may be materially adversely affected in a number of ways.
For example, we seek to maintain sufficient capacity in our fulfillment, call center and professional services operations and computer technology systems to support our projected existing and new client business activity, including seasonal volumes and we currently plan on increasing capacity to support future projected growth. The fixed cost structure of many of these investments limits our flexibility to reduce our costs when excess capacity occurs. A reduction in our clients’ business or our inability to grow our business or increase service fee revenue from new or existing clients could result in an underutilization in our invested assets. While certain of our building leases permit early termination in advance of their regular scheduled maturity date, these early terminations would require incremental termination related payments which reduce the potential benefit of this flexibility.
Similarly, salaries and payroll-related expenses are a significant component of our costs. Balancing our workforce levels against the demands for our services is difficult. We generally cannot reduce our labor costs as quickly as negative changes in revenue may occur. In order to maintain scalability to meet client demand, we may retain underutilized employees. To achieve our desired level of profitability, we must maintain our utilization at an appropriate rate. If we are unable to achieve and maintain our target utilization rates, our profitability could be adversely impacted. Further, if labor costs increase, this could put upward pressure on our costs and adversely affect our profitability if we are unable to recover these increased costs by increasing the prices for our services.
15
Moreover, our ability to estimate service fee revenue for future periods is substantially dependent upon our clients’ and our own projections, the accuracy of which has been, and will continue to be, unpredictable. Therefore, our planning for client activity and targeted goals for service fee revenue and gross margin may be materially adversely affected by incomplete, delayed or inaccurate projections. In addition, most of our service agreements with our clients are non-exclusive and we cannot assure you any of our clients will continue to use our services for any period of time. The loss of a significant amount of service fee revenue due to client terminations or material reductions in the services provided to one or more clients could have a material adverse effect on our ability to cover our costs and thus on our profitability.
We may incur financial penalties if we fail to meet contractual service levels under client service agreements.
Many of our client service agreements contain minimum service level requirements and impose financial penalties if we fail to meet such requirements. The imposition of a substantial amount of such penalties could have a material adverse effect on our business and operations. In the event we are unable to meet the service levels expected by the client, our relationship with the client will suffer and may result in financial penalties and/or the termination of the client contract.
We are dependent on our key personnel, and we need to hire and retain skilled personnel to sustain our business.
Our performance is highly dependent on the continued services of our executive officers and other key personnel, the loss of any of whom could materially adversely affect our business. In addition, we need to attract and retain other highly-skilled, technical and managerial personnel for whom there is intense competition. We cannot assure you we will be able to attract and retain the personnel necessary for the continuing growth of our business. Our inability to attract and retain qualified technical and managerial personnel could materially adversely affect our ability to maintain and grow our business significantly.
Our business may suffer if we are unable to hire and retain sufficient temporary workers or if labor costs increase. In addition, recent healthcare legislation and related regulations could affect our cost of providing healthcare benefits adversely affecting our results and cash flows.
We regularly hire a large number of part-time and seasonal workers, particularly during the fourth quarter holiday season and to meet temporary increases in client activity volume related to “flash sales” and other short-term marketing programs. Any difficulty we may encounter in hiring such workers could result in significant increases in labor costs, or inability to support our clients’ business, which could have a material adverse effect on our business, financial condition and results of operations. Competition for labor could substantially increase our labor costs. In addition, the Patient Protection and Affordable Care Act and regulations that interpret the law contain provisions which could materially impact our future healthcare costs. While the legislation’s ultimate impact is not yet known, it is possible that these changes could significantly increase our employee benefits costs which would adversely affect our results and cash flows. Although we seek to preserve the contractual ability to pass through increases in labor costs to our clients, not all of our current contracts provide us with this protection, and we may enter into contracts in the future which limit or prohibit our ability to pass through increases in labor costs to our clients.
Our business is susceptible to risks associated with international operations.
Outside of the United States, we currently maintain distribution facilities, call centers, technology centers, administrative offices and/or have sales personnel in Belgium, Canada, Germany, India and the United Kingdom, and we currently intend to expand our international operations. We cannot assure you we will be successful in expanding in these or any additional international markets. In addition to the uncertainty regarding our ability to generate revenue or profits from foreign operations and expand our international presence, there are risks inherent in doing business internationally that we have not generally faced in our U.S. operations, including:
|
● |
lack of familiarity with, and resulting risk of breach of, and/or unanticipated additional cost of compliance with, foreign laws and regulations governing privacy, data security, data transfer, employment, taxes, tariffs, trade restrictions, transfer pricing and other matters; |
|
● |
changes in regulatory environments; |
|
● |
difficulties and expenses associated with localizing our services and operations to local markets, including language and cultural differences; |
|
● |
difficulties in staffing and managing international operations, including complex and costly hiring, disciplinary, and termination requirements; |
|
● |
the complexities of foreign value-added taxes and restrictions on the repatriation of earnings; |
|
● |
reduced or varied protection for intellectual property rights in some countries; |
|
● |
political, social and economic instability abroad, terrorist attacks and security concerns; |
16
|
● |
fluctuations in currency exchange rates; and |
|
● |
increased accounting and reporting burdens and complexities. |
Additionally, operating in international market requires significant management attention and financial resources. We cannot be certain that the investments and additional resources required to establish and maintain operations in other countries will hold their value or produce desired levels of revenues or profitability. Any negative impact from our international business efforts could negatively impact our business, results of operations and financial condition as a whole.
Our financial results may be adversely affected by fluctuations in the foreign currency exchange markets.
The revenues and expenses of our international operations generally are denominated in local currencies. Accordingly, we are subject to exchange rate fluctuations between such local currencies and the U.S. dollar. These exchange rate fluctuations subject us to currency translation risk with respect to the reported results of our international operations. Significant strengthening or weakening of the U.S. dollar against currencies like the Canadian Dollar and the Euro may materially impact our revenue and profits. As we continue to expand our presence in India, we will have increased exposure to fluctuations between the Indian Rupee and the U.S. dollar. In addition, we have transactions with clients, as well as inter-company transactions between our subsidiaries, that cross currencies and expose us to foreign currency gains and losses. These types of events are difficult to predict and may recur. There can be no assurance that we will be able to reduce the currency risks associated with our international operations. We seek to manage our exposure to changes in foreign currency exchange rates through our normal operating and financing activities and, if deemed appropriate, we may use derivative financial instruments. There is no assurance that we will be successful in managing or controlling foreign currency risks.
We may engage in future strategic alliances or acquisitions that could dilute our existing shareholders’ ownership, cause us to incur significant expenses or harm our business. Acquisitions can result in an increase in our operating costs, divert management's attention away from other operational matters and expose us to other risks associated with acquisitions.
We have made two recent acquisitions and we continually evaluate potential acquisitions to complement our current business or enhance our technological capabilities. We consider acquisitions to be an important part of our future growth strategy. Acquisitions, including our recent acquisitions of REV Solutions and LiveAreaLabs, involve numerous risks, including, but not limited to:
|
● |
difficulties and increased costs in connection with the acquisition and integration of personnel, operations, technologies and services of acquired companies; |
|
● |
diversion of management's attention from other operational matters; |
|
● |
the potential loss of our key employees and the key employees of acquired companies; |
|
● |
our inability to achieve the intended cost efficiency, level of profitability or other intended strategic goals for the acquisitions, strategic investments, joint ventures or other strategic alliances; |
|
● |
lack of synergy, or inability to realize expected synergies, resulting from the acquisition; |
|
● |
the risk that the issuance of our common stock, if any, in an acquisition or merger, or the consolidation of an acquired company’s financial results could be dilutive to our shareholders; |
|
● |
acquired assets becoming impaired as a result of technological advancements or worse-than-expected performance of the acquired company; |
|
● |
inability to complete proposed transactions as anticipated or at all and incurrence of costs associated with uncompleted transactions; |
|
● |
the potential impact of the announcement or consummation of a proposed transaction on the market value of our common stock or relationships with third parties; |
|
● |
reductions in cash balances and/or increases in debt obligations to finance activities associated with a transaction, including future payments under earnouts and other contingent payments, which reduce the availability of cash flow for general corporate or other purposes or impact our financial results; and |
|
● |
inadequacy or ineffectiveness of an acquired company’s internal financial controls, disclosure controls and procedures, and/or other policies or practices; and unknown, underestimated and/or undisclosed commitments or liabilities. |
17
Our financial results may be negatively impacted by impairment in the carrying value of our goodwill and intangible assets.
Goodwill and identifiable intangible assets represented approximately 7% of our total assets as of December 31, 2014. The carrying value of goodwill represents the fair value of an acquired business in excess of identifiable assets and liabilities as of the acquisition date. We are required to test goodwill and intangible assets for impairment annually, as well as on an interim basis to the extent that factors or indicators become apparent that could reduce the fair value of any of our reporting units below its book value. Such factors requiring an interim test for impairment include financial performance indicators such as negative or declining cash flows or a decline in actual or planned revenue or earnings and a sustained decrease in share price. Our cash flow estimates involve projections that are inherently subject to change based on future events. A significant downward revision in the fair value of one or more of our business units that causes the carrying value to exceed the fair value could cause goodwill or intangible assets to be considered impaired, and could result in a non-cash impairment charge in our consolidated statement of operations.
Our business and profitability could be adversely affected if the operations of one or more of our facilities were interrupted or shut down as the result of a natural disaster.
We operate a majority of our distribution facilities in the Memphis, Tennessee area and our headquarters and call center operations are centered in the Dallas, Texas area. We also maintain facilities in Canada, Europe and India. A natural disaster or other serious disruption to our facilities due to fire, tornado, flood, severe weather or any other cause could substantially disrupt our operations and could impair our ability to adequately service our clients and customers. In addition, we could incur significantly higher costs during the time it takes for us to reopen or replace any one or more of our facilities, which may or may not be reimbursed by insurance. As a result, disruption at one or more of our facilities could adversely affect our business and profitability.
A breach of our eCommerce security measures could reduce demand for our services. Credit card fraud and other fraud could adversely affect our business.
A requirement of the continued growth of eCommerce is the secure transmission of confidential information over public networks. A party who is able to circumvent our security measures could misappropriate proprietary information or interrupt our operations. Any compromise or elimination of our security could reduce demand for our services.
We may be required to expend significant capital and other resources to protect against security breaches or to address any problem they may cause. Because our activities involve the storage and transmission of proprietary information, such as credit card numbers, security breaches could damage our reputation, cause us to lose clients, impact our ability to attract new clients and we could be exposed to litigation and possible liability. Our security measures may not prevent security breaches, and failure to prevent security breaches may disrupt our operations. The failure to adequately control fraudulent transactions on either our behalf or our client’s behalf could increase our expenses and expose us to reputational damage which would adversely affect our business.
We may be liable for misappropriation of our customers’ and our clients’ customers’ personal information.
Data security laws are becoming more stringent in the United States and abroad. Third parties are engaging in increased cyber-attacks against companies doing business on the Internet and individuals are increasingly subjected to identity and credit card theft on the Internet. If third parties or unauthorized employees are able to penetrate our network security or otherwise misappropriate our customers’ or our clients’ customers’ personal information or credit card information, or if we give third parties or our employees’ improper access to customers’ personal information or credit card information, we could be subject to liability. This liability could include claims for unauthorized purchases with credit card information, impersonation or other similar fraud claims. This liability could also include claims for other misuses of personal information, including unauthorized marketing purposes. Liability for misappropriation of this information could decrease our profitability and adversely affect our business. In such circumstances, we also could be liable for failing to provide timely notice of a data security breach affecting certain types of personal information. In addition, the Federal Trade Commission and state agencies have brought numerous enforcement actions against Internet companies for alleged deficiencies in those companies’ privacy and data security practices, and they may continue to bring such actions. We could incur additional expenses if new regulations regarding the collection, use or storage of personal information are introduced or if government agencies investigate our privacy or security practices.
18
We rely on encryption and authentication technology to provide the security and authentication necessary to effect secure transmission of sensitive customer information such as customer credit card numbers. Advances in computer capabilities, new discoveries in the field of cryptography or other events or developments may result in a compromise or breach of the measures that we use to protect customer transaction data. If any such compromise of security were to occur, it could subject us to liability, damage our reputation and diminish the value of our brand-name. A party who is able to circumvent the security measures could misappropriate proprietary information or cause interruptions in operations. We may be required to expend significant capital and other resources to protect against such security breaches or to alleviate problems caused by such breaches. Our security measures are designed to prevent security breaches, but our failure to prevent such security breaches could subject us to liability, damage our reputation and diminish the value of our brand-name.
Our insurance policies may not fully cover all losses we may incur.
Although we attempt to limit our liability for damages arising from negligent acts, errors or omissions through contractual provisions, the limitations of liability included in our contracts may not fully protect us from liability or damages and may not be enforceable in all instances. In addition, not all of our contracts may limit our exposure for certain liabilities, such as data security claims or claims of third parties for which we may be required to indemnify our clients. Although we have general liability and errors and omissions insurance coverage, this coverage may not continue to be available on terms reasonable to us or in sufficient amounts to cover one or more large claims, and our insurers may disclaim coverage as to any future claim. The successful assertion of one or more large claims against us that are excluded from our insurance coverage or that exceed our available insurance coverage, or changes in our insurance policies (including premium increases or the imposition of large deductible or co-insurance requirements), could have a material adverse effect on our business, results of operations, financial condition and cash flows.
Changes in regulations, regulatory scrutiny, or user concerns regarding privacy and protection of user data could adversely affect our business.
We are subject to U.S. and foreign laws relating to the collection, use, retention, security and transfer of personally identifiable information. The interpretation and application of user data protection laws are in a state of flux, and may vary from country to country. In many cases, these laws apply not only to third-party transactions, but also to transfers of information between or among ourselves, our subsidiaries and other parties with which we have commercial relations. Further, these laws continue to develop in ways we cannot predict and which may adversely impact our business. For example, new laws or regulations, in particular, financial or privacy laws or regulations, may be enacted in jurisdictions in which we do business that require data (including customer information, transaction data or other information) to be stored locally on servers in that jurisdiction and/or prohibit such data from being transmitted outside of that jurisdiction, which would increase our operational costs or capital expenditures and potentially impact the performance or availability of our services and/or our ability to use or process customer data.
We or our clients may be a party to litigation involving our eCommerce intellectual property rights. If third parties claim we or our clients are infringing their intellectual property rights, we could incur significant litigation costs, be required to pay damages, or change our business or incur licensing expenses.
Third parties have asserted, and may in the future assert, that our business or the technologies we use infringe on their intellectual property rights. As a result, we or our clients may be subject to intellectual property legal proceedings and claims in the ordinary course of business. We cannot predict whether third parties will assert claims of infringement in the future or whether any future claims will prevent us from offering popular products or services. If we or our clients are found to infringe, we may be required to pay monetary damages, which could include treble damages and attorneys’ fees for any infringement that is found to be willful, and either be enjoined or required to pay ongoing royalties with respect to any technologies found to infringe. Further, as a result of infringement claims either against us or our clients, we may be required, or deem it advisable, to develop non-infringing technology, which could be costly and time consuming, or enter into costly royalty or licensing agreements. Such royalty or licensing agreements, if required, may be unavailable on terms that are acceptable, or at all. If a third party successfully asserts an infringement claim against us or our clients and we are enjoined or required to pay monetary damages or royalties or we are unable to develop suitable non-infringing alternatives or license the infringed or similar technology on reasonable terms on a timely basis, our business, results of operations and financial condition could be materially harmed.
We rely on third party providers for a portion of our client services, and we are subject to various risks and liabilities if we are unable to continue our relationship with such providers, such providers do not provide the third party services or provide them in a manner that does not meet required service levels.
We currently, and may in the future, rely on third party providers, such as Demandware, to provide various material portions of our solution service offering. If our business relationship with a third-party provider of a material portion of our solution service offering is negatively affected, or is terminated, we might not be able to deliver the corresponding service offering to our clients,
19
which could cause us to lose clients and future business, reducing our revenues. Under the terms of several of our contracts with our service clients, we remain liable to provide such third party services and may be liable for the actions and omissions of such third party providers. In certain instances, certain clients prepay in advance a portion of the service fees payable in respect of the third party services, and, under certain circumstances, including our breach or the breach by our third party provider of our or their respective obligations, we are liable to refund all or a portion of such prepaid fees. Consequently, in the event our third party provider fails to provide the third party services in compliance with required services levels, or otherwise breaches its obligations, or discontinues its business, whether as the result of bankruptcy, insolvency or otherwise, we may be required to provide such services at a higher cost to us and may otherwise be liable for various costs and expenses related to such event. In addition, any such failure may damage our reputation and otherwise result in a material adverse effect upon our business and financial condition.
We may incur liability for indemnification obligations under our contracts with our clients and business partners, which may have a material adverse effect upon our business, results of operations and financial condition.
We include indemnification provisions in the contracts we enter into with our clients and business partners. Generally, the provisions require us to defend claims arising out of our infringement of third-party intellectual property rights, breach of contractual obligations and/or unlawful or otherwise culpable conduct, including breach of data security. The indemnity obligations generally cover damages, costs and attorneys’ fees arising out of such claims. In many instances, our indemnification obligations to our clients include the actions or omissions of our third-party service providers. Although we seek to limit our total liability under such provisions to either a portion of the value of the contract or a specified, agreed-upon amount, in some cases our total liability under such provisions is unlimited. Although in most cases our third party service providers indemnify us for their actions and omissions, such providers may dispute or be unable to satisfy their indemnification obligation to us. In addition, our indemnification obligation to our clients may be broader in scope, or may be subject to larger limitations of liability, than the indemnification obligation of our third party service providers to us. In most cases, the term of the indemnity provision is perpetual. If we are required to indemnify a claim in a material amount, or if a series of indemnification claims are in the aggregate a material amount, we may be required to expend significant resources to defend the claims, which may have a material adverse effect upon our business, results of operations and financial condition.
Our business is subject to the risk of customer and supplier concentration.
For 2014, no individual client represented more than 10% of our service fee revenue. For 2015, we currently expect one client to represent between 10% to 15% of our service fee revenue. Most of our client agreements state a contract expiration date, but many also include an early termination clause permitting the client to terminate the contract for convenience prior to its stated expiration date or to reduce the scope of services or delay the commencement of services to be provided under the contract. Termination, reduction, or delay of our services under a contract could result from factors unrelated to our work product or the progress of the project, such as factors related to business or financial conditions of the client, changes in client strategies or the domestic or global economy generally. The early termination, reduction or substantial delay of services any significant client, or nonrenewal of any significant client contract, or the nonpayment of a material amount of our service fees by a significant client, could have a material adverse effect upon our business, results of operation and financial condition.
The majority of our Supplies Distributors product revenue is generated by sales of product purchased under distributor agreements with Ricoh. These agreements are terminable at will and no assurance can be given that Ricoh will continue the distributor agreements with Supplies Distributors. Supplies Distributors does not have its own sales force and relies upon Ricoh’s sales force and product demand generation activities for its sale of Ricoh product. As a result of certain operational restructuring of its business, Ricoh has implemented, and will continue to implement, certain changes in the sale and distribution of Ricoh products. The changes have resulted, and are expected to continue to result, in reduced revenues and profitability for Supplies Distributors. Further reduction in the Ricoh business may have a material adverse effect on Supplies Distributors’ business and may adversely affect our overall financial condition.
Sales by Supplies Distributors to two customers in the aggregate accounted for approximately 26% of Supplies Distributors’ total product revenue for the year ended December 31, 2014 and 8% of consolidated net revenue. The loss of one or both of such customers, or non-payment of any material amount by these or any other customer, would have a material adverse effect upon Supplies Distributors’ business, results of operations and financial condition.
Our operating results are materially impacted by our client mix and the seasonality of their business.
Our business is materially impacted by our client mix and the seasonality of their business. Based upon our current client mix and their current projected business volumes, we anticipate our service fee revenue business activity will be at its highest in our fourth quarter. We are unable to predict how the seasonality of future clients’ business may affect our quarterly revenue and whether the seasonality may change due to modifications to a client’s business. As such, we believe results of operations for a quarterly period may not be indicative of the results for any other quarter or for the full year.
20
Our systems may not accommodate significant growth in our number of clients.
Our success depends on our ability to handle a large number of transactions for many different clients in various product categories. We expect the volume of transactions will increase significantly as we expand our operations. In addition, client marketing programs, such as “secret sales”, “flash sales” or holiday related promotions often result in significant short-term spikes in transaction volumes. When this occurs, additional stress is placed upon our network hardware and software and our ability to efficiently manage our operations, and we cannot assure you of our ability to efficiently manage a large number of transactions. If we are not able to maintain an appropriate level of operating performance, we may be in breach of our client contractual obligations, develop a negative reputation, and impair existing and prospective client relationships and our business would be materially adversely affected.
We may not be able to recover all or a portion of our start-up costs associated with one or more of our clients.
We generally incur start-up costs in connection with the planning and implementation of business process solutions for our clients. Although we generally attempt to recover these costs from the client in the early stages of the client relationship, or upon contract termination if the client terminates without cause prior to full amortization of these costs, there is a risk that the client contract may not fully cover the start-up costs or that the client will terminate the contract for cause and withhold payment of any unamortized start-up costs. To the extent start-up costs exceed the start-up fees received, certain excess costs will be expensed as incurred. Additionally, in connection with new client contracts, we generally incur capital expenditures associated with assets whose primary use is related to the client solution. There is a risk that the contract may end before expected and we may not recover the full amount of our capital costs.
We face competition from many sources that could adversely affect our business; growth in our clients’ ecommerce business may make it more efficient for the client to perform our services themselves.
Many companies offer, on an individual basis, one or more of the same services we do, and we face competition from many different sources depending upon the type and range of services requested by a potential client. Our competitors include vertical outsourcers, which are companies that offer a single function, such as call centers, public warehouses or professional services firms such as system integrators and digital agencies. We compete against transportation logistics providers who offer product management functions as an ancillary service to their primary transportation services. We also compete against other infrastructure service providers, who perform many similar services as us. Many of these companies have greater capabilities than we do for the single or multiple functions they provide. In addition, we compete against other professional service firms that have substantial offshore operations with lower labor costs, which enable them to offer lower pricing to potential clients. In many instances, our competition is the in-house operations of potential clients themselves. The in-house operations of potential clients often believe they can perform the same services we do, while others are reluctant to outsource business functions that involve direct customer contact. We cannot be certain we will be able to compete successfully against these or other competitors in the future.
In addition, growth in our clients’ ecommerce businesses may cause a client to consider making the necessary investments to process their ecommerce operations in-house. In such event, unless we can provide a more cost-effective solution to the client, the client may choose to terminate our services. There is no assurance that we will be able to provide a more cost-effective solution, or that any such solution will not reduce our profitability or be accepted by the client.
Our sales and implementation cycles are highly variable and our ability to finalize pending contracts may cause our operating results to vary widely.
The sales cycle for our services is variable, typically ranging between several months to up to a year or longer from initial contact with the potential client to the signing of a contract. Occasionally the sales cycle requires substantially more time. Delays in signing and executing client contracts may affect our revenue and cause our operating results to vary widely. A potential client’s decision to purchase our services is discretionary, involves a significant commitment of the client’s resources and is influenced by intense internal and external pricing and operating comparisons. To successfully sell our services, we generally must educate our potential clients regarding the use and benefit of our services, which can require significant time and resources. Consequently, the period between initial contact and the purchase of our services is often long and subject to delays associated with the lengthy approval and competitive evaluation processes that typically accompany significant operational decisions. Additionally, the time required to finalize pending contracts and to implement our systems and integrate a new client can range from several weeks to many months. Delays in signing and integrating new clients may affect our revenue and cause our operating results to vary widely.
21
Our business could be adversely affected by a systems or equipment failure, whether ours or our clients.
Our operations are dependent upon our ability to protect our distribution facilities, customer service centers, computer and telecommunications equipment and software systems against damage and failures. Damage or failures could result from fire, power loss, equipment malfunctions, system failures, natural disasters and other causes. If our business is interrupted either from accidents or the intentional acts of others, our business could be materially adversely affected. In addition, in the event of widespread damage or failures at our facilities, our short-term disaster recovery and contingency plans and insurance coverage may not be sufficient.
Our clients’ businesses may also be harmed from any system or equipment failures we experience. In that event, our relationship with these clients may be adversely affected, we may lose these clients, our ability to attract new clients may be adversely affected and we could be exposed to liability.
Interruptions could also result from the intentional acts of others, like hackers. If our systems are penetrated by computer hackers, or if computer viruses infect our systems, our computers could fail or proprietary information could be misappropriated.
If our clients suffer similar interruptions in their operations, for any of the reasons discussed above or for others, our business could also be adversely affected. Many of our clients’ computer systems interface with our systems. If our clients suffer interruptions in their systems, the link to our systems could be severed and sales of the client’s products could be slowed or stopped.
We and our clients may be subject to sales tax in one or more jurisdictions which adversely affect our business.
We collect sales or other similar taxes for shipments of our and our clients’ goods in certain states and jurisdictions. One or more local, state or foreign jurisdictions may seek to impose sales tax collection obligations on us and other out-of-state companies, including our clients, that engage in online commerce, depending upon the nexus we or our clients may have with that jurisdiction and the product or services being performed. If unexpected sales tax obligations are successfully imposed upon us or our clients by a state or other jurisdiction, we or our clients could be exposed to substantial tax liabilities for past sales and fines and penalties for failure to collect sales taxes and we or our clients could suffer decreased sales in that state or jurisdiction as the effective cost of purchasing goods from or through us increases for those residing in that state or jurisdiction. In addition, new legislation or regulation, the application of laws and regulations from jurisdictions whose laws do not currently apply to our business or the application of existing laws and regulations to the Internet and commercial online services could result in significant additional taxes or regulatory restrictions on our business. These taxes could have an adverse effect on our cash flows and results of operations. Furthermore, there is a possibility that we or our clients may be subject to significant fines or other payments for any past failures to comply with these requirements.
Determinations under government audits could negatively affect our business.
We provide services to a U.S. government agency under a contract that provides the agency with the right to audit and review our performance under the contract, our pricing practices, our cost structure, and our compliance with applicable laws, regulations, and standards. If a government audit determines that we are in breach of our contractual terms, or have engaged in improper or illegal activities, we may be subject to civil and criminal penalties and administrative sanctions, including termination of the contract, suspension of payments, or disqualification from continuing to do business, or bidding on new business, with this agency and other federal agencies.
We may recognize losses or reduced profitability if we do not accurately estimate the cost of engagements conducted on a fixed-price basis.
When making a proposal for or managing a fixed-price engagement, we rely on our estimates of costs and timing for delivering our services, which may be based on limited data and could be inaccurate. If we do not accurately estimate our costs and the timing for completion of a fixed-price project, the contract for such a project could prove unprofitable or yield a profit margin that is lower than expected. Losses, if any, on fixed-price contracts are recognized when the loss is determined. Any increased or unexpected costs or unanticipated delays in connection with the performance of fixed-price contracts, including delays caused by factors outside of our control, could make these contracts less profitable or unprofitable and may affect the amount of revenue, profit, and profit margin reported in any period.
22
Risks Related to Our Industry
Our market is subject to rapid technological change and to compete we must continually enhance our systems to comply with evolving standards.
To remain competitive, we must continue to enhance and improve the responsiveness, functionality and features of our services and the underlying network infrastructure. If we are unable to adapt to changing market conditions, client requirements or emerging industry standards, our business could be adversely affected. The internet and eCommerce environments are characterized by rapid technological change, changes in user requirements and preferences, frequent new product and service introductions embodying new technologies and the emergence of new industry standards and practices that could render our technology and systems obsolete. Our success will depend, in part, on our ability to both internally develop and license leading technologies to enhance our existing services and develop new services. We must continue to address the increasingly sophisticated and varied needs of our clients and respond to technological advances and emerging industry standards and practices on a cost-effective and timely basis. The development of proprietary technology involves significant technical and business risks. We may fail to develop new technologies effectively or to adapt our proprietary technology and systems to client requirements or emerging industry standards.
Risks Related to Our Stock
Institutional shareholders hold a significant amount of our common stock and these shareholders may have conflicts of interests with the interests of our other shareholders.
As of December 31, 2014, institutional investors own or control approximately 52% of the voting power of our common stock. The interests of these institutional shareholders may differ from our other shareholders in material respects. This concentration of voting power of our common stock may make it difficult for our other shareholders to approve or defeat matters that may be submitted for action by our shareholders, including the election of directors and amendments to our Certificate of Incorporation or Bylaws. This also may have the effect of deterring, delaying, or preventing a change in control, even when such a change in control could benefit our other shareholders. These institutional shareholders may have the power to exert significant influence over our affairs in ways that may be adverse to the interests of our other shareholders.
The market price of our common stock may be volatile. You may not be able to sell your shares at or above the price at which you purchased such shares.
The trading price of our common stock may be subject to wide fluctuations in response to quarter-to-quarter fluctuations in operating results, announcements of material adverse events, general conditions in our industry or the public marketplace and other events or factors, including the thin trading of our common stock. In addition, stock markets have experienced extreme price and trading volume volatility in recent years. This volatility has had a substantial effect on the market prices of securities of many technology-related companies for reasons frequently unrelated to the operating performance of the specific companies. These broad market fluctuations may adversely affect the market price of our common stock. In addition, if our operating results differ from our announced guidance or the expectations of equity research analysts or investors, the price of our common stock could decrease significantly.
Our stock price could decline if a significant number of shares become available for sale.
As of December 31, 2014, we have issued an aggregate of (i) 1.6 million outstanding stock options with a weighted average exercise price of $5.36 per share (ii) 448,000 performance shares of common stock, of which 150,000 are vested and the remainder of which may vest, subject to satisfaction of vesting conditions, over the next two years, and (iii) 40,700 deferred stock units to certain of the non-employee members of our Board of Directors under which the underlying shares will be issued upon the termination of service of the holder. The current and future issuance and/or vesting of shares of our common stock under the foregoing stock options, performance shares and deferred stock units, sales of substantial amounts of common stock in the public market following the issuance and/or vesting of such shares, and/or the perception that future sales of these shares could occur, could reduce the market price of our common stock and make it more difficult to sell equity securities in the future.
Our certificate of incorporation, our bylaws, our shareholder rights plan and Delaware law make it difficult for a third party to acquire us, despite the possible benefit to our shareholders.
Provisions of our certificate of incorporation, our bylaws, our shareholder rights plan and Delaware law could make it more difficult for a third party to acquire us, even if doing so would be beneficial to our shareholders. For example, our certificate of incorporation permits our Board of Directors to issue one or more series of preferred stock, which may have rights and preferences superior to those of the common stock. The ability to issue preferred stock could have the effect of delaying or preventing a third party from acquiring us. We have also adopted a shareholder rights plan. These provisions could discourage takeover attempts and could materially adversely affect the price of our stock. In addition, because we are incorporated in Delaware, we are governed by the
23
provisions of Section 203 of the Delaware General Corporation Law, which may prohibit large shareholders from consummating a merger with, or acquisition of us. These provisions may prevent a merger or acquisition that would be attractive to shareholders and could limit the price investors would be willing to pay in the future for our common stock.
There are limitations on the liabilities of our directors and executive officers.
Pursuant to our bylaws and under Delaware law, our directors are not liable to us or our shareholders for monetary damages for breach of fiduciary duty, except for liability for breach of a director’s duty of loyalty, acts or omissions by a director not in good faith or which involve intentional misconduct or a knowing violation of law, or any transaction in which a director has derived an improper personal benefit.
None.
Our headquarters are located in Allen, Texas, a Dallas suburb.
In the U.S., we operate a distribution facility in Memphis, Tennessee, with aggregate space of more than 440,000 square feet. We also operate two additional distribution facilities totaling an aggregate of approximately 540,000 square feet in Southaven, Mississippi. These facilities are located approximately ten miles from the Memphis International Airport. We also manage for our clients two other facilities: a distribution facility in Grapevine, Texas with approximately 200,000 square feet and a DTC facility in Memphis, Tennessee with approximately 205,000 square feet.
Internationally, we operate a distribution complex in Liège, Belgium with approximately 200,000 square feet, and distribution operations in Ontario with approximately 30,000 square feet. We also operate a facility in Bangalore, India with approximately 23,000 square feet to provide primarily technology development and administrative support.
Except for the Grapevine, Texas facility and the DTC facility in Memphis, Tennessee, which we manage on our clients’ behalf, all of our facilities are leased and the lease agreements generally contain one or more renewal options.
We operate customer service centers in our facilities in Dallas, Texas, Liège, Belgium and Ontario, Canada. Our call center technology permits the automatic routing of calls to available customer service representatives in several of our call centers.
We are not party to any legal proceedings other than routine claims and lawsuits arising in the ordinary course of our business. We do not believe such claims and lawsuits, individually or in the aggregate, will have a material adverse effect on our business.
Not Applicable
24
|
Item 5. |
Market for Registrant’s Common Equity, Related Shareholder Matters and Issuer Purchases of Equity Securities |
Our common stock is listed, and currently trades, on the NASDAQ Capital Market under the symbol “PFSW.” The following table sets forth for the periods indicated the high and low sale price for the common stock as reported by NASDAQ:
|
|
Price |
|
|||||
|
|
High |
|
|
Low |
|
||
|
Year Ended December 31, 2013 |
|
|
|
|
|
|
|
|
First Quarter |
$ |
4.24 |
|
|
$ |
2.73 |
|
|
Second Quarter |
$ |
4.65 |
|
|
$ |
3.40 |
|
|
Third Quarter |
$ |
6.10 |
|
|
$ |
3.91 |
|
|
Fourth Quarter |
$ |
9.35 |
|
|
$ |
5.91 |
|
|
|
|
|
|
|
|
|
|
|
Year Ended December 31, 2014 |
|
|
|
|
|
|
|
|
First Quarter |
$ |
10.43 |
|
|
$ |
7.54 |
|
|
Second Quarter |
$ |
9.29 |
|
|
$ |
7.33 |
|
|
Third Quarter |
$ |
11.21 |
|
|
$ |
7.09 |
|
|
Fourth Quarter |
$ |
12.71 |
|
|
$ |
9.42 |
|
As of March 4, 2015, there were approximately 2,900 shareholders, of which 121 were record holders of the common stock.
We have never declared or paid cash dividends on our common stock and do not anticipate the payment of cash dividends on our common stock in the foreseeable future. We are also restricted from paying dividends under our debt agreements without the prior approval of our lenders. The payment of any future cash dividends will be at the discretion of our Board of Directors and will depend upon, among other things, future earnings, operations, capital requirements, the general financial condition of the Company and general business conditions and the approval of our lenders. See “Management’s Discussion and Analysis of Financial Condition and Results of Operations — Liquidity and Capital Resources.”
The following table summarizes information with respect to equity compensation plans under which equity securities of the Company are authorized for issuance as of December 31, 2014:
|
|
(a) Number of securities to be issued upon exercise of outstanding options, warrants and rights |
|
|
(b) Weighted-average exercise price of outstanding options, warrants and rights |
|
|
(c) Number of securities remaining available for future issuance under equity compensation plans (excluding securities reflected in column (a)) |
|
|||
|
Plan category (1) |
|
|
|
|
|
|
|
|
|
|
|
|
Equity compensation plans approved by shareholders |
|
1,942,609 |
|
|
$ |
5.36 |
|
|
|
1,537,957 |
|
|
Equity compensation plans not approved by shareholders |
— |
|
|
|
|
|
|
— |
|
||
|
(1) |
See Note 6 to the Consolidated Financial Statements for more detailed information regarding the Company’s equity compensation plans. |
None
25
We believe the following discussion and analysis provides information that is relevant to an assessment and understanding of our consolidated results of operations and financial condition. The discussion and analysis should be read in conjunction with the consolidated financial statements and related notes thereto appearing elsewhere in this Form 10-K. This Management’s Discussion and Analysis will help you understand:
|
● |
The impact of forward looking statements; |
|
● |
Key transactions and events during 2014; |
|
● |
Our financial structure, including our historical financial presentation; |
|
● |
Our results of operations for the previous two years as well as certain projections for the future; |
|
● |
Certain of our relationships with our subsidiaries; |
|
● |
Our liquidity and capital resources; |
|
● |
The impact of seasonality, inflation and recently issued accounting standards on our financial statements; and |
|
● |
Our critical accounting policies and estimates. |
Forward-Looking Information
We have made forward-looking statements in this Report on Form 10-K. These statements are subject to risks and uncertainties, and there can be no guarantee that these statements will prove to be correct. Forward-looking statements include assumptions as to how we may perform in the future. When we use words like “seek,” “strive,” “believe,” “expect,” “anticipate,” “predict,” “potential,” “continue,” “will,” “may,” “could,” “intend,” “plan,” “target,” “project” and “estimate” or similar expressions, we are making forward-looking statements. You should understand that the following important factors, in addition to the Risk Factors set forth above or elsewhere in this Report on Form 10-K, could cause our results to differ materially from those expressed in our forward-looking statements. These factors include:
|
● |
our ability to retain and expand relationships with existing clients and attract and implement new clients; |
|
● |
our reliance on the fees generated by the transaction volume, product sales and technology and digital agency projects of our clients; |
|
● |
our reliance on our clients’ projections, transaction volume or product sales; |
|
● |
our dependence upon our agreements with International Business Machines Corporation (“IBM”) and Ricoh: |
|
● |
our dependence upon our agreements with our major clients; |
|
● |
our client mix, their business volumes and the seasonality of their business; |
|
● |
our ability to finalize pending client and customer contracts; |
|
● |
the impact of strategic alliances and acquisitions; |
|
● |
trends in eCommerce, outsourcing, government regulation, both foreign and domestic, and the market for our services; |
|
● |
whether we can continue and manage growth; |
|
● |
increased competition; |
|
● |
our ability to generate more revenue and achieve sustainable profitability; |
|
● |
effects of changes in profit margins; |
|
● |
the customer and supplier concentration of our business; |
|
● |
the reliance on third-party providers and other subcontracted services; |
|
● |
the unknown effects of possible system failures and rapid changes in technology; |
|
● |
foreign currency risks and other risks of operating in foreign countries; |
|
● |
potential litigation; |
|
● |
our dependence upon key personnel; |
|
● |
our ability to retain seasonal and temporary workers; |
26
|
● |
the impact of new accounting standards and changes in existing accounting rules or the interpretations of those rules; |
|
● |
our ability to raise additional capital or obtain additional financing; |
|
● |
our ability, and the ability of our subsidiaries, to borrow under current financing arrangements and maintain compliance with debt covenants; |
|
● |
our relationship with, and our guarantees of, certain of the liabilities and indebtedness of our subsidiaries; and |
|
● |
taxation on the sale of our products and provision of our services. |
We have based these statements on our current expectations about future events. Although we believe the expectations reflected in our forward-looking statements are reasonable, we cannot guarantee these expectations will actually be achieved. In addition, some forward-looking statements are based upon assumptions as to future events that may not prove to be accurate. Therefore, actual outcomes and results may differ materially from what is expected or forecasted in such forward-looking statements. We undertake no obligation to update publicly any forward-looking statement for any reason, even if new information becomes available or other events occur in the future. There may be additional risks we do not currently view as material or that are not presently known. In evaluating these statements, you should consider various factors, including the risks set forth in the section entitled “Risk Factors.”
Key Transactions and Events in 2014
During 2014, we were impacted by the following key transactions and events:
|
● |
Implemented a significant new contract with a United States government agency. |
|
● |
Announced and began a comprehensive mergers and acquisition strategy to enhance our service offering, diversify our operations and expand our global opportunities, which resulted in the acquisitions described below, for which we incurred aggregate merger and acquisition related costs of approximately $1.7 million. |
|
● |
Acquired the outstanding capital stock of REV Solutions, Inc. and REVTECH Solutions India Private Limited (collectively “REV”) effective September 3. Through its offices in the United States and India, REV provides eCommerce website technical design, development and support services, enabling retailers, manufacturers and suppliers to optimize the customer experience across multiple channels. Consideration paid included $3.2 million during 2014 and additional performance-based contingent payments based on REV’s achievement of certain 2014 and 2015 financial targets, of which $1.4 million will be paid in 2015. The results of operations of REV have been included in our consolidated financial statements since the acquisition date. |
|
● |
Acquired the outstanding capital stock of LiveAreaLabs, Inc. (“LAL”) effective September 22. LAL provides digital agency services to U.S. clients, including strategy, branding, website design, visual design, copywriting, interactive development and support services primarily to manufacturers and retailers. Consideration paid included $4.0 million and approximately $0.5 million of stock issued during 2014 and additional performance-based contingent payments based on LAL’s achievement of certain 2014 and 2015 financial targets, of which $1.0 million will be paid in 2015. The results of operations of LAL have been included in our consolidated financial statements since the acquisition date. |
|
● |
Completed the implementation of other new contracts with both new and existing clients signed in both 2013 and 2014. |
Overview
We are a global provider of omni-channel commerce solutions. Comprised of a broad range of technology, critical infrastructure and professional services, we provide our clients with best-of-breed capabilities offered as a complete end-to-end solution or on an à la carte basis. We provide these solutions and services to major brand name companies and others seeking to optimize their supply chain and to enhance their online and traditional business channels and initiatives. We derive our revenues from providing a broad range of services using three different seller services financial models: 1) the Service Fee model, 2) the Agent (or Flash) model and 3) the Retail model.
We refer to the standard PFSweb seller services financial model as the Service Fee model. In this model, our clients own the inventory and are the merchants of record and engage us to provide various infrastructure, technology and digital agency services in support of their business operations. We derive our service fee revenues from a broad range of service offerings that include digital agency and marketing, eCommerce technologies, system integration, order management, customer care, logistics and fulfillment, financial management and professional consulting. We offer our services as an integrated solution, which enables our clients to outsource their complete ecommerce needs to a single source and to focus on their core competencies, though clients are also able to select individual or groupings of our various service offerings on an à la carte basis. We currently provide services to clients that operate in a range of vertical markets, including technology manufacturing, computer products, cosmetics, fragile goods, coins and collectibles, apparel, aviation, telecommunications, consumer electronics and consumer packaged goods, among others.
27
In the Service fee model, we typically charge for our services on a cost-plus basis, a percent of shipped revenue basis, a time and materials, project or retainer basis for our professional services or a per-transaction basis, such as a per-labor hour basis for web-enabled customer contact center services and a per-item basis for fulfillment services. Additional fees are billed for other services. We price our services based on a variety of factors, including the depth and complexity of the services provided, the amount of capital expenditures or systems customization required, the length of contract and other factors.
Many of our service fee contracts involve third-party vendors who provide additional services, such as package delivery. The costs we are charged by these third-party vendors for these services are often passed on to our clients. Our billings for reimbursements of these costs and other ‘out-of-pocket’ expenses include travel, shipping and handling costs and telecommunication charges and are included in pass-through revenue.
As an additional service, we offer the Agent, or Flash, financial model, in which our clients maintain ownership of the product inventory stored at our locations as in the Service Fee model. When a customer orders the product from our clients, a “flash” sale transaction passes product ownership to us for each order and we in turn immediately re-sell the product to the customer. The “flash” ownership exchange establishes us as the merchant of record, which enables us to use our existing merchant infrastructure to process sales to end customers, removing the need for the clients to establish these business processes internally, but permitting them to control the sales process to end customers. In this model, based on the terms of our current client arrangements, we record product revenue net of cost of product revenue as a component of service fee revenue in our consolidated statement of operations.
Finally, our Retail model allows us to purchase inventory from the client. In this model, we place the initial and replenishment purchase orders with the client and take ownership of the product upon delivery to our facility. In this model, depending on the terms of our client arrangements, we may own the inventory and the accounts receivable arising from our product sales. Under the Retail model, depending upon the product category and sales characteristics, we may require the client to provide product price protection as well as product purchase payment terms, right of return, and obsolescence protection appropriate to the product sales profile. Depending on the terms of our client arrangements in the Retail model, we record in our consolidated statement of operations either: 1) product revenue as a component of product revenue, or 2) product revenue net of cost of product revenue as a component of service fee revenue. In general, we seek to structure client relationships in our Retail model under the net revenue approach to more closely align with our service fee revenue financial presentation and mitigate inventory ownership, although we have one client still utilizing the gross revenue approach. Freight costs billed to customers are reflected as components of product revenue. This business model generally requires significant working capital, for which we have credit available either through credit terms provided by our clients or under senior credit facilities.
In general, we provide the Service Fee model through our PFS, REV, LAL and Supplies Distributors subsidiaries, the Agent (or Flash) model through our PFS and Supplies Distributors subsidiaries and the Retail model through our Supplies Distributors and PFSweb Retail Connect subsidiaries.
Growth is a key element to achieving our future goals, including achieving and maintaining sustainable profitability. Growth in our Service Fee and Agent models is driven by two main elements: new client relationships and organic growth from existing clients. We focus our sales efforts on larger contracts with brand-name companies within four primary target markets, health and beauty, home goods and collectibles, fashion and consumer packaged goods, which, by nature, require a longer duration to close but also have the potential to be higher quality and longer duration engagements. In September 2014, we acquired REV and LAL to expand our service offering capabilities, add new client relationships and enhance our growth opportunities. Based on the timing of these acquisitions, we only received a partial year benefit in 2014.
Currently, we are targeting any growth within our Retail model to be through relationships with clients under which we can record service fee revenue (product revenue net of product cost of revenue) in our consolidated statement of operations. These relationships are often driven by the sales and marketing efforts of the manufacturers and third party sales partners. In addition, as a result of certain operational restructuring of its business, our primary client relationship operating in the Retail model, Ricoh, has implemented, and will continue to implement, certain changes in the sale and distribution of Ricoh products. The changes have resulted, and are expected to continue to result, in reduced product revenues and profitability under our Retail model.
We continue to monitor and control our costs to focus on profitability. While we are targeting our new service fee contracts to yield incremental gross profit, we also expect to incur incremental investments in technology development, operational and support management and sales and marketing expenses to help generate growth.
Our expenses comprise primarily four categories: 1) cost of product revenue, 2) cost of service fee revenue, 3) cost of pass-through revenue and 4) selling, general and administrative expenses.
28
Cost of product revenue – consists of the purchase price of product sold and freight costs, which are reduced by certain reimbursable expenses. These reimbursable expenses include pass-through customer marketing programs, direct costs incurred in passing on any price decreases offered by vendors to cover price protection and certain special bids, the cost of products provided to replace defective product returned by customers and certain other expenses as defined under the distributor agreements.
Cost of service fee revenue – consists primarily of compensation and related expenses for our web-enabled customer contact center services, international fulfillment and distribution services and professional, digital agency and technology services, and other fixed and variable expenses directly related to providing services under the terms of fee based contracts, including certain occupancy and information technology costs and depreciation and amortization expenses.
Cost of pass-through revenue – the related reimbursable costs for pass-through expenditures are reflected as cost of pass-through revenue.
Selling, General and Administrative expenses – consist of expenses such as compensation and related expenses for sales and marketing staff, distribution costs (excluding freight) applicable to the Supplies Distributors business and the Retail model, executive, management and administrative personnel, non-billable labor costs of our professional services team, and other overhead costs, including certain occupancy and information technology costs and depreciation and amortization expenses.
Monitoring and controlling our available cash balances and our expenses continues to be a primary focus. Our cash and liquidity positions are important components of our financing of both current operations and our targeted growth. To improve our cash and liquidity position, in May 2013, we sold an aggregate of 3.2 million shares of our Common Stock at $4.57 per share, resulting in net proceeds of $14.1 million.
Results of Operations
Year Ended December 31, 2014 Compared to Year Ended December 31, 2013
The following table discloses certain financial information for the periods presented, expressed in terms of dollars, dollar change, percentage change and as a percentage of total revenue (in millions).
|
|
|
|
|
|
|
|
|
|
Change |
|
|
% of Net Revenues |
|
||||||||||
|
|
2014 |
|
|
2013 |
|
|
$ |
|
|
% |
|
|
2014 |
|
|
2013 |
|
||||||
|
Revenues |
|
|
|
|
|
|
|
|
|
|
|
|
|
|
|
|
|
|
|
|
|
|
|
|
Product revenue, net |
$ |
75.3 |
|
|
$ |
91.0 |
|
|
$ |
(15.7 |
) |
|
|
(17.3 |
)% |
|
|
30.5 |
% |
|
|
37.7 |
% |
|
Service fee revenue |
|
134.4 |
|
|
|
113.0 |
|
|
|
21.4 |
|
|
|
18.9 |
% |
|
|
54.4 |
% |
|
|
46.8 |
% |
|
Pass-through revenue |
|
37.4 |
|
|
|
37.6 |
|
|
|
(0.2 |
) |
|
|
(0.7 |
)% |
|
|
15.1 |
% |
|
|
15.5 |
% |
|
Total net revenues |
|
247.1 |
|
|
|
241.6 |
|
|
|
5.5 |
|
|
|
2.3 |
% |
|
|
100.0 |
% |
|
|
100.0 |
% |
|
Cost of Revenues |
|
|
|
|
|
|
|
|
|
|
|
|
|
|
|
|
|
|
|
|
|
|
|
|
Cost of product revenue (1) |
|
71.0 |
|
|
|
85.3 |
|
|
|
(14.3 |
) |
|
|
(16.7 |
)% |
|
|
94.3 |
% |
|
|
93.7 |
% |
|
Cost of service fee revenue (2) |
|
94.9 |
|
|
|
77.2 |
|
|
|
17.7 |
|
|
|
22.9 |
% |
|
|
70.6 |
% |
|
|
68.3 |
% |
|
Pass-through cost of revenue (3) |
|
37.4 |
|
|
|
37.6 |
|
|
|
(0.2 |
) |
|
|
(0.7 |
)% |
|
|
100.0 |
% |
|
|
100.0 |
% |
|
Total cost of revenues |
|
203.3 |
|
|
|
200.1 |
|
|
|
3.2 |
|
|
|
1.6 |
% |
|
|
82.3 |
% |
|
|
82.8 |
% |
|
Product revenue gross profit |
|
4.3 |
|
|
|
5.7 |
|
|
|
(1.4 |
) |
|
|
(25.8 |
)% |
|
|
5.7 |
% |
|
|
6.3 |
% |
|
Service fee gross profit |
|
39.5 |
|
|
|
35.8 |
|
|
|
3.7 |
|
|
|
10.4 |
% |
|
|
29.4 |
% |
|
|
31.7 |
% |
|
Pass-through gross profit |
|
— |
|
|
|
— |
|
|
|
— |
|
|
|
— |
|
|
|
— |
|
|
|
— |
|
|
Total gross profit |
|
43.8 |
|
|
|
41.5 |
|
|
|
2.3 |
|
|
|
5.4 |
% |
|
|
17.7 |
% |
|
|
17.2 |
% |
|
Selling General and Administrative expense |
|
47.7 |
|
|
|
46.2 |
|
|
|
1.5 |
|
|
|
3.1 |
% |
|
|
19.3 |
% |
|
|
19.1 |
% |
|
Loss from operations |
|
(3.9 |
) |
|
|
(4.7 |
) |
|
|
0.8 |
|
|
|
17.3 |
% |
|
|
(1.6 |
)% |
|
|
(1.9 |
)% |
|
Interest expense, net |
|
0.8 |
|
|
|
0.7 |
|
|
|
0.1 |
|
|
|
19.7 |
% |
|
|
0.3 |
% |
|
|
0.3 |
% |
|
Loss before income taxes |
|
(4.7 |
) |
|
|
(5.4 |
) |
|
|
0.7 |
|
|
|
12.6 |
% |
|
|
(1.9 |
)% |
|
|
(2.2 |
)% |
|
Income tax expense (benefit), net |
|
(0.1 |
) |
|
|
0.5 |
|
|
|
(0.6 |
) |
|
|
(109.8 |
)% |
|
|
(0.0 |
)% |
|
|
0.2 |
% |
|
Net loss |
$ |
(4.6 |
) |
|
$ |
(5.9 |
) |
|
$ |
1.3 |
|
|
|
21.5 |
% |
|
|
(1.9 |
)% |
|
|
(2.4 |
)% |
|
(1) |
Represents the percent of Product revenue, net. |
|
(2) |
Represents the percent of Service fee revenue. |
|
(3) |
Represents the percent of Pass-through revenue. |
29
Product revenue, net. Product revenue decreased $15.7 million, or 17.3%, in 2014 as compared to the prior year. This reduction in revenue is primarily due to the operational restructuring by Ricoh of its business, which has resulted, and is expected to continue to result, in lower product revenue from the sale of Ricoh products. The reduction of product revenue on a comparative basis also includes the effect of the transition of a client from a Retail model to a Service Fee model in late 2013. We currently expect product revenue to continue to decline as compared to the prior year and be approximately $60 million to $65 million in 2015.
Service fee revenue. The increase in service fee revenue for the year ended December 31, 2014 as compared to the prior year was primarily due to the impact of expanded and new client relationships that began in 2013 and 2014, including service fee revenues generated by our newly acquired subsidiaries REV and LAL, beginning in September 2014, partially offset by the conclusion or reduction of operations of several client programs during 2014.
The change in service fee revenue, excluding pass-through revenue, is shown below ($ millions):
|
Period ended December 31, 2013 |
$ |
113.0 |
|
|
New service contract relationships |
|
10.7 |
|
|
REV and LAL revenue |
|
5.3 |
|
|
Change in existing client service fee relationships |
|
15.7 |
|
|
Terminated client relationships not included in 2014 revenue |
|
(10.3 |
) |
|
Period ended December 31, 2014 |
$ |
134.4 |
|
When considering client relationships, we define an existing client to be a client from whom we earned revenue in both the current and prior year; we define a new client to be a client from whom we only earned revenue in the current year; and we define a terminated client as a client from whom we only earned revenue in the prior year. Our 2014 service fee revenue includes approximately $4.5 million of service fee revenues from clients (excluding REV and LAL clients) who concluded their relationship with us during 2014. However, based on current client projections, we expect the reduction in revenue from these terminated client programs to be more than offset by new service fee revenue generated by new or expanded client opportunities and revenues generated by our newly acquired subsidiaries, REV and LAL. For 2015, we are currently targeting an increase in service fee revenues of approximately 20% as compared to 2014.
Cost of Product Revenue. Cost of product revenue decreased by $14.3 million, or 16.7%, to $71.0 million in 2014 as compared to the prior year. The resulting gross profit margin was $4.3 million or 5.7% of product revenue for the year ended December 31, 2014 and $5.7 million or 6.3% of product revenue for 2013. The decrease in gross profit percentage was primarily due to the operational restructuring of Ricoh, which resulted in a higher percentage of our product revenue generated from lower gross margin product categories and other inventory adjustments. The gross profit margin for 2013 includes the impact of incremental gross margin earned on product sales resulting from certain product price increases and the impact of certain incremental inventory cost reductions. We currently expect our product revenue gross profit margin to be approximately 5% in 2015.
Cost of Service Fee Revenue. Gross profit as a percentage of service fees was 29.4% in 2014 and 31.7% in 2013. The gross profit percentage in each period included the benefit of higher margin project activity. Additionally, 2014 included certain incremental expenses incurred to prepare for and support certain client solutions for the fourth quarter holiday volumes, while 2013 included an incremental benefit of $1.2 million applicable to certain client transition related agreements.
We target to earn an overall average gross profit on our service fee activity of 25-30% on existing and new service fee contracts, but we have accepted, and may continue to accept, lower gross margin percentages on certain contracts depending on contract scope and other factors, including projected volumes. Gross margins on our service fee business are expected to be within our targeted range of 25-30% for 2015. We are focused on continuing to increase our level of higher margin service fee activity, including our professional and technology services, to help offset other lower margin activities. Based on our projected continued growth in the professional services area of our business, we are projecting to be at the higher end of the targeted range in 2015. Our service fee gross profit will continue to be impacted by the split of our infrastructure related services versus our professional services activity, as well as project work.
Selling, General and Administrative Expenses (“SG&A”). SG&A expenses were $47.7 million, or 19.3% of total revenues in 2014 and $46.2 million, or 19.1% of total revenues in the prior year. The year ended December 31, 2014 includes $1.1 million of SG&A expenses for our newly consolidated acquisitions, REV and LAL, and a $0.5 million increase in stock based compensation expense compared to the prior year partially offset by decreases in certain personnel related expenses. The year ended December 31, 2014 also includes $1.7 million of incremental professional fees and other expenses associated with our mergers and acquisition activity. SG&A expenses for 2014 and 2013 include approximately $1.0 million and $2.5 million, respectively, of restructuring related charges. Excluding the restructuring and acquisition related charges in 2014 and the restructuring related charges in 2013, SG&A expenses were 18.2% and 18.1% of total revenues in 2014 and 2013, respectively. We currently expect our SG&A expenses
30
will increase in 2015, as compared to 2014, as we include a full year of expenses for REV and LAL, incur additional expenditures related to our sales and marketing activities and incur a full year of amortization for identifiable intangible assets acquired in our REV and LAL acquisitions. In addition, we expect to incur incremental expenses in 2015 applicable to other transition costs incident to our REV and LAL acquisitions.
Income Taxes. We recorded a tax provision associated with state income taxes and the majority of our international operations. A valuation allowance has been provided for the majority of our domestic net deferred tax assets, which are primarily related to our net operating loss carryforwards, and for certain foreign deferred tax assets. In 2014 we recorded a deferred tax benefit in applicable to a change in our valuation allowance following our REV and LAL acquisitions under the related purchase accounting adjustments. We expect we will continue to record an income tax provision associated with state income taxes and the majority of our international operations.
Supplies Distributors and its Subsidiaries
We conduct a portion of our Retail business model operations through Supplies Distributors and its subsidiaries, which act as distributors of various Ricoh and other products. We conduct these services through transaction management services agreements under which PFS provides transaction management and fulfillment services to Supplies Distributors and its subsidiaries. In addition to our equity investment in Supplies Distributors, we have also provided Supplies Distributors with a subordinated loan that, as of December 31, 2014, had an outstanding balance of $2.5 million.
Supplies Distributors paid us dividends of $1.8 million and $1.5 million in 2014 and 2013, respectively. Supplies Distributors has received lender approval to pay dividends of approximately $0.9 million in 2015, but pursuant to the terms of its amended credit agreements, is restricted from paying further cash dividends without the prior approval of its lenders. In addition, no distribution may be made if, after giving effect thereto, Supplies Distributors or its subsidiaries are in noncompliance with its financial covenants under its current facilities.
Liquidity and Capital Resources
During 2014, we generated $13.3 million of cash from operating activities, which resulted primarily due to a:
|
- |
$3.4 million decrease in inventories primarily applicable to reduced Ricoh related business volumes; |
|
- |
$5.8 million increase in accounts payable, deferred revenue, accrued expenses and other liabilities in part due to increased business activity and timing of payments to clients of customer collections related to strong holiday volume, partially offset by the impact of reduced product purchases; and |
|
- |
$9.6 million of cash income from operations before working capital changes. |
These sources of cash were partially offset by a:
|
- |
$2.7 million increase in accounts receivable applicable to: |
|
o |
increased activity for certain new and expanded client relationships in which we own the resulting customer trade receivable (through our Agent or Retail models), |
|
o |
increased service fee activity, including the impact from the REV and LAL acquisitions, and the timing of client receipts applicable to service fee activity, |
|
o |
Both of the above partially offset by the impact of reduced Ricoh related business. |
|
- |
$2.5 million increase in prepaid expenses, and other receivables and other assets in part due to increase in deferred start-up costs related to start-up activity for new clients and timing of certain payments. |
At December 31, 2014 and 2013, our accounts payable and accrued expenses were higher than normal operating levels due to the timing of various vendor and client reimbursement payments.
During 2013, we generated $6.8 million of cash from operating activities, which resulted primarily due to a:
|
- |
$10.5 million decrease in inventories primarily applicable to reduced Ricoh related business volumes, and |
|
- |
$2.5 million decrease in prepaid expenses, and other receivables and other assets in part due to timing of receipts and reduced product revenue related activity. |
|
- |
$7.0 million of cash income from operations before working capital changes. |
31
These sources of cash were partially offset by a:
|
- |
$9.3 million increase in accounts receivable applicable to: |
|
o |
increased activity for certain new and expanded client relationships in which we own the resulting customer trade receivable, |
|
o |
the timing of client receipts applicable to service fee activity, |
|
o |
Both of the above partially offset by the impact of reduced Ricoh related business. |
|
- |
$3.6 million decrease in accounts payable, deferred revenue, accrued expenses and other liabilities in part due to reduced inventory purchases as a result of a reduction in product revenue. |
Cash used for payments on debt and capital leases, net of any proceeds from debt and a change in restricted cash, was $5.8 million and $12.3 million, during 2014 and 2013, respectively.
Capital expenditures have historically consisted of additions to upgrade our management information systems, development of customized technology solutions to support and integrate with our service fee clients and general expansion and upgrades to our facilities, both domestic and foreign. We expect to incur capital expenditures to support new contracts and anticipated future growth opportunities. Based on our current client business activity and our targeted growth plans, we anticipate our total investment in upgrades and additions to facilities and information technology solutions and services for the upcoming twelve months, including costs to implement new clients, will be approximately $9 million to $12 million, although additional capital expenditures may be necessary to support the infrastructure requirements of new clients. To maintain our current operating cash position, a portion of these expenditures may be financed through client reimbursements, debt, operating or capital leases or additional equity. We may elect to modify or defer a portion of such anticipated investments in the event that we do not obtain the financing results necessary to support such investments.
During 2014, our working capital decreased to $17.8 million from $26.4 million at December 31, 2013, primarily due to the following key factors: the purchase price paid for non-working capital related assets and liabilities of REV and LAL, including performance-based contingent payments, acquisition related expenses, capital expenditures, and paydown of debt facilities, which were partially offset by income from operations before working capital changes and proceeds from the issuance of common stock. The performance-based contingent payments include future earn-out-payments payable in 2015 and 2016 based on REV’s and LAL’s 2014 and 2015 financial targets, of which $6.25 million is the aggregate maximum contractual earn-out for REV and LAL combined, and of which $2.4 million will be paid in 2015, which is recorded in accrued expenses in the accompanying consolidated balance sheet. To obtain additional financing in the future, in addition to our current cash position, we plan to evaluate various financing alternatives including the sale of equity, utilizing capital or operating leases, borrowing under our credit facilities, expanding our current credit facilities or entering into new debt agreements. No assurances can be given we will be successful in obtaining any additional financing or the terms thereof. We currently believe our cash position, financing available under our credit facilities and funds generated from operations will satisfy our presently known operating cash needs, our working capital and capital expenditure requirements, our current debt and lease obligations, and additional loans to our subsidiaries, if necessary, for at least the next twelve months.
As described above, we have provided collateralized guarantees to secure the repayment of certain of our subsidiaries’ credit facilities. Many of these facilities include both financial and non-financial covenants, and also include cross default provisions applicable to other credit facilities and agreements. These covenants include, among other things, minimum levels of net worth, profitability and cash flow (as defined) and the restrictions on the ability of the borrower subsidiaries to advance funds to other borrower subsidiaries. As a result, it is possible for one or more of these borrower subsidiaries to fail to meet their respective covenants even if another borrower subsidiary otherwise has available excess funds which, if not restricted, could be used to cure the default. To the extent we fail to comply with our debt covenants, including the monthly financial covenant requirements and our required level of shareholders’ equity and we are not able to obtain a waiver, the lenders would be entitled to accelerate the repayment of any outstanding credit facility obligations, and exercise all other rights and remedies, including sale of collateral and enforcement of payment under our parent guarantee. A requirement to accelerate the repayment of the credit facility obligations may have a material adverse impact on our financial condition and results of operations. We can provide no assurance we will have the financial ability to repay all such obligations. As of December 31, 2014, we were in compliance with all debt covenants. Further, non-renewal of any of our credit facilities may have a material adverse impact on our business and financial condition. Other than performance-based contingent payments applicable to our acquisitions of REV and LAL, and our capital and operating lease commitments, we do not have any other material financial commitments, although future client contracts may require capital expenditures and lease commitments to support the services provided to such clients.
32
We receive municipal tax abatements in certain locations. In prior years we received notice from a municipality that we did not satisfy certain criteria necessary to maintain the abatements and that the municipal authority planned to make an adjustment to our tax abatement. We disputed the adjustment and such dispute has been settled with the municipality. However, the amount of additional property taxes to be assessed against us and the timing of the related payments has not been finalized. As of December 31, 2014, we believe we have adequately accrued for the expected assessment.
In April 2010, a sales employee of eCOST.com, Inc. (“eCOST,” the former name of Retail Connect), was charged with violating various federal criminal statutes in connection with the sales of eCOST products to certain customers, and approximately $620,000 held in an eCOST deposit account was seized and turned over to the Office of the U.S. Attorney in connection with such activity. In August 2012, the employee pleaded guilty to a misdemeanor. Neither the Company nor eCOST have been charged with any criminal activity, and we are seeking the recovery of the funds, which are currently classified as other receivables in the consolidated balance sheets. Based on the information available to date, we are unable to determine the amount of the loss, if any, relating to the seizure of such funds. No assurance can be given, however, that the seizure of such funds, or our inability to recover such funds or any significant portion thereof, or any costs and expenses we may incur in connection with such matter will not have a material adverse effect upon our financial condition or results of operations.
Supplies Distributors Financing
To finance its distribution of Ricoh products in the U.S., Supplies Distributors has a short-term credit facility with IBM Credit LLC (“IBM Credit”) that provides financing for up to $15.0 million. We have provided a collateralized guarantee to secure the repayment of this credit facility. The IBM Credit facility does not have a stated maturity and both parties have the ability to exit the facility following a 90-day notice. The Company has direct vendor credit terms with Ricoh to finance Supplies Distributors European subsidiary’s inventory purchases.
Supplies Distributors also has a loan and security agreement with Wells Fargo Bank, National Association (“Wells Fargo”) to provide financing for up to $12.0 million of eligible accounts receivables in the United States and Canada. The Wells Fargo facility expires on the earlier of March 2016 or the date on which the parties to the Ricoh distributor agreement no longer operate under the terms of such agreement and/or Ricoh no longer supplies products pursuant to such agreement.
These credit facilities contain cross default provisions, various restrictions upon the ability of Supplies Distributors and its subsidiaries to, among other things, merge, consolidate, sell assets, incur indebtedness, make loans, investments and payments to related parties (including entities directly or indirectly owned by PFSweb), provide guarantees, make investments and loans, pledge assets, make changes to capital stock ownership structure and pay dividends, as well as financial covenants, such as cash flow from operations, annualized revenue to working capital, net profit after tax to revenue, minimum net worth and total liabilities to tangible net worth, as defined, and are secured by all of the assets of Supplies Distributors, as well as a collateralized guaranty of PFSweb. Additionally, we are required to maintain a subordinated loan to Supplies Distributors of no less than $2.5 million, not maintain restricted cash of more than $5.0 million, are restricted with regard to transactions with related parties, indebtedness and changes to capital stock ownership structure and a minimum shareholders’ equity of at least $18.0 million. Furthermore, we are obligated to repay any over-advance made to Supplies Distributors or its subsidiaries under these facilities if they are unable to do so. We have also provided a guarantee of substantially all of the obligations of Supplies Distributors and its subsidiaries to IBM and Ricoh.
PFS Financing
Our PFS subsidiary has a Loan and Security Agreement (“Comerica Agreement”) with Comerica Bank (“Comerica”), which provides for up to $20.0 million ($17.0 million during certain non-seasonal peak months) of eligible accounts receivable financing through March 2016. The Comerica Agreement also provides for up to $2.0 million of additional eligible equipment financing (“Equipment Advances”) through March 2015. Outstanding Equipment Advances have a final maturity date of September 15, 2017. We entered into this Comerica Agreement to supplement our existing cash position, and provide funding for our current and future operations, including our targeted growth. The Comerica Agreement contains cross default provisions, various restrictions upon our ability to, among other things, merge, consolidate, sell assets, incur indebtedness, make loans and payments to subsidiaries, affiliates and related parties (including entities directly or indirectly owned by PFSweb), make capital expenditures, make investments and loans, pledge assets, make changes to capital stock ownership structure, as well as financial covenants, as defined, of a minimum tangible net worth of $20.0 million, a minimum earnings before interest and taxes, plus depreciation, amortization and non-cash compensation accruals, if any, and a minimum liquidity ratio. The Comerica Agreement also limits PFS’ ability to increase the subordinated loan to Supplies Distributors to more than $5.0 million and permits PFS to advance incremental amounts to certain of its subsidiaries and/or affiliates subject to certain financial covenants. The Comerica Agreement is secured by all of the assets of PFS, as well as a guarantee of PFSweb.
33
Private Placement
In May 2013, we sold 3.2 million shares of our common stock in a private transaction at $4.57 per share, resulting in net proceeds of approximately $14.1 million after deducting expenses.
Restricted Net Assets
Certain of our credit facilities contain various financial covenants and include covenants that restrict our ability to incur additional indebtedness, create or permit liens on assets, engage in mergers or consolidations, and place restrictions on the transfer of assets or the payment of dividends between us and our subsidiaries. At December 31, 2014 and 2013, we had restricted net assets of approximately $23.2 million and $26.9 million, respectively.
Off-Balance Sheet Arrangements
There are no off-balance sheet arrangements that have or are reasonably likely to have a current or future effect on our financial condition, changes in financial condition, revenues or expenses, results of operations, liquidity, capital expenditures or capital resources that is material to investors.
Inventory Management
In our Retail model, we manage our inventories held for sale by maintaining sufficient quantities of product to achieve appropriate order fill rates. To reduce the risk of loss due to supplier price reductions, Supplies Distributors’ distributor agreement provides for price protection under which it receives credits if the supplier lowers prices on previously purchased inventory.
Seasonality
The seasonality of our service fee business is dependent upon the seasonality of our clients’ business and sales of their products. Accordingly, we must rely upon the projections of our clients in assessing quarterly variability. We believe that with our current client mix and their current business volumes, our run rate service fee business activity will generally be highest during the quarter ended December 31. We believe our historical revenue pattern makes it difficult to predict the effect of seasonality on our future revenues and results of operations.
We believe that results of operations for a quarterly period may not be indicative of the results for any other quarter or for the full year.
Inflation
Management believes inflation has not had a material effect on our operations.
Impact of Recently Issued Accounting Standards
In May 2014, the Financial Accounting Standards Board (the “FASB”) issued ASU 2014-09, Revenue from Contracts with Customers (“ASU 2014-09”), which outlines a single, comprehensive model for entities to use in accounting for revenue arising from contracts with customers. ASU 2014-09 is applicable for fiscal years beginning after December 15, 2016, including interim periods therein, and can be applied either retrospectively to each period presented or as a cumulative-effect adjustment as of the date of adoption. Early adoption is not permitted. We are currently evaluating the impact of the new guidance on our consolidated financial statements and related disclosures.
Critical Accounting Policies and Estimates
Our consolidated financial statements have been prepared in conformity with accounting principles generally accepted in the United States of America. These accounting principles require us to make estimates and assumptions that affect the reported amounts of assets and liabilities at the date of our financial statements and the reported amounts of revenues and expenses during the reporting period. While we do not believe the reported amounts would be materially different, application of these policies involves the exercise of judgment and the use of assumptions as to future uncertainties and, as a result, actual results could differ from these estimates. If there is a significant unfavorable change to current conditions, it would likely result in a material adverse impact to our business, operating results and financial condition. We evaluate our estimates and assumptions on an ongoing basis. We base our estimates on experience and on various other assumptions that we believe to be reasonable under the circumstances. All of our significant accounting policies are disclosed in the notes to our consolidated financial statements.
34
We have defined a critical accounting estimate as one that is both important to the portrayal of our financial condition and results of operations and requires us to make difficult, subjective or complex judgments or estimates about matters that are uncertain. During the past two years, we have not made any material changes in accounting methodology used to establish the critical accounting estimates discussed below. The following represent certain critical accounting policies that require us to exercise our business judgment or make significant estimates. In addition, there are other items within our consolidated financial statements that require estimation but are not deemed critical as defined above.
Revenue Recognition
We derive revenue primarily from services provided under contractual arrangements with our clients or from the sale of products under our distributor agreements. We recognize revenue when persuasive evidence of a sales arrangement exists, product shipment or delivery has occurred or services are rendered, the sales price or fee is fixed or determinable, and collectability is reasonably assured.
In instances where revenue is derived from sales of third-party vendor services, we record revenue on a gross basis when we are a principal to the transaction and net of costs when we are acting as an agent between the customer or client and the vendor. We consider several factors to determine whether we are a principal or an agent, most notably whether we are the primary obligor to the vendor or customer, have established our own pricing and have inventory and credit risks, if applicable.
Product revenue is recognized when the title and risk of loss are passed to the customer, there is persuasive evidence of an arrangement for the sale, delivery has occurred and/or services have been rendered, the sales price is fixed or determinable and collectability is reasonably assured.
Sales are reported net of estimated returns and allowances which are estimated based upon historical return information. Management also considers any other current information and trends in making estimates. If actual sales returns, allowances and discounts are greater than estimated by management, additional expense may be incurred.
Our service fee revenue relates to our distribution services, order management/customer care services, professional, digital agency and technology services and the reimbursement of out-of-pocket and third-party expenses. We typically charge our service fee revenue on either a cost-plus basis, a percent of shipped revenue basis, a time and materials, project or retainer basis for our professional services or a per transaction basis, such as a per item basis for fulfillment services or a per labor hour basis for web-enabled customer contact center services. Additional fees are billed for other services. For technology and digital agency services, we often charge on a fixed cost basis based on an estimated maximum number of professional service labor hours.
We evaluate our contractual arrangements to determine whether or not they include multiple service elements. Revenue recognition is determined for the separate service elements of the contract in accordance with the requirements of Accounting Standards Codification 605, “Revenue Recognition.” A deliverable constitutes a separate unit of accounting when it has stand-alone value and there are no return rights or other contingencies present for the delivered elements. We allocate revenue to each element based on estimated selling price. Each of our client contracts, and the related services, is unique, with individual needs and criteria customized for each client. Each client engagement is scoped and priced separately and as such we are not able to establish vendor specific objective evidence of fair value for our services, nor is third-party evidence available to establish stand-alone selling prices. Accordingly we use management’s best estimate of selling price for the deliverables. We establish our estimates considering internal factors such as margin objectives, pricing practices and controls as well as market conditions such as competitor pricing strategies.
We perform front-end set-up and integration services to support client eCommerce platforms and websites. When we determine these front-end set-up and integration services do not meet the criteria for recognition as a separate unit of accounting, we defer the start-up fees received and the related costs, and recognize them over the contract term. When we determine these front-end set-up and integration services do meet the criteria for recognition as a separate unit of accounting, for time and material arrangements, we recognize revenue as services are rendered and costs as they are incurred. For fixed-price arrangements, we use the completed contract method to recognize revenues and costs if reasonable and reliable cost estimates for a project cannot be made. If reasonable and reliable costs estimates for a project can be made, we recognize revenue over the contract term on a proportional performance basis, as determined by the relationship of actual costs incurred compared to the estimated total contract costs.
Cost of Service Fee Revenue
Our service fee revenue primarily relates to our distribution services and order management/customer care services and professional, digital agency and technology services. Distribution services relate primarily to inventory management, product receiving, warehousing and fulfillment (i.e., picking, packing and shipping product on our clients’ behalf). Order management/customer care services relate primarily to taking customer orders for our clients’ products via various channels such as
35
telephone call-center, electronic or facsimile. These services also entail addressing customer questions related to orders, as well as cross-selling/up-selling activities. Professional and technology services relate primarily to design, implementation and support of eCommerce platforms, website solutions and quality control for our clients.
Our cost of service fee revenue represents the cost to provide the services described above, primarily compensation and related expenses and other fixed and variable expenses directly related to providing the services. These also include certain occupancy and information technology costs and depreciation and amortization expenses. Certain of these costs are allocated from general and administrative expenses. For these allocations, we estimate the amount of direct expenses based on client-specific information, such as the number of transactions processed. We believe our allocation methodology is reasonable, however a change in assumptions would result in a different gross profit in our statement of operations, yet no change to the resulting net income or loss.
Allowance for Doubtful Accounts
The determination of the collectability of amounts due from our clients and customers requires us to use estimates and make judgments regarding future events and trends, including monitoring our customers’ payment history and current credit worthiness to determine that collectability is reasonably assured, as well as consideration of the overall business climate in which our clients and customers operate. Inherently, these uncertainties require us to make frequent judgments and estimates regarding our clients and customers’ ability to pay amounts due us to determine the appropriate amount of valuation allowances required for doubtful accounts. Provisions for doubtful accounts are recorded when it becomes evident the client or customer will not make the required payments at either contractual due dates or in the future.
In our Retail model, we also maintain an allowance for uncollectible vendor receivables, which arise from inventory returns to vendors, vendor rebates, price protections and other promotions. We determine the sufficiency of the vendor receivable allowance based upon various factors, including payment history. Amounts received from vendors may vary from amounts recorded because of potential non-compliance with certain elements of vendor programs. If our estimated allowances for uncollectible accounts or vendor receivables subsequently prove insufficient, additional allowance maybe required.
Allowance for doubtful accounts totaled $0.4 million at both December 31, 2014 and 2013. We believe our allowances for doubtful accounts are adequate to cover anticipated losses under current conditions; however, uncertainties regarding changes in the financial condition of our clients and customers, either adverse or positive, could impact the amount and timing of any additional provisions for doubtful accounts that may be required.
Inventory Reserves
Inventories (merchandise, held for resale, all of which are finished goods) are stated at the lower of weighted average cost or market. Supplies Distributors and its subsidiaries assume responsibility for slow-moving inventory under certain distributor agreements, subject to certain termination rights, but have the right to return product rendered obsolete by engineering changes, as defined. We review inventories for impairment on a periodic basis, but at a minimum, annually. Recoverability of the inventory on hand is measured by comparisons of the carrying value to the fair value of the inventory. This requires us to record provisions and maintain reserves for excess or obsolete inventory. If write-downs of inventories are necessary, the cost basis of that inventory is adjusted. To determine these reserve amounts, we regularly review inventory quantities on hand and compare them to estimates of future product demand and market conditions. These estimates and forecasts inherently include uncertainties and require us to make judgments regarding potential outcomes. At December 31, 2014 and 2013, our reserve for slow moving inventory was $0.8 million and $1.0 million, respectively. We believe our reserves are adequate to cover anticipated losses under current conditions. Significant or unanticipated changes to our estimates and forecasts, either adverse or positive, could impact the amount and timing of any additional provisions for excess or obsolete inventory that may be required.
Stock Compensation
We utilize our Employee Stock and Incentive Plan (the “Plan”) to help attract, retain and incentivize qualified executives, key employees and non-employee directors to increase our shareholder value and help build and sustain growth. As of December 31, 2014, grants for which an aggregate of 1,942,609 shares of common stock have been awarded under the Plan, and 1,537,957 shares remain available for future grants. The Plan provides for the granting of incentive awards in a variety of forms such as the award of an option, stock appreciation right, restricted stock award, restricted stock unit, deferred stock unit, among other stock-based awards.
From the service inception date to the grant date, we recognize compensation cost for all share-based payments based on the reporting date fair value of the award. After the grant date, compensation cost is measured based on the grant date fair value. Depending on the conditions associated with the vesting of the award, compensation cost is recognized on a straight-line or graded basis, net of estimated forfeitures, over the requisite service period of each award.
36
We estimate the fair value of each option grant on the date of grant using the Black-Scholes option-pricing model. For certain of the awards that have a performance condition, we estimate the compensation cost using a Monte-Carlo simulation. The estimated fair value for awards involves assumptions for expected dividend yield, stock price volatility, risk-free interest rates and the expected life of the award.
If, in the future, we determine that another method of estimating an award’s fair value is more reasonable, or, if another method for calculating these input assumptions is prescribed by authoritative guidance, and, therefore, should be used to estimate expected volatility or expected term, the fair value calculated for our stock-based compensation could change significantly.
Income Taxes
The liability method is used for determining our income taxes, under which current and deferred tax liabilities and assets are recorded in accordance with enacted tax laws and rates. Under this method, the amounts of deferred tax liabilities and assets at the end of each period are determined using the tax rate expected to be in effect when taxes are actually paid or recovered. Valuation allowances are established to reduce deferred tax assets to their net realizable value when it is more likely than not that some portion or all of the deferred tax assets will not be realized. In determining the need for valuation allowances, we have considered and made judgments and estimates regarding estimated future taxable income. These estimates and judgments include some degree of uncertainty and changes in these estimates and assumptions could require us to adjust the valuation allowances for our deferred tax assets. The ultimate realization of our deferred tax assets depends on the generation of sufficient taxable income in the applicable taxing jurisdictions. Although we believe our estimates and judgments are reasonable, actual results may differ, which could be material.
Because we operate in multiple countries, we are subject to the jurisdiction of multiple domestic and foreign tax authorities. Determination of taxable income in any jurisdiction requires the interpretation of the related tax laws and regulations and the use of estimates and assumptions regarding significant future events such as the amount, timing and character of deductions, permissible revenue recognition methods under the tax law and the sources and character of income and tax credits. Changes in tax laws, regulations, foreign currency exchange restrictions or our level of operations or profitability in each taxing jurisdiction could have an impact on the amount of income taxes that we provide during any given year.
Long-Lived Assets
Long-lived assets include property, intangible assets, goodwill and certain other assets. We make judgments and estimates in conjunction with the carrying value of these assets, including amounts to be capitalized, depreciation and amortization methods and useful lives. Additionally, we review long-lived assets for impairment whenever events or changes in circumstances indicate that the carrying amount of an asset may not be recoverable. We review goodwill for impairment at least annually. We record impairment losses in the period in which we determine that the carrying amount is not recoverable. Recoverability of assets to be held and used is measured by a comparison of the carrying amount of an asset to future net cash flows expected to be generated by the asset. This may require us to make judgments regarding long-term forecasts of our future revenues and costs related to the assets subject to review.
Not Applicable.
37
Index to Consolidated Financial Statements
|
|
Page |
|
PFSweb, Inc. and Subsidiaries |
|
|
|
39 |
|
|
41 |
|
Consolidated Statements of Operations and Comprehensive Loss |
42 |
|
|
43 |
|
|
44 |
|
|
45 |
|
|
|
|
|
|
|
|
|
38
Report of Independent Registered Public Accounting Firm
The Board of Directors and Shareholders
PFSweb, Inc.:
We have audited the accompanying consolidated balance sheets of PFSweb, Inc. (a Delaware corporation) and subsidiaries (the “Company”) as of December 31, 2014 and 2013, and the related consolidated statements operations and comprehensive loss, shareholders’ equity, and cash flows for each of the two years in the period ended December 31, 2014. Our audits of the basic consolidated financial statements included the financials statement schedules listed in the index appearing under Item 15(a)(1). These financial statements and financial statement schedules are the responsibility of the Company’s management. Our responsibility is to express an opinion on these financial statements and financial statement schedules based on our audits.
We conducted our audits in accordance with the standards of the Public Company Accounting Oversight Board (United States). Those standards require that we plan and perform the audit to obtain reasonable assurance about whether the financial statements are free of material misstatement. An audit includes examining, on a test basis, evidence supporting the amounts and disclosures in the financial statements. An audit also includes assessing the accounting principles used and significant estimates made by management, as well as evaluating the overall financial statement presentation. We believe that our audits provide a reasonable basis for our opinion.
In our opinion, the consolidated financial statements referred to above present fairly, in all material respects, the financial position of PFSweb, Inc. and subsidiaries as of December 31, 2014 and 2013, and the results of their operations and their cash flows for each of the two years in the period ended December 31, 2014 in conformity with accounting principles generally accepted in the United States of America. Also in our opinion, the related financial statement schedules, when considered in relation to the basic consolidated financial statements taken as a whole, present fairly, in all material respects, the information set forth therein.
We also have audited, in accordance with the standards of the Public Company Accounting Oversight Board (United States), the Company’s internal control over financial reporting as of December 31, 2014, based on criteria established in the 2013 Internal Control—Integrated Framework issued by the Committee of Sponsoring Organizations of the Treadway Commission (COSO), and our report dated March 23, 2015 expressed an unmodified opinion.
/s/ GRANT THORNTON LLP
Dallas, Texas
March 23, 2015
39
Report of Independent Registered Public Accounting Firm
The Board of Directors and Shareholders
PFSweb, Inc.
We have audited the internal control over financial reporting of PFSweb, Inc. (a Delaware corporation) and subsidiaries (the “Company”) as of December 31, 2014, based on criteria established in the 2013 Internal Control—Integrated Framework issued by the Committee of Sponsoring Organizations of the Treadway Commission (COSO). The Company’s management is responsible for maintaining effective internal control over financial reporting and for its assessment of the effectiveness of internal control over financial reporting, included in the accompanying Management’s Report on Internal Control over Financial Reporting. Our responsibility is to express an opinion on the Company’s internal control over financial reporting based on our audit. Our audit of, and opinion on, the Company's internal control over financial reporting does not include the internal control over financial reporting of REV Solutions, Inc. and REVTECH Solutions India Private Limited (collectively “REV”), a consolidated subsidiary, whose financial statements reflect total assets and revenues constituting 4.7% and 1.3%, respectively, of the related consolidated financial statement amounts as of and for the year ended December 31, 2014. Our audit of, and opinion on, the Company's internal control over financial reporting also does not include the internal control over financial reporting of LiveAreaLabs, Inc., a consolidated subsidiary, whose financial statements reflect total assets and revenues constituting 6.2% and 1.2% percent, respectively, of the related consolidated financial statement amounts as of and for the year ended December 31, 2014. As indicated in Management's Report on Internal Control over Financial Reporting, these subsidiaries were acquired during 2014, and therefore, management's assertion on the effectiveness of the Company's internal control over financial reporting excluded internal control over financial reporting of these subsidiaries.
We conducted our audit in accordance with the standards of the Public Company Accounting Oversight Board (United States). Those standards require that we plan and perform the audit to obtain reasonable assurance about whether effective internal control over financial reporting was maintained in all material respects. Our audit included obtaining an understanding of internal control over financial reporting, assessing the risk that a material weakness exists, testing and evaluating the design and operating effectiveness of internal control based on the assessed risk, and performing such other procedures as we considered necessary in the circumstances. We believe that our audit provides a reasonable basis for our opinion.
A company’s internal control over financial reporting is a process designed to provide reasonable assurance regarding the reliability of financial reporting and the preparation of financial statements for external purposes in accordance with generally accepted accounting principles. A company’s internal control over financial reporting includes those policies and procedures that (1) pertain to the maintenance of records that, in reasonable detail, accurately and fairly reflect the transactions and dispositions of the assets of the company; (2) provide reasonable assurance that transactions are recorded as necessary to permit preparation of financial statements in accordance with generally accepted accounting principles, and that receipts and expenditures of the company are being made only in accordance with authorizations of management and directors of the company; and (3) provide reasonable assurance regarding prevention or timely detection of unauthorized acquisition, use, or disposition of the company’s assets that could have a material effect on the financial statements.
Because of its inherent limitations, internal control over financial reporting may not prevent or detect misstatements. Also, projections of any evaluation of effectiveness to future periods are subject to the risk that controls may become inadequate because of changes in conditions, or that the degree of compliance with the policies or procedures may deteriorate.
In our opinion, the Company maintained, in all material respects, effective internal control over financial reporting as of December 31, 2014, based on criteria established in the 2013 Internal Control—Integrated Framework issued by COSO.
We also have audited, in accordance with the standards of the Public Company Accounting Oversight Board (United States), the consolidated financial statements of the Company as of and for the year ended December 31, 2014, and our report dated March 23, 2015 expressed an unqualified opinion on those financial statements.
/s/ GRANT THORNTON LLP
Dallas, Texas
March 23, 2015
40
CONSOLIDATED BALANCE SHEETS
(In thousands, except share data)
|
|
December 31, |
|
|
December 31, |
|
||
|
|
2014 |
|
|
2013 |
|
||
|
ASSETS |
|
|
|
|
|
|
|
|
CURRENT ASSETS: |
|
|
|
|
|
|
|
|
Cash and cash equivalents |
$ |
18,128 |
|
|
$ |
22,418 |
|
|
Restricted cash |
|
521 |
|
|
|
130 |
|
|
Accounts receivable, net of allowance for doubtful accounts of $447 and $382 at December 31, 2014 and December 31, 2013, respectively |
|
59,126 |
|
|
|
55,292 |
|
|
Inventories, net of reserves of $768 and $962 at December 31, 2014 and December 31, 2013, respectively |
|
10,534 |
|
|
|
14,169 |
|
|
Other receivables |
|
5,638 |
|
|
|
5,241 |
|
|
Prepaid expenses and other current assets |
|
7,103 |
|
|
|
4,713 |
|
|
Total current assets |
|
101,050 |
|
|
|
101,963 |
|
|
PROPERTY AND EQUIPMENT, net |
|
26,604 |
|
|
|
27,190 |
|
|
IDENTIFIABLE INTANGIBLES, net |
|
2,170 |
|
|
|
— |
|
|
GOODWILL |
|
8,366 |
|
|
|
— |
|
|
OTHER ASSETS |
|
2,556 |
|
|
|
2,883 |
|
|
Total assets |
$ |
140,746 |
|
|
$ |
132,036 |
|
|
LIABILITIES AND SHAREHOLDERS’ EQUITY |
|
|
|
|
|
|
|
|
CURRENT LIABILITIES: |
|
|
|
|
|
|
|
|
Current portion of long-term debt and capital lease obligations |
$ |
6,850 |
|
|
$ |
8,231 |
|
|
Trade accounts payable |
|
38,842 |
|
|
|
34,096 |
|
|
Deferred revenue |
|
9,098 |
|
|
|
8,181 |
|
|
Accrued expenses |
|
28,473 |
|
|
|
25,045 |
|
|
Total current liabilities |
|
83,263 |
|
|
|
75,553 |
|
|
LONG-TERM DEBT AND CAPITAL LEASE OBLIGATIONS, less current portion |
|
4,062 |
|
|
|
2,876 |
|
|
DEFERRED REVENUE |
|
5,355 |
|
|
|
7,491 |
|
|
DEFERRED RENT |
|
4,870 |
|
|
|
5,191 |
|
|
OTHER LIABILITIES |
|
3,091 |
|
|
|
— |
|
|
Total liabilities |
|
100,641 |
|
|
|
91,111 |
|
|
|
|
|
|
|
|
|
|
|
COMMITMENTS AND CONTINGENCIES |
|
|
|
|
|
|
|
|
|
|
|
|
|
|
|
|
|
SHAREHOLDERS’ EQUITY: |
|
|
|
|
|
|
|
|
Preferred stock, $1.00 par value; 1,000,000 shares authorized; none issued or outstanding |
|
— |
|
|
|
— |
|
|
Common stock, $0.001 par value; 35,000,000 shares authorized; 17,047,093 and 16,540,904 shares issued at December 31, 2014 and December 31, 2013, respectively; and 17,013,626 and 16,507,437 outstanding at December 31, 2014 and December 31, 2013, respectively |
|
17 |
|
|
|
17 |
|
|
Additional paid-in capital |
|
129,457 |
|
|
|
124,522 |
|
|
Accumulated deficit |
|
(89,926 |
) |
|
|
(85,300 |
) |
|
Accumulated other comprehensive income |
|
682 |
|
|
|
1,811 |
|
|
Treasury stock at cost, 33,467 shares |
|
(125 |
) |
|
|
(125 |
) |
|
Total shareholders’ equity |
|
40,105 |
|
|
|
40,925 |
|
|
Total liabilities and shareholders’ equity |
$ |
140,746 |
|
|
$ |
132,036 |
|
The accompanying notes are an integral part of these consolidated financial statements.
41
CONSOLIDATED STATEMENTS OF OPERATIONS AND COMPREHENSIVE LOSS
FOR THE YEARS ENDED DECEMBER 31
(In thousands, except per share data)
|
|
2014 |
|
|
2013 |
|
||
|
REVENUES: |
|
|
|
|
|
|
|
|
Product revenue, net |
$ |
75,284 |
|
|
$ |
90,982 |
|
|
Service fee revenue |
|
134,385 |
|
|
|
112,977 |
|
|
Pass-through revenue |
|
37,379 |
|
|
|
37,644 |
|
|
Total revenues |
|
247,048 |
|
|
|
241,603 |
|
|
COSTS OF REVENUES: |
|
|
|
|
|
|
|
|
Cost of product revenue |
|
71,019 |
|
|
|
85,237 |
|
|
Cost of service fee revenue |
|
94,858 |
|
|
|
77,160 |
|
|
Cost of pass-through revenue |
|
37,379 |
|
|
|
37,644 |
|
|
Total costs of revenues |
|
203,256 |
|
|
|
200,041 |
|
|
Gross profit |
|
43,792 |
|
|
|
41,562 |
|
|
SELLING, GENERAL AND ADMINISTRATIVE EXPENSES, including stock based compensation expense of $3,059 and $2,574 in the years ended December 31, 2014 and 2013, respectively |
|
47,658 |
|
|
|
46,235 |
|
|
Loss from operations |
|
(3,866 |
) |
|
|
(4,673 |
) |
|
INTEREST EXPENSE, net |
|
813 |
|
|
|
679 |
|
|
Loss from operations before income taxes |
|
(4,679 |
) |
|
|
(5,352 |
) |
|
INCOME TAX EXPENSE (BENEFIT) |
|
(53 |
) |
|
|
539 |
|
|
NET LOSS |
$ |
(4,626 |
) |
|
$ |
(5,891 |
) |
|
|
|
|
|
|
|
|
|
|
NET LOSS PER SHARE: |
|
|
|
|
|
|
|
|
Basic |
$ |
(0.28 |
) |
|
$ |
(0.39 |
) |
|
Diluted |
$ |
(0.28 |
) |
|
$ |
(0.39 |
) |
|
WEIGHTED AVERAGE NUMBER OF SHARES OUTSTANDING: |
|
|
|
|
|
|
|
|
Basic |
|
16,737 |
|
|
|
14,957 |
|
|
Diluted |
|
16,737 |
|
|
|
14,957 |
|
|
COMPREHENSIVE LOSS: |
|
|
|
|
|
|
|
|
Net loss |
$ |
(4,626 |
) |
|
$ |
(5,891 |
) |
|
Foreign currency translation adjustment |
|
(1,129 |
) |
|
|
257 |
|
|
TOTAL COMPREHENSIVE LOSS |
$ |
(5,755 |
) |
|
$ |
(5,634 |
) |
The accompanying notes are an integral part of these consolidated financial statements.
42
CONSOLIDATED STATEMENTS OF SHAREHOLDERS’ EQUITY
(In thousands, except share data)
|
|
|
|
|
|
|
|
|
|
|
|
|
Accumulated |
|
|
|
|
|
|
|
|
|
|
|
|
|
||||||
|
|
|
|
|
|
|
|
|
|
Additional |
|
|
|
|
|
|
Other |
|
|
|
|
|
|
|
|
|
|
Total |
|
|||
|
|
Common Stock |
|
|
Paid-In |
|
|
Accumulated |
|
|
Comprehensive |
|
|
Treasury Stock |
|
|
Shareholders' |
|
||||||||||||||
|
|
Shares |
|
|
Amount |
|
|
Capital |
|
|
Deficit |
|
|
Income (Loss) |
|
|
Shares |
|
|
Amount |
|
|
Equity |
|
||||||||
|
|
|
|
|
|
|
|
|
|
|
|
|
|
|
|
|
|
|
|
|
|
|
|
|
|
|
|
|
|
|
|
|
|
Balance, December 31, 2012 |
|
12,812,386 |
|
|
$ |
13 |
|
|
$ |
106,018 |
|
|
$ |
(79,409 |
) |
|
$ |
1,554 |
|
|
|
33,467 |
|
|
$ |
(125 |
) |
|
$ |
28,051 |
|
|
Net loss |
— |
|
|
— |
|
|
— |
|
|
|
(5,891 |
) |
|
— |
|
|
— |
|
|
— |
|
|
|
(5,891 |
) |
||||||
|
Stock-based compensation expense |
— |
|
|
— |
|
|
|
2,574 |
|
|
— |
|
|
— |
|
|
— |
|
|
— |
|
|
|
2,574 |
|
||||||
|
Issuance of common stock |
|
3,728,518 |
|
|
|
4 |
|
|
|
15,930 |
|
|
— |
|
|
— |
|
|
— |
|
|
— |
|
|
|
15,934 |
|
||||
|
Other comprehensive loss - foreign currency translation adjustment |
— |
|
|
— |
|
|
— |
|
|
— |
|
|
|
257 |
|
|
— |
|
|
— |
|
|
|
257 |
|
||||||
|
Balance, December 31, 2013 |
|
16,540,904 |
|
|
|
17 |
|
|
|
124,522 |
|
|
|
(85,300 |
) |
|
|
1,811 |
|
|
|
33,467 |
|
|
|
(125 |
) |
|
|
40,925 |
|
|
Net loss |
— |
|
|
— |
|
|
— |
|
|
|
(4,626 |
) |
|
— |
|
|
— |
|
|
— |
|
|
|
(4,626 |
) |
||||||
|
Stock-based compensation expense, net of taxes |
— |
|
|
— |
|
|
|
2,620 |
|
|
— |
|
|
— |
|
|
— |
|
|
— |
|
|
|
2,620 |
|
||||||
|
Issuance of common stock |
|
451,585 |
|
|
— |
|
|
|
1,631 |
|
|
— |
|
|
— |
|
|
— |
|
|
— |
|
|
|
1,631 |
|
|||||
|
Shares issued for acquisition |
|
54,604 |
|
|
— |
|
|
|
544 |
|
|
— |
|
|
— |
|
|
— |
|
|
— |
|
|
|
544 |
|
|||||
|
Non-cash compensation expense |
— |
|
|
— |
|
|
|
140 |
|
|
— |
|
|
— |
|
|
— |
|
|
— |
|
|
|
140 |
|
||||||
|
Other comprehensive loss - foreign currency translation adjustment |
— |
|
|
— |
|
|
— |
|
|
— |
|
|
|
(1,129 |
) |
|
— |
|
|
— |
|
|
|
(1,129 |
) |
||||||
|
Balance, December 31, 2014 |
|
17,047,093 |
|
|
$ |
17 |
|
|
$ |
129,457 |
|
|
$ |
(89,926 |
) |
|
$ |
682 |
|
|
|
33,467 |
|
|
$ |
(125 |
) |
|
$ |
40,105 |
|
The accompanying notes are an integral part of these consolidated financial statements.
43
CONSOLIDATED STATEMENTS OF CASH FLOWS
FOR THE YEARS ENDED DECEMBER 31
(In thousands)
|
|
2014 |
|
|
2013 |
|
||
|
CASH FLOWS FROM OPERATING ACTIVITIES: |
|
|
|
|
|
|
|
|
Net loss |
$ |
(4,626 |
) |
|
$ |
(5,891 |
) |
|
Adjustments to reconcile net loss to net cash provided by operating activities: |
|
|
|
|
|
|
|
|
Depreciation and amortization |
|
11,675 |
|
|
|
10,210 |
|
|
Provision for doubtful accounts |
|
165 |
|
|
|
25 |
|
|
Provision for excess and obsolete inventory |
|
53 |
|
|
|
81 |
|
|
Deferred income taxes |
|
(841 |
) |
|
|
29 |
|
|
Stock-based compensation expense |
|
3,059 |
|
|
|
2,574 |
|
|
Non-cash compensation expense |
|
140 |
|
|
|
— |
|
|
Changes in operating assets and liabilities: |
|
|
|
|
|
|
|
|
Restricted cash |
|
(31 |
) |
|
|
28 |
|
|
Accounts receivable |
|
(2,743 |
) |
|
|
(9,273 |
) |
|
Inventories |
|
3,407 |
|
|
|
10,456 |
|
|
Prepaid expenses, other receivables and other assets |
|
(2,526 |
) |
|
|
2,498 |
|
|
Deferred rent |
|
(187 |
) |
|
|
(273 |
) |
|
Accounts payable, deferred revenue, accrued expenses and other liabilities |
|
5,798 |
|
|
|
(3,636 |
) |
|
Net cash provided by operating activities |
|
13,343 |
|
|
|
6,828 |
|
|
|
|
|
|
|
|
|
|
|
CASH FLOWS FROM INVESTING ACTIVITIES: |
|
|
|
|
|
|
|
|
Purchases of property and equipment |
|
(5,445 |
) |
|
|
(7,971 |
) |
|
Acquisitions, net of cash acquired |
|
(6,366 |
) |
|
|
— |
|
|
Net cash used in investing activities |
|
(11,811 |
) |
|
|
(7,971 |
) |
|
|
|
|
|
|
|
|
|
|
CASH FLOWS FROM FINANCING ACTIVITIES: |
|
|
|
|
|
|
|
|
Net proceeds from issuance of common stock |
|
1,631 |
|
|
|
15,934 |
|
|
Increase (decrease) in restricted cash |
|
(360 |
) |
|
|
126 |
|
|
Payments on capital lease obligations |
|
(2,533 |
) |
|
|
(2,680 |
) |
|
Payments on long-term debt, net |
|
(2,929 |
) |
|
|
(9,724 |
) |
|
Net cash provided by (used in) financing activities |
|
(4,191 |
) |
|
|
3,656 |
|
|
|
|
|
|
|
|
|
|
|
EFFECT OF EXCHANGE RATES ON CASH AND CASH EQUIVALENTS |
|
(1,631 |
) |
|
|
279 |
|
|
|
|
|
|
|
|
|
|
|
NET INCREASE (DECREASE) IN CASH AND CASH EQUIVALENTS |
|
(4,290 |
) |
|
|
2,792 |
|
|
|
|
|
|
|
|
|
|
|
CASH AND CASH EQUIVALENTS, beginning of period |
|
22,418 |
|
|
|
19,626 |
|
|
|
|
|
|
|
|
|
|
|
CASH AND CASH EQUIVALENTS, end of period |
$ |
18,128 |
|
|
$ |
22,418 |
|
|
|
|
|
|
|
|
|
|
|
SUPPLEMENTAL CASH FLOW INFORMATION |
|
|
|
|
|
|
|
|
Non-cash investing and financing activities: |
|
|
|
|
|
|
|
|
Property and equipment acquired under long-term debt and capital leases |
$ |
5,344 |
|
|
$ |
1,338 |
|
The accompanying notes are an integral part of these consolidated financial statements.
44
NOTES TO CONSOLIDATED FINANCIAL STATEMENTS
1. Overview
PFSweb, Inc. and its subsidiaries are collectively referred to as the “Company;” “Supplies Distributors” refers to Supplies Distributors, Inc. and its subsidiaries; “Retail Connect” refers to PFSweb Retail Connect, Inc.; “REV” collectively refers to REV Solutions, Inc. and REVTECH Solutions India Private Limited; “LAL” refers to LiveAreaLabs, Inc., and “PFSweb” refers to PFSweb, Inc. and its subsidiaries and affiliates, excluding Supplies Distributors and Retail Connect.
PFSweb Overview
PFSweb is a global provider of omni-channel commerce solutions, including a broad range of technology, infrastructure and professional services, to major brand name companies and others seeking to optimize their supply chain and to enhance their online and traditional business channels and initiatives in the United States, Canada, and Europe. PFSweb’s service offerings include website design, creation and integration, digital agency and marketing, eCommerce technologies, order management, customer care, logistics and fulfillment, financial management and professional consulting.
Supplies Distributors Overview
Supplies Distributors and PFSweb operate under distributor agreements with Ricoh Company Limited and Ricoh USA Inc., a strategic business unit within the Ricoh Family Group of Companies (collectively hereafter referred to as “Ricoh”), under which Supplies Distributors acts as a distributor of various Ricoh products. The majority of Supplies Distributors’ revenue is generated by its sale of product purchased from Ricoh.
Supplies Distributors has obtained financing (see Notes 4 and 5) to fund the working capital requirements for the sale of primarily Ricoh products. Pursuant to the transaction management services agreements between PFSweb and Supplies Distributors, PFSweb provides to Supplies Distributors transaction management and fulfillment services, such as managed web hosting and maintenance, procurement support, web-enabled customer contact center services, customer relationship management, financial services including billing and collection services, information management, and international distribution services. Supplies Distributors does not have its own sales force and relies upon Ricoh’s sales force and product demand generation activities for its sale of Ricoh products. Supplies Distributors sells its products in the United States, Canada and Europe.
All of the agreements between PFSweb and Supplies Distributors were made in the context of a related party relationship and were negotiated in the overall context of PFSweb’s and Supplies Distributors’ arrangement with Ricoh. Although management believes the terms of these agreements are generally consistent with fair market values, there can be no assurance that the prices charged to or by each company under these arrangements are not higher or lower than the prices that may be charged by, or to, unaffiliated third parties for similar services. All of these transactions are eliminated upon consolidation.
2. Acquisition of REV
On September 3, 2014, Priority Fulfillment Services, Inc. (“PFS”), a wholly-owned subsidiary of PFSweb, acquired the outstanding capital stock of REV, which provides eCommerce website technical design, development and support services, enabling retailers, manufacturers and suppliers to optimize the customer experience across multiple channels. REV maintains operations in the United States and India. Consideration paid for the shares included an initial $2.6 million cash payment. In December, 2014, PFS paid an additional $0.6 million, which represented a true-up adjustment based on REV’s final shareholders’ equity balance compared to the balance as of the date of acquisition. The purchase agreement provides for future earn-out payments (“REV Earn-out Payments”) payable in 2015 and 2016 based on REV’s achievement of certain 2014 and 2015 financial targets, with a guaranteed minimum of an aggregate of $1.4 million and an aggregate maximum of $3.25 million, in each case, subject to possible offsets for indemnification and other claims arising under the purchase agreement. At PFS’ election, up to $0.2 million and $0.3 million of the 2014 REV Earn-out Payments and 2015 REV Earn-out Payments, respectively, are payable in unregistered shares of common stock of the Company. As of December 31, 2014, the Company has recognized a total liability of $2.9 million applicable to the projected REV earn-out payments, of which, $1.4 million is reflected as a current liability and is expected to be paid in 2015.
45
PFSWEB, INC. AND SUBSIDIARIES
NOTES TO CONSOLIDATED FINANCIAL STATEMENTS – (continued)
The transaction was accounted for using the purchase method of accounting for business combinations and, accordingly, the assets acquired and liabilities assumed, including an allocation of purchase price, and the results of operations of REV have been included in the Company's consolidated financial statements since the date of acquisition. The Company determined fair value using a combination of the discounted cash flow, market multiple and market capitalization valuation methods.
The following table summarizes the estimated fair value of the tangible and intangible assets acquired and liabilities assumed (in thousands):
|
Cash and cash equivalents |
$ |
765 |
|
|
Accounts receivable |
|
1,753 |
|
|
Property and equipment |
|
289 |
|
|
Identifiable intangibles |
|
1,019 |
|
|
Other assets |
|
16 |
|
|
Total assets acquired |
|
3,842 |
|
|
Total liabilities assumed |
|
655 |
|
|
Net assets acquired |
|
3,187 |
|
|
Total purchase price |
|
5,943 |
|
|
Goodwill |
$ |
2,756 |
|
Purchase price for REV is as follows (in thousands):
|
Aggregate cash payments |
$ |
3,161 |
|
|
Performance-based contingent payments |
|
2,782 |
|
|
Total purchase price |
$ |
5,943 |
|
The excess of the purchase price over the fair value of the net identifiable assets acquired and liabilities assumed was allocated to goodwill. Total goodwill of $2.8 million, none of which is deductible for tax purposes, is not being amortized but is subject to an annual impairment test using a fair-value-based approach.
The Company is amortizing the identifiable intangible assets acquired using a pattern in which the economic benefit of the assets are expected to be realized by the Company over their estimated remaining useful lives. There are no residual values for any of the intangible assets subject to amortization acquired during the REV acquisition.
Definite lived intangible assets acquired in the REV acquisition consist of (in thousands):
|
|
|
|
|
|
|
December 31, 2014 |
|
|
Estimated |
|||||
|
|
|
Fair Value |
|
|
Accumulated |
|
|
Net Carrying |
|
|
Useful Life |
|||
|
|
|
at Acquisition |
|
|
Amortization |
|
|
Value |
|
|
from Acquisition |
|||
|
|
|
|
|
|
|
|
|
|
|
|
|
|
|
|
|
Non-compete agreements |
|
$ |
94 |
|
|
$ |
(15 |
) |
|
$ |
79 |
|
|
1-3.5 years |
|
Leasehold |
|
|
45 |
|
|
|
(6 |
) |
|
|
39 |
|
|
2.5 years |
|
Customer relationships |
|
|
880 |
|
|
|
(49 |
) |
|
|
831 |
|
|
6 years |
|
Total definite lived intangible assets |
|
$ |
1,019 |
|
|
$ |
(70 |
) |
|
$ |
949 |
|
|
|
Acquisition of LAL
Effective September 22, 2014, PFS acquired the outstanding capital stock of LAL, which provides digital agency services including strategy, branding, website design, visual design, copywriting, interactive development and support services primarily to manufacturers and retailers. LAL operates in the United States. Consideration paid for the shares included an initial $4.0 million cash payment and 54,604 unregistered shares of Company stock (approximately $0.5 million in value as of acquisition date). The purchase agreement provides for future earn out payments (“LAL Earn-out Payments”) payable in 2015 and 2016 based on LAL’s achievement of certain 2014 and 2015 financial targets, with no guaranteed minimum and an aggregate maximum of $3.0 million, in each case, subject to possible offsets for indemnification and other claims arising under the purchase agreement. At PFS’ election, up to 25% of the 2015 LAL Earn-out Payments are payable in unregistered shares of common stock of the Company. As of December 31, 2014,
46
PFSWEB, INC. AND SUBSIDIARIES
NOTES TO CONSOLIDATED FINANCIAL STATEMENTS – (continued)
the Company has recognized a total liability of $2.5 million applicable to the projected LAL earn-out payments, of which, $1.0 million is reflected as a current liability and is expected to be paid in 2015.
The transaction was accounted for using the purchase method of accounting for business combinations and, accordingly, the assets acquired and liabilities assumed, including an allocation of purchase price, and the results of operations of LAL have been included in the Company's consolidated financial statements since the date of acquisition. The Company determined fair value using a combination of the discounted cash flow, market multiple and market capitalization valuation methods.
The following table summarizes the preliminary unaudited, estimated fair value of the tangible and intangible assets acquired and liabilities assumed (in thousands):
|
Cash |
$ |
30 |
|
|
Accounts receivable, net |
|
1,299 |
|
|
Property and equipment |
|
253 |
|
|
Identifiable intangibles |
|
1,290 |
|
|
Other assets |
|
28 |
|
|
Total assets acquired |
|
2,900 |
|
|
Total liabilities assumed |
|
1,617 |
|
|
Net assets acquired |
|
1,283 |
|
|
Total purchase price |
|
6,893 |
|
|
Goodwill |
$ |
5,610 |
|
Purchase price for LAL is as follows (in thousands, except share data):
|
Number of shares of common stock issued |
|
54,604 |
|
|
Multiplied by PFSweb Inc.'s stock price |
$ |
9.96 |
|
|
Share consideration |
$ |
544 |
|
|
Aggregate cash payments |
|
4,000 |
|
|
Performance-based contingent payments |
|
2,349 |
|
|
Total purchase price |
$ |
6,893 |
|
The excess of the purchase price over the fair value of the net identifiable assets acquired and liabilities assumed was allocated to goodwill. Total goodwill of $5.6 million, none of which is deductible for tax purposes, is not being amortized but is subject to an annual impairment test using a fair-value-based approach.
The Company is amortizing the identifiable intangible assets acquired using a pattern in which the economic benefit of the assets are expected to be realized by the Company over their estimated remaining useful lives. There are no residual values for any of the intangible assets subject to amortization acquired during the LAL acquisition.
Definite lived intangible assets acquired in the LAL acquisition consist of (in thousands):
|
|
|
|
|
|
|
December 31, 2014 |
|
|
Estimated |
|||||
|
|
|
Fair Value |
|
|
Accumulated |
|
|
Net Carrying |
|
|
Useful Life |
|||
|
|
|
at Acquisition |
|
|
Amortization |
|
|
Value |
|
|
from Acquisition |
|||
|
|
|
|
|
|
|
|
|
|
|
|
|
|
|
|
|
Non-compete agreements |
|
$ |
150 |
|
|
$ |
(11 |
) |
|
$ |
139 |
|
|
3.5 years |
|
Trade name |
|
|
150 |
|
|
|
(16 |
) |
|
|
134 |
|
|
2.25 years |
|
Customer relationships |
|
|
990 |
|
|
|
(42 |
) |
|
|
948 |
|
|
6 years |
|
Total definite lived intangible assets |
|
$ |
1,290 |
|
|
$ |
(69 |
) |
|
$ |
1,221 |
|
|
|
47
PFSWEB, INC. AND SUBSIDIARIES
NOTES TO CONSOLIDATED FINANCIAL STATEMENTS – (continued)
Definite Lived Intangible Asset Amortization
The Company recognized $0.1 million of amortization expense, applicable to the REV and LAL definite lived intangible assets in selling, general and administrative expenses in 2014. The estimated amortization expense for each of the next five years is as follows (in thousands):
|
2015 |
$ |
475 |
|
|
2016 |
|
459 |
|
|
2017 |
|
409 |
|
|
2018 |
|
320 |
|
|
2019 |
|
312 |
|
Pro Forma Information
The following table presents selected pro forma information, for comparative purposes, assuming the acquisitions of REV and LAL had occurred on January 1, 2013 (unaudited) (in thousands, except per share amounts):
|
|
Year Ended |
|
|||||
|
|
December 31, |
|
|||||
|
|
2014 |
|
|
2013 |
|
||
|
Total revenues |
$ |
258,450 |
|
|
$ |
254,691 |
|
|
Net loss |
|
(2,281 |
) |
|
|
(5,284 |
) |
|
Basic and diluted net loss per share |
|
(0.14 |
) |
|
|
(0.35 |
) |
The unaudited pro forma information combines the historical audited consolidated results of the Company’s operations and REV’s and LAL’s operations for the years ended December 31, 2014 and 2013 giving effect to the acquisitions and related events as if they had been consummated on January 1, 2013. The unaudited pro forma total revenues and pro forma net loss are not necessarily indicative of the consolidated results of operations for future periods or the results of operations that would have been realized had the Company consolidated REV and LAL during the periods noted.
Acquisition Related Expenses
The Company incurred approximately $1.7 million of acquisition-related costs during the year ended December 31, 2014, which are included in selling, general and administrative expenses in the consolidated statements of operations.
3. Significant Accounting Policies
Principles of Consolidation
All intercompany accounts and transactions have been eliminated in consolidation.
Investment in Affiliates
Priority Fulfillment Services, Inc. (“PFS”), a wholly-owned subsidiary of PFSweb, has made advances to Supplies Distributors that are evidenced by a Subordinated Demand Note (the “Subordinated Note”). Under the terms of certain of the Company’s debt facilities, the outstanding balance of the Subordinated Note cannot be increased to more than $5.0 million or decreased to less than $2.5 million without prior approval of certain of the Company’s lenders (see Notes 4 and 5). As of December 31, 2014 and 2013, the outstanding balance of the Subordinated Note was $2.5 million and $3.5 million, respectively. The Subordinate Note is eliminated in the Company’s consolidated financial statements.
PFS has also made advances to LAL, which totaled $0.4 million as of December 31, 2014 and are eliminated in the Company’s consolidated financial statements.
48
PFSWEB, INC. AND SUBSIDIARIES
NOTES TO CONSOLIDATED FINANCIAL STATEMENTS – (continued)
Use of Estimates
The preparation of consolidated financial statements and related disclosures in conformity with accounting principles generally accepted in the United States of America (“US GAAP”) requires management to make judgments, estimates and assumptions that affect the reported amounts of assets, liabilities, revenues and expenses and disclosure of contingent assets and liabilities. The recognition and allocation of certain revenues and selling, general and administrative expenses in these consolidated financial statements also require management estimates and assumptions.
Estimates and assumptions about future events and their effects cannot be determined with certainty. The Company bases its estimates on historical experience and various other assumptions believed to be applicable and reasonable under the circumstances. These estimates may change as new events occur, as additional information is obtained and as the operating environment changes. These changes have been included in the consolidated financial statements as soon as they became known. In addition, management is periodically faced with uncertainties, the outcomes of which are not within its control and will not be known for prolonged periods of time. Based on a critical assessment of accounting policies and the underlying judgments and uncertainties affecting the application of those policies, management believes the Company’s consolidated financial statements are fairly stated in accordance with US GAAP, and provide a fair presentation of the Company’s financial position and results of operations.
Revenue and Cost Recognition
The Company derives revenue primarily from services provided under contractual arrangements with its clients or from the sale of products under its distributor agreements. The following revenue recognition policies define the manner in which the Company accounts for sales transactions.
The Company recognizes revenue when persuasive evidence of a sales arrangement exists, product shipment or delivery has occurred or services have been rendered, the sales price or fee is fixed or determinable, and collectability is reasonably assured.
In instances where revenue is derived from sales of third-party vendor services, the Company records revenue on a gross basis when the Company is a principal to the transaction and net of costs when the Company is acting as an agent between the customer or client and the vendor. The Company considers several factors to determine whether it is a principal or an agent, most notably whether the Company is the primary obligor to the vendor or customer, has established its own pricing and has inventory and credit risks, if applicable.
Product Revenue Activity
Depending on the terms of the customer arrangement, Supplies Distributors recognizes product revenue and product cost either upon the shipment of product to customers or when the customer receives the product. Supplies Distributors permits its customers to return product for credit against other purchases, which include returns for defective products (that Supplies Distributors then returns to the manufacturer) and incorrect shipments. Supplies Distributors provides a reserve for estimated returns and allowances and offers terms to its customers that it believes are standard for its industry.
Freight costs billed to customers are reflected as components of product revenue. Freight costs incurred are recorded as a component of cost of goods sold.
Under its distributor agreements (see Note 7), Supplies Distributors bills Ricoh for reimbursements of certain expenses, including: pass-through customer marketing programs, including rebates and coop funds; certain freight costs; direct costs incurred in passing on any price decreases offered by Ricoh to Supplies Distributors or its customers to cover price protection and certain special bids; the cost of products provided to replace defective product returned by customers; and certain other expenses as defined. Supplies Distributors records these reimbursable amounts as they are incurred as other receivables in the consolidated balance sheet with a corresponding reduction in either inventory or cost of product revenue. Supplies Distributors also records pass-through customer marketing programs as a reduction of both product revenue and cost of product revenue.
49
PFSWEB, INC. AND SUBSIDIARIES
NOTES TO CONSOLIDATED FINANCIAL STATEMENTS – (continued)
Service Fee Revenue Activity
The Company’s service fee revenue primarily relates to its distribution services, order management/customer care services, professional digital agency and technology services. The Company typically charges its service fee revenue on either a cost-plus basis, a percent of shipped revenue basis , on a time and materials, project or retainer basis for professional services, or a per transaction basis, such as a per item basis for fulfillment services or a per labor hour basis for web-enabled customer contact center services. Additional fees are billed for other services.
The Company evaluates its contractual arrangements to determine whether or not they include multiple service elements. Revenue recognition is determined for the separate service elements of the contract in accordance with the requirements of Accounting Standards Codification 605, “Revenue Recognition.” A deliverable constitutes a separate unit of accounting when it has standalone value and there are no return rights or other contingencies present for the delivered elements. The Company allocates revenue to each element based on estimated selling price. Each of the Company’s client contracts, and the related services, is unique, with individual needs and criteria customized for each client. Each client engagement is scoped and priced separately and as such the Company is not able to establish vendor specific objective evidence of fair value for its services, nor is third-party evidence available to establish stand-alone selling prices. Accordingly the Company uses management’s best estimate of selling price for the deliverables. The Company establishes its estimates considering internal factors such as margin objectives, pricing practices and controls as well as market conditions such as competitor pricing strategies.
Distribution services relate primarily to inventory management, product receiving, warehousing and fulfillment (i.e., picking, packing and shipping) and facilities and operations management. Service fee revenue for these activities is recognized as earned, which is either (i) on a per transaction basis or (ii) at the time of product fulfillment, which occurs at the completion of the distribution services.
Order management/customer care services relate primarily to taking customer orders for the Company’s clients’ products. These services also entail addressing customer questions related to orders, as well as cross-selling/up-selling activities. Service fee revenue for this activity is recognized as the services are rendered. Fees charged to the client are on a per transaction basis based on either (i) a pre-determined fee per order or fee per telephone minutes incurred, (ii) a per dedicated agent fee, or (iii) are included in the product fulfillment service fees that are recognized on product shipment.
Professional consulting and technology service revenues primarily relate to design, implementation, service and support of eCommerce platforms, website design and solutions and quality control for the Company’s clients. Additionally, the Company provides digital agency services that enable client marketing programs to attract new customers, convert buyers and increase website value. These fees are typically charged on either a per labor hour or transaction basis, a dedicated resource model, a fixed price arrangement, or a percent of merchandise shipped basis. Service fee revenue for this activity is generally recognized as the services are rendered.
The Company performs front-end set-up and integration services to support client eCommerce platforms and websites. When the Company determines these front-end set-up and integration services do not meet the criteria for recognition as a separate unit of accounting, the Company defers the start-up fees received and the related costs, and recognizes them over the contract term which the Company believes approximates the performance period. When the Company determines these front-end set-up and integration services do meet the criteria for recognition as a separate unit of accounting, for time and material arrangements, the Company recognizes revenue as services are rendered and costs as they are incurred. For fixed-price arrangements, the Company uses the completed contract method to recognize revenues and costs if reasonable and reliable cost estimates for a project cannot be made. If reasonable and reliable costs estimates for a project can be made, the Company recognizes revenue over the contract term on a proportional performance basis, as determined by the relationship of actual costs incurred compared to the estimated total contract costs.
The Company’s billings for reimbursement of out-of-pocket expenses, including travel and certain third-party vendor expenses such as shipping and handling costs and telecommunication charges, are included in pass-through revenue. The related reimbursable costs are reflected as cost of pass-through revenue.
The Company’s cost of service fee revenue, representing the cost to provide the services described above, is recognized as incurred. Cost of service fee revenue also includes certain costs associated with technology collaboration and ongoing technology support that include maintenance, web hosting and other ongoing programming activities. These activities are primarily performed to support the distribution and order management/customer care services and are recognized as incurred.
50
PFSWEB, INC. AND SUBSIDIARIES
NOTES TO CONSOLIDATED FINANCIAL STATEMENTS – (continued)
Accounts Receivable
The Company recognizes revenue and records trade accounts receivable, pursuant to the methods described above, when collectability is reasonably assured. Collectability is evaluated in the aggregate and on an individual customer or client basis taking into consideration payment due date, historical payment trends, current financial position, results of independent credit evaluations and payment terms. Related reserves are determined by either using percentages applied to certain aged receivable categories based on historical results, reevaluated and adjusted as additional information is received, or a specific identification method. After all attempts to collect a receivable have failed, the receivable is written off against the allowance for doubtful accounts.
Deferred Revenues and Deferred Costs
The Company primarily performs its services under multiple year contracts, certain of which include early termination provisions, and clients are obligated to pay for services performed. In conjunction with these long-term contracts, the Company sometimes receives start-up fees to cover its implementation costs, including certain technology infrastructure and development costs. When the Company determines that these set-up and integration activities do not meet the criteria for recognition as a separate unit of accounting, the Company defers the start-up fees received, and the related costs, and recognizes them over the contract term, which the Company believes approximates the performance period. The amortization of deferred revenue is included as a component of service fee revenue. The amortization of deferred implementation costs is included as a cost of service fee revenue. To the extent implementation costs for non-technology infrastructure and development exceed the corresponding fees received, the excess costs are expensed as incurred. The following summarizes the deferred implementation revenues and costs, excluding technology and development costs that are included in property and equipment (in thousands):
|
|
December 31, |
|
|||||
|
|
2014 |
|
|
2013 |
|
||
|
Deferred implementation revenues |
|
|
|
|
|
|
|
|
Current |
$ |
9,098 |
|
|
$ |
8,181 |
|
|
Non-Current |
|
5,355 |
|
|
|
7,491 |
|
|
|
$ |
14,453 |
|
|
$ |
15,672 |
|
|
Deferred implementation costs |
|
|
|
|
|
|
|
|
Current |
$ |
3,309 |
|
|
$ |
1,977 |
|
|
Non-Current |
|
1,279 |
|
|
|
1,780 |
|
|
|
$ |
4,588 |
|
|
$ |
3,757 |
|
Current and non-current deferred implementation costs, excluding technology and development costs, are a component of prepaid expenses and other current assets and other assets, respectively.
Concentration of Business and Credit Risk
No product revenue customer or service fee client relationship represented more than 10% of the Company’s consolidated total net revenues during the years ended December 31, 2014 or 2013. One client exceeded 10% of the Company’s consolidated accounts receivable at December 31, 2013.
The Company has provided certain collateralized guarantees of its subsidiaries’ financings and credit arrangements. These subsidiaries’ ability to obtain financing on similar terms would be significantly impacted without these guarantees.
The Company has multiple arrangements with International Business Machines Corporation (“IBM”) and Ricoh. These arrangements include Supplies Distributors’ distributor agreements and certain of Supplies Distributors’ working capital financing agreements. The majority of Supplies Distributors’ revenue is generated by its sale of product purchased from Ricoh. Supplies Distributors also relies upon Ricoh’s sales force and product demand generation activities and the discontinuance of such services would have a material impact upon Supplies Distributors’ business. In addition, Supplies Distributors has product sales to IBM and Ricoh business affiliates.
As a result of certain operational restructuring of its business, Ricoh has implemented, and will continue to implement, certain changes in the sale and distribution of Ricoh products. The changes have resulted, and are expected to continue to result, in reduced revenues and profitability for Supplies Distributors.
51
PFSWEB, INC. AND SUBSIDIARIES
NOTES TO CONSOLIDATED FINANCIAL STATEMENTS – (continued)
Cash and Cash Equivalents
Cash equivalents are defined as short-term highly liquid investments with original maturities, when acquired, of three months or less. At times, the Company has cash balances in bank accounts that exceed Federal Deposit Insurance Corporation insured limits. The Company has not experienced any losses related to these cash concentrations.
Other Receivables
Other receivables include $3.6 million and $3.9 million as of December 31, 2014 and 2013, respectively, primarily for amounts due from Ricoh for costs incurred by the Company under the distributor agreements (see Note 7). In addition, other receivables include $1.3 million and $0.7 million as of December 31, 2014 and 2013, respectively, applicable to value added tax receivables.
Inventories
Inventories (all of which are finished goods) are stated at the lower of weighted average cost or market. The Company establishes inventory reserves based upon estimates of declines in values due to inventories that are slow moving or obsolete, excess levels of inventory or values assessed at lower than cost.
Supplies Distributors assumes responsibility for slow-moving inventory under its Ricoh distributor agreements, subject to certain termination rights, but has the right to return product rendered obsolete by engineering changes, as defined (see Note 7). In the event PFSweb, Supplies Distributors and Ricoh terminate the distributor agreements, the agreements provide for the parties to mutually agree on a plan of disposition of Supplies Distributors’ then existing inventory.
Supplies Distributors’ inventories include merchandise in-transit that has not been received by the Company but that has been shipped and invoiced by Supplies Distributors’ vendors. The corresponding payable for inventories in-transit is included in accounts payable in the accompanying consolidated financial statements.
The Company reviews inventory for impairment on a periodic basis, but at a minimum annually. Recoverability of the inventory on hand is measured by comparison of the carrying value of the inventory to the fair value of the inventory. The reserve for slow moving or excess inventory was $0.8 million and $1.0 million as of December 31, 2014 and 2013, respectively.
Property and Equipment
The components of property and equipment as of December 31, 2014 and 2013 are as follows (in thousands):
|
|
December, 31 |
|
|
Depreciable |
|||||
|
|
2014 |
|
|
2013 |
|
|
Life |
||
|
|
|
|
|
|
|
|
|
|
|
|
Purchased and capitalized software costs |
$ |
44,514 |
|
|
$ |
39,829 |
|
|
2-7 years |
|
Furniture and fixtures |
|
23,456 |
|
|
|
23,158 |
|
|
2-10 years |
|
Computer equipment |
|
12,184 |
|
|
|
11,050 |
|
|
3-5 years |
|
Leasehold improvements |
|
13,825 |
|
|
|
13,648 |
|
|
3-10 years |
|
Other |
|
1,144 |
|
|
|
2,520 |
|
|
3-5 years |
|
|
|
95,123 |
|
|
|
90,205 |
|
|
|
|
Less-accumulated depreciation and amortization |
|
(68,519 |
) |
|
|
(63,015 |
) |
|
|
|
Property and equipment, net |
$ |
26,604 |
|
|
$ |
27,190 |
|
|
|
The Company makes judgments and estimates in conjunction with the carrying value of these assets, including amounts to be capitalized, depreciation and amortization methods and useful lives. Additionally, the Company reviews long-lived assets for impairment whenever events or changes in circumstances indicate the carrying amount of an asset may not be recoverable. The Company records impairment losses, if any, in the period in which the Company determines the carrying amount is not recoverable. Recoverability of any assets to be held and used is measured by a comparison of the carrying amount of an asset to future net cash flows expected to be generated by the asset. This may require the Company to make judgments regarding long-term forecasts of future revenues and costs related to the assets subject to review. During 2014 and 2013, no impairment of property and equipment was identified or recorded.
52
PFSWEB, INC. AND SUBSIDIARIES
NOTES TO CONSOLIDATED FINANCIAL STATEMENTS – (continued)
Property and equipment are stated at cost and are depreciated using the straight-line method over the estimated useful lives of the respective assets. Capitalized implementation costs are depreciated over the respective client contract term, which the Company believes approximates the performance period. Leasehold improvements are amortized over the shorter of the useful life of the related asset or the remaining lease term. Depreciation and amortization expense related to property and equipment, excluding capital leases, during 2014 and 2013 was $9.1 million and $7.6 million, respectively.
The Company’s property held under capital leases amount to approximately $4.8 million and $4.0 million, net of accumulated amortization of approximately $4.0 million and $4.4 million, at December 31, 2014 and 2013, respectively. Depreciation and amortization expense related to capital leases during 2014 and 2013 was $2.5 million and $2.6 million, respectively.
Long-Lived Assets
The Company reviews long-lived assets with definite lives for impairment whenever events or changes in circumstances indicate that the carrying amount of an asset may not be recoverable. The Company reviews goodwill for an impairment at least annually. Long-lived assets include property, intangible assets, goodwill and certain other assets. Recoverability of assets is measured by a comparison of the carrying amount of an asset to future net cash flows expected to be generated by the asset. If such assets are considered to be impaired, the impairment to be recognized is measured as the amount by which the carrying amount of the assets exceeds the fair value of the assets. Fair value is determined using appraisals, discounted cash flow analysis or similar valuation techniques. We make judgments and estimates in conjunction with the carrying value of these assets, including amounts to be capitalized, depreciation and amortization methods and useful lives. We record impairment losses in the period in which we determine that the carrying amount is not recoverable. This may require us to make judgments regarding long-term forecasts of our future revenues and costs related to the assets subject to review.
Operating Leases
The Company leases certain real estate for its warehouse, call center, sales, professional services and corporate offices, as well as certain equipment under non-cancelable operating leases that expire at various dates through 2024. Management expects that, in the normal course of business, leases that expire will be renewed or replaced by other similar leases. The Company recognizes escalating lease payments on a straight-line basis over the term of each respective lease, and classifies the difference between cash payments and rent expense recognized as deferred rent in the accompanying consolidated balance sheets.
Foreign Currency Translation and Transactions
For the Company’s Canadian, European and Indian operations, the local currency is the functional currency. Assets and liabilities are translated at exchange rates in effect at the end of the period, and income and expense items are translated at the average exchange rates on a monthly basis.
The Company includes currency gains and losses on short-term intercompany advances in the determination of net income and loss. The Company reports gains and losses on intercompany foreign currency transactions that are of a long-term investment nature as a separate component of shareholders’ equity.
Stock-Based Compensation
The Company uses stock-based compensation, including stock options, deferred stock units and other stock-based awards to provide long-term performance incentives for its executives, key employees and non-employee directors. From the service inception date to the grant date, the Company recognizes compensation cost for all share-based payments based on the reporting date fair value of the award. After the grant date, compensation cost is measured based on the grant date fair value. Depending on the conditions associated with the vesting of the award, compensation cost is recognized on a straight-line or graded basis, net of estimated forfeitures, over the requisite service period of each award. The Company records compensation cost as a component of selling, general and administrative expenses in the consolidated statements of operations.
The Company estimates the fair value of each option grant on the date of grant using the Black-Scholes option-pricing model and estimates the compensation cost for certain of the awards that have a performance condition using a Monte-Carlo simulation. The estimated fair value for awards involves assumptions for expected dividend yield, stock price volatility, risk-free interest rates and the expected life of the award.
53
PFSWEB, INC. AND SUBSIDIARIES
NOTES TO CONSOLIDATED FINANCIAL STATEMENTS – (continued)
Income Taxes
For federal income tax purposes, tax years that remain subject to examination include years 2011 through 2014. However, the utilization of net operating loss (“NOL”) carryforwards that arose prior to 2011 remains subject to examination through the years such carryforwards are utilized. For Europe, tax years that remain subject to examination include years 2012 to 2014. However, the utilization of NOL carryforwards that arose prior to 2012 remain subject to examination through the years such carryforwards are utilized. For Canada, tax years that remain subject to examination include years 2006 to 2014, depending on the subsidiary. For state income tax purposes, the tax years that remain subject to examination include years 2010 to 2014, depending upon the jurisdiction in which the Company files tax returns. The Company and its subsidiaries have various income tax returns in the process of examination. The Company does not expect these examinations will result in unrecognized tax benefits.
Deferred tax assets and liabilities are recognized for the future tax consequences attributable to differences between the financial statement carrying amounts of existing assets and liabilities and their respective tax bases. Deferred tax assets and liabilities are measured using enacted tax rates expected to apply to taxable income in the years in which those temporary differences are expected to be recovered or settled. The effect on deferred tax assets and liabilities of a change in tax rates is recognized in income in the period that includes the enactment date. Valuation allowances are established when necessary to reduce deferred tax assets to the amount more likely than not to be realized.
The Company recognizes interest and penalties related to certain tax positions in income tax expense.
Self Insurance
The Company is self-insured in the U.S. for medical insurance benefits up to certain stop-loss limits. Such costs are accrued based on known claims and an estimate of incurred, but not reported (“IBNR”) claims. IBNR claims are estimated using historical lag information and other data provided by claims administrators.
Fair Value of Financial Instruments
The carrying value of the Company’s financial instruments, which include cash and cash equivalents, accounts receivable, accounts payable, debt and capital lease obligations, approximate their fair values based on short terms to maturity or current market prices and interest rates.
Comprehensive Income (Loss)
Comprehensive income (loss) is defined as the change in equity (net assets) of a business enterprise during a period from transactions and other events and circumstances from non-owner sources. Comprehensive income (loss) consists of net income (loss) and foreign currency translation adjustments.
Net Loss Per Common Share
Basic and diluted net loss per share are computed by dividing net loss by the weighted-average number of common shares outstanding for the reporting period. The following equity awards (see Note 6) have been excluded from the calculation of diluted net loss per share as their effect would be anti-dilutive: 1.6 million and 1.8 million stock options for the years ended December 31, 2014 and 2013, respectively; 0.6 million and 0.5 million performance shares for the years ended December 31, 2014 and 2013, respectively; and 41,000 deferred stock units for the year ended December 31, 2014.
Cash Paid For Interest and Taxes During Year
The Company made payments for interest of approximately $0.7 million in each of the years ended December 31, 2014 and 2013 (see Notes 4 and 5). Income tax payments of approximately $0.7 million and $0.5 million were made during each of the years ended December 31, 2014 and 2013, respectively (see Note 9).
Impact of Recently Issued Accounting Standards
In May 2014, the Financial Accounting Standards Board (the “FASB”) issued ASU 2014-09, Revenue from Contracts with Customers (“ASU 2014-09”), which outlines a single, comprehensive model for entities to use in accounting for revenue arising from contracts with customers. ASU 2014-09 is applicable for fiscal years beginning after December 15, 2016, including interim periods
54
PFSWEB, INC. AND SUBSIDIARIES
NOTES TO CONSOLIDATED FINANCIAL STATEMENTS – (continued)
therein, and can be applied either retrospectively to each period presented or as a cumulative-effect adjustment as of the date of adoption. Early adoption is not permitted. The Company is currently evaluating the impact of the new guidance on the consolidated financial statements and related disclosures.
4. Vendor Financing
Supplies Distributors has a short-term credit facility with IBM Credit LLC (“IBM Credit”) to finance its distribution of Ricoh products in the United States, providing financing for eligible Ricoh inventory and certain receivables up to $15.0 million. The agreement has no stated maturity date and provides either party the ability to exit the facility following a 90-day notice. Given the structure of this facility and as outstanding balances, which represent inventory purchases, are repaid within twelve months, the Company has classified the outstanding amounts under this facility, which were $8.4 million and $9.8 million as of December 31, 2014 and 2013, respectively, as accounts payable in the consolidated balance sheets. As of December 31, 2014, Supplies Distributors had $1.9 million of available credit under this facility. The credit facility contains cross default provisions, various restrictions upon the ability of Supplies Distributors to, among other things, merge, consolidate, sell assets, incur indebtedness, make loans and payments to related parties (including entities directly or indirectly owned by PFSweb, Inc.), provide guarantees, make investments and loans, pledge assets, make changes to capital stock ownership structure and pay dividends. The credit facility also contains financial covenants, such as annualized revenue to working capital, net profit after tax to revenue, and total liabilities to tangible net worth, as defined, and is secured by certain of the assets of Supplies Distributors, as well as a collateralized guaranty of PFSweb. Additionally, PFS is required to maintain a minimum Subordinated Note receivable balance from Supplies Distributors of $2.5 million and the Company is required to maintain a minimum shareholders’ equity of $18.0 million. Borrowings under the credit facility accrue interest, after a defined free financing period, at prime rate plus 0.5% (3.75% as of both December 31, 2014 and 2013). The facility also includes a monthly service fee.
5. Debt and Capital Lease Obligations:
Outstanding debt and capital lease obligations consist of the following (in thousands):
|
|
December 31, |
|
|||||
|
|
2014 |
|
|
2013 |
|
||
|
Loan and security agreements |
|
|
|
|
|
|
|
|
Supplies Distributors |
$ |
3,267 |
|
|
$ |
3,776 |
|
|
PFS |
|
1,890 |
|
|
|
1,473 |
|
|
Master lease agreements |
|
5,589 |
|
|
|
4,973 |
|
|
Other |
|
166 |
|
|
|
885 |
|
|
Total |
|
10,912 |
|
|
|
11,107 |
|
|
Less current portion of long-term debt |
|
6,850 |
|
|
|
8,231 |
|
|
Long-term debt, less current portion |
$ |
4,062 |
|
|
$ |
2,876 |
|
55
PFSWEB, INC. AND SUBSIDIARIES
NOTES TO CONSOLIDATED FINANCIAL STATEMENTS – (continued)
Loan and Security Agreement – Supplies Distributors
Supplies Distributors has a loan and security agreement with Wells Fargo Bank, National Association (“Wells Fargo”) to provide financing for up to $12 million of eligible accounts receivable in the United States and Canada. As of December 31, 2014, Supplies Distributors had $3.2 million of available credit under this agreement. The Wells Fargo facility expires on the earlier of March 2016 or the date on which the parties to the Ricoh distributor agreement (see Note 7) no longer operate under the terms of such agreement and/or Ricoh no longer supplies products pursuant to such agreement. Borrowings under the Wells Fargo facility accrue interest at prime rate plus 0.25% to 0.75% (3.75% as of December 31, 2014) or Eurodollar rate plus 2.5% to 3.0%, dependent on excess availability and subject to a minimum of 3.0%, as defined. The interest rate as of December 31, 2014 was 3.75% for $2.3 million of outstanding borrowings and 3.0% for $1.0 million of outstanding borrowings. As of December 31, 2013, the interest rate was 3.75% for all of the outstanding borrowings. This agreement includes a monthly service fee and contains cross default provisions, various restrictions upon the ability of Supplies Distributors to, among other things, merge, consolidate, sell assets, incur indebtedness, make loans and payments to related parties (including entities directly or indirectly owned by PFSweb, Inc.), provide guarantees, make investments and loans, pledge assets, make changes to capital stock ownership structure and pay dividends. This agreement also contains financial covenants, such as a minimum net worth, as defined, and is secured by all of the assets of Supplies Distributors, as well as a collateralized guaranty of PFSweb. Additionally, PFS is required to maintain a Subordinated Note receivable balance from Supplies Distributors of no less than $2.5 million, may not maintain restricted cash of more than $5.0 million and is restricted with regard to transactions with related parties, indebtedness and changes to capital stock ownership structure. Supplies Distributors has entered into blocked account agreements with its banks pursuant to which a security interest was granted to Wells Fargo for all U.S. and Canadian customer remittances received in specified bank accounts. At December 31, 2014 and 2013, these bank accounts held $0.4 million and $0.1 million, respectively, which was restricted for payment to Wells Fargo.
Loan and Security Agreement – PFSweb
PFS has a Loan and Security Agreement (“Comerica Agreement”) with Comerica Bank (“Comerica”). The Comerica Agreement provides for up to $20.0 million ($17.0 million during certain non-seasonal peak months) of eligible accounts receivable financing (“Working Capital Advances”) through March 2016. The Comerica Agreement also provides for up to $2.0 million of eligible equipment advances (“Equipment Advances”) through March 2015, with a final maturity date of September 15, 2017. As of December 31, 2014, PFS had $19.9 million of available credit under the Working Capital Advance portion of this facility and $0.4 million available for Equipment Advances. Effective March 2014, borrowings under the Working Capital Advance portion of the Comerica Agreement accrue interest at prime rate plus 1% (4.25% at December, 31, 2014), while the Equipment Advances accrue interest at prime rate plus 1.5% (4.75% at December 31, 2014). Prior to March 2014, borrowings under the Working Capital Advance portion of the Comerica Agreement accrued interest at prime rate plus 2% (5.25% at December 31, 2013), while the Equipment Advances accrued interest at prime rate plus 2.25% (5.5% at December 31, 2013). The Comerica Agreement includes a monthly service fee and contains cross default provisions, various restrictions upon PFS’s ability to, among other things, merge, consolidate, sell assets, incur indebtedness, make loans and payments to related parties (including entities directly or indirectly owned by PFSweb, Inc.), make capital expenditures, make investments and loans, pledge assets, make changes to capital stock ownership structure, as well as financial covenants, as defined, of a minimum tangible net worth of $20 million, a minimum earnings before interest and taxes, plus depreciation, amortization and non-cash compensation accruals, if any, and a minimum liquidity ratio. The Comerica Agreement restricts the amount of the Subordinated Note receivable from Supplies Distributors to a maximum of $5.0 million. The Comerica Agreement is secured by all of the assets of PFS, as well as a guarantee of PFSweb, Inc.
Factoring Agreement
Supplies Distributors’ European subsidiary has a factoring agreement with BNP Paribas Fortis Factor (“BNP Paribas”) that provides factoring for up to 7.5 million Euros (approximately $9.1 million at December 31, 2014) of eligible accounts receivables through March 2015. The Company does not anticipate renewing this agreement upon expiration in March 2015. There were no outstanding borrowings as of December 31, 2014 or 2013. As of December 31, 2014, Supplies Distributors’ European subsidiary had approximately 0.5 million Euros (approximately $0.6 million) of available credit under this agreement. Borrowings accrue interest at Euribor plus 0.7% (0.7% at December 31, 2014).
Debt Covenants
To the extent the Company or any of its subsidiaries fail to comply with its covenants applicable to its debt or vendor financing obligations, including the monthly financial covenant requirements, such as profitability and cash flow, and required level of shareholders’ equity or net worth (as defined), the Company would be required to obtain a waiver from the lender or the lender would
56
PFSWEB, INC. AND SUBSIDIARIES
NOTES TO CONSOLIDATED FINANCIAL STATEMENTS – (continued)
be entitled to accelerate the repayment of any outstanding credit facility obligations, and exercise all other rights and remedies, including sale of collateral and enforcement of payment under the Company parent guarantee. Any acceleration of the repayment of the credit facilities may have a material adverse impact on the Company’s financial condition and results of operations and no assurance can be given that the Company would have the financial ability to repay all of such obligations. At December 31, 2014 and 2013, the Company had restricted net assets of approximately $23.2 million and $26.9 million, respectively. As of and for the year ended December 31, 2014, the Company was in compliance with all debt covenants.
Master Lease Agreements
The Company has various agreements that provide for leasing or financing transactions of equipment and other assets and will continue to enter into such arrangements as needed to finance the purchasing or leasing of certain equipment or other assets. Borrowings under these agreements, which generally have terms of three to five years, are generally secured by the related equipment, and in certain cases, by a Company parent guarantee.
Debt and Capital Lease Maturities
The Company’s aggregate maturities of debt subsequent to December 31, 2014 are as follows (in thousands):
|
Year ended December 31, |
|
|
|
|
2014 |
$ |
4,850 |
|
|
2015 |
|
1,085 |
|
|
2016 |
|
223 |
|
|
Thereafter |
— |
|
|
|
Total |
$ |
6,158 |
|
The following is a schedule of the Company’s future minimum lease payments under the capital leases, together with the present value of the net minimum lease payments as of December 31, 2014 (in thousands):
|
Year ended December 31, |
|
|
|
|
2014 |
$ |
2,186 |
|
|
2015 |
|
1,524 |
|
|
2016 |
|
966 |
|
|
2017 |
|
401 |
|
|
2018 |
|
14 |
|
|
Thereafter |
— |
|
|
|
Total minimum lease payments |
$ |
5,091 |
|
|
Less amount representing interest at rates ranging from 4.75% to 6.68% |
|
(337 |
) |
|
Present value of net minimum lease payments |
|
4,754 |
|
|
Less: Current portion |
|
(2,000 |
) |
|
Long-term capital lease obligations |
$ |
2,754 |
|
6. Stock and Stock Options
In May 2013, the Company completed a private placement pursuant to which the Company sold an aggregate of 3.2 million shares of common stock, par value $0.001 per share, at $4.57 per share, resulting in net proceeds, after deducting offering expense, of approximately $14.1 million.
Preferred Stock Purchase Rights
On June 8, 2000, and as amended, the Company’s Board of Directors declared a dividend distribution of one preferred stock purchase right (a “Right”) for each share of the Company’s common stock outstanding on July 6, 2000 and each share of common stock issued thereafter. Each Right entitles the registered shareholders to purchase from the Company one one-thousandth of a share of preferred stock at an exercise price of $67, subject to adjustment. The Rights are not currently exercisable, but would become
57
PFSWEB, INC. AND SUBSIDIARIES
NOTES TO CONSOLIDATED FINANCIAL STATEMENTS – (continued)
exercisable if certain events occurred relating to a person or group acquiring or attempting to acquire 23 percent or more of the Company’s outstanding shares of common stock. The Rights expire on July 6, 2015, unless redeemed, exchanged or extended by the Company.
Stock Compensation Plans
The Company has an Employee Stock and Incentive Plan (the “Employee Plan”) and a Non-Employee Director Stock Option and Retainer Plan (the “Director Plan”), each as amended and restated (collectively, the “Plans”) under which an aggregate of 4,942,341 shares of common stock have been authorized for issuance. The Plans provide for the granting of incentive awards to directors, executive management, key employees, and outside consultants of the Company in a variety of forms such as the award of an option, stock appreciation right, restricted stock award, restricted stock unit, deferred stock unit, among other stock-based awards. The Company uses newly issued shares of common stock to satisfy awards under the Plans.
From the service inception date to the grant date, the Company recognizes compensation cost for all share-based payments based on the reporting date fair value of the award. After the grant date compensation cost is measured based on the grant date fair value. Depending on the conditions associated with the vesting of the award, compensation cost is recognized on a straight-line or graded basis, net of estimated forfeitures, over the requisite service period of each award.
Total stock-based compensation expense was $3.1 million and $2.6 million for the years ended December 31, 2014 and 2013, respectively, and was included as a component of selling, general and administrative expenses in the consolidated statements of operations. As of December 31, 2014, there was $2.4 million of total unrecognized compensation costs related to non-vested share-based compensation arrangements granted under the Plans, which is expected to be recognized over a remaining weighted average period of approximately 2.0 years. This expected cost does not include the impact of any future stock-based compensation awards.
As of December 31, 2014, there were 1,537,957 shares available for future grants under the Plans. Each stock option or stock appreciation right award granted reduces the total shares available for grant by one share, while each award granted other than in the form of a stock option or stock appreciation right reduces the shares available for grant by 1.22 shares.
Stock Options
The rights to purchase shares under employee stock option agreements issued under the Plans typically vest over a three-year period, one-twelfth each quarter. Stock options must be exercised within 10 years from the date of grant. Stock options are generally issued such that the exercise price is equal to the market value of the Company’s common stock at the date of grant.
The following table summarizes stock option activity under the Plans:
|
|
|
|
|
|
|
|
|
|
|
|
Weighted |
|
|
|
|
|
|
|
|
|
|
|
|
|
|
|
|
|
|
Average |
|
|
|
|
|
|
|
|
|
|
|
|
|
|
Weighted |
|
|
Remaining |
|
|
Aggregate |
|
|||
|
|
|
|
|
|
|
|
Average |
|
|
Contractual |
|
|
Intrinsic |
|
|||
|
|
|
|
|
|
|
|
Exercise |
|
|
Life (in |
|
|
Value (in |
|
|||
|
|
Shares |
|
|
Price Per Share |
|
Price |
|
|
years) |
|
|
millions) |
|
||||
|
Outstanding, December 31, 2013 |
|
1,818,592 |
|
|
$1.01 - $13.91 |
|
$ |
4.90 |
|
|
|
|
|
|
|
|
|
|
Granted |
|
182,500 |
|
|
$7.44 - $11.19 |
|
$ |
9.07 |
|
|
|
|
|
|
|
|
|
|
Exercised |
|
(351,441 |
) |
|
$1.01 - $8.65 |
|
$ |
4.64 |
|
|
|
|
|
|
|
|
|
|
Canceled |
|
(46,793 |
) |
|
$2.72 - $13.91 |
|
$ |
6.97 |
|
|
|
|
|
|
|
|
|
|
Outstanding, December 31, 2014 |
|
1,602,858 |
|
|
$1.01 - $12.08 |
|
$ |
5.36 |
|
|
|
|
|
|
|
|
|
|
Exercisable, December 31, 2014 |
|
1,306,688 |
|
|
$1.01 - $12.08 |
|
$ |
4.88 |
|
|
|
5.3 |
|
|
$ |
10.2 |
|
|
Exercisable and expected to vest, December 31, 2014 |
|
1,558,688 |
|
|
$1.01 - $12.08 |
|
$ |
5.28 |
|
|
|
5.9 |
|
|
$ |
11.5 |
|
The weighted average fair value per share of options granted during the years ended December 31, 2014 and 2013 was $6.22 and $3.72, respectively. The total intrinsic value of options exercised under the Stock Option Plans was $1.8 million during the year ended December 31, 2014.
58
PFSWEB, INC. AND SUBSIDIARIES
NOTES TO CONSOLIDATED FINANCIAL STATEMENTS – (continued)
The fair value of each option grant is estimated on the date of grant using the Black-Scholes option-pricing model with the following assumptions used for grants of options under the Plans:
|
|
Year Ended |
|
|||||
|
|
December 31, |
|
|||||
|
|
2014 |
|
|
2013 |
|
||
|
Expected dividend yield |
— |
|
|
— |
|
||
|
Expected stock price volatility |
73% - 80% |
|
|
80% - 82% |
|
||
|
Weighted average stock price volatility |
|
79% |
|
|
|
82% |
|
|
Risk-free interest rate |
1.3% - 2.0% |
|
|
1.0% - 2.1% |
|
||
|
Expected life of options (years) |
6 |
|
|
6 |
|
||
The Black-Scholes option valuation model requires the input of highly subjective assumptions, including the expected life of the stock-based award and stock-price volatility. The assumptions listed above represent management’s best estimates, but these estimates involve inherent uncertainties and the application of management judgment. As a result, if other assumptions had been used, the Company’s recorded and pro forma stock-based compensation expense could have been different. In addition, the Company is required to estimate the expected forfeiture rate and only recognize expense for those shares expected to vest. If the Company’s actual forfeiture rate is materially different from its estimate, the share-based compensation expense could be materially different. The Company calculates the expected stock price volatility using the Company’s historical stock price during the expected term immediately preceding a stock option grant date. The Company has not paid dividends in the past and does not anticipate paying dividends in the future. The Company uses the risk-free interest rates of United States Treasury securities for a comparable term as the expected life of a stock option. The expected life of options has been computed using the simplified method, which the Company uses as it does not believe it has established a consistent exercise pattern to accurately estimate the expected term of stock options.
Performance Shares
On May 22, 2013, pursuant to the Employee Plan, the Company issued Performance-Based Share Awards (“Performance Shares”, as defined in the Employee Plan) to the Company’s executive officers and certain senior management. Under the terms of such awards, the determination of the number of Performance Shares that each such individual may receive was subject to, and calculated by reference to, the achievement by the Company of a goal measured by a range of targeted financial performance, as defined. Based on the Company’s 2013 results, the Company issued an aggregate of approximately 598,000 Performance Shares for 2013. The Performance Shares are subject to four year vesting based upon continued employment and the comparative market performance (on an annual and cumulative basis) of the Company’s common stock on NASDAQ compared to the Russell Micro Cap Index. The actual number of shares issued on each annual vesting date could range from zero to 100%, depending on satisfaction of the vesting conditions.
In March 2014, the Company issued Performance-Based Share Awards to the Company’s executive officers and certain senior management under which the number of performance shares to be issued was subject to, and calculated by reference to, the achievement by the Company of a performance goal measured by a range of targeted financial performance, as defined, for 2014. Based on the Company’s 2014 financial performance, no performance shares will be issued under the 2014 Performance Based Share Awards.
The compensation cost for the market condition portion of the Performance Shares was estimated based on a grant date valuation using a Monte-Carlo simulation. The 2013 Performance Shares resulted in a range of estimated fair values of $5.29 - $9.07 for the annual performance market condition and $7.34 - $9.07 for the cumulative performance market condition. The estimated fair values used for the 2013 Performance Shares were computed assuming a risk-free interest rate of 0.8% and an expected volatility of 52.6%.
As of December 31, 2014, the aggregate intrinsic value of the vested and unvested Performance Shares for 2013 was $1.9 million and $3.6 million, respectively.
Stock Units
Each non-employee Director of the Company’s Board of Directors (the “Board”) receives a quarterly retainer (the “Retainer”) of $25,000, payable on or about the first day of each quarter, through the issuance of an equity based award (an “Award”) under the
59
PFSWEB, INC. AND SUBSIDIARIES
NOTES TO CONSOLIDATED FINANCIAL STATEMENTS – (continued)
Employee Plan in the form of a Deferred Stock Unit (a “DSU”). The number of DSUs is determined by dividing the Retainer by the immediately preceding closing price of the Common Stock. Each DSU represents the right to receive an equal number of shares of Common Stock upon the retirement, resignation or termination of service from the Board. As of December 31, 2014, the Company has issued approximately 41,000 DSU Awards.
7. Distributor Agreements
Supplies Distributors, PFSweb and Ricoh have entered into distributor agreements under which Supplies Distributors acts as a distributor of various products, primarily Ricoh products, and PFSweb provides transaction management and fulfillment services to Supplies Distributors. The distributor agreements are subject to periodic renewals, the next of which is in December 2015. Under the distributor agreements, Ricoh sells product to Supplies Distributors and reimburses Supplies Distributors for certain freight costs, direct costs incurred in passing on any price decreases offered by Ricoh to Supplies Distributors or its customers to cover price protection and certain special bids, the cost of products provided to replace defective product returned by customers and other certain expenses as defined. Supplies Distributors can return to Ricoh product rendered obsolete by Ricoh engineering changes after customer demand ends. Ricoh determines when a product is obsolete. Ricoh and Supplies Distributors also have agreements under which Ricoh reimburses or collects from Supplies Distributors amounts calculated in certain inventory cost adjustments. Supplies Distributors passes through to customers marketing programs specified by Ricoh and administers such programs according to Ricoh guidelines.
8. Supplies Distributors
Pursuant to a credit agreement, Supplies Distributors is restricted from making any distributions to PFSweb if, after giving affect thereto, Supplies Distributors’ would be in noncompliance with its financial covenants. Under the terms of its amended credit agreements, Supplies Distributors is restricted from paying annual cash dividends without the prior approval of its lenders (see Notes 4 and 5). Supplies Distributors has received lender approval to pay approximately $0.9 million of dividends in 2015. Supplies Distributors paid dividends to PFSweb of $1.8 million and $1.5 million in 2014 and 2013, respectively.
9. Income Taxes
The consolidated income (loss) from continuing operations before income taxes, by domestic and foreign entities, is as follows (in thousands):
|
|
Year Ended |
|
|||||
|
|
December 31, |
|
|||||
|
|
2014 |
|
|
2013 |
|
||
|
Domestic |
$ |
(5,947 |
) |
|
$ |
(6,043 |
) |
|
Foreign |
|
1,268 |
|
|
|
691 |
|
|
Total |
$ |
(4,679 |
) |
|
$ |
(5,352 |
) |
60
PFSWEB, INC. AND SUBSIDIARIES
NOTES TO CONSOLIDATED FINANCIAL STATEMENTS – (continued)
A reconciliation of the difference between the expected income tax expense from continuing operations at the U.S. federal statutory corporate tax rate of 34%, and the Company’s effective tax rate is as follows (in thousands):
|
|
Year Ended |
|
|||||
|
|
December 31, |
|
|||||
|
|
2014 |
|
|
2013 |
|
||
|
Income tax benefit computed at statutory rate |
$ |
(1,591 |
) |
|
$ |
(1,820 |
) |
|
Foreign dividends received |
|
243 |
|
|
|
45 |
|
|
Items not deductible for tax purposes |
|
244 |
|
|
|
41 |
|
|
Change in valuation allowance |
|
911 |
|
|
|
1,654 |
|
|
Change in valuation reserve related to business combination adjustments |
|
(979 |
) |
|
— |
|
|
|
State taxes |
|
438 |
|
|
|
367 |
|
|
Foreign exchange rate difference |
|
155 |
|
|
|
104 |
|
|
Net operating loss adjustments |
|
634 |
|
|
|
(220 |
) |
|
Prior year return-to-provision true-up |
|
(131 |
) |
|
|
567 |
|
|
Other |
|
23 |
|
|
|
(199 |
) |
|
Provision for income taxes |
$ |
(53 |
) |
|
$ |
539 |
|
Current and deferred income tax expense (benefit) is summarized as follows (in thousands):
|
|
Year Ended |
|
|||||
|
|
December 31, |
|
|||||
|
|
2014 |
|
|
2013 |
|
||
|
Current |
|
|
|
|
|
|
|
|
State |
$ |
460 |
|
|
$ |
406 |
|
|
Foreign |
|
328 |
|
|
|
104 |
|
|
Total Current |
|
788 |
|
|
|
510 |
|
|
Deferred |
|
|
|
|
|
|
|
|
Domestic |
|
(979 |
) |
|
— |
|
|
|
State |
|
48 |
|
|
|
(107 |
) |
|
Foreign |
|
90 |
|
|
|
136 |
|
|
Total Deferred |
|
(841 |
) |
|
|
29 |
|
|
Provision for income taxes |
$ |
(53 |
) |
|
$ |
539 |
|
61
PFSWEB, INC. AND SUBSIDIARIES
NOTES TO CONSOLIDATED FINANCIAL STATEMENTS – (continued)
The components of the deferred tax asset (liability) are as follows (in thousands):
|
|
Year Ended |
|
|||||
|
|
December 31, |
|
|||||
|
|
2014 |
|
|
2013 |
|
||
|
Deferred tax assets: |
|
|
|
|
|
|
|
|
Allowance for doubtful accounts |
$ |
643 |
|
|
$ |
616 |
|
|
Inventory reserve |
|
255 |
|
|
|
347 |
|
|
Property and equipment |
|
46 |
|
|
— |
|
|
|
Accrued expenses |
|
1,419 |
|
|
|
2,104 |
|
|
Net operating loss carryforwards |
|
21,588 |
|
|
|
20,893 |
|
|
Other |
|
3,400 |
|
|
|
4,192 |
|
|
|
|
27,351 |
|
|
|
28,152 |
|
|
Less - Valuation allowance |
|
26,500 |
|
|
|
26,568 |
|
|
Total deferred tax asset |
|
851 |
|
|
|
1,584 |
|
|
Deferred tax liabilities: |
|
|
|
|
|
|
|
|
Property and equipment |
— |
|
|
|
(931 |
) |
|
|
Other |
|
(303 |
) |
|
— |
|
|
|
Total deferred tax liabilities |
|
(303 |
) |
|
|
(931 |
) |
|
Deferred tax assets, net |
$ |
548 |
|
|
$ |
653 |
|
Management believes that PFSweb has not established a sufficient history of earnings, on a stand-alone basis, to support the more likely than not realization of certain deferred tax assets in excess of existing taxable temporary differences. A valuation allowance has been provided for the majority of these net deferred income tax assets as of December 31, 2014 and 2013. The remaining net deferred tax assets at both December 31, 2014 and 2013 primarily relate to the Company’s European operations and certain state tax benefits. At December 31, 2014, net operating loss (“NOL”) carryforwards relate to taxable losses of PFSweb’s Canadian subsidiary totaling approximately $5.2 million and PFSweb’s U.S. subsidiaries totaling approximately $60.4 million that expire at various dates from 2015 through 2034. The U.S. NOL carryforward includes approximately $5.6 million relating to tax benefits of stock option exercises and, if utilized, will be recorded against additional paid-in capital upon utilization rather than as an adjustment to income tax expense from continuing operations. The U.S. NOL also includes approximately $20.3 million of NOL acquired before February 2006, which is subject to annual limits of $1.2 million, $16.0 million of NOL created before February 2006 subject to annual limits of $1.4 million, and $0.2 million acquired September 2014 subject to annual limits of $0.1 million under IRS Section 382.
The Company evaluates its tax positions for potential liabilities associated with unrecognized tax benefits. As of and for the year ended December 31, 2014, $0.1 million of unrecognized tax benefits, penalties or interest were identified or recorded in conjunction with the Company’s acquisition of REV. The Company does not expect to record unrecognized tax benefits in the next twelve months.
10. Commitments and Contingencies
The Company leases facilities, warehouse and office space and transportation and other equipment under operating leases expiring in various years through February 28, 2024. In most cases, management expects that, in the normal course of business, leases will be renewed or replaced by other similar leases. The Company’s facility leases generally contain one or more renewal options.
62
PFSWEB, INC. AND SUBSIDIARIES
NOTES TO CONSOLIDATED FINANCIAL STATEMENTS – (continued)
Minimum future annual rental payments under non-cancelable operating leases having original terms in excess of one year are as follows (in thousands):
|
|
Operating |
|
|
|
|
Lease |
|
|
|
|
Payments |
|
|
|
Year ended December 31, |
|
|
|
|
2015 |
$ |
7,644 |
|
|
2016 |
|
7,287 |
|
|
2017 |
|
6,185 |
|
|
2018 |
|
4,872 |
|
|
2019 |
|
4,335 |
|
|
Thereafter |
|
14,243 |
|
|
Total |
$ |
44,566 |
|
Total rental expense under operating leases approximated $7.2 million and $6.6 million for the years ended December 31, 2014 and 2013, respectively.
The Company received municipal tax abatements in certain locations. In prior years, the Company received notice from a municipality that it did not satisfy certain criteria necessary to maintain the abatements and that the municipal authority planned to make an adjustment to the Company’s tax abatement. The Company disputed the adjustment and such dispute has been settled with the municipality. However, the amount of additional property taxes to be assessed against the Company and the timing of the related payments has not been finalized. As of December 31, 2014, the Company believes it has adequately accrued for the expected assessment.
In April 2010, a sales employee of eCOST.com, Inc. (“eCOST”, the former name of Retail Connect) was charged with violating various federal criminal statutes in connection with the sales of eCOST products to certain customers, and approximately $620,000 held in an eCOST deposit account was seized and turned over to the Office of the U.S. Attorney in connection with such activity. In August 2012, the employee pleaded guilty to a misdemeanor. Neither the Company nor eCOST have been charged with any criminal activity, and the Company is seeking the recovery of the funds that are currently classified as other receivables on the December 31, 2014 and December 31, 2013 balance sheets. Based on the information available to date, the Company is unable to determine the amount of the loss, if any, relating to the seizure of such funds. No assurance can be given, however, that the seizure of such funds, or the inability of the Company to recover such funds or any significant portion thereof, or any costs and expenses incurred by the Company in connection with this matter, will not have a material adverse effect upon the Company’s financial condition or results of operations.
The Company is subject to claims in the ordinary course of business, including claims of alleged infringement by the Company or its subsidiaries of the patents, trademarks and other intellectual property rights of third parties. PFS is generally required to indemnify its service fee clients against any third party claims asserted against such clients alleging infringement by PFS of the patents, trademarks and other intellectual property rights of third parties.
63
PFSWEB, INC. AND SUBSIDIARIES
NOTES TO CONSOLIDATED FINANCIAL STATEMENTS – (continued)
11. Segment and Geographic Information
The Company is currently organized into two primary operating segments, which generally align with the corporate organization structure. In the first segment, PFSweb is a global provider of various infrastructure, technology and digital agency solutions and operates as a service fee business. In the second operating segment, (“Business and Retail Connect”), subsidiaries of the Company purchase inventory from clients and resell the inventory to client customers. In this segment, the Company generally recognizes product revenue.
|
|
Year Ended |
|
|||||
|
|
December 31, |
|
|||||
|
|
2014 |
|
|
2013 |
|
||
|
Revenues (in thousands): |
|
|
|
|
|
|
|
|
PFSweb |
$ |
171,508 |
|
|
$ |
152,338 |
|
|
Business and Retail Connect |
|
91,234 |
|
|
|
100,960 |
|
|
Eliminations |
|
(15,694 |
) |
|
|
(11,695 |
) |
|
|
$ |
247,048 |
|
|
$ |
241,603 |
|
|
Income (loss) from operations (in thousands): |
|
|
|
|
|
|
|
|
PFSweb |
$ |
(5,951 |
) |
|
$ |
(5,859 |
) |
|
Business and Retail Connect |
|
2,085 |
|
|
|
1,186 |
|
|
|
$ |
(3,866 |
) |
|
$ |
(4,673 |
) |
|
Depreciation and amortization (in thousands): |
|
|
|
|
|
|
|
|
PFSweb |
$ |
11,620 |
|
|
$ |
10,051 |
|
|
Business and Retail Connect |
|
55 |
|
|
|
159 |
|
|
|
$ |
11,675 |
|
|
$ |
10,210 |
|
|
Capital expenditures (in thousands): |
|
|
|
|
|
|
|
|
PFSweb |
$ |
5,445 |
|
|
$ |
7,876 |
|
|
Business and Retail Connect |
|
— |
|
|
|
95 |
|
|
|
$ |
5,445 |
|
|
$ |
7,971 |
|
|
|
|
|
|
|
|
|
|
|
|
|
|
|
|
|
|
|
|
|
|
|
|
|
|
|
|
|
|
December 31, |
|
|||||
|
|
2014 |
|
|
2013 |
|
||
|
Assets (in thousands): |
|
|
|
|
|
|
|
|
PFSweb |
$ |
104,372 |
|
|
$ |
98,745 |
|
|
Business and Retail Connect |
|
47,682 |
|
|
|
47,116 |
|
|
Eliminations |
|
(11,308 |
) |
|
|
(13,825 |
) |
|
|
$ |
140,746 |
|
|
$ |
132,036 |
|
64
PFSWEB, INC. AND SUBSIDIARIES
NOTES TO CONSOLIDATED FINANCIAL STATEMENTS – (continued)
Geographic areas in which the Company operates include the United States, Europe (primarily Belgium), Canada and India. The following is geographic information by area. Revenues are attributed based on the Company’s domicile.
|
|
Year Ended |
|
|||||
|
|
December 31, |
|
|||||
|
|
2014 |
|
|
2013 |
|
||
|
Revenues (in thousands): |
|
|
|
|
|
|
|
|
United States |
$ |
197,709 |
|
|
$ |
192,522 |
|
|
Europe |
|
43,291 |
|
|
|
44,770 |
|
|
Canada |
|
7,222 |
|
|
|
5,988 |
|
|
India |
|
641 |
|
|
— |
|
|
|
Inter-segment Eliminations |
|
(1,815 |
) |
|
|
(1,677 |
) |
|
|
$ |
247,048 |
|
|
$ |
241,603 |
|
|
|
|
|
|
|
|
|
|
|
Other long-lived assets (in thousands): |
|
|
|
|
|
|
|
|
United States |
$ |
35,069 |
|
|
$ |
25,549 |
|
|
Europe |
|
2,825 |
|
|
|
4,168 |
|
|
Canada |
|
350 |
|
|
|
356 |
|
|
India |
|
1,452 |
|
|
|
— |
|
|
|
$ |
39,696 |
|
|
$ |
30,073 |
|
12. Employee Savings Plan
The Company has a defined contribution employee savings plan under Section 401(k) of the Internal Revenue Code. Substantially all full-time and part-time U.S. employees are eligible to participate in the plan. The Company, at its discretion, may match employee contributions to the plan and also make an additional matching contribution in the form of profit sharing in recognition of the Company’s performance. The Company contributed approximately $0.2 million during each of the years ended December 31, 2014 and 2013, to match an approved percentage of employee contributions.
65
None.
Evaluation of Disclosure Controls and Procedures
We maintain a comprehensive set of disclosure controls and procedures as defined in Rules 13a-15(e) and 15d-15(e) under the Securities Exchange Act of 1934 (the “Exchange Act”). As of December 31, 2014, an evaluation of the effectiveness of our disclosure controls and procedures was carried out under the supervision and with the participation of our management, including our Chief Executive Officer and Chief Financial Officer. Based upon that evaluation, the Chief Executive Officer and Chief Financial Officer concluded that, as of the end of the period covered by this report, these disclosure controls and procedures were effective.
Changes in Internal Control Over Financial Reporting
We continually evaluate our internal control processes to ensure that as our business and processes change our internal control structure adapts accordingly. Pursuant to this ongoing control evaluation, during the fourth quarter of 2014 we implemented an enhanced journal entry review process that expanded upon our detailed account level review controls, which are designed and in place to detect material journal entry related misstatements.
Management’s Report on Internal Control Over Financial Reporting
Our management is responsible for establishing and maintaining adequate internal control over financial reporting as defined in Rules 13a-15(f) under the Exchange Act. Our internal control over financial reporting is designed, under the supervision of our principle executive and principle financial officers, and effected by our Board of Directors, management and other personnel, to provide reasonable assurance regarding the reliability of financial reporting and the preparation of financial statements for external purposes in accordance with accounting principles generally accepted in the United States of America (GAAP). Our internal control over financial reporting includes those policies and procedures that: (i) pertain to the maintenance of records that, in reasonable detail, accurately and fairly reflect the transactions and dispositions of our assets; (ii) provide reasonable assurance that transactions are recorded as necessary to permit preparation of financial statements in accordance with GAAP, and that our receipts and expenditures are being made only in accordance with authorizations of our management and Board of Directors; and (iii) provide reasonable assurance regarding prevention or timely detection of unauthorized acquisition, use or disposition of our assets that could have a material effect on the financial statements.
We conducted an evaluation of the effectiveness of our internal control over financial reporting as of December 31, 2014. This evaluation was based on the framework in “Internal Control—Integrated Framework” issued by the Committee of Sponsoring Organizations of the Treadway Commission (COSO) in 2013. All internal control systems, no matter how well designed, have inherent limitations. Therefore, even those systems determined to be effective can provide only reasonable assurance regarding the reliability of financial reporting and the preparation of financial statements for external purposes in accordance with GAAP. Also, projections of any evaluation of the effectiveness of internal control over financial reporting to future periods are subject to the risk that the controls may become inadequate because of changes in conditions, or that the degree of compliance with the policies or procedures may deteriorate.
During September 2014, the Company completed acquisitions of REV Solutions, Inc. and REVTECH Solutions India Private Limited (collectively “REV”) and LiveAreaLabs, Inc. Management has acknowledged that it is responsible for establishing and maintaining a system of internal controls over financial reporting for these subsidiaries. We are in the process of integrating these subsidiaries, and we therefore excluded these subsidiaries from our December 31, 2014 assessment of the effectiveness of internal control over financial reporting. REV is a consolidated subsidiary whose financial statements reflect total assets of $6.6 million and total revenues of $3.2 million, which represent 4.7% and 1.3%, respectively, of the related consolidated financial statement amounts as of and for the year ended December 31, 2014. LiveAreaLabs, Inc., is a consolidated subsidiary whose financial statements reflect total assets of $8.8 million and total revenues of $3.1 million, which represent 6.2% and 1.2%, respectively, of the related consolidated financial statement amounts as of and for the year ended December 31, 2014. The impact of these transactions has not materially affected and is not expected to materially affect our internal control over financial reporting. As a result of these integration activities, certain controls will be evaluated and may be changed. We believe, however, that we will be able to maintain sufficient controls over the substantive results of our financial reporting throughout this integration process.
Based on our evaluation under the framework in Internal Control—Integrated Framework, our Chief Executive Officer and Chief Financial Officer concluded that internal control over financial reporting was effective as of December 31, 2014.
66
Grant Thornton LLP, an independent registered public accounting firm, has audited the effectiveness of our internal control over financial reporting as of December 31, 2014, as stated in their report, which is included herein.
None.
Reference is made to the information to be set forth in the section entitled “Board of Directors” and “Committees of the Board” in the definitive proxy statement in connection with our Annual Meeting of Shareholders (the “Proxy Statement”), which section is incorporated herein by reference. Our Proxy Statement will be filed with the Securities and Exchange Commission not later than 120 days after the last day of our fiscal year ended December 31, 2014.
Information required by Part III, Item 11, will be included in the section entitled “Executive Compensation” of our Proxy Statement relating to our annual meeting of shareholders and is incorporated herein by reference.
|
Item 12. |
Security Ownership of Certain Beneficial Owners and Management and Related Stockholder Matters |
Information required by Part III, Item 12, will be included in the Sections entitled “Election of Directors” and “Security Ownership of Certain Beneficial Owners and Management” of our Proxy Statement relating to our annual meeting of shareholders and is incorporated herein by reference.
The following table summarizes information with respect to equity compensation plans under which equity securities of the Company are authorized for issuance as of December 31, 2014:
|
|
(a) |
|
|
(b) |
|
|
(c) |
|
|||
|
Plan category (1) |
|
|
|
|
|
|
|
|
|
|
|
|
Equity compensation plans approved by shareholders |
|
1,942,609 |
|
|
$ |
5.36 |
|
|
|
1,537,957 |
|
|
Equity compensation plans not approved by shareholders |
— |
|
|
|
|
|
|
— |
|
||
|
(1) |
See Note 6 to the Consolidated Financial Statements for more detailed information regarding the Company’s equity compensation plans. |
Information regarding certain of our relationships and related transactions will be included in the section entitled “Certain Relationship and Related Transactions” of our Proxy Statement relating to our annual meeting of shareholders and is incorporated herein by reference.
Information required by Part III, Item 14, will be included in the section entitled “Ratification of Appointment of Independent Auditors” of our Proxy Statement relating to our annual meeting of shareholders and is incorporated herein by reference.
67
|
(a) |
The following documents are filed as part of this report: |
|
1. |
Financial Statements |
PFSweb, Inc. and Subsidiaries
Report of Independent Registered Public Accounting Firm
Consolidated Balance Sheets
Consolidated Statements of Operations
Consolidated Statements of Shareholders’ Equity and Comprehensive Loss
Consolidated Statements of Cash Flows
Notes to Consolidated Financial Statements
Financial Statement Schedules
Schedule I – Condensed Financial Information of Registrant
Schedule II – Valuation and Qualifying Accounts
All other schedules are omitted because the required information is not present in amounts sufficient to require submission of the schedule or because the information required is included in the financial statements or notes thereto.
|
2. |
Exhibits |
|
|
Exhibit |
|
|
|
Description of Exhibits |
|
|
3.1 (1) |
|
Amended and Restated Certificate of Incorporation of PFSweb, Inc. |
||||
|
3.1.1 (20) |
|
Certificate of Amendment to Amended and Restated Certificate of Incorporation of PFSweb, Inc. |
||||
|
3.1.2 (32) |
|
Certificate of Amendment to Certificate of Incorporation of PFSweb, Inc. |
||||
|
3.1.3 (36) |
|
Certificate of Amendment to Amended and Restated Certificate of Incorporation of PFSweb, Inc. |
||||
|
3.1.4 (53) |
|
Certificate of Amendment to Amended and Restated Certificate of Incorporation of PFSweb, Inc. |
||||
|
3.2 (1) |
|
Amended and Restated Bylaws |
||||
|
3.2.1 (26) |
|
Amendment to the Amended and Restated By-Laws of PFSweb, Inc. |
||||
|
3.2.2 (39) |
|
Amendment to the Amended and Restated By-Laws of PFSweb, Inc. |
||||
|
3.2.3 (53) |
|
Amendment to the Amended and Restated By-Laws of PFSweb, Inc. |
||||
|
4.1 (30) |
|
Rights Agreement, dated as of June 8, 2000, between the Company and ChaseMellon Shareholder Services, LLC |
||||
|
4.1 (31) |
|
Amendment No. 1 to Rights Agreement, dated as of May 30, 2008 between the Company and Mellon Investor Services LLC, as successor to ChaseMellon Shareholder Services, L.L.C., as rights agent. |
||||
|
4.1 (38) |
|
Amendment No. 2 to Rights Agreement, dated as of May 24, 2010 between the Company and Mellon Investor Services LLC, as successor to ChaseMellon Shareholder Services, L.L.C., as rights agent. |
||||
|
4.1 (39) |
|
Amendment No. 3 to Rights Agreement, dated as of July 2, 2010 between the Company and Mellon Investor Services LLC, as successor to ChaseMellon Shareholder Services, L.L.C., as rights agent. |
||||
|
4.1 (49) |
|
Amendment No. 4 to Rights Agreement, dated as of May 15, 2013 between the Company and Computershare Shareowner Services LLC (formerly known as Mellon Investor Services LLC,) as successor to ChaseMellon Shareholder Services, L.L.C., as rights agent. |
||||
|
10.1 (18) |
|
Amendment 3 to Loan and Security Agreement. |
||||
|
10.2 (18) |
|
Amendment 6 to Agreement for Inventory Financing. |
||||
68
|
10.3 (18) |
|
Amendment 1 to First Amended and Restated Loan and Security Agreement. |
||||
|
10.4 (16) |
|
Amendment 5 to Amended and Restated Platinum Plan Agreement. |
||||
|
10.5 (16) |
|
Agreement for IBM Global Financing Platinum Plan Invoice Discounting Schedule. |
||||
|
10.6 (16) |
|
Amendment No. 5 to Agreement for Inventory Financing. |
||||
|
10.7 (1) |
|
Industrial Lease Agreement between Shelby Drive Corporation and Priority Fulfillment Services, Inc. |
||||
|
10.8 (1) |
|
Lease Contract between Transports Weerts and Priority Fulfillment Services Europe B.V. |
||||
|
10.9 (2) |
|
Form of Change of Control Agreement between the Company and each of its executive officers |
||||
|
10.10 (5) |
|
Agreement for Inventory Financing by and among Business Supplies Distributors Holdings, LLC, Supplies Distributors, Inc., Priority Fulfillment Services, Inc., PFSweb, Inc., Inventory Financing Partners, LLC and IBM Credit Corporation |
||||
|
10.11 (5) |
|
Amended and Restated Collateralized Guaranty by and between Priority Fulfillment Services, Inc. and IBM Credit Corporation |
||||
|
10.12 (5) |
|
Amended and Restated Guaranty to IBM Credit Corporation by PFSweb, Inc. |
||||
|
10.13 (5) |
|
Amended and Restated Platinum Plan Agreement (with Invoice Discounting) by and among Supplies Distributors, S.A., Business Supplies Distributors Europe B.V., PFSweb B.V., and IBM Belgium Financial Services S.A. |
||||
|
10.14 (5) |
|
Amended and Restated Guaranty to IBM Belgium Financial Services S.A. by PFSweb, Inc. |
||||
|
10.15 (5) |
|
Subordinated Demand Note by and between Supplies Distributors, Inc. and Priority Fulfillment Services, Inc. |
||||
|
10.16 (5) |
|
Notes Payable Subordination Agreement between Congress Financial Corporation (Southwest) and Priority Fulfillment Services, Inc. |
||||
|
10.17 (5) |
|
Guarantee in favor of Congress Financial Corporation (Southwest) by Business Supplies Distributors Holdings, LLC, Priority Fulfillment Services, Inc. and PFSweb, Inc. |
||||
|
10.18 (5) |
|
General Security Agreement by Priority Fulfillment Services, Inc. in favor of Congress Financial Corporation (Southwest). |
||||
|
10.19 (5) |
|
Inducement Letter by Priority Fulfillment Services, Inc. and PFSweb, Inc. in favor of Congress Financial Corporation (Southwest). |
||||
|
10.20 (6) |
|
Form of Executive Severance Agreement between the Company and each of its executive officers. |
||||
|
10.20.1 (33) |
|
Form of Amendment to Executive Severance Agreement. |
||||
|
10.20.2 (33) |
|
Form of Amendment to Change in Control Severance Agreement. |
||||
|
10.20.3 (39) |
|
Severance, Nondisclosure, Nonsolicitation and Noncompete Agreement dated July 2, 2010 between the Company and Cynthia Almond. |
||||
|
10.21 (7) |
|
Amendment to Agreement for Inventory Financing by and among Business Supplies Distributors Holdings, LLC, Supplies Distributors, Inc., Priority Fulfillment Services, Inc., PFSweb, Inc., Inventory Financing Partners, LLC and IBM Credit Corporation |
||||
|
10.22 (7) |
|
Amendment to Amended and Restated Platinum Plan Agreement (with Invoice Discounting) by and among Supplies Distributors, S.A., Business Supplies Distributors Europe B.V., PFSweb B.V., and IBM Belgium Financial Services S.A. |
||||
|
10.23 (7) |
|
Amendment to Factoring agreement dated March 29, 2002 between Supplies Distributors S.A. and Fortis Commercial Finance N.V. |
||||
|
10.24 (8) |
|
Unconditional Guaranty of PFSweb, Inc. to Comerica Bank – California |
||||
|
10.25 (8) |
|
Security Agreement of PFSweb, Inc. to Comerica Bank – California |
||||
69
|
10.26 (8) |
|
Intellectual Property Security Agreement between Priority Fulfillment Services, Inc. and Comerica Bank – California |
||||
|
10.27 (8) |
|
Amendment 2 to Amended and Restated Platinum Plan Agreement (with Invoice Discounting) by and among Supplies Distributors, S.A., Business Supplies Distributors B.V., PFSweb B.V., and IBM Belgium Financial Services S.A. |
||||
|
10.28 (8) |
|
Amendment to Agreement for Inventory Financing by and among Business Supplies Distributors Holdings, LLC, Supplies Distributors, Inc., Priority Fulfillment Services, Inc., PFSweb, Inc., and IBM Credit LLC |
||||
|
10.29 (9) |
|
Amendment to factoring agreement dated April 30, 2003 between Supplies Distributors S.A. and Fortis Commercial Finance N.V. |
||||
|
10.30 (9) |
|
Loan and Security Agreement by and between Congress Financial Corporation (Southwest), as Lender and Supplies Distributors, Inc., as Borrower dated March 29, 2002. |
||||
|
10.31 (9) |
|
General Security Agreement – Business Supplies Distributors Holdings, LLC in favor of Congress Financial Corporation (Southwest) |
||||
|
10.32 (9) |
|
Stock Pledge Agreement between Supplies Distributors, Inc. and Congress Financial Corporation (Southwest) |
||||
|
10.33 (9) |
|
First Amendment to General Security Agreement by Priority Fulfillment Services, Inc. in favor of Congress Financial Corporation (Southwest) |
||||
|
10.34 (12) |
|
Second Amendment to Industrial Lease Agreement between ProLogis North Carolina Limited Partnership and Priority Fulfillment Services, Inc. |
||||
|
10.35 (12) |
|
Modification, Ratification and Extension of Lease between Shelby Drive Corporation and Priority Fulfillment Services, Inc. |
||||
|
10.36 (13) |
|
Amendment to Agreement for Inventory Financing by and among Business Supplies Distributors Holdings, LLC, Supplies Distributors, Inc., Priority Fulfillment Services, Inc., PFSweb, Inc., and IBM Credit LLC |
||||
|
10.37 (13) |
|
Amendment 4 to Amended and Restated Platinum Plan Agreement (with Invoice Discounting) by and among Supplies Distributors, S.A., Business Supplies Distributors B.V., PFSweb B.V., and IBM Belgium Financial Services S.A. |
||||
|
10.38 (13) |
|
First Amendment to Loan and Security Agreement by and between Congress Financial Corporation (Southwest), as Lender and Supplies Distributors, Inc., as Borrower. |
||||
|
10.39 (13) |
|
Form of Modification to Executive Severance Agreement. |
||||
|
10.40 (14) |
|
Industrial Lease Agreement by and between Industrial Developments International, Inc. and Priority Fulfillment Services, Inc. |
||||
|
10.41 (14) |
|
Guaranty by PFSweb, Inc. in favor of Industrial Developments International, Inc. |
||||
|
10.42 (15) |
|
First Amended and Restated Loan and Security Agreement by and between Comerica Bank and Priority Fulfillment Services, Inc. |
||||
|
10.43 (20) |
|
Amendment to factoring agreement dated December 12, 2005 between Supplies Distributors S.A. and Fortis Commercial Finance N.V. |
||||
|
10.44 (21) |
|
Amendment 7 to Agreement for Inventory Financing. |
||||
|
10.45 (21) |
|
Amendment 6 to Amended and Restated Platinum Plan Agreement. |
||||
|
10.46 (21) |
|
Agreement for IBM Global Financing Platinum Plan Invoice Discounting Schedule. |
||||
|
10.47 (21) |
|
Amendment 4 to Loan and Security Agreement. |
||||
|
10.48 (21) |
|
Second Amendment to First Amended and Restated Loan and Security Agreement by and between Comerica Bank and Priority Fulfillment Services, Inc. |
||||
|
10.49 (24) |
|
Amendment 8 to Agreement for Inventory Financing. |
||||
|
10.50 (24) |
|
Amendment 5 to Loan and Security Agreement. |
||||
70
|
10.51 (24) |
|
Amendment 7 to Amended and Restated Platinum Plan Agreement. |
||||
|
10.52 (24) |
|
Agreement for IBM Global Financing Platinum Plan Invoice Discounting Schedule. |
||||
|
10.53 (25) |
|
Fifth Amendment to First Amended and Restated Loan and Security Agreement by and between Comerica Bank and Priority Fulfillment Services, Inc. |
||||
|
10.54 (27) |
|
Second Amendment to Industrial Lease Agreement by and between Industrial Property Fund VI, LLC and Priority Fulfillment Services, Inc. |
||||
|
10.55 (29) |
|
Amendment 9 to Agreement for Inventory Financing. |
||||
|
10.56 (29) |
|
Amendment 8 to Amended and Restated Platinum Plan Agreement. |
||||
|
10.57 (29) |
|
Agreement for IBM Global Financing Platinum Plan Invoice Discounting Schedule. |
||||
|
10.58 (29) |
|
Sixth Amendment to First Amended and Restated Loan and Security Agreement by and between Comerica Bank and Priority Fulfillment Services, Inc. |
||||
|
10.59 (34) |
|
Sixth Amendment to Loan and Security Agreement dated January 6, 2009 between Wachovia Bank and Supplies Distributors, Inc. |
||||
|
10.60 (35) |
|
Amendment 10 to Agreement for Inventory Financing. |
||||
|
10.61 (35) |
|
Amendment 9 to Amended and Restated Platinum Plan Agreement. |
||||
|
10.62 (35) |
|
Agreement for IBM Global Financing Platinum Plan Invoice Discounting Schedule. |
||||
|
10.63 (35) |
|
Seventh Amendment to First Amended and Restated Loan and Security Agreement by and between Comerica Bank and Priority Fulfillment Services, Inc. |
||||
|
10.64 (36) |
|
Amended and Restated 2005 Employee Stock and Incentive Plan of PFSweb, Inc. |
||||
|
10.65 (36) |
|
Amended and Restated Non-Employee Director Stock Option and Retainer Plan of PFSweb, Inc. |
||||
|
10.66 (37) |
|
Eighth Amended and Restated Notes Payable Subordination Agreement by and between Priority Fulfillment Services, Inc., Supplies Distributors, Inc. and IBM Credit Corporation. |
||||
|
10.67 (37) |
|
Amendment 11 to Agreement for Inventory Financing. |
||||
|
10.68 (37) |
|
Amendment 10 to Amended and Restated Platinum Plan Agreement. |
||||
|
10.69 (37) |
|
Agreement for IBM Global Financing Platinum Plan Invoice Discounting Schedule. |
||||
|
10.70 (37) |
|
Eighth Amendment to First Amended and Restated Loan and Security Agreement by and between Comerica Bank and Priority Fulfillment Services, Inc. |
||||
|
10.71 (42) |
|
Factoring Agreement by and between BNP Paribus Fortis Factor and Supplies Distributors, S.A. |
||||
|
10.72 (42) |
|
Amendment 12 to Agreement for Inventory Financing |
||||
|
10.73 (42) |
|
Amendment 11 to Amended and Restated Platinum Plan Agreement |
||||
|
10.74 (42) |
|
Agreement for IBM Global Financing Platinum Plan Invoice Discounting Schedule |
||||
|
10.75 (42) |
|
Ninth Amendment to First Amended and Restated Loan and Security Agreement by and between Comerica Bank and Priority Fulfillment services, Inc. |
||||
|
10.76 (42) |
|
Seventh Amendment to Loan and Security Agreement dated January 6, 2009 between Wells Fargo Bank and Supplies Distributors, Inc. |
||||
|
10.77 (44) |
|
Tenth Amendment to First Amended and Restated Loan and Security Agreement dated November 10, 2011 by and between Priority Fulfillment Services, Inc., and Comerica Bank |
||||
|
10.78 (45) |
|
Lease agreement by and between Binyan Realty LP and Priority Fulfillment Services, Inc. |
||||
71
|
10.79 (45) |
|
Lease Guaranty by PFSweb, Inc. in favor of Binyan Realty LP |
||||
|
10.80 (45) |
|
Lease Agreement dated December 8, 2011, between CCI-Millennium, L.P. and Priority Fulfillment Services, Inc. |
||||
|
10.81 (45) |
|
Guaranty of PFSweb, Inc. to CCI-Millennium, L.P. |
||||
|
10.82 (45) |
|
Eleventh Amendment to First Amended and Restated Loan and Security Agreement by and between Priority Fulfillment Services, Inc., and Comerica Bank |
||||
|
10.83 (45) |
|
Amendment 13 to Agreement for Inventory Financing |
||||
|
10.84 (46) |
|
Twelfth Amendment to First Amended and Restated Loan and Security Agreement dated May 14, 2012 by and between Priority Fulfillment Services, Inc., and Comerica Bank. |
||||
|
10.85 (46) |
|
Eighth Amendment to Loan and Security Agreement dated January 6, 2009 by and between Wells Fargo Bank, National Association and PFSweb Retail Connect, Inc. |
||||
|
10.86 (46) |
|
Fourteenth Amendment to First Amended and Restated Loan and Security Agreement between Priority Fulfillment Services, Inc. and Comerica Bank. |
||||
|
10.87 (48) |
|
Amendment to Executive Severance Agreement dated March 26, 2013 between PFSweb, Inc., and Mark Layton. |
||||
|
10.88 (49) |
|
Securities Purchase Agreement dated May 15, 2013 between the Company and transcosmos, inc. |
||||
|
10.89 (49) |
|
Registration Rights Agreement dated May 15, 2013 between the Company and transcosmos, inc. |
||||
|
10.90 (50) |
|
First Amendment to Industrial Lease Agreement dated May 7, 2013 by and between US Industrial REIT II and Priority Fulfillment Services, Inc. |
||||
|
10.91 (51) |
|
Agreement, dated as of May 15, 2013, by and among PFSweb, Inc. and Privet Fund LP, Privet Fund Management LLC, Ryan Levenson and Benjamin Rosenzweig. |
||||
|
10.92 (52) |
|
Form of 2013 Performance Shares Award Agreement. |
||||
|
10.93 (55) |
|
Modification, Ratification and Extension of Lease dated February 28, 2014 between Southpark Distribution Center Inc., (successor-in-interest to Shelby Drive Corporation) and Priority Fulfillment Services, Inc. |
||||
|
10.94 (56) |
|
Eighth Amendment to Loan and Security Agreement dated March 28, 2014, by and between Wells Fargo Bank, National Association and Supplies Distributors, Inc. |
||||
|
10.95 (56) |
|
Amendment to Agreement for Inventory Financing dated March 28, 2014 by and among Business Supplies Distributors Holdings, LLC, Supplies Distributors, Inc., Priority Fulfillment Services, Inc., PFSweb, Inc., and IBM Credit LLC. |
||||
|
10.96 (56) |
|
Fifteenth Amendment to First Amended and Restated Loan and Security Agreement dated March 31, 2014 between Priority Fulfillment Services, Inc., and Comerica Bank. |
||||
|
10.97 (57) |
|
Ninth Amended and Restated Notes Payable Subordination Agreement by and between Priority Fulfillment Services, Inc., Supplies Distributors, Inc. and IBM Credit Corporation. |
||||
|
10.98 (58) |
|
Stock Purchase Agreement dated September 3, 2014 by and among Priority Fulfillment Services, Inc., REV Solutions Limited, Steven J. Stephan, the Ashu Chahal Irrevocable Children’s Trust, the Babu Venkatesh Irrevocable Children’s Trust, Babu Venkatesh, and Ashu Chahal. |
||||
|
10.99 (58) |
|
Stock Purchase Agreement dated September 22, 2014 by and among Priority Fulfillment Services, Inc., Mark Moskal and Neil Nylander. |
||||
|
10.100 (58) |
|
Sixteenth Amendment to First Amended and Restated Loan and Security Agreement dated March 3, 2015 between Priority Fulfillment Services, Inc., and Comerica Bank. |
||||
|
21 (59) |
|
Subsidiary Listing |
||||
|
23.1 (59) |
|
Consent of Grant Thornton, LLP, Independent Registered Public Accounting Firm |
||||
|
31.1 (59) |
|
Certifications of Principal Executive Officer Pursuant to 18 U.S.C. Section 1350 |
||||
72
|
31.2 (59) |
|
Certifications of Principal Financial Officer Pursuant to 18 U.S.C. Section 1350 |
||||
|
32.1 (59) |
|
Certifications Pursuant to 18 U.S.C. Section 1350, as Adopted Pursuant to Section 906 of the Sarbanes-Oxley Act of 2002 |
||||
|
101.INS (59) |
|
XBRL Instance Document. |
||||
|
101.SCH (59) |
|
XBRL Taxonomy Extension Schema. |
||||
|
101.CAL (59) |
|
XBRL Taxonomy Extension Calculation Linkbase. |
||||
|
101.DEF (59) |
|
XBRL Taxonomy Extension Definition Linkbase. |
||||
|
101.LAB (59) |
|
XBRL Taxonomy Extension Label Linkbase. |
||||
|
101.PRE (59) |
|
XBRL Taxonomy Extension Presentation Linkbase. |
||||
|
(1) |
Incorporated by reference from PFSweb, Inc. Registration Statement on Form S-1 (Commission File No. 333-87657). |
|
(2) |
Incorporated by reference from PFSweb, Inc. Form 10-K for the fiscal year ended March 31, 2001 |
|
(3) |
Incorporated by reference from PFSweb, Inc. Form 10-Q/A for the quarterly period ended September 30, 2001 |
|
(4) |
Incorporated by reference from PFSweb, Inc. Form 10-K for the transition period ended December 31, 2001 |
|
(5) |
Incorporated by reference from PFSweb, Inc. Form 10-Q for the quarterly period ended March 31, 2002 |
|
(6) |
Incorporated by reference from PFSweb, Inc. Form 10-Q for the quarterly period ended June 30, 2002 |
|
(7) |
Incorporated by reference from PFSweb, Inc. Form 10-K for the year ended December 31, 2002 |
|
(8) |
Incorporated by reference from PFSweb, Inc. Form 10-Q for the quarterly period ended March 31, 2003 |
|
(9) |
Incorporated by reference from PFSweb, Inc. Form 10-Q for the quarterly period ended June 30, 2003 |
|
(10) |
Incorporated by reference from PFSweb, Inc. Form 10-Q for the quarterly period ended September 30, 2003 |
|
(11) |
Incorporated by reference from PFSweb, Inc. Report on Form 8-K filed on November 10, 2003 |
|
(12) |
Incorporated by reference from PFSweb, Inc. Form 10-K for the year ended December 31, 2003 |
|
(13) |
Incorporated by reference from PFSweb, Inc. Form 10-Q for the quarterly period ended March 31, 2004 |
|
(14) |
Incorporated by reference from PFSweb, Inc. Form 10-Q for the quarterly period ended September 30, 2004 |
|
(15) |
Incorporated by reference from PFSweb, Inc. Form 10-K for the year ended December 31, 2004. |
|
(16) |
Incorporated by reference from PFSweb, Inc. Form 10-Q for the quarterly period ended March 31, 2005. |
|
(17) |
Incorporated by reference from PFSweb, Inc. Report on Form 8-K filed on June 14, 2005. |
|
(18) |
Incorporated by reference from PFSweb, Inc. Form 10-Q for the quarterly period ended June 30, 2005. |
|
(19) |
Incorporated by reference from PFSweb, Inc. Current Report on Form 8-K filed on November 30, 2005. |
|
(20) |
Incorporated by reference from PFSweb, Inc. Form 10-K for the year ended December 31, 2005. |
|
(21) |
Incorporated by reference from PFSweb, Inc. Form 10-Q for the quarterly period ended March 31, 2006. |
|
(22) |
Incorporated by reference from PFSweb, Inc. Current Report on Form 8-K filed on June 2, 2006. |
|
(23) |
Incorporated by reference from PFSweb, Inc. Form 10-Q for the quarterly period ended September 30, 2006. |
|
(24) |
Incorporated by reference from PFSweb, Inc. Form 10-K for the year ended December 31, 2006. |
|
(25) |
Incorporated by reference from PFSweb, Inc. Form 10-Q for the quarterly period ended March 31, 2007. |
|
(26) |
Incorporated by reference from PFSweb, Inc. Report on Form 8-K filed on November 13, 2007. |
|
(27) |
Incorporated by reference from PFSweb, Inc. Form 10-K for the year ended December 31, 2007. |
|
(28) |
Incorporated by reference from PFSweb, Inc. Report on Form 8-K filed on May 2, 2008. |
|
(29) |
Incorporated by reference from PFSweb, Inc. Form 10-Q for the quarterly period ended March 31, 2008. |
|
(30) |
Incorporated by reference from PFSweb, Inc. Registration Statement on Form 8-A filed on June 14, 2000. |
|
(31) |
Incorporated by reference from PFSweb, Inc. Report on Form 8K filed on May 30, 2008. |
|
(32) |
Incorporated by reference from PFSweb, Inc. Report on Form 8-K filed on June 2, 2008. |
|
(33) |
Incorporated by reference from PFSweb, Inc. Report on Form 8-K filed on January 6, 2009. |
|
(34) |
Incorporated by reference from PFSweb, Inc. Report on Form 8-K filed on January 9, 2009. |
|
(35) |
Incorporated by reference from PFSweb, Inc. Form 10-Q filed on May 15, 2009. |
|
(36) |
Incorporated by reference from PFSweb, Inc. Form 10-Q filed on August 14, 2009. |
|
(37) |
Incorporated by reference from PFSweb, Inc. Form 10-Q filed on May 17, 2010. |
|
(38) |
Incorporated by reference from PFSweb, Inc. Report on Form 8-K filed on May 25, 2010. |
|
(39) |
Incorporated by reference from PFSweb, Inc. Report on Form 8-K filed on July 2, 2010. |
|
(40) |
Incorporated by reference from PFSweb, Inc. Report on Form 8-K filed on February 23, 2011. |
|
(41) |
Incorporated by reference from PFSweb, Inc. Form 10-K for the year ended December 31, 2010. |
|
(42) |
Incorporated by reference from PFSweb, Inc. Form 10-Q filed on May 16, 2011 |
|
(43) |
Incorporated by reference from PFSweb, Inc. Form 10-Q filed on August 15, 2011. |
|
(44) |
Incorporated by reference from PFSweb, Inc. Form 10-Q filed on November 14, 2011. |
|
(45) |
Incorporated by reference from PFSweb, Inc. Form 10-K for the year ended December 31, 2011. |
73
|
(46) |
Incorporated by reference from PFSweb, Inc. Form 10-Q filed on May 15, 2012. |
|
(47) |
Incorporated by reference from PFSweb, Inc. Form 10-Q filed on November 14, 2012. |
|
(48) |
Incorporated by reference from PFSweb, Inc. Report on Form 8-K filed on March 29, 2013. |
|
(49) |
Incorporated by reference from PFSweb, Inc. Report on Form 8-K filed on May 15, 2013. |
|
(50) |
Incorporated by reference from PFSweb, Inc. Form 10-Q filed on May 15, 2013. |
|
(51) |
Incorporated by reference from PFSweb, Inc. Report on Form 8-K filed on May 20, 2013. |
|
(52) |
Incorporated by reference from PFSweb, Inc. Report on Form 8-K filed on May 29, 2013. |
|
(53) |
Incorporated by reference from PFSweb, Inc. Report on Form 8-K filed on July 18, 2013. |
|
(54) |
Incorporated by reference from PFSweb, Inc. Form 10-Q filed on August 14, 2013. |
|
(55) |
Incorporated by reference from PFSweb, Inc. Form 10-K filed on March 31, 2014. |
|
(56) |
Incorporated by reference from PFSweb, Inc. Form 10-Q filed on May 15, 2014. |
|
(57) |
Incorporated by reference from PFSweb, Inc. Form 10-Q filed on August 13, 2014. |
|
(58) |
Incorporated by reference from PFSweb, Inc. Form 10-Q filed on November 14, 2014. |
|
(59) |
Filed herewith. |
74
PFSWEB, INC. AND SUBSIDIARIES
CONDENSED FINANCIAL INFORMATION OF REGISTRANT
BALANCE SHEETS – PARENT COMPANY ONLY
(In thousands)
|
|
December 31, |
|
|
December 31, |
|
||
|
|
2014 |
|
|
2013 |
|
||
|
ASSETS: |
|
|
|
|
|
|
|
|
Cash and cash equivalents |
$ |
555 |
|
|
$ |
10,722 |
|
|
Receivable from subsidiaries |
|
34,460 |
|
|
|
25,252 |
|
|
Investment in subsidiaries |
|
5,090 |
|
|
|
4,951 |
|
|
Total assets |
|
40,105 |
|
|
|
40,925 |
|
|
LIABILITIES: |
|
|
|
|
|
|
|
|
Total liabilities |
— |
|
|
— |
|
||
|
SHAREHOLDERS’ EQUITY: |
|
|
|
|
|
|
|
|
Preferred stock |
— |
|
|
— |
|
||
|
Common stock |
|
17 |
|
|
|
17 |
|
|
Additional paid-in capital |
|
129,457 |
|
|
|
124,522 |
|
|
Accumulated deficit |
|
(89,926 |
) |
|
|
(85,300 |
) |
|
Accumulated other comprehensive income |
|
682 |
|
|
|
1,811 |
|
|
Treasury stock |
|
(125 |
) |
|
|
(125 |
) |
|
Total shareholders’ equity |
|
40,105 |
|
|
|
40,925 |
|
|
Total liabilities and shareholders’ equity |
$ |
40,105 |
|
|
$ |
40,925 |
|
The condensed financial statements should be read in conjunction with the consolidated financial statements and notes thereto.
75
SCHEDULE I
PFSWEB, INC. AND SUBSIDIARIES
CONDENSED FINANCIAL INFORMATION OF REGISTRANT
STATEMENTS OF OPERATIONS – PARENT COMPANY ONLY
FOR THE YEARS ENDED DECEMBER 31
(In thousands)
|
|
2014 |
|
|
2013 |
|
||
|
SELLING, GENERAL AND ADMINISTRATIVE EXPENSES: |
|
|
|
|
|
|
|
|
Selling, general and administrative expenses |
$ |
4,806 |
|
|
$ |
2,574 |
|
|
Equity in net loss (income) of consolidated subsidiaries |
|
(180 |
) |
|
|
3,317 |
|
|
Total operating expenses |
|
4,626 |
|
|
|
5,891 |
|
|
NET LOSS |
$ |
(4,626 |
) |
|
$ |
(5,891 |
) |
The condensed financial statements should be read in conjunction with the consolidated financial statements and notes thereto.
76
SCHEDULE I
PFSWEB, INC. AND SUBSIDIARIES
CONDENSED FINANCIAL INFORMATION OF REGISTRANT
STATEMENTS OF CASH FLOWS – PARENT COMPANY ONLY
FOR THE YEARS ENDED DECEMBER 31
(In thousands)
|
|
2014 |
|
|
2013 |
|
||
|
CASH FLOWS FROM OPERATING ACTIVITIES: |
|
|
|
|
|
|
|
|
Net loss |
$ |
(4,626 |
) |
|
$ |
(5,891 |
) |
|
Adjustments to reconcile net loss to net cash used in operating activities: |
|
|
|
|
|
|
|
|
Stock-based compensation expense |
|
3,059 |
|
|
|
2,574 |
|
|
Equity in net loss (income) of consolidated subsidiaries |
|
(180 |
) |
|
|
3,317 |
|
|
Net cash used in operating activities |
|
(1,747 |
) |
|
|
— |
|
|
CASH FLOWS FROM FINANCING ACTIVITIES: |
|
|
|
|
|
|
|
|
Proceeds from issuance of common stock |
|
1,631 |
|
|
|
15,934 |
|
|
Increase in receivable from subsidiaries, net |
|
(10,051 |
) |
|
|
(10,620 |
) |
|
Net cash provided by (used in) financing activities |
|
(8,420 |
) |
|
|
5,314 |
|
|
NET INCREASE (DECREASE) IN CASH |
|
(10,167 |
) |
|
|
5,314 |
|
|
CASH AND CASH EQUIVALENTS, beginning of period |
|
10,722 |
|
|
|
5,408 |
|
|
CASH AND CASH EQUIVALENTS, end of period |
$ |
555 |
|
|
$ |
10,722 |
|
The condensed financial statements should be read in conjunction with the consolidated financial statements and notes thereto.
77
PFSWEB, INC. AND SUBSIDIARIES
VALUATION AND QUALIFYING ACCOUNTS
FOR THE YEARS ENDED DECEMBER 31
(Amounts in thousands)
|
|
|
|
|
Additions |
|
|
|
|
|
|
|
||||||||
|
|
Balance at |
|
|
Charges |
|
|
Charges |
|
|
Deductions |
|
|
Balance |
|
|||||
|
Year Ended December 31, 2013: |
|
|
|
|
|
|
|
|
|
|
|
|
|
|
|
|
|
|
|
|
Allowance for doubtful accounts |
$ |
450 |
|
|
|
25 |
|
|
|
— |
|
|
|
(93 |
) |
|
$ |
382 |
|
|
Year Ended December 31, 2014: |
|
|
|
|
|
|
|
|
|
|
|
|
|
|
|
|
|
|
|
|
Allowance for doubtful accounts |
$ |
382 |
|
|
|
165 |
|
|
|
— |
|
|
|
(100 |
) |
|
$ |
447 |
|
78
Pursuant to the requirements of Section 13 or 15(d) of the Securities Exchange Act of 1934, the Registrant has duly caused this report to be signed on its behalf by the undersigned, thereunto duly authorized.
|
By: |
/s/Thomas J. Madden |
|
Thomas J. Madden, |
|
|
Executive Vice President and Chief Financial and Accounting Officer |
|
Pursuant to the requirements of the Securities Exchange Act of 1934, this report has been signed below by the following persons on behalf of the Registrant and in the capacities and on the dates indicated.
|
Signature |
|
Title |
|
Date |
|
/s/Michael Willoughby
Michael Willoughby |
|
Chief Executive Officer (Principal Executive Officer) |
|
March 23, 2015 |
|
/s/Thomas J. Madden
Thomas J. Madden |
|
Executive Vice President and Chief Financial and Accounting Officer (Principal Financial and Accounting Officer) |
|
March 23, 2015 |
|
/s/James F. Reilly |
|
Chairman of the Board |
|
March 23, 2015 |
|
James F. Reilly |
|
|
|
|
|
/s/Monica Luechtefeld |
|
Director |
|
March 23, 2015 |
|
Monica Luechtefeld |
|
|
|
|
|
/s/David I. Beatson |
|
Director |
|
March 23, 2015 |
|
David I. Beatson |
|
|
|
|
|
/s/Benjamin Rosenzweig |
|
Director |
|
March 23, 2015 |
|
Benjamin Rosenzweig |
|
|
|
|
|
/s/Shinichi Nagakura |
|
Director |
|
March 23, 2015 |
|
Shinichi Nagakura |
|
|
|
|
79