Attached files
| file | filename |
|---|---|
| 8-K - FORM 8-K - NN INC | d896736d8k.htm |
Exhibit 99.1
|
|

Exhibit 99.1
Investor Presentation
March 23, 2015
|
|
Forward-Looking Statement & Disclaimer
Forward Looking Statement: With the exception of the historical information contained in this presentation, the matters described
herein contain forward-looking statements that are made pursuant to the safe harbor provisions of the Private Securities Litigation
Reform Act of 1995. Forward-looking statements involve a number of risks and uncertainties that may cause actual results to be
materially different from such forward-looking statements. Such factors include, among others, general economic conditions and
economic conditions in the industrial sector, competitive influences, risks that current customers will commence or increase captive
production, risks of capacity underutilization, quality issues, availability of raw materials, currency and other risks associated with
international trade, the Company’s dependence on certain major customers, and other risk factors and cautionary statements listed
from time to time in the Company’s periodic reports filed with the Securities and Exchange Commission, including, but not limited to,
the Company’s Annual Report on 10 -K for the fiscal year ended December 31, 2013 .
Disclaimer: NN disclaims any obligation to update any such factors or to publicly announce the result of any revisions to any of the
forward-looking statements included herein or therein to reflect future events or developments.
This presentation includes certain non-GAAP measures as defined by SEC rules. A reconciliation of those measures to the most
directly comparable GAAP equivalent is provided at the end of this presentation.
2
|
|
Building a Diversified Industrial
3
|
|
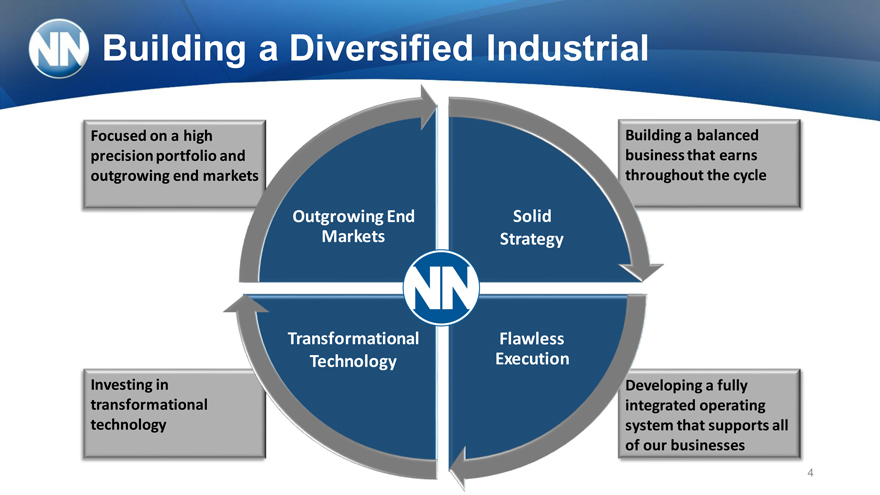
Building a Diversified Industrial
Focused on a high precision portfolio and outgrowing end markets
Building a balanced business that earns throughout the cycle
Investing in transformational technology
Developing a fully integrated operating system that supports all of our businesses
Outgrowing End Markets
Solid
Strategy
Transformational technology
Flawless execution
4
|
|

Building a Diversified Industrial
We have made significant progress against other DIs…
Rank among comparable S/Mid-Cap DIs
Metric Ä Rank
2012—13 2013—14
Sales Growth 8 1 +7
Adjusted Operating
8 5 +3
Margin
Return on Equity 8 5 +3
Total Return 10 1 +9
P/E Ratio 5 6 -1
…but we remain undervalued to our peers
Compared to 9 S/Mid Cap companies outlined on page 10 5
Analysis was done on year over year, TTM, and 2 year TTM period or using 2014 estimates
Source: Bloomberg Analytics
|
|
Building a Diversified Industrial
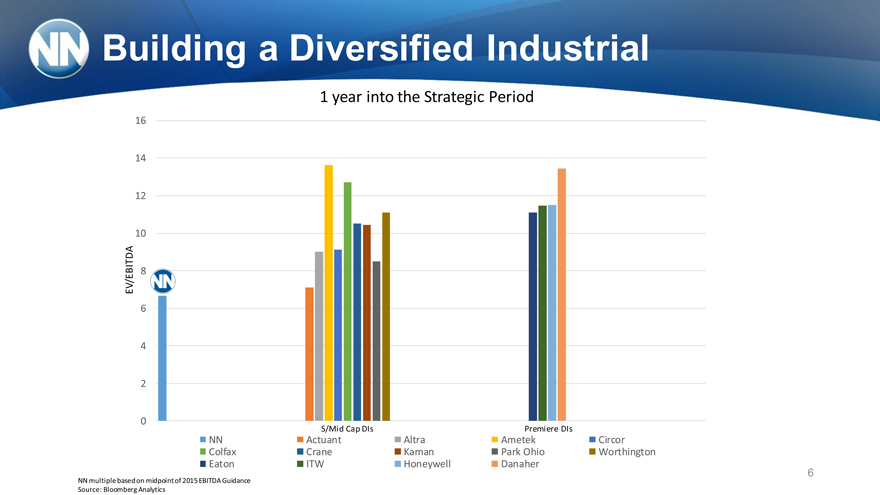
1 year into the Strategic Period
16
14
12
10
EV/EBITDA 8
6
4
2
0
S/Mid Cap DIs Premiere DIs
NN Actuant Altra Ametek Circor
Colfax Crane Kaman Park Ohio Worthington
Eaton ITW Honeywell Danaher
6
NN multiple based on midpoint of 2015 EBITDA Guidance
Source: Bloomberg Analytics
|
|

Company Overview
7
|
|
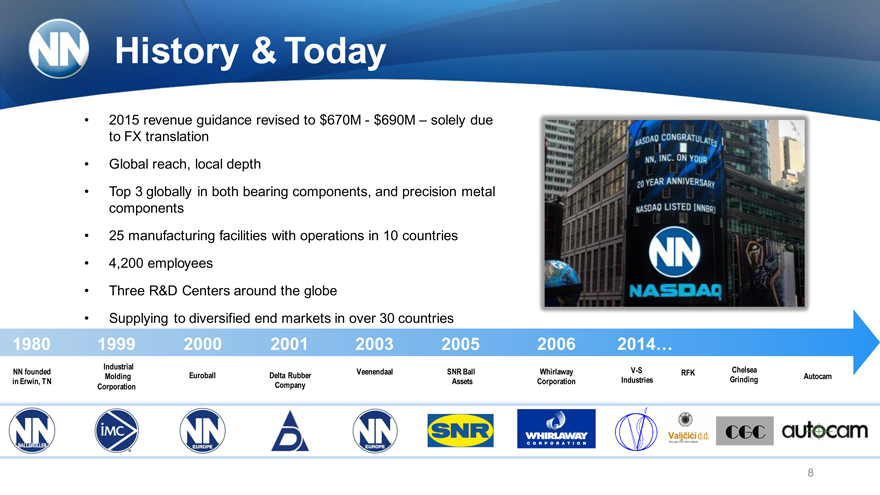
History & Today
2015 revenue guidance revised to $670M—$690M – solely due to FX translation
Global reach, local depth
Top 3 globally in both bearing components, and precision metal components
25 manufacturing facilities with operations in 10 countries
4,200 employees
Three R&D Centers around the globe
Supplying to diversified end markets in over 30 countries
1980Metal Bearing 1999Components 2000 2001 2003 2005 2006 2014…
Industrial Veenendaal SNR Ball Whirlaway V-S Chelsea
NN founded Molding Euroball Delta Rubber RFK Autocam
in Erwin, TN Assets Corporation Industries Grinding
Corporation Company
8
|
|
Foundation for Growth
Five new Board appointments since 2012
New President & CEO in 2013, key management retained
Developed Treasury, FP&A, Supply Chain, Shared Services and
IT group infrastructure
Design of the NN Operating System
Enhanced management bandwidth with acquisitions
The fundaments of our plan have not changed. We will continue to deliver on our commitments. 9
|
|
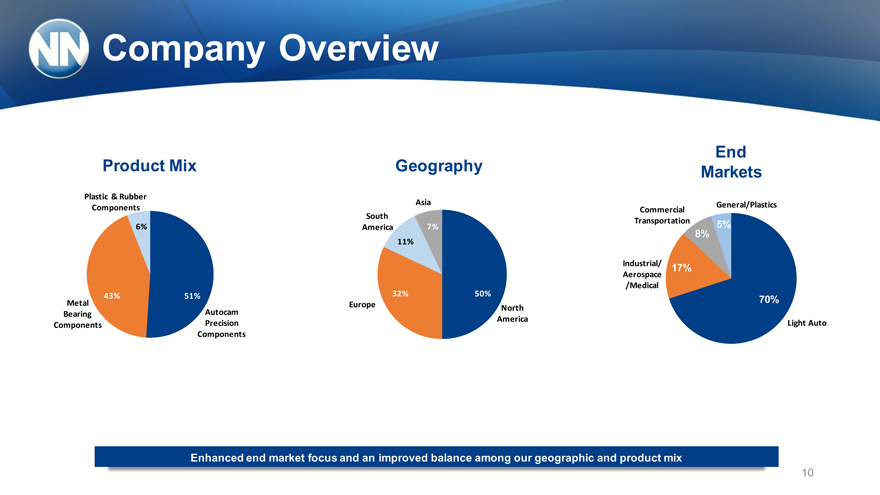
Company Overview
Product Mix
Plastic & Rubber
Components
6%
43% 51%
Metal
Bearing Autocam
Components Precision
Components
Geography
Asia
South
America 7%
11%
7%
32% 50%
Europe North
America
End
Markets
Commercial General/Plastics
Transportation 5%
8%
Industrial/ 17%
Aerospace
/Medical
70%
Light Auto
Enhanced end market focus and an improved balance among our geographic and product mix
10
|
|
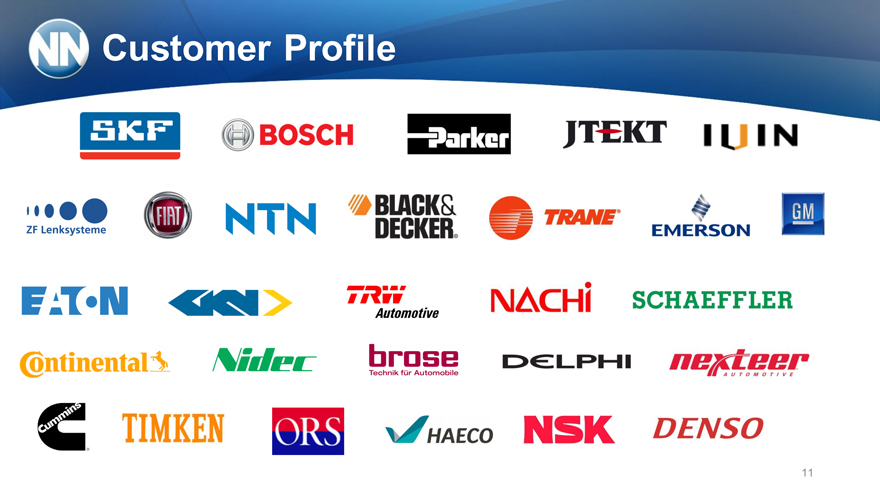
Customer Profile
11
|
|
Value Proposition
Ability to manufacture precision products with ultra tight tolerances in high volume
Total product life cycle
Established global footprint
Highly specialized skill and engineering in bearing components and precision machining
Significant proprietary knowledge and trade secrets
Leading manufacturer of high precision components 12
|
|
Differentiation
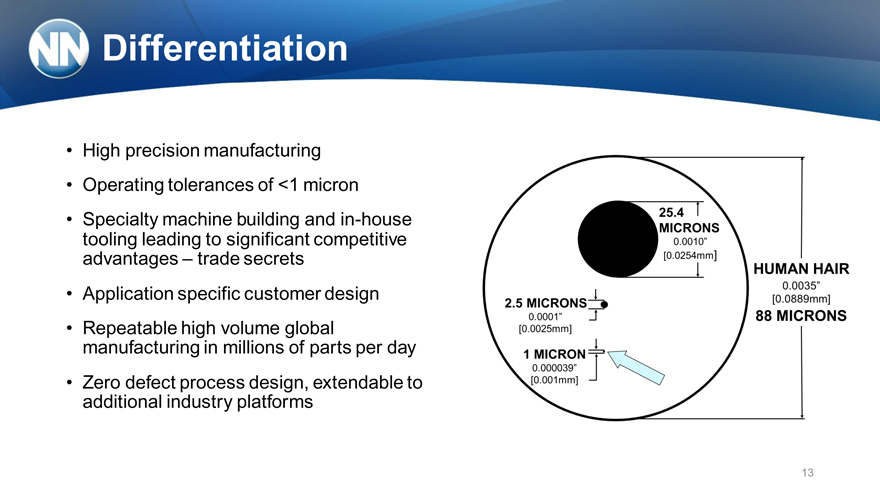
High precision manufacturing
Operating tolerances of <1 micron
Specialty machine building and in-house tooling leading to significant competitive advantages – trade secrets
Application specific customer design
Repeatable high volume global manufacturing in millions of parts per day
Zero defect process design, extendable to additional industry platforms
13
|
|
Global Footprint
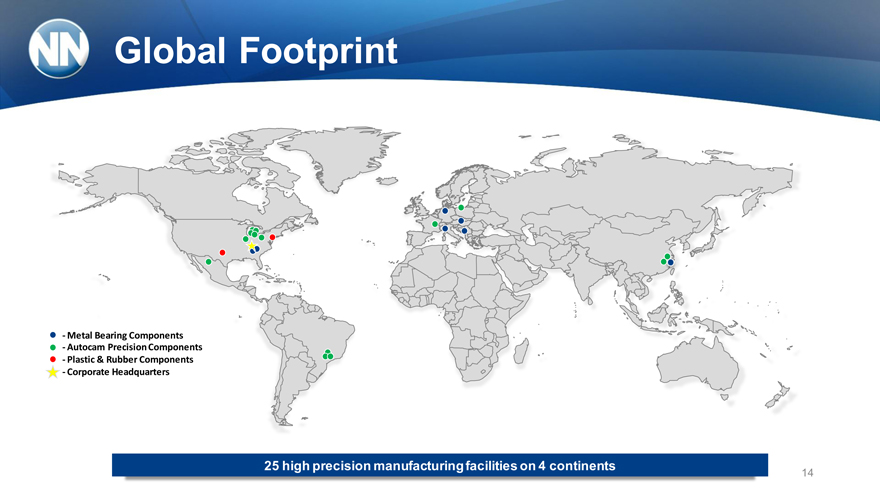
—Metal Bearing Components
—Autocam Precision Components
—Plastic & Rubber Components
—Corporate Headquarters
25 high precision manufacturing facilities on 4 continents
14
|
|

Moving Forward
15
|
|
Road to $1 Billion
$ Millions
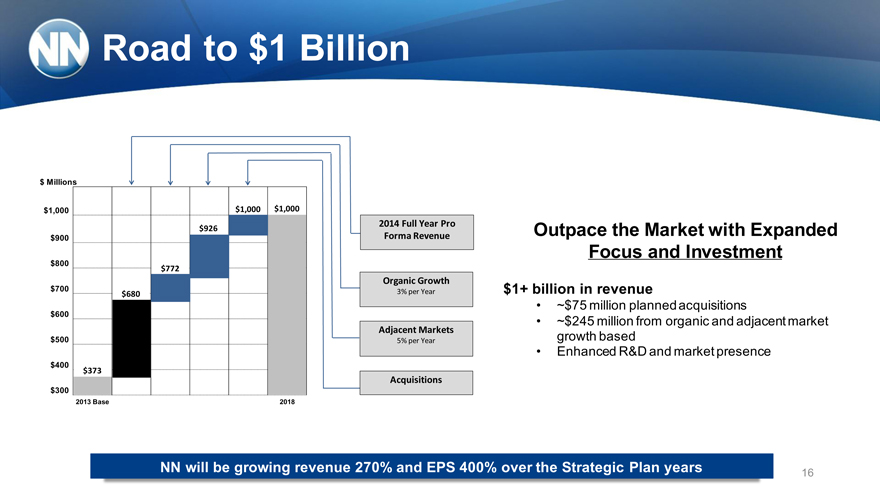
$1,000 $1,000 $1,000
2014 Full Year Pro $926 Forma Revenue
$900
$800 $772
Organic Growth
$700 3% per Year $680
$600
Adjacent Markets
$500 5% per Year
$400 $373
Acquisitions
$300 $200 2013 Base 2018
Outpace the Market with Expanded Focus and Investment
$1+ billion in revenue
~$75 million planned acquisitions
~$245 million from organic and adjacent market growth based
Enhanced R&D and market presence
NN will be growing revenue 270% and EPS 400% over the Strategic Plan years 16
|
|
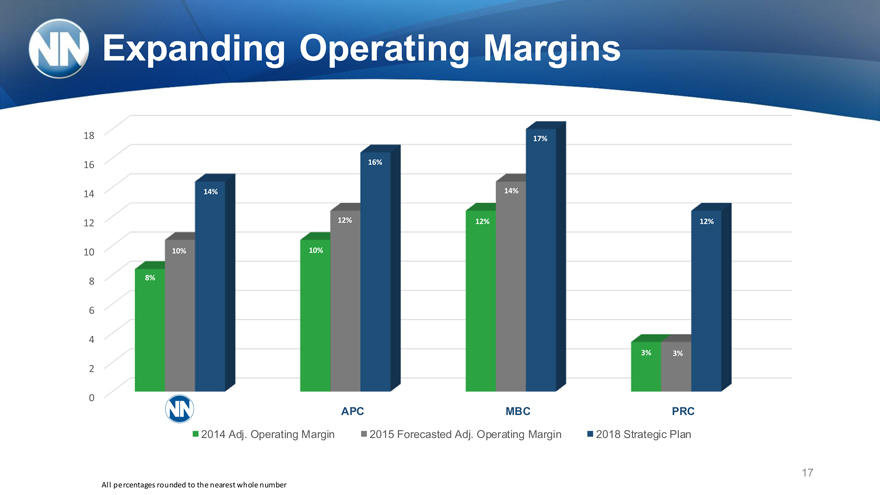
Expanding Operating Margins
18 17%
16 16%
14 14% 14%
12 12% 12% 12%
10 10% 10%
8 8%
6
4
3% 3%
2
0
APC MBC PRC
2014 Adj. Operating Margin 2015 Forecasted Adj. Operating Margin 2018 Strategic Plan
17
All percentages rounded to the nearest whole number
|
|
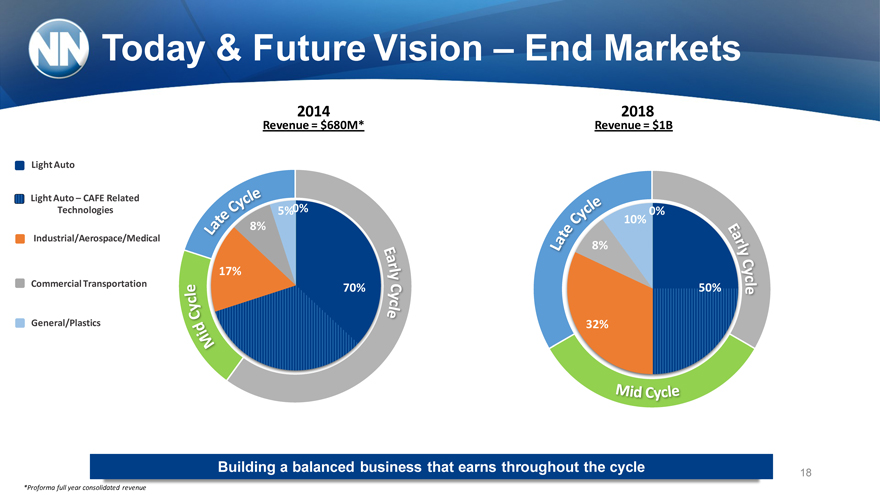
Today & Future Vision – End Markets
Light Auto
Light Auto – CAFE Related
Technologies
Industrial/Aerospace/Medical
Commercial Transportation
General/Plastics
2014 2018
Revenue = $680M* Revenue = $1B
5%
8%
17%
70%
10%
8%
50%
32%
Building a balanced business that earns throughout the cycle 18
*Proforma full year consolidated revenue
|
|
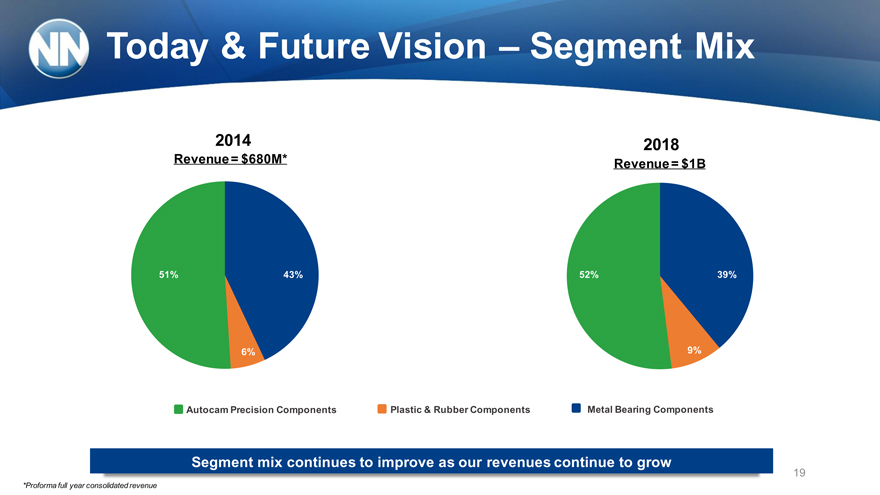
Today & Future Vision – Segment Mix
2014 2018
Revenue = $680M* Revenue = $1B
51 43% %
51% 43% 43 52% 39% %
6% 9% 6%
31 43% 50 51
% % % Autocam Precision 60 Components Plastic & Rubber Components Metal Bearing Components % 25 %
Segment mix continues to improve as our revenues continue to grow 19
*Proforma full year consolidated revenue
|
|
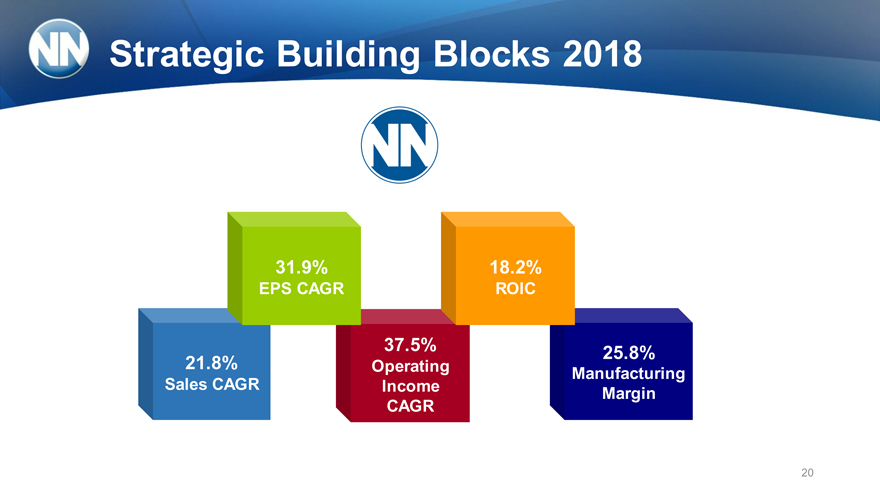
Strategic Building Blocks 2018
31.9% 18.2%
EPS CAGR ROIC
37.5% 8% 25.
21.8% Operating
Manufacturing Sales CAGR Income Margin CAGR
20
|
|
Financial Strategy / Policy
Build upon a strong, global operating platform while maintaining financial strength and flexibility
Financial policy:
Maintain healthy leverage over business cycles and strategic growth period: Debt to EBITDA 2.0x – 3.0x, < 4.0x at peak
Cash flow priorities:
1) Debt repayment to achieve target leverage
2) Capex to achieve operational excellence and growth
3) Stable common dividends to shareholders (< 20% free cash flow)
4) Strategic acquisitions financed by debt and equity issuance to maintain leverage target
Generate above-market-average revenue growth and capture market share in key areas of new technology over Strategic Plan period
Improve market mix by decreasing auto exposure from 70% to 50%
Increase industrial /aerospace/medical offerings in existing product lines
Expand segment gross and operating margins (optimize mix, operational improvement, cost reductions)
Continue to invest in R&D
Continue to pursue selective strategic acquisitions to diversify end markets and expand global reach, within leverage targets
21
|
|
22
|
|
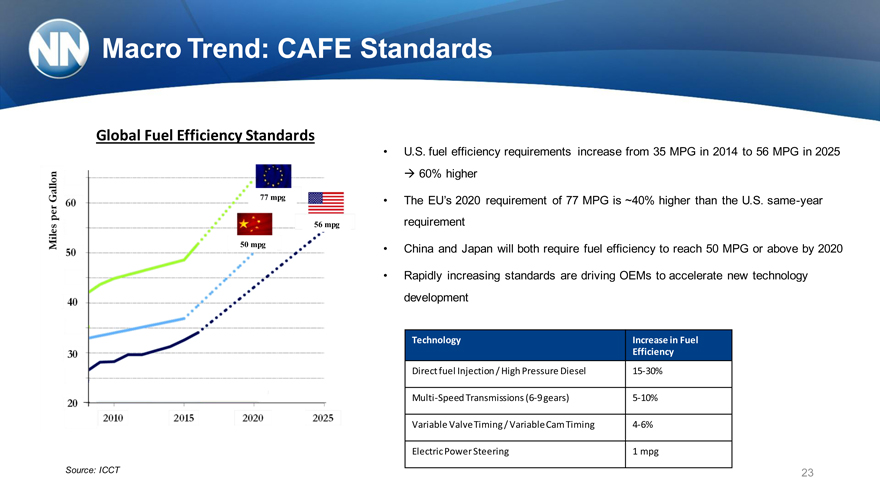
Macro Trend: CAFE Standards
Global Fuel Efficiency Standards
77 mpg
56 mpg
50 mpg
Source: ICCT
U.S. fuel efficiency requirements increase from 35 MPG in 2014 to 56 MPG in 2025
? 60% higher
The EU’s 2020 requirement of 77 MPG is ~40% higher than the U.S. same-year
requirement
China and Japan will both require fuel efficiency to reach 50 MPG or above by 2020
Rapidly increasing standards are driving OEMs to accelerate new technology
development
Technology Increase in Fuel
Efficiency
Direct fuel Injection / High Pressure Diesel 15-30%
Multi-Speed Transmissions (6-9 gears) 5-10%
Variable Valve Timing / Variable Cam Timing 4-6%
Electric Power Steering 1 mpg
23
|
|
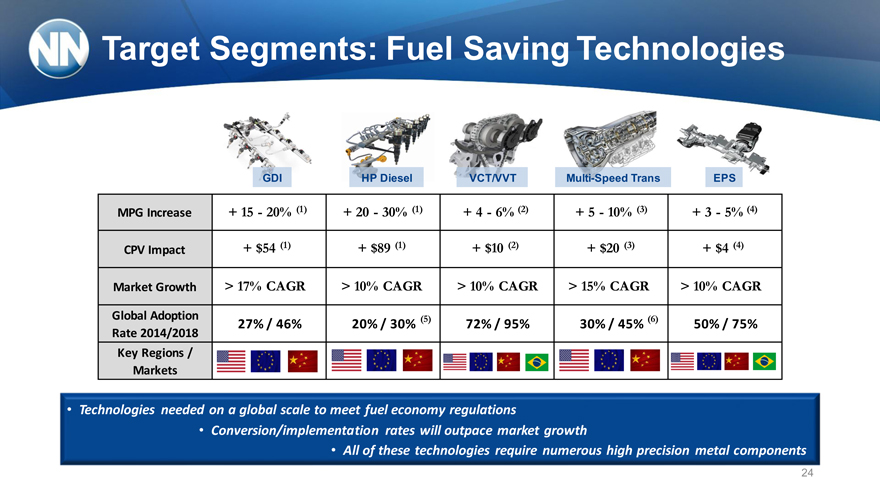
Target Segments: Fuel Saving Technologies
GDI HP Diesel VCT/VVT Multi-Speed Trans EPS
MPG Increase + 15—20% (1) + 20—30% (1) + 4—6% (2) + 5—10% (3) + 3—5% (4)
CPV Impact + $54 (1) + $89 (1) + $10 (2) + $20 (3) + $4 (4)
Market Growth > 17% CAGR > 10% CAGR > 10% CAGR > 15% CAGR > 10% CAGR
Global Adoption (5) (6)
27% / 46% 20% / 30% 72% / 95% 30% / 45% 50% / 75%
Rate 2014/2018
Key Regions /
Markets
Technologies needed on a global scale to meet fuel economy regulations
Conversion/implementation rates will outpace market growth
• All of these technologies require numerous high precision metal components
24
|
|
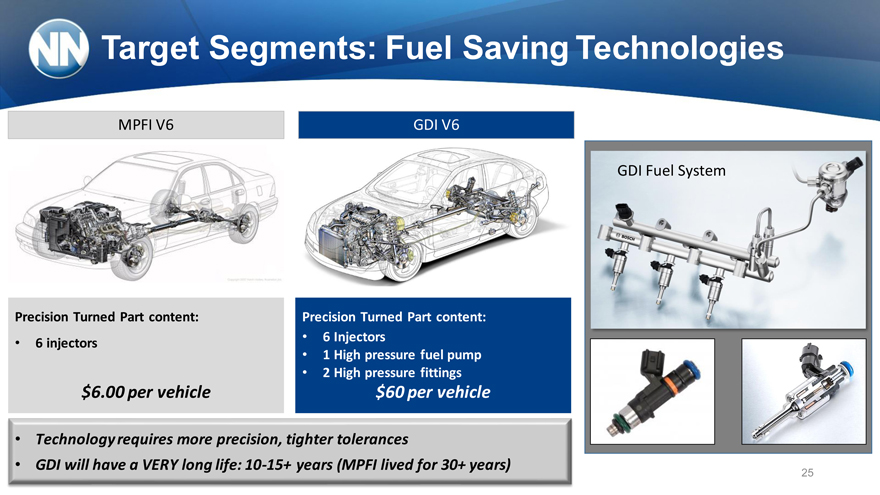
Target Segments: Fuel Saving Technologies
MPFI V6 GDI V6
GDI Fuel System
Precision Turned Part content: Precision Turned Part content:
6 injectors 6 Injectors
• 1 High pressure fuel pump
• 2 High pressure fittings
$6.00 per vehicle $60 per vehicle
Technology requires more precision, tighter tolerances
GDI will have a VERY long life: 10-15+ years (MPFI lived for 30+ years) 25
|
|
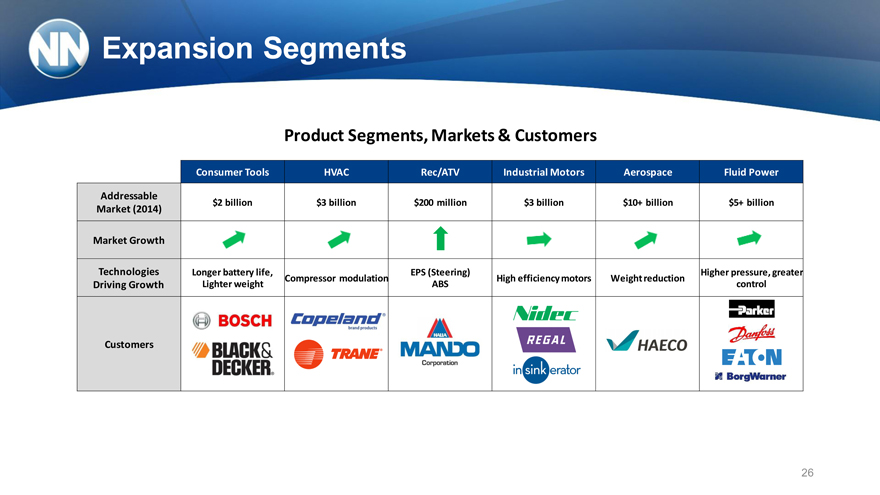
Expansion Segments
Product Segments, Markets & Customers
Consumer Tools HVAC Rec/ATV Industrial Motors Aerospace Fluid Power
Addressable $2 billion $3 billion $200 million $3 billion $10+ billion $5+ billion
Market (2014)
Market Growth
Technologies Longer battery life, EPS (Steering) Higher pressure, greater Compressor modulation High efficiency motors Weight reduction Driving Growth Lighter weight ABS control
Customers
26
|
|
27
|
|
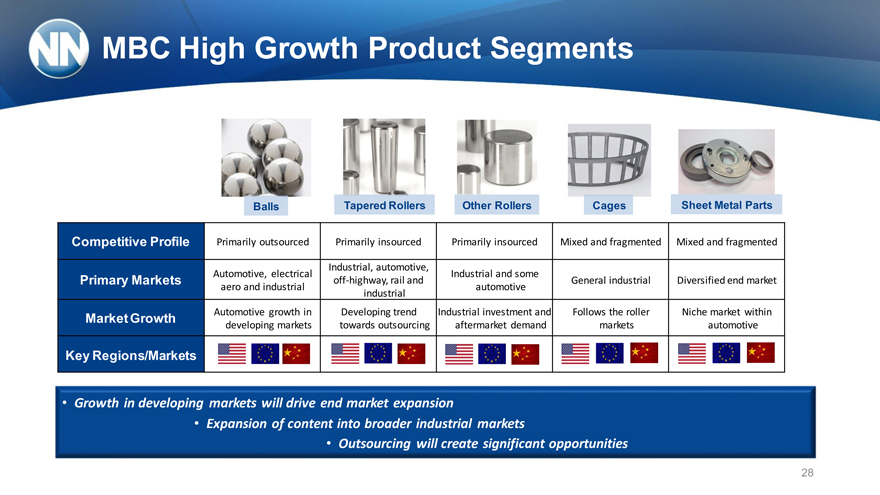
MBC High Growth Product Segments
Balls Tapered Rollers Other Rollers Cages Sheet Metal Parts
Competitive Profile Primarily outsourced Primarily insourced Primarily insourced Mixed and fragmented Mixed and fragmented
Industrial, automotive,
Automotive, electrical Industrial and some
Primary Markets off-highway, rail and General industrial Diversified end market
aero and industrial automotive
industrial
Market Growth Automotive growth in Developing trend Industrial investment and Follows the roller Niche market within
developing markets towards outsourcing aftermarket demand markets automotive
Key Regions/Markets
Growth in developing markets will drive end market expansion
Expansion of content into broader industrial markets
• Outsourcing will create significant opportunities
28
|
|
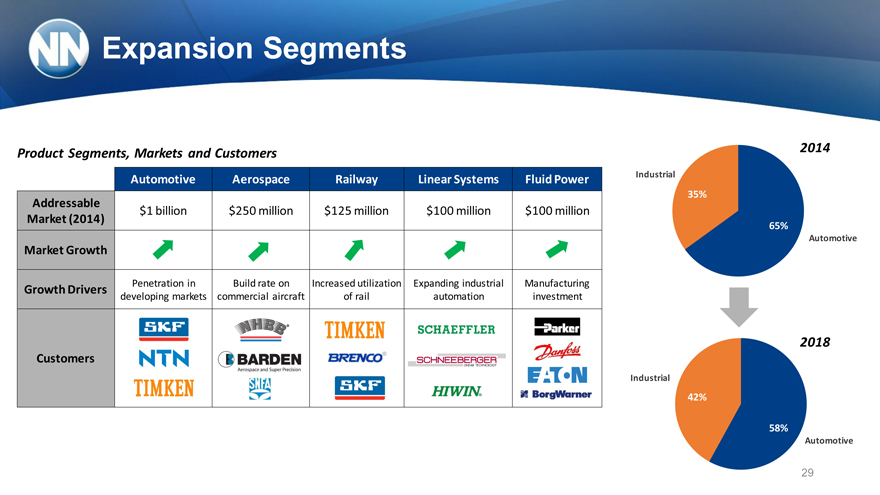
Expansion Segments
Product Segments, Markets and Customers 2014
Automotive Aerospace Railway Linear Systems Fluid Power Industrial
35%
Addressable
$1 billion $250 million $125 million $100 million $100 million
Market (2014)
65%
Automotive
Market Growth
Growth Drivers Penetration in Build rate on Increased utilization Expanding industrial Manufacturing
developing markets commercial aircraft of rail automation investment
2018
Customers
Industrial
42%
58%
Automotive
29
|
|

2014 Results
30
|
|
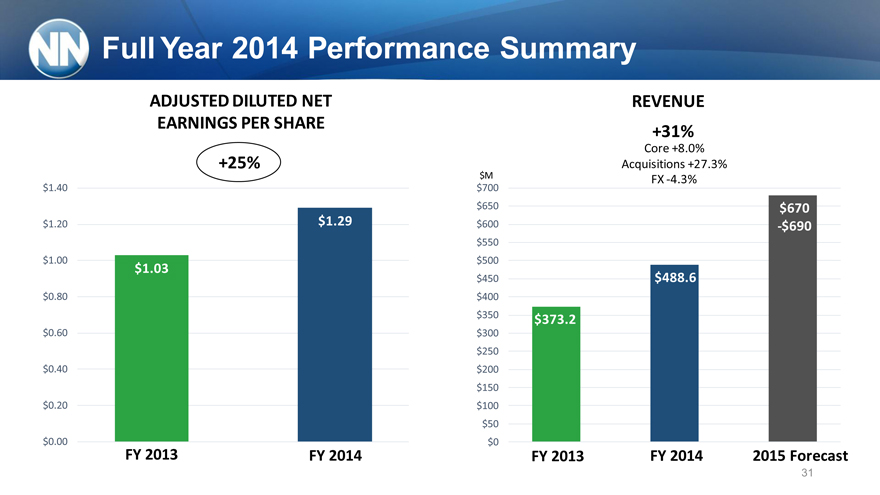
Full Year 2014 Performance Summary
ADJUSTED DILUTED NET
EARNINGS PER SHARE
+25%
$1.40
$1.20 $1.29
$1.00
$1.03
$0.80
$0.60
$0.40
$0.20
$0.00
FY 2013 FY 2014
REVENUE
+31%
Core +8.0%
Acquisitions +27.3%
$M FX -4.3%
$700
$650 $670
$600 -$690
$550
$500
$450 $488.6
$400
$350 $373.2
$300
$250
$200
$150
$100
$50
$0
FY 2013 FY 2014 2015 Forecast
31
|
|
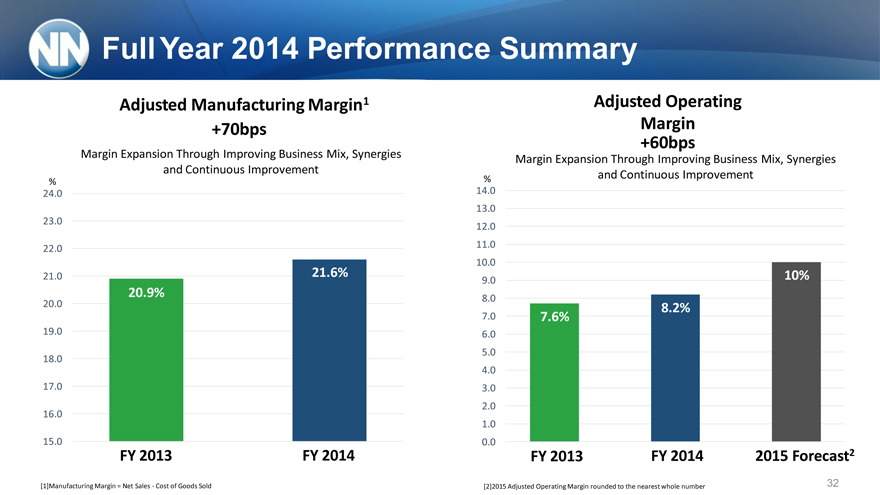
Adjusted Operating Margin +60bps
Margin Expansion Through Improving Business Mix, Synergies % and Continuous Improvement
Full Year 2014 Performance Summary
Adjusted Manufacturing Margin1 +70bps
Margin Expansion Through Improving Business Mix, Synergies and Continuous Improvement
%
24.0
23.0
22.0
21.0 21.6% 20.9%
20.0 19.0 18.0 17.0 16.0
15.0
FY 2013 FY 2014
14.0 13.0 12.0 11.0 10.0
9.0 10%
8.0 8.2%
7.0 7.6%
6.0
5.0
4.0
3.0
2.0
1.0
0.0
FY 2013 FY 2014 2015 Forecast2
[1]Manufacturing Margin = Net Sales—Cost of Goods Sold
[2]2015 Adjusted Operating Margin rounded to the nearest whole number
32
|
|
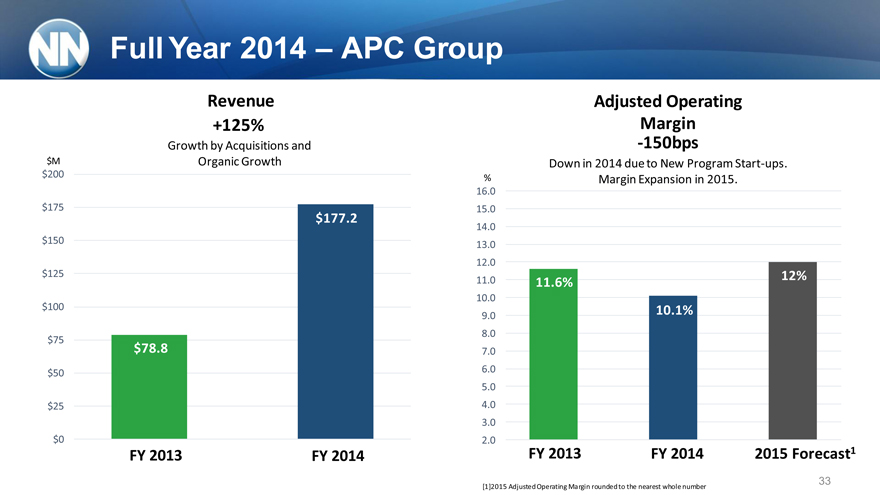
Full Year 2014 – APC Group
Revenue +125%
Growth by Acquisitions and $M Organic Growth
$200
$175
$177.2
$150
$125
$100
20.9%
$75
$78.8
$50
$25
$0
FY 2013 FY 2014
Adjusted Operating
Margin
-150bps
Down in 2014 due to New Program Start-ups.
% Margin Expansion in 2015.
16.0
15.0
14.0
13.0
12.0
11.0 12%
11.6%
10.0
10.1%
9.0
8.0
7.0
6.0
5.0
4.0
3.0
2.0
FY 2013 FY 2014 2015 Forecast1
33
[1]2015 Adjusted Operating Margin rounded to the nearest whole number
|
|
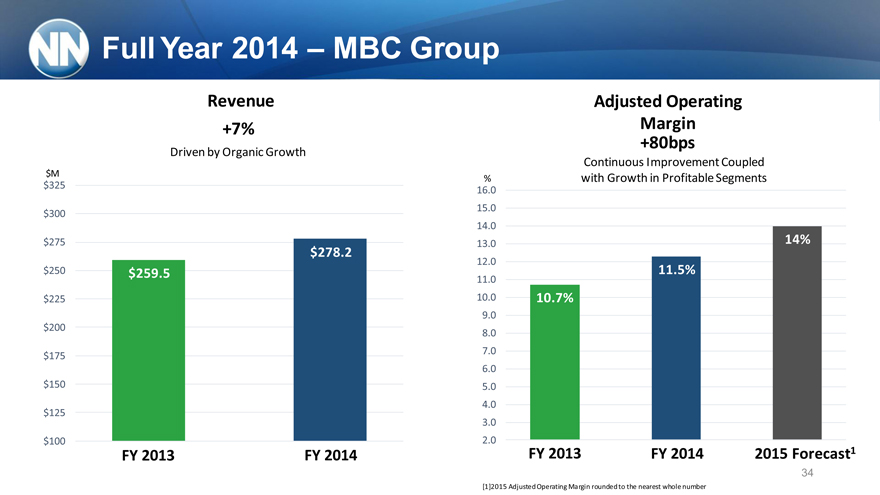
Full Year 2014 – MBC Group
Revenue
+7%
Driven by Organic Growth
$M
$325
$300
$275 $278.2
$250 $259.5
$225
$200
$175
$150
$125
$100
FY 2013 FY 2014
Adjusted Operating
Margin
+80bps
Continuous Improvement Coupled
% with Growth in Profitable Segments
16.0
15.0
14.0
13.0 14%
12.0
11.5%
11.0
10.0 10.7% 8.2
9.0 6%
8.0
7.0
6.0
5.0
4.0
3.0
2.0
FY 2013 FY 2014 2015 Forecast1
34
[1]2015 Adjusted Operating Margin rounded to the nearest whole number
|
|
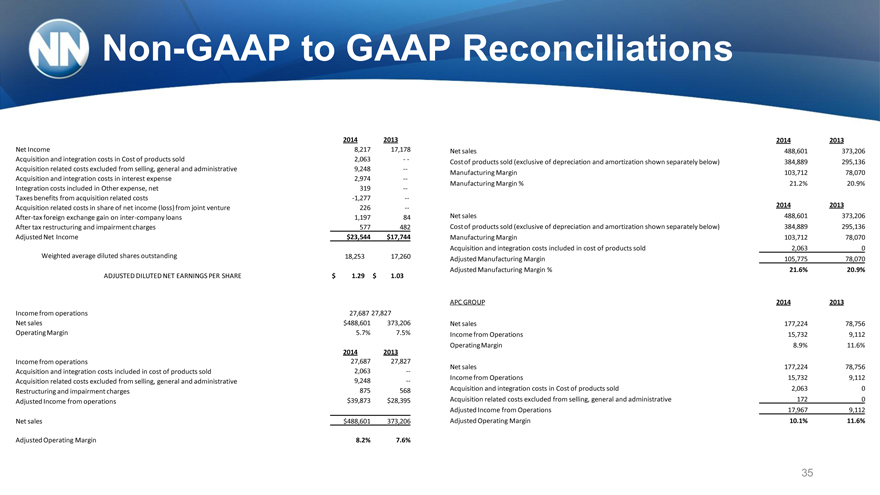
Non-GAAP to GAAP Reconciliations
2014 2013 2014 2013
Net Income 8,217 17,178 Net sales 488,601 373,206 Acquisition and integration costs in Cost of products sold 2,063 — Cost of products sold (exclusive of depreciation and amortization shown separately below) 384,889 295,136 Acquisition related costs excluded from selling, general and administrative 9,248 — Manufacturing Margin 103,712 78,070 Acquisition and integration costs in interest expense 2,974 — Manufacturing Margin % 21.2% 20.9% Integration costs included in Other expense, net 319 — Taxes benefits from acquisition related costs -1,277 — 2014 2013
Acquisition related costs in share of net income (loss) from joint venture 226 —
After-tax foreign exchange gain on inter-company loans 1,197 84 Net sales 488,601 373,206 After tax restructuring and impairment charges 577 482 Cost of products sold (exclusive of depreciation and amortization shown separately below) 384,889 295,136 Adjusted Net Income $23,544 $17,744 Manufacturing Margin 103,712 78,070 Acquisition and integration costs included in cost of products sold 2,063 0 Weighted average diluted shares outstanding 18,253 17,260 Adjusted Manufacturing Margin 105,775 78,070 Adjusted Manufacturing Margin % 21.6% 20.9% ADJUSTED DILUTED NET EARNINGS PER SHARE $ 1.29 $ 1.03
APC GROUP 2014 2013
Income from operations 27,687 27,827
Net sales $488,601 373,206 Net sales 177,224 78,756 Operating Margin 5.7% 7.5% Income from Operations 15,732 9,112 Operating Margin 8.9% 11.6%
2014 2013
Income from operations 27,687 27,827
Net sales 177,224 78,756 Acquisition and integration costs included in cost of products sold 2,063 —Income from Operations 15,732 9,112 Acquisition related costs excluded from selling, general and administrative 9,248 —875 568 Acquisition and integration costs in Cost of products sold 2,063 0 Restructuring and impairment charges Adjusted Income from operations $39,873 $28,395 Acquisition related costs excluded from selling, general and administrative 172 0 Adjusted Income from Operations 17,967 9,112 Net sales $488,601 373,206 Adjusted Operating Margin 10.1% 11.6%
Adjusted Operating Margin 8.2% 7.6%
35
|
|
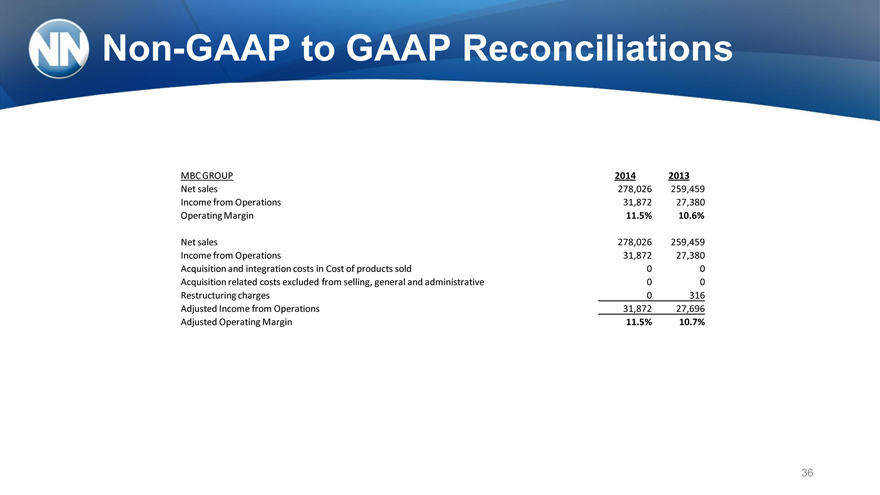
Non-GAAP to GAAP Reconciliations
MBC GROUP 2014 2013 Net sales 278,026 259,459 Income from Operations 31,872 27,380 Operating Margin 11.5% 10.6%
Net sales 278,026 259,459 Income from Operations 31,872 27,380 Acquisition and integration costs in Cost of products sold 0 0 Acquisition related costs excluded from selling, general and administrative 0 0 Restructuring charges 0 316 Adjusted Income from Operations 31,872 27,696 Adjusted Operating Margin 11.5% 10.7%
36
|
|

Investor Presentation
March 23, 2015