Attached files
| file | filename |
|---|---|
| EX-3.3 - EX-3.3 - Apigee Corp | d804501dex33.htm |
| EX-4.3 - EX-4.3 - Apigee Corp | d804501dex43.htm |
| EX-4.1 - EX-4.1 - Apigee Corp | d804501dex41.htm |
| EX-10.1 - EX-10.1 - Apigee Corp | d804501dex101.htm |
| EX-4.2 - EX-4.2 - Apigee Corp | d804501dex42.htm |
| EX-3.1 - EX-3.1 - Apigee Corp | d804501dex31.htm |
| EX-23.2 - EX-23.2 - Apigee Corp | d804501dex232.htm |
| EX-10.2 - EX-10.2 - Apigee Corp | d804501dex102.htm |
| EX-23.1 - EX-23.1 - Apigee Corp | d804501dex231.htm |
| EX-21.1 - EX-21.1 - Apigee Corp | d804501dex211.htm |
| EX-10.12 - EX-10.12 - Apigee Corp | d804501dex1012.htm |
| EX-10.11 - EX-10.11 - Apigee Corp | d804501dex1011.htm |
| EX-10.14 - EX-10.14 - Apigee Corp | d804501dex1014.htm |
| EX-10.13 - EX-10.13 - Apigee Corp | d804501dex1013.htm |
Table of Contents
As filed with the Securities and Exchange Commission on March 20, 2015
Registration No. 333-
UNITED STATES
SECURITIES AND EXCHANGE COMMISSION
Washington, D.C. 20549
FORM S-1
REGISTRATION STATEMENT
UNDER
THE SECURITIES ACT OF 1933
APIGEE CORPORATION
(Exact name of Registrant as specified in its charter)
| Delaware | 7372 | 20-1367539 | ||
| (State or other jurisdiction of incorporation or organization) |
(Primary Standard Industrial Classification Code Number) |
(I.R.S. Employer Identification Number) |
10 S. Almaden Blvd., 16th Floor
San Jose, California 95113
(408) 343-7300
(Address, including zip code, and telephone number, including area code, of Registrant’s principal executive offices)
Chet Kapoor
Chief Executive Officer
Apigee Corporation
10 S. Almaden Blvd., 16th Floor
San Jose, California 95113
(408) 343-7300
(Name, address, including zip code, and telephone number, including area code, of agent for service)
Copies to:
| David J. Segre Mark B. Baudler Andrew D. Hoffman Wilson Sonsini Goodrich & Rosati, P.C. 650 Page Mill Road Palo Alto, California 94304 (650) 493-9300 |
Stacey Giamalis Apigee Corporation 10 S. Almaden Blvd., 16th Floor San Jose, California 95113 (408) 343-7300 |
Andrew S. Williamson Charles S. Kim David Peinsipp Cooley LLP 101 California Street, 5th Floor San Francisco, California 94111 (415) 693-2000 |
Approximate date of commencement of proposed sale to the public: As soon as practicable after this registration statement becomes effective.
If any of the securities being registered on this Form are to be offered on a delayed or continuous basis pursuant to Rule 415 under the Securities Act, check the following box: ¨
If this Form is filed to register additional securities for an offering pursuant to Rule 462(b) under the Securities Act, please check the following box and list the Securities Act registration statement number of the earlier effective registration statement for the same offering. ¨
If this Form is a post-effective amendment filed pursuant to Rule 462(c) under the Securities Act, check the following box and list the Securities Act registration statement number of the earlier effective registration statement for the same offering. ¨
If this Form is a post-effective amendment filed pursuant to Rule 462(d) under the Securities Act, check the following box and list the Securities Act registration statement number of the earlier effective registration statement for the same offering. ¨
Indicate by check mark whether the registrant is a large accelerated filer, an accelerated filer, a non-accelerated filer, or a smaller reporting company. See the definitions of “large accelerated filer,” “accelerated filer” and “smaller reporting company” in Rule 12b-2 of the Exchange Act. (Check one):
| Large accelerated filer | ¨ | Accelerated filer | ¨ | |||||
| Non-accelerated filer | x (Do not check if a smaller reporting company) | Smaller reporting company | ¨ |
CALCULATION OF REGISTRATION FEE
|
| ||||
| Title of Each Class of Securities to be Registered |
Proposed Maximum Aggregate Offering Price(1)(2) |
Amount of Registration Fee | ||
| Common Stock, $0.001 par value per share |
$86,250,000 | $10,023 | ||
|
| ||||
|
| ||||
| (1) | Estimated solely for the purpose of computing the amount of the registration fee pursuant to Rule 457(o) under the Securities Act of 1933, as amended. |
| (2) | Includes the aggregate offering price of additional shares that the underwriters have the option to purchase to cover over-allotments, if any. |
The Registrant hereby amends this Registration Statement on such date or dates as may be necessary to delay its effective date until the Registrant shall file a further amendment which specifically states that this Registration Statement shall thereafter become effective in accordance with Section 8(a) of the Securities Act of 1933 or until the Registration Statement shall become effective on such date as the Commission, acting pursuant to said Section 8(a), may determine.
Table of Contents
The information in this preliminary prospectus is not complete and may be changed. We may not sell these securities until the registration statement filed with the Securities and Exchange Commission is effective. This preliminary prospectus is not an offer to sell these securities and we are not soliciting offers to buy these securities in any jurisdiction where the offer or sale is not permitted.
PROSPECTUS (Subject to Completion)
Issued , 2015
Shares

COMMON STOCK
Apigee Corporation is offering shares of its common stock. This is our initial public offering and no public market currently exists for our shares. We anticipate that the initial public offering price will be between $ and $ per share.
We have applied to list our common stock on The NASDAQ Global Select Market under the symbol “APIC.”
We are an “emerging growth company” as defined under the federal securities laws and, as such, may elect to comply with certain reduced public company reporting requirements for future filings. Investing in our common stock includes risks. See “Risk Factors” beginning on page 13.
PRICE $ A SHARE
| Price to Public |
Underwriting Discounts and Commissions(1) |
Proceeds to Apigee | ||||
| Per Share |
$ | $ | $ | |||
| Total |
$ | $ | $ |
| (1) | See the section titled “Underwriting” for a description of the compensation payable to the underwriters. |
We have granted the underwriters the right to purchase up to an additional shares of common stock to cover over-allotments.
Neither the Securities and Exchange Commission nor any state securities regulators have approved or disapproved of these securities, or determined if this prospectus is truthful or complete. Any representation to the contrary is a criminal offense.
The underwriters expect to deliver the shares of common stock to purchasers on , 2015.
| MORGAN STANLEY | J.P. MORGAN | CREDIT SUISSE |
| PACIFIC CREST SECURITIES | JMP SECURITIES | NOMURA | ||
, 2015
Table of Contents
![]()
Making every business a digital business
apigee
Table of Contents
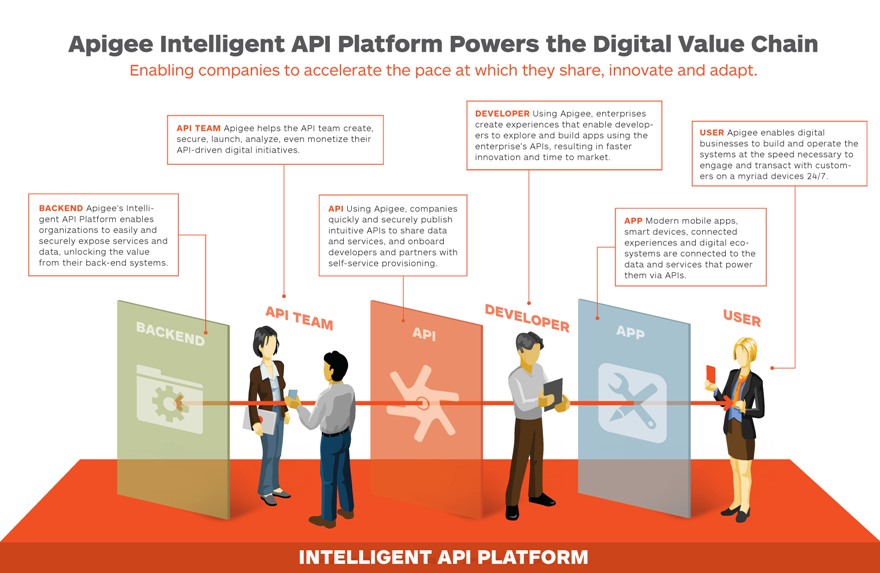
Apigee Intelligent API Platform Powers the Digital Value Chain Enabling companies to accelerate the pace at which they share, innovate and adapt. INTELLIGENT API PLATFORM APP API API TEAM USER DEVELOPER BACKEND API TEAM Apigee helps the API team create, secure, launch, analyze, even monetize their API-driven digital initiatives. DEVELOPER Using Apigee, enterprises create experiences that enable developers to explore and build apps using the enterprise’s APIs, resulting in faster innovation and time to market. USER Apigee enables digital businesses to build and operate the systems at the speed necessary to engage and transact with customers on a myriad devices 24/7. BACKEND Apigee’s Intelligent API Platform enables organizations to easily and securely expose services and data, unlocking the value from their back-end systems. API Using Apigee, companies quickly and securely publish intuitive APIs to share data and services, and onboard developers and partners with self-service provisioning. APP Modern mobile apps, smart devices, connected experiences and digital ecosystems are connected to the data and services that power them via APIs.
Table of Contents
Neither we nor the underwriters have authorized anyone to provide you with any information or make any representations other than those contained in this prospectus or in any free writing prospectus prepared by or on behalf of us or to which we have referred you. We take no responsibility for, and can provide no assurance as to the reliability of, any other information that others may give you. We are offering to sell, and seeking offers to buy, shares of common stock only in jurisdictions where offers and sales are permitted. The information contained in this prospectus is accurate only as of the date of this prospectus, regardless of the time of delivery of this prospectus or of any sale of the common stock. Our business, financial condition, results of operations and prospects may have changed since that date.
Through and including , 2015 (the 25th day after the date of this prospectus), all dealers effecting transactions in these securities, whether or not participating in this offering, may be required to deliver a prospectus. This is in addition to a dealer’s obligation to deliver a prospectus when acting as an underwriter and with respect to an unsold allotment or subscription.
For investors outside of the United States: Neither we nor the underwriters have done anything that would permit this offering or possession or distribution of this prospectus in any jurisdiction where action for that purpose is required, other than in the United States. You are required to inform yourselves about and to observe any restrictions relating to this offering and the distribution of this prospectus outside of the United States.
Table of Contents
This summary highlights information contained elsewhere in this prospectus. You should read the following summary together with the more detailed information appearing in this prospectus, including “Risk Factors,” “Selected Consolidated Financial and Other Data,” “Management’s Discussion and Analysis of Financial Condition and Results of Operations,” “Business,” and our consolidated financial statements and related notes before deciding whether to purchase shares of our common stock. Unless the context otherwise requires, the terms “Apigee,” “Apigee Corporation,” “the company,” “we,” “us” and “our” in this prospectus refer to Apigee Corporation and its subsidiaries. Our fiscal year end is July 31, and our fiscal quarters end on October 31, January 31, April 30, and July 31. Our fiscal years ended July 31, 2012, 2013 and 2014 and our fiscal year ending July 31, 2015 are referred to herein as fiscal 2012, fiscal 2013, fiscal 2014 and fiscal 2015, respectively.
APIGEE CORPORATION
Overview
At Apigee, our mission is to make every business a digital business.
Unprecedented growth in mobile technologies, big data, cloud services and the connected devices that comprise the Internet of Things, or IoT, has disrupted or transformed the dynamics of business, changed consumer behavior and eroded the divide between the physical and digital worlds. To fully embrace the digital world, businesses must provide seamless customer experiences across a myriad of devices and channels, respond quickly to fast-changing customer expectations and market conditions, drive revenue through new business models and create or participate in digital ecosystems. A digital business creates value by unlocking its data and services to better serve customers in a real-time, anywhere-anytime fashion and uses data to continually improve the customer experience and drive additional revenue.
We believe that application programming interfaces, or APIs, are a critical enabling technology for the shifts in mobile, cloud computing, big data and the IoT and that APIs are a foundational technology on which digital business operates. We believe that a new and expansive market opportunity exists to help enterprises adopt digital strategies and navigate the digitally driven economy.
We provide an innovative software platform that allows businesses to design, deploy, and scale APIs as a connection layer between their core IT systems and data and the applications with which their customers, partners, employees and other users engage with their business. The foundations of our platform are Apigee Edge, a robust API-management solution, and Apigee Insights, our predictive analytics software solution. Our platform enables a comprehensive view of the enterprise data the user is consuming and generating, and data about the context in which the customer is using the digital product or service, or contextual data. In addition, our platform provides tools for businesses to drive usage and adoption of APIs by their business partners and developers. Using our platform, businesses in any industry can easily and securely connect their core services and data to developers to enable them to develop applications and experiences for customers, partners, employees and other users. Using our platform, businesses can forge new partnerships, build partner ecosystems, and participate fully in emerging digital business networks.
Today, it is difficult for many businesses to fully participate and innovate in the digital world because traditional enterprise software is not designed to interact with and connect to the rapidly evolving digital economy. The IT architectures deployed at most businesses are based on thousands of application servers communicating with databases, other applications and numerous middleware layers, each using thousands of custom integrations and connectors. These legacy architectures generally cannot publish APIs in a way that can be used by application developers. Furthermore, they are not equipped to consume or leverage the data that flow
-1-
Table of Contents
from digital interactions or the contextual data that exist in digital networks. A business with a legacy architecture will not have access to the data necessary to drive better business decisions nor to respond to customers in relevant and responsive ways.
We believe that in order to build, manage and extract valuable insights from APIs and data that are needed for digital business, nearly all businesses will require a new layer within their core application software stack. To enable this new layer, we provide a single secure platform for APIs and predictive analytics, which can be deployed either in the cloud or on premises. By using our platform, an organization can securely share its data and services, enabling users to easily engage and transact with the business. Because we provide API publishing, operations, and data visibility in our integrated solution, our platform enables more informed predictive analytics to help the business anticipate and adapt to customer behavior.
We have achieved significant scale, with a customer base that has grown over 35% from the end of fiscal 2012 to the end of fiscal 2014. Our customers include many leading businesses: 20 of the Fortune 100, five of the top 10 Global 2000 retail brands and six of the top 10 global telecommunications companies as of January 31, 2015. Our platform has been sold to customers in over 30 countries around the world.
We have experienced rapid growth in recent periods. Our total revenue was $27.6 million, $43.2 million and $52.7 million in fiscal 2012, fiscal 2013 and fiscal 2014, respectively, and $23.4 million and $32.6 million in the six months ended January 31, 2014 and 2015, respectively. Our gross billings were $36.7 million, $43.1 million and $63.8 million in fiscal 2012, fiscal 2013 and fiscal 2014, respectively, representing growth rates of 18% from fiscal 2012 to fiscal 2013 and 48% from fiscal 2013 to fiscal 2014. Our gross billings were $23.7 million and $37.6 million in the six months ended January 31, 2014 and 2015, respectively, representing a growth rate of 59%. We define gross billings as our total revenue plus the change in our deferred revenue in a period. For fiscal 2014, 33% of our revenue was derived from customers located outside the United States, up from 16% in fiscal 2013. For the six months ended January 31, 2015, we derived 38% of our revenue from customers located outside of the United States, up from 33% in the six months ended January 31, 2014. We incurred net losses of $8.3 million, $25.9 million and $60.8 million in fiscal 2012, fiscal 2013 and fiscal 2014, respectively, and $32.2 million and $26.8 million in the six months ended January 31, 2014 and 2015, respectively. See “Selected Consolidated Financial and Other Data—Certain Key Non-GAAP Financial Metrics” for information regarding the limitations of using gross billings as a financial measure and for a reconciliation of gross billings to total revenue, the most directly comparable financial measure calculated in accordance with generally accepted accounting principles in the United States, or GAAP.
Our Industry
Behind every mobile app, smart device and connected experience sits at least one API. An API is a set of programming instructions and standards that enables software applications to interact with other IT resources. APIs connect an enterprise’s services, content and data to developers and partners in an easy and secure way, making it possible for developers to create powerful new applications and experiences. As an example, when someone uses Yelp to look for the closest Italian restaurant, APIs make it work. An API is the code that allows an application such as Yelp to interact with the maps data and show the restaurant on a map. Although the foregoing example does not involve our platform (in this case the Google Maps API is involved), we believe that this example is a good illustration of the integral and ubiquitous nature of APIs generally.
Without APIs, a digital business would not be able to as effectively enhance existing assets and unlock the value of data. We believe that analyzing customer behavior to predict future actions is crucial for fostering business innovation in customer engagement and operational processes. By using predictive analytics, digital businesses have a unique opportunity to turn the significant volume of structured and unstructured data in their digital ecosystems
-2-
Table of Contents
into actionable business insights. Every event is rich with contextual information such as user demographics, time, location and activities such as purchases. Using real-time, API-driven insights into individual user behavior and aggregate user activity, businesses can predict user actions and respond in a relevant way.
The traditional approaches to integration, application architecture, data management and security make it difficult for a business to connect its customers, partners, employees and other users to its operations. As a result, businesses are not able to fully leverage the data streams generated by the user applications and experiences that characterize digital business. Fundamentally, these traditional approaches do not meet the technical demands of the modern digital experience—the new “systems of engagement,” that are used by customers, partners, employees and other users to engage with businesses across multiple channels and locations. These systems of engagement represent a new layer in the enterprise IT architecture on top of its systems of record—the enterprise resource planning systems companies rely on to run their business, such as databases, financial, manufacturing, customer relationship management and human resources software.
We believe that the key IT requirements to support digital business capabilities are as follows:
| • | Speed: Legacy IT Integration Cannot Keep Up with Pace of Change. Traditional IT approaches to middleware demanded centralized planning and governance. Historically business decisions about the connectivity of systems required a lengthy planning process and the participation of specialists who were often removed from the business needs driving the projects. Today, modern adaptive IT processes are renouncing centralized planning and governance practices and embracing agile methodologies that allow the organization to more rapidly scale to meet the diverse and evolving demands of the digital business. |
| • | Hyper-connectivity: Legacy IT Cannot Meet the Demands of a Mobile World. Legacy middleware systems were primarily designed for server-to-server communication and not for enabling the modern, user-facing digital experiences that businesses need to deliver across a variety of mobile and connected devices. Most middleware technologies were built around the expectation of reliable and high-bandwidth communications over networks within a company’s data centers. However, the bandwidth constraints of mobile technologies place new constraints on the volume of data and latency between servers and applications. |
| • | Data: Narrow View of Data Does Not Adequately Support Business Insights. In a digital business, analytics is not about delivering reports on last month’s activity. Rather, it is about generating responsive actions based on predictive insights into individual and aggregate user behavior and activity. Most legacy architectures are unprepared for the enormous amount of contextual data that is generated through new digital channels. |
| • | Security: Perimeter Models of Security Provide Only Limited Protection. Traditional information security architectures have presupposed that the applications and users exist within the firewalled perimeters of the enterprise network. Software that assumes and even requires a “perimeter” where the software can be installed, or that requires a company “agent” to be installed on all mobile devices is ineffective for digital businesses that must support a myriad of new applications and devices, as well as external developers and partners. |
Our Solution
Our platform enables digital business by providing the following features:
| • | Purpose-built for People and Technology Across the Digital Value Chain. Our management tools, business and operational analytics, policy-based approach and advanced programmability provide a simple yet powerful platform that serves the entire digital value chain between the end user and the business’ backend systems. This digital value chain includes the applications, the developers who build them and the APIs that they use, all of which need to work together seamlessly, and each of which has requirements that can only be |
-3-
Table of Contents
| addressed by an integrated platform. Pre-built and configurable policies enable organizations to control traffic on their APIs, enhance performance, enforce security, simplify customer self-service and reduce time-to-value—all without coding or changing the backend systems of record. |
| • | Enterprise-grade Software Enables Web Scale, Reliability and Security. Our platform is web scale and flexible and is offered as a cloud service or as an on-premises deployment. Our cloud service provides up to 99.99% availability and uptime, and a multi-region API delivery network enabling low latency worldwide. We enable organizations to control access to APIs and services and protect customers and the business from threats, backend system overload, service issues and sensitive data exposure. |
| • | Built-in Developer Services to Foster Adoption and Enhance the Business Value of APIs. Our platform enables a business to provide a developer community experience that accelerates API adoption, simplifies learning, enables monetization and increases the business value of APIs. Using our platform, businesses can rapidly onboard developers and facilitate their secure interaction with their business data and systems. Our customizable developer portal helps businesses foster innovation among internal and external developers and partners by making it easy for developers to interact with the enterprise and with each other. |
| • | Analytics for End-to-end Business Visibility. Our platform provides end-to-end visibility across the entire digital value chain with unified operational and business metrics and application monitoring. Operational metrics and application monitoring enable monitoring of the health and performance of APIs, applications and digital ecosystems. Business metrics enable businesses to track product, service, and customer usage and trends, respond quickly to customer and market changes, and make data-driven decisions. |
| • | Predictive Analytics to Derive Actionable Insights at the Point of Engagement. With APIs positioned at the center of the application data stream, our platform enables businesses to gain actionable insights from the flow of data and effect a change of behavior that improves the customer experience. Our platform turns the intelligence derived from the enormous amount of data generated by increasingly connected customers into action, enabling the enterprise to deliver the right experience, at the right time, on the right device. |
| • | Support for New Forms of Interaction and Connectivity, Such as the Internet of Things. Our platform powers the APIs, and captures and derives insights from the data generated by the applications and experiences through which customers, partners and employees engage with a business. We believe that our platform is positioned to power complex, distributed systems such as the IoT, including wearable technology, intelligent cars, smart energy grids, and other forms of emerging connected interaction. |
Our Growth Strategy
Our goal is to be the provider of the leading software platform that enables digital business acceleration for enterprises worldwide. The key elements of our growth strategy include:
| • | Continue to Lead the Transformation to Digital Business Across Industries. We believe that the transformation of businesses in nearly every industry to digital business, enabled by APIs and big data analytics, is an emerging trend, and that we have a leadership position in this new market. We intend to extend our leadership position by continuing to innovate, bringing new technologies to market, and honing best practices and thought leadership by working closely with our global customer base. |
| • | Expand our Platform and Continue Building Our Technology Leadership. We intend to continue building innovative software products that extend the value of our existing solutions and further help enterprises realize digital business success, through new growth and operational efficiencies. For example, we continue to invest in Apigee Insights, a self-service predictive analytics solution that helps enterprises build customer journey models and adaptive applications. In addition to continued investments in product development, we may also pursue acquisitions of technology that complement our platform. |
-4-
Table of Contents
| • | Expand Sales to New Customers and Within Our Existing Customer Base. We intend to increase deployment of our solutions to new customers and within existing customers by targeting additional use cases and more functional areas and business units within the customer organization, and by meeting increasing capacity requirements. |
| • | Expand Partnerships to Acquire and Service New Customers. In August 2013, we formed a global alliance with Accenture to deliver enterprise API solutions and, in July 2014, we announced a reseller agreement with SAP. We intend to continue building partnerships with global systems integrators as well as OEMs to enable us to efficiently expand our sales capacity and to provide professional services related to our software platform that also afford us strategic insights into customer deployments. |
| • | Continue to Aggressively Grow our Business Internationally. We believe that there is a substantial opportunity to grow our international business. We plan to continue to aggressively market to customers located outside of the United States by building partnerships and by expanding our direct and indirect sales channels outside the United States and EMEA. For fiscal 2014 and the six months ended January 31, 2015, respectively, we derived approximately 33% and 38% of our revenue from customers located outside the United States. |
Risks Associated with Our Business
Our business is subject to numerous risks and uncertainties, including those highlighted in the section titled “Risk Factors” immediately following this prospectus summary. These risks include, but are not limited to, the following:
| • | we have a history of losses, and we expect to incur losses for the foreseeable future; |
| • | the market for our platform is new and unproven and may not grow or may decrease; |
| • | we have a short operating history for our recently released solutions, including the current version of our cloud-based solution and the current version of our predictive analytics solution, which makes it difficult to evaluate our future prospects and may increase the risk that we will not be successful; |
| • | because we currently derive substantially all of our revenue and cash flows from our Apigee Edge solution, failure of this solution to satisfy customer demands or achieve increased market acceptance would materially and adversely affect our business, results of operations, financial condition and growth prospects; |
| • | if we are not able to introduce new products successfully and to make enhancements to existing products, our growth rates would likely decline and our business, results of operations and competitive position could suffer; |
| • | we may not be able to compete successfully against current and future competitors; |
| • | our future quarterly results may fluctuate significantly, which could adversely affect our share price; |
| • | we expect our revenue mix to vary over time, which can affect our gross margin and operating results; and |
| • | our directors, executive officers and significant stockholders that beneficially own more than 5% of our common stock will continue to have substantial control over us after this offering, and could delay or prevent a change in corporate control. Such stockholders will beneficially own approximately % of our common stock after the offering collectively, based on the beneficial ownership of our stock as of February 15, 2015, and after giving effect to the automatic conversion of all outstanding shares of our convertible preferred stock and the sale of common stock in this offering. See the section titled “Principal Stockholders” for additional information. |
-5-
Table of Contents
Corporate Information
We were incorporated in the State of Delaware as Nexgen Machines, Inc. on June 3, 2004, changed our name to Sonoa Systems, Inc. on November 15, 2004 and changed our name to Apigee Corporation on September 21, 2010. Our principal executive offices are located at 10 South Almaden Blvd., 16th Floor, San Jose, California 95113. Our telephone number at that location is (408) 343-7300. Our website address is www.apigee.com. Information on our website is not part of this prospectus and should not be relied upon in determining whether to make an investment decision.
The Apigee design logo and the mark “Apigee” are the property of Apigee Corporation. This prospectus contains additional trade names, trademarks, and service marks of other companies. We do not intend our use or display of other companies’ trade names, trademarks or service marks to imply a relationship with, or endorsement or sponsorship of us by, these other companies.
Implications of Being an Emerging Growth Company
As a company with less than $1.0 billion in revenue during our last fiscal year, we qualify as an “emerging growth company” as defined in the Jumpstart Our Business Startups Act of 2012, or the JOBS Act. An emerging growth company may take advantage of specified reduced reporting requirements that are otherwise applicable generally to public companies. These reduced reporting requirements include:
| • | the requirement to present only two years of audited financial statements and only two years of related management’s discussion and analysis in this prospectus; |
| • | an exemption from compliance with the auditor attestation requirement on the effectiveness of our internal control over financial reporting; |
| • | an exemption from compliance with any requirement that the Public Company Accounting Oversight Board may adopt regarding mandatory audit firm rotation or a supplement to the auditor’s report providing additional information about the audit and the financial statements; |
| • | reduced disclosure about our executive compensation arrangements; and |
| • | exemption from the requirements to obtain a non-binding advisory vote on executive compensation or shareholder approval of any golden parachute arrangements. |
We will remain an emerging growth company until the earliest to occur of: (1) the first fiscal year following the fifth anniversary of our initial public offering; (2) the first fiscal year after our annual gross revenue is $1.0 billion or more; (3) the date on which we have, during the previous three-year period, issued more than $1.0 billion in non-convertible debt securities; or (4) as of the end of any fiscal year in which the market value of our common stock held by non-affiliates exceeded $700.0 million as of the end of the second quarter of that fiscal year.
We may choose to take advantage of some, but not all, of the available benefits under the JOBS Act. We are choosing to irrevocably “opt out” of the extended transition periods available under the JOBS Act for complying with new or revised accounting standards, but we intend to take advantage of the other exemptions discussed above. Accordingly, the information contained herein may be different than the information you receive from other public companies in which you hold stock.
-6-
Table of Contents
The Offering
| Common stock offered by us |
shares | |
| Over-allotment option being offered by us |
shares | |
| Common stock to be outstanding after this offering |
shares ( shares, if the underwriters exercise their over-allotment option in full) | |
| Use of proceeds |
We estimate that the net proceeds from our sale of shares of common stock in this offering at an assumed initial public offering price of $ per share, which is the midpoint of the estimated offering price range reflected on the cover page of this prospectus, after deducting estimated underwriting discounts and commissions and estimated offering expenses payable by us, will be approximately $ million, or $ million if the underwriters exercise their over-allotment option in full.
The principal purposes of this offering are to increase our capitalization and financial flexibility, to create a public market for our stock and thereby enable access to the public equity markets for our employees and stockholders, to obtain additional capital and to increase our visibility in the marketplace.
We currently intend to use the net proceeds we receive from this offering primarily for general corporate purposes, including working capital, sales and marketing activities, solution and platform development, general and administrative matters, and capital expenditures, although we do not currently have any specific or preliminary plans with respect to the use of proceeds for such purposes. We may also use a portion of the net proceeds for the acquisition of, or investment in, technologies, solutions or businesses that complement our business, although we have no present commitments or agreements to enter into any acquisitions or investments. See “Use of Proceeds.” | |
| Directed share program |
At our request, the underwriters have reserved up to 5% of the common stock being offered by this prospectus for sale at the initial public offering price to certain individuals associated with us and members of their families. None of our directors, executive officers or employees will participate in the directed share program. The sales will be made by Morgan Stanley, an underwriter of this offering, through a directed share program. We do not know if these individuals will choose to purchase all or any portion of these reserved shares, but any purchases they do make will reduce the number of shares that are available to the general public. Any reserved shares that are not so purchased will be offered by the underwriters to the general public on the same terms as the other shares of common stock. | |
| Proposed NASDAQ trading symbol |
“APIC” | |
-7-
Table of Contents
The number of shares of our common stock to be outstanding after this offering is based on 181,441,420 shares of our common stock outstanding as of January 31, 2015, after giving effect to the automatic conversion of our convertible preferred stock outstanding as of such date into an aggregate of 149,907,620 shares of our common stock immediately prior to the completion of this offering, as well as the performance-based vesting condition of certain restricted stock units, or RSUs, outstanding as of January 31, 2015 that settle for 38,043 shares of common stock, which we expect to record upon completion of this offering, as further described in “Management’s Discussion and Analysis of Financial Condition and Results of Operations—Critical Accounting Policies and Estimates—Stock-based Compensation,” and excludes:
| • | 32,451,089 shares of common stock issuable upon the exercise of options, including a non-plan option, outstanding as of January 31, 2015, with a weighted-average exercise price of $0.58 per share; |
| • | 65,890 shares of common stock issuable upon the vesting of RSUs outstanding as of January 31, 2015; |
| • | 526,562 shares of common stock issuable upon the exercise of warrants outstanding as of January 31, 2015, with a weighted-average exercise price of $0.31 per share (not including warrants to purchase 79,687 shares of common stock, which may become issuable in the future pursuant to our loan and security agreement with Silicon Valley Bank); |
| • | 2,235,224 shares of common stock issuable upon the exercise of options granted after January 31, 2015, with an exercise price of $2.31 per share; |
| • | 100,000 shares of common stock issuable upon the vesting of RSUs granted after January 31, 2015; and |
| • | shares of common stock reserved for future issuance under our stock-based compensation plans, consisting of (1) 35,697,026 shares of common stock reserved for future issuance under our 2005 Stock Incentive Plan, or the 2005 Plan, which shares will be added to the shares to be reserved under our 2015 Equity Incentive Plan, or the 2015 Plan, which will become effective upon completion of this offering, (2) shares of common stock reserved for future issuance under our 2015 Plan, which will become effective upon completion of this offering, (3) shares of common stock reserved for future issuance under our 2015 Employee Stock Purchase Plan, or the ESPP, which will become effective upon completion of this offering, and (4) shares of common stock that become available under our 2015 Plan and ESPP, pursuant to provisions thereof that automatically increase the share reserves under the plans each year, as more fully described in “Executive Compensation—Employee Benefit and Stock Plans.” |
Except as otherwise indicated, all information in this prospectus assumes:
| • | the effectiveness of our amended and restated certificate of incorporation immediately prior to the completion of this offering; |
| • | the automatic conversion of all shares of our convertible preferred stock outstanding as of January 31, 2015 into an aggregate of 149,907,620 shares of common stock immediately prior to the completion of this offering; |
| • | the vesting of RSUs outstanding as of January 31, 2015 that settle for 38,043 shares of common stock, which vest subject to a time-based vesting condition that has been partially met and a performance-based vesting condition related to the completion of our initial public offering, as further described in “Management’s Discussion and Analysis of Financial Condition and Results of Operations—Critical Accounting Policies and Estimates—Stock-based Compensation;” |
| • | no exercise of outstanding options or warrants after January 31, 2015; |
| • | no exercise of the underwriters’ over-allotment option; and |
| • | a one-for- reverse split of our common stock to be effected prior to the completion of this offering. |
-8-
Table of Contents
Summary Consolidated Financial and Other Data
The following table summarizes our consolidated financial and other data. The summary consolidated statements of operations data presented below for fiscal 2012, fiscal 2013 and fiscal 2014, and the consolidated balance sheet data as of July 31, 2014, have been derived from audited consolidated financial statements that are included elsewhere in this prospectus. The consolidated statements of operations data for the six months ended January 31, 2014 and 2015, and the consolidated balance sheet data as of January 31, 2015, are derived from our unaudited consolidated financial statements appearing elsewhere in this prospectus. The following summary consolidated financial and other data should be read together with our audited and unaudited consolidated financial statements and the related notes, as well as the section titled “Management’s Discussion and Analysis of Financial Condition and Results of Operations” included elsewhere in this prospectus. Our historical results are not necessarily indicative of our results in any future period.
| Fiscal Year
Ended July 31, |
Six Months Ended January 31, |
|||||||||||||||||||
| 2012 | 2013 | 2014 | 2014 | 2015 | ||||||||||||||||
| (unaudited) | ||||||||||||||||||||
| (in thousands, except per share data) | ||||||||||||||||||||
| Consolidated Statement of Operations Data: |
||||||||||||||||||||
| Revenue |
||||||||||||||||||||
| License |
$ | 9,452 | $ | 13,917 | $ | 11,411 | $ | 3,566 | $ | 9,522 | ||||||||||
| Subscription and support |
7,308 | 15,243 | 20,237 | 9,651 | 14,164 | |||||||||||||||
| Professional services and other |
10,847 | 13,992 | 21,054 | 10,200 | 8,929 | |||||||||||||||
|
|
|
|
|
|
|
|
|
|
|
|||||||||||
| Total revenue |
27,607 | 43,152 | 52,702 | 23,417 | 32,615 | |||||||||||||||
| Cost of revenue |
||||||||||||||||||||
| License |
157 | 108 | 366 | 88 | 257 | |||||||||||||||
| Subscription and support(1) |
3,484 | 9,286 | 11,911 | 7,425 | 5,367 | |||||||||||||||
| Professional services and other(1) |
8,352 | 12,435 | 15,431 | 7,847 | 7,044 | |||||||||||||||
|
|
|
|
|
|
|
|
|
|
|
|||||||||||
| Total cost of revenue |
11,993 | 21,829 | 27,708 | 15,360 | 12,668 | |||||||||||||||
|
|
|
|
|
|
|
|
|
|
|
|||||||||||
| Gross profit |
15,614 | 21,323 | 24,994 | 8,057 | 19,947 | |||||||||||||||
| Operating expenses |
||||||||||||||||||||
| Research and development(1) |
10,922 | 16,848 | 22,273 | 9,152 | 14,385 | |||||||||||||||
| Sales and marketing(1) |
9,801 | 23,812 | 47,029 | 22,456 | 25,174 | |||||||||||||||
| General and administrative(1) |
4,033 | 5,885 | 14,415 | 6,767 | 6,704 | |||||||||||||||
|
|
|
|
|
|
|
|
|
|
|
|||||||||||
| Total operating expenses |
24,756 | 46,545 | 83,717 | 38,375 | 46,263 | |||||||||||||||
|
|
|
|
|
|
|
|
|
|
|
|||||||||||
| Loss from operations |
(9,142 | ) | (25,222 | ) | (58,723 | ) | (30,318 | ) | (26,316 | ) | ||||||||||
|
|
|
|
|
|
|
|
|
|
|
|||||||||||
| Other income (expense), net |
1,228 | (376 | ) | (1,678 | ) | (1,757 | ) | (290 | ) | |||||||||||
|
|
|
|
|
|
|
|
|
|
|
|||||||||||
| Loss before income taxes |
(7,914 | ) | (25,598 | ) | (60,401 | ) | (32,075 | ) | (26,606 | ) | ||||||||||
| Provision for income taxes |
367 | 273 | 392 | 137 | 203 | |||||||||||||||
|
|
|
|
|
|
|
|
|
|
|
|||||||||||
| Net loss and comprehensive loss |
$ | (8,281 | ) | $ | (25,871 | ) | $ | (60,793 | ) | $ | (32,212 | ) | $ | (26,809 | ) | |||||
|
|
|
|
|
|
|
|
|
|
|
|||||||||||
| Net loss per share(2): |
||||||||||||||||||||
| Basic and diluted |
$ | (0.56 | ) | $ | (1.39 | ) | $ | (2.34 | ) | $ | (1.33 | ) | $ | (0.88 | ) | |||||
|
|
|
|
|
|
|
|
|
|
|
|||||||||||
| Weighted-average shares outstanding used in calculating net loss per share(1): |
||||||||||||||||||||
| Basic and diluted |
14,862 | 18,576 | 25,938 | 24,165 | 30,467 | |||||||||||||||
|
|
|
|
|
|
|
|
|
|
|
|||||||||||
| Pro forma net loss per share (unaudited)(2): |
||||||||||||||||||||
| Basic and diluted |
$ | (0.39 | ) | $ | (0.15 | ) | ||||||||||||||
|
|
|
|
|
|||||||||||||||||
| Weighted-average shares outstanding used in calculating pro forma net loss per share (unaudited)(2): |
||||||||||||||||||||
| Basic and diluted |
157,297 | 180,004 | ||||||||||||||||||
|
|
|
|
|
|||||||||||||||||
-9-
Table of Contents
| (1) | Includes stock-based compensation expense as follows: |
| Fiscal Year
Ended July 31, |
Six Months Ended January 31, |
|||||||||||||||||||
| 2012 | 2013 | 2014 | 2014 | 2015 | ||||||||||||||||
| (unaudited) | ||||||||||||||||||||
| (in thousands) | ||||||||||||||||||||
| Cost of subscription and support revenue |
$ | 2 | $ | 21 | $ | 24 | $ | 12 | $ | 13 | ||||||||||
| Cost of professional services and other revenue |
30 | 65 | 133 | 47 | 91 | |||||||||||||||
| Research and development |
74 | 114 | 490 | 135 | 453 | |||||||||||||||
| Sales and marketing |
55 | 138 | 1,090 | 146 | 319 | |||||||||||||||
| General and administrative |
20 | 70 | 989 | 430 | 571 | |||||||||||||||
|
|
|
|
|
|
|
|
|
|
|
|||||||||||
| Total stock-based compensation expense |
$ | 181 | $ | 408 | $ | 2,726 | $ | 770 | $ | 1,447 | ||||||||||
|
|
|
|
|
|
|
|
|
|
|
|||||||||||
| (2) | See Note 13 to our audited consolidated financial statements appearing elsewhere in this prospectus for an explanation of our basic and diluted net loss per share and pro forma net loss per share calculations. |
Our consolidated balance sheet as of January 31, 2015, is presented on:
| • | an actual basis; |
| • | a pro forma basis, giving effect to the automatic conversion of all outstanding shares of our convertible preferred stock into 149,907,620 shares of common stock and the effectiveness of our amended and restated certificate of incorporation (each of which will occur immediately prior to the completion of this offering), as if such conversion had occurred and our amended and restated certificate of incorporation had become effective on January 31, 2015, as well as the stock-based compensation expense associated with the performance-based vesting of certain RSUs, which we expect to record upon completion of our initial public offering, as described in footnote (1) below; and |
| • | a pro forma as adjusted basis, giving effect to the pro forma adjustments noted above and the sale of shares of common stock by us in this offering, based on an assumed initial public offering price of $ per share, which is the midpoint of the estimated offering price range reflected on the cover page of this prospectus, after deducting estimated underwriting discounts and commissions and estimated offering expenses payable by us. |
The pro forma as adjusted information set forth in the table below is illustrative only and will be adjusted based on the actual initial public offering price and other terms of this offering determined at pricing.
| January 31, 2015 | ||||||||||||
| Actual | Pro Forma(1) | Pro Forma As Adjusted(2) |
||||||||||
| (unaudited) | ||||||||||||
| (in thousands) | ||||||||||||
| Consolidated Balance Sheet Data: |
||||||||||||
| Cash and cash equivalents |
$ | 29,133 | $ | 29,133 | $ | |||||||
| Working capital |
12,045 | 12,045 | ||||||||||
| Total assets |
75,901 | 75,901 | ||||||||||
| Deferred revenue, current and long-term |
33,193 | 33,193 | ||||||||||
| Term debt, current and long-term |
4,899 | 4,899 | ||||||||||
| Additional paid-in capital |
197,100 | 197,123 | ||||||||||
| Total stockholders’ equity |
24,593 | 24,593 | ||||||||||
-10-
Table of Contents
| (1) | Includes the stock-based compensation expense associated with RSUs that settle for 38,043 shares of common stock, which vest subject to a time-based vesting condition that has been partially met and a performance-based vesting condition related to the completion of our initial public offering, as further described in “Management’s Discussion and Analysis of Financial Condition and Results of Operations— Critical Accounting Policies and Estimates — Stock-based Compensation.” |
| (2) | Each $1.00 increase (decrease) in the assumed initial public offering price of $ per share, which is the midpoint of the estimated offering price range reflected on the cover page of this prospectus, would increase (decrease) each of our cash and cash equivalents, working capital (deficit), total assets, additional paid-in capital, and total stockholders’ equity by approximately $ million, assuming that the number of shares offered by us, as set forth on the cover page of this prospectus, remains the same and after deducting the estimated underwriting discounts and commissions and estimated offering expenses payable by us. Each 1.0 million increase (decrease) in the number of shares offered by us as set forth on the cover page of this prospectus, would increase (decrease) each of our cash and cash equivalents, working capital (deficit), total assets, additional paid-in capital, and total stockholders’ equity by approximately $ million, assuming that the assumed initial public offering price of $ per share, which is the midpoint of the estimated offering price range reflected on the cover page of this prospectus, remains the same and after deducting the estimated underwriting discounts and commissions and estimated offering expenses payable by us. |
Certain Key Non-GAAP Financial Metrics
We monitor the following key non-GAAP financial metrics:
| Fiscal Year Ended July 31, |
Six Months Ended January 31, |
|||||||||||||||||||
| 2012 | 2013 | 2014 | 2014 | 2015 | ||||||||||||||||
| (dollar amounts in thousands) | ||||||||||||||||||||
| Gross billings |
$ | 36,701 | $ | 43,136 | $ | 63,768 | $ | 23,684 | $ | 37,618 | ||||||||||
| Non-GAAP gross profit |
$ | 15,646 | $ | 21,409 | $ | 25,763 | $ | 8,233 | $ | 20,505 | ||||||||||
| Non-GAAP gross margin |
56.7 | % | 49.6 | % | 48.9 | % | 35.2 | % | 62.9 | % | ||||||||||
| Non-GAAP operating loss |
$ | (8,912 | ) | $ | (24,638 | ) | $ | (55,117 | ) | $ | (29,326 | ) | $ | (24,269 | ) | |||||
Gross Billings. We define gross billings as our total revenue plus the change in our deferred revenue in a period. Gross billings in any period consists of sales to new customers plus renewals and additional sales to existing customers. Our management uses gross billings as a performance measurement because we generally bill our customers at the time of sale of our solutions and recognize revenue either upon delivery or ratably over subsequent periods, and a portion of our revenue may be recognized over a period of more than 12 months. We believe that gross billings provides valuable insight into the sales of our solutions and the performance of our business. See “Selected Consolidated Financial and Other Data—Certain Key Non-GAAP Financial Metrics” for information regarding the limitations of using gross billings as a financial measure and for a reconciliation of gross billings to total revenue, the most directly comparable financial measure calculated in accordance with GAAP.
Non-GAAP Gross Profit and Gross Margin. We define non-GAAP gross profit as our total revenue less our total cost of revenue, adjusted to exclude stock-based compensation expense associated with equity awards granted to professional services and maintenance personnel, and amortization of acquired intangible assets. We define non-GAAP gross margin as non-GAAP gross profit as a percentage of our total revenue. Non-GAAP gross profit and gross margin are key measures used by our management to understand and evaluate our operating performance and trends. In particular, non-GAAP gross profit and gross margin exclude certain non-cash expenses and can provide useful measures for period-to-period comparisons of our business. See “Selected Consolidated Financial and Other
-11-
Table of Contents
Data—Certain Key Non-GAAP Financial Metrics” for information regarding the limitations of using non-GAAP gross profit and gross margin as financial measures and for a reconciliation of non-GAAP gross profit to gross profit, the most directly comparable financial measure calculated in accordance with GAAP.
Non-GAAP Operating Loss. We define non-GAAP operating loss as our operating loss excluding stock-based compensation and amortization of acquired intangibles assets. Our management uses non-GAAP operating loss to understand and evaluate our operating performance and trends. In particular, non-GAAP operating loss excludes certain non-cash expenses and can provide useful measures for period-to-period comparisons of our business. See “Selected Consolidated Financial and Other Data—Certain Key Non-GAAP Financial Metrics” for information regarding the limitations of using non-GAAP operating loss as a financial measure and for a reconciliation of non-GAAP operating loss to operating loss, the most directly comparable financial measure calculated in accordance with GAAP.
-12-
Table of Contents
Investing in our common stock involves a high degree of risk. You should carefully consider the risks and uncertainties described below, together with all of the other information contained in this prospectus, including our consolidated financial statements and the related notes thereto, before making a decision to invest in our common stock. Additional risks and uncertainties that we are unaware of, or that we currently believe are not material, may also become important factors that affect us. If any of the following risks occur, our business, financial condition, operating results and prospects could be materially and adversely affected. In that event, the price of our common stock could decline, and you could lose part or all of your investment.
Risks Related to Our Business and Industry
We have a history of losses, and we expect to incur losses for the foreseeable future.
We have incurred significant net losses in each year since our inception, including net losses of $8.3 million, $25.9 million and $60.8 million in fiscal 2012, 2013 and 2014, respectively, and $32.2 million and $26.8 million for the six months ended January 31, 2014 and 2015, respectively. As a result, we had an accumulated deficit of $145.9 million at July 31, 2014 and $172.7 million at January 31, 2015, and we expect to continue to incur net losses for the foreseeable future. Because the market for our software is rapidly evolving and has not yet reached widespread adoption, it is difficult for us to predict our future operating results. We expect our operating expenses to significantly increase over the next several years as we hire additional personnel, particularly in sales and marketing, expand and improve the effectiveness of our distribution channels, expand our operations and infrastructure, both domestically and internationally, and continue to develop our platform. In addition, as we grow and as we become a newly public company, we will incur additional significant legal, accounting and other expenses that we did not incur as a private company. If our revenue does not increase to offset these increases in our operating expenses, we will not be profitable in future periods. While historically, our total revenue has grown, not all components of our total revenue have grown consistently. Further, in future periods, our revenue growth could slow or our revenue could decline for a number of reasons, including slowing demand for our software, increasing competition, any failure to gain or retain channel partners, a decrease in the growth of our overall market, or our failure, for any reason, to continue to capitalize on growth opportunities. As a result, our past financial performance should not be considered indicative of our future performance. Any failure by us to sustain or increase profitability on a consistent basis could cause the value of our common stock to materially decline.
The market for our platform is new and unproven and may not grow or may decrease.
We were founded in 2004 and since our inception have been creating products for the developing and rapidly evolving market for API-based software platforms, a market that is largely unproven and is subject to a number of inherent risks and uncertainties. We believe that our future success will depend in large part on the growth, if any, in the market for software platforms that provide features and functionality to create and implement APIs to enable applications that interact with an enterprise’s backend databases and services, and provide visibility across the entire digital value chain from end-user interactions to backend systems to allow an enterprise to optimize operations and make data-driven business decisions. The utilization of API software and predictive analytics is still relatively new, and enterprises may not recognize the need for APIs and predictive analytics or, if they do, they may decide that they do not need a solution that offers the range of functionalities that we offer, or may decide to build such capabilities in-house. In order to grow our business and extend our market position, we intend to expand the functionality of our product and bring new technologies to market to increase market acceptance and use of our platform. It is difficult to predict customer adoption and renewal rates, customer demand for our solutions, the size and growth rate of the overall market that our platform addresses, the entry of competitive products or the success of existing competitive products. Any expansion of the market our platform addresses depends upon a number of factors, including the cost, performance and perceived value associated with such solutions. If the market our platform addresses does not achieve significant additional growth or there is a reduction in demand for such solutions caused by a lack of customer acceptance, technological challenges, competing technologies and products, decreases in corporate spending, weakening
-13-
Table of Contents
economic conditions, or otherwise, it could result in reduced revenue and customer orders, early terminations, and reduced renewal rates, any of which would adversely affect our business, results of operations, financial condition and growth prospects.
We have a short operating history for our recently released solutions, including the current version of our cloud-based solution and the current version of our predictive analytics solution, which makes it difficult to evaluate our future prospects and may increase the risk that we will not be successful.
We have a short operating history in selling our recently released solutions, including the current version of our cloud-based solution that we began offering at the end of 2012 and the current version of our predictive analytics solution, Apigee Insights, that we began offering in 2014, which limits our ability to forecast our future operating results and plan for and model future growth. We also have encountered and will continue to encounter risks and uncertainties frequently experienced by growing companies in developing industries. If our assumptions regarding these uncertainties, which we use to plan our business, are incorrect or if we do not address these risks successfully, our business, results of operations, financial condition and growth prospects could differ materially from our expectations and our business could suffer.
Additionally, we have limited experience with respect to determining the optimal prices for our solutions. If the market for our solutions begins to mature or as new competitors introduce new products or services that compete with our solutions, we may be unable to attract new customers based on the pricing model we have used historically. Moreover, large customers, which are the focus of our sales efforts, may demand greater price concessions. As a result, in the future we may be required to reduce our prices, which could adversely affect our revenue, gross margin, and other results of operations, financial condition and cash flows.
Moreover, although we have experienced strong growth historically, we may not continue to grow in the future. Any success that we may experience in the future will depend in large part on our ability to, among other things:
| • | maintain and expand our customer base and the ways in which our customers use our platform; |
| • | increase revenue from existing customers through increased or broader use of our platform within their organizations; |
| • | improve the performance and capabilities of our software through research and development; |
| • | successfully expand our business domestically and internationally; |
| • | successfully compete with other companies, open source initiatives and custom development efforts that are currently in, or may in the future enter, the markets for our software; |
| • | continue to invest in our platform to foster an ecosystem of developers and users to expand the use cases of our software; |
| • | continue to develop Apigee Edge, Apigee Insights and Apigee Developer; |
| • | generate leads and convert users of the trial version of our software to paying customers; |
| • | prevent users from circumventing the terms of their software licenses; |
| • | continue to enhance our website infrastructure to minimize interruptions or slower than expected download times when accessing our software from our website; |
| • | process, store and use our customers’ data in compliance with applicable governmental regulations and other legal obligations related to data privacy and security; and |
| • | hire, integrate and retain qualified talent. |
If we fail to address these risks and challenges and those described elsewhere in this “Risk Factors” section, our business will be adversely affected and our operating results will suffer.
-14-
Table of Contents
Because we currently derive substantially all of our revenue and cash flows from our Apigee Edge solution, failure of this solution to satisfy customer demands or to achieve increased market acceptance would materially and adversely affect our business, results of operations, financial condition and growth prospects.
We derive substantially all of our revenue and cash flows from our Apigee Edge solution. As such, the market acceptance of Apigee Edge is critical to our continued success. Demand for Apigee Edge is affected by a number of factors beyond our control, including continued market acceptance of our solutions by referenceable accounts for existing and new use cases, the timing of development and release of new products by our competitors and additional capabilities and functionality by us, technological change, and growth or contraction of the market in which we compete. In addition, similar to the situation encountered by traditional APIs, we cannot assure you that our Apigee Edge solution and future enhancements to our platform and solutions will be able to address future advances in technology or requirements of digital businesses. Moreover, our platform may not be able to scale and perform to meet increased requirements, including any associated with the proliferation of mobile apps and devices. We also lacked a clear migration path to transition existing customers under prior versions of our Apigee Edge solution (versions prior to August 2012), which has limited our ability to sell add-on purchases to these existing customers. We have experienced, and may continue to experience, decline in add-on purchases from customers using prior versions of our Apigee Edge solution. If we are unable to continue to meet customer demands or to achieve more widespread market acceptance of our software, our business, results of operations, financial condition and growth prospects will be materially and adversely affected.
If we are not able to introduce new products successfully and to make enhancements to existing products, our growth rates would likely decline and our business, results of operations and competitive position could suffer.
We invest substantial resources in researching and developing new products and enhancing existing products by incorporating additional features, improving functionality and adding other improvements to meet our customers’ evolving demands in our highly competitive industry. In order to be competitive, our platform must address an ever-increasing array of mobile apps, networked devices and back end databases, applications and systems, as well as keep pace with technological innovations in our industry and with our customers’ business requirements. For example, we are focused on enhancing the features and functionality of our platform to enhance its adaptability for the Internet of Things, or IoT. Since developing our platform is complex, the timetable for the release of enhancements is difficult to predict and we may not offer updates as rapidly as our customers require or expect. The success of enhancements to our platform and their market acceptance may depend upon the timing of introduction of these enhancements, and any failure in this regard may significantly impair our revenue growth. We also have invested, and expect in the future to continue to invest, in the acquisition of complementary products or services that expand the solutions that we can offer our customers and help us enter into new markets. We often make these investments without being certain that they will result in products or enhancements that our target markets will accept or that they will expand our share of those markets. The sizes of the markets currently addressed by our products are not certain, and our ability to grow our business in the future may depend upon our ability to introduce new solutions or enhance and improve our existing products for those markets or entry into new markets. Our growth would likely be adversely affected and we would not be able to extend our leadership position if we fail to introduce these new solutions or enhancements, fail to manage successfully the transition to new solutions from the products they are replacing or do not invest our development efforts in appropriate products or enhancements for significant new markets, or if these new products or enhancements do not attain market acceptance.
Our new solutions or enhancements could fail to attain market acceptance for many reasons, including:
| • | downtime or other lack of availability or performance of our cloud–based solution; |
| • | defects, errors or failures in our platform; |
| • | the inability of our platform to interoperate effectively with products from other vendors or to operate successfully when deployed within the networks of our customers; |
-15-
Table of Contents
| • | negative publicity about the performance or effectiveness of our new solutions or enhancements to our existing solutions; |
| • | the timeliness of the introduction and delivery of our solutions or enhancements; |
| • | our failure or inability to predict changes in our industry or customers’ requirements; |
| • | reluctance of customers to purchase products that include cloud-based solutions or incorporate elements of open source software; |
| • | failure of our channel partners to market, support or distribute our solutions; and |
| • | changes in government or industry standards and criteria. |
If we do not respond to the rapidly changing needs of our customers by timely developing and introducing new and effective solution features, upgrades and services that can respond adequately to their needs, our competitive position, business and growth prospects will be harmed.
We may not be able to compete successfully against current and future competitors.
We compete against in-house or custom IT development efforts, a variety of large software vendors and smaller specialized companies and open source initiatives, all of which vary in the breadth and scope of the products and services offered. The principal competitive factors in our markets include domain expertise in API business practices and technologies, size of customer base and level of user and developer adoption, established status as a strategic IT platform, brand awareness and reputation, total cost of ownership, ease of deployment and use of our solution by paying customers and developers, breadth and depth of offering, performance, availability and support for our solution, capability for configurability, integration, security, scalability and reliability of applications, and the ability to innovate and respond to customer needs rapidly. Beyond in-house or custom IT development efforts, our competitors include, among others, International Business Machines Corporation and Oracle Corporation, both of which can bundle competing products and services with other software offerings, or offer them at a low price as part of a larger sale. Some of our actual and potential competitors have certain additional advantages over us, such as:
| • | significantly greater financial, technical, marketing, research and development or other resources; |
| • | stronger brand and business user recognition; |
| • | larger installed customer bases; |
| • | larger intellectual property portfolios; and |
| • | broader global distribution and presence. |
Our industry is evolving rapidly and is becoming increasingly competitive, and we expect further increased competition if our market continues to expand. Larger and more established companies may focus on API management and API-based platforms and could directly compete with us. Smaller companies could also launch new products and services that we do not offer and that could gain market acceptance quickly. Conditions in our market could change rapidly and significantly as a result of technological advancements, open source initiatives or other factors.
In recent years, there have been significant acquisitions and consolidation by and among our competitors. Consolidation in our industry may allow our competitors to take advantage of the greater resources of the larger organization or may increase the likelihood of our competitors offering bundled or integrated products with which we cannot effectively compete. As a result of these acquisitions, competitors might take advantage of the greater resources of the larger organization to compete more vigorously or broadly with us. If we are unable to differentiate our product from the integrated or bundled products of our competitors, such as by offering enhanced functionality or performance, we may see decreased demand for those solutions, which would
-16-
Table of Contents
adversely affect our business, operations, financial results and growth prospects. Further, it is possible that continued industry consolidation may impact customers’ perceptions of the viability of smaller or even medium-sized software firms and consequently their willingness to use software solutions from such firms. Similarly, if customers seek to concentrate their software license purchases in the product portfolios of a few large providers, we may be at a competitive disadvantage regardless of the performance and features of our software. We believe that to remain competitive at the large enterprise level, we may need to develop and expand relationships with resellers and large system integrators that provide a broad range of products and services. If we are unable to compete effectively, our business, results of operations, financial condition and growth prospects could be materially and adversely affected.
Our future quarterly results may fluctuate significantly, which could adversely affect our share price.
Our results of operations, including the levels of our revenue, cost of revenue, gross margin, operating expenses, cash flow and deferred revenue, have fluctuated from quarter to quarter in the past and may continue to vary significantly in the future so that period-to-period comparisons of our operating results may not be meaningful. Accordingly, our financial results in any one quarter should not be relied upon as indicative of future performance. Our quarterly financial results may fluctuate as a result of a variety of factors, many of which are outside of our control, may be difficult to predict, and may or may not fully reflect the underlying performance of our business. Because the timing and amount of our revenue is difficult to forecast and because our operating costs and expenses are relatively fixed in the short term, if our revenue does not meet our expectations, we are unlikely to be able to adjust our spending to levels commensurate with our revenue. As a result, the effect of revenue shortfalls on our results of operations may be more accentuated, and these and other fluctuations in quarterly results may negatively affect the market price of our common stock. Among the factors that may cause fluctuations in our quarterly financial results are those listed below:
| • | our ability to attract and retain new customers; |
| • | the addition or loss of large customers; |
| • | our ability to successfully expand our business domestically and internationally; |
| • | our ability to gain new channel partners and retain existing channel partners; |
| • | fluctuations in the growth rate of the overall market that our solutions address; |
| • | fluctuations in the mix of our revenue; |
| • | the unpredictability of the timing of our receipt of orders for perpetual licenses, the revenue for which we typically recognize upfront; |
| • | the amount and timing of operating expenses related to the maintenance and expansion of our business and operations, including continued investments in sales and marketing, research and development and general and administrative resources; |
| • | network outages or performance degradation of our cloud service; |
| • | information security breaches; |
| • | general economic, industry and market conditions; |
| • | customer renewal rates; |
| • | increases or decreases in the number of elements of our services or pricing changes upon any renewals of customer agreements; |
| • | changes in our pricing policies or those of our competitors; |
| • | the budgeting cycles and purchasing practices of customers; |
| • | decisions by potential customers to purchase alternative solutions from larger, more established vendors, including from their primary software vendors; |
-17-
Table of Contents
| • | decisions by potential customers to develop in-house solutions as alternatives to our platform; |
| • | insolvency or credit difficulties confronting our customers, which could adversely affect their ability to purchase or pay for our software and services; |
| • | delays in our ability to fulfill our customers’ orders; |
| • | seasonal variations in sales of our solutions; |
| • | the cost and potential outcomes of future litigation or other disputes; |
| • | future accounting pronouncements or changes in our accounting policies; |
| • | our overall effective tax rate, including impacts caused by any reorganization in our corporate tax structure and any new legislation or regulatory developments; |
| • | fluctuations in stock-based compensation expense; |
| • | fluctuations in foreign currency exchange rates; |
| • | the timing and success of new products and service introductions by us or our competitors or any other change in the competitive dynamics of our industry, including consolidation among competitors, customers or strategic partners; |
| • | the timing of expenses related to the development or acquisition of technologies or businesses and potential future charges for impairment of goodwill from acquired companies; and |
| • | other risk factors described in this prospectus. |
We expect our revenue mix to vary over time, which can affect our gross margin and operating results.
We expect our revenue mix to vary over time due to a number of factors, including the mix of perpetual licenses, time-based licenses, subscriptions and professional services. In addition, third-party hosting infrastructure costs associated with customer adoption of our cloud-based solution can vary over time. Our gross margins and operating results can be affected by such changes in revenue mix and costs, together with numerous other factors including:
| • | entry into new markets or growth in lower margin markets; |
| • | entry into markets with different pricing and cost structures; |
| • | pricing discounts; |
| • | increased price competition; |
| • | changes in distribution channels; and |
| • | how well we execute our strategy and operating plans. |
Reliance on orders, especially for perpetual licenses, at the end of a fiscal quarter could cause our revenue to vary from period to period or to fall below expected levels for a given period.
As a result of customer buying behavior and the efforts of our sales force and channel partners to meet or exceed their sales objectives, we have historically received and generated a substantial portion of bookings and generated a significant portion of our quarterly revenue related to perpetual licenses during the last month of each quarter. The unpredictability of the timing of customer licenses—particularly for perpetual licenses, the revenue for which we typically recognize upfront—and subscriptions could cause our revenue to vary from period to period or to fall below expected levels for a given period, which would adversely affect our business, financial condition, and results of operations, and result in a decline in the market price of our common stock.
-18-
Table of Contents
Our business and growth depend on our ability to obtain subscription and maintenance renewals from existing customers. Nonrenewals and subscription downgrades could adversely affect our future operating results.
We primarily sell our platform on a yearly subscription basis, either deployed in the cloud or on premises. At the end of the term of these subscriptions, customers can renew their existing subscriptions, upgrade their subscriptions, downgrade their subscriptions or not renew. In recent periods, a lesser portion of our total revenue has been derived from annual maintenance and support associated with perpetual licenses. During the six months ended January 31, 2015, our subscription and time-based licenses that were eligible for renewal were renewed at a dollar-based renewal rate of approximately 85%. We calculate dollar-based renewal rate based on the dollar value of renewed contracts divided by the dollar value of expiring contracts at any given period. However, due to limited historical data with respect to rates of subscription renewals by our customers, particularly for our cloud-based solution, we cannot accurately predict customer dollar-based renewal rates. The dollar-based renewal rate for the six months ended January 31, 2015, is not necessarily indicative of our dollar-based renewal rate for the full year or any future period. Our customers’ renewal rates may decline or fluctuate as a result of a number of factors, including customer dissatisfaction with our pricing or our products’ functionality, features or performance, competitors’ product offerings or in-house developed solutions, customers’ ability to continue their operations and spending levels, migration path issues for new versions of products (which we have experienced before) and other factors, a number of which are beyond our control. Our customers have no obligation to renew their subscriptions after the expiration of the initial term, and they may elect not to renew their subscriptions or to reduce the product quantity under their subscriptions or maintenance and support contracts, thereby reducing our future revenue. If our customers do not renew their subscriptions for our products on similar pricing terms, our revenue may decline and our business, results of operations and growth prospects could suffer. In addition, if the average term of our contracts were to decrease, this may afford us less visibility into our future financial performance.
We recognize a majority of our revenue over the term of our customer contracts. Consequently, downturns or upturns in new sales may not be immediately reflected in our operating results and may be difficult to discern.
We recognize a majority of our revenue ratably over the term, typically one year, of customer subscriptions for our cloud-based solution and on-premises time-based licenses. As a result, a portion of our total revenue in each quarter is derived from the recognition of deferred revenue relating to subscriptions and time-based licenses and maintenance and support contracts entered into during prior periods. Consequently, a decline in new or renewed subscriptions or time-based licenses in any single quarter may have a small impact on our revenue for that quarter. However, such a decline will negatively affect our revenue in future quarters. Accordingly, the effect of significant downturns in sales and market acceptance of our platform and potential changes in our rate of customer expansion or retention or in our pricing policies will not be fully reflected in our results of operations in a single quarter but only over several quarters. In addition, a significant majority of our operating costs are expensed as incurred, while a majority of our revenue is recognized over the term of our agreements with our customers. As a result, continued growth in the number of our customers may not result in increases in our revenue that offset increases in our operating costs and expenses. Our subscription model also makes it difficult for us to rapidly increase our revenue through additional sales in any period, as revenue from new customers is generally recognized ratably over the applicable term of our agreements.
We may require additional capital to support our business, and this capital might not be available on acceptable terms, if at all.
We intend to continue to make investments to support our business and may require additional funds, in particular as we seek to grow our business, including the need to develop new features or enhance our software, improve our operating infrastructure or acquire complementary businesses and technologies. Accordingly, we may need to engage in equity or debt financings to secure additional funds. If we raise additional funds through future issuances of equity or convertible debt securities, our existing stockholders could suffer significant dilution, and any new equity securities we issue could have rights, preferences and privileges superior to those of holders of our common stock. Any debt financing that we may secure in the future could involve restrictive
-19-
Table of Contents
covenants relating to our capital raising activities and other financial and operational matters, which may make it more difficult for us to obtain additional capital and to pursue business opportunities, including potential acquisitions. We may not be able to obtain additional financing on terms favorable to us, if at all. If we are unable to obtain adequate financing or financing on terms satisfactory to us when we require it, our ability to continue to support our business growth, scale our infrastructure, develop product enhancements and to respond to business challenges could be significantly impaired, and our business may be adversely affected.
To the extent that we are unable to timely recognize revenue from the provision of professional services to our customers or to develop additional channel partner relationships to deliver professional services for our solutions, we will continue to have a substantial portion of our revenue mix derived from our provision of such services which carry lower gross margins than our other revenue sources.
We generally offer professional services associated with implementing our solutions, and we recognize revenue from professional services primarily on a time and materials basis as services are delivered. Costs associated with maintaining a professional services department is fixed while professional services revenue is dependent on the amount of work actually billed to customers in a period, the combination of which may result in variability in our gross profit. In addition, the timing of the recognition of professional services revenue is dependent on several factors outside our control. If a customer deploys our solutions and utilizes our services more slowly than we expect, we may not be able to recognize the related revenue as quickly as we anticipated, which may adversely affecting our gross profit and other results of operations. We rely, in part, on our channel partners for professional services associated with implementing our solutions and we plan to continue to expand our channel relationships that provide these professional services to supplement our own resources and, to the extent that we are unable to adequately grow these channel partner relationships, we will continue to have a substantial portion of our revenue mix derived from our provision of such services which carry lower gross margins than our other revenue sources.
The seasonality of our business can create significant variance in our quarterly bookings, license revenue and cash flows from operations.
We operate on a July 31 fiscal year end and believe that there are significant seasonal factors which may cause us to experience lower levels of revenue in our first fiscal quarter ending October 31 and higher levels of revenue in our second fiscal quarter ending January 31 as compared with other quarters. We believe that this seasonality results from a number of factors, including:
| • | slower enterprise buying patterns during the late summer months, both domestically and overseas, including from our telecommunications customers, as well as government customer procurement, budget and deployment cycles, and the timing of our training for our entire sales force, each of which impacts our revenue in our first fiscal quarter; and |
| • | larger customers with a December 31 fiscal year end choosing to spend remaining budgets shortly before their year end, which impacts our revenue in our second fiscal quarter. |
We believe that these seasonal trends have been moderated in recent periods due to our growth, but we anticipate that they may be more pronounced in fiscal 2015 and in future periods.
If we are unable to attract and retain key personnel, our business could be adversely affected.
We depend on the continued contributions of our senior management and other key personnel, the loss of whom could adversely affect our business. All of our executive officers and key employees are at-will employees, which means they may terminate their employment relationship with us at any time. We do not maintain a key-person life insurance policy on any of our officers or other employees.
Our future success also depends in large part on our ability to identify, attract and retain highly skilled technical, managerial, finance and other personnel, particularly in our sales and marketing, research and development, general and administrative, and professional service departments. We face intense competition for qualified individuals from
-20-
Table of Contents
numerous software and other technology companies. In addition, competition for qualified personnel, particularly software engineers, is particularly intense in the San Francisco Bay Area, where our headquarters are located. We may incur significant costs to attract and retain them, and we may lose new employees to our competitors or other technology companies before we realize the benefit of our investment in recruiting and training them. As we move into new geographies, we will need to attract and recruit skilled personnel in those areas. If we are unable to attract and retain suitably qualified individuals who are capable of meeting our growing technical, operational and managerial requirements, on a timely basis or at all, our business will be adversely affected.
Volatility or lack of appreciation in our stock price may also affect our ability to attract and retain our key employees. Many of our senior management personnel and other key employees have become, or will soon become, vested in a substantial amount of stock or stock options. Employees may be more likely to leave us if the shares they own or the shares underlying their vested options have significantly appreciated in value relative to the original purchase prices of the shares or the exercise prices of the options, or, conversely, if the exercise prices of the options that they hold are significantly above the market price of our common stock. If we are unable to retain our employees, or if we need to increase our compensation expenses to retain our employees, our business, results of operations, financial condition and cash flows would be adversely affected.
If we do not effectively train and expand our sales force, we may be unable to add new customers or increase sales to our existing customers and our business will be adversely affected.
Currently, we sell our solutions primarily through our direct sales force. Our ability to increase our sales to both new and existing customers is in part dependent on our ability to continue to train and expand our sales force, which from July 31, 2012 to July 31, 2014, grew nearly 300%. There is significant competition for sales personnel with the skills and technical knowledge that we require. Moreover, newly hired sales personnel require substantial training and typically take a significant amount of time before they achieve full productivity. Our recent hires and planned hires may not become productive as quickly as we expect, and we may be unable to hire or retain sufficient numbers of qualified individuals in the markets where we do business or plan to do business. In addition, as we continue to grow, a large percentage of our sales force can be expected to be new to the company and our platform. Identifying, recruiting and effectively training sufficient sales personnel to support our growth requires significant time, expenses and management and other resources. If we are unable to hire, develop and retain sales personnel or if our new direct sales personnel are unable to achieve expected sales productivity levels in a reasonable period of time or at all, we may not be able to increase our revenue and grow our business, which would adversely affect our results of operations.
If we fail to manage our growth effectively, our business, operating results and financial condition would be adversely affected.
In recent periods, we have been adding personnel and other resources as we focus on growing our business, entering new geographic markets and increasing our market share, and we expect to incur significant additional expenses in further expanding our personnel, particularly in sales and marketing and our international operations in order to grow our business, operations and customer base, and we intend to continue to make significant additional investments in these areas. The number of our full-time employees was 241 as of July 31, 2012, 352 as of July 31, 2013, 437 as of July 31, 2014 and 396 as of February 15, 2015. The return on these investments in terms of increases in revenue, operating margin and number of customers may be lower, or may be realized more slowly, than we expect. If we do not achieve the benefits anticipated from our investments, or if the achievement of these benefits is delayed, our business, results of operations and financial condition would be adversely affected.
In addition, our growth has placed, and is expected to continue to place, a significant strain on our managerial, administrative, operational, financial and other resources. To effectively manage growth, we must continue to improve our operational, financial and management controls, and our reporting systems and procedures.
-21-
Table of Contents
If we are not able to maintain and enhance our brand and increase market awareness of our company and solutions, our business and operating results may be adversely affected.
We believe that maintaining and enhancing the “Apigee” brand identity and increasing market awareness of our company and solutions is critical to achieving widespread acceptance of our platform, to our relationships with our customers and channel partners and to our ability to attract new customers and channel partners. The successful promotion of our brand will depend largely upon our marketing efforts, our ability to continue to offer high-quality software, our ability to be thought leaders in API-based software platforms and our ability to successfully differentiate our platform from those of our competitors. Our thought leadership and brand promotion activities may not be successful or yield increased revenue. In addition, independent industry analysts often provide reviews of our products, as well as those of our competitors, and perception of our product in the marketplace may be significantly influenced by these reviews. If these reviews are negative, or less positive as compared to those of our competitors’ products and services, our brand may be adversely affected.
In addition, the promotion of our brand requires us to make substantial expenditures, and we anticipate that the expenditures will increase as our market becomes more competitive, as we expand into new markets and as more sales are generated through our channel partners. To the extent that these activities yield increased revenue, this revenue may not offset the increased expenses we incur. If we do not successfully maintain and enhance our brand, our business may not grow, we may have reduced pricing power relative to competitors with stronger brands, and we may lose customers and channel partners, all of which would adversely affect our business, results of operations, and financial condition.
Our growth depends in part on the success of our strategic relationships with third parties, which relationships are at an early stage of development.
In order to grow our business, we anticipate that we will continue to depend on relationships with third parties, such as Accenture LLP and SAP AG, to resell and co-sell and provide services related to our platform. Our relationships with these partners are at an early stage of development, we have generated very limited revenue through these relationships to date, and we cannot assure you that these partners will be successful in marketing and selling our platform or solutions based upon our platform. Identifying partners such as these, negotiating and supporting relationships with them and maintaining relationships requires significant commitment of time and resources that may not yield a significant return on our investment in these relationships. Our channel partners are not required to exclusively market or sell our solutions in our target markets and have only limited commitments to dedicate resources to the marketing and promoting our solutions. In addition, our competitors may be more effective in providing incentives to our strategic partners or prospective partners to favor their products or services over our solutions. If we are unsuccessful in establishing or maintaining our relationships with strategic partners, or if these partners are unsuccessful in marketing or selling our solutions, or are unable or unwilling to devote sufficient resources to these activities, our ability to compete in the marketplace or to grow our revenue could be impaired and our operating results may suffer.
Our sales cycles can be long and unpredictable, and our sales efforts require considerable time and expense. As a result, our sales and revenue are difficult to predict and may vary substantially from period to period.
The timing of our sales and related revenue recognition is difficult to predict because of the length and unpredictability of the sales cycle for our platform. We are often required to spend time and resources to better familiarize potential customers with the value proposition of API software generally. Customers often view the purchase of our products as a significant and strategic decision and, as a result, frequently require considerable time to evaluate, test and qualify our products prior to making a purchase decision and placing an order. A number of factors influence the length and variability of our sales cycles, including, for example:
| • | the need to educate potential customers about the uses and benefits of our platform; |
| • | the discretionary nature of potential customers’ purchasing and budget cycles and decisions; |
-22-
Table of Contents
| • | the competitive nature of potential customers’ evaluation and purchasing approval processes; and |
| • | the availability of in-house solutions, either currently or through addition internal development, to our potential and current customers. |
The amount of time that customers devote to their evaluation, contract negotiation and budgeting processes varies significantly. The length of the sales cycle for our platform averages approximately seven months, but specific transactions can be significantly longer. During the sales cycle, we expend significant time and money on sales and marketing and contract negotiation activities, which may not result in a sale. For all of these reasons, it is difficult to predict whether and when a sale will be completed, and when revenue from a sale will be recognized or begin to be recognized. If our sales cycles lengthen, our revenue could be lower than expected, which would have an adverse effect on our business, results of operations and financial condition.
We rely upon Amazon Web Services to operate certain aspects of our service and any disruption of or interference with our use of Amazon Web Services would impact our operations and our business would be adversely impacted.
Amazon Web Services, or AWS, provides a distributed computing infrastructure platform for business operations, or what is commonly referred to as a cloud computing service. We have architected our software and computer systems so as to utilize data processing, storage capabilities and other services provided by AWS. Currently, the vast majority of our cloud service infrastructure is run on AWS. Given this, along with the fact that we cannot easily switch our AWS operations to another cloud provider, any disruption of or interference with our use of AWS would impact our operations and our business would be adversely impacted.
If we fail to adequately maintain cloud-based infrastructure capacity through third parties, our existing customers may experience service outages, and our new customers may experience delays in the deployment of our platform.
Customers of our cloud-based solution need to be able to access our platform 24 hours a day, seven days a week, without interruption or degradation of performance. We outsource all of our data centers to third parties, including AWS. The number of API calls trafficked through our platform is increasing substantially. An API call is a request for data or services from within an application, made through an API, to another application or system. Although we expend considerable effort to ensure that our platform performance is able to handle existing and anticipated traffic levels, we are dependent upon third parties in order to meet these uptime and performance requirements of our customers and we may not be able to maintain the level of uptime and performance required by our customers, especially to cover peak levels or spikes in the number of API calls trafficked through our platform. The provisioning of new cloud hosting capacity and data center infrastructure requires lead time. If we do not accurately predict our infrastructure capacity requirements with sufficient lead time, our customers could experience service shortfalls.
We do not control the operation of the third-party infrastructure on which our cloud service is deployed and we are therefore vulnerable to any information security breaches, power outages or other issues the data center may experience. We have in the past experienced, and expect that we will in the future experience, interruptions, delays and outages in service and availability from time to time due to a variety of factors, including infrastructure changes, human or software errors, website or third-party hosting disruptions or capacity constraints due to a number of potential causes including technical failures, natural disasters or fraud or security attacks. For example, in the fall of 2014, we were unable to process all of the API calls for one of our customers due to initial capacity constraints in connection with a spike in the number of API calls for this customer. As a result, this customer experienced a momentary outage in service and availability, and during a period of less than two hours the performance of our platform was degraded for this customer while we provisioned additional capacity for this customer. We assessed the impact of the outage and determined that it did not have a material impact on our business or operating results. If our security, or that of our third-party infrastructure providers, is compromised, our
-23-
Table of Contents
platform is unavailable or our users are unable to deploy our solutions within a reasonable amount of time or at all, our business could be negatively affected. In some instances, we may not be able to identify the cause or causes of these performance problems within an acceptable period of time. It may become increasingly difficult to maintain and improve our platform performance, especially during peak usage times and as our software becomes more complex and the number of API calls trafficked through our platform increases. To the extent that we do not effectively address capacity constraints, upgrade third-party infrastructure as needed and continually develop our technology and network architecture to accommodate actual and anticipated changes in technology, our business and results of operations may be adversely affected. In addition, any changes in service levels from our cloud infrastructure provider may adversely affect our ability to meet our customers’ requirements.
Any of the above circumstances or events may harm our reputation, cause customers to terminate their agreements with us, impair our ability to obtain subscription and maintenance renewals from existing customers, impair our ability to grow our customer base, subject us to financial penalties and liabilities under our service level agreements, and otherwise harm our business, results of operations and financial condition.
Breaches of our networks or systems, or those of our third-party cloud infrastructure providers, could degrade our ability to conduct our business operations, delay our ability to recognize revenue, compromise the integrity of our solutions and products, result in significant data losses and the theft of our intellectual property, damage our reputation, expose us to liability to third parties and require us to incur significant additional costs to maintain the security of our networks and data.
We increasingly depend upon our IT systems to conduct virtually all of our business operations, ranging from our internal operations and product development activities to our marketing and sales efforts and communications with our customers and business partners. Computer programmers or other individuals or entities may attempt to penetrate our network security, or that of our platform, including both customer deployments and our third-party cloud infrastructure, and to cause adverse effects on our business operations, including by misappropriating our proprietary information or that of our customers, employees and business partners or to cause interruptions of our service. Because the techniques used by such individuals or entities to access, disrupt or sabotage computing devices, systems and networks change frequently and may not be recognized until launched against a target, we may be unable to anticipate these techniques, and we may not become timely aware of such a security breach which could exacerbate any damage we experience. Any data security incidents, unauthorized access, unauthorized usage, virus or similar breach or disruption of us or of third-party infrastructure provider could result in loss of confidential information, damage to our reputation, early termination of our contracts, litigation, regulatory investigations, fines, penalties and other liabilities. Additionally, we depend upon our employees and contractors to appropriately handle confidential and sensitive data and to deploy our IT resources in safe and secure fashion that does not expose our network systems to security breaches or the loss of data. Accordingly, if our cybersecurity defenses and those of our contractors, including our third-party infrastructure providers, fail to protect against unauthorized access, attacks (which may include sophisticated cyberattacks) and the mishandling of data by our employees and contractors, our ability to conduct our business effectively could be damaged in a number of ways, including:
| • | sensitive data regarding our business, including intellectual property and other proprietary data, could be stolen or compromised; |
| • | sensitive customer data running through our cloud-based solution or through on-premises customer deployments could be stolen or compromised; |
| • | our electronic communications systems, including email and other methods, could be disrupted, and our ability to conduct our business operations could be seriously impeded until such systems can be restored; |
| • | our ability to process customer orders, electronically deliver solutions and services and perform our contractual obligations could be degraded, and our distribution channels could be disrupted, resulting in delays in revenue recognition; |
-24-
Table of Contents
| • | defects and security vulnerabilities could be introduced into our software, thereby damaging the reputation and perceived reliability and security of our solutions and potentially making the data systems of our customers vulnerable to further data loss and cyberincidents; and |
| • | personally identifiable data of our customers, employees and business partners could be stolen or compromised. |
If our security measures or those of our third-party infrastructure providers are breached as a result of third-party action, employee error, malfeasance or otherwise and, as a result, someone obtains unauthorized access to or engages in unauthorized use of customer data, our reputation may be damaged, our business may suffer and we could incur significant liability. Also, the regulatory and contractual actions, litigation, investigations, fines, penalties and liabilities relating to any such incidents can be significant in terms of the dedication of management and financial resources, reputational impact and may necessitate changes to our business operations that may be disruptive to us. Additionally, we could incur significant costs, both in terms of monetary expense and in management and technical attention, in order to upgrade our information security systems and methods and remediate damages. Consequently, our financial performance and results of operations could be adversely affected.
Our international sales and operations subject us to additional risks that can adversely affect our operating results and financial condition.
In fiscal 2013 and fiscal 2014, respectively, we derived approximately 16% and 33% of our total revenue from customers located outside the United States. In the six months ended January 31, 2014 and 2015, respectively, we derived approximately 33% and 38% of our total revenue from customers located outside the United States, and we are continuing to expand our international operations as part of our growth strategy. Sales to our customers in foreign countries have typically been denominated in U.S. dollars. Fluctuations in currency exchange rates could cause our products to become relatively more expensive to end customers in a particular country, leading to a reduction in sales in that country. We are also exposed to movements in foreign currency exchange rates since the operating expenses we incur for our operations and personnel outside the United States are denominated in local currencies. We have research and development personnel in India and the United Kingdom, engage contractors in various international locations, and have testing and support personnel in the United States, India and the United Kingdom, and we may expand our offshore development efforts. In addition, we have sales and support personnel in numerous countries worldwide and expect to continue to substantially expand our overseas headcount. Our international operations subject us to a variety of additional risks, including:
| • | the difficulty of managing and staffing international offices and the increased travel, infrastructure and legal compliance costs associated with numerous international locations; |
| • | reduced demand for technology products outside the United States; |
| • | difficulties in enforcing contracts and collecting accounts receivable, and longer payment cycles, especially in emerging markets; |
| • | demanding data protection standards in certain jurisdictions that can interrupt or delay the transfer and processing of personal data; |
| • | tariffs and trade barriers, import requirements, export control and trade sanctions regulations and other regulatory or contractual limitations on our ability to sell or develop our products in certain foreign markets; |
| • | heightened exposure to political instability, war and terrorism; |
| • | added legal compliance obligations and complexity; |
| • | reduced protection for intellectual property rights in some countries; |
| • | multiple conflicting tax laws and regulations; |
| • | lack of familiarity and burdens of complying with foreign laws, accounting and legal standards, regulatory requirements, tariffs, and other barriers; |
-25-
Table of Contents
| • | compliance with laws and regulations applicable to domestic and international operations, including the United States Foreign Corrupt Practices Act of 1977, as amended, or FCPA, the United Kingdom Bribery Act of 2010, or Bribery Act, privacy and data protection laws and regulations, import and export control laws, tariffs, trade barriers, economic sanctions and other regulatory or contractual limitations on our ability to sell our software in certain foreign markets, and the risks and costs of non-compliance; |
| • | heightened risks of unfair or corrupt business practices in certain geographies and of improper or fraudulent sales arrangements that may impact financial results and result in restatements of financial statements and irregularities in financial statements; |
| • | difficulties in adapting to differing technology standards; |
| • | the need to localize our products for international end customers and our lack of experience in connection with the localization of our solutions, including translation into foreign languages and adaptation for local practices and regulatory requirements; and |
| • | complexities and increased costs in retaining and terminating employees in some countries. |
As noted above, we are subject to the FCPA and the Bribery Act in certain cases. We are also subject to the U.S. domestic bribery statute contained in 18 U.S.C. § 201, the U.S. Travel Act, the USA PATRIOT Act, and possibly other anti-bribery and anti-money laundering laws and regulations in countries in which we conduct activities. Failure to comply with these laws and regulations could cause delays in revenue recognition and financial reporting misstatements, and subject us to other serious adverse consequences discussed below. Anti-corruption and anti-bribery laws such as the FCPA and Bribery Act generally prohibit companies and their employees and third-party intermediaries from making corrupt payments to government officials or private parties for the purpose of obtaining or keeping business, permits or other regulatory approvals, securing an advantage, or directing business to another. These laws also require companies to maintain accurate books and records and a system of internal accounting controls. We plan to increase our international sales and business and engage with an increasing number of business partners and other third-party intermediaries to conduct our business and sell our products and services abroad. We, our business partners, or our third-party intermediaries may have direct or indirect interactions with officials and employees of government agencies or state-owned or affiliated entities. Under the FCPA, the company may be held liable for the corrupt actions taken by directors, officers, employees, agents, or other strategic or local partners or representatives. Similarly, under the Bribery Act, we may be held strictly liable for the corrupt acts of any person associated with us. As such, if we or our intermediaries fail to comply with the requirements of the FCPA, the Bribery Act or similar legislation, we could be subject to whistleblower complaints, investigations, sanctions, settlements, prosecution, other enforcement actions, significant criminal fines, civil penalties, tax penalties, disgorgement, and other remedial measures, suspension or debarment from contracting with certain governments or other persons, the loss of export privileges, reputational harm, adverse media coverage, civil litigation, and other collateral consequences. In addition, responding to any allegation or action will likely result in a materially significant diversion of management’s attention and resources and investigation, compliance, and defense costs and other professional fees, and could result in a material adverse effect on our business, prospects, financial condition, or results of operations. We also face the risk of multijurisdictional liability for the same act. This is due to the fact that many countries have broad laws and regulations in place which overlap with the laws and regulations of other countries.
As we continue to expand our business globally, our success will depend, in large part, on our ability to anticipate and manage effectively these and other risks associated with our international operations. In addition, compliance with laws and regulations applicable to our international operations increases our cost of doing business in foreign jurisdictions. We may be unable to keep current with changes in government requirements as they change from time to time. Failure to comply with these regulations could have adverse effects on our business. Although we will implement policies and procedures designed to ensure compliance with these laws and policies, we cannot assure you that all of our employees, contractors, channel partners and agents will comply with these laws and policies.
-26-
Table of Contents
Our ability to sell our products is highly dependent on the quality of our software, support and services offerings, and our failure to offer high-quality software, support and services could have a material and adverse effect on our business and results of operations.
Once our platform is deployed for our customers, those customers depend on our support organization and those of our channel partners to resolve any issues relating to our platform. Customers using our cloud-based solution are similarly dependent upon our ability to resolve these platform issues. Because our software is complex, undetected errors, failures or bugs may occur. Our platform may be installed and used in large-scale computing environments with different operating systems, system management software and equipment and networking configurations, which may cause errors or failures of our software or other aspects of the computing environment into which it is deployed. Despite testing by us, errors, failures or bugs may not be found in enhancements to our platform until they are used by our customers. In the past, we have discovered software errors, failures and bugs in our platform. Real or perceived errors, failures or bugs in our software could result in negative publicity, loss of or delay in market acceptance of our software, loss of competitive position, claims by customers for losses sustained by them or, in the case of our cloud-based solution, failure to meet the stated service level commitments in our customer agreements. In such an event, we may be required, or may choose, for customer relations or other reasons, to expend significant additional resources in order to help correct the problem.
High-quality software, support and services are critical for the successful marketing and sale of our products. If we or our channel partners do not devote sufficient resources or are otherwise unsuccessful in assisting our customers in deploying our products effectively, succeed in helping our customers resolve post-deployment issues quickly, or provide ongoing support, it could adversely affect our ability to sell our products to existing end customers and could harm our reputation with potential customers. In addition, as we expand our operations internationally, our support organization will face additional challenges, including those associated with delivering support, training and documentation in languages other than English. Our failure or the failure of our channel partners to maintain high-quality software, support and services could have an adverse effect on our business, results of operations and financial condition.
Incorrect implementation or use of our software could result in customer dissatisfaction and negatively affect our business, operations, financial results and growth prospects.
Our platform is designed to be operated in a “self-service” manner by our customers who subscribe to our cloud-based solution. In addition, our platform may be deployed in large scale, complex technology environments of our customers. Our customers and channel partners require training and experience in the proper use of and the variety of benefits that can be derived from our platform to maximize its potential. If our software is not implemented or used correctly or as intended, inadequate performance or security vulnerabilities may result. Because our customers rely on our software to manage a wide range of operations, the incorrect implementation or use of our software, our failure to train customers on how to productively use our software may result in customer dissatisfaction, negative publicity and adversely affect our reputation and brand. Failure by us to provide these training and implementation services to our customers would result in lost opportunities for follow-on sales to these customers and adoption of our platform by new customers, and adversely affect our business and growth prospects.
In cases where our platform has been deployed on premises within a customer’s environment, if we or our customers are unable to configure or implement our software properly, or unable to do so in a timely manner, customer perceptions of our platform may be impaired, our reputation and brand may suffer, and customers may choose not to increase their use of our software or to discontinue its use. In addition, our on-premises solution imposes server load and data storage requirements for implementation. If our customers do not have the server load capacity or the storage capacity required, they may not be able to effectively implement and use our software and, therefore, may not choose to increase their use of our software or to discontinue its use.
-27-
Table of Contents
We typically provide service level commitments of up to 99.99% under our customer contracts. If we fail to meet these contractual commitments, we could be obligated to provide credits or refunds for prepaid amounts related to unused subscription services or face contract terminations, which could adversely affect our business, results of operations and financial condition.
Subscriptions for our cloud-based solution typically provide our customers with service level commitments on a monthly basis. If we are unable to meet the stated service level commitments to our customers or suffer extended periods of unavailability of our cloud-based solution, we may be contractually obligated to provide these customers with service credits, refunds for prepaid amounts related to unused subscription services, and could face contract terminations. As a result, our revenue, other operating results and financial condition could be adversely affected if we suffer unscheduled downtime that exceeds the service level commitments under our agreements with our customers, and any extended service outages could adversely affect our business and reputation.
Our reliance on Software-as-a-Service technologies from third parties may adversely affect our business and operating results.
We rely heavily on hosted Software-as-a-Service, technologies from third parties in order to operate critical functions of our business, including enterprise resource planning services from NetSuite and customer relationship management services from salesforce.com. If these services become unavailable due to extended outages, interruptions or because they are no longer available on commercially reasonable terms or prices, our expenses could increase, our ability to manage our finances could be interrupted and our processes for managing sales of our software and supporting our customers could be impaired until equivalent services, if available, are identified, obtained and implemented, all of which could adversely affect our business.
We could incur substantial costs in protecting or defending our intellectual property rights, and any failure to protect our intellectual property could impair our business.
Our success depends, in part, on our ability to protect proprietary methods and technologies that we develop under patent and other intellectual property laws of the United States and foreign jurisdictions so that we can prevent others from using our inventions and proprietary information. We have only been issued nine U.S. patents to date and have been issued no foreign patents and there can be no assurance that additional patents will be issued or that any patents that have been issued or that may be issued in the future will provide significant protection for our intellectual property. If we fail to protect our intellectual property rights adequately, our competitors might gain access to our technology and our business might be harmed. There is no assurance that the particular forms of intellectual property protection that we seek, including business decisions about when to file patents and when to maintain trade secrets, will be adequate to protect our business. We could be required to spend significant resources to monitor and protect our intellectual property rights. Litigation may be necessary in the future to enforce our intellectual property rights, protect our trade secrets, determine the validity and scope of the proprietary rights of us or others or defend against claims of infringement or invalidity. Such litigation could be costly, time-consuming and distracting to management, result in a diversion of significant resources, the narrowing or invalidation of portions of our intellectual property and have an adverse effect on our business, results of operations and financial condition. Our efforts to enforce our intellectual property rights may be met with defenses, counterclaims and countersuits attacking the validity and enforceability of our intellectual property rights or alleging that we infringe the counterclaimant’s own intellectual property. These steps may be inadequate to protect our intellectual property. Any of our patents, copyrights, trademarks or other intellectual property rights could be challenged by others or invalidated through administrative process or litigation.
We also rely, in part, on confidentiality agreements with our technology partners, employees, consultants, advisors, customers and others in our efforts to protect our proprietary technology, processes and methods,. These agreements may not effectively prevent disclosure of our confidential information, and it may be possible for unauthorized parties to copy our software or other proprietary technology or information, or to develop similar software independently without our having an adequate remedy for unauthorized use or disclosure of our
-28-
Table of Contents
confidential information. In addition, others may independently discover our trade secrets and proprietary information, and in these cases we would not be able to assert any trade secret rights against those parties. Costly and time-consuming litigation could be necessary to enforce and determine the scope of our proprietary rights, and failure to obtain or maintain trade secret protection could adversely affect our competitive business position.
In addition, the laws of some countries do not protect proprietary rights to the same extent as the laws of the United States. To the extent we expand our international activities, our exposure to unauthorized copying, transfer and use of our solutions and proprietary technology or information may increase.
There can be no assurance that our means of protecting our proprietary rights will be adequate or that our competitors will not independently develop similar technology. If we fail to meaningfully protect our intellectual property, our business, brand, operating results and financial condition could be materially harmed.
We could incur substantial costs as a result of any claim of infringement of another party’s intellectual property rights.
In recent years, there has been significant litigation involving patents and other intellectual property rights in the software industry. Companies providing software are increasingly bringing and becoming subject to suits alleging infringement of proprietary rights, particularly patent rights, and to the extent we gain greater market visibility, we face a higher risk of being the subject of intellectual property infringement claims. We do not have a significant patent portfolio, which could prevent us from deterring patent infringement claims through our own patent portfolio, and our competitors and others may now and in the future have significantly larger and more mature patent portfolios than we have. The risk of patent litigation has been amplified by the increase in the number of a type of patent holder, which we refer to as a non-practicing entity, whose sole business is to assert such claims and against whom our own intellectual property portfolio may provide little deterrent value. We could incur substantial costs in prosecuting or defending any intellectual property litigation. If we sue to enforce our rights or are sued by a third party that claims that our solutions infringe its rights, the litigation could be expensive and could divert our management resources.
Any intellectual property litigation to which we might become a party, or for which we are required to provide indemnification, may require us to do one or more of the following:
| • | cease selling or using solutions that incorporate the intellectual property that we allegedly infringe; |
| • | make substantial payments for legal fees, settlement payments or other costs or damages; |
| • | obtain a license, which may not be available on reasonable terms or at all, to sell or use the relevant technology; or |
| • | redesign the allegedly infringing solutions to avoid infringement, which could be costly, time-consuming or impossible. |
If we are required to make substantial payments or undertake any of the other actions noted above as a result of any intellectual property infringement claims against us or any obligation to indemnify our customers for such claims, such payments or actions could harm our business.
Our use of open source software could negatively affect our ability to sell our solutions and subject us to possible litigation.
A portion of our technologies incorporate open source software, and we expect to continue to incorporate open source software in our solutions in the future. Few of the licenses applicable to open source software have been interpreted by courts, and there is a risk that these licenses could be construed in a manner that could impose unanticipated conditions or restrictions on our ability to commercialize our products. Moreover, we cannot assure you that we have not incorporated additional open source software in our software in a manner that
-29-
Table of Contents
is inconsistent with the terms of the license or our current policies and procedures. If we fail to comply with these licenses, we may be subject to certain requirements, including requirements that we offer our solutions that incorporate the open source software for no cost, that we make available source code for modifications or derivative works we create based upon, incorporating or using the open source software and that we license such modifications or derivative works under the terms of applicable open source licenses. If an author or other third party that distributes such open source software were to allege that we had not complied with the conditions of one or more of these licenses, we could be required to incur significant legal expenses defending against such allegations and could be subject to significant damages, enjoined from the sale of our solutions that contained the open source software and required to comply with onerous conditions or restrictions on these solutions, which could disrupt the distribution and sale of these solutions. In addition, there have been claims challenging the ownership of open source software against companies that incorporate open source software into their products. In any of these events, we and our customers could be required to seek licenses from third parties in order to continue offering our products, and to re-engineer our products or discontinue the sale of our products in the event re-engineering cannot be accomplished on a timely basis. We and our customers may also be subject to suits by parties claiming infringement due to the reliance by our solutions on certain open source software, and such litigation could be costly for us to defend or subject us to an injunction. Any of the foregoing could require us to devote additional research and development resources to re-engineer our solutions, could result in customer dissatisfaction, and may adversely affect our business, results of operations and financial condition.
We may have additional tax liabilities, which could harm our business, operating results, financial condition and prospects.
Significant judgments and estimates are required in determining our provision for income taxes and other tax liabilities. Our tax expense may be impacted if our intercompany transactions, which are required to be computed on an arm’s-length basis, are challenged and successfully disputed by the tax authorities. Also, our tax expense could be impacted depending on the applicability of withholding and other taxes (including withholding and indirect taxes on software licenses and related intercompany transactions) under the tax laws of certain jurisdictions in which we have business operations. In determining the adequacy of income taxes, we assess the likelihood of adverse outcomes that could result if our tax positions were challenged by the Internal Revenue Service, or IRS, and other tax authorities. The tax authorities in the United States and other countries where we do business regularly examine our income and other tax returns. The ultimate outcome of these examinations cannot be predicted with certainty. Should the IRS or other tax authorities assess additional taxes as a result of examinations, we may be required to record charges to operations that could have a material impact on the results of operations, financial position or cash flows.
Taxing authorities may successfully assert that we should have collected or in the future should collect sales and use, value added or similar taxes, and we could be subject to liability with respect to past or future sales, which could adversely affect our results of operations.
We do not collect sales and use, value added and similar taxes in all jurisdictions in which we have sales, based on our belief that such taxes are not applicable. Sales and use, value added and similar tax laws and rates vary greatly by jurisdiction. Certain jurisdictions in which we do not collect such taxes may assert that such taxes are applicable, which could result in tax assessments, penalties and interest, and we may be required to collect such taxes in the future. Such tax assessments, penalties and interest or future requirements may adversely affect our results of operations.
Indemnity provisions in various agreements potentially expose us to substantial liability for intellectual property infringement and other losses.
Our agreements with clients and other third parties may include indemnification provisions under which we agree to indemnify them for losses suffered or incurred as a result of claims of intellectual property infringement, damages caused by us to property or persons, or other liabilities relating to or arising from our products, services,
-30-
Table of Contents
or other contractual obligations. Some of these indemnity agreements provide for uncapped liability for which we would be responsible. The term of these indemnity provisions generally survives termination or expiration of the applicable agreement. Large indemnity payments could harm our business, operating results and financial condition. From time to time, we are requested by clients to indemnify them for breach of confidentiality with respect to personal data or other security breaches. Although we typically do not agree to, or contractually limit our liability with respect to, such requests, the existence of such a dispute with a client may have adverse effects on our client relationships and reputation.
We may become involved in litigation that may materially adversely affect us.
From time to time, we may become involved in various legal proceedings relating to matters incidental to the ordinary course of our business, including patent, commercial, product liability, employment, class action, whistleblower and other litigation and claims, and governmental and other regulatory investigations and proceedings. Such matters can be time-consuming, divert management’s attention and resources, cause us to incur significant expenses or liability and/or require us to change our business practices. Because of the potential risks, expenses and uncertainties of litigation, we may, from time to time, settle disputes, even where we have meritorious claims or defenses, by agreeing to settlement agreements. Because litigation is inherently unpredictable, we cannot assure you that the results of any of these actions will not have a material adverse effect on our business, financial condition, results of operations and prospects.
We employ third-party licensed software for use in or with our products, and the inability to maintain these licenses or errors in the software we license could result in increased costs, or reduced service levels, which would adversely affect our business.
Our products incorporate certain third-party software obtained under licenses from other companies. We anticipate that we will continue to rely on such third-party software and development tools from third parties in the future. Such third-party companies may discontinue their products, go out of business, or otherwise cease to make support available for such third-party software. Although we believe that there are commercially reasonable alternatives to the third-party software we currently license, this may not always be the case, or it may be difficult or costly to replace. In addition, integration of the software used in our products with new third-party software may require significant work and require substantial investment of our time and resources. Also, to the extent that our products depend upon the successful operation of third-party software in conjunction with our software, any undetected errors or defects in this third-party software could prevent the deployment or impair the functionality of our products, delay new product introductions, result in a failure of our products and injure our reputation. Our use of additional or alternative third-party software would require us to enter into license agreements with third parties.
Future acquisitions could disrupt our business and adversely affect our results of operations, financial condition and cash flows.
We may choose to expand by making acquisitions that could be material to our business, results of operations, financial condition and cash flows. Our ability as an organization to successfully acquire and integrate technologies or businesses is unproven. Acquisitions involve many risks, including the following:
| • | an acquisition may negatively affect our results of operations, financial condition or cash flows because it may require us to incur charges or assume substantial debt or other liabilities, may cause adverse tax consequences or unfavorable accounting treatment, may expose us to claims and disputes by third parties, including intellectual property claims and disputes, or may not generate sufficient financial return to offset additional costs and expenses related to the acquisition; |
| • | we may encounter difficulties or unforeseen expenditures in integrating the business, technologies, products, personnel or operations of any company that we acquire, particularly if key personnel of the acquired company decide not to work for us; |
-31-
Table of Contents
| • | an acquisition may disrupt our ongoing business, divert resources, increase our working capital requirements and expenses, and distract our management; |
| • | the need to implement or improve internal controls, procedures and policies appropriate for a public company at businesses that, prior to our acquisition of them, may have lacked effective controls, procedures or policies, including but not limited to, processes required for the effective and timely reporting of the financial condition and results of operations of the acquired business, both for historical periods prior to the acquisition and on a forward basis following the acquisition; |
| • | an acquisition may result in a delay or reduction of customer purchases for both us and the company acquired due to customer uncertainty about continuity and effectiveness of service from either company; |
| • | we may encounter difficulties in, or may be unable to, successfully sell any acquired products; |
| • | an acquisition may involve the entry into geographic or business markets in which we have little or no prior experience or where competitors have stronger market positions; |
| • | our use of cash to pay for acquisition would limit other potential uses for our cash; |
| • | if we incur debt to fund such acquisition, such debt may subject us to material restrictions on our ability to conduct our business as well as financial maintenance covenants; and |
| • | to the extent that we issue a significant amount of equity securities in connection with future acquisitions, existing stockholders may be diluted and earnings per share may decrease. |
The occurrence of any of these risks could have a material adverse effect on our business, results of operations, financial condition and cash flows.
If our goodwill or intangible assets become impaired, we may be required to record a significant charge to earnings.
We review our intangible assets for impairment when events or changes in circumstances indicate the carrying value may not be recoverable. Goodwill is required to be tested for impairment at least annually. As of July 31, 2014 and January 31, 2015, we had goodwill and intangible assets with a net book value of $18.8 million and $18.3 million, respectively, related to our acquisition of InsightsOne Systems, Inc., or InsightsOne. An adverse change in market conditions, particularly if such change has the effect of changing one of our critical assumptions or estimates, could result in a change to the estimation of fair value that could result in an impairment charge to our goodwill or intangible assets. Any such charges may have a material negative impact on our operating results.
If currency exchange rates fluctuate substantially in the future, the results of our operations, which are reported in U.S. dollars, could be adversely affected.
As we continue to expand our international operations, we become more exposed to the effects of fluctuations in currency exchange rates. Our sales contracts are denominated in U.S. dollars, and therefore substantially all of our revenue are not subject to foreign currency risk. However, a strengthening of the U.S. dollar could increase the real cost of our software to our customers located outside of the United States, which could adversely affect our business, results of operations, financial condition and cash flows. In addition, we incur expenses for employee compensation and other operating expenses at our non-U.S. locations in the local currency. Fluctuations in the exchange rates between the U.S. dollar and other currencies could result in the dollar equivalent of such expenses being higher. This could have a negative impact on our reported operating results. To date, we have not engaged in any hedging strategies, and any such strategies, such as forward contracts, options and foreign exchange swaps related to transaction exposures that we may implement to mitigate this risk may not eliminate our exposure to foreign exchange fluctuations.
-32-
Table of Contents
Our ability to use our net operating losses to offset future taxable income may be subject to certain limitations.
In general, under Section 382 of the Internal Revenue Code of 1986, as amended, or the Code, a corporation that undergoes an “ownership change” is subject to limitations on its ability to utilize its pre-change net operating losses, or NOLs, to offset future taxable income. Our existing NOLs may be subject to limitations arising from previous ownership changes, and if we undergo an ownership change in connection with or after this offering, our ability to utilize NOLs could be further limited by Section 382 of the Code. Future changes in our stock ownership, some of which are outside of our control, could result in an ownership change under Section 382 of the Code. Furthermore, our ability to utilize NOLs of companies that we may acquire in the future may be subject to limitations. There is also a risk that due to regulatory changes, such as suspensions on the use of NOLs, or other unforeseen reasons, our existing NOLs could expire or otherwise be unavailable to offset future income tax liabilities. For these reasons, we may not be able to utilize a material portion of the NOLs reflected on our balance sheet, even if we attain profitability.
Our international operations may give rise to potentially adverse tax consequences.
We generally conduct our international operations through wholly-owned subsidiaries and report our taxable income in various jurisdictions worldwide based upon our business operations in those jurisdictions. Our intercompany relationships are subject to complex transfer pricing regulations administered by taxing authorities in various jurisdictions. The relevant taxing authorities may disagree with our determinations as to the income and expenses attributable to specific jurisdictions. In addition, a taxing authority in a jurisdiction in which we have substantial business operations could assert that withholding or other taxes in such jurisdiction could apply, including in connection with a future disposition of our shares. If such a disagreement were to occur or such assertion by a taxing authority made, we could be required to pay additional taxes, interest and penalties, which could result in one-time tax charges, higher effective tax rates and reduced cash flows. We believe that our financial statements reflect adequate reserves to cover such a contingency, but there can be no assurances in that regard. If our reserves are not sufficient to cover such contingency, our financial results could be harmed.
The enactment of legislation implementing changes in the U.S. taxation of international business activities or the adoption of other tax reform policies could materially impact our financial position and results of operations.
Recent changes to U.S. tax laws, including limitations on the ability of taxpayers to claim and utilize foreign tax credits and the deferral of certain tax deductions until earnings outside of the United States are repatriated to the United States, as well as changes to U.S. tax laws that may be enacted in the future, could impact the tax treatment of our foreign earnings. Due to expansion of our international business activities, any changes in the U.S. taxation of such activities may increase our worldwide effective tax rate and adversely affect our financial position and results of operations.
Our business is subject to the risks of earthquakes, fire, floods and other natural catastrophic events, and to interruption by man-made problems such as power disruptions or terrorism.
Our corporate headquarters are located in the San Francisco Bay Area, a region known for seismic activity. We also have significant facilities in India, a region known for typhoons, floods and other natural disasters. A significant natural disaster, such as an earthquake, fire or a flood, occurring at our headquarters, at one of our other facilities or where a channel partner or supplier is located could have a material adverse effect on our business, operating results and financial condition. In addition, natural disasters and acts of terrorism could cause disruptions in our or our customers’ businesses, national economies or the world economy as a whole. We also rely on IT systems to communicate among our workforce located worldwide and, in particular, our research and development activities that are coordinated between our corporate headquarters in the San Francisco Bay Area and our operations in other states and countries. Any disruption to our internal communications, whether caused by a natural disaster or by man-made problems, such as power disruptions or terrorism, could delay our research and development efforts. To the extent that these disruptions result in delays or cancellations of customer orders or delays in our research and development efforts or the deployment of our solutions, our business and operating results would be materially and adversely affected.
-33-
Table of Contents
Unfavorable conditions in our industry or the global economy or reductions in information technology spending could limit our ability to grow our business and negatively affect our operating results.
Our operating results may vary based on the impact of changes in our industry or the global economy on us or our customers. The revenue growth and potential profitability of our business depend on demand for business software applications and services generally and for API-based software platforms in particular. Current or future economic uncertainties or downturns could adversely affect our business and results of operations. Negative conditions in the general economy both in the United States and abroad, including conditions resulting from changes in gross domestic product growth, financial and credit market fluctuations, political deadlock, natural catastrophes, warfare and terrorist attacks on the United States, Europe, the Asia Pacific region or elsewhere, could cause a decrease in business investments, including corporate spending on API-based software platforms in general and negatively affect the rate of growth of our business. Historically, during economic downturns there have been reductions in spending on information technology as well as pressure for extended billing terms and other financial concessions. If economic conditions deteriorate, our customers and prospective customers may elect to decrease their information technology, which would limit our ability to grow our business and negatively affect our operating results.
To the extent purchases of our platform perceived by customers and potential customers to be discretionary, our revenue may be disproportionately affected by delays or reductions in general information technology spending. Also, customers may choose to develop in-house software as an alternative to using our products. Moreover, competitors may respond to market conditions by lowering prices and attempting to lure away our customers. In addition, the increased pace of consolidation in certain industries may result in reduced overall spending on our software.
We cannot predict the timing, strength or duration of any economic slowdown, instability or recovery, generally or within any particular industry. If the economic conditions of the general economy or industries in which we operate do not improve, or worsen from present levels, our business, results of operations, financial condition and cash flows could be adversely affected.
The estimates of market opportunity and forecasts of market growth included in this prospectus may prove to be inaccurate, and even if the market in which we compete achieves the forecasted growth, our business could fail to grow at similar rates, if at all.
Market opportunity estimates and growth forecasts included in this prospectus, including those we have generated ourselves, are subject to significant uncertainty and are based on assumptions and estimates that may not prove to be accurate. Even if the market in which we compete meets the size estimates and growth forecasted in this prospectus, our business could fail to grow at similar rates, if at all. For more information regarding the estimates of market opportunity and the forecasts of market growth included in this prospectus, see the section titled “Market and Industry Data.”
We are subject to governmental export and import controls that could impair our ability to compete in international markets due to licensing requirements and subject us to liability if we are not in compliance with applicable laws.
Our solutions are subject to export control and import laws and regulations, including the U.S. Export Administration Regulations, U.S. Customs regulations and various economic and trade sanctions regulations administered by the U.S. Treasury Department’s Office of Foreign Assets Controls. Exports of our solutions must be made in compliance with these laws and regulations. If we fail to comply with these laws and regulations, we and certain of our employees could be subject to substantial civil or criminal penalties, including: the possible loss of export or import privileges; fines, which may be imposed on us and responsible employees or managers; and, in extreme cases, the incarceration of responsible employees or managers. Obtaining the necessary authorizations, including any required license, for a particular sale may be time-consuming, is not guaranteed and may result in the delay or loss of sales opportunities. In addition, changes in our solutions or
-34-
Table of Contents
changes in applicable export or import regulations may create delays in the introduction and sale of our solutions in international markets, prevent our customers with international operations from deploying our solutions or, in some cases, prevent the export or import of our solutions to certain countries, governments or persons altogether. Any change in export or import regulations, shift in the enforcement or scope of existing regulations, or change in the countries, governments, persons or technologies targeted by such regulations, could also result in decreased use of our solutions, or in our decreased ability to export or sell our solutions to existing or potential customers with international operations. Any decreased use of our solutions or limitation on our ability to export or sell our solutions would likely adversely affect our business.
Furthermore, we incorporate encryption technology into certain of our solutions. Various countries regulate the import of certain encryption technology, including through import permitting and licensing requirements, and have enacted laws that could limit our ability to distribute our solutions or could limit our customers’ ability to implement our solutions in those countries. Encrypted solutions and the underlying technology may also be subject to export control restrictions. Governmental regulation of encryption technology and regulation of imports or exports of encryption products, or our failure to obtain required import or export approval for our solutions, when applicable, could harm our international sales and adversely affect our revenue. Compliance with applicable regulatory requirements regarding the export of our solutions, including with respect to new releases of our solutions, may create delays in the introduction of our solutions in international markets, prevent our customers with international operations from deploying our solutions throughout their globally-distributed systems or, in some cases, prevent the export of our solutions to some countries altogether.
Moreover, U.S. export control laws and economic sanctions programs prohibit the shipment of certain products and services to countries, governments and persons that are subject to U.S. economic embargoes and trade sanctions. Any violations of such economic embargoes and trade sanction regulations could have negative consequences, including government investigations, penalties and reputational harm.
Our platform and our business are subject to a variety of U.S. and international laws and regulations, including those regarding privacy, data protection and information security, and our customers may be subject to regulations related to the handling and transfer of certain types of sensitive and confidential information. Any failure of our products or solutions to comply with or enable our customers and channel partners to comply with applicable laws and regulations would harm our business, financial condition and operating results.
We and our customers that use our solutions may be subject to privacy- and data protection-related laws and regulations that impose obligations in connection with the collection, processing and use of personal data, financial data, health data or other similar data. Existing U.S. federal and various state and foreign privacy- and data protection-related laws and regulations are evolving and subject to potentially differing interpretations, and various legislative and regulatory bodies may expand current or enact new laws and regulations regarding privacy- and data protection-related matters. New laws, amendments to or re-interpretations of existing laws and regulations, rules of self-regulatory bodies, industry standards and contractual obligations may impact our business and practices, and we may be required to expend significant resources to adapt to these changes. These developments could harm our business, financial condition and results of operations.
The U.S. federal and various state and foreign governments have adopted or proposed limitations on, or requirements regarding, the collection, distribution, use, security and storage of personally identifiable information of individuals. The U.S. Federal Trade Commission and numerous state attorneys general are applying federal and state consumer protection laws to impose standards on the online collection, use and dissemination of data, and to the security measures applied to such data. Similarly, many foreign countries and governmental bodies, including the EU member states, have laws and regulations concerning the collection and use of personally identifiable information obtained from their residents or by businesses operating within their jurisdiction, which are often more restrictive than those in the United States. Laws and regulations in these jurisdictions apply broadly to the collection, use, storage, disclosure and security of personally identifiable
-35-
Table of Contents
information that identifies or may be used to identify an individual, such as names, email addresses and, in some jurisdictions, Internet Protocol, or IP, addresses. Although we are working to have our platform comply with applicable laws and regulations, these and other obligations may be modified, they may be interpreted and applied in an inconsistent manner from one jurisdiction to another, and they may conflict with one another, other regulatory requirements or our internal practices. In addition, we may find it necessary or desirable to join industry or other self-regulatory bodies or other privacy or data protection-related organizations that require compliance with their rules pertaining to privacy and data protection. We also may be bound by contractual obligations relating to our collection, use and disclosure of personal, financial and other data.
As part of our efforts as a global business to comply with the obligations related to personal data under EU member state laws, we self-certify under—and are subject to—the U.S. Department of Commerce U.S.-EU Safe Harbor Framework and U.S.-Swiss Safe Harbor Framework. The Safe Harbor Frameworks are intended for organizations operating within the EU and Switzerland that transfer personal data, as the term is used in the context of the EU Data Protection Directive, to the United States and require U.S.-based companies that have certified with the Department of Commerce as part of the Safe Harbor Frameworks to provide assurance that they are adhering to relevant European standards for data protection. As we expand into new verticals and regions, we will need to comply with these and any new or changed requirements. Self-certification under the Safe Harbor Frameworks subjects us to oversight by the U.S. Federal Trade Commission, and potential non-compliance could result in an investigation and enforcement action brought by the Federal Trade Commission. Additionally, non-compliance could cause us to be in violation of applicable laws and regulations of the EU and its member states, which could result in investigations by relevant authorities of the EU and its member states, as well as fines and other penalties. Responding to an investigation or enforcement action could divert management’s attention and resources, cause us to incur investigation, compliance and defense costs and other professional fees, and adversely affect our business, results of operations, financial condition and cash flows. Recently, the Safe Harbor Frameworks have come under scrutiny in the EU and in the future could be modified or invalidated, in which case it is possible that we will no longer be in compliance with laws and regulations of the EU or its member states.
We facilitate our customers’ compliance with a number of diverse data protection, security, privacy and other government- and industry-specific requirements, including those that require companies to notify individuals of data security incidents involving certain types of personal data. For example, our solutions must conform, in certain circumstances, to requirements set forth in the U.S. Health Insurance Portability and Accountability Act of 1996, or HIPAA, as amended by the Health Information Technology for Economic and Clinical Health Act of 2009, or HITECH, and their respective implementing regulations, including the final omnibus rule published on January 25, 2013. Among other things, HITECH, through its implementing regulations, makes certain of HIPAA’s privacy and security standards directly applicable to business associates, defined as persons or organizations that create, receive, maintain or transmit protected health information, or PHI, for or on behalf of a HIPAA-covered entity for a function or activity regulated by HIPAA. Because certain customers that are HIPAA-covered entities receive and transmit PHI through our platform, we are a business associate with respect to these customers and therefore subject to the HIPAA requirements applicable to business associates. In addition, state laws govern the privacy and security of personal information and health information in certain circumstances, many of which differ from each other in significant ways and may not have the same effect, thus complicating compliance efforts. Noncompliance with applicable HIPAA and related state law requirements could result in monetary and criminal penalties, which could adversely impact our business, financial condition and cash flows as well as our reputation.
Similarly, because a number of our clients interface with payment card systems through our platform, including those for the processing of debit or credit cards, we maintain Payment Card Industry Data Security Standard, or PCI DSS, compliance as part of our information security program. If we are unable to comply with PCI DSS, whether due to changes in the PCI DSS standard or for another reason, we might incur significant liability and may suffer an adverse effect to our reputation.
-36-
Table of Contents
With respect to all of the above, any failure or perceived failure by us or our platform to comply with U.S., EU or other foreign privacy or security laws, policies, industry standards or legal obligations, or any security incident that results in the unauthorized access to, or acquisition, release or transfer of, personally identifiable information or other customer data may result in governmental investigations, inquiries, enforcement actions and prosecutions, private litigation, fines and penalties or adverse publicity. Such actions and penalties could divert management’s attention and resources, adversely affect our business, results of operations, financial condition and cash flows, and cause our customers and channel partners to lose trust in our solutions, which could have an adverse effect on our reputation and business.
We expect that there will continue to be new proposed laws, regulations and industry standards concerning privacy, data protection and information security in the United States, the European Union and other jurisdictions, and we cannot yet determine the impact such future laws, regulations and standards may have on our business. Because global laws, regulations and industry standards concerning privacy, data protection and information security have continued to develop and evolve rapidly, it is possible that we or our platform and solutions may not be, or may not have been, compliant with each such applicable law, regulation, and industry standard.
Any such new laws, regulations, other legal obligations or industry standards, or any changed interpretation of existing laws, regulations or other standards may require us to incur additional costs and restrict our business operations. If our privacy or data security measures fail to comply with current or future laws, regulations, policies, legal obligations or industry standards, we may be subject to litigation, regulatory investigations, fines or other liabilities, as well as negative publicity and a potential loss of business. Moreover, if future laws, regulations, other legal obligations or industry standards, or any changed interpretations of the foregoing limit our customers’ or partners’ ability to use and share personally identifiable information or our ability to store, process and share personally identifiable information or other data, demand for our solutions could decrease, our costs could increase and our business, financial condition and operating results could be harmed.
Changes in laws and regulations related to the Internet or changes in the Internet infrastructure itself may diminish the demand for our platform, and could have a negative impact on our business.
The future success of our business depends upon the continued use of the Internet as a primary medium for commerce, communication, and business applications. Federal, state, or foreign government bodies or agencies have in the past adopted, and may in the future adopt, laws or regulations affecting the use of the Internet as a commercial medium. Changes in these laws or regulations could require us to modify our platform in order to comply with these changes. In addition, government agencies or private organizations have imposed and may impose additional taxes, fees, or other charges for accessing the Internet or commerce conducted via the Internet. These laws or charges could limit the growth of Internet-related commerce or communications generally, or result in reductions in the demand for Internet-based platforms and services such as ours. In addition, the use of the Internet as a business tool could be adversely affected due to delays in the development or adoption of new standards and protocols to handle increased demands of Internet activity, security, reliability, cost, ease-of-use, accessibility, and quality of service. The performance of the Internet and its acceptance as a business tool has been adversely affected by “viruses,” “worms,” and similar malicious programs and the Internet has experienced a variety of outages and other delays as a result of damage to portions of its infrastructure. If the use of the Internet is adversely affected by these issues, demand for our platform could decline.
The terms of our existing loan and security agreement with Silicon Valley Bank and future indebtedness could restrict our operations, particularly our ability to respond to changes in our business or to take specified actions.
The terms of our existing loan and security agreement with Silicon Valley Bank, or SVB, contains, and any future indebtedness would likely contain, a number of restrictive covenants that impose significant operating and financial restrictions on us, including restrictions on our ability, and the ability of our subsidiaries, to take actions that may be in our best interests, including, among others, disposing of assets, entering into change of control transactions, mergers or acquisitions, incurring additional indebtedness, granting liens on our assets and paying
-37-
Table of Contents
dividends. Our loan and security agreement requires us to satisfy specified financial covenants, including a minimum revenue covenant and a minimum liquidity ratio. Our ability to meet those financial covenants can be affected by events beyond our control, and we may not be able to continue to meet those covenants. A breach of any of these covenants or the occurrence of other events specified in the loan and security agreement could result in an event of default under the loan and security agreement. Upon the occurrence of an event of default, SVB could elect to declare all amounts outstanding under the loan and security agreement to be immediately due and payable and terminate all commitments to extend further credit. If we were unable to repay those amounts, SVB could proceed against the collateral granted to them to secure such indebtedness. We have pledged substantially all of our assets, other than our intellectual property, as collateral under the loan and security agreement. If SVB accelerates the repayment of borrowings, if any, we may not have sufficient funds to repay our existing debt.
The nature of our business requires the application of complex revenue and expense recognition rules and the current legislative and regulatory environment affecting GAAP is uncertain. Significant changes in current principles could affect our financial statements going forward and changes in financial accounting standards or practices may cause adverse, unexpected financial reporting fluctuations and harm our operating results.
The accounting rules and regulations that we must comply with are complex and subject to interpretation by the Financial Accounting Standards Board, or FASB, the SEC and various bodies formed to promulgate and interpret appropriate accounting principles. Recent actions and public comments from FASB and the SEC have focused on the integrity of financial reporting. In addition, many companies’ accounting policies are being subject to heightened scrutiny by regulators and the public. Further, the accounting rules and regulations are continually changing in ways that could materially impact our financial statements. For example, in May 2014, FASB issued a new accounting guidance on revenue recognition, Accounting Standards Update No. 2014-09, Revenue from Contracts with Customers, that becomes effective for us beginning August 1, 2017. The standard permits the use of either the retrospective or cumulative effect transition method.
We have not yet selected a transition method and continue to evaluate the impact that this guidance will have on our financial condition and results of operations. Regardless of the transition method, the application of this new guidance may result in exclusion of certain future licensing revenues in the statement of comprehensive loss after the adoption date, which, despite no change in associated cash flows, could have a material adverse effect on our net income or loss. We cannot predict the impact of future changes to accounting principles or our accounting policies on our financial statements going forward, which could have a significant effect on our reported financial results, and could affect the reporting of transactions completed before the announcement of the change. In addition, were we to change our critical accounting estimates, including the timing of recognition of license revenue and other revenue sources, our results of operations could be significantly impacted.
Risks Related to Ownership of Our Common Stock and This Offering
Our stock price may be volatile or may decline, regardless of our operating performance, resulting in substantial losses for investors purchasing shares in this offering.
The trading prices of the securities of technology companies have been highly volatile. The market price of our common stock may fluctuate significantly in response to numerous factors, many of which are beyond our control, including:
| • | actual or anticipated fluctuations in our operating results; |
| • | the financial projections we may provide to the public, any changes in these projections or our failure to meet these projections; |
| • | failure of securities analysts to initiate or maintain coverage of our company, changes in financial estimates by any securities analysts who follow our company, or our failure to meet these estimates or the expectations of investors; |
-38-
Table of Contents
| • | ratings changes by any securities analysts who follow our company; |
| • | announcements by us or our competitors of significant technical innovations, acquisitions, strategic partnerships, joint ventures or capital commitments; |
| • | the addition or loss of large customers; |
| • | network outages or performance issues of our cloud service; |
| • | information security breaches of our internal systems, our cloud service or customer on-premises deployments of our platform; |
| • | changes in operating performance and stock market valuations of other technology companies generally, or those in our industry in particular; |
| • | price and volume fluctuations in the overall stock market, including as a result of trends in the economy as a whole; |
| • | any major change in our board of directors or management; |
| • | lawsuits threatened or filed against us; and |
| • | other events or factors, including those resulting from war, incidents of terrorism or responses to these events. |
In addition, the stock markets, and in particular the market on which our common stock will be listed, have experienced extreme price and volume fluctuations that have affected and continue to affect the market prices of equity securities of many technology companies. Stock prices of many technology companies have fluctuated in a manner unrelated or disproportionate to the operating performance of those companies. In the past, stockholders have instituted securities class action litigation following periods of market volatility. If we were to become involved in securities litigation, it could subject us to substantial costs, divert resources and the attention of management from our business and adversely affect our business, results of operations, financial condition and cash flows.
We cannot assure you that a market will develop for our common stock or what the market price of our common stock will be.
We have applied to list our common stock on The NASDAQ Global Select Market under the symbol “APIC.” However, we cannot assure you that an active trading market for our common stock will develop on such exchange or elsewhere or, if developed, that any market will be sustained. The lack of an active market may impair your ability to sell your shares at the time you wish to sell them or at a price that you consider reasonable. An inactive market may also impair our ability to raise capital by selling shares and may impair our ability to acquire other businesses, applications or technologies using our shares as consideration. We cannot predict the prices at which our common stock will trade. The initial public offering price of our common stock was determined by negotiations with the underwriters and may not bear any relationship to the market price at which our common stock will trade after this offering or to any other established criteria of the value of our business and prospects.
Our directors, executive officers and significant stockholders will continue to have substantial control over us after this offering and could delay or prevent a change in corporate control.
After this offering, our directors, executive officers and holders of more than 5% of our common stock, together with their affiliates, will beneficially own, in the aggregate, % of our outstanding common stock. As a result, these stockholders, acting together, would have the ability to control the outcome of matters submitted to our stockholders for approval, including the election of directors and any merger, consolidation or sale of all or substantially all of our assets. In addition, these stockholders, acting together, would have the ability to control the management and affairs of our company. Accordingly, this concentration of ownership might adversely affect the market price of our common stock by:
| • | delaying, deferring or preventing a change in control of the company; |
-39-
Table of Contents
| • | impeding a merger, consolidation, takeover or other business combination involving us; or |
| • | discouraging a potential acquirer from making a tender offer or otherwise attempting to obtain control of the company. |
If securities or industry analysts do not publish research or reports about our business, or publish negative reports about our business, our share price and trading volume could decline.
The trading market for our common stock will depend in part on the research and reports that securities or industry analysts publish about us or our business, our market and our competitors. We do not have any control over these analysts. If one or more of the analysts who cover us downgrade our shares or change their opinion of our shares, our share price would likely decline. If one or more of these analysts cease coverage of our company or fail to regularly publish reports on us, we could lose visibility in the financial markets, which could cause our share price or trading volume to decline.
Purchasers in this offering will experience immediate and substantial dilution in the book value of their investment.
The initial public offering price per share will be substantially higher than the pro forma net tangible book value per share of our common stock outstanding prior to this offering. As a result, investors purchasing common stock in this offering will experience immediate dilution of $ per share. This dilution is due in large part to the fact that our earlier investors paid substantially less than the initial public offering price when they purchased their shares of common stock. In addition, we have issued options to acquire common stock at prices significantly below the initial public offering price. To the extent outstanding options are ultimately exercised, there will be further dilution to investors in this offering. In addition, if the underwriters exercise their option to purchase additional shares from us or if we issue additional equity securities, you will experience additional dilution.
Substantial future sales of shares of our common stock could cause the market price of our common stock to decline.
The market price of shares of our common stock could decline as a result of substantial sales of our common stock, particularly sales by our directors, executive officers and significant stockholders, a large number of shares of our common stock becoming available for sale or the perception in the market that holders of a large number of shares intend to sell their shares. After this offering, we will have outstanding shares of our common stock, based on the number of shares outstanding as of January 31, 2015. This includes the shares included in this offering, which may be resold in the public market immediately. The remaining shares are currently restricted as a result of market stand-off agreements. In addition, certain of these shares are also subject to lock-up agreements, as more fully described in “Underwriting.”
After this offering, the holders of an aggregate of shares of our common stock as of January 31, 2015, will have rights, subject to some conditions, to require us to file registration statements covering their shares or to include their shares in registration statements that we may file for ourselves or our stockholders. Substantially all of these shares are subject to lock-up agreements restricting their sale for 180 days after the date of this prospectus, subject to potential extension in the event we release earnings results or a material event relating to us occurs near the end of the lock-up period. We also intend to register shares of common stock that we may issue under our employee equity incentive plans. Once we register these shares, they will be able to be sold freely in the public market upon issuance, subject to existing market stand-off and/or lock-up agreements. Morgan Stanley & Co. LLC may, in its sole discretion, permit our officers, directors, employees and current stockholders who are subject to the 180-day contractual lock-up to sell shares prior to the expiration of the lock-up agreements.
We are an “emerging growth company” and we cannot be certain if the reduced disclosure requirements applicable to emerging growth companies will make our common stock less attractive to investors.
We are an “emerging growth company,” as defined in the Jumpstart our Business Startups Act of 2012, or JOBS Act, and we may take advantage of certain exemptions from various reporting requirements that are
-40-
Table of Contents
applicable to other public companies that are not “emerging growth companies” including, but not limited to, not being required to comply with the auditor attestation requirements of section 404 of the Sarbanes-Oxley Act of 2002, or the Sarbanes-Oxley Act, reduced disclosure obligations regarding executive compensation in our periodic reports and proxy statements, and exemptions from the requirements of holding a nonbinding advisory vote on executive compensation and stockholder approval of any golden parachute payments not previously approved. We cannot predict if investors will find our common stock less attractive because we may rely on these exemptions. If some investors find our common stock less attractive as a result, there may be a less active trading market for our common stock and our stock price may be more volatile.
In addition, Section 107 of the JOBS Act also provides that an “emerging growth company” can take advantage of the extended transition period provided in Section 7(a)(2)(B) of the Securities Act of 1933, as amended, or the Securities Act, for complying with new or revised accounting standards. In other words, an “emerging growth company” can delay the adoption of certain accounting standards until those standards would otherwise apply to private companies. However, we are choosing to “opt out” of such extended transition period, and as a result, we will comply with new or revised accounting standards on the relevant dates on which adoption of such standards is required for non-emerging growth companies. Section 107 of the JOBS Act provides that our decision to opt out of the extended transition period for complying with new or revised accounting standards is irrevocable.
We may invest or spend the proceeds of this offering in ways with which you may not agree or in ways which may not yield a return.
The principal purposes of this offering are to raise additional capital, to create a public market for our common stock and to facilitate our future access to the public equity markets. We currently intend to use the net proceeds we receive from this offering primarily for general corporate purposes, including working capital, sales and marketing activities, solution and platform development, general and administrative matters, and capital expenditures, although we do not currently have any specific or preliminary plans with respect to the use of proceeds for such purposes. We may also use a portion of the net proceeds for the acquisition of, or investment in, technologies, solutions or businesses that complement our business, although we have no present commitments or agreements to enter into any acquisitions or investments. Our management will have considerable discretion in the application of the net proceeds, and you will not have the opportunity, as part of your investment decision, to assess whether the proceeds are being used appropriately. Investors in this offering will need to rely upon the judgment of our management with respect to the use of proceeds. If we do not use the net proceeds that we receive in this offering effectively, our business, financial condition, results of operations and prospects could be harmed, and the market price of our common stock could decline.
Anti-takeover provisions in our charter documents and under Delaware law could make an acquisition of our company more difficult, limit attempts by our stockholders to replace or remove our current management and limit the market price of our common stock.
Provisions in our certificate of incorporation and bylaws, as amended and restated in connection with this offering, may have the effect of delaying or preventing a change of control or changes in our management. Our amended and restated certificate of incorporation and bylaws include provisions that:
| • | authorize our board of directors to issue, without further action by the stockholders, shares of undesignated preferred stock with terms, rights and preferences determined by our board of directors; |
| • | require that any action to be taken by our stockholders be effected at a duly called annual or special meeting and not by written consent; |
| • | specify that special meetings of our stockholders can be called only by our board of directors, the Chairman of our board of directors, or our Chief Executive Officer; |
| • | establish an advance notice procedure for stockholder proposals to be brought before an annual meeting, including proposed nominations of persons for election to our board of directors; |
-41-
Table of Contents
| • | establish that our board of directors is divided into three classes, Class I, Class II and Class III, with each class serving three-year staggered terms; |
| • | prohibit cumulative voting in the election of directors; |
| • | provide that our directors may be removed only for cause; |
| • | provide that vacancies on our board of directors may be filled only by a majority of directors then in office, even though less than a quorum; and |
| • | require the approval of our board of directors or the holders of a supermajority of our outstanding shares of capital stock to amend our bylaws and certain provisions of our certificate of incorporation. |
These provisions may frustrate or prevent any attempts by our stockholders to replace or remove our current management by making it more difficult for stockholders to replace members of our board of directors, which is responsible for appointing the members of our management. In addition, because we are incorporated in Delaware, we are governed by the provisions of Section 203 of the Delaware General Corporation Law, which generally prohibits a Delaware corporation from engaging in any of a broad range of business combinations with any “interested” stockholder for a period of three years following the date on which the stockholder became an “interested” stockholder.
The requirements of being a public company may strain our resources, divert management’s attention and affect our ability to attract and retain executive management and qualified board members.
As a public company, we will be subject to the reporting requirements of the Securities Exchange Act of 1934, or the Exchange Act, the Sarbanes-Oxley Act, the Dodd-Frank Act, the accounting provisions of the FCPA, the listing requirements of the NASDAQ Stock Market and other applicable securities rules and regulations. Compliance with these rules and regulations will increase our legal and financial compliance costs, make some activities more difficult, time-consuming or costly and increase demand on our systems and resources, particularly after we are no longer an “emerging growth company.” The Exchange Act requires, among other things, that we file annual, quarterly and current reports with respect to our business and operating results. The Sarbanes-Oxley Act requires, among other things, that we maintain effective disclosure controls and procedures and internal control over financial reporting. In order to maintain and, if required, improve our disclosure controls and procedures and internal control over financial reporting to meet this standard, significant resources and management oversight may be required. As a result, management’s attention may be diverted from other business concerns, which could adversely affect our business and operating results. Although we have already hired additional employees to comply with these requirements, we may need to hire more employees in the future or engage outside consultants, which will increase our costs and expenses.
In addition, changing laws, regulations and standards relating to corporate governance and public disclosure are creating uncertainty for public companies, increasing legal and financial compliance costs and making some activities more time consuming. These laws, regulations and standards are subject to varying interpretations, in many cases due to their lack of specificity, and, as a result, their application in practice may evolve over time as new guidance is provided by regulatory and governing bodies. This could result in continuing uncertainty regarding compliance matters and higher costs necessitated by ongoing revisions to disclosure and governance practices. We intend to invest resources to comply with evolving laws, regulations and standards, and this investment may result in increased general and administrative expenses and a diversion of management’s time and attention from revenue-generating activities to compliance activities. If our efforts to comply with new laws, regulations and standards differ from the activities intended by regulatory or governing bodies due to ambiguities related to their application and practice, regulatory authorities may initiate legal proceedings against us and our business may be adversely affected.
However, for as long as we remain an “emerging growth company” as defined in the JOBS Act, we may take advantage of certain exemptions from various reporting requirements that are applicable to other public
-42-
Table of Contents
companies that are not “emerging growth companies” including, but not limited to, not being required to comply with the auditor attestation requirements of Section 404 of the Sarbanes-Oxley Act, reduced disclosure obligations regarding executive compensation in our periodic reports and proxy statements, and exemptions from the requirements of holding a nonbinding advisory vote on executive compensation and stockholder approval of any golden parachute payments not previously approved. We may take advantage of these reporting exemptions until we are no longer an “emerging growth company.”
We will remain an “emerging growth company” for up to five years, although if the market value of our common stock that is held by non-affiliates exceeds $700 million as of any July 31 before that time, we would cease to be an “emerging growth company” as of the following January 31.
We also expect that being a public company and these new rules and regulations will make it more expensive for us to obtain director and officer liability insurance, and we may be required to accept reduced coverage or incur substantially higher costs to obtain coverage. These factors could also make it more difficult for us to attract and retain qualified members of our board of directors, particularly to serve on our audit committee and compensation committee, and qualified executive officers.
As a result of disclosure of information in this prospectus and in filings required of a public company, our business and financial condition will become more visible, which we believe may result in threatened or actual litigation, including by competitors and other third parties. If such claims are successful, our business and operating results could be adversely affected, and even if the claims do not result in litigation or are resolved in our favor, these claims, and the time and resources necessary to resolve them, could divert the resources of our management and adversely affect our business and operating results.
As a result of becoming a public company, we will be obligated to develop and maintain proper and effective internal control over financial reporting. We may not complete our analysis of our internal control over financial reporting in a timely manner, or these internal controls may not be determined to be effective, which may adversely affect investor confidence in our company and, as a result, the value of our common stock.
We will be required, pursuant to Section 404 of the Sarbanes–Oxley Act, to furnish a report by management on, among other things, the effectiveness of our internal control over financial reporting for the first fiscal year beginning after the effective date of this offering. This assessment will need to include disclosure of any material weaknesses identified by our management in our internal control over financial reporting, as well as a statement that our independent registered public accounting firm has issued an opinion on our internal control over financial reporting.
We are in the very early stages of the costly and challenging process of compiling the system and processing documentation necessary to perform the evaluation needed to comply with Section 404. We may not be able to complete our evaluation, testing and any required remediation in a timely fashion. During the evaluation and testing process, if we identify one or more material weaknesses in our internal control over financial reporting, we will be unable to assert that our internal controls are effective.
If we are unable to assert that our internal control over financial reporting is effective, or if our independent registered public accounting firm is unable to express an opinion on the effectiveness of our internal controls, we could lose investor confidence in the accuracy and completeness of our financial reports, which would cause the price of our common stock to decline, and we may be subject to investigation or sanctions by the SEC.
We will be required to disclose changes made in our internal control and procedures on a quarterly basis. However, our independent registered public accounting firm will not be required to formally attest to the effectiveness of our internal control over financial reporting pursuant to Section 404 until the later of the year following our first annual report required to be filed with the SEC, or the date we are no longer an “emerging growth company” as defined in the JOBS Act if we take advantage of the exemptions contained in the JOBS Act.
-43-
Table of Contents
We will remain an “emerging growth company” for up to five years, although if the market value of our common stock that is held by non-affiliates exceeds $700 million as of any July 31 before that time, we would cease to be an “emerging growth company” as of the following January 31. To comply with the requirements of being a public company, we may need to undertake various actions, such as implementing new internal controls and procedures and hiring accounting or internal audit staff.
Our independent registered public accounting firm is not required to formally attest to the effectiveness of our internal control over financial reporting until the later of the year following our first annual report required to be filed with the SEC, or the date we are no longer an “emerging growth company.” At such time, our independent registered public accounting firm may issue a report that is adverse in the event it is not satisfied with the level at which our controls are documented, designed or operating. Our remediation efforts may not enable us to avoid a material weakness in the future.
We do not intend to pay dividends for the foreseeable future.
We have never declared or paid any cash dividends on our common stock and do not intend to pay any cash dividends in the foreseeable future. We anticipate that we will retain all of our future earnings for use in the development of our business and for general corporate purposes. Any determination to pay dividends in the future will be at the discretion of our board of directors. In addition, our loan and security agreement with SVB restricts, and any future indebtedness may restrict, our ability to pay dividends. Accordingly, investors must rely on sales of their common stock after price appreciation, which may never occur, as the only way to realize any future gains on their investments.
-44-
Table of Contents
SPECIAL NOTE REGARDING FORWARD-LOOKING STATEMENTS
This prospectus, including the sections entitled “Prospectus Summary,” “Risk Factors,” “Use of Proceeds,” “Management’s Discussion and Analysis of Financial Condition and Results of Operations” and “Business,” contains forward-looking statements. The words “believe,” “may,” “will,” “potentially,” “estimate,” “continue,” “anticipate,” “intend,” “could,” “would,” “project,” “plan,” “expect” and similar expressions that convey uncertainty of future events or outcomes are intended to identify forward-looking statements.
These forward-looking statements include, but are not limited to, statements concerning the following:
| • | our future financial performance, including our expectations regarding our revenue, cost of revenue, gross profit or gross margin, operating expenses including changes in research and development, sales and marketing and general and administrative expenses, and our ability to achieve and maintain future profitability; |
| • | our business plan and beliefs and objectives for future operations; |
| • | the anticipated benefits associated with the use of our solutions; |
| • | our plans to further invest in and grow our business, and our ability to effectively manage our growth and associated investments; |
| • | anticipated trends, growth rates and challenges in our business and in the markets in which we operate; |
| • | market adoption of our solutions; |
| • | our sales and marketing strategy and related activities; |
| • | our ability to increase sales of our solutions and renewals of our subscriptions; |
| • | our ability to attract and retain customers; |
| • | our ability to expand sales to our existing customers; |
| • | maintaining and expanding our customer base and our relationships with our channel partners; |
| • | our ability to timely and effectively scale and adapt our solutions; |
| • | our ability to develop new solutions and bring them to market in a timely manner and make enhancements to our existing solutions; |
| • | expanding the delivery of professional services to our customers through our channel partners; |
| • | the effects of increased competition in our markets and our ability to compete effectively; |
| • | our ability to maintain, protect and enhance our brand and intellectual property; |
| • | our ability to continue to expand internationally; |
| • | our future capital requirements and estimates regarding the sufficiency of our cash resources; |
| • | the effects of seasonal trends on our business; |
| • | future acquisitions or investments; |
| • | our ability to stay in compliance with laws and regulations that currently apply or become applicable to our business both in the United States and internationally; |
| • | economic and industry trends or trend analysis; |
| • | the attraction and retention of qualified employees and key personnel; |
| • | the estimates and estimate methodologies used in preparing our consolidated financial statements and determining option exercise prices; and |
| • | the future trading prices of our common stock. |
-45-
Table of Contents
These forward-looking statements are subject to a number of risks, uncertainties, and assumptions, including those described in “Risk Factors” and elsewhere in this prospectus. Moreover, we operate in a very competitive and rapidly changing environment, and new risks emerge from time to time. It is difficult for our management to predict all risks, nor can we assess the impact of all factors on our business or the extent to which any factor, or combination of factors, may cause actual results to differ materially from those contained in any forward-looking statements we may make. In light of these risks, uncertainties, and assumptions, the forward-looking events and circumstances discussed in this prospectus may not occur and actual results could differ materially and adversely from those anticipated or implied in the forward-looking statements.
You should not rely upon forward-looking statements as predictions of future events. Although we believe that the expectations reflected in the forward-looking statements are reasonable, we cannot guarantee that the future results, levels of activity, performance or events and circumstances reflected in the forward-looking statements will be achieved or occur. Moreover, neither we nor any other person assumes responsibility for the accuracy and completeness of the forward-looking statements. We undertake no obligation to update publicly any forward-looking statements for any reason after the date of this prospectus to conform these statements to actual results or to changes in our expectations, except as required by law.
You should read this prospectus and the documents that we reference in this prospectus and have filed with the Securities and Exchange Commission, or the SEC, as exhibits to the registration statement of which this prospectus is a part with the understanding that our actual future results, levels of activity, performance, and events and circumstances may be materially different from what we expect.
Unless otherwise indicated, information contained in this prospectus concerning our industry and the markets in which we operate, including our general expectations and market position, market opportunity, and market size, is based on information and data from various sources, including S&P Capital IQ and Gartner, Inc. or Gartner, on assumptions that we have made that are based on that information and data and other similar sources and on our knowledge of the markets for our products and services. This information involves a number of assumptions and limitations, and you are cautioned not to give undue weight to such estimates. While we believe the market position, market opportunity and market size information included in this prospectus is generally reliable, such information is inherently imprecise. In addition, projections, assumptions and estimates of our future performance and the future performance of the industry in which we operate is necessarily subject to a high degree of uncertainty and risk due to a variety of factors, including those described in the section titled “Risk Factors” and elsewhere in this prospectus. These and other factors could cause results to differ materially from those expressed in the estimates made by the independent parties and by us.
The S&P Capital IQ data described herein represents proprietary data gathered by S&P Capital IQ and is not a representation of fact. The S&P Capital IQ data is as of March 3, 2015 (and not as of the date of this prospectus) and is subject to change without notice.
The Gartner Reports described herein, or Gartner Reports, represent data, research opinion or viewpoints published as part of a syndicated subscription service, by Gartner, and are not representations of fact. The Gartner Reports speak as of their original publication dates (and not as of the date of this prospectus) and the opinions expressed in the Gartner Reports are subject to change without notice. The Gartner Reports consist of:
| (1) | Gartner, Press Release dated May 15, 2014: “Gartner Says Worldwide Application Infrastructure and Middleware Market Revenue Grew 5.6 Percent in 2013.” |
| (2) | Gartner, Forecast Enterprise Software Markets WW 2011-2018 3Q14, Sept 2014. |
-46-
Table of Contents
We estimate that the net proceeds from our sale of shares of common stock in this offering will be approximately $ million, or $ million if the underwriters exercise their over-allotment option in full, based on an assumed initial public offering price of $ per share, which is the midpoint of the estimated offering price range reflected on the cover page of this prospectus, after deducting estimated underwriting discounts and commissions and estimated offering expenses payable by us. A $1.00 increase (decrease) in the assumed initial public offering price would increase (decrease) the net proceeds to us from this offering by $ million, assuming that the number of shares offered by us, as reflected on the cover page of this prospectus, remains the same and after deducting estimated underwriting discounts and commissions and estimated offering expenses payable by us. A 1.0 million increase (decrease) in the number of shares offered by us, as set forth on the cover page of this prospectus, would increase (decrease) the net proceeds to us from this offering by $ million, assuming that the assumed initial public offering price, which is the midpoint of the estimated offering price range reflected on the cover page of this prospectus, remains the same and after deducting estimated underwriting discounts and commissions and estimated offering expenses payable by us.
The principal purposes of this offering are to increase our capitalization and financial flexibility, to create a public market for our stock and thereby enable access to the public equity markets for our employees and stockholders, to obtain additional capital and to increase our visability in the marketplace. We currently intend to use the net proceeds we receive from this offering primarily for general corporate purposes, including working capital, sales and marketing activities, solution and platform development, general and administrative matters, and capital expenditures, although we do not currently have any specific or preliminary plans with respect to the use of proceeds for such purposes. We may also use a portion of the net proceeds for the acquisition of, or investment in, technologies, solutions or businesses that complement our business, although we have no present commitments or agreements to enter into any acquisitions or investments. We will have broad discretion over the uses of the net proceeds of this offering. Pending these uses, we intend to invest the net proceeds from this offering in short-term, investment-grade, interest-bearing securities such as money market accounts, certificates of deposit, commercial paper, and guaranteed obligations of the U.S. government.
We have never declared or paid cash dividends on our common stock. We currently intend to retain all available funds and any future earnings for use in the operation of our business and do not anticipate paying any dividends on our common stock in the foreseeable future. Additionally, our ability to pay dividends on our common stock is limited by restrictions on our ability to pay dividends or make distributions under the terms of our loan and security agreement with SVB. Any future determination to declare dividends will be made at the discretion of our board of directors and will depend on our financial condition, operating results, capital requirements, general business conditions and other factors that our board of directors may deem relevant.
-47-
Table of Contents
The following table sets forth our cash and cash equivalents and capitalization as of January 31, 2015 on:
| • | an actual basis; |
| • | a pro forma basis, giving effect to the automatic conversion of all outstanding shares of our convertible preferred stock into an aggregate of 149,907,620 shares of common stock and the effectiveness of our amended and restated certificate of incorporation (each of which will occur immediately prior to the completion of this offering), as if such conversions had occurred and our amended and restated certificate of incorporation had become effective on January 31, 2015, as well as the stock-based compensation expense associated with the performance-based vesting of certain RSUs, which we expect to record upon completion of our initial public offering, as described in footnote (1) below; and |
| • | a pro forma as adjusted basis, giving effect to the pro forma adjustments noted above and the sale of shares of common stock by us in this offering, based on an assumed initial public offering price of $ per share, which is the midpoint of the estimated offering price range reflected on the cover page of this prospectus, after deducting estimated underwriting discounts and commissions and estimated offering expenses payable by us. |
The pro forma as adjusted information set forth in the table below is illustrative only and will be adjusted based on the actual initial public offering price and other terms of this offering determined at pricing.
You should read this table together with “Selected Consolidated Financial and Other Data,” “Management’s Discussion and Analysis of Financial Condition and Results of Operations” and our audited and unaudited consolidated financial statements and related notes included elsewhere in this prospectus.
| January 31, 2015 | ||||||||||||
| Actual | Pro Forma(1) | Pro Forma As Adjusted(2) |
||||||||||
| (in thousands, except share and per share data) | ||||||||||||
| Cash and cash equivalents |
$ | 29,133 | $ | 29,133 | $ | |||||||
|
|
|
|
|
|
|
|||||||
| Term debt, current and non-current |
$ | 4,899 | $ | 4,899 | $ | |||||||
| Stockholders’ equity: |
||||||||||||
| Convertible preferred stock: $0.001 par value; 142,194,666 shares authorized, 141,513,411 issued and outstanding, actual; no shares authorized, issued and outstanding, pro forma and pro forma as adjusted |
142 | — | ||||||||||
| Preferred stock: par value $0.001; no shares authorized, issued and outstanding, actual; 200,000,000 shares authorized, no shares issued and outstanding, pro forma and pro forma as adjusted |
— | — | ||||||||||
| Common stock: $0.001 par value; 230,000,000 shares authorized, 31,495,757 shares issued and outstanding, actual; 1,000,000,000 shares authorized, 181,441,420 shares issued and outstanding, pro forma; 1,000,000,000 shares authorized, shares issued and outstanding, pro forma as adjusted |
31 | 181 | ||||||||||
| Additional paid-in capital |
197,100 | 197,123 | ||||||||||
| Accumulated deficit |
(172,680 | ) | (172,711 | ) | ||||||||
|
|
|
|
|
|
|
|||||||
| Total stockholders’ equity |
24,593 | 24,593 | ||||||||||
|
|
|
|
|
|
|
|||||||
| Total capitalization |
$ | 29,492 | $ | 29,492 | $ | |||||||
|
|
|
|
|
|
|
|||||||
| (1) | Also reflects the stock-based compensation expense associated with RSUs outstanding as of January 31, 2015 that settle for 38,043 shares of common stock, which vest subject to a time-based |
-48-
Table of Contents
| vesting condition that has been partially met and a performance-based vesting condition related to the completion of our initial public offering, as further described in “Management’s Discussion and Analysis of Financial Condition and Results of Operations—Critical Accounting Policies and Estimates—Stock-based Compensation.” |
| (2) | Each $1.00 increase (decrease) in the assumed initial public offering price of $ per share, which is the midpoint of the estimated offering price range reflected on the cover page of this prospectus, would increase (decrease) each of our pro forma as adjusted cash and cash equivalents, additional paid-in capital, total stockholders’ equity, and total capitalization by approximately $ million, assuming that the number of shares offered by us, as set forth on the cover page of this prospectus, remains the same and after deducting estimated underwriting discounts and commissions and estimated offering expenses payable by us. Each 1.0 million increase (decrease) in the number of shares offered by us, as set forth on the cover page of this prospectus, would increase (decrease) each of our cash and cash equivalents, additional paid-in capital, total stockholders’ equity and total capitalization by approximately $ million, assuming that the assumed initial public offering price of $ per share, which is the midpoint of the estimated offering price range reflected on the cover page of this prospectus, remains the same and after deducting estimated underwriting discounts and commissions and estimated offering expenses payable by us. |
The number of shares of our common stock to be outstanding after this offering is based on 181,441,420 shares of our common stock outstanding as of January 31, 2015, after giving effect to the automatic conversion of our convertible preferred stock outstanding as of such date into an aggregate of 149,907,620 shares of our common stock immediately prior to the completion of this offering, as well as the performance-based vesting condition of certain RSUs outstanding as of January 31, 2015 that settle for 38,043 shares of common stock, which we expect to record upon completion of this offering, as further described in “Management’s Discussion and Analysis of Financial Condition and Results of Operations—Critical Accounting Policies and Estimates—Stock-based Compensation,” and excludes:
| • | 32,451,089 shares of common stock issuable upon the exercise of options, including a non-plan option, outstanding as of January 31, 2015, with a weighted-average exercise price of $0.58 per share; |
| • | 65,890 shares of common stock issuable upon the vesting of RSUs outstanding as of January 31, 2015; |
| • | 526,562 shares of common stock issuable upon the exercise of warrants outstanding as of January 31, 2015, with a weighted-average exercise price of $0.31 per share; (not including warrants to purchase 79,687 shares of common stock, which may become issuable in the future pursuant to our loan and security agreement with Silicon Valley Bank); |
| • | 2,235,224 shares of common stock issuable upon the exercise of options granted after January 31, 2015, with an exercise price of $2.31 per share; |
| • | 100,000 shares of common stock issuable upon the vesting of RSUs granted after January 31, 2015; and |
| • | shares of common stock reserved for future issuance under our share-based compensation plans, consisting of (1) 35,697,026 shares of common stock reserved for future issuance under our 2005 Plan, which shares will be added to the shares to be reserved under our 2015 Plan, which will become effective upon completion of this offering, (2) shares of common stock reserved for future issuance under our 2015 Plan, which will become effective upon completion of this offering, (3) shares of common stock reserved for future issuance under our ESPP which will become effective upon completion of this offering, and (4) shares of common stock that become available under our 2015 Plan and ESPP, pursuant to provisions thereof that automatically increase the share reserves under the plans each year, as more fully described in “Executive Compensation—Employee Benefit and Stock Plans.” |
-49-
Table of Contents
If you invest in our common stock, your interest will be diluted to the extent of the difference between the amount per share paid by purchasers of shares of common stock in this initial public offering and the pro forma as adjusted net tangible book value per share of common stock immediately after this offering.
As of January 31, 2015, our net tangible book value was approximately $6.1 million, or $0.03 per share of common stock. Our net tangible book value per share represents the amount of our total tangible assets reduced by the amount of our total liabilities and divided by the total number of shares of our common stock outstanding as of January 31, 2015, after giving effect to the automatic conversion of all outstanding shares of our convertible preferred stock into 149,907,620 shares of common stock, as well as the vesting of RSUs that settle for 38,043 shares of common stock, which vest subject to a time-based vesting condition that has been partially met and a performance-based vesting condition related to the completion of our initial public offering, as further described in “Management’s Discussion and Analysis of Financial Condition and Results of Operations—Critical Accounting Policies and Estimates—Stock-based Compensation.”
After giving effect to our sale in this offering of shares of our common stock, at an assumed initial public offering price of $ per share, which is the midpoint of the estimated offering price range reflected on the cover page of this prospectus, after deducting estimated underwriting discounts and commissions and estimated offering expenses payable by us, our pro forma as adjusted net tangible book value as of January 31, 2015, would have been approximately $ million, or $ per share of our common stock. This represents an immediate increase in pro forma net tangible book value of $ per share to our existing stockholders and an immediate dilution of $ per share to investors purchasing shares in this offering.
The following table illustrates this dilution:
| Assumed initial public offering price per share |
$ | |||||||
| Pro forma net tangible book value per share as of January 31, 2015 |
$ | 0.03 | ||||||
| Increase in pro forma net tangible book value per share attributable to this offering |
||||||||
|
|
|
|||||||
| Pro forma net tangible book value, as adjusted to give effect to this offering |
||||||||
|
|
|
|||||||
| Dilution in pro forma net tangible book value per share to new investors in this offering |
$ | |||||||
|
|
|
The dilution information discussed above is illustrative only and will change based on the actual initial public offering price and other terms of this offering determined at pricing. Each $1.00 increase (decrease) in the assumed initial public offering price of $ per share, which is the midpoint of the estimated offering price range reflected on the cover page of this prospectus, would increase (decrease) our pro forma net tangible book value, as adjusted to give effect to this offering, by $ per share, the increase (decrease) attributable to this offering by $ per share, and the dilution in pro forma as adjusted net tangible book value per share to new investors in this offering by $ per share, assuming the number of shares offered by us, as set forth on the cover page of this prospectus, remains the same and after deducting estimated underwriting discounts and commissions and estimated offering expenses payable by us. Each 1.0 million increase (decrease) in the number of shares offered by us, as set forth on the cover page of this prospectus, would increase (decrease) our pro forma net tangible book value, as adjusted to give effect to this offering, by $ per share, the increase (decrease) attributable to this offering by $ per share, and the dilution in pro forma as adjusted net tangible book value per share to new investors in this offering by $ per share, assuming that the assumed initial public offering price of $ per share, which is the midpoint of the estimated offering price range reflected on the cover page of this prospectus, remains the same and after deducting estimated underwriting discounts and commissions and estimated offering expenses payable by us.
If the underwriters exercise their over-allotment option in full, the pro forma net tangible book value per share of our common stock after giving effect to this offering would be $ per share, and the dilution in net tangible book value per share to investors in this offering would be $ per share.
-50-
Table of Contents
The following table summarizes, on a pro forma as adjusted basis as of January 31, 2015, after giving effect to (1) the automatic conversion of all of our convertible preferred stock into common stock and the effectiveness of our amended and restated certificate of incorporation, as well as the vesting of RSUs that settle for 38,043 shares of common stock, which vest subject to a time-based vesting condition that has been partially met and a performance-based vesting condition related to the completion of our initial public offering, as further described in “Management’s Discussion and Analysis of Financial Condition and Results of Operations—Critical Accounting Policies and Estimates—Stock-based Compensation,” and (2) the sale of shares of common stock by us in this offering at an assumed initial public offering price of $ per share, which is the midpoint of the estimated offering price range reflected on the cover page of this prospectus, the difference between existing stockholders and new investors with respect to the number of shares of common stock purchased from us, the total consideration paid to us, and the average price per share paid, before deducting estimated underwriting discounts and commissions and estimated offering expenses payable by us:
| Shares Purchased | Total Consideration | Average Price Per Share |
||||||||||||||||||
| Number | Percent | Amount | Percent | |||||||||||||||||
| Existing stockholders |
181,441,420 | % | 173,131,556 | % | $ | 0.95 | ||||||||||||||
| New public investors |
$ | |||||||||||||||||||
|
|
|
|
|
|
|
|
|
|||||||||||||
| Total |
100.0 | % | $ | 100.0 | % | |||||||||||||||
|
|
|
|
|
|
|
|
|
|||||||||||||
The information discussed above is illustrative only and will change based on the actual initial public offering price and other terms of this offering determined at pricing. Each $1.00 increase (decrease) in the assumed initial public offering price of $ per share, which is the midpoint of the estimated offering price range reflected on the cover page of this prospectus, would increase (decrease) each of the total consideration paid by new investors and total consideration paid by all stockholders by approximately $ million, assuming that the number of shares offered by us, as set forth on the cover page of this prospectus, remains the same and after deducting estimated underwriting discounts and commissions and estimated offering expenses payable by us. Each 1.0 million increase (decrease) in the number of shares offered by us, as set forth on the cover page of this prospectus, would increase (decrease) each of the total consideration paid by new investors and total consideration paid by all stockholders by approximately $ million, assuming that the assumed initial public offering price of $ per share, which is the midpoint of the estimated offering price range reflected on the cover page of this prospectus, remains the same and after deducting estimated underwriting discounts and commissions and estimated offering expenses payable by us.
To the extent that any outstanding options or warrants are exercised, investors will experience further dilution.
Except as otherwise indicated, the above discussion and tables assume no exercise of the underwriters’ over-allotment option. If the underwriters exercise their over-allotment option in full, our existing stockholders would own % and our new investors would own % of the total number of shares of our common stock outstanding upon the completion of this offering.
The number of shares of our common stock to be outstanding after this offering is based on 181,441,420 shares of our common stock outstanding as of January 31, 2015, after giving effect to the automatic conversion of our convertible preferred stock outstanding as of such date into an aggregate of 149,907,620 shares of our common stock immediately prior to the completion of this offering, as well as the performance-based vesting condition of certain RSUs outstanding as of January 31, 2015 that settle for 38,043 shares of common stock, which we expect to record upon completion of this offering, as further described in “Management’s Discussion and Analysis of Financial Condition and Results of Operations—Critical Accounting Policies and Estimates—Stock-based Compensation,” and excludes:
| • | 32,451,089 shares of common stock issuable upon the exercise of options, including a non-plan option, outstanding as of January 31, 2015, with a weighted-average exercise price of $0.58 per share; |
| • | 65,890 shares of common stock issuable upon the vesting of RSUs outstanding as of January 31, 2015; |
-51-
Table of Contents
| • | 526,562 shares of common stock issuable upon the exercise of warrants outstanding as of January 31, 2015, with a weighted-average exercise price of $0.31 per share; (not including warrants to purchase 79,687 shares of common stock, which may become issuable in the future pursuant to our loan and security agreement with Silicon Valley Bank); |
| • | 2,235,224 shares of common stock issuable upon the exercise of options granted after January 31, 2015, with an exercise price of $2.31 per share; |
| • | 100,000 shares of common stock issuable upon the vesting of RSUs granted after January 31, 2015; and |
| • | shares of common stock reserved for future issuance under our share-based compensation plans, consisting of (1) 35,697,026 shares of common stock reserved for future issuance under our 2005 Plan, which shares will be added to the shares to be reserved under our 2015 Plan, which will become effective upon completion of this offering, (2) shares of common stock reserved for future issuance under our 2015 Plan, which will become effective upon completion of this offering, (3) shares of common stock reserved for future issuance under our ESPP, which will become effective upon completion of this offering, and (4) shares of common stock that become available under our 2015 Plan and ESPP, pursuant to provisions thereof that automatically increase the share reserves under the plans each year, as more fully described in “Executive Compensation—Employee Benefit and Stock Plans.” |
-52-
Table of Contents
SELECTED CONSOLIDATED FINANCIAL AND OTHER DATA
The following selected consolidated financial and other data should be read together with our consolidated financial statements and accompanying notes and “Management’s Discussion and Analysis of Financial Condition and Results of Operations” included elsewhere in this prospectus. The selected consolidated financial and other data in this section is not intended to replace our consolidated financial statements and the related notes. We derived the selected consolidated statements of operations data for fiscal 2012, fiscal 2013 and fiscal 2014 and the consolidated balance sheet data as of July 31, 2013 and 2014 from our audited consolidated financial statements included elsewhere in this prospectus. We derived the selected consolidated balance sheet data as of July 31, 2012 from our audited consolidated financial statements not included in this prospectus. The consolidated statements of operations data for the six months ended January 31, 2014 and 2015, and the consolidated balance sheet data as of January 31, 2015, are derived from our unaudited consolidated financial statements appearing elsewhere in this prospectus. Our historical results presented below are not necessarily indicative of financial results to be achieved in future periods.
| Fiscal Year Ended July 31, |
Six Months Ended January 31, |
|||||||||||||||||||
| 2012 | 2013 | 2014 | 2014 | 2015 | ||||||||||||||||
| (unaudited) | ||||||||||||||||||||
| (in thousands, except per share data) |
||||||||||||||||||||
| Consolidated Statement of Operations Data: |
||||||||||||||||||||
| Revenue |
||||||||||||||||||||
| License |
$ | 9,452 | $ | 13,917 | $ | 11,411 | $ | 3,566 | $ | 9,522 | ||||||||||
| Subscription and support |
7,308 | 15,243 | 20,237 | 9,651 | 14,164 | |||||||||||||||
| Professional services and other |
10,847 | 13,992 | 21,054 | 10,200 | 8,929 | |||||||||||||||
|
|
|
|
|
|
|
|
|
|
|
|||||||||||
| Total revenue |
27,607 | 43,152 | 52,702 | 23,417 | 32,615 | |||||||||||||||
| Cost of revenue |
||||||||||||||||||||
| License |
157 | 108 | 366 | 88 | 257 | |||||||||||||||
| Subscription and support(1) |
3,484 | 9,286 | 11,911 | 7,425 | 5,367 | |||||||||||||||
| Professional services and other(1) |
8,352 | 12,435 | 15,431 | 7,847 | 7,044 | |||||||||||||||
|
|
|
|
|
|
|
|
|
|
|
|||||||||||
| Total cost of revenue |
11,993 | 21,829 | 27,708 | 15,360 | 12,668 | |||||||||||||||
|
|
|
|
|
|
|
|
|
|
|
|||||||||||
| Gross profit |
15,614 | 21,323 | 24,994 | 8,057 | 19,947 | |||||||||||||||
| Operating expenses |
||||||||||||||||||||
| Research and development(1) |
10,922 | 16,848 | 22,273 | 9,152 | 14,385 | |||||||||||||||
| Sales and marketing(1) |
9,801 | 23,812 | 47,029 | 22,456 | 25,174 | |||||||||||||||
| General and administrative(1) |
4,033 | 5,885 | 14,415 | 6,767 | 6,704 | |||||||||||||||
|
|
|
|
|
|
|
|
|
|
|
|||||||||||
| Total operating expenses |
24,756 | 46,545 | 83,717 | 38,375 | 46,263 | |||||||||||||||
|
|
|
|
|
|
|
|
|
|
|
|||||||||||
| Loss from operations |
(9,142 | ) | (25,222 | ) | (58,723 | ) | (30,318 | ) | (26,316 | ) | ||||||||||
|
|
|
|
|
|
|
|
|
|
|
|||||||||||
| Other income (expense), net |
1,228 | (376 | ) | (1,678 | ) | (1,757 | ) | (290 | ) | |||||||||||
|
|
|
|
|
|
|
|
|
|
|
|||||||||||
| Loss before income taxes |
(7,914 | ) | (25,598 | ) | (60,401 | ) | (32,075 | ) | (26,606 | ) | ||||||||||
| Provision for income taxes |
367 | 273 | 392 | 137 | 203 | |||||||||||||||
|
|
|
|
|
|
|
|
|
|
|
|||||||||||
| Net loss and comprehensive loss |
$ | (8,281 | ) | $ | (25,871 | ) | $ | (60,793 | ) | $ | (32,212 | ) | $ | (26,809 | ) | |||||
|
|
|
|
|
|
|
|
|
|
|
|||||||||||
| Net loss per share(2): |
||||||||||||||||||||
| Basic and diluted |
$ | (0.56 | ) | $ | (1.39 | ) | $ | (2.34 | ) | $ | (1.33 | ) | $ | (0.88 | ) | |||||
|
|
|
|
|
|
|
|
|
|
|
|||||||||||
| Weighted-average shares outstanding used in calculating net loss per share(1): |
||||||||||||||||||||
| Basic and diluted |
14,862 | 18,576 | 25,938 | 24,165 | 30,467 | |||||||||||||||
|
|
|
|
|
|
|
|
|
|
|
|||||||||||
| Pro forma net loss per share (unaudited)(2): |
||||||||||||||||||||
| Basic and diluted |
$ | (0.39 | ) | $ | (0.15 | ) | ||||||||||||||
|
|
|
|
|
|||||||||||||||||
| Weighted-average shares outstanding used in calculating pro forma net loss per share (unaudited)(2): |
||||||||||||||||||||
| Basic and diluted |
157,297 | 180,004 | ||||||||||||||||||
|
|
|
|
|
|||||||||||||||||
-53-
Table of Contents
| (1) | Includes stock-based compensation expense as follows: |
| Fiscal Year Ended July 31, |
Six Months
Ended January 31, |
|||||||||||||||||||
| 2012 | 2013 | 2014 | 2014 | 2015 | ||||||||||||||||
| (unaudited) | ||||||||||||||||||||
| (in thousands) | ||||||||||||||||||||
| Cost of subscription and support revenue |
$ | 2 | $ | 21 | $ | 24 | $ | 12 | $ | 13 | ||||||||||
| Cost of professional services and other revenue |
30 | 65 | 133 | 47 | 91 | |||||||||||||||
| Research and development |
74 | 114 | 490 | 135 | 453 | |||||||||||||||
| Sales and marketing |
55 | 138 | 1,090 | 146 | 319 | |||||||||||||||
| General and administrative |
20 | 70 | 989 | 430 | 571 | |||||||||||||||
|
|
|
|
|
|
|
|
|
|
|
|||||||||||
| Total stock-based compensation expense |
$ | 181 | $ | 408 | $ | 2,726 | $ | 770 | $ | 1,447 | ||||||||||
|
|
|
|
|
|
|
|
|
|
|
|||||||||||
| (2) | See Note 13 to our audited consolidated financial statements appearing elsewhere in this prospectus for an explanation of our basic and diluted net loss per share and pro forma net loss per share calculations. |
| July 31, | January
31, 2015 |
|||||||||||||||
| 2012 | 2013 | 2014 | ||||||||||||||
| (unaudited) | ||||||||||||||||
| (in thousands) | ||||||||||||||||
| Consolidated Balance Sheet Data: |
||||||||||||||||
| Cash and cash equivalents |
$ | 32,583 | $ | 44,243 | $ | 51,759 | $ | 29,133 | ||||||||
| Working capital |
18,201 | 31,051 | 36,317 | 12,045 | ||||||||||||
| Total assets |
49,997 | 56,550 | 95,622 | 75,901 | ||||||||||||
| Deferred revenue, current and long-term |
17,140 | 17,124 | 28,190 | 33,193 | ||||||||||||
| Term debt, current and long-term |
1 | 3,681 | 5,243 | 4,899 | ||||||||||||
| Additional paid-in capital |
76,488 | 112,279 | 195,221 | 197,100 | ||||||||||||
| Total stockholders’ equity |
17,395 | 27,336 | 49,522 | 24,593 | ||||||||||||
Certain Key Non-GAAP Financial Metrics
We monitor the following key non-GAAP financial metrics:
| Fiscal Year Ended July 31, |
Six Months Ended January 31, |
|||||||||||||||||||
| 2012 | 2013 | 2014 | 2014 | 2015 | ||||||||||||||||
| (dollar amounts in thousands) | ||||||||||||||||||||
| Gross billings |
$ | 36,701 | $ | 43,136 | $ | 63,768 | $ | 23,684 | $ | 37,618 | ||||||||||
| Non-GAAP gross profit |
$ | 15,646 | $ | 21,409 | $ | 25,763 | $ | 8,233 | $ | 20,505 | ||||||||||
| Non-GAAP gross margin |
56.7 | % | 49.6 | % | 48.9 | % | 35.2 | % | 62.9 | % | ||||||||||
| Non-GAAP operating loss |
$ | (8,912 | ) | $ | (24,638 | ) | $ | (55,117 | ) | $ | (29,326 | ) | $ | (24,269 | ) | |||||
Gross Billings. We define gross billings as our total revenue plus the change in our deferred revenue in a period. Gross billings in any period consists of sales to new customers plus renewals and additional sales to existing customers. Our management uses gross billings as a performance measurement because we generally bill our customers at the time of sale of our solutions and recognize revenue either upon delivery or ratably over subsequent periods, and a portion of our revenue may be recognized over a period of more than 12 months. We believe that gross billings provides valuable insight into the sales of our solutions and the performance of our business.
Non-GAAP Gross Profit and Gross Margin. We define non-GAAP gross profit as our total revenue less our total cost of revenue, adjusted to exclude stock-based compensation associated with equity awards granted to
-54-
Table of Contents
professional services and maintenance personnel, and amortization of acquired intangible assets. We define non-GAAP gross margin as non-GAAP gross profit as a percentage of our total revenue. Non-GAAP gross profit and gross margin are key measures used by our management to understand and evaluate our operating performance and trends. In particular, non-GAAP gross profit and gross margin exclude certain non-cash expenses and can provide useful measures for period-to-period comparisons of our business.
Non-GAAP Operating Loss. We define non-GAAP operating loss as our operating loss excluding stock-based compensation and amortization of acquired intangibles assets. Our management uses non-GAAP operating loss to understand and evaluate our operating performance and trends. In particular, non-GAAP operating loss excludes certain non-cash expenses and can provide useful measures for period-to-period comparisons of our business.
Reconciliation of Non-GAAP Financial Measures
The non-GAAP measures discussed above under “—Certain Key Non-GAAP Financial Metrics” have limitations as analytical tools, and you should not consider them in isolation or as a substitute for the most directly comparable financial measures prepared in accordance with GAAP. Gross billings, non-GAAP gross profit and gross margin, and non-GAAP operating loss are not substitutes for total revenue, gross profit and gross margin, and operating loss, respectively. In addition, other companies may calculate non-GAAP financial measures differently or may use other measures to evaluate their performance, all of which could reduce the usefulness of our non-GAAP financial measures as tools for comparison. For example, other companies may not use gross billings, may calculate gross billings differently, may have different billing frequencies, or may use other financial measures to evaluate their performance, all of which could reduce the usefulness of gross billings as a comparative measure. Also, the non-GAAP gross profit and gross margin, and non-GAAP operating loss measures do not consider the dilutive impact of equity awards and the associated stock-based compensation, which is an ongoing expense for us, and these non-GAAP measures exclude amortization of acquired intangible assets, even though we may engage in future acquisitions that may result in additional amortization. We urge you to review the reconciliation of our non-GAAP financial measures to the most directly comparable GAAP financial measures included below, and not to rely on any single financial measure to evaluate our business.
The following table reflects the reconciliation of the most directly comparable GAAP financial measure to each of the non-GAAP financial measures discussed above:
| Fiscal Year Ended July 31, |
Six Months Ended January, 31 |
|||||||||||||||||||
| 2012 | 2013 | 2014 | 2014 | 2015 | ||||||||||||||||
| (in thousands) | ||||||||||||||||||||
| Gross billings: |
||||||||||||||||||||
| Total revenue |
$ | 27,607 | $ | 43,152 | $ | 52,702 | $ | 23,417 | $ | 32,615 | ||||||||||
| Total deferred revenue, end of period |
17,140 | 17,124 | 28,190 | 17,391 | 33,193 | |||||||||||||||
| Less: Total deferred revenue, beginning of period |
(8,046 | ) | (17,140 | ) | (17,124 | ) | (17,124 | ) | (28,190 | ) | ||||||||||
|
|
|
|
|
|
|
|
|
|
|
|||||||||||
| Total change in deferred revenue |
9,094 | (16 | ) | 11,066 | 267 | 5,003 | ||||||||||||||
|
|
|
|
|
|
|
|
|
|
|
|||||||||||
| Gross billings |
$ | 36,701 | $ | 43,136 | $ | 63,768 | $ | 23,684 | $ | 37,618 | ||||||||||
|
|
|
|
|
|
|
|
|
|
|
|||||||||||
| Non-GAAP gross profit: |
||||||||||||||||||||
| Gross profit |
$ | 15,614 | $ | 21,323 | $ | 24,994 | $ | 8,057 | $ | 19,947 | ||||||||||
| Add: Stock-based compensation expense |
32 | 86 | 157 | 59 | 104 | |||||||||||||||
| Add: Amortization of intangible assets |
— | — | 612 | 117 | 454 | |||||||||||||||
|
|
|
|
|
|
|
|
|
|
|
|||||||||||
| Non-GAAP gross profit |
$ | 15,646 | $ | 21,409 | $ | 25,763 | $ | 8,233 | $ | 20,505 | ||||||||||
|
|
|
|
|
|
|
|
|
|
|
|||||||||||
| Non-GAAP operating loss: |
||||||||||||||||||||
| Operating loss |
$ | (9,142 | ) | $ | (25,222 | ) | $ | (58,723 | ) | $ | (30,318 | ) | $ | (26,316 | ) | |||||
| Add: Stock-based compensation expense |
181 | 408 | 2,726 | 770 | 1,447 | |||||||||||||||
| Add: Amortization of intangible assets |
49 | 176 | 880 | 222 | 600 | |||||||||||||||
|
|
|
|
|
|
|
|
|
|
|
|||||||||||
| Non-GAAP operating loss |
$ | (8,912) | $ | (24,638 | ) | $ | (55,117 | ) | $ | (29,326 | ) | $ | (24,269 | ) | ||||||
|
|
|
|
|
|
|
|
|
|
|
|||||||||||
-55-
Table of Contents
MANAGEMENT’S DISCUSSION AND ANALYSIS OF FINANCIAL CONDITION AND RESULTS OF OPERATIONS
You should read the following discussion and analysis of our financial condition and results of operations together with the consolidated financial statements and related notes that are included elsewhere in this prospectus. This discussion contains forward looking statements based upon current expectations that involve risks and uncertainties. Our actual results may differ materially from those anticipated in these forward looking statements as a result of various factors, including those set forth under the section titled “Risk Factors” or in other parts of this prospectus. The last day of our fiscal year is July 31.
Overview
At Apigee, our mission is to make every business a digital business.
Unprecedented growth in mobile technologies, big data, cloud services and the connected devices that comprise the Internet of Things, or IoT, has disrupted or transformed the dynamics of business, changed consumer behavior and eroded the divide between the physical and digital worlds. To fully embrace the digital world, businesses must provide seamless customer experiences across a myriad of devices and channels, respond quickly to fast-changing customer expectations and market conditions, drive revenue through new business models and create or participate in digital ecosystems. A digital business creates value by unlocking its data and services to better serve customers in a real-time, anywhere-anytime fashion and uses data to continually improve the customer experience and drive additional revenue.
We believe that application programming interfaces, or APIs, are a critical enabling technology for the shifts in mobile, cloud computing, big data and the IoT and that APIs are a foundational technology on which digital business operates. We believe that a new and expansive market opportunity exists to help enterprises adopt digital strategies and navigate the digitally driven economy.
We provide an innovative software platform that allows businesses to design, deploy, and scale APIs as a connection layer between their core IT systems and data and the applications with which their customers, partners, employees and other users engage with their business. The foundations of our platform are Apigee Edge, a robust API-management solution, and Apigee Insights, our predictive analytics software solution. Our platform enables a comprehensive view of the enterprise data the user is consuming and generating, and data about the context in which the customer is using the digital product or service, or contextual data. In addition, our platform provides tools for businesses to drive usage and adoption of APIs by their business partners and developers. Using our platform, businesses in any industry can easily and securely connect their core services and data to developers to enable them to develop applications and experiences for customers, partners, employees and other users. Using our platform, businesses can forge new partnerships, build partner ecosystems, and participate fully in emerging digital business networks.
We believe that in order to build, manage and extract valuable insights from APIs and data needed for digital business, nearly all businesses will require a new layer within their core application software stack to achieve this. To enable this new layer, we provide a purpose-built, self-service, scalable platform that can be deployed either in the cloud or on premises to securely expose a business’ data and services needed to enable users to engage and transact with the business. Because we provide API publishing, operations, and data visibility in our integrated solution, our platform enables more informed predictive analytics to help the business anticipate and adjust to customer behavior.
We were incorporated in fiscal 2004. From fiscal 2004 to fiscal 2007, our activities were focused on research and development that resulted in the first commercial release of our software in fiscal 2007—our Apigee Edge on-premises platform. In fiscal 2009, we extended our Apigee Edge solution to a cloud offering to enable deployment flexibility for our customers. In fiscal 2012, we further extended our platform with the release of our
-56-
Table of Contents
first predictive analytics solution, Apigee Insights. In December 2013, we acquired InsightsOne Systems, Inc., or InsightsOne, to further advance predictive analytics as part of our platform strategy and to bolster our developer adoption strategy. In fiscal 2013, we expanded our network of channel partners by entering into a master alliance agreement with Accenture, under which either we co-sell or they resell our solutions as part of larger installations. In fiscal 2014, we announced an OEM and reseller partnership with SAP under which SAP will deliver a comprehensive API management application built on our Apigee Edge product on SAP’s Hana Cloud to SAP’s cloud customers, and sell our Apigee Edge product on a standalone basis to its on-premises customers.
We generate our revenue primarily from licenses and subscriptions for our Apigee Edge products and from professional services. We also generate revenue from licenses of and subscriptions to our Apigee Insights product, although such revenue has been immaterial to date because we re-released our Apigee Insights product in fiscal year 2014 and currently have few active customers. We also offer a free trial version of Apigee Developer to the developer community. We provide our customers the flexibility to deploy our software as a cloud service or on premises. For those customers that deploy our products as a cloud service, we license our software on a subscription basis. For those customers that deploy our products on premises, we offer two licensing options, a time-based license or a perpetual license. We recognize revenue from subscription fees ratably over the service period, and have been increasing the proportion of our revenue mix that we derive from subscriptions. We therefore believe that gross billings provides valuable insight into the performance of our business. We expect professional services and other revenue to account for a decreasing percentage of our total revenue over the long term as we continue to increase our subscriptions and as our customers increase their use of professional services provided by our channel partners and other third parties. However, we expect to continue to provide professional services as an important part of our solution to our customers because digital infrastructure transformation frequently involves core business strategy.
We sell our products through direct field sales, direct inside sales and indirect channel sales. We utilize a wide range of online and offline marketing activities to drive brand awareness, thought leadership, developer trials and lead volume. Many of our customers initially use our product as a free trial by visiting our website, creating an account and testing the free cloud version of our platform. In addition, we offer open source solutions that introduce developers to the key technical concepts and technologies of APIs and mobile app development, and that allow their APIs and applications to be migrated or deployed to our paid products. After signing up, developers are able to experience the power of our platform and learn how to interact with our solutions, enabling them to understand the benefits of our paid products. We use the trial program as a source of lead volume for our direct sales team.
We have achieved significant scale, with a customer base that has grown over 35% from the end of fiscal 2012 to the end of fiscal 2014. Our customers include many leading businesses: 20 of the Fortune 100, five of the top 10 Global 2000 retail brands and six of the top 10 global telecommunications companies as of January 31, 2015. Our solution has been sold to customers in over 30 countries around the world. Our current focus is on acquiring new customers and increasing revenue from our existing customers as they realize the value of our platform and expand the use of our software through additional use cases and broader deployment within their organizations. We are also focused on increasing adoption of our platform through our Apigee developer program.
We have experienced rapid growth in recent periods. Our gross billings were $36.7 million, $43.1 million and $63.8 million in fiscal 2012, 2013 and 2014, respectively, representing growth rates of 18% from fiscal 2012 to fiscal 2013 and 48% from fiscal 2013 to fiscal 2014. Our gross billings were $23.7 million and $37.6 million in the six months ended January 31, 2014 and 2015, respectively, representing a growth rate of 59%. Our total revenue was $27.6 million, $43.2 million and $52.7 million in fiscal 2012, 2013 and 2014, respectively, and $23.4 million and $32.6 million in the six months ended January 31, 2014 and 2015, respectively. AT&T accounted for 38% of our total revenue in fiscal 2012, 36% of our total revenue in fiscal 2013 and 15% of our total revenue in fiscal 2014. For the six months ended January 31, 2014 and 2015, respectively, AT&T accounted for 17% and 6% of our total revenue. Excluding our revenue from AT&T, our total revenue was $17.0 million, $27.5 million and $45.0 million in fiscal 2012, 2013 and 2014, respectively, and $19.4 million and $30.6 million in the six months ended January 31, 2014 and 2015, respectively. No other customer accounted for more than
-57-
Table of Contents
10% of our total revenue in fiscal 2012, 2013 or 2014, or in the six months ended January 31, 2014 and 2015. Our revenue derived from sales to customers located outside the United States was approximately 16%, 16% and 33% in fiscal 2012, 2013 and 2014, respectively, and 33% and 38% in the six months ended January 31, 2014 and 2015, respectively. We expect that sales to customers located outside the United States will continue to comprise a significant portion of our total revenue for the foreseeable future.
We have made substantial investments in developing and improving our platform and solutions, in expanding our sales and marketing capabilities and geographic coverage, and in providing general and administrative resources to support our growth. As a result, we have incurred net losses of $8.3 million, $25.9 million and $60.8 million in fiscal 2012, 2013 and 2014, respectively, and $32.2 million and $26.8 million in the six months ended January 31, 2014 and 2015, respectively. We had an accumulated deficit of $145.9 million and $172.7 million as of July 31, 2014 and January 31, 2015, respectively, and we expect to continue to incur net losses for the foreseeable future. We expect that continued investments will drive further growth in our gross billings and total revenue. While increases in our gross billings and total revenue may trail the increases in our operating expenses in the near term, we expect to realize operating leverage in our business model over the long term. See “Selected Consolidated Financial and Other Data—Certain Key Non-GAAP Financial Metrics” for more information and a reconciliation of gross billings to total revenue.
Key Opportunities and Challenges Affecting Our Performance
Market Adoption of Our Platform
We are affected by the pace at which enterprises adopt APIs, mobile apps and cloud computing, and make the transition to become digital businesses. We believe that the transformation to digital business, enabled by APIs and powerful analytics, is an emerging trend. We believe that we have established a leadership position in this new market, both as a provider of API management and data analytics and also as a thought leader helping to define the architecture and vision of API-enabled and data-driven businesses. We intend to extend our leadership position by continuing to innovate, bringing new technologies to market, and honing best practices and thought leadership by working closely with our global customer base, both at a technology level and with senior executives. The degree to which prospective customers recognize the need to transform their businesses into digital businesses will determine the rate at which we are able to sell our platform to new and existing customers.
Investment in Our API and Predictive Analytics Solutions
We have invested, and intend to continue to invest, in expanding the breadth and depth of our platform to enable organizations to deploy robust APIs, big data, and predictive analytics solutions. We intend to continue to invest in research and development to enhance the application development and technology capabilities of our platform. We have had four significant product releases or enhancements in calendar 2014. We typically provide our customers with updates to our solutions at least monthly in the cloud and quarterly on premises.
Ability to Grow Our Worldwide Sales Capacity
We have invested, and intend to continue to invest, in expanding our sales capacity and improving our sales operations to drive additional revenue and support the growth of our global customer base. We sell our platform through direct field sales, direct inside sales and indirect channel sales. Our sales to date have been primarily through our direct field sales force, which grew nearly 300% from July 31, 2012 to July 31, 2014. We are continuing to develop and expand a partner community to supplement our sales and support operations through system integrators, OEM partners, resellers and other partners to further influence customer decision making and drive adoption of our solutions. Our partners may also co-sell with our direct field sales organization. Our channel partners provide us with additional sales leverage by sourcing new prospects, providing professional services and technical support to existing customers and upselling additional use cases. These channel partners expand our geographic sales reach worldwide, particularly in key international markets in EMEA and APAC. All of these factors will influence timing and overall levels of sales capacity, impacting the rate at which we will be able to acquire customers to drive revenue growth. In fiscal 2014, we derived very limited revenue through our channel partners.
-58-
Table of Contents
Expansion and Upsell Within Our Existing Customer Base
After the initial sale to and successful deployment by a new customer, we focus on expanding our relationship with the customer to sell additional software licenses and add-on features of our current platform. Historically, we have often realized sales of additional software licenses and add-on features on prior versions of our Apigee Edge platform as well. However, upon the introduction of our current platform in August 2012, there was no viable migration path for transitioning existing customers to the current Apigee Edge platform. Accordingly, we believe our upsell opportunities with customers on our prior platforms to be limited. We expect our opportunity to expand our customer relationships through additional sales to increase as we add new customers to the current Apigee Edge platform, broaden our product portfolio to meet additional mobile IT requirements, increase the benefits provided to both users and the enterprise and enhance platform functionality. Additional sales over the lifecycle of a customer relationship can significantly increase the return on our sales and marketing investments. Accordingly, our financial performance will depend in part on the degree to which our expansion and upsell sales strategy is successful.
Mix of Products Sold as Subscription and Perpetual Licenses
We offer our customers the flexibility to use our software as a cloud service or on premises. For those customers that use our platform as a cloud service, we license our software on a subscription basis. For those customers that use our platform on premises, we offer two licensing options, a time-based license or a perpetual license. In addition, we also offer our customers software support and professional services. We expect the proportion of our subscription and support revenue to our total revenue to increase over time. However, because we recognize subscription and term revenue ratably over the duration of the related contracts, increases in total revenue will lag any increase in subscription arrangements. Furthermore, the unpredictability of the timing of our receipt of orders for perpetual licenses, the revenue for which we typically recognize upfront, may cause fluctuations in our quarterly financial results.
Future Investment in Growth and Product Development
We intend to extend our leadership position by continuing to innovate, bringing new technologies to market, and honing best practices and thought leadership by working closely with our global customer base, both at a technology level and with senior executives. We intend to continue building innovative software products that extend the value of our existing offering and further help enterprises realize digital business success, through new growth and operational efficiencies. We develop technology to address emerging technology markets such as the IoT. We have steadily increased our focus on partner and channel development efforts to drive efficient new customer acquisition across geographies and industries. We believe that there is substantial opportunity to grow our international business. We plan to continue to aggressively market to customers located outside the United States by building partnerships that help us add customers internationally and by expanding our direct and indirect sales channels outside the United States and EMEA.
Components of Our Operating Results
Revenue
License Revenue. License revenue reflects the revenue recognized from sales of on-premises software licenses. A substantial majority of our license revenue consists of revenue from perpetual licenses, under which we generally recognize the license fee portion of the arrangement upfront, assuming all revenue recognition criteria are satisfied. Customers can also purchase time-based licenses, under which we typically recognize the license fee ratably over the term of the license after all other revenue recognition criteria are met. Due to the differing revenue recognition criteria applicable to perpetual and time-based licenses, shifts in the mix between perpetual and time-based licenses from quarter to quarter could produce substantial variation in the revenue we recognize.
-59-
Table of Contents
Subscription and Support Revenue. We generate subscription and support revenue primarily from subscription fees from the customer accessing our software in the cloud. We also generate revenue from maintenance and support agreements with customers for on-premises licenses, which represented approximately 10% of our total revenue for fiscal 2012, 2013 and 2014. Going forward, we expect our maintenance and support revenue to remain flat or to account for a decreasing percentage of our total revenue over the long term. We typically recognize subscription and support revenue ratably over the term of the arrangement after all other revenue recognition criteria are met.
To assess our renewals with respect to our licenses, we utilize a dollar–based renewal rate, which is calculated by the dollar value of renewed contracts divided by the dollar value of expiring contracts in any given period. During the six months ended January 31, 2015, our subscription and time-based licenses that were eligible for renewal were renewed at a dollar-based renewal rate of approximately 85%. The dollar-based renewal rate for the six months ended January 31, 2015, is not necessarily indicative of our dollar-based renewal rate for a full year or any future period.
Professional Services and Other Revenue. Professional services and other revenue consists of fees recognized from consulting services. We recognize fees from consulting services as revenue as the services are performed. We recognize fees from time and material services as revenue as services are rendered based on inputs to the project, such as billable hours incurred, after all other revenue recognition criteria are met. For fixed-fee professional service arrangements, we recognize revenue under the proportional performance method of accounting and estimate the proportional performance on a monthly basis, utilizing hours incurred to date as a percentage of the total estimated hours to complete the project. If we do not have a sufficient basis to measure progress towards completion, we recognize revenue upon completion of the arrangement.
Our professional services and other revenue represented 40% of our total revenue for fiscal 2014. We have experienced continued growth in our professional services and other revenue primarily due to the deployment of our software with some customers that have large, highly complex IT environments. However, going forward, we expect our professional services and other revenue to account for a decreasing percentage of our total revenue over the long term as we continue to increase our subscription and support revenue and as our customers increase their use of professional services provided by our channel partners and other third parties. We have also started to refer professional services opportunities to our partners and have started to field requests from customers to use their current third-party service providers for professional services engagements.
Cost of Revenue
Cost of License Revenue. Cost of license revenue consists primarily of the cost of third-party software royalties and amortization of acquired intangible assets.
Cost of Subscription and Support Revenue. Cost of subscription and support revenue includes all direct costs to deliver our cloud-based solution and software support, including salaries, benefits and stock-based compensation for our customer support organization, third-party hosting costs, third-party software royalties, allocated overhead for facilities and IT, and amortization of acquired intangible assets.
Cost of Professional Services and Other Revenue. Cost of professional services and other revenue includes salaries, benefits and stock-based compensation for our professional services organization, consulting services and allocated overhead for facilities and IT.
Gross Profit and Gross Margin
Gross profit, or total revenue less total cost of revenue, and gross margin, or gross profit as a percentage of total revenue, has been and will continue to be affected by various factors, including the mix among our license, subscription and professional services and other revenue, the costs associated with third-party hosting facilities and the extent to which we expand our customer support and professional services organizations. Our gross margin on license revenue and subscription and support revenue is significantly higher than our gross margin on
-60-
Table of Contents
professional services and other revenue, and our gross margin on license revenue is significantly higher than our gross margin on subscription and support revenue. We expect our gross margin to increase modestly over the long term, although our gross margin will fluctuate from period to period depending on the interplay of all of these factors.
Operating Expenses
We classify our operating expenses into three categories: research and development, sales and marketing, and general and administrative. For each category, the largest component is personnel costs, which include salaries and bonuses, employee benefits costs, stock-based compensation and, in the case of sales and marketing expenses, sales commissions. Operating expenses also include allocated overhead costs for facilities and IT, which include compensation of personnel and costs associated with our facilities and IT infrastructure.
Research and Development. Research and development expenses primarily consist of personnel costs and allocated overhead attributable to our research and development personnel. We have devoted our product development efforts primarily to enhancing the functionality and expanding the capabilities of our software platform. We intend to continue to make significant investments in research and development to enhance and further develop our platform. As a result, we expect our research and development expenses to continue to increase in dollar amount for the foreseeable future. However, we expect our research and development expenses to decrease as a percentage of our total revenue over the long term, although our research and development expenses may fluctuate as a percentage of our total revenue from period to period.
Sales and Marketing. Sales and marketing expenses primarily consist of personnel costs and allocated overhead for our sales, marketing and business development personnel, commissions earned by our sales personnel, and the cost of marketing and business development programs. We intend to continue to make significant investments in sales and marketing to drive additional revenue and grow our global customer base. As a result, we expect our sales and marketing expenses to increase in dollar amount and to continue to be our largest operating expenses category as we continue to grow our global customer base and expand our geographic coverage. However, we expect our sales and marketing expenses to decrease as a percentage of our total revenue over the long term, although our sales and marketing expenses may fluctuate as a percentage of our total revenue from period to period.
General and Administrative. General and administrative expenses primarily consist of personnel costs and allocated overhead for our executive and administrative personnel, legal, accounting and other professional services fees, and other corporate expenses. We have recently incurred, and expect to continue to incur, additional general and administrative expenses to support the growth of our operations and to prepare to operate as a public company. As a result, we expect our general and administrative expenses to increase in dollar amount for the foreseeable future. However, we expect our general and administrative expenses to decrease as a percentage of our total revenue over the long term, although our general and administrative expenses may fluctuate as a percentage of our total revenue from period to period.
Other Income (Expense), Net
Other income (expense), net consists primarily of the changes in the fair value of common stock warrants, foreign currency exchange gains or losses, interest expense on outstanding debt and interest income earned on our cash and cash equivalents balances.
Provision for Income Taxes
Provision for income taxes is based on the amount of earnings and enacted federal, state and foreign tax rates and is adjusted for allowable credits and deductions. Our provision for income taxes consists of state and foreign taxes. Our income tax provision may be significantly affected by changes to our estimates for tax in jurisdictions in which we operate and other estimates utilized in determining the global effective tax rate.
-61-
Table of Contents
Because of our history of U.S. net operating losses, we have established a full valuation allowance against potential future benefits for our U.S. deferred tax assets including loss carryforwards and research and development and other tax credits. Our income tax provision could be significantly impacted by estimates surrounding our uncertain tax positions and changes to our valuation allowance in future periods. We reevaluate the judgments surrounding our estimates and make adjustments as appropriate each reporting period. See Note 7 of our audited consolidated financial statements appearing elsewhere in this prospectus for more information concerning our provision for income taxes.
Results of Operations
The following tables set forth our results of operations for the periods presented and as a percentage of our total revenue for those periods. The period-to-period comparison of financial results are not necessarily indicative of financial results to be achieved in future periods.
| Fiscal Year Ended July 31, |
Six Months Ended January 31, |
|||||||||||||||||||
| 2012 | 2013 | 2014 | 2014 | 2015 | ||||||||||||||||
| (unaudited) | ||||||||||||||||||||
| (in thousands) | ||||||||||||||||||||
| Consolidated Statement of Operations Data: |
||||||||||||||||||||
| Revenue |
||||||||||||||||||||
| License |
$ | 9,452 | $ | 13,917 | $ | 11,411 | $ | 3,566 | $ | 9,522 | ||||||||||
| Subscription and support |
7,308 | 15,243 | 20,237 | 9,651 | 14,164 | |||||||||||||||
| Professional services and other |
10,847 | 13,992 | 21,054 | 10,200 | 8,929 | |||||||||||||||
|
|
|
|
|
|
|
|
|
|
|
|||||||||||
| Total revenue |
27,607 | 43,152 | 52,702 | 23,417 | 32,615 | |||||||||||||||
| Cost of revenue |
||||||||||||||||||||
| License |
157 | 108 | 366 | 88 | 257 | |||||||||||||||
| Subscription and support(1) |
3,484 | 9,286 | 11,911 | 7,425 | 5,367 | |||||||||||||||
| Professional services and other(1) |
8,352 | 12,435 | 15,431 | 7,847 | 7,044 | |||||||||||||||
|
|
|
|
|
|
|
|
|
|
|
|||||||||||
| Total cost of revenue |
11,993 | 21,829 | 27,708 | 15,360 | 12,668 | |||||||||||||||
|
|
|
|
|
|
|
|
|
|
|
|||||||||||
| Gross profit |
15,614 | 21,323 | 24,994 | 8,057 | 19,947 | |||||||||||||||
| Operating expenses |
||||||||||||||||||||
| Research and development(1) |
10,922 | 16,848 | 22,273 | 9,152 | 14,385 | |||||||||||||||
| Sales and marketing(1) |
9,801 | 23,812 | 47,029 | 22,456 | 25,174 | |||||||||||||||
| General and administrative(1) |
4,033 | 5,885 | 14,415 | 6,767 | 6,704 | |||||||||||||||
|
|
|
|
|
|
|
|
|
|
|
|||||||||||
| Total operating expenses |
24,756 | 46,545 | 83,717 | 38,375 | 46,263 | |||||||||||||||
|
|
|
|
|
|
|
|
|
|
|
|||||||||||
| Operating loss |
(9,142 | ) | (25,222 | ) | (58,723 | ) | (30,318 | ) | (26,316 | ) | ||||||||||
| Other income (expense), net |
1,228 | (376 | ) | (1,678 | ) | (1,757 | ) | (290 | ) | |||||||||||
|
|
|
|
|
|
|
|
|
|
|
|||||||||||
| Loss before income taxes |
(7,914 | ) | (25,598 | ) | (60,401 | ) | (32,075 | ) | (26,606 | ) | ||||||||||
| Provision for income taxes |
367 | 273 | 392 | 137 | 203 | |||||||||||||||
|
|
|
|
|
|
|
|
|
|
|
|||||||||||
| Net loss |
$ | (8,281 | ) | $ | (25,871 | ) | $ | (60,793 | ) | $ | (32,212 | ) | $ | (26,809 | ) | |||||
|
|
|
|
|
|
|
|
|
|
|
|||||||||||
-62-
Table of Contents
| (1) | Includes stock-based compensation expense as follows: |
| Fiscal Year Ended July 31, |
Six Months Ended January 31, |
|||||||||||||||||||
| 2012 | 2013 | 2014 | 2014 | 2015 | ||||||||||||||||
| (unaudited) | ||||||||||||||||||||
| (in thousands) | ||||||||||||||||||||
| Cost of subscription and support revenue |
$ | 2 | $ | 21 | $ | 24 | $ | 12 | $ | 13 | ||||||||||
| Cost of professional services and other revenue |
30 | 65 | 133 | 47 | 91 | |||||||||||||||
| Research and development |
74 | 114 | 490 | 135 | 453 | |||||||||||||||
| Sales and marketing |
55 | 138 | 1,090 | 146 | 319 | |||||||||||||||
| General and administrative |
20 | 70 | 989 | 430 | 571 | |||||||||||||||
|
|
|
|
|
|
|
|
|
|
|
|||||||||||
| Total stock-based compensation expense |
$ | 181 | $ | 408 | $ | 2,726 | $ | 770 | $ | 1,447 | ||||||||||
|
|
|
|
|
|
|
|
|
|
|
|||||||||||
| Fiscal Year Ended July 31, |
Six Months Ended January 31, |
|||||||||||||||||||
| 2012 | 2013 | 2014 | 2014 | 2015 | ||||||||||||||||
| (as a percentage of total revenue) (unaudited) | ||||||||||||||||||||
| Consolidated Statement of Operations Data: |
||||||||||||||||||||
| Revenue |
||||||||||||||||||||
| License |
34.2 | % | 32.3 | % | 21.7 | % | 15.2 | % | 29.2 | % | ||||||||||
| Subscription and support |
26.5 | 35.3 | 38.4 | 41.2 | 43.4 | |||||||||||||||
| Professional services and other |
39.3 | 32.4 | 39.9 | 43.6 | 27.4 | |||||||||||||||
|
|
|
|
|
|
|
|
|
|
|
|||||||||||
| Total revenue |
100.0 | 100.0 | 100.0 | 100.0 | 100.0 | |||||||||||||||
| Cost of revenue |
||||||||||||||||||||
| License |
0.6 | 0.3 | 0.7 | 0.4 | 0.8 | |||||||||||||||
| Subscription and support |
12.6 | 21.5 | 22.6 | 31.7 | 16.4 | |||||||||||||||
| Professional services and other |
30.3 | 28.8 | 29.3 | 33.5 | 21.6 | |||||||||||||||
|
|
|
|
|
|
|
|
|
|
|
|||||||||||
| Total cost of revenue |
43.5 | 50.6 | 52.6 | 65.6 | 38.8 | |||||||||||||||
|
|
|
|
|
|
|
|
|
|
|
|||||||||||
| Gross profit |
56.5 | 49.4 | 47.4 | 34.4 | 61.2 | |||||||||||||||
| Operating expenses |
||||||||||||||||||||
| Research and development |
39.6 | 39.0 | 42.3 | 39.1 | 44.1 | |||||||||||||||
| Sales and marketing |
35.5 | 55.2 | 89.2 | 95.9 | 77.2 | |||||||||||||||
| General and administrative |
14.6 | 13.6 | 27.4 | 28.9 | 20.6 | |||||||||||||||
|
|
|
|
|
|
|
|
|
|
|
|||||||||||
| Total operating expenses |
89.7 | 107.8 | 158.9 | 163.9 | 141.9 | |||||||||||||||
|
|
|
|
|
|
|
|
|
|
|
|||||||||||
| Operating loss |
(33.2 | ) | (58.4 | ) | (111.5 | ) | (129.5 | ) | (80.7 | ) | ||||||||||
| Other income (expense), net |
4.4 | (0.9 | ) | (3.2 | ) | (7.5 | ) | (0.9 | ) | |||||||||||
|
|
|
|
|
|
|
|
|
|
|
|||||||||||
| Loss before income taxes |
(28.8 | ) | (59.3 | ) | (114.7 | ) | (137.0 | ) | (81.6 | ) | ||||||||||
| Provision for income taxes |
1.3 | 0.6 | 0.7 | 0.6 | 0.6 | |||||||||||||||
|
|
|
|
|
|
|
|
|
|
|
|||||||||||
| Net loss |
(30.1 | )% | (59.9 | )% | (115.4 | )% | (137.6 | )% | (82.2 | )% | ||||||||||
|
|
|
|
|
|
|
|
|
|
|
|||||||||||
-63-
Table of Contents
Six Months Ended January 31, 2014 and 2015
Revenue
| Six Months Ended January 31, |
% Change |
|||||||||||
| 2014 | 2015 | |||||||||||
| (unaudited) |
||||||||||||
| Revenue |
||||||||||||
| License |
$ | 3,566 | $ | 9,522 | 167.0 | % | ||||||
| Subscription and support |
9,651 | 14,164 | 46.8 | % | ||||||||
| Professional services and other |
10,200 | 8,929 | (12.5 | )% | ||||||||
|
|
|
|
|
|||||||||
| Total revenue |
$ | 23,417 | $ | 32,615 | 39.3 | % | ||||||
|
|
|
|
|
|||||||||
| Percentage of revenue |
||||||||||||
| License |
15.2 | % | 29.2 | % | ||||||||
| Subscription and support |
41.2 | 43.4 | ||||||||||
| Professional services and other |
43.6 | 27.4 | ||||||||||
|
|
|
|
|
|||||||||
| Total |
100.0 | % | 100.0 | % | ||||||||
|
|
|
|
|
|||||||||
Total revenue increased $9.2 million, or 39%, in the six months ended January 31, 2015, compared to six months ended January 31, 2014, primarily due to an increase in license revenue of $6.0 million, or 167%, and growth in subscription and support revenue of $4.5 million, or 47%. The increase in license revenue was driven primarily by growth in our on-premises deployments. The decline in professional services and other revenue of $1.3 million, or 13%, was primarily due to professional services and other revenue we recognized from AT&T in the six months ended January 31, 2014. AT&T accounted for 17% of our total revenue in the six months ended January 31, 2014, and 6% of total revenue in the six months ended January 31, 2015. No other customers accounted for more than 10% of our total revenue in the six months ended January 31, 2014 or 2015. Excluding revenue from AT&T, our total revenue increased $11.1 million, or 57%, in the six months ended January 31, 2015, compared to the six months ended January 31, 2014. Excluding our license revenue from AT&T, our license revenue increased $5.9 million, or 166%, in the six months ended January 31, 2015, compared to the six months ended January 31, 2014. Excluding our subscription and support revenue from AT&T, our subscription and support revenue increased $4.6 million, or 51%, in the six months ended January 31, 2015, compared to the six months ended January 31, 2014. Excluding our professional services and other revenue from AT&T, our professional services and other revenue increased $0.6 million, or 9%, in the six months ended January 31, 2015, compared to the six months ended January 31, 2014. We also experienced an increase in the proportion of our total revenue that we derive from customers located outside the United States, rising from 33% in the six months ended January 31, 2014 to 38% in the six months ended January 31, 2015.
-64-
Table of Contents
Cost of Revenue and Gross Margin
| Six Months Ended January 31, |
% Change | |||||||||||
| 2014 | 2015 | |||||||||||
| (unaudited) | ||||||||||||
| (dollar amounts in thousands) |
||||||||||||
| Cost of revenue |
||||||||||||
| License |
$ | 88 | $ | 257 | 192.0 | % | ||||||
| Subscription and support |
7,425 | 5,367 | (27.7 | )% | ||||||||
| Professional services and other |
7,847 | 7,044 | (10.2 | )% | ||||||||
|
|
|
|
|
|||||||||
| Total cost of revenue |
$ | 15,360 | $ | 12,668 | (17.5 | )% | ||||||
|
|
|
|
|
|||||||||
| Gross margin |
||||||||||||
| License |
97.5 | % | 97.3 | % | ||||||||
| Subscription and support |
23.1 | % | 62.1 | % | ||||||||
| Professional services and other |
23.1 | % | 21.1 | % | ||||||||
|
|
|
|
|
|||||||||
| Total gross margin |
34.4 | % | 61.2 | % | ||||||||
|
|
|
|
|
|||||||||
Total cost of revenue decreased $2.7 million, or 18%, in the six months ended January 31, 2015, compared to the six months ended January 31, 2014, primarily due to a decrease in cost of subscription and support revenue of $2.1 million, or 28%, and a decrease in cost of professional services and other revenue of $0.8 million, or 10%. The decrease in cost of subscription and support revenue primarily reflected $1.1 million in decreased salaries and benefits and stock-based compensation costs due to decreased headcount in our customer support organization and a $0.8 million decrease in third-party hosting and consulting costs as we gained efficiencies in our customer support organization and substantially completed the migration of customers to our current digital platform. The decrease in cost of professional services and other revenue primarily reflected a $0.9 million decrease in third-party consulting costs as we gained efficiencies in our professional services organization. Cost of license revenue was nominal in both periods.
Total gross margin increased due to the impact of revenue mix between our license, subscription and support and professional services and other revenue. More specifically, our license revenue accounted for a significantly higher percentage of our total revenue in the six months ended January 31, 2015, compared to the six months ended January 31, 2014. This increase in total gross margin also reflected increased efficiencies in our customer support organization and substantial completion of customer migration to our current digital platform. In addition, this increase was partially offset by a decline in gross margin realized on our professional services and other revenue as we continued to expand our professional services organizations to support our growing customer base.
-65-
Table of Contents
Operating Expenses
| Six Months Ended January 31, |
% Change | |||||||||||
| 2014 | 2015 | |||||||||||
| (unaudited) (dollar amounts in |
||||||||||||
| Operating expenses |
||||||||||||
| Research and development |
$ | 9,152 | $ | 14,385 | 57.2 | % | ||||||
| Sales and marketing |
22,456 | 25,174 | 12.1 | % | ||||||||
| General and administrative |
6,767 | 6,704 | (0.9 | )% | ||||||||
|
|
|
|
|
|||||||||
| Total operating expenses |
$ | 38,375 | $ | 46,263 | 20.6 | % | ||||||
| Percentage of revenue |
||||||||||||
| Research and development |
39.1 | % | 44.1 | % | ||||||||
| Sales and marketing |
95.9 | 77.2 | ||||||||||
| General and administrative |
28.9 | 20.6 | ||||||||||
|
|
|
|
|
|||||||||
| Total operating expenses |
163.9 | % | 141.9 | % | ||||||||
|
|
|
|
|
|||||||||
Research and Development Expense
Research and development expense increased $5.2 million, or 57%, in the six months ended January 31, 2015, compared to the six months ended January 31, 2014, primarily due to a $5.0 million increase in salaries and benefits expense and stock-based compensation as we increased engineering headcount to support ongoing development and enhancement of our product offerings.
Sales and Marketing Expense
Sales and marketing expense increased $2.7 million, or 12%, in the six months ended January 31, 2015, compared to the six months ended January 31, 2014, primarily due to a $3.0 million increase in salaries and benefits expense and stock-based compensation as we increased head count to expand our sales operations as well as increased commissions reflecting our higher sales levels.
General and Administrative Expense
General and administrative expense was relatively flat in the six months ended January 31, 2015, compared to the six months ended January 31, 2014, and primarily related to a $0.8 million increase in personnel-related expenses to support our overall growth partially offset by a decrease of $0.7 million in professional services fees related to accounting, legal and recruiting activities.
Other Income (Expense), Net
| Six Months Ended January 31, |
% Change | |||||||||||
| 2014 | 2015 | |||||||||||
| (unaudited) (dollar amounts in |
||||||||||||
| Other income (expense), net |
$ | (1,757 | ) | $ | (290 | ) | (83.5 | )% | ||||
| Percentage of revenue |
||||||||||||
| Other income (expense), net |
(7.5 | )% | (0.9 | )% | ||||||||
-66-
Table of Contents
Other income (expense), net decreased primarily due to $1.6 million of expense associated with the revaluation of our common stock warrants during the six months ended January 31, 2014, that did not recur in the six months ended January 31, 2015.
| Six Months Ended January 31, |
% Change | |||||||||||
| 2014 | 2015 | |||||||||||
| (unaudited) | ||||||||||||
| (dollar amounts in thousands) |
||||||||||||
| Provision for income taxes |
$ | 137 | $ | 203 | 48.2 | % | ||||||
| Percentage of revenue |
||||||||||||
| Provision for income taxes |
0.6 | % | 0.6 | % | ||||||||
Provision for income taxes remained flat in the six months ended January 31, 2015, compared to the six months ended January 31, 2014, and primarily relates to state and foreign taxes.
Fiscal 2012, Fiscal 2013 and Fiscal 2014
Revenue
| Fiscal Year
Ended July 31, |
2012 to 2013 % Change |
2013 to 2014 % Change |
||||||||||||||||||
| 2012 | 2013 | 2014 | ||||||||||||||||||
| (dollar amounts in thousands) | ||||||||||||||||||||
| Revenue |
||||||||||||||||||||
| License |
$ | 9,452 | $ | 13,917 | $ | 11,411 | 47.2 | % | (18.0 | )% | ||||||||||
| Subscription and support |
7,308 | 15,243 | 20,237 | 108.6 | % | 32.8 | % | |||||||||||||
| Professional services and other |
10,847 | 13,992 | 21,054 | 29.0 | % | 50.5 | % | |||||||||||||
|
|
|
|
|
|
|
|||||||||||||||
| Total revenue |
$ | 27,607 | $ | 43,152 | $ | 52,702 | 56.3 | % | 22.1 | % | ||||||||||
|
|
|
|
|
|
|
|||||||||||||||
| Percentage of revenue |
||||||||||||||||||||
| License |
34.2 | % | 32.3 | % | 21.7 | % | ||||||||||||||
| Subscription and support |
26.5 | 35.3 | 38.4 | |||||||||||||||||
| Professional services and other |
39.3 | 32.4 | 39.9 | |||||||||||||||||
|
|
|
|
|
|
|
|||||||||||||||
| Total |
100.0 | % | 100.0 | % | 100.0 | % | ||||||||||||||
|
|
|
|
|
|
|
|||||||||||||||
Fiscal 2013 Compared to Fiscal 2014. Total revenue increased $9.6 million, or 22%, in fiscal 2014 compared to fiscal 2013, primarily due to an increase in subscription and support revenue of $5.0 million, or 33%, and growth in professional services and other revenue of $7.1 million, or 51%. The increase in subscription and support revenue was driven primarily by growth in the number of customers adopting our cloud-based solution and an increase in revenue from software support as a result of on-premises software licenses that increased our cumulative installed base of customers that pay for recurring software support fees. The increase in professional services and other revenue was primarily due to an increase in sales of consulting services reflecting the overall growth in our business. The decline in license revenue of $2.5 million, or 18%, in fiscal 2014 compared to fiscal 2013, was due to $8.0 million of license revenue we recognized from AT&T in fiscal 2013, which was not ongoing in fiscal 2014 and which we considered to be abnormally large given the Company’s operating results at the time. AT&T accounted for 36% of our total revenue, 54% of our license revenue, 10% of our subscription and support revenue and 47% of our professional services and other revenue in fiscal 2013 compared to 15% of our total revenue, 7% of our subscription and support revenue and 30% of our professional services and other revenue in fiscal 2014. No other customer accounted for more than 10% of our total revenue in fiscal 2013 or 2014. Excluding revenue from AT&T, our total revenue increased $17.5 million, or 64%, in fiscal 2014 compared to fiscal 2013. Excluding our license revenue from AT&T, our license revenue increased
-67-
Table of Contents
$5.0 million, or 78%, in fiscal 2014 compared to fiscal 2013, driven by growth in our on-premises deployments. Excluding our subscription and support revenue from AT&T, our subscription and support revenue increased $5.1 million, or 37%, in fiscal 2014 compared to fiscal 2013. Excluding our professional services and other revenue from AT&T, our professional services and other revenue increased $7.4 million, or 100%, in fiscal 2014 compared to fiscal 2013. In fiscal 2014, we also experienced an increase in the proportion of our total revenue that we derive from customers located outside the United States, rising from 16% in fiscal 2013 to 33% in fiscal 2014.
Fiscal 2012 Compared to Fiscal 2013. Total revenue increased $15.5 million, or 56%, in fiscal 2013 compared to fiscal 2012, primarily due to growth in subscription and support revenue of $7.9 million, or 109%, the increase in license revenue of $4.5 million, or 47%, and to a lesser extent the increase in professional services and other revenue of $3.1 million, or 29%. The increase in subscription and support revenue was driven primarily by growth in the number of customers adopting our cloud-based solution. The increase in professional services and other revenue was primarily due to an increase in sales of consulting services reflecting our growing customer base. The increase in license revenue was due to revenue that we recognized from AT&T. AT&T accounted for 38% of our total revenue, 35% of our license revenue, 20% of our subscription and support revenue and 53% of our professional services and other revenue in fiscal 2012 compared to 36% of our total revenue, 54% of our license revenue, 10% of our subscription and support revenue and 47% of our professional services and other revenue in fiscal 2013. No other customer accounted for more than 10% of our total revenue in fiscal 2012 or 2013. Excluding revenue from AT&T, our total revenue increased $10.4 million, or 61%, in fiscal 2013 compared to fiscal 2012. Excluding our license and subscription and support revenue from AT&T, our license revenue increased $0.3 million, or 5%, in fiscal 2013 compared to fiscal 2012 and our subscription and support revenue increased $7.8 million, or 133%, driven by growth in the number of customers accessing our software in the cloud. Excluding the professional services and other revenue from AT&T, professional services and other revenue increased $2.3 million, or 46%, in fiscal 2013 compared to fiscal 2012, primarily due to an increase in sales of consulting services reflecting our growing customer base.
Cost of Revenue and Gross Margin
| Fiscal Year
Ended July 31, |
2012 to 2013 % Change |
2013 to 2014 % Change |
||||||||||||||||||
| 2012 | 2013 | 2014 | ||||||||||||||||||
| (dollar amounts in thousands) | ||||||||||||||||||||
| Cost of revenue |
||||||||||||||||||||
| License |
$ | 157 | $ | 108 | $ | 366 | (31.2 | )% | 238.9 | % | ||||||||||
| Subscription and support |
3,484 | 9,286 | 11,911 | 166.5 | % | 28.3 | % | |||||||||||||
| Professional services and other |
8,352 | 12,435 | 15,431 | 48.9 | % | 24.1 | % | |||||||||||||
|
|
|
|
|
|
|
|||||||||||||||
| Total cost of revenue |
$ | 11,993 | $ | 21,829 | $ | 27,708 | 82.0 | % | 26.9 | % | ||||||||||
|
|
|
|
|
|
|
|||||||||||||||
| Gross margin |
||||||||||||||||||||
| License |
98.3 | % | 99.2 | % | 96.8 | % | ||||||||||||||
| Subscription and support |
52.3 | % | 39.1 | % | 41.1 | % | ||||||||||||||
| Professional services and other |
23.0 | % | 11.1 | % | 26.7 | % | ||||||||||||||
|
|
|
|
|
|
|
|||||||||||||||
| Total gross margin |
56.6 | % | 49.4 | % | 47.4 | % | ||||||||||||||
|
|
|
|
|
|
|
|||||||||||||||
Fiscal 2013 Compared to Fiscal 2014. Total cost of revenue increased $5.9 million, or 27%, in fiscal 2014 compared to fiscal 2013, primarily due to an increase in cost of subscription and support revenue of $2.6 million, or 28%, and an increase in cost of professional services and other revenue of $3.0 million, or 24%. The increase in cost of subscription and support revenue primarily reflected $1.4 million in increased salaries and benefits costs and stock-based compensation due to increased headcount in our customer support organization to support our growing customer base and $0.7 million of third-party hosting costs as we increased our data center capacity to migrate customers to our current digital platform and to support our customer growth, $0.3 million related to the
-68-
Table of Contents
amortization of acquired intangible assets and $0.6 million related to facilities and other overhead costs partially offset by a decrease of $0.5 million in third-party consulting services. The increase in cost of professional services and other revenue primarily reflected $3.1 million in increased salaries and benefits costs and stock-based compensation due to increased headcount in our professional services organization to support our growing customer base and to support customers migrating to our current digital platform, $0.5 million related to facilities and other overhead costs, partially offset by a decrease of $0.9 million of deferred costs of revenue recognized in accordance with the Company’s revenue recognition policy. Cost of license revenue was nominal in both periods.
Total gross margin decreased in fiscal 2014 compared to fiscal 2013 due to the impact of revenue mix between our license, subscription and support and professional services and other revenue. This decline in total gross margin reflected growth in the number of customers accessing our software in the cloud, which has lower gross margins and the costs associated with third-party hosting facilities. In addition, this decline also reflected lower gross margin realized on our professional services and other revenue as we continued to expand our customer support and professional services organizations to support our growing customer base.
Fiscal 2012 Compared to Fiscal 2013. Total cost of revenue increased $9.8 million, or 82%, in fiscal 2013 compared to fiscal 2012, due to an increase in cost of subscription and support revenue of $5.8 million, or 167%, and an increase in cost of professional services and other revenue of $4.1 million, or 49%. The increase in cost of subscription and support revenue primarily reflected $2.2 million in increased salaries and benefits costs and stock-based compensation due to increased headcount in our customer support organization to support our growing customer base and $2.5 million of third-party hosting costs as we increased our data center capacity to migrate customers to our current digital platform and to support our customer growth. The increase in cost of professional services and other revenue primarily reflected $3.6 million in increased salaries and benefits costs and stock-based compensation due to increased headcount in our professional services organization to support our growing customer base and to support customers migrating to our current digital platform, and $1.5 million of deferred costs of revenue recognized in accordance with the Company’s revenue recognition policy. Cost of license revenue was nominal in both periods.
Total gross margin decreased in fiscal 2013 compared to fiscal 2012 primarily due to our significant investments made to migrate customers to our current digital platform, and expansion of our customer support and professional services organizations to support our growing customer base, as well as the impact of revenue mix among our license, subscription and support and professional services and other revenue.
Operating Expenses
| Fiscal Year
Ended July 31, |
2012 to 2013 % Change |
2013 to 2014 % Change |
||||||||||||||||||
| 2012 | 2013 | 2014 | ||||||||||||||||||
| (dollar amounts in thousands) | ||||||||||||||||||||
| Operating expenses |
||||||||||||||||||||
| Research and development |
$ | 10,922 | $ | 16,848 | $ | 22,273 | 54.3 | % | 32.2 | % | ||||||||||
| Sales and marketing |
9,801 | 23,812 | 47,029 | 143.0 | % | 97.5 | % | |||||||||||||
| General and administrative |
4,033 | 5,885 | 14,415 | 45.9 | % | 144.9 | % | |||||||||||||
|
|
|
|
|
|
|
|||||||||||||||
| Total operating expenses |
$ | 24,756 | $ | 46,545 | $ | 83,717 | 88.0 | % | 79.9 | % | ||||||||||
|
|
|
|
|
|
|
|||||||||||||||
| Percentage of revenue |
||||||||||||||||||||
| Research and development |
39.6 | % | 39.0 | % | 42.3 | % | ||||||||||||||
| Sales and marketing |
35.5 | % | 55.2 | % | 89.2 | % | ||||||||||||||
| General and administrative |
14.6 | % | 13.6 | % | 27.4 | % | ||||||||||||||
|
|
|
|
|
|
|
|||||||||||||||
| Total operating expenses |
89.7 | % | 107.8 | % | 158.9 | % | ||||||||||||||
|
|
|
|
|
|
|
|||||||||||||||
-69-
Table of Contents
Research and Development Expense
Fiscal 2013 Compared to Fiscal 2014. Research and development expense increased $5.4 million, or 32%, in fiscal 2014 compared to fiscal 2013, primarily due to a $5.0 million increase in salaries and benefits expense and stock-based compensation as we increased engineering headcount to support ongoing development and enhancement of our product offerings and a $0.7 million increase in allocated overhead costs for facilities and IT. This increase was partially offset by a $0.3 million decrease in third-party consulting fees as a result of our shifting resources from contractors to full-time employees.
Fiscal 2012 Compared to Fiscal 2013. Research and development expense increased $5.9 million, or 54%, in fiscal 2013 compared to fiscal 2012, primarily due to a $4.5 million increase in salaries and benefits expense and stock-based compensation as we increased engineering headcount to support ongoing development and enhancement of our product offerings as well as $1.1 million increase in allocated overhead costs for facilities and IT.
Sales and Marketing Expense
Fiscal 2013 Compared to Fiscal 2014. Sales and marketing expense increased $23.2 million, or 98%, in fiscal 2014 compared to fiscal 2013, primarily due to a $16.7 million increase in salaries and benefits expense and stock-based compensation as we increased headcount to expand our sales operations, as well as increased commissions reflecting our higher sales levels. The increased expenses in fiscal 2014 also reflected an increase in marketing related expenditures of $2.7 million as we expanded customer programs and lead generation activities, travel related expenses of $2.0 million due to increased headcount and allocated overhead costs for facilities and IT of $2.2 million, which were partially offset by a $0.4 million decrease in third-party consulting fees.
Fiscal 2012 Compared to Fiscal 2013. Sales and marketing expense increased $14.0 million, or 143%, in fiscal 2013 compared to fiscal 2012, primarily due to a $9.6 million increase in salaries and benefits expense and stock-based compensation as we expanded our sales operations internationally, a $2.8 million increase in recruiting and third-party consulting and professional services fees, $1.0 million in increased travel related expenses, and an increase in allocated overhead costs for facilities and IT of $0.4 million.
General and Administrative Expense
Fiscal 2013 Compared to Fiscal 2014. General and administrative expense increased $8.5 million, or 145%, in fiscal 2014 compared to fiscal 2013, primarily due to a $4.1 million increase in salaries and benefits and stock-based compensation as we increased general and administrative headcount, including our executive management team, to support our overall growth. The increased expenses in fiscal 2014 also reflected an increase of $3.8 million in third-party consulting and professional services fees related to audit, accounting and legal activities, and increases of $0.2 million in allocated overhead costs for facilities and IT.
Fiscal 2012 Compared to Fiscal 2013. General and administrative expense increased $1.9 million, or 46%, in fiscal 2013 compared to fiscal 2012, primarily due to a $1.8 million increase in salaries and benefits and stock-based compensation as we increased general and administrative headcount to support our overall growth.
Other Income (Expense), Net
| Fiscal Year
Ended July 31, |
2012 to 2013 % Change |
2013 to 2014 % Change |
||||||||||||||||||
| 2012 | 2013 | 2014 | ||||||||||||||||||
| (dollar amounts in thousands) | ||||||||||||||||||||
| Other income (expense), net |
$ | 1,228 | $ | (376 | ) | $ | (1,678 | ) | (130.6 | )% | (346.3 | )% | ||||||||
| Percentage of revenue |
||||||||||||||||||||
| Other income (expense), net |
4.4 | % | (0.9 | )% | (3.2 | )% | ||||||||||||||
-70-
Table of Contents
Fiscal 2013 Compared to Fiscal 2014. Other income (expense), net decreased primarily due to $1.6 million of expense associated with the revaluation of our common stock warrants as well as foreign exchange gains and losses.
Fiscal 2012 Compared to Fiscal 2013. Other income (expense), net decreased primarily due to gains on bargain purchases related to fiscal 2012 acquisitions.
Provision for Income Taxes
| Fiscal Year
Ended July 31, |
2012 to 2013 % Change |
2013 to 2014 % Change |
||||||||||||||||||
| 2012 | 2013 | 2014 | ||||||||||||||||||
| (dollar amounts in thousands) | ||||||||||||||||||||
| Provision for income taxes |
$ | 367 | $ | 273 | $ | 392 | (25.6 | )% | 43.6 | % | ||||||||||
| Percentage of revenue |
||||||||||||||||||||
| Provision for income taxes |
1.3 | % | 0.6 | % | 0.7 | % | ||||||||||||||
In each of fiscal 2012, fiscal 2013 and fiscal 2014, we recorded income taxes that were principally attributable to state and foreign taxes.
-71-
Table of Contents
Quarterly Results of Operations
The following tables set forth selected unaudited quarterly statements of operations data for the six fiscal quarters ended January 31, 2015, as well as the percentage that each line item represents of total revenue. The information for each of these quarters has been prepared on the same basis as the audited annual financial statements included elsewhere in this prospectus and, in the opinion of management, includes all adjustments, which includes only normal recurring adjustments, necessary for the fair statement of the results of operations for these periods. This data should be read in conjunction with our audited consolidated financial statements and related notes included elsewhere in this prospectus. These quarterly operating results are not necessarily indicative of our operating results for a full year or any future period.
| Three Months Ended | ||||||||||||||||||||||||
| Oct. 31, 2013 |
Jan. 31, 2014 |
April 30, 2014 |
July 31, 2014 |
Oct. 31, 2014 |
Jan. 31 2015 |
|||||||||||||||||||
| (in thousands) | ||||||||||||||||||||||||
| Consolidated Statement of Operations Data: |
||||||||||||||||||||||||
| Revenue |
||||||||||||||||||||||||
| License |
$ | 688 | $ | 2,878 | $ | 3,739 | $ | 4,106 | $ | 4,416 | $ | 5,106 | ||||||||||||
| Subscription and support |
4,421 | 5,230 | 5,043 | 5,543 | 6,493 | 7,671 | ||||||||||||||||||
| Professional services and other |
5,125 | 5,075 | 5,606 | 5,248 | 4,698 | 4,231 | ||||||||||||||||||
|
|
|
|
|
|
|
|
|
|
|
|
|
|||||||||||||
| Total revenue |
10,234 | 13,183 | 14,388 | 14,897 | 15,607 | 17,008 | ||||||||||||||||||
| Cost of revenue |
||||||||||||||||||||||||
| License |
15 | 73 | 142 | 136 | 129 | 128 | ||||||||||||||||||
| Subscription and support(1) |
3,700 | 3,725 | 2,255 | 2,231 | 2,438 | 2,929 | ||||||||||||||||||
| Professional services and other(1) |
3,793 | 4,054 | 3,598 | 3,986 | 3,720 | 3,324 | ||||||||||||||||||
|
|
|
|
|
|
|
|
|
|
|
|
|
|||||||||||||
| Total cost of revenue |
7,508 | 7,852 | 5,995 | 6,353 | 6,287 | 6,381 | ||||||||||||||||||
|
|
|
|
|
|
|
|
|
|
|
|
|
|||||||||||||
| Gross profit |
2,726 | 5,331 | 8,393 | 8,544 | 9,320 | 10,627 | ||||||||||||||||||
| Operating expenses |
||||||||||||||||||||||||
| Research and development(1) |
4,331 | 4,821 | 6,229 | 6,892 | 7,323 | 7,062 | ||||||||||||||||||
| Sales and marketing(1) |
9,681 | 12,775 | 11,571 | 13,002 | 13,960 | 11,214 | ||||||||||||||||||
| General and administrative(1) |
3,176 | 3,591 | 3,357 | 4,291 | 3,579 | 3,125 | ||||||||||||||||||
|
|
|
|
|
|
|
|
|
|
|
|
|
|||||||||||||
| Total operating expenses |
17,188 | 21,187 | 21,157 | 24,185 | 24,862 | 21,401 | ||||||||||||||||||
|
|
|
|
|
|
|
|
|
|
|
|
|
|||||||||||||
| Operating loss |
(14,462 | ) | (15,856 | ) | (12,764 | ) | (15,641 | ) | (15,542 | ) | (10,774 | ) | ||||||||||||
| Other income (expense), net |
(152 | ) | (1,605 | ) | (123 | ) | 202 | (107 | ) | (183 | ) | |||||||||||||
|
|
|
|
|
|
|
|
|
|
|
|
|
|||||||||||||
| Loss before income taxes |
(14,614 | ) | (17,461 | ) | (12,887 | ) | (15,439 | ) | (15,649 | ) | (10,957 | ) | ||||||||||||
| Provision for income taxes |
99 | 38 | 128 | 127 | 111 | 92 | ||||||||||||||||||
|
|
|
|
|
|
|
|
|
|
|
|
|
|||||||||||||
| Net loss |
$ | (14,713 | ) | $ | (17,499 | ) | $ | (13,015 | ) | $ | (15,566 | ) | $ | (15,760 | ) | (11,049 | ) | |||||||
|
|
|
|
|
|
|
|
|
|
|
|
|
|||||||||||||
| (1) | Includes stock-based compensation expense as follows: |
| Three Months Ended | ||||||||||||||||||||||||
| Oct. 31, 2013 |
Jan. 31, 2014 |
April 30, 2014 |
July 31, 2014 |
Oct. 31, 2014 |
Jan. 31, 2015 |
|||||||||||||||||||
| (in thousands) | ||||||||||||||||||||||||
| Cost of subscription and support revenue |
$ | 9 | $ | 3 | $ | 5 | $ | 7 | $ | 5 | $ | 8 | ||||||||||||
| Cost of professional services and other revenue |
17 | 30 | 42 | 44 | 43 | 48 | ||||||||||||||||||
| Research and development |
35 | 100 | 174 | 181 | 196 | 257 | ||||||||||||||||||
| Sales and marketing |
57 | 89 | 115 | 829 | 131 | 188 | ||||||||||||||||||
| General and administrative |
208 | 222 | 355 | 204 | 222 | 349 | ||||||||||||||||||
|
|
|
|
|
|
|
|
|
|
|
|
|
|||||||||||||
| Total stock-based compensation expense |
$ | 326 | $ | 444 | $ | 691 | $ | 1,265 | $ | 597 | $ | 850 | ||||||||||||
|
|
|
|
|
|
|
|
|
|
|
|
|
|||||||||||||
-72-
Table of Contents
| Three Months Ended | ||||||||||||||||||||||||
| Oct. 31, 2013 |
Jan. 31, 2014 |
April 30, 2014 |
July 31, 2014 |
October 31, 2014 |
Jan. 31, 2015 |
|||||||||||||||||||
| (as a percentage of total revenue) | ||||||||||||||||||||||||
| Consolidated Statement of Operations Data: |
||||||||||||||||||||||||
| Revenue |
||||||||||||||||||||||||
| License |
6.7 | % | 21.8 | % | 26.0 | % | 27.6 | % | 28.3 | % | 30.0 | % | ||||||||||||
| Subscription and support |
43.2 | 39.7 | 35.0 | 37.2 | 41.6 | 45.1 | ||||||||||||||||||
| Professional services and other |
50.1 | 38.5 | 39.0 | 35.2 | 30.1 | 24.9 | ||||||||||||||||||
|
|
|
|
|
|
|
|
|
|
|
|
|
|||||||||||||
| Total revenue |
100.0 | 100.0 | 100.0 | 100.0 | 100.0 | 100.0 | ||||||||||||||||||
|
|
|
|
|
|
|
|
|
|
|
|
|
|||||||||||||
| Cost of revenue |
||||||||||||||||||||||||
| License |
0.1 | 0.6 | 1.0 | 0.9 | 0.8 | 0.8 | ||||||||||||||||||
| Subscription and support |
36.2 | 28.2 | 15.7 | 15.0 | 15.6 | 17.2 | ||||||||||||||||||
| Professional services and other |
37.1 | 30.8 | 25.0 | 26.8 | 23.9 | 19.5 | ||||||||||||||||||
|
|
|
|
|
|
|
|
|
|
|
|
|
|||||||||||||
| Total cost of revenue |
73.4 | 59.6 | 41.7 | 42.7 | 40.3 | 37.5 | ||||||||||||||||||
|
|
|
|
|
|
|
|
|
|
|
|
|
|||||||||||||
| Gross profit |
26.6 | 40.4 | 58.3 | 57.3 | 59.7 | 62.5 | ||||||||||||||||||
|
|
|
|
|
|
|
|
|
|
|
|
|
|||||||||||||
| Operating expenses |
||||||||||||||||||||||||
| Research and development |
42.3 | 36.6 | 43.3 | 46.3 | 46.9 | 41.5 | ||||||||||||||||||
| Sales and marketing |
94.6 | 96.9 | 80.4 | 87.3 | 89.5 | 65.9 | ||||||||||||||||||
| General and administrative |
31.0 | 27.2 | 23.3 | 28.8 | 22.9 | 18.4 | ||||||||||||||||||
|
|
|
|
|
|
|
|
|
|
|
|
|
|||||||||||||
| Total operating expenses |
167.9 | 160.7 | 147.0 | 162.4 | 159.3 | 125.8 | ||||||||||||||||||
|
|
|
|
|
|
|
|
|
|
|
|
|
|||||||||||||
| Operating loss |
(141.3 | ) | (120.3 | ) | (88.7 | ) | (105.1 | ) | (99.6 | ) | (63.3 | ) | ||||||||||||
| Other income (expense), net |
(1.5 | ) | (12.2 | ) | (0.9 | ) | 1.4 | (0.7 | ) | (1.1 | ) | |||||||||||||
|
|
|
|
|
|
|
|
|
|
|
|
|
|||||||||||||
| Loss before income taxes |
(142.8 | ) | (132.5 | ) | (89.6 | ) | (103.7 | ) | (100.3 | ) | (64.4 | ) | ||||||||||||
| Provision for income taxes |
1.0 | 0.3 | 0.9 | 0.9 | 0.7 | 0.6 | ||||||||||||||||||
|
|
|
|
|
|
|
|
|
|
|
|
|
|||||||||||||
| Net loss |
(143.8 | )% | (132.8 | )% | (90.5 | )% | (104.6 | )% | (101.0 | )% | (65.0 | )% | ||||||||||||
|
|
|
|
|
|
|
|
|
|
|
|
|
|||||||||||||
While our quarterly results in recent periods have not reflected seasonal variations in our total revenue due to our growth and the revenue recognition policies applicable to license revenue derived from time-based licenses and to subscription and support revenue, we anticipate that we will experience seasonality in the future. We expect to experience a pattern of lower sequential total revenue in our first fiscal quarter as a result of slower enterprise buying patterns during the late summer months both domestically and overseas, including from our telecommunications customers, as well as due to government customer procurement, budget and deployment cycles, and the timing of our training for our entire sales force. In addition, we expect to experience sequentially higher total revenue in our second fiscal quarter as a result of larger customers with a December 31 fiscal year end choosing to spend remaining budgets shortly before their year-end, which we expect to impact our total revenue in our second fiscal quarter. We anticipate that our gross margin and other operating results will be affected by these seasonal trends in future periods because the majority of our expenses are relatively fixed in the short term.
Our total revenue has increased over the periods presented due to increased sales to new customers as well as expanded sales to existing customers that seek to increase their digital deployments or expand the use of our software through additional use cases or broader deployment within their organizations.
Other than the second quarter of fiscal 2015, research and development expenses increased sequentially in dollar amount in each quarter presented primarily due to increases in personnel related expenses from the continued hiring of engineering headcount to develop and enhance our product offerings.
Other than the third quarter of fiscal 2014 and the second quarter of fiscal 2015, sales and marketing expenses increased sequentially in dollar amount in each quarter presented primarily due to increases in
-73-
Table of Contents
personnel-related expenses, as well as increased marketing programs and events. The decrease in sales and marketing expenses from the second quarter to the third quarter of fiscal 2014 and from the first quarter to the second quarter of fiscal 2015 primarily was due to expenses we incurred in connection with our holding of an annual user and developer conference in the second quarter of fiscal 2014 and the first quarter of fiscal 2015.
Other than the third quarter of fiscal 2014, general and administrative expenses increased sequentially in every quarter of fiscal 2014 primarily due to increases in personnel-related expenses, as well as increased consulting and professional services fees related to accounting, legal and recruiting activities to support the growth of our operations and to prepare to operate as a public company. The decrease in general and administrative expenses from the second quarter to the third quarter of fiscal 2014 primarily reflects the decrease in our use of third-party consulting and professional services. General and administrative expenses decreased sequentially in every quarter of fiscal 2015 due to decreases in professional services fees related to accounting, legal and recruiting activities.
Certain Key Non-GAAP Financial Metrics
The following table summarizes certain of our key non-GAAP financial metrics:
| Fiscal Year
Ended July 31, |
Six Months Ended January 31, |
|||||||||||||||||||
| 2012 | 2013 | 2014 | 2014 | 2015 | ||||||||||||||||
| (dollar amounts in thousands) | ||||||||||||||||||||
| Gross billings |
$ | 36,701 | $ | 43,136 | $ | 63,768 | $ | 23,684 | $ | 37,618 | ||||||||||
| Non-GAAP gross profit |
$ | 15,646 | $ | 21,409 | $ | 25,763 | $ | 8,233 | $ | 20,505 | ||||||||||
| Non-GAAP gross margin |
56.7 | % | 49.6 | % | 48.9 | % | 35.2 | % | 62.9 | % | ||||||||||
| Non-GAAP operating loss |
$ | (8,912 | ) | $ | (24,638 | ) | $ | (55,117 | ) | $ | (29,326 | ) | $ | (24,269 | ) | |||||
Gross Billings. We define gross billings as our total revenue plus the change in our deferred revenue in a period. Gross billings in any period consists of sales to new customers plus renewals and additional sales to existing customers. Our management uses gross billings as a performance measurement because we generally bill our customers at the time of sale of our solutions and recognize revenue either upon delivery or ratably over subsequent periods, and a portion of our revenue may be recognized over a period of more than 12 months. We believe that gross billings provides valuable insight into the sales of our solutions and the performance of our business. Our gross billings were $36.7 million, $43.1 million and $63.8 million in fiscal 2012, 2013 and 2014, and grew 18% and 48% year-over-year in fiscal 2013 and fiscal 2014, respectively. Our gross billings were $23.7 million and $37.6 million in the six months ended January 31, 2014 and 2015, respectively, and grew 59%. The growth is primarily due to increased customer adoption of our cloud-based and on-premise solutions.
Non-GAAP Gross Profit and Gross Margin. We define non-GAAP gross profit as our total revenue less our total cost of revenue, adjusted to exclude stock-based compensation associated with equity awards granted to professional services and maintenance personnel and amortization of acquired intangible assets. We define non-GAAP gross margin as our non-GAAP gross profit as a percentage of our total revenue. Non-GAAP gross profit and gross margin are key measures used by our management to understand and evaluate our operating performance and trends. In particular, non-GAAP gross profit and gross margin exclude certain non-cash expenses and can provide useful measures for period-to-period comparisons of our business. Our non-GAAP gross profit was $15.6 million, $21.4 million and $25.8 million in fiscal 2012, 2013 and 2014, and grew 37% and 20% year-over-year in fiscal 2013 and fiscal 2014, respectively. Our non-GAAP gross profit was $8.2 million and $20.5 million in the six months ended January 31, 2014 and 2015, respectively, and grew 149%. The increase in non-GAAP gross profit in fiscal 2014 and the six months ended January 31, 2015, was largely as a result of increased total revenue. Non-GAAP gross margin decreased from 57% to 50% from fiscal 2012 to fiscal 2013 and remained relatively flat at 49% in fiscal 2014. Our non-GAAP gross margin decreased from fiscal 2012 to fiscal 2013 because our subscription and support revenue accounted for a higher percentage of our total revenue in fiscal 2013 and we incurred substantial costs in fiscal 2013 to migrate our customers to our current
-74-
Table of Contents
digital platform. Non-GAAP gross margin increased from 35% to 63% in the six months ended January 31, 2014, compared to the six months ended January 31, 2015, because our license revenue accounted for a significantly higher percentage of our total revenue in the six months ended January 31, 2015 compared to the six months ended January 31, 2014. Our non-GAAP gross margin on license revenue and subscription and support revenue is significantly higher than our non-GAAP gross margin on professional services and other revenue, and our non-GAAP gross margin on license revenue is significantly higher than our non-GAAP gross margin on subscription and support revenue. In fiscal 2013 and fiscal 2014, we continued to expand our customer support and professional services organizations to support our growing customer base and to migrate customers to our current digital platform. However, going forward we expect our professional services and other revenue to account for a decreasing percentage of our total revenue over the long term as we continue to increase our subscription and support revenue and as our customers increase their use of professional services provided by our channel partners and other third parties.
Non-GAAP Operating Loss. We define non-GAAP operating loss as our operating loss excluding stock-based compensation expense and amortization of acquired intangibles assets. Our management uses non-GAAP operating loss to understand and evaluate our operating performance and trends. In particular, non-GAAP operating loss excludes certain non-cash expenses and can provide useful measures for period-to-period comparisons of our business. Our non-GAAP operating loss was $8.9 million, $24.6 million and $55.1 million in fiscal 2012, 2013 and 2014, respectively, and $29.3 million and $24.3 million in the six months ended January 31, 2014 and 2015, respectively. The increase in non-GAAP operating loss through fiscal 2014 reflects our substantial investments to continue to develop and improve our platform and solutions, to expand our sales and marketing capabilities and geographic coverage, and to provide general and administrative resources to support our growth. The decrease in non-GAAP operating loss in fiscal 2015 reflects increased efficiencies in our customer support organization and substantial completion of customer migration to our current platform.
See “Selected Consolidated Financial and Other Data—Certain Key Non-GAAP Financial Metrics” for information regarding the limitations of using non-GAAP financial measures and for reconciliations of each of the non-GAAP financial measures to their most directly comparable financial measures calculated in accordance with GAAP.
Liquidity and Capital Resources
| As of July 31, | As of January 31, | |||||||||||||||||||
| 2012 | 2013 | 2014 | 2014 | 2015 | ||||||||||||||||
| (in thousands) | ||||||||||||||||||||
| Cash and cash equivalents |
$ | 32,583 | $ | 44,243 | $ | 51,759 | $ | 13,965 | $ | 29,133 | ||||||||||
| Fiscal Year
Ended July 31, |
Six Months
Ended January 31, |
|||||||||||||||||||
| 2012 | 2013 | 2014 | 2014 | 2015 | ||||||||||||||||
| (in thousands) | ||||||||||||||||||||
| Cash used in operating activities |
$ | (1,258 | ) | $ | (26,780 | ) | $ | (50,267 | ) | $ | (27,994 | ) | $ | (21,274 | ) | |||||
| Cash provided by (used in) investing activities |
1,723 | (584 | ) | (2,086 | ) | (1,596 | ) | (350 | ) | |||||||||||
| Cash provided by (used in) financing activities |
27,023 | 39,024 | 59,869 | (688 | ) | (1,002 | ) | |||||||||||||
|
|
|
|
|
|
|
|
|
|
|
|||||||||||
| Net increase (decrease) in cash and cash equivalents |
$ | 27,488 | $ | 11,660 | $ | 7,516 | $ | (30,278 | ) | $ | (22,626 | ) | ||||||||
|
|
|
|
|
|
|
|
|
|
|
|||||||||||
Since fiscal 2012 we have funded our operations primarily through private sales of equity securities. At July 31, 2014 and January 31, 2015, respectively, our cash and cash equivalents of $51.8 million and $29.1 million were held for working capital purposes, a majority of which was invested in money market funds. We intend to increase our capital expenditures in the rest of fiscal 2015, consistent with the growth in our business and operations. We believe that our existing cash and cash equivalents will be sufficient to meet our
-75-
Table of Contents
anticipated cash needs for at least the next 12 months. Our future capital requirements will depend on many factors, including our growth rate, our needs for increased data center capacity to migrate customers to our current digital platform and to support our expanding customer base, the timing and extent of spending to support development efforts, the expansion of sales and marketing activities, the introduction of new and enhanced software and services offerings, and the continuing market acceptance of our solutions. In the event that additional financing is required from outside sources, we may not be able to raise it on terms acceptable to us, if at all. If we are unable to raise additional capital when desired, our business, operating results and financial condition would be adversely affected.
Operating Activities
For the six months ended January 31, 2015, we used $21.3 million of cash in our operating activities, which reflects our net loss of $26.8 million, adjusted by non-cash charges of $2.7 million consisting primarily of $1.4 million for stock-based compensation and $1.2 million for depreciation and amortization. Additional sources of cash inflows were from changes in our working capital, including a $5.5 million increase in deferred revenue and $0.5 million increase in accrued expenses and other liabilities, which was partially offset by a $2.6 million increase in accounts receivable and a $0.4 million increase in prepaid expenses and other assets.
For the six months ended January 31, 2014, we used $28.0 million of cash in our operating activities, which reflects our net loss of $32.2 million, adjusted by non-cash charges of $3.2 million consisting primarily of $1.6 million associated with changes in the fair value of our common stock warrants, $0.8 million for stock-based compensation and $0.7 million for depreciation and amortization. Additional sources of cash were from changes in our working capital, including a $3.0 million increase in accounts payable and a $2.4 million increase in accrued expenses and other liabilities, which were partially offset by a $3.2 million increase in accounts receivable and a $1.4 million increase in prepaid expenses and other assets.
For fiscal 2014, we used $50.3 million of cash in our operating activities, which reflects our net loss of $60.8 million, adjusted by non-cash charges of $6.6 million consisting primarily of $2.7 million for stock-based compensation, $2.1 million for depreciation and amortization and $1.6 million associated with changes in fair value of our common stock warrants. Additional sources of cash inflows were from changes in our working capital, including an $11.0 million increase in deferred revenue, and $3.7 million increase in accounts payable, accrued expenses and other liabilities, which were partially offset by a $9.7 million increase in accounts receivable associated with increased sales and a $1.2 million increase in prepaid expenses and other assets.
For fiscal 2013, we used $26.8 million of cash in our operating activities, which reflects our net loss of $25.9 million, adjusted by non-cash charges of $3.1 million consisting primarily of $1.3 million associated with issuances and changes in fair value of our common stock warrants, $0.4 million for stock-based compensation and $1.2 million for depreciation and amortization. Additional uses of cash were from changes in our working capital, including an $8.4 million decrease in accounts payable, accrued expenses and other liabilities, and a $2.5 million increase in accounts receivable associated with increased sales, which were partially offset by a $6.9 million decrease in prepaid expenses and other assets.
For fiscal 2012, we used $1.3 million of cash in our operating activities, which reflects our net loss of $8.3 million, as well as non-cash adjustments of $0.7 million consisting primarily of a $1.6 million gain on purchase for fiscal 2012 acquisitions, partially offset by $0.2 million for stock-based compensation, $0.2 million of deferred income taxes and $0.3 million for depreciation and amortization. Additional sources of cash inflows were from changes in our working capital, including a $9.1 million increase in deferred revenue, a $1.9 million increase in accounts payable, accrued expenses and other liabilities, which were partially offset by a $2.4 million increase in accounts receivable, due to increased sales, and a $0.9 million increase in prepaid expenses and other assets.
-76-
Table of Contents
Investing Activities
During the six months ended January 31, 2015, cash used in investing activities of $0.4 million was primarily attributable to capital expenditures for technology and software to support the growth of our business. During the six months ended January 31, 2014, cash used in investing activities of $1.6 million was primarily attributable to capital expenditures of $2.0 million for technology and software to support the growth of our business, as well as leasehold improvements on our corporate headquarters, partially offset by $0.4 million of cash acquired in our acquisition of InsightsOne.
During fiscal 2014, cash used in investing activities of $2.1 million was primarily attributable to capital expenditures of $2.5 million for technology and software to support the growth of our business, as well as leasehold improvements on our corporate headquarters, partially offset by $0.4 million of cash acquired in our acquisition of InsightsOne.
During fiscal 2013, cash used in investing activities of $0.6 million was primarily attributable to capital expenditures for technology and software to support our corporate infrastructure.
During fiscal 2012, cash provided by investing activities of $1.7 million was attributable to $2.7 million of cash received from acquisitions. This was partially offset by $1.0 million in capital expenditures related to the purchase of technology and software to support the growth of our business.
Financing Activities
During the six months ended January 31, 2015, cash used in financing activities was primarily due to $4.3 million of repayments on our outstanding debt obligations, as well as $1.1 million of payments of deferred initial public offering costs, partially offset by $4.0 million proceeds from the issuance of debt and proceeds from exercise of common stock options of $0.4 million. During the six months ended January 31, 2014, cash used in financing activities was primarily due to $0.8 million of repayments on our outstanding debt obligations, partially offset by proceeds from exercise of common stock options of $0.1 million.
During fiscal 2014, cash provided by financing activities of $59.9 million was primarily due to $59.9 million proceeds from the issuance of convertible preferred stock and $6.5 million of proceeds from the issuance of debt, each net of issuance costs, as well as $0.5 million of proceeds from exercise of common stock options. This was partially offset by $7.0 million of repayments on our outstanding debt obligations.
During fiscal 2013, cash provided by financing activities of $39.0 million was primarily due to $34.9 million of proceeds from the issuance of convertible preferred stock and $4.0 million of proceeds from the issuance of debt, net of issuance costs, as well as $0.4 million of proceeds from exercise of common stock options. This was partially offset by $0.3 million of repayments on our outstanding debt obligations.
During fiscal 2012, cash provided by financing activities of $27.0 million was primarily due to $26.8 million of proceeds from the issuance of convertible preferred stock and $0.2 million of proceeds from the exercise of common stock options.
Long-term Debt
In May 2012, we entered into a Loan and Security Agreement with Silicon Valley Bank, or SVB, which was amended and restated in November 2014, or the Loan and Security Agreement. Prior to the amendment and restatement, the agreement provided us with the ability to borrow up to $11.5 million through a $6.0 million revolving line of credit subject to an accounts receivable borrowing base, a $4.0 million term loan facility and a $1.5 million capital equipment term loan. We had the ability to draw upon the revolving line of credit through April 2016 at a floating interest rate equal to prime plus 1.5% per annum. The amount outstanding on the revolving line of credit was limited to the lesser of $6.0 million or 80% of the balance of certain eligible
-77-
Table of Contents
customer accounts receivable. The interest rate on the term loans was 6.5% per annum, payable monthly in arrears, and the outstanding principal was payable in equal monthly installments over a 30-month period with the last payment due in November 2015. The interest rate on the equipment loan was a floating rate equal to prime plus 2.0% per annum and the outstanding principal was payable in monthly installments over a 36-month period with the last payment due in June 2017. As of July 31, 2014 and January 31, 2015, we had borrowings of $2.2 million and $3.7 million under the term loan, respectively, and $1.5 million and $1.2 million under the capital equipment term loan, respectively.
In connection with the Loan and Security Agreement, we issued warrants to purchase an aggregate of 300,000 shares and 200,000 shares of common stock during the years ended July 31, 2012 and July 31, 2013, respectively. Warrants to purchase 315,000 shares have an exercise price of $0.09 per share and expire in May 2022, Warrants to purchase 185,000 shares have an exercise price of $0.48 per share and expire in May 2022. As of July 31, 2014 and January 31, 2015, all 500,000 of these warrants to purchase shares of common stock remained outstanding and exercisable.
In December 2013, in connection with our acquisition of InsightsOne, we amended the Loan and Security Agreement and entered into an Assignment and Assumption Agreement with SVB to assume the payment obligations of the InsightsOne growth capital loan with an outstanding loan balance of $2.0 million per a loan and security agreement between InsightsOne and SVB dated April 19, 2013. The interest rate on the growth capital loan was equal to prime plus 1.5% per annum and the outstanding principal was payable in equal monthly installments over a 36-month period with the last payment due in December 2016. As of July 31, 2014 and January 31, 2015, respectively, $1.6 million and $0 aggregate principal amount was outstanding under the growth capital loan. In November 2014, the growth capital loan was refinanced with the amended and restated Loan and Security Agreement discussed below.
In November 2014, we amended and restated the Loan and Security Agreement with SVB. The amended agreement provides us with the ability to borrow up to $25.0 million through a $12.5 million revolving line of credit subject to an accounts receivable borrowing base, which refinanced and replaced the existing revolving line in its entirety and a $12.5 million term loan. We can draw upon the revolving line of credit through October 31, 2017, and the revolving loans bear interest at a rate equal to prime plus 1.5% per annum. Outstanding revolving loans are limited to the lesser of $12.5 million or 80% of the balance of certain eligible customer accounts receivable. The term loan is available in two tranches. The first tranche, Tranche A, in an aggregate principal amount of $4.0 million, refinanced and replaced the existing term loan and existing growth capital loan in their entirety. The principal amount of Tranche A is payable in equal monthly installments over a 30-month period with the last payment due no later than May 31, 2017. The second tranche, Tranche B, in an aggregate principal amount of up to $8.5 million, is available to borrow through May 31, 2016, Tranche B has interest only payments during such draw period and then the principal is payable in equal monthly installments thereafter over a 24-month period. An end-of-term payment of $156,250 will become due upon the final payment of Tranche A, or Tranche B, if applicable. We are permitted to prepay all term loans without premium or penalty. The existing equipment term loan is fully funded and not available for further draws under the amendment and we will continue to repay the outstanding principal in monthly installments, plus interest at a rate equal to prime plus 2.0%, with the last payment due in June 2017.
The Loan and Security Agreement contains customary affirmative covenants and certain financial and negative covenants, including restrictions on disposing of assets, entering into change of control transactions, mergers or acquisitions, incurring additional indebtedness, granting liens on our assets and paying dividends. We are required to maintain minimum total revenue on a rolling two quarter basis that is not less than 80% of our projected revenues for each period. We have pledged substantially all of our assets, other than our intellectual property, as collateral under the Loan and Security Agreement. As of October 31, 2012, we were not in compliance with the required minimum revenue financial covenant, which would have allowed SVB to declare all outstanding amounts due and payable and to terminate the loan facility. However, SVB waived this covenant breach in December 2012. As of July 31, 2013 and 2014 and January 31, 2015, we were in compliance with all loan covenants.
-78-
Table of Contents
The Loan and Security Agreement contains customary events of default that include, among others, payment defaults, covenant defaults, bankruptcy defaults, cross-defaults to certain other obligations, judgment defaults and inaccuracy of representations and warranties. Upon the occurrence of an event of default, SVB may elect to declare all amounts outstanding under the Loan and Security Agreement to be immediately due and payable and terminate all commitments to extend further credit. If we are unable to repay those amounts, SVB can proceed against the collateral granted to them to secure such indebtedness. In addition, the occurrence of an event of default will increase the applicable rate of interest by 3.0%.
In connection with the November 2014 amendment and restatement, we issued warrants to purchase 26,562 shares of common stock with an exercise price of $1.80 per share and expiration in November 2024; and upon funding of Tranche B, we will issue warrants to purchase 79,687 shares of common stock with an exercise price of $1.80 per share and expiration in November 2024. As of January 31, 2015, 26,562 of these warrants to purchase shares of common stock remained outstanding and exercisable.
Contractual Payment Obligations
The following summarizes our contractual commitments and obligations as of July 31, 2014:
| Payments Due by Period | ||||||||||||||||||||
| Total | Less Than 1 Year |
1-3 Years |
3-5 Years |
More Than 5 Years |
||||||||||||||||
| (in thousands) | ||||||||||||||||||||
| Contractual Obligations(1): |
||||||||||||||||||||
| Debt obligations(2) |
$ | 5,274 | $ | 2,802 | $ | 2,472 | $ | — | $ | — | ||||||||||
| Purchase obligations |
2,008 | 1,373 | 426 | 209 | — | |||||||||||||||
| Operating lease obligations(3) |
8,842 | 1,922 | 3,505 | 3,415 | — | |||||||||||||||
| (1) | The table above excludes the liability for uncertain tax positions due to the uncertainty of when the related tax settlements will become due. |
| (2) | Excludes future interest payments on debt obligations for which the timing and amounts are uncertain. Interest payments on debt obligations range from prime plus 1.5% per annum and prime plus 2.0% per annum for the growth capital loan and equipment loan, respectively, to 6.5% per annum for the term loan. Upon the occurrence of an event of default, interest rates may increase up to 3.0% above the applicable rate. |
| (3) | Excludes proceeds from non-cancelable sublease of $0.5 million. |
In November 2014, we amended and restated our Loan and Security Agreement with SVB for borrowings of up to $25.0 million, including a $12.5 million revolving line of credit and a $12.5 million term loan. The term loan is available in two tranches, and the first tranche, Tranche A, was used to refinance and replace the existing term and growth capital loans in their entirety. The second tranche is available to borrow through May 2016. Payments on Tranche A are due in equal monthly installments over a 30-month period, and an end-of-term payment of $156,250 will become due upon the final payment of Tranche A, or Tranche B, if applicable.
In December 2014, we entered into an operating lease agreement for our facilities in the United Kingdom. The operating lease agreement is non-cancelable for a 36-month period and lease payments are due in quarterly installments beginning with the fourth quarter of fiscal 2015. As a result, operating lease obligations reflected in the table above increased by approximately $1.1 million, of which $0.2 million is due by July 31, 2015, $0.8 million is due between July 31, 2015 and July 31, 2017, and $0.1 million is due by July 31, 2018.
Off-balance Sheet Arrangements
During fiscal 2012, 2013 and 2014 and the six months ended January 31, 2015, we did not have any relationships with unconsolidated organizations or financial partnerships, such as structured finance or special purpose entities that would have been established for the purpose of facilitating off-balance sheet arrangements or other contractually narrow or limited purposes.
-79-
Table of Contents
Indemnification Arrangements
In the ordinary course of business, we enter into contractual arrangements under which we agree to provide indemnification of varying scope and terms to customers, business partners and other parties with respect to certain matters, including losses arising out of the breach of such agreements, intellectual property infringement claims made by third parties, and other liabilities with respect to our products and services and our business. In these circumstances, payment may be conditional on the other party making a claim pursuant to the procedures specified in the particular contract.
We include service level commitments to our cloud customers warranting certain levels of uptime reliability and performance and permitting those customers to receive credits in the event that we fail to meet those levels. To date, we have not incurred any material costs as a result of these commitments and we expect the time between any potential claims and issuance of the credits to be short. As a result, we have not accrued any liabilities related to these commitments in our consolidated financial statements.
In addition, we have indemnification agreements with our directors and certain of our executive officers that require us, among other things, to indemnify them against certain liabilities that may arise by reason of their status or service as directors or officers.
Critical Accounting Policies and Estimates
We prepare our condensed consolidated financial statements in accordance with GAAP in the United States. The preparation of condensed consolidated financial statements also requires us to make estimates and assumptions that affect the reported amounts of assets, liabilities, revenue, costs and expenses and related disclosures. We base our estimates on historical experience and on various other assumptions that we believe to be reasonable under the circumstances. Actual results could differ significantly from the estimates made by our management. To the extent that there are differences between our estimates and actual results, our future financial statement presentation, financial condition, results of operations and cash flows will be affected. We believe that the accounting policies discussed below are critical to understanding our historical and future performance, as these policies relate to the more significant areas involving management’s judgments and estimates.
Revenue Recognition
We generate revenue from the sale of our software solutions to customers as a cloud service or on premises. For those customers that deploy our platform as a cloud service, we license our software on a subscription basis. For those customers that deploy our platform on premises, we offer two licensing options, a time-based license or a perpetual license. We also generate revenue from the sale of post-contract software support for on premises licenses including when and if available updates, and professional services such as consulting and training services.
We begin to recognize revenue when (1) persuasive evidence of an arrangement exists, (2) delivery has occurred or services have been provided, (3) the sales price is fixed and determinable and (4) collection of the related receivable is probable.
Signed agreements, including by electronic acceptance, are used as evidence of an arrangement. For our on premises solution, delivery is considered to occur when we provide the customer the ability to download the software. For our cloud service, delivery is considered to occur when subscription service is provisioned and made available to a customer. We assess whether a fee is fixed or determinable at the outset of the arrangement, primarily based on the payment terms associated with the sale. We assess collectability of the fee based on a number of factors such as collection history and creditworthiness of the customer. If we determine that collectability is not probable, revenue is deferred until collectability becomes probable, generally upon receipt of payment from the customer.
We typically enter into multiple-element arrangements with our customers in which a customer may purchase a combination of our software (offered on premises with software support or as a cloud service) and
-80-
Table of Contents
professional services. The software support and professional services are not considered essential to the functionality of the software. All of these elements are considered separate units of accounting. Typically, our agreements do not include rights for customers to cancel or terminate arrangements or to return software to obtain refunds.
We established vendor-specific objective evidence, or VSOE, of fair value for consulting days, training and software support, except for software support bundled with time-based licenses or subscriptions, based on a substantial majority of separate stand-alone sales of these elements, which have been priced within a reasonably narrow range. As a result, for multiple-element arrangements that include perpetual licenses, revenue is allocated to undelivered elements based on VSOE for software support or consulting days and training. Using the residual method, the difference between the total arrangement fee and amount deferred for the undelivered elements is recognized upon delivery of the perpetual license if all other revenue recognition criteria are met. Revenue for software support for our on-premises perpetual and time-based software licenses is generally recognized ratably over the contractual term, which is typically one to three years. Software support is bundled with time-based licenses, and we use a consistent systematic and rational method to allocate between time-based license and support revenue for financial statement presentation purposes only.
We have not historically priced our cloud service within a narrow range and, therefore, cannot establish VSOE. We also believe that third-party evidence, or TPE, is not readily available for our cloud service as pricing is not readily accessible and there is no comparable product offering in the market. As a result, we use best estimate of selling price, or BESP, in order to allocate the selling price to cloud deliverables. We determined BESP considering multiple factors, including the price we charge for similar offerings, market conditions, competitive landscape, and pricing practices. For cloud services that include consulting days and training, we use BESP for cloud deliverables and VSOE for consulting days and training to allocate revenue into separate units of accounting. Revenue for our cloud services is generally recognized over the subscription period when all other revenue recognition criteria are met.
Revenue from our on-premises perpetual licenses is generally recognized upfront, assuming all revenue recognition criteria are satisfied. Revenue from our on premises time-based licenses is recognized ratably over the contractual term. Our on-premises licenses are included as a component of license revenue within our consolidated statements of comprehensive loss. Revenue from subscriptions to our cloud service and software support for our on-premises licenses is generally recognized ratably over the contract term and is included as a component of subscription and support revenue within our consolidated statements of comprehensive loss. Revenue related to professional services and training is recognized as delivered and is included as a component of professional services and other revenue within the consolidated statements of comprehensive loss.
Stock-based Compensation
Stock-based compensation is measured at the grant date based on the fair value of the award and is recognized as expense, net of estimated forfeitures, straight line over the requisite service period, which is generally the vesting period of the respective award.
Determining the fair value of stock-based awards at the grant date requires judgment. We use the Black-Scholes option pricing model to determine the fair value of stock options. The determination of the grant-date fair value of options using an option pricing model is affected by a number of complex and subjective variables. These variables include the fair value of our common stock, the expected term of the options, our expected stock price volatility, risk-free interest rates, and expected dividends, which are estimated as follows:
| • | Fair Value of Our Common Stock. Because our stock is not publicly traded prior to this initial public offering, or IPO, we estimated the fair value of common stock, as discussed in “Common stock valuations” below. Upon the completion of our IPO, our common stock will be valued by reference to its publicly traded price. |
-81-
Table of Contents
| • | Expected Term. The expected term represents the period that our stock-based awards are expected to be outstanding. As we do not have sufficient historical experience for determining the expected term of the stock option awards granted, we have based our expected term on the simplified method. The simplified method calculates the expected term as the average of the time-to-vesting and the contractual life of the options. |
| • | Expected Volatility. As we do not have a significant trading history for our common stock, the expected stock price volatility for our common stock was estimated by taking the average historic price volatility for industry peers based on daily price observations over a period equivalent to the expected term of the stock option grants. We did not rely on implied volatilities of traded options in our industry peers’ common stock because the volume of activity was relatively low. We intend to continue to consistently apply this process using the same or similar public companies until we have a sufficient amount of historical information regarding the volatility of our own common stock share price. |
| • | Risk-free Rate. The risk-free interest rate is based on the yields of U.S. Treasury securities with maturities similar to the expected term of the options. |
| • | Dividend Yield. We have never declared or paid any cash dividends and do not presently plan to pay cash dividends in the foreseeable future. Consequently, we used an expected dividend yield of zero. |
If any of the assumptions used in the Black-Scholes model changes materially, stock-based compensation for future awards may differ materially compared with the awards granted previously.
The following table presents the weighted-average assumptions used to estimate the fair value of options granted during the periods presented:
| Fiscal Year
Ended July 31, |
Six Months
Ended January 31, | |||||||||
| 2012 | 2013 | 2014 | 2014 | 2015 | ||||||
| Expected term (in years) |
5.6 – 6.9 | 5.9 – 6.1 | 5.5 – 6.9 | 5.8 – 6.9 | 6.0 – 6.1 | |||||
| Expected volatility |
51 – 52% | 50 – 51% | 48 – 50% | 49 – 50% | 40 – 44% | |||||
| Risk-free rate |
1.0 – 1.3% | 0.8 – 1.7% | 1.7 – 2.3% | 1.7 – 2.3% | 1.5 – 1.8% | |||||
| Dividend yield |
0% | 0% | 0% | 0% | 0% | |||||
| Fair value of common stock |
$0.06 – 0.09 | $0.20 – 0.48 | $0.54 – 1.20 | $0.54 – 0.97 | $1.37 – 2.09 | |||||
In connection with our acquisition of InsightsOne in December 2013, we issued 125,176 RSUs. These RSUs are subject to a time-based vesting condition and a performance-based vesting condition, both of which must be satisfied before the RSUs are vested and settled for shares of common stock. The time-based vesting condition is three years and the performance-based vesting condition is satisfied upon the completion of our initial public offering. No expense related to these awards will be recognized unless the performance-based vesting condition is satisfied. Upon satisfaction of the performance-based vesting condition, cumulative stock-based expense will be recognized to the extent of satisfaction of the time-based vesting condition as of such date, with the remaining expense recognized over the remainder of the time-based vesting condition. RSUs that have met the time-based vesting condition are not cancelled when service to us is terminated; however, these shares will not vest until the performance-based vesting condition is met. RSUs that have not satisfied the time-based vesting condition as of termination of employment are automatically forfeited. The RSUs will expire seven years from the grant date if not previously settled for shares of common stock.
Common Stock Valuations
Prior to our IPO, the fair value of the common stock underlying our stock options was determined by our board of directors, which intended all options granted to be exercisable at a price per share not less than the per share fair value of our common stock underlying those options on the date of grant. The valuations of our common stock were determined in accordance with the guidelines outlined in the American Institute of Certified Public Accountants
-82-
Table of Contents
Practice Aid, Valuation of Privately-Held-Company Equity Securities Issued as Compensation. The assumptions we used in the valuation model were based on future expectations combined with management judgment. Because there had been no public market for our common stock, our board of directors with input from management exercised significant judgment and considered numerous objective and subjective factors to determine the fair value of our common stock as of the date of each option grant, including the following factors:
| • | contemporaneous valuations performed at periodic intervals by an independent valuation firm; |
| • | the prices, rights, preferences and privileges of our convertible preferred stock relative to the common stock; |
| • | our historical and expected operating and financial performance; |
| • | relevant precedent transactions involving our capital stock; |
| • | current business conditions; |
| • | the hiring of key personnel; |
| • | our stage of development; |
| • | the likelihood of achieving a liquidity event for the shares of common stock underlying these stock options, such as an initial public offering or sale of our company, given prevailing market conditions; |
| • | any adjustment necessary to recognize a lack of marketability for our common stock; |
| • | the market performance of comparable publicly traded technology companies; and |
| • | the U.S. and global capital market conditions. |
The fair value of the underlying common stock will be determined by our board of directors until such time that our common stock is listed on an established stock exchange or national market system.
We granted stock-based awards with the following exercise prices since the beginning of fiscal 2014:
| Grant Date |
Shares Underlying Options |
Shares Underlying RSUs |
Common Stock Fair Value Per Share at Grant Date |
Exercise Price (Options) |
||||||||||||
| September 3, 2013 |
3,210,935 | — | $ | 0.54 | $ | 0.54 | ||||||||||
| October 14, 2013 |
5,882,809 | — | $ | 0.54 | $ | 0.54 | ||||||||||
| December 17, 2013 |
1,432,597 | — | $ | 0.97 | $ | 0.56 | ||||||||||
| March 5, 2014 |
1,283,366 | 145,676 | $ | 0.97 | $ | 0.97 | ||||||||||
| May 20, 2014 |
480,600 | — | $ | 1.20 | $ | 1.20 | ||||||||||
| June 17, 2014 |
358,600 | 9,000 | $ | 1.20 | $ | 1.20 | ||||||||||
| August 19, 2014 |
910,373 | — | $ | 1.37 | $ | 1.37 | ||||||||||
| October 25, 2014 |
2,663,050 | — | $ | 1.67 | $ | 1.67 | ||||||||||
| November 18, 2014 |
981,500 | — | $ | 1.80 | $ | 1.80 | ||||||||||
| December 16, 2014 |
1,148,000 | — | $ | 2.09 | $ | 2.09 | ||||||||||
| January 21, 2015 |
241,600 | — | $ | 2.09 | $ | 2.09 | ||||||||||
| March 19, 2015 |
2,235,224 | 100,000 | $ | 2.31 | $ | 2.31 | ||||||||||
The third-party valuations of our common stock determined the enterprise value of our business by applying either or both the market approach and the income approach. Depending on whether stock options were granted near periods in which we also had a preferred stock issuance, the valuations of our common stock were back-solved for the common stock equity value using the Option Pricing Method, or OPM backsolve method.
The income approach estimates value based on the expectation of future cash flows that we will generate over the forecast horizon and a terminal value at the end of the forecast horizon. These future cash flows and terminal value are discounted to their present values using a discount rate derived from an analysis of the cost of
-83-
Table of Contents
capital for other companies in a similar stage of development as of each valuation date. The market comparable approach estimates value based on a comparison of our company to comparable public companies in a similar line of business. From the comparable companies, a representative market value multiple is determined which is applied to our historical and projected results of operations to estimate the value of our company. In our valuations, the multiples of the comparable companies was determined using a ratio of the market value of invested capital less cash to the last 12 months’ revenue, or the historical multiple, and the estimated future revenue for the each company’s next fiscal year and the fiscal year subsequent to next fiscal year, or the forward multiple. The estimated equity value is then allocated to determine the estimated value of common stock. In addition, we also considered an appropriate discount adjustment to the value of common stock to reflect the lack of marketability of the common stock of a privately-held entity.
The OPM treats the rights of the holders of preferred and common stock as equivalent to call options on any value of the enterprise above certain break points of value based upon the liquidation preferences of the holders of preferred stock, as well as their rights to participation and conversion. Thus, the estimated value of the common stock can be determined by estimating the value of its portion of each of these call option rights. The OPM backsolve method derives the implied equity value of a company from a recent transaction involving the company’s own securities issued on an arms-length basis.
We used a hybrid method utilizing a combination of the probability weighted expected return method, or PWERM, and OPM, in estimating the value of our common stock. The hybrid method estimates the probability-weighted value across multiple scenarios, but uses OPM to estimate the allocation of value within one or more of those scenarios. PWERM considers the present value of the returns afforded to stockholders under an IPO scenario at each valuation date. After the enterprise value is determined and allocated to the various classes of stock using the hybrid of OPM and PWERM allocation methodologies, a discount for lack of marketability, or DLOM, is applied to arrive at the fair value of our common stock. DLOM is applied based on the premise that a private company valuation analysis relies on data from publicly traded companies, which may have substantially different characteristics; thus, discount adjustment is needed to accurately estimate the fair value of the private company common stock.
In connection with the preparation of our condensed consolidated financial statements as of and for the year ended July 31, 2014, we reviewed and reassessed the grant-date fair value of our common stock as of December 17, 2013. As a result of this reassessment , the fair value of our common stock on December 17, 2013 was increased from our original determination of $0.56 per share to $0.97 per share. This increase in fair value per share represents the third-party valuation of our common stock as of January 31, 2014, which took into account significant events that occurred on or prior to December 17, 2013. In connection with this determination, for the year ended July 31, 2014, we recognized approximately $0.1 million of additional stock-based compensation expense associated with stock options granted on December 17, 2013 than we would have recognized had we not reviewed and reassessed our original determination of fair value. Additionally, we recognized $1.5 million of additional expense in other income (expense), net for the final fair value of the common stock warrants that were exercised in December 2013.
Income Taxes
We are subject to income taxes in the United States and numerous foreign jurisdictions. Significant judgment is required in determining our provision for income taxes and income tax assets and liabilities, including evaluating uncertainties in the application of accounting principles and complex tax laws. We record a provision for income taxes for the anticipated tax consequences of the reported results of operations using the asset and liability method. Under this method, we recognize deferred tax assets and liabilities for the expected future tax consequences of temporary differences between the financial reporting and tax bases of assets and liabilities, as well as for operating loss and tax credit carryforwards. Deferred tax assets and liabilities are measured using the tax rates that are expected to apply to taxable income for the years in which those tax assets and liabilities are expected to be realized or settled. We record a valuation allowance to reduce our deferred tax assets to the net amount that we believe is more likely than not to be realized.
-84-
Table of Contents
We recognize tax benefits from uncertain tax positions only if we believe that it is more likely than not that the tax position will be sustained on examination by the taxing authorities based on the technical merits of the position. Although we believe that we have adequately reserved for our uncertain tax positions, we can provide no assurance that the final tax outcome of these matters will not be materially different. We make adjustments to these reserves when facts and circumstances change, such as the closing of a tax audit or the refinement of an estimate. To the extent that the final tax outcome of these matters is different than the amounts recorded, such differences will affect the provision for income taxes in the period in which such determination is made and could have a material impact on our financial condition and operating results. The provision for income taxes includes the effects of any reserves that we believe are appropriate, as well as the related net interest and penalties.
Quantitative and Qualitative Disclosures About Market Risk
We are exposed to financial market risks, primarily changes in interest rates and currency exchange rate fluctuations.
Interest Rate Risk
We had cash and cash equivalents of $51.8 million and $29.1 million as of July 31, 2014 and January 31, 2015, respectively. Our cash and cash equivalents are held in cash deposits and money market funds. Due to the short-term nature of these instruments, we do not believe that we have any material exposure to changes in the fair value of our investment portfolio as a result of changes in interest rates. Declines in interest rates, however, would reduce our future interest income.
The primary objective of our investment activities is to preserve principal while maximizing yields without significantly increasing risk. This objective is accomplished by making investments, consisting only of money market funds. During the fiscal years ended July 31, 2012, 2013, and 2014 and the six months ended January 31, 2015, the effect of a hypothetical 10% increase or decrease in overall interest rates would not have had a material impact on our interest income.
Any draws under our outstanding debt obligations bear interest at a variable rate tied to the prime rate. At July 31, 2014 and January 31, 2015, respectively, we had an outstanding balance of $5.2 million and $4.9 million on our debt obligations. During the fiscal years ended July 31, 2012, 2013, and 2014 and the six months ended January 31, 2015, the effect of a hypothetical 10% increase or decrease in overall interest rates would not have had a material impact on our interest expense.
Foreign Currency Exchange Risk
Our results of operations and cash flows are subject to fluctuations due to changes in foreign currency exchange rates. All of our revenue is generated in U.S. dollars. Our expenses are generally denominated in the currencies in which our operations are located, which is primarily in the U.S. and to a lesser extent in Europe and Asia. Our results of operations and cash flows are, therefore, subject to fluctuations due to changes in foreign currency exchange rates and may be adversely affected in the future due to changes in foreign exchange rates. The effect of a hypothetical 10% change in foreign currency exchange rates applicable to our business would not have a material impact on our historical condensed consolidated financial statements for the fiscal years ended July 31, 2012, 2013 and 2014 and the six months ended January 31, 2015. To date, we have not engaged in any hedging strategies. As our international operations grow, we will continue to reassess our approach to manage our risk relating to fluctuations in currency rates.
Inflation
We do not believe that inflation had a material effect on our business, financial condition or results of operations in the last three fiscal years. If our costs were to become subject to significant inflationary pressures, we may not be able to fully offset such higher costs through price increases. Our inability or failure to do so could harm our business, financial condition and results of operations.
-85-
Table of Contents
JOBS Act Accounting Election
We are an “emerging growth company,” as defined in the JOBS Act. Under the JOBS Act, emerging growth companies can delay adopting new or revised accounting standards issued subsequent to the enactment of the JOBS Act until such time as those standards apply to private companies. We have irrevocably elected not to avail ourselves of this exemption from new or revised accounting standards, and, therefore, will be subject to the same new or revised accounting standards as other public companies that are not emerging growth companies.
Recent Accounting Pronouncements
Going Concern: In August 2014, the FASB issued ASU No. 2014-15, Presentation of Financial Statements - Going Concern, which requires an entity to evaluate whether there is substantial doubt about its ability to continue as a going concern, and to provide related footnote disclosures. The new standard is effective for us in our fiscal year ending July 31, 2017. We are evaluating the effect of our pending adoption of ASU 2014-15 on our consolidated financial statements and related disclosures and do not expect it to have a material impact on our consolidated financial statements.
Share-Based Payments with Performance Targets: In June 2014, the FASB issued Accounting Standards Update No. 2014-12, Accounting for Share-Based Payments When the Terms of an Award Provide That a Performance Target Could Be Achieved after the Requisite Service Period (ASU 2014-12). ASU 2014-12 requires that a performance target that affects vesting and could be achieved after the requisite service period be treated as a performance condition. A reporting entity should apply existing guidance in ASC 718, Compensation—Stock Compensation, as it relates to such awards. ASU 2014-12 is effective for us in our first quarter of fiscal 2017 with early adoption permitted using either of two methods: (1) prospective to all awards granted or modified after the effective date; or (2) retrospective to all awards with performance targets that are outstanding as of the beginning of the earliest annual period presented in the financial statements and to all new or modified awards thereafter, with the cumulative effect of applying ASU 2014-12 as an adjustment to the opening retained earnings balance as of the beginning of the earliest annual period presented in the financial statements. We have elected to early adopt the new standard using the retrospective adoption method. The adoption of this standard did not have a material effect on our financial position.
Revenue Recognition: In May 2014, the FASB issued Accounting Standards Update No. 2014-09, Revenue from Contracts with Customers (ASU 2014-09), which requires an entity to recognize the amount of revenue to which it expects to be entitled for the transfer of promised goods or services to customers. ASU 2014-09 will replace most existing revenue recognition guidance in GAAP when it becomes effective. The new standard is effective for us in its first quarter of fiscal 2018. Early application is not permitted. The standard permits the use of either the retrospective or cumulative effect transition method. We are evaluating the effect that ASU 2014-09 will have on our consolidated financial statements and related disclosures. We have not yet selected a transition method nor have we determined the effect of the standard on our ongoing financial reporting.
-86-
Table of Contents
At Apigee, our mission is to make every business a digital business.
Unprecedented growth in mobile technologies, big data, cloud services and the connected devices that comprise the Internet of Things, or IoT, has disrupted or transformed the dynamics of business, changed consumer behavior and eroded the divide between the physical and digital worlds. To fully embrace the digital world, businesses must provide seamless customer experiences across a myriad of devices and channels, respond quickly to fast-changing customer expectations and market conditions, drive revenue through new business models and create or participate in digital ecosystems. A digital business creates value by unlocking its data and services to better serve customers in a real-time, anywhere-anytime fashion and uses data to continually improve the customer experience and drive additional revenue.
We believe that application programming interfaces, or APIs, are a critical enabling technology for the shifts in mobile, cloud computing, big data and the IoT and that APIs are a foundational technology on which digital business operates. We believe that a new and expansive market opportunity exists to help enterprises adopt digital strategies and navigate the digitally driven economy.
We provide an innovative software platform that allows businesses to design, deploy, and scale APIs as a connection layer between their core IT systems and data and the applications with which their customers, partners, employees and other users engage with their business. The foundations of our platform are Apigee Edge, a robust API-management solution, and Apigee Insights, our predictive analytics software solution. Our platform enables a comprehensive view of the enterprise data the user is consuming and generating, and data about the context in which the customer is using the digital product or service, or contextual data. In addition, our platform provides tools for businesses to drive usage and adoption of APIs by their business partners and developers. Using our platform, businesses in any industry can easily and securely connect their core services and data to developers to enable them to develop applications and experiences for customers, partners, employees and other users. Using our platform, businesses can forge new partnerships, build partner ecosystems, and participate fully in emerging digital business networks.
Today, it is difficult for many businesses to fully participate and innovate in the digital world because traditional enterprise software is not designed to interact with and connect to the rapidly evolving digital economy. The IT architectures deployed at most businesses are based on thousands of application servers communicating with databases, other applications and numerous middleware layers, each using thousands of custom integrations and connectors. These legacy architectures generally cannot publish APIs in a way that can be used by application developers. Furthermore, they are not equipped to consume or leverage the data that flow from digital interactions or the contextual data that exist in digital networks. A business with a legacy architecture will not have access to the data necessary to drive better business decisions nor to respond to customers in relevant and responsive ways.
We believe that in order to build, manage and extract valuable insights from APIs and data that are needed for digital business, nearly all businesses will require a new layer within their core application software stack. To enable this new layer, we provide a single secure platform for APIs and predictive analytics, which can be deployed either in the cloud or on premises. By using our platform, an organization can securely share its data and services, enabling users to easily engage and transact with the business. Because we provide API publishing, operations, and data visibility in our integrated solution, our platform enables more informed predictive analytics to help the business anticipate and adapt to customer behavior.
We have achieved significant scale, with a customer base that has grown over 35% from the end of fiscal 2012 to the end of fiscal 2014. Our customers include many leading businesses: 20 of the Fortune 100, five of the top 10 Global 2000 retail brands and six of the top 10 global telecommunications companies as of January 31, 2015. Our platform has been sold to customers in over 30 countries around the world.
-87-
Table of Contents
We have experienced rapid growth in recent periods. Our gross billings were $36.7 million, $43.1 million and $63.8 million in fiscal 2012, fiscal 2013 and fiscal 2014, respectively, representing growth rates of 18% from fiscal 2012 to fiscal 2013 and 48% from fiscal 2013 to fiscal 2014. Our gross billings were $23.7 million and $37.6 million in the six months ended January 31, 2014 and 2015, respectively, representing a growth rate of 59%. Our total revenue was $27.6 million, $43.2 million, and $52.7 million in fiscal 2012, fiscal 2013 and fiscal 2014, respectively, and $23.4 million and $32.6 million in the six months ended January 31, 2014 and 2015, respectively. For fiscal 2014, 33% of our revenue was derived from customers located outside the United States, up from 16% in fiscal 2013. For the six months ended January 31, 2015, we derived 38% of our revenue from customers located outside the United States, up from 33% in the six months ended January 31, 2014. We incurred net losses of $8.3 million, $25.9 million and $60.8 million in fiscal 2012, fiscal 2013 and fiscal 2014, respectively, and $32.2 million and $26.8 million in the six months ended January 31, 2014 and 2015, respectively. See “Selected Consolidated Financial and Other Data—Certain Key Non-GAAP Financial Metrics” for information regarding the limitations of using gross billings as a financial measure and for a reconciliation of gross billings to total revenue, the most directly comparable financial measure calculated in accordance with generally accepted accounting principles in the United States, or GAAP.
Industry Background
Businesses Must Be Digital Businesses
The rapid growth in mobile technologies, big data, cloud service and the IoT has profoundly changed market dynamics, fostering the convergence of the digital and physical worlds, and changing consumer behavior. The pace of change is accelerating. Businesses must provide seamless customer experiences across digital and physical channels and respond quickly to fast-changing customer expectations and market conditions to meet the demands of hyper-connected customers, partners and employees.
Successful established companies, such as Walgreens, recognize the benefit of being digital. In 2012, Walgreens launched a single digital initiative in response to changing customer behavior in the pharmacy retail space, and quickly realized that a broader digital strategy was necessary to maintain a competitive advantage. In response to the realization that an increasing number of photos were being taken on smartphones, Walgreens embarked on its first digital initiative. It built QuickPrints—a digital platform through which Walgreens enables mobile app developers to allow their users to print photos from their mobile devices to any of the more than 8,200 Walgreens locations. Today, a growing ecosystem of partner photo applications integrate with the QuickPrints platform. Realizing that digital transformation needed to extend to the entire business, Walgreens next developed a mobile prescription refill capability that provided even more convenience to customers who expect connectivity to all parts of a company’s product and service offerings.
APIs Make Digital Business Work
Behind every mobile app, smart device and connected experience sits at least one API. An API is a set of programming instructions and standards that enables software applications to interact with other IT resources. APIs connect an enterprise’s services, content and data to developers and partners in an easy and secure way, making it possible for developers to create powerful new applications and experiences. APIs are a common part of online experiences. As an example, when someone uses Yelp to look for the closest Italian restaurant, APIs make it work. An API (in this case the Google Maps API) is the code that allows an application such as Yelp to interact with the maps data and show the restaurant on a map.
As the Yelp example shows, APIs enable a new way of building applications and of making them work together easily. APIs also make it easier for companies to create partnerships, easily combining their data and services in mobile apps and other digital products to create new digital experiences. Without APIs, companies such as Yelp and Google would likely have endured lengthier negotiations to establish their business partnership and extensive internal IT discussions to work out the technical integration while preserving the integrity of their
-88-
Table of Contents
separate systems. APIs are not limited to simple use cases, such as the aforementioned Yelp example; they also have the power to enable much more complex partnerships, solve large scale connectivity challenges and help facilitate application interoperability in the most complex IT environments.
APIs Are the Building Blocks for Digital Business in Nearly Every Industry
Using APIs to build powerful applications and business partnerships is no longer solely the province of companies that were founded to do business during the age of the Internet. We believe that companies doing business with increasingly connected and mobile customers, partners and employees will be required to use APIs. Examples from multiple industries and our customer base demonstrate the power of APIs to facilitate the digital experiences that allow businesses to interact with their customers and partners wherever and whenever:
| • | Telecom: Using APIs, AT&T enables their resellers to activate their customers’ iPhones immediately and at the point of purchase such as at an Apple store. |
| • | Retail: Using APIs, retail organizations, such as Walgreens and Marks & Spencer, connect data from their websites, mobile apps and stores to provide customers a multi-channel personalized shopping experience. |
| • | Travel: Using APIs, Expedia has enabled controlled access into its travel marketplace in which thousands of service providers, including airlines, hotels, car rental and cruise companies can connect their inventory. |
| • | Aviation: Using APIs, Gogo, a leading provider of in-flight communications services, enables partners and developers to create in-flight applications for passengers and flight crews. |
| • | Satellite TV: Using APIs, a leading satellite service provider enables retailers to activate their satellite service directly from the retailer’s point of sale system when a customer purchases a new TV. |
| • | Financial Services: Using APIs, First Data powers an ecosystem that enables merchants and developers to quickly develop and deploy applications with secure mobile payment capabilities. |
A Digital Business Must Be Data-Driven
We believe that analyzing customer behavior to predict future actions is crucial for fostering business innovation in customer engagement and operational processes. By using predictive analytics, digital businesses have a unique opportunity to turn the significant volume of structured and unstructured data in their digital ecosystems into actionable business insights. A company that can leverage data to understand customers’ behavior and context and use that insight to deliver personalized experiences, help retain customers and better maximize customer satisfaction gains a significant competitive advantage. At the same time, companies need to meet these demands efficiently across a large number of customers, channels and touchpoints.
To maximize the value of their data, companies need to use predictive analytics to model every business interaction and customer service process as a set of “events” that can be captured and stored for analysis. Every event is rich with contextual information such as user demographics, time, location and activities such as purchases. The ability to derive value from data hinges on two things: the ability to collect the data at the time and place it is generated and the ability to take action on it at the point when it can have the most impact.
APIs not only deliver data to the applications through which customers, partners and employees engage with a business, but are uniquely positioned to collect the data at the place and time it is generated, enabling a business to generate actions at the point where they can have the most impact.
Examples from our customer base that demonstrate the power of APIs and predictive analytics to transform companies into data-driven businesses include:
| • | Telecom: By analyzing customer activity patterns on their API-powered applications and web properties, AT&T was able to identify customers at-risk of switching to competitive services and contact them pro-actively with promotional offers to retain them as subscribers. |
-89-
Table of Contents
| • | Healthcare: By running sophisticated algorithms on all of the data in its vast ecosystem, Independence Blue Cross has been able to predict when its clients are becoming dissatisfied with Medicare service. By taking action proactively, the company has significantly reduced formal complaints to Medicare. |
| • | Travel: Expedia uses predictive analytics on their API traffic in their travel marketplace to better understand anticipated inventory levels from service providers such as airlines, hotels and car rental companies. |
Legacy IT Technologies Are Unable to Meet the Demands of Digital Business
The traditional approaches to integration, application architecture, data management and security make it difficult for a business to connect its customers, partners, employees and other users to its operation. As a result, the business intelligence, or BI, is not able to fully leverage the data streams generated by the user applications and experiences that characterize digital business. Fundamentally, these traditional approaches do not meet the technical demands of the modern digital experience—the new “system of engagement,” that is used by customers, partners, employees and other users to engage with businesses across multiple channels and locations. This system of engagement represents a new layer in the enterprise IT architecture on top of its systems of record—the enterprise resource planning, or ERP, systems companies rely on to run their business (such as databases, financial, manufacturing, customer relationship management and human resources software).
This system of engagement is more decentralized and must incorporate technologies that enable interactions, and it must be faster and more agile than the systems of record to keep pace with dynamic and diverse customer, partner and employee expectations and to take advantage of the data generated through new digital channels.
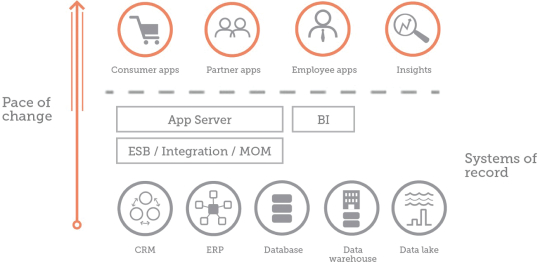
Traditionally, IT has approached the challenges of connecting systems through “middleware” technologies. These technologies include integration servers, application servers, enterprise service buses, or ESBs, message-oriented middleware, or MOM, and various service-oriented architecture, or SOA, technologies, as illustrated above. This approach was effective when middleware projects were few in number and had lengthy implementation timeframes. However, the processes for implementing and operating these integration systems are labor intensive and do not easily scale when the number of connected systems increases.
-90-
Table of Contents
Legacy IT Cannot Meet the Demands of a Mobile World
Legacy middleware systems were primarily designed for server-to-server communication and not for enabling the modern, user-facing digital experiences that businesses need to deliver across a variety of mobile and connected devices. Most middleware technologies were built around the expectation of reliable and high- bandwidth communications over networks within a company’s data centers. However, the bandwidth constraints of mobile technologies place new constraints on the volume of data and latency between servers and applications.
In addition, most mobile operating systems are not well equipped to deal with the legacy communications protocols used by traditional IT middleware technologies. For example, XML-based protocols, such as Simple Object Access Protocol, or SOAP, often deliver data payloads that consume bandwidth and tax the limited processing power and memory of mobile devices.
Narrow View of Data Does Not Adequately Support Business Insights
Legacy solutions require significant integration efforts to tap into the various sources of data events and, more importantly, most solutions deliver analysis well after the fact. In a digital business, analytics is not about delivering reports on last month’s activity. Rather, it is about generating actions based on predictive insights into individual and aggregate user behavior and activity.
Most legacy architectures are unprepared for the enormous amount of contextual data that is generated through new digital channels. Digital interactions deliver a constant stream of data, such as location data, items saved to digital shopping carts, preferences, and sensor data from the connected devices in the IoT, from users to the backend operational and transactional systems, or systems of record. Much of this data is discarded as it passes from the applications and experiences to the systems of record. This winnowing of the data stream loses the valuable contextual signals that are necessary to feed big data systems.
Perimeter Models of Security Provide Only Limited Protection
Traditional information security architectures have presupposed that the applications and users exist within the firewalled perimeters of the enterprise network. Software that assumes and even requires a “perimeter” where the software can be installed, or that requires a company “agent” to be installed on all mobile devices is ineffective for digital businesses that must support a myriad of new applications and devices, as well as external developers and partners. Furthermore, an enormous amount of data exists in multiple places: some resides in the core enterprise or legacy operational and transactional systems and an increasing amount of data comes from outside the enterprise. Most importantly, these data are generated by, and reside in, new digital channels like mobile apps. IT security experts are often overburdened and may not be consulted by fast-moving digital teams that are developing and deploying new applications. As a result, many projects implement security in an independent and piecemeal fashion, resulting in inconsistent security.
Centralized IT Processes Have Fundamental Limitations
IT for all aspects of systems, applications, data and security has traditionally operated through processes of centralized planning and governance. Historically, business decisions about the connectivity of systems required a lengthy planning process and the participation of specialists who were removed from the business needs driving the projects. However, today, companies need to build myriad digital connections among customers, partners and employees. While these connections take many forms, such as new mobile apps or business partner integrations, traditional IT infrastructure and its systems and processes remain cumbersome and an impediment to the business’s ability to stay competitive. Today, modern adaptive IT processes are renouncing centralized planning and governance practices and embracing agile methodologies that allow the organization to more rapidly scale to meet the diverse and evolving demands of digital business. Many integration or application architects, data scientists and security specialists are overburdened with a backlog of projects, and frequently cannot keep pace
-91-
Table of Contents
with fast-moving digital teams. The result is that many projects implement critical functions, such as security in an inconsistent and piecemeal fashion, with potentially disastrous results. Traditional IT technologies were not designed for application developers; rather, they were meant to be used by application architects, data scientists, and security specialists. Further, these systems are not designed to support user interactions on mobile devices. In other words, traditional IT also disenfranchises developers who are forced to give up on innovative solutions and instead work within the confined centralized IT environment.
Digital Business Requires a New Adaptive Architecture
A new API-centric adaptive layer is required to enable agile and web-scale innovation so that IT can meet evolving business requirements, while allowing existing IT systems to continue to run reliably and securely. According to Gartner, businesses invested approximately $21.5 billion in 2013 alone in middleware. We believe that this is a product of the web era and comprises primarily core network infrastructure and back-office business applications. An adaptive API architecture enables businesses to unlock the value of this investment and extend it to new channels.
This new layer must enable enterprises to control and secure the operational and transactional systems built on integration servers, ESBs, MOM and various SOA technologies, while also enabling the speed and agility to deliver powerful new applications and services that serve customers, partners and employees in a world that is fast moving. An adaptive API platform must bridge the speeds of the stable and reliable operational systems with the rapidly evolving systems of engagement, as illustrated below.
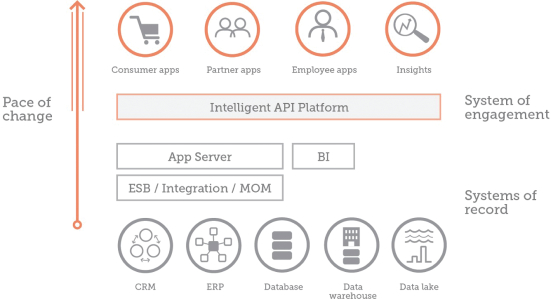
In the same way as the last decade’s investment in Web IT infrastructure did not eliminate previous layers of IT infrastructure, this new tier of API-based IT infrastructure does not eliminate legacy infrastructure. An adaptive API platform enables an organization to implement an architecture, build a workforce and define and manage all of the processes around the business—from the backend operational systems to the customers and the applications they use to engage with the business. This new API tier must enable the speed and agility required to serve increasingly mobile and connected customers, partners and employees, while allowing a business to maintain control of their backend systems. It must make data and analytics a core priority in the IT infrastructure, enabling data-driven business and operational decisions. It must leverage APIs and data analytics to power the actions that help create relevant, personalized interactions with customers and help systems adapt automatically
-92-
Table of Contents
to changing conditions. It must scale to meet the needs of new forms of interaction and connectivity. Critically, it must enable the developers who are building the applications and experiences of the digital world with self-service and intuitive tools.
Our Solution
We have pioneered an API-based software platform that enables digital connectivity and business insights. Our solution is a single secure platform for APIs and predictive analytics that accelerates the pace at which businesses innovate, share their data and services, and adapt to rapidly changing customer and market needs. Our API platform is designed for the digital economy and the data-rich and mobile-driven APIs and applications that power it. It is designed to serve the people and technology across the digital value chain, from the backend systems of record through to the customer who interacts with a digital experience delivered by a mobile app or a connected device.

Key elements of this solution include:
| • | Purpose-built for People and Technology Across the Digital Value Chain. Our management tools, business and operational analytics, policy-based approach and advanced programmability provide a simple yet powerful platform that serves the entire digital value chain between the end user and the business’ backend systems. This digital value chain includes the applications, the developers who build them and the APIs that they use, all of which need to work together seamlessly and each of which has requirements that can only be addressed by an integrated platform. Pre-built and configurable policies provide a unified and intuitive platform approach to APIs, enabling organizations to control traffic on their APIs, enhance performance, enforce security, simplify customer self-service and reduce time-to-value—all without coding or changing the backend systems of record. Advanced programmability allows developers to handle advanced use cases, customize existing APIs for online and mobile platforms and add new API services—all using languages and tools, such as Java, JavaScript, Node.js and Python, which are familiar to developers. |
| • | Enterprise-grade Software Enables Web Scale, Reliability and Security. Our platform is web scale and flexible and is offered as a cloud service or as an on-premises deployment. Our cloud service provides up to 99.99% availability and uptime, and a multi-region API delivery network enabling low latency worldwide. We enable organizations to control access to APIs and services and protect customers and the business from threats, backend system overload, service issues and sensitive data exposure. Our platform supports billions of API calls per week for the world’s largest and mission-critical API programs, including 20 of the Fortune 100, five of the top 10 Global 2000 retail brands and six of the top 10 global telecommunications companies as of January 31, 2015. As of January 31, 2015, nearly 9,000 individual applications were accessed by our users per month, nearly 6,000 individual APIs were accessed by users of our cloud service per month and our platform had processed over 1,500 terabytes of data since January 1, 2013. |
-93-
Table of Contents
Monthly Apps
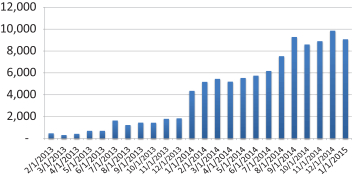
Monthly Apps. We define monthly apps as the total number of individual applications accessed by users of our cloud service in a calendar month. This number includes apps running on production environments of paying customers and apps from our Apigee Developer environments. We use this measure to monitor the adoption rate and utilization of our cloud services and to monitor the development of our customers’ API-based apps.
Monthly APIs
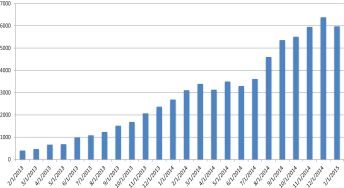
Monthly APIs. We define monthly APIs as the total number of individual APIs accessed by users of our cloud service in a calendar month. This number includes APIs running on production environments of paying customers and APIs from our Apigee Developer environments. We use this measure to monitor the adoption rate and utilization of our cloud services.
Cumulative Data Processing Volume (in TB)
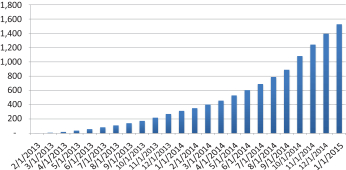
Cumulative Data Processing Volume. We define cumulative data processing volume as the cumulative amount of data, measured in terabytes, that was exchanged across our cloud service since January 1, 2013, when we first began recording this metric. This number includes data processed on production
-94-
Table of Contents
environments of paying customers and data processed from our Apigee Developer environments. We use this information to improve scalability and gauge the reliability of our algorithms.
| • | Built-in Developer Services to Foster Adoption and Enhance the Business Value of APIs. Our platform enables a business to provide a developer community experience that accelerates API adoption, simplifies learning, enables monetization and increases the business value of APIs. Using our platform, businesses can rapidly onboard developers and facilitate their secure interaction with their business data and systems. Our customizable developer portal helps businesses foster innovation among internal and external developers and partners by making it easy for developers to interact with the enterprise and with each other. |
| • | Analytics for End-to-end Business Visibility. Our platform provides end-to-end visibility across the digital value chain with unified operational and business metrics and application monitoring. Operational metrics enable monitoring of the health and performance of APIs and digital ecosystems. Business metrics enable businesses to track product, service, customer usage and trends, respond quickly to customer and market changes and make data-driven decisions. Application monitoring helps organizations discover application errors and performance glitches, optimize application performance, identify network bottlenecks and understand usage patterns. |
| • | Predictive Analytics to Derive Actionable Insights at the Point of Engagement. With APIs positioned at the center of the application data stream, our platform enables businesses to gain actionable insights from the flow of data. Our platform collects data in a Hadoop data store and mines API traffic for critical business events and adds contextual data from the customer journey, which is the sequence of digital interactions by customers with the business over time. Businesses can derive insights from these events, their context and their sequence, and use them to create models to predict likely customer behaviors, and generate actions that result in a change of behavior in a system or in delivering the right experience, at the right time, on the right device. |
| • | Support for All New Forms of Interaction and Connectivity, such as the Internet of Things. Our platform allows businesses to manage APIs and data at the scale needed to support new and emerging forms of interaction and connectivity. Our platform powers the APIs, and captures and derives insights from the data generated by the applications and experiences, through which customers, partners, and employees engage with a business. We believe that our platform is positioned to power complex, distributed systems such as the IoT, including wearable technology, intelligent cars, smart energy grids and other forms of emerging connected interaction. |
Our Opportunity
By 2016, Gartner estimates that the application infrastructure and middleware market and the business intelligence and analytics market will be approximately $27 billion and approximately $18 billion, respectively, of which we believe that the global API market is a subset.
We estimate the total addressable market, or TAM, for our solution is $5.5 billion. We have arrived at this figure by taking the number of operating companies listed in all industries with greater than $500 million in annual revenue using certain S&P Capital IQ commercial data and multiplying that figure by the average historical customer spend on our products and services. The total number of companies was 19,246 and our average customer spend in fiscal year 2014 was $287,988. Therefore, we estimate the TAM for our solution is $5,542,617,048, or about $5.5 billion.
Our Competitive Strengths
We believe that we possess the following competitive strengths:
| • | Category Creator and Market Leader. We have played an important role in the transition of enterprises to API-enabled and data-driven businesses. We believe that we are recognized as a thought |
-95-
Table of Contents
| leader in digital business transformation and that we are in a position to define the roadmap of the market. This leadership position has enabled us to form a global alliance with Accenture to deliver enterprise API solutions and an OEM and reseller agreement with SAP. |
| • | Products Built From the Ground Up for the Connected Digital Era. Our technology is purpose built for a mobile-first environment and new forms of digital interaction. This has enabled us to build products and features on design principles focused on self-service, ease of use, simplicity, scalability and with advanced data capabilities in mind. Our platform offers multi-tenancy in both cloud and on-premises versions, providing a flexible solution suited to the particular customer’s needs. |
| • | Large and Growing Developer Reach. Our growing community of API and application developers use Apigee Edge Trial, our free, self-service, cloud-based version of Apigee Edge, as well as open-source technologies that we sponsor and to which we contribute. This developer reach provides us with a rapidly growing network of developers who build awareness and promote the adoption of our software. Adoption of the free version results in our solutions being used in customer projects at early stages of development, giving us an advantage as those projects grow and require commercial support and services. We believe that the self-service nature of our solutions accelerates our customer evaluations and our sales cycle. |
| • | Large and Growing Blue Chip and Diverse Customers Running Billions of API Calls Per Week. We focus on serving enterprises, service providers and government entities, and we have seen significant momentum in the adoption of our platform. Our customers run billions of API calls through our cloud solution each week. Our customers include many leading businesses: 20 of the Fortune 100, five of the top 10 Global 2000 retail brands and six of the top 10 global telecommunications companies as of January 31, 2015. Many of our customers have stringent enterprise technology criteria, and their adoption of our platform has helped validate our platform. |
| • | Access to Senior Executives. Digital infrastructure transformation is a senior executive level project that involves core business strategy and impacts the entire organization. We are often involved in strategic senior executive level business discussions with our clients and have broad exposure to key executives throughout these organizations and become a trusted partner for the most important aspects of our clients’ transformation. We believe that our success with senior executives provides us with the opportunity to expand in other parts of an organization that are not part of our initial mandates. |
| • | Significant Investment in Our Technology and Team. We have devoted considerable resources in developing our technology, including our investment in an agile model for design, development and deployment of our cloud and on-premises software, our acquisition and integration of Usergrid and InsightsOne into our platform, and our engineers’ significant contribution to our open source products, Apigee 127 and Apigee Zetta. We have assembled a team of leading technology experts from well-established application infrastructure, analytics and cloud services companies. |
Our Growth Strategy
Our goal is to provide the leading software platform that enables digital business acceleration for enterprises worldwide. The key elements of our growth strategy include:
| • | Continue to Lead the Transformation to Digital Business Across Industries. We believe that the transformation of businesses in nearly every industry to digital business, enabled by APIs and big data analytics, is an emerging trend. We believe that we have established a leadership position in this market, both as a provider of API management and data analytics and also as a thought leader helping to define the architecture and vision of API-enabled and data-driven businesses. We intend to extend our leadership position by continuing to innovate, bringing new technologies to market and honing best practices and thought leadership by working closely with our global customer base. |
| • | Expand our Platform and Continue Building Our Technology Leadership. We intend to continue building innovative software products that extend the value of our existing solutions and further help |
-96-
Table of Contents
| enterprises realize digital business success through new growth and operational efficiencies. For example, we continue to invest in Apigee Insights, a self-service predictive analytics solution that helps enterprises build customer journey models and adaptive applications. We plan to continue to invest in Zetta, an open source platform for creating IoT servers, to provide the tools for developers to use APIs and data to better realize the potential of the IoT. In addition to continued investments in product development, we may also pursue acquisitions of technology that complement our platform. |
| • | Expand Sales to New Customers and Within Our Existing Customer Base. We have substantially expanded our sales force in recent years to grow our customer base and drive adoption of our solutions. Our customer deployments often begin with the requirement to solve a specific project, which subsequently turns into a program spanning across the enterprise. We intend to increase deployment of our solutions to new customers and within existing customers by targeting additional use cases and more functional areas and business units within the customer organization, and by meeting increasing capacity requirements, such as API monetization and analytics as their API business models evolve. |
| • | Expand Partnerships to Acquire and Service New Customers. We intend to continue building partnerships with global systems integrators and OEMs to enable us to efficiently expand our sales capacity and to provide professional services related to our software platform that also afford us strategic insights into customer deployments. In August 2013, we formed a global alliance with Accenture to deliver enterprise API solutions. In July 2014, we announced an OEM and reseller agreement with SAP. Additionally, a number of global systems integrators and digital agencies are partnering with us to sell our platform. |
| • | Continue to Aggressively Grow Our Business Internationally. We believe that there is substantial opportunity to grow our international business. We have been focused on international expansion, starting by opening our EMEA base in London in late 2012. For fiscal 2014 and the six months ended January 31, 2015, respectively, we derived approximately 33% and 38% of our revenue from customers located outside the United States. We plan to continue to aggressively market to customers located outside of the United States by building partnerships, and by expanding our direct and indirect sales channels outside the United States and EMEA. In addition to our existing strategic global partnerships with Accenture and SAP, we intend to pursue other systems integrators and digital agencies to address specific geographic regions and vertical markets. |
Our Platform
Architecture
Our guiding architectural principles are simplicity, scalability and data-centricity. These principles guide our product design and technology strategies.
We define simplicity in two dimensions: first as the initial “zero to sixty” experience of a first time user of our platform, and second as the ability of our product to serve the entire life cycle of usage by both individuals and teams across multiple projects. We define scalability as the ability to handle the highest levels of traffic throughput with the lowest latencies, with a system that is reliable and available, in the cloud or in a private datacenter. We define data-centricity as the essential property that drives us to enable the customer to mine every transaction and interaction for data; to provide data management capabilities that efficiently store all of the data that we collect or generate; and to ensure that these data can be used throughout the system, whether to present meaningful dashboard reports or to automatically adapt the platform to optimize business outcomes.
-97-
Table of Contents
Our architecture is designed as a true platform technology—it is not just about managing APIs, but a technology stack that is itself built out of APIs. This makes it possible for us to build new solutions for new markets and it enables our customers and partners to leverage the full set of capabilities that we deliver for new purpose-built applications and systems. Examples of customers and partners that have built their digital businesses on our platform include:
| • | Walgreens uses our software as a platform to enable an ecosystem of developers building applications using Walgreens APIs. |
| • | A leading telecommunications company uses our software as a platform to power multiple independent projects on a single Apigee installation. |
| • | SAP uses our platform as the basis for an API management application offering to its customers both on premises and through the SAP HANA Cloud Platform. |
Products
Our platform is designed to empower business leaders, IT technologists and developers to build and operate digital businesses. The platform is comprised of the following products:
| • | Apigee Edge is a self-service API platform that enables businesses to manage the digital value chain from exposure of their services and data through APIs to the use of those APIs by developers who are building consumer-facing and enterprise applications, and to measure the success of the business’s digital initiatives with end-to-end analytics. |
| • | Apigee Insights is the self-service predictive analytics solution that enables the enterprise to find time-based patterns in big data—both structured and unstructured—and gain insights to help an enterprise provide personalized experiences, maximize customer satisfaction and retention and grow revenue and profits. |
| • | Apigee Developer is comprised of Apigee Edge Trial, two open source products, Apigee 127 and Apigee Zetta, and open source projects that we sponsor. Apigee Edge Trial provides a free, self-service, non-expiring cloud-based trial of Apigee Edge to developers. Apigee 127 is an open source, design-first toolkit for building rich, enterprise-class APIs on a laptop or any local development environment, which can be deployed on multiple platforms as a service. Apigee Zetta is an open source platform for creating IoT servers that run across geo-distributed computers and in the cloud. We are a principal contributor to the Apache Usergrid project, an open source Backend-as-a-Service, or BaaS. In addition, we provide free API documentation tools that facilitate developers’ learning and testing of APIs. Developers, in turn, are able to redistribute these tools through community sites. |
Apigee Edge
Apigee Edge is the foundation of our platform strategy. It provides a solution that addresses the entire digital value chain and minimizes risk and time-to-value by eliminating the need to integrate disparate point solutions. Apigee Edge includes three components: API Services, Developer Services and Analytics Services.
API Services unites Internet and enterprise technologies with API management, BaaS, security and programming extensibility. API Services enable the transformation of services into APIs that extend an enterprise’s capabilities to the digital world of applications and devices, delivering new agility while maintaining the security and reliability that enterprises require. Key capabilities of API Services include:
| • | Self-service and extensibility enables developers to directly manage API policy configuration and changes with pre-built policies for traffic management, security, mediation and extension. |
| • | Protocol transformation enables the transformation of enterprise data and services into easily usable, scalable and secure APIs. |
-98-
Table of Contents
| • | BaaS provides developers with a cloud datastore and API-based capabilities for user management, push notifications, social networking and geolocation services. |
| • | Policy-based security architecture provides a configurable model that enables enterprise-grade security to protect the business from threats, backend overload and service issues. |
| • | API programmability enables the extension of API Services capabilities to increase flexibility and meet business requirements, with support for Java, JavaScript, Node.js and Python. |
Developer Services enables an enhanced developer and community experience that accelerates API adoption, simplifies learning and increases the business value of APIs. Key Developer Services capabilities include:
| • | Developer portal is deployed by an enterprise to provide a community for developers with the resources necessary to learn about the enterprise’s APIs, become a registered developer and collaborate with peers and with the enterprise. |
| • | Fast on-boarding for developers with self-service registration and key generation to register their applications and engage with both the API provider and with a community of peer developers. |
| • | Interactive API documentation and modeling simplifies designing and documenting new APIs as well as learning, testing and evaluation of existing APIs. |
| • | API consoles enable developers to easily access and explore APIs from almost 100 top API providers, improving their knowledge and ability to use the appropriate API for their needs. |
| • | API monetization enables API revenue models based on fees, freemium and revenue sharing and can be customized to meet complex requirements. |
Analytics Services enables end-to-end visibility across the digital value chain with the unified operational, developer, application performance and business metrics necessary to monitor, measure and manage success. Key Analytics Services capabilities include:
| • | Business metrics provide a business context for monitoring and measuring API program goals and helping to make smart, informed business decisions. |
| • | Operational analytics monitors the health and performance of production APIs, enabling enterprises to plan for traffic spikes, identify slow and error-prone APIs, find root causes and understand traffic anomalies. |
| • | Application performance monitoring measures mobile app usage and performance of applications, on different platforms, carriers and devices. |
| • | Developer program metrics identifies the developer programs with the most popular applications, best developer engagement and highest API traffic. |
Apigee Insights
Apigee Insights delivers predictive analytics enabling businesses to gain actionable insights. To address the need to perform sophisticated predictive analytics on business events, such as those captured by the data streams running through our APIs, we have built a unique time-sequenced graph database that stores and analyzes the events within graphs, which can be used to represent the relationships of events within complex sequences. This allows businesses to model customers’ journeys as they interact with various digital touch-points such as mobile apps. By modeling the propensity of a customer to step through these sequences, a company can make predictions that determine the next most likely or next best action, or to make recommendations and tailor the experience to drive the user to choose the next action that serves business objectives. Graph and Sequence Processing technology, or GRASP, is the core proprietary technology within Insights. Key capabilities of this technology include:
| • | Time-sequenced graph database that makes it simple to efficiently aggregate information along customer journey paths and to analyze customer events; |
-99-
Table of Contents
| • | Data management to import data into GRASP, understand the imported data, and view statistics about each imported data set; and |
| • | Data loaders to load data into GRASP from Apigee Edge, Hadoop-based data lakes, Amazon S3 and enterprise data warehouses. |
Predictive analytics capabilities enable businesses to anticipate each customer’s likely next action by analyzing all interactions along the customer journey and including the customer’s current context such as location, weather or time of day. Key elements of these capabilities include:
| • | Customer journey analytics to measure and visualize the sequences of interactions of multiple customers and understand customer distribution along one or more attributes; |
| • | Unstructured data processor to extract relevant keywords from text and determine customer sentiment based on user-submitted responses; and |
| • | Predictive modeling to analyze likelihood of future actions based on customer events and customer profiles. |
Adaptive interactions capabilities enable business to realize value from data by solving the last mile problem of integrating predictive analytics into applications. This capability enables a business to adapt the behavior of applications in real time. Key elements of these capabilities include:
| • | Segmentation and profiling to easily segment and target users using descriptive, behavioral and predictive attributes; |
| • | Scalable, real-time propensity scores based on user and context events that can be used to power adaptive applications that generate dynamic responses to influence user behavior; |
| • | RESTful APIs to access all customer predictions, segments and data; and |
| • | Self-service to enable developers to quickly build new predictive data projects and initiate analytics tasks without the need to setup or configure independent installations. |
Apigee Developer
Apigee Developer is comprised of Apigee Edge Trial, two open source products, Apigee 127 and Apigee Zetta, and other open source projects that we sponsor.
Apigee Edge Trial is a free, self-service cloud edition of Apigee Edge. Apigee Edge Trial provides software developers with much of the functionality in the enterprise edition of Apigee Edge, but without an enterprise service level agreement and with restrictions on storage and traffic rates. We provide the developer service free of charge as a way to build awareness of our platform and our technologies within the developer community. This results in our products being used in projects at early stages of development, giving us an advantage as projects grow and require commercial support and services. It also greatly expands the pool of developers who are proficient with our technology.
Apigee 127 is an open source, design-first toolkit for building enterprise-class APIs in Node.js in a local development environment. Developers can design, model and configure APIs using the popular Swagger API definition language with our easy-to-use editor. These API definitions generate ready-to-run APIs that can be run on Apigee Edge or other cloud services.
Apigee Zetta is an open source product for creating IoT servers that run across geo-distributed computers and the cloud. Zetta allows IoT developers to assemble smartphone applications, device applications and cloud applications into large, complex adaptive “systems of systems” that operate at scale in the physical world of home automation, smart transportation and wearable computing.
-100-
Table of Contents
Our Technology
Our technology efforts are centered on five key areas of focus across our solutions: scalability, multi-tenancy, data-centricity, simplicity and reliability. Each of these areas represents a significant challenge to implement effectively, and we believe that the combination of the five differentiates our platform.
Scale Is Hard
Our API platform is positioned at the center of the enterprise architecture and enables all API traffic between applications and backend systems to pass through our systems. This means that our products must be among the most scalable, high performance and reliable systems in the enterprise. Enterprise architectures are by nature distributed geographically and often have elements that run in the cloud as well as in the customer’s data center. Therefore, our platform technology is built as a distributed architecture and can be deployed both in the cloud and on premises. Our cloud service is highly scalable and can process more than one billion API calls a day.
In order to build a system that can perform at scale, we use a variety of best practices and technologies. These include:
| • | High-performance pipelined proxy architectures that can effectively handle very high levels of API traffic, efficiently processing the traffic whether to analyze or transform it with minimal computational overhead; |
| • | Automated elastic computing to devote additional computational resources on-demand, with our software automatically able to take advantage of new resources and allocate them to tasks efficiently; |
| • | Micro-services architecture that allows us to develop constituent services powering specific features and then scale these features independently as necessary based on usage patterns; and |
| • | Distributed database technologies and expertise that allows us to manage the storage requirements for our architecture as demand grows. |
Multi-tenancy Is Hard
Multi-tenancy is the technology that cloud-based services use to share IT resources cost-efficiently and securely across multiple users and projects. The multi-tenant design of a cloud service can have a dramatic impact on the application delivery and productivity of an IT organization. Multi-tenancy at scale is a core requirement and key technological advantage for us. Customers of our cloud service business must experience the fast and simple self-service process that they have come to expect from Software-as-a-Service products.
We have developed unique mechanisms for ensuring that each user of our cloud service is isolated from other users in ways designed to ensure that each user gets guaranteed service levels. At the same time, we are able to safely share certain pooled computation and data resources between users in order to create a high degree of operational efficiency. We provide the same multi-tenancy experience to our non-cloud customers who install our software as an on-premises solution.
Data Is Hard
All of our solutions rely on the ability to store, query and analyze data, often in real time, and at significant levels of scale, leveraging a unique combination of open source data storage technologies, including Cassandra, Hadoop and Postgres, and a proprietary set of data management and analytics capabilities. We have augmented these capabilities with predictive analytics based on complex graph-based analysis of these data streams. These technologies allow us to:
| • | Store large amounts of API data and API traffic metadata in real-time regardless of traffic levels; |
| • | Construct queries that can execute in real time with traffic flows in order to retrieve information that supplements API data and to make real-time decisions about the handling of API traffic; |
| • | Implement “counters,” which are the running tallies of traffic patterns and key metrics related to users, devices and business events; |
-101-
Table of Contents
| • | Generate alerts based on data conditions in order to notify IT personnel of critical events; and |
| • | Serve pre-defined and customer reports to provide answers to questions such as how API traffic is trending over time, who are the top developers, when API response time varies, from which geography is API traffic coming, what APIs are failing, and what devices are making the most API requests. |
Apigee Insights leverages our proprietary GRASP to power big data predictive analytics that increases the ability to find time-based patterns in structured and unstructured data. Featuring a distributed processing foundation based on Hadoop and an in-memory real-time processor, Apigee Insights combines the power of big data and data science to deliver significantly greater precision than is possible with traditional technologies and statistical tools.
Simplicity Is Hard
We leverage APIs in our own platform architecture to deliver simplicity and adaptability. Using a modern “microservices architecture” approach, the capabilities of our solutions are exposed as APIs. This allows us to develop our solutions as a set of independent services, which are assembled to create a comprehensive user experience. This also allows developers or organizations to create and customize the manner in which they interact with our solutions, bringing simplicity and flexibility to enterprise infrastructure. We provide an intuitive graphical user interface, and easy to use “command line” options for developers. We make our APIs intuitive and easy to use and enable developers to build on our platform with technologies such as JavaScript and Node.js, simplifying the programmability of our platform. Our platform is designed to be operated in a “self-service” manner by our customers, and our configurable policies allow customers to transform services into highly consumable APIs, control API traffic, enhance performance and enforce security, all without coding or changing the backend systems of record.
Reliability Is Hard
The integrity and security of our cloud products is critical to our business, and as such we leverage industry-standard security and monitoring tools to ensure performance across our cloud service. Our technology enables enterprises to provide secure access to their data and services with a well-defined API that is consistent across all of their databases and services, regardless of implementation. Our cloud customers are highly dependent on our cloud service, and as such, it is designed to be available 24 hours a day, 365 days a year. We provide a service level commitment for our cloud service, which can be up to 99.99%, excluding designated periods of maintenance.
Our Customers
Our customers include leading enterprises across a broad range of industry segments, including telecommunications, media and entertainment, financial services, retail, travel and hospitality, and healthcare and insurance. Our customer base has grown over 35% from the end of fiscal 2012 to the end of fiscal 2014. Our customers are comprised of organizations that have purchased our cloud or on-premises software solutions and professional services. On an annual basis, our revenue per customer ranges from less than $50,000 to over $1.0 million. One customer, AT&T, represented 38%, 36% and 15%, of our total revenue in fiscal 2012, fiscal 2013 and fiscal 2014, respectively and represented 17% and 6% of our total revenue in the six months ended January 31, 2014 and 2015, respectively. No other customer accounted for more than 10% of our total revenue in any of the past three fiscal years.
Below are some of our representative customers by revenue during the prior six fiscal quarters ended January 31, 2015, organized by industry segment:
| Telecommunications | Media & Entertainment | Financial Services | ||
| AT&T Inc. | BBC Worldwide Ltd. | First Data Corporation | ||
| Swisscom AG | Gamesys, Ltd. | Morningstar, Inc. | ||
| Telefonica, S.A. | Live Nation Entertainment, Inc. | Vantiv, Inc. | ||
| Vodafone Group Plc | Outerwall Inc. | |||
-102-
Table of Contents
| Retail | Healthcare/Insurance | |
| Burberry Group plc | eHealth, Inc. | |
| Magazine Luiza | Health Care Service Corp. | |
| Target Corporation | Humana Inc. | |
| Walgreens Company | Independence Blue Cross | |
| WM Morrison Supermarkets PLC | Kaiser Permanente | |
We also offer a free version of our software to developers with much of the functionality in the enterprise edition of Apigee Edge, but without an enterprise service level agreement and with restrictions on storage and traffic rates. This enables us to build awareness of our platform and our technologies within the developer community and we believe that it results in our products being used in projects at early stages of development, giving us an advantage as projects grow and require commercial support and services.
Customers Case Studies
The following case studies are examples of how certain of our customers have deployed and benefited from our platform.
AT&T
Problem: AT&T, one of the world’s leading providers of IP-based communications services, wanted to deliver new capabilities to its customers faster by making it secure and easy for independent developers and partners to build apps using its network-based services. As part of this digital initiative, AT&T wanted a secure, simple way to expose and manage its back-end services with third-party developers and partners.
Solution: In 2011, AT&T started using our platform as part of its digital initiative to securely open up its network-based services – such as location, messaging, payment and speech – and enable outside developers to create an ecosystem of innovative apps using AT&T’s network. Using Apigee Edge, AT&T securely manages and shares select back-end services (defined through APIs) with third-party developers. In 2013, AT&T expanded its use of our platform to manage APIs and data delivery for its mission-critical system used by national reseller partners to securely activate AT&T mobile phones. AT&T continues to tap additional capabilities in our platform as it continues its digital transformation, including an initiative that uses our Apigee Insights predictive analytics platform to anticipate and adapt to change.
Gogo
Problem: Leading global aero communications service provider Gogo wanted to enable airline partners and digital agencies to build engaging new applications for airline passengers using Gogo’s in-flight communications services, but its IT architecture was not designed to securely share data with third-party applications at scale.
Solution: In 2014, Gogo built a custom developer portal, which operates on the Apigee platform, where partners can now come to build innovative applications using Gogo data and services. Partners can access and use Gogo APIs such as “gogoFlightInfo” to create new applications that deliver compelling in-flight experiences. For example, a leading airline created an application using Gogo APIs that encourages networking among business travelers in the air. Our platform securely delivers Gogo’s backend data and services to partner applications via APIs. Apigee also provides the control and analytics to support Gogo as the ecosystem of third-party Gogo applications scales.
-103-
Table of Contents
McCormick
Problem: McCormick, a global leader in spice manufacturing, wanted to quickly accelerate growth beyond its long-standing model of adding stores to its physical distribution chain.
Solution: Using our platform, McCormick developed a new digital service called FlavorPrint, which has been referred to as the “Netflix for the food industry” because it uses data analytics to suggest what consumers should cook based on his or her unique flavor “fingerprint” (similar to Netflix’s movie suggestions). Using consumer digital engagement to influence in-store sales, FlavorPrint creates customized profiles of the foods and recipes people love to drive them to stores to buy McCormick products. A customer since 2013, McCormick uses the Apigee platform to securely deliver all FlavorPrint data and web services to mobile and web applications across consumer touchpoints. Our integrated analytics have also helped McCormick understand how FlavorPrint is being used in order to optimize the service and grow faster.
First Data
Problem: First Data, a global leader in payment technology and services solutions, wanted to quickly build a solution to support Apple’s new Apple Pay single-touch payment solution.
Solution: With Apigee’s platform, First Data was able to accelerate project development and time to market for Payeezy.com, its online eCommerce solution that gives merchants access to Apple Pay. A customer since 2014, First Data uses our platform to bring app developers onboard and to enable them to rapidly build and scale solutions supporting online and mobile payments using First Data APIs. As a result, First Data was one of the first financial services companies that supported Apple Pay. Our platform is an integral component of Payeezy.com, connecting First Data services and data to outside developers via First Data APIs so those developers can rapidly build solutions supporting online and mobile payments.
Swisscom
Problem: Swisscom, the largest telecommunications operator in Switzerland, wanted to operate with more agility and efficiency to remain competitive amid declining revenues for services like voice and messaging.
Solution: APIs powered by our platform are key to Swisscom’s digital transformation, enabling the telecommunications leader to more quickly and securely share data and digital services, both inside and outside its organization. With our platform, Swisscom, a customer since 2013, makes it easier for software developers to build powerful apps that take advantage of its network-based services. Swisscom can securely deliver its APIs, manage growing API traffic and quickly expand the ecosystem of applications that use Swisscom services. Moving forward, Swisscom’s API program powered by our platform will drive a Swisscom “partner platform” that delivers a variety of applications in an iTunes model and a Swisscom “experience platform” similar to Facebook.
Equinix
Problem: Equinix, a global interconnection and data center company, wanted to ensure that customers using its new Cloud Exchange offering would receive consistent, high-performance connections to multiple clouds in near-real time.
Solution: A customer since 2013, Equinix uses our platform to help simplify the complex process of provisioning and managing connections to multiple cloud services and networks in multiple geographies. The Equinix Cloud Exchange offers a large ecosystem comprised of leading cloud services, including Amazon Web Services, Microsoft Azure and Google Cloud Platform. Because the near-real-time connectivity in the Equinix Cloud Exchange is achieved through the use of APIs, which need to be optimized for performance and managed at scale, Equinix has embedded our API platform into the Cloud Exchange to deliver seamless, on-demand, high-performance access to multiple clouds from multiple networks around the world.
-104-
Table of Contents
Tradier
Problem: Tradier, an online brokerage company, wanted to ensure that the data and services used as part of its new cloud-based brokerage platform had high security, were easy to integrate into applications and could scale.
Solution: Tradier offers APIs and tools that enable financial services firms, software developers and investors to create customized trading experiences and real-time portfolios. A customer since 2013, Tradier uses our API platform to provide the security, visibility, traffic management and analytics required to operate its business-critical and often sensitive data and services. Tradier estimates that our platform accelerated the launch of its brokerage platform by several months, and its partners have indicated that the onboarding process with our technology is three to nine times faster than similar integrations with other platform providers.
Pearson
Problem: Pearson, the world’s largest education and book publishing company, wanted to deliver more and better educational experiences for its global audiences.
Solution: Pearson created an API program, powered by our platform, to simplify the development and maintenance of its online educational applications using its wide-ranging selection of educational content. Starting in 2012, the company adopted our platform to securely deliver Pearson content through a global ecosystem of online applications and to serve as the technology foundation for Pearson’s software developer portal. Using our platform, Pearson has been able to accelerate and scale its developer ecosystem, which has grown to over 3,000 developers. With Apigee and APIs, Pearson estimates the time it takes a developer to build an application using Pearson educational content has decreased from four weeks to just six to eight hours on average. As a result, Pearson’s community continues to expand, creating high-quality and adaptive online learning experiences globally.
Philips
Problem: The Lighting division of Philips, a Global 500 company, wanted to address demand for the IoT and expand the number of applications built for its Hue lighting system beyond the limited number of applications developed internally.
Solution: A customer since 2014, Philips has been using APIs to enable outside developers to build over 200 apps to use lights in new ways. With Apigee, Philips has been able to re-engineer their server interface to enable developers to securely access their APIs via the cloud, which will further accelerate the API use and link it to internet services like Facebook and Evernote.
Sales and Marketing
Our sales and marketing organizations optimize our customer acquisition process by generating brand and product awareness, cultivating customer relationships, lead generation, building pipeline, onboarding new channel partners and implementing customer expansion programs.
Sales
We sell our software through direct field sales, direct inside sales and indirect channel sales. We have local sales teams in North America, Europe and Asia Pacific. We also have a dedicated sales team focused on government customers, which covers U.S. federal, state and local government entities. We generate prospects and leads through a wide range of marketing programs and events and also run a robust outbound teleprospecting program. Leads are qualified by inside account development representatives, based on a set of criteria agreed
-105-
Table of Contents
upon by sales and marketing leadership. Our direct sales team seeks to build relationships high up in the enterprise where business strategy decisions are being made. In addition to acquiring new customers, our sales teams are responsible for increased adoption of our software by existing customers.
We have formed strategic partnerships with Accenture and SAP and work closely with them globally to acquire new customers. We also have established relationships with other channel partners to provide us with additional sales leverage worldwide by sourcing new prospects, providing professional services and technical support to existing customers and upselling for additional use cases. Our channel partners include system integrators that combine our products with their own technology expertise and solutions and digital agencies that help customers implement digital initiatives. Technology partners and OEMs integrate our products to extend functionality and use our products in their own solutions.
As is typical in the software industry, we expect a significant portion of our product orders to be received in the last month of each fiscal quarter. We typically provision our product orders shortly after the receipt of an order. While we may have backlog consisting of product orders that have not shipped and maintenance, professional and training services that have not been billed and for which the services have not yet been performed at the end of a given fiscal year, historically, we have not had material backlog, and we do not anticipate having material backlog in the future.
Marketing
Our marketing and demand generation efforts consist of a mix of metrics-driven programs to educate the market and generate leads for our field sales team. Through our marketing programs and events, and through our strategic relationships, we generate customer leads, accelerate sales opportunities and increase brand awareness.
Our thought leadership content and online education and certification programs reach business leaders, IT technologists and developers, helping define the language and the requirements of the market. Equipping all of these important constituents with the know-how and tools to be effective in digital business facilitates our potential future sales. We offer a free trial cloud service as well as free developer tools, and open source solutions to help drive adoption of our solutions. Our marketing programs include free online and local training to engage both existing and prospective customers. We participate in conferences, trade shows and industry events and also annually host the largest API industry user conference, called I Love APIs, to build and support the API community to enable companies to become digital businesses.
Customer Success
We have built a company culture centered around our customers’ success and satisfaction. We have developed several programs designed to provide customers with service options to enhance their experience with, and expand their use of, our products.
Professional Services
We provide consulting, training, configuration and implementation services to customers through our professional services organization. These services are typically utilized by large enterprises looking to deploy our solutions across their large, disparate and complex IT infrastructure. We believe that these professional services are an important part of our solution to our customers because digital infrastructure transformation frequently involves core business strategy and impacts the entire organization. Personnel within our professional services organization are trained on our products and are encouraged to follow our methodologies. We generally provide these services at the time of initial installation to help the customer with configuration and implementation. Given our software’s ease-of-use, our professional services engagements are typically short in duration.
-106-
Table of Contents
Maintenance and Customer Support
Our customers typically purchase annual subscriptions to our platform that include software maintenance and support as part of their initial purchase of our software platform. Software maintenance and support is not included as part of a perpetual license and may be purchased separately. The maintenance agreements provide customers the right to receive unspecified software updates, maintenance releases and patches and access to our technical support services during the term of the agreement.
Customers receiving maintenance and support receive guaranteed response times, direct telephonic support and access to online support portals. All support is provided 24x7x365 for critical issues. Our customer support organization has global capabilities, delivering support with deep expertise in both its software as well as complex IT environments. Our support team also works closely with our updates team to create the best possible experience for customers as they move from one version of our products to the next version.
Training
We provide several options for customers to increase their level of knowledge about our products through our training organization, which offers classroom training, virtual classroom training and on-demand training. Paid classroom training offers customers the opportunity to visit one of our training facilities for one or more days of hands-on, instructor-led courses. Paid virtual classroom training is also delivered by an instructor, but students attend the training on-line rather than being present at a training facility. We also continue to develop our free and on-demand online education and enablement courses through the Apigee Academy.
Research and Development
We invest substantial resources in research and development to enhance our platform, develop new solutions, conduct software and quality assurance testing and improve our core technology. Our technical staff monitors and tests our software on a regular basis, and we maintain a regular release process to refine, update, and enhance our existing products. We typically provide our customers with updates to our solutions at least monthly in the cloud and quarterly on premises. Research and development expense totaled $10.9 million, $16.8 million and $22.3 million for fiscal 2012, fiscal 2013 and fiscal 2014, respectively, and $9.2 million and $14.4 million for the six months ended January 31, 2014 and 2015, respectively.
Competition
The market for enterprise API-based platforms is fragmented, rapidly evolving and highly competitive. We compete against in-house or custom development efforts, a variety of large software vendors and smaller specialized companies and open source initiatives, all of which vary in the breadth and scope of the products and services offered. Beyond in-house or custom development efforts, our competitors include International Business Machines Corporation and Oracle Corporation, both of which can bundle competing products and services with other software offerings, or offer them at a low price as part of a larger sale. In addition, our industry is evolving rapidly and is becoming increasingly competitive. Larger and more established companies may focus on API management and API-based platforms and could directly compete with us. Smaller companies could also launch competing or new products and services.
We believe that the principal competitive factors in our market include the following:
| • | domain expertise in API business practices and technologies; |
| • | size of customer base and level of user adoption; |
| • | established status as a strategic IT platform; |
| • | brand awareness and reputation; |
-107-
Table of Contents
| • | total cost of ownership; |
| • | ease of deployment and use of API-based platforms by paying customers and developers; |
| • | level of paying customer and developer following; |
| • | breadth and depth of offering; |
| • | performance, availability and support for API-based platforms; |
| • | capability for customization, configurability, integration, security, scalability and reliability of applications; and |
| • | the ability to innovate and respond to customer needs rapidly. |
We believe that we compete favorably on the basis of the above factors. However, some of our actual and potential competitors have certain additional advantages over us, such as significantly greater financial, technical, marketing, research and development or other resources, stronger brand and business user recognition, larger installed customer bases, larger intellectual property portfolios and broader global distribution and presence.
Intellectual Property
Our success depends in part upon our ability to protect our core technology and intellectual property. To accomplish this, we rely on a combination of intellectual property rights, including patents, trade secrets, copyrights and trademarks, as well as customary contractual protections.
We had nine issued patents and eight patent applications pending in the United States as of February 15, 2015. Our issued patents expire between 2028 and 2029. We cannot assure you whether any of our patent applications will result in the issuance of a patent or whether the examination process will require us to narrow our claims. Furthermore, even if a patent issues, we cannot assure you that such patent will be adequate to protect our business. We also license software from third parties for integration into our solutions, including open source software and other software available on commercially reasonable terms.
We control access to and use of our proprietary technology and other confidential information through the use of internal and external controls, including contractual protections with employees, contractors, customers and partners, and our software is protected by U.S. and international copyright laws. Despite our efforts to protect our technology and proprietary rights through intellectual property rights, licenses and confidentiality agreements, unauthorized parties may still copy or otherwise obtain and use our software and other technology. In addition, we intend to expand our international operations, and effective patent, copyright, trademark and trade secret protection may not be available or may be limited in foreign countries.
Our industry is characterized by the existence of a large number of patents and frequent claims and related litigation regarding patent and other intellectual property rights. In particular, leading companies in our markets have extensive patent portfolios and are regularly involved in litigation. From time to time, third parties, including certain of these leading companies, may assert patent, copyright, trade secret and other intellectual property rights against us, our channel partners or our customers. Our standard license and other agreements may obligate us to indemnify our channel partners and customers against such claims. Successful claims of infringement by a third party could prevent us from continuing to offer our solution or performing certain services, require us to expend time and money to develop non-infringing solutions, or force us to pay substantial damages, including treble damages if we are found to have willfully infringed patents or copyrights, royalties or other fees. Competitors may also be more likely to claim that our solutions infringe their proprietary rights and seek an injunction against us from continuing to offer our platform. We cannot assure you that we do not currently infringe, or that we will not in the future infringe, upon any third-party patents or other proprietary rights.
-108-
Table of Contents
Employees
As of February 15, 2015, we had 396 full-time employees. None of our employees are either represented by a labor union or subject to a collective bargaining agreement. We have not experienced any work stoppages, and we consider our relations with our employees to be good.
Facilities
We currently lease approximately 41,000 square feet of space for our corporate headquarters in San Jose, California under a lease agreement expiring in June 2019. We lease regional offices for sales, support and product development in Atlanta, Georgia and Detroit, Michigan and various international locations, including India, Dubai and the United Kingdom. While we believe our facilities are sufficient and suitable for the operations of our business today, we are closely monitoring the need to add new facilities and expanding our existing facilities as we add employees and expand into additional markets.
Government Regulation
We are subject to a number of U.S. federal and state and foreign laws and regulations that involve matters central to our business. These laws and regulations may involve privacy, data protection, intellectual property, competition, consumer protection, taxation or other subjects. Many of the laws and regulations to which we are subject are still evolving and being tested in courts and could be interpreted in ways that could harm our business. In addition, the application and interpretation of these laws and regulations often are uncertain, particularly in the new and rapidly evolving industry in which we operate. Because global laws and regulations have continued to develop and evolve rapidly, it is possible that we may not be, or may not have been, compliant with each such applicable law or regulation.
Legal Proceedings
From time to time we are a party to various litigation matters and subject to claims that arise in the ordinary course of business including, for example, patent infringement lawsuits by non-practicing entities. In addition, third parties may from time to time assert claims against us in the form of letters and other communications. We currently believe that these ordinary course matters will not have a material adverse effect on our future financial results of operations; however, the results of litigation and claims are inherently unpredictable. Regardless of the outcome, litigation can have an adverse impact on us because of defense and settlement costs, diversion of management resources and other factors.
-109-
Table of Contents
Executive Officers and Directors
The following table provides information regarding our executive officers and directors as of March 2, 2015:
| Name |
Age | Position(s) | ||
| Executive Officers |
||||
| Chet Kapoor |
47 | Chief Executive Officer, President and Director | ||
| Tim Wan |
44 | Chief Financial Officer | ||
| Stacey Giamalis |
50 | Chief Counsel | ||
| Anant Jhingran |
51 | Chief Technology Officer | ||
| Shankar Ramaswamy |
47 | Vice President of Engineering and Operations | ||
| Stephen Rowland |
46 | Vice President of Worldwide Sales | ||
| Non-employee Directors |
||||
| Bob L. Corey(1) |
63 | Director | ||
| Neal Dempsey(1)(3) |
73 | Director | ||
| Promod Haque(2)(3) |
66 | Director | ||
| William “BJ” Jenkins, Jr.*(1)(2) |
49 | Director | ||
| Edmond Mesrobian(3) |
54 | Director | ||
| Robert Schwartz(2) |
53 | Director | ||
| * | Lead independent director |
| (1) | Member of our audit committee. |
| (2) | Member of our compensation committee. |
| (3) | Member of our nominating and corporate governance committee. |
Executive Officers
Chet Kapoor has served as our Chief Executive Officer and as a member of our board of directors since January 2007. Prior to joining our company, Mr. Kapoor served as Vice President of Content Management and Search Products at International Business Machines Corporation, from May 2005 to December 2006. From December 2004 to May 2005, Mr. Kapoor served as Chief Executive Officer of Gluecode Software, Inc., an open source application infrastructure company. From April 2002 to December 2004, Mr. Kapoor served as the Vice President and General Manager at BEA Systems, Inc., an enterprise infrastructure software company. Mr. Kapoor holds a B.S. degree in engineering from Arizona State University.
We believe that Mr. Kapoor possesses specific attributes that qualify him to serve as a member of our board of directors, including his extensive experience in the hardware and software industries and the operational insight and expertise he has accumulated as our Chief Executive Officer.
Tim Wan has served as our Chief Financial Officer since March 2015. Mr. Wan previously served as Senior Vice President, Chief Financial Officer and Treasurer of RealNetworks, Inc., a digital media and applications company, from April 2012 to February 2015. Mr. Wan served as RealNetworks’ Vice President, Finance from September 2009 to April 2012, as its Area Vice President, Strategic Planning and Analysis from March 2006 to August 2009, and in various other leadership roles at RealNetworks between 2000 and 2006, including General Manager of Consumer Operations, Director of Marketing Analysis and Senior Manager of Marketing Analysis. Mr. Wan also served as a trustee at Overlake Hospital Medical Center and as a board member of Rhapsody International. Mr. Wan has a B.A. in Economics from University of California, Los Angeles, and an M.B.A. from the University of Southern California.
-110-
Table of Contents
Stacey Giamalis has served as our Chief Counsel since October 2013. From April 2010 to October 2013, Ms. Giamalis served in several positions, including Vice President, General Counsel, Chief Privacy Officer and Secretary at Adchemy, Inc., a software solutions company. From July 2005 to September 2009, Ms. Giamalis served as Senior Vice President Legal and Human Resources, General Counsel and Secretary at LookSmart, Ltd., an online advertising company. From July 2002 to January 2005, Ms. Giamalis served in various roles at QRS Corporation, a commerce solutions company, including as its Vice President, General Counsel and Secretary. Ms. Giamalis holds a B.A. degree in psychology from the University of California, Davis and a J.D. degree from the University of California, Berkeley, Boalt Hall.
Anant Jhingran has served as our Chief Technology Officer since July 2012 and as our Vice President of Data from September 2011 to July 2012. Prior to joining our company, he served in several positions, including Vice President and Director of Computer Science at International Business Machines Corporation, from March 2000 to September 2011, most recently as an IBM Fellow and Chief Technology Officer, Information Management. Mr. Jhingran holds a B.S. degree in electrical engineering from IIT Delhi and a Ph.D. degree in computer science from the University of California, Berkeley.
Shankar Ramaswamy has served as our Vice President of Engineering and Operations since June 2013. From December 2009 to June 2013, Mr. Ramaswamy served in various roles at eBay Inc., an e-commerce company, including Director of Product Management, Application Platform of the Marketplaces division and Director of Product Management, Platform of the X.commerce division, most recently as Director of Engineering, Digital Payments Customer Engineering of the PayPal division. From August 2008 to December 2008, he served as Principal Technical Program Manager at Amazon.com, Inc. Mr. Ramaswamy holds a B.S. degree in electronics, physics and mathematics from Delhi University, an M.S. degree in electrical engineering from the Indian Institute of Science and a Ph.D. degree in electrical engineering and computer engineering from the University of Illinois at Urbana-Champaign.
Stephen Rowland has served as our Vice President of Worldwide Sales since July 2012. From September 2007 to June 2012, Mr. Rowland served in several positions, including Vice President of Asia Pacific Field Operations and Vice President of Americas Field Operations at Blue Coat Systems, Inc., a security and networking solutions company. From June 2006 to June 2007, Mr. Rowland served as Senior Vice President of Worldwide Sales at Workbrain, Inc., a workforce management software company. From August 1998 to June 2006, he served in several positions, including as vice president of sales at BMC Software Inc., an enterprise management solutions company. Mr. Rowland holds a B.S. degree in engineering from Texas A&M University.
Non-employee Directors
Bob L. Corey has served as a member of our board of directors since October 2011. Since May 2013, Mr. Corey has served as Senior Vice President and Chief Financial Officer of Callidus Software Inc., an enterprise software company. From May 2012 to May 2013, Mr. Corey served as the Chief Financial Officer of FrontRange Solutions USA Inc., an enterprise software company. From July 2009 to March 2011, he served in various roles, including Interim Chief Executive Officer and Executive Vice President and Chief Financial Officer at Extreme Networks, Inc., an ethernet solutions company. From May 2003 to January 2006, Mr. Corey served as Executive Vice President and Chief Financial Officer, at Thor Technologies, Inc., an enterprise software company. Mr. Corey holds a B.B.A. degree in accounting from California State University, Fullerton.
We believe that Mr. Corey possesses specific attributes that qualify him to serve as a member of our board of directors, including his financial and accounting expertise and his experience serving in a variety of finance positions at numerous public companies.
Neal Dempsey has served as a member of our board of directors since April 2005. Mr. Dempsey has been a General Partner of Bay Partners, a venture capital firm, since May 1989, and the Managing General Partner since July 2002. Mr. Dempsey currently sits on the boards of numerous private companies, and since April 2010, he
-111-
Table of Contents
has been a member of the board of directors of Enphase Energy, Inc., a solar energy management device maker. Previously, he has served as a member of the board of directors of Eloqua, Inc., a marketing solutions company, and Guidewire Software, Inc., a software company, from August 2006 to February 2013 and August 2006 to December 2013, respectively. He holds a B.S. degree in business from the University of Washington.
We believe that Mr. Dempsey possesses specific attributes that qualify him to serve as a member of our board of directors, including his extensive experience in the venture capital industry analyzing, investing in and serving on the boards of directors of technology companies, as well as his perspective as a representative of one of our largest stockholders.
Promod Haque has served as a member of our board of directors since April 2005. Mr. Haque has been a Senior Managing Partner of Norwest Venture Partners, a venture capital firm, since January 2013 and had previously served as a Managing Partner since 1990. He currently serves on the boards of directors of Cyan, Inc., an enterprise network company and several privately held companies, including Palerra, Inc., Health Catalyst, LLC and PCH International. He also previously served on the board of directors of FireEye, Inc., a provider of cybersecurity solutions, from March 2005 until October 2014, Persistent Systems Limited, a software product and technology services company, from November 2005 until November 2010, and as a chairman of the board of directors of Veraz Networks, Inc., a software solutions company, from July 2001 until October 2010 when it merged with Dialogic Corporation. Mr. Haque holds a B.S. degree in electrical engineering from the University of Delhi, India, an M.B.A. degree from Northwestern University’s Kellogg Graduate School of Management and a Ph.D. degree in electrical engineering from Northwestern University.
We believe that Mr. Haque possesses specific attributes that qualify him to serve as a member of our board of directors, including his extensive experience in the venture capital industry analyzing, investing in and serving on the boards of directors of technology companies, as well as his perspective as a representative of our largest stockholder.
William “BJ” Jenkins, Jr. has served as our lead independent director since February 2015 and as a member of our board of directors since September 2013. Since November 2012, Mr. Jenkins has served as Chief Executive Officer of Barracuda Networks, Inc., a hardware and software solutions company. From April 1998 to November 2012, Mr. Jenkins served in various roles, including President of the Backup Recovery Systems division at EMC Corporation, an information infrastructure company. Mr. Jenkins holds a B.S. degree in general engineering from the University of Illinois and an M.B.A. degree from Harvard Business School.
We believe that Mr. Jenkins possesses specific attributes that qualify him to serve as a member of our board of directors, including his extensive experience as an executive of companies in the technology industry.
Edmond Mesrobian has served as a member of our board of directors since March 2014. From January 2011 to September 2014, Mr. Mesrobian served as Chief Technology Officer of Expedia, Inc., an online travel company. From June 2003 to August 2010, Mr. Mesrobian served in various roles, including Chief Technology Officer at Real Networks, Inc., an internet streaming media delivery company. Previously, Mr. Mesrobian served in executive positions at ArtistDirect, Inc., Amplified Holdings, Inc. and Buena Vista Internet Group, as well as co-founded Checkout.com and the UCLA Data Mining Laboratory. Mr. Mesrobian holds a B.S. degree in math computer science, an M.Sc. degree in computer science and a Ph.D. in artificial intelligence and computer vision, all from University of California, Los Angeles.
We believe that Mr. Mesrobian possesses specific attributes that qualify him to serve as a member of our board of directors, including his extensive experience as an executive of companies in the technology industry.
Robert Schwartz has served as a member of our board of directors since June 2008. Since June 2000, Mr. Schwartz has been Managing Partner of Third Point Ventures, a venture capital arm of Third Point LLC. From 1984 to September 2013, Mr. Schwartz was the President of RF Associates North, Inc., a privately held
-112-
Table of Contents
communications semiconductor manufacturer’s representative firm. Mr. Schwartz currently serves on the board of directors of Enphase Energy, Inc., a solar array manufacturing company, and several privately held companies. Mr. Schwartz holds a B.S. degree in engineering from the University of California, Berkeley.
We believe that Mr. Schwartz possesses specific attributes that qualify him to serve as a member of our board of directors, including his extensive experience as a board member of companies in the technology industry.
Our executive officers are appointed by our board of directors and serve until their successors have been duly elected and qualified. There are no family relationships among any of our directors or executive officers.
Codes of Business Conduct and Ethics
We have adopted a code of business conduct and ethics that applies to all of our employees, officers and directors, including our Chief Executive Officer, Chief Financial Officer and other executive and senior financial officers. Upon the completion of this offering, the full text of our code of business conduct and ethics will be available on our website at www.apigee.com. We intend to post any amendment to our code of business conduct and ethics, and any waivers of such code for directors and executive officers, on the same website. Information on or that can be accessed through our website is not part of this prospectus.
Board Composition
Our board of directors currently consists of seven members. The current composition of our board of directors is dictated by our voting agreement, although this agreement will terminate upon the completion of this offering.
Following the completion of this offering, our amended and restated certificate of incorporation and amended and restated bylaws will provide for a classified board of directors, with each director serving a staggered, three-year term. The terms of the directors will expire upon the election and qualification of successor directors at the annual meeting of stockholders to be held during 2016 for the Class I directors, 2017 for the Class II directors and 2018 for the Class III directors.
| • | Our Class I directors will be Chet Kapoor and Promod Haque, and their terms will expire at the annual meeting of stockholders to be held in 2016; |
| • | Our Class II directors will be Neal Dempsey, Robert Schwartz and Bob L. Corey, and their terms will expire at the annual meeting of stockholders to be held in 2017; and |
| • | Our Class III directors will be William “BJ” Jenkins, Jr. and Edmond Mesrobian, and their terms will expire at the annual meeting of stockholders to be held in 2018. |
Upon expiration of the term of a class of directors, directors for that class will be elected for three-year terms at the annual meeting of stockholders in the year in which that term expires. Each director’s term shall continue until the election and qualification of his or her successor, or his or her earlier death, resignation or removal. Any additional directorships resulting from an increase in the number of authorized directors will be distributed among the three classes so that, as nearly as possible, each class will consist of one-third of the directors.
The division of our board of directors into three classes with staggered three-year terms may delay or prevent a change of our management or a change of control. Under Delaware law, our directors may be removed for cause by the affirmative vote of the holders of a majority of our voting stock.
Director Independence
In connection with this offering, we have applied to list our common stock on The NASDAQ Global Select Market. Under the rules of the NASDAQ Stock Market, independent directors must comprise a majority of a listed company’s board of directors within a specified period of the completion of this offering. In addition, the rules of the NASDAQ Stock Market require that, subject to specified exceptions, each member of a listed company’s
-113-
Table of Contents
audit, compensation and nominating and corporate governance committees be independent. Under the rules of the NASDAQ Stock Market, a director will only qualify as an “independent director” if, in the opinion of that company’s board of directors, that person does not have a relationship that would interfere with the exercise of independent judgment in carrying out the responsibilities of a director. Audit committee members must also satisfy the independence criteria set forth in Rule 10A-3 under the Exchange Act.
In order to be considered independent for purposes of Rule 10A-3, a member of an audit committee of a listed company may not, other than in his or her capacity as a member of the audit committee, the board of directors or any other board committee accept, directly or indirectly, any consulting, advisory or other compensatory fee from the listed company or any of its subsidiaries or be an affiliated person of the listed company or any of its subsidiaries.
Our board of directors has undertaken a review of the independence of each director and considered whether each director has a material relationship with us that could compromise his ability to exercise independent judgment in carrying out his responsibilities. As a result of this review, our board of directors determined that Bob L. Corey, Neal Dempsey, Promod Haque, William “BJ” Jenkins, Jr., Edmond Mesrobian and Robert Schwartz, representing six of our seven directors, were “independent directors” as defined under the applicable rules and regulations of the SEC and the listing requirements and rules of the NASDAQ Stock Market.
Committees of the Board of Directors
Our board of directors has an audit committee, a compensation committee and a nominating and corporate governance committee, each of which will have the composition and responsibilities described below upon completion of this offering. Members serve on these committees until their resignation or until otherwise determined by our board of directors.
Audit Committee
Bob L. Corey, Neal Dempsey and William “BJ” Jenkins, Jr. each of whom is a non-employee member of our board of directors, comprise our audit committee. Bob L. Corey is the chair of our audit committee. Our board of directors has determined that each of the members of our audit committee satisfies the requirements for independence and financial literacy under the rules and regulations of the NASDAQ Stock Market and the SEC. Our board of directors has also determined that Mr. Corey qualifies as an “audit committee financial expert” as defined in the SEC rules and satisfies the financial sophistication requirements of the NASDAQ Stock Market. We expect to satisfy the member independence requirements for the audit committee prior to the end of the transition period provided under current NASDAQ Stock Market listing standards and SEC rules and regulations for companies completing their initial public offering. The audit committee is responsible for, among other things:
| • | selecting and hiring our registered public accounting firm; |
| • | evaluating the performance and independence of our registered public accounting firm; |
| • | approving the audit and pre-approving any non-audit services to be performed by our registered public accounting firm; |
| • | reviewing our financial statements and related disclosures and reviewing our critical accounting policies and practices; |
| • | reviewing the adequacy and effectiveness of our internal control policies and procedures and our disclosure controls and procedures; |
| • | overseeing procedures for the treatment of complaints on accounting, internal accounting controls or audit matters; |
| • | reviewing and discussing with management and the independent registered public accounting firm the results of our annual audit, our quarterly financial statements and our publicly filed reports; |
-114-
Table of Contents
| • | reviewing and approving in advance any proposed related person transactions; and |
| • | preparing the audit committee report that the SEC requires in our annual proxy statement. |
Compensation Committee
Promod Haque, William “BJ” Jenkins, Jr. and Robert Schwartz, each of whom is a non-employee member of our board of directors, comprise our compensation committee. Promod Haque is the chairman of our compensation committee. Our board of directors has determined that each member of our compensation committee meets the requirements for independence under the rules of the NASDAQ Stock Market and the SEC, is a “non-employee director” within the meaning of Rule 16b-3 under the Exchange Act, and is an “outside director” within the meaning of Section 162(m) of the Internal Revenue Code of 1986, or the Internal Revenue Code. We expect to satisfy the member independence requirements for the compensation committee prior to the end of the transition period provided under current NASDAQ Stock Market listing standards and SEC rules and regulations for companies completing their initial public offering. The compensation committee is responsible for, among other things:
| • | reviewing and approving our Chief Executive Officer’s and other executive officers’ annual base salaries, incentive compensation plans, including the specific goals and amounts, equity compensation, employment agreements, severance arrangements and change in control agreements and any other benefits, compensation or arrangements; |
| • | administering our equity compensation plans; |
| • | overseeing our overall compensation philosophy, compensation plans and benefits programs; and |
| • | preparing the compensation committee report that the SEC will require in our annual proxy statement. |
Nominating and Corporate Governance Committee
Neal Dempsey, Promod Haque and Edmond Mesrobian, each of whom is a non-employee member of our board of directors, comprise our nominating and corporate governance committee. Neal Dempsey is the chairman of our nominating and corporate governance committee. Our board of directors has determined that each member of our compensation committee meets the requirements for independence under the rules of the NASDAQ Stock Market. We expect to satisfy the member independence requirements for the nominating and corporate governance committee prior to the end of the transition period provided under current NASDAQ Stock Market listing standards and SEC rules and regulations for companies completing their initial public offering. The nominating and corporate governance committee will be responsible for, among other things:
| • | evaluating and making recommendations regarding the composition, organization and governance of our board of directors and its committees; |
| • | evaluating and making recommendations regarding the creation of additional committees or the change in mandate or dissolution of committees; |
| • | reviewing and making recommendations with regard to our corporate governance guidelines and compliance with laws and regulations; and |
| • | reviewing and approving conflicts of interest of our directors and corporate officers, other than related person transactions reviewed by the audit committee. |
We intend to post the charters of our audit, compensation and nominating and corporate governance committees, and any amendments thereto that may be adopted from time to time, on our website at www.apigee.com. Information on or that can be accessed through our website is not part of this prospectus.
Our board of directors may from time to time establish other committees.
-115-
Table of Contents
Compensation Committee Interlocks and Insider Participation
None of the members of our compensation committee is or has been an officer or employee of our company. None of our executive officers currently serves, or in the past year has served, as a member of the compensation committee or director (or other board committee performing equivalent functions or, in the absence of any such committee, the entire board of directors) of any entity that has one or more executive officers serving on our compensation committee or our board of directors.
A member of our board of directors and our compensation committee, Promod Haque, is affiliated with Norwest Venture Partners, which is a holder of more than 5% of our capital stock. Entities affiliated with Norwest Venture Partners purchased 5,193,510 shares of our Series E convertible preferred stock for a total purchase price of $3,003,406.84 in November 2011, 4,181,165 shares of our Series F convertible preferred stock for a total purchase price of $6,392,165.06 in July 2012, 4,494,492 shares of our Series G convertible preferred stock for a total purchase price of $9,999,997.52 in July 2013, and 2,943,198 shares of our Series H convertible preferred stock for a total purchase price of $8,564,706.18 in April 2014. In addition, an entity affiliated with Norwest Venture Partners received 3,591,445 shares of our Series G convertible preferred stock for a total purchase price of $7,990,605.98 as a stockholder of InsightsOne Systems, which we acquired in December 2013 through the merger of our wholly-owned merger subsidiary with and into InsightsOne with InsightsOne continuing as the surviving corporation and a wholly-owned subsidiary of us.
A member of our board of directors and our compensation committee, Robert Schwartz, is affiliated with Third Point Partners, which is a holder of more than 5% of our capital stock. Entities affiliated with Third Point Partners purchased 2,221,306 shares of our Series E convertible preferred stock for a total purchase price of $1,284,581.28 in November 2011, 2,028,403 shares of our Series F convertible preferred stock for a total purchase price of $3,101,022.53 in July 2012, 2,010,685 shares of our Series G convertible preferred stock for a total purchase price of $4,473,663.56 in July 2013, and 929,430 shares of our Series H convertible preferred stock for a total purchase price of $2,704,641.30 in April 2014.
In connection with the purchases of our convertible preferred stock, we entered into an amended and restated investors’ rights agreement with the holders of such stock, including entities affiliated with each of Norwest Venture Partners and Third Point Ventures. This agreement provides, among other things, that the holders of our preferred stock have the right to request that we file a registration statement or request that their shares be covered by a registration statement that we are otherwise filing, subject to certain exceptions. For a description of these registration rights, see the section titled “Description of Capital Stock—Registration Rights.”
Non-employee Director Compensation
We do not currently have a formal policy with respect to compensation payable to our non-employee directors for service as directors. During 2014, our non-employee directors did not receive any cash compensation for their services as directors or as board committee members. Our board of directors has, however, granted equity awards from time to time to non-employee directors as compensation for their service as directors.
The table below shows the equity and other compensation granted to our non-employee directors during 2014.
| Name |
Year | Option Awards ($)(1) |
All
Other Compensation ($) |
Total ($) |
||||||||||||
| Bob L. Corey |
2014 | — | 11,706 | 11,706 | (2) | |||||||||||
| Neal Dempsey |
2014 | — | — | — | ||||||||||||
| Promod Haque |
2014 | — | — | — | ||||||||||||
| William “BJ” Jenkins, Jr. |
2014 | 84,087 | — | 84,087 | ||||||||||||
| Edmond Mesrobian |
2014 | 92,972 | — | 92,972 | ||||||||||||
| Robert Schwartz |
2014 | — | — | — | ||||||||||||
-116-
Table of Contents
| (1) | The amounts in this column represent the aggregate grant-date fair value of the award as computed in accordance with Financial Accounting Standard Board Accounting Standards Codification Topic 718. The assumptions used in calculating the grant-date fair value of the awards reported in this column are set forth in the notes to our audited consolidated financial statements included elsewhere in this prospectus. |
| (2) | The amounts represent health insurance premiums paid by us on behalf of Mr. Corey. |
The following table lists all outstanding equity awards held by our non-employee directors as of July 31, 2014:
| Option Awards | ||||||||||||||||||||
| Name |
Option Grant Date |
Number of Securities Underlying Unexercised Options Exercisable |
Number of Securities Underlying Unexercised Options Unexercisable |
Option Exercise Price Per Share |
Option Expiration Date |
|||||||||||||||
| Bob L. Corey |
2/14/2012 | 162,250 | 73,750 | (1) | $ | 0.09 | 2/13/2022 | |||||||||||||
| Neal Dempsey |
— | — | — | — | — | |||||||||||||||
| Promod Haque |
— | — | — | — | — | |||||||||||||||
| William “BJ” Jenkins, Jr. |
9/3/2013 | — | 460,685 | (2) | $ | 0.54 | 9/2/2023 | |||||||||||||
| Edmond Mesrobian |
3/5/2014 | — | 288,041 | (3) | $ | 0.97 | 3/4/2024 | |||||||||||||
| Robert Schwartz |
— | — | — | — | — | |||||||||||||||
| (1) | The option vests, subject to Mr. Corey’s continued role as a service provider to us, with one-fourth of the shares subject to the option vest on the twelve-month anniversary of the vesting commencement date of October 6, 2011 and one forty-eighth of the shares subject to the option vest monthly thereafter. |
| (2) | The option vests, subject to Mr. Jenkins’ continued role as a service provider to us, with one-fourth of the shares subject to the option vest on the twelve-month anniversary of the vesting commencement date of August 30, 2013 and one forty-eighth of the shares subject to the option vest monthly thereafter. |
| (3) | The option vests, subject to Mr. Mesrobian’s continued role as a service provider to us, with one-fourth of the shares subject to the option vest on the twelve-month anniversary of the vesting commencement date of February 10, 2014 and one forty-eighth of the shares subject to the option vest monthly thereafter. |
In March 2015, our board of directors approved a stock option grant to Mr. Corey to purchase 217,636 shares of our common stock at a purchase price of $2.31 per share. The option was granted pursuant to our 2005 Stock Incentive Plan and is scheduled to vest, subject to Mr. Corey’s continued role as a service provider, as to one twenty-fourth of the total shares on each monthly anniversary of October 6, 2015.
Upon a change of control, each non-employee directors’ then-outstanding and unvested shares subject to options granted under the 2005 Plan, will become fully vested and exercisable (and our repurchase right with respect to shares acquired through an early exercise will lapse).
-117-
Table of Contents
2014 Summary Compensation Table
The following table presents information concerning the total compensation of our named executive officers for services rendered to us in all capacities during the year ended July 31, 2014:
Summary Compensation Table
| Name and Principal Position |
Year | Salary($) | Bonus($) | Option Awards($)(1) |
Non-Equity Incentive Plan Compensation($) (2) |
All
Other Compensation($)(3) |
Total($) | |||||||||||||||||||||
| Chet Kapoor |
2014 | 312,771 | — | 546,540 | 87,150 | 572,521 | (4) | 1,518,982 | ||||||||||||||||||||
| Chief Executive Officer |
||||||||||||||||||||||||||||
| Steve Valenzuela(5) Former Chief Financial Officer |
2014 | 201,763 | 100,000 | (6) | 472,144 | 45,150 | — | 819,057 | ||||||||||||||||||||
| Stephen Rowland Vice President of Worldwide Sales |
2014 | 270,000 | — | 19,748 | 130,107 | 129,150 | 549,005 | |||||||||||||||||||||
| (1) | The amounts in this column represent the aggregate grant-date fair value of the award as computed in accordance with Financial Accounting Standard Board Accounting Standards Codification Topic 718. The assumptions used in calculating the grant-date fair value of the awards reported in this column are set forth in the notes to our audited consolidated financial statements included elsewhere in this prospectus. |
| (2) | The amounts included in this column represent incentives earned under our employee cash incentive plan described below. See “—2014 Non-equity Incentive Plan Compensation” for more details. |
| (3) | The amounts in this column represent the difference between the aggregate purchase price paid by Pine River Capital Management L.P. and the aggregate fair market value of such shares on the date of sale by the named executive officer. |
| (4) | This amount also includes $271 of disability insurance premium paid by us on behalf of Mr. Kapoor. |
| (5) | Mr. Valenzuela served as our chief financial officer from October 2013 to November 2014. |
| (6) | This amount consists of sign-on and retention bonuses paid to Mr. Valenzuela. |
2014 Non-equity Incentive Plan Compensation
Chet Kapoor and Steve Valenzuela
We approved a 2014 Executive Bonus Plan, or the 2014 Bonus Plan, which was amended effective November 1, 2013. The 2014 Bonus Plan provided cash incentives for certain executives, including Messrs. Kapoor and Valenzuela, for the period May 1, 2013 through April 30, 2014. The 2014 Bonus Plan was based on the attainment of company objectives and individual objectives that were established by our board of directors, weighted 90% and 10%, respectively. The company objectives consisted of revenue targets, bookings targets, and gross margins targets, weighted 40%, 30%, and 30%, respectively. The individual performance objectives were comprised of key metrics designed to measure each executive officer’s functional contributions to achieving our key strategic goals.
Based on our performance against the company objectives, the compensation committee determined to fund the 2014 Bonus Plan at 60% of the target level for the company objectives component. The compensation committee also determined that for the individual objectives component, Mr. Kapoor achieved 95% of his individual performance objectives and Mr. Valenzuela achieved 100% of his individual performance objectives.
-118-
Table of Contents
In addition, we approved an executive bonus plan for the period May 1, 2014 through July 31, 2014, or the 2014 Q4 Bonus Plan. The 2014 Q4 Bonus Plan provided cash incentive for certain executives, including Messrs. Kapoor and Valenzuela. The 2014 Q4 Bonus Plan was based on the attainment of company objectives that were established by our board of directors. The company objectives consisted of revenue targets and profitability targets, weighted equally.
Based on our performance against the company objectives, the compensation committee determined to fund the 2014 Q4 Bonus Plan at 100% of the target level.
The amounts in the Summary Compensation Table under the column “Non-equity Incentive Plan Compensation” for Messrs. Kapoor and Valenzuela are based on the achievements under the 2014 Bonus Plan (pro-rated for the portion of the bonus period that occurred during the 2014 fiscal year) and the Q4 Bonus Plan, and, in the case of Mr. Valenzuela, further pro-rated based on the period of time during the 2014 fiscal year in which he was employed with us.
Stephen Rowland
Stephen Rowland did not participate in the 2014 Q4 Bonus Plan. Instead, Mr. Rowland participated in a commissions plan under which he was eligible to earn quarterly commissions based on total booking attainment against quarterly goals. At the end of the first quarter of our 2014 fiscal year, Mr. Rowland achieved 52% of the bookings target, and received a payment equal to $20,820. At the end of the second quarter of our 2014 fiscal year, Mr. Rowland achieved 74% of the bookings target, and received a payment equal to $33,145. At the end of the third quarter of our 2014 fiscal year, Mr. Rowland achieved 81% of the bookings target, and received a payment equal to $39,036. At the end of the fourth quarter of our 2014 fiscal year, Mr. Rowland achieved 82% of the bookings target, and received a payment equal to $37,107.
The amount in the Summary Compensation Table under the column “Non-Equity Incentive Plan Compensation” for Mr. Rowland is based on achievements under his commission plan during the 2014 fiscal year.
2014 Outstanding Equity Awards at Year End
The following table presents information concerning all outstanding equity awards held by each of our named executive officers as of July 31, 2014.
| Named Executive Officer |
Grant Date | Option Awards – Number of Securities Underlying Unexercised Options(#) Exercisable |
Option Awards – Number of Securities Underlying Unexercised Options(#) Unexercisable |
Option Awards – Option Exercise Price($) |
Option Awards – Option Expiration Date |
Stock Awards – Number of Shares or Units of Stock That Have Not Vested (#) |
Stock Awards – Market Value of Shares or Units of Stock That Have Not Vested |
|||||||||||||||||||||
| Chet Kapoor |
1/10/2007 | 3,304,692 | — | $ | 0.14 | 1/9/2017 | — | — | ||||||||||||||||||||
| 12/21/2010 | 69,193 | 27,678 | (1) | $ | 0.06 | 12/20/2020 | — | — | ||||||||||||||||||||
| 8/16/2011 | 301,667 | — | $ | 0.06 | 8/15/2021 | — | — | |||||||||||||||||||||
| 4/24/2012 | 87,500 | 612,500 | (2) | $ | 0.09 | 4/23/2022 | — | — | ||||||||||||||||||||
| 10/14/2013 | 616,936 | 1,498,276 | (3) | $ | 0.54 | 10/13/2023 | — | — | ||||||||||||||||||||
| Steve Valenzuela(7) |
10/14/2013 | — | 1,785,000 | (4) | $ | 0.54 | 10/13/2023 | — | — | |||||||||||||||||||
| Stephen Rowland |
8/14/2012 | 21,663 | 519,900 | (5) | $ | 0.20 | 8/13/2022 | — | — | |||||||||||||||||||
| 9/3/2013 | 2,083 | 72,917 | (6) | $ | 0.54 | 9/2/2023 | — | — | ||||||||||||||||||||
| (1) | The option vests, subject to Mr. Kapoor’s continued role as a service provider to us, with respect to one-eighth of the total shares on the six-month anniversary of the vesting commencement date of November 1, 2010 and one forty-eighth of the total shares vesting monthly thereafter. |
-119-
Table of Contents
| (2) | The option vests, subject to Mr. Kapoor’s continued role as a service provider to us, with respect to one forty-eighth of the total shares every month, beginning on the one-month anniversary of the vesting commencement date of January 1, 2014. |
| (3) | The option vests, subject to Mr. Kapoor’s continued role as a service provider to us, with respect to one forty-eighth of the total shares every month, beginning on the one-month anniversary of the vesting commencement date of May 1, 2013. |
| (4) | The option vests, subject to Mr. Valenzuela’s continued role as a service provider to us, with respect to one-fourth of the total shares on the one-year anniversary of the vesting commencement date of October 10, 2013 and one forty-eighth of the total shares vesting monthly thereafter. |
| (5) | The option vests, subject to Mr. Rowland’s continued role as a service provider to us, with respect to one-fourth of the total shares on the one year anniversary of the vesting commencement date of July 9, 2012 and one forty-eighth of the total shares vesting monthly thereafter. |
| (6) | The option vests, subject to Mr. Rowland’s continued role as a service provider to us, with respect to one-fourth of the total shares on the one-year anniversary of the vesting commencement date of June 26, 2013 and one forty-eighth of the total shares vesting monthly thereafter. |
| (7) | Mr. Valenzuela served as our chief financial officer from October 2013 to November 2014. |
Executive Employment Arrangements
Chet Kapoor
Prior to the completion of this offering, we intend to enter into a confirmatory employment letter with Chet Kapoor, our Chief Executive Officer. The confirmatory employment letter will have no specific term and will provide that Mr. Kapoor is an at-will employee. The confirmatory employment letter also is expected to provide Mr. Kapoor with severance and change in control benefits. Mr. Kapoor’s current annual base salary is $335,000 and he is eligible for an annual target cash incentive payment equal to 50% of his annual base salary.
Stephen Rowland
Prior to the completion of this offering, we intend to enter into a confirmatory employment letter with Stephen Rowland, our Vice President of Worldwide Sales. The confirmatory employment letter will have no specific term and will provide that Mr. Rowland is an at-will employee. The confirmatory employment letter also is expected to provide Mr. Rowland with severance and change in control benefits. Mr. Rowland’s current annual base salary is $270,000 and he is eligible for an annual cash target incentive payment equal to $180,000.
Separation Agreement with Steve Valenzuela
On November 22, 2014, we entered into a separation agreement and general release with Steve Valenzuela, our former chief financial officer (the “Valenzuela Agreement”). Under the Valenzuela Agreement, Mr. Valenzuela’s employment with us will terminate on December 19, 2014. Mr. Valenzuela will be available for transition consulting services from December 24, 2014 through June 23, 2015 pursuant to an independent contractor agreement between us and Mr. Valenzuela, under which Mr. Valenzuela will make himself available to collaborate with us on financial and investor relations matters at a rate of $250 per hour.
In consideration for Mr. Valenzuela executing and not revoking the Valenzuela Agreement, Mr. Valenzuela is entitled to receive:
| • | A lump sum payment equal to $125,000 paid within 10 days of Mr. Valenzuela’s employment termination date; |
| • | Reimbursement of COBRA continuation premiums for up to seven months, beginning on January 1, 2015; |
-120-
Table of Contents
| • | If we pay a bonus covering the bonus period beginning on August 1, 2014 and ending October 31, 2014, Mr. Valenzuela will be eligible to receive a bonus for this period; and |
| • | 223,125 of the shares subject to Mr. Valenzuela’s options to purchase shares of our common stock will accelerate and fully vest as of his employment termination date. |
In exchange for the separation benefits described above, Mr. Valenzuela (1) released the company from all past, present, and future claims, (2) agreed to not engage with any unfair competition with the company, and (3) agreed to adhere to our standard proprietary information and invention agreement, including provisions relating to non-solicitation.
Tim Wan
On February 27, 2015, we entered into an offer letter agreement with Tim Wan, our chief financial officer. The offer letter agreement has no specific term and constitutes at-will employment. Mr. Wan’s current annual base salary is $300,000 and he is eligible for an annual target cash incentive payment equal to 30% of his annual base salary. Mr. Wan’s base salary is subject to review annually. Additionally, Mr. Wan’s offer letter provides for cash severance of nine months base salary and reimbursement of COBRA continuation premiums for up to six months upon a termination of employment without cause or resignation for good reason. If a qualifying termination occurs within the period beginning one month preceding and 12 months following a change of control of our company, then Mr. Wan is entitled to full accelerated vesting of his then outstanding equity awards in addition to the cash severance payment described above.
Employee Benefit and Stock Plans
2015 Equity Incentive Plan
Our board of directors is expected to adopt, and we expect our stockholders will approve our 2015 Equity Incentive Plan, or the 2015 Plan, prior to the completion of this offering. Subject to the board of directors and stockholder approval, the 2015 Plan will be effective one business day prior to the effectiveness of this Registration Statement and is not expected to be utilized until after the completion of this offering. Our 2015 Plan will provide for the grant of incentive stock options, within the meaning of Section 422 of the Internal Revenue Code, to our employees and any of our parent and subsidiary corporations’ employees, and for the grant of nonstatutory stock options, restricted stock, restricted stock units, stock appreciation rights, performance units and performance shares to our employees, directors and consultants, and our parent and subsidiary corporations’ employees and consultants.
Authorized Shares. A total of shares of our common stock will be reserved for issuance pursuant to the 2015 Plan. In addition, the shares reserved for issuance under our 2015 Plan will also include (a) those shares reserved but unissued under our 2005 Plan (as defined below) as of the effective date described above and (b) shares returned to our 2005 Plan as the result of expiration or termination of options (provided that the maximum number of shares that may be added to the 2015 Plan pursuant to (a) and (b) is shares). The number of shares available for issuance under the 2015 Plan will also include an annual increase on the first day of each fiscal year beginning in 2016, equal to the least of:
| • | shares; |
| • | % of the outstanding shares of common stock as of the last day of our immediately preceding year; or |
| • | such other amount as our board of directors may determine. |
Plan Administration. Our compensation committee will administer our 2015 Plan. Subject to the provisions of our 2015 Plan, the administrator will have the power to determine the terms of the awards, including the exercise price, the number of shares subject to each such award, the exercisability of the awards, and the form of
-121-
Table of Contents
consideration, if any, payable upon exercise. The administrator also has the authority to amend existing awards to reduce their exercise price, to allow participants the opportunity to transfer outstanding awards to a financial institution or other person or entity selected by the administrator and to institute an exchange program by which outstanding awards may be surrendered in exchange for awards with a higher or lower exercise price.
Stock Options. The exercise price of options granted under our 2015 Plan must at least be equal to the fair market value of our common stock on the date of grant. The term of an incentive stock option may not exceed 10 years, except that with respect to any participant who owns more than 10% of the voting power of all classes of our outstanding stock, the term must not exceed five years and the exercise price must equal at least 110% of the fair market value on the grant date. Subject to the provisions of our 2015 Plan, the administrator will determine the term of all other options.
After the termination of service of an employee, director or consultant, he or she may exercise his or her option for the period of time stated in his or her award agreement. Generally, if termination is due to death or disability, the option will remain exercisable for 12 months. In all other cases, the option will generally remain exercisable for three months following the termination of service. However, in no event may an option be exercised later than the expiration of its term.
Stock Appreciation Rights. Stock appreciation rights may be granted under our 2015 Plan. Stock appreciation rights allow the recipient to receive the appreciation in the fair market value of our common stock between the exercise date and the date of grant. Subject to the provisions of our 2015 Plan, the administrator will determine the terms of stock appreciation rights, including when such rights become exercisable and whether to pay any increased appreciation in cash or with shares of our common stock, or a combination thereof, except that the per share exercise price for the shares to be issued pursuant to the exercise of a stock appreciation right will be no less than 100% of the fair market value per share on the date of grant. After the termination of service of an employee, director or consultant, he or she may exercise his or her stock appreciation right for the period of time stated in his or her award agreement. Generally, stock appreciation rights will be subject to the same post-termination exercise restrictions as options as described above.
Restricted Stock. Restricted stock may be granted under our 2015 Plan. Restricted stock awards are grants of shares of our common stock that vest in accordance with terms and conditions established by the administrator. The administrator will determine the number of shares of restricted stock granted and may impose whatever conditions to vesting it determines to be appropriate (for example, the administrator may set restrictions based on the achievement of specific performance goals or continued service to us). The administrator, in its sole discretion, may accelerate the time at which any restrictions will lapse or be removed. Shares of restricted stock that do not vest are subject to our right of repurchase or forfeiture.
Restricted Stock Units. Restricted stock units may be granted under our 2015 Plan. Restricted stock units are bookkeeping entries representing an amount equal to the fair market value of one share of our common stock. The administrator will determine the terms and conditions of restricted stock units, including the number of units granted, the vesting criteria (which may include accomplishing specified performance criteria or continued service to us), and the form and timing of payment. The administrator, in its sole discretion, may accelerate the time at which any restrictions will lapse or be removed.
Performance Units and Performance Shares. Performance units and performance shares may be granted under our 2015 Plan. Performance units and performance shares are awards that will result in a payment to a participant only if performance goals established by the administrator are achieved or the awards otherwise vest. The administrator will establish organizational or individual performance goals in its discretion, which, depending on the extent to which they are met, will determine the number and/or the value of performance units and performance shares to be paid out to participants. After the grant of a performance unit or performance share, the administrator, in its sole discretion, may reduce or waive any performance objectives or other vesting provisions for such performance units or performance shares. The administrator, in its sole discretion, may pay earned performance units or performance shares in the form of cash, in shares, or in some combination thereof.
-122-
Table of Contents
Non-employee Directors. Our 2015 Plan will provide that all non-employee directors will be eligible to receive all types of awards (except for incentive stock options) under the 2015 Plan. In order to provide an annual maximum limit on the awards that can be made to our non-employee directors, our 2015 Plan will provide that in any given year a non-employee director will not receive (1) cash-settled awards having a grant-date fair value greater than $ , increased to $ in connection with his or her initial service; and (2) stock-settled awards having a grant-date fair value greater than $ , increased to $ in connection with his or her initial service, in each case, as determined under GAAP. The maximum limits do not reflect the intended size of any potential grants or a commitment to make grants to our non-employee directors under our 2015 Plan in the future. Please see the description of our non-employee director compensation above under “Management—Non-employee Director Compensation.”
Non-transferability of Awards. Unless the administrator provides otherwise, our 2015 Plan generally will not allow for the transfer of awards, and only the recipient of an award may exercise an award during his or her lifetime.
Merger or Change in Control. Our 2015 Plan will provide that in the event of a merger or change in control, as defined in the 2015 Plan, each outstanding award will be treated as the administrator determines, including that the successor corporation or its parent or subsidiary will assume or substitute an equivalent award for each outstanding award. The administrator will not be required to treat all awards similarly. If there is no assumption or substitution of outstanding awards, the awards will fully vest, all restrictions will lapse, all performance goals or other vesting criteria will be deemed achieved at 100% of target levels and the awards will become fully exercisable. If the service of an outside director is terminated on or following a change of control, other than pursuant to a voluntary resignation, his or her options, stock appreciation rights and restricted stock units, if any, will vest and become immediately exercisable, all restrictions on his or her restricted stock will lapse, all performance goals or other vesting requirements for his or her performance shares and units will be deemed achieved at 100% of target levels and all other terms and conditions will be deemed met.
Plan Amendment and Termination. Our 2015 Plan will automatically terminate in 2025, unless we terminate it sooner. The administrator has the authority to amend, suspend, or terminate our 2015 Plan provided such action does not impair the existing rights of any participant.
2015 Employee Stock Purchase Plan
Our board of directors is expected to adopt, and we expect our stockholders will approve, our 2015 Employee Stock Purchase Plan, or ESPP, prior to the completion of this offering. Subject to board of directors and stockholder approval, the ESPP will become effective one business day prior to the effectiveness of this Registration Statement. We believe that allowing our employees to participate in the ESPP provides them with a further incentive towards ensuring our success and accomplishing our corporate goals.
Authorized Shares. A total of shares of our common stock will be made available for sale under the ESPP. In addition, our ESPP provides for annual increases in the number of shares available for issuance under the plan on the first day of each fiscal year beginning in 2016, equal to the least of:
| • | % of the outstanding shares of our common stock on the first day of such fiscal year; |
| • | shares; or |
| • | such amount as determined by our board of directors. |
Plan Administration. Our compensation committee will administer the ESPP, and will have full and exclusive authority to interpret the terms of the plan and determine eligibility to participate, subject to the conditions of the plan as described below.
-123-
Table of Contents
Eligibility. Generally, all of our employees will be eligible to participate if they are employed by us, or any designated subsidiary, for at least 20 hours per week and more than five months in any calendar year. However, an employee may not be granted rights to purchase stock under the ESPP if such employee:
| • | immediately after the grant would own stock possessing 5% or more of the total combined voting power or value of all classes of our capital stock; or |
| • | hold rights to purchase stock under all of our employee stock purchase plans that accrue at a rate that exceeds $25,000 worth of stock for each calendar year. |
Offering Periods. Our ESPP will be intended to qualify under Section 423 of the Code. Each offering period will include purchase periods, which will be the approximately months commencing with one exercise date and ending with the next exercise date. The offering periods will be scheduled to start on the first trading day on or after and of each year, except for the first offering period, which will commence on the first trading day on or after completion of this offering and will end on the first trading day on or after .
Our ESPP will permit participants to purchase shares of common stock through payroll deductions of up to % of their eligible compensation. A participant may purchase a maximum of shares during a six month period.
Exercise of Purchase Right. Amounts deducted and accumulated by the participant will be used to purchase shares of our common stock at the end of each month purchase period. The purchase price of the shares will be % of the lower of the fair market value of our common stock on the first trading day of each offering period or on the exercise date. Participants may end their participation at any time during an offering period and will be paid their accrued contributions that have not yet been used to purchase shares of common stock. Participation will end automatically upon termination of employment with us.
Non-transferability. A participant may not transfer rights granted under the ESPP. If the compensation committee permits the transfer of rights, it may only be done by will, the laws of descent and distribution, or as otherwise provided under the ESPP.
Merger or Change in Control. In the event of our merger or change in control, as defined under the ESPP, a successor corporation may assume or substitute each outstanding purchase right. If the successor corporation refuses to assume or substitute for the outstanding purchase right, the offering period then in progress will be shortened, and a new exercise date will be set. The administrator will notify each participant that the exercise date has been changed and that the participant’s option will be exercised automatically on the new exercise date unless prior to such date the participant has withdrawn from the offering period.
Amendment; Termination. Our ESPP will automatically terminate in 2035, unless we terminate it sooner. Our board of directors will have the authority to amend, suspend, or terminate our ESPP, except that, subject to certain exceptions described in the ESPP, no such action may adversely affect any outstanding rights to purchase stock under our ESPP.
2005 Stock Incentive Plan
Our board of directors adopted and our stockholders approved our 2005 Stock Incentive Plan, or the 2005 Plan, on March 29, 2005, as most recently amended in October 2014. Our 2005 Plan permits the grant of incentive stock options, within the meaning of Code Section 422, to our employees and any of our parent and subsidiary corporations’ employees, and for the grant of nonstatutory stock options, stock appreciation rights, restricted stock, restricted stock units, and other stock awards to our employees, directors, and consultants and our parent and subsidiary corporations’ employees, directors, and consultants. It is expected that as of one business day prior to the effectiveness of this Registration Statement, the 2005 Plan will be terminated and we will not grant any additional awards under the 2005 Plan. However, the 2005 Plan will continue to govern the terms and conditions of the outstanding awards previously granted thereunder.
-124-
Table of Contents
Authorized Shares. The maximum aggregate number of shares issuable under the 2005 Plan was 54,191,310 shares of our common stock as of January 31, 2015. As of January 31, 2015, options to purchase 32,442,089 shares of our common stock were outstanding under our 2005 Plan, 103,933 restricted stock units were outstanding under our 2005 Plan, and 3,151,004 shares of our common stock remained available for future grant under the 2005 Plan.
Plan Administration. The 2005 Plan is administered by our board of directors or a committee appointed by our board of directors (referred to as the “administrator”). Subject to the provisions of our 2005 Plan, the administrator has the full authority and discretion to take any actions it deems necessary or advisable for the administration of the 2005 Plan. The administrator’s decisions, interpretations, and any other actions of our board with respect to the 2005 Plan will be final and binding on all participants.
Stock Options. Incentive stock options within the meaning of Section 422 of the Internal Revenue Code and nonstatutory stock options are permitted to be granted under our 2005 Plan; provided that incentive stock options can only be granted to employees. The exercise price of such options has to equal at least the fair market value of our common stock on the grant date and the term of an option may not exceed ten years; provided, however, that an incentive stock option held by a participant who owns more than 10% of the total combined voting power of all classes of our stock, or of certain of our parent or subsidiary corporations, may not have a term in excess of five years and must have an exercise price of at least 110% of the fair market value of our common stock on the grant date.
The administrator will determine the methods of payment of the exercise price of an option, which may include cash, shares or other form of consideration determined by the administrator. After the termination of service of an employee, director or consultant, the participant may exercise his or her option, to the extent vested as of such date of termination, for the period of time stated in his or her award agreement. If termination is due to any reason other than cause (as defined in the 2005 Plan), death, or disability (as defined in the 2005 Plan), the option will remain exercisable for at least 30 days. If termination is due to death or disability, the option will remain exercisable for at least 6 months. If termination is due to cause, the award agreement may provide that the right to exercise the option terminates immediately on the effective date of termination. However, in no event may an option be exercised later than the expiration of its term. The specific terms of options are set forth in award agreements.
Restricted Stock. Restricted stock are permitted to be granted under our 2005 Plan. Restricted stock awards are grants of shares of our common stock that are subject to various restrictions, including restrictions on transferability and forfeiture provisions. Shares of restricted stock vest, and the restrictions on such shares lapse, in accordance with terms and conditions established by the administrator and, unless determined otherwise in the award agreement, such vesting restrictions apply to any dividends paid with respect to such shares. Shares of restricted stock that do not vest for any reason may be repurchased by us. Unless otherwise determined by the administrator, any right to acquire shares pursuant to a restricted stock award automatically expires if not exercised within 30 days after we communicate the grant of the award to the participant. The specific terms of restricted stock grants are set forth in the award agreements.
Stock Appreciation Rights. Stock appreciation rights are permitted to be granted under the 2005 Plan. Stock appreciation rights allow the recipient to receive the appreciation the fair market value of our common stock between the exercise date and the date of grant. Subject to the provisions of the 2005 Plan, the administrator determine the terms of stock appreciation rights, except that the per share exercise price of a stock appreciation right may not be less than 100% of the fair market value of a share of our common stock on the date of grant. After the termination of service of an employee, director, or consultant, the participant may exercise his or her stock appreciation right to the extent vested as of such date of termination, for the period of time stated in his or her award agreement. Generally, stock appreciation rights will be subject to the same post-termination exercise restrictions as described above for options.
-125-
Table of Contents
Restricted Stock Units. Restricted stock units are permitted to be granted under the 2005 Plan. Restricted stock units are bookkeeping entries representing an amount equal to the fair market value of one share of our common stock. The administrator determines the terms and conditions of restricted stock units.
Transferability of Awards. Unless the administrator provides otherwise, our 2005 Plan generally does not allow for the transfer of awards other than by beneficiary designation, will, and the laws of descent and distribution, and only the recipient of an award, or the recipient’s guardian or legal representative, may exercise such an award during his or her lifetime.
Mergers and Consolidations. Our 2005 Plan provides that in the event of a merger or other consolidation, or in the event of a transaction providing for the sale of all or substantially all of the Company’s stock or assets, each outstanding award will be treated as indicated by the agreement of merger, consolidation, or sale, in each case without the participants’ consent. On a change of control, awards held by outside directors will fully vest and, with respect to options and stock appreciation rights, become fully exercisable.
Plan Amendment and Termination. Our board of directors has the authority to amend, suspend or terminate the 2005 Plan for any reason, provided that such action does not have a material adverse effect on any award previously granted.
Executive Incentive Compensation Plan
Our board of directors has adopted an Executive Incentive Compensation Plan, which we refer to as our Bonus Plan. Our Bonus Plan allows our compensation committee to provide cash incentive awards to selected employees, including our named executive officers, based upon performance goals established by our compensation committee. Pursuant to the Bonus Plan, our compensation committee, in its sole discretion, will establish a target award for each participant and a bonus pool, with actual awards payable from such bonus pool, with respect to the applicable performance period.
Under the Bonus Plan, our compensation committee, in its sole discretion, will determine the performance goals applicable to awards, which goals may include, without limitation: attainment of research and development milestones, bookings, business divestitures and acquisitions, cash flow, cash position, contract awards or backlog, customer renewals, customer retention rates from an acquired company, subsidiary, business unit or division, earnings (which may include earnings before interest and taxes, earnings before taxes, and net taxes), earnings per share, expenses, gross margin, growth in stockholder value relative to the moving average of the S&P 500 Index or another index, installs, internal rate of return, inventory turns, inventory levels, market share, net income, net profit, net sales, new product development, new product invention or innovation, number of customers, operating cash flow, operating expenses, operating income, operating margin, overhead or other expense reduction, product defect measures, product release timelines, productivity, profit, retained earnings, return on assets, return on capital, return on equity, return on investment, return on sales, revenue, revenue growth, sales results, sales growth, stock price, time to market, total stockholder return, working capital, and individual objectives such as peer reviews or other subjective or objective criteria. As determined by our compensation committee, performance goals that include our financial results may be determined in accordance with GAAP, or such financial results may consist of non-GAAP financial measures and any actual results may be adjusted by our compensation committee for one-time items or unbudgeted or unexpected items and/or payments when determining whether the performance goals have been met. The goals may be on the basis of any factors our compensation committee determines relevant, and may be on an individual, divisional, business unit or company-wide basis. The performance goals may differ from participant to participant and from award to award.
Our compensation committee may, in its sole discretion and at any time, increase, reduce or eliminate a participant’s actual award, or increase, reduce or eliminate the amount allocated to the bonus pool for a particular performance period. The actual award may be below, at or above a participant’s target award, in our compensation committee’s discretion. Our compensation committee may determine the amount of any reduction
-126-
Table of Contents
on the basis of such factors as it deems relevant, and it is not be required to establish any allocation or weighting with respect to the factors it considers.
Actual awards are paid in cash (or its equivalent) in a single lump sum as soon as practicable after the end of the performance period during which they are earned and after they are approved by our compensation committee, but in no event later than the 15th day of the third month of the fiscal year following the date the award has been earned. Unless otherwise determined by our compensation committee, to earn an actual award, a participant must be employed by us (or an affiliate of ours) through the date the bonus is paid. Accordingly, an award is not considered earned until paid.
Our board of directors, in its sole discretion, may alter, suspend or terminate the Bonus Plan provided such action does not, without the consent of the participant, alter or impair the rights or obligations under any award theretofore earned by such participant.
2015 Executive Bonus Plan
We approved a 2015 Executive Bonus Plan, or the 2015 Bonus Plan, to provide cash incentives for certain executives, including Mr. Kapoor, for our 2015 fiscal year. The 2015 Bonus Plan will be funded and paid to participants based on achievements against financial and other company goals and individual goals established by our board of directors, weighted 90% and 10%, respectively. The financial and other company goals under the 2015 Bonus Plan are revenue, non-GAAP operating gain/loss, and key strategic initiatives that our board of directors determined were important to drive performance in 2015 fiscal year, weighted 60%, 30%, and 10%, respectively. The individual performance metrics are based on measurable objectives.
The 2015 Bonus Plan may fund and pay bonuses according to the following schedule: 18% of each participant’s total annual target bonus may be paid following the end of each fiscal quarter based on quarterly performance against the financial and other company goals for that quarter. The remaining 28% of each participant’s annual target bonus may be paid following the end of 2015 based on performance against our financial and other company goals and individual goals for our 2015 fiscal year.
A minimum of 80% of the target performance goals must be met for a fiscal quarter for bonuses to be paid with respect to that quarter. Upon achievement of 80% of the target performance goals, 50% of each participant’s target bonus for that quarter will be paid. If performance exceeds 80% of the target performance goals for a specific quarter, the percentage of each participant’s target bonus that may be paid for that quarter will increase linearly up to 125% if performance for a quarter equals or exceeds 115% of target levels. In order for the annual bonus to be paid, 80% of the fourth quarter target performance goals must be achieved.
401(k) plan
We maintain a tax-qualified 401(k) retirement plan for all employees who satisfy certain eligibility requirements, including requirements relating to age and length of service. Under our 401(k) plan, employees may elect to defer up to all eligible compensation, subject to applicable annual Internal Revenue Code limits. We do not match any contributions made by our employees, including executives, but have the discretion to do so. We intend for our 401(k) plan to qualify under Section 401(a) and 501(a) of the Internal Revenue Code so that contributions by employees to our 401(k) plan, and income earned on those contributions, are not taxable to employees until withdrawn from our 401(k) plan.
Limitation on Liability and Indemnification Matters
Our amended and restated certificate of incorporation and amended and restated bylaws, each to be effective upon the completion of this offering, will provide that we will indemnify our directors and officers and may indemnify our employees and other agents, to the fullest extent permitted by the Delaware General Corporation
-127-
Table of Contents
Law, which prohibits our amended and restated certificate of incorporation from limiting the liability of our directors for the following:
| • | any breach of the director’s duty of loyalty to us or to our stockholders; |
| • | acts or omissions not in good faith or that involve intentional misconduct or a knowing violation of law; |
| • | unlawful payment of dividends or unlawful stock repurchases or redemptions; and |
| • | any transaction from which the director derived an improper personal benefit. |
If Delaware law is amended to authorize corporate action further eliminating or limiting the personal liability of a director, then the liability of our directors will be eliminated or limited to the fullest extent permitted by Delaware law, as so amended. Our amended and restated certificate of incorporation does not eliminate a director’s duty of care and in appropriate circumstances, equitable remedies, such as injunctive or other forms of non-monetary relief, remain available under Delaware law. This provision also does not affect a director’s responsibilities under any other laws, such as the federal securities laws or other state or federal laws. Under our amended and restated bylaws, we will also be empowered to purchase insurance on behalf of any person whom we are required or permitted to indemnify.
In addition to the indemnification required in our amended and restated certificate of incorporation and amended and restated bylaws, we plan to enter into indemnification agreements with each of our current directors, officers and some employees before the completion of this offering. These agreements will provide indemnification for certain expenses and liabilities incurred in connection with any action, suit, proceeding or alternative dispute resolution mechanism, or hearing, inquiry or investigation that may lead to the foregoing, to which they are a party, or are threatened to be made a party, by reason of the fact that they are or were a director, officer, employee, agent or fiduciary of our company, or any of our subsidiaries, by reason of any action or inaction by them while serving as an officer, director, agent, or fiduciary, or by reason of the fact that they were serving at our request as a director, officer, employee, agent or fiduciary of another entity. In the case of an action or proceeding by, or in the right of, our company or any of our subsidiaries, no indemnification will be provided for any claim where a court determines that the indemnified party is prohibited from receiving indemnification. We believe that these bylaw provisions and indemnification agreements are necessary to attract and retain qualified persons as directors and officers. We also maintain directors’ and officers’ liability insurance.
The limitation of liability and indemnification provisions in our amended and restated certificate of incorporation and amended and restated bylaws may discourage stockholders from bringing a lawsuit against directors for breach of their fiduciary duties. They may also reduce the likelihood of derivative litigation against directors and officers, even though an action, if successful, might benefit us and our stockholders. A stockholder’s investment may be harmed to the extent we pay the costs of settlement and damage awards against directors and officers pursuant to these indemnification provisions. Insofar as we may provide indemnification for liabilities arising under the Securities Act to our directors, officers and controlling persons pursuant to the foregoing provisions, or otherwise, we have been advised that, in the opinion of the SEC, such indemnification is against public policy as expressed in the Securities Act and is, therefore, unenforceable. There is no pending litigation or proceeding naming any of our directors or officers as to which indemnification is being sought, nor are we aware of any pending or threatened litigation that may result in claims for indemnification by any director or officer.
-128-
Table of Contents
CERTAIN RELATIONSHIPS AND RELATED PARTY TRANSACTIONS
We describe below transactions and series of similar transactions, during our last three fiscal years, to which we were a party or will be a party, in which:
| • | the amounts involved exceeded or will exceed $120,000; and |
| • | any of our directors, executive officers or beneficial holders of more than 5% of any class of our capital stock had or will have a direct or indirect material interest. |
Equity Financings
Series E Preferred Stock Financing
In November 2011, we sold and issued an aggregate of 12,104,444 shares of our Series E convertible preferred stock at a purchase price of $0.5783 per share, for an aggregate purchase price of approximately $7.0 million. Each share of our Series E convertible preferred stock will convert automatically into one share of our common stock upon the completion of this offering. Purchasers of our Series E convertible preferred stock include venture capital funds that hold 5% or more of our capital stock or were represented on our board of directors. The following table presents the number of shares and the total purchase price paid by these entities:
| Investor |
Shares of Convertible Preferred Stock |
Total Purchase Price |
||||||
| Entities Affiliated with Norwest Venture Partners(1) |
5,193,510 | $ | 3,003,406.84 | |||||
| Entities Affiliated with Bay Partners(2) |
3,389,242 | $ | 1,959,998.66 | |||||
| Entities Affiliated with Third Point Partners(3) |
2,221,306 | $ | 1,284,581.28 | |||||
| (1) | Entities affiliated with Norwest Venture Partners holding our securities whose shares are aggregated for purposes of reporting share ownership information include Norwest Venture Partners IX, LP and Norwest Venture Partners VIII, LP. Promod Haque, a member of our board of directors, is affiliated with Norwest Venture Partners. |
| (2) | Entities affiliated with Bay Partners holding our securities whose shares are aggregated for purposes of reporting share ownership information include Bay Partners X, LP and Bay Partners X Entrepreneurs Fund, LP. Neal Dempsey, a member of our board of directors, is affiliated with Bay Partners. |
| (3) | Entities affiliated with Third Point holding our securities whose shares are aggregated for purposes of reporting share ownership information include Third Point Offshore Master Fund L.P., Third Point Partners Qualified, L.P., Third Point Ultra Master Fund L.P. and Third Point Partners, L.P. Robert Schwartz, a member of our board of directors, is affiliated with Third Point. |
Series F Preferred Stock Financing
In July 2012 and February 2013, we sold and issued an aggregate of 13,114,861 shares of our Series F convertible preferred stock at a purchase price of $1.5288 per share, for an aggregate purchase price of approximately $20.0 million. Each share of our Series F convertible preferred stock will convert automatically into one share of our common stock immediately prior to the completion of this offering. Purchasers of our Series F convertible preferred stock include venture capital funds that hold 5% or more of our capital stock or were represented on our board of directors. The following table presents the number of shares and the total purchase price paid by these entities:
| Investor |
Shares of Convertible Preferred Stock |
Total Purchase Price |
||||||
| Entities Affiliated with Norwest Venture Partners(1) |
4,181,165 | $ | 6,392,165.06 | |||||
| Entities Affiliated with Bay Partners(2) |
3,439,674 | $ | 5,258,573.62 | |||||
| Entities Affiliated with Third Point Partners(3) |
2,028,403 | $ | 3,101,022.53 | |||||
-129-
Table of Contents
| (1) | Entities affiliated with Norwest Venture Partners holding our securities whose shares are aggregated for purposes of reporting share ownership information include Norwest Venture Partners IX, LP and Norwest Venture Partners VIII, LP. Promod Haque, a member of our board of directors, is affiliated with Norwest Venture Partners. |
| (2) | Entities affiliated with Bay Partners holding our securities whose shares are aggregated for purposes of reporting share ownership information include Bay Partners X, LP and Bay Partners X Entrepreneurs Fund, LP. Neal Dempsey, a member of our board of directors, is affiliated with Bay Partners. |
| (3) | Entities affiliated with Third Point holding our securities whose shares are aggregated for purposes of reporting share ownership information include Third Point Offshore Master Fund L.P., Third Point Partners Qualified, L.P., Third Point Ultra Master Fund L.P. and Third Point Partners, L.P. Robert Schwartz, a member of our board of directors, is affiliated with Third Point. |
Series G Preferred Stock Financing
In July 2013, we sold and issued an aggregate of 15,730,725 shares of our Series G convertible preferred stock at a purchase price of $2.224945 per share, for an aggregate purchase price of approximately $35.0 million. Each share of our Series G convertible preferred stock will convert automatically into one share of our common stock immediately prior to the completion of this offering. Purchasers of our Series G convertible preferred stock include venture capital funds that hold 5% or more of our capital stock or were represented on our board of directors. The following table presents the number of shares and the total purchase price paid by these entities:
| Investor |
Shares of Convertible Preferred Stock |
Total Purchase Price |
||||||
| Entities Affiliated with Norwest Venture Partners(1) |
4,494,492 | $ | 9,999,997.52 | |||||
| Entities Affiliated with Third Point Partners(2) |
2,010,685 | $ | 4,473,663.56 | |||||
| Entities Affiliated with Bay Partners(3) |
1,517,958 | $ | 3,377,373.08 | |||||
| (1) | Entities affiliated with Norwest Venture Partners holding our securities whose shares are aggregated for purposes of reporting share ownership information include Norwest Venture Partners XI, LP, Norwest Venture Partners IX, LP and Norwest Venture Partners VIII, LP. Promod Haque, a member of our board of directors, is affiliated with Norwest Venture Partners. |
| (2) | Entities affiliated with Third Point Partners holding our securities whose shares are aggregated for purposes of reporting share ownership information include Third Point Offshore Master Fund L.P., Third Point Partners Qualified, L.P., Third Point Ultra Master Fund L.P. and Third Point Partners, L.P. Robert Schwartz, a member of our board of directors, is affiliated with Third Point Partners. |
| (3) | Entities affiliated with Bay Partners holding our securities whose shares are aggregated for purposes of reporting share ownership information include Bay Partners X, LP and Bay Partners X Entrepreneurs Fund, LP. Neal Dempsey, a member of our board of directors, is affiliated with Bay Partners. |
Series H Preferred Stock Financing
In April and May 2014, we sold and issued an aggregate of 20,637,076 shares of our Series H convertible preferred stock at a purchase price of $2.91 per share, for an aggregate purchase price of approximately $60.1 million. Each share of our Series H convertible preferred stock will convert automatically into one share of our common stock immediately prior to the completion of this offering. Purchasers of our Series H convertible preferred stock include venture capital funds that hold 5% or more of our capital stock or were represented on our board of directors. The following table presents the number of shares and the total purchase price paid by these entities:
| Investor |
Shares of Convertible Preferred Stock |
Total Purchase Price |
||||||
| Entities Affiliated with Norwest Venture Partners(1) |
2,943,198 | $ | 8,564,706.18 | |||||
| Entities Affiliated with Third Point Partners(2) |
929,430 | $ | 2,704,641.30 | |||||
| Entities Affiliated with Bay Partners(3) |
362,682 | $ | 1,055,404.62 | |||||
-130-
Table of Contents
| (1) | Entities affiliated with Norwest Venture Partners holding our securities whose shares are aggregated for purposes of reporting share ownership information include Norwest Venture Partners XI, LP, Norwest Venture Partners IX, LP and Norwest Venture Partners VIII, LP. Promod Haque, a member of our board of directors, is affiliated with Norwest Venture Partners. |
| (2) | Entities affiliated with Third Point Partners holding our securities whose shares are aggregated for purposes of reporting share ownership information include Third Point Offshore Master Fund L.P., Third Point Partners Qualified, L.P., Third Point Ultra Master Fund L.P. and Third Point Partners, L.P. Robert Schwartz, a member of our board of directors, is affiliated with Third Point Partners. |
| (3) | Entities affiliated with Bay Partners holding our securities whose shares are aggregated for purposes of reporting share ownership information include Bay Partners X, LP and Bay Partners X Entrepreneurs Fund, LP. Neal Dempsey, a member of our board of directors, is affiliated with Bay Partners. |
Acquisition of InsightsOne Systems
In December 2013, we acquired InsightsOne. The acquisition of InsightsOne was effected through the merger of our wholly-owned merger subsidiary with and into InsightsOne, with InsightsOne continuing as the surviving corporation and a wholly-owned subsidiary of us. In connection with this acquisition, holders of outstanding capital stock of InsightsOne received an aggregate of 5,181,757 shares and 3,887,736 shares of our Series G-1 and Series G convertible preferred stock, respectively, as consideration for their shares of capital stock of InsightsOne, of which 777,255 shares and 583,160 shares of our Series G-1 and Series G convertible preferred stock, respectively, are being held in escrow pursuant to the terms of the merger agreement. Recipients of our Series G convertible preferred stock pursuant to this acquisition include a venture capital fund that holds 5% or more of our capital stock and was represented on our board of directors. The following table summarizes the issuance of our Series G convertible preferred stock to such recipient:
| Investor |
Shares of Preferred Stock |
Total Purchase Price |
||||||
| Norwest Venture Partners XI, L.P.(1) |
3,591,445 | $ | 7,990,605.98 | |||||
| (1) | Promod Haque, a member of our board of directors, is affiliated with Norwest Venture Partners XI, L.P. |
Stock Option Grants to Executive Officers
We have granted stock options to our executive officers and non-employee directors. For a description of options granted to our named executive officers and non-employee directors, see the section titled “Executive Compensation—2014 Outstanding Equity Awards at Year-End Table” and “Management—Non-Employee Director Compensation” above.
Offer Letters
We have entered into offer letters and other arrangements containing compensation, termination and change of control provisions, among others, with certain of our executive officers as described under the caption “Executive Compensation—Executive Employment Arrangements” above.
Additionally, we have entered into offer letters with board members Bob L. Corey, William “BJ” Jenkins, Jr. and Edmond Mesrobian, which provide that each of Messrs. Corey, Jenkins and Mesrobian will be granted common stock under our 2005 Stock Incentive Plan. In accordance with such agreements 236,000, 460,685 and 288,041 shares of common stock were granted in 2012, 2013 and 2014, respectively. Mr. Corey’s offer letter further provides him health coverage under our health insurance plan.
Investors’ Rights Agreements
We entered into an amended and restated investors’ rights agreement with the holders of our convertible preferred stock, including entities affiliated with each of Norwest Venture Partners, Third Point Ventures and
-131-
Table of Contents
Bay Partners which each hold 5% or more of our capital stock or of which certain of our directors are affiliated. This agreement provides, among other things, that the holders of our preferred stock have the right to request that we file a registration statement or request that their shares be covered by a registration statement that we are otherwise filing, subject to certain exceptions. For a description of these registration rights, see the section titled “Description of Capital Stock—Registration Rights.”
Indemnification Agreements
We have entered into indemnification agreements with each of our directors and officers. The indemnification agreements and our certificate of incorporation and bylaws require us to indemnify our directors and officers to the fullest extent permitted by Delaware law. See the section titled “Executive Compensation—Limitation on Liability and Indemnification Matters.”
Policies and Procedures for Related Party Transactions
We have a formal written policy providing that our executive officers, directors, nominees for election as directors, beneficial owners of more than 5% of any class of our common stock and any member of the immediate family of any of the foregoing persons, is not permitted to enter into a related party transaction with us without the consent of our audit committee, subject to the exceptions described below.
In approving or rejecting any such proposal, our audit committee is to consider the relevant facts and circumstances available and deemed relevant to our audit committee, including, whether the transaction is on terms no less favorable than terms generally available to an unaffiliated third party under the same or similar circumstances, and the extent of the related party’s interest in the transaction. Our audit committee has determined that certain transactions will not require audit committee approval, including certain employment arrangements of executive officers, director compensation, transactions with another company at which a related party’s only relationship is as a non-executive employee, director or beneficial owner of less than 10% of that company’s shares and the aggregate amount involved does not exceed $120,000 in any fiscal year, transactions where a related party’s interest arises solely from the ownership of our common stock and all holders of our common stock received the same benefit on a pro rata basis and transactions available to all employees generally.
We believe that we have executed all of the transactions set forth above on terms no less favorable to us than we could have obtained from unaffiliated third parties. It is our intention to ensure that all future transactions between us and our officers, directors and principal stockholders and their affiliates, are approved by the audit committee of our board of directors and are on terms no less favorable to us than those that we could obtain from unaffiliated third parties.
-132-
Table of Contents
The following table sets forth certain information with respect to the beneficial ownership of our common stock at February 15, 2015, after giving effect to the automatic conversion of all outstanding shares of our convertible preferred stock into 149,907,620 shares of common stock, and as adjusted to reflect the sale of common stock in this offering, for:
| • | each of our directors; |
| • | each of our current named executive officers; |
| • | all of our current directors and executive officers as a group; and |
| • | each person, or group of affiliated persons, who beneficially owned more than 5% of our common stock. |
We have determined beneficial ownership in accordance with the rules of the SEC, and the information is not necessarily indicative of beneficial ownership for any other purpose. Except as indicated by the footnotes below, we believe, based on information furnished to us, that the persons and entities named in the table below have sole voting and sole investment power with respect to all shares of common stock that they beneficially owned, subject to applicable community property laws.
Applicable percentage ownership prior to, and after this offering is based on 181,700,130 shares of common stock outstanding at February 15, 2015, after giving effect to the automatic conversion of all outstanding shares of convertible preferred stock into 149,907,620 shares of common stock, as well as the vesting of RSUs that settle for 38,043 shares of common stock, which vest subject to a time-based vesting condition that has been partially met and a performance-based vesting condition related to the completion of our initial public offering, as further described in “Management’s Discussion and Analysis of Financial Condition and Results of Operations—Critical Accounting Policies and Estimates—Stock-based Compensation.” In computing the number of shares of common stock beneficially owned by a person and the percentage ownership of such person, we deemed to be outstanding all shares of common stock subject to equity awards held by the person that are currently exercisable or exercisable within 60 days of February 15, 2015. We did not deem such shares outstanding, however, for the purpose of computing the percentage ownership of any other person.
-133-
Table of Contents
Unless otherwise indicated, the address of each beneficial owner listed in the table below is c/o Apigee Corporation, 10 S. Almaden Boulevard, 16th Floor, San Jose, California 95113.
| Shares Beneficially Owned Prior to the Offering |
Shares Beneficially Owned After the Offering | |||||||||||
| Name of Beneficial Owner |
Number of Shares |
% | Number of Shares |
% | ||||||||
| 5% Stockholders: |
||||||||||||
| Entities Affiliated with Bay Partners(1) |
33,780,955 | 18.6 | ||||||||||
| Entities Affiliated with Norwest Venture Partners(2) |
47,577,115 | 26.2 | ||||||||||
| Entities Affiliated with Third Point Partners(3) |
21,751,974 | 12.0 | ||||||||||
| Wellington Management Company, LLP and certain of its investment advisory clients(4) |
13,745,704 | 7.6 | ||||||||||
| Current Named Executive Officers and Directors: |
||||||||||||
| Chet Kapoor(5) |
8,928,530 | 4.8 | ||||||||||
| Tim Wan |
— | — | ||||||||||
| Stephen Rowland(6) |
635,612 | * | ||||||||||
| Bob L. Corey(7) |
206,500 | * | ||||||||||
| Neal Dempsey(8) |
33,780,955 | 18.6 | ||||||||||
| Promod Haque(9) |
47,577,115 | 26.2 | ||||||||||
| William “BJ” Jenkins, Jr.(10) |
128,766 | * | ||||||||||
| Edmond Mesrobian |
84,011 | * | ||||||||||
| Robert Schwartz(11) |
— | — | ||||||||||
| All current executive officers and directors as a group (12 persons)(12) |
116,286,199 | 61.3 | ||||||||||
| * | Represents beneficial ownership of less than one percent (1%). |
| (1) | Consists of (i) 1,773,491 shares held of record by Bay Partners X Entrepreneurs Fund, LP (Entrepreneurs Fund); and (ii) 32,007,464 shares held of record by Bay Partners X, LP (Bay Partners X and together with Entrepreneurs Fund, the Bay Entities). Neal Dempsey and Stuart G. Phillips are the co-Managers of Bay Management Company X, LLC, the general partner of each of the Bay Entities. Messrs. Dempsey and Phillips share voting and dispositive power over the shares held by the Bay entities. The address for each of these entities is c/o Neal Dempsey, 2180 Sand Hill Road, Suite 345, Menlo Park, California 94025. |
| (2) | Consists of (i) 6,623,015 shares held of record by Norwest Venture Partners VIII, LP (Partners VIII); (ii) 37,733,121 shares held of record by Norwest Venture Partners IX, LP (Partners IX); and (iii) 3,220,979 shares held of record by Norwest Venture Partners XI, LP (Partners XI and together with Partners VIII, Partners IX, the Norwest Venture Partners Entities), which excludes the 538,717 shares of Series G convertible preferred stock held in escrow pursuant to the acquisition of InsightsOne Systems. NVP Associates, LLC (NVP), is the managing member of the general partners of the Norwest Venture Partners Entities, and shares voting and dispositive power over the shares held by the Norwest Venture Partners Entities. Promod Haque, Jeffrey Crowe and Matthew Howard, as co-chief executive officers of NVP and members of the general partners, may be deemed to share voting and dispositive power with respect to the shares held of record by the Norwest Venture Partners Entities. The address for each of these entities is c/o Promod Haque, 525 University Ave, Ste 800, Palo Alto, California 94301-1922. |
| (3) | Consists of (i) 14,553,035 shares held of record by Third Point Offshore Master Fund, L.P.; (ii) 2,806,638 shares held of record by Third Point Partners Qualified, L.P.; (iii) 1,718,157 shares held of record by Third Point Partners, L.P.; and (iv) 2,674,144 shares held of record by Third Point Ultra Master Fund L.P. Robert Schwartz, a member of our board of directors, is a Managing Partner of Third Point Ventures (the Sunnyvale, California-based venture capital arm of Third Point LLC), but does not have any voting or dispositive power with respect to the shares held by Third Point Ventures and its affiliated entities. Mr. Schwartz disclaims beneficial ownership of these shares except to the extent of his pecuniary interest therein. Third Point LLC, the investment manager of |
-134-
Table of Contents
| Third Point Offshore Master Fund, L.P., Third Point Partners Qualified L.P., Third Point Partners L.P. and Third Point Ultra Master Fund L.P., and Daniel S. Loeb, in his capacity as the Chief Executive Officer of Third Point LLC, have voting and dispositive power over shares held by Third Point Offshore Master Fund, L.P., Third Point Partners Qualified L.P., Third Point Partners L.P. and Third Point Ultra Master Fund L.P. The address for each of these persons is c/o Third Point LLC, 390 Park Avenue, New York, 19th Floor, New York 10022. |
| (4) | Consists of: (i) 628,505 shares held by John Hancock Variable Insurance Trust Small Cap Growth Trust; (ii) 143,039 shares held by Hartford Global Capital Appreciation Fund; (iii) 1,363,871 shares held by Hartford Growth Opportunities HLS Fund; (iv) 1,393,846 shares held by Hartford Small Company HLS Fund; (v) 370,884 shares held by The Hartford Capital Appreciation Fund; (vi) 3,329,812 shares held by The Hartford Growth Opportunities Fund; (vii) 870,207 shares held by The Hartford Small Company Fund; (viii) 84,518 shares held by Northeast Utilities Service Company Master Trust; (ix) 256,001 shares held by Optimum Small-Mid Cap Growth Fund; (x) 839,668 shares held by Quissett Investors (Bermuda) L.P.; (xi) 764,617 shares held by Quissett Partners, L.P.; (xii) 260,625 shares held by John Hancock Funds II Small Cap Growth Fund; (xiii) 148,495 shares held by Alpha Opportunities Trust; (xiv) 280,906 shares held by Alpha Opportunities Fund; (xv) 1,877,800 shares held by Mid Cap Stock Fund; (xvi) 59,363 shares held by John Hancock Pension Plan; and (xvii) 1,073,547 shares held by Mid Cap Stock Trust. Wellington Management Company, LLP, or Wellington Management, is an investment adviser registered under the Investment Advisers Act of 1940, as amended, and serves as the advisor to these entities. Wellington Management, in such capacity, may be deemed to share beneficial ownership (within the meaning of Rule 13d-3 promulgated under the Exchange Act) of the shares held by its client accounts. The address for each of the above referenced entities is c/o Wellington Management Company, LLP, 280 Congress Street, Boston, Massachusetts 02210. |
| (5) | Consists of (i) 3,993,011 shares held of record by Mr. Kapoor; and (ii) 4,935,519 shares exercisable within 60 days of February 15, 2015, all of which are fully vested as of such date. |
| (6) | Consists of (i) 400,237 shares held of record by Mr. Rowland; and (ii) 235,375 shares exercisable within 60 days of February 15, 2015, all of which are fully vested as of such date. |
| (7) | Consists of 206,500 shares exercisable within 60 days of February 15, 2015, all of which are fully vested as of such date. |
| (8) | Consists of the shares listed in footnote (1) above, which are held by entities affiliated with Bay Partners. Mr. Dempsey is a co-Manager of Bay Management Company X, LLC, the general partner of each of the Bay Entities and a limited partner of such funds, and as such may be deemed to share voting and dispositive power with respect to all shares held by such entities. |
| (9) | Consists of the shares listed in footnote (2) above, which are held by entities affiliated with Norwest Venture Partners. Mr. Haque is a member of the general partners of the Norwest Venture Partners Entities. Mr. Haque is also an officer of NVP Associates, LLC, the managing member of the Norwest Venture Partners Entities and a limited partner of such funds, and as such may be deemed to share voting and dispositive power with respect to all shares held by such entities. |
| (10) | Consists of 128,766 shares exercisable within 60 days of February 15, 2015, all of which are fully vested as of such date. |
| (11) | Excludes the shares listed in Note (3) above, the beneficial ownership of which Mr. Schwartz disclaims, except to the extent of his pecuniary interest therein. |
| (12) | Consists of (i) 108,281,359 shares beneficially owned by our current executive officers and directors; and (ii) 8,004,840 shares subject to options exercisable within 60 days of February 15, 2015, all of which are fully vested as of such date. |
-135-
Table of Contents
General
The following is a summary of the rights of our common stock and preferred stock and certain provisions of our amended and restated certificate of incorporation and amended and restated bylaws as they will be in effect immediately prior to the completion of this offering. This summary does not purport to be complete and is qualified in its entirety by the provisions of our amended and restated certificate of incorporation and amended and restated bylaws, copies of which have been filed as exhibits to the registration statement of which this prospectus is a part.
Immediately following the completion of this offering, our authorized capital stock will consist of 1,200,000,000 shares, with a par value of $0.001 per share, of which:
| • | 1,000,000,000 shares are designated as common stock; and |
| • | 200,000,000 shares are designated as preferred stock. |
Our board of directors is authorized, without stockholder approval, except as required by the listing standards of the NASDAQ Stock Market, to issue an additional shares of our capital stock.
As of February 15, 2015, we had outstanding 181,700,130 shares of common stock, held by approximately 380 stockholders of record, and no shares of preferred stock, assuming the automatic conversion of all outstanding shares of our convertible preferred stock into 149,907,620 common stock effective immediately prior to the completion of this offering, as well as the vesting of RSUs that settle for 38,043 shares of common stock, which vest subject to a time-based vesting condition that has been partially met and a performance-based vesting condition related to the completion of our initial public offering, as further described in “Management’s Discussion and Analysis of Financial Condition and Results of Operations—Critical Accounting Policies and Estimates—Stock-based Compensation.”
Common Stock
The holders of common stock are entitled to one vote per share on all matters submitted to a vote of our stockholders and do not have cumulative voting rights. Accordingly, holders of a majority of the shares of common stock entitled to vote in any election of directors may elect all of the directors standing for election. Subject to preferences that may be applicable to any preferred stock outstanding at the time, the holders of outstanding shares of common stock are entitled to receive ratably any dividends declared by our board of directors out of assets legally available. In addition, the terms of our loan and security agreement with SVB currently prohibit us from paying cash dividends on our common stock. See the section titled “Dividend Policy” for additional information. Upon our liquidation, dissolution or winding up, holders of our common stock are entitled to share ratably in all assets remaining after payment of liabilities and the liquidation preference of any then outstanding shares of preferred stock. Holders of common stock have no preemptive or conversion rights or other subscription rights. There are no redemption or sinking fund provisions applicable to the common stock.
Preferred Stock
After the completion of this offering, no shares of preferred stock will be outstanding. Pursuant to our amended and restated certificate of incorporation, our board of directors will have the authority, without further action by the stockholders, to issue from time to time up to 200,000,000 shares of preferred stock in one or more series. Our board of directors may designate the rights, preferences, privileges and restrictions of the preferred stock, including dividend rights, conversion rights, voting rights, redemption rights, liquidation preference, sinking fund terms and the number of shares constituting any series or the designation of any series. The issuance of preferred stock could have the effect of restricting dividends on the common stock, diluting the voting power
-136-
Table of Contents
of the common stock, impairing the liquidation rights of the common stock or delaying, deterring or preventing a change in control. Such issuance could have the effect of decreasing the market price of the common stock. We currently have no plans to issue any shares of preferred stock.
Option Awards and RSUs
As of February 15, 2015, there were 31,915,446 shares of our common stock issuable upon exercise of outstanding stock options pursuant to our equity plans with a weighted-average exercise price of $0.58 per share.
As of February 15, 2015, we had outstanding a non-plan option to purchase an aggregate of 9,000 shares of our common stock at a weighted average exercise price of $1.67 per share.
As of February 15, 2015, we had 103,933 shares of common stock issuable upon the vesting of RSUs.
Warrants
As of February 15, 2015 we had outstanding warrants to purchase 526,562 shares of our common stock with a weighted exercise price of $0.31 per share. The warrants have a net exercise provision pursuant to which the holder may, in lieu of payment of the exercise price in cash, surrender the warrant and receive a net amount of shares based on the fair market value of our common stock, as applicable, at the time of exercise of the warrant after deduction of the aggregate exercise price.
Registration Rights
We will pay the registration expenses (other than underwriting discounts, selling commissions and stock transfer taxes) of the holders of the shares registered pursuant to the registrations described below. In an underwritten offering, the managing underwriter, if any, has the right, subject to specified conditions, to limit the number of shares such holders may include. In connection with the completion of this offering, each stockholder that has registration rights agreed not to sell or otherwise dispose of any securities without the prior written consent of Morgan Stanley & Co. LLC for a period of 180 days after the date of this prospectus, subject to certain terms and conditions. See the section titled “Underwriting” for additional information.
Following the completion of this offering, the holders of shares of our convertible preferred stock or their permitted transferees are entitled to rights with respect to the registration of these shares under the Securities Act.
These rights are provided under the terms of a rights agreement dated April 17, 2014, or our Rights Agreement, between us and the holders of these shares, which was entered into in connection with our convertible preferred stock financing, and include requested registration rights, piggyback registration rights and S-3 registration rights. These registration rights will expire, with respect to any particular stockholder, when such stockholder is able to sell all of its shares pursuant to Rule 144 of the Securities Act in any 90-day period. In any registration made pursuant to such rights agreement, all fees, costs and expenses of underwritten registrations, including the reasonable fees of one special counsel for the selling holders selected by them (not to exceed $50,000), will be borne by us and underwriting discounts, selling commissions and stock transfer taxes will be borne by the holders of the shares being registered.
Requested Registration Rights
The holders of an aggregate of 149,907,620 shares of our common stock (assuming the automatic conversion of all outstanding shares of our convertible preferred stock into shares of common stock immediately prior to the completion of this offering), or their permitted transferees, are entitled to requested registration rights pursuant to the Rights Agreement. Six months after the completion of this offering, the holders of at least 50% of the shares entitled to registration rights then outstanding can request that we register the offer and sale of their shares, provided that such registration of shares would result in an anticipated aggregate offering price to the public of at least $15.0 million, after deducting underwriter’s discounts and commissions related to the issuance.
-137-
Table of Contents
We are required to effect only two registrations pursuant to this provision of the Rights Agreement. Depending on certain conditions, however, we may defer such registration for up to 90 days once in any 12-month period. We are not required to effect a requested registration earlier than 180 days after the effective date of this offering.
Piggyback Registration Rights
The holders of an aggregate of 149,907,620 shares of our common stock (assuming the automatic conversion of all outstanding shares of our convertible preferred stock into shares of common stock immediately prior to the completion of this offering), or their permitted transferees are entitled to piggyback registration rights pursuant to the Rights Agreement. If we register any of our securities under the Securities Act, subject to certain exceptions, the holders of these shares will be entitled to notice of the registration and to include their registrable securities in the registration. The underwriters of any underwritten offering have the right to limit the number of shares registered by these holders for marketing reasons, subject to limitations set forth in the Rights Agreement.
S-3 Registration Rights
The holders of an aggregate of 149,907,620 shares of our common stock (assuming the automatic conversion of all outstanding shares of our convertible preferred stock into shares of common stock immediately prior to the completion of this offering), or their permitted transferees are also entitled to S-3 registration rights pursuant to the Rights Agreement. If we are eligible to file a registration statement on Form S-3, these holders have the right, upon written request from holders of these shares, to have such shares registered by us if the proposed aggregate offering price of the shares to be registered by the holders requesting registration is at least $1.0 million, subject to exceptions set forth in the Rights Agreement.
Anti-takeover Effects of Delaware Law and Our Certificate of Incorporation and Bylaws
Our amended and restated certificate of incorporation and amended and restated bylaws to be effective immediately prior to the completion of this offering will contain provisions that could have the effect of delaying, deferring or discouraging another party from acquiring control of us. These provisions and certain provisions of Delaware law, which are summarized below, could discourage takeovers, coercive or otherwise. These provisions are also designed, in part, to encourage persons seeking to acquire control of us to negotiate first with our board of directors. We believe that the benefits of increased protection of our potential ability to negotiate with an unfriendly or unsolicited acquirer outweigh the disadvantages of discouraging a proposal to acquire us.
Issuance of Undesignated Preferred Stock. As discussed above under “—Preferred Stock,” our board of directors will have the ability to designate and issue preferred stock with voting or other rights or preferences that could deter hostile takeovers or delay changes in our control or management.
Limits on Ability of Stockholders to Act by Written Consent or Call a Special Meeting. Our amended and restated certificate of incorporation will provide that our stockholders may not act by written consent. This limit on the ability of stockholders to act by written consent may lengthen the amount of time required to take stockholder actions. As a result, the holders of a majority of our capital stock would not be able to amend the amended and restated bylaws or remove directors without holding a meeting of stockholders called in accordance with the amended and restated bylaws.
In addition, our amended and restated bylaws will provide that special meetings of the stockholders may be called only by the chairman of the board, the chief executive officer, the president (in the absence of a chief executive officer) or a majority of our board of directors. A stockholder may not call a special meeting, which may delay the ability of our stockholders to force consideration of a proposal or for holders controlling a majority of our capital stock to take any action, including the removal of directors.
Requirements for Advance Notification of Stockholder Nominations and Proposals. Our amended and restated bylaws will establish advance notice procedures with respect to stockholder proposals and the
-138-
Table of Contents
nomination of candidates for election as directors, other than nominations made by or at the direction of our board of directors or a committee of the board of directors. These advance notice procedures may have the effect of precluding the conduct of certain business at a meeting if the proper procedures are not followed and may also discourage or deter a potential acquirer from conducting a solicitation of proxies to elect its own slate of directors or otherwise attempt to obtain control of our company.
Board Classification. Our amended and restated certificate of incorporation provides that our board of directors will be divided into three classes, one class of which is elected each year by our stockholders. The directors in each class will serve for a three-year term. For more information on the classified board of directors, see the titled section “Management—Board Composition.” Our classified board of directors may tend to discourage a third party from making a tender offer or otherwise attempting to obtain control of us because it generally makes it more difficult for stockholders to replace a majority of the directors.
Election and Removal of Directors. Our amended and restated certificate of incorporation and amended and restated bylaws contain provisions that establish specific procedures for appointing and removing members of our board of directors. Under our amended and restated certificate of incorporation and amended and restated bylaws, vacancies and newly created directorships on our board of directors may be filled only by a majority of the directors then serving on our board of directors. Under our amended and restated certificate of incorporation and amended and restated bylaws, directors may be removed only for cause by the affirmative vote of the holders of a majority of the shares then entitled to vote at an election of directors.
No Cumulative Voting. The Delaware General Corporation Law provides that stockholders are not entitled to the right to cumulate votes in the election of directors unless our restated certificate of incorporation provides otherwise. Our restated certificate of incorporation and amended and restated bylaws do not expressly provide for cumulative voting. Without cumulative voting, a minority stockholder may not be able to gain as many seats on our board of directors as the stockholder would be able to gain if cumulative voting were permitted. The absence of cumulative voting makes it more difficult for a minority stockholder to gain a seat on our board of directors to influence our board of directors’ decision regarding a takeover.
Amendment of Charter Provision. Any amendment of the above provisions in our amended and restated certificate of incorporation would require approval by holders of at least two-thirds of our then outstanding common stock.
Delaware Anti-takeover Statute. We will be subject to the provisions of Section 203 of the Delaware General Corporation Law regulating corporate takeovers. In general, Section 203 prohibits a publicly held Delaware corporation from engaging, under certain circumstances, in a business combination with an interested stockholder for a period of three years following the date the person became an interested stockholder unless:
| • | prior to the date of the transaction, our board of directors approved either the business combination or the transaction that resulted in the stockholder becoming an interested stockholder; |
| • | upon completion of the transaction that resulted in the stockholder becoming an interested stockholder, the interested stockholder owned at least 85% of the voting stock of the corporation outstanding at the time the transaction commenced, excluding for purposes of determining the voting stock outstanding, but not the outstanding voting stock owned by the interested stockholder, (1) shares owned by persons who are directors and also officers and (2) shares owned by employee stock plans in which employee participants do not have the right to determine confidentially whether shares held subject to the plan will be tendered in a tender or exchange offer; or |
| • | at or subsequent to the date of the transaction, the business combination is approved by our board of directors and authorized at an annual or special meeting of stockholders, and not by written consent, by the affirmative vote of at least two-thirds of the outstanding voting stock that is not owned by the interested stockholder. |
-139-
Table of Contents
Generally, a business combination includes a merger, asset or stock sale, or other transaction resulting in a financial benefit to the interested stockholder. An interested stockholder is a person who, together with affiliates and associates, owns or, within three years prior to the determination of interested stockholder status, did own 15% or more of a corporation’s outstanding voting stock. We expect the existence of this provision to have an anti-takeover effect with respect to transactions our board of directors does not approve in advance. We also anticipate that Section 203 may discourage attempts that might result in a premium over the market price for the shares of common stock held by stockholders.
The provisions of Delaware law and the provisions of our amended and restated certificate of incorporation and amended and restated bylaws could have the effect of discouraging others from attempting hostile takeovers and as a consequence, they might also inhibit temporary fluctuations in the market price of our common stock that often result from actual or rumored hostile takeover attempts. These provisions might also have the effect of preventing changes in our management. It is also possible that these provisions could make it more difficult to accomplish transactions that stockholders might otherwise deem to be in their best interests.
Transfer Agent and Registrar
Upon the completion of this offering, the transfer agent and registrar for our common stock will be American Stock Transfer & Trust Company, LLC. The transfer agent’s address is 6201 15th Avenue, Brooklyn, New York 11219, and its telephone number is (718) 921-8206.
Exchange Listing
We have applied to list our common stock on The NASDAQ Global Select Market under the symbol “APIC.”
-140-
Table of Contents
SHARES ELIGIBLE FOR FUTURE SALE
Prior to this offering, there has been no public market for shares of our common stock and we cannot assure you that a liquid trading market for our common stock will develop or be sustained after this offering. Future sales of substantial amounts of shares of common stock, including shares issued upon the exercise of outstanding options, in the public market after this offering, or the possibility of these sales occurring, could adversely affect the prevailing market price for our common stock or impair our ability to raise equity capital in the future.
Based on shares outstanding as of February 15, 2015, upon the completion of this offering, a total of shares of common stock will be outstanding, after giving effect to the automatic conversion of all outstanding shares of our convertible preferred stock into 149,907,620 shares of common stock immediately prior to the completion of this offering, as well as the vesting of RSUs that settle for 38,043 shares of common stock, which vest subject to a time-based vesting condition that has been partially met and a performance-based vesting condition related to the completion of our initial public offering, as further described in “Management’s Discussion and Analysis of Financial Condition and Results of Operations—Critical Accounting Policies and Estimates—Stock-based Compensation,” and assuming no exercises of options or warrants that were outstanding as of February 15, 2015. Of these shares, all the shares of common stock sold in this offering by us, plus any shares sold upon exercise of the underwriters’ over-allotment option, will be freely tradable in the public market without restriction or further registration under the Securities Act, unless these shares are held by “affiliates,” as that term is defined in Rule 144 under the Securities Act.
The remaining outstanding shares of our common stock will be deemed “restricted securities” as defined in Rule 144. Restricted securities may be sold in the public market only if they are registered or if they qualify for an exemption from registration under Rule 144 or Rule 701 under the Securities Act, which rules are summarized below. In addition, holders of substantially all of our equity securities are subject to market stand-off agreements or have entered into lock-up agreements with the underwriters under which they have agreed, subject to specific exceptions, not to sell any of our stock for at least 180 days following the date of this prospectus, as described below. As a result of these agreements and the provisions of our Rights Agreement described in the section titled “Description of Capital Stock—Registration Rights,” subject to the provisions of Rule 144 or Rule 701, following the expiration of the lock-up period, all shares subject to such provisions and agreements will be available for sale in the public market only if registered or pursuant to an exemption from registration under Rule 144 or Rule 701 under the Securities Act.
Rule 144
In general, under Rule 144 as currently in effect, once we have been subject to public company reporting requirements for at least 90 days, a person who is not deemed to have been one of our affiliates for purposes of the Securities Act at any time during the 90 days preceding a sale and who has beneficially owned the shares proposed to be sold for at least six months, including the holding period of any prior owner other than our affiliates, is entitled to sell such shares (subject to the requirements of the lock-up agreements, as described below) without complying with the manner of sale, volume limitation or notice provisions of Rule 144, subject to compliance with the public information requirements of Rule 144. If such a person has beneficially owned the shares proposed to be sold for at least one year, including the holding period of any prior owner other than our affiliates, then such person is entitled to sell such shares (subject to the requirements of the lock-up agreements, as described below) without complying with any of the requirements of Rule 144.
In general, under Rule 144, as currently in effect, our affiliates or persons selling shares on behalf of our affiliates are entitled to sell upon expiration of the lock-up agreements described above, within any three-month period beginning 90 days after the date of this prospectus, a number of shares that does not exceed the greater of:
| • | 1% of the number of shares of common stock then outstanding, which will equal approximately shares immediately after this offering; or |
-141-
Table of Contents
| • | the average weekly trading volume of the common stock during the four calendar weeks preceding the filing of a notice on Form 144 with respect to such sale. |
Sales under Rule 144 by our affiliates or persons selling shares on behalf of our affiliates are also subject to certain manner of sale provisions and notice requirements and to the availability of current public information about us. Notwithstanding the availability of Rule 144, the holders of substantially all of common stock have entered into lock-up agreements as described below, and their restricted securities will become eligible for sale (subject to the above limitations under Rule 144) upon the expiration of the restrictions set forth in those agreements.
Rule 701
Rule 701, as currently in effect, generally allows a stockholder who purchased shares of our common stock pursuant to a written compensatory plan or contract and who is not deemed to have been an affiliate of our company during the immediately preceding 90 days to sell these shares (subject to the requirements of the lock-up agreements, as described below) in reliance upon Rule 144, but without being required to comply with the public information, holding period, volume limitation or notice provisions of Rule 144. Rule 701 also permits affiliates of our company to sell their Rule 701 shares under Rule 144 without complying with the holding period requirements of Rule 144. However, all holders of Rule 701 shares are required to wait until 90 days after the date of this prospectus (or until such later date that is required by the lock-up agreements, as described below) before selling such shares pursuant to Rule 701.
Lock-up Agreements
We, all of our directors and officers and holders of substantially all of our common stock, or securities exercisable for or convertible into our common stock outstanding immediately prior to this offering, have agreed that, without the prior written consent of Morgan Stanley & Co. LLC on behalf of the underwriters, we and they will not, subject to certain exceptions, during the period ending 180 days after the date of this prospectus:
| • | offer, pledge, sell, contract to sell, sell any option or contract to purchase, purchase any option or contract to sell, grant any option, right or warrant to purchase, lend or otherwise transfer or dispose of, directly or indirectly, any shares of common stock or any securities convertible into or exercisable or exchangeable for shares of common stock or publicly disclose the intention to make any offer, sale, pledge or disposition; or |
| • | enter into any swap or other arrangement that transfers to another, in whole or in part, any of the economic consequences of ownership of our common stock; |
whether any such transaction described above is to be settled by delivery of shares of our common stock or such other securities, in cash or otherwise, subject to certain exceptions set forth in the section titled “Underwriting.”
Registration Rights
The holders of 149,907,620 shares of common stock or their transferees will be entitled to various rights with respect to the registration of these shares under the Securities Act. Registration of these shares under the Securities Act would result in these shares becoming fully tradable without restriction under the Securities Act immediately upon the effectiveness of the registration, except for shares purchased by affiliates. See the section titled “Description of Capital Stock—Registration Rights” for additional information.
Registration Statements on Form S-8
Upon the completion of this offering, we intend to file a registration statement on Form S-8 under the Securities Act to register all of the shares of common stock issued or reserved for issuance under outstanding stock options and our stock option plans. Shares covered by this registration statement will be eligible for sale in the public market, upon the expiration or release from the terms of the lock-up agreements and subject to vesting of such shares.
-142-
Table of Contents
MATERIAL U.S. FEDERAL INCOME AND ESTATE TAX CONSEQUENCES TO NON-U.S. HOLDERS OF OUR COMMON STOCK
The following is a summary of the material U.S. federal income and estate tax consequences to non-U.S. holders (as defined below) of their ownership and disposition of our common stock purchased in this offering but is for general information only and does not purport to be a complete analysis of all the potential tax considerations relating thereto. This summary is based upon the provisions of the Internal Revenue Code of 1986, as amended, or the Code, existing and proposed Treasury regulations promulgated thereunder, administrative rulings and judicial decisions, all as of the date hereof. These authorities may be changed, possibly retroactively, so as to result in U.S. federal income and estate tax consequences different from those set forth below.
This summary also does not address the tax considerations arising under the laws of any non-U.S., state or local jurisdiction, or under any non-income tax laws, including U.S. federal gift and estate tax laws, except to the limited extent set forth below. In addition, this discussion does not address tax considerations applicable to an investor’s particular circumstances or to investors that may be subject to special tax rules, including, without limitation:
| • | banks, insurance companies or other financial institutions; |
| • | persons subject to the alternative minimum tax or tax on net investment income; |
| • | tax-exempt organizations or governmental organizations; |
| • | regulated investment companies and real estate investment trusts; |
| • | controlled foreign corporations, passive foreign investment companies and corporations that accumulate earnings to avoid U.S. federal income tax; |
| • | brokers or dealers in securities or currencies; |
| • | traders in securities that elect to use a mark-to-market method of accounting for their securities holdings; |
| • | persons that own, or are deemed to own, more than five percent of our capital stock (except to the extent specifically set forth below); |
| • | tax-qualified retirement plans; |
| • | certain former citizens or long-term residents of the United States; |
| • | partnerships or entities classified as partnerships for U.S. federal income tax purposes and other passthrough entities (and investors therein); |
| • | persons who hold our common stock as a position in a hedging transaction, “straddle,” “conversion transaction” or other risk reduction transaction or integrated investment; |
| • | persons who hold or receive our common stock pursuant to the exercise of any employee stock option or otherwise as compensation; |
| • | persons who do not hold our common stock as a capital asset within the meaning of Section 1221 of the Code; or |
| • | persons deemed to sell our common stock under the constructive sale provisions of the Code. |
In addition, if a partnership or entity classified as a partnership for U.S. federal income tax purposes holds our common stock, the tax treatment of a partner generally will depend on the status of the partner and upon the activities of the partnership. Accordingly, partnerships that hold our common stock, and partners in such partnerships, should consult their tax advisors. There can be no assurance that the Internal Revenue Service, or IRS, will not challenge one or more of the tax consequences described herein, and we have not obtained, and do not intend to obtain, an opinion of counsel or ruling from the IRS with respect to the U.S. federal income tax consequences to a non-U.S. holder of the purchase, ownership or disposition of our common stock. We urge prospective investors to consult with their own tax advisors regarding the U.S. federal, state, local and non-U.S. income and other tax considerations of purchasing, owning and disposing of shares of our common stock.
-143-
Table of Contents
You are urged to consult your tax advisor with respect to the application of the U.S. federal income tax laws to your particular situation, as well as any tax consequences of the purchase, ownership and disposition of our common stock arising under the U.S. federal estate or gift tax laws or under the laws of any state, local, non-U.S. or other taxing jurisdiction or under any applicable tax treaty.
Non-U.S. Holder Defined
For purposes of this discussion, you are a non-U.S. holder (other than a partnership) if you are any beneficial owner of our common stock other than:
| • | an individual citizen or resident of the United States (for tax purposes); |
| • | a corporation or other entity taxable as a corporation created or organized in the United States or under the laws of the United States or any political subdivision thereof, or other entity treated as such for U.S. federal income tax purposes; |
| • | an estate whose income is subject to U.S. federal income tax regardless of its source; or |
| • | a trust (x) whose administration is subject to the primary supervision of a U.S. court and which has one or more “U.S. persons” (within the meaning of Section 7701(a)(3) of the Code) who have the authority to control all substantial decisions of the trust or (y) which has made a valid election to be treated as a U.S. person. |
Distributions
As described in the section titled “Dividend Policy,” we have never declared or paid cash dividends on our common stock and do not anticipate paying any dividends on our common stock in the foreseeable future. However, if we do make distributions on our common stock, those payments will constitute dividends for U.S. tax purposes to the extent paid from our current or accumulated earnings and profits, as determined under U.S. federal income tax principles. To the extent those distributions exceed both our current and our accumulated earnings and profits, the excess will constitute a return of capital and will first reduce your basis in our common stock, but not below zero, and then will be treated as gain from the sale of stock as described below under “—Gain on Disposition of Common Stock.”
Subject to the discussion below on effectively connected income, any dividend paid to you generally will be subject to U.S. withholding tax either at a rate of 30% of the gross amount of the dividend or such lower rate as may be specified by an applicable income tax treaty. In order to receive a reduced treaty rate, you must provide us with an IRS Form W-8BEN or IRS Form W-8BEN-E or such successor form as the IRS designates certifying qualification for the reduced rate. These forms must be updated periodically. A non-U.S. holder of shares of our common stock eligible for a reduced rate of U.S. withholding tax pursuant to an income tax treaty may obtain a refund of any excess amounts withheld by timely filing an appropriate claim for refund with the IRS. If the non-U.S. holder holds our common stock through a financial institution or other agent acting on the non-U.S. holder’s behalf, the non-U.S. holder will be required to provide appropriate documentation to the agent, which then will be required to provide certification to us or our paying agent, either directly or through other intermediaries.
Dividends received by you that are effectively connected with your conduct of a U.S. trade or business (and, if required by an applicable income tax treaty, attributable to a permanent establishment or fixed base maintained by you in the United States) are generally exempt from such withholding tax if you satisfy certain certification and disclosure requirements. In order to obtain this exemption, you must provide us with an IRS Form W-8ECI or other applicable IRS Form W-8 properly certifying such exemption. Such effectively connected dividends, although not subject to withholding tax, are taxed at the same graduated U.S. federal income tax rates applicable to U.S. persons, net of certain deductions and credits. In addition, if you are a corporate non-U.S. holder, dividends you receive that are effectively connected with your conduct of a U.S. trade or business may also be subject to a branch profits tax at a rate of 30% or such lower rate as may be specified by an applicable income tax treaty. You should consult your tax advisor regarding any applicable tax treaties that may provide for different rules.
-144-
Table of Contents
Gain on Disposition of Common Stock
Subject to the discussion below regarding backup withholding and foreign accounts, you generally will not be required to pay U.S. federal income tax on any gain realized upon the sale, exchange or other disposition of our common stock unless:
| • | the gain is effectively connected with your conduct of a U.S. trade or business (and, if required by an applicable income tax treaty, the gain is attributable to a permanent establishment or fixed base maintained by you in the United States); |
| • | you are a non-resident alien individual who is present in the United States for a period or periods aggregating 183 days or more during the calendar year in which the sale or disposition occurs and certain other conditions are met; or |
| • | our common stock constitutes a U.S. real property interest by reason of our status as a “United States real property holding corporation,” or USRPHC, for U.S. federal income tax purposes at any time within the shorter of the five-year period preceding your disposition of, or your holding period for, our common stock. |
We believe that we are not currently and will not become a USRPHC for U.S. federal income tax purposes, and the remainder of this discussion so assumes. However, because the determination of whether we are a USRPHC depends on the fair market value of our U.S. real property relative to the fair market value of our other business assets, there can be no assurance that we will not become a USRPHC in the future. Even if we become a USRPHC, however, as long as our common stock is regularly traded on an established securities market, such common stock will be treated as U.S. real property interests only if you actually or constructively hold more than five percent of such regularly traded common stock at any time during the shorter of the five-year period preceding your disposition of, or your holding period for, our common stock.
If you are a non-U.S. holder described in the first bullet above, you will be required to pay tax on the net gain derived from the sale under regular graduated U.S. federal income tax rates, and a corporate non-U.S. holder described in the first bullet above also may be subject to the branch profits tax at a 30% rate, or such lower rate as may be specified by an applicable income tax treaty. If you are an individual non-U.S. holder described in the second bullet above, you will be required to pay a flat 30% tax (or such lower rate specified by an applicable income tax treaty) on the gain derived from the sale, which gain may be offset by U.S. source capital losses for the year (provided you have timely filed U.S. federal income tax returns with respect to such losses). You should consult your tax advisor regarding any applicable income tax or other treaties that may provide for different rules.
Federal Estate Tax
Our common stock beneficially owned by an individual who is not a citizen or resident of the United States (as defined for U.S. federal estate tax purposes) at the time of their death will generally be includable in the decedent’s gross estate for U.S. federal estate tax purposes. Such shares, therefore, may be subject to U.S. federal estate tax, unless an applicable estate tax treaty provides otherwise.
Backup Withholding and Information Reporting
Generally, we must report annually to the IRS the amount of dividends paid to you, your name and address and the amount of tax withheld, if any. A similar report will be sent to you. Pursuant to applicable income tax treaties or other agreements, the IRS may make these reports available to tax authorities in your country of residence.
Payments of dividends on or of proceeds from the disposition of our common stock made to you may be subject to information reporting and backup withholding at a current rate of 28% unless you establish an exemption, for example, by properly certifying your non-U.S. status on an IRS Form W-8BEN or IRS Form W-8BEN-E or another appropriate version of IRS Form W-8. Notwithstanding the foregoing, backup withholding and information reporting may apply if either we or our paying agent has actual knowledge, or reason to know, that such holder is a U.S. person.
-145-
Table of Contents
Backup withholding is not an additional tax; rather, the U.S. federal income tax liability of persons subject to backup withholding will be reduced by the amount of tax withheld. If withholding results in an overpayment of taxes, a refund or credit may generally be obtained from the IRS, provided that the required information is furnished to the IRS in a timely manner.
Foreign Account Tax Compliance
The Foreign Account Tax Compliance Act, or FATCA, generally imposes withholding tax at a rate of 30% on dividends on and gross proceeds from the sale or other disposition of our common stock paid to “foreign financial institutions” (as specially defined under these rules), unless such institution enters into an agreement with the U.S. government to, among other things, withhold on certain payments and to collect and provide to the U.S. tax authorities substantial information regarding the U.S. account holders of such institution (which includes certain equity and debt holders of such institution, as well as certain account holders that are foreign entities with U.S. owners) or otherwise establishes an exemption. FATCA also generally imposes a U.S. federal withholding tax of 30% on dividends on and gross proceeds from the sale or other disposition of our common stock paid to a “non-financial foreign entity” (as specially defined for purposes of these rules) unless such entity provides the withholding agent with a certification identifying certain substantial direct and indirect U.S. owners of the entity, certifies that there are none or otherwise establishes an exemption. The withholding provisions under FATCA generally apply to dividends on our common stock, and under current transitional rules are expected to apply with respect to the gross proceeds from a sale or other disposition of our common stock on or after January 1, 2017. Under certain circumstances, a non-U.S. holder might be eligible for refunds or credits of such taxes. An intergovernmental agreement between the United States and an applicable foreign country may modify the requirements described in this paragraph. Non-U.S. holders should consult their own tax advisors regarding the possible implications of this legislation on their investment in our common stock.
Each prospective investor should consult its own tax advisor regarding the particular U.S. federal, state and local and non-U.S. tax consequences of purchasing, holding and disposing of our common stock, including the consequences of any proposed change in applicable laws.
-146-
Table of Contents
Under the terms and subject to the conditions in an underwriting agreement dated the date of this prospectus, the underwriters named below, for which Morgan Stanley & Co. LLC, J.P. Morgan Securities LLC and Credit Suisse Securities (USA) LLC are acting as representatives, have severally agreed to purchase, and we have agreed to sell to them, severally, the number of shares indicated below:
| Name |
Number of Shares | |
| Morgan Stanley & Co. LLC |
||
| J.P. Morgan Securities LLC |
||
| Credit Suisse Securities (USA) LLC |
||
| Pacific Crest Securities LLC |
||
| JMP Securities LLC |
||
| Nomura Securities International, Inc. |
||
|
| ||
| Total |
||
|
|
The underwriters and the representatives are collectively referred to as the “underwriters” and the “representatives,” respectively. The underwriters are offering the shares of common stock subject to their acceptance of the shares from us and subject to prior sale. The underwriting agreement provides that the obligations of the several underwriters to pay for and accept delivery of the shares of common stock offered by this prospectus are subject to the approval of certain legal matters by their counsel and to certain other conditions. The underwriters are obligated to take and pay for all of the shares of common stock offered by this prospectus if any such shares are taken. However, the underwriters are not required to take or pay for the shares covered by the underwriters’ over-allotment option described below.
The underwriters initially propose to offer part of the shares of common stock directly to the public at the offering price listed on the cover page of this prospectus and part to certain dealers. After the initial offering of the shares of common stock, the offering price and other selling terms may from time to time be varied by the representatives.
We have granted to the underwriters an option, exercisable for 30 days from the date of this prospectus, to purchase up to additional shares of common stock at the public offering price listed on the cover page of this prospectus, less underwriting discounts and commissions. The underwriters may exercise this option solely for the purpose of covering over-allotments, if any, made in connection with the offering of the shares of common stock offered by this prospectus. To the extent the option is exercised, each underwriter will become obligated, subject to certain conditions, to purchase about the same percentage of the additional shares of common stock as the number listed next to the underwriter’s name in the preceding table bears to the total number of shares of common stock listed next to the names of all underwriters in the preceding table.
The following table shows the per share and total public offering price, underwriting discounts and commissions, and proceeds before expenses to us. These amounts are shown assuming both no exercise and full exercise of the underwriters’ option to purchase up to an additional shares of common stock.
| Per Share | Total | |||||
| No Exercise | Full Exercise | |||||
| Public offering price |
$ | $ | $ | |||
| Underwriting discounts and commissions to be paid by us |
$ | $ | $ | |||
| Proceeds, before expenses, to us |
$ | $ | $ | |||
The estimated offering expenses payable by us, exclusive of the underwriting discounts and commissions, are approximately $ . We have also agreed to reimburse the underwriters for certain FINRA-related expenses up to a maximum of $30,000.
-147-
Table of Contents
The underwriters have informed us that they do not intend sales to discretionary accounts to exceed 5% of the total number of shares of common stock offered by them.
We have applied to list our common stock on The NASDAQ Global Select Market under the trading symbol “APIC.”
At our request, the underwriters have reserved for sale, at the initial public offering price, up to 5% of the shares offered by this prospectus for sale to some of our related persons through a directed share program. If these persons purchase reserved shares it will reduce the number of shares available for sale to the general public. Any reserved shares that are not so purchased will be offered by the underwriters to the general public on the same terms as the other shares offered by this prospectus. None of our executive officers or directors will participate in the directed share program. We have agreed to indemnify for Morgan Stanley & Co. LLC and its affiliates against certain liabilities and expenses, including liabilities under the Securities Act, in connection with the sale of such reserved shares.
We, all of our directors and officers and the holders of substantially all of our outstanding stock and securities exercisable for or convertible into our common stock outstanding immediately prior to this offering have agreed that, without the prior written consent of Morgan Stanley & Co. LLC on behalf of the underwriters, we and they will not, during the period ending 180 days after the date of this prospectus (the “restricted period”):
| • | offer, pledge, sell, contract to sell, sell any option or contract to purchase, purchase any option or contract to sell, grant any option, right or warrant to purchase, lend or otherwise transfer or dispose of, directly or indirectly, any shares of common stock or any securities convertible into or exercisable or exchangeable for shares of common stock, or publicly disclose the intention to make any offer, sale, pledge, disposition or filing; |
| • | in our case, file any registration statement with the SEC relating to the offering of any shares of common stock or any securities convertible into or exercisable or exchangeable for common stock; or |
| • | enter into any swap or other arrangement that transfers to another, in whole or in part, any of the economic consequences of ownership of the common stock; |
whether any such transaction described above is to be settled by delivery of common stock or such other securities, in cash or otherwise. In addition, we and each such person agrees that, without the prior written consent of Morgan Stanley & Co. LLC on behalf of the underwriters, we or such other person will not, during the restricted period, make any demand for, or exercise any right with respect to, the registration of any shares of common stock or any security convertible into or exercisable or exchangeable for common stock.
The restrictions described in the immediately preceding paragraph do not apply to certain transactions, including:
| • | the sale of shares to the underwriters; |
| • | transactions by a securityholder relating to shares of common stock or other securities acquired in open market transactions after the completion of this offering, provided that no filing under Section 16(a) of the Exchange Act shall be required or shall be voluntarily made in connection with subsequent sales of common stock or other securities acquired in such open market transactions; |
| • | the transfer by a securityholder of shares of common stock or any securities convertible into or exercisable or exchangeable for common stock: (i) to an immediate family member of a securityholder or to a trust, or other entity formed for estate planning purposes formed for the direct or indirect benefit of the securityholder or such immediate family member; (ii) by bona fide gift, will or intestacy; (iii) if the securityholder is a corporation, partnership, limited liability company or other business entity (A) to another corporation, partnership, limited liability company or other business entity that is an affiliate of such securityholder or (B) as part of a disposition, transfer or distribution by such securityholder to its members, limited partners or equity holders; or (iv) if the securityholder is a trust, to a trustor or beneficiary of the trust; provided that in each case, each transferee, donee or distributee signs and delivers a lock-up agreement prior to or upon such transfer or distribution, and (1) in the case of any transfer or |
-148-
Table of Contents
| distribution pursuant to clauses (i), (ii) or (iv) above, no filing under Section 16(a) of the Exchange Act reporting a reduction in beneficial ownership of shares of common stock shall be voluntarily made during the restricted period and if a securityholder is required to file a report under Section 16(a) of the Exchange Act reporting a reduction in beneficial ownership of shares of common stock during the restricted period, the securityholder shall include a statement in such report to the effect that such transfer is not a transfer for value and (2) in the case of any transfer or distribution pursuant to clause (iii) above, no filing under Section 16(a) of the Exchange Act, reporting a reduction of beneficial ownership of shares of common stock, shall be required or voluntarily made during the restricted period; |
| • | the receipt by a securityholder from us of shares of common stock upon the vesting of restricted stock awards or exercise of options to purchase our securities issued pursuant to our equity incentive plans or the transfer by a securityholder of shares of common stock or any securities convertible into common stock to us upon a vesting event of our securities or upon the exercise of options or warrants to purchase our securities, in each case on a “cashless” or “net exercise” basis or to cover tax withholding obligations of the securityholders in connection with such vesting or exercise, provided that no filing under Section 16(a) of the Exchange Act shall be required or shall be voluntarily made within 30 days after the date of this prospectus, and after such 30th day, if a securityholder is required to file a report under Section 16(a) of the Exchange Act reporting a reduction in beneficial ownership of shares of common stock during the restricted period, the securityholder shall include a statement in such report to the effect that the purpose of such transfer was to cover tax withholding obligations of the securityholder in connection with such vesting or exercise and provided further that any shares received by the securityholder upon the vesting of restricted stock awards or exercise of options to purchase our securities issued pursuant to our equity incentive plans shall be subject to the restrictions described above; |
| • | the transfer by a securityholder of shares of common stock or any security convertible into or exercisable or exchangeable for common stock to us, pursuant to agreements under which we have the option to repurchase such shares or securities or a right of first refusal with respect to transfers of such shares or securities; |
| • | the establishment of a trading plan pursuant to Rule 10b5-1 under the Exchange Act for the transfer of shares of common stock, provided that such plan does not provide for the transfer of common stock during the restricted period and to the extent a public announcement or filing is required of or voluntarily made by or on behalf of the securityholder or us regarding the establishment of such plan, such announcement or filing shall include a statement to the effect that no transfer of common stock may be made under such plan during the restricted period; |
| • | the conversion our outstanding preferred stock into shares of our common stock, provided that such shares of common stock remain subject to the restrictions described above; |
| • | the transfer of shares of common stock or any security convertible into or exercisable or exchangeable for common stock that occurs by operation of law, including pursuant to a qualified domestic order or in connection with a divorce settlement, provided that the securityholder uses its reasonable best efforts to cause the transferee to sign and deliver a lock-up agreement including the restrictions described in this section prior to such transfer, and provided further, that any filing under Section 16(a) of the Exchange Act that is required to be made during the restricted period as a result of such transfer, states that such transfer has occurred by operation of law; |
| • | the sale and transfer by a securityholder of shares of common stock to the underwriters pursuant to the underwriting agreement; |
| • | the issuance by us of shares of common stock upon the exercise of an option or warrant or the conversion or vesting of a security outstanding on the date hereof; |
| • | the issuance and grant by us of options, restricted stock, restricted stock units or other stock-based compensation pursuant to equity compensation plans or employee stock purchase plans described in this prospectus; |
-149-
Table of Contents
| • | the sale or issuance of or entry into an agreement to sell or issue shares of common stock or securities convertible into or exercisable for common stock in connection with any (i) mergers, (ii) acquisition of securities, businesses, property, technologies or other assets, (iii) joint ventures, (iv) strategic alliances, commercial relationships or other collaborations, (v) equipment leasing arrangements (vi) debt financing or (vii) the assumption of employee benefit plans in connection with mergers or acquisitions; provided, that the aggregate number of shares of common stock or securities convertible into or exercisable for common stock (on an as-converted or as-exercised basis, as the case may be) that we may sell or issue or agree to sell or issue shall not exceed % of the total number of shares of our common stock issued and outstanding immediately following the completion of the transactions (determined on a fully-diluted basis and as adjusted for stock splits, stock dividends and other similar events after the date of this prospectus); and provided further, that each recipient of shares of common stock or securities convertible into or exercisable for common stock shall execute a lock-up agreement with respect to the remaining restricted period; and |
| • | the filing of one or more registration statements with the SEC on Form S-8 with respect to shares of common stock issued or issuable under any equity compensation plan in effect on the date of this prospectus. |
Morgan Stanley & Co. LLC, in its sole discretion, may release the common stock and other securities subject to the lock-up agreements described above in whole or in part at any time with or without notice.
In order to facilitate the offering of the common stock, the underwriters may engage in transactions that stabilize, maintain or otherwise affect the price of the common stock. Specifically, the underwriters may sell more shares than they are obligated to purchase under the underwriting agreement, creating a short position. A short sale is covered if the short position is no greater than the number of shares available for purchase by the underwriters under the over-allotment option. The underwriters can close out a covered short sale by exercising the over-allotment option or purchasing shares in the open market. In determining the source of shares to close out a covered short sale, the underwriters will consider, among other things, the open market price of shares compared to the price available under the over-allotment option. The underwriters may also sell shares in excess of the over-allotment option, creating a naked short position. The underwriters must close out any naked short position by purchasing shares in the open market. A naked short position is more likely to be created if the underwriters are concerned that there may be downward pressure on the price of the common stock in the open market after pricing that could adversely affect investors who purchase in this offering. As an additional means of facilitating this offering, the underwriters may bid for, and purchase, shares of common stock in the open market to stabilize the price of the common stock. These activities may raise or maintain the market price of the common stock above independent market levels or prevent or retard a decline in the market price of the common stock. The underwriters are not required to engage in these activities and may end any of these activities at any time.
We and the underwriters have agreed to indemnify each other against certain liabilities, including liabilities under the Securities Act.
A prospectus in electronic format may be made available on websites maintained by one or more underwriters, or selling group members, if any, participating in this offering. The representative may agree to allocate a number of shares of common stock to underwriters for sale to their online brokerage account holders. Internet distributions will be allocated by the representative to underwriters that may make Internet distributions on the same basis as other allocations.
The underwriters and their respective affiliates are full service financial institutions engaged in various activities, which may include securities trading, commercial and investment banking, financial advisory, investment management, investment research, principal investment, hedging. financing and brokerage activities. Certain of the underwriters and their respective affiliates have, from time to time, performed, and may in the future perform, various financial advisory and investment banking services for us, for which they received or will receive customary fees and expenses.
-150-
Table of Contents
In addition, in the ordinary course of their various business activities, the underwriters and their respective affiliates may make or hold a broad array of investments and actively trade debt and equity securities (or related derivative securities) and financial instruments (including bank loans) for their own account and for the accounts of their customers and may at any time hold long and short positions in such securities and instruments. Such investment and securities activities may involve our securities and instruments. The underwriters and their respective affiliates may also make investment recommendations or publish or express independent research views in respect of such securities or instruments and may at any time hold, or recommend to clients that they acquire, long or short positions in such securities and instruments.
Pricing of the Offering
Prior to this offering, there has been no public market for our common stock. The initial public offering price will be determined by negotiations between us and the representative. Among the factors considered in determining the initial public offering price will be our future prospects and those of our industry in general, our sales, earnings and certain other financial and operating information in recent periods, and the price-earnings ratios, price-sales ratios, market prices of securities, and certain financial and operating information of companies engaged in activities similar to ours.
Selling Restrictions
European Economic Area
In relation to each Member State of the European Economic Area which has implemented the Prospectus Directive (each, a “Relevant Member State”) an offer to the public of any shares of our common stock may not be made in that Relevant Member State, except that an offer to the public in that Relevant Member State of any shares of our common stock may be made at any time under the following exemptions under the Prospectus Directive, if they have been implemented in that Relevant Member State:
| (a) | to any legal entity which is a qualified investor as defined in the Prospectus Directive; |
| (b) | to fewer than 100 or, if the Relevant Member State has implemented the relevant provision of the 2010 PD Amending Directive, 150, natural or legal persons (other than qualified investors as defined in the Prospectus Directive), as permitted under the Prospectus Directive, subject to obtaining the prior consent of the representatives for any such offer; or |
| (c) | in any other circumstances falling within Article 3(2) of the Prospectus Directive, provided that no such offer of shares of our common stock shall result in a requirement for the publication by us or any underwriter of a prospectus pursuant to Article 3 of the Prospectus Directive. |
For the purposes of this provision, the expression an “offer to the public” in relation to any shares of our common stock in any Relevant Member State means the communication in any form and by any means of sufficient information on the terms of the offer and any shares of our common stock to be offered so as to enable an investor to decide to purchase any shares of our common stock, as the same may be varied in that Member State by any measure implementing the Prospectus Directive in that Member State, the expression “Prospectus Directive” means Directive 2003/71/EC (and amendments thereto, including the 2010 PD Amending Directive, to the extent implemented in the Relevant Member State), and includes any relevant implementing measure in the Relevant Member State, and the expression “2010 PD Amending Directive” means Directive 2010/73/EU.
United Kingdom
Each underwriter has represented and agreed that:
| (a) | it has only communicated or caused to be communicated and will only communicate or cause to be communicated an invitation or inducement to engage in investment activity (within the meaning of |
-151-
Table of Contents
| Section 21 of the FSMA) received by it in connection with the issue or sale of the shares of our common stock in circumstances in which Section 21(1) of the FSMA does not apply to us; and |
| (b) | it has complied and will comply with all applicable provisions of the FSMA with respect to anything done by it in relation to the shares of our common stock in, from or otherwise involving the United Kingdom. |
Hong Kong
The shares may not be offered or sold by means of any document other than (1) in circumstances which do not constitute an offer to the public within the meaning of the Companies Ordinance (Cap.32, Laws of Hong Kong), or (2) to “professional investors” within the meaning of the Securities and Futures Ordinance (Cap.571, Laws of Hong Kong) and any rules made thereunder, or (3) in other circumstances which do not result in the document being a “prospectus” within the meaning of the Companies Ordinance (Cap.32, Laws of Hong Kong), and no advertisement, invitation, or document relating to the shares may be issued or may be in the possession of any person for the purpose of issue (in each case whether in Hong Kong or elsewhere), which is directed at, or the contents of which are likely to be accessed or read by, the public in Hong Kong (except if permitted to do so under the laws of Hong Kong) other than with respect to shares which are or are intended to be disposed of only to persons outside Hong Kong or only to “professional investors” within the meaning of the Securities and Futures Ordinance (Cap. 571, Laws of Hong Kong) and any rules made thereunder.
Singapore
This prospectus has not been registered as a prospectus with the Monetary Authority of Singapore. Accordingly, this prospectus and any other document or material in connection with the offer or sale, or invitation for subscription or purchase, of the shares may not be circulated or distributed, nor may the shares be offered or sold, or be made the subject of an invitation for subscription or purchase, whether directly or indirectly, to persons in Singapore other than (i) to an institutional investor under Section 274 of the Securities and Futures Act, Chapter 289 of Singapore (the “SFA”), (ii) to a relevant person, or any person pursuant to Section 275(1A), and in accordance with the conditions, specified in Section 275 of the SFA, or (iii) otherwise pursuant to, and in accordance with the conditions of, any other applicable provision of the SFA.
Where the shares are subscribed or purchased under Section 275 by a relevant person which is: (a) a corporation (which is not an accredited investor) the sole business of which is to hold investments and the entire share capital of which is owned by one or more individuals, each of whom is an accredited investor; or (b) a trust (where the trustee is not an accredited investor) whose sole purpose is to hold investments and each beneficiary is an accredited investor, shares, debentures and units of shares, and debentures of that corporation, or the beneficiaries’ rights and interest in that trust shall not be transferable for six months after that corporation or that trust has acquired the shares under Section 275 except: (1) to an institutional investor under Section 274 of the SFA or to a relevant person, or any person pursuant to Section 275(1A), and in accordance with the conditions, specified in Section 275 of the SFA; (2) where no consideration is given for the transfer; or (3) by operation of law.
Japan
The securities have not been and will not be registered under the Financial Instruments and Exchange Law of Japan (the Financial Instruments and Exchange Law) and each underwriter has agreed that it will not offer or sell any securities, directly or indirectly, in Japan or to, or for the benefit of, any resident of Japan (which term as used herein means any person resident in Japan, including any corporation or other entity organized under the laws of Japan), or to others for re-offering or resale, directly or indirectly, in Japan or to a resident of Japan, except pursuant to an exemption from the registration requirements of, and otherwise in compliance with, the Financial Instruments and Exchange Law and any other applicable laws, regulations and ministerial guidelines of Japan.
-152-
Table of Contents
Switzerland
The shares may not be publicly offered in Switzerland and will not be listed on the SIX Swiss Exchange (SIX) or on any other stock exchange or regulated trading facility in Switzerland. This document has been prepared without regard to the disclosure standards for issuance prospectuses under art. 652a or art. 1156 of the Swiss Code of Obligations or the disclosure standards for listing prospectuses under art. 27 ff. of the SIX Listing Rules or the listing rules of any other stock exchange or regulated trading facility in Switzerland. Neither this document nor any other offering or marketing material relating to the shares or the offering may be publicly distributed or otherwise made publicly available in Switzerland.
Neither this document nor any other offering or marketing material relating to the offering, the company, or the shares have been or will be filed with or approved by any Swiss regulatory authority. In particular, this document will not be filed with, and the offer of shares will not be supervised by, the Swiss Financial Market Supervisory Authority FINMA (FINMA), and the offer of shares has not been and will not be authorized under the Swiss Federal Act on Collective Investment Schemes (CISA). The investor protection afforded to acquirers of interests in collective investment schemes under the CISA does not extend to acquirers of the shares.
Dubai International Financial Centre
This prospectus relates to an Exempt Offer in accordance with the Offered Securities Rules of the Dubai Financial Services Authority (DFSA). This prospectus is intended for distribution only to persons of a type specified in the Offered Securities Rules of the DFSA. It must not be delivered to, or relied on by, any other person. The DFSA has no responsibility for reviewing or verifying any documents in connection with Exempt Offers. The DFSA has not approved this prospectus nor taken steps to verify the information set forth herein and has no responsibility for the prospectus. The shares to which this prospectus relates may be illiquid and/or subject to restrictions on their resale. Prospective purchasers of the shares offered should conduct their own due diligence on the shares. If you do not understand the contents of this prospectus you should consult an authorized financial advisor.
-153-
Table of Contents
The validity of the shares of common stock offered hereby will be passed upon for us by Wilson Sonsini Goodrich & Rosati, Professional Corporation, Palo Alto, California. Cooley LLP, San Francisco, California, is acting as counsel to the underwriters.
The consolidated financial statements of Apigee Corporation and subsidiaries as of July 31, 2013 and 2014, and for each of the years in the three-year period ended July 31, 2014, have been included herein in reliance upon the report of KPMG LLP, independent registered public accounting firm appearing elsewhere herein, and upon the authority of such firm as experts in accounting and auditing.
The financial statements of InsightsOne Systems, Inc. as of December 31, 2012 and for the year in the period ended December 31, 2012 appearing in this Prospectus and Registration Statement have been audited by Mayer Hoffman McCann P.C., independent auditor, as set forth in their report thereon appearing elsewhere herein, and are included in reliance upon such report given on the authority of such firm as experts in accounting and auditing.
We have filed with the SEC a registration statement on Form S-1 under the Securities Act with respect to the shares of common stock offered by this prospectus. This prospectus, which constitutes a part of the registration statement, does not contain all of the information set forth in the registration statement, some of which is contained in exhibits to the registration statement as permitted by the rules and regulations of the SEC. For further information with respect to us and our common stock, we refer you to the registration statement, including the exhibits filed as a part of the registration statement. Statements contained in this prospectus concerning the contents of any contract or any other document are not necessarily complete. If a contract or document has been filed as an exhibit to the registration statement, please see the copy of the contract or document that has been filed. Each statement is this prospectus relating to a contract or document filed as an exhibit is qualified in all respects by the filed exhibit. You may obtain copies of this information by mail from the Public Reference Section of the SEC, 100 F Street, N.E., Room 1580, Washington, D.C. 20549, at prescribed rates. You may obtain information on the operation of the public reference rooms by calling the SEC at 1-800-SEC-0330. The SEC also maintains an Internet website that contains reports, proxy statements and other information about issuers, like us, that file electronically with the SEC. The address of that website is www.sec.gov.
As a result of this offering, we will become subject to the information and reporting requirements of the Exchange Act and, in accordance with this law will file periodic reports, proxy statements, and other information with the SEC. These periodic reports, proxy statements and other information will be available for inspection and copying at the SEC’s public reference facilities and the website of the SEC referred to above. We also maintain a website at www.apigee.com. Upon completion of this offering, you may access these materials free of charge as soon as reasonably practicable after they are electronically filed with, or furnished to, the SEC. Information contained on or that can be accessed through our website is not a part of this prospectus, and the inclusion of our website address in this prospectus is an inactive textual reference only.
-154-
Table of Contents
INDEX TO CONSOLIDATED FINANCIAL STATEMENTS
| Page | ||||
| APIGEE CORPORATION | ||||
| F-2 | ||||
| F-3 | ||||
| F-4 | ||||
| F-5 | ||||
| F-6 | ||||
| F-7 | ||||
| INSIGHTSONE SYSTEMS, INC. | ||||
| F-40 | ||||
| F-41 | ||||
| F-42 | ||||
| F-43 | ||||
| F-44 | ||||
| F-45 | ||||
F-1
Table of Contents
REPORT OF INDEPENDENT REGISTERED PUBLIC ACCOUNTING FIRM
The Board of Directors and Stockholders
Apigee Corporation:
We have audited the accompanying consolidated balance sheets of Apigee Corporation and subsidiaries (the Company) as of July 31, 2013 and 2014, and the related consolidated statements of comprehensive loss, stockholders’ equity (deficit), and cash flows for each of the years in the three-year period ended July 31, 2014. These consolidated financial statements are the responsibility of the Company’s management. Our responsibility is to express an opinion on these consolidated financial statements based on our audits.
We conducted our audits in accordance with the standards of the Public Company Accounting Oversight Board (United States). Those standards require that we plan and perform the audit to obtain reasonable assurance about whether the financial statements are free of material misstatement. An audit includes examining, on a test basis, evidence supporting the amounts and disclosures in the financial statements. An audit also includes assessing the accounting principles used and significant estimates made by management, as well as evaluating the overall financial statement presentation. We believe that our audits provide a reasonable basis for our opinion.
In our opinion, the consolidated financial statements referred to above present fairly, in all material respects, the financial position of Apigee Corporation and subsidiaries as of July 31, 2013 and 2014, and the results of their operations and their cash flows for each of the years in the three-year period ended July 31, 2014, in conformity with U.S. generally accepted accounting principles.
/s/ KPMG LLP
Santa Clara, California
November 26, 2014
F-2
Table of Contents
Consolidated Balance Sheets
(in thousands, except share amounts)
| July 31, | January 31, | Pro Forma Stockholders’ Equity As of January 31, |
||||||||||||||
| 2013 | 2014 | 2015 | 2015 | |||||||||||||
| (Unaudited) | ||||||||||||||||
| Assets |
||||||||||||||||
| Current assets |
||||||||||||||||
| Cash and cash equivalents |
$ | 44,243 | $ | 51,759 | $ | 29,133 | ||||||||||
| Accounts receivable, net of allowance for doubtful accounts of $172, $204 and $86 as of July 31, 2013, 2014 and January 31, 2015 (unaudited), respectively |
6,757 | 16,403 | 18,515 | |||||||||||||
| Prepaid expenses and other current assets |
3,362 | 4,533 | 5,748 | |||||||||||||
|
|
|
|
|
|
|
|||||||||||
| Total current assets |
54,362 | 72,695 | 53,396 | |||||||||||||
|
|
|
|
|
|
|
|||||||||||
| Property and equipment, net |
1,342 | 3,474 | 3,290 | |||||||||||||
| Goodwill |
— | 14,744 | 14,744 | |||||||||||||
| Intangible assets, net |
496 | 4,342 | 3,742 | |||||||||||||
| Other assets |
350 | 367 | 729 | |||||||||||||
|
|
|
|
|
|
|
|||||||||||
| Total assets |
$ | 56,550 | $ | 95,622 | $ | 75,901 | ||||||||||
|
|
|
|
|
|
|
|||||||||||
| Liabilities and stockholders’ equity |
||||||||||||||||
| Current liabilities |
||||||||||||||||
| Accounts payable |
$ | 1,740 | $ | 2,850 | $ | 2,159 | ||||||||||
| Accrued expenses and other current liabilities |
5,829 | 7,394 | 8,741 | |||||||||||||
| Deferred revenue, current portion |
14,233 | 23,356 | 28,380 | |||||||||||||
| Term debt, current portion |
1,509 | 2,778 | 2,071 | |||||||||||||
|
|
|
|
|
|
|
|||||||||||
| Total current liabilities |
23,311 | 36,378 | 41,351 | |||||||||||||
|
|
|
|
|
|
|
|||||||||||
| Non-current liabilities |
||||||||||||||||
| Deferred revenue, non-current |
2,891 | 4,834 | 4,813 | |||||||||||||
| Deferred rent, non-current |
36 | 1,617 | 1,522 | |||||||||||||
| Other liabilities, non-current |
804 | 806 | 794 | |||||||||||||
| Term debt, non-current |
2,172 | 2,465 | 2,828 | |||||||||||||
|
|
|
|
|
|
|
|||||||||||
| Total non-current liabilities |
5,903 | 9,722 | 9,957 | |||||||||||||
|
|
|
|
|
|
|
|||||||||||
| Total liabilities |
29,214 | 46,100 | 51,308 | |||||||||||||
|
|
|
|
|
|
|
|||||||||||
| Commitments and contingencies (Note 9) |
||||||||||||||||
| Stockholders’ equity |
||||||||||||||||
| Convertible preferred stock: $0.001 par value; 112,731,253, 142,194,666 and 142,194,666 shares authorized; 112,461,978, 142,168,547 and 141,513,411 shares issued and outstanding at July 31, 2013 and 2014, and January 31, 2015 (unaudited), respectively (aggregate liquidation preference of $107,016, $187,249 and $185,792 as of July 31, 2013 and 2014, and January 31, 2015 (unaudited), respectively) |
112 | 142 | 142 | — | ||||||||||||
| Common stock: $0.001 par value; 200,000,000, 230,000,000 and 230,000,000 shares authorized; 22,824,467, 29,876,435 and 31,495,757 shares issued and outstanding at July 31, 2013 and 2014 and January 31, 2015 (unaudited), respectively; pro forma 181,441,420 issued and outstanding at January 31, 2015 (unaudited) |
23 | 30 | 31 | 181 | ||||||||||||
| Additional paid-in capital |
112,279 | 195,221 | 197,100 | 197,123 | ||||||||||||
| Accumulated deficit |
(85,078 | ) | (145,871 | ) | (172,680 | ) | (172,711 | ) | ||||||||
|
|
|
|
|
|
|
|
|
|||||||||
| Total stockholders’ equity |
27,336 | 49,522 | 24,593 | $ | 24,593 | |||||||||||
|
|
|
|
|
|
|
|
|
|||||||||
| Total liabilities and stockholders’ equity |
$ | 56,550 | $ | 95,622 | $ | 75,901 | ||||||||||
|
|
|
|
|
|
|
|||||||||||
See accompanying notes to consolidated financial statements
F-3
Table of Contents
Consolidated Statements of Comprehensive Loss
(in thousands, except per share amounts)
| Year Ended July 31, | Six Months Ended January 31, |
|||||||||||||||||||
| 2012 | 2013 | 2014 | 2014 | 2015 | ||||||||||||||||
| (unaudited) | ||||||||||||||||||||
| Revenue |
||||||||||||||||||||
| License |
$ | 9,452 | $ | 13,917 | $ | 11,411 | $ | 3,566 | $ | 9,522 | ||||||||||
| Subscription and support |
7,308 | 15,243 | 20,237 | 9,651 | 14,164 | |||||||||||||||
| Professional services and other |
10,847 | 13,992 | 21,054 | 10,200 | 8,929 | |||||||||||||||
|
|
|
|
|
|
|
|
|
|
|
|||||||||||
| Total revenue |
27,607 | 43,152 | 52,702 | 23,417 | 32,615 | |||||||||||||||
| Cost of revenue |
||||||||||||||||||||
| License |
157 | 108 | 366 | 88 | 257 | |||||||||||||||
| Subscription and support |
3,484 | 9,286 | 11,911 | 7,425 | 5,367 | |||||||||||||||
| Professional services and other |
8,352 | 12,435 | 15,431 | 7,847 | 7,044 | |||||||||||||||
|
|
|
|
|
|
|
|
|
|
|
|||||||||||
| Total cost of revenue |
11,993 | 21,829 | 27,708 | 15,360 | 12,668 | |||||||||||||||
|
|
|
|
|
|
|
|
|
|
|
|||||||||||
| Gross profit |
15,614 | 21,323 | 24,994 | 8,057 | 19,947 | |||||||||||||||
| Operating expenses |
||||||||||||||||||||
| Research and development |
10,922 | 16,848 | 22,273 | 9,152 | 14,385 | |||||||||||||||
| Sales and marketing |
9,801 | 23,812 | 47,029 | 22,456 | 25,174 | |||||||||||||||
| General and administrative |
4,033 | 5,885 | 14,415 | 6,767 | 6,704 | |||||||||||||||
|
|
|
|
|
|
|
|
|
|
|
|||||||||||
| Total operating expenses |
24,756 | 46,545 | 83,717 | 38,375 | 46,263 | |||||||||||||||
|
|
|
|
|
|
|
|
|
|
|
|||||||||||
| Loss from operations |
(9,142 | ) | (25,222 | ) | (58,723 | ) | (30,318 | ) | (26,316 | ) | ||||||||||
| Other income (expense), net |
1,228 | (376 | ) | (1,678 | ) | (1,757 | ) | (290 | ) | |||||||||||
|
|
|
|
|
|
|
|
|
|
|
|||||||||||
| Loss before provision for income taxes |
(7,914 | ) | (25,598 | ) | (60,401 | ) | (32,075 | ) | (26,606 | ) | ||||||||||
| Provision for income taxes |
367 | 273 | 392 | 137 | 203 | |||||||||||||||
|
|
|
|
|
|
|
|
|
|
|
|||||||||||
| Net loss and comprehensive loss |
$ | (8,281 | ) | $ | (25,871 | ) | $ | (60,793 | ) | $ | (32,212 | ) | $ | (26,809 | ) | |||||
|
|
|
|
|
|
|
|
|
|
|
|||||||||||
| Net loss per share: |
||||||||||||||||||||
| Basic and diluted |
$ | (0.56 | ) | $ | (1.39 | ) | $ | (2.34 | ) | $ | (1.33 | ) | $ | (0.88 | ) | |||||
|
|
|
|
|
|
|
|
|
|
|
|||||||||||
| Weighted-average shares outstanding used in calculating net loss per share: |
||||||||||||||||||||
| Basic and diluted |
14,862 | 18,576 | 25,938 | 24,165 | 30,467 | |||||||||||||||
|
|
|
|
|
|
|
|
|
|
|
|||||||||||
| Pro forma net loss per share (unaudited): |
||||||||||||||||||||
| Basic and diluted |
$ | (0.39 | ) | $ | (0.15 | ) | ||||||||||||||
|
|
|
|
|
|||||||||||||||||
| Pro forma weighted-average shares outstanding used in calculating net loss per share (unaudited): |
||||||||||||||||||||
| Basic and diluted |
157,297 | 180,004 | ||||||||||||||||||
|
|
|
|
|
|||||||||||||||||
See accompanying notes to consolidated financial statements
F-4
Table of Contents
Consolidated Statements of Stockholders’ Equity (Deficit)
(in thousands, except share amounts)
| Convertible Preferred Stock | Common Stock | Additional
Paid-in Capital |
Accumulated Deficit |
Total Stockholders’ Equity (Deficit) |
||||||||||||||||||||||||
| Shares | Amount | Shares | Amount | |||||||||||||||||||||||||
| Balances at July 31, 2011 |
71,511,948 | $ | 72 | 13,064,667 | $ | 13 | $ | 49,284 | $ | (50,926 | ) | $ | (1,557 | ) | ||||||||||||||
| Issuance of Series E convertible preferred stock, net of issuance costs of $111 |
12,104,444 | 12 | — | — | 6,877 | — | 6,889 | |||||||||||||||||||||
| Issuance of Series F convertible preferred stock, net of issuance costs of $67 |
13,082,156 | 13 | — | — | 19,920 | — | 19,933 | |||||||||||||||||||||
| Issuance of common stock upon exercise of options |
— | — | 3,679,455 | 4 | 206 | — | 210 | |||||||||||||||||||||
| Issuance of common stock warrants |
— | — | — | — | 20 | — | 20 | |||||||||||||||||||||
| Stock-based compensation |
— | — | — | — | 181 | — | 181 | |||||||||||||||||||||
| Net loss |
— | — | — | — | — | (8,281 | ) | (8,281 | ) | |||||||||||||||||||
|
|
|
|
|
|
|
|
|
|
|
|
|
|
|
|||||||||||||||
| Balances at July 31, 2012 |
96,698,548 | 97 | 16,744,122 | 17 | 76,488 | (59,207 | ) | 17,395 | ||||||||||||||||||||
| Issuance of Series F convertible preferred stock, net of issuance costs of $8 |
32,705 | — | — | — | 42 | — | 42 | |||||||||||||||||||||
| Issuance of Series G convertible preferred stock, net of issuance costs of $103 |
15,730,725 | 15 | — | — | 34,881 | — | 34,896 | |||||||||||||||||||||
| Issuance of common stock upon exercise of options |
— | — | 5,922,010 | 6 | 400 | — | 406 | |||||||||||||||||||||
| Issuance of common stock upon vesting of restricted stock units |
— | — | 158,335 | — | — | — | — | |||||||||||||||||||||
| Issuance of common stock warrants |
— | — | — | — | 60 | — | 60 | |||||||||||||||||||||
| Stock-based compensation |
— | — | — | — | 408 | — | 408 | |||||||||||||||||||||
| Net loss |
— | — | — | — | — | (25,871 | ) | (25,871 | ) | |||||||||||||||||||
|
|
|
|
|
|
|
|
|
|
|
|
|
|
|
|||||||||||||||
| Balances at July 31, 2013 |
112,461,978 | 112 | 22,824,467 | 23 | 112,279 | (85,078 | ) | 27,336 | ||||||||||||||||||||
| Issuance of Series G convertible preferred stock in connection with InsightsOne acquisition |
3,887,736 | 4 | — | — | 9,599 | — | 9,603 | |||||||||||||||||||||
| Issuance of Series G-1 convertible preferred stock in connection with InsightsOne acquisition |
5,181,757 | 5 | — | — | 7,416 | — | 7,421 | |||||||||||||||||||||
| Issuance of Series H convertible preferred stock, net of issuance costs of $180 |
20,637,076 | 21 | — | — | 59,853 | — | 59,874 | |||||||||||||||||||||
| Issuance of common stock upon exercise of options |
— | — | 4,145,727 | 4 | 452 | — | 456 | |||||||||||||||||||||
| Issuance of common stock upon vesting of restricted stock units |
— | — | 537,002 | 1 | 29 | — | 30 | |||||||||||||||||||||
| Issuance of common stock from exercise of common stock warrants |
— | — | 2,369,239 | 2 | 2,836 | — | 2,838 | |||||||||||||||||||||
| Issuance of restricted stock units in connection with InsightsOne acquisition |
— | — | — | — | 31 | — | 31 | |||||||||||||||||||||
| Stock-based compensation |
— | — | — | — | 2,726 | — | 2,726 | |||||||||||||||||||||
| Net loss |
— | — | — | — | — | (60,793 | ) | (60,793 | ) | |||||||||||||||||||
|
|
|
|
|
|
|
|
|
|
|
|
|
|
|
|||||||||||||||
| Balances at July 31, 2014 |
142,168,547 | $ | 142 | 29,876,435 | $ | 30 | $ | 195,221 | $ | (145,871 | ) | $ | 49,522 | |||||||||||||||
| Issuance of common stock upon exercise of options (Unaudited) |
— | — | 1,619,322 | 1 | 406 | — | 407 | |||||||||||||||||||||
| Issuance of common stock warrants (Unaudited) |
— | — | — | — | 26 | — | 26 | |||||||||||||||||||||
| Stock-based compensation (Unaudited) |
— | — | — | — | 1,447 | — | 1,447 | |||||||||||||||||||||
| Repurchase of series G-1 preferred stock (Unaudited) |
(655,136 | ) | — | — | — | — | — | — | ||||||||||||||||||||
| Net loss (Unaudited) |
— | — | — | — | — | (26,809 | ) | (26,809 | ) | |||||||||||||||||||
|
|
|
|
|
|
|
|
|
|
|
|
|
|
|
|||||||||||||||
| Balances at January 31, 2015 (Unaudited) |
141,513,411 | $ | 142 | 31,495,757 | $ | 31 | $ | 197,100 | $ | (172,680 | ) | $ | 24,593 | |||||||||||||||
|
|
|
|
|
|
|
|
|
|
|
|
|
|
|
|||||||||||||||
See accompanying notes to consolidated financial statements
F-5
Table of Contents
Consolidated Statements of Cash Flows
(in thousands)
| Year Ended July 31, | Six Months Ended January 31, |
|||||||||||||||||||
| 2012 | 2013 | 2014 | 2014 | 2015 | ||||||||||||||||
| (Unaudited) | ||||||||||||||||||||
| Cash flows from operating activities |
||||||||||||||||||||
| Net loss |
$ | (8,281 | ) | $ | (25,871 | ) | $ | (60,793 | ) | $ | (32,212 | ) | $ | (26,809 | ) | |||||
| Adjustments to reconcile net loss to net cash used in operating activities |
||||||||||||||||||||
| Depreciation and amortization |
307 | 1,187 | 2,104 | 748 | 1,212 | |||||||||||||||
| Provision for doubtful accounts |
124 | 124 | 150 | 81 | 18 | |||||||||||||||
| Amortization of debt discount |
— | — | 24 | 11 | 26 | |||||||||||||||
| Issuances and changes in fair value of common stock warrants |
— | 1,254 | 1,584 | 1,584 | — | |||||||||||||||
| Deferred income taxes |
206 | 90 | (84 | ) | — | — | ||||||||||||||
| Stock-based compensation expense |
181 | 408 | 2,726 | 770 | 1,447 | |||||||||||||||
| Loss (gain) on disposal of fixed assets |
— | (2 | ) | 39 | — | — | ||||||||||||||
| Loss on lease abandonment |
— | — | 75 | — | — | |||||||||||||||
| Gain on bargain purchase |
(1,550 | ) | — | — | — | — | ||||||||||||||
| Changes in operating assets and liabilities |
||||||||||||||||||||
| Accounts receivable |
(2,369 | ) | (2,466 | ) | (9,671 | ) | (3,223 | ) | (2,630 | ) | ||||||||||
| Prepaid expenses and other assets |
(869 | ) | 6,947 | (1,173 | ) | (1,357 | ) | (357 | ) | |||||||||||
| Accounts payable |
939 | (576 | ) | 1,034 | 2,974 | (204 | ) | |||||||||||||
| Accrued expenses and other liabilities |
960 | (7,859 | ) | 2,694 | 2,406 | 520 | ||||||||||||||
| Deferred revenue |
9,094 | (16 | ) | 11,024 | 224 | 5,503 | ||||||||||||||
|
|
|
|
|
|
|
|
|
|
|
|||||||||||
| Net cash used in operating activities |
(1,258 | ) | (26,780 | ) | (50,267 | ) | (27,994 | ) | (21,274 | ) | ||||||||||
|
|
|
|
|
|
|
|
|
|
|
|||||||||||
| Cash flows from investing activities |
||||||||||||||||||||
| Purchase of property and equipment |
(1,015 | ) | (587 | ) | (2,539 | ) | (2,045 | ) | (350 | ) | ||||||||||
| Proceeds from the sale of property and equipment |
— | 3 | 4 | — | — | |||||||||||||||
| Acquisitions, net of cash acquired |
2,738 | — | 449 | 449 | — | |||||||||||||||
|
|
|
|
|
|
|
|
|
|
|
|||||||||||
| Net cash provided by (used in) investing activities |
1,723 | (584 | ) | (2,086 | ) | (1,596 | ) | (350 | ) | |||||||||||
|
|
|
|
|
|
|
|
|
|
|
|||||||||||
| Cash flows from financing activities |
||||||||||||||||||||
| Proceeds from issuance of debt, net of issuance costs |
— | 4,000 | 6,500 | — | 4,000 | |||||||||||||||
| Repayments of debt obligations |
(9 | ) | (320 | ) | (6,961 | ) | (808 | ) | (4,332 | ) | ||||||||||
| Proceeds from issuance of convertible preferred stock, net of issuance costs |
26,822 | 34,938 | 59,874 | — | — | |||||||||||||||
| Payment of deferred initial public offering costs |
— | — | — | — | (1,077 | ) | ||||||||||||||
| Proceeds from exercise of stock options |
210 | 406 | 456 | 120 | 407 | |||||||||||||||
|
|
|
|
|
|
|
|
|
|
|
|||||||||||
| Net cash provided by (used in) financing activities |
27,023 | 39,024 | 59,869 | (688 | ) | (1,002 | ) | |||||||||||||
|
|
|
|
|
|
|
|
|
|
|
|||||||||||
| Net increase (decrease) in cash and cash equivalents |
27,488 | 11,660 | 7,516 | (30,278 | ) | (22,626 | ) | |||||||||||||
| Cash and cash equivalents |
||||||||||||||||||||
| Beginning of period |
5,095 | 32,583 | 44,243 | 44,243 | 51,759 | |||||||||||||||
|
|
|
|
|
|
|
|
|
|
|
|||||||||||
| End of period |
$ | 32,583 | $ | 44,243 | $ | 51,759 | $ | 13,965 | $ | 29,133 | ||||||||||
|
|
|
|
|
|
|
|
|
|
|
|||||||||||
| Supplemental disclosures |
||||||||||||||||||||
| Cash paid for interest |
$ | — | $ | 24 | $ | 321 | $ | 122 | $ | 133 | ||||||||||
| Cash paid for taxes, net of refunds |
99 | 425 | 348 | 162 | 406 | |||||||||||||||
| Non-cash investing and financing activities |
||||||||||||||||||||
| Accrued purchases of property and equipment |
$ | 26 | $ | 65 | $ | 15 | $ | 132 | $ | 104 | ||||||||||
| Property and equipment acquired through tenant improvement |
— | — | 883 | 823 | — | |||||||||||||||
| Convertible preferred stock issued in connection with the InsightsOne acquisition |
— | — | 17,024 | 17,024 | — | |||||||||||||||
| Issuance of restricted stock units in connection with the InsightsOne acquisition |
— | — | 31 | 31 | — | |||||||||||||||
| Deferred offering costs not yet paid |
— | — | — | — | 1,069 | |||||||||||||||
See accompanying notes to consolidated financial statements
F-6
Table of Contents
Apigee Corporation
Notes to Consolidated Financial Statements
(1) Description of Business and Significant Accounting Policies
Description of Business
Apigee Corporation’s (together with its wholly-owned subsidiaries, “Apigee” or the “Company”) mission is to make every business a digital business. The Company provides an innovative software platform that allows businesses to design, deploy, and scale APIs, as a connection layer between their core IT systems and data and the applications with which their customers, partners, employees and other users engage with the business. The foundations of the Company’s platform are Apigee Edge, a robust API-management solution, and Apigee Insights, the Company’s predictive analytics software solution. The Company delivers its platform both in the cloud and on premises. Apigee was incorporated in Delaware on June 3, 2004 and is headquartered in San Jose, California.
Principles of Consolidation
The accompanying consolidated financial statements have been prepared in accordance with generally accepted accounting principles in the United States (“GAAP”), and include the accounts of Apigee Corporation and its wholly-owned subsidiaries. All intercompany balances and transactions have been eliminated upon consolidation.
Unaudited Interim Financial Information
The accompanying interim consolidated balance sheet as of January 31, 2015, the related interim consolidated statements of comprehensive loss and cash flows for the six-month periods ended January 31, 2014 and 2015, the statement of stockholders’ equity (deficit) for the six-month period ended January 31, 2015 and the related footnote disclosures are unaudited. These unaudited interim consolidated financial statements have been prepared in accordance with GAAP applicable to interim financial statements. The interim financial statements are presented in accordance with the rules and regulations of the Securities and Exchange Commission and do not include all disclosures normally required in annual consolidated financial statements prepared in accordance with U.S. GAAP. In management’s opinion, the unaudited interim consolidated financial statements have been prepared on the same basis as the annual financial statements and include all adjustments, which include only normal recurring adjustments, necessary for the fair presentation of our financial position as of January 31, 2015 and our consolidated results of operations and cash flows for the six months ended January 31, 2014 and 2015. The results for the six months ended January 31, 2015 are not necessarily indicative of the results expected for the full fiscal year.
Use of Estimates
The preparation of consolidated financial statements in conformity with GAAP requires management to make estimates and assumptions that affect the reported amounts of assets and liabilities and disclosure of contingent assets and liabilities at the date of the consolidated financial statements and the reported amounts of revenue and expenses during the reporting period covered by the consolidated financial statements and accompanying notes. In particular, the Company makes estimates with respect to the fair value of multiple elements in revenue recognition, the uncollectible accounts receivables, assets acquired and liabilities assumed in a business combination, valuation of long-lived assets, stock-based compensation, income taxes and other contingencies. Actual results could differ from those estimates and such differences could be material to the financial statements and affect the results of operations reported in future periods.
Foreign Currency Transactions
The functional currency of the Company’s foreign subsidiaries is the U.S. dollar. Accordingly, monetary balance sheet accounts are remeasured using the current exchange rate in effect at the balance sheet date and non-
F-7
Table of Contents
monetary items are remeasured at the historical exchange rate. Expenses are remeasured at the average exchange rates for the period. The resulting gains and losses are included in other income (expense), net and were not material for the years ended July 31, 2012, 2013 and 2014 and for the six months ended January 31, 2014 and 2015.
Cash and Cash Equivalents
The Company considers all highly liquid instruments with original or remaining maturities of 90 days or less at the date of purchase to be cash equivalents. Cash and cash equivalents are recorded at cost, which approximates fair value. As of July 31, 2013 and 2014 and January 31, 2015, $44.1 million, $51.3 million and $28.3 million, respectively, of cash and cash equivalents were invested in money market funds.
Concentration of Risk and Significant Customers
Financial instruments that potentially subject the Company to significant concentrations of credit risk consist primarily of cash and cash equivalents, and accounts receivable. The Company maintains the majority of its cash and money market accounts at one financial institution that management believes is a high-credit, high-quality financial institution and accordingly, subject to minimal credit risk. Deposits held with these financial institutions may be in excess the amount of insured limits provided on such deposits, if any.
The Company’s accounts receivable are subject to credit risks. The accounts receivable are unsecured and are derived from customers around the world in a variety of industries.
The Company’s significant customers who individually exceeded 10% of total accounts receivable as of the dates shown or total revenue during the period are as follows:
| Revenue | Accounts Receivable | |||||||||||||||||||||||||||||||
| Year
Ended July 31, |
Six Months Ended January 31, |
As of July 31, |
As
of January 31, 2015 |
|||||||||||||||||||||||||||||
| 2012 | 2013 | 2014 | 2014 | 2015 | 2013 | 2014 | ||||||||||||||||||||||||||
| (unaudited) | (unaudited) | |||||||||||||||||||||||||||||||
| Customer A |
* | * | * | * | * | 24 | % | * | * | |||||||||||||||||||||||
| Customer B |
38 | % | 36 | % | 15 | % | 17 | % | * | 14 | % | * | * | |||||||||||||||||||
| Customer C |
* | * | * | * | * | * | 20 | % | * | |||||||||||||||||||||||
| Customer D |
* | * | * | * | * | * | 18 | % | * | |||||||||||||||||||||||
| Customer E |
* | * | * | * | * | * | * | 32 | % | |||||||||||||||||||||||
| * | Does not exceed 10%. |
Accounts Receivable and Allowance for Doubtful Accounts
The Company’s accounts receivable are recorded at invoiced amounts, net of the Company’s estimated allowances for doubtful accounts. The allowance for doubtful accounts is estimated based on an assessment of the Company’s ability to collect on customer accounts receivable. The Company performs ongoing credit evaluations of its customers and regularly reviews the allowance by considering certain factors such as historical experience, industry data, credit quality, age of accounts receivable balances and current economic conditions that may affect a customer’s ability to pay. In cases where the Company is aware of circumstances that may impair a specific customer’s ability to meet their financial obligations, the Company records a specific allowance against amounts due from the customer and thereby reduces the net recognized receivable to the amount the Company reasonably believes will be collected. There is judgment involved with estimating the Company’s allowance for doubtful accounts and if the financial condition of its customers were to deteriorate, resulting in their inability to make the required payments, the Company may be required to record additional allowances or charges against revenue. The Company writes off accounts receivable against the allowance when it determines a balance is uncollectible and no longer actively pursues collection of the receivable. The Company’s accounts receivable are not collateralized by any security.
F-8
Table of Contents
The following table summarizes the accounts receivable allowance activity:
| Year Ended July 31, | Six Months Ended January 31, 2015 |
|||||||||||||||
| 2012 | 2013 | 2014 | ||||||||||||||
| (unaudited) | ||||||||||||||||
| (in thousands) | ||||||||||||||||
| Balance at beginning of period |
$ | 34 | $ | 137 | $ | 172 | $ | 204 | ||||||||
| Additions |
124 | 124 | 150 | 13 | ||||||||||||
| Write-offs, net of recoveries |
(21 | ) | (89 | ) | (118 | ) | (131 | ) | ||||||||
|
|
|
|
|
|
|
|
|
|||||||||
| Balance at end of period |
$ | 137 | $ | 172 | $ | 204 | $ | 86 | ||||||||
|
|
|
|
|
|
|
|
|
|||||||||
Property and Equipment, Net
Property and equipment are stated at cost, net of accumulated depreciation and amortization. Depreciation is calculated using the straight-line method over the estimated useful lives of the assets generally ranging from three to five years. Leasehold improvements are amortized over the shorter of the estimated useful life or the remaining lease term. When assets are retired or disposed of, the cost and accumulated depreciation are removed from the accounts, and any resulting gains or losses are included in the consolidated statements of comprehensive loss. Maintenance and repairs that do not improve or extend the lives of the respective assets are expensed in the period incurred.
The estimated useful lives of property and equipment are as follows:
| Useful Life | ||
| Computer equipment and software |
3 years | |
| Furniture and fixtures |
5 years | |
| Leasehold improvements |
Shorter of the lease term or estimated useful life |
Fair Value of Financial Instruments
Assets and liabilities recorded at fair value in the financial statements are categorized based upon the level of judgment associated with the inputs used to measure their fair value. Hierarchical levels which are directly related to the amount of subjectivity associated with the inputs to the valuation of these assets or liabilities are as follows:
Level 1—Observable inputs, such as quoted prices in active markets for identical assets or liabilities.
Level 2—Observable inputs other than Level 1 prices such as quoted prices for similar assets or liabilities, quoted prices in markets that are not active, or other inputs that are observable or can be corroborated by observable market data for substantially the full term of the assets or liabilities.
Level 3—Unobservable inputs that are supported by little or no market activity and that are significant to the fair value of the assets or liabilities.
The Company has certain financial assets and liabilities that are measured at fair value on a recurring basis. Assets and liabilities measured at fair value are classified in their entirety based on the lowest level of input that is significant to the fair value measurement. The Company’s assessment of the significance of a particular input to the fair value measurement in its entirety requires management to make judgments and considers factors specific to the asset or liability. The Company’s cash equivalents include highly liquid money market funds and are classified within the Level 1 of the fair value hierarchy. Level 3 liabilities that are measured at fair value on a recurring basis consist solely of the Company’s common stock warrant liability. The fair values of the outstanding common stock warrants are measured using the Black-Scholes option-pricing model. Inputs used to
F-9
Table of Contents
determine estimated fair value include the estimated fair value of the underlying stock at the valuation measurement date, the remaining contractual term of the warrants, risk-free interest rates, expected dividends, and the expected volatility of the underlying stock. Generally, increases (decreases) in the fair value of the underlying stock and estimated term would have a directionally similar impact to the fair value measurement.
The carrying amounts of certain of the Company’s financial instruments including cash equivalents, accounts receivable, accounts payable and accrued liabilities approximate fair value due to their short-term maturities. Based on borrowing rates currently available to the Company for financing obligations with similar terms and considering the Company’s credit risks, the carrying value of the Company’s long-term debt approximates fair value.
Goodwill and Intangible Assets
Goodwill represents the excess of the purchase price over the fair value of the net tangible and intangible assets acquired in a business combination. Goodwill is not amortized, but is tested for impairment at least annually or more frequently if events or changes in circumstances indicate that the asset may be impaired. The Company’s impairment tests are based on a single operating segment and reporting unit structure. If the Company determines that it is more likely than not that the fair value of the Company’s reporting unit is less than the carrying value, it will conduct a two-step test for impairment of goodwill. The first step involves comparing the fair value of the Company’s reporting unit to its carrying value, including goodwill. If the carrying value of the reporting unit exceeds its fair value, the second step of the test is performed by comparing the carrying value of the goodwill in the reporting unit to its implied fair value. An impairment charge is recognized for the excess of the carrying value of goodwill over its implied fair value. The Company’s annual goodwill impairment test resulted in no impairment charges during the year ended July 31, 2014.
Intangible assets acquired as part of a business combination, consisting primarily of developed technology, customer relationships and backlog are capitalized at their acquisition-date fair value and amortized using the straight-line method over their estimated useful life.
Impairment of Long-lived Assets
Long-lived assets, such as property, plant, and equipment, and purchased intangible assets are reviewed for impairment whenever events or changes in circumstances indicate that the carrying amount of an asset may not be recoverable. Recoverability of these assets is measured by a comparison of the future undiscounted cash flows expected to be generated by that asset or asset group to its carrying value. If the carrying value of the long-lived asset or asset group is not recoverable on an undiscounted cash flow basis, an impairment is recognized to the extent that the carrying value exceeds its fair value. There were no impairment charges for the years ended July 31, 2012, 2013 and 2014 and for the six months ended January 31, 2014 and 2015.
Business Combinations
The Company recognizes assets acquired, liabilities assumed and contingent consideration at their fair value on the acquisition date. The Company’s estimates are inherently uncertain and subject to refinement. As a result, during the measurement period, which may be up to one year from the acquisition date, the Company may record adjustments to the fair value of assets acquired and liabilities assumed, with the corresponding offset to goodwill. Upon the conclusion of the measurement period or final determination of the fair value of assets acquired or liabilities assumed, whichever comes first, any subsequent adjustments are recorded to the Company’s consolidated statements of comprehensive loss.
In addition, uncertainties in income tax and tax related valuation allowances assumed in connection with a business combination are initially estimated as of the acquisition date. The Company continues to gather information and evaluates these items and records any adjustments to the Company’s preliminary estimates to
F-10
Table of Contents
goodwill when the Company is within the measurement period. Subsequent to the measurement period, changes to these income tax uncertainties and tax related valuation allowances will affect the Company’s provision for income taxes in the Company’s consolidated statements of comprehensive loss.
Capitalized Software Development Costs
Software development costs are expensed as incurred until the establishment of technological feasibility, at which time those costs are capitalized until the product is available for general release to customers and amortized over the estimated life of the product. Technological feasibility is established upon completion of a working model. To date, costs incurred subsequent to the establishment of technological feasibility have not been significant, and all software development costs have been charged to research and development expense in the accompanying consolidated statements of comprehensive loss.
Deferred Offering Costs
Deferred offering costs consisted primarily of accounting, legal and other fees related to the Company’s proposed initial public offering. There were $2.1 million of deferred offering costs included in other assets on the Company’s consolidated balance sheet as of January 31, 2015. Upon completion of the initial public offering contemplated herein, these amounts will be recorded as a reduction of stockholders’ equity as an offset against the proceeds of the offering. If the offering is terminated, the deferred offering costs will be expensed.
Revenue Recognition
The Company generates revenue from the sale of its software solutions to customers through perpetual licenses and time-based licenses for its on premises solutions, and subscription arrangements for its cloud service. The Company also generates revenue from the sale of post-contract software support for on premises licenses including when and if available updates, and professional services such as consulting and training services. The Company recognizes revenue when all of the following conditions are met:
| • | persuasive evidence of an arrangement exists; |
| • | delivery has occurred or services have been provided; |
| • | sales price is fixed or determinable; and |
| • | collection of the related receivable is probable. |
Signed agreements, including by electronic acceptance, are used as evidence of an arrangement. For the Company’s on premises solution, delivery is considered to occur when it provides the customer the ability to download the software. For the Company’s cloud service solution, delivery is considered to occur when a subscription service is provisioned and made available to a customer. The Company assesses whether a fee is fixed or determinable at the outset of the arrangement, primarily based on the payment terms associated with the sale. The Company assesses collectability of the fee based on a number of factors such as collection history and creditworthiness of the customer. If the Company determines that collectability is not probable, revenue is deferred until collectability becomes probable, generally upon receipt of payment from the customer.
The Company typically enters into multiple-element arrangements with its customers in which a customer may purchase a combination of its software (offered on premises with software support or as a cloud service) solution, and professional services. The software support and professional services are not considered essential to the functionality of the software. All of these elements are considered separate units of accounting. Typically, the Company’s agreements do not include rights for customers to cancel or terminate arrangements or to return software to obtain refunds.
The Company presents revenue on a net basis, and therefore, all sales taxes are excluded from revenue in the consolidated statements of comprehensive loss. Travel and other reimbursable costs are recorded in revenue.
F-11
Table of Contents
License
License revenue is comprised of revenue generated from licenses of the Company’s on premises perpetual and time-based software solutions. The majority of the Company’s perpetual software license arrangements include a combination of the Company’s software downloaded on the customer’s hardware, software support, or professional services. For software elements, under the software revenue recognition guidance, the residual method is used to recognize revenue when a multiple-element arrangement includes one or more elements to be delivered at a future date and vendor-specific objective evidence (“VSOE”) of fair value of all undelivered element exists. VSOE is defined as the price charged when the same element is sold separately or for an element not yet being sold separately, the price established by management having relevant authority. In the majority of the Company’s software arrangements, the only element that remains undelivered at the time of delivery of the software product is software support or services.
The Company has established VSOE for consulting days, training and software support, except for software support bundled with time-based licenses, based on a substantial majority of separate stand-alone sales of these elements, which have been priced within a reasonably narrow range. As a result, for multiple element arrangements that include perpetual licenses, revenue is allocated to the undelivered elements based on VSOE for support or consulting days and training. Using the residual method, the difference between the total arrangement fee and amount deferred for the undelivered elements is recognized upon delivery of the perpetual license if all other revenue recognition criteria are met.
The Company does not have VSOE for software support bundled with time-based licenses. Therefore, revenue from time-based licenses to the Company’s on-premises solution is generally recognized ratably over the contractual term for all periods presented.
Subscription and Support
Subscription and support revenue includes the revenue derived from customer subscriptions to the Company’s cloud service and software support for its on premises software licenses. Cloud service arrangements generally include the Company’s cloud service solution offered on a subscription basis and professional services. The term of the arrangement allows for the customer to access the Company’s software for a specified period of time, generally one to three years. In cloud service subscription arrangements, the customer is not allowed to take possession of the Company’s software. Revenue from subscriptions to the Company’s cloud service is generally recognized ratably over the contractual term for all periods presented.
When cloud service subscription arrangements involve multiple elements that qualify as separate units of accounting (i.e., the delivered items have stand-alone value), the Company allocates arrangement consideration based on the relative selling price method using the following selling price hierarchy: (1) VSOE if available; (2) third-party evidence (“TPE”), if VSOE is not available; and (3) best estimate of selling price (“BESP”) if neither VSOE nor TPE is available.
The Company has not historically priced its cloud service solution within a narrow range and, therefore, cannot establish VSOE. The Company also believes that TPE is not readily available for its cloud service as pricing is not readily accessible and there is no comparable product offering in the market. As a result, the Company uses BESP in order to allocate the selling price to cloud deliverables. The Company determines BESP considering multiple factors including, but not limited to, the price it charges for similar offerings, market conditions, competitive landscape, and pricing practices. For cloud offerings that include consulting days and training, the Company uses BESP for cloud deliverables and VSOE for consulting days and training to allocate revenue into separate units of accounting. Revenue for the cloud service is generally recognized over the subscription period when all other revenue recognition criteria are met. Consulting days and training are recognized as the services are performed, as discussed below.
F-12
Table of Contents
Revenue from software support for the Company’s on-premises perpetual and time-based software licenses is generally recognized ratably over the contractual term, which is typically one to three years. Software support is bundled with time-based licenses and the Company uses a consistent systematic and rational method to allocate between time-based license and support revenue for financial statement presentation purposes only.
Professional Services and Other
Generally, the Company’s professional service arrangements are short-term in nature and not considered essential to the functionality of the Company’s software. Professional services are generally offered as consulting days, time and material and fixed-fee arrangements. Consulting days are recognized as revenue as the services are performed on an hourly basis or upon expiration of the service period. Time and material services are recognized as revenue as services are rendered based on inputs to the project, such as billable hours incurred. For fixed-fee professional service arrangements, the Company recognizes revenue under the proportional performance method of accounting and estimates the proportional performance on a monthly basis, utilizing hours incurred to date as a percentage of the total estimated hours to complete the project.
In cases where the Company has on premises perpetual or time-based license and professional services arrangements requiring significant customization and implementation that are considered essential to the functionality of the software, the arrangement is accounted for using contract accounting until the essential services are complete. If the Company can make reliable estimates of total project costs and the extent of progress toward completion, it applies the percentage-of-completion method in recognizing the arrangement fee.
Deferred Revenue
Deferred revenue primarily consists of billings or payments received in advance of revenue recognition from the Company’s product offerings described above and is recognized as the revenue recognition criteria are met. Deferred revenue that will be recognized during the following 12 months is recorded as a current liability and the remaining portion is recorded as noncurrent.
Deferred Cost of Revenue
Deferred cost of revenue primarily consists of direct costs for professional services from multiple-element arrangements either accounted for using the completed contract method or subject to acceptance. The direct costs are being recognized in proportion to the related revenue.
Product Warranties
The Company generally provides a warranty for its software products and services to its customers for periods ranging from one to six months. The Company’s software products are generally warranted to be free of defects in materials and workmanship under normal use and the products are also generally warranted to substantially perform as described in published documentation. The Company’s services are generally warranted to be performed in a professional manner and to materially conform to the specifications set forth in the related customer contract. In the event there is a failure of such warranties, the Company generally will correct the problem or provide a reasonable workaround or replacement product. If the Company cannot correct the problem or provide a workaround or replacement product, then the customer’s remedy is generally limited to refund of the fees paid for the nonconforming product or services. To date, the warranty expenses have been insignificant.
Sales Commissions
Sales commissions are recorded as a component of sales and marketing expenses and consist of the variable compensation paid to the Company’s sales force. Sales commissions are earned and recorded at the time that a customer has entered into a binding license, subscription or services agreement. Sales commission expense was $1.6 million, $2.5 million and $4.6 million for the years ended July 31, 2012, 2013 and 2014, respectively, and $1.8 million and $3.4 million for the six months ended January 31, 2014 and 2015, respectively.
F-13
Table of Contents
Research and Development
Research and development costs are expensed as incurred, except for certain internal-use software development costs, which may be capitalized as noted above.
Advertising
The Company expenses advertising costs as incurred as a component of sales and marketing expenses. The Company incurred advertising costs of $0.1 million, $0.1 million and $0.2 million for the years ended July 31, 2012, 2013 and 2014, respectively, and $63,000 and $58,000 for the six months ended January 31, 2014 and 2015, respectively.
Stock-based Compensation
The Company recognizes compensation expense for all stock-based awards, including stock options and restricted stock units (“RSUs”), based on the estimated fair value of the award on the grant date in the consolidated statements of comprehensive loss over the related vesting periods. The expense recorded is based on awards ultimately expected to vest and therefore is reduced by estimated forfeitures. Forfeitures are estimated at the time of grant and revised, if necessary, in subsequent periods if actual forfeitures differ from those estimates. The Company calculates the fair value of options using the Black-Scholes option pricing model and records expense using the straight-line attribution approach.
The determination of the grant-date fair value of options is affected by a number of complex and subjective variables, which include the Company’s fair value of common stock, expected term of the options, expected volatility, risk-free interest rates and expected dividends.
The Company accounts for equity awards issued to non-employees, such as consultants, in accordance with the guidance relating to equity instruments that are issued to other than employees for acquiring, or in conjunction with selling, goods or services, using the Black-Scholes option pricing model to determine the fair value of such instruments. Awards granted to non-employees are remeasured over the vesting period, and the resulting value is recorded as an expense over the period the services are received.
Segments
The Company operates its business as one operating segment. The Company’s chief operating decision maker is its Chief Executive Officer, who reviews financial information presented on a consolidated basis for purposes of making operating decisions, assessing financial performance and allocating resources.
Taxes
Income Taxes
The Company accounts for income taxes using the asset and liability approach. Deferred tax assets and liabilities are recognized for the future tax consequences attributable to differences between the financial statement carrying amounts of existing assets and liabilities and their respective tax bases and operating loss and tax credit carryforwards. Deferred tax assets and liabilities are measured using enacted tax rates expected to apply to taxable income in the years in which those temporary differences are expected to be recovered or settled. The Company evaluates the realizability of its deferred income tax assets and assesses the need for a valuation allowance on an ongoing basis. In evaluating its deferred income tax assets, the Company considers all available positive and negative evidence related to the likelihood of realization of the deferred tax assets to determine, based on the weight of available evidence, whether it is more likely than not that some or all of the deferred tax assets will not be realized.
F-14
Table of Contents
The Company has placed a full valuation allowance on its U.S. deferred tax assets as of July 31, 2014 because the realization of these tax benefits through future taxable income is not more likely than not as of July 31, 2014. The valuation allowance will be maintained until sufficient positive evidence exists to support the reversal of the valuation allowance. The Company makes estimates and judgments about its future taxable income that are based on assumptions that are consistent with the plans and estimates. Should the actual amounts differ from the estimates, the amount of the valuation allowance could be materially impacted.
The Company accounts for uncertain tax positions using a two-step approach for recognizing and measuring uncertain tax positions. Tax positions are evaluated for recognition by determining if the weight of available evidence indicates that it is probable that the position will be sustained on audit, including resolution of related appeals or litigation. Tax benefits are then measured as the largest amount which is more than 50% likely of being realized upon ultimate settlement. The Company considers many factors when evaluating and estimating tax positions and tax benefits, which may require periodic adjustments and which may not accurately anticipate actual outcomes.
The Company recognized potential accrued interest and penalties related to unrecognized tax benefits in tax expense.
Other Taxes
The Company conducts operations in many tax jurisdictions throughout the U.S. In many of these jurisdictions, non-income based taxes such as property taxes, sales and use taxes, and value-added taxes are assessed on the Company’s operations in that particular location. While the Company strives to ensure compliance with these various non-income based tax filing requirements, there have been instances where potential non-compliance exposures have been identified. In accordance with GAAP, the Company makes a provision for these exposures when it is both probable that a liability has been incurred and the amount of the exposure can be reasonably estimated. The Company believes that, as of July 31, 2013 and 2014 and January 31, 2015, it has adequately provided for such contingencies. However, it is possible that the Company’s results of operations, cash flows, and financial position could be harmed if one or more non-compliance tax exposures are asserted by any of the jurisdictions where the Company conducts its operations.
Commitments and Contingencies
Liabilities for loss contingencies arising from claims, assessments, litigation, fines and penalties and other sources are recorded when it is probable that a liability has been or will be incurred and the amount of the liability can be reasonably estimated. Legal costs incurred in connection with loss contingencies are expensed as incurred.
Recently Issued Accounting Standards
Going Concern: In August 2014, the Financial Accounting Standards Board (“FASB”) issued ASU No. 2014-15, Presentation of Financial Statements—Going Concern, which requires an entity to evaluate whether there is substantial doubt about its ability to continue as a going concern, and to provide related footnote disclosures. The new standard is effective for the Company for its fiscal year ending July 31, 2017. The Company is evaluating the effect of its pending adoption of ASU 2014-15 on its consolidated financial statements and related disclosures and does not expect it to have a material impact on its consolidated financial statements.
Share-Based Payments with Performance Targets: In June 2014, the FASB issued Accounting Standards Update No. 2014-12, Accounting for Share-Based Payments When the Terms of an Award Provide That a Performance Target Could Be Achieved after the Requisite Service Period (ASU 2014-12). ASU 2014-12 requires that a performance target that affects vesting and could be achieved after the requisite service period be treated as a performance condition. A reporting entity should apply existing guidance in ASC 718,
F-15
Table of Contents
Compensation—Stock Compensation, as it relates to such awards. ASU 2014-12 is effective for the Company in its first quarter of fiscal 2017 with early adoption permitted using either of two methods: (1) prospective to all awards granted or modified after the effective date; or (2) retrospective to all awards with performance targets that are outstanding as of the beginning of the earliest annual period presented in the financial statements and to all new or modified awards thereafter, with the cumulative effect of applying ASU 2014-12 as an adjustment to the opening retained earnings balance as of the beginning of the earliest annual period presented in the financial statements. The Company has elected to early adopt the new standard using the retrospective adoption method. The adoption of this standard did not have a material effect on its financial position.
Revenue Recognition: In May 2014, the FASB issued Accounting Standard Update No. 2014-09, Revenue from Contracts with Customers (ASU 2014-09), which requires an entity to recognize the amount of revenue to which it expects to be entitled for the transfer of promised goods or services to customers. ASU 2014-09 will replace most existing revenue recognition guidance in GAAP when it becomes effective. The new standard is effective for the Company in its first quarter of fiscal 2018. Early application is not permitted. The standard permits the use of either the retrospective or cumulative effect transition method. The Company is evaluating the effect that ASU 2014-09 will have on its consolidated financial statements and related disclosures. The Company has not yet selected a transition method nor has it determined the effect of the standard on its ongoing financial reporting.
(2) Acquisitions
Fiscal 2012 Acquisitions
Usergrid
On January 10, 2012, the Company acquired the assets of Usergrid, a sole proprietorship engaged in mobile app development and the provision of APIs for managing dates, users and events, for $140,000 in cash.
The following table summarizes the allocation of consideration to the fair value of the tangible and intangible assets acquired and liabilities assumed:
| (in thousands) | ||||
| Cash paid |
$ | 140 | ||
|
|
|
|||
| Identifiable intangible assets: |
||||
| Developed technology |
308 | |||
|
|
|
|||
| Total identifiable intangible assets |
308 | |||
|
|
|
|||
| Total fair value allocated to identifiable assets and liabilities |
308 | |||
|
|
|
|||
| Gain on bargain purchase |
(168 | ) | ||
|
|
|
|||
| Total purchase price |
$ | 140 | ||
|
|
|
|||
The Company determined that the transaction included a bargain purchase, or gain on the purchase, of $168,000, which was recorded in other income for the year ended July 31, 2012. The bargain purchase gain was primarily the result of contingent cash and restricted stock unit considerations payable to the former sole proprietor, which were excluded from the purchase price, as the payments were contingent on future employment and were recorded as compensation expense as earned. Intangible assets are being amortized on a straight-line basis over an estimated useful life of four years.
WAC Application Services, Ltd.
On July 14, 2012, the Company acquired WAC Application Services, Ltd. (“WAC”), a global alliance of leading telecommunications companies focused on creating a unified and open platform for mobile app development, for $1.5 million in cash.
F-16
Table of Contents
The following table summarizes the allocation of consideration to the fair value of the tangible and intangible assets acquired and liabilities assumed:
| (in thousands) | ||||
| Cash paid |
$ | 1,500 | ||
|
|
|
|||
| Cash and other current assets acquired |
13,095 | |||
| Property and equipment |
632 | |||
| Identifiable intangible assets: |
||||
| Developed technology |
120 | |||
| Favorable lease contract |
30 | |||
|
|
|
|||
| Total identifiable intangible assets |
150 | |||
|
|
|
|||
| Debt and liabilities assumed |
(11,111 | ) | ||
|
|
|
|||
| Total fair value allocated to identifiable assets and liabilities |
2,766 | |||
|
|
|
|||
| Gain on bargain purchase |
(1,266 | ) | ||
|
|
|
|||
| Total purchase price |
$ | 1,500 | ||
|
|
|
|||
The Company determined that the transaction included a bargain purchase, or gain on the purchase, of $1.3 million, which was recorded in other income for the year ended July 31, 2012. The Company believes that it was able to acquire WAC for less than fair value of its net assets, as the former owners of the business were a global technology cooperative of major telecommunications companies with the goal of creating an open uniform platform for mobile app development. The owners were willing to accept less than fair value of the net assets, primarily comprised of current assets and fixed assets, as they believed that the Company could be more effective and efficient in meeting this objective. Intangible assets are being amortized on a straight-line basis over estimated useful lives ranging from two to four years.
InstaOps, Inc.
On July 18, 2012, the Company acquired InstaOps, Inc. (“InstaOps”), a provider of a cloud service and software development kits (“SDK”), for $160,000 in cash.
The following table summarizes the allocation of consideration to the fair value of the tangible and intangible assets acquired and liabilities assumed:
| (in thousands) | ||||
| Cash paid |
$ | 160 | ||
|
|
|
|||
| Identifiable intangible assets: |
||||
| Developed technology |
276 | |||
|
|
|
|||
| Total identifiable intangible assets |
276 | |||
|
|
|
|||
| Total fair value allocated to identifiable assets and liabilities |
276 | |||
|
|
|
|||
| Gain on bargain purchase |
(116 | ) | ||
|
|
|
|||
| Total purchase price |
$ | 160 | ||
|
|
|
|||
The Company determined that the transaction included a bargain purchase, or gain on the purchase, of $116,000, which was recorded in other income for the year ended July 31, 2012. The bargain purchase gain was primarily the result of contingent cash and restricted stock unit considerations payable to the former owners, which were excluded from the purchase price, as the payment was contingent on future employment. Intangible assets are being amortized on a straight-line basis over an estimated useful life of four years.
F-17
Table of Contents
The financial results of fiscal 2012 acquisitions are included in the Company’s consolidated results from their respective acquisition dates. The Company’s business combinations completed in fiscal 2012 did not have a material impact on the Company’s consolidated financial statements, and therefore pro forma disclosures have not been presented.
Fiscal 2014 Acquisitions
InsightsOne Systems, Inc.
On December 19, 2013, the Company acquired all of the outstanding shares of InsightsOne Systems, Inc. (“InsightsOne”), a provider of on-premises and cloud-based consumer lifecycle predictive analytics. This acquisition is expected to enhance the API platform capabilities to further analyze and find patterns in consumer data across multiple channels. The Company issued 3,887,736 shares of Series G convertible preferred stock, 5,181,757 shares of Series G-1 convertible preferred stock, and 125,176 RSUs in exchange for all of the outstanding preferred stock, common stock and unvested stock options outstanding of InsightsOne.
The acquisition date fair value of the purchase consideration totaled $17.1 million, which consisted of the following:
| (in thousands) | ||||
| Series G convertible preferred stock |
$ | 9,603 | ||
| Series G-1 convertible preferred stock |
7,421 | |||
| Restricted stock units |
31 | |||
|
|
|
|||
| Total purchase price |
$ | 17,055 | ||
|
|
|
|||
For several employees, the Series G-1 convertible preferred stock is subject to certain post-acquisition vesting terms. The total fair value of the Series G-1 convertible preferred stock exchanged for post-combination service was $4.3 million and will be expensed over the remaining vesting terms of the award, with a weighted-average period of 2.93 years. The RSUs are subject to a time-based vesting condition and a performance-based vesting condition, including the completion of the Company’s initial public offering, both of which must be satisfied before the RSUs are vested and settled for shares of common stock. The total fair value of the RSUs exchanged for post-combination service was determined to be $90,000 and the Company will record the vested portion of the expense upon the satisfaction of the above conditions.
The following table summarizes the allocation of consideration to the fair value of the tangible and intangible assets acquired and liabilities assumed:
| (in thousands) | ||||
| Cash and other current assets acquired |
$ | 579 | ||
| Property and equipment |
27 | |||
| Identifiable intangible assets: |
||||
| Developed technology |
4,540 | |||
| Customer relationships |
150 | |||
| Backlog |
53 | |||
|
|
|
|||
| Total identifiable intangible assets |
4,743 | |||
| Debt and liabilities assumed |
(3,038 | ) | ||
|
|
|
|||
| Total fair value allocated to identifiable assets and liabilities |
2,311 | |||
| Goodwill |
14,744 | |||
|
|
|
|||
| Total purchase price |
$ | 17,055 | ||
|
|
|
|||
Goodwill represents the excess of the purchase price over the fair value of the net tangible and identifiable intangible assets acquired. Among the factors that contributed to a purchase price in excess of the fair value of
F-18
Table of Contents
the net tangible and intangible assets were the expected synergies that can be leveraged by the Company and the acquisition of an assembled workforce of experienced software engineers. None of the goodwill is expected to be deductible for income tax purposes. The Company estimated the fair value of the developed technology using a discounted cash flow model, which included royalty and discount rate assumptions. The fair value of customer relationships were estimated using the cost approach, which included assumptions related to the estimated cost to recreate the asset. Intangible assets are being amortized on a straight-line basis over estimated useful lives ranging from less than one year to five years. Debt and liabilities include a $2.0 million growth capital loan assumed by the Company. The Company incurred acquisition-related transaction costs of approximately $368,000 for the year ended July 31, 2014, which were included in general and administrative expenses. The financial results of InsightsOne are included in the Company’s consolidated results from the acquisition date. These results were not material to the Company’s consolidated financial statements.
The following unaudited pro forma financial information presents the combined results of operations for the Company and InsightsOne as if the acquisition had occurred at the beginning of each of the periods presented, and includes pro forma adjustments related to the amortization of acquired intangible assets, stock-based compensation expense, and direct and incremental transaction costs. The unaudited pro forma financial information combines the historical results of the Company for the years ended July 31, 2013 and 2014 and the historical results of InsightsOne, which have been conformed to match the Company’s reporting periods. The unaudited pro forma financial information has been prepared for comparative purposes only and is not necessarily indicative of the actual operating results that would have been recorded had the acquisition actually taken place at the beginning of each of the periods presented, or of future consolidated operating results. Additionally, the unaudited pro forma financial results do not include any anticipated synergies or other expected benefits from the acquisition.
| Year Ended July 31, | ||||||||
| 2013 | 2014 | |||||||
| (unaudited and in thousands) | ||||||||
| Revenue |
$ | 43,723 | $ | 53,256 | ||||
| Net loss |
$ | (32,432 | ) | $ | (62,999 | ) | ||
(3) Goodwill and Intangible Assets
The following table provides a summary of changes in the carrying amount of the Company’s goodwill:
| Year Ended July 31, | Six Months
Ended January 31, 2015 |
|||||||||||||||
| 2012 | 2013 | 2014 | ||||||||||||||
| (unaudited) | ||||||||||||||||
| (in thousands) | ||||||||||||||||
| Balance at beginning of period |
$ | — | $ | — | $ | — | $ | 14,744 | ||||||||
| Acquisition |
— | — | 14,744 | — | ||||||||||||
|
|
|
|
|
|
|
|
|
|||||||||
| Balance at end of period |
$ | — | $ | — | $ | 14,744 | $ | 14,744 | ||||||||
|
|
|
|
|
|
|
|
|
|||||||||
The following tables provide a summary of the carrying amount and accumulated amortization of the Company’s intangible assets:
| July 31, 2013 |
Amortization Period |
Gross Amount |
Accumulated Amortization |
Net Carrying Value |
||||||||||
| (dollars in thousands) | ||||||||||||||
| Developed technology |
48 months | $ | 704 | $ | (225 | ) | $ | 479 | ||||||
| Favorable lease contract |
28 months | 30 | (13 | ) | 17 | |||||||||
|
|
|
|
|
|
|
|||||||||
| Total |
$ | 734 | $ | (238 | ) | $ | 496 | |||||||
|
|
|
|
|
|
|
|||||||||
F-19
Table of Contents
| July 31, 2014 |
Amortization Period |
Gross Amount |
Accumulated Amortization |
Net Carrying Value |
||||||||||
| (dollars in thousands) | ||||||||||||||
| Developed technology |
48-60 months | $ | 5,244 | $ | (960 | ) | $ | 4,284 | ||||||
| Customer relationships |
12 months | 150 | (92 | ) | 58 | |||||||||
| Backlog |
<12 months | 53 | (53 | ) | — | |||||||||
|
|
|
|
|
|
|
|||||||||
| Total |
$ | 5,447 | $ | (1,105 | ) | $ | 4,342 | |||||||
|
|
|
|
|
|
|
|||||||||
| January 31, 2015 |
Amortization Period |
Gross Amount |
Accumulated Amortization |
Net Carrying Value |
||||||||||
| (unaudited) | ||||||||||||||
| (dollars in thousands) | ||||||||||||||
| Developed technology |
48-60 months | $ | 5,244 | $ | (1,502 | ) | $ | 3,742 | ||||||
| Customer Relationships |
12 months | 150 | (150 | ) | — | |||||||||
|
|
|
|
|
|
|
|||||||||
| Total |
$ | 5,394 | $ | (1,652 | ) | $ | 3,742 | |||||||
|
|
|
|
|
|
|
|||||||||
Amortization expense was $49,000, $0.2 million and $0.9 million for the years ended July 31, 2012, 2013 and 2014, respectively, and $0.2 million and $0.6 million for the six months ended January 31, 2014 and 2015, respectively. Expected future amortization expense as of July 31, 2014 is as follows:
| Amount | ||||
| (in thousands) | ||||
| 2015 |
$ | 1,142 | ||
| 2016 |
1,035 | |||
| 2017 |
908 | |||
| 2018 |
908 | |||
| 2019 |
349 | |||
|
|
|
|||
| Total |
$ | 4,342 | ||
|
|
|
|||
(4) Fair Value Measurements
The following table sets forth the fair value of the Company’s financial assets and liabilities that were measured on a recurring basis:
| As of July 31, 2013 | ||||||||||||||||
| Level I | Level II | Level III | Total | |||||||||||||
| (in thousands) | ||||||||||||||||
| Financial Assets |
||||||||||||||||
| Money market funds |
$ | 44,068 | $ | — | $ | — | $ | 44,068 | ||||||||
|
|
|
|
|
|
|
|
|
|||||||||
| Reported as: |
||||||||||||||||
| Cash and cash equivalents |
$ | 44,068 | ||||||||||||||
|
|
|
|||||||||||||||
| Financial Liability |
||||||||||||||||
| Common stock warrant liability |
$ | — | $ | — | $ | 1,254 | $ | 1,254 | ||||||||
|
|
|
|
|
|
|
|
|
|||||||||
| Reported as: |
||||||||||||||||
| Other current liabilities |
$ | 1,254 | ||||||||||||||
|
|
|
|||||||||||||||
F-20
Table of Contents
| As of July 31, 2014 | ||||||||||||||||
| Level I | Level II | Level III | Total | |||||||||||||
| (in thousands) | ||||||||||||||||
| Financial Assets |
||||||||||||||||
| Money market funds |
$ | 51,258 | $ | — | $ | — | $ | 51,258 | ||||||||
|
|
|
|
|
|
|
|
|
|||||||||
| Reported as: |
||||||||||||||||
| Cash and cash equivalents |
$ | 51,258 | ||||||||||||||
|
|
|
|||||||||||||||
| Financial Liability |
||||||||||||||||
| Common stock warrant liability |
$ | — | $ | — | $ | — | $ | — | ||||||||
|
|
|
|
|
|
|
|
|
|||||||||
| Reported as: |
||||||||||||||||
| Other current liabilities |
$ | — | ||||||||||||||
|
|
|
|||||||||||||||
| As of January 31, 2015 | ||||||||||||||||
| Level I | Level II | Level III | Total | |||||||||||||
| (unaudited) | ||||||||||||||||
| (in thousands) | ||||||||||||||||
| Financial Assets |
||||||||||||||||
| Money market funds |
$ | 28,347 | $ | — | $ | — | $ | 28,347 | ||||||||
|
|
|
|
|
|
|
|
|
|||||||||
| Reported as: |
||||||||||||||||
| Cash and cash equivalents |
$ | 28,347 | ||||||||||||||
|
|
|
|||||||||||||||
| Financial Liability |
||||||||||||||||
| Common stock warrant liability |
$ | — | $ | — | $ | — | $ | — | ||||||||
|
|
|
|
|
|
|
|
|
|||||||||
| Reported as: |
||||||||||||||||
| Other current liabilities |
$ | — | ||||||||||||||
|
|
|
|||||||||||||||
Refer to Note 5 for additional quantitative information regarding the common stock warrants. A summary of changes in the fair value of the Company’s Level III financial liability related to the common stock warrants as of July 31, 2013 and 2014 is as follows:
| Year Ended July 31, | ||||||||
| 2013 | 2014 | |||||||
| (in thousands) | ||||||||
| Fair value, beginning of period |
$ | — | $ | 1,254 | ||||
| Issuance of common stock warrants |
336 | — | ||||||
| Change in fair value of Level III liabilities |
918 | 1,584 | ||||||
| Exercise of common stock warrants |
— | (2,838 | ) | |||||
|
|
|
|
|
|||||
| Fair value, end of period |
$ | 1,254 | $ | — | ||||
|
|
|
|
|
|||||
(5) Customer Common Stock Warrants
On February 14, 2013, the Company issued to one of its customers a warrant to purchase 3,198,851 shares of common stock with an exercise price of $0.20 per share. The warrant was provided as a sales incentive and recorded as an offset to the amount of revenue recognized by the customer. The warrant vests 50% upon achievement of each of two performance milestones. Both performance milestones are based on achieving certain targets and both were met as of July 31, 2013. The warrant agreement had an anti-dilution clause whereby, if a financing event occurred prior to December 31, 2013, the Company was obligated to issue additional warrants to the customer equal to 2% of the Company’s outstanding shares on a fully diluted basis. A financing event was defined as a sale of equity securities for capital raising purposes during the period beginning on the date of the issue of the warrants until December 31, 2013.
F-21
Table of Contents
On July 26, 2013, as a result of the Company’s Series G preferred stock financing, the Company issued warrants to purchase an additional 486,633 shares of the Company’s common stock with an exercise price of $0.20 per share to the customer based on the terms of the warrant agreement described above. On December 17, 2013, the customer net exercised the warrants and such warrants were not outstanding as of July 31, 2014.
Due to the anti-dilution provision of the warrants, the fair value of the outstanding warrants was classified within current liabilities on the consolidated balance sheets, and any changes in fair value were recognized as a reduction of revenue prior to the achievement of the performance milestones and as a component of other income (expense), net after both milestones were met, in its consolidated statements of comprehensive loss. The Company recorded $0.9 million related to the revaluation of the warrants during fiscal 2013, of which $0.8 million was recorded as a reduction of revenue and $0.1 million was included in other income (expense), net. During fiscal 2014 the Company performed the final remeasurement of the warrants prior to its exercise on December 17, 2013 and recorded an expense of $1.6 million, which was included in other income (expense), net.
The Company determined the fair value of warrants on the issuance date and subsequent reporting dates using the Black-Scholes pricing model utilizing the assumptions noted below. The expected term of the warrants was based on the remaining contractual expiration period. The expected stock price volatility for the Company’s stock was determined by examining the historical volatilities of a group of its industry peers as it did not have any trading history of its common stock. The risk-free interest rate was calculated using the average of the published interest rates for U.S. Treasury zero-coupon issues with maturities that approximate the expected term. The dividend yield assumption is zero, as the Company does not have any history of, nor plans for, dividend payments.
The following assumptions were used to estimate the fair value of the common stock warrants:
| Year Ended July 31, | ||||
| 2013 | 2014 | |||
| Expected volatility |
36.0 – 40.0% | 34.9 – 37.0% | ||
| Risk-free rate |
0.11 – 0.17% | 0.07 – 0.11% | ||
| Dividend yield |
0% | 0% | ||
| Expected term (in years) |
0.67 – 1.12 | 0.28 – 0.41 | ||
| Fair value of common stock |
$0.23 – $0.54 | $0.54 – $0.97 | ||
(6) Balance Sheet Components
Prepaid Expenses and Other Current Assets
Prepaid expenses and other current assets consisted of the following:
| July 31, | January
31, 2015 |
|||||||||||
| 2013 | 2014 | |||||||||||
| (unaudited) | ||||||||||||
| (in thousands) | ||||||||||||
| Prepaid expenses |
$ | 1,322 | $ | 1,635 | $ | 1,352 | ||||||
| Deferred offering costs |
— | — | 2,146 | |||||||||
| Prepaid hosting costs |
1,277 | 1,760 | 1,514 | |||||||||
| Other |
763 | 1,138 | 736 | |||||||||
|
|
|
|
|
|
|
|||||||
| $ | 3,362 | $ | 4,533 | $ | 5,748 | |||||||
|
|
|
|
|
|
|
|||||||
F-22
Table of Contents
Property and Equipment, Net
Property and equipment are stated at cost, net of accumulated depreciation and amortization. These assets are depreciated and amortized using the straight-line method over the estimated useful lives. Property and equipment, net consisted of the following:
| July 31, | January
31, 2015 |
|||||||||||
| 2013 | 2014 | |||||||||||
| (unaudited) | ||||||||||||
| (in thousands) | ||||||||||||
| Computer equipment and software |
$ | 1,691 | $ | 2,538 | $ | 2,662 | ||||||
| Furniture and fixtures |
242 | 662 | 668 | |||||||||
| Leasehold improvements |
760 | 2,076 | 2,357 | |||||||||
|
|
|
|
|
|
|
|||||||
| 2,693 | 5,276 | 5,687 | ||||||||||
| Less: accumulated depreciation and amortization |
(1,351 | ) | (1,802 | ) | (2,397 | ) | ||||||
|
|
|
|
|
|
|
|||||||
| $ | 1,342 | $ | 3,474 | $ | 3,290 | |||||||
|
|
|
|
|
|
|
|||||||
Total depreciation expense for the years ended July 31, 2012, 2013 and 2014 was $0.3 million, $1.0 million and $1.2 million, respectively, and for the six months ended January 31, 2014 and 2015 was $0.5 million and $0.6 million, respectively.
Accrued Liabilities
Accrued expenses and other current liabilities consisted of the following:
| July 31, | January
31, 2015 |
|||||||||||
| 2013 | 2014 | |||||||||||
| (unaudited) | ||||||||||||
| (in thousands) | ||||||||||||
| Accrued payroll and benefits |
$ | 639 | $ | 1,025 | $ | 967 | ||||||
| Accrued bonus and commission |
1,268 | 2,522 | 2,571 | |||||||||
| Accrued sales, service and income taxes |
1,504 | 2,140 | 2,393 | |||||||||
| Common stock warrants |
1,254 | — | — | |||||||||
| Other |
1,164 | 1,707 | 2,810 | |||||||||
|
|
|
|
|
|
|
|||||||
| $ | 5,829 | $ | 7,394 | $ | 8,741 | |||||||
|
|
|
|
|
|
|
|||||||
Deferred Revenue
Deferred revenue consisted of the following:
| July 31, | January
31, 2015 |
|||||||||||
| 2013 | 2014 | |||||||||||
| (unaudited) | ||||||||||||
| (in thousands) | ||||||||||||
| Deferred revenue: |
||||||||||||
| License |
$ | 2,187 | $ | 5,476 | $ | 3,875 | ||||||
| Subscription and support |
10,316 | 19,372 | 25,671 | |||||||||
| Professional services and other |
4,621 | 3,342 | 3,647 | |||||||||
|
|
|
|
|
|
|
|||||||
| Total deferred revenue |
17,124 | 28,190 | 33,193 | |||||||||
| Less: current portion of deferred revenue |
14,233 | 23,356 | 28,380 | |||||||||
|
|
|
|
|
|
|
|||||||
| Non-current portion of deferred revenue |
$ | 2,891 | $ | 4,834 | $ | 4,813 | ||||||
|
|
|
|
|
|
|
|||||||
F-23
Table of Contents
(7) Income Taxes
Loss before provision for income taxes consisted of the following for the periods shown below:
| Year Ended July 31, | ||||||||||||
| 2012 | 2013 | 2014 | ||||||||||
| (in thousands) | ||||||||||||
| United States |
$ | (8,414 | ) | $ | (26,074 | ) | $ | (61,957 | ) | |||
| International |
500 | 476 | 1,556 | |||||||||
|
|
|
|
|
|
|
|||||||
| Total |
$ | (7,914 | ) | $ | (25,598 | ) | $ | (60,401 | ) | |||
|
|
|
|
|
|
|
|||||||
Income tax expense consisted of the following for the periods shown below:
| Year Ended July 31, | ||||||||||||
| 2012 | 2013 | 2014 | ||||||||||
| (in thousands) | ||||||||||||
| Current income tax provision: |
||||||||||||
| Federal |
$ | — | $ | — | $ | — | ||||||
| State |
4 | 6 | — | |||||||||
| Foreign |
157 | 177 | 476 | |||||||||
|
|
|
|
|
|
|
|||||||
| Total current tax provision |
$ | 161 | $ | 183 | $ | 476 | ||||||
|
|
|
|
|
|
|
|||||||
| Deferred income tax provision |
||||||||||||
| Federal |
— | — | — | |||||||||
| State |
— | — | (96 | ) | ||||||||
| Foreign |
206 | 90 | 12 | |||||||||
|
|
|
|
|
|
|
|||||||
| Total deferred tax provision |
206 | 90 | (84 | ) | ||||||||
|
|
|
|
|
|
|
|||||||
| Total income tax provision |
$ | 367 | $ | 273 | $ | 392 | ||||||
|
|
|
|
|
|
|
|||||||
For the fiscal years ended July 31, 2012, 2013 and 2014, the Company’s tax provision consisted principally of state and foreign income tax expense.
The reconciliation of federal statutory income tax provision to the Company’s effective income tax provision is as follows:
| Year Ended July 31, | ||||||||||||
| 2012 | 2013 | 2014 | ||||||||||
| (in thousands) | ||||||||||||
| Expected provision at U.S. federal statutory rate |
$ | (2,691 | ) | $ | (8,703 | ) | $ | (20,536 | ) | |||
| State income taxes—net of federal benefit |
3 | 4 | (96 | ) | ||||||||
| Stock options |
51 | 100 | 98 | |||||||||
| Common stock warrant |
— | 383 | 63 | |||||||||
| Tax credits |
82 | (629 | ) | (225 | ) | |||||||
| Foreign tax rate differential |
(8 | ) | 216 | (67 | ) | |||||||
| Bargain purchase gain |
(249 | ) | — | — | ||||||||
| Acquisition costs |
— | — | 125 | |||||||||
| Change in valuation allowance |
3,078 | 8,894 | 20,790 | |||||||||
| Other |
101 | 8 | 240 | |||||||||
|
|
|
|
|
|
|
|||||||
| Total tax provision |
$ | 367 | $ | 273 | $ | 392 | ||||||
|
|
|
|
|
|
|
|||||||
The income tax provision for the six months ended January 31, 2014 and 2015, differed from amounts computed by applying the U.S. federal income tax rate to pre-tax loss primarily as a result of the valuation allowance recorded against its U.S. net operating losses generated in the periods.
F-24
Table of Contents
Deferred tax assets and liabilities consisted of the following:
| July 31, | ||||||||
| 2013 | 2014 | |||||||
| (in thousands) | ||||||||
| Deferred tax assets: |
||||||||
| Net operating loss carryforwards |
$ | 30,375 | $ | 54,343 | ||||
| Accrued liabilities |
1,126 | 2,142 | ||||||
| Tax credit carryforwards |
1,825 | 2,389 | ||||||
| Fixed assets |
106 | 106 | ||||||
| Deferred revenue |
1,203 | 452 | ||||||
| Stock-based compensation |
68 | 315 | ||||||
| Other |
2 | 1 | ||||||
| Valuation allowance |
(34,680 | ) | (58,268 | ) | ||||
|
|
|
|
|
|||||
| Total deferred tax assets |
25 | 1,480 | ||||||
|
|
|
|
|
|||||
| Deferred tax liabilities: |
||||||||
| Intangible assets |
(6 | ) | (1,436 | ) | ||||
|
|
|
|
|
|||||
| Total deferred tax liabilities |
(6 | ) | (1,436 | ) | ||||
|
|
|
|
|
|||||
| Net deferred tax assets |
$ | 19 | $ | 44 | ||||
|
|
|
|
|
|||||
| July 31, | ||||||||
| 2013 | 2014 | |||||||
| (in thousands) | ||||||||
| Recorded as: |
||||||||
| Current deferred tax assets |
$ | 2,159 | $ | 2,174 | ||||
| Current valuation allowance |
(2,148 | ) | (2,111 | ) | ||||
| Non-current deferred tax assets |
32,565 | 56,190 | ||||||
| Non-current valuation allowance |
(32,532 | ) | (56,157 | ) | ||||
| Non-current deferred tax liabilities |
(25 | ) | (52 | ) | ||||
|
|
|
|
|
|||||
| Net deferred tax assets |
$ | 19 | $ | 44 | ||||
|
|
|
|
|
|||||
The Company evaluates the need for a valuation allowance against its deferred tax assets on a regular basis. In evaluating its ability to recover its deferred tax assets, the Company considers all available positive and negative evidence, including operating results, history of losses, and forecasts of future taxable income in various U.S. and foreign jurisdictions. Accordingly, the U.S. net deferred tax assets have been fully offset by a valuation allowance. A valuation allowance has not been recorded on certain foreign deferred net tax assets because of the existence of future taxable income. The valuation allowance increased by $10.4 million and $23.6 million, respectively, during the years ended July 31, 2013 and 2014.
As of July 31, 2013 and 2014, the Company had net operating loss carryforwards for federal income tax purposes of $76.5 million and $143.4 million, respectively, which expire in the years 2024 through 2034. As of July 31, 2013 and 2014, the Company had net operating loss carryforwards for California state income tax purposes of $69.3 million and $81.1 million, respectively, which expire in the years 2015 through 2034. As of July 31, 2013 and 2014, the Company had R&D credit carryforwards for federal income tax purposes of $1.6 million and $2.0 million, respectively, which expire in the years 2024 through 2034. As of July 31, 2013 and 2014, the Company had R&D credit carryforwards for California income tax purposes of $1.2 million and $1.8 million, respectively, which have no expiration date.
The Code, as amended, imposes restrictions on the utilization of net operating losses in the event of an “ownership change” of a corporation. Accordingly, a company’s ability to use net operating losses may be limited as prescribed under Internal Revenue Code Section 382 (“IRC Section 382”). Events which may cause
F-25
Table of Contents
limitations in the amount of the net operating losses that the Company may use in any one year include, but are not limited to, a cumulative ownership change of more than 50% over a three-year period. Utilization of the federal and state net operating losses may be subject to substantial annual limitation due to the ownership change limitations provided by the IRC Section 382 and similar state provisions. No analysis was conducted through July 31, 2014 to determine whether an ownership change had occurred since inception. In the event the Company has changes in ownership, net operating losses and research and development credit carryovers could be limited and may expire unutilized.
The Company files U.S. federal, states and foreign income tax returns. In the normal course of business, the Company is subject to examination by taxing authorities. The Company is currently being audited by the India taxing authorities related to transfer pricing. Management has recorded a long-term tax liability for uncertain tax positions, including accrued interest and penalties.
Uncertain Income Tax Positions
The Company accounts for uncertainty in income taxes by determining whether it is more likely than not that a tax position will be sustained upon examination by the appropriate taxing authorities before any part of the benefit can be recorded in the consolidated financial statements.
The following table summarizes the activity related to the Company’s unrecognized tax benefits:
| July 31, | ||||||||
| 2013 | 2014 | |||||||
| (in thousands) | ||||||||
| Balance at beginning of year |
$ | 747 | $ | 1,033 | ||||
| Increase related to prior year tax positions |
68 | 1 | ||||||
| Decrease related to prior year tax positions |
(30 | ) | — | |||||
| Increase related to current year tax positions |
248 | 239 | ||||||
| Settlements with tax authorities |
— | — | ||||||
| Decrease related to lapse of statute of limitations |
— | — | ||||||
|
|
|
|
|
|||||
| Balance at end of year |
$ | 1,033 | $ | 1,273 | ||||
|
|
|
|
|
|||||
If the gross unrecognized tax benefits at July 31, 2014 were recognized, $0.3 million of the recognition would affect the income tax rate. The Company is unable to make a reasonably reliable estimate as to when cash settlement with a taxing authority may occur. It is reasonably possible that the total amount of unrecognized tax benefits will increase or decrease in the next 12 months.
The Company also recognizes interest and penalties accrued in relation to unrecognized tax benefits as a tax expense. For the years ended July 31, 2012, 2013 and 2014, the Company recorded charges to tax expense of $129,000, $39,000 and $39,000 for interest and penalties, respectively. As of July 31, 2013 and 2014, the Company had $0.5 million and $0.5 million, respectively, of accrued interest and penalties, which are included in non-current income tax liabilities in the consolidated balance sheets.
(8) Long-term Debt
In May 2012, the Company entered into a Loan and Security Agreement with Silicon Valley Bank (“SVB”), which was amended and restated in November 2014 (see Note 16) (“Loan Agreement”). The loan agreement provides the Company with the ability to borrow up to $25.0 million through a $12.5 million revolving line of credit subject to an accounts receivable borrowing base, which refinanced and replaced the existing revolving line in its entirety and $12.5 million term loan. The Company can draw upon the revolving line of credit through
F-26
Table of Contents
October 31, 2017, and the revolving loans bear interest at a rate equal to prime plus 1.5% per annum (4.75% at January 31, 2015). Outstanding revolving loans are limited to the lesser of $12.5 million or 80% of the balance of certain eligible customer accounts receivable. The term loan is available in two tranches. The first tranche, Tranche A, in an aggregate principal amount of $4.0 million, refinanced and replaced the existing term loan and existing growth capital loan in their entirety. The principal amount of Tranche A is payable in equal monthly installments over a 30-month period with the last payment due no later than May 31, 2017. The second tranche, Tranche B, in an aggregate principal amount of up to $8.5 million, is available to borrow through May 31, 2016. Tranche B has interest only payments during such draw period and then the principal is payable in equal monthly installments thereafter over a 24-month period. An end-of-term payment of $156,250 will become due upon the final payment of Tranche A, or Tranche B, if applicable. The Company is permitted to prepay all term loans without premium or penalty. The existing equipment term loan is fully funded and not available for further draws under the amendment and the Company will continue to repay the outstanding principal in monthly installments, plus interest at a rate equal to prime plus 2.0% per annum (5.25% at January 31, 2015), with the last payment due in June 2017.
Prior to the amendment and restatement, the agreement provided the Company with the ability to borrow up to $11.5 million through a $6.0 million revolving line of credit subject to an accounts receivable borrowing base, a $4.0 million term loan facility and a $1.5 million equipment term loan. The Company had the ability to draw upon the revolving line of credit through April 2016 at a floating interest rate equal to prime plus 1.5% per annum (4.75% at July 31, 2014). The amount outstanding on the revolving line of credit was limited to the lesser of $6.0 million or 80% of the balance of certain eligible customer receivable accounts. The interest rate on the term loans was 6.5% per annum, payable monthly in arrears, and the outstanding principal was payable in equal monthly installments over a 30-month period with the last payment due in November 2015. The interest rate on the equipment loan was a floating rate equal to prime plus 2.0% per annum (5.25% at July 31, 2014 and January 31, 2015) and the outstanding principal was payable in monthly installments over a 36-month period with the last payment due in June 2017.
In December 2013, in connection with the acquisition of InsightsOne, the Company entered into another amendment to the Loan and Security Agreement and an Assignment and Assumption Agreement with SVB whereby the Company assumed the payment obligations of the InsightsOne growth capital loan with an outstanding loan balance of $2.0 million per a Loan and Security Agreement between InsightsOne and SVB dated April 19, 2013. The interest rate on the growth capital loan was equal to prime plus 1.5% per annum (4.75% at July 31, 2014) and the outstanding principal was payable in equal monthly installments over a 36-month period with the last payment due in December 2016.
The Loan and Security Agreement contains customary affirmative covenants and certain financial and negative covenants, including restrictions on disposing of assets, entering into change of control transactions, mergers or acquisitions, incurring additional indebtedness, granting liens on our assets and paying dividends. The Company is required to maintain minimum revenue on a rolling two quarter basis that is not less than 80% of its projected revenues for each period. The Company has pledged substantially all of its assets, other than its intellectual property, as collateral under the loan and security agreement. As of October 31, 2012, the Company was not in compliance with the required minimum revenue financial covenant, which would have allowed SVB to declare all outstanding amounts due and payable and to terminate the loan facility. However, SVB waived this
F-27
Table of Contents
covenant breach in December 2012. As of July 31, 2013 and 2014 and January 31, 2015, the Company was in compliance with all loan covenants. The Company’s outstanding loan balances as of July 31, 2013 and 2014 and January 31, 2015 are summarized as follows:
| July 31, | January
31, 2015 |
|||||||||||
| 2013 | 2014 | |||||||||||
| (unaudited) | ||||||||||||
| (in thousands) | ||||||||||||
| Silicon Valley Bank term loan |
$ | 3,735 | $ | 2,204 | $ | 3,733 | ||||||
| Silicon Valley Bank growth capital loan |
— | 1,611 | — | |||||||||
| Silicon Valley Bank equipment loan |
— | 1,459 | 1,208 | |||||||||
|
|
|
|
|
|
|
|||||||
| Total principal amount |
3,735 | 5,274 | 4,941 | |||||||||
| Less: Unamortized discount |
(54 | ) | (31 | ) | (42 | ) | ||||||
|
|
|
|
|
|
|
|||||||
| Total debt |
3,681 | 5,243 | 4,899 | |||||||||
| Less: current portion |
(1,509 | ) | (2,778 | ) | (2,071 | ) | ||||||
|
|
|
|
|
|
|
|||||||
| Non-current debt, excluding current portion |
$ | 2,172 | $ | 2,465 | $ | 2,828 | ||||||
|
|
|
|
|
|
|
|||||||
The future principal maturities of debt as of July 31, 2014 are as follows:
| (in thousands) | ||||
| 2015 |
$ | 2,802 | ||
| 2016 |
1,736 | |||
| 2017 |
736 | |||
|
|
|
|||
| Total |
$ | 5,274 | ||
|
|
|
|||
In connection with the Loan and Security Agreement, the Company issued warrants (“SVB warrants”) to purchase 300,000 shares and 200,000 shares of common stock during the years ended July 31, 2012 and July 31, 2013, respectively. Warrants to purchase 315,000 shares have an exercise price of $0.09 per share and expire in May 2022. Warrants to purchase 185,000 shares have an exercise price of $0.48 per share and expire in May 2022. The fair value of the SVB warrants was determined using the Black-Scholes option valuation model. The total fair value of the warrants was recorded as a debt discount for the years ended July 31, 2012 and 2013, which is being amortized over the term of the loan. As of July 31, 2014 and January 31, 2015, all 500,000 of these warrants to purchase shares of common stock remained outstanding and exercisable.
In connection with the amendment and restatement of the Loan and Security Agreement with SVB in November 2014, the Company issued warrants to purchase 26,562 shares of common stock with an exercise price of $1.80 per share and expiration in November 2024; and upon funding of Tranche B, the Company will issue warrants to purchase 79,687 shares of common stock with an exercise price of $1.80 per share and expiration in November 2024. As of January 31, 2015, all 26,562 of these warrants to purchase shares of common stock remained outstanding and exercisable.
The following assumptions were used to estimate the fair value of the SVB warrants:
| Year Ended July 31, | Six Months Ended January 31, 2015 |
|||||||||||
| 2012 | 2013 | |||||||||||
| Expected volatility |
66.0 | % | 59.0% – 62.0 | % | 42.0 | % | ||||||
| Risk-free interest rate |
2.0 | % | 1.5% – 1.9 | % | 2.3 | % | ||||||
| Dividend yield |
0 | % | 0 | % | 0 | % | ||||||
| Expected term (in years) |
10.0 | 8.9 – 9.6 | 10.0 | |||||||||
F-28
Table of Contents
(9) Commitments and Contingencies
Leases
The Company leases office space in San Jose, California; London, England; and Bangalore, India under non-cancelable operating leases with various expiration dates through 2019. Rent expense was $0.8 million, $1.6 million and $2.5 million for the years ended July 31, 2012, 2013 and 2014, respectively, and $1.2 million and $1.2 million for the six months ended January 31, 2014 and 2015, respectively.
Future minimum lease payments under non-cancelable operating leases as of July 31, 2014 are as follows:
| (in thousands) | ||||
| 2015 |
$ | 1,922 | ||
| 2016 |
1,792 | |||
| 2017 |
1,713 | |||
| 2018 |
1,760 | |||
| 2019 |
1,655 | |||
|
|
|
|||
| Future minimum operating lease payments |
8,842 | |||
| Less: minimum payments to be received from non-cancelable sublease |
(464 | ) | ||
|
|
|
|||
| Total future minimum operating lease payments, net |
$ | 8,378 | ||
|
|
|
|||
In December 2014, the Company entered into an operating lease agreement for its facilities in the United Kingdom. The operating lease agreement is non-cancelable for a 36-month period and lease payments are due in quarterly installments beginning in the fourth quarter of fiscal 2015. As a result, operating lease obligations reflected in the table above increased by approximately $1.1 million, of which $0.2 million is due in fiscal 2015, $0.4 million is due in fiscal 2016 and fiscal 2017, and $0.1 million is due by July 31, 2018.
Letters of Credit
As of July 31, 2014 and January 31, 2015, the Company had a total of $0.5 million in letters of credit outstanding related to its leased office space in San Jose, California. The letters of credit are collateralized by substantially all of the Company’s assets, excluding its intellectual property. These letters of credit renew annually and mature at various dates through June 30, 2019.
Legal Matters and Contingencies
The Company makes a provision for a liability relating to legal matters and loss contingencies when it is both probable that a liability has been or will be incurred and the amount of the loss can be reasonably estimated.
From time to time, the Company may become a party to litigation and subject to claims incident to the ordinary course of business, including intellectual property claims, labor and employment claims, and threatened claims, breach of contract claims, tax, and other matters.
The Company is not currently aware of any litigation matters or loss contingencies that would be expected to have a material adverse effect on its business, consolidated financial position, results of operations, comprehensive loss or cash flows.
Indemnification Arrangements
In the ordinary course of business, the Company enters into contractual arrangements under which it agrees to provide indemnification of varying scope and terms to customers, business partners and other parties with respect to certain matters, including, losses arising out of the breach of such agreements, intellectual property infringement claims made by third parties, and other liabilities with respect to the Company’s products and services and its business. In these circumstances, payment may be conditional on the other party making a claim pursuant to the procedures specified in the particular contract.
F-29
Table of Contents
The Company includes service level commitments to its cloud customers warranting certain levels of uptime reliability and performance and permitting those customers to receive credits in the event that it fails to meet those levels. To date, the Company has not incurred any material costs as a result of these commitments and the Company expects the time between any potential claims and issuance of the credits to be short. As a result, the Company has not accrued any liabilities related to these commitments in the Company’s consolidated financial statements.
In addition, the Company has indemnification agreements with its directors and certain of its executive officers that require the Company, among other things, to indemnify them against certain liabilities that may arise by reason of their status or service as directors or officers.
(10) Segment Information and Information About Geographic Areas
Revenue by geography is based on the shipping address of the customer. The following tables present the Company’s revenue by geographic region for the periods presented:
| Year Ended July 31, | Six Months
Ended January 31, |
|||||||||||||||||||
| 2012 | 2013 | 2014 | 2014 | 2015 | ||||||||||||||||
| (unaudited) | ||||||||||||||||||||
| (in thousands) | ||||||||||||||||||||
| United States |
$ | 23,093 | $ | 36,049 | $ | 35,434 | $ | 15,644 | $ | 20,108 | ||||||||||
| United Kingdom |
2,769 | 1,382 | 4,049 | 1,642 | 3,572 | |||||||||||||||
| Rest of the world |
1,745 | 5,721 | 13,219 | 6,131 | 8,935 | |||||||||||||||
|
|
|
|
|
|
|
|
|
|
|
|||||||||||
| $ | 27,607 | $ | 43,152 | $ | 52,702 | $ | 23,417 | $ | 32,615 | |||||||||||
|
|
|
|
|
|
|
|
|
|
|
|||||||||||
No individual country other than the United States and the United Kingdom accounted for more than 10% of total revenue during any of the periods presented.
Long-lived assets by geographic area were as follows:
| July 31, | January 31, | |||||||||||
| 2013 | 2014 | 2015 | ||||||||||
| (unaudited) | ||||||||||||
| (in thousands) | ||||||||||||
| United States |
$ | 1,336 | $ | 22,117 | $ | 21,138 | ||||||
| India |
477 | 364 | 271 | |||||||||
| Rest of the world |
25 | 79 | 367 | |||||||||
|
|
|
|
|
|
|
|||||||
| $ | 1,838 | $ | 22,560 | $ | 21,776 | |||||||
|
|
|
|
|
|
|
|||||||
(11) Stockholders’ Equity
Common Stock
As of July 31, 2013 and 2014, respectively, the Company was authorized to issue 200,000,000 and 230,000,000 shares of $0.001 par value of common stock in accordance with its Amended and Restated Certificate of Incorporation. No additional common shares were authorized to be issued during the six months ended January 31, 2015. As of July 31, 2013 and 2014 and January 31, 2015, respectively, the Company had 22,824,467, 29,876,435 and 31,495,757 shares of common stock issued and outstanding. Holders of common stock are entitled to one vote per share, and to receive dividends and, upon liquidation or dissolution, are entitled to receive all assets available for distribution to stockholders. The holders have no preemptive or other subscription rights and there are no redemption or sinking fund provisions with respect to such shares. Common stock is subordinate to the convertible preferred stock with respect to dividend rights and rights upon liquidation, winding up, and dissolution of the Company.
F-30
Table of Contents
Convertible Preferred Stock
The following table summarizes convertible preferred stock authorized, issued and outstanding as of July 31, 2013 and 2014 and January 31, 2015:
| As of July 31, 2013 | ||||||||||||||||
| Convertible Preferred Stock: |
Shares Authorized |
Shares Issued and Outstanding |
Net Proceeds |
Aggregate Liquidation Preference |
||||||||||||
| (dollars in thousands) | ||||||||||||||||
| Series A |
14,520,125 | 14,520,125 | $ | 11,612 | $ | 11,725 | ||||||||||
| Series B |
12,672,303 | 12,672,303 | 12,518 | 12,647 | ||||||||||||
| Series C |
30,706,959 | 30,706,959 | 13,912 | 14,094 | ||||||||||||
| Series D |
13,612,561 | 13,612,561 | 6,427 | 6,500 | ||||||||||||
| Series E |
12,104,444 | 12,104,444 | 6,889 | 7,000 | ||||||||||||
| Series F |
13,114,861 | 13,114,861 | 19,975 | 20,050 | ||||||||||||
| Series G |
16,000,000 | 15,730,725 | 34,896 | 35,000 | ||||||||||||
|
|
|
|
|
|
|
|
|
|||||||||
| Total convertible preferred stock |
112,731,253 | 112,461,978 | $ | 106,229 | $ | 107,016 | ||||||||||
|
|
|
|
|
|
|
|
|
|||||||||
| As of July 31, 2014 | ||||||||||||||||
| Convertible Preferred Stock: |
Shares Authorized |
Shares Issued and Outstanding |
Net Proceeds |
Aggregate Liquidation Preference |
||||||||||||
| (dollars in thousands) | ||||||||||||||||
| Series A |
14,520,125 | 14,520,125 | $ | 11,612 | $ | 11,725 | ||||||||||
| Series B |
12,672,303 | 12,672,303 | 12,518 | 12,647 | ||||||||||||
| Series C |
30,706,959 | 30,706,959 | 13,912 | 14,094 | ||||||||||||
| Series D |
13,612,561 | 13,612,561 | 6,427 | 6,500 | ||||||||||||
| Series E |
12,104,444 | 12,104,444 | 6,889 | 7,000 | ||||||||||||
| Series F |
13,114,861 | 13,114,861 | 19,975 | 20,050 | ||||||||||||
| Series G |
19,618,461 | 19,618,461 | 34,896 | 43,650 | ||||||||||||
| Series G-1 |
5,181,757 | 5,181,757 | — | 11,529 | ||||||||||||
| Series H |
20,663,195 | 20,637,076 | 59,874 | 60,054 | ||||||||||||
|
|
|
|
|
|
|
|
|
|||||||||
| Total convertible preferred stock |
142,194,666 | 142,168,547 | $ | 166,103 | $ | 187,249 | ||||||||||
|
|
|
|
|
|
|
|
|
|||||||||
| As of January 31, 2015 | ||||||||||||||||
| Convertible Preferred Stock: |
Shares Authorized |
Shares Issued and Outstanding |
Net Proceeds |
Aggregate Liquidation Preference |
||||||||||||
| (unaudited) | ||||||||||||||||
| (dollars in thousands) | ||||||||||||||||
| Series A |
14,520,125 | 14,520,125 | $ | 11,612 | $ | 11,725 | ||||||||||
| Series B |
12,672,303 | 12,672,303 | 12,518 | 12,647 | ||||||||||||
| Series C |
30,706,959 | 30,706,959 | 13,912 | 14,094 | ||||||||||||
| Series D |
13,612,561 | 13,612,561 | 6,427 | 6,500 | ||||||||||||
| Series E |
12,104,444 | 12,104,444 | 6,889 | 7,000 | ||||||||||||
| Series F |
13,114,861 | 13,114,861 | 19,975 | 20,050 | ||||||||||||
| Series G |
19,618,461 | 19,618,461 | 34,896 | 43,650 | ||||||||||||
| Series G-1 |
5,181,757 | 4,526,621 | — | 10,071 | ||||||||||||
| Series H |
20,663,195 | 20,637,076 | 59,874 | 60,054 | ||||||||||||
|
|
|
|
|
|
|
|
|
|||||||||
| Total convertible preferred stock |
142,194,666 | 141,513,411 | $ | 166,103 | $ | 185,791 | ||||||||||
|
|
|
|
|
|
|
|
|
|||||||||
F-31
Table of Contents
The holders of convertible preferred stock have various rights, preferences and privileges as follows:
Redemption—The convertible preferred stock is not redeemable.
Dividends—Holders of Series A, B, C, D, E, F, G, G-1 and H series convertible preferred stock are entitled to receive noncumulative dividends on a pari passu basis in preference to any dividends to common stockholders at a rate of $0.0480, $0.0599, $0.0275, $0.0287, $0.0347, $0.0917, $0.1335, $0.1335 and $0.1746 per share per annum, respectively, on each outstanding share of preferred stock (adjusted to reflect stock splits, stock dividends, and recapitalizations). Such dividends are payable out of funds legally available and are payable only when and if declared by the board of directors and are noncumulative. No dividends are payable on the common stock during any fiscal year until the Series A, B, C, D, E, F, G, G-1 and H convertible preferred stockholders have received their dividend preference for that fiscal year. Any additional dividends declared shall be distributed among the holders of preferred stock and common stock, assuming conversion of all convertible preferred stock into common stock. No dividends have been declared on any shares of the Company’s capital stock.
Liquidation Preference—In the event of liquidation, dissolution, or winding up or change of control of the Company, the holders of Series C, D, E, F, G, G-1, and H convertible preferred stock are entitled to receive on a pari passu basis $0.4590, $0.4775, $0.5783, $1.5288, $2.2249, $2.2249, and $2.91 per share, respectively, plus any declared but unpaid dividends. After payments to Series C, D, E, F, G, G-1 and H convertible preferred stockholders, the holders of Series A and B convertible preferred stock are entitled to receive an amount equal to $0.8075 and $0.9980 per share, respectively, plus any declared but unpaid dividends. After payment has been made to the holders of preferred stockholders, the entire remaining assets and funds shall be distributed ratably among the holders of preferred stock (excluding Series G-1) and common stock in proportion to shares of common stock then held by each plus all declared but unpaid dividends.
Any acquisition of the Company by means of merger or other form of corporate reorganization in which the outstanding shares of the Company are exchanged for securities or other consideration issued, or caused to be issued, by the acquiring corporation or its subsidiary (other than a reincorporation transaction) or a sale of all or substantially all of the assets of the Company shall be treated as a liquidation, dissolution, or winding-up of the corporation and shall entitle the holders of convertible preferred stock and common stock to receive at the closing in cash, securities, or other property amounts as specified above.
Conversion—The holders of the Series A, B, C, D, E, F, G, G-1 and H convertible preferred stock have the right to convert the convertible preferred stock, at any time, into shares of common stock. The conversion rate for Series C, D, E, F, G, G-1 and H convertible preferred stock is on a 1:1 basis, for Series A convertible stock on 1:1.261 basis and for Series B convertible preferred stock is on 1:1.363 basis, subject to adjustment for common stock dividends, combinations, or splits and subsequent issues of common or convertible preferred stock.
Automatic Conversion—The Series H convertible preferred stock automatically converts into common stock upon the earlier of (1) the date specified by a vote or written consent or agreement of holders of at least a majority of the shares of Series H convertible preferred stockholders or (2) an initial public offering at a price of at least $2.91 per share with gross proceeds of at least $35,000,000. The Series C, D, E, F, G and G-1 convertible preferred stock automatically converts into common stock upon the earlier of 1) the date specified by a vote or written consent or agreement of at least 70% of the shares of Series C, D, E, F, G and G-1 convertible preferred stock or (2) an initial public offering at a price of at least $2.2249 per share with aggregate gross proceeds of at least $35,000,000. The Series A and B convertible preferred stock automatically converts into common stock upon the earlier of (1) the date specified by a vote or written consent or agreement of holders of at least a majority of the shares of Series A and B preferred stock or (2) an initial public offering with aggregate gross proceeds of at least $35,000,000.
Conversion Price Adjustments—The conversion price per share of the Series A, B, C, D and E convertible preferred stock will be reduced if the Company issues any additional stock without consideration or for consideration per share less than the Series A, B, C, D and E convertible preferred stock conversion price in effect for that series.
F-32
Table of Contents
Voting Rights—Each share of convertible preferred stock has a number of votes equal to the number of shares of common stock into which it is convertible. The holders of Series A convertible preferred stock, voting together as a single class on an as-if-converted basis, have the right to elect two directors. The holders of Series D convertible preferred stock, voting as a single class, have the right to elect one director. The holders of the common stock, voting together as a single class, have the right to elect two directors. The holders of convertible preferred stock, voting as a single class, have the right to elect one preferred director. The holders of the common stock and convertible preferred stock, voting together on an as-if-converted basis, elect one at-large director.
(12) Stock Incentive Plan
In 2005, the Company adopted the 2005 Stock Incentive Plan (“the Plan”), which was amended in April 2014. Pursuant to the Plan, the Company’s board of directors may grant common stock options, RSUs, restricted stock awards, stock appreciation rights, and other stock awards to employees, outside directors, and consultants. The exercise price per share of all common stock options and stock appreciation rights granted under the Plan must equal to or greater than the fair market value per share of the Company’s common stock on the date of grant. The common stock options granted generally vest over a period of four years and expire 10 years from the grant date.
As of July 31, 2013 and 2014 and January 31, 2015, respectively, an aggregate of 48,600,310, 54,200,310 and 54,191,310 common shares were reserved under the Plan, of which 11,103,289, 6,736,244 and 3,151,004 common shares were available for issuance as of July 31, 2013 and 2014 and January 31, 2015, respectively.
Stock-based Compensation Expense
The total stock-based compensation expense recognized for stock-based awards under the Plan in the consolidated statements of comprehensive loss was as follows:
| Year Ended July 31, | Six Months Ended January 31, |
|||||||||||||||||||
| 2012 | 2013 | 2014 | 2014 | 2015 | ||||||||||||||||
| (unaudited) | ||||||||||||||||||||
| (in thousands) | ||||||||||||||||||||
| Cost of subscription and support revenue |
$ | 2 | $ | 21 | $ | 24 | $ | 12 | $ | 13 | ||||||||||
| Cost of professional services and other revenue |
30 | 65 | 133 | 47 | 91 | |||||||||||||||
| Research and development |
74 | 114 | 490 | 135 | 453 | |||||||||||||||
| Sales and marketing |
55 | 138 | 1,090 | 146 | 319 | |||||||||||||||
| General and administrative |
20 | 70 | 989 | 430 | 571 | |||||||||||||||
|
|
|
|
|
|
|
|
|
|
|
|||||||||||
| Total stock-based compensation expense |
$ | 181 | $ | 408 | $ | 2,726 | $ | 770 | $ | 1,447 | ||||||||||
|
|
|
|
|
|
|
|
|
|
|
|||||||||||
F-33
Table of Contents
The total stock-based compensation expense for stock options awarded to non-employees included above was immaterial for all periods presented.
Stock Options
A summary of activity under the Plan and related information was as follows:
| Options Outstanding | ||||||||||||||||
| Number of Shares Underlying Outstanding Options |
Weighted- Average Exercise Price |
Weighted- Average Remaining Contractual Life (Years) |
Aggregate Intrinsic Value (In thousands) |
|||||||||||||
| Balances at July 31, 2011 |
18,181,823 | $ | 0.08 | 8.08 | $ | 106 | ||||||||||
| Options granted (weighted-average fair value of $0.04) |
12,763,525 | 0.08 | ||||||||||||||
| Options exercised |
(3,679,455 | ) | 0.06 | |||||||||||||
| Options cancelled |
(2,903,919 | ) | 0.07 | |||||||||||||
|
|
|
|||||||||||||||
| Balances at July 31, 2012 |
24,361,974 | 0.08 | 8.15 | 2,124 | ||||||||||||
| Options granted (weighted-average fair value of $0.12) |
9,473,704 | 0.25 | ||||||||||||||
| Options exercised |
(5,922,010 | ) | 0.07 | |||||||||||||
| Options cancelled |
(3,116,382 | ) | 0.14 | |||||||||||||
|
|
|
|||||||||||||||
| Balances at July 31, 2013 |
24,797,286 | 0.14 | 7.82 | 9,807 | ||||||||||||
| Options granted (weighted-average fair value of $0.35) |
12,648,907 | 0.63 | ||||||||||||||
| Options exercised |
(4,145,727 | ) | 0.11 | |||||||||||||
| Options cancelled |
(2,831,546 | ) | 0.38 | |||||||||||||
|
|
|
|||||||||||||||
| Balances at July 31, 2014 |
30,468,920 | 0.33 | 7.65 | 31,716 | ||||||||||||
|
|
|
|||||||||||||||
| Options granted (weighted-average fair value of $0.74) (unaudited) |
5,944,523 | 1.74 | ||||||||||||||
| Options exercised (unaudited) |
(1,619,322 | ) | 0.25 | |||||||||||||
| Options cancelled (unaudited) |
(2,343,032 | ) | 0.51 | |||||||||||||
|
|
|
|||||||||||||||
| Balances at January 31, 2015 (unaudited) |
32,451,089 | $ | 0.58 | 7.52 | $ | 49,032 | ||||||||||
|
|
|
|||||||||||||||
| Exercisable at July 31, 2014 |
12,921,273 | $ | 0.17 | 6.16 | $ | 15,559 | ||||||||||
|
|
|
|||||||||||||||
| Vested and expected to vest at July 31, 2014 |
25,880,911 | $ | 0.32 | 7.48 | $ | 27,281 | ||||||||||
|
|
|
|||||||||||||||
| Exercisable at January 31, 2015 (unaudited) |
15,851,162 | $ | 0.22 | 6.16 | $ | 29,669 | ||||||||||
|
|
|
|||||||||||||||
| Vested and expected to vest at January 31, 2015 (unaudited) |
27,094,676 | $ | 0.53 | 7.28 | $ | 42,262 | ||||||||||
|
|
|
|||||||||||||||
No income tax benefit has been recognized relating to stock-based compensation expense and no tax benefits have been realized from exercised stock options. The total intrinsic value of stock options exercised during the years ended July 31, 2012, 2013 and 2014 was $0.1 million, $1.4 million and $3.6 million, respectively, and during the six months ended January 31, 2014 and 2015, was $0.9 million and $2.6 million, respectively. The total fair value of options vested during the years ended July 31, 2012, 2013 and 2014 was $0.1 million, $0.3 million and $0.7 million, respectively, and during the six months ended January 31, 2014 and 2015, was $0.2 million and $0.9 million, respectively. As of July 31, 2014 and January 31, 2015, there was total unrecognized stock-based compensation cost of $3.0 million and $5.0 million, respectively, related to unvested stock options, net of estimated forfeitures, which is expected to be recognized over a weighted-average period of 2.53 years and 3.09 years, respectively.
F-34
Table of Contents
The following table summarizes information about stock options outstanding under the option plan as of July 31, 2014:
| Options Outstanding | Options Exercisable | |||||||||||||||||||
| Exercise Price |
Number of Options Outstanding |
Weighted- Average Remaining Contractual Life (Years) |
Weighted- Average Exercise Price per Share |
Number of Options Exercisable |
Weighted- Average Exercise Price Per Share |
|||||||||||||||
| $0.03 |
34,321 | 5.32 | $ | 0.03 | 34,321 | $ | 0.03 | |||||||||||||
| $0.06 |
3,908,966 | 6.67 | 0.06 | 3,187,283 | 0.06 | |||||||||||||||
| $0.08 |
448,459 | 4.60 | 0.08 | 448,459 | 0.08 | |||||||||||||||
| $0.08 |
17,500 | 1.12 | 0.08 | 17,500 | 0.08 | |||||||||||||||
| $0.09 |
5,432,492 | 7.64 | 0.09 | 2,509,321 | 0.09 | |||||||||||||||
| $0.14 |
3,446,078 | 2.47 | 0.14 | 3,446,078 | 0.14 | |||||||||||||||
| $0.20 |
3,238,437 | 8.17 | 0.20 | 1,147,854 | 0.20 | |||||||||||||||
| $0.23 |
1,259,888 | 8.65 | 0.23 | 505,849 | 0.23 | |||||||||||||||
| $0.48 |
1,215,313 | 8.91 | 0.48 | 326,725 | 0.48 | |||||||||||||||
| $0.54 |
8,231,344 | 9.17 | 0.54 | 1,286,008 | 0.54 | |||||||||||||||
| $0.56 |
1,249,097 | 9.38 | 0.56 | 9,375 | 0.56 | |||||||||||||||
| $0.97 |
1,162,825 | 9.60 | 0.97 | — | — | |||||||||||||||
| $1.20 |
824,200 | 9.84 | 1.20 | 2,500 | 1.20 | |||||||||||||||
|
|
|
|
|
|||||||||||||||||
| 30,468,920 | 7.65 | $ | 0.33 | 12,921,273 | $ | 0.17 | ||||||||||||||
|
|
|
|
|
|||||||||||||||||
Valuation Assumptions
The Company estimates the fair value of each option awarded on the date of grant using the Black-Scholes option pricing model utilizing the assumptions noted below. The expected term of the options is based on the average period the stock options are expected to remain outstanding calculated as the midpoint of the options’ vesting terms and contractual expiration periods, as the Company does not have sufficient historical information to develop reasonable expectations about future exercise patterns and post-vesting employment termination behavior. The expected stock price volatility for the Company’s common stock was determined by examining the historical volatilities of a group of its industry peers as it does not have sufficient trading history of the Company’s common stock. The risk-free interest rate was calculated using the average of the published interest rates for United States Treasury zero-coupon issues with maturities that approximate the expected term. The dividend yield assumption is zero as the Company does not have any history of, nor plans to make, dividend payments. Forfeitures were estimated at the time of grant and revised, if necessary, in subsequent periods if actual forfeitures differed from those estimates. Forfeitures were estimated based on historical experience. The fair value of the common stock has historically been determined by the Company’s board of directors. Because there has been no public market for the Company’s common stock, the board of directors has determined the fair value of the common stock at the time of the option grant by considering a number of objective and subjective factors, including valuations of comparable companies, operating and financial performance, lack of liquidity of capital stock and general and industry-specific economic outlooks, amongst other factors. The fair value of the underlying common stock will be determined by the board of directors until such time that the Company’s common stock is listed on an established stock exchange or national market system.
F-35
Table of Contents
The following assumptions were used to estimate the fair value of options granted:
| Year Ended July 31, | Six Months Ended January 31, |
|||||||||||||||||||
| 2012 | 2013 | 2014 | 2014 | 2015 | ||||||||||||||||
| (unaudited) | ||||||||||||||||||||
| Expected term (in years) |
5.6 – 6.9 | 5.9 – 6.1 | 5.5 – 6.9 | 5.8 – 6.9 | 6.0 – 6.1 | |||||||||||||||
| Risk-free interest rate |
1.0 – 1.3 | % | 0.8 – 1.7 | % | 1.7 – 2.3 | % | 1.7 – 2.3 | % | 1.5 – 1.8 | % | ||||||||||
| Expected volatility |
51 – 52 | % | 50 – 51 | % | 48 – 50 | % | 49 – 50 | % | 40 – 44 | % | ||||||||||
| Dividend yield |
0 | % | 0 | % | 0 | % | 0 | % | 0 | % | ||||||||||
| Fair value of common stock |
$ | 0.06 – 0.09 | $ | 0.20 – 0.48 | $ | 0.54 – 1.20 | $0.54 – 0.97 | $ | 1.37 – 2.09 | |||||||||||
Series G-1 Convertible Preferred Stock
Stock-based compensation expense for the year ended July 31, 2014 and the six months ended January 31, 2015 included $0.9 million and $0.3 million, respectively, of amortization expense for Series G-1 convertible preferred stock issued to former employees of InsightsOne. The awards are subject to vesting on a monthly basis over certain vesting periods. Additionally, the Company recorded a modification charge of $0.5 million during the year ended July 31, 2014 related to the acceleration of unvested shares in connection with the termination of a former InsightsOne employee.
As of July 31, 2014 and January 31, 2015, the remaining unamortized expense related to Series G-1 convertible preferred stock was $1.5 million and $1.0 million, respectively, which will be recognized over a weighted-average remaining period of 2.22 years and 1.74 years, respectively.
Restricted Stock Units
A summary of RSUs under the Plan and related information was as follows:
| RSUs Outstanding | Aggregate Intrinsic Value (In thousands) |
|||||||||||||||
| Number of Shares |
Weighted- Average Grant-Date Fair Value |
Weighted- Average Remaining Contractual Life (Years) |
||||||||||||||
| Balances at July 31, 2011 |
— | $ | — | |||||||||||||
| Granted |
645,837 | 0.13 | ||||||||||||||
| Released |
— | — | ||||||||||||||
| Forfeited |
— | — | ||||||||||||||
|
|
|
|||||||||||||||
| Balances at July 31, 2012 |
645,837 | 0.13 | ||||||||||||||
| Granted |
20,000 | 0.48 | ||||||||||||||
| Released |
(158,335 | ) | 0.14 | |||||||||||||
| Forfeited |
— | — | ||||||||||||||
|
|
|
|||||||||||||||
| Balances at July 31, 2013 |
507,502 | 0.14 | ||||||||||||||
| Granted |
154,676 | 0.98 | ||||||||||||||
| Released |
(537,002 | ) | 0.19 | |||||||||||||
| Forfeited |
(4,992 | ) | 0.97 | |||||||||||||
|
|
|
|||||||||||||||
| Balances at July 31, 2014 |
120,184 | 0.97 | ||||||||||||||
| Granted (unaudited) |
— | — | ||||||||||||||
| Released (unaudited) |
— | — | ||||||||||||||
| Forfeited (unaudited) |
(16,251 | ) | 0.97 | |||||||||||||
|
|
|
|||||||||||||||
| Balances at January 31, 2015 (unaudited) |
103,933 | $ | 0.97 | 6.09 | $ | 217 | ||||||||||
F-36
Table of Contents
RSUs granted during the year ended July 31, 2012 include 345,837 RSUs granted in connection with the acquisition of Usergrid and 300,000 RSUs granted in connection with the acquisition of InstaOps. The Usergrid RSUs had a fair value of $0.09 per share and vest over a period of 30 months of continuous employment with the Company (40% and 60% vest at 18 and 30 months, respectively). The InstaOps RSUs had a fair value of $0.17 per share and vest 100% after 24 months of continuous employment with the Company.
RSUs granted during the year ended July 31, 2014 include 125,176 RSUs granted in connection with the acquisition of InsightsOne. These RSUs are subject to a time-based vesting condition and a performance-based vesting condition, both of which must be satisfied before the RSUs are vested and settled for shares of common stock. The time-based vesting condition is three years and the performance-based vesting condition is satisfied upon the completion of the Company’s initial public offering. No expense related to these awards will be recognized unless the performance-based vesting condition is satisfied. Upon satisfaction of the performance-based vesting condition, cumulative stock-based compensation expense will be recognized to the extent of satisfaction of the time-based vesting condition as of such date, with the remaining expense recognized over the remainder of the time-based vesting condition. RSUs that have met the time-based vesting condition are not cancelled when service to the Company is terminated; however, these shares will not vest until the performance-based vesting condition is met. RSUs that have not satisfied the time-based vesting condition as of termination of employment are automatically forfeited. The RSUs will expire seven years from the grant date if not previously settled for shares of common stock.
(13) Net Loss Per Share
The Company computes net loss per share of common stock in conformity with the two-class method required for participating securities. The Company considers all series of the convertible preferred stock to be participating securities as the holders of the preferred stock are entitled to receive a non-cumulative dividend on a pari passu basis in the event that a dividend is paid on the common stock. The holders of the convertible preferred stock do not have a contractual obligation to share in the Company’s losses. As such, the Company’s net losses for the years ended July 31, 2012, 2013 and 2014 and the six months ended January 31, 2015, were not allocated to these participating securities.
Basic net loss per share attributable to common stockholders is computed by dividing the net loss attributable to common stockholders by the weighted-average number of shares of common stock outstanding during the period. Diluted net loss per share is computed by giving effect to all potential shares of common stock, including common stock issuable upon conversion of the convertible preferred stock, outstanding stock-based awards, and outstanding warrants, to the extent dilutive. Basic and diluted net loss per share was the same for each period presented as the inclusion of all potential common stock outstanding would have been anti-dilutive.
The following table presents the calculation of basic and diluted net loss per share for the periods presented:
| Year Ended July 31, | Six Months Ended January 31, |
|||||||||||||||||||
| 2012 | 2013 | 2014 | 2014 | 2015 | ||||||||||||||||
| (unaudited) | ||||||||||||||||||||
| (in thousands, except per share data) | ||||||||||||||||||||
| Numerator: |
||||||||||||||||||||
| Net loss |
$ | (8,281 | ) | $ | (25,871 | ) | $ | (60,793 | ) | $ | (32,212 | ) | $ | (26,809 | ) | |||||
|
|
|
|
|
|
|
|
|
|
|
|||||||||||
| Denominator: |
||||||||||||||||||||
| Weighted-average shares used to compute net loss per share, basic and diluted |
14,862 | 18,576 | 25,938 | 24,165 | 30,467 | |||||||||||||||
|
|
|
|
|
|
|
|
|
|
|
|||||||||||
| Net loss per share, basic and diluted |
$ | (0.56 | ) | $ | (1.39 | ) | $ | (2.34 | ) | $ | (1.33 | ) | $ | (0.88 | ) | |||||
|
|
|
|
|
|
|
|
|
|
|
|||||||||||
F-37
Table of Contents
Since the Company was in a loss position for all periods presented, basic net loss per share is the same as diluted net loss per share as the inclusion of all potential common shares outstanding would have been anti-dilutive. Potentially dilutive securities that were not included in the diluted per share calculations because they would be anti-dilutive were as follows:
| Year Ended July 31, | Six Months Ended January 31, |
|||||||||||||||||||
| 2012 | 2013 | 2014 | 2014 | 2015 | ||||||||||||||||
| (unaudited) | ||||||||||||||||||||
| (in thousands) | ||||||||||||||||||||
| Shares subject to outstanding common stock options |
24,362 | 24,797 | 30,469 | 32,465 | 32,451 | |||||||||||||||
| Convertible preferred stock (on an as if converted basis) |
105,076 | 120,856 | 150,563 | 129,926 | 149,908 | |||||||||||||||
| Restricted stock units |
646 | 508 | 120 | — | 104 | |||||||||||||||
| Shares subject to preferred stock warrants (on as if converted basis) |
301 | — | — | — | — | |||||||||||||||
| Shares subject to common stock warrants |
300 | 4,185 | 500 | 500 | 527 | |||||||||||||||
|
|
|
|
|
|
|
|
|
|
|
|||||||||||
| Total |
130,685 | 150,346 | 181,652 | 162,891 | 182,990 | |||||||||||||||
|
|
|
|
|
|
|
|
|
|
|
|||||||||||
Unaudited Consolidated Pro Forma Net Loss per Share Attributable to Common Stockholders
Unaudited pro forma net loss per share for fiscal 2014 has been computed to give effect to the automatic conversion of the convertible preferred stock into common stock, the conversion of preferred stock warrants into common stock warrants, and vesting of restricted stock units.
| Year Ended
July 31, 2014 |
Six Months
Ended January 31, 2015 |
|||||||
| (in thousands except per share data) | ||||||||
| Net loss |
$ | (60,793 | ) | $ | (26,809 | ) | ||
| Pro forma adjustment to reflect assumed vesting of restricted stock units |
(18 | ) | (13 | ) | ||||
|
|
|
|
|
|||||
| Net loss used in computing pro forma basic and diluted net loss per share |
$ | (60,811 | ) | $ | (26,822 | ) | ||
| Basic and diluted shares: |
||||||||
| Weighted-average common shares outstanding |
25,938 | 30,467 | ||||||
| Pro forma adjustment to reflect assumed vesting of restricted stock units |
5 | 29 | ||||||
| Pro forma adjustment to reflect assumed conversion of preferred stock to common stock |
132,438 | 149,908 | ||||||
| Less: Weighted-average unvested Series G-1 convertible preferred stock subject to repurchase or forfeiture |
(1,084 | ) | (592 | ) | ||||
| Pro forma adjustment to reflect the repurchase of Series G-1 convertible preferred stock |
— | 192 | ||||||
|
|
|
|
|
|||||
| Pro forma basic and diluted shares |
157,297 | 180,004 | ||||||
|
|
|
|
|
|||||
| Pro forma basic and diluted net loss per share |
$ | (0.39 | ) | $ | (0.15 | ) | ||
|
|
|
|
|
|||||
(14) Employee Benefit Plan
The Company adopted a defined-contribution retirement plan (the “401(k) Plan”), which qualifies under Section 401(k) of the Internal Revenue Code of 1996. This 401(k) Plan covers essentially all employees. Eligible employees may make voluntary contributions to the 401(k) Plan up to the statutory annual limitations, and the Company is allowed to make discretionary contributions. The Company has made no discretionary contributions during the years ended July 31, 2012, 2013 and 2014 and during the six months ended January 31, 2014 and 2015.
F-38
Table of Contents
(15) Related Party Transactions
A member of the Company’s board of directors was a key employee of a publicly-traded company that is a customer of the Company. There was no revenue recorded from sales to this customer for the years ended July 31, 2012, 2013 and 2014, respectively. For the six months ended January 31, 2015, $2.0 million of revenue was recorded from sales to this customer. The Company recorded deferred revenue from sales to this customer of $0, $2.9 million and $0.9 million and had $0, $2.9 million and $0 of accounts receivable due from this customer as of July 31, 2013 and 2014 and January 31, 2015, respectively.
Another member of the Company’s board of directors had a direct ownership interest in InsightsOne prior to its acquisition by Apigee in December 2013. See Note 2 for further details on the InsightsOne acquisition.
(16) Subsequent Events
Management has evaluated subsequent events from the most recent balance sheet date through November 26, 2014, the date at which the consolidated financial statements were available to be issued.
Debt Financing Facilities
In November 2014, the Company amended and restated the Loan and Security Agreement with SVB (“loan amendment”). The loan amendment provides the Company with the ability to borrow up to $25.0 million through a $12.5 million revolving line of credit subject to an accounts receivable borrowing base, which refinanced and replaced the existing revolving line in its entirety and $12.5 million term loan. The Company can draw upon the revolving line of credit through October 31, 2017, and the revolving loans bear interest at a rate equal to prime plus 1.5% per annum. Outstanding revolving loans are limited to the lesser of $12.5 million or 80% of the balance of certain eligible customer accounts receivable. The term loan is available in two tranches. The first tranche, Tranche A, in an aggregate principal amount of $4.0 million, refinanced and replaced the existing term loan and existing growth capital loan in their entirety. The principal amount of Tranche A is payable in equal monthly installments over a 30-month period with the last payment due no later than May 31, 2017. The second tranche, Tranche B, in an aggregate principal amount of up to $8.5 million, is available to borrow through May 31, 2016. Tranche B has interest only payments during such draw period and then the principal is payable in equal monthly installments thereafter over a 24-month period. The Company is permitted to prepay all term loans without premium or penalty. The existing equipment term loan is fully funded and not available for further draws under the amendment and the Company will continue to repay the outstanding principal in monthly installments, plus interest at a rate equal to prime plus 2.0%, with the last payment due in June 2017.
In connection with loan amendment, the Company issued warrants to purchase 26,562 shares of common stock with an exercise price of $1.80 per share and expiration in November 2024; and upon funding of Tranche B, the Company will issue warrants to purchase 79,687 shares of common stock with an exercise price of $1.80 per share and expiration in November 2024.
(17) Events (unaudited) Subsequent to the Date of the Report of the Independent Registered Public Accounting Firm
None.
F-39
Table of Contents
INDEPENDENT AUDITOR’S REPORT OF INSIGHTSONE SYSTEMS, INC.
To the Board of Directors and Stockholders of
InsightsOne Systems, Inc.
Santa Clara, California
We have audited the accompanying financial statements of InsightsOne Systems, Inc., which comprise the balance sheet as of December 31, 2012, and the related statements of operations, stockholders’ equity and cash flows for the year then ended, and the related notes to the financial statements.
Management’s Responsibility for the Financial Statements
Management is responsible for the preparation and fair presentation of these financial statements in accordance with accounting principles generally accepted in the United States of America; this includes the design, implementation, and maintenance of internal control relevant to the preparation and fair presentation of financial statements that are free from material misstatement, whether due to fraud or error.
Auditor’s Responsibility
Our responsibility is to express an opinion on these financial statements based on our audit. We conducted our audit in accordance with auditing standards generally accepted in the United States of America. Those standards require that we plan and perform the audit to obtain reasonable assurance about whether the financial statements are free from material misstatement.
An audit involves performing procedures to obtain audit evidence about the amounts and disclosures in the financial statements. The procedures selected depend on the auditor’s judgment, including the assessment of the risks of material misstatement of the financial statements, whether due to fraud or error. In making those risk assessments, the auditor considers internal control relevant to the entity’s preparation and fair presentation of the financial statements in order to design audit procedures that are appropriate in the circumstances, but not for the purpose of expressing an opinion on the effectiveness of the entity’s internal control. Accordingly, we express no such opinion. An audit also includes evaluating the appropriateness of accounting policies used and the reasonableness of significant accounting estimates made by management, as well as evaluating the overall presentation of the financial statements.
We believe that the audit evidence we have obtained is sufficient and appropriate to provide a basis for our audit opinion.
Opinion
In our opinion, the financial statements referred to above present fairly, in all material respects, the financial position of InsightsOne Systems, Inc. as of December 31, 2012, and the results of its operations and its cash flows for the year then ended in conformity with accounting principles generally accepted in the United States of America.
The accompanying financial statements have been prepared assuming that InsightsOne Systems, Inc. will continue as a going concern. As discussed in Note 1 to the financial statements, the Company has incurred recurring operating losses and will require additional capital to fund future operations. These conditions raise substantial doubt about the Company’s ability to continue as a going concern. Management’s plans in regard to this matter also are described in Note 1 to the financial statements. The financial statements do not include any adjustments that might result from the outcome of this uncertainty.
/s/ Mayer Hoffman McCann P.C.
San Diego, California
December 9, 2013
F-40
Table of Contents
Balance Sheets
| December 31, 2012 |
September 30, 2013 |
|||||||
| (unaudited) | ||||||||
| Assets |
||||||||
| Current Assets |
||||||||
| Cash and cash equivalents |
$ | 2,088,194 | $ | 846,529 | ||||
| Accounts receivable |
90,000 | — | ||||||
| Prepaid expenses and other current assets |
16,301 | 156,693 | ||||||
|
|
|
|
|
|||||
| Total current assets |
2,194,495 | 1,003,222 | ||||||
| Fixed Assets—Net |
32,626 | 40,346 | ||||||
| Other Assets—Net |
5,218 | 5,218 | ||||||
|
|
|
|
|
|||||
| Total Assets |
$ | 2,232,339 | $ | 1,048,786 | ||||
|
|
|
|
|
|||||
| Liabilities and Stockholders’ Equity (Deficit) |
||||||||
| Current Liabilities |
||||||||
| Current portion of term note payable |
$ | — | $ | 500,000 | ||||
| Accounts payable |
44,504 | 42,828 | ||||||
| Accrued expenses |
71,736 | 223,422 | ||||||
| Deferred revenue |
15,000 | 15,000 | ||||||
| Other current liabilities |
28,625 | 15,444 | ||||||
|
|
|
|
|
|||||
| Total current liabilities |
159,865 | 796,694 | ||||||
| Term Note Payable, Less Current Portion |
— | 1,493,759 | ||||||
|
|
|
|
|
|||||
| Total liabilities |
$ | 159,865 | $ | 2,290,453 | ||||
|
|
|
|
|
|||||
| Stockholders’ Equity (Deficit) |
||||||||
| Series A convertible preferred stock, $0.0001 par value; 10,299,712 shares authorized; 10,299,710 shares issued and outstanding at December 31, 2012; 10,299,710 issued and outstanding at September 30, 2013; liquidation preference of $0.4204 per share |
1,029 | 1,029 | ||||||
| Common stock, $0.0001 par value; 34,000,000 shares authorized; 18,525,600 shares issued and outstanding at December 31, 2012; 18,578,724 shares issued and outstanding at September 30, 2013 |
1,853 | 1,858 | ||||||
| Additional paid-in capital |
4,326,690 | 4,358,820 | ||||||
| Accumulated deficit |
(2,257,098 | ) | (5,603,374 | ) | ||||
|
|
|
|
|
|||||
| Total stockholders’ equity (deficit) |
2,072,474 | (1,241,667 | ) | |||||
|
|
|
|
|
|||||
| Total liabilities and stockholders’ equity (deficit) |
$ | 2,232,339 | $ | 1,048,786 | ||||
|
|
|
|
|
|||||
The accompanying notes are an integral part of these financial statements.
F-41
Table of Contents
InsightsOne Systems, Inc.
| For the year ended December 31, 2012 |
For the nine months ended September 30, |
|||||||||||
| 2012 | 2013 | |||||||||||
| (unaudited) | (unaudited) | |||||||||||
| Net Sales |
$ | 723,600 | $ | 538,600 | $ | 430,000 | ||||||
| Operating Costs and Expenses |
||||||||||||
| Cost of revenue—software |
90,725 | 64,463 | 62,046 | |||||||||
| Cost of revenue—professional services |
269,657 | 191,336 | 324,338 | |||||||||
| Research and development expenses |
1,561,454 | 1,072,131 | 1,606,101 | |||||||||
| Selling, general and administrative expenses |
1,006,979 | 636,202 | 1,742,134 | |||||||||
|
|
|
|
|
|
|
|||||||
| Loss from Operations |
(2,205,215 | ) | (1,425,532 | ) | (3,304,619 | ) | ||||||
|
|
|
|
|
|
|
|||||||
| Other Income (Expense) |
||||||||||||
| Interest expense |
— | — | (41,728 | ) | ||||||||
| Interest income |
— | — | 871 | |||||||||
|
|
|
|
|
|
|
|||||||
| Total Other Expense |
$ | — | $ | — | $ | (40,857 | ) | |||||
|
|
|
|
|
|
|
|||||||
| Net Loss Before Taxes |
(2,205,215 | ) | (1,425,532 | ) | (3,345,476 | ) | ||||||
| Income tax expense |
800 | 800 | 800 | |||||||||
|
|
|
|
|
|
|
|||||||
| Net Loss |
$ | (2,206,015 | ) | $ | (1,426,332 | ) | $ | (3,346,276 | ) | |||
|
|
|
|
|
|
|
|||||||
The accompanying notes are an integral part of these financial statements.
F-42
Table of Contents
Statements of Stockholders’ Equity (Deficit)
| Series A
Convertible Preferred Stock |
Common Stock | Additional Paid-in Capital |
Accumulated Deficit |
Total | ||||||||||||||||||||||||
| Shares | Amount | Shares | Amount | |||||||||||||||||||||||||
| Balance at December 31, 2011 |
9,514,746 | 951 | 18,050,000 | 1,805 | 3,937,080 | (51,083 | ) | 3,888,753 | ||||||||||||||||||||
| Common stock option exercises |
— | — | 475,600 | 48 | 42,756 | — | 42,804 | |||||||||||||||||||||
| Issuance of Series A convertible preferred stock |
784,964 | 78 | — | — | 329,921 | — | 329,999 | |||||||||||||||||||||
| Stock-based compensation |
— | — | — | — | 16,933 | — | 16,933 | |||||||||||||||||||||
| Net loss |
— | — | — | — | — | (2,206,015 | ) | (2,206,015 | ) | |||||||||||||||||||
|
|
|
|
|
|
|
|
|
|
|
|
|
|
|
|||||||||||||||
| Balance at December 31, 2012 |
10,299,710 | 1,029 | 18,525,600 | 1,853 | 4,326,690 | (2,257,098 | ) | 2,072,474 | ||||||||||||||||||||
| Common stock option exercises (unaudited) |
— | — | 53,124 | 5 | 4,776 | — | 4,781 | |||||||||||||||||||||
| Stock-based compensation (unaudited) |
— | — | — | — | 20,288 | — | 20,288 | |||||||||||||||||||||
| Issuance of common stock warrants (unaudited) |
— | — | — | — | 7,066 | — | 7,066 | |||||||||||||||||||||
| Net loss (unaudited) |
— | — | — | — | — | (3,346,276 | ) | (3,346,276 | ) | |||||||||||||||||||
|
|
|
|
|
|
|
|
|
|
|
|
|
|
|
|||||||||||||||
| Balance at September 30, 2013 (unaudited) |
10,299,710 | $ | 1,029 | 18,578,724 | $ | 1,858 | $ | 4,358,820 | $ | (5,603,374 | ) | $ | (1,241,667 | ) | ||||||||||||||
|
|
|
|
|
|
|
|
|
|
|
|
|
|
|
|||||||||||||||
The accompanying notes are an integral part of these financial statements.
F-43
Table of Contents
Statements of Cash Flows
| For the year ended December 31, 2012 |
For the nine months ended September 30, |
|||||||||||
| 2012 | 2013 | |||||||||||
| (unaudited) | (unaudited) | |||||||||||
| Cash Flows from Operating Activities |
||||||||||||
| Net loss |
$ | (2,206,015 | ) | $ | (1,426,332 | ) | $ | (3,346,276 | ) | |||
| Adjustments to reconcile net loss to net cash provided by (used in) operating activities: |
||||||||||||
| Depreciation |
5,025 | 3,179 | 7,728 | |||||||||
| Stock-based compensation expense |
16,933 | 11,523 | 20,288 | |||||||||
| Non-cash interest expense |
— | — | 825 | |||||||||
| Increase (decrease) in cash resulting from changes in: |
||||||||||||
| Accounts receivable |
(90,000 | ) | (197,701 | ) | 90,000 | |||||||
| Prepaid expenses and other current assets |
(14,804 | ) | (24,804 | ) | (140,392 | ) | ||||||
| Other assets—net |
(3,818 | ) | (3,818 | ) | — | |||||||
| Accounts payable |
44,504 | 47,076 | (1,676 | ) | ||||||||
| Accrued expenses |
42,230 | 74,993 | 151,686 | |||||||||
| Deferred revenue |
(184,100 | ) | (53,900 | ) | — | |||||||
| Other current liabilities |
28,625 | — | (13,181 | ) | ||||||||
|
|
|
|
|
|
|
|||||||
| Net cash provided by (used in) operating activities |
(2,361,420 | ) | (1,569,784 | ) | (3,230,998 | ) | ||||||
|
|
|
|
|
|
|
|||||||
| Cash Flows from Investing Activities |
||||||||||||
| Purchases of fixed assets |
(29,734 | ) | (25,938 | ) | (15,448 | ) | ||||||
|
|
|
|
|
|
|
|||||||
| Net cash used in investing activities |
(29,734 | ) | (25,938 | ) | (15,448 | ) | ||||||
|
|
|
|
|
|
|
|||||||
| Cash Flows from Financing Activities |
||||||||||||
| Net proceeds from issuance of Series A preferred stock |
329,999 | 329,999 | — | |||||||||
| Proceeds from issuance of term note payable |
— | — | 2,000,000 | |||||||||
| Issuance of restricted common stock to founders |
— | — | — | |||||||||
| Common stock option exercises |
42,804 | 42,804 | 4,781 | |||||||||
|
|
|
|
|
|
|
|||||||
| Net cash provided by financing activities |
372,803 | 372,803 | 2,004,781 | |||||||||
|
|
|
|
|
|
|
|||||||
| Net Increase (Decrease) in Cash and Cash Equivalents |
(2,018,351 | ) | (1,222,919 | ) | (1,241,665 | ) | ||||||
| Cash and Cash Equivalents at Beginning of Period |
4,106,545 | 4,106,545 | 2,088,194 | |||||||||
|
|
|
|
|
|
|
|||||||
| Cash and Cash Equivalents at End of Period |
$ | 2,088,194 | $ | 2,883,626 | $ | 846,529 | ||||||
|
|
|
|
|
|
|
|||||||
| Supplemental Disclosure of Cash Flow Information: |
||||||||||||
| Cash paid during the year for: |
||||||||||||
| Interest |
$ | — | $ | — | $ | 40,903 | ||||||
| Income taxes |
$ | 800 | $ | 800 | $ | 800 | ||||||
| Noncash Investing and Financing Activities |
||||||||||||
| Noncash debt discount related to issuance of warrants |
$ | — | $ | — | $ | 7,066 | ||||||
|
|
|
|
|
|
|
|||||||
The accompanying notes are an integral part of these financial statements.
F-44
Table of Contents
InsightsOne Systems, Inc.
(1) Summary of Significant Accounting Policies
A summary of the InsightsOne Systems, Inc. (a Delaware corporation) (“the Company”) significant accounting policies consistently applied in the preparation of the accompanying financial statements follows. All references made throughout these financial statements to September 30, 2012 and 2013 are unaudited. All references made to 2013 throughout these financial statements are referenced to the nine months ended September 30, 2013, unless otherwise noted.
Nature of operations
The Company was formed on October 1, 2010. The Company offers precise, on-premise and cloud-based consumer lifecycle predictive analytics. The Company’s advanced analytics and big data infrastructure provides a comprehensive understanding of consumer preferences to help increase revenue, customer retention, and a superior consumer experience with no upfront investment in hardware or software.
Basis of presentation
The Company has experienced net losses since its inception, and, as of December 31, 2012, had an accumulated deficit of $2,257,098. To date, the Company has derived the majority of its working capital primarily through the issuance of convertible preferred stock (Note 4) and long-term debt (Note 3). The Company expects to continue to incur net losses and will need to raise additional financing to complete its development efforts and expand its operations. There can be no assurance that additional financing will be available on terms acceptable to the Company, or at all. These conditions raise substantial doubt about the Company’s ability to continue as a going concern.
The accompanying financial statements have been prepared assuming that the Company will continue as a going concern. The basis of accounting contemplates the recovery of the Company’s assets and the satisfaction of its liabilities in the normal course of business. Successful completion of the Company’s development and its transition to attaining profitable operations is dependent upon the Company achieving a level of revenues adequate to support the Company’s cost structure. The accompanying financial statements do not include any adjustments to reflect the possible future effects on the recoverability and classification of assets or the amounts and classification of liabilities that may result from the possible inability of the Company to continue as a going concern.
Use of estimates
The preparation of the financial statements in conformity with U.S. generally accepted accounting principles (“GAAP”) requires management to make estimates and assumptions that affect certain reported amounts and disclosures. The Company has used significant estimates in its determination of the timing of revenue recognition, stock-based compensation expense, warrant valuations and the reserve for accounts receivable. Actual results could differ from those estimates.
Cash and cash equivalents
The Company considers all highly liquid investments with original maturities of three months or less to be cash equivalents.
Accounts receivable
Accounts receivable are carried at original invoice amount. The Company estimates an allowance for doubtful accounts for potential credit losses that are expected to be incurred, based on management’s assessment
F-45
Table of Contents
of the collectability of specific customer accounts, the aging of the accounts receivable, historical information and other currently available evidence. Receivables are written off when deemed uncollectible. As of December 31, 2012 and September 30, 2012 and 2013, management determined that all the amounts recorded as accounts receivable were collectible, and no allowance for doubtful accounts was needed.
Depreciation and amortization
Depreciation and amortization is provided using the straight-line method over the estimated useful lives of the assets, or in the case of leasehold improvements, over the lesser of the useful life of the related asset or lease term.
Fair value of financial instruments
The Company adopted authoritative guidance which defines fair value, establishes a framework for using fair value to measure financial assets and liabilities on a recurring basis, and expands disclosures about fair value measurements. The Company also applied the guidance to non-financial assets and liabilities measured at fair value on a non-recurring basis. The guidance establishes a hierarchy for inputs used in measuring fair value that maximizes the use of observable inputs and minimizes the use of unobservable inputs by requiring that the most observable inputs be used when available. Observable inputs are inputs that market participants would use in pricing the asset or liability developed based on market data obtained from sources independent of the Company. Unobservable inputs are inputs that reflect the Company’s assumptions of what market participants would use in pricing the asset or liability developed based on the best information available in the circumstances. The hierarchy is broken down into three levels based on the reliability of the inputs as follows:
Level—1: Uses unadjusted quoted prices that are available in active markets for identical assets or liabilities as of the reporting date. Active markets are those in which transactions for the assets or liability occur in sufficient frequency and volume to provide pricing information on an ongoing basis.
Level—2: Uses inputs other than Level 1 that are either directly or indirectly observable as of the reporting date through correlation with market data, including quoted prices for similar assets and liabilities in active markets and quoted prices in markets that are not active. Level 2 also includes assets and liabilities that are valued using models or other pricing methodologies that do not require significant judgment since the input assumptions used in the models, such as interest rates volatility factors, are corroborated by readily observable data.
Level—3: Uses inputs that are unobservable and are supported by little or no market activity and reflect the use of significant management judgment. These values are generally determined using pricing models for which the assumptions utilize management’s estimates of market participant’s assumptions.
The Company’s financial instruments consist principally of cash and cash equivalents, accounts payable, accrued liabilities, and notes payable. Pursuant to authoritative guidance, the fair value of the Company’s cash and cash equivalents is determined based on “Level 1” inputs, which consist of quoted prices in active markets for identical assets. The recorded values of all other financial instruments approximate their current fair values because of their nature and respective maturity dates or durations.
Impairment of long-lived assets
In accordance with authoritative guidance, the Company reviews its long-lived assets for impairment whenever events or changes in circumstances indicate that the carrying amounts of the assets may not be fully recoverable. To determine recoverability of its long-lived assets, the Company evaluates whether future undiscounted net cash flows will be less than the carrying amount of the assets and adjusts the carrying amount of its assets to fair value. Management has determined that no impairment of long-lived assets occurred during 2012 or 2013 (unaudited).
F-46
Table of Contents
Stock options
The Company accounts for stock-based compensation in accordance with authoritative guidance related to share-based payments, which require the Company to measure the cost of employee services received in exchange for an award of equity instruments based on the grant-date fair value of the award. That cost is recognized in the statements of operations over the period during which the employee is required to provide service in exchange for the award. No compensation cost is recognized for equity instruments for which employees do not render the requisite service. The grant-date fair value of employee share options and similar instruments is estimated using the Black-Scholes option pricing model.
Income taxes
Deferred income taxes are recognized for the tax consequences in future years of differences between the tax basis of assets and liabilities and their financial reporting amounts at each year end based on enacted tax laws and statutory tax rates applicable to the periods in which the differences are expected to affect taxable income. A provision has been made for income taxes due on taxable income and for the deferred taxes on the temporary differences. The components of the deferred tax asset and liability are individually classified as current and noncurrent based on their characteristics. Deferred tax assets and liabilities are adjusted for the effects of changes in tax laws and rates on the date of enactment. Realization of the deferred income tax assets is dependent on generating sufficient taxable income in future years.
Valuation allowances are established when necessary to reduce deferred tax assets to the amount expected to be realized. Income tax expense is the combination of the tax payable for the period and the change during the period in deferred tax assets and liabilities.
Revenue recognition
The Company recognizes revenues when the following fundamental criteria are met: (1) persuasive evidence of an arrangement exists, (2) delivery has occurred or the services have been rendered, (3) the fee is fixed or determinable, and (4) collection of the resulting receivable is reasonably assured.
The Company generally generates revenues by providing access to the Company’s online database or delivering information obtained from the database, usually in the form of periodic reports. Revenues are typically recognized on a straight-line basis over the period in which access to data or reports is provided. In certain cases the Company’s only deliverable is the delivery of a specific report or analysis, in which case revenue is recognized upon delivery of the related report.
The Company also generates revenues under service contracts where there is not a monthly subscription fee, but rather milestone payments upon the delivery of specific reports to the customer. These contracts are accounted for under the proportional performance method. Under this method, the Company recognizes revenue in proportion to the value provided to the customer for each project as of each reporting date.
Concentrations of risk
Revenues include amounts recognized from sales to certain customers who represent over 10 percent of total revenues. For the year ended December 31, 2012, one represented 64 percent of the Company’s revenues. No amounts were receivable from this customer at December 31, 2012. For the nine months ended September 30, 2012 and 2013, three and two customers represented 90 and 96 percent of the Company’s revenues, respectively. Amounts receivable from these customers were $170,200 and $0 at September 30, 2012 and 2013, respectively (unaudited).
The Company maintains cash and cash equivalent balances at various financial institutions located in Santa Clara, CA. Accounts at these institutions are secured by the Federal Deposit Insurance Corporation. At times, balances may exceed federally insured limits. The Company has not experienced any losses in such accounts. Management believes that the Company is not exposed to any significant credit risk with respect to its cash and cash equivalents.
F-47
Table of Contents
Advertising costs
The Company charges advertising costs to expense as incurred. During the year ended December 31, 2012 and the nine months ended September 30, 2012 (unaudited) and 2013 (unaudited), the Company incurred advertising costs of $0.
New accounting standards
In July 2013, the FASB issued ASU 2013-11 “Income Taxes (Topic 740)”. The amendments in this update provide guidance on the financial statement presentation of an unrecognized tax benefit when a net operating loss carryforward, similar tax loss, or tax credit carryforward exists. This guidance is effective for fiscal years and interim periods beginning after December 15, 2014, with early adoption permitted. The amendments should be applied prospectively to all unrecognized tax benefits that exist at the effective date Retrospective application is permitted. The Company is currently evaluating the impact, if any, that adoption will have on its financial statements.
(2) Fixed Assets
Fixed assets consisted of the following:
| December
31, 2012 |
September
30, 2013 |
|||||||
| (unaudited) | ||||||||
| Computer equipment |
$ | 38,639 | $ | 54,088 | ||||
| Less accumulated depreciation |
(6,013 | ) | (13,742 | ) | ||||
|
|
|
|
|
|||||
| Total fixed assets, net |
$ | 32,626 | $ | 40,346 | ||||
|
|
|
|
|
|||||
Depreciation expense was approximately $5,025 for 2012, and $3,179 and $7,728 for the nine months ended September 30, 2012 (unaudited) and 2013 (unaudited), respectively.
(3) Debt
During 2013 the Company entered into a loan and security agreement (the “growth capital line of credit”), allowing the Company to borrow up to $2,000,000 through April 30, 2013 (the “growth capital availability end date”). Interest is payable monthly on the first month following the growth capital availability end date at the prime rate plus 1.5% (4.75% at September 30, 2013). Interest only payments are made through December 31, 2013, at which point the Company must begin to pay equal monthly principal and interest payments through the maturity date of December 1, 2016. In addition, the agreement contains certain non-financial covenants. At September 30, 2013, the Company was not aware of any violations of these covenants. In conjunction with this growth capital line of credit, the Company issued fully vested and immediately exercisable warrants to purchase common stock at an exercise price of $0.12 (Note 5). At September 30, 2013, the balance of the growth capital line of credit was $2,000,000. Future minimum payments under the growth capital line of credit are as follows:
| As of September 30, 2013 and for the year ending December 31: |
||||
| 2013 remaining payments |
$ | — | ||
| 2014 |
666,667 | |||
| 2015 |
666,667 | |||
| 2016 |
666,666 | |||
|
|
|
|||
| Total |
$ | 2,000,000 | ||
|
|
|
|||
F-48
Table of Contents
(4) Stockholders’ Equity
The Second Amended and Restated Certificate of Incorporation dated February 27, 2012, authorizes the issuance of 34,000,000 shares of common stock and 10,299,712 shares of preferred stock, with a par value of $0.0001 per share. Upon filing of the Second Amended and Restated Certificate of Incorporation, each share of common and preferred stock issued and outstanding at such time was automatically split into two shares of such common or preferred stock. The accompanying financial statements have been retroactively restated to reflect the stock split for all periods presented.
Preferred stock
In November 2011 the Company entered into the Series A Preferred Stock Purchase Agreement. Under the terms of the agreement, the Company issued 9,514,746 shares of Series A Convertible Preferred Stock at $0.4204 per share for proceeds of $3,938,031, net of issuance costs of $61,968. In February 2012 the Company had a second closing of the Series A Convertible Preferred Stock whereby the Company issued an additional 784,964 shares for total proceeds of $329,999.
Dividends
Dividends are payable if and when declared by the Board of Directors. The holders of the Company’s Series A Convertible Preferred Stock are entitled to non-cumulative dividends at a rate of $0.03363 per share, per annum, when and if declared. No dividends were declared during the year ended December 31, 2012 or the nine months ended September 30, 2013 (unaudited).
Conversion
At the option of the holder, the shares of Series A Convertible Preferred Stock are convertible into Common Stock at a conversion rate of 1.00 to 1.00, subject to adjustment as defined in the Second Amended and Restated Certificate of Incorporation.
Each share of Series A Convertible Preferred Stock is automatically converted into shares of common stock at the then effective conversion rate (1) immediately prior to the closing of a firm commitment underwritten initial public offering pursuant to an effective registration statement filed under the Securities Act of 1933, covering the offer and sale of the corporation’s common stock, provided that the offering price per share is not less than $2.102, as adjusted for recapitalizations, and the aggregate gross proceeds to the corporation are not less than $30,000,000, or (2) upon the receipt by the corporation of a written request for such conversion from the holders of a majority of the preferred stock then outstanding.
Redemption
The shares of Series A Convertible Preferred Stock are not redeemable.
Liquidation preference
In the event of the liquidation, dissolution or winding up of the Company, the holders of Series A Convertible Preferred Stock are entitled, prior to distribution to common shareholders, an amount per share held equal to the sum of (1) $0.4204 (original issue price) per share and (2) all declared but unpaid dividends (if any) on such shares of preferred stock, or such lesser amount as may be approved by the holders of a majority of the outstanding shares of preferred stock. After payment to Series A Convertible Preferred Stock holders, the remaining assets of the Company legally available for distribution shall be distributed pro rata to holders of preferred stock and common stock of the Company in proportion to the number of shares of common stock held by each (with the shares of Series A Convertible Preferred Stock being treated for this purpose as if they had been converted to shares of common stock at the then applicable conversion rate) until, with respect to preferred stock, such holders have received two times the original issue price. The remaining assets are distributed pro rata to common shareholders.
F-49
Table of Contents
Voting rights
The holders of Common Stock and the Series A Convertible Preferred Stock shall vote together as a single class. Each holder of Common Stock shall be entitled to one vote for each share of Common Stock held. Each holder of Series A Convertible Preferred Stock shall be entitled to the number of votes equal to the number of shares of Common Stock into which such shares of Series A Convertible Preferred Stock could be converted.
Stock options
In 2011 the Board of Directors of the Company approved the InsightsOne Systems, Inc. 2011 Stock Plan (“the Plan”). The Plan provides for the issuance of common stock options to officers, employees, directors, consultants and other key persons of the Company. The number of shares that may be issued under the Plan may not exceed 3,355,968 shares. Options issued under the Plan generally vest over a four-year period with cliff vesting for the first year, and expire no later than ten years from the date of grant.
The Company adopted the fair value recognition provisions in accordance with authoritative guidance related to share-based payments. Compensation costs in 2012 and 2013 include the portion of awards vested in the period for all share-based payments granted, based on the grant-date fair value estimated using a Black-Scholes based option valuation model, consistent with authoritative guidance, using the weighted average assumptions in the table below:
| As
of December 31, 2012 |
As of September 30, | |||||||||||
| 2012 | 2013 | |||||||||||
| (unaudited) | (unaudited) | |||||||||||
| Expected volatility |
60 | % | 60 | % | 60 | % | ||||||
| Dividend yield |
0 | % | 0 | % | 0 | % | ||||||
| Risk-free interest rate |
0.76 | % | 0.76 | % | 0.83 | % | ||||||
| Expected terms in years |
6 | 6 | 6 | |||||||||
Expected Volatility—The expected volatility is based on a peer group in the industry in which the Company does business.
Dividend Yield—The Company has not, and does not, intend to pay dividends.
Risk-free Interest Rate—The Company applies the risk-free interest rate based on the U.S. Treasury yield in effect at the time of the grant consistent with the life of the award.
Expected Term in Years—The expected term is based upon the Company’s consideration of the historical life of options, the vesting period of the option granted and the contractual period of the option granted. For 2012 and 2013, the Company calculated the expected term as the average of the contractual term of the option and the vesting period in accordance with authoritative guidance.
Weighted Average Fair Value of Options Granted—Using the weighted average assumptions described above, the weighted average fair value of options granted was $0.05 during both the year ended December 31, 2012 and the nine months ended September 30, 2012 (unaudited). The weighted average fair value of options granted was $0.07 during the nine months ended September 30, 2013 (unaudited).
Forfeitures—Stock-based compensation expense recognized in the statements of operations is based on awards ultimately expected to vest, reduced for estimated forfeitures. Authoritative guidance applicable to stock-based compensation requires forfeitures to be estimated at the time of grant and revised, if necessary, in subsequent periods if actual forfeitures differ from those estimates. Forfeitures were estimated based on historical experience.
F-50
Table of Contents
Estimates of fair value are not intended to predict actual future events or the value ultimately realized by employees who receive equity awards, and subsequent events are not indicative of the reasonableness of the original estimates of fair value made by the Company in accordance with authoritative guidance.
A summary of the Company’s stock option activity is as follows:
| Number of Shares |
Weighted Average Exercise Price |
|||||||
| Options outstanding at December 31, 2011 |
— | |||||||
| Granted |
2,833,458 | $ | 0.09 | |||||
| Forfeited |
(1,014,100 | ) | 0.09 | |||||
| Exercised |
(475,600 | ) | 0.09 | |||||
|
|
|
|
|
|||||
| Options outstanding at December 31, 2012 |
1,343,758 | 0.09 | ||||||
| Granted |
378,920 | 0.12 | ||||||
| Forfeited |
(161,876 | ) | 0.09 | |||||
| Exercised |
(53,124 | ) | 0.09 | |||||
|
|
|
|
|
|||||
| Options outstanding at September 30, 2013 (unaudited) |
1,507,678 | $ | 0.10 | |||||
|
|
|
|
|
|||||
Additional information regarding options outstanding as of December 31, 2012 is as follows:
| Exercise Price |
Number Outstanding |
Weighted Average Remaining Contractual Life in Years |
Number Exercisable |
Weighted Average Remaining Contractual Life in Years |
||||||||||||
| $ 0.09 |
1,343,758 | 9.64 | 84,790 | 8.41 | ||||||||||||
|
|
|
|
|
|
|
|
|
|||||||||
| 1,343,758 | 9.64 | 84,790 | 8.41 | |||||||||||||
|
|
|
|
|
|
|
|
|
|||||||||
Additional information regarding options outstanding as of September 30, 2013 is as follows (unaudited):
| Exercise Price |
Number Outstanding |
Weighted Average Remaining Contractual Life in Years |
Number Exercisable |
Weighted Average Remaining Contractual Life in Years |
||||||||||||
| $0.09 |
1,128,758 | 8.86 | 398,233 | 8.68 | ||||||||||||
| $0.12 |
378,920 | 9.68 | — | — | ||||||||||||
|
|
|
|
|
|
|
|
|
|||||||||
| 1,507,678 | 9.07 | 398,233 | 8.68 | |||||||||||||
|
|
|
|
|
|
|
|
|
|||||||||
The aggregate intrinsic value of options exercised was approximately $14,000 and $2,000 during the year ended December 31, 2012 and the nine months ended September 30, 2013 (unaudited), respectively. The intrinsic value for options exercised represents the difference between the fair market value based on the valuation of the stock on the date of exercise and the exercise price of the stock option. The aggregate intrinsic value of options outstanding and exercisable was approximately $3,000 and $12,000 at December 31, 2012 and September 30, 2013 (unaudited), respectively.
During the year ended December 31, 2012, stock-based compensation expense of $16,933 was included in the statements of operations. Stock-based compensation expense of $11,523 and $20,288 for the nine months ended September 30, 2012 (unaudited) and 2013 (unaudited), respectively, was included in the statements of operations.
The Company has a 100% valuation allowance recorded against its deferred tax assets; therefore, the stock-based compensation has no tax effect on the statements of operations.
F-51
Table of Contents
As of December 31, 2012 and September 30, 2013 (unaudited), there was $72,808 and $70,021, respectively, of total unrecognized compensation expense related to unvested share-based compensation arrangements granted under the Plan. The cost is expected to be recognized over a weighted-average period of 3.35 and 2.83 years, respectively.
Certain employees early exercised their common stock options in accordance with their stock option agreement. During 2012 and 2013 (unaudited), 0 and 241,382 shares, respectively, of the restricted stock issued vested. Unvested common stock is subject to repurchase by the Company at the exercise price paid, adjusted for dividends and stock splits, in the event the employee ceases to provide services for any reason. During 2012 and 2013 (unaudited) no shares were repurchased by the Company.
Restricted stock activity for 2012 and 2013 (unaudited) is as follows:
| Number of Shares |
Weighted Average Exercise Price |
|||||||
| Non vested shares at January 1, 2012 |
— | — | ||||||
| Non vested stock exercised |
475,600 | $ | 0.09 | |||||
| Non vested stock forfeited |
— | — | ||||||
| Restricted stock vested |
— | — | ||||||
|
|
|
|
|
|||||
| Non vested shares at December 31, 2012 |
475,600 | $ | 0.09 | |||||
| Non vested stock exercised |
53,124 | $ | 0.09 | |||||
| Non vested stock forfeited |
— | — | ||||||
| Restricted stock vested |
(241,382 | ) | $ | 0.09 | ||||
|
|
|
|
|
|||||
| Non vested shares at September 30, 2013 (unaudited) |
287,342 | $ | 0.09 | |||||
|
|
|
|
|
|||||
(5) Warrants
In conjunction with the growth capital line of credit agreement in 2013 (see Note 3), the Company issued the lender warrants to purchase Common Stock at $0.12 per share. Under the terms of the agreement, the Company granted 47,558 warrants to purchase the Company’s common stock upon execution of the agreement, which represented 0.15% of the fully diluted ownership interest at such date. In addition, the Company was to grant additional warrants calculated as 0.15% of the fully diluted ownership interest upon the first advance under the loan agreement. The Company granted the lender an additional 47,558 warrants as a result. The warrants are exercisable any time until the eighth anniversary after the issue date.
The Company evaluated the provisions of the agreement and determined that the proceeds should be allocated to the loan and warrants based on their fair values. As a result, using a Black-Scholes pricing model, the Company allocated $7,066 to the warrants, which was recorded as a debt discount and amortized to interest expense on a pro-rata basis over the term of the loan.
The assumptions used in the Black-Scholes pricing model to calculate fair value of the warrants were 60%, 0%, 1.11%, and 8 for the expected volatility, dividend yield, risk-free interest rate, and expected term in years, respectively. The Company recorded $825 to interest expense associated with the amortization of the fair value of the warrants during 2013.
(6) Income Taxes
For 2012 and 2013 (unaudited), the Company paid California state income taxes of $800 each year. The Company did not pay any Federal income taxes in 2012 or 2013.
At December 31, 2012, the Company has federal net operating loss carry forwards of approximately $2,213,000 and California net operating loss carry forwards of approximately $2,213,000 each of which begin to expire in 2031.
F-52
Table of Contents
Pursuant to Sections 382 and 383 of the Internal Revenue Code, annual use of the Company’s net operating loss and credit carry forwards may be limited in the event that a cumulative change in ownership of more than 50% has occurred within a three-year period.
The Company has established a valuation allowance for all deferred tax assets including those for net operating loss and tax credit carry forwards. The valuation allowance is recorded when it is more likely than not that the deferred tax assets will not be realized.
Significant components of the Company’s deferred income taxes are as follows as of:
| December 31, |
2012 | |||
| Deferred Tax Assets: |
||||
| Net operating loss carry forward |
$ | 881,000 | ||
| Depreciation and other |
8,000 | |||
|
|
|
|||
| Total deferred tax assets |
889,000 | |||
| Valuation allowance |
(889,000 | ) | ||
|
|
|
|||
| Net deferred taxes |
$ | — | ||
|
|
|
|||
The Company applies authoritative guidance relating to the accounting for uncertainty in income taxes. The authoritative guidance prescribes a recognition threshold and measurement attribute for the financial statement recognition and measurement of a tax position taken or expected to be taken in a tax return. The authoritative guidance requires that a Company determine whether the benefits of tax positions are more likely than not of being sustained upon audit based on the technical merits of the tax position. For tax positions that are more likely than not of being sustained upon audit, the Company recognizes the largest amount of the benefits that are more likely than not of being sustained in the financial statements. For tax positions that are not more likely than not of being sustained upon audit, the Company does not recognize any portion of the benefit in the financial statements. At December 31, 2012 no portion of the Company’s net deferred tax asset (before being fully reserved) has been adjusted by the application of the authoritative guidance.
The Company classifies interest and penalties on income tax liabilities as additional income tax expense. There was no accrued interest or penalties associated with uncertain tax positions as of December 31, 2012.
The Company files income tax returns in the United States and California. As of December 31, 2012, the Company is not under examination by any major tax jurisdiction. At December 31, 2012, the Company has determined that the federal statute of limitation remains open for 2012. The statute of limitations for the state income tax returns remains open for 2012.
(7) Commitments and Contingencies
Operating leases
The Company leases office space under a month to month lease agreement. Rent expense for the years ended December 31, 2012 was $48,801. Rent expense for the nine months ended September 30, 2012 (unaudited) and 2013 (unaudited) was $34,191 and $51,878, respectively.
Litigation
In the normal course of business, the Company may possibly be named as a defendant in various lawsuits; there are no such lawsuits currently pending nor is management aware of any such potential lawsuits.
(8) Subsequent Events
The Company has evaluated subsequent events through the report date, which is December 9, 2013.
F-53
Table of Contents
Effective September 30, 2013, three of the Company’s top executives elected to defer their salaries until further notice. The Company is recording the full amount of the deferrals as liabilities until they are paid.
In November 2013 the Company’s Chief Executive Officer made a non-interest bearing cash advance of $99,000 to the Company.
In December 2013 the Company repurchased common stock from a former employee in the amount of $29,000.
F-54
Table of Contents
INDEX TO UNAUDITED PRO FORMA CONDENSED COMBINED FINANCIAL STATEMENTS
P-1
Table of Contents
UNAUDITED PRO FORMA CONDENSED COMBINED STATEMENT OF COMPREHENSIVE LOSS
Introduction to Unaudited Pro Forma Condensed Combined Statement of Comprehensive Loss
The following unaudited pro forma condensed combined statement of comprehensive loss for the year ended July 31, 2014 is presented to give effect to the acquisition of InsightsOne Systems, Inc. (“InsightsOne”) on December 19, 2013 for $17.1 million consideration transferred, consisting of Series G and Series G-1 convertible preferred shares and restricted stock units.
The pro forma information was prepared based on the historical consolidated financial statements of Apigee Corporation (“Apigee” or the “Company”) and InsightsOne after giving effect to the acquisition using the acquisition method of accounting, and after applying the assumptions, reclassifications, and adjustments described in the accompanying notes. The pro forma information is presented as if the acquisition had occurred on August 1, 2013.
Apigee and InsightsOne have different fiscal year ends. Apigee’s fiscal year ends on July 31 and InsightsOne’s fiscal year ends on December 31. The Apigee condensed statement of comprehensive loss information included herein was derived from its audited July 31, 2014 statement of comprehensive loss included in this prospectus. The InsightsOne historical statement of comprehensive loss included herein was derived from its unaudited statement of operations from August 1, 2013 through the acquisition date.
The pro forma information has been prepared for illustrative purposes only and is not intended to represent or be indicative of the consolidated financial position or results of operations in future periods or the results that actually would have been achieved had Apigee and InsightsOne been a combined company during the period presented. The pro forma information does not reflect any operating efficiencies, post-acquisition synergies or cost savings that Apigee may achieve with respect to the combined companies.
The pro forma information should be read together with (1) the accompanying notes to the unaudited pro forma condensed combined statement of comprehensive loss, (2) the audited historical financial statements and related notes included elsewhere in this prospectus, and (3) the audited historical financial statements and related notes of InsightsOne included elsewhere in this prospectus.
P-2
Table of Contents
Unaudited Pro Forma Condensed Combined Statement of Comprehensive Loss
For the year ended July 31, 2014
(in thousands, except per share amounts)
| Historical | Pro
Forma Adjustments (See Note 2) |
Pro Forma Combined |
||||||||||||||||
| Apigee | InsightsOne | |||||||||||||||||
| Revenue |
||||||||||||||||||
| License |
$ | 11,411 | $ | — | $ | — | $ | 11,411 | ||||||||||
| Subscription and support |
20,237 | — | — | 20,237 | ||||||||||||||
| Professional services and other |
21,054 | 554 | $ | — | 21,608 | |||||||||||||
|
|
|
|
|
|
|
|
|
|||||||||||
| Total revenue |
52,702 | 554 | — | 53,256 | ||||||||||||||
| Cost of revenue |
||||||||||||||||||
| License |
366 | — | 175 | (a) | 541 | |||||||||||||
| Subscription and support |
11,911 | — | 174 | 12,085 | ||||||||||||||
| Professional services and other |
15,431 | 228 | 27 | (c) | 15,686 | |||||||||||||
|
|
|
|
|
|
|
|
|
|||||||||||
| Total cost of revenue |
27,708 | 228 | 376 | 28,312 | ||||||||||||||
|
|
|
|
|
|
|
|
|
|||||||||||
| Gross profit |
24,994 | 326 | (376 | ) | 24,944 | |||||||||||||
| Operating expenses |
||||||||||||||||||
| Research and development |
22,273 | 940 | 200 | (c) | 23,413 | |||||||||||||
| Sales and marketing |
47,029 | 512 | 85 | (a)(c) | 47,626 | |||||||||||||
| General and administrative |
14,415 | 755 | (467 | ) | (b)(c)(d) | 14,703 | ||||||||||||
|
|
|
|
|
|
|
|
|
|||||||||||
| Total operating expenses |
83,717 | 2,207 | (182 | ) | 85,742 | |||||||||||||
|
|
|
|
|
|
|
|
|
|||||||||||
| Loss from operations |
(58,723 | ) | (1,881 | ) | (194 | ) | (60,798 | ) | ||||||||||
| Other income (expense), net |
(1,678 | ) | (36 | ) | — | (1,714 | ) | |||||||||||
|
|
|
|
|
|
|
|
|
|||||||||||
| Loss before provision for income taxes |
(60,401 | ) | (1,917 | ) | (194 | ) | (62,512 | ) | ||||||||||
| Provision for income taxes |
392 | — | 95 | (e) | 487 | |||||||||||||
|
|
|
|
|
|
|
|
|
|||||||||||
| Net loss and comprehensive loss |
$ | (60,793 | ) | $ | (1,917 | ) | $ | (289 | ) | $ | (62,999 | ) | ||||||
|
|
|
|
|
|
|
|
|
|||||||||||
| Net loss per share of common stock, basic and diluted |
$ | (2.34 | ) | $ | (2.43 | ) | ||||||||||||
|
|
|
|
|
|||||||||||||||
| Weighted-average shares used in computing net loss per share of common stock, basic and diluted |
25,938 | 25,938 | ||||||||||||||||
|
|
|
|
|
|||||||||||||||
See notes to unaudited pro forma condensed combined statement of comprehensive loss
P-3
Table of Contents
Notes to the Unaudited Pro Forma Condensed Combined Statement of Comprehensive Loss
Note 1. Basis of Presentation
The unaudited pro forma condensed combined statement of comprehensive loss for the year ended July 31, 2014 is presented to give effect to the acquisition of InsightsOne Systems, Inc. (“InsightsOne”) on December 19, 2013 for $17.1 million consideration transferred, consisting of Series G and Series G-1 convertible preferred shares and restricted stock units, as follows:
| (in thousands) | ||||
| Series G convertible preferred stock |
$ | 9,603 | ||
| Series G-1 convertible preferred stock |
7,421 | |||
| Restricted stock units |
31 | |||
|
|
|
|||
| Total purchase price |
$ | 17,055 | ||
|
|
|
|||
Additionally, the Company assumed $2.0 million of a growth capital loan. In accordance with the acquisition method of accounting for business combinations, the assets acquired and the liabilities assumed are recorded at their respective fair values and added to those of the Company. The excess purchase consideration over the fair values of assets acquired and liabilities assumed was recorded as goodwill.
The total purchase price was allocated using information currently available to the Company. As a result, the Company may continue to adjust the preliminary purchase price allocation after obtaining more information regarding asset valuations, liabilities assumed and revisions of preliminary estimates.
Under the acquisition method, acquisition-related transaction costs (e.g., advisory, legal, valuation and other professional fees) are not included as consideration transferred but are accounted for as expenses in the periods in which the costs are incurred. These costs are not presented in the unaudited pro forma condensed combined statement of comprehensive loss because they will not have a continuing impact on the combined results.
The unaudited pro forma condensed combined statement of comprehensive loss reflect certain adjustments that are necessary to present fairly our unaudited pro forma condensed combined statement of comprehensive loss. The pro forma adjustments give effect to events that are (1) directly attributable to the acquisition, (2) factually supportable and (3) with respect to the statement of comprehensive loss, expected to have a continuing impact on us, and are based on assumptions that management believes are reasonable given the best information currently available.
Accounting Periods Presented
InsightsOne’s last fiscal year ended on December 31, 2013 and, for purposes of this unaudited pro forma condensed combined statement of comprehensive loss, its historical results have been aligned to conform to the Company’s fiscal year ended July 31, 2014. The historical results of InsightsOne were derived using the unaudited historical results of operations from August 1, 2013 through the acquisition date. Subsequently, the results of InsightsOne have been combined with the Company’s results from the acquisition date through July 31, 2014.
Reclassifications
The Company made certain reclassification adjustments to the presentation of InsightsOne’s historical statement of operations in order to conform to the Company’s presentation. Sales and marketing expenses, which were combined with general and administrative expenses, were reclassified as a separate line item. Additionally, certain personnel-related expenses and facilities costs which were included in general and administrative expenses were allocated to each department based on the Company’s allocation methodology.
P-4
Table of Contents
Note 2. Pro Forma Adjustments
The accompanying unaudited pro forma condensed combined statement of comprehensive loss has been prepared as if the acquisition was completed on August 1, 2013 for statement of comprehensive loss purposes and reflects the following pro forma adjustments:
| (a) | To record $0.3 million of estimated amortization expense associated with the fair value of acquired developed technology and $0.1 million of estimated amortization expense associated with the fair value of acquired customer relationships, as follows: |
| (in thousands) | ||||
| Cost of revenues—license |
$ | 349 | ||
| Sales and marketing |
58 | |||
| (b) | To eliminate $32,000 of stock-based compensation expense recorded in the historical statement of operations of InsightsOne. The outstanding awards of former InsightsOne employees were replaced with Series G-1 convertible preferred stock and restricted stock units of the Company. |
| (c) | To record $0.6 million of estimated stock-based compensation expense associated with Series G-1 awards issued to former employees of InsightsOne, as follows: |
| (in thousands) | ||||
| Cost of revenues—professional services and other |
$ | 27 | ||
| Research and development |
200 | |||
| Sales and marketing |
27 | |||
| General and administrative |
308 | |||
| (d) | To eliminate $0.4 million in transaction costs incurred by the Company and $0.3 million transactions costs incurred by InsightsOne as a result of the acquisition, primarily consisting of legal and advisory fees. |
| (e) | To remove the tax benefit of $0.1 million related to goodwill resulting from the release of valuation allowance. As both Apigee and InsightsOne have a full valuation allowance in the U.S., there is no tax impact on the pro forma adjustments. |
P-5
Table of Contents

Table of Contents
PART II—INFORMATION NOT REQUIRED IN PROSPECTUS
ITEM 13. OTHER EXPENSES OF ISSUANCE AND DISTRIBUTION.
The following table sets forth all expenses to be paid by Apigee Corporation (the “Registrant”), other than underwriting discounts and commissions, upon completion of this offering. All amounts shown are estimates except for the Securities and Exchange Commission (“SEC”) registration fee and the Financial Industry Regulatory Authority, Inc. (“FINRA”) filing fee.
| SEC registration fee |
$ | 10,023 | ||
| FINRA filing fee |
13,438 | |||
| NASDAQ listing fee |
125,000 | |||
| Printing and engraving |
* | |||
| Legal fees and expenses |
* | |||
| Accounting fees and expenses |
* | |||
| Blue sky fees and expenses |
* | |||
| Transfer agent and registrar fees |
* | |||
| Miscellaneous |
* | |||
|
|
|
|||
| Total |
$ | * | ||
|
|
|
| * | To be filed by amendment. |
ITEM 14. INDEMNIFICATION OF DIRECTORS AND OFFICERS.
Section 145 of the Delaware General Corporation Law authorizes a corporation’s board of directors to grant, and authorizes a court to award, indemnification to officers, directors and other corporate agents.
On completion of this offering, as permitted by Section 102(b)(7) of the Delaware General Corporation Law, the Registrant’s amended and restated certificate of incorporation will include provisions that eliminate the personal liability of its directors for monetary damages for breach of their fiduciary duty as directors, excluding liability for any breach of the duty of loyalty.
In addition, as permitted by Section 145 of the Delaware General Corporation Law, the amended and restated certificate of incorporation and amended and restated bylaws of the Registrant will provide that:
| • | The Registrant shall indemnify its directors and officers for serving the Registrant in those capacities or for serving other business enterprises at the Registrant’s request, to the fullest extent permitted by Delaware law. Delaware law provides that a corporation may indemnify such person if such person acted in good faith and in a manner such person reasonably believed to be in or not opposed to the best interests of the Registrant and, with respect to any criminal proceeding, had no reasonable cause to believe such person’s conduct was unlawful. |
| • | The Registrant may, in its discretion, indemnify employees and agents in those circumstances where indemnification is permitted by applicable law. |
| • | The Registrant is required to advance expenses, as incurred, to its directors and officers in connection with defending a proceeding, provided that such director or officer shall undertake to repay such advances if it is ultimately determined that such person is not entitled to indemnification. |
| • | The Registrant will not be obligated pursuant to the amended and restated bylaws to indemnify a person with respect to proceedings initiated by that person, except with respect to proceedings authorized by the Registrant’s board of directors or brought to enforce a right to indemnification. |
| • | The rights conferred in the amended and restated certificate of incorporation and amended and restated bylaws are not exclusive, and the Registrant is authorized to enter into indemnification agreements with its directors, officers, employees and agents and to obtain insurance to indemnify such persons. |
II-1
Table of Contents
| • | The Registrant may not retroactively amend the bylaw provisions to reduce its indemnification obligations to directors, officers, employees and agents. |
The Registrant’s policy is to enter into separate indemnification agreements with each of its directors and officers that provide the maximum indemnity allowed to directors and executive officers by Section 145 of the Delaware General Corporation Law and also to provide for certain additional procedural protections. The Registrant also maintains directors and officers insurance to insure such persons against certain liabilities.
These indemnification provisions and the indemnification agreements entered into between the Registrant and its officers and directors may be sufficiently broad to permit indemnification of the Registrant’s officers and directors for liabilities (including reimbursement of expenses incurred) arising under the Securities Act of 1933, as amended (the “Securities Act”).
The underwriting agreement to be filed as Exhibit 1.1 to this registration statement provides for indemnification by the underwriters of the Registrant and its officers and directors for certain liabilities arising under the Securities Act and otherwise.
ITEM 15. RECENT SALES OF UNREGISTERED SECURITIES.
Since August 1, 2011, the Registrant issued the following unregistered securities:
Sales of Series E Preferred Stock
In November 2011, the Registrant issued 12,104,444 shares of Series E preferred stock to 18 accredited investors at a per share purchase price of $0.5783, for an aggregate purchase price of approximately $7.0 million.
Sales of Series F Preferred Stock
In July 2012 and February 2013, the Registrant issued 13,114,861 shares of Series F preferred stock to 23 accredited investors at a per share purchase price of $1.5288, for an aggregate purchase price of approximately $20.0 million.
Sales of Series G Preferred Stock
In July 2013, the Registrant issued 15,730,725 shares of Series G preferred stock to 19 accredited investors at a per share purchase price of $2.224945, for an aggregate purchase price of approximately $35.0 million.
Issuance of Series G-1 and Series G Preferred Stock
In December 2013 pursuant to Regulation D (Rule 506) of the Securities Act, the Registrant issued an aggregate of 5,181,757 shares and 3,887,736 shares of its Series G-1 and Series G convertible preferred stock, respectively, to 37 accredited investors and 5 sophisticated investors, as consideration for its acquisition of InsightsOne Systems, Inc.
Sales of Series H Preferred Stock
In April and May 2014, the Registrant issued 20,637,076 shares of Series H preferred stock to 32 accredited investors at a per share purchase price of $2.91, for an aggregate purchase price of approximately $60.1 million.
Option and Common Stock Issuances
(a) Incentive Plan Grants
From August 1, 2011 through March 20, 2015, the Registrant granted to its officers, directors, employees, consultants and other service providers options to purchase an aggregate of 43,056,883 shares of common stock under its 2005 Stock Incentive Plan at exercise prices ranging from $0.06 to $2.31 per share. Of the options
II-2
Table of Contents
granted, options to purchase 1,202,362 shares of common stock were granted to three non-employee directors with exercise prices ranging from $0.09 to $2.31 per share; options to purchase 14,884,736 shares of common stock were granted to eight executives with exercise prices ranging from $0.06 to $2.31 per share and options to purchase 913,924 shares of common stock were granted to 23 consultants and other service providers with exercise prices ranging from $0.06 to $2.31 per share.
From August 1, 2011 to March 20, 2015, the Registrant granted 795,337 RSUs to certain of its officers, directors, employees, consultants and other service providers under its 2005 Stock Incentive Plan. In addition, the Registrant issued 125,176 RSUs in connection with its acquisition of InsightsOne Systems, Inc.
(b) Warrant Issuances and Non-plan Option Grants
From August 1, 2011 through March 20, 2015, the Registrant issued warrants to three accredited investors to purchase 6,978,746 shares of its common stock at exercise prices ranging from $0.09 to $1.80 per share.
On October 25, 2014, pursuant to Section 4(2) of the Securities Act, the Registrant issued a non-plan option to a service provider to purchase 9,000 shares of its common stock to a sophisticated investor with adequate access to information about the Registrant at an exercise price of $1.67 per share.
(c) Common Stock Issuances
From August 1, 2011 through March 20, 2015, the Registrant issued and sold 195,000 shares of its common stock, at exercise prices ranging from $0.09 to $0.97 per share, for an aggregate exercise price of $40,150, to certain consultants and other service providers in transactions deemed to be exempt from registration under the Securities Act in reliance upon Section 4(2) of the Securities Act as transactions by an issuer not involving any public offering. Each of the recipients of securities in these transactions was either an accredited investor or a sophisticated person that had adequate access, through their relationships with the Registrant, to information about the Registrant.
From August 1, 2011 through March 20, 2015, the Registrant issued and sold 277,582 shares of its common stock, at exercise prices ranging from $0.06 to $1.20 per share, for an aggregate exercise price of $104,833.16, to certain consultants and other service providers through offers and sales of securities pursuant to certain compensatory benefit plans and contracts relating to compensation deemed to be exempt from registration under the Securities Act in reliance upon Rule 701 promulgated under Section 3(b) of the Securities Act.
None of the foregoing transactions involved any underwriters, underwriting discounts or commissions or any public offering.
The recipients of the offers, sales and issuances of the securities described above represented their intention to acquire the securities for investment only and not with a view to or for sale in connection with any distribution thereof, and appropriate legends were affixed to the stock certificates and instruments issued in such transactions. All recipients had adequate access, through their relationships with the Registrant, to information about the Registrant.
ITEM 16. EXHIBITS AND FINANCIAL STATEMENT SCHEDULES.
(a) Exhibits.
The Registrant filed the exhibits listed on the accompanying Exhibit Index of this Registration Statement, which is incorporated by reference herein.
(b) Financial Statement Schedules.
All financial statement schedules are omitted because the information called for is not required or is shown either in the consolidated financial statements or in the notes thereto.
II-3
Table of Contents
ITEM 17. UNDERTAKINGS.
The undersigned Registrant hereby undertakes to provide to the underwriters at the closing specified in the underwriting agreement certificates in such denominations and registered in such names as required by the underwriters to permit prompt delivery to each purchaser.
Insofar as indemnification for liabilities arising under the Securities Act of 1933 may be permitted to directors, officers, and controlling persons of the Registrant pursuant to the foregoing provisions, or otherwise, the Registrant has been advised that in the opinion of the Securities and Exchange Commission such indemnification is against public policy as expressed in the Act and is, therefore, unenforceable. In the event that a claim for indemnification against such liabilities (other than the payment by the Registrant of expenses incurred or paid by a director, officer, or controlling person of the Registrant in the successful defense of any action, suit, or proceeding) is asserted by such director, officer, or controlling person in connection with the securities being registered, the Registrant will, unless in the opinion of its counsel the matter has been settled by controlling precedent, submit to a court of appropriate jurisdiction the question whether such indemnification by it is against public policy as expressed in the Act and will be governed by the final adjudication of such issue.
The undersigned Registrant hereby undertakes that:
| (1) | For purposes of determining any liability under the Securities Act of 1933, the information omitted from the form of prospectus filed as part of this registration statement in reliance upon Rule 430A and contained in a form of prospectus filed by the Registrant pursuant to Rule 424(b)(1) or (4) or 497(h) under the Securities Act shall be deemed to be part of this registration statement as of the time it was declared effective. |
| (2) | For the purpose of determining any liability under the Securities Act of 1933, each post-effective amendment that contains a form of prospectus shall be deemed to be a new registration statement relating to the securities offered therein, and the offering of such securities at that time shall be deemed to be the initial bona fide offering thereof. |
II-4
Table of Contents
SIGNATURES
Pursuant to the requirements of the Securities Act of 1933, the Registrant has duly caused this registration statement on Form S-1 to be signed on its behalf by the undersigned, thereunto duly authorized, in San Jose, California, on the 19th day of March 2015.
| APIGEE CORPORATION | ||
| By: |
/s/ Chet Kapoor | |
| Chet Kapoor | ||
| Chief Executive Officer | ||
POWER OF ATTORNEY
KNOW ALL PERSONS BY THESE PRESENTS, that each person whose signature appears below hereby constitutes and appoints Chet Kapoor, Tim Wan and Stacey Giamalis, and each of them, as his true and lawful attorney-in-fact and agent with full power of substitution, for him in any and all capacities, to sign any and all amendments to this registration statement (including post-effective amendments or any abbreviated registration statement and any amendments thereto filed pursuant to Rule 462(b) increasing the number of securities for which registration is sought), and to file the same, with all exhibits thereto and other documents in connection therewith, with the Securities and Exchange Commission, granting unto said attorney-in-fact, proxy and agent full power and authority to do and perform each and every act and thing requisite and necessary to be done in connection therewith, as fully for all intents and purposes as he might or could do in person, hereby ratifying and confirming all that said attorney-in-fact, proxy and agent, or his substitute, may lawfully do or cause to be done by virtue hereof.
Pursuant to the requirements of the Securities Act of 1933, this registration statement on Form S-1 has been signed by the following persons in the capacities and on the dates indicated.
| Signature |
Title |
Date | ||
| /s/ Chet Kapoor | Chief Executive Officer and Director (Principal Executive Officer) |
March 19, 2015 | ||
|
Chet Kapoor |
||||
| /s/ Tim Wan | Chief Financial Officer (Principal Accounting and Financial Officer) |
March 19, 2015 | ||
|
Tim Wan |
||||
| /s/ Bob L. Corey | Director | March 19, 2015 | ||
|
Bob L. Corey |
||||
| /s/ Neal Dempsey | Director | March 19, 2015 | ||
|
Neal Dempsey |
||||
| /s/ Promod Haque | Director | March 19, 2015 | ||
|
Promod Haque |
||||
| /s/ William “BJ” Jenkins, Jr. | Director | March 19, 2015 | ||
|
William “BJ” Jenkins, Jr. |
||||
| /s/ Edmond Mesrobian | Director | March 19, 2015 | ||
|
Edmond Mesrobian |
||||
| /s/ Robert Schwartz | Director | March 19, 2015 | ||
|
Robert Schwartz |
||||
II-5
Table of Contents
EXHIBIT INDEX
| Exhibit Number |
Description | |
| 1.1** | Form of Underwriting Agreement | |
| 3.1 | Amended and Restated Certificate of Incorporation of the Registrant, as currently in effect | |
| 3.2** | Form of Amended and Restated Certificate of Incorporation of the Registrant, to be in effect immediately prior to the completion of this offering | |
| 3.3 | Bylaws of the Registrant, as currently in effect | |
| 3.4** | Form of Amended and Restated Bylaws of the Registrant, to be in effect immediately prior to the completion of this offering | |
| 4.1 | Amended and Restated Investors’ Rights Agreement dated as of April 17, 2014, by and among the Registrant and the other parties thereto | |
| 4.2 | Warrant to Purchase Common Stock issued by the Registrant to Silicon Valley Bank, dated as of May 1, 2012, as amended on October 3, 2012 | |
| 4.3 | Form of Warrant to purchase common stock issued by the Registrant to Silicon Valley Bank | |
| 4.4** | Specimen common stock certificate of the Registrant | |
| 5.1** | Opinion of Wilson Sonsini Goodrich & Rosati, Professional Corporation | |
| 10.1 | Form of Indemnification Agreement by and between the Registrant and each of its directors and executive officers, to be in effect upon the completion of this offering | |
| 10.2+ | 2005 Stock Incentive Plan, as amended, and form of agreements thereunder | |
| 10.3+** | 2015 Equity Incentive Plan and forms of agreements thereunder | |
| 10.4+** | 2015 Employee Stock Purchase Plan and form of agreement thereunder | |
| 10.5+** | Offer Letter, by and between the Registrant and Chet Kapoor, dated December 18, 2006 | |
| 10.6+** | Offer Letter, by and between the Registrant and Tim Wan, dated February 27, 2015 | |
| 10.7+** | Offer Letter, by and between the Registrant and Stacey Giamalis, dated September 16, 2013 | |
| 10.8+** | Offer Letter, by and between the Registrant and Anant Jhingran, dated August 29, 2011 | |
| 10.9+** | Offer Letter, by and between the Registrant and Shankar Ramaswamy, dated May 14, 2013 | |
| 10.10+** | Offer Letter, by and between the Registrant and Stephen Rowland, dated May 23, 2012 | |
| 10.11+ | Separation Agreement, by and between the Registrant and Steve Valenzuela, dated November 22, 2014 | |
| 10.12 | Amended and Restated Loan and Security Agreement dated as of November 17, 2014, by and between the Registrant and Silicon Valley Bank | |
| 10.13 | Office Lease, by and between the Registrant and CA-10 Almaden Limited Partnership, dated October 18, 2013 | |
| 10.14+ | Executive Incentive Compensation Plan | |
| 21.1 | List of subsidiaries of the Registrant | |
| 23.1 | Consent of KPMG LLP, Independent Registered Public Accounting Firm | |
| 23.2 | Consent of Mayer Hoffman McCann P.C., Independent Auditor | |
| 23.3** | Consent of Wilson Sonsini Goodrich & Rosati, P.C. (included in Exhibit 5.1) | |
| 24.1 | Power of Attorney (included in page II-5 to this Registration Statement on Form S-1) | |
| ** | To be filed by amendment. |
| + | Indicates a management contract or compensatory plan or arrangement. |