Attached files
| file | filename |
|---|---|
| 8-K - FORM 8-K - NexPoint Residential Trust, Inc. | d893356d8k.htm |
| Exhibit 99.1
|
NEXPOINT RESIDENTIAL TRUST
Investor Presentation March 2015
an affiliate of
|
|
CAUTIONARY STATEMENTS
Forward-Looking Statements
This presentation includes forward-looking statements. These statements reflect the current views of the Company’s management with respect to future events and financial performance. These statements include forward-looking statements with respect to the Company’s business and industry in general. Statements that include the words “expect,” “intend,” “estimate,” “may,” “should,” “anticipate” and similar statements of a future or forward-looking nature identify forward-looking statements for purposes of the federal securities laws or otherwise. Forward-looking statements address matters that involve risks and uncertainties. Accordingly, there are or will be important factors that could cause the Company’s actual results to differ materially from those indicated in these statements. For a discussion of the factors that could change these forward-looking statements, see our filings with the SEC. The statements made herein speak only as of the date of this presentation and the Company does not undertake to update this information except as required by law. Past performance does not guarantee future results. Performance during time periods shown is limited and may not reflect the performance in different economic and market cycles. There can be no assurance that similar performance will be experienced.
Non-GAAP Financial Measures
This presentation contains non-GAAP financial measures. A “non-GAAP financial measure” is defined as a numerical measure of a Company’s financial performance that excludes or includes amounts so as to be different than the most directly comparable measure calculated and presented in accordance with GAAP in the statements of income, balance sheets or statements of cash flow of the Company. The non-GAAP financial measures used within this presentation are funds from operations, or FFO, adjusted funds from operations, or AFFO, and net operating income, or NOI. FFO is defined by NAREIT as net income computed in accordance with GAAP, excluding gains or losses from real estate dispositions, plus real estate depreciation and amortization and impairment charges. We compute FFO in accordance with NAREIT’s definition. AFFO is calculated by adjusting FFO by adding back items that do not reflect ongoing property operations, such as acquisition expenses, equity-based compensation expenses and the amortization of deferred loan costs. AFFO will also be adjusted to include any gains (losses) from sales of property to the extent excluded from FFO, and operating property capital expenditures. NOI is calculated by adjusting net income to add back interest, depreciation and amortization, advisory management fees, advisory reimbursement of operating expenses, and advisory administrative fees. We believe that the use of FFO, AFFO and NOI, combined with the required GAAP presentations, improves the understanding of operating results of REITs among investors and makes comparisons of operating results among such companies more meaningful. While FFO, AFFO and NOI are relevant and widely used measures of operating performance of REITs, they do not represent cash flows from operations or net income as defined by GAAP and should not be considered an alternative to those measures in evaluating our liquidity or operating performance. FFO, AFFO and NOI do not purport to be indicative of cash available to fund our future cash requirements. Further, our computation of FFO, AFFO and NOI may not be comparable to FFO, AFFO and NOI reported by other REITs. For additional information about our non-GAAP financial measures, see page 27 of this presentation and our filings with the SEC.
Additional Information
This presentation provides a summary of the Company’s information statement filed as an exhibit to the Company’s registration statement on Form 10 that was declared effective by the SEC on March 18, 2015 and is qualified by the disclosures contained in the Form 10. Investors are urged to read the Form 10 in its entirety. For additional information, see our filings with the SEC. The final information statement will be mailed to stockholders of record as of March 23, 2015.
an affiliate of
| 1 |
|
|
|
EXECUTIVE SUMMARY
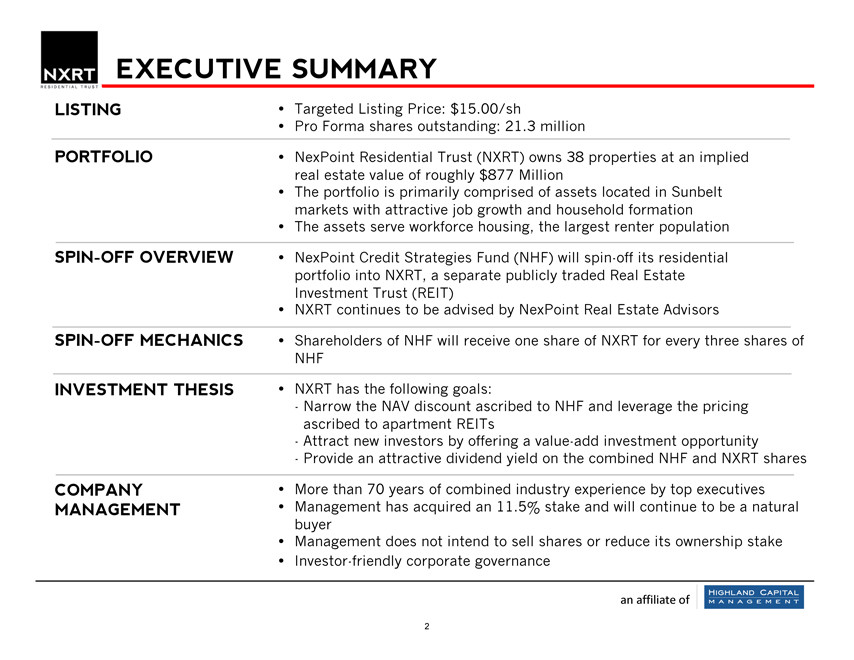
LISTING
Targeted Listing Price: $15.00/sh
Pro Forma shares outstanding: 21.3 million
PORTFOLIO
NexPoint Residential Trust (NXRT) owns 38 properties at an implied
real estate value of roughly $877 Million
The portfolio is primarily comprised of assets located in Sunbelt
markets with attractive job growth and household formation
The assets serve workforce housing, the largest renter population
SPIN-OFF
OVERVIEW
NexPoint Credit Strategies Fund (NHF) will spin-off its residential
portfolio into NXRT, a separate publicly traded Real Estate
Investment Trust (REIT)
NXRT continues to be advised by NexPoint Real Estate Advisors
SPIN-OFF
MECHANICS
Shareholders of NHF will receive one share of NXRT for every three shares of
NHF
INVESTMENT THESIS
NXRT has the following goals:
- Narrow the NAV discount ascribed to NHF and leverage the pricing
ascribed to apartment REITs
- Attract new investors by offering a value-add investment opportunity
- Provide an attractive dividend yield on the combined NHF and NXRT shares
COMPANY
More than 70 years of combined industry experience by top executives
MANAGEMENT
Management has acquired an 11.5% stake and will continue to be a natural
buyer
Management does not intend to sell shares or reduce its ownership stake
Investor-friendly corporate governance
an affiliate of
2
|
|
LISTING OVERVIEW
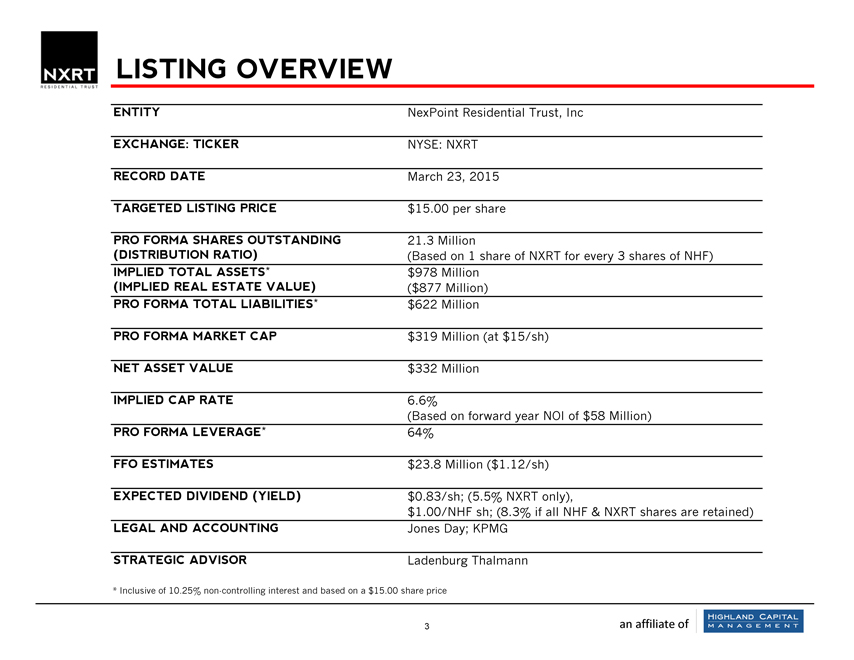
ENTITY
NexPoint Residential Trust, Inc
EXCHANGE: TICKER
NYSE: NXRT
RECORD DATE
March 23, 2015
TARGETED LISTING PRICE
$15.00 per share
PRO FORMA SHARES OUTSTANDING
21.3 Million
(DISTRIBUTION RATIO)
(Based on 1 share of NXRT for every 3 shares of NHF)
IMPLIED TOTAL ASSETS*
$978 Million
(IMPLIED REAL ESTATE VALUE)
($877 Million)
PRO FORMA TOTAL LIABILITIES*
$622 Million
PRO FORMA MARKET CAP
$319 Million (at $15/sh)
NET ASSET VALUE
$332 Million
IMPLIED CAP RATE
6.6%
(Based on forward year NOI of $58 Million)
PRO FORMA LEVERAGE*
64%
FFO ESTIMATES
$23.8 Million ($1.12/sh)
EXPECTED DIVIDEND (YIELD)
$0.83/sh; (5.5% NXRT only),
$1.00/NHF sh; (8.3% if all NHF & NXRT shares are retained)
LEGAL AND ACCOUNTING
Jones Day; KPMG
STRATEGIC ADVISOR
Ladenburg Thalmann
* Inclusive of 10.25% non-controlling interest and based on a $15.00 share price
an affiliate of
|
|
BACKGROUND
| • |
|
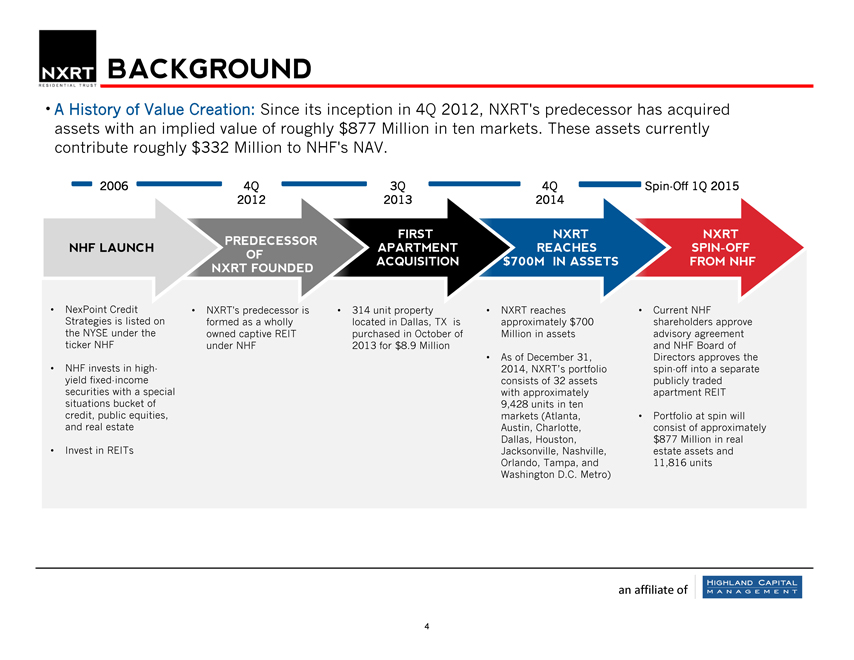
A History of Value Creation: Since its inception in 4Q 2012, NXRT’s predecessor has acquired assets with an implied value of roughly $877 Million in ten markets. These assets currently contribute roughly $332 Million to NHF’s NAV. |
2006 4Q 3Q 4Q Spin-Off 1Q 2015
FIRST NXRT NXRT PREDECESSOR
NHF LAUNCH APARTMENT REACHES SPIN-OFF OF
ACQUISITION 700M IN ASSETS FROM NHF NXRT FOUNDED
| • |
|
NexPoint Credit NXRT’s predecessor is 314 unit property NXRT reaches Current NHF |
Strategies is listed on formed as a wholly located in Dallas, TX is approximately $700 shareholders approve the NYSE under the owned captive REIT purchased in October of Million in assets advisory agreement ticker NHF under NHF 2013 for $8.9 Million and NHF Board of
| • |
|
As of December 31, Directors approves the |
| • |
|
NHF invests in high- 2014, NXRT’s portfolio spin-off into a separate yield fixed-income consists of 32 assets publicly traded securities with a special with approximately apartment REIT situations bucket of 9,428 units in ten credit, public equities, markets (Atlanta, Portfolio at spin will and real estate Austin, Charlotte, consist of approximately Dallas, Houston, $877 Million in real |
| • |
|
Invest in REITs Jacksonville, Nashville, estate assets and Orlando, Tampa, and 11,816 units Washington D.C. Metro) |
an affiliate of
| 4 |
|
|
|
EXPERIENCED & PROVEN TEAM
Senior Management
Ownership % in ()
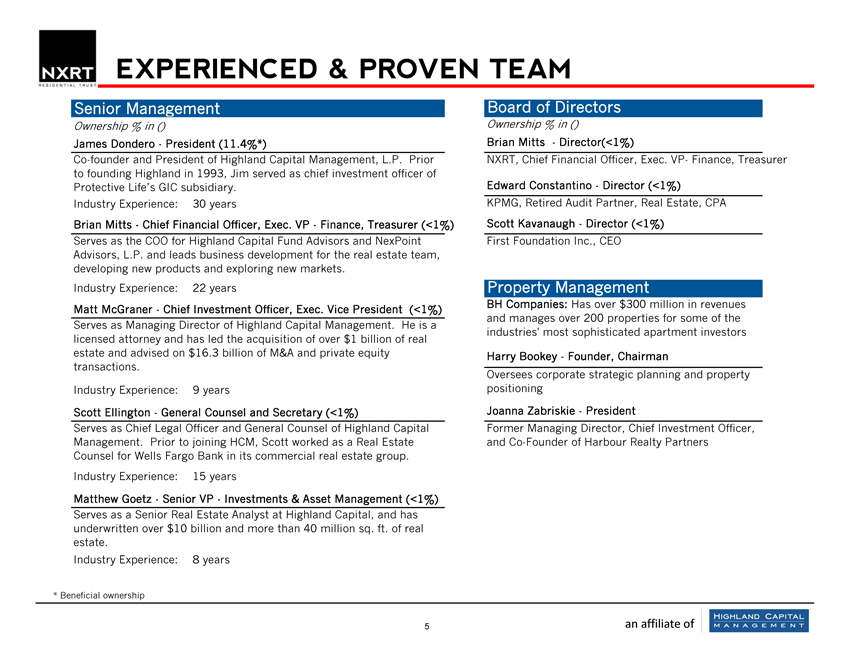
James Dondero—President (11.4%*)
Co-founder and President of Highland Capital Management, L.P. Prior to founding Highland in 1993, Jim served as chief investment officer of Protective Life’s GIC subsidiary.
Industry Experience: 30 years
Brian Mitts—Chief Financial Officer, Exec. VP—Finance, Treasurer (<1%) Serves as the COO for Highland Capital Fund Advisors and NexPoint Advisors, L.P. and leads business development for the real estate team, developing new products and exploring new markets.
Industry Experience: 22 years
Matt McGraner—Chief Investment Officer, Exec. Vice President (<1%) Serves as Managing Director of Highland Capital Management. He is a licensed attorney and has led the acquisition of over $1 billion of real estate and advised on $16.3 billion of M&A and private equity transactions.
Industry Experience: 9 years
Scott Ellington—General Counsel and Secretary (<1%)
Serves as Chief Legal Officer and General Counsel of Highland Capital Management. Prior to joining HCM, Scott worked as a Real Estate Counsel for Wells Fargo Bank in its commercial real estate group. Industry Experience: 15 years Matthew Goetz—Senior VP—Investments & Asset Management (<1%) Serves as a Senior Real Estate Analyst at Highland Capital, and has underwritten over $10 billion and more than 40 million sq. ft. of real estate.
Industry Experience: 8 years
| * |
|
Beneficial ownership |
Board of Directors
Ownership % in ()
Brian Mitts —Director(<1%)
NXRT, Chief Financial Officer, Exec. VP- Finance, Treasurer
Edward Constantino—Director (<1%)
KPMG, Retired Audit Partner, Real Estate, CPA Scott Kavanaugh—Director (<1%) First Foundation Inc., CEO
Property Management
BH Companies: Has over $300 million in revenues and manages over 200 properties for some of the industries’ most sophisticated apartment investors
Harry Bookey—Founder, Chairman
Oversees corporate strategic planning and property positioning Joanna Zabriskie—President Former Managing Director, Chief Investment Officer, and Co-Founder of Harbour Realty Partners
| 5 |
|
an affiliate of |
|
|
STRUCTURE
| • |
|
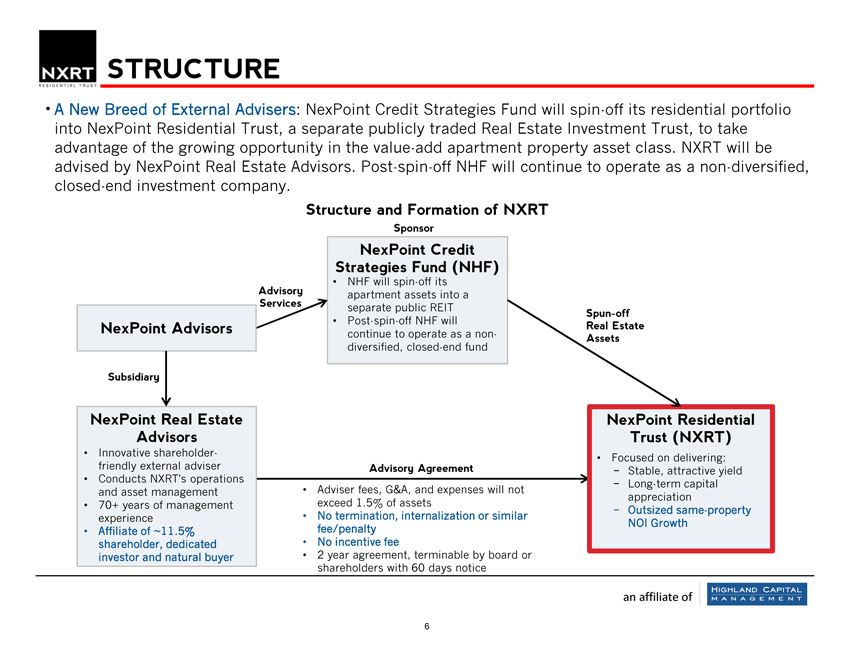
A New Breed of External Advisers: NexPoint Credit Strategies Fund will spin-off its residential portfolio into NexPoint Residential Trust, a separate publicly traded Real Estate Investment Trust, to take advantage of the growing opportunity in the value-add apartment property asset class. NXRT will be advised by NexPoint Real Estate Advisors. Post-spin-off NHF will continue to operate as a non-diversified, closed-end investment company. |
Structure and Formation of NXRT
Sponsor
NexPoint Credit Strategies Fund (NHF)
| • |
|
NHF will spin-off its apartment assets into a separate public REIT |
| • |
|
Post-spin-off NHF will continue to operate as a non-diversified, closed-end fund |
Advisory Services
NexPoint Advisors
Subsidiary
NexPoint Real Estate Advisors
| • |
|
Innovative shareholder-friendly external adviser |
| • |
|
Conducts NXRT’s operations and asset management |
| • |
|
70+ years of management experience |
| • |
|
Affiliate of ~11.5% shareholder, dedicated investor and natural buyer |
Advisory Agreement
| • |
|
Adviser fees, G&A, and expenses will not exceed 1.5% of assets |
| • |
|
No termination, internalization or similar fee/penalty |
| • |
|
No incentive fee |
| • |
|
2 year agreement, terminable by board or shareholders with 60 days notice |
Spun-off Real Estate Assets
NexPoint Residential Trust (NXRT)
| • |
|
Focused on delivering: |
- Stable, attractive yield
- Long-term capital appreciation
- Outsized same-property NOI Growth
an affiliate of
|
|
INVESTMENT THESIS
NARROW DISCOUNT AND APARTMENT REIT PRICING
| • |
|
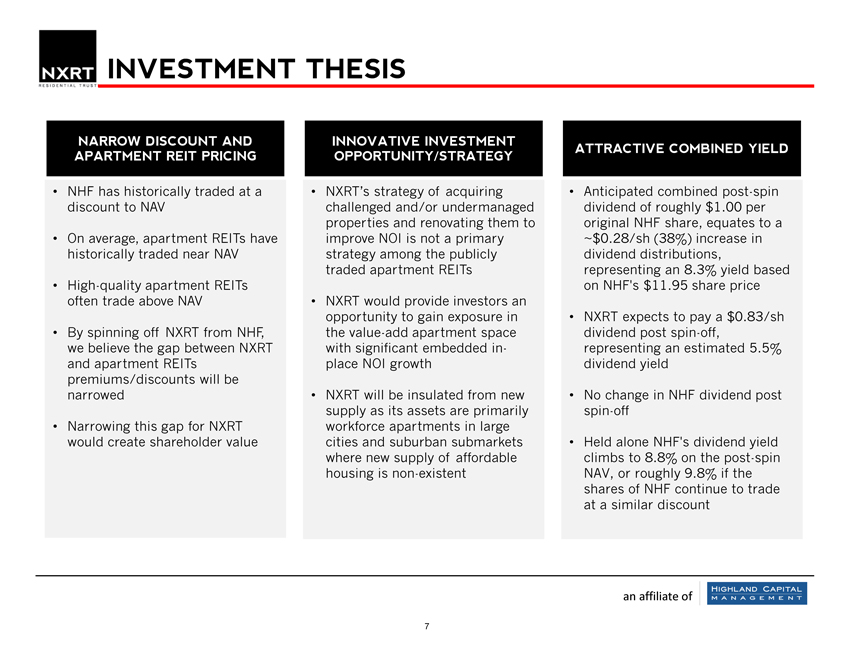
NHF has historically traded at a discount to NAV |
| • |
|
On average, apartment REITs have historically traded near NAV |
| • |
|
High-quality apartment REITs often trade above NAV |
| • |
|
By spinning off NXRT from NHF, we believe the gap between NXRT and apartment REITs premiums/discounts will be narrowed |
| • |
|
Narrowing this gap for NXRT would create shareholder value |
INNOVATIVE INVESTMENT OPPORTUNITY/STRATEGY
| • |
|
NXRT’s strategy of acquiring challenged and/or undermanaged properties and renovating them to improve NOI is not a primary strategy among the publicly traded apartment REITs |
| • |
|
NXRT would provide investors an opportunity to gain exposure in the value-add apartment space with significant embedded in-place NOI growth |
| • |
|
NXRT will be insulated from new supply as its assets are primarily workforce apartments in large cities and suburban submarkets where new supply of affordable housing is non-existent |
ATTRACTIVE COMBINED YIELD
| • |
|
Anticipated combined post-spin dividend of roughly $1.00 per original NHF share, equates to a |
~$0.28/sh (38%) increase in dividend distributions, representing an 8.3% yield based on NHF’s $11.95 share price
| • |
|
NXRT expects to pay a $0.83/sh dividend post spin-off, representing an estimated 5.5% dividend yield |
| • |
|
No change in NHF dividend post spin-off |
| • |
|
Held alone NHF’s dividend yield climbs to 8.8% on the post-spin NAV, or roughly 9.8% if the shares of NHF continue to trade at a similar discount |
an affiliate of
| 7 |
|
|
|
INVESTMENT THESIS: NARROW DISCOUNT
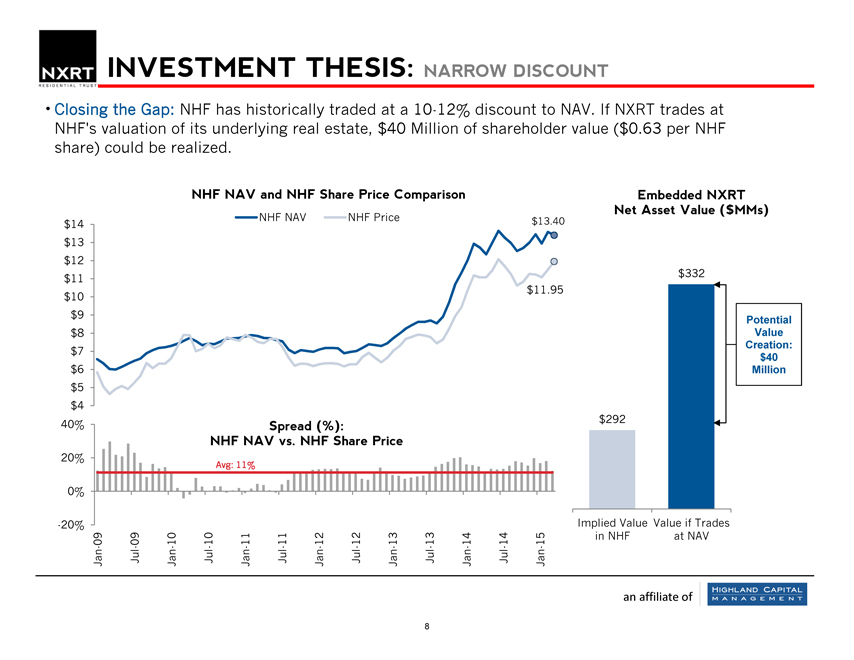
Closing the Gap: NHF has historically traded at a 10-12% discount to NAV. If NXRT trades at NHF’s valuation of its underlying real estate, $40 Million of shareholder value ($0.63 per NHF share) could be realized.
NHF NAV and NHF Share Price Comparison
NHF NAV NHF Price
NHF NAV NHF Price $13.40 $14 $13 $12 $11
$11.95 $10 $9 $8 $7 $6 $5 $4
40% Spread (%):
NHF NAV vs. NHF Share Price
20%
Avg: 11%
0%
-20%
09 09—10 10—11—11 12—12 13—13 14 14—15 Jan- Jul Jan- Jul Jan- Jul Jan- Jul Jan- Jul Jan- Jul Jan-
Embedded NXRT Net Asset Value ($MMs)
$332
Potential Value Creation: $40 Million
$292
Implied Value Value if Trades in NHF at NAV
an affiliate of
| 8 |
|
|
|
INVESTMENT THESIS: APARTMENT REIT PRICING
| • |
|
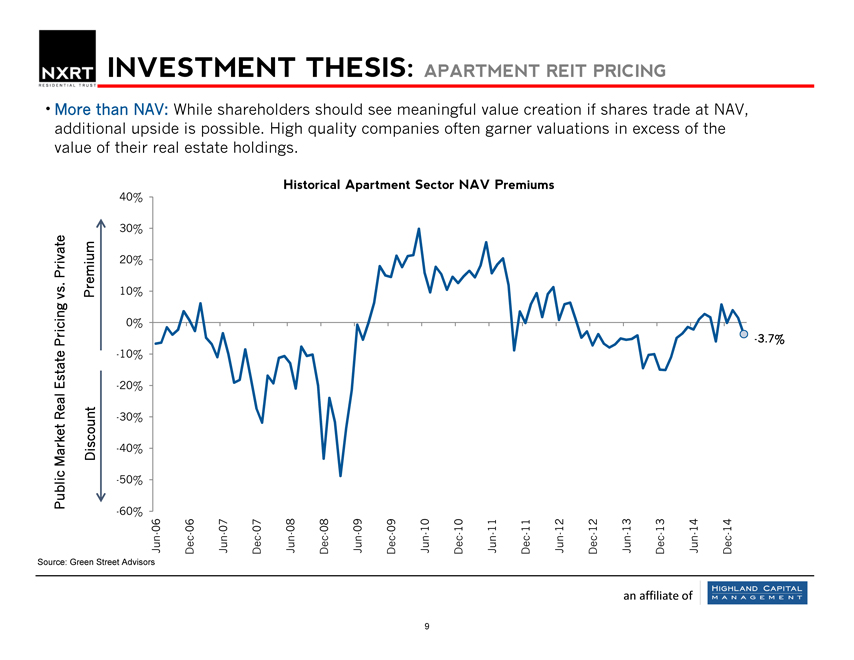
More than NAV: While shareholders should see meaningful value creation if shares trade at NAV, additional upside is possible. High quality companies often garner valuations in excess of the value of their real estate holdings. |
Historical Apartment Sector NAV Premiums
Source: Public Market Real Estate Pricing vs. Private
Green
Discount Premium
Street — — —
Advisors 60% 50% 40% 30% 20% 10% 0% 10% 20% 30% 40% Jun-06
Dec- 06 Jun-07 Dec- 07
Jun-08
Dec- 08 Historical
Jun-09
Dec- 09 Apartment
Jun-10 Sector Dec- 10 NAV Jun-11
Dec- 11 Premiums
Jun-12 Dec- 12 Jun-13 Dec- 13 Jun-14 Dec- 14
| 3 |
|
-7% . |
an affiliate of
9
|
|
INVESTMENT THESIS: APARTMENT REIT PRICING
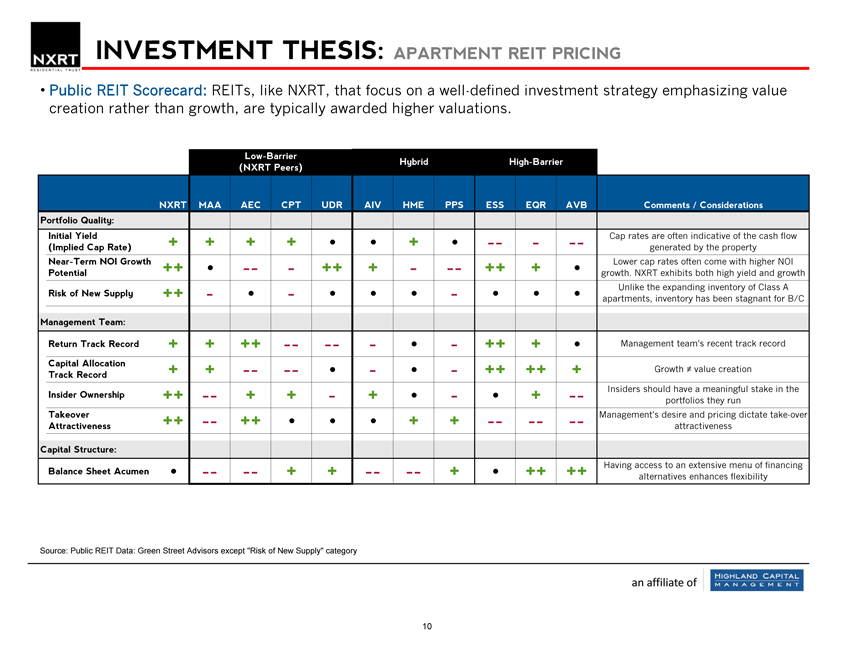
Public REIT Scorecard: REITs, like NXRT, that focus on a well-defined investment strategy emphasizing value creation rather than growth, are typically awarded higher valuations.
Low-Barrier
Hybrid High-Barrier (NXRT Peers)
NXRT MAA AEC CPT UDR AIV HME PPS ESS EQR AVB Comments / Considerations Portfolio Quality:
Initial Yield + +++ •• + • ——- Cap rates are often indicative of the cash flow (Implied Cap Rate) generated by the property Near-Term NOI Growth ++ • ——++ + —- ++ + • Lower cap rates often come with higher NOI Potential growth. NXRT exhibits both high yield and growth Unlike the expanding inventory of Class A
Risk of New Supply ++—•—•••—• •• apartments, inventory has been stagnant for B/C
Management Team:
Return Track Record ++ ++ — ——•—++ + • Management team’s recent track record
Capital Allocation
++ — — •—•—++ ++ + Growth ? value creation
Track Record
Insiders should have a meaningful stake in the
Insider Ownership ++ — ++—+ •—• + —portfolios they run
Takeover ++ — ++ ••• ++ — — — Management’s desire and pricing dictate take-over
Attractiveness attractiveness
Capital Structure:
Having access to an extensive menu of financing
Balance Sheet Acumen • — — ++ — — + • ++ ++ alternatives enhances flexibility
Source: Public REIT Data: Green Street Advisors except “Risk of New Supply” category
an affiliate of
10
|
|
INVESTMENT THESIS: INNOVATIVE STRATEGY
| • |
|
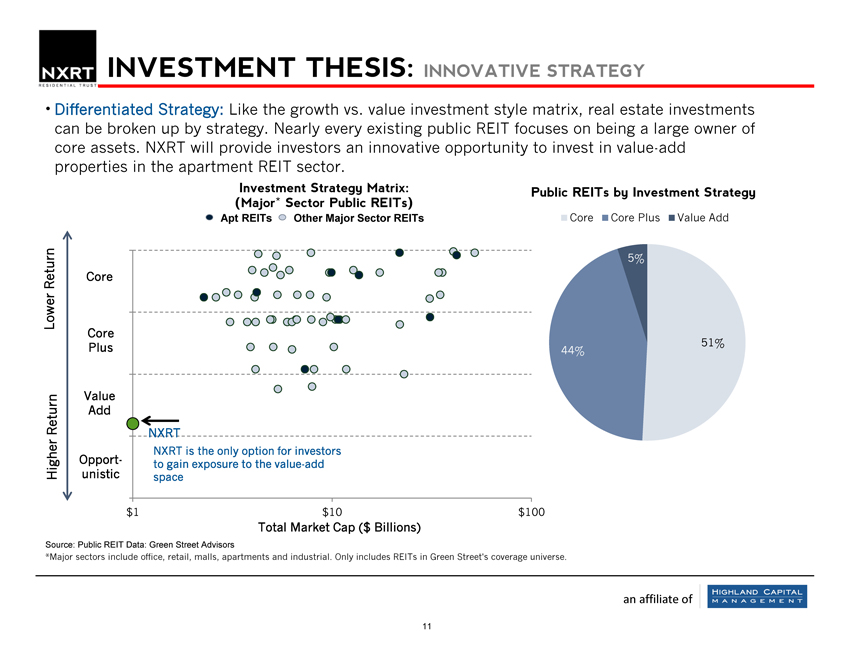
Differentiated Strategy: Like the growth vs. value investment style matrix, real estate investments can be broken up by strategy. Nearly every existing public REIT focuses on being a large owner of core assets. NXRT will provide investors an innovative opportunity to invest in value-add properties in the apartment REIT sector. |
Investment Strategy Matrix: Public REITs by Investment Strategy (Major* Sector Public REITs)
Apt REITs Other Major Sector REITs Core Core Plus Value Add
10
Return Core Lower 7.5
Core Plus
| 5 |
|
Value
Return Add
2.5
Opport-Higher unistic
0
5%
51% 44%
NXRT
NXRT is the only option for investors to gain exposure to the value-add space
$1 $10 $100
Total Market Cap ($ Billions)
Total Market Cap ($ Billions)
Source: Public REIT Data: Green Street Advisors
*Major sectors include office, retail, malls, apartments and industrial. Only includes REITs in Green Street’s coverage universe.
an affiliate of
11
|
|
INVESTMENT THESIS: INNOVATIVE STRATEGY (PROCESS)
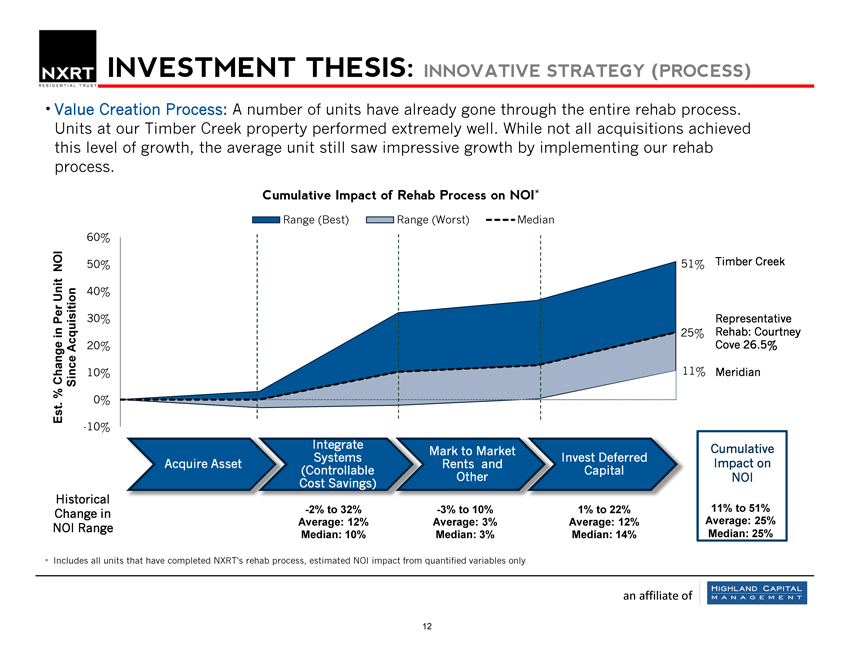
Value Creation Process: A number of units have already gone through the entire rehab process. Units at our Timber Creek property performed extremely well. While not all acquisitions achieved this level of growth, the average unit still saw impressive growth by implementing our rehab process.
Cumulative Impact of Rehab Process on NOI*
Range (Best) Range (Worst) Median
Range (Best) Range (Worst) Median 60%
NOI 50% 51% Timber Creek
Unit 40%
Per 30% Representative Rehab: Courtney in 25% Acquisition 20% Cove 26.5% Change Since 10% 11% Meridian
% 0% Est .
-10%
Acquire Integrate erred
Mark to Market l Cumulative Systems Invest Deferred Impact on Acquire Asset Rents and (Controllable Capital Other NOI
Cost Savings) Historical
Change in -2% to 32% -3% to 10% 1% to 22% 11% to 51% Average: 12% Average: 3% Average: 12% Average: 25%
NOI Range
Median: 10% Median: 3% Median: 14% Median: 25%
* Includes all units that have completed NXRT’s rehab process, estimated NOI impact from quantified variables only
an affiliate of
12
|
|
INVESTMENT THESIS: INNOVATIVE STRATEGY(TRACK RECORD)
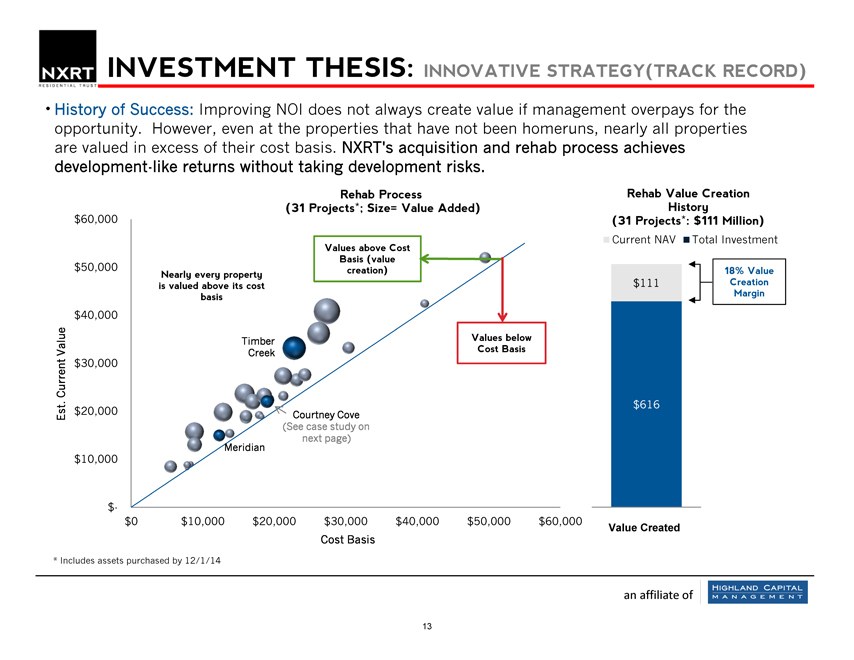
• History of Success: Improving NOI does not always create value if management overpays for the opportunity. However, even at the properties that have not been homeruns, nearly all properties are valued in excess of their cost basis. NXRT’s acquisition and rehab process achieves development-like returns without taking development risks.
Rehab Process Rehab Value Creation (31 Projects*; Size= Value Added) History $60,000 (31 Projects*: $111 Million)
Current NAV Total Investment
Values above Cost Basis (value $50,000 creation) 18% Value Nearly every property is valued above its cost $111 Creation basis Margin $40,000
Timber Values below Value Creek Cost Basis
Current $30,000
. $616 Est $20,000 Courtney Cove (See case study on Meridian next page) $10,000
$-
$0 $10,000 $20,000 $30,000 $40,000 $50,000 $60,000
Value Created
Cost Basis
| * |
|
Includes assets purchased by 12/1/14 |
an affiliate of
|
|
INVESTMENT THESIS: INNOVATIVE STRATEGY(CASE STUDY)
| • |
|
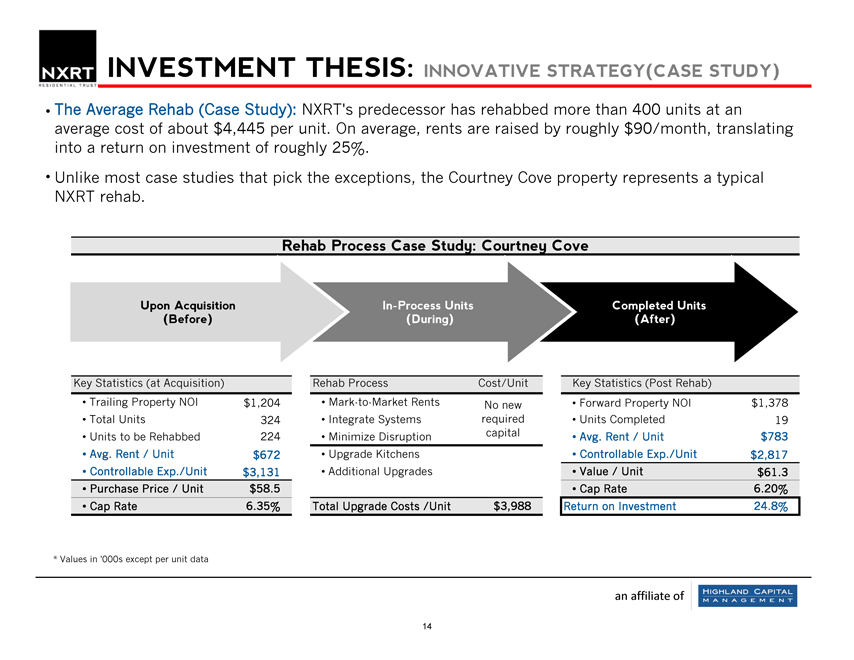
The Average Rehab (Case Study): NXRT’s predecessor has rehabbed more than 400 units at an average cost of about $4,445 per unit. On average, rents are raised by roughly $90/month, translating into a return on investment of roughly 25%. |
| • |
|
Unlike most case studies that pick the exceptions, the Courtney Cove property represents a typical NXRT rehab. |
Rehab Process Case Study: Courtney Cove
Upon Acquisition In-Process Units Completed Units (Before) (During) (After)
Key Statistics (at Acquisition) Rehab Process Cost/Unit Key Statistics (Post Rehab)
| • |
|
Trailing Property NOI $1,204 Mark-to-Market Rents No new Forward Property NOI $1,378 |
| • |
|
Total Units 324 Integrate Systems required Units Completed 19 |
| • |
|
Units to be Rehabbed 224 Minimize Disruption capital Avg. Rent / Unit $783 |
| • |
|
Avg. Rent / Unit $672 Upgrade Kitchens Controllable Exp./Unit $2,817 |
| • |
|
Controllable Exp./Unit $3,131 Additional Upgrades Value / Unit $61.3 |
| • |
|
Purchase Price / Unit $58.5 Cap Rate 6.20% |
| • |
|
Cap Rate 6.35% Total Upgrade Costs /Unit $3,988 Return on Investment 24.8% |
| * |
|
Values in ‘000s except per unit data |
an affiliate of
14
|
|
INVESTMENT THESIS: INNOVATIVE STRATEGY(SUPPLY)
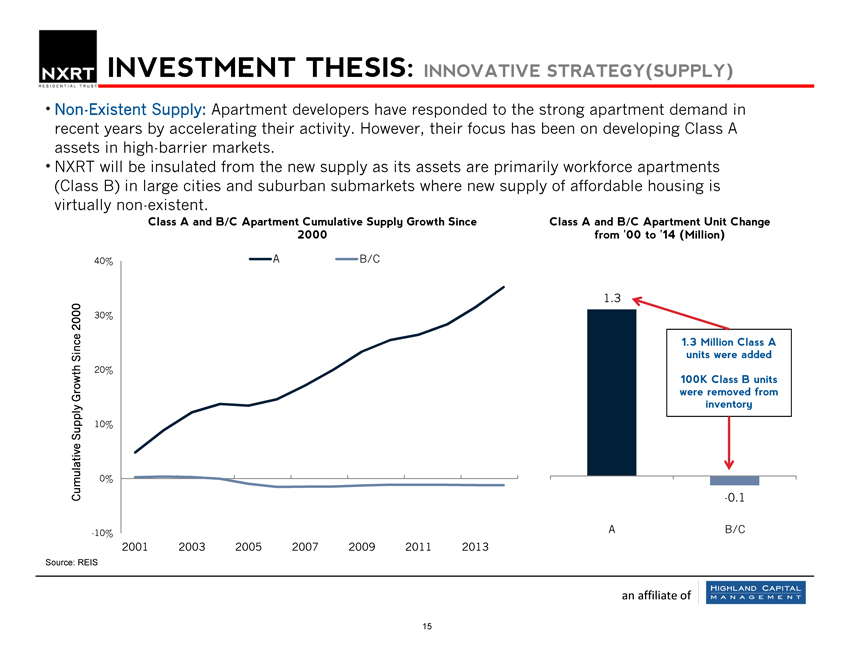
Non-Existent Supply: Apartment developers have responded to the strong apartment demand in recent years by accelerating their activity. However, their focus has been on developing Class A assets in high-barrier markets.
NXRT will be insulated from the new supply as its assets are primarily workforce apartments (Class B) in large cities and suburban submarkets where new supply of affordable housing is virtually non-existent.
Class A and B/C Apartment Cumulative Supply Growth Since Class A and B/C Apartment Unit Change 2000 from ‘00 to ‘14 (Million)
40% A B/C
1.3
2000 30%
1.3 Million Class A Since units were added 20% 100K Class B units Growth were removed from inventory
Supply 10% Cumulative 0%
-0.1
-10% AB/C 2001 2003 2005 2007 2009 2011 2013
Source: REIS
an affiliate of
15
|
|
INVESTMENT THESIS: UNIQUE STRATEGY(SUPPLY)
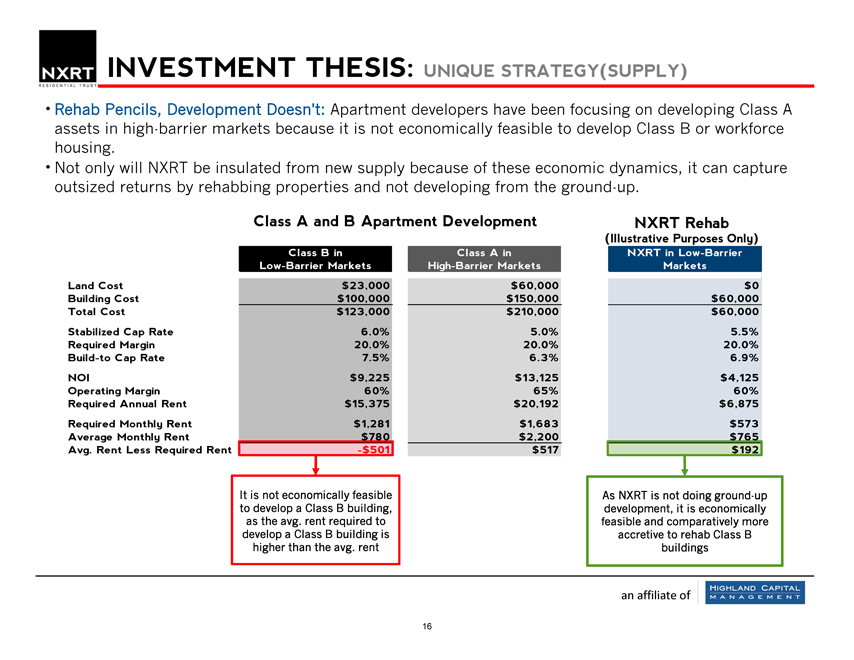
Rehab Pencils, Development Doesn’t: Apartment developers have been focusing on developing Class A assets in high-barrier markets because it is not economically feasible to develop Class B or workforce housing.
Not only will NXRT be insulated from new supply because of these economic dynamics, it can capture outsized returns by rehabbing properties and not developing from the ground-up.
Class A and B Apartment Development NXRT Rehab
(Illustrative Purposes Only)
Class B in Class A in NXRT in Low-Barrier Low-Barrier Markets High-Barrier Markets Markets Land Cost $23,000 $60,000 $0 Building Cost $100,000 $150,000 $60,000 Total Cost $123,000 $210,000 $60,000 Stabilized Cap Rate 6.0% 5.0% 5.5% Required Margin 20.0% 20.0% 20.0% Build-to Cap Rate 7.5% 6.3% 6.9% NOI $9,225 $13,125 $4,125 Operating Margin 60% 65% 60% Required Annual Rent $15,375 $20,192 $6,875 Required Monthly Rent $1,281 $1,683 $573 Average Monthly Rent $780 $2,200 $765 Avg. Rent Less Required Rent -$501 $517 $192
It is not economically feasible As NXRT is not doing ground-up to develop a Class B building, development, it is economically as the avg. rent required to feasible and comparatively more develop a Class B building is accretive to rehab Class B higher than the avg. rent buildings
an affiliate of
16
|
|
INVESTMENT THESIS: COMBINED YIELD
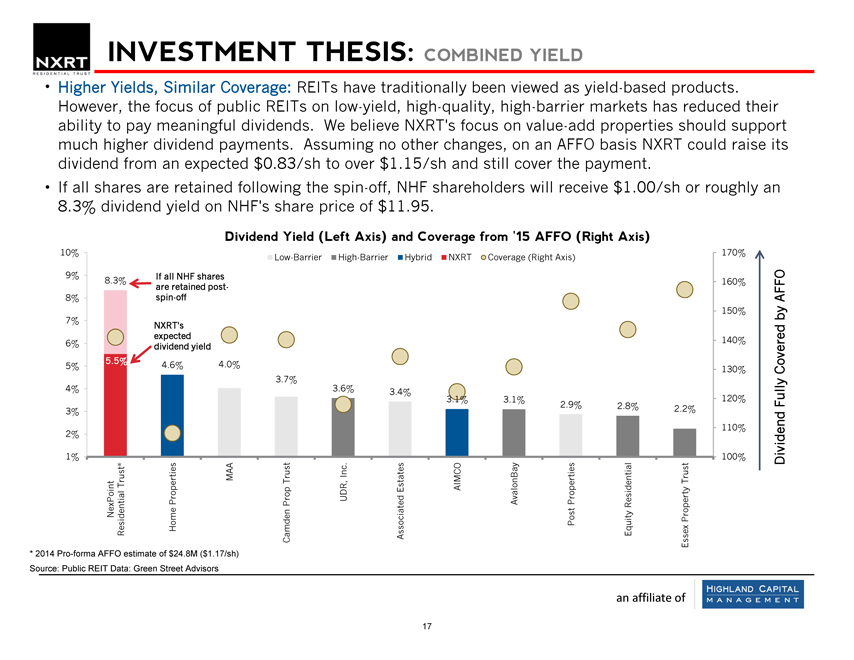
Higher Yields, Similar Coverage: REITs have traditionally been viewed as yield-based products. However, the focus of public REITs on low-yield, high-quality, high-barrier markets has reduced their ability to pay meaningful dividends. We believe NXRT’s focus on value-add properties should support much higher dividend payments. Assuming no other changes, on an AFFO basis NXRT could raise its dividend from an expected $0.83/sh to over $1.15/sh and still cover the payment.
If all shares are retained following the spin-off, NHF shareholders will receive $1.00/sh or roughly an 8.3% dividend yield on NHF’s share price of $11.95.
Dividend Yield (Left Axis) and Coverage from ‘15 AFFO (Right Axis)
10% 170% Low-Barrier High-Barrier Hybrid NXRT Coverage (Right Axis)
9% If all NHF shares
8.3% 160% are retained post-
8% spin-off AFFO 150% by 7% NXRT’s expected 140% 6% dividend yield
5.5% 4.6% 4.0%
5% 130% Covered
3.7%
4% 3.6% 3.4%
3.1% 3.1% 120% Fully
2.9% 2.8%
3% 2.2% 110% 2%
1% 100% Dividend
Inc .
MAA Trust Trust Trust* AIMCO Estates Properties Prop UDR, AvalonBay Properties Residential NexPoint Property Residential Home Camden Associated Post Equity Essex
* 2014 Pro-forma AFFO estimate of $24.8M ($1.17/sh) Source: Public REIT Data: Green Street Advisors
an affiliate of
17
|
|
PORTFOLIO SUMMARY
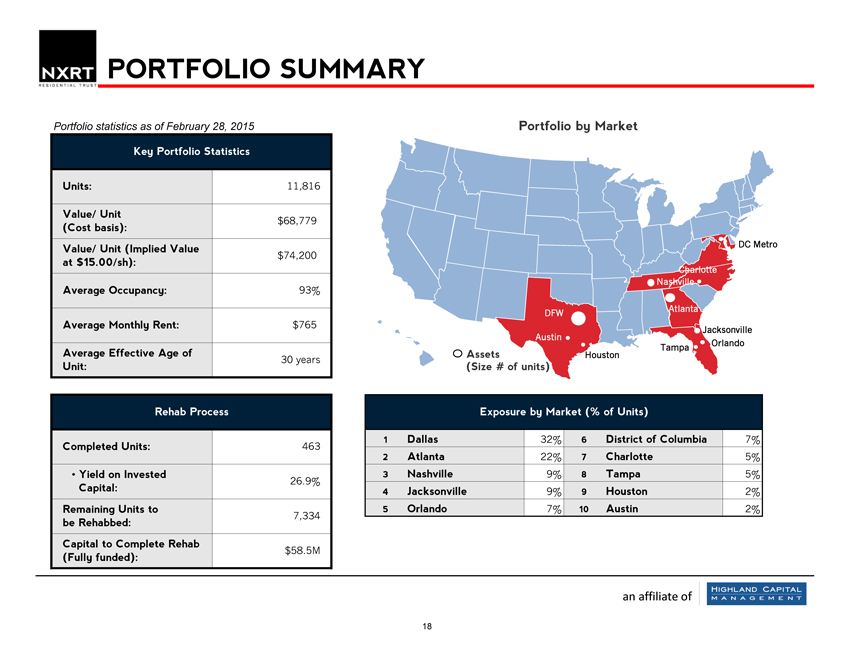
Portfolio statistics as of February 28, 2015
Key Portfolio Statistics
Units: 11,816
Value/ Unit $68,779
(Cost basis):
Value/ Unit (Implied Value $74,200 at $15.00/sh):
Average Occupancy: 93%
Average Monthly Rent: $765
Average Effective Age of
30 years
Unit:
Rehab Process
Completed Units: 463
Yield on Invested
26.9%
Capital: Remaining Units to
7,334 be Rehabbed: Capital to Complete Rehab $58.5M
(Fully funded):
Portfolio by Market
DC Metro
Charlotte Nashville
Atlanta DFW
Jacksonville Austin Orlando Tampa
Assets Houston (Size # of units)
Exposure by Market (% of Units)
1 Dallas 32% 6 District of Columbia 7%
2 Atlanta 22% 7 Charlotte 5%
3 Nashville 9% 8 Tampa 5%
4 Jacksonville 9% 9 Houston 2%
5 Orlando 7% 10 Austin 2%
an affiliate of
18
|
|
PORTFOLIO GEOGRAPHY
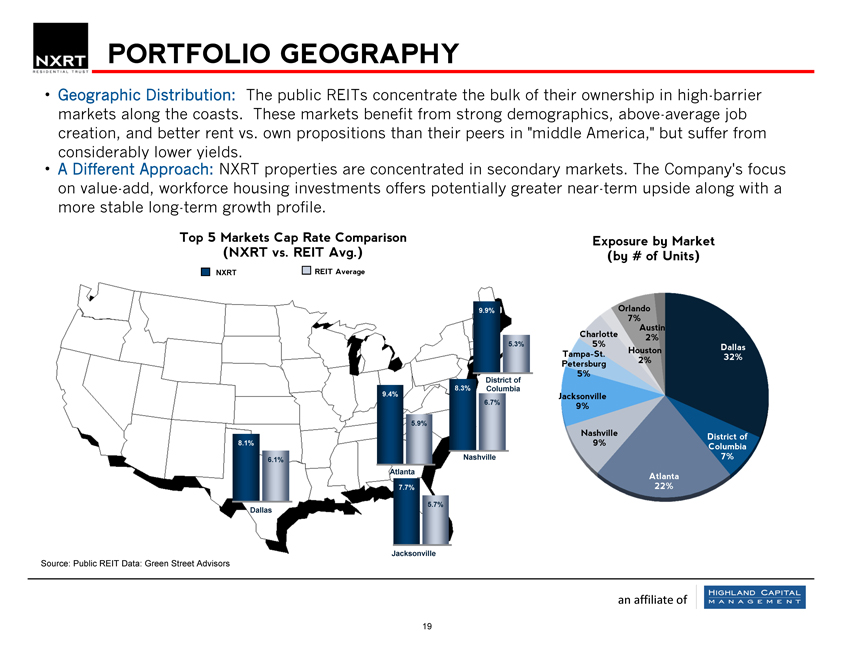
Geographic Distribution: The public REITs concentrate the bulk of their ownership in high-barrier markets along the coasts. These markets benefit from strong demographics, above-average job creation, and better rent vs. own propositions than their peers in “middle America,” but suffer from considerably lower yields.
A Different Approach: NXRT properties are concentrated in secondary markets. The Company’s focus on value-add, workforce housing investments offers potentially greater near-term upside along with a more stable long-term growth profile.
Top 5 Markets Cap Rate Comparison Exposure by Market (NXRT vs. REIT Avg.) (by # of Units)
NXRT REIT Average
9.9% Orlando 7% Austin Charlotte 2%
5.3% 5% Dallas Tampa-St. Houston
2% 32% Petersburg 5%
District of
9.4% 8.3% Columbia
Jacksonville
6.7% 9% 5.9%
Nashville District of 8.1% 9% Columbia
6.1% Nashville 7% Atlanta
Atlanta
7.7% 22% 5.7%
Dallas
Jacksonville
Source: Public REIT Data: Green Street Advisors
an affiliate of
19
|
|
INTERNAL GROWTH
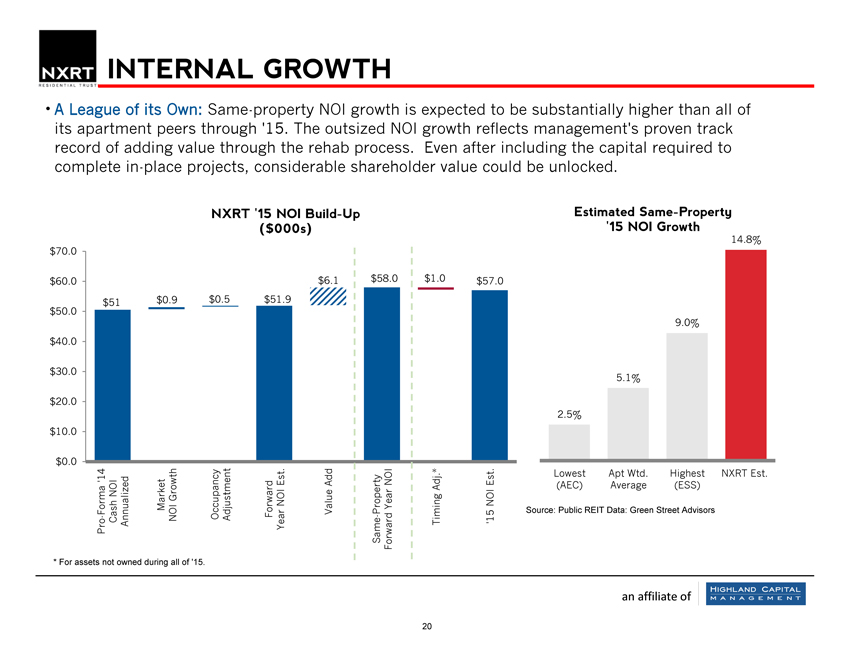
A League of its Own: Same-property NOI growth is expected to be substantially higher than all of its apartment peers through ‘15. The outsized NOI growth reflects management’s proven track record of adding value through the rehab process. Even after including the capital required to complete in-place projects, considerable shareholder value could be unlocked.
NXRT ‘15 NOI Build-Up Estimated Same-Property
($000s) ‘15 NOI Growth
14.8%
$70.0
$60.0 $6.1 $58.0 $1.0 $57.0
$51 $0.9 $0.5 $51.9
$50.0
9.0%
$40.0
$30.0
5.1%
$20.0
2.5%
$10.0
$0.0
. * .
‘14 . Lowest Apt Wtd. Highest NXRT Est. Est AddNOIEst (AEC) Average (ESS) Adj NOI
Growth
NOI Year NOI
Forma Market Value Property Source: Public REIT Data: Green Street Advisors
- Cash Annualized NOI Occupancy Adjustment Forward Year—Timing ‘15 Pro Same Forward
* For assets not owned during all of ‘15.
an affiliate of
20
|
|
PORTFOLIO GROWTH
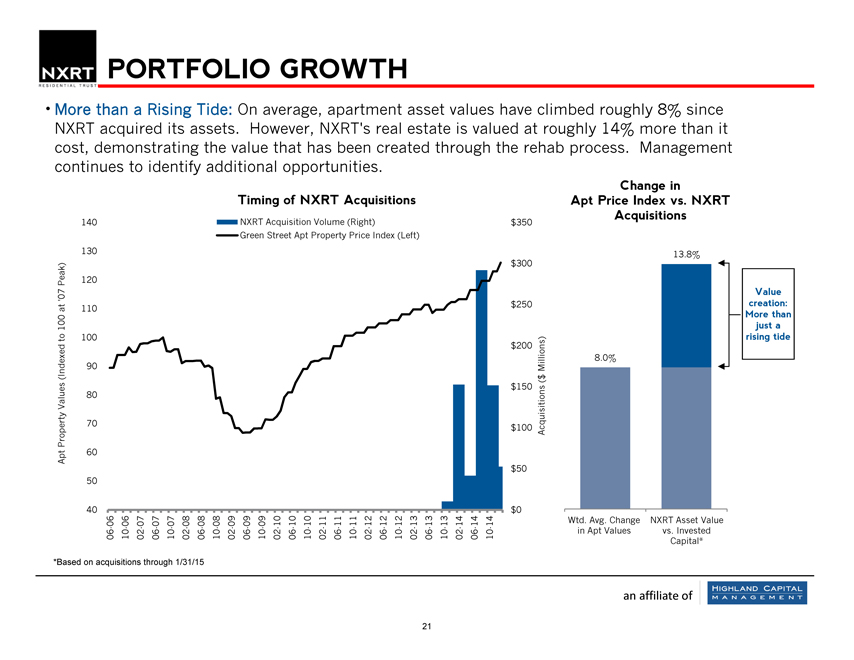
More than a Rising Tide: On average, apartment asset values have climbed roughly 8% since NXRT acquired its assets. However, NXRT’s real estate is valued at roughly 14% more than it cost, demonstrating the value that has been created through the rehab process. Management continues to identify additional opportunities.
Change in Timing of NXRT Acquisitions Apt Price Index vs. NXRT
Acquisitions
140 NXRT Acquisition Volume (Right) $350 Green Street Apt Property Price Index (Left)
130 13.8% $300 Peak) 120
‘07 Value $250 creation: at 110
More than 100 just a to 100 rising tide $200
90 Millions) 8.0% (Indexed $ ( Values 80 $150 Property 70 $100 Acquisitions Apt 60 $50 50
40 $0
06 06 07 07 07 08 08 08 09 09 09 10 10 10 11 11 11 12 12 12 13 13 13 14 14 14 Wtd. Avg. Change NXRT Asset Value 06- 10- 02- 06- 10- 02- 06- 10- 02- 06- 10- 02- 06- 10- 02- 06- 10- 02- 06- 10- 02- 06- 10- 02- 06- 10- in Apt Values vs. Invested Capital*
*Based on acquisitions through 1/31/15
an affiliate of
21
|
|
EXTERNAL GROWTH
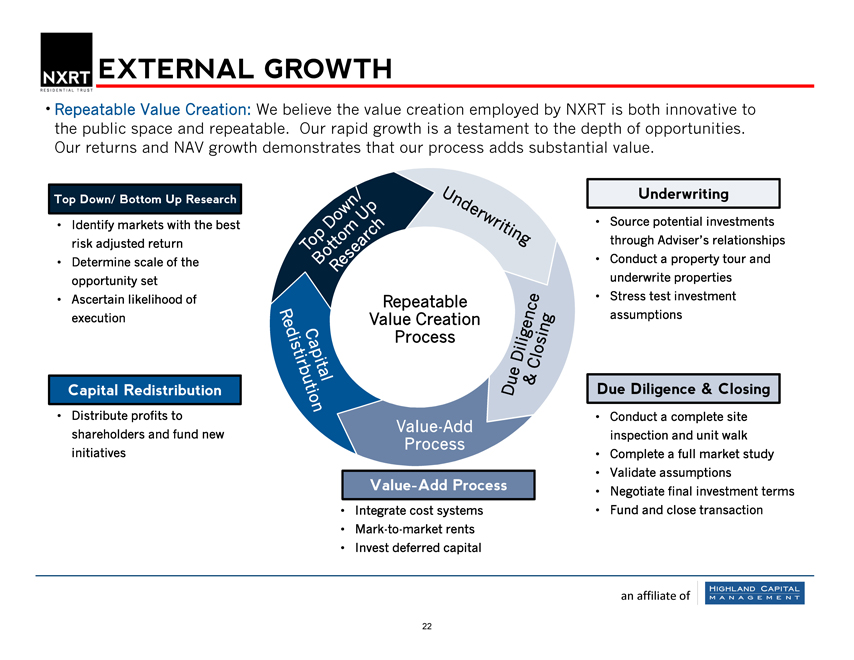
Repeatable Value Creation: We believe the value creation employed by NXRT is both innovative to the public space and repeatable. Our rapid growth is a testament to the depth of opportunities. Our returns and NAV growth demonstrates that our process adds substantial value.
Top Down/ Bottom Up Research
Identify markets with the best risk adjusted return
Determine scale of the opportunity set
Ascertain likelihood of execution
Capital Redistribution
Distribute profits to shareholders and fund new initiatives
Repeatable Value Creation Process
Value-Add Process
Integrate cost systems
Mark-to-market rents
Invest deferred capital
Underwriting
Source potential investments
through Adviser’s relationships
Conduct a property tour and
underwrite properties
Stress test investment
assumptions
Due Diligence & Closing
Conduct a complete site
inspection and unit walk
Complete a full market study
Validate assumptions
Negotiate final investment terms
Fund and close transaction
an affiliate of
|
|
PEER COMPARISON: SIZE
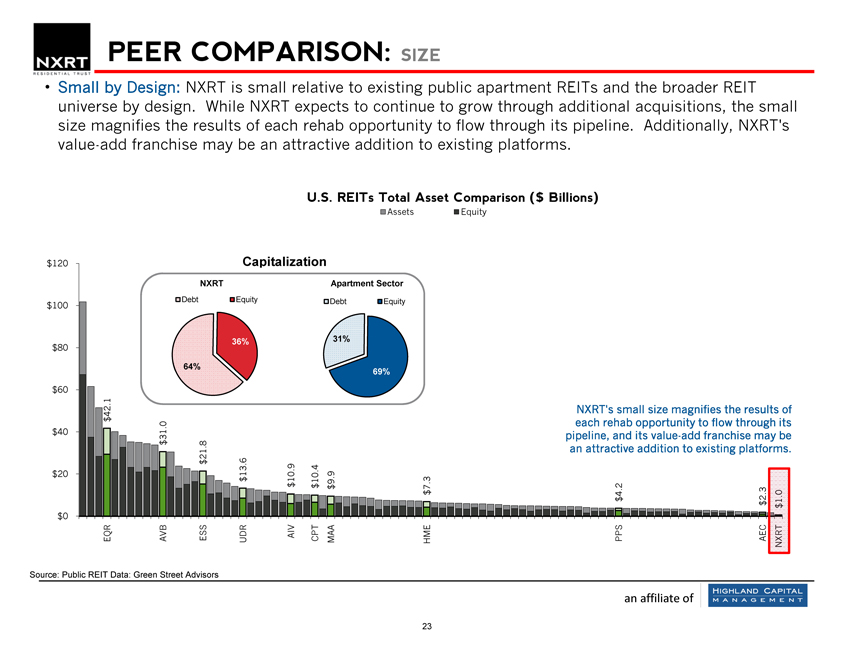
Small by Design: NXRT is small relative to existing public apartment REITs and the broader REIT universe by design. While NXRT expects to continue to grow through additional acquisitions, the small size magnifies the results of each rehab opportunity to flow through its pipeline. Additionally, NXRT’s value-add franchise may be an attractive addition to existing platforms.
U.S. REITs Total Asset Comparison ($ Billions)
Assets Equity
$120 Capitalization
NXRT Apartment Sector
Debt Equity Debt Equity $100
$80 36% 31% 64%
69% $60 1
. 42 NXRT’s small size magnifies the results of $0 each rehab opportunity to flow through its
$40 . 31 pipeline, and its value-add franchise may be $ 8 . an attractive addition to existing platforms.
21 6
$ . 9 4
. . 9
$20 13 $ 10 . 3
10 9
$ . 2
$ $ 7 .
. 3
$ 4 2 $ $ $0 EQR AVB ESS UDRAIV CPT MAA PPS AEC
HME
Source: Public REIT Data: Green Street Advisors
an affiliate of
23
|
|
PEER COMPARISON: IMPLIED NOMINAL CAP RATE
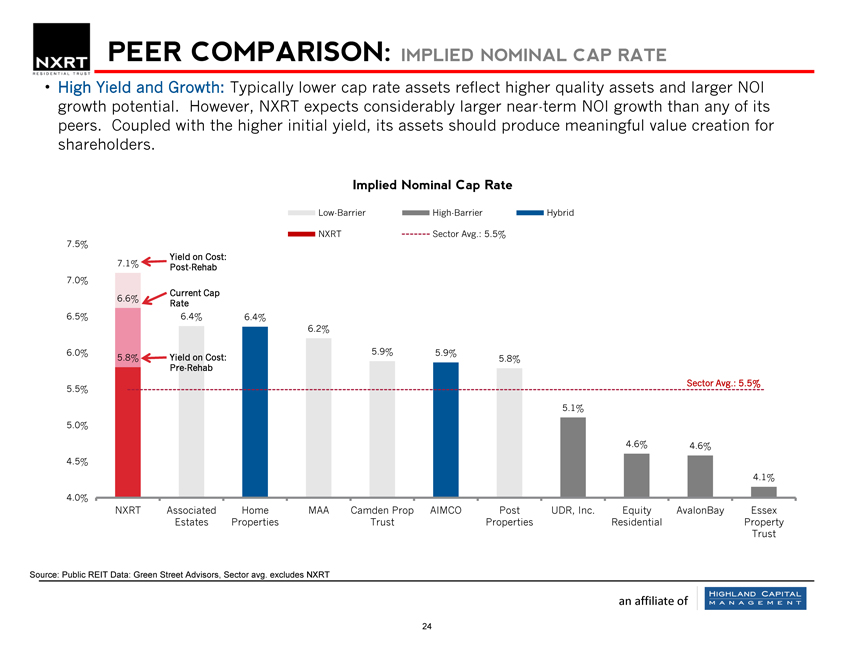
High Yield and Growth: Typically lower cap rate assets reflect higher quality assets and larger NOI growth potential. However, NXRT expects considerably larger near-term NOI growth than any of its peers. Coupled with the higher initial yield, its assets should produce meaningful value creation for shareholders.
Implied Nominal Cap Rate
Low-Barrier High-Barrier Hybrid
NXRT Sector Avg.: 5.5%
7.5%
Yield on Cost:
7.1% Post-Rehab
7.0%
Current Cap
6.6%
Rate
6.5% 6.4% 6.4%
6.2%
6.0% 5.9% 5.9%
5.8% Yield on Cost: 5.8% Pre-Rehab
Sector Avg.: 5.5%
5.5%
5.1%
5.0%
4.6% 4.6%
4.5%
4.1%
4.0%
NXRT Associated Home MAA Camden Prop AIMCO Post UDR, Inc. Equity AvalonBay Essex Estates Properties Trust Properties Residential Property Trust
Source: Public REIT Data: Green Street Advisors, Sector avg. excludes NXRT
an affiliate of
24
|
|
PEER COMPARISON: RENT PER UNIT
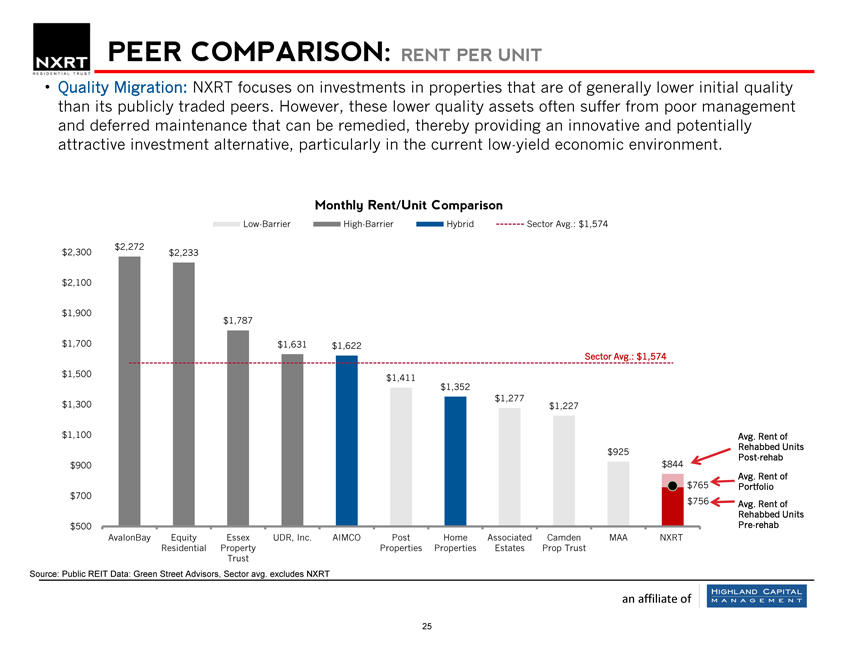
Quality Migration: NXRT focuses on investments in properties that are of generally lower initial quality than its publicly traded peers. However, these lower quality assets often suffer from poor management and deferred maintenance that can be remedied, thereby providing an innovative and potentially attractive investment alternative, particularly in the current low-yield economic environment.
Monthly Rent/Unit Comparison
Low-Barrier High-Barrier Hybrid Sector Avg.: $1,574
$2,272 $2,300 $2,233
$2,100
$1,900 $1,787
$1,700 $1,631 $1,622
Sector Avg.: $1,574 $1,500 $1,411 $1,352 $1,277 $1,300 $1,227
$1,100 Avg. Rent of Rehabbed Units $925 Post-rehab $900 $844 $765 Avg. Rent of $700 Portfolio $756 Avg. Rent of Rehabbed Units $500 Pre-rehab AvalonBay Equity Essex UDR, Inc. AIMCO Post Home Associated Camden MAA NXRT
Residential Property Properties Properties Estates Prop Trust Trust
Source: Public REIT Data: Green Street Advisors, Sector avg. excludes NXRT
an affiliate of
25
|
|
GUIDANCE
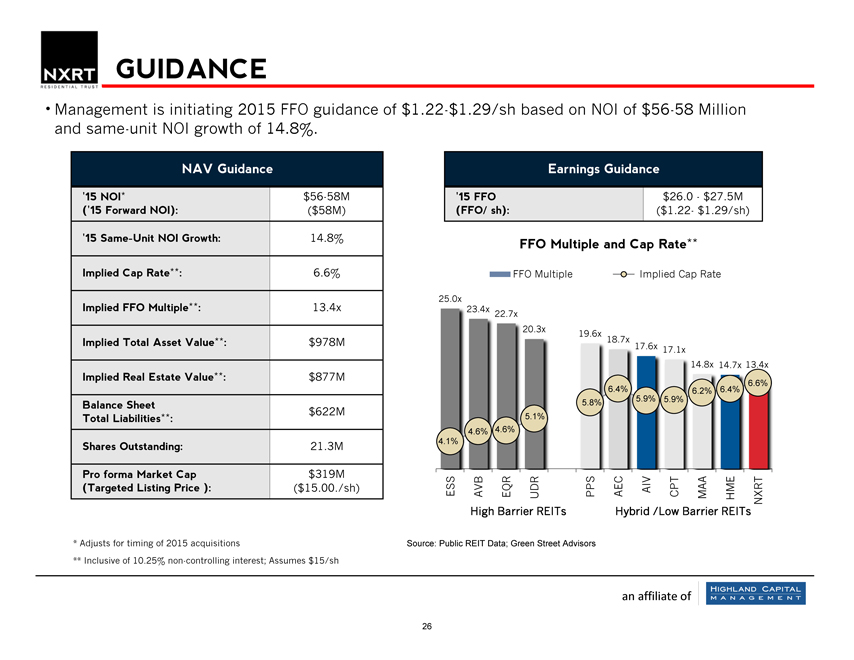
Management is initiating 2015 FFO guidance of $1.22-$1.29/sh based on NOI of $56-58 Million and same-unit NOI growth of 14.8%.
NAV Guidance
‘15 NOI* $56-58M (‘15 Forward NOI): ($58M)
‘15 Same-Unit NOI Growth: 14.8% Implied Cap Rate**: 6.6% Implied FFO Multiple**: 13.4x Implied Total Asset Value**: $978M
Implied Real Estate Value**: $877M
Balance Sheet $622M
Total Liabilities**:
Shares Outstanding: 21.3M
Pro forma Market Cap $319M (Targeted Listing Price ): ($15.00./sh)
* Adjusts for timing of 2015 acquisitions
** Inclusive of 10.25% non-controlling interest; Assumes $15/sh
Earnings Guidance
‘15 FFO $26.0 - $27.5M
(FFO/ sh): ($1.22- $1.29/sh)
FFO Multiple and Cap Rate**
FFO Multiple Implied Cap Rate
25.0x 10.
.0x 23.4x 22.7x
20.3x 9.
.0x 19.6x 18.7x
17.6x 17.1x 8.
14.8x 14.7x 13.4x
.0x 7.
6.6%
6.4% 6.2% 6.4%
.0x 5.8% 5.9% 5.9% 6.
5.1% 5.
4.6% 4.6%
5.0x 4.1% 4.
0.0x 3.
ESS AVB EQR UDR PPS AEC AIV CPT MAA HME NXRT
High Barrier REITs Hybrid /Low Barrier REITs
Source: Public REIT Data; Green Street Advisors
an affiliate of
26
|
|
RECONCILIATION OF NON-GAAP FINANCIAL MEASURES
Reconciliation of 2014 NOI
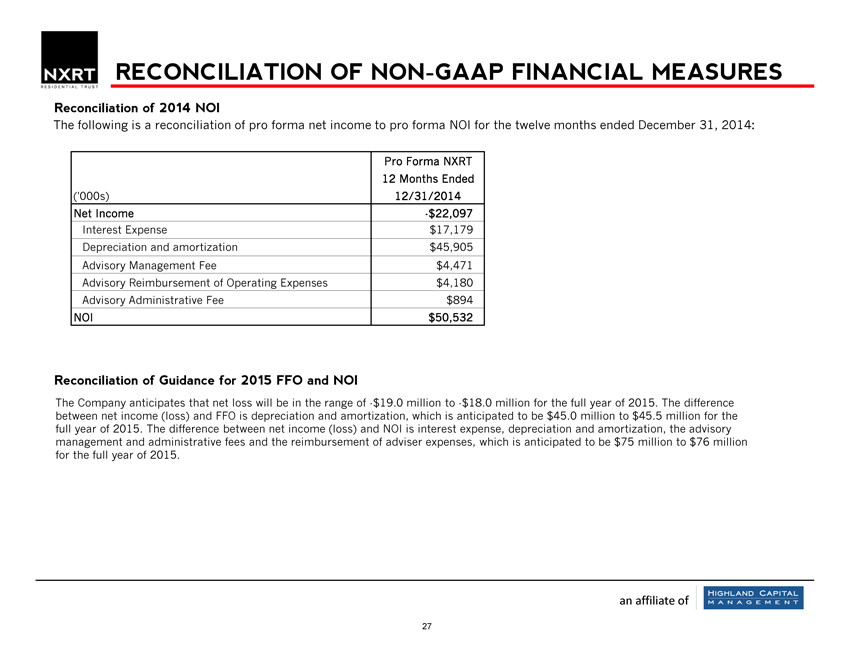
The following is a reconciliation of pro forma net income to pro forma NOI for the twelve months ended December 31, 2014:
Pro Forma NXRT
12 Months Ended (‘000s) 12/31/2014 Net Income -$22,097 Interest Expense $17,179 Depreciation and amortization $45,905 Advisory Management Fee $4,471 Advisory Reimbursement of Operating Expenses $4,180 Advisory Administrative Fee $894 NOI $50,532
Reconciliation of Guidance for 2015 FFO and NOI
The Company anticipates that net loss will be in the range of -$19.0 million to -$18.0 million for the full year of 2015. The difference between net income (loss) and FFO is depreciation and amortization, which is anticipated to be $45.0 million to $45.5 million for the full year of 2015. The difference between net income (loss) and NOI is interest expense, depreciation and amortization, the advisory management and administrative fees and the reimbursement of adviser expenses, which is anticipated to be $75 million to $76 million for the full year of 2015.
an affiliate of
27