Attached files
| file | filename |
|---|---|
| 8-K - 8-K - STIFEL FINANCIAL CORP | d894599d8k.htm |
| Exhibit 99.1
|
Stifel Financial Corp.
March 2015
|
|
Disclaimer
Forward-Looking Statements
This presentation may contain “forward-looking statements” within the meaning of the Private Securities Litigation Reform Act of 1995 that involve significant risks, assumptions, and uncertainties, including statements relating to the market opportunity and future business prospects of Stifel Financial Corp., as well as Stifel, Nicolaus & Company, Incorporated and its subsidiaries (collectively, SF or the Company ). These statements can be identified by the use of the words “may,” “will,” “should,” “could,” “would,” “plan,” “potential,” “estimate,” “project,” “believe,” “intend,” “anticipate,” “expect,” and similar expressions. In particular, these statements may refer to our goals, intentions, and expectations, our business plans and growth strategies, our ability to integrate and manage our acquired businesses, estimates of our risks and future costs and benefits, and forecasted demographic and economic trends relating to our industry.
You should not place undue reliance on any forward-looking statements, which speak only as of the date they were made. We will not update these forward-looking statements, even though our situation may change in the future, unless we are obligated to do so under federal securities laws.
Actual results may differ materially and reported results should not be considered as an indication of future performance. Factors that could cause actual results to differ are included in the Company’s annual and quarterly reports and from time to time in other reports filed by the Company with the Securities and Exchange Commission and include, among other things, changes in general economic and business conditions, actions of competitors, regulatory and legal actions, changes in legislation, and technology changes.
Use of Non-GAAP Financial Measures
The Company utilized non-GAAP calculations of presented net revenues, compensation and benefits, non-compensation operating expenses, income from continuing operations before income taxes, provision for income taxes, net income from continuing operations, net income, compensation and non-compensation operating expense ratios, pre-tax margin and diluted earnings per share as an additional measure to aid in understanding and analyzing the Company’s financial results for the three and twelve months ended December 31, 2014. Specifically, the Company believes that the non-GAAP measures provide useful information by excluding certain items that may not be indicative of the Company’s core operating results and business outlook. The Company believes that these non-GAAP measures will allow for a better evaluation of the operating performance of the business and facilitate a meaningful comparison of the Company’s results in the current period to those in prior periods and future periods. Reference to these non-GAAP measures should not be considered as a substitute for results that are presented in a manner consistent with GAAP. These non-GAAP measures are provided to enhance investors’ overall understanding of the Company’s financial performance.
2
|
|

Stifel Overview
|
|
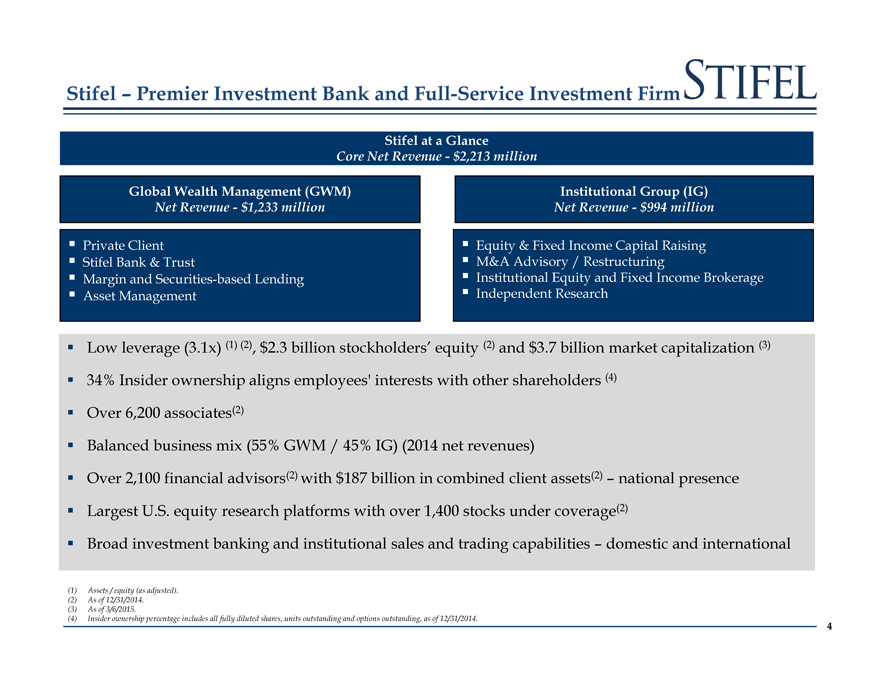
Stifel – Premier Investment Bank and Full-Service Investment Firm
Stifel at a Glance
Core Net Revenue—$2,213 million
Global Wealth Management (GWM) Institutional Group (IG)
Net Revenue—$1,233 million Net Revenue—$994 million
Private Client Equity & Fixed Income Capital Raising
Stifel Bank & Trust M&A Advisory / Restructuring
Margin and Securities-based Lending Institutional Equity and Fixed Income Brokerage
Asset Management Independent Research
Low leverage (3.1x) (1) (2), $2.3 billion stockholders’ equity (2) and $3.7 billion market capitalization (3)
34% Insider ownership aligns employees’ interests with other shareholders (4)
Over 6,200 associates(2)
Balanced business mix (55% GWM / 45% IG) (2014 net revenues)
Over 2,100 financial advisors(2) with $187 billion in combined client assets(2) – national presence
Largest U.S. equity research platforms with over 1,400 stocks under coverage(2)
Broad investment banking and institutional sales and trading capabilities – domestic and international
(1) Assets / equity (as adjusted).
(2) As of 12/31/2014.
(3) As of 3/6/2015.
(4) Insider ownership percentage includes all fully diluted shares, units outstanding and options outstanding, as of 12/31/2014.
4
|
|
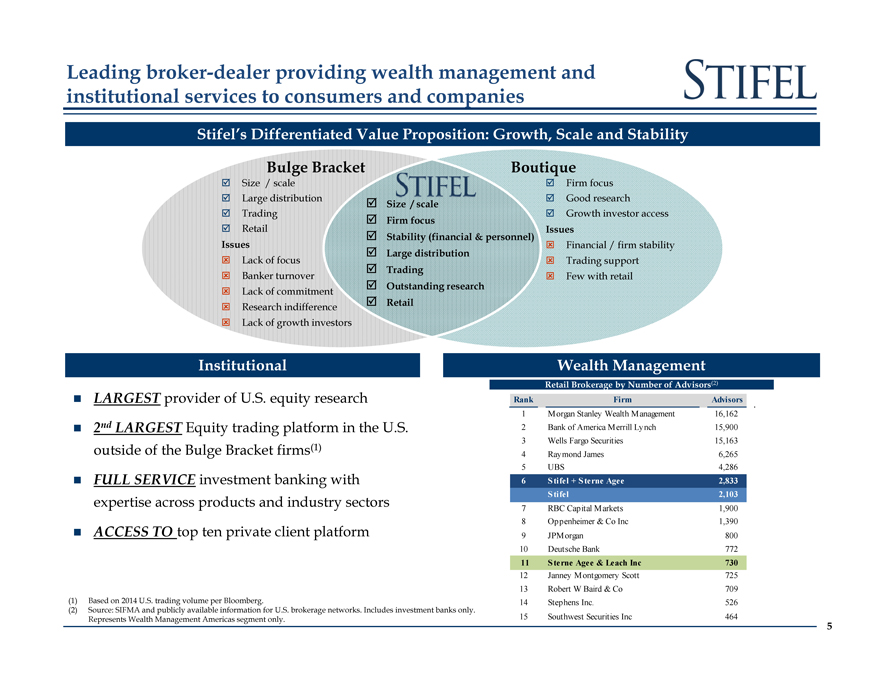
Leading broker-dealer providing wealth management and
institutional services to consumers and companies
Stifel’s Differentiated Value Proposition: Growth, Scale and Stability
Bulge Boutique
Size / scale Firm focus
Large distribution Size / scale Good research
Trading Growth investor access
Firm focus
Retail Issues
Stability (financial & personnel)
Issues C Financial / firm stability
Large distribution
Lack of focus Trading support
Trading
Banker turnover Few with retail
Lack of commitment Outstanding research
Research indifference Retail
Lack of growth investors
Institutional Wealth Management
Retail Brokerage by Number of Advisors(2)
LARGEST provider of U.S. equity research Rank Firm Advisors
1 Morgan Stanley Wealth Management 16,162
2nd LARGEST Equity trading platform in the U.S. 2 Bank of America Merrill Lynch 15,900
3 Wells Fargo Securities 15,163
outside of the Bulge Bracket firms(1) 4 Raymond James 6,265
5 UBS 4,286
FULL SERVICE investment banking with 6 Stifel + Sterne Agee 2,833
expertise across products and industry sectors Stifel 2,103
7 RBC Capital Markets 1,900
8 Oppenheimer & Co Inc 1,390
ACCESS TO top ten private client platform 9 JPMorgan 800
10 Deutsche Bank 772
11 Sterne Agee & Leach Inc 730
12 Janney Montgomery Scott 725
13 Robert W Baird & Co 709
(1) Based on 2014 U.S. trading volume per Bloomberg. 14 Stephens Inc. 526
(2) Source: SIFMA and publicly available information for U.S. brokerage networks. Includes investment banks only.
Represents Wealth Management Americas segment only. 15 Southwest Securities Inc 464
5
|
|
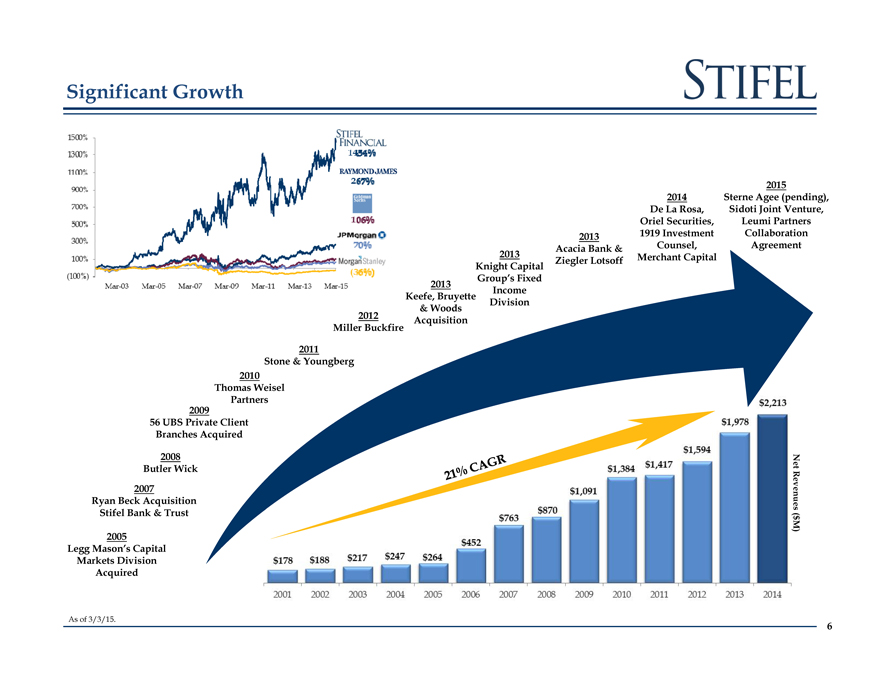
Significant Growth
2015
2014 Sterne Agee (pending),
De La Rosa, Sidoti Joint Venture,
Oriel Securities, Leumi Partners
2013 1919 Investment Collaboration
Acacia Bank & Counsel, Agreement
2013 Ziegler Lotsoff Merchant Capital
Knight Capital
Group’s Fixed
2013 Income
Keefe, Bruyette Division
& Woods
2012 Acquisition
Miller Buckfire
2011
Stone & Youngberg
2010
Thomas Weisel
Partners
2009
56 UBS Private Client
Branches Acquired
Butler 2008 Wick Net
2007
Ryan Beck Acquisition Revenues
Stifel Bank & Trust(
$
M)
2005
Legg Mason’s Capital
Markets Division
Acquired
As of 3/3/15.
6
|
|
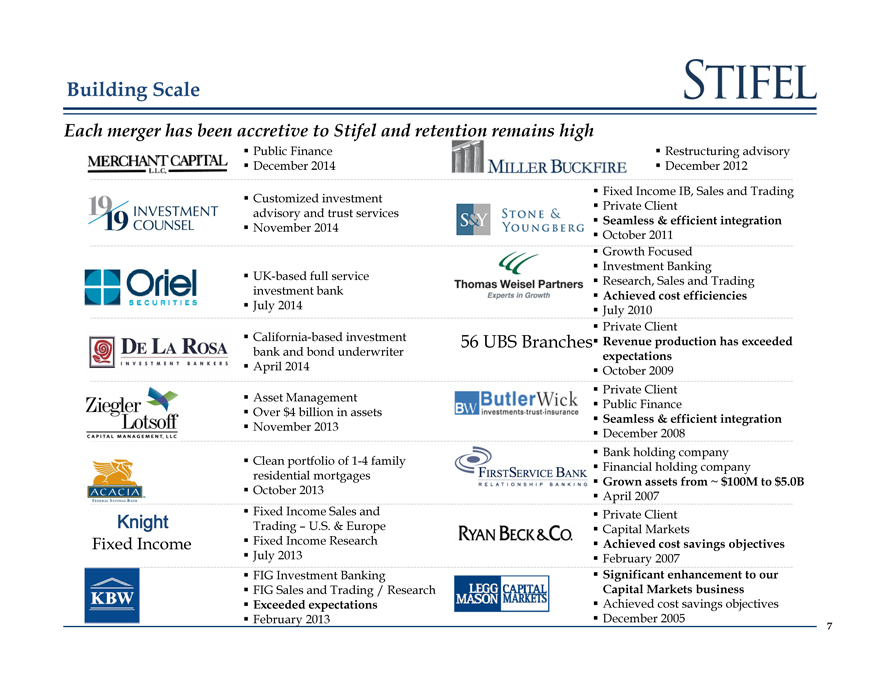
Building Scale
Each merger has been accretive to Stifel and retention remains high
Public Finance Restructuring advisory
December 2014 December 2012
Fixed Income IB, Sales and Trading
Customized investment Private Client
advisory and trust serviceservices Seamless & efficient integration
November 2014 October 2011
Growth Focused
Investment Banking
UK-based full service Research, Sales and Trading
investment bank Achieved cost efficiencies
July 2014 July 2010
Private Client
California-based investment 56 UBS Branches Revenue production has exceeded
bank and bond underwriter expectations
April 2014 October 2009
Private Client
Asset Management Public Finance
Over $4 billion in assets Seamless & efficient integration
November 2013 December 2008
Bank holding company
Clean portfolio of 1-4 family Financial holding company
residential mortgages Grown assets from ~ $100M to $5.0B
October 2013 April 2007
Fixed Income Sales and Private Client
Knight Trading – U.S. & Europe Capital Markets
Fixed Income Fixed Income Research Achieved cost savings objectives
July 2013 February 2007
FIG Investment Banking Significant enhancement to our
FIG Sales and Trading / Research Capital Markets business
Exceeded expectations Achieved cost savings objectives
February 2013 December 2005 7
|
|
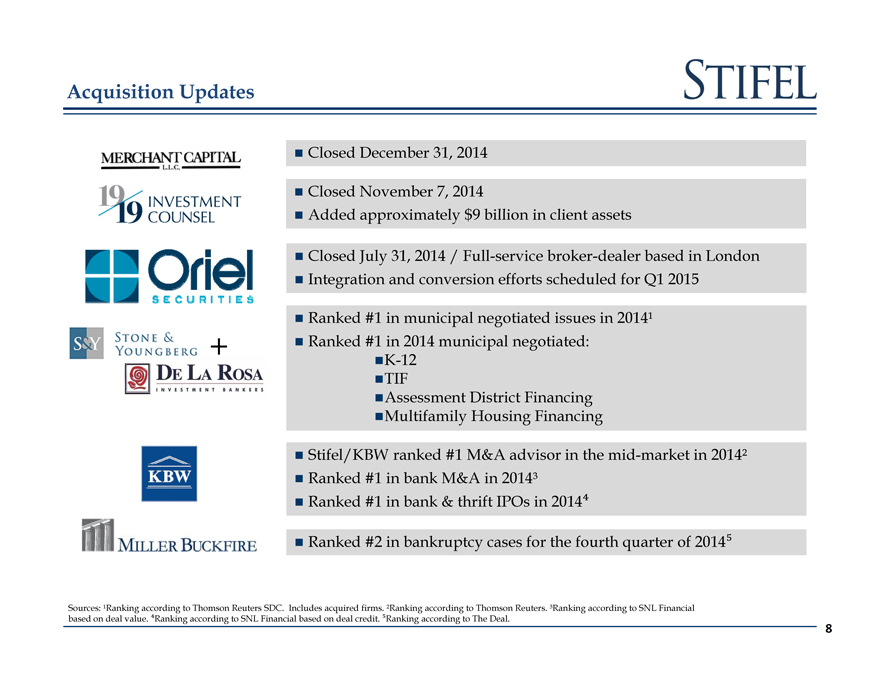
Acquisition Updates
[Graphic Appears Here]
[Graphic Appears Here]
Closed December 31, 2014
Closed November 7, 2014
Added approximately $9 billion in client assets
Closed July 31, 2014 / Full-service broker-dealer based in London
Integration and conversion efforts scheduled for Q1 2015
Ranked #1 in municipal negotiated issues in 2014¹
+ Ranked #1 in 2014 municipal negotiated:
K-12
TIF
Assessment District Financing
Multifamily Housing Financing
Stifel/KBW ranked #1 M&A advisor in the mid-market in 2014²
Ranked #1 in bank M&A in 2014³
Ranked #1 in bank & thrift IPOs in 2014?
Ranked #2 in bankruptcy cases for the fourth quarter of 2014?
Sources: ¹Ranking according to Thomson Reuters SDC. Includes acquired firms. ²Ranking according to Thomson Reuters. ³Ranking according to SNL Financial based on deal value. ?Ranking according to SNL Financial based on deal credit. ?Ranking according to The Deal.
8
|
|
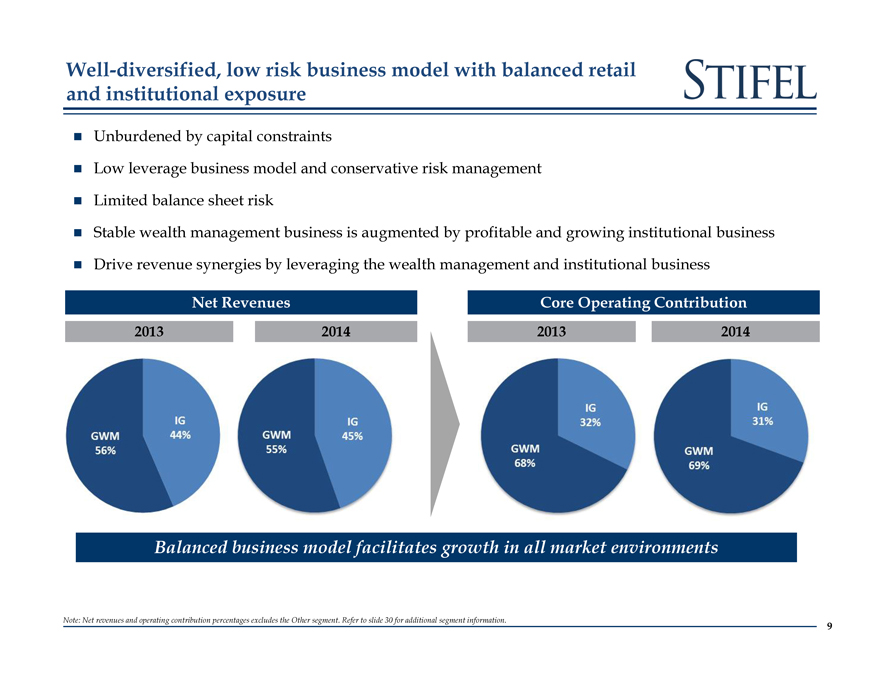
Well-diversified, low risk business model with balanced retail and institutional exposure
[Graphic Appears Here]
Unburdened by capital constraints
Low leverage business model and conservative risk management
Limited balance sheet risk
Stable wealth management business is augmented by profitable and growing institutional business
Drive revenue synergies by leveraging the wealth management and institutional business
Net Revenues Core Operating Contribution
2013 2014 2013 2014
Balanced business model facilitates growth in all market environments
Note: Net revenues and operating contribution percentages excludes the Other segment. Refer to slide 30 for additional segment information.
9
|
|
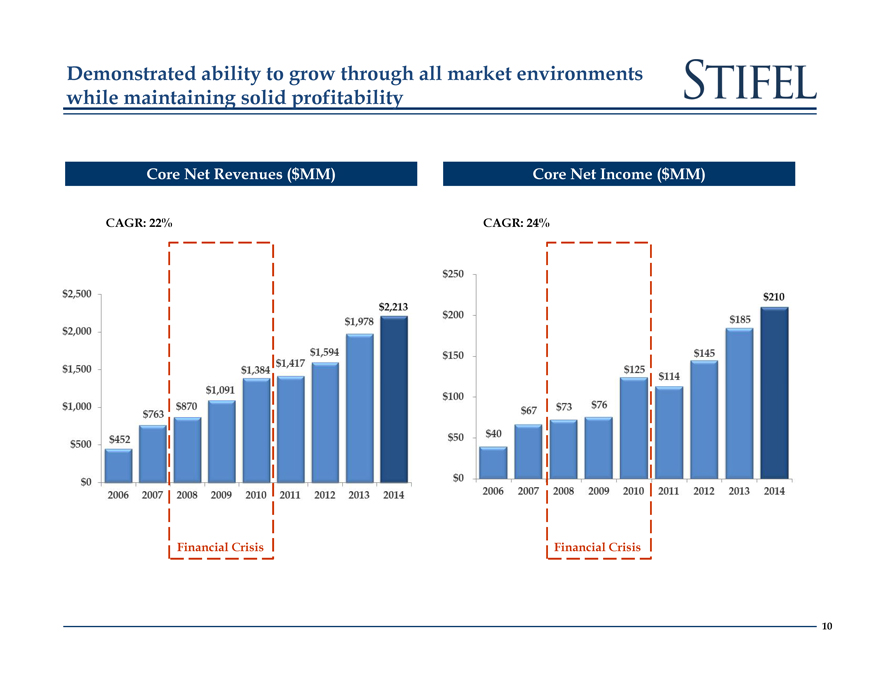
Demonstrated ability to grow through all market environments
while maintaining solid profitability
Core Net Revenues ($MM) Core Net Income ($MM)
CAGR: 22% CAGR: 24%
Financial Crisis Financial Crisis
10
|
|

Segment Overview – Global Wealth Management
|
|
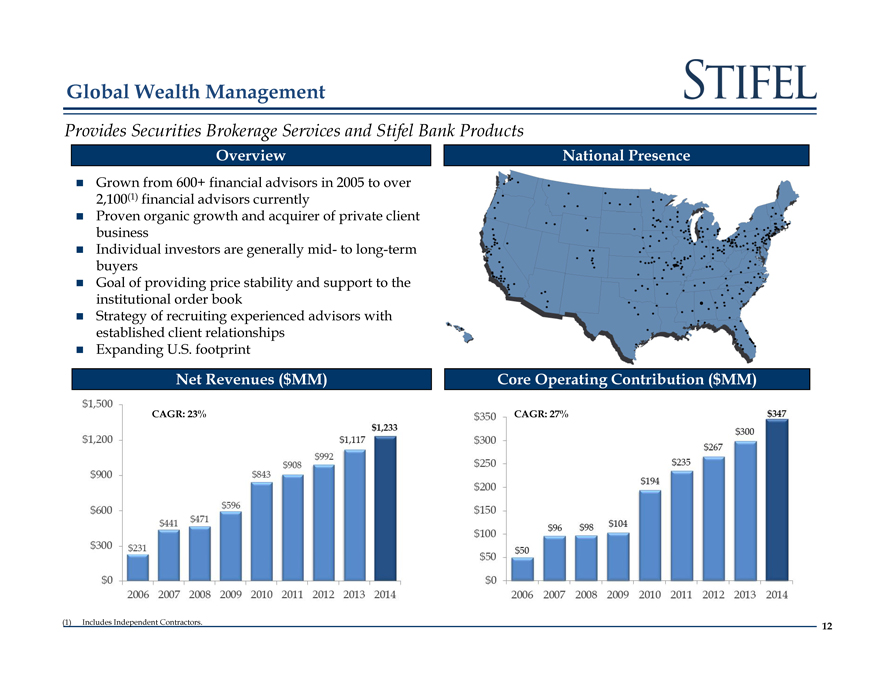
Global Wealth Management
Provides Securities Brokerage Services and Stifel Bank Products
Overview National Presence
Grown from 600+ financial advisors in 2005 to over
2,100(1) financial advisors currently
Proven organic growth and acquirer of private client
business
Individual investors are generally mid- to long-term
buyers
Goal of providing price stability and support to the
institutional order book
Strategy of recruiting experienced advisors with
established client relationships
Expanding U.S. footprint
Net Revenues ($MM) Core Operating Contribution ($MM)
CAGR: 23% CAGR: 27%
Includes Independent Contractors. 12
|
|
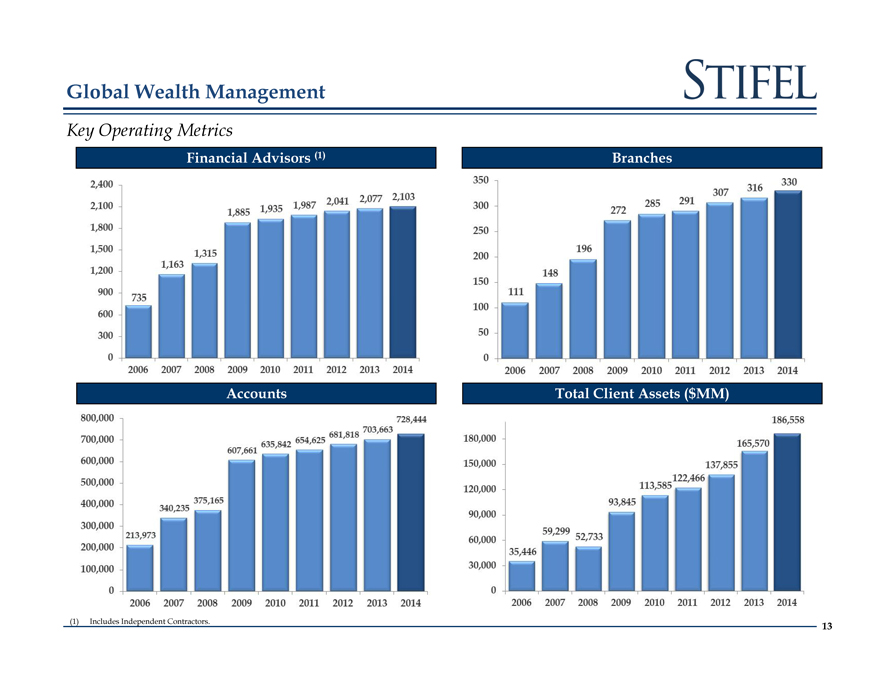
Global Wealth Management
Key Operating Metrics
Financial Advisors (1) Branches
Accounts Total Client Assets ($MM)
(1) Includes Independent Contractors. 13
|
|
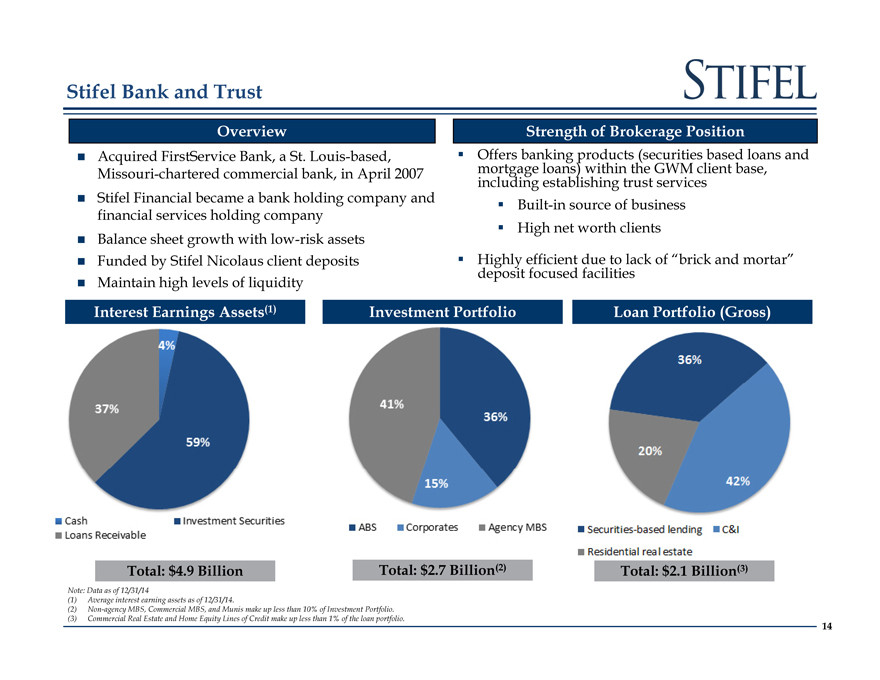
Stifel Bank and Trust
Overview
Acquired FirstService Bank, a St. Louis-based, Missouri-chartered commercial bank, in April 2007
Stifel Financial became a bank holding company and financial services holding company
Balance sheet growth with low-risk assets
Funded by Stifel Nicolaus client deposits
Maintain high levels of liquidity
Strength of Brokerage Position
Offers banking products (securities based loans and mortgage loans) within the GWM client base, including establishing trust services
Built-in source of business
High net worth clients
Highly efficient due to lack of “brick and mortar” deposit focused facilities
Interest Earnings Assets(1) Investment Portfolio Loan Portfolio (Gross)
Total: $4.9 Billion Total: $2.7 Billion(2) Total: $2.1 Billion(3)
Note: Data as of 12/31/14
Average interest earning assets as of 12/31/14.
Non-agency MBS, Commercial MBS, and Munis make up less than 10% of Investment Portfolio.
Commercial Real Estate and Home Equity Lines of Credit make up less than 1% of the loan portfolio.
14
|
|
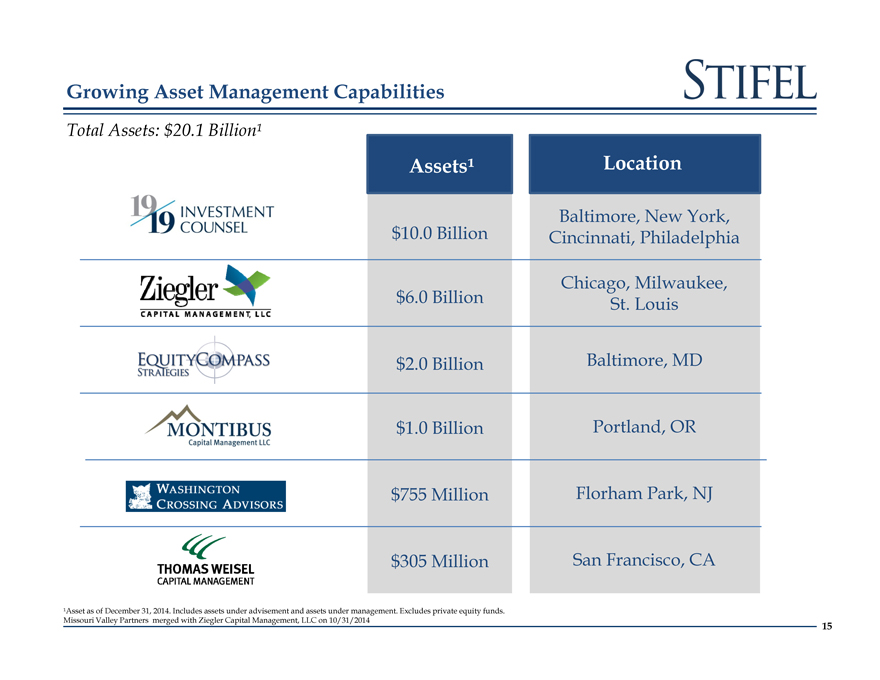
Growing Asset Management Capabilities
Total Assets: $20.1 Billion¹
Assets¹ Location
Baltimore, New York,
$10.0 Billion Cincinnati, Philadelphia
Chicago, Milwaukee,
$6.0 Billion St. Louis
$2.0 Billion Baltimore, MD
$1.0 Billion Portland, OR
$755 Million Florham Park, NJ
$305 Million San Francisco, CA
¹Asset as of December 31, 2014. Includes assets under advisement and assets under management. Excludes private equity funds. Missouri Valley Partners merged with Ziegler Capital Management, LLC on 10/31/2014
15
|
|
Segment Overview – Institutional Group
|
|
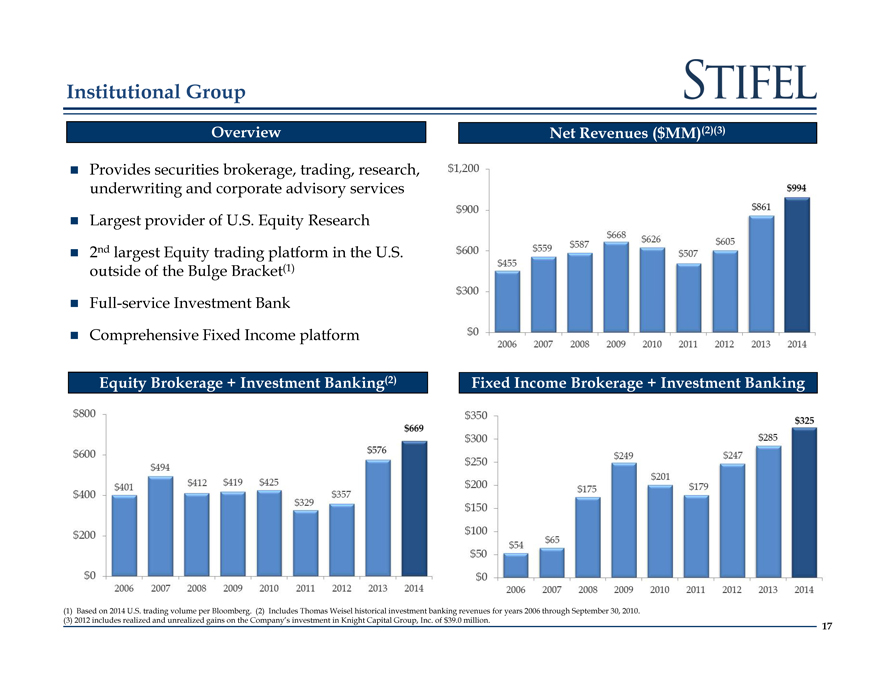
Institutional Group
Overview
Provides securities brokerage, trading, research, underwriting and corporate advisory services
Largest provider of U.S. Equity Research
2nd largest Equity trading platform in the U.S. outside of the Bulge Bracket(1)
Full-service Investment Bank
Comprehensive Fixed Income platform
Net Revenues ($MM)(2)(3)
Equity Brokerage + Investment Banking(2)
Fixed Income Brokerage + Investment Banking
(1) Based on 2014 U.S. trading volume per Bloomberg. (2) Includes Thomas Weisel historical investment banking revenues for years 2006 through September 30, 2010.
(3) 2012 includes realized and unrealized gains on the Company’s investment in Knight Capital Group, Inc. of $39.0 million. 17
|
|
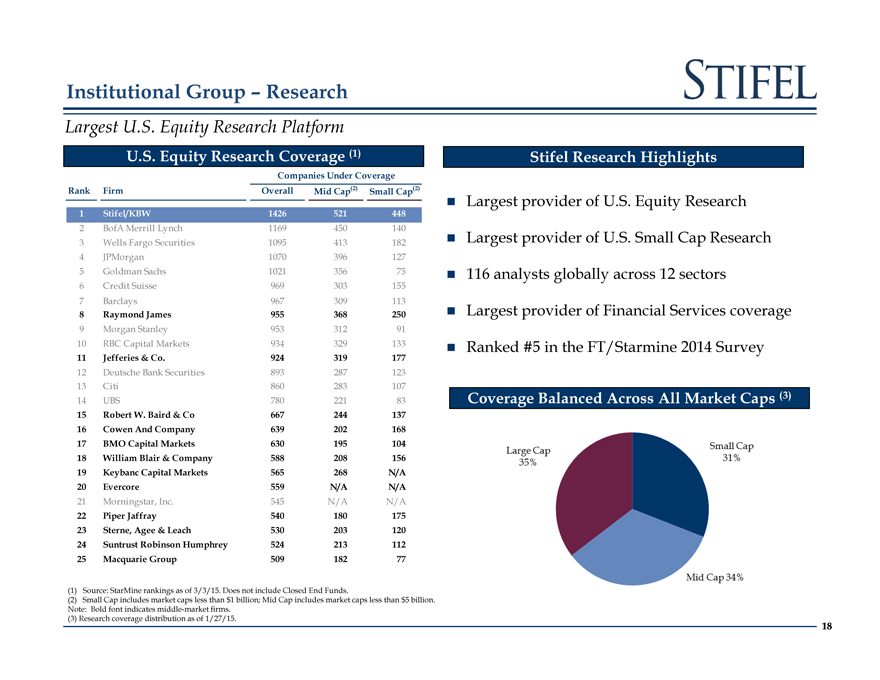
Institutional Group – Research
Largest U.S. Equity Research Platform
U.S. Equity Research Coverage (1)
Companies Under Coverage
Rank Firm Overall Mid Cap(2) Small Cap(2)
1 Stifel/KBW 1426 521 448
2 BofA Merrill Lynch 1169 450 140
3 Wells Fargo Securities 1095 413 182
4 JPMorgan 1070 396 127
5 Goldman Sachs 1021 356 75
6 Credit Suisse 969 303 155
7 Barclays 967 309 113
8 Raymond James 955 368 250
9 Morgan Stanley 953 312 91
10 RBC Capital Markets 934 329 133
11 Jefferies & Co. 924 319 177
12 Deutsche Bank Securities 893 287 123
13 Citi 860 283 107
14 UBS 780 221 83
15 Robert W. Baird & Co 667 244 137
16 Cowen And Company 639 202 168
17 BMO Capital Markets 630 195 104
18 William Blair & Company 588 208 156
19 Keybanc Capital Markets 565 268 N/A
20 Evercore 559 N/A N/A
21 Morningstar, Inc. 545 N/A N/A
22 Piper Jaffray 540 180 175
23 Sterne, Agee & Leach 530 203 120
24 Suntrust Robinson Humphrey 524 213 112
25 Macquarie Group 509 182 77
Source: StarMine rankings as of 3/3/15. Does not include Closed End Funds.
Small Cap includes market caps less than $1 billion; Mid Cap includes market caps less than $5 billion.
Note: Bold font indicates middle-market firms.
(3) Research coverage distribution as of 1/27/15.
Stifel Research Highlights
Largest provider of U.S. Equity Research
Largest provider of U.S. Small Cap Research
116 analysts globally across 12 sectors
Largest provider of Financial Services coverage
Ranked #5 in the FT/Starmine 2014 Survey
Coverage Balanced Across All Market Caps (3)
18
|
|
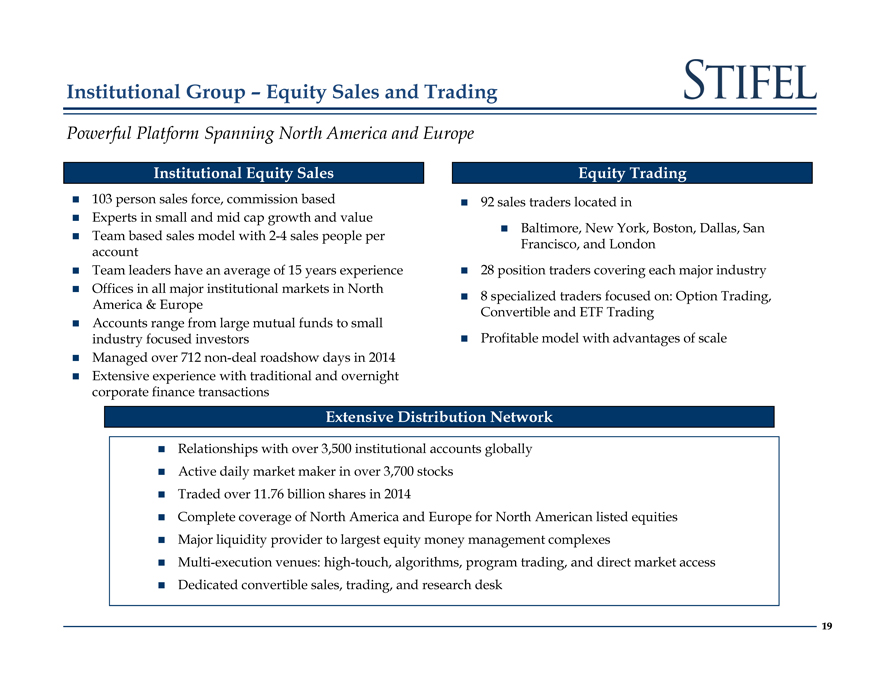
Institutional Group – Equity Sales and Trading
Powerful Platform Spanning North America and Europe
Institutional Equity Sales
103 person sales force, commission based
Experts in small and mid cap growth and value
Team based sales model with 2-4 sales people per account
Team leaders have an average of 15 years experience
Offices in all major institutional markets in North America & Europe
Accounts range from large mutual funds to small industry focused investors
Managed over 712 non-deal roadshow days in 2014
Extensive experience with traditional and overnight corporate finance transactions
Equity Trading
92 sales traders located in
Baltimore, New York, Boston, Dallas, San Francisco, and London
28 position traders covering each major industry
8 specialized traders focused on: Option Trading, Convertible and ETF Trading
Profitable model with advantages of scale
Extensive Distribution Network
Relationships with over 3,500 institutional accounts globally
Active daily market maker in over 3,700 stocks
Traded over 11.76 billion shares in 2014
Complete coverage of North America and Europe for North American listed equities
Major liquidity provider to largest equity money management complexes
Multi-execution venues: high-touch, algorithms, program trading, and direct market access
Dedicated convertible sales, trading, and research desk
19
|
|
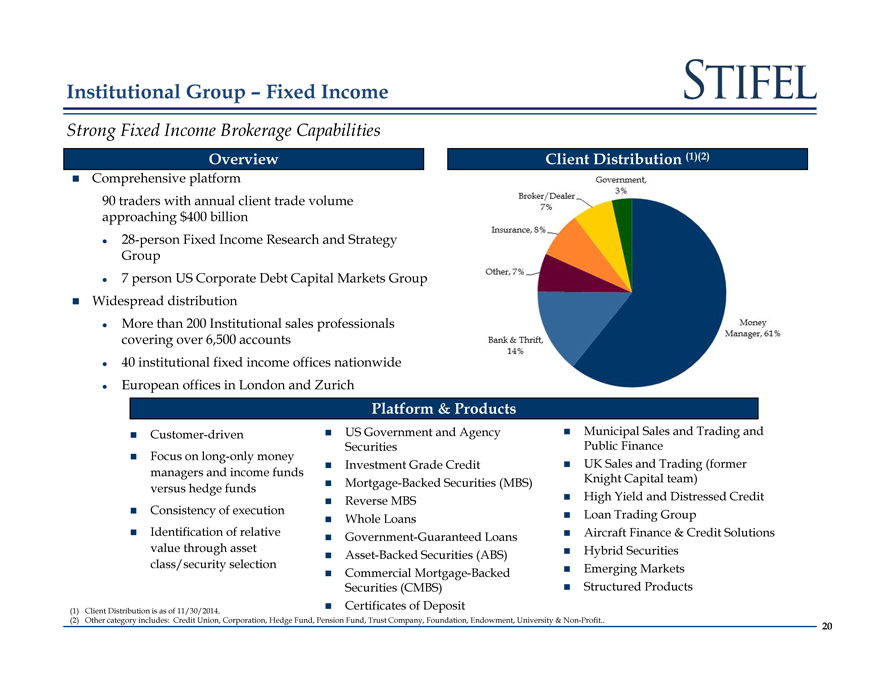
Institutional Group – Fixed Income
Strong Fixed Income Brokerage Capabilities
Overview
Comprehensive platform
90 traders with annual client trade volume
approaching $400 billion
28-person Fixed Income Research and Strategy Group
7 person US Corporate Debt Capital Markets Group
Widespread distribution
More than 200 Institutional sales professionals covering over 6,500 accounts
40 institutional fixed income offices nationwide
European offices in London and Zurich
Client Distribution (1)(2)
Platform & Products
Customer-driven US Government and Agency Municipal Sales and Trading and
Securities Public Finance
Focus on long-only money
managers and income funds Investment Grade Credit UK Sales and Trading (former
Mortgage-Backed Securities (MBS) Knight Capital team)
versus hedge funds
Reverse MBS High Yield and Distressed Credit
Consistency of execution Whole Loans Loan Trading Group
Identification of relative Government-Guaranteed Loans Aircraft Finance & Credit Solutions
value through asset Asset-Backed Securities (ABS) Hybrid Securities
class/security selection Commercial Mortgage-Backed Emerging Markets
Securities (CMBS) Structured Products
(1) Client Distribution is as of 11/30/2014. Certificates of Deposit
(2) Other category includes: Credit Union, Corporation, Hedge Fund, Pension Fund, Trust Company, Foundation, Endowment, University & Non-Profit 20
|
|
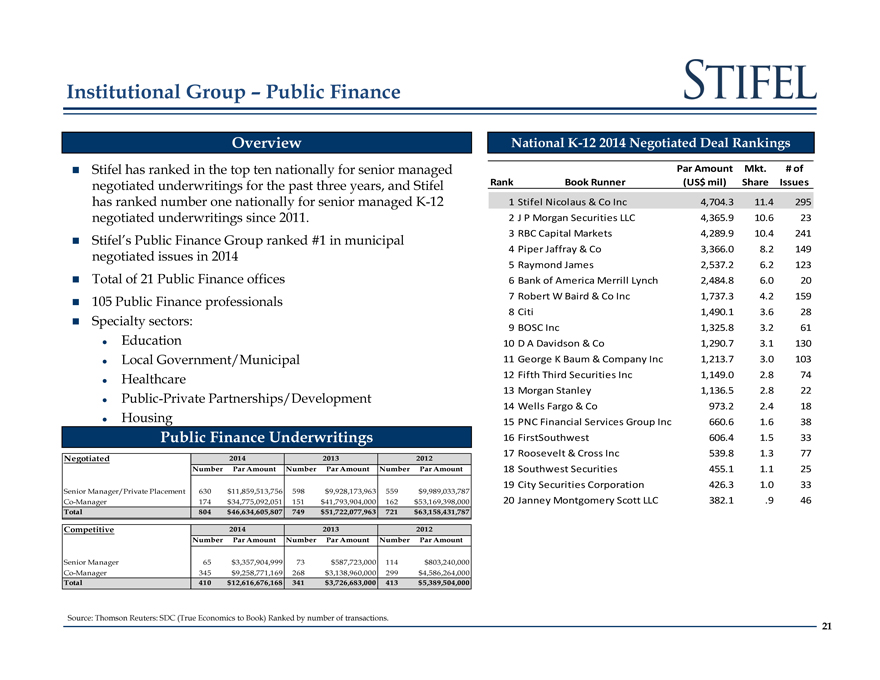
Institutional Group – Public Finance
Overview National K-12 2014 Negotiated Deal Rankings
Stifel has ranked in the top ten nationally for senior managed Par Amount Mkt. # of
negotiated underwritings for the past three years, and Stifel Rank Book Runner(US$ mil) Share Issues
has ranked number one nationally for senior managed K-12 1 Stifel Nicolaus & Co Inc 4,704.3 11.4 295
negotiated underwritings since 2011. 2 J P Morgan Securities LLC 4,365.9 10.6 23
Stifel’s Public Finance Group ranked #1 in municipal 3 RBC Capital Markets 4,289.9 10.4 241
negotiated issues in 2014 4 Piper Jaffray & Co 3,366.0 8.2 149
5 Raymond James 2,537.2 6.2 123
Total of 21 Public Finance offices 6 Bank of America Merrill Lynch 2,484.8 6.0 20
105 Public Finance professionals 7 Robert W Baird & Co Inc 1,737.3 4.2 159
8 Citi 1,490.1 3.6 28
Specialty sectors: 9 BOSC Inc 1,325.8 3.2 61
? Education 10 D A Davidson & Co 1,290.7 3.1 130
? Local Government/Municipal 11 George K Baum & Company Inc 1,213.7 3.0 103
? Healthcare 12 Fifth Third Securities Inc 1,149.0 2.8 74
13 Morgan Stanley 1,136.5 2.8 22
? Public-Private Partnerships/Development
14 Wells Fargo & Co 973.2 2.4 18
? Housing 15 PNC Financial Services Group Inc 660.6 1.6 38
Public Finance Underwritings 16 FirstSouthwest 606.4 1.5 33
Negotiated 2014 2013 2012 17 Roosevelt & Cross Inc 539.8 1.3 77
Number Par Amount Number Par Amount Number Par Amount 18 Southwest Securities 455.1 1.1 25
19 City Securities Corporation 426.3 1.0 33
Senior Manager/Private Placement 630 $11,859,513,756 598 $9,928,173,963 559 $9,989,033,787
Co-Manager 174 $34,775,092,051 151 $41,793,904,000 162 $53,169,398,000 20 Janney Montgomery Scott LLC 382.1 .9 46
Total 804 $46,634,605,807 749 $51,722,077,963 721 $63,158,431,787
Competitive 2014 2013 2012
Number Par Amount Number Par Amount Number Par Amount
Senior Manager 65 $3,357,904,999 73 $587,723,000 114 $803,240,000
Co-Manager 345 $9,258,771,169 268 $3,138,960,000 299 $4,586,264,000
Total 410 $12,616,676,168 341 $3,726,683,000 413 $5,389,504,000
Source: Thomson Reuters: SDC (True Economics to Book) Ranked by number of transactions.
21
|
|
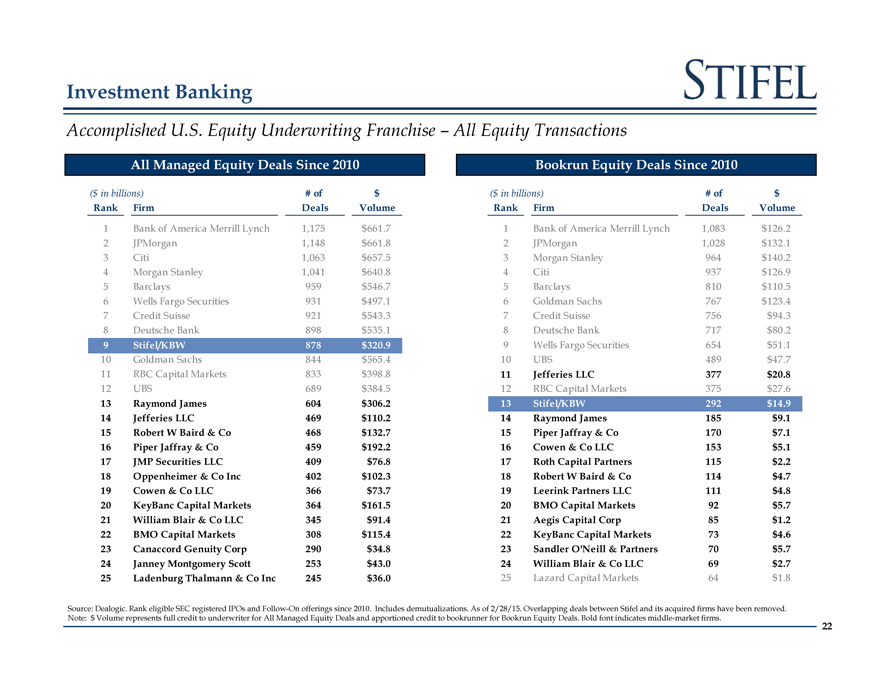
Investment Banking
Accomplished U.S. Equity Underwriting Franchise – All Equity Transactions
All Managed Equity Deals Since 2010 Bookrun Equity Deals Since 2010
($ in billions) # of $($ in billions) # of $
Rank Firm Deals Volume Rank Firm Deals Volume
1 Bank of America Merrill Lynch 1,175 $661.7 1 Bank of America Merrill Lynch 1,083 $126.2
2 JPMorgan 1,148 $661.8 2 JPMorgan 1,028 $132.1
3 Citi 1,063 $657.5 3 Morgan Stanley 964 $140.2
4 Morgan Stanley 1,041 $640.8 4 Citi 937 $126.9
5 Barclays 959 $546.7 5 Barclays 810 $110.5
6 Wells Fargo Securities 931 $497.1 6 Goldman Sachs 767 $123.4
7 Credit Suisse 921 $543.3 7 Credit Suisse 756 $94.3
8 Deutsche Bank 898 $535.1 8 Deutsche Bank 717 $80.2
9 Stifel/KBW 878 $320.9 9 Wells Fargo Securities 654 $51.1
10 Goldman Sachs 844 $565.4 10 UBS 489 $47.7
11 RBC Capital Markets 833 $398.8 11 Jefferies LLC 377 $20.8
12 UBS 689 $384.5 12 RBC Capital Markets 375 $27.6
13 Raymond James 604 $306.2 13 Stifel/KBW 292 $14.9
14 Jefferies LLC 469 $110.2 14 Raymond James 185 $9.1
15 Robert W Baird & Co 468 $132.7 15 Piper Jaffray & Co 170 $7.1
16 Piper Jaffray & Co 459 $192.2 16 Cowen & Co LLC 153 $5.1
17 JMP Securities LLC 409 $76.8 17 Roth Capital Partners 115 $2.2
18 Oppenheimer & Co Inc 402 $102.3 18 Robert W Baird & Co 114 $4.7
19 Cowen & Co LLC 366 $73.7 19 Leerink Partners LLC 111 $4.8
20 KeyBanc Capital Markets 364 $161.5 20 BMO Capital Markets 92 $5.7
21 William Blair & Co LLC 345 $91.4 21 Aegis Capital Corp 85 $1.2
22 BMO Capital Markets 308 $115.4 22 KeyBanc Capital Markets 73 $4.6
23 Canaccord Genuity Corp 290 $34.8 23 Sandler O’Neill & Partners 70 $5.7
24 Janney Montgomery Scott 253 $43.0 24 William Blair & Co LLC 69 $2.7
25 Ladenburg Thalmann & Co Inc 245 $36.0 25 Lazard Capital Markets 64 $1.8
Source: Dealogic. Rank eligible SEC registered IPOs and Follow-On offerings since 2010. Includes demutualizations. As of 2/28/15. Overlapping deals between Stifel and its acquired firms have been removed. Note: $ Volume represents full credit to underwriter for All Managed Equity Deals and apportioned credit to bookrunner for Bookrun Equity Deals. Bold font indicates middle-market firms.
22
|
|

Financial Overview
|
|
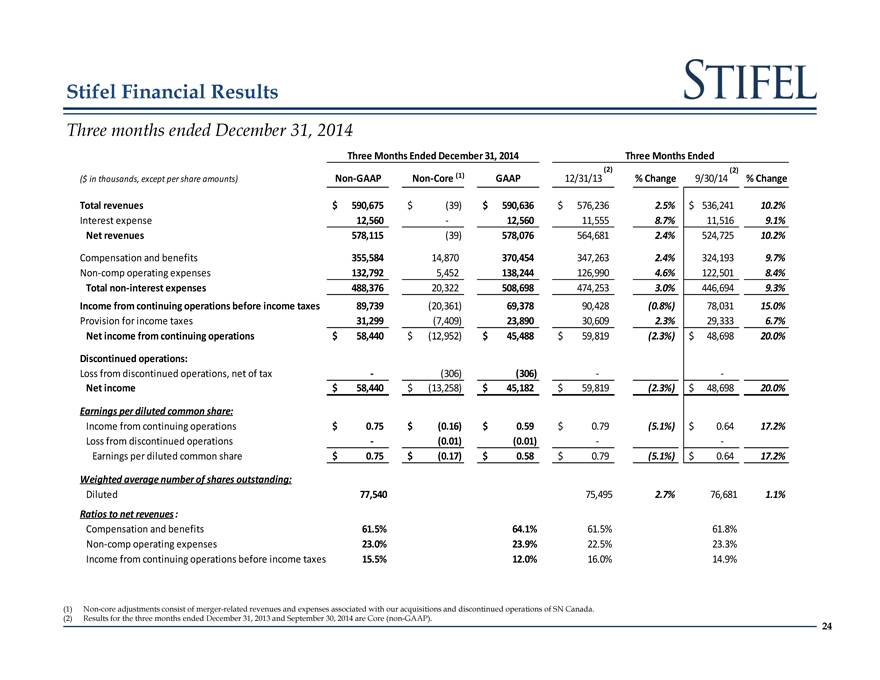
Stifel Financial Results
Three months ended December 31, 2014
Three Months Ended December 31, 2014 Three Months Ended
(2)(2)
($ in thousands, except per share amounts) Non-GAAP Non-Core (1) GAAP 12/31/13% Change 9/30/14% Change
Total revenues $ 590,675 $(39) $ 590,636 $ 576,236 2.5% $ 536,241 10.2%
Interest expense 12,560—12,560 11,555 8.7% 11,516 9.1%
Net revenues 578,115(39) 578,076 564,681 2.4% 524,725 10.2%
Compensation and benefits 355,584 14,870 370,454 347,263 2.4% 324,193 9.7%
Non-comp operating expenses 132,792 5,452 138,244 126,990 4.6% 122,501 8.4%
Total non-interest expenses 488,376 20,322 508,698 474,253 3.0% 446,694 9.3%
Income from continuing operations before income taxes 89,739(20,361) 69,378 90,428(0.8%) 78,031 15.0%
Provision for income taxes 31,299(7,409) 23,890 30,609 2.3% 29,333 6.7%
Net income from continuing operations $ 58,440 $ (12,952) $ 45,488 $ 59,819(2.3%) $ 48,698 20.0%
Discontinued operations:
Loss from discontinued operations, net of tax -(306)(306) —
Net income $ 58,440 $ (13,258) $ 45,182 $ 59,819(2.3%) $ 48,698 20.0%
Earnings per diluted common share:
Income from continuing operations $ 0.75 $(0.16) $ 0.59 $ 0.79(5.1%) $ 0.64 17.2%
Loss from discontinued operations -(0.01)(0.01) —
Earnings per diluted common share $ 0.75 $(0.17) $ 0.58 $ 0.79(5.1%) $ 0.64 17.2%
Weighted average number of shares outstanding:
Diluted 77,540 75,495 2.7% 76,681 1.1%
Ratios to net revenues :
Compensation and benefits 61.5% 64.1% 61.5% 61.8%
Non-comp operating expenses 23.0% 23.9% 22.5% 23.3%
Income from continuing operations before income taxes 15.5% 12.0% 16.0% 14.9%
Non-core adjustments consist of merger-related revenues and expenses associated with our acquisitions and discontinued operations of SN Canada.
Results for the three months ended December 31, 2013 and September 30, 2014 are Core (non-GAAP).
24
|
|
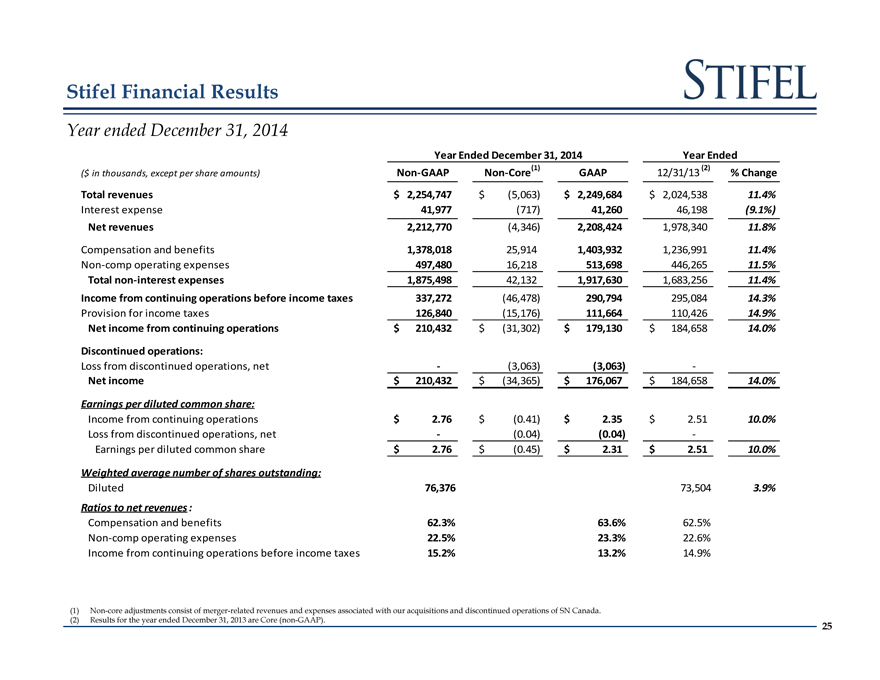
Stifel Financial Results
Year ended December 31, 2014
Year Ended December 31, 2014 Year Ended
($ in thousands, except per share amounts) Non-GAAP Non-Core(1) GAAP 12/31/13 (2)% Change
Total revenues $ 2,254,747 $(5,063) $ 2,249,684 $ 2,024,538 11.4%
Interest expense 41,977(717) 41,260 46,198(9.1%)
Net revenues 2,212,770(4,346) 2,208,424 1,978,340 11.8%
Compensation and benefits 1,378,018 25,914 1,403,932 1,236,991 11.4%
Non-comp operating expenses 497,480 16,218 513,698 446,265 11.5%
Total non-interest expenses 1,875,498 42,132 1,917,630 1,683,256 11.4%
Income from continuing operations before income taxes 337,272(46,478) 290,794 295,084 14.3%
Provision for income taxes 126,840(15,176) 111,664 110,426 14.9%
Net income from continuing operations $ 210,432 $(31,302) $ 179,130 $ 184,658 14.0%
Discontinued operations:
Loss from discontinued operations, net -(3,063)(3,063) -
Net income $ 210,432 $(34,365) $ 176,067 $ 184,658 14.0%
Earnings per diluted common share:
Income from continuing operations $ 2.76 $(0.41) $ 2.35 $ 2.51 10.0%
Loss from discontinued operations, net -(0.04)(0.04) -
Earnings per diluted common share $ 2.76 $(0.45) $ 2.31 $ 2.51 10.0%
Weighted average number of shares outstanding:
Diluted 76,376 73,504 3.9%
Ratios to net revenues :
Compensation and benefits 62.3% 63.6% 62.5%
Non-comp operating expenses 22.5% 23.3% 22.6%
Income from continuing operations before income taxes 15.2% 13.2% 14.9%
(1) Non-core adjustments consist of merger-related revenues and expenses associated with our acquisitions and discontinued operations of SN Canada.
(2) Results for the year ended December 31, 2013 are Core (non-GAAP).
25
|
|
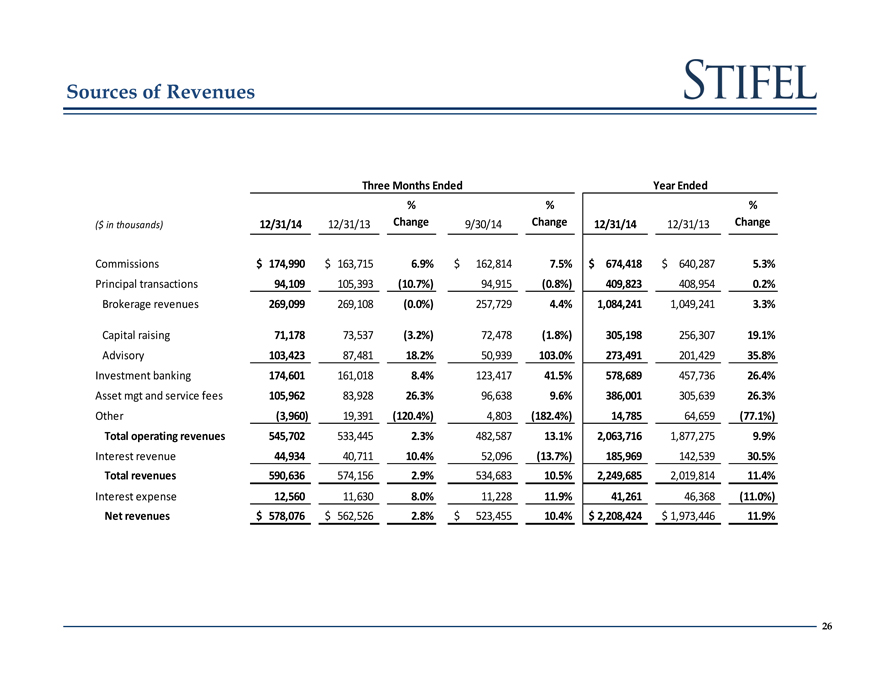
Sources of Revenues
Three Months Ended Year Ended
%%%
($ in thousands) 12/31/14 12/31/13 Change 9/30/14 Change 12/31/14 12/31/13 Change
Commissions $ 174,990 $ 163,715 6.9% $ 162,814 7.5% $ 674,418 $ 640,287 5.3%
Principal transactions 94,109 105,393(10.7%) 94,915(0.8%) 409,823 408,954 0.2%
Brokerage revenues 269,099 269,108(0.0%) 257,729 4.4% 1,084,241 1,049,241 3.3%
Capital raising 71,178 73,537(3.2%) 72,478(1.8%) 305,198 256,307 19.1%
Advisory 103,423 87,481 18.2% 50,939 103.0% 273,491 201,429 35.8%
Investment banking 174,601 161,018 8.4% 123,417 41.5% 578,689 457,736 26.4%
Asset mgt and service fees 105,962 83,928 26.3% 96,638 9.6% 386,001 305,639 26.3%
Other(3,960) 19,391(120.4%) 4,803(182.4%) 14,785 64,659(77.1%)
Total operating revenues 545,702 533,445 2.3% 482,587 13.1% 2,063,716 1,877,275 9.9%
Interest revenue 44,934 40,711 10.4% 52,096(13.7%) 185,969 142,539 30.5%
Total revenues 590,636 574,156 2.9% 534,683 10.5% 2,249,685 2,019,814 11.4%
Interest expense 12,560 11,630 8.0% 11,228 11.9% 41,261 46,368(11.0%)
Net revenues $ 578,076 $ 562,526 2.8% $ 523,455 10.4% $ 2,208,424 $ 1,973,446 11.9%
26
|
|
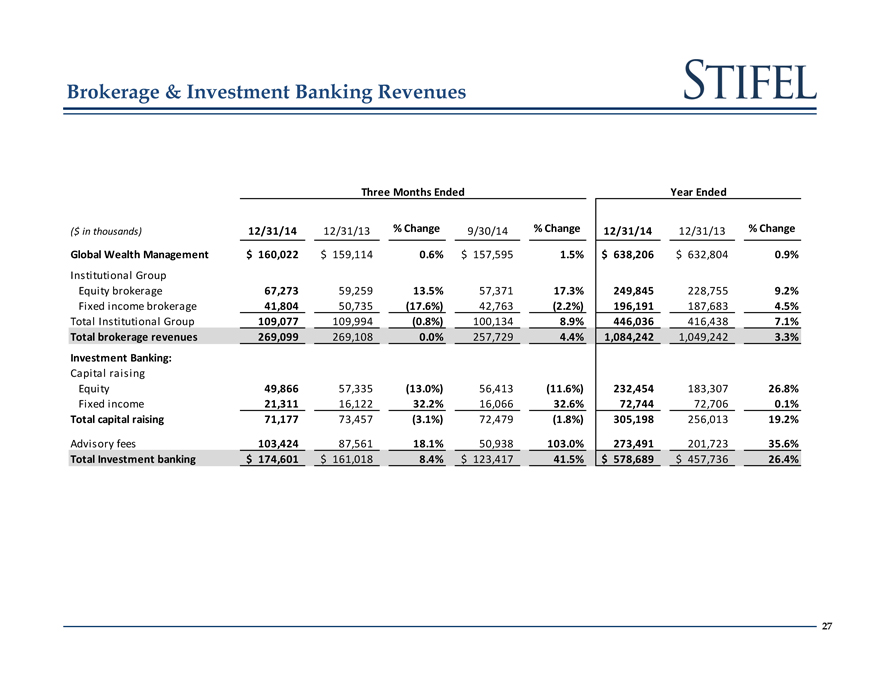
Brokerage & Investment Banking Revenues
Three Months Ended Year Ended
($ in thousands) 12/31/14 12/31/13% Change 9/30/14% Change 12/31/14 12/31/13% Change
Global Wealth Management $ 160,022 $ 159,114 0.6% $ 157,595 1.5% $ 638,206 $ 632,804 0.9%
Institutional Group
Equity brokerage 67,273 59,259 13.5% 57,371 17.3% 249,845 228,755 9.2%
Fixed income brokerage 41,804 50,735(17.6%) 42,763(2.2%) 196,191 187,683 4.5%
Total Institutional Group 109,077 109,994(0.8%) 100,134 8.9% 446,036 416,438 7.1%
Total brokerage revenues 269,099 269,108 0.0% 257,729 4.4% 1,084,242 1,049,242 3.3%
Investment Banking:
Capital raising
Equity 49,866 57,335(13.0%) 56,413(11.6%) 232,454 183,307 26.8%
Fixed income 21,311 16,122 32.2% 16,066 32.6% 72,744 72,706 0.1%
Total capital raising 71,177 73,457(3.1%) 72,479(1.8%) 305,198 256,013 19.2%
Advisory fees 103,424 87,561 18.1% 50,938 103.0% 273,491 201,723 35.6%
Total Investment banking $ 174,601 $ 161,018 8.4% $ 123,417 41.5% $ 578,689 $ 457,736 26.4%
27
|
|
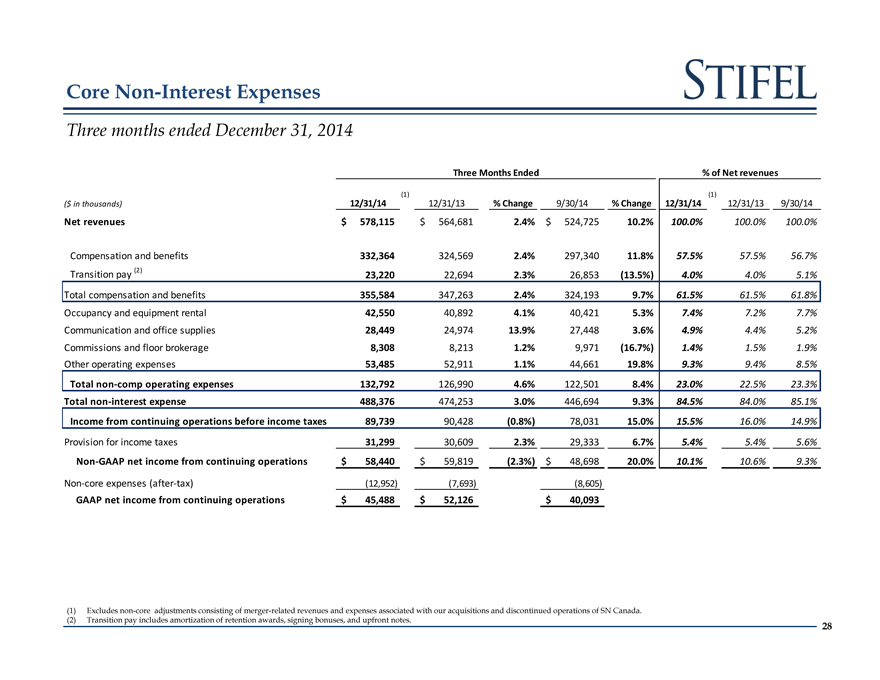
Core Non-Interest Expenses
Three months ended December 31, 2014
Three Months Ended% of Net revenues
(1)(1)
($ in thousands) 12/31/14 12/31/13% Change 9/30/14% Change 12/31/14 12/31/13 9/30/14
Net revenues $ 578,115 $ 564,681 2.4% $ 524,725 10.2% 100.0% 100.0% 100.0%
Compensation and benefits 332,364 324,569 2.4% 297,340 11.8% 57.5% 57.5% 56.7%
Transition pay (2) 23,220 22,694 2.3% 26,853(13.5%) 4.0% 4.0% 5.1%
Total compensation and benefits 355,584 347,263 2.4% 324,193 9.7% 61.5% 61.5% 61.8%
Occupancy and equipment rental 42,550 40,892 4.1% 40,421 5.3% 7.4% 7.2% 7.7%
Communication and office supplies 28,449 24,974 13.9% 27,448 3.6% 4.9% 4.4% 5.2%
Commissions and floor brokerage 8,308 8,213 1.2% 9,971(16.7%) 1.4% 1.5% 1.9%
Other operating expenses 53,485 52,911 1.1% 44,661 19.8% 9.3% 9.4% 8.5%
Total non-comp operating expenses 132,792 126,990 4.6% 122,501 8.4% 23.0% 22.5% 23.3%
Total non-interest expense 488,376 474,253 3.0% 446,694 9.3% 84.5% 84.0% 85.1%
Income from continuing operations before income taxes 89,739 90,428(0.8%) 78,031 15.0% 15.5% 16.0% 14.9%
Provision for income taxes 31,299 30,609 2.3% 29,333 6.7% 5.4% 5.4% 5.6%
Non-GAAP net income from continuing operations $ 58,440 $ 59,819(2.3%) $ 48,698 20.0% 10.1% 10.6% 9.3%
Non-core expenses (after-tax)(12,952)(7,693)(8,605)
GAAP net income from continuing operations $ 45,488 $ 52,126 $ 40,093
(1) Excludes non-core adjustments consisting of merger-related revenues and expenses associated with our acquisitions and discontinued operations of SN Canada.
(2) Transition pay includes amortization of retention awards, signing bonuses, and upfront notes.
28
|
|
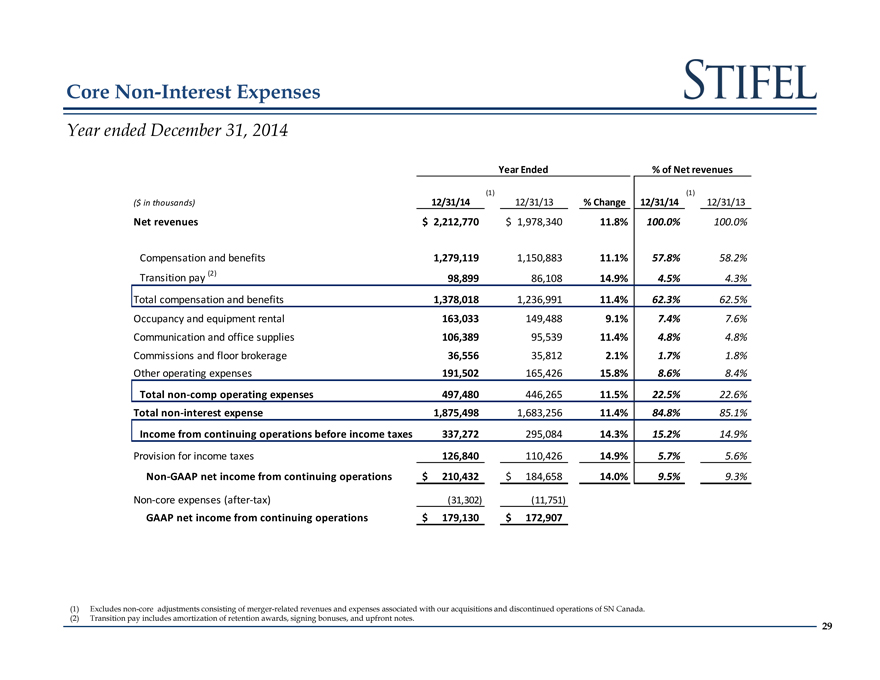
Core Non-Interest Expenses
Year ended December 31, 2014
Year Ended% of Net revenues
(1)(1)
($ in thousands) 12/31/14 12/31/13% Change 12/31/14 12/31/13
Net revenues $ 2,212,770 $ 1,978,340 11.8% 100.0% 100.0%
Compensation and benefits 1,279,119 1,150,883 11.1% 57.8% 58.2%
Transition pay (2) 98,899 86,108 14.9% 4.5% 4.3%
Total compensation and benefits 1,378,018 1,236,991 11.4% 62.3% 62.5%
Occupancy and equipment rental 163,033 149,488 9.1% 7.4% 7.6%
Communication and office supplies 106,389 95,539 11.4% 4.8% 4.8%
Commissions and floor brokerage 36,556 35,812 2.1% 1.7% 1.8%
Other operating expenses 191,502 165,426 15.8% 8.6% 8.4%
Total non-comp operating expenses 497,480 446,265 11.5% 22.5% 22.6%
Total non-interest expense 1,875,498 1,683,256 11.4% 84.8% 85.1%
Income from continuing operations before income taxes 337,272 295,084 14.3% 15.2% 14.9%
Provision for income taxes 126,840 110,426 14.9% 5.7% 5.6%
Non-GAAP net income from continuing operations $ 210,432 $ 184,658 14.0% 9.5% 9.3%
Non-core expenses (after-tax)(31,302)(11,751)
GAAP net income from continuing operations $ 179,130 $ 172,907
Excludes non-core adjustments consisting of merger-related revenues and expenses associated with our acquisitions and discontinued operations of SN Canada.
Transition pay includes amortization of retention awards, signing bonuses, and upfront notes.
29
|
|
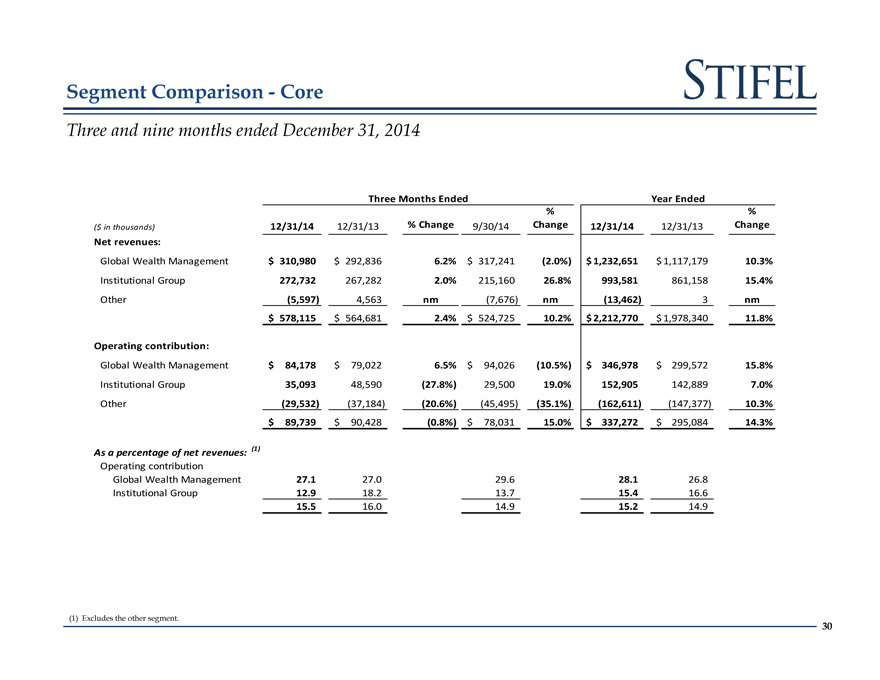
Segment Comparison—Core
Three and nine months ended December 31, 2014
Three Months Ended Year Ended
%%
($ in thousands) 12/31/14 12/31/13% Change 9/30/14 Change 12/31/14 12/31/13 Change
Net revenues:
Global Wealth Management $ 310,980 $ 292,836 6.2% $ 317,241(2.0%) $ 1,232,651 $ 1,117,179 10.3%
Institutional Group 272,732 267,282 2.0% 215,160 26.8% 993,581 861,158 15.4%
Other(5,597) 4,563 nm(7,676) nm(13,462) 3 nm
$ 578,115 $ 564,681 2.4% $ 524,725 10.2% $ 2,212,770 $ 1,978,340 11.8%
Operating contribution:
Global Wealth Management $ 84,178 $ 79,022 6.5% $ 94,026(10.5%) $ 346,978 $ 299,572 15.8%
Institutional Group 35,093 48,590(27.8%) 29,500 19.0% 152,905 142,889 7.0%
Other(29,532)(37,184)(20.6%)(45,495)(35.1%)(162,611)(147,377) 10.3%
$ 89,739 $ 90,428(0.8%) $ 78,031 15.0% $ 337,272 $ 295,084 14.3%
As a percentage of net revenues: (1)
Operating contribution
Global Wealth Management 27.1 27.0 29.6 28.1 26.8
Institutional Group 12.9 18.2 13.7 15.4 16.6
15.5 16.0 14.9 15.2 14.9
(1) Excludes the other segment.
30
|
|
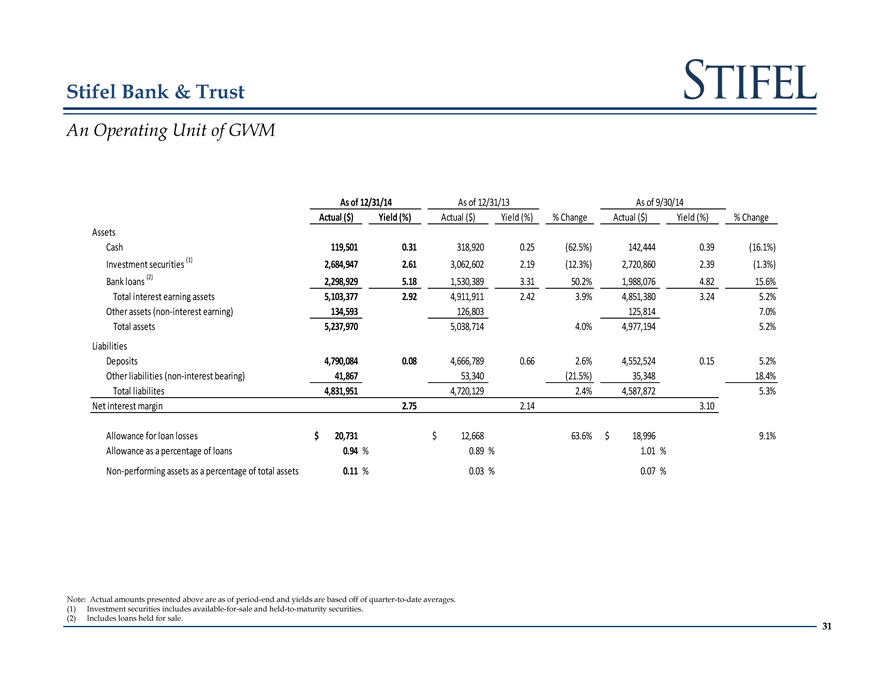
Stifel Bank & Trust
An Operating Unit of GWM
As of 12/31/14 As of 12/31/13 As of 9/30/14
Actual ($) Yield (%) Actual ($) Yield (%)% Change Actual ($) Yield (%)% Change
Assets
Cash 119,501 0.31 318,920 0.25(62.5%) 142,444 0.39(16.1%)
Investment securities (1) 2,684,947 2.61 3,062,602 2.19(12.3%) 2,720,860 2.39(1.3%)
Bank loans (2) 2,298,929 5.18 1,530,389 3.31 50.2% 1,988,076 4.82 15.6%
Total interest earning assets 5,103,377 292. 4,911,911 2.42 3.9% 4,851,380 3.24 5.2%
Other assets (non-interest earning) 134,593 126,803 125,814 7.0%
Total assets 5,237,970 5,038,714 4.0% 4,977,194 5.2%
Liabilities
Deposits 4,790,084 0.08 4,666,789 0.66 2.6% 4,552,524 0.15 5.2%
Other liabilities (non-interest bearing) 41,867 53,340(21.5%) 35,348 18.4%
Total liabilites 4,831,951 4,720,129 2.4% 4,587,872 5.3%
Net interest margin 2.75 2.14 3.10
Allowance for loan losses $ 20,731 $ 12,668 63.6% $ 18,996 9.1%
Allowance as a percentage of loans 0.94%0.89% 1.01%
Non-performing assets as a percentage of total assets 0.11% 0.03% 0.07%
Note: Actual amounts presented above are as of period-end and yields are based off of quarter-to-date averages.
Investment securities includes available-for-sale and held-to-maturity securities.
Includes loans held for sale.
31
|
|
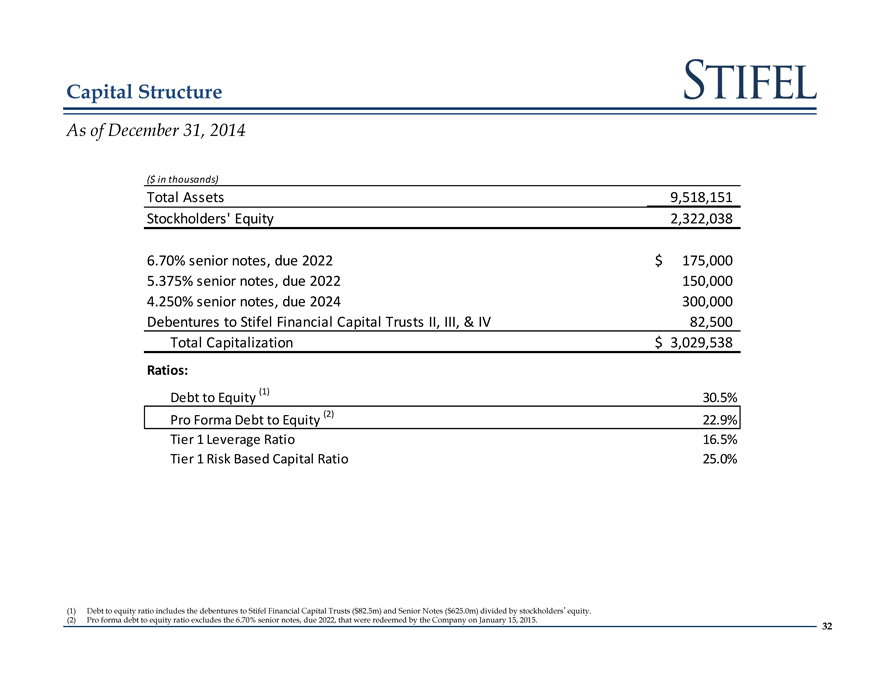
Capital Structure
As of December 31, 2014
($ in thousands)
Total Assets 9,518,151
Stockholders’ Equity 2,322,038
6.70% senior notes, due 2022 $ 175,000
5.375% senior notes, due 2022 150,000
4.250% senior notes, due 2024 300,000
Debentures to Stifel Financial Capital Trusts II, III, & IV 82,500
Total Capitalization $ 3,029,538
Ratios:
Debt to Equity (1) 30.5%
Pro Forma Debt to Equity (2) 22.9%
Tier 1 Leverage Ratio 16.5%
Tier 1 Risk Based Capital Ratio 25.0%
(1) Debt to equity ratio includes the debentures to Stifel Financial Capital Trusts ($82.5m) and Senior Notes ($625.0m) divided by stockholders’equity.
(2) Pro forma debt to equity ratio excludes the 6.70% senior notes, due 2022, that were redeemed by the Company on January 15, 2015.
32
|
|
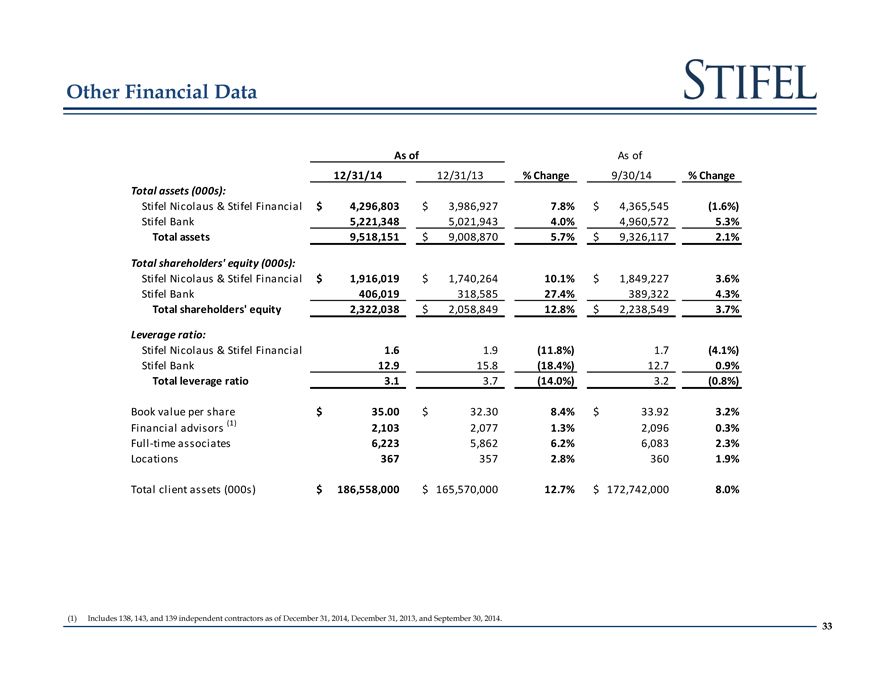
Other Financial Data
As of As of
12/31/14 12/31/13% Change 9/30/14% Change
Total assets (000s):
Stifel Nicolaus & Stifel Financial $ 4,296,803 $ 3,986,927 7.8% $ 4,365,545(1.6%)
Stifel Bank 5,221,348 5,021,943 4.0% 4,960,572 5.3%
Total assets 9,518,151 $ 9,008,870 5.7% $ 9,326,117 2.1%
Total shareholders’ equity (000s):
Stifel Nicolaus & Stifel Financial $ 1,916,019 $ 1,740,264 10.1% $ 1,849,227 3.6%
Stifel Bank 406,019 318,585 27.4% 389,322 4.3%
Total shareholders’ equity 2,322,038 $ 2,058,849 12.8% $ 2,238,549 3.7%
Leverage ratio:
Stifel Nicolaus & Stifel Financial 1.6 1.9(11.8%) 1.7(4.1%)
Stifel Bank 12.9 15.8(18.4%) 12.7 0.9%
Total leverage ratio 3.1 3.7(14.0%) 3.2(0.8%)
Book value per share $ 35.00 $ 32.30 8.4% $ 33.92 3.2%
Financial advisors (1) 2,103 2,077 1.3% 2,096 0.3%
Full -time associates 6,223 5,862 6.2% 6,083 2.3%
Locations 367 357 2.8% 360 1.9%
Total client assets (000s) $ 186,558,000 $ 165,570,000 12.7% $ 172,742,000 8.0%
(1) Includes 138, 143, and 139 independent contractors as of December 31, 2014, December 31, 2013, and September 30, 2014.
33
|
|
Sterne Agee Merger
|
|
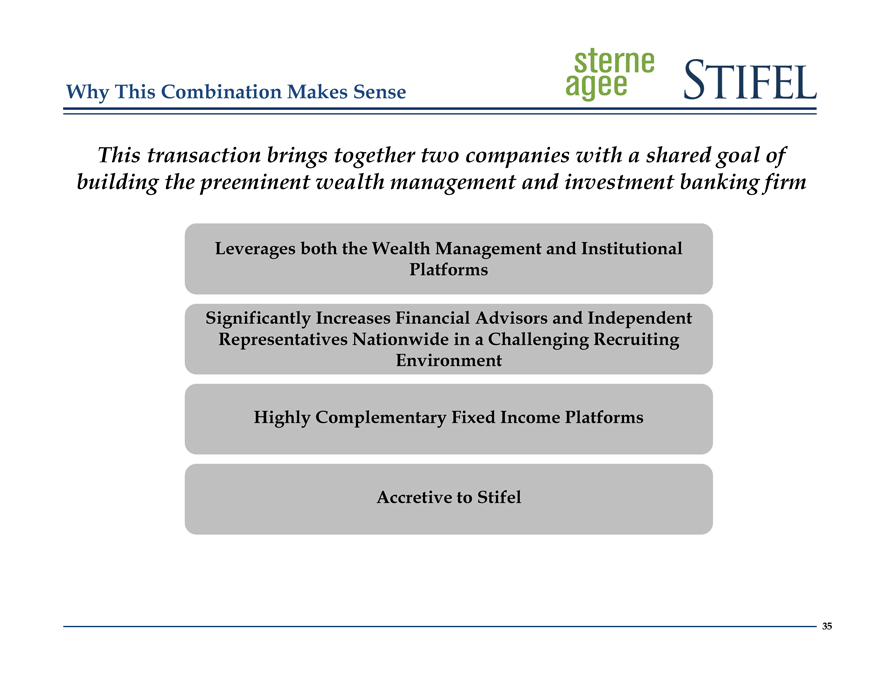
Why This Combination Makes Sense
This transaction brings together two companies with a shared goal of building the preeminent wealth management and investment banking firm
Leverages both the Wealth Management and Institutional Platforms
Significantly Increases Financial Advisors and Independent Representatives Nationwide in a Challenging Recruiting Environment
Highly Complementary Fixed Income Platforms
Accretive to Stifel
35
|
|
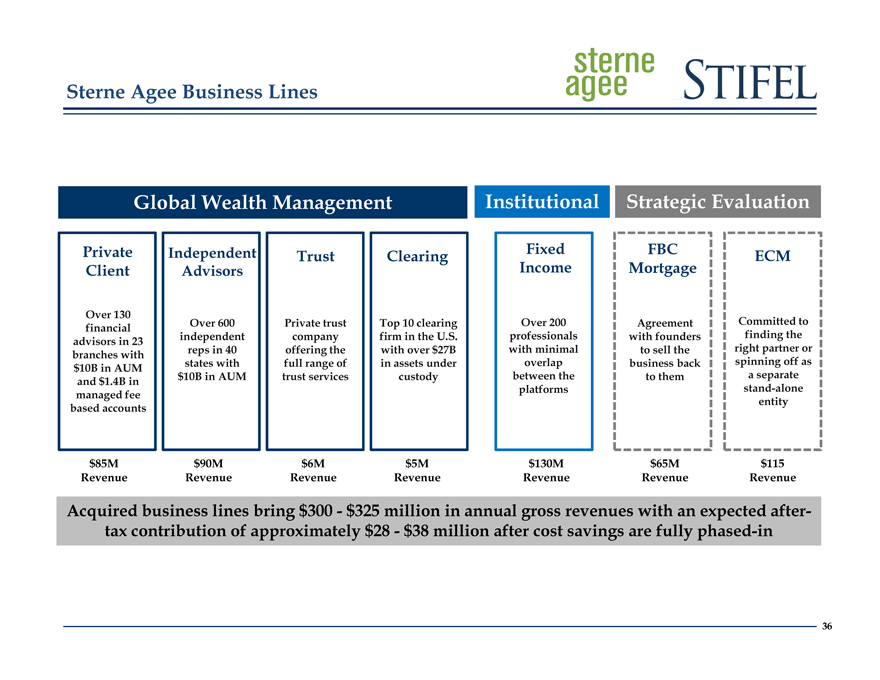
Sterne Agee Business Lines
Global Wealth Management Institutional Strategic Evaluation
Private Independent Trust Clearing Fixed FBC ECM
Client Advisors Income Mortgage
Over 130
financial Over 600 Private trust Top 10 clearing Over 200 Agreement Committed to
advisors in 23 independent company firm in the U.S. professionals with founders finding the
branches with reps in 40 offering the with over $27B with minimal to sell the right partner or
$10B in AUM states with full range of in assets under overlap business back spinning off as
and $1.4B in $10B in AUM trust services custody between the to them a separate
managed fee platforms stand-alone
based accounts entity
$85M $90M $6M $5M $130M $65M $115
Revenue Revenue Revenue Revenue Revenue Revenue Revenue
Acquired business lines bring $300—$325 million in annual gross revenues with an expected after-tax contribution of approximately $28—$38 million after cost savings are fully phased-in
36
|
|
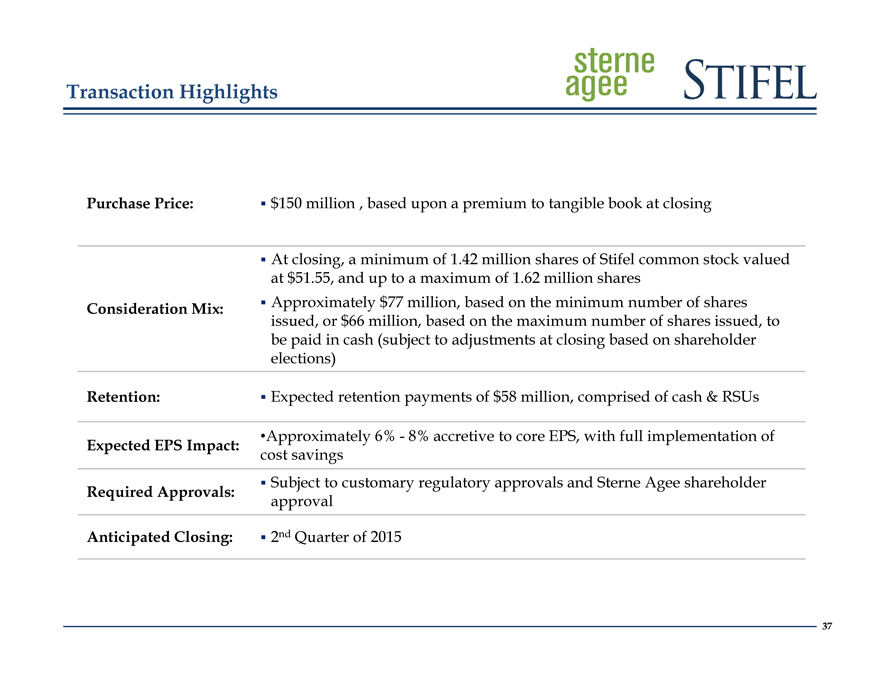
Transaction Highlights
Purchase Price:
Consideration Mix:
Retention:
Expected EPS Impact:
Required Approvals:
Anticipated Closing:
$150 million , based upon a premium to tangible book at closing
At closing, a minimum of 1.42 million shares of Stifel common stock valued at $51.55, and up to a maximum of 1.62 million shares
Approximately $77 million, based on the minimum number of shares issued, or $66 million, based on the maximum number of shares issued, to be paid in cash (subject to adjustments at closing based on shareholder elections)
Expected retention payments of $58 million, comprised of cash & RSUs
Approximately 6%—8% accretive to core EPS, with full implementation of cost savings
Subject to customary regulatory approvals and Sterne Agee shareholder approval
2nd Quarter of 2015
37
|
|
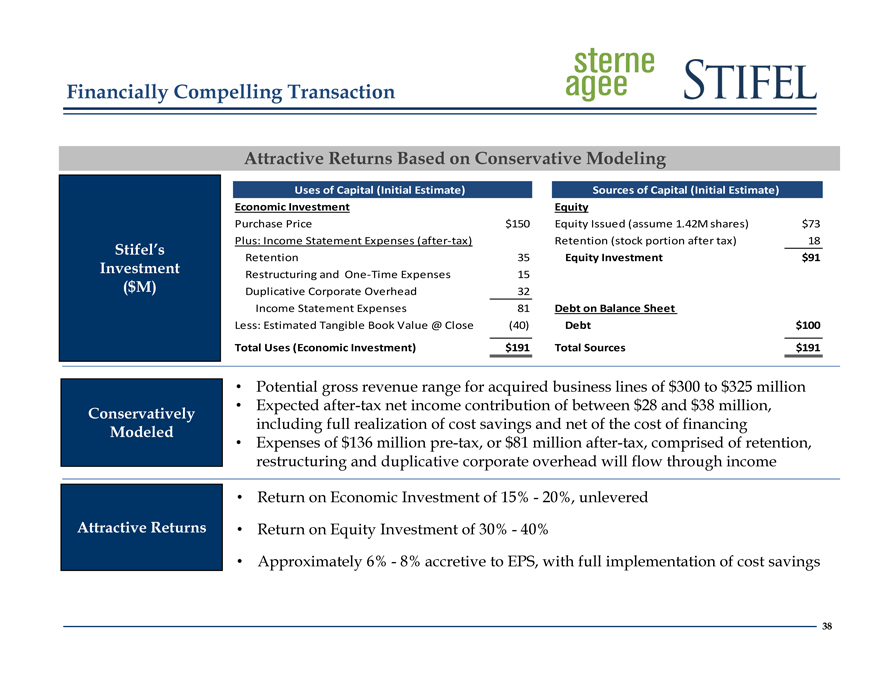
Financially Compelling Transaction
Attractive Returns Based on Conservative Modeling
Uses of Capital (Initial Estimate) Sources of Capital (Initial Estimate)
Economic Investment Equity
Purchase Price $150 Equity Issued (assume 1.42M shares) $73
Stifel’s Plus: Income Statement Expenses (after-tax) Retention (stock portion after tax) 18
Retention 35 Equity Investment $91
Investment Restructuring and One-Time Expenses 15
($M) Duplicative Corporate Overhead 32
Income Statement Expenses 81 Debt on Balance Sheet
Less: Estimated Tangible Book Value @ Close(40) Debt $100
Total Uses (Economic Investment) $191 Total Sources $191
• Potential gross revenue range for acquired business lines of $300 to $325 million
Conservatively • Expected after-tax net income contribution of between $28 and $38 million,
Modeled including full realization of cost savings and net of the cost of financing
• Expenses of $136 million pre-tax, or $81 million after-tax, comprised of retention,
restructuring and duplicative corporate overhead will flow through income
• Return on Economic Investment of 15%—20%, unlevered
Attractive Returns • Return on Equity Investment of 30%—40%
• Approximately 6%—8% accretive to EPS, with full implementation of cost savings
38
|
|
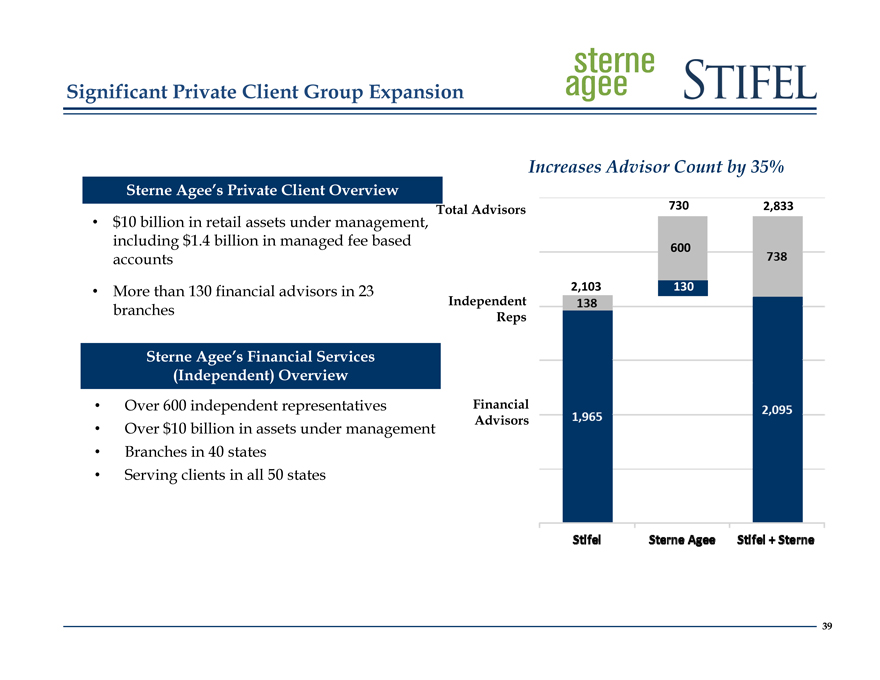
Significant Private Client Group Expansion
Increases Advisor Count by 35%
Sterne Agee’s Private Client Overview
Total Advisors 730 2,833
$10 billion in retail assets under management,
including $1.4 billion in managed fee based 600
accounts
• More than 130 financial advisors in 23 2,103 130
Independent
branches Reps
Sterne Agee’s Financial Services
(Independent) Overview
Over 600 independent representatives Financial
Over $10 billion in assets under management Advisors
Branches in 40 states
Serving clients in all 50 states
39
|
|
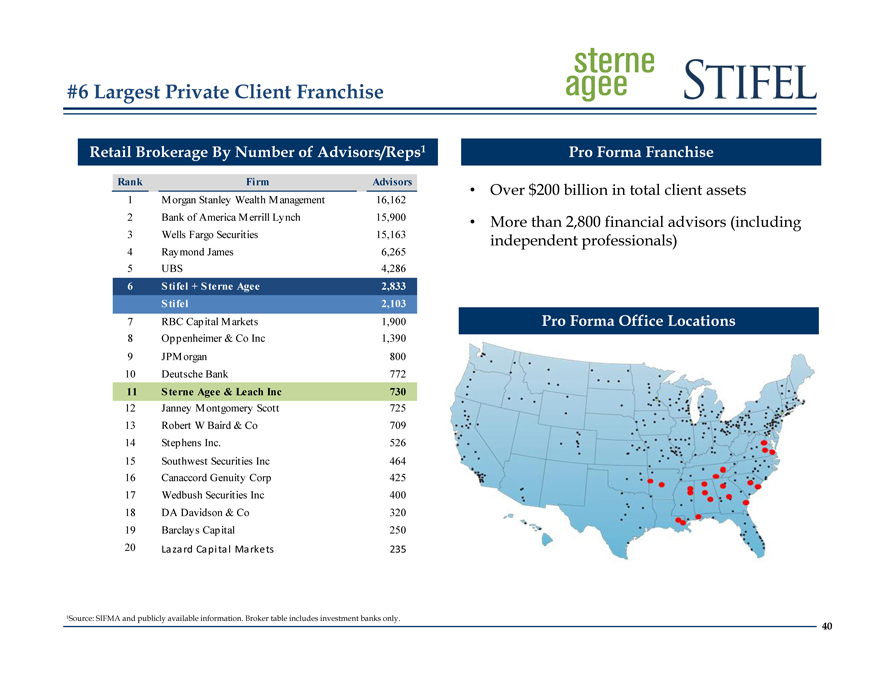
#6 Largest Private Client Franchise
Retail Brokerage By Number of Advisors/Reps1
Rank Firm Advisors
1 Morgan Stanley Wealth Management 16,162
2 Bank of America Merrill Lynch 15,900
3 Wells Fargo Securities 15,163
4 Raymond James 6,265
5 UBS 4,286
6 Stifel + Sterne Agee 2,833
Stifel 2,103
7 RBC Capital Markets 1,900
8 Oppenheimer & Co Inc 1,390
9 JPMorgan 800
10 Deutsche Bank 772
11 Sterne Agee & Leach Inc 730
12 Janney Montgomery Scott 725
13 Robert W Baird & Co 709
14 Stephens Inc. 526
15 Southwest Securities Inc 464
16 Canaccord Genuity Corp 425
17 Wedbush Securities Inc 400
18 DA Davidson & Co 320
19 Barclays Capital 250
20 Lazard Ca pital Markets 235
Pro Forma Franchise
Over $200 billion in total client assets
More than 2,800 financial advisors (including independent professionals)
Pro Forma Office Locations
¹Source: SIFMA and publicly available information. Broker table includes investment banks only.
40
|
|
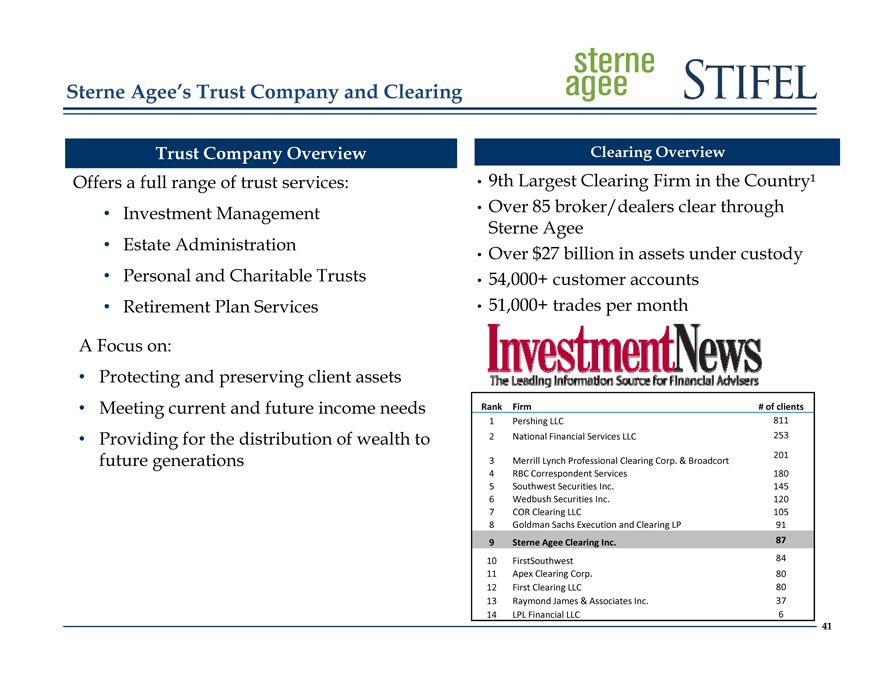
Sterne Agee’s Trust Company and Clearing
Trust Company Overview
Offers a full range of trust services:
Investment Management
Estate Administration
Personal and Charitable Trusts
Retirement Plan Services
A Focus on:
Protecting and preserving client assets
Meeting current and future income needs
Providing for the distribution of wealth to future generations
Clearing Overview
9th Largest Clearing Firm in the Country¹
Over 85 broker/dealers clear through Sterne Agee
Over $27 billion in assets under custody
54,000+ customer accounts
51,000+ trades per month
Rank Firm # of clients
1 Pershing LLC 811
2 National Financial Services LLC 253
201
3 Merrill Lynch Professional Clearing Corp. & Broadcort
4 RBC Correspondent Services 180
5 Southwest Securities Inc. 145
6 Wedbush Securities Inc. 120
7 COR Clearing LLC 105
8 Goldman Sachs Execution and Clearing LP 91
9 Sterne Agee Clearing Inc. 87
10 FirstSouthwest 84
11 Apex Clearing Corp. 80
12 First Clearing LLC 80
13 Raymond James & Associates Inc. 37
14 LPL Financial LLC 6
41
|
|
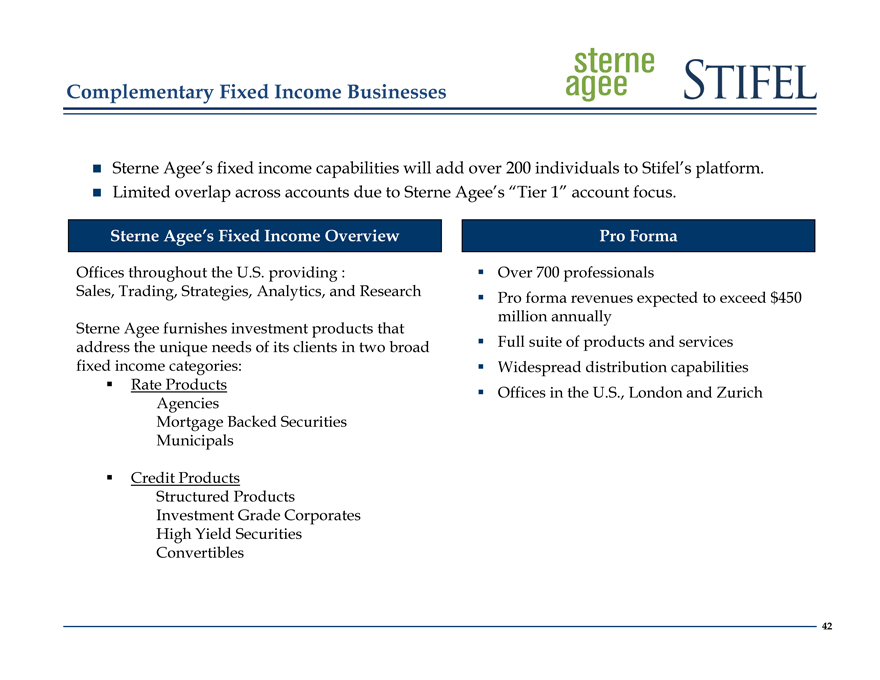
Complementary Fixed Income Businesses
Sterne Agee’s fixed income capabilities will add over 200 individuals to Stifel’s platform.
Limited overlap across accounts due to Sterne Agee’s “Tier 1” account focus.
Sterne Agee’s Fixed Income Overview
Pro Forma
Offices throughout the U.S. providing :
Sales, Trading, Strategies, Analytics, and Research
Sterne Agee furnishes investment products that address the unique needs of its clients in two broad fixed income categories: Rate Products Agencies Mortgage Backed Securities Municipals
Credit Products
Structured Products
Investment Grade Corporates
High Yield Securities
Convertibles
Over 700 professionals
Pro forma revenues expected to exceed $450 million annually
Full suite of products and services
Widespread distribution capabilities
Offices in the U.S., London and Zurich
42
|
|
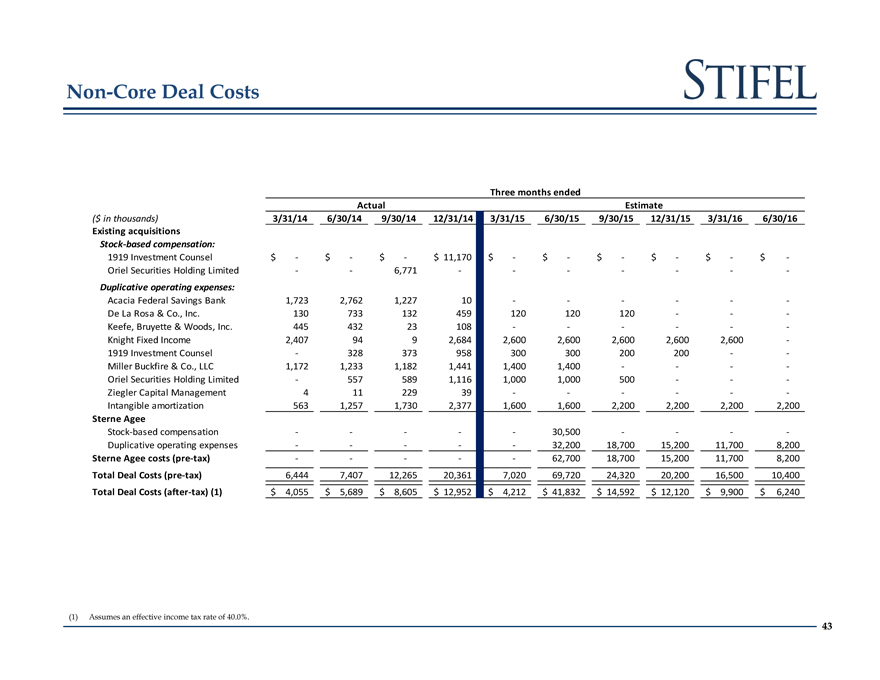
Non-Core Deal Costs
Three months ended
Actual Estimate
($ in thousands) 3/31/14 6/30/14 9/30/14 12/31/14 3/31/15 6/30/15 9/30/15 12/31/15 3/31/16 6/30/16
Existing acquisitions
Stock-based compensation:
1919 Investment Counsel $—$—$—$ 11,170 $—$—$—$—$—$ -
Oriel Securities Holding Limited — 6,771 — — — -
Duplicative operating expenses:
Acacia Federal Savings Bank 1,723 2,762 1,227 10 — — —
De La Rosa & Co., Inc. 130 733 132 459 120 120 120 — -
Keefe, Bruyette & Woods, Inc. 445 432 23 108 — — —
Knight Fixed Income 2,407 94 9 2,684 2,600 2,600 2,600 2,600 2,600 -
1919 Investment Counsel—328 373 958 300 300 200 200 —
Miller Buckfire & Co., LLC 1,172 1,233 1,182 1,441 1,400 1,400 — —
Oriel Securities Holding Limited—557 589 1,116 1,000 1,000 500 — -
Ziegler Capital Management 4 11 229 39 — — —
Intangible amortization 563 1,257 1,730 2,377 1,600 1,600 2,200 2,200 2,200 2,200
Sterne Agee
Stock-based compensation — ——30,500 — —
Duplicative operating expenses — ——32,200 18,700 15,200 11,700 8,200
Sterne Agee costs (pre-tax) — ——62,700 18,700 15,200 11,700 8,200
Total Deal Costs (pre-tax) 6,444 7,407 12,265 20,361 7,020 69,720 24,320 20,200 16,500 10,400
Total Deal Costs (after-tax) (1) $ 4,055 $ 5,689 $ 8,605 $ 12,952 $ 4,212 $ 41,832 $ 14,592 $ 12,120 $ 9,900 $ 6,240
(1) Assumes an effective income tax rate of 40.0%.
43