Attached files
| file | filename |
|---|---|
| EXCEL - IDEA: XBRL DOCUMENT - JUNIPER PHARMACEUTICALS INC | Financial_Report.xls |
| EX-23.1 - EX-23.1 - JUNIPER PHARMACEUTICALS INC | d849346dex231.htm |
| EX-21 - EX-21 - JUNIPER PHARMACEUTICALS INC | d849346dex21.htm |
| EX-31.1 - EX-31.1 - JUNIPER PHARMACEUTICALS INC | d849346dex311.htm |
| EX-32.1 - EX-32.1 - JUNIPER PHARMACEUTICALS INC | d849346dex321.htm |
| EX-31.2 - EX-31.2 - JUNIPER PHARMACEUTICALS INC | d849346dex312.htm |
| EX-32.2 - EX-32.2 - JUNIPER PHARMACEUTICALS INC | d849346dex322.htm |
Table of Contents
UNITED STATES
SECURITIES AND EXCHANGE COMMISSION
Washington, D.C. 20549
FORM 10-K
| x | ANNUAL REPORT PURSUANT TO SECTION 13 OR 15(d) OF THE SECURITIES EXCHANGE ACT OF 1934 |
For the fiscal year ended December 31, 2014
OR
| ¨ | TRANSITION REPORT PURSUANT TO SECTION 13 OR 15(d) OF THE SECURITIES EXCHANGE ACT OF 1934 |
For the transition period from to
Commission File number 1-10352
COLUMBIA LABORATORIES, INC.
(Exact name of registrant as specified in its charter)
| Delaware | 59-2758596 | |
| (State or other jurisdiction of incorporation or organization) |
(I.R.S. Employer Identification No.) | |
| 4 Liberty Square Boston, Massachusetts (Address of principal executive offices)
Registrant’s telephone number, including area code: (617) 639-1500 |
02109 (Zip Code) | |
Securities registered pursuant to Section 12(b) of the Act:
| Common Stock, $.01 par value | NASDAQ Global Market | |
| (Title of each class) | (Name of exchange on which registered) |
Securities registered pursuant to Section 12(g) of the Act: None
Indicate by check mark if the registrant is a well-known seasoned issuer, as defined in Rule 405 of the Securities Act. Yes ¨ No x
Indicate by check mark if the registrant is not required to file reports pursuant to Section 13 or Section 15(d) of the Act. Yes ¨ No x
Indicate by check mark whether the registrant (1) has filed all reports required to be filed by Section 13 or 15(d) of the Securities Exchange Act of 1934 during the preceding 12 months (or for such shorter period that the registrant was required to file such reports), and (2) has been subject to such filing requirements for the past 90 days. Yes x No ¨
Indicate by check mark whether the registrant has submitted electronically and posted on its corporate Web site, if any, every Interactive Data File required to be submitted and posted pursuant to Rule 405 of Regulation S-T (§232.405 of this chapter) during the preceding 12 months (or for such shorter period that the registrant was required to submit and post such files). Yes x No ¨
Indicate by check mark if disclosure of delinquent filers pursuant to Item 405 of Regulation S-K (§229.405 of this chapter) is not contained herein, and will not be contained, to the best of registrant’s knowledge, in definitive proxy or information statements incorporated by reference in Part III of this Form 10-K or any amendment to this Form 10-K. x
Indicate by check mark whether the registrant is a large accelerated filer, an accelerated filer or a non-accelerated filer or a smaller reporting company. See the definitions of “large accelerated filer”, “accelerated filer” and “smaller reporting company” in Rule 12b-2 of the Exchange Act.
| Large accelerated filer | ¨ | Accelerated filer | ¨ | |||
| Non-accelerated filer | x | Smaller reporting company | ¨ | |||
Indicate by check mark whether the registrant is a shell company (as defined in Rule 12b-2 of the Act). Yes ¨ No x
The aggregate market value of Common Stock held by non-affiliates of the registrant on June 30, 2014, the last business day of the registrant’s most recently completed second fiscal quarter, based on the adjusted closing price on that date of $6.85, was $70,324,251.
Number of shares of Common Stock of Columbia Laboratories, Inc. issued and outstanding as of March 3, 2015 is 10,775,101.
Documents Incorporated By Reference
Portions of the Columbia Laboratories, Inc. (“Columbia” or the “Company”) Proxy Statement for the 2015 Annual Meeting of Shareholders (the “Proxy Statement”) are incorporated by reference into Part III of this Form 10-K.
Table of Contents
Index to Annual Report on Form 10-K
Fiscal Year Ended December 31, 2014
2
Table of Contents
Forward-Looking Information
This Annual Report on Form 10-K contains forward-looking statements, that involve risk and uncertainties. Generally, forward-looking statements can be identified by words such as “may,” “will,” “plan,” “believe,” “expect,” “intend,” “anticipate,” “potential,” “should,” “estimate,” “predict,” “project,” “would,” and similar expressions, which are generally not historical in nature. However, the absence of these words or similar expressions does not mean that a statement is not forward-looking. All statements that address operating performance, events or developments that we expect or anticipate will occur in the future – including statements relating to our future operating or financial performance or events, our strategy, goals, plans and projections regarding our financial position, our liquidity and capital resources, and our product development – are forward-looking statements. Management believes that these forward-looking statements are reasonable as and when made. However, caution should be taken not to place undue reliance on any such forward-looking statements because such statements speak only as of the date when made. Our Company undertakes no obligation to publicly update or revise any forward-looking statements, whether as a result of new information, future events or otherwise, except as required by law. In addition, forward-looking statements are subject to certain known and unknown risks, uncertainties and factors that may cause actual results to differ materially from our Company’s historical experience and our present expectations or projections.
Actual results or events could differ materially from the plans, intentions, and expectations disclosed in the forward-looking statements we make. We have included important risk factors in the cautionary statements included in this Annual Report on Form 10-K for the year ended December 31, 2014, particularly in Part 1 – Item 1A and in our other public filings with the Securities and Exchange Commission that could cause actual results or events to differ materially from the forward-looking statements that we make.
You should read this Annual Report and the documents that we have filed as exhibits to the Annual Report completely and with the understanding that our actual future results may be materially different from what we expect. While we may elect to update forward-looking statements at some point in the future, we do not undertake any obligation to update any forward-looking statement, whether written or oral, that may be made from time to time, whether as a result of new information, future events or otherwise.
3
Table of Contents
| Item 1. | Business |
Overview
Columbia Laboratories, Inc., and its subsidiaries (herein referred to as “Columbia”, the “Company”, “we”, “us” or “our”) have historically been in the business of developing, manufacturing, licensing and selling pharmaceutical products that utilize proprietary drug delivery technologies to treat various medical conditions to commercial partners. In September 2013 the Company acquired Nottingham, UK based Molecular Profiles, Ltd. (Molecular Profiles), a pharmaceutical services company. Molecular Profiles provides a range of drug development and consulting services to the pharmaceutical industry and has provided Columbia with an additional revenue source and in-house expertise for internal pharmaceutical programs.
All of the pharmaceutical products we have developed to-date utilize our Bioadhesive Delivery System (“BDS”), which consists of a formulation that contains a polymer, polycarbophil, and other inactive ingredients, along with an active pharmaceutical ingredient. The BDS is based upon the principle of bioadhesion, a process by which the polymer adheres to epithelial surfaces or mucosa. Our vaginally administered products adhere to the vaginal epithelium; the buccal product adheres to the mucosal membrane of the gum and cheek. The polymer remains attached to epithelial surfaces or mucosa and is discharged upon normal cell turnover, a physiological process that, depending upon the area of the body, occurs every 12 to 72 hours, or longer. Both vaginally administered and buccal BDS products provide the sustained and controlled delivery of an active drug ingredient. Its extended period of attachment also makes use of BDS indicated in products where extended duration of effectiveness is desirable or required.
To date we have developed six prescription and “over-the-counter” pharmaceutical products: five BDS vaginal gel products that are indicated for conditions such as vaginal dryness, vaginal pH adjustment, progesterone supplementation as part of fertility treatments, and amenorrhea, and a BDS testosterone buccal product for male hypogonadism. Currently, we receive revenues associated with only one of these products, CRINONE 8% (progesterone gel). We have supplied CRINONE to Merck Serono S.A. (“Merck Serono”), internationally, and sold the rights to CRINONE to Actavis, Inc. (“Actavis”) (formerly Watson Pharmaceuticals, Inc.), in the United States (“U.S.”).
We plan to identify and develop additional pharmaceutical products to address unmet medical needs in women. These products may or may not use our BDS.
Molecular Profile’s pharmaceutical services offering includes product development and manufacturing of clinical trial material. The Company also provides analytical and consulting services, leveraging expertise in the analysis of pharmaceutical drug substance and formulations.
Our focus is on the following strategic objectives:
| • | supplying CRINONE to our marketing partner, Merck Serono, for sale in over 60 countries around the world; |
| • | advancing COL-1077, an investigational extended-release lidocaine vaginal gel, into clinical development; |
| • | growing our Pharmaceutical Services business; and |
| • | identifying product candidates and building a pipeline of pharmaceutical products focused on women’s health. |
Columbia’s revenue is derived from:
| • | Product revenues, which primarily consist of sales of CRINONE to Merck Serono; |
4
Table of Contents
| • | Royalty revenues, which primarily consist of royalty payments by Actavis on sales of CRINONE in the United States; |
| • | Service revenues, which primarily consist of pharmaceutical development, clinical trial manufacturing, and advanced analytical and consulting services provided to the pharmaceutical industry. |
Commercial Product
CRINONE
Progesterone is a hormone manufactured by a woman’s ovaries in the second half of the menstrual cycle and by the placenta during pregnancy. Progesterone is responsible for preparing the uterus for pregnancy and, if pregnancy occurs, maintaining it until birth, or, if pregnancy does not occur, inducing menstruation.
CRINONE 8% (progesterone gel) (“CRINONE”) is a sustained release bioadhesive gel that utilizes the Company’s BDS technology to deliver natural progesterone intra-vaginally. Intra-vaginal delivery of CRINONE provides preferential uptake of progesterone from the vagina to the uterus. This is known as the “First Uterine Pass Effect™” and CRINONE is the first product designed and approved by the U.S. Food and Drug Administration (“FDA”) to deliver progesterone directly to the uterus, providing a therapeutic benefit.
CRINONE was approved in the U.S. in 1997 for progesterone supplementation or replacement as part of an Assisted Reproductive Technology (“ART”) treatment for infertile women with progesterone deficiency.
Outside the U.S., CRINONE has been approved for marketing for one or more medical indications in over 60 countries. The medical indications include: progesterone supplementation or replacement as part of an ART treatment for infertile women; the treatment of secondary amenorrhea; the prevention of hyperplasia in post-menopausal women receiving hormone replacement therapy (“HRT”); the reduction of symptoms of premenstrual syndrome (“PMS”); menstrual irregularities; dysmenorrhea; and dysfunctional uterine bleeding.
The most common side effects of CRINONE are breast enlargement, constipation, somnolence, nausea, headache, and perineal pain. CRINONE is contraindicated in the U.S. in patients with active thrombophlebitis or thromboembolic disorders, or a history of hormone-associated thrombophlebitis or thromboembolic disorders, missed abortion, undiagnosed vaginal bleeding, liver dysfunction or disease, and known or suspected malignancy of the breast or genital organs.
CRINONE is sold outside the U.S. by Merck Serono pursuant to a supply agreement with the Company.
Within the U.S., CRINONE is marketed by Actavis pursuant to a Purchase and Collaboration Agreement, dated March 2010. Pursuant to the terms of this agreement Actavis purchased certain of our assets and we agreed to collaborate with Actavis with respect to the development of certain progesterone gel products. In July 2010, and in connection with this agreement, we entered into a License Agreement with Actavis, which provided Actavis exclusive rights to develop, manufacture and offer to sell and commercialize these progesterone gel products in the U.S. We also entered into a Supply Agreement with Actavis, dated July 2010, which made us the exclusive supplier to Actavis for CRINONE. In November 2013, Columbia and Actavis terminated the Supply Agreement. The Purchase and Collaboration Agreement remains in effect through July 2, 2020.
In April 2011, we filed a New Drug Application (“NDA”), NDA 22-139, to expand the labeled uses of progesterone vaginal gel 8% to include its use in the reduction of risk of preterm birth in women with a singleton gestation and a short uterine cervical length in the mid-trimester of pregnancy. NDA 22-139 was reviewed by the FDA’s Advisory Committee for Reproductive Health Drugs in January 2012. While Committee members generally agreed that progesterone vaginal gel 8% is safe, the Committee stated that more information is needed to support approval. On February 10, 2012, we transferred NDA 22-139 to Actavis pursuant to the second closing
5
Table of Contents
of our sale of assets to Actavis under the Purchase and Collaboration Agreement. On February 24, 2012, Actavis received a Complete Response Letter (“CRL”) from the FDA indicating that the review cycle for NDA 22-139 was complete but the application was not ready for approval in its present form. The CRL stated that the effect of treatment with progesterone vaginal gel 8% in reducing the risk of preterm birth in women with a short uterine cervical length at £ 32 6/7 weeks gestation (p=0.022) did not meet the level of statistical significance generally expected to support the approval of the product in the U.S. market from a single trial. In the CRL, the FDA stated that additional clinical work would be required to support the approval. Actavis held an “End-of-Review” meeting with the FDA to discuss the issues outlined in the CRL. Actavis continued discussions with the FDA to determine a viable pathway forward and in August 2012 filed a Formal Dispute Resolution Request (“FDRR”) related to this application. The FDA denied Actavis’s FDRR in October 2012. We have discontinued further development of this program.
Advanced Formula Legatrin PM
In May 2000, we licensed Advanced Formula Legatrin PM®, a product designed for the relief of occasional pain and sleeplessness associated with minor muscle aches, to Lil’ Drug Store, which paid the Company a royalty of 20% of the net sales of the product. In July 2014, Lil’ Drug Store exercised its option to purchase the intellectual property rights and technology related to Legatrin PM®, pursuant to the terms of the license agreement. We ceased receiving recurring royalties from Legatrin after the August option exercise.
Pharmaceutical Services
Molecular Profiles provides a range of services to the pharmaceutical industry and our customers range from start-up biotechnology firms to global pharmaceutical companies. Within our services offering, we provide our customers expertise on the characterization, development and manufacturing of small molecule compounds. Our services model allows us to take our customers drug candidates from early development through to Phase II clinical trials manufacturing. We also support our customers with advanced analytical and consulting services for intellectual property issues and we have particular expertise in problem solving for challenging compounds that are considered “difficult to progress”.
Pharmaceutical Development Services (PDS)
Our PDS business provides customers with a range of drug development services including pre-formulation, formulation development, product characterization and clinical trial manufacturing. Our science-based approach considers the physiochemical properties of the drug substance, the end-use need, and the destination of delivery to provide customers with a pharmaceutical formulation that meets their specifications. In addition to conventional development services, we offer more novel approaches such as particle size reduction, solid solutions/dispersions, self emulsifying systems and spray dried drug-polymer matrices, which allows us to develop a diverse range of dosage forms for customer compounds.
The Company holds a U.K. manufacturer’s authorization for an investigational medicinal products (“IMP”) license for the manufacture, testing and certification of products for use in human clinical trials. We can manufacture, test and certify IMPs for use in Phase I and Phase II clinical trials for our customers.
During 2014 we have added enabling technologies to our pharmaceutical services offering that facilitate processing of “difficult-to-progress” molecules and expanded our business development activities.
| • | In April 2014, we completed the purchase of hot melt extrusion (HME) technology along with further milling equipment, enabling us to accelerate formulation development for our clients. |
6
Table of Contents
| • | In October 2014, we unveiled the ROADMAP to Clinical Trial platform, which provides our clients a streamlined pathway to the clinic. This new enabling technology screening platform aims to support companies with the rapid development of both standard and complex drug products. |
| • | We have initiated business development activities in the United States to access that large market of pharmaceutical customers. |
Analytical and Consulting Services
We believe we have an established reputation for resolving some of the toughest issues in pharmaceutical development through our expertise in the analysis of pharmaceutical drug substance and formulations. We utilize a wide range of physical, chemical and surface analytical equipment to provide detailed insights to progress development, scale-up, resolve manufacturing issues and provide technical review for patent related issues. Our analytical know-how and pharmaceutical experience has been utilized to provide independent consultancy for intellectual property issues, due diligence and has provided technical consultancy for global litigation matters. We are called upon to provide technical opinion, testing and testimony regarding, chemical, formulation, process and device patents.
Collaboration Agreements
Our primary revenue product is CRINONE. We have licensed CRINONE to Merck Serono, outside the U.S., and have sold the rights to CRINONE to Actavis, in the United States.
Merck Serono S.A.
During 2012 and 2013, we manufactured and sold CRINONE to Merck Serono at a price determined on a country-by-country basis that is the greater of (i) thirty percent (30%) of the net selling price in such country, or (ii) our direct manufacturing cost plus 20%. Certain quantity discounts were applied to annual purchases over 10 million, 20 million, and 30 million units.
In April 2013, our license and supply agreement with Merck Serono for the sale of CRINONE outside the U.S. was renewed for an additional five year term, extending the expiration date from to May 19, 2020.
Under the terms of the amended license and supply agreement, we will sell CRINONE to Merck Serono on a country-by-country basis at the greater of (i) direct manufacturing cost plus 20% or (ii) a percentage of Merck Serono’s net selling price. From 2014 through 2020, the percentage of net selling price will be determined based on a tiered structure, which is based on volume sold. As sales volumes increase our percentage share of each incremental tier decreases. Additionally, the parties are cooperating to evaluate and implement manufacturing cost reduction measures, with both parties sharing any reductions realized from these initiatives. If, at the end of the supply term, the parties cannot agree upon mutually acceptable terms for renewal of the supply arrangement, Merck Serono may elect to retain a license to the product and will have an irrevocable fully paid up license to the product.
We are the exclusive supplier of CRINONE to Merck Serono. Merck Serono holds marketing authorizations for CRINONE in over 60 countries outside the United States. Until September 2014, we held patents on the delivery system for CRINONE in key markets including Australia, Canada, Germany, Hungary, Italy and Russia. In other large markets including Brazil, China, India, South Korea, Taiwan, Thailand, Turkey and Vietnam there were no patents.
The amended license and supply agreement requires Merck Serono to provide a rolling 18-month forecast of its CRINONE requirements for each country in which the product is marketed. The first four months of each forecast are considered firm orders. Under the agreement, each party is responsible for new clinical trials and government registrations in its territory and the parties are obligated to consult from time to time regarding the studies. Each party has agreed to promptly provide the other party the data from its CRINONE studies free-of-charge. During the term of the agreement, Columbia has agreed not to develop, license, manufacture or sell to
7
Table of Contents
another party outside the United States any product for the vaginal delivery of progesterone or progestational agents for hormone replacement therapy or other indications where progesterone or progestational agents are commonly used.
Actavis, Inc. (formerly Watson Pharmaceuticals, Inc.)
From July 2010 to November 2013 we manufactured and sold products to Actavis at direct manufacturing cost plus 10%; the revenues generated from these sales were recorded as product revenues from a related party. We co-developed progesterone gel with Actavis for pre-term birth, which Actavis was to market. In advance of our filing of an NDA for FDA approval of 8% progesterone gel for use in the prevention of preterm birth in women with premature cervical shortening in 2012 and during the NDA review period, Actavis built up inventory of sufficient quantities for a planned commercial launch. After the FDA’s denial of both our application and Actavis’ subsequent appeal, Actavis decided not to continue development of the proposed indication. Since Actavis had sufficient inventories of CRINONE, there were no orders in 2013. In November 2013, we entered into an early termination of the exclusive supply agreement with Actavis. The early termination of the agreement, which would have otherwise terminated in May 2015, provided for a one-time payment by Actavis, as a termination fee, in addition to payment for all raw materials purchased by Columbia to meet forecast requirements. Pursuant to the Purchase and Collaboration Agreement, Columbia will continue to be eligible to receive royalties until July 2, 2020 equal to a minimum of 10% of annual net sales of CRINONE by Actavis for annual net sales up to $150 million, 15% for sales above $150 million but less than $250 million, and 20% for annual net sales of $250 million and over.
Segments
We currently operate in two segments; product and service. Our product segment includes supply chain management for CRINONE, our sole commercialized product. In certain foreign countries, these products may be classified as medical devices or cosmetics by those countries’ regulatory agencies. See Note 12 to the consolidated financial statements for information on our foreign operations. Our service segment includes pharmaceutical development, clinical trial manufacturing, and advanced analytical and consulting services for our customers as well as characterizing and developing pharmaceutical product candidates for our internal programs.
In September 2013, we acquired Molecular Profiles, a U.K.-based provider of pharmaceutical development, clinical trial manufacturing, and advanced analytical and consulting services to the pharmaceutical industry. We view the development and clinical trial manufacturing of drug product for our pharmaceutical company clients and the manufacturing of CRINONE for our commercial partner to be similar activities. Accordingly, we have integrated all operational activities for the CRINONE business into Molecular Profiles. These activities, including management of CRINONE manufacturing, quality assurance and logistics and, management of our intellectual property estate are now managed out of our Nottingham, U.K. facility.
Segment information is consistent with the financial information regularly reviewed by our chief operating decision maker, who we have determined to be the chief executive officer, for purposes of evaluating performance, allocating resources, setting incentive compensation targets, and planning and forecasting future periods. Our chief operating decision maker evaluates the performance of our product and service segments based on gross profit. Our chief operating decision maker does not review our assets, operating expenses or non-operating income and expenses by business segment at this time.
Operations
Our primary operating facility is the Molecular Profiles site in Nottingham, United Kingdom. At this location we perform all of our pharmaceutical development, clinical trial manufacturing advanced analytical and consulting services. This facility supports both our internal drug development program in addition to supporting external customer programs.
8
Table of Contents
During 2014, all logistics and quality operations associated with the manufacturing of CRINONE vaginal gel products were integrated into the operations at our Nottingham site. We contract the production of CRINONE to three third-party manufacturers. CRINONE is manufactured in bulk by Fleet Laboratories Limited, in Watford, Hertfordshire, U.K. (“Fleet”), filled into overwrapped single-use disposable applicators by Maropack AG, in Zell, Switzerland (“Maropack”) and packaged in commercial cartons by Central Pharma, in Bedford, U.K. (“Central”), pursuant to standard purchase orders. We take the financial risk of producing CRINONE throughout the supply chain until Merck Serono takes ownership of the product just prior to shipment.
Fleet. In December 2009, our wholly-owned subsidiary Columbia Laboratories (Bermuda) Ltd., entered into a supply agreement with Fleet, the long-standing manufacturer of our progesterone vaginal gel. Pursuant to the supply agreement, using a dedicated suite and dedicated equipment that we have purchased, Fleet exclusively manufactures and supplies to us, and we exclusively purchase from Fleet, our requirements of bulk progesterone gel. Pursuant to the agreement, the price may be adjusted annually to take into account any documented decrease or increase in the cost of raw materials or any other decrease or increase in the cost of manufacturing. The term of the agreement extends to December 2020, with automatic renewals for additional periods of two years unless either party gives to the other party, not less than six months prior to expiration of the agreement, written notice of its intention not to extend the agreement; provided, however, that upon termination of the agreement, Fleet agrees to perform its obligations under the agreement until the earlier of one year and Columbia’s engagement and qualification of an alternative manufacturer. Payments under the agreement are made in British Pounds sterling.
Maropack. In October 1993, Columbia Laboratories (Bermuda) Ltd. entered into an agreement with Maropack to fill our bulk progesterone gel into overwrapped single-use disposable applicators. We have purchased and own certain equipment that is dedicated to Columbia products. The current term of the agreement is one year with automatic one year renewals. Either party may terminate the agreement on six months prior written notice before the end of any renewal term. Prices are renegotiated annually based on forecast production volumes. Payments under the agreement are made in Swiss francs.
Central. In July 2006, Columbia Laboratories (Bermuda) Ltd., entered into a Technical Agreement with Central to provide final packaging and distribution services. We have purchased our own equipment that is unique to and dedicated to Columbia products. The agreement is renewable every two years at our determination. Payments under the agreement are made in British Pounds sterling.
Aspen Oss B.V. is the only supplier of progesterone approved by the regulatory agencies worldwide excluding the U.S. in marketing licenses for CRINONE.
Lubrizol, Inc. (“Lubrizol”) is the only supplier of medical grade, cross-linked polycarbophil, the polymer used in our BDS-based products. We do not have a long-term supply agreement with Lubrizol.
Any initiative to qualify additional or alternate suppliers would require agreement with, and filing of regulatory amendments by Merck Serono, in several countries.
We regularly evaluate the performance of our third-party manufacturers with the objective of confirming their continuing capabilities to meet our needs efficiently and economically. We have established a quality assurance program intended to ensure our third-party manufacturers and service providers produce materials and provide services, when applicable, in accordance with the FDA’s current Good Manufacturing Practices, or cGMP, and other applicable regulations. Manufacturing facilities, both foreign and domestic, are subject to inspections by regulatory authorities. A failure by any of our third-party manufacturers to pass an inspection could adversely affect our ability to continue to supply product to Merck Serono and thus negatively impact our revenues.
Research and Development
In 2014, we merged our research and product development activities expertise with Molecular Profiles. In combining clinical program development capabilities with the Nottingham team’s skills in formulation
9
Table of Contents
development and clinical trial supply manufacturing, we believe we are in a position to drive new development efforts. We spent $0.7 million in 2014 on research and development activities, which primarily related to costs associated with our extended release lidocaine vaginal gel platform.
BDS Technology. Through the BDS Technology process a novel bioadhesive gel is created that allows sustained delivery of pharmaceuticals to mucosal surfaces. This bioadhesive gel formulation is a unique delivery system that adheres to mucosal surfaces in a manner similar to mucin, the main component found in mucus that lines epithelial surfaces of the body. The key BDS ingredient is polycarbophil, which is a non-immunogenic, hypoallergenic, bioadhesive polymer. When combined with a specific drug, the bioadhesive gel suspension facilitates the binding of the drug to mucosal surfaces allowing for drug release in a controlled and sustained manner. An advantage of this delivery system may be higher localized concentrations of drug reaching targeted tissues such as the vaginal mucosa and endometrium of the uterus. This targeted drug delivery system is designed to maximize the therapeutic effect while minimizing the potential for systemic side effects.
COL-1077 Vaginally Administered Lidocaine in BDS Gel. In 2014, we completed our commercial and intellectual property assessment of COL-1077, a sustained release lidocaine gel for vaginal administration, intended as an acute-use anesthetic for minimally-invasive gynecologic procedures. Approximately five million such gynecological procedures are performed in the U.S. every year, representing a significant medical need for a safe and effective localized anesthetic treatment for patients. A Phase II clinical trial is on track to commence in the second quarter of 2015 after having received United States Food and Drug Administration (“FDA”) feedback for the Pre-Investigational New Drug (“IND”) written response. This trial will be a multicenter, randomized, double-blind, placebo-controlled study of the efficacy and safety of 10% dosing strength of COL-1077 in women undergoing transvaginal pipelle-directed endometrial biopsy. Clinical trial supplies for the Phase II trial will be produced at the Company’s Nottingham facility. The FDA feedback provided guidance on the proposed clinical plan, manufacturing approach, and clinical study design and Columbia will submit its IND application in March 2015.
Product Development using proprietary BDS Gel. In 2014, our marketing research expenditures focused on exploring additional clinical indications that could be pursued utilizing the bioadhesive gel formulation, which would leverage the sustained release technology in an unmet medical need population, and follow a 505 (b)(2) U.S. registry pathway.
Once a product candidate is identified for development, the Company takes steps to initiate nonclinical studies and clinical studies. Generally the first steps in a New Drug Application (“NDA”) includes the product candidate entering the nonclinical testing stage. Nonclinical tests include laboratory evaluations of product chemistry, toxicity and formulation, as well as animal pharmacology and toxicology studies. An IND sponsor must submit the results of the nonclinical tests, together with manufacturing information and analytical data, to the FDA as part of the IND. The IND describes how, where, and by whom the studies will be conducted; information about the safety of the active drug ingredient; how it is thought to work in the body; any toxic effects it may have; and how it is manufactured. Nonclinical testing typically continues even after the IND is submitted. In addition to including the results of the nonclinical studies, the IND also will include a protocol detailing, among other things, the objectives of the initial clinical trial and the parameters to be used in monitoring safety as well as the study endpoints. The IND automatically becomes effective 30 days after receipt by the FDA unless the FDA requests changes or further information.
Section 505(b)(2) of the Federal Food, Drug and Cosmetic Act was established by the Hatch-Waxman Amendments of 1984 to allow sponsors to obtain approval of NDAs containing investigations of safety and effectiveness that were not conducted by or for the applicant, but for which the FDA has issued an approval. A 505(b)(2) section was added to Federal Food, Drug and Cosmetic Act to allow sponsors to avoid unnecessary duplication of studies already performed on the reference drug. We will be taking this regulatory pathway approach for the vaginally administered COL-1077 bioadhesive gel clinical program.
Clinical studies are divided into three phases. Phase I studies typically involve small numbers of normal, healthy volunteers. Phase I studies are intended to assess a drug’s safety profile, including the safe dosage range.
10
Table of Contents
Phase I studies also determine how the drug is absorbed, distributed, metabolized, and excreted, as well as the duration of its action. Columbia has historically developed products using already approved active ingredients and incorporated them in our BDS technology. This has meant that certain Phase I studies have not always been required for our product candidates. Phase II studies involve volunteer patients (people with the disease intended to be treated) to assess the drug’s effectiveness and to further evaluate its safety. Phase III studies usually involve larger numbers of patients in clinics and hospitals to confirm the product’s efficacy and identify possible side effects. Phase III studies are the “pivotal” studies that regulatory agencies require to show both safety and efficacy on a statistically representative population of patients intended to be treated. Progress reports on clinical studies must be submitted at least annually to the FDA and the Institutional Review Board (“IRB”).
Following the completion of all three phases of clinical trials, we and our development partner, if any, analyze all of the data and if the data successfully demonstrates both safety and effectiveness, file a NDA with the FDA for the U.S., or the appropriate regulatory authority for a targeted international market. The NDA contains all of the scientific information that the Company has gathered on the potential new medication or treatment. If the regulatory authority approves the NDA, the new product becomes available for physicians to prescribe. The Company or its licensee must continue to submit periodic reports to the applicable regulatory authority, disclosing any cases of adverse reactions and providing appropriate quality-control records. The development, clinical testing and filing of an application can cost millions of dollars.
Section 505 of the Act describes three types of new drug applications: (1) an application that contains full reports of investigations of safety and effectiveness (section 505(b)(1)); (2) an application that contains full reports of investigations of safety and effectiveness but where at least some of the information required for approval comes from studies not conducted by or for the applicant and for which the applicant has not obtained a right of reference (section 505(b)(2)); and (3) an application that contains information to show that the proposed product is identical in active ingredient, dosage form, strength, route of administration, labeling, quality, performance characteristics, and intended use, among other things, to a previously approved product (section 505(j)).
Patents, Trademarks and Proprietary Information
We actively seek protection for our products and technology by means of U.S. and foreign patents, trademarks, and copyrights, as appropriate. The following table sets forth U.S. patents granted to the Company since 2002.
| Year Granted |
Nature of Patent | |
| 2014 | Bioadhesive progressive hydration tablets | |
| 2013 | Extended, controlled-release pharmaceutical compositions using charged polymers. | |
| 2011 | Progesterone for the treatment or prevention of spontaneous preterm birth.1 | |
| 2010 | Low concentration of peroxide for treating or preventing vaginal infections. | |
| 2006 | Bioadhesive progressive hydration tablets using desmopressin or prostaglandin E2 as the active ingredient. | |
| 2004 | Compositions and methods for safely preventing or treating premature labor using a beta-adrenergic agonist, such as terbutaline. | |
| 2004 | Methods of safely treating endometriosis or infertility, and for improving fertility, using a beta-adrenergic agonist. | |
| 2003 | Bioadhesive progressive hydration tablet. | |
| 2002 | Use of certain polycarboxylic acid polymers for vaginal pH buffering to prevent miscarriage and premature labor associated with bacterial vaginosis. | |
| 1 | Progesterone-specific patents were transferred to Actavis in connection with the first closing of the Actavis transaction in July 2010. Columbia receives royalties from Actavis on quarterly net sales of the progesterone-based products covered by these patents. |
11
Table of Contents
We continue to maintain and expand our patent families globally. We believe our patents are important to our business and we intend to continue to protect them, including through legal action, when appropriate. While patent applications do not ensure the ultimate issuance of a patent, and having patent protection cannot ensure that competitors will not emerge, this is a fundamental step in protecting the Company’s technologies.
The following table sets forth the expiration dates of the principal U.S. patents for the marketed BDS products and current development projects.
| Subject of Patent |
Year of Expiration | Product or Project | ||
| Progesterone to prevent or treat preterm birth1 |
2028 | PROCHIEVE 8%/ progesterone vaginal gel 8% | ||
| Progressive hydration tablets |
2019 | STRIANT | ||
| Extended controlled release pharmaceutical compositions using charged polymers |
2024 | COL-1077 | ||
| First Uterine Pass Effect™ |
2018 | COL-1077 |
| 1 | Progesterone-specific patents were transferred to Actavis in conjunction with the first closing of the Actavis transaction in July 2010. Columbia receives royalties from Actavis on quarterly net sales of the progesterone-based products covered by these patents. |
Our fully-paid licensee markets STRIANT (testosterone buccal system) in the U.S. We hold patents that expire in August 2019 on the product formulation of STRIANT around the world, including the U.S., Canada and the United Kingdom.
Merck Serono holds marketing authorizations for CRINONE in over 60 countries outside the United States. All of our patents on the delivery system for CRINONE outside the United States, including in key markets like Australia, Canada, Italy, Ireland, Russia, and the United Kingdom expired in September 2014. We do not hold patents in other large markets including Brazil, China, India, South Korea, Taiwan, Thailand, Turkey, and Vietnam. Given the clinical and regulatory hurdles a potential generic competitor to CRINONE would likely face, we do not expect the lack of patent protection to have a significant impact on our product revenues.
Actavis owns registrations for the “CRINONE” and “PROCHIEVE” trademarks in the U.S. Merck Serono owns registrations for the CRINONE trademark throughout the rest of the world. Our licensees own registrations for “STRIANT” and “STRIANT SR” as trademarks in some countries throughout the world, including the U.S. and Canada. There can be no assurance that such trademarks will afford adequate protection or that licensees will have the financial resources to enforce their rights under such trademarks.
The Company also relies on confidentiality and nondisclosure agreements to protect its intellectual property. There can be no assurance that other companies will not acquire information that the Company considers to be proprietary. Moreover, there can be no assurance that other companies will not independently develop know-how comparable, or superior, to that of the Company.
Success of Marketing Efforts
CRINONE
We rely on commercial pharmaceutical partners to successfully market the pharmaceutical product we manufacture. Their success and ours is dependent on market acceptance of our products by physicians, healthcare payors, patients, and the wider medical community. Medical doctors’ willingness to prescribe our products, the willingness of payors to make payments for our products and the general acceptance by patients and the wider medical community depends on many factors, including:
| • | Perceived efficacy of our products; |
| • | Convenience and ease of administration; |
12
Table of Contents
| • | Prevalence and severity of adverse side effects in both clinical trials and commercial use; |
| • | Availability of alternative treatments; |
| • | Cost effectiveness; and |
| • | The pricing, reimbursement and third-party coverage of our products. |
Service
We market and sell our pharmaceutical development, consulting and analytical services through direct business development efforts and through partners to emerging, regional and multi-national pharmaceutical companies that are seeking to develop new pharmaceutical products.
We target potential customers through client visits and trade shows in addition to direct business development contacts. We actively maintain a public relations program to promote coverage of our products and services on popular social media outlets. In addition, our services are featured in several publications around the world and we have twice been awarded the Queen’s Award for Enterprise in Innovation (U.K.).
Factors that could affect the success of our marketing efforts as well as those of our partners for our services include:
| • | The effectiveness of our analytical and pharmaceutical development services; |
| • | The successful marketing of our services by our sales force; |
| • | Our reputation in the marketplace; and |
| • | The success of competing products and services. |
| • | The investment we make in our own product development. |
Competition
We and our marketing partners compete against established pharmaceutical companies who market products and services addressing the same markets and patient needs. Further, numerous companies are developing, or may develop, enhanced delivery systems, products and services that compete with our present and proposed products and services. It is possible that we may not have the resources to withstand these and other competitive forces. Some of these competitors possess greater financial, research and technical resources than we or our partners. Moreover, these companies may possess greater marketing capabilities than we or our partners, including the resources to implement extensive advertising campaigns.
The pharmaceutical industry is subject to change as new delivery technologies are developed, new products enter the market, regulatory requirements change, generic versions of available drugs become available and treatment paradigms evolve to reflect these and other medical research discoveries. We face significant competition in all areas of our business. The rapid pace of change in the pharmaceutical industry continually creates new opportunities for competitors and start-ups and can quickly render existing products, technologies and services less valuable. Customer requirements and physician and patient preferences continually change as new treatment options emerge, are more or less heavily promoted, and become less expensive. As a result, our partners may not gain, and may lose, market share.
CRINONE
CRINONE, a natural progesterone product, competes in markets with other progestins, both synthetic and natural, that may be delivered by pharmacy-compounded injections or vaginal suppositories, including Prometrium® (oral micronized progesterone) marketed by Abbott Laboratories, and Endometrin® (progesterone
13
Table of Contents
vaginal insert) marketed by Ferring Pharmaceuticals, Inc. CRINONE and Endometrin are the only progestin products approved by the FDA for use in infertility.
Service
There are a range of large and smaller scale competitors who compete with our Molecular Profiles services business providing similar services. Some of these competitors have greater financial and human resources than we do and have established reputations, as well as worldwide distribution channels and sales and marketing capabilities that are larger and more established than ours.
Additional competitors may enter the market, and we are likely to compete with new companies in the future. Our service offerings also compete against companies performing services such as:
| • | Pharmaceutical development services – Focused on the early phases of development of small molecule compounds, including, “challenging” compounds that are considered difficult to formulate. |
| • | Clinical trial manufacturing services – Customized manufacturing and packaging for primarily phase I and II clinical trials. Including the manufacturing of tablets, capsules, topicals, dry powder inhaled products (“DPI’s”) and liquids for clinical trials. |
| • | Advanced analytical and consulting services – Detailed analytical characterization to support pharmaceutical development, troubleshooting process or manufacturing issues, materials characterization, independent consultancy for intellectual property issues, due diligence and for global litigation matters. This includes providing technical opinion, testing and testimony regarding, chemical, formulation, process and device patents. |
Competition among organizations providing pharmaceutical development and analytical services is characterized by technical expertise and reputation, breadth of technical services, budget considerations and the ability to timely deliver the customer’s requirements. Accordingly, our success depends in part on establishing, maintaining and expanding a client base, offering new innovative services and maintaining regulatory and quality compliance of our Nottingham facility. To compete effectively, we must demonstrate that our products and services are attractive alternatives to others by differentiating our services on the basis of technical expertise, performance, reputation, quality of customer support and price. Breadth of service offerings is also important. We believe that we perform favorably with respect to each of these factors. However, we have encountered and expect to continue to encounter potential customers who choose the services offered by our competitors. Potential customers also may decide not to purchase our services, or to delay such purchases, due to technical, clinical, regulatory or financial considerations beyond our control. In addition, we expect that competitive pressures may result in price competition, which could affect our profitability from time to time.
Customers
CRINONE
We have a long-term product supply agreement with Merck Serono, which places firm purchase for CRINONE orders four months in advance of the expected shipping date.
Service
Our pharmaceutical development, consulting and analytical services are offered to customers that range from emerging to regional and multi-national pharmaceutical companies of various sizes. These customers are typically in an innovative phase of drug development and are looking for assistance to formulate a drug product, manufacture supplies for clinical trial or to find answers to why a pharmaceutical drug or molecule behaves in a particular manner or demonstrates certain characteristics. These tend to be discrete contracts that are short-term in duration, and we must continue to compete on performance and price to win new and repeat business. Many of
14
Table of Contents
our customers are developing novel therapeutic products and may discontinue development at any time due to technical, clinical, regulatory or financial considerations beyond our control.
Revenues
Revenues by Source
The following table sets forth the percentage of the Company’s consolidated revenues, including product revenues, royalty and license revenue, and service revenue attributable to each revenue source accounting for 10% or more of consolidated revenues in any of the three years ended December 31:
| 2014 | 2013 | 2012 | ||||||||||
| Product revenues |
54 | % | 73 | % | 86 | % | ||||||
| Royalties, milestone and license fees |
19 | 13 | 13 | |||||||||
| Services revenues |
27 | 13 | — | |||||||||
| Other |
— | 1 | 1 | |||||||||
|
|
|
|
|
|
|
|||||||
| Total |
100 | % | 100 | % | 100 | % | ||||||
|
|
|
|
|
|
|
|||||||
Revenues by Customer
The following table sets forth the percentage of the Company’s consolidated revenues, including product sales, royalty and license revenue, and service revenue attributable to each customer accounting for 10% or more of consolidated revenues in any of the three years ended December 31:
| 2014 | 2013 | 2012 | ||||||||||
| Merck Serono |
53 | % | 73 | % | 67 | % | ||||||
| Actavis |
13 | % | 13 | % | 31 | % | ||||||
| All others |
34 | % | 14 | % | 2 | % | ||||||
|
|
|
|
|
|
|
|||||||
| Total |
100 | % | 100 | % | 100 | % | ||||||
|
|
|
|
|
|
|
|||||||
The revenues from Actavis above include royalties on sales by Actavis and product sales in 2012 only.
Revenues by Geographic Area
The following table sets forth the Company’s consolidated revenues, based on sales by geographic area, for each area accounting for 10% or more of consolidated revenues in any of the three years ended December 31:
| (in millions) | 2014 | 2013 | 2012 | |||||||||
| Switzerland |
$ | 17.9 | $ | 21.7 | $ | 17.2 | ||||||
| Other |
4.2 | 2.0 | — | |||||||||
| Subtotal International |
22.1 | 23.7 | 17.2 | |||||||||
|
|
|
|
|
|
|
|||||||
| United States |
10.4 | 5.5 | 8.6 | |||||||||
| Total |
$ | 32.5 | $ | 29.2 | $ | 25.8 | ||||||
|
|
|
|
|
|
|
|||||||
Long-lived Assets
For information concerning our long-lived assets by geographic area, see Note 12 of our 2014 consolidated financial statements, which information is incorporated herein by reference.
15
Table of Contents
Employees
As of March 3, 2015, the Company had 85 employees, including four executive officers, 10 employees in supply chain management and quality, 4 employees in sales and marketing functions, 51 employees in technical and other production functions, 2 employees in research and development functions and 14 employees in other administrative functions. We also use consultants as necessary to support key functions. Our success is highly dependent on our ability to attract and retain qualified employees. Competition for employees is intense in the pharmaceutical industry. We believe we have been successful in our efforts to recruit qualified employees, but we cannot guarantee that we will continue to be as successful in the future. None of the Company’s employees are represented by a labor union or are subject to collective bargaining agreements. We believe that our relationship with our employees is good.
Available Information
The Company’s Internet address is www.columbialabs.com. Through a link on the “Investor” section of this website, we make available, free of charge, our annual report on Form 10-K, quarterly reports on Form 10-Q, proxy filings on Form Def-14 A, current reports on Form 8-K, and any amendments to those reports, as soon as reasonably practicable after we electronically file such material or furnish it to the SEC. In addition, we will provide electronic or paper copies of our filings free of charge upon request. Information contained on our corporate website or any other website is not incorporated into this Annual Report and does not constitute a part of this Annual Report.
In addition, the public may read and copy any materials filed by the Company with the SEC at the SEC’s Reference Room, which is located at 100 F Street NE, Washington, D.C., 20549. Interested parties may call (800) SEC-0330 for further information on the Reference Room. The SEC also maintains a website containing reports, proxy materials and information statements, among other information, at http://www.sec.gov.
Corporate Information
Columbia was incorporated as a Delaware corporation in 1986. Our principal executive offices are located at 4 Liberty Square, Boston Massachusetts 02109, and our telephone number is (617) 639-1500. The Company’s wholly-owned subsidiaries are Columbia Laboratories (Bermuda) Ltd. (“Columbia Bermuda”), Columbia Laboratories (France) SA (“Columbia France”), Columbia Laboratories (U.K.) Limited (“Columbia U.K.”), and Molecular Profiles (U.K.).
16
Table of Contents
| Item 1A. | Risk Factors |
We may fail to obtain new contracts, renew existing contracts and/or have contract cancellations with customers of our wholly-owned subsidiary, Molecular Profiles, which may adversely affect our business.
The majority of our customer contracts in the services business are short-term in duration. As a result, we must maintain a robust backlog of programs with existing and new customers to replace contracts as they are completed. In the event we are unable to replace these contracts in a timely manner or at all, our revenues may not be able to be sustained or may decline. In addition, certain of our long-term contracts may be cancelled or delayed by clients for any reason upon notice. Multiple cancellations, non-renewals, or renewals on less favorable terms to us related to significant contracts could materially impact our business. While we intend to seek to negotiate new or extended agreements, if new contracts cannot be completed or existing contracts cannot be extended on terms acceptable to us or at all, our business, results of operation and financial condition could be materially adversely affected.
Our business is dependent on the continued sale of CRINONE to Merck Serono.
Our operating results are dependent on the product revenues from Merck Serono derived from the sale of CRINONE in countries outside the U.S. Revenues from sales to Merck Serono during the years ended December 31, 2014, 2013 and 2012 constituted approximately 53%, 73% and 67% of our total revenues, respectively. We do not control the amount and timing of marketing resources that Merck Serono may or may not devote to our product. The failure of Merck Serono to effectively market our products and maintain licensure in marketed countries could have a material adverse effect on our business, financial condition and results of operations. Our supply agreement with Merck Serono expires on May 19, 2020.
We have made significant capital investments in the Molecular Profiles services business to meet growth expectations. If we are unable to utilize the facilities’ expected capacity, our margins could be adversely affected.
We have made substantial investments in our Nottingham, U.K. facilities and equipment to support increased development and contract manufacturing activity. If new customer agreements are not executed or do not generate expected revenues, we may have excess fixed costs capacity that may require an impairment charge that will negatively affect our financial performance.
Changes in regulatory approval policy or statutory or regulatory requirements, or in the regulatory environment, during the development period of any of our product candidates may result in delays in the approval, or rejection, of the application for approval of one or more of our product candidates. If we fail to obtain approval, or are delayed in obtaining approval, of our product candidates, our ability to generate revenue will be severely impaired.
The process of drug development and regulatory approval for product candidates takes many years, during which time the FDA’s interpretations of the standards against which drugs are judged for approval may evolve or change. The FDA can also change its approval policies based upon changes in laws and regulations. In addition, the FDA can, based on its then current approval policies, any changes in those policies and its broad discretion in the approval process, weigh the benefits and the risks of every drug candidate. As a result of any of the foregoing, the FDA may decide that the data we submit in support of an application for approval of a drug candidate are insufficient for approval.
If we, or our current or future collaborators, do not obtain and maintain required regulatory approvals for one or more of our product candidates, we will be unable to commercialize those product candidates. Further, if we are delayed in obtaining or unable to obtain, any required approvals, or our contract manufacturers are unable to manufacture and supply product for sale, our collaborators may terminate, or be entitled to terminate, their agreements with us or reduce or eliminate their payments to us under these agreements or we may be required to pay termination payments under these agreements.
17
Table of Contents
Our product candidates that are under development are subject to extensive domestic and foreign regulation. The FDA regulates, among other things, the development, testing, manufacture, safety, efficacy, record keeping, labeling, storage, advertising, promotion, sale and distribution of pharmaceutical products in the U.S. In order to market our products abroad, we must comply with extensive regulation by foreign governments. If we are unable to obtain and maintain FDA and foreign government approvals for our product candidates, we, alone or through our collaborators, will not be permitted to sell them. Failure to obtain regulatory approval for a product candidate will prevent us from commercializing that product candidate.
In the U.S., an NDA or supplement must be filed with respect to each indication for which marketing approval of a product is sought. Each NDA, in turn, requires the successful completion of preclinical, toxicology, genotoxicity and carcinogenicity studies, as well as clinical trials demonstrating the safety and efficacy of the product for that particular indication. We may not receive regulatory approval of any of the NDAs that we file with the FDA or any approval of applications we may seek in the future outside the U.S.
We and our contract manufacturers are required to comply with the applicable FDA current Good Manufacturing Practices, or cGMP, regulations, which include requirements relating to quality control and quality assurance, as well as the corresponding maintenance of records and documentation. Further, manufacturing facilities must be approved by the FDA before they can be used to manufacture our product candidates, and are subject to additional FDA inspection. Manufacturing facilities may also be subject to state regulations.
We, or our third-party manufacturers, may not be able to comply with cGMP regulations or other FDA regulatory requirements, or applicable state regulations, or may not be able to successfully manufacture our products that could result in a delay or an inability to commercialize the products. If we or our partners wish or need to identify an alternative manufacturer, delays in obtaining FDA approval of the alternative manufacturing facility could cause an interruption in the supply of our products.
Labeling and promotional activities are subject to scrutiny by the FDA and state regulatory agencies and, in some cases, the Federal Trade Commission. FDA enforcement policy prohibits the marketing of unapproved products as well as the marketing of approved products for unapproved, or off-label, uses. These regulations and the FDA’s interpretation of them may limit our or our partners’ ability to market products for which we gain approval. Failure to comply with these requirements can result in federal and state regulatory enforcement action. Further, we may not obtain the labeling claims we or our partners believe are necessary or desirable for the promotion of our product candidates.
The price of our common stock has been and may continue to be volatile.
The market prices and volume of securities of small specialty pharmaceutical companies, including ours, from time to time experience significant price and volume fluctuations. Historically, the market price of our common stock has fluctuated over a wide range. Between 2012 and 2014, our common stock traded in a range from $4.49 to $23.20 per share. In 2014, our common stock traded in a range from $5.25 to $7.50 per share. It is likely that the price of our common stock will continue to fluctuate. In particular, the market price of our common stock may fluctuate significantly due to a variety of factors, including: the results of operations, our ability to develop additional products and services, and general market conditions. In addition, the occurrence of any of the risks described in these “Risk Factors” could have a material and adverse impact on the market price of our common stock.
A decline in the price of our common stock could affect our ability to raise further working capital and adversely impact our ability to continue operations.
Any sudden or prolonged decline in the price of our common stock could result in a reduction in the liquidity of our common stock and a reduction in our ability to raise capital. Such reductions may force us to
18
Table of Contents
reallocate funds from other planned uses and may have a significant negative impact on our business plans and operations, including our ability to invest in growing our services, developing our own proprietary technologies and product candidates and continuing our current operations. If we are unable to raise sufficient capital in the future, and we are unable to generate funds from operations sufficient to meet our obligations, we will not have the resources to continue our normal operations.
Impairment of our intangible assets could result in significant charges that would adversely impact our future operating results.
We have significant intangible assets, including goodwill and intangibles with useful lives ranging from 3 to 7 years, which are susceptible to valuation adjustments as a result of changes in various factors or conditions. The most significant intangible assets we have is goodwill as well as developed technology, customer relationships and trade names. We amortize our intangible assets that have finite lives using either the straight-line or accelerated method, based on the useful life of the asset over which it is expected to be consumed utilizing expected undiscounted future cash flows. Amortization is recorded over the estimated useful lives ranging from 3 to 7 years. We assess the potential impairment of intangible assets on an annual basis, as well as whenever events or changes in circumstances indicate that the carrying value may not be recoverable. Factors that could trigger an impairment of such assets include the following:
| • | Significant underperformance relative to historical or projected future operating results; |
| • | Significant changes in the manner of or use of the acquired assets or the strategy for our overall business; |
| • | Significant negative industry or economic trends; |
| • | Significant decline in our stock price for a sustained period; |
| • | Changes in our organization or management reporting structure that could result in additional reporting units, which may require alternative methods of estimating fair values or greater disaggregation in our analysis by reporting unit; and |
| • | A decline in our market capitalization below net book value. |
Future adverse changes in these or other unforeseeable factors could result in an impairment charge that would impact our results of operations and financial position in the reporting period identified.
Our progesterone delivery patent for CRINONE expired in 2013 in the U.S. and expired in 2014 outside the U.S. and a generic product to CRINONE may become available.
Our U.S. progesterone delivery patent for the current formulation of CRINONE expired in September 2013. These patent expirations could enable a generic bioadhesive progesterone vaginal gel product to enter the infertility marketplace. Actavis has developed a next generation progesterone product utilizing a new applicator. We have no assurance this development will prevent new competitors from entering the market. However due to the clinical and regulatory hurdles that a potential generic competitor would likely face, we believe the risk of generic entry is not high.
Until September 2014, we held patents on the delivery system for CRINONE in the following countries in which sales of CRINONE are material: Australia, Canada, Ireland, Italy, Russia, and the United Kingdom. In other large markets including Brazil, China, India, South Korea, Taiwan, Thailand, Turkey, and Vietnam there were no patents in place. Merck Serono holds marketing authorizations for CRINONE in over 60 countries outside the United States.
19
Table of Contents
We face increased competition, which could adversely affect the operating results of our business
Our services business competes directly with the in-house research departments of pharmaceutical companies and biotechnology companies, as well as contract research companies, and research and academic institutions. We also experience significant competition from foreign companies operating under lower cost structures. Many of our competitors have greater financial and other resources than we have. As new companies enter the market and as more advanced technologies become available, we currently expect to face increased competition. In the future, any one of our competitors may develop technological advances that render the services that we provide obsolete. While we plan to develop technologies, which will give us competitive advantages, our competitors plan to do the same. We may not be able to develop the technologies we need to successfully compete in the future, and our competitors may be able to develop such technologies before we do or provide those services at a lower cost. Consequently, we may not be able to successfully compete in the future.
Any significant change in government regulation of the drug development process could have a material adverse effect on the Company.
The manufacture of pharmaceutical products is subject to extensive regulation by governmental authorities, including the FDA, Medicines and Healthcare products Regulatory Agency (“MHRA”), the European Medicines Agency (“EMA”) and comparable regulatory authorities in other countries. Our business, as well as our customers’ business, depends in part on strict government regulation of the drug development process. Legislation may be introduced and enacted to modify existing regulations or impose new regulations to be administered by the FDA, MHRA or the EMA governing the manufacture of drugs and the drug approval process. Any significant change in regulations governing the manufacture of clinical trial drugs or reduction in the scope of regulatory requirements or the introduction of simplified drug approval procedures could have a material adverse effect our business.
We face significant competition from pharmaceutical companies that may adversely impact our market share.
Our marketing partners compete against established pharmaceutical companies that market products addressing similar needs. Further, the pharmaceutical development services that we offer are also offered by numerous larger companies that may have better technology, products and services that compete with our present and proposed product and service offerings. Some of these competitors may possess greater financial, research and technical resources than our company or our partners. Moreover, these companies may possess greater marketing capabilities than our company or our partners, including the resources to implement extensive advertising campaigns.
The pharmaceutical industry is subject to change as new drug delivery technologies are developed, new products enter the market, generic versions of existing drugs become available, and service and technology offerings evolve to reflect these and other medical research discoveries. We face significant competition in all areas of our business. The rapid pace of change in the pharmaceutical industry continually creates new opportunities for existing competitors and start-ups, and can quickly render existing products and services less valuable. Customer requirements and physician and patient preferences continually change as new treatment options emerge, are more or less heavily promoted, and become less expensive. As a result, we may not gain, and may lose, market share.
The loss of our key executives could have a significant impact on us.
Our success depends in large part upon the abilities and continued service of our executive officers and other key employees. Our employment agreements with our executive officers are terminable by either party on short notice. The loss of key employees may result in a significant loss in the knowledge and experience that we, as an organization, possess, and could cause significant delays in, or outright failure of, the management of our
20
Table of Contents
supply chain, our pharmaceutical development, analytical and consulting services business and, or, our development of future products and product candidates. If we are unable to attract and retain qualified and talented senior management personnel, our business may suffer.
Our products could demonstrate hormone replacement risks.
In the past, certain studies of female hormone replacement therapy products, such as estrogen, have reported an increase in health risks. Progesterone is a natural female hormone present at normal levels in most women throughout their lifetimes. However, some women require progesterone supplementation due to a natural or chemical-related progesterone deficiency. It is possible that data suggesting risks or problems may come to light in the future that could demonstrate a health risk associated with progesterone or progestin supplementation or CRINONE. It is also possible that future study results for hormone replacement therapy could be negative and could result in negative publicity about the risks and benefits of hormone replacement therapy. As a result, physicians and patients may not wish to prescribe or use progestins, including CRINONE.
Healthcare insurers and other payors may not pay for our products or may impose limits on reimbursement.
The ability of our partners to commercialize our prescription products will depend, in part, on the extent to which reimbursement for our products is available from third-party payors, such as health maintenance organizations, health insurers and other public and private payors. If we or our partners succeed in bringing new prescription products to market or expand the approved label for existing products, we cannot be assured that third-party payors will pay for such products, or establish and maintain price levels sufficient for realization of an appropriate return on our investment in product development.
Government health agencies, private health maintenance organizations and other third-party payors may use one or more tools including price controls, profit or reimbursement caps, and use of formularies, or lists of drugs for which coverage is provided under a healthcare benefit plan, to control the costs of prescription drugs. Each payor that maintains a drug formulary makes its own determination as to whether a new drug will be added to the formulary and whether particular drugs in a therapeutic class will have preferred status over other drugs in the same class. This determination often involves an assessment of the clinical appropriateness of the drug and, in some cases, the cost of the drug in comparison to alternative products. Our products marketed by our partners from which we derive sales revenues and royalties may not be added to payors’ formularies, our products may not have preferred status to alternative therapies, and formulary decisions may not be conducted in a timely manner. Once reimbursement at an agreed level is approved by a payor organization, reimbursement may be lost entirely or be reduced compared to competitive products. As reimbursement is often approved for a period of time, this risk is greater at the end of the time period, if any, for which the reimbursement was approved. Our partners may also decide to enter into discount or formulary fee arrangements with payors, which could result in lower or discounted prices for CRINONE or future products.
Healthcare law and policy changes, based on recently enacted legislation, may have a material adverse effect on us.
In March 2010, the Patient Protection and Affordable Care Act, as amended by the Health Care and Education Affordability Reconciliation Act, or collectively, PPACA, became law in the U.S. PPACA substantially changes the way healthcare is financed by both governmental and private insurers and significantly affects the pharmaceutical industry. Most notably, the PPACA increased Medicaid rebates, expanded Medicaid eligibility, extended Public Health Service eligibility, imposed annual reporting requirements on certain entities, including pharmaceutical companies, to disclose certain financial relationships with physicians and teaching hospitals, and established a new Patient-Centered Outcomes Research Institute, an entity charged with examining the relative health outcomes, clinical, effectiveness and appropriateness of difficult medical treatments. Many of these provisions could have the effect of reducing our revenue generated by Actavis’ sales of CRINONE and any future commercial products we may develop. In addition, we anticipate that the PPACA, as well as other
21
Table of Contents
healthcare reform measures that may be adopted in the future, may result in more rigorous coverage criteria and an additional downward pressure on the price that we receive for any approved product, which may harm our business. Insurers may also refuse to provide any coverage of uses of approved products for medical indications other than those for which the FDA has granted market approvals.
We are dependent on single-source third-party suppliers of raw materials for our products, the loss of whom could impair our ability to manufacture and sell our products.
Medical grade, cross-linked polycarbophil, the polymer used in our BDS-based products is currently available from only one supplier, Lubrizol. We believe that Lubrizol will supply as much of the material as we require because our products rank among the highest value-added uses of the polymer. In the event that Lubrizol cannot or will not supply enough of the product to satisfy our needs, we will be required to seek alternative sources of polycarbophil. An alternative source of polycarbophil may not be available on satisfactory terms or at all, which would impair our ability to manufacture and sell our products. While we purchase polycarbophil from Lubrizol, Inc. from time to time, we do not have an agreement with them concerning future purchases. The Company’s policy is to have in inventory at least a 12 month supply of polycarbophil.
Only one supplier of progesterone is approved by regulatory authorities outside the U.S. If this supplier is unable or unwilling to satisfy our needs, we will be required to seek alternative sources of supply. While alternative sources of progesterone exist, the time needed to obtain regulatory approvals for new suppliers may impair our ability to manufacture and sell our products.
We are dependent upon single-source third-party manufacturers, the loss of which could result in a loss of revenues.
We rely on third parties to manufacture our products, including Fleet, which manufacturers CRINONE in bulk, Maropack, which fills CRINONE into applicators, and Central Pharma, which packages CRINONE in final containers. These third parties may not be able to satisfy our needs in the future, and we may not be able to find or obtain approval from regulatory authorities of alternate developers and manufacturers. Delays in the manufacture of our products could have a material adverse effect on our business. This reliance on third parties could have an adverse effect on our profit margins. Any interruption in the manufacture of our products would impair our ability to deliver our products to customers on a timely and competitive basis, and could result in the loss of revenues.
We may be exposed to product liability claims.
We could be exposed to future product liability claims by consumers. Although we presently maintain product liability insurance coverage at what we believe is a commercially reasonable level, such insurance may not be sufficient to cover all possible liabilities. An award against us in an amount greater than our insurance coverage could have a material adverse effect on our operations.
Steps taken by us to protect our proprietary rights might not be adequate; in which case, competitors may infringe on our rights or develop similar products. The U.S. and foreign patents upon which our original BDS was based have expired.
Our success and competitive position are partially dependent on our ability to protect our proprietary position for our technology, products and product candidates. We rely primarily on a combination of patents, trademarks, copyrights, trade secret laws, third-party confidentiality and nondisclosure agreements, and other methods to protect our proprietary rights. The steps we take to protect our proprietary rights, may not be adequate. Third parties may infringe or misappropriate our patents, copyrights, trademarks, and similar proprietary rights. Moreover, we may not be able or willing, for financial, legal or other reasons, to enforce our rights.
22
Table of Contents
Bio-Mimetics, Inc. (“Bio-Mimetics”) originally held the patent upon which our original BDS was based until we purchased it from them. Bio-Mimetics’ patent contained broad claims covering controlled release products, which include a bioadhesive. However, this U.S. patent and its corresponding foreign patents expired in November 2003 and 2004, respectively. Based upon the expiration of the original Bio-Mimetics patent, other parties will be permitted to make, use or sell products covered by the claims of the Bio-Mimetics patent, subject to other patents, including those which we hold. We have obtained numerous patents with claims covering improved methods of formulating and delivering therapeutic compounds using the BDS. The formulation patents relating to CRINONE expired in 2013 in the U.S. and in 2014 in the rest of the world. We cannot assure you that any remaining patents will enable us to prevent infringement, or that our competitors will not develop alternative methods of delivering compounds, potentially resulting in competitive products outside the protection that may be afforded by our patents. Other companies may independently develop or obtain patent or similar rights to equivalent or superior technologies or processes. Additionally, although we believe that our patented technology has been independently developed and does not infringe on the proprietary rights of others, we cannot assure you that our products do not and will not infringe on the proprietary rights of others. In the event of infringement, we may be required to modify our technology or products, obtain licenses or pay license fees. We may not be able to do so in a timely manner or upon acceptable terms and conditions. This may have a material adverse effect on our operations.
The standards that the U.S. Patent and Trademark Office and its foreign counterparts use to grant patents are not always applied predictably or uniformly and can change. Limitations on patent protection in some countries outside the U.S., and the differences in what constitutes patentable subject matter in these countries, may limit the protection we seek outside of the U.S. For example, methods of treating humans are not patentable subject matter in many countries outside of the U.S. In addition, laws of foreign countries may not protect our intellectual property to the same extent as would laws of the U.S. In determining whether or not to seek a patent or to license any patent in a particular foreign country, we weigh the relevant costs and benefits, and consider, among other things, the market potential of our product candidates in the jurisdiction and the scope and enforceability of patent protection afforded by the law of the jurisdiction.
Our products are subject to government regulation, which could affect our partners’ ability to sell products.
Nearly every aspect of the development, manufacture and commercialization of pharmaceutical products is subject to time-consuming and costly regulation by various governmental entities, including the FDA and MHRA, as well as regulatory agencies in those foreign countries in which our products are manufactured or distributed. The National Drug agencies may have the power to seize adulterated or misbranded products and unapproved new drugs, to require their recall from the market, to enjoin further manufacture or sale, and to publicize certain facts concerning a product.
We employ various quality control measures in our efforts to ensure that our products conform to their intended specifications and meet the standards required under applicable governmental regulations. Notwithstanding our efforts, our products or the ingredients we purchase from our suppliers for inclusion in our products may contain undetected defects or non-conformities with specifications. Such defects or non-conformities could compel us to recall the affected product, make changes to or restrict distribution of the product, or take other remedial actions. The occurrence of such events may harm our relations with or result in the loss of customers, injure our reputation, impair market acceptance of our products, harm our financial results, and, in certain circumstances, expose us to product liability or other claims.
The potential development of our pharmaceutical products is uncertain and subject to a number of significant risks.
In order to develop future pharmaceutical products, we must complete extensive human clinical trials and non-clinical trials that demonstrate the safety and efficacy of a product in order to apply for regulatory approval to market the product.
23
Table of Contents
The process of developing product candidates involves a degree of risk and may take several years. Product candidates that appear promising in the early phases of development may fail to reach the market for several reasons, including:
| • | Clinical trials may show our product candidates to be ineffective for the indications studied or to have harmful side effects; |
| • | Product candidates may fail to receive regulatory approvals required to bring the products to market; |
| • | Manufacturing costs or other factors may make our product candidates uneconomical; |
| • | The proprietary rights of others and their competing products and technologies may prevent our product candidates from being effectively commercialized; and |
| • | Our inability to attract development and commercialization partners. |
Success in early clinical trials does not ensure that subsequent large-scale clinical trials will be successful. Clinical results are frequently susceptible to varying interpretations that may delay, limit or prevent regulatory approvals.
The length of time necessary to complete clinical trials and to submit an application for marketing approval for a final decision by a regulatory authority varies significantly and may be difficult to predict. The speed with which we can complete clinical trials and applications for marketing approval will depend on several factors, including the following:
| • | The rate of patient enrollment which is a function of factors including the size of the patient population, competing clinical studies, the proximity of patients to clinical sites, the eligibility criteria for the study, and the nature of the study protocol; |
| • | Institutional Review Board, or IRB, approval of the study protocol and the informed consent form; |
| • | Prior regulatory agency review and approval; |
| • | Analysis of data obtained from clinical activities, which are susceptible to varying interpretations and which interpretations could delay, limit or prevent regulatory approval; |
| • | Changes in the policies of regulatory authorities for drug approval during the period of product development; and |
| • | The availability of skilled and experienced staff to conduct and monitor clinical studies and to prepare the appropriate regulatory applications. |
| • | Sufficient safety and efficacy results of any non-clinical trials conducted. |
In addition, developing product candidates is very expensive. Factors affecting our product development expenses include:
| • | Our ability to raise any additional funds, if needed, to complete our trials; |
| • | The number and outcome of clinical trials conducted by us and/or our collaborators; |
| • | The number of products we may have in clinical development; |
| • | In-licensing or other partnership activities, including the timing and amount of related development funding, license fees or milestone payments; and |
| • | Future levels of our revenue. |
Clinical trials are expensive and can take years to complete, and there is no guarantee that the clinical trials will demonstrate sufficient safety and/or efficacy of the products to meet FDA requirements, or those of foreign regulatory authorities.
24
Table of Contents
Delays or failures in obtaining regulatory approvals may delay or prevent marketing of the products that we develop.
The regulatory approval process typically is extremely expensive, takes many years, and the timing or likelihood of any approval cannot be accurately predicted. Delays in obtaining regulatory approval can be extremely costly in terms of lost sales opportunities and increased clinical trial costs. If we or our partners fail to obtain regulatory approval for our future product candidates or expanded indications for currently marketed products, we will be unable to receive income from the sale of such products and indications.
As part of the regulatory approval process, we must conduct clinical trials for each product candidate to demonstrate safety and efficacy. The number of clinical trials that will be required varies depending on the product candidate, the indication being evaluated, the trial results, and the regulations applicable to such particular product candidate.
The results of initial clinical trials of product candidates do not necessarily predict the results of later-stage clinical trials. Product candidates in later stages of clinical trials may fail to show the desired safety and efficacy despite having progressed through initial clinical trials. The data collected from the clinical trials of our product candidates may not be sufficient to support FDA or other regulatory approval. In addition, the continuation of a particular study after review by an IRB or independent data safety monitoring board does not necessarily indicate that a product candidate will achieve the clinical endpoint.
The FDA and other regulatory agencies can delay, limit or deny approval for many reasons, including:
| • | A product candidate may not be deemed to be safe or effective; |
| • | The manufacturing processes or facilities selected may not meet the applicable requirements; and |
| • | Changes in their approval policies or adoption of new regulations may require additional clinical trials, other data or removal from the market. |
Any delay in, or failure to receive, approval for any of our product candidates could prevent us from growing our revenues.
We may observe adverse side effects of our future potential product candidates in clinical trials, which could delay or halt product development.
Our future potential product candidates may demonstrate serious adverse side effects in clinical trials. These adverse side effects could interrupt, delay or halt clinical trials of product candidates and could result in FDA or other regulatory authorities denying approval of product candidates for any or all targeted indications. An IRB or independent data safety monitoring board, the FDA, other regulatory authorities, or we ourselves or our customers may suspend or terminate clinical trials at any time. Product candidates may prove not to be safe for human use. In such circumstances we may not be able to complete development and successful licensing of our own internal programs and our customers may not place additional contracts with us and may cancel existing contracts.
If we fail to maintain an effective system of internal control over financial reporting, we may not be able to accurately report our financial results, and current and potential stockholders may lose confidence in our financial reporting.
We are required by the SEC to establish and maintain adequate internal control over financial reporting that provides reasonable assurance regarding the reliability of our financial reporting and the preparation of financial statements in accordance with generally accepted accounting principles, or GAAP. We are likewise required, on an annual basis, to evaluate the effectiveness of our disclosure controls and to disclose any changes and material weaknesses in our internal controls.
25
Table of Contents
As described in Item 9a of this Annual Report on Form 10-K, our management recently identified a material weakness in our internal control over financial reporting, relating to our evaluation of revenue recognition for services transactions and contractual arrangements during the year ended December 31, 2014.
We are actively engaged in developing a remediation plan designed to address the material weakness in our internal control over financial reporting. Our plan includes additional staffing, enhancing policies and procedures relating to revenue recognition and other areas reflected in the material weakness, and implementing a series of incremental software solutions. These steps, however, may not be sufficient to remediate the material weakness, even if successfully implemented.
We cannot assure you that we will be successful in remediating this material weakness or that additional material weaknesses in our internal control over financial reporting will not be identified in the future. Any failure to implement and document new and more precise monitoring controls or to implement organizational changes including skillset enhancements through resource changes or education to improve detection and communication of financial misstatements across all levels of the organization could result in additional material weaknesses, result in material misstatements in our financial statements and cause us to fail to meet our reporting obligations, which in turn could cause the trading price of our common stock to decline.
We may be limited in our use of our net operating loss carryforwards.
As of December 31, 2014, we had certain net operating loss carryforwards of approximately $160 million that may be used to reduce our future U.S. federal income tax liabilities, if we become profitable on a federal income tax basis. If unused, these tax loss carryforwards will begin to expire between 2018 and 2034. Our ability to use these loss carryforwards to reduce our future U.S. federal income tax liabilities could also be lost if we were to experience more than a 50% change in ownership within the meaning of Section 382(g) of the Internal Revenue Code of 1986 (“Code”), as amended. If we were to lose the benefits of these loss carryforwards, our future earnings and cash resources would be materially and adversely affected.
On January 22, 2015, our Board of Directors adopted an amendment and restatement of the Amended and Restated Rights Agreement, dated as of November 29, 2010 (the “Rights Plan”), between the Company and American Stock Transfer & Trust Company, LLC, as successor rights agent (as amended and restated, the “Amended Rights Plan”). We adopted the Rights Plan to preserve the value of our net operating loss carry forwards by reducing the likelihood that the Company would experience an ownership change by discouraging any person (together with such person’s affiliates and associates), without the approval of the Board of Directors, (i) from acquiring 4.99% or more of the outstanding Voting Stock (as defined in the Rights Plan) and (ii) that currently beneficially owns 4.99% or more of the outstanding Voting Stock from acquiring more shares of Voting Stock, other than by exercise or conversion of currently existing warrants, convertible securities or other equity-linked securities. In general, the Amended Rights Plan leaves the Rights Plan unchanged in all material respects, other than increasing from 4.99% or more to 9.99% or more the percentage of outstanding shares of Voting Stock that a Person must Beneficially Own (as defined in the Amended Rights Plan) in order to qualify as an “Acquiring Person” for purposes of triggering the Rights (as defined in the Amended Rights Plan) under the Amended Rights Plan. The Amended Rights Plan expires on July 3, 2016.
There is no guarantee that the Rights Plan will prevent an ownership change within the meaning of Section 382(g) of the Internal Revenue Code and, therefore, no guarantee that the value of our net operating loss carryforwards will be preserved.
26
Table of Contents
Sales of large amounts of our common stock may adversely affect our market price. The issuance of preferred stock or convertible debt may adversely affect the rights of our common stockholders.
As of February 27, 2015, we had 10,775,101 shares of common stock outstanding, of which 10,135,507 shares were freely tradable. As of that date, approximately 639,594 shares of our common stock were held by affiliates. We also have the following securities outstanding: series B convertible preferred stock, contingently redeemable series C convertible preferred stock, common stock warrants, treasury shares, and options. If all of these securities are exercised or converted, an additional 3.1 million shares of our common stock will be outstanding, all of which will be available for resale under the Securities Act. The exercise and conversion of these securities would likely dilute the book value per share of our common stock. In addition, the existence of these securities may adversely affect the terms on which we can obtain additional equity financing.
In March 2002, our Board of Directors authorized shares of series D junior participating preferred stock in connection with its adoption of a stockholder rights plan (as discussed above, this plan was amended and restated on November 29, 2010 and subsequently on January 28, 2015), under which we issued rights to purchase series D convertible preferred stock to holders of our common stock. Upon certain triggering events, such rights become exercisable to purchase shares of our common stock (or, in the discretion of our Board of Directors, series D convertible preferred stock) at a price substantially discounted from the then current market price of our common stock.
Under our certificate of incorporation, our Board of Directors has the authority to issue up to 1.0 million shares of preferred stock and to determine the price, rights, preferences and privileges of those shares without any further vote or action by our stockholders. In addition, we may issue convertible debt without shareholder approval. The rights of the holders of our common stock are subject to, and may be adversely affected by, the rights of the holders of any shares of preferred stock or convertible debt that may be issued in the future. While we have no present intention to authorize or issue any additional series of preferred stock or convertible debt, such preferred stock or convertible debt, if authorized and issued, may have other rights, including economic rights senior to our common stock, and, as a result, their issuance could have a material adverse effect on the market value of our common stock.
Our corporate compliance program cannot guarantee that we are in compliance with all potentially applicable regulations.
We are a small company and we rely heavily on third parties to conduct many important functions. As a pharmaceutical development and services company, we are subject to a large body of legal and regulatory requirements. In addition, as a publicly traded company we are subject to significant regulations. We cannot assure you that we are or will be in compliance with all potentially applicable laws and regulations. Failure to comply with all potentially applicable laws and regulations could lead to the imposition of fines, cause the value of our common stock to decline, impede our ability to raise capital or lead to the de-listing of our stock.
Anti-takeover provisions could impede or discourage a third-party acquisition of the Company. This could prevent stockholders from receiving a premium over market price for their stock.
We are a Delaware corporation. Anti-takeover provisions of Delaware law impose various obstacles to the ability of a third party to acquire control of our company, even if a change in control would be beneficial to our existing stockholders. In addition, our Board of Directors has adopted a stockholder rights plan (as discussed above, this plan was amended and restated on November 29, 2010 and subsequently on January 28, 2015) and has designated a series of preferred stock that could be used defensively if a takeover is threatened. Our incorporation under Delaware law, our stockholder rights plan, and our ability to issue additional series of preferred stock, could impede a merger, takeover or other business combination involving our company or discourage a potential acquirer from making a tender offer for our common stock. This could reduce the market
27
Table of Contents
value of our common stock if investors view these factors as preventing stockholders from receiving a premium for their shares.
Our operations involve hazardous materials and are subject to environmental, health and safety controls and regulations.
We are subject to environmental, health and safety laws and regulations, including those governing the use of hazardous materials, and we spend considerable time complying with such laws and regulations. Our business activities involve the controlled use of hazardous materials and although we take precautions to prevent accidental contamination or injury from these materials, we cannot completely eliminate the risk of using these materials. In the event of an accident or environmental discharge, we may be held liable for any resulting damages, which may materially harm our business, financial condition and results of operations.
We are exposed to market risk from foreign currency exchange rates.
With four international subsidiaries and third party manufacturers in Europe, economic and political developments in the European Union can have a significant impact on our business. All of our products are currently manufactured in Europe. We are exposed to currency fluctuations related to payment for the manufacture of our products in Euros, Pound Sterling, Swiss Francs, and other currencies and selling them in U.S. dollars and other currencies.
We could be negatively impacted by securities class action complaints.
Between February 1, 2012 and February 6, 2012, two putative securities class action complaints were filed against Columbia and certain of its officers and directors in the United States District Court for the District of New Jersey. These actions were filed under the captions Wright v. Columbia Laboratories, Inc., et al., and Shu v. Columbia Laboratories, Inc., et al. and asserted claims under sections 10(b) and 20(a) of the Securities Exchange Act of 1934 as amended (the “Exchange Act”) and Rule 10b-5 promulgated under the Exchange Act on behalf of an alleged class of purchasers of the common stock during the period from December 6, 2010 through January 20, 2012. Both actions were consolidated into a single proceeding entitled In re Columbia Laboratories, Inc., Securities Litigation, under which Actavis and three of its officers were added as defendants. The Consolidated Amended Complaint alleged that Columbia and two of its officers, one of whom is a director, omitted to state material facts that they were under a duty to disclose, and made materially false and misleading statements that related to the results of Columbia’s PREGNANT study and the likelihood of approval by the FDA of a NDA to market progesterone vaginal gel 8% for the prevention of preterm birth in women with premature cervical shortening. According to the amended complaint, these alleged omissions and misleading statements had the effect of artificially inflating the market price of our common stock. The plaintiffs sought unspecified damages on behalf of the putative class and an award of costs and expenses, including attorney’s fees. On June 11, 2013, the Court dismissed the amended complaint for failure to state a claim upon which relief could be granted, holding that the plaintiffs did not adequately plead facts supporting an inference of an intent to deceive investors. The Court permitted the plaintiffs to file a second amended complaint, which they did on July 11, 2013. Columbia moved to dismiss the second amended complaint, which the court did on October 21, 2013. The Court ruled that changes the plaintiffs made to their first amended complaint “still do not create a strong inference that the Defendants acted with an intent to deceive, manipulate or defraud.” The Court ordered that if the plaintiffs sought to attempt to plead a cognizable action in a third amended complaint, they must do so within thirty days and specifically address why the attempt would not be futile. The plaintiffs chose not to file any further amendments and the case was dismissed with prejudice on December 2, 2013. On December 20, 2013, the plaintiffs appealed the dismissal to the United States Court of Appeals for the Third Circuit. The Court heard oral argument on December 9, 2014. On March 10, 2015, the Court affirmed the dismissal in a written opinion. By rule, the plaintiffs may request a rehearing. Columbia believes that the action is without merit, and intends to defend it vigorously. At this time, it is not possible to determine the likely outcome of, or to estimate the potential liability related to this action, and Columbia has not made any provision for losses in connection with it.
28
Table of Contents
| Item 1B. | Unresolved Staff Comments |
None.
| Item 2. | Properties |
We lease a 3,300 square foot facility in Boston, Massachusetts, which houses our executive offices and certain administrative functions. The lease on this facility expires in April 2016. We own two facilities in Nottingham, United Kingdom. The first is an 8,000 square foot facility containing administrative offices and laboratories for analytical and development services. The second building is a 30,000 square foot facility containing laboratories and clean rooms primarily used for pharmaceutical development, analytical and manufacturing activities.
| Item 3. | Legal Proceedings |
Claims and lawsuits are filed against the Company from time to time. Although the results of pending claims are always uncertain, the Company believes that it has adequate reserves or adequate insurance coverage in respect of these claims, but no assurance can be given as to the sufficiency of such reserves or insurance coverage in the event of any unfavorable outcome resulting from these actions.
Between February 1, 2012 and February 6, 2012, two putative securities class action complaints were filed against us and certain of our officers and directors in the United States District Court for the District of New Jersey. These actions were filed under the captions Wright v. Columbia Laboratories, Inc., et al., and Shu v. Columbia Laboratories, Inc., et al. and asserted claims under sections 10(b) and 20(a) of the Securities Exchange Act of 1934 as amended (the “Exchange Act”) and Rule 10b-5 promulgated under the Exchange Act on behalf of an alleged class of purchasers of the common stock during the period from December 6, 2010 through January 20, 2012. Both actions were consolidated into a single proceeding entitled In re Columbia Laboratories, Inc., Securities Litigation, under which Actavis and three of its officers were added as defendants. The Consolidated Amended Complaint alleged that Columbia and two of its officers, one of whom is a director, omitted to state material facts that they were under a duty to disclose, and made materially false and misleading statements that related to the results of Columbia’s PREGNANT study and the likelihood of approval by the FDA of a NDA to market progesterone vaginal gel 8% for the prevention of preterm birth in women with premature cervical shortening. According to the amended complaint, these alleged omissions and misleading statements had the effect of artificially inflating the market price of our common stock. The plaintiffs sought unspecified damages on behalf of the putative class and an award of costs and expenses, including attorney’s fees. On June 11, 2013, the Court dismissed the amended complaint for failure to state a claim upon which relief could be granted, holding that the plaintiffs did not adequately plead facts supporting an inference of an intent to deceive investors. The Court permitted the plaintiffs to file a second amended complaint, which they did on July 11, 2013. We moved to dismiss the second amended complaint, which the court did on October 21, 2013. The Court ruled that changes the plaintiffs made to their first amended complaint “still do not create a strong inference that the Defendants acted with an intent to deceive, manipulate or defraud.” The Court ordered that if the plaintiffs sought to attempt to plead a cognizable action in a third amended complaint, they must do so within thirty days and specifically address why the attempt would not be futile. The plaintiffs chose not to file any further amendments and the case was dismissed with prejudice on December 2, 2013. On December 20, 2013, the plaintiffs appealed the dismissal to the United States Court of Appeals for the Third Circuit. The Court heard oral arguments on December 9, 2014. On March 10, 2015, the Court affirmed the dismissal in a written opinion. By rule, the plaintiffs may request a rehearing. We believe that the action is without merit, and intend to defend it vigorously. At this time, it is not possible to determine the likely outcome of, or to estimate the potential liability related to this action, and we have not made any provision for losses in connection with it.
| Item 4. | Mine Safety Disclosures |
Not Applicable.
29
Table of Contents
| Item 5. | Market for the Registrant’s Common Equity and Related Stockholder Matters and Issuer Purchases of Equity Securities |
Market Price of and Dividends on Our Common Stock and Related Stockholder Matters.
Our common stock is traded on the Nasdaq Global Market under the symbol “CBRX.” The following table sets forth for the periods indicated the high and low sales prices of our common stock on the Nasdaq Global Market.
| High | Low | |||||||
| Fiscal Year Ended December 31, 2014 |
||||||||
| First Quarter |
$ | 7.50 | $ | 6.37 | ||||
| Second Quarter |
7.33 | 6.20 | ||||||
| Third Quarter |
6.84 | 5.59 | ||||||
| Fourth Quarter |
6.34 | 5.25 | ||||||
| Fiscal Year Ended December 31, 2013 |
||||||||
| First Quarter |
$ | 5.24 | $ | 4.56 | ||||
| Second Quarter |
5.82 | 4.49 | ||||||
| Third Quarter |
8.37 | 5.20 | ||||||
| Fourth Quarter |
7.36 | 6.12 | ||||||
At February 27, 2015, there were approximately 200 shareholders of record of our common stock, one shareholder of record of our Series B convertible preferred stock (“Series B Preferred Stock”) and two shareholders of record of our Series C Convertible Preferred Stock (“Series C Preferred Stock”). We estimate that there were approximately 4,000 beneficial owners of our common stock on such date.
In August 2013, the Company effected a 1-for-8 reverse stock split, which was previously approved by the Board of Directors in July 2013. The reverse stock split was approved by Columbia’s stockholders at its annual meeting of stockholders in May 2013. All share and per share amounts relating to the common stock, stock options and warrants included in the financial statements and accompanying footnotes have been retroactively adjusted for all periods presented to give effect to this reverse stock split, including reclassifying an equal amount to the reduction in par value of common stock to additional paid-in capital. The reverse stock split did not result in a retroactive adjustment to the share amounts for any of the classes of the Company’s preferred stock.
In September 2013, Columbia acquired all of the outstanding capital stock of Molecular Profiles a U.K.-based pharmaceutical development services company. As a result of the transaction, former Molecular Profiles stockholders received as consideration for their shares of Molecular Profiles common stock an aggregate of $16.7 million in cash and 1,051,323 shares of our common stock. The total consideration was valued at $24.0 million, based upon the closing price of our common stock adjusted for a discount for lack of marketability on September 12, 2013, the closing date.
On March 7, 2014 the Company acquired all of its common stock that was beneficially owned by Actavis at that time, which represented approximately 11.5% of the Company’s outstanding common stock. Columbia purchased the 1.4 million shares held by Actavis at a price of $6.08 per share, which represented a 10.75% discount to the market closing price on March 6, 2014. The total purchase price was approximately $8.5 million, which is included in treasury stock at December 31, 2014.
At December 31, 2014, 130 shares of our Series B Preferred Stock remain outstanding. Each share of Series B Preferred Stock is convertible into 2.5 shares of common stock. Upon our liquidation, the holders of the Series B Preferred Stock are entitled to $100 per share. The Series B Preferred Stock will be automatically
30
Table of Contents
converted into common stock upon the occurrence of certain events. Holders of the Series B Preferred Stock are entitled to one vote for each share of common stock into which the preferred stock is convertible.
The contingently redeemable series C Preferred Stock has a stated value of $1,000 per share, and is convertible into common stock at the lower of: (i) $28.00 per share of common stock; or, (ii) 100% of the average of the closing prices during the three trading days immediately preceding the conversion notice, not to exceed 294,045 shares as of December 31, 2014. The Series C Preferred Stock pays a 5% dividend, payable quarterly in arrears on the last day of each quarter. The security holders of Series C Preferred Stock have certain redemption rights due to events beyond our control such as delisting, dividend defaults and certain other defaults. The terms of the Series C Preferred Stock have remained the same since inception.
On July 2, 2010, we purchased approximately $40 million in aggregate principal amount of our outstanding convertible notes (the “Notes”) pursuant to a Note Purchase Agreement. The aggregate purchase price for the Notes was approximately $26 million in cash (plus accrued and unpaid interest through but excluding the date of the closing of the Note purchases), warrants to purchase 968,750 shares of common stock at an exercise price of $10.80 per share and 925,925 shares of our common stock.
All of such securities were issued in unregistered offerings pursuant to Section 4(2) of the Securities Act of 1933, as amended or Regulation D thereunder.
In October 2009, we raised approximately $11.8 million in gross proceeds from the issuance and sale of 1,362,500 shares of our common stock at a price of $8.64 per share and warrants to purchase 681,275 shares of common stock with an exercise price of $12.16 per share in a registered offering. The warrants became exercisable on April 30, 2010, and expire on April 30, 2015, unless earlier exercised or terminated.
Dividend Policy
We have never paid a cash dividend on our common stock and do not anticipate the payment of cash dividends in the foreseeable future. We intend to retain any earnings for use in the development and expansion of our business. We are required to pay a 5% dividend on our Series C Preferred Stock on the last day of each quarter. We are current on our dividend payments.
Applicable provisions of the Delaware General Corporation Law may affect our ability to declare and pay dividends on our common stock as well as on our Series C Preferred Stock. In particular, pursuant to the Delaware General Corporation Law, a company may pay dividends out of its surplus, as defined, or out of its net profits, for the fiscal year in which the dividend is declared and/or the preceding year. Surplus is defined in the Delaware General Corporation Law to be the excess of our net assets over capital. Capital is defined to be the aggregate par value of shares issued unless otherwise established by the Board of Directors.
Equity Compensation Plan Information
See Part III, Item 12 for information regarding securities authorized for issuance under our equity compensation plans.
31
Table of Contents
Stock Performance Graph
The table below shows the cumulative total stockholder return of an investment of $100 on December 31, 2009 in our common stock, the Russell 2000 Index, and Peer Group. Our stock price performance shown in the table below is not indicative of future stock price performance.
Comparison of Five-Year Cumulative Total Return
Columbia Laboratories, Inc., Russell 2000 Index and Peer Group*
(Performance Results Through 12/31/2014)
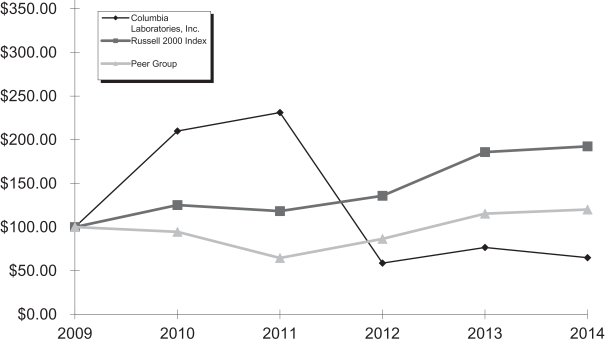
| December 31, | ||||||||||||||||||||
| 2010 | 2011 | 2012 | 2013 | 2014 | ||||||||||||||||
| Columbia Laboratories, Inc. |
$ | 210.19 | $ | 231.48 | $ | 58.84 | $ | 76.50 | $ | 64.81 | ||||||||||
| Russell 2000 Index |
$ | 125.31 | $ | 118.47 | $ | 135.81 | $ | 186.07 | $ | 192.63 | ||||||||||
| Peer Group |
$ | 94.41 | $ | 64.58 | $ | 86.59 | $ | 115.34 | $ | 120.13 | ||||||||||
| * | Peer Group Companies are ANI Pharmaceuticals, Inc., Elite Pharmaceuticals, Inc., Antares Pharma, Inc., BioDelivery Sciences International, Inc., POZEN Inc., Pain Therapeutics Inc., NovaBay Pharmaceuticals, Inc., Alexza Pharmaceuticals, NeoStem. |
Note: Factual material is obtained from sources believed to be reliable, but the publisher is not responsible for any errors or omissions contained herein.
32
Table of Contents
| Item 6. | Selected Financial Data |
The following selected financial data are derived from the Company’s audited consolidated financial statements and are qualified in their entirety by reference to, and should be read in conjunction with, such consolidated financial statements and Item 7, “Management’s Discussion and Analysis of Financial Condition and Results of Operations” of this Annual Report. The consolidated statement of operations data for the years ended December 31, 2014, 2013, 2012, 2011, and 2010 and consolidated balance sheet data as of December 31, 2014, 2013, 2012, 2011, and 2010 have been derived from audited consolidated financial statements. The historical results are not necessarily indicative of the results to be expected for any future period.
| Year Ended December 31, | ||||||||||||||||||||
| 2014 | 2013 | 2012 | 2011 | 2010 | ||||||||||||||||
| Consolidated Statement of Operations Data: |
||||||||||||||||||||
| (000’s except per share data) |
||||||||||||||||||||
| Revenues |
$ | 32,464 | $ | 29,226 | $ | 25,828 | $ | 43,062 | $ | 45,676 | ||||||||||
| Gross profit |
14,775 | 15,976 | 13,040 | 31,371 | 36,655 | |||||||||||||||
| Operating expenses |
10,960 | 10,101 | 10,231 | 8,442 | 35,482 | |||||||||||||||
| Interest expense |
118 | 25 | — | 12 | 4,838 | |||||||||||||||
| Net income (loss) |
$ | 3,390 | $ | 6,704 | $ | 9,917 | $ | 20,527 | $ | (21,831 | ) | |||||||||
| Income (loss) per common share-basic and diluted |
||||||||||||||||||||
| Basic |
$ | 0.31 | $ | 0.59 | $ | 0.91 | $ | 1.90 | $ | (2.38 | ) | |||||||||
| Diluted |
$ | 0.27 | $ | 0.52 | $ | 0.26 | $ | 1.73 | $ | (2.38 | ) | |||||||||
| Weighted average number of common shares outstanding: |
||||||||||||||||||||
| Basic |
10,992 | 11,259 | 10,914 | 10,791 | 9,183 | |||||||||||||||
| Diluted |
11,007 | 11,273 | 11,063 | 11,569 | 9,183 | |||||||||||||||
| Consolidated Balance Sheet Data: |
||||||||||||||||||||
| (000’s) |
||||||||||||||||||||
| Working capital |
$ | 20,438 | $ | 25,930 | $ | 32,157 | $ | 27,500 | $ | 1,997 | ||||||||||
| Total assets |
52,208 | 60,092 | 36,869 | 36,083 | 29,859 | |||||||||||||||
| Notes payable |
3,532 | 3,995 | — | — | — | |||||||||||||||
| Contingently redeemable series C preferred stock |
550 | 550 | 550 | 600 | 600 | |||||||||||||||
| Shareholders’ equity (deficiency) |
40,868 | 46,878 | 31,365 | 20,631 | (20,514 | ) | ||||||||||||||
33
Table of Contents
| Item 7. | Management’s Discussion and Analysis of Financial Condition and Results of Operations |
You should read the following discussion and analysis of our financial condition and results of operations together with our financial statements and the related notes and other financial data included elsewhere in this Annual Report on Form 10-K. Some of the information contained in this discussion and analysis or set forth elsewhere in this Annual Report, including information with respect to our plans and strategy for our business, includes forward-looking statements that involve risks and uncertainties. You should review Item 1A of this Annual Report for a discussion of important factors that could cause actual results to differ materially from the results described in or implied by the forward-looking statements contained in the following discussion and analysis.
Company Overview
We have been in the business of developing, manufacturing, licensing and selling pharmaceutical products that utilize proprietary drug delivery technologies to treat various medical conditions to commercial partners. In September 2013, we acquired Nottingham, U.K. based Molecular Profiles, a pharmaceutical services company. Molecular Profiles provides a range of drug development and consulting services to the pharmaceutical industry and has provided us with an additional revenue source and in-house expertise for internal pharmaceutical programs.
To date we have developed six prescription and “over-the-counter” pharmaceutical products: five BDS vaginal gel products that are indicated for conditions such as vaginal dryness, vaginal pH adjustment, progesterone supplementation as part of fertility treatments, and amenorrhea, and a BDS testosterone buccal system for male hypogonadism. Currently, we receive revenues associated with only one of these products, CRINONE 8% (progesterone gel). We have supplied CRINONE to Merck Serono, internationally, and sold the rights to CRINONE to Actavis in the United States. We routinely evaluate drug candidates to add to our pipeline for clinical development. The next product in development is COL-1077, a sustained release vaginal lidocaine gel, which may be used as an acute use anesthetic for minimally invasive gynecological procedures.
The acquisition of Molecular Profiles provided us with a strong capability in pharmaceutical development and clinical trial manufacturing for our internal programs in addition to the revenue derived from services to third-parties. The main service lines provided by the acquisition include:
| • | Pharmaceutical Development Services – Focused on the early phases of development of small molecule compounds, including, “challenging” compounds that are considered difficult to formulate; |
| • | Clinical Trial Manufacturing Services – Customized manufacturing and packaging for primarily phase I and II clinical trials. Including the manufacturing of tablets, capsules, topicals, dry powder inhaled products (“DPI’s”) and liquids; and |
| • | Advanced Analytical and Consulting Services – Detailed analytical characterization to support pharmaceutical development, troubleshooting process or manufacturing issues, materials characterization, independent consultancy for intellectual property issues, due diligence and for global litigation matters. This includes providing technical opinion, testing and testimony regarding, chemical, formulation, process and device patents. |
We believe the addition of Molecular Profiles has broadened our technical expertise in the field of pharmaceutical development and analytical services.
Our focus is on the following strategic objectives:
| • | supplying CRINONE to our marketing partner, Merck Serono, for sale in over 60 countries around the world; |
34
Table of Contents
| • | advancing COL-1077, an investigational extended-release lidocaine vaginal gel, into clinical development; |
| • | growing our Pharmaceutical Services business; and |
| • | identifying product candidates and building a pipeline of pharmaceutical products focused on women’s health. |
We believe we will be able to generate sufficient cash from operations to execute on our objectives and maintain our strong balance sheet.
Supply of CRINONE
In 2012 and 2013, we sold CRINONE to Merck Serono at a price determined on a country-by-country basis that is the greater of (i) thirty percent (30%) of the net selling price in such country, or (ii) our direct manufacturing cost plus 20%. Certain quantity discounts were applied to annual purchases over 10 million, 20 million, and 30 million units.
In April 2013, our license and supply agreement with Merck Serono for the sale of CRINONE outside the U.S. was renewed for an additional five year term, extending the expiration date from May 19, 2015 to May 19, 2020.
Under the terms of the amended license and supply agreement, we will continue to sell CRINONE to Merck Serono on a country-by-country basis at the greater of (i) cost plus 20% or (ii) a percentage of Merck Serono’s net selling price. From 2014 through 2020, the percentage of net selling price will be determined based on a tiered structure. As sales volumes increase our percentage of incremental sales will decrease. These thresholds have been agreed to in order to incentivize Merck Serono to continue to develop existing markets and to enter new markets. Additionally, the parties will jointly cooperate to evaluate and implement manufacturing cost reduction measures, with both parties sharing any reductions realized from these initiatives. If, at the end of the supply term, the parties cannot agree upon mutually acceptable terms for renewal of the supply arrangement, Merck Serono may elect to retain a license to the product and will have an irrevocable fully paid up license to the product.
All of our products are manufactured in Europe by third parties on behalf of our foreign subsidiaries who sell the products to our worldwide licensees, and to us, in the case of products supplied for resale in the United States prior to November 2013. Because our foreign subsidiaries recognize these sales and only its associated product manufacturing costs, we have historically shown a profit from our foreign operations. Earlier this year, we completed the transfer of operations and quality management of CRINONE to our Nottingham site, resulting in annual savings of approximately $0.4 million in manufacturing costs.
From July 2010 to November 2013 we manufactured and sold products to Actavis at our cost plus 10%; the revenues generated from these sales were recorded within product revenues from a related party. In advance of our filing of an NDA for FDA approval of 8% progesterone gel for use in the prevention of preterm birth in women with premature cervical shortening in 2012 and during the NDA review period, Actavis’ built up inventory to sufficient quantities for a planned commercial launch. After the FDA’s denial of both our application and Actavis’ subsequent appeal, Actavis decided not to continue development of the proposed indication. Since Actavis had sufficient inventories of CRINONE there were no orders in 2013. In November 2013, we entered into an early termination of our exclusive supply agreement with Actavis. The early termination of the agreement, which would have otherwise terminated in May 2015, provided for us to receive a one-time payment as a termination fee as well as payment for all raw materials purchased by us to meet forecast requirements. Pursuant to the Purchase and Collaboration Agreement, we will continue to be eligible to receive royalties until July 2, 2020 equal to a minimum of 10% of annual net sales by Actavis for annual net sales up to $150 million, 15% for sales above $150 million but less than $250 million, and 20% for annual net sales of $250 million and over.
35
Table of Contents
In August 2014, Lil’ Drug Store Products exercised its option to purchase the intellectual property rights and technology related to Legatrin P.M. The Company licensed this product to Lil Drug Store Products previously and had received annual royalties. Based on a predetermined formula, the Company received approximately $2.2 million from the sale.
Development of COL-1077- Sustained Release Vaginal Lidocaine Gel Program:
COL-1077 is an investigational sustained-release lidocaine vaginal gel, which may be used as an anesthetic for the control of pain associated with minimally invasive gynecological procedures. This program has data from two previous Phase I and Phase II programs and is expected to enter the clinical phase in 2015. We are leveraging the technical capabilities of our Nottingham site for the development and clinical trial manufacturing of this product candidate and intend to utilize external contract research organizations for clinical development support.
Pharmaceutical Development Services:
During 2014 we expanded our enabling technologies to our pharmaceutical services offering that facilitate the development of difficult-to-progress molecules and expanded our business development activities.
| • | In April 2014, we completed the purchase of hot melt extrusion (HME) technology along with further milling equipment, enabling us to accelerate formulation development for our clients. |
| • | In October 2014, we unveiled the ROADMAP to Clinical Trial platform which provides our clients a streamlined pathway to the clinic. This new enabling technology screening platform aims to support companies with the rapid development of both standard and complex drug products. |
| • | We have also initiated business development activities in the United States market to expand our presence in that large market of pharmaceutical customers. |
Workforce Reduction and Corporate Office Relocation
In March 2012, the Company announced a 42% workforce reduction from 24 employees at December 31, 2011 to 14 employees, resulting in a severance charge of approximately $1.4 million for the year ended December 31, 2012. The reduction impacted research and development and general and administrative positions.
During the year ended December 31, 2013, we relocated our corporate facilities from Livingston, New Jersey to Boston, Massachusetts. In March 2013, we entered into a lease agreement for our new facilities in Boston. The new lease has provided a significant cost saving to the Company as compared to our lease in Livingston, which expired in October 2013. We incurred a charge of $0.7 million for the year ended December 31, 2013, related to severance and other relocation costs associated with the elimination of certain positions at the Livingston location.
Revenues
We generate revenues primarily from the sale of our products and services and from a royalty stream and certain other revenues. During the year ended December 31, 2014, we derived approximately 54% of our revenues from the sale of our products, 27% from the sale of our services and 19% from our royalty stream and certain other revenues. During the year ended December 31, 2013, we derived approximately 73% of our revenues from the sale of our products, 13% from the sale of our services and 14% of our revenues from royalty stream and certain other revenues. During the year ended December 31, 2012, we derived approximately 86% of our revenues from the sale of our products and 14% of our revenues from royalty stream and certain other revenues. Generally, we recognize revenues from the sales of our products upon delivery to our customers and revenues from service as the work is performed.
36
Table of Contents
We sell our products directly to our partner Merck Serono and use a sales force to sell our services worldwide. During the years ended December 31, 2014, 2013 and 2012, we derived 68%, 81% and 67% of our total revenues, respectively, from sales outside North America.
Our services business is supported by sales and business development activities by both company executives and a dedicated business development team. At December 31, 2014, we had three dedicated sales employees based in the United Kingdom covering territories worldwide and in January 2015, we filled an open position for a U.S. based sales employee. A technical support team, that covers the scientific aspects of customer programs, supports this sales team.
We expect that future recurring revenues will be derived from product sales to Merck Serono, a royalty stream from Actavis and from offering pharmaceutical development, clinical trial manufacturing, and analytical and consulting services. Quarterly sales results can vary widely and affect comparisons with prior periods because (i) products shipped to Merck Serono occur only in full batches, and may not correlate to Merck Serono’s in-market sales and (ii) service revenues are driven by obtaining and retaining our customer contracts, which may vary widely from quarter to quarter.
Cost of Product Revenues
Our cost of product revenues consists primarily of material, labor, consulting, manufacturing overhead expenses, cost of components and subassemblies supplied by third party suppliers. Cost of revenues also includes depreciation expense for certain equipment used for the manufacturing of our products.
Cost of Service Revenues
Our cost of service revenues consists primarily of labor, consulting, overhead expenses associated with the production and service projects undertaken by our scientists and laboratory employees. Cost of service revenues also includes depreciation expense for the utilization of manufacturing and laboratory equipment and facilities and amortization expense for developed technology, an intangible asset identified as a part of the Molecular Profiles acquisition.
Sales and Marketing Expenses
Our sales and marketing expenses consist of costs including personnel and other administrative costs associated with employees directly focused on sales and marketing activities for our services business. There were no sales and marketing costs in 2012.
Research and Development Expenses
Research and development expenses include costs for product and clinical development, which were a combination of internal and third-party costs, and regulatory fees. There were no research and development expenses in 2013 because we eliminated our research and development activities as part of our workforce reduction and office relocation. In 2014, we resumed research and development activities for COL-1077, a sustained-release vaginal lidocaine gel for which the target indication is an acute use anesthetic for minimally invasive gynecological procedures. In 2015, we expect our research and development expenses to increase significantly as a percentage of revenue as a result of our further research and development efforts related to COL-1077.
Acquisition-Related Expenses
Our acquisition-related expenses for 2013 were costs associated with our acquisition of Molecular Profiles as well as a failed transaction in 2013. We did not incur any acquisition-related expenses in 2014.
37
Table of Contents
General and Administrative Expenses
General and administrative costs include payroll, employee benefits, equity compensation, and other personnel-related costs associated with administrative and support staff, as well as legal costs, insurance costs, bad debt expense and other administrative fees. In 2012, general and administrative expenses also included the one-time charge of $0.9 million for the write-down of certain assets due to the determination that certain capacity was no longer needed at Maropack, one of our contract manufacturers.
Interest Income (Expense), net
Historically interest income consists primarily of interest earned on our short-term marketable securities consisting of U.S. Treasury and agency securities. In 2013, the company sold its short-term marketable securities. Subsequent interest income is derived from interest bearing bank accounts. Interest expense consists of interest payments associated with the debt assumed as a part of the acquisition of Molecular Profiles. The debt assumed is secured by a mortgage on the facilities that we own in Nottingham.
Change in the Fair Value of Common Stock Warrants
We account for our warrants in accordance with “ASC 815-40” Accounting for Derivative Financial Instruments Indexed to and Potentially Settled in a Company’s Own Stock,” which requires warrants to be classified as permanent equity, temporary equity or as assets or liabilities. Our warrants are classified as liabilities because they include a provision that specifies that we must deliver freely tradable shares upon exercise by the warrant holder. Because there are circumstances, irrespective of likelihood that they may not be within our control, that could prevent delivery of registered shares, ASC 815-40 requires the warrants be recorded as a liability at fair value, with subsequent changes in fair value recorded as income or expense in our Consolidated Statements of Operations. The fair value of our warrants is determined using a Black-Scholes option pricing model, and is affected by changes in inputs to that model including our stock price, expected stock price volatility and contractual term. At December 31, 2014 the value of common stock warrants was $0.
Other Income (Expense), net
Other income (expense), net consists primarily of foreign currency re-measurement gains or losses and other miscellaneous income and expense items.
Provision for Income Taxes
The Company operates in multiple countries and has evaluated the need for a valuation allowance on a separate jurisdiction basis. Valuation allowances are provided if, based on the weight of available evidence, it is more-likely-than-not that some or all of the deferred tax assets will not be realized. In the fourth quarter of 2014, it was determined that the utilization of our tax loss carryforwards in the United Kingdom was not likely to be realized based on updated forecasts and projections of product development efforts the Company is beginning to undertake. Consequently, we have recorded a full valuation allowance against our net deferred tax assets in that jurisdiction, resulting in deferred tax expense of $0.5 million in 2014.
We will continue to monitor the need for valuation allowances in each jurisdiction, and may adjust our positions in the future based on actual results.
38
Table of Contents
Results of Operations
Years Ended December 31, 2014 and 2013
The following tables contain selected statement of operations information, which serves as the basis of the discussion surrounding our results of operations for the years ended December 31, 2014 and 2013 (in thousands):
| Year Ended December 31, |
||||||||||||||||||||||||
| 2014 | 2013 | |||||||||||||||||||||||
| Amount | As a % of Total Revenues |
Amount | As a % of Total Revenues |
$ Change |
% Change |
|||||||||||||||||||
| Product revenues |
$ | 17,381 | 54 | % | $ | 21,336 | 73 | % | $ | (3,955 | ) | (19 | )% | |||||||||||
| Service revenues |
8,770 | 27 | 3,640 | 13 | 5,130 | 141 | ||||||||||||||||||
| Royalties |
6,313 | 19 | 3,831 | 13 | 2,482 | 65 | ||||||||||||||||||
| Other revenues |
— | — | 419 | 1 | (419 | ) | (100 | ) | ||||||||||||||||
|
|
|
|
|
|
|
|
|
|
|
|
|
|||||||||||||
| Total revenues |
32,464 | 100 | 29,226 | 100 | 3,238 | 11 | ||||||||||||||||||
| Cost of product revenues |
10,470 | 32 | 10,903 | 37 | (433 | ) | (4 | ) | ||||||||||||||||
| Cost of service revenues |
7,219 | 22 | 2,347 | 8 | 4,872 | 208 | ||||||||||||||||||
|
|
|
|
|
|
|
|
|
|
|
|
|
|||||||||||||
| Total cost of revenues |
17,689 | 54 | 13,250 | 45 | 4,439 | 34 | ||||||||||||||||||
| Gross profit |
14,775 | 46 | 15,976 | 55 | (1,201 | ) | (8 | ) | ||||||||||||||||
| Operating expenses: |
||||||||||||||||||||||||
| Sales and marketing |
1,708 | 5 | 439 | 2 | 1,269 | 289 | ||||||||||||||||||
| Research and development |
663 | 2 | — | — | 663 | 100 | ||||||||||||||||||
| Acquisition-related expenses |
— | — | 1,623 | 6 | (1,623 | ) | (100 | ) | ||||||||||||||||
| General and administrative |
8,589 | 26 | 8,039 | 28 | 550 | 7 | ||||||||||||||||||
|
|
|
|
|
|
|
|
|
|
|
|
|
|||||||||||||
| Total operating expenses |
10,960 | 34 | 10,101 | 35 | 859 | 9 | ||||||||||||||||||
|
|
|
|
|
|
|
|
|
|
|
|
|
|||||||||||||
| Income from operations |
3,815 | 12 | 5,875 | 20 | (2,060 | ) | (35 | ) | ||||||||||||||||
| Interest (expense) income, net |
(118 | ) | — | 71 | — | (189 | ) | (266 | ) | |||||||||||||||
| Change in fair value of common stock warrant liability |
379 | 1 | 794 | 3 | (415 | ) | (52 | ) | ||||||||||||||||
| Other income (expense), net |
302 | 1 | (14 | ) | — | 316 | 2,257 | |||||||||||||||||
|
|
|
|
|
|
|
|
|
|
|
|
|
|||||||||||||
| Income before income taxes |
4,378 | 13 | 6,726 | 23 | (2,348 | ) | (35 | ) | ||||||||||||||||
| Provision for income taxes |
988 | 3 | 22 | — | 966 | 4,391 | ||||||||||||||||||
|
|
|
|
|
|
|
|
|
|
|
|
|
|||||||||||||
| Net income |
$ | 3,390 | 11 | % | $ | 6,704 | 23 | % | $ | (3,314 | ) | (49 | )% | |||||||||||
|
|
|
|
|
|
|
|
|
|
|
|
|
|||||||||||||
Revenues
| Year Ended December 31, |
$ Change |
% Change |
||||||||||||||
| 2014 | 2013 | |||||||||||||||
| Product revenues |
$ | 17,381 | $ | 21,336 | $ | (3,955 | ) | (19 | )% | |||||||
| Service revenues |
8,770 | 3,640 | 5,130 | 141 | ||||||||||||
| Royalties |
6,313 | 3,831 | 2,482 | 65 | ||||||||||||
| Other revenues |
— | 419 | (419 | ) | (100 | ) | ||||||||||
|
|
|
|
|
|
|
|
|
|||||||||
| Total revenues |
$ | 32,464 | $ | 29,226 | $ | 3,238 | 11 | % | ||||||||
|
|
|
|
|
|
|
|
|
|||||||||
39
Table of Contents
Revenues for the year ended December 31, 2014 increased by $3.2 million, or 11%, as compared to the year ended December 31, 2013. The increase was primarily attributable to the following factors by segment:
Product
| • | Revenues from the sale of products decreased by approximately $4.0 million, or 19%, from the 2013 period primarily due to reduced shipments of CRINONE in the year ended December 31, 2014 to one of Merck Serono’s higher-volume, higher margin markets during a routine license renewal in that market. |
| • | Royalty revenues increased $2.5 million, or 65%, for the year ended December 31, 2014 as compared to the year ended December 31, 2013 driven by the one-time benefit of $2.2 million from the sale of intellectual property rights and technology for Legatrin P.M. to Lil’ Drug Store and higher sales of progesterone products by Actavis. Royalty revenue associated with Legatrin P.M. in the 2013 period was $0.4 million as compared with $0.2 million in the 2014 period prior to the sale. Due to the sale of the intellectual property rights of Legatrin P.M., we no longer expect any further revenues from this royalty stream. |
| • | Other revenues in the year ended December 31, 2013 primarily relate to a one-time payment associated with the termination of the supply agreement with Actavis in the fourth quarter of 2013. There were no other revenues for the year ended December 31, 2014. |
Service
| • | Service revenues from our pharmaceutical development, clinical trial manufacturing, consulting and analytic services business increased approximately $5.1 million in the 2014 period compared to 2013. Our acquisition of Molecular Profiles was completed in September 2013, resulting in three and a half months of service revenue in the 2013 period compared to a full year in 2014. |
Cost of revenues
| Year Ended December 31, |
$ Change |
% Change |
||||||||||||||
| 2014 | 2013 | |||||||||||||||
| Cost of product revenues |
$ | 10,470 | $ | 10,903 | $ | (433 | ) | (4 | )% | |||||||
| Cost of service revenues |
7,219 | 2,347 | 4,872 | 208 | ||||||||||||
|
|
|
|
|
|
|
|
|
|||||||||
| Total cost of revenues |
$ | 17,689 | $ | 13,250 | $ | 4,439 | 34 | % | ||||||||
|
|
|
|
|
|
|
|
|
|||||||||
| Total cost of revenues (as a percentage of total revenues) |
54 | % | 45 | % | ||||||||||||
| Product gross margin |
56 | % | 57 | % | ||||||||||||
| Service gross margin |
18 | % | 36 | % | ||||||||||||
Total cost of revenues were $17.7 million and $13.3 million for the years ended December 31, 2014 and 2013, respectively. Cost of product revenues decreased due to a 2% reduction in units shipped in the 2014 period as compared to the 2013 period. Cost of service revenues consist mainly of personnel costs, external consultant fees, depreciation and materials used in connection with generating our service revenues. The increase in total cost of revenues in 2014 was driven by a full-year of service costs for our Nottingham operations versus a shortened period in 2013. Product gross margin decreased in 2014 as compared to 2013 due to reduced shipments of CRINONE to one of Merck Serono’s higher-volume higher margin markets during a routine license renewal in the market. Service gross margin decreased in 2014 as compared to 2013 due to a change in mix of revenue type within the service segment. 2013 had a higher concentration of clinical trial manufacturing revenue that generally carries a higher margin.
40
Table of Contents
Sales and marketing
| Year Ended December 31, |
$ Change |
% Change |
||||||||||||||
| 2014 | 2013 | |||||||||||||||
| Sales and marketing |
$ | 1,708 | $ | 439 | $ | 1,269 | 289 | % | ||||||||
| Sales and marketing (as a percentage of total revenues) |
5 | % | 2 | % | ||||||||||||
Sales and marketing expenses incurred during the year ended December 31, 2014 and 2013 represented the sales and marketing activities associated with our services offerings, which we acquired in September 2013 with our acquisition of Molecular Profiles. These expenses consist of personnel costs for our sales force as well as marketing costs consisting of tradeshows and conference fees. The increase was attributable to having a full year of service revenues in 2014 compared to three and one-half months in 2013.
Research and development
| Year Ended December 31, |
$ Change |
% Change |
||||||||||||||
| 2014 | 2013 | |||||||||||||||
| Research and development |
$ | 663 | $ | — | $ | 663 | 100 | % | ||||||||
| Research and development (as a percentage of total revenues) |
2 | % | — | % | ||||||||||||
Research and development costs incurred during the year ended December 31, 2014 were primarily attributable to activities associated with COL-1077. These costs mainly consist of personnel-related expenses for employees directly involved in product development as well as professional service consultants. There were no research and development expenses in the year ended December 31, 2013. As we continue to advance COL-1077 and other potential proprietary product programs, we expect corresponding increases in research and development costs for the foreseeable future.
Acquisition-related expenses
| Year Ended December 31, |
$ Change |
% Change |
||||||||||||||
| 2014 | 2013 | |||||||||||||||
| Acquisition-related expenses |
$ | — | $ | 1,623 | $ | (1,623 | ) | (100 | )% | |||||||
| Acquisition-related expenses (as a percentage of total revenues) |
— | % | 6 | % | ||||||||||||
There were no acquisition-related expenses during the year ended December 31, 2014. Acquisition-related expenses for the year ended December 31, 2013 primarily related to legal fees, accounting services and other transaction costs associated with our acquisition of Molecular Profiles in September 2013, as well as the costs associated with a failed transaction in the 2013 period.
General and administrative
| Year Ended December 31, |
$ Change |
% Change |
||||||||||||||
| 2014 | 2013 | |||||||||||||||
| General and administrative |
$ | 8,589 | $ | 8,039 | $ | 550 | 7 | % | ||||||||
| General and administrative (as a percentage of total revenues) |
26 | % | 28 | % | ||||||||||||
41
Table of Contents
General and administrative expenses increased by $0.6 million to $8.6 million for the year ended December 31, 2014, compared with $8.0 million for the year ended December 31, 2013. This increase mainly relates to costs associated with certain organizational charges in addition to administrative costs related to our facility in the U.K., which we acquired in September 2013.
Non-operating income and expense
| Year Ended December 31, |
$ Change |
% Change |
||||||||||||||
| 2014 | 2013 | |||||||||||||||
| Interest (expense) income, net |
$ | (118 | ) | $ | 71 | $ | (189 | ) | (266 | )% | ||||||
| Change in fair value of common stock warrant liability |
$ | 379 | $ | 794 | $ | (415 | ) | (52 | )% | |||||||
| Other income (expense), net |
$ | 302 | $ | (14 | ) | $ | 316 | 2,257 | % | |||||||
The decrease in interest (expense) income, net, primarily relates to interest paid in the 2014 period on the debt assumed in connection with the Molecular Profiles acquisition, compared to the realized gain recognized on the sale of our marketable securities during the 2013 period. The debt assumed is secured by a mortgage on the facilities in Nottingham, U.K.
The income of $0.4 million associated with the change in fair value of our common stock warrant liability is related to the 2009 stock and warrant issuance and resulted from the stabilization of the volatility rate used in our Black-Scholes model as the warrants approach their expiration in April 2015. The income of $0.8 million associated with the change in fair value of stock warrants for the year ended December 31, 2013 resulted from a stabilization of the volatility rate used in our Black-Scholes model as the warrants approach their expiration date.
Other income (expense), net, for the year ended December 31, 2014 increased primarily due to income associated with the Regional Growth Fund recognized in 2014; offset partially by, net foreign currency transaction losses related to the strengthening of the euro and the British pound against the U.S. dollar in 2013.
Provision for income taxes
| Year Ended December 31, |
$ Change |
% Change |
||||||||||||||
| 2014 | 2013 | |||||||||||||||
| Provision for income taxes |
$ | 988 | $ | 22 | $ | 966 | 4,391 | % | ||||||||
| Provision for income taxes (as a percentage of income before income taxes) |
23 | % | 0.3 | % | ||||||||||||
In the fourth quarter of 2014, we determined that the utilization of our tax loss carryforwards in the United Kingdom was not likely to be realized. This was due to updated forecasts and projections on product development efforts the Company is beginning to undertake. Consequently, we have recorded a full valuation allowance against our net deferred tax assets in this jurisdiction, resulting in deferred tax expense of $0.5 million. The remainder of our 2014 tax expense represents federal alternative minimum tax, state minimum taxes owed, and a one-time clawback provision under a New Jersey Economic Development Authority program relating to the sale of our state net operating losses. The 2013 tax expense represents state minimum tax expenses. Currently, we have a full valuation allowance offsetting our net domestic deferred tax asset.
42
Table of Contents
Years Ended December 31, 2013 and 2012
The following tables contain selected statement of operations information, which serves as the basis of the discussion surrounding our results of operations for the years ended December 31, 2013 and 2012 (in thousands):
| Year Ended December 31, |
||||||||||||||||||||||||
| 2013 | 2012 | |||||||||||||||||||||||
| Amount | As a % of Total Revenues |
Amount | As a % of Total Revenues |
$ Change |
% Change |
|||||||||||||||||||
| Product revenues |
$ | 21,336 | 73 | % | $ | 22,230 | 86 | % | $ | (894 | ) | (4 | )% | |||||||||||
| Service revenues |
3,640 | 13 | — | — | 3,640 | 100 | ||||||||||||||||||
| Royalties |
3,831 | 13 | 3,460 | 13 | 371 | 11 | ||||||||||||||||||
| Other revenues |
419 | 1 | 138 | 1 | 281 | 204 | ||||||||||||||||||
|
|
|
|
|
|
|
|
|
|
|
|
|
|||||||||||||
| Total revenues |
29,226 | 100 | 25,828 | 100 | 3,398 | 13 | ||||||||||||||||||
| Cost of product revenues |
10,903 | 37 | 12,788 | 50 | (1,885 | ) | (15 | ) | ||||||||||||||||
| Cost of service revenues |
2,347 | 8 | — | — | 2,347 | 100 | ||||||||||||||||||
|
|
|
|
|
|
|
|
|
|
|
|
|
|||||||||||||
| Total cost of revenues |
13,250 | 45 | 12,788 | 50 | 462 | 4 | ||||||||||||||||||
| Gross profit |
15,976 | 55 | 13,040 | 50 | 2,936 | 23 | ||||||||||||||||||
| Operating expenses: |
||||||||||||||||||||||||
| Sales and marketing |
439 | 2 | — | — | 439 | 100 | ||||||||||||||||||
| Research and development (net of reimbursement from related party: 2012 – $435 |
— | — | 771 | 3 | (771 | ) | (100 | ) | ||||||||||||||||
| Acquisition-related expenses |
1,623 | 6 | — | — | 1,623 | 100 | ||||||||||||||||||
| General and administrative |
8,039 | 28 | 9,460 | 37 | (1,421 | ) | (15 | ) | ||||||||||||||||
|
|
|
|
|
|
|
|
|
|
|
|
|
|||||||||||||
| Total operating expenses |
10,101 | 35 | 10,231 | 40 | (130 | ) | (1 | ) | ||||||||||||||||
|
|
|
|
|
|
|
|
|
|
|
|
|
|||||||||||||
| Income from operations |
5,875 | 20 | 2,809 | 11 | 3,066 | 109 | ||||||||||||||||||
| Interest income, net |
71 | — | 238 | 1 | (167 | ) | (70 | ) | ||||||||||||||||
| Change in fair value of common stock warrant liability |
794 | 3 | 6,995 | 27 | (6,201 | ) | (89 | ) | ||||||||||||||||
| Other expense, net |
(14 | ) | — | (122 | ) | — | 108 | (89 | ) | |||||||||||||||
|
|
|
|
|
|
|
|
|
|
|
|
|
|||||||||||||
| Income before income taxes |
6,726 | 23 | 9,920 | 38 | (3,194 | ) | (32 | ) | ||||||||||||||||
| Provision for income taxes |
22 | — | 3 | — | 19 | 633 | ||||||||||||||||||
|
|
|
|
|
|
|
|
|
|
|
|
|
|||||||||||||
| Net income |
$ | 6,704 | 23 | % | $ | 9,917 | 38 | % | $ | (3,213 | ) | (32 | )% | |||||||||||
|
|
|
|
|
|
|
|
|
|
|
|
|
|||||||||||||
Revenues
| Year Ended December 31, |
$ Change |
% Change |
||||||||||||||
| 2013 | 2012 | |||||||||||||||
| Product revenues |
$ | 21,336 | $ | 22,230 | $ | (894 | ) | (4 | )% | |||||||
| Service revenues |
3,640 | — | 3,640 | 100 | ||||||||||||
| Royalties |
3,831 | 3,460 | 371 | 11 | ||||||||||||
| Other revenues |
419 | 138 | 281 | 204 | ||||||||||||
|
|
|
|
|
|
|
|
|
|||||||||
| Total revenues |
$ | 29,226 | $ | 25,828 | $ | 3,398 | 13 | % | ||||||||
|
|
|
|
|
|
|
|
|
|||||||||
43
Table of Contents
Revenues for the year ended December 31, 2013 increased by $3.4 million, or 13%, as compared to the year ended December 31, 2012. The increase was primarily attributable to the following factors by segment:
Product
| • | Revenues from the sale of products decreased by approximately $0.9 million, or 4%, from the 2012 period primarily due to the absence of product revenues from Actavis in the year ended December 31, 2013 as compared with $4.3 million in the year ended December 31, 2012 due to sufficient inventory on hand at Actavis in 2013 and the termination of the supply agreement in the fourth quarter of 2013. This was offset by higher revenues from Merck Serono in the year ended December 31, 2013 attributable to a 24% increase in volume year-over-year. |
| • | Royalty revenues increased $0.4 million, or 11%, for the year ended December 31, 2013 as compared to the year ended December 31, 2012 driven by higher sales of progesterone products by Actavis. |
| • | Other revenues in the year ended December 31, 2013, increased by $0.3 million primarily due to a one-time payment associated with the termination of the supply agreement with Actavis in the fourth quarter of 2013. |
Service
| • | Service revenues of $3.6 million in the 2013 period were from the pharmaceutical development, clinical trial manufacturing, consulting and analytic services offered by our wholly-owned subsidiary Molecular Profiles, which was acquired in September 2013. |
Cost of revenues
| Year Ended December 31, |
$ Change |
% Change |
||||||||||||||
| 2013 | 2012 | |||||||||||||||
| Cost of product revenues |
$ | 10,903 | $ | 12,788 | $ | (1,885 | ) | (15 | )% | |||||||
| Cost of service revenues |
2,347 | — | 2,347 | 100 | ||||||||||||
|
|
|
|
|
|
|
|
|
|||||||||
| Total cost of revenues |
$ | 13,250 | $ | 12,788 | $ | 462 | 4 | % | ||||||||
|
|
|
|
|
|
|
|
|
|||||||||
| Total cost of revenues (as a percentage of total revenues) |
45 | % | 50 | % | ||||||||||||
| Product gross margin |
57 | % | 50 | % | ||||||||||||
| Service gross margin |
36 | % | — | |||||||||||||
Total cost of revenues were $13.3 million and $12.8 million for the years ended December 31, 2013 and 2012, respectively. Cost of product revenues decreased due to a more favorable sales mix, which was partially offset by the cost of service revenues comprised mainly of depreciation and amortization, labor and other materials purchased associated with the services offered by Molecular Profiles. Product gross margin increased 7% in 2013 as compared to 2012 due to the absence of shipments to Actavis, which carries a significant lower margin. Service gross margin was 36%, which relates to the service revenues associated with the acquisition of Molecular Profiles in September 2013.
Sales and marketing
| Year Ended December 31, |
$ Change |
% Change |
||||||||||||||
| 2013 | 2012 | |||||||||||||||
| Sales and marketing |
$ | 439 | $ | — | $ | 439 | 100 | % | ||||||||
| Sales and marketing (as a percentage of total revenues) |
2 | % | — | % | ||||||||||||
44
Table of Contents
Sales and marketing expenses incurred during the year ended December 31, 2013 are attributable to the sales activities of Molecular Profiles, acquired in September 2013.
Research and development
| Year Ended December 31, |
$ Change |
% Change |
||||||||||||||
| 2013 | 2012 | |||||||||||||||
| Research and development |
$ | — | $ | 771 | $ | (771 | ) | (100 | )% | |||||||
| Research and development (as a percentage of total revenues) |
— | % | 3 | % | ||||||||||||
There were no research and development expenses in the year ended December 31, 2013 because we had eliminated our research and development activities. Research and development expenses of $0.8 million in 2012 included costs for product development, clinical development and regulatory fees, which were a combination of internal and third-party costs.
Acquisition-related expenses
| Year Ended December 31, |
$ Change |
% Change |
||||||||||||||
| 2013 | 2012 | |||||||||||||||
| Acquisition-related expenses |
$ | 1,623 | $ | — | $ | 1,623 | 100 | % | ||||||||
| Acquisition-related expenses (as a percentage of total revenues) |
6 | % | — | % | ||||||||||||
Total acquisition-related expenses of $1.6 million in 2013 were costs associated with the Molecular Profiles acquisition and a failed transaction in the 2013 period. These costs were primarily made up of legal costs, accounting fees and other professional fees.
General and administrative
| Year Ended December 31, |
$ Change |
% Change |
||||||||||||||
| 2013 | 2012 | |||||||||||||||
| General and administrative |
$ | 8,039 | $ | 9,460 | $ | (1,421 | ) | (15 | )% | |||||||
| General and administrative (as a percentage of total revenues) |
28 | % | 37 | % | ||||||||||||
General and administrative expenses decreased by $1.4 million to $8.0 million for the year ended December 31, 2013, compared with $9.5 million for the year ended December 31, 2012. This decrease is due to lower personnel costs associated with the workforce reduction in January 2013. In addition, the 2012 period included a one-time expense of $0.9 million for the write-down of certain assets.
Non-operating income and expense
| Year Ended December 31, |
$ Change |
% Change |
||||||||||||||
| 2013 | 2012 | |||||||||||||||
| Interest income, net |
$ | 71 | $ | 238 | $ | (167 | ) | (70 | )% | |||||||
| Change in fair value of common stock warrant liability |
$ | 794 | $ | 6,995 | $ | (6,201 | ) | (89 | )% | |||||||
| Other expense, net |
$ | (14 | ) | $ | (122 | ) | $ | 108 | (89 | )% | ||||||
45
Table of Contents
The decrease in interest income, net primarily relates to the realized gain on the sale of our marketable securities during the 2013 period offset partially by interest expense associated with the debt assumed as a part of the acquisition of Molecular Profiles in September 2013. The debt assumed is secured by a mortgage on the facilities that are owned in Nottingham, United Kingdom.
The income of $0.8 million associated with the change in fair value of stock warrants for the year ended December 31, 2013 is related to the October 2009 stock and warrant issuance and resulted from an stabilization of the volatility rate used in our Black-Scholes model as the warrants approach their expiration date. The change in fair value of stock warrants for the year ended December 31, 2012 resulted in $7.0 million in income associated with a decrease in our stock price during 2012.
Other expense, net, for the year ended December 31, 2013 decreased primarily due to lower net foreign currency transaction losses related to the strengthening of the euro and the British pound against the U.S. dollar in 2013 as compared with 2012.
Provision for income taxes
| Year Ended December 31, |
$ Change |
% Change |
||||||||||||||
| 2013 | 2012 | |||||||||||||||
| Provision for income taxes |
$ | 22 | $ | 3 | $ | 19 | 633 | % | ||||||||
| Provision as a percentage of income before provision for income taxes |
0.3 | % | 0.03 | % | ||||||||||||
The difference in our effective tax rate between the years ended December 31, 2013 and 2012 of 0.3% and 0.03%, respectively, is due to the foreign tax expense in 2013 and state true-up adjustments in 2012. The 2013 effective tax rate represents state minimum taxes owed and foreign tax expense calculated on the investment in a foreign subsidiary. All other items are offset by tax net operating loss carryforwards, which are carried with a full valuation allowance.
Liquidity and Capital Resources
We require cash to fund operating expenses and working capital needs, finance research and development and product development efforts, make capital expenditures and fund acquisitions.
At December 31, 2014, our cash and cash equivalents were $16.8 million. Our cash and cash equivalents are highly liquid investments with original maturities of 90 days or less at date of purchase, and consist of cash in operating accounts.
In March 2014 we acquired all of our common stock that was beneficially owned by Actavis at that time, which represented 11.5% of our outstanding common stock. Immediately following the closing of the stock repurchase and as of December 2014, Actavis did not own any of our outstanding common stock. We purchased the 1.4 million shares held by Actavis at a price of $6.08 per share, which represented a 10.75% discount to the market closing price on March 6, 2014. The total purchase price was approximately $8.5 million, which is included in treasury stock at December 31, 2014.
Our future capital requirements depend on a number of factors, including the rate of market acceptance of our current and future services and products and the resources we devote to developing and supporting the same. Our capital expenditures increased for the twelve months ended December 31, 2014, as compared to the twelve months ended December 31, 2013, due primarily to investments in capital equipment made at our Nottingham, U.K. site and our contract manufacturer sites. We expect our capital expenditures to remain consistent in the year
46
Table of Contents
ending December 31, 2015, as compared to the year ended December 31, 2014, primarily due to investments made at the Nottingham site.
Research and development expenses include costs for product and clinical development, which were a combination of internal and third-party costs, and regulatory fees. There were no research and development expenses in 2013 because we eliminated our research and development activities as part of our workforce reduction and office relocation. In 2014, we resumed research and development activities for COL-1077, an investigational sustained-release vaginal lidocaine gel, for which the target indication is an acute use anesthetic for minimally invasive gynecological procedures. In 2015, we expect our research and development expenses to increase as a percentage of revenue as a result of our further research and development efforts related to COL-1077.
As of December 31, 2014, we had 445,684 exercisable options, and 1,124,182 exercisable warrants outstanding which, if exercised, would result in approximately $16.7 million of additional capital and would cause the number of shares outstanding to increase; provided, however, that the cashless exercise feature of certain warrants will result in no cash to us. There can be no assurance that any such options or warrants will be exercised. The intrinsic value of exercisable options for the year ended December 31, 2014 was $14,656. There was no aggregate intrinsic value of warrants at December 31, 2014.
On August 9, 2013, the Company effected a 1-for-8 reverse stock split, which was previously approved by the Board of Directors on July 26, 2013. Our reverse stock split was approved by our stockholders at our annual meeting of stockholders on May 1, 2013. All share and per share amounts relating to the common stock, stock options and warrants included in the financial statements and accompanying footnotes have been retroactively adjusted for all periods presented to give effect to this reverse stock split, including reclassifying an equal amount to the reduction in par value of common stock to additional paid-in capital. The reverse stock split did not result in a retroactive adjustment to the share amounts for any of the classes of our preferred stock.
We believe that our current cash and cash equivalents, as well as cash generated from operations, will be sufficient to meet our anticipated cash needs for working capital, including advancing our product development candidates, and capital expenditures for the foreseeable future.
Cash Flows
Net cash provided by operating activities for the year ended December 31, 2014 was $6.9 million and resulted primarily from $3.4 million of net income for the period, inclusive of a one-time benefit from the sale of intellectual property rights and technology for Legatrin P.M., increased by approximately $2.6 million in depreciation and amortization and stock-based compensation expense, and partially offset by $0.4 million from the change in fair value of stock warrants. Net changes in working capital items increased cash from operating activities by approximately $0.8 million, primarily driven by decreases to accounts receivable from increased collection efforts as well as decreases in accounts payable offset by an increase to prepaid expenses and other assets. Net cash used in investing activities was $2.0 million for the year ended December 31, 2014, which resulted primarily from the purchase of property plant and equipment. Net cash used in financing activities was approximately $8.7 million for the year ended December 31, 2014, primarily relating to the $8.5 million stock buyback from Actavis and $0.2 million of principal payments on notes payable.
Net cash provided by operating activities for the year ended December 31, 2013 was $7.1 million and resulted primarily from $6.7 million of net income for the period, increased by approximately $1.4 million in depreciation and amortization and stock-based compensation expense, and partially offset by $0.8 million from the change in fair value of stock warrants. Net changes in working capital items reduced cash from operating activities by approximately $0.3 million, primarily due to an increase in accounts receivable of $2.4 million associated with increased product shipments and a decrease in accrued expense of $0.8 million, offset by a decrease in amounts due from related party totaling $1.3 million primarily related to the absence of product
47
Table of Contents
shipments to Actavis and a decrease in prepaid expenses and other current assets of $1.4 million. Net cash provided by investing activities was $0.3 million for the year ended December 31, 2013, which resulted primarily from the proceeds from the sale of short-term investments totaling $15.4 million partially offset by the net cash paid for the Molecular Profiles acquisition of $14.5 million and the purchase of property and equipment of $0.5 million. Net cash used in financing activities was $0.1 million for the year ended December 31, 2013, primarily due to $0.1 million of principal payments on notes payable.
Net cash provided by operating activities for the year ended December 31, 2012 was $4.3 million and resulted primarily from $9.9 million of net income for the period, increased by approximately $1.3 million in depreciation and amortization and stock-based compensation expense as well as $1.0 million related to the write-off of certain inventories and $0.9 million for write-down of impaired assets, and decreased by $7.0 million for the change in fair value of stock warrants and $0.6 million from the increase in provision for sales returns. Net changes in working capital items reduced cash from operating activities by $1.1 million, primarily relating to a decrease in accounts payable and accrued expense of $2.7 million and an increase of prepaid expenses and other current assets of $0.6 million partially offset by a decrease of accounts receivable of $1.8 million and other non-current assets of $0.4 million. Net cash used in investing activities for the year ended December 31, 2012 was $1.2 million resulting from the purchase of property and equipment of $1.0 million and the purchase of short-term investments of $0.2 million. Net cash used in financing activities was $0.1 million for the year ended December 31, 2012, due to $0.1 million associated with the redemption of series C convertible preferred stock.
Contractual Obligations
In October 2009, we raised approximately $11.8 million in gross proceeds from the issuance and sale of 1,362,500 shares of our common stock at a price of $8.64 per share and warrants to purchase 681,275 shares of our common stock with an exercise price of $12.16 per share in a registered offering. The warrants became exercisable on April 30, 2010, and expire on April 30, 2015, unless earlier exercised or terminated.
In July 2010, we purchased approximately $40 million in aggregate principal amount of our outstanding Notes. The aggregate purchase price for the Notes was approximately $26 million in cash (plus accrued and unpaid interest through but excluding the date of the closing of the Note purchases), warrants to purchase 968,750 shares of common stock with an exercise price of $10.80 per share and 925,925 shares of our common stock. The warrants issued under the Note Purchase Agreements are exercisable, subject to the limitations set forth therein, until July 2, 2015, unless earlier exercised or terminated as provided in such warrants.
Our significant outstanding contractual obligations relate to operating leases for our facilities that are not owned and debt assumed as a result of the acquisition of Molecular Profiles on September 12, 2013. Our facility leases are non-cancellable and contain renewal options. Our future contractual obligations include the following:
| Total | 1 year or less | 1-3 years | 3-5 years | More than 5 years |
||||||||||||||||
| Operating lease obligations |
$ | 144 | $ | 108 | $ | 36 | $ | — | $ | — | ||||||||||
| Loan principal repayments |
3,532 | 242 | 250 | 257 | 2,783 | |||||||||||||||
|
|
|
|
|
|
|
|
|
|
|
|||||||||||
| Total |
$ | 3,676 | $ | 350 | $ | 286 | $ | 257 | $ | 2,783 | ||||||||||
|
|
|
|
|
|
|
|
|
|
|
|||||||||||
We assumed debt of $3.9 million in connection with our acquisition of Molecular Profiles. Molecular Profiles had entered into a Business Loan Agreement (“Loan Agreement”) covering three loan facilities with Lloyds TSB Bank (“Lloyds”), as administrative agent, to fund the construction and expansion of their facility, which includes analytical labs, office space, and a manufacturing facility in the United Kingdom. Prior to the acquisition, Molecular Profiles had drawn down $3.9 million under the loan facilities and as of December 31, 2014 owes $3.5 million under the Loan Agreement. The three loan facilities are each repayable in monthly installments, that began in February 2013 for one of the facilities and in October 2013 for the other two facilities.
48
Table of Contents
Repayment of the three facilities is scheduled to occur over a 15-year period from the date of drawdown. Two of the facilities bear interest at the Bank of England’s base rate plus 1.95% and 2.55%, respectively. The interest rate at December 31, 2014 for these two facilities was 2.45% and 3.05%, respectively. The third facility is a fixed rate agreement bearing interest at 3.52% per annum. The weighted average interest rate for the three loan facilities for the twelve months ending December 31, 2014 was 3.00%. Borrowings under the Loan Agreement are secured by the mortgaged property and an unlimited lien on other assets of Molecular Profiles. The Loan Agreement contains financial covenants that limit the amount of indebtedness we may incur, requires us to maintain certain levels of net worth, and restricts our ability to materially alter the character of its business. As of December 31, 2014, we remain in compliance with all of the covenants under the Loan Agreement.
As part of the acquisition of Molecular Profiles, we assumed a $2.5 million obligation under a grant arrangement with the Regional Growth Fund on behalf of the Secretary of State for Business, Innovation, and Skills in the United Kingdom. Molecular Profiles used this grant to fund the building of their second facility, which includes analytical labs, office space, and a manufacturing facility. As a part of the arrangement, Molecular Profiles is required to create and maintain certain full-time equivalent personnel levels through October 2017. As of December 31, 2014, we remain in compliance with the covenants of the arrangement.
The income from the Regional Growth Fund will be recognized on a decelerated basis over the next three years. As of December 31, 2014, the obligation is valued at $2.1 million and is recorded as deferred revenue on the consolidated balance sheets. The amount of other income on the obligation that will be recognized provided we remain in compliance with the covenants will be the following:
| Year |
Total | |||
| 2015 |
$ | 559 | ||
| 2016 |
808 | |||
| 2017 |
745 | |||
|
|
|
|||
| Total |
$ | 2,112 | ||
|
|
|
|||
Off-Balance Sheet Arrangements
We do not have any off-balance sheet arrangements.
Critical Accounting Policies and Estimates
The discussion and analysis of our financial condition and results of operations set forth above are based on our financial statements, which have been prepared in accordance with U.S. generally accepted accounting principles, or GAAP. The preparation of these financial statements requires us to make estimates and judgments that affect the reported amounts of assets, liabilities, revenues and expenses. On an ongoing basis, we evaluate our estimates and judgments, including those described below. We base our estimates on historical experience and on various assumptions that we believe to be reasonable under the circumstances. These estimates and assumptions form the basis for making judgments about the carrying values of assets and liabilities, and the reported amounts of revenues and expenses, that are not readily apparent from other sources. Actual results may differ from these estimates under different assumptions or conditions.
We believe the following critical accounting policies require significant judgment and estimates by us in the preparation of our financial statements.
Revenue Recognition
Revenue results are difficult to predict, and any shortfall in revenue or delay in recognizing revenue could cause operating results to vary significantly from quarter to quarter. In addition, revenue recognition determines
49
Table of Contents
the timing of certain expenses. Because products shipped to our one major customer occurs only in full batches and because services provided by our services business are primarily provided under discrete short-term contracts, quarterly sales can vary widely and affect quarter to quarter comparisons. Also product sales may not correlate to our customers’ in-market sales.
Revenues from the sale of products are recorded at the time goods were shipped to customers. We believe we have not made any shipments in excess of our customers’ ordinary course of ordering for certain business inventory levels.
Revenues from our pharmaceutical development services and analytical services business are recorded as multiple-element arrangements and are evaluated in accordance with the principles of Accounting Standards update (“ASU”) 2009-13, (Revenue Recognition Topic – Multiple Element Arrangements) and we allocate revenue among the elements based upon each element’s relative fair value. These amounts are recognized as revenue as the service for each element is performed.
Revenues from the sales of consulting services are recognized on a time and materials basis over the contract period as services are provided. Payments received by Columbia in advance of performance for services are deferred until earned.
Amounts paid but not yet earned on a project are recorded as deferred revenue until such time as performance is rendered or the obligation to perform the service is completed.
When a sale includes performance of multiple services, we allocate revenue derived from each such service to a unit of accounting based on its relative selling price, and recognize revenue for each such unit of accounting when the revenue recognition criteria for such unit have been met. The Company follows the selling price hierarchy as outlined in the guidance Revenue Recognition (ASC Topic 605) – Multiple-Deliverable Revenue Arrangements. The guidance provides a hierarchy to determine the selling price to be used for allocating revenue to deliverables: (i) vendor-specific objective evidence (“VSOE”), (ii) third-party evidence (“TPE”), if available, and when VSOE is not available, and (iii) best estimate of the selling price (“BESP”), if neither VSOE nor TPE is available. We use BESP to determine the standalone selling price for our services. We have a process for developing BESP, which incorporates pricing practices, historical selling prices, and the effect of market conditions as well as entity-specific factors. Estimated selling price is monitored and evaluated on a regular basis to ensure that changes in circumstances are accounted for in a timely manner.
Royalty revenues, based on sales by licensees, are recorded as revenues when those sales are made by the licensees.
License fees are recorded over the life of the license.
Inventories and Allowance for Excess and Obsolescence
We state all inventories at the lower of cost or market value, determined on a first-in, first-out method. We monitor standard costs on a monthly basis and update them annually and as necessary to reflect changes in raw material costs and labor and overhead rates. Our inventory balance as of December 31, 2014 was $3.2 million and as of December 31, 2013 was $2.6 million.
We provide inventory allowances when conditions indicate that the selling price could be less than cost due to physical deterioration, usage, obsolescence, reductions in estimated future demand and reductions in selling prices. We balance the need to maintain strategic inventory levels with the risk of obsolescence due to changing technology and customer demand levels. Unfavorable changes in market conditions may result in a need for additional inventory reserves that could adversely impact our gross margins. Conversely, favorable changes in demand could result in higher gross margins when we sell products. Our inventory allowance as of December 31, 2014 was $36,000 and as of December 31, 2013 was $0.2 million.
50
Table of Contents
Segments
We are engaged in two segments: product and service. Our product segment includes supply chain management for CRINONE, our sole commercialized product. In certain foreign countries, these products may be classified as medical devices or cosmetics by those countries’ regulatory agencies. See Note 12 for information on foreign operations. Our service segment includes pharmaceutical development, clinical trial manufacturing, and advanced analytical and consulting services for our customers as well as characterizing and developing pharmaceutical product candidates for our internal programs. In September 2013, we acquired Molecular Profiles, a U.K.-based provider of pharmaceutical development, clinical trial manufacturing, and advanced analytical and consulting services to the pharmaceutical industry. We have integrated our supply chain management for our sole commercialized product, CRINONE into those operations and have therefore sought to capture synergies by transferring all operational activities related to its historic business.
The Chief Executive Officer, who is the Company’s Chief Operating Decision Maker (CODM), currently manages the business based on the expansion of our revenues and as such have concluded that we are two segments, which consists of product and service. Segment information is consistent with the financial information regularly reviewed by our chief operating decision maker, who we have determined to be the chief executive officer, for purposes of evaluating performance, allocating resources, setting incentive compensation targets, and planning and forecasting future periods. Our chief operating decision maker evaluates the performance of our product and service segments based on gross profit. Our chief operating decision maker does not review our assets, operating expenses or non-operating income and expenses by business segment at this time.
Goodwill
Goodwill represents the excess of the purchase price over the fair value of assets acquired and liabilities assumed in a business combination. We do not amortize our goodwill, but instead test for impairment annually and more frequently whenever events or changes in circumstances indicate that the fair value of the asset may be less than its carrying value of the asset. Our annual test for impairment occurs on the first day in the fourth quarter.
In accordance with Accounting Standards Codification, or ASC 350, Goodwill and Other Intangibles (“ASC 350”), we use the two step approach for each reporting unit. The first step compares the carrying amount of the reporting unit to its estimated fair value (Step 1) utilizing a discounted cash flow analysis based on the present value of estimated future cash flows to be generated using a risk-adjusted discount rate. To the extent that the carrying value of the reporting unit exceeds its estimated fair value, a second step is performed, wherein the reporting unit’s carrying value is compared to the implied fair value (Step 2). To the extent that the carrying value of goodwill exceeds the implied fair value of goodwill, impairment exists and must be recognized.
We have concluded that our business represents two reporting units for goodwill impairment testing, which are product and service. Our goodwill is assigned to our service reporting unit. We have performed our annual test for impairment and have determined that our goodwill is not impaired as of December 31, 2014.
Intangible Assets
We capitalize and include in intangible assets the costs of developed technology, customer relationships and trade names. Intangible assets are recorded at fair value and are stated net of accumulated amortization and impairments. We amortize our intangible assets that have finite lives using either the straight-line or accelerated method, based on the useful life of the asset over which it is expected to be consumed utilizing expected undiscounted future cash flows. Amortization is recorded over the estimated useful lives ranging from three to seven years. We evaluate the realizability of our definite lived intangible assets whenever events or changes in circumstances or business conditions indicate that the carrying value of these assets may not be recoverable
51
Table of Contents
based on expectations of future undiscounted cash flows for each asset group. If the carrying value of an asset or asset group exceeds its undiscounted cash flows, we estimate the fair value of the assets, generally utilizing a discounted cash flow analysis based on the present value of estimated future cash flows to be generated by the assets using a risk adjusted discount rate. To estimate the fair value of the assets, we use market participant assumptions pursuant to ASC 820, Fair Value Measurements. If the estimate of an intangible asset’s remaining useful life is changed, we will amortize the remaining carrying value of the intangible asset prospectively over the remaining useful life.
Sales Returns
Up to July 2013, we were responsible for sales returns for CRINONE and PROCHIEVE products sold prior to the Actavis transaction on July 2, 2010, and for STRIANT products sold prior to the sale of the product to Auxilium in April 2011. We are not and were not responsible for returns for international sales. Our policy for sales to the trade made prior to the Actavis and Auxilium transactions allows product to be returned for a period that began three months prior to the product expiration date and ended twelve months after the product expiration date. Provisions for returns on sales to wholesalers, distributors and retail chain stores were estimated based on a percentage of sales, using such factors as historical sales information, distributor inventory levels and product prescription data, and were recorded as a reduction to sales in the same period as the related sales were recognized. We assumed that our customers were using the first-in, first-out method in filling orders so that the oldest saleable product was used first. We recorded a provision for returns on a quarterly basis using an estimated rate and adjusted the provision when necessary. Currently there is no sales returns reserve as the return rights obligation has elapsed for all products for which Columbia provided a right of return.
Accounting for Fair Value for Common Stock Warrant Liabilities
The estimated fair value of the common stock warrant liability is determined by using the Black-Scholes option pricing model which is based on our stock price at the measurement date, exercise price of the warrant, risk-free rate and historical volatility, and is classified as a Level 2 measurement.
Share-Based Compensation
We recognize compensation expense in accordance with ASC 718, “Share Based Payment” (“ASC 718”), for all stock-based awards made to employees and directors including employee stock options based on estimated fair values. ASC 718 requires companies to estimate the fair value of stock-based awards on the date of grant using an option pricing model. The value of the portion of the award that is ultimately expected to vest is recognized as expense over the requisite service periods in our Consolidated Statements of Operations.
Recent Accounting Pronouncements
In May 2014, the FASB issued Accounting Standards Update No. 2014-09, “Revenue from Contracts with Customers: Topic 606” (ASU 2014-09), to supersede nearly all existing revenue recognition guidance under U.S. GAAP. The core principle of ASU 2014-09 is to recognize revenues when promised goods or services are transferred to customers in an amount that reflects the consideration that is expected to be received for those goods or services. ASU 2014-09 defines a five step process to achieve this core principle and, in doing so, it is possible more judgment and estimates may be required within the revenue recognition process than required under existing U.S. GAAP including identifying performance obligations in the contract, estimating the amount of variable consideration to include in the transaction price and allocating the transaction price to each separate performance obligation.
ASU 2014-09 is effective for us in our first quarter of fiscal 2017 using either of two methods: (i) retrospective to each prior reporting period presented with the option to elect certain practical expedients as
52
Table of Contents
defined within ASU 2014-09; or (ii) retrospective with the cumulative effect of initially applying ASU 2014-09 recognized at the date of initial application and providing certain additional disclosures as defined per ASU 2014-09. We are currently evaluating the impact of our pending adoption of ASU 2014-09 on our consolidated financial statements.
In August 2014, the FASB issued changes to the disclosure of uncertainties about an entity’s ability to continue as a going concern. Under GAAP, continuation of a reporting entity as a going concern is presumed as the basis for preparing financial statements unless and until the entity’s liquidation becomes imminent. Even if an entity’s liquidation is not imminent, there may be conditions or events that raise substantial doubt about the entity’s ability to continue as a going concern. Because there is no guidance in GAAP about management’s responsibility to evaluate whether there is substantial doubt about an entity’s ability to continue as a going concern or to provide related note disclosures, there is diversity in practice whether, when, and how an entity discloses the relevant conditions and events in its financial statements. As a result, these changes require an entity’s management to evaluate whether there are conditions or events, considered in the aggregate, that raise substantial doubt about the entity’s ability to continue as a going concern within one year after the date that financial statements are issued. Substantial doubt is defined as an indication that it is probable that an entity will be unable to meet its obligations as they become due within one year after the date that financial statements are issued. If management has concluded that substantial doubt exists, then the following disclosures should be made in the financial statements: (i) principal conditions or events that raised the substantial doubt, (ii) management’s evaluation of the significance of those conditions or events in relation to the entity’s ability to meet its obligations, (iii) management’s plans that alleviated the initial substantial doubt or, if substantial doubt was not alleviated, management’s plans that are intended to at least mitigate the conditions or events that raise substantial doubt, and (iv) if the latter in (iii) is disclosed, an explicit statement that there is substantial doubt about the entity’s ability to continue as a going concern. These changes become effective for Columbia for the 2016 annual period. Management has determined that the adoption of these changes will not have an impact on the consolidated Financial Statements. Subsequent to adoption, this guidance will need to be applied by management at the end of each annual period and interim period therein to determine what, if any, impact there will be on the consolidated Financial Statements in a given reporting period.
| Item 7A. | Quantitative and Qualitative Disclosures About Market Risks |
Market Rate Risk
We do not believe that we have material exposure to market rate risk. We may, however, require additional financing to fund future obligations and no assurance can be given that the terms of future sources of financing will not expose us to material market risk.
Foreign Currency Exchange
A significant portion of our operations are conducted through operations in countries other than the United States. Revenues from our international operations that were recorded in U.S. dollars represented approximately 66% of our total international revenues during the year ended December 31, 2014. The remaining 34% of our international revenues were in British pounds. Since we conduct our business in U.S. dollars, our main exposure, if any, results from changes in the exchange rate between the British pound and the U.S. dollar. Our policy is to reduce exposure to exchange rate fluctuations by having most of our assets and liabilities, as well as most of our revenues and expenditures, designated in U.S. dollars, or U.S. dollar linked. We have not historically engaged in hedging activities relating to our non-U.S. dollar-based operations. We may be exposed to exchange rate fluctuations that occur from certain intercompany transactions with our subsidiaries, which we recognize as unrealized gains and losses in our statements of operations. Upon settlement of these payments, we may record realized foreign exchange gains and losses. We may incur negative foreign currency translation charges as a result of changes in currency exchange rates.
53
Table of Contents
| Item 8. | Financial Statements and Supplementary Data |
The financial statements and supplementary data required by this item are set forth at the pages indicated in Item 15, set forth in this Annual Report on Form 10-K.
| Item 9. | Changes in and Disagreements with Accountants on Accounting and Financial Disclosure |
Not Applicable.
| Item 9A. | Controls and Procedures |
Evaluation of Disclosure Controls and Procedures
Our management, under the supervision of our Chief Executive Officer and Chief Financial Officer, evaluated the effectiveness of the design and operation of our disclosure controls and procedures as of December 31, 2014. The term “disclosure controls and procedures,” as defined in Rules 13a-15(e) and 15d-15(e) under the Exchange Act, means controls and other procedures of a company that are designed to ensure that information required to be disclosed by us in the reports that we file or submit under the Exchange Act is recorded, processed, summarized and reported within the time periods specified in the SEC’s rules and forms. Disclosure controls and procedures include, without limitation, controls and procedures designed to ensure that information required to be disclosed by us in the reports that we file or submit under the Exchange Act is accumulated and communicated to our management, including our Chief Executive Officer and Chief Financial Officer, as appropriate, to allow timely decisions regarding required disclosure. Based on this evaluation, our Chief Executive Officer and Chief Financial Officer concluded that our disclosure controls and procedures were not effective as of December 31, 2014 at the reasonable assurance level due to the material weakness described below under “Management’s Report on Internal Control over Financial Reporting.” Notwithstanding the existence of the material weakness, management has concluded that the consolidated financial statements included in this report present fairly, in all material respects, our consolidated financial position, results of operations and cash flows for the periods presented in conformity with United States generally accepted accounting principles.
Management’s Annual Report on Internal Control over Financial Reporting
Our management is responsible for establishing and maintaining adequate internal control over financial reporting, as such term is defined in Exchange Act Rules 13a-15(f) and 15d-15(f). Internal control over financial reporting is a process designed to provide reasonable assurance regarding the reliability of financial reporting and the preparation of financial statements for external reporting purposes in accordance with United States generally accepted accounting principles.
Under the supervision and with the participation of our management, including our Chief Executive Officer and Chief Financial Officer, we conducted an evaluation of the effectiveness of our internal control over financial reporting as of December 31, 2014 based on the guidelines established in Internal Control-Integrated Framework issued by the Committee of Sponsoring Organizations of the Treadway Commission (COSO).
In connection with the audit of our consolidated financial statements and management’s assessment of our internal controls over financial reporting at December 31, 2014, we identified a material weakness in our internal control over financial reporting associated with revenue recognition for services transactions and contractual arrangements. This material weakness resulted in the revision of our prior period interim financial statements for the 2014 period and are included in this Annual Report on Form 10-K.
A material weakness is defined as a deficiency, or combination of deficiencies, in internal control over financial reporting such that there is a reasonable possibility that a material misstatement of annual or interim consolidated financial statements will not be prevented or detected on a timely basis.
54
Table of Contents
As a result of the material weakness described above, we have concluded our internal control over financial reporting was not effective at December 31, 2014. We have reviewed the results of our annual assessment with our Audit Committee.
Management’s Remediation Initiatives
With the oversight of senior management and our Audit Committee, we plan to take steps intended to address the underlying causes of the material weakness in the immediate future, primarily through the following:
| • | Staffing: In addition to a realignment of our accounting staff structure and operations, we have added a new revenue accounting specialist position to better ensure compliance with our revenue recognition policies. We have also designed various controls around the review and approval of transactions that impact our judgment on recognizing revenue. |
| • | Policies and procedures: We will be engaging external accounting experts to assist us with enhancing our policies and procedures related to revenue recognition, contracting and other areas reflected in the material weakness. |
| • | Systems: We are currently implementing a series of incremental software solutions to enhance our documentation in critical areas such as revenue recognition. |
| • | Process improvements: We have redesigned specific processes and controls associated with services revenue recognition, including the targeted review and approval of relevant transactions and enhanced monthly closing and reconciliation processes. |
We have not yet been able to remediate this material weakness. We do expect to be able to remediate all of the control deficiencies underlying this material weakness in 2015. In addition, we may need to incur incremental costs associated with this remediation, primarily due to the hiring and training of finance and accounting personnel, and the implementation and validation of improved accounting and financial reporting procedures. As we continue to evaluate and work to improve our internal control over financial reporting, we may determine to take additional measures to address the material weakness.
Changes in Internal Control over Financial Reporting
Other than the changes described above under “Management’s Report on Internal Control over Financial Reporting,” there were no changes in our internal control over financial reporting identified in connection with the evaluation required by paragraph (d) of Exchange Act Rules 13a-15 or 15d-15 that occurred during our last fiscal quarter that have materially affected, or are reasonably likely to materially affect, our internal control over financial reporting.
55
Table of Contents
| Item 9B. | Other Information |
None.
| Item 10. | Directors, Executive Officers and Corporate Governance |
The information required by this item with respect to our directors and executive officers will be contained in our 2015 Proxy Statement under the caption “Board of Directors and Corporate Governance – The Board in General” and “– Executive Officers” and is incorporated by reference into Item 10 of this report.
The information required by this item with respect to Section 16(a) beneficial ownership reporting compliance will be contained in our 2015 Proxy Statement under the caption “Ownership of the Company – Section 16(a) Beneficial Ownership Reporting Compliance” and is incorporated by reference into Item 10 of this report.
The information required by this item with respect to Audit Committee matters will be contained in our 2015 Proxy Statement under the caption “Board of Directors and Corporate Governance – Audit Committee” and is incorporated by reference into Item 10 of this report.
Code of Ethics
The Board of Directors of the Company has adopted a Code of Business Conduct and Ethics applicable to all Board members, executive officers and all employees. The Code of Business Conduct and Ethics is available on the Company’s website (“www.columbialabs.com”), under the investor relations tab. We will provide an electronic or paper copy of this document free of charge upon request. If amendments to the Code of Business Conduct and Ethics are executed, or if waivers are granted with respect to the Company’s Chief Executive Officer, Chief Financial Officer, Controller or persons performing similar functions, the Company will post and disclose the nature of such amendments or waivers on the Company’s website or in a report on Form 8-K.
| Item 11. | Executive Compensation |
The information required by this item will be contained in our 2015 Proxy Statement under the caption “Compensation Discussion and Analysis” and “Executive and Director Compensation” and is incorporated by reference into Item 11 of this report.
| Item 12. | Security Ownership of Certain Beneficial Owners and Management and Related Stockholder Matters |
The information required by this item will be contained in our 2015 Proxy Statement under the caption “Ownership of the Company – Security Ownership of Certain Beneficial Owners and Management” and “Equity Compensation Plan Information” and is incorporated by reference into Item 12 of this report.
| Item 13. | Certain Relationships and Related Transactions, and Director Independence |
The information required by this item will be contained in our 2015 Proxy Statement under the caption “Board of Directors and Corporate Governance – Certain Relationships and Related Party Transactions” and “– Director Independence” and is incorporated by reference into Item 13 of this report.
| Item 14. | Principal Accountant Fees and Services |
The information required by this item will be contained in our 2015 under the caption “Relationship With Independent Registered Public Accounting Firm” and is incorporated by reference into Item 14 of this report.
56
Table of Contents
| Item 15. | Exhibits and Financial Statement Schedule (a)(1)(2) Financial Statements and Financial Statement Schedules |
| Exhibit | Index Description of Exhibit | |
| 2.1 | Purchase and Collaboration Agreement, dated March 3, 2010, by and between Columbia Laboratories, Inc. and Coventry Acquisition, Inc. (incorporated by reference to Exhibit 2.1 to the Registrant’s Current Report on Form 8-K (File No. 001-10352), filed on March 4, 2010) | |
| 2.2 | Share Purchase Agreement, dated September 2013, between the Sellers, Columbia Laboratories, Inc. and Molecular Profiles Limited (incorporated by reference to Exhibit 2.1 to the Registrant’s Current Report on Form 8-K (File No. 001-10352), filed on September 18, 2013) | |
| 2.3 | Stock Purchase Agreement, dated March 6, 2014, by and between Columbia Laboratories, Inc. and Coventry Acquisition, Inc. (incorporated by reference to Exhibit 10.1 to the Registrant’s Current Report on Form 8-K (File No. 001-10352), filed on March 7, 2014) | |
| 3.1 | Restated Certificate of Incorporation of the Company, as amended (incorporated by reference to Exhibit 3.1 to the Registrant’s Annual Report on Form 10-K (File No. 001-10352) for the year ended December 31, 2005, filed on March 13, 2006) | |
| 3.2 | Certificate of Amendment of Restated Certificate of Incorporation of the Company (incorporated by reference to Exhibit 3.1 to the Registrant’s Current Report on Form 8-K (File No. 001-10352), filed on July 6, 2010) | |
| 3.3 | Certificate of Amendment of Restated Certificate of Incorporation of the Company (incorporated by reference to Exhibit 3.1 to the Registrant’s Current Report on Form 8-K (File No. 001-10352), filed on August 8, 2013) | |
| 3.4 | Amended and Restated By-laws of Company (incorporated by reference to Exhibit 3.2 to the Registrant’s Current Report on Form 8-K (File No. 001-10352), filed on January 12, 2015) | |
| 4.1 | Certificate of Designations, Preferences and Rights of Series C Convertible Preferred Stock of the Company, dated as of January 7, 1999 (incorporated by reference to Exhibit 4.1 to the Registrant’s Annual Report on Form 10-K (File No. 001-10352) for the year ended December 31, 1998, filed on March 25, 1999) | |
| 4.2* | Form of Restricted Stock Agreement (incorporated by reference to Exhibit 10.62 of the Registrant’s Current Report on Form 8-K (File No. 001-10352), filed on May 17, 2006) | |
| 4.3* | Form of Option Agreement (incorporated by reference to Exhibit 4.10 to the Registrant’s Annual Report on Form 10-K (File No. 001-10352) for the year ended December 31, 2008, filed on March 16, 2009) | |
| 4.4 | Amended and Restated Rights Agreement by and between Columbia Laboratories, Inc. and American Stock Transfer & Trust Company, LLC dated January 28, 2015 (incorporated by reference to Exhibit 4.1 to the Registrant’s Current Report on Form 8-K (File No. 001-10352), filed on January 30, 2015) | |
| 4.5* | Form of Award Agreement under the Amended and Restated 2008 Long-term Incentive Plan of Columbia Laboratories, Inc. (incorporated by reference to Exhibit 4.4 to the Registrant’s Registration Statement on Form S-8 (File No. 333-18647), filed on May 16, 2013) | |
| 10.1* | 1996 Long-term Performance Plan, as amended, of the Company (incorporated by reference to Annex A to the Registrant’s Proxy Statement (File No. 001-10352), filed on May 10, 2000) | |
| 10.2 | License Agreement, dated April 18, 2000, between the Company and Lil’ Drug Store Products, Inc. (incorporated by reference to Exhibit 10.23 to the Registrant’s Quarterly Report on Form 10-Q (File No. 001-10352) for the quarter ended March 31, 2000, filed on May 15, 2000) | |
57
Table of Contents
| Exhibit | Index Description of Exhibit | |
| 10.3* | Form of Indemnification Agreement for Officers and Directors (incorporated by reference to Exhibit 10.46 to the Registrant’s Annual Report on Form 10-K (File No. 001-10352) for the year ended December 31, 2003, filed on March 15, 2004) | |
| 10.4 | Packaging Agreement, dated October 28, 1993, between Columbia Laboratories (Ireland) Ltd. and Maropack AG (incorporated by reference to Exhibit 10.32 to the Registrant’s Annual Report on Form 10-K (File No. 001-10352) for the year ended December 31, 2007, filed on March 28, 2008) | |
| 10.5* | Columbia Laboratories, Inc. Amended and Restated 2008 Long-Term Incentive Plan (incorporated by reference to Appendix B to the Registrant’s Proxy Statement (File No. 001-10352), filed on March 22, 2013) | |
| 10.6* | Columbia Laboratories, Inc. (Amended and Restated) Incentive Plan (incorporated by reference to Exhibit 10.24 to the Registrant’s Annual Report on Form 10-K (File No. 001-10352) for the year ended December 31, 2008, filed on March 16, 2009) | |
| 10.7* | Form of Executive Change of Control Severance Agreement (incorporated by reference to Exhibit 10.25 to the Registrant’s Annual Report on Form 10-K (File No. 001-10352) for the year ended December 31, 2008, filed on March 16, 2009) | |
| 10.8* | Columbia Laboratories Stock Ownership Guidelines for Officers and Directors (incorporated by reference to Exhibit 99.1 to the Registrant’s Current Report on Form 8-K (File No. 001-10352), filed November 23, 2009) | |
| 10.9 | Manufacturing and Supply Agreement, dated December 8, 2009, between Fleet Laboratories and Columbia Laboratories (Bermuda), Ltd. (incorporated by reference to Exhibit 10.1 to the Registrant’s Current Report on Form 8-K (File No. 001-10352), filed on December 9, 2009) | |
| 10.10 | Note Purchase and Amendment Agreement, dated March 3, 2010, by and between Columbia Laboratories, Inc. and holders listed on Schedule I thereto (incorporated by reference to Exhibit 10.1 to the Registrant’s Current Report on Form 8-K (File No. 001-10352), filed on March 4, 2010) | |
| 10.11* | Amended and Restated Employment Agreement, dated May 4, 2010, by and between Columbia Laboratories, Inc. and Frank C. Condella, Jr. (incorporated by reference to Exhibit 10.1 to the Registrant’s Current Report on Form 8-K (File No. 001-10352), filed on May 5, 2010) | |
| 10.12 | Second Amended and Restated License and Supply Agreement, dated May 14, 2010, between Columbia Laboratories, Inc. and Ares Trading S.A. (incorporated by reference to Exhibit 10.1 to the Registrant’s Current Report on Form 8-K (File No. 001-10352), filed on May 18, 2010) | |
| 10.13* | Addendum to Amended and Restated Employment Agreement, dated March 1, 2011, by and between Columbia Laboratories, Inc., and Frank C. Condella, Jr. (incorporated by reference to Exhibit 10.46 to the Registrant’s Annual Report on Form 10-K (File No. 001-10352) for the year ended December 31, 2010, filed on March 10, 2011) | |
| 10.14* | Employment Agreement, dated January 15, 2013, by and between Columbia Laboratories, Inc., and Jonathan B. Lloyd Jones (incorporated by reference to Exhibit 10.1 to the Registrant’s Current Report on Form 8-K (File No. 001-10352), filed on January 16, 2013) | |
| 10.15 | Amendment No. 1 to the Second Amended and Restated License and Supply Agreement, dated April 4, 2013, between Columbia Laboratories, Inc. and Ares Trading S.A. (incorporated by reference to Exhibit 10.1 to the Registrant’s Current Report on Form 8-K (File No. 001-10352), filed on April 9, 2013) | |
| 10.16 | Parent Guarantee of Columbia Laboratories, Inc., dated September 12, 2013 (incorporated by reference to Exhibit 10.1 to the Registrant’s Current Report on Form 8-K (File No. 001-10352), filed on September 18, 2013) | |
58
Table of Contents
| Exhibit | Index Description of Exhibit | |
| 10.17* | Employment Agreement, dated September 12, 2013, between Dr. Nikin Patel and Columbia Laboratories, Inc. (incorporated by reference to Exhibit 10.2 to the Registrant’s Current Report on Form 8-K (File No. 001-10352), filed on September 18, 2013) | |
| 10.18 | Bank Loan Agreement, dated January 6, 2012, between Molecular Profiles Limited and Lloyds TSB Bank plc (incorporated by reference to Exhibit 10.3 the Registrant’s Quarterly Report on Form 10-Q (File No. 001-10352) for the quarter ended September 30, 2013, filed on November 7, 2013) | |
| 10.19 | Amendment letter, dated September 16, 2013, between Molecular Profiles Limited and Lloyds TSB Bank plc (incorporated by reference to Exhibit 10.4 the Registrant’s Quarterly Report on Form 10-Q (File No. 001-10352) for the quarter ended September 30, 2013, filed on November 7, 2013) | |
| 10.20 | Amendment to Manufacturing and Supply Agreement, effective as of December 31, 2013, between Columbia Laboratories (Bermuda) Ltd., and Fleet Laboratories Limited (incorporated by reference to Exhibit 10.1 to the Registrant’s Current Report on Form 8-K (File No. 001-10352), filed on February 6, 2014) | |
| 10.21 | Employment Agreement, dated September 23, 2014, by and between Columbia Laboratories, Inc. and George O. Elston (incorporated by reference to Exhibit 10.1 to the Registrant’s Current Report on Form 8-K (Filed No. 001-10352), filed on September 26, 2014) | |
| 21 | Subsidiaries of the Company | |
| 23.1 | Consent of BDO USA, LLP, Independent Registered Public Accounting Firm | |
| 31(i).1 | Certification of Chief Executive Officer of the Company | |
| 31(i).2 | Certification of Chief Financial Officer of the Company | |
| 32.1 | Certification of Chief Executive Officer pursuant to 18 U.S.C. Section 1350, as adopted pursuant to Section 906 of the Sarbanes-Oxley Act of 2002 | |
| 32.2 | Certification of Chief Financial Officer pursuant to 18 U.S.C. Section 1350, as adopted pursuant to Section 906 of the Sarbanes-Oxley Act of 2002 | |
| 101 | The following materials from the Columbia Laboratories, Inc. Annual Report on Form 10-K for the year ended December 31, 2014, formatted in XBRL (eXtensible Business Reporting Language): (i) Consolidated Balance Sheets at December 31, 2014 and December 31, 2013, (ii) Consolidated Statements of Operations for the years ended December 31, 2014, 2013 and 2012, (iii) Consolidated Statements of Comprehensive Income for the years ended December 31, 2014, 2013 and 2012, (iv) Consolidated Statements of Shareholders’ Equity for the years ended December 31, 2014, 2013 and 2012, (v) Consolidated Statements of Cash Flows for the years ended December 31, 2014, 2013 and 2012, and (vi) Notes to Consolidated Financial Statements. | |
| † | Confidential treatment has been requested with respect to certain portions of this exhibit. Omitted portions have been filed separately with the SEC. | |
| * | Management contract or compensatory plans or arrangements | |
59
Table of Contents
Pursuant to the requirements of Section 13 or 15(d) of the Securities Exchange Act of 1934, the Registrant has duly caused this report to be signed on its behalf by the undersigned, thereunto duly authorized.
| COLUMBIA LABORATORIES, INC. | ||||||
| Date: March 18, 2015 | By: | /s/ George O. Elston | ||||
| George O. Elston Vice President, Chief Financial Officer and Treasurer | ||||||
Pursuant to the requirements of the Securities Exchange Act of 1934, this report has been signed below by the following persons on behalf of the Registrant and in the capacities and on the dates indicated.
| /s/ Frank C. Condella, Jr. Frank C. Condella, Jr. |
President, Chief Executive Officer and Director (Principal Executive Officer) | March 18, 2015 | ||
| /s/ George O. Elston George O. Elston |
Vice President, Chief Financial Officer and Treasurer (Principal Financial and Accounting Officer) | March 18, 2015 | ||
| /s/ Nikin Patel Nikin Patel |
Chief Operating Officer and Director | March 18, 2015 | ||
| /s/ Valerie L. Andrews Valerie L. Andrews |
Director | March 18, 2015 | ||
| /s/ Frank Armstrong Frank Armstrong |
Director | March 18, 2015 | ||
| /s/ Cristina Csimma Cristina Csimma |
Director | March 18, 2015 | ||
| /s/ Donald H. Hunter Donald H. Hunter |
Director | March 18, 2015 | ||
| /s/ Stephen G. Kasnet Stephen G. Kasnet |
Chairman of the Board of Directors | March 18, 2015 | ||
60
Table of Contents
COLUMBIA LABORATORIES, INC.
INDEX TO FINANCIAL STATEMENTS
F-1
Table of Contents
REPORT OF INDEPENDENT REGISTERED PUBLIC ACCOUNTING FIRM
Board of Directors and Stockholders
Columbia Laboratories, Inc.
Boston, MA
We have audited the accompanying consolidated balance sheets of Columbia Laboratories, Inc. as of December 31, 2014 and 2013 and the related consolidated statements of operations, comprehensive income, stockholders’ equity, and cash flows for each of the three years in the period ended December 31, 2014. These financial statements are the responsibility of the Company’s management. Our responsibility is to express an opinion on these financial statements based on our audits.
We conducted our audits in accordance with the standards of the Public Company Accounting Oversight Board (United States). Those standards require that we plan and perform the audit to obtain reasonable assurance about whether the financial statements are free of material misstatement. The Company is not required to have, nor were we engaged to perform, an audit of its internal control over financial reporting. Our audits included consideration of internal control over financial reporting as a basis for designing audit procedures that are appropriate in the circumstances, but not for the purpose of expressing an opinion on the effectiveness of the Company’s internal control over financial reporting. Accordingly, we express no such opinion. An audit includes examining, on a test basis, evidence supporting the amounts and disclosures in the financial statements, assessing the accounting principles used and significant estimates made by management, as well as evaluating the overall financial statement presentation. We believe that our audits provide a reasonable basis for our opinion.
In our opinion, the consolidated financial statements referred to above present fairly, in all material respects, the financial position of Columbia Laboratories at December 31, 2014 and 2013, and the results of its operations and its cash flows for each of the three years in the period ended December 31, 2014, in conformity with accounting principles generally accepted in the United States of America.
/s/ BDO USA, LLP
Boston, Massachusetts
March 18, 2015
F-2
Table of Contents
Columbia Laboratories, Inc.
(in thousands, except per share data)
| December 31, | ||||||||
| 2014 | 2013 | |||||||
| Assets |
||||||||
| Current assets: |
||||||||
| Cash and cash equivalents |
$ | 16,762 | $ | 20,715 | ||||
| Accounts receivable, net |
5,289 | 7,197 | ||||||
| Amounts due from related parties |
— | 900 | ||||||
| Inventories |
3,201 | 2,584 | ||||||
| Prepaid expenses and other current assets |
1,134 | 831 | ||||||
|
|
|
|
|
|||||
| Total current assets |
26,386 | 32,227 | ||||||
| Property and equipment, net |
13,041 | 13,226 | ||||||
| Intangible assets, net |
2,182 | 2,828 | ||||||
| Goodwill |
10,503 | 11,152 | ||||||
| Deferred tax assets |
— | 570 | ||||||
| Other assets |
96 | 89 | ||||||
|
|
|
|
|
|||||
| Total assets |
$ | 52,208 | $ | 60,092 | ||||
|
|
|
|
|
|||||
| Liabilities and Shareholders’ Equity |
||||||||
| Current liabilities: |
||||||||
| Accounts payable |
$ | 2,873 | $ | 2,805 | ||||
| Accrued expenses |
1,918 | 2,488 | ||||||
| Deferred revenue |
914 | 754 | ||||||
| Notes payable |
243 | 250 | ||||||
|
|
|
|
|
|||||
| Total current liabilities |
5,948 | 6,297 | ||||||
| Deferred revenue, net of current portion |
1,553 | 2,243 | ||||||
| Notes payable, net of current portion |
3,289 | 3,745 | ||||||
| Common stock warrant liability |
— | 379 | ||||||
|
|
|
|
|
|||||
| Total liabilities |
10,790 | 12,664 | ||||||
|
|
|
|
|
|||||
| Commitments and contingencies |
||||||||
| Contingently redeemable series C preferred stock, 0.55 shares issued and outstanding (liquidation preference of $550) |
550 | 550 | ||||||
|
|
|
|
|
|||||
| Shareholders’ equity: |
||||||||
| Preferred stock, $.01 par value; 1,000 shares authorized |
||||||||
| Series B convertible preferred stock, 0.13 shares issued and outstanding (liquidation preference of $13) |
— | — | ||||||
| Common stock $.01 par value; 150,000 shares authorized; 12,186 issued and 10,775 outstanding at December 31, 2014 and 12,152 shares issued and outstanding at December 31, 2013 |
122 | 122 | ||||||
| Additional paid-in capital |
287,660 | 287,048 | ||||||
| Treasury stock (at cost), 1,411 shares at December 31, 2014 |
(8,579 | ) | — | |||||
| Accumulated deficit |
(238,272 | ) | (241,662 | ) | ||||
| Accumulated other comprehensive income |
(63 | ) | 1,370 | |||||
|
|
|
|
|
|||||
| Total shareholders’ equity |
40,868 | 46,878 | ||||||
|
|
|
|
|
|||||
| Total liabilities and shareholders’ equity |
$ | 52,208 | $ | 60,092 | ||||
|
|
|
|
|
|||||
The accompanying notes are an integral part of these consolidated financial statements.
F-3
Table of Contents
Columbia Laboratories, Inc.
Consolidated Statements of Operations
(in thousands, except per share data)
| Year Ended December 31, | ||||||||||||
| 2014 | 2013 | 2012 | ||||||||||
| Revenues |
||||||||||||
| Product revenues |
$ | 17,214 | $ | 21,336 | $ | 17,926 | ||||||
| Product revenues from related party |
167 | — | 4,305 | |||||||||
| Service revenues |
8,770 | 3,640 | — | |||||||||
| Royalties |
5,599 | 395 | 380 | |||||||||
| Royalties from related party |
714 | 3,436 | 3,079 | |||||||||
| Other revenues |
— | 119 | 138 | |||||||||
| Other revenues from related party |
— | 300 | — | |||||||||
|
|
|
|
|
|
|
|||||||
| Total revenues |
32,464 | 29,226 | 25,828 | |||||||||
| Cost of product revenues |
10,470 | 10,903 | 8,875 | |||||||||
| Cost of product revenues from related party |
— | — | 3,913 | |||||||||
| Cost of service revenues |
7,219 | 2,347 | — | |||||||||
|
|
|
|
|
|
|
|||||||
| Total cost of revenues |
17,689 | 13,250 | 12,788 | |||||||||
| Gross profit |
14,775 | 15,976 | 13,040 | |||||||||
| Operating expenses |
||||||||||||
| Sales and marketing |
1,708 | 439 | — | |||||||||
| Research and development (net of reimbursement from related party: 2012 – $435) |
663 | — | 771 | |||||||||
| Acquisition-related expenses |
— | 1,623 | — | |||||||||
| General and administrative |
8,589 | 8,039 | 9,460 | |||||||||
|
|
|
|
|
|
|
|||||||
| Total operating expenses |
10,960 | 10,101 | 10,231 | |||||||||
| Income from operations |
3,815 | 5,875 | 2,809 | |||||||||
|
|
|
|
|
|
|
|||||||
| Interest (expense) income, net |
(118 | ) | 71 | 238 | ||||||||
| Change in fair value of common stock warrant liability |
379 | 794 | 6,995 | |||||||||
| Other income (expense), net |
302 | (14 | ) | (122 | ) | |||||||
|
|
|
|
|
|
|
|||||||
| Income before income taxes |
4,378 | 6,726 | 9,920 | |||||||||
| Provision for income taxes |
988 | 22 | 3 | |||||||||
|
|
|
|
|
|
|
|||||||
| Net income |
$ | 3,390 | $ | 6,704 | $ | 9,917 | ||||||
|
|
|
|
|
|
|
|||||||
| Basic net income per common share |
$ | 0.31 | $ | 0.59 | $ | 0.91 | ||||||
|
|
|
|
|
|
|
|||||||
| Diluted net income per common share |
$ | 0.27 | $ | 0.52 | $ | 0.26 | ||||||
|
|
|
|
|
|
|
|||||||
| Basic weighted average common shares outstanding |
10,992 | 11,259 | 10,914 | |||||||||
|
|
|
|
|
|
|
|||||||
| Diluted weighted average common shares outstanding |
11,007 | 11,273 | 11,063 | |||||||||
|
|
|
|
|
|
|
|||||||
The accompanying notes are an integral part of these consolidated financial statements.
F-4
Table of Contents
Columbia Laboratories, Inc.
Consolidated Statements of Comprehensive Income
(in thousands)
| Year Ended December 31, | ||||||||||||
| 2014 | 2013 | 2012 | ||||||||||
| Net income |
$ | 3,390 | $ | 6,704 | $ | 9,917 | ||||||
| Other comprehensive (loss) income components: |
||||||||||||
| Foreign currency translation |
(1,433 | ) | 1,184 | 3 | ||||||||
| Unrealized (loss) gain on short term investments |
— | (80 | ) | 175 | ||||||||
| Reclassification adjustment for gains included in net income |
— | (17 | ) | — | ||||||||
|
|
|
|
|
|
|
|||||||
| Total other comprehensive (loss) income |
(1,433 | ) | 1,087 | 178 | ||||||||
| Comprehensive income |
$ | 1,957 | $ | 7,791 | $ | 10,095 | ||||||
|
|
|
|
|
|
|
|||||||
The accompanying notes are an integral part of these consolidated financial statements.
F-5
Table of Contents
Columbia Laboratories, Inc.
Consolidated Statements of Shareholders’ Equity
(in thousands, except for shares and per share amounts)
| Series B Convertible Preferred Stock |
Series E Convertible Preferred Stock |
Common Stock | Treasury Stock | |||||||||||||||||||||||||||||||||||||||||||||
| Number of Shares |
Amount | Number of Shares |
Amount | Number of Shares |
Amount | Capital in Excess of Par Value |
Number of Shares |
Treasury Stock |
Accumulated Deficit |
Accumulated Other Comprehensive Income |
Total | |||||||||||||||||||||||||||||||||||||
| Balance, December 31, 2011 |
— | $ | — | 23 | $ | — | 10,921 | $ | 109 | $ | 278,825 | (5 | ) | $ | (125 | ) | $ | (258,283 | ) | $ | 105 | $ | 20,631 | |||||||||||||||||||||||||
|
|
|
|
|
|
|
|
|
|
|
|
|
|
|
|
|
|
|
|
|
|
|
|
|
|||||||||||||||||||||||||
| Restricted shares vested |
— | — | — | — | 22 | — | — | — | — | — | — | — | ||||||||||||||||||||||||||||||||||||
| Share based compensation expense |
— | — | — | — | — | — | 668 | — | — | — | — | 668 | ||||||||||||||||||||||||||||||||||||
| Dividends on preferred stock |
— | — | — | — | — | — | (29 | ) | — | — | — | — | (29 | ) | ||||||||||||||||||||||||||||||||||
| Translation adjustment |
— | — | — | — | — | — | — | — | — | — | 3 | 3 | ||||||||||||||||||||||||||||||||||||
| Unrealized gain on short term investments |
— | — | — | — | — | — | — | — | — | — | 175 | 175 | ||||||||||||||||||||||||||||||||||||
| Net income |
— | — | — | — | — | — | — | — | — | 9,917 | 9,917 | |||||||||||||||||||||||||||||||||||||
|
|
|
|
|
|
|
|
|
|
|
|
|
|
|
|
|
|
|
|
|
|
|
|
|
|||||||||||||||||||||||||
| Balance, December 31, 2012 |
— | $ | — | 23 | $ | — | 10,943 | $ | 109 | $ | 279,464 | (5 | ) | $ | (125 | ) | $ | (248,366 | ) | $ | 283 | $ | 31,365 | |||||||||||||||||||||||||
|
|
|
|
|
|
|
|
|
|
|
|
|
|
|
|
|
|
|
|
|
|
|
|
|
|||||||||||||||||||||||||
| Options exercised and restricted shares vested |
— | — | — | — | 27 | 1 | 11 | — | — | — | — | 11 | ||||||||||||||||||||||||||||||||||||
| Issuance of common stock in connection with the acquisition of Molecular Profiles LTD |
— | — | — | — | 1,051 | 11 | 7,284 | — | — | — | — | 7,295 | ||||||||||||||||||||||||||||||||||||
| Conversion of series E preferred stock |
— | — | (23 | ) | — | 131 | 1 | (157 | ) | 11 | 156 | — | — | — | ||||||||||||||||||||||||||||||||||
| Purchase of treasury stock |
— | — | — | — | — | — | — | (6 | ) | (31 | ) | — | — | (31 | ) | |||||||||||||||||||||||||||||||||
| Share based compensation expense |
— | — | — | — | — | — | 475 | — | — | — | — | 476 | ||||||||||||||||||||||||||||||||||||
| Dividends on preferred stock |
— | — | — | — | — | — | (28 | ) | — | — | — | — | (28 | ) | ||||||||||||||||||||||||||||||||||
| Reverse stock split – cash in lieu |
— | — | — | — | — | — | (1 | ) | — | — | — | — | (1 | ) | ||||||||||||||||||||||||||||||||||
| Translation adjustment |
— | — | — | — | — | — | — | — | — | — | 1,184 | 1,184 | ||||||||||||||||||||||||||||||||||||
| Unrealized loss on short term investments |
— | — | — | — | — | — | — | — | — | — | (80 | ) | (80 | ) | ||||||||||||||||||||||||||||||||||
| Reclassification adjustment for gains included in net income |
— | — | — | — | — | — | — | — | — | — | (17 | ) | (17 | ) | ||||||||||||||||||||||||||||||||||
| Net income |
— | — | — | — | — | — | — | — | — | 6,704 | — | 6,704 | ||||||||||||||||||||||||||||||||||||
|
|
|
|
|
|
|
|
|
|
|
|
|
|
|
|
|
|
|
|
|
|
|
|
|
|||||||||||||||||||||||||
| Balance, December 31, 2013 |
— | $ | — | — | $ | — | 12,152 | $ | 122 | $ | 287,048 | — | $ | — | $ | (241,662 | ) | $ | 1,370 | $ | 46,878 | |||||||||||||||||||||||||||
|
|
|
|
|
|
|
|
|
|
|
|
|
|
|
|
|
|
|
|
|
|
|
|
|
|||||||||||||||||||||||||
| Options exercised and restricted shares vested |
— | — | — | — | 34 | — | 33 | — | — | — | — | 33 | ||||||||||||||||||||||||||||||||||||
| Purchase of treasury stock |
— | — | — | — | — | — | — | (1,411 | ) | (8,579 | ) | — | — | (8,579 | ) | |||||||||||||||||||||||||||||||||
| Share based compensation expense |
— | — | — | — | — | — | 607 | — | — | — | — | 607 | ||||||||||||||||||||||||||||||||||||
| Dividends on preferred stock |
— | — | — | — | — | — | (28 | ) | — | — | — | — | (28 | ) | ||||||||||||||||||||||||||||||||||
| Translation adjustment |
— | — | — | — | — | — | — | — | — | — | (1,433 | ) | (1,433 | ) | ||||||||||||||||||||||||||||||||||
| Net income |
— | — | — | — | — | — | — | — | — | 3,390 | — | 3,390 | ||||||||||||||||||||||||||||||||||||
|
|
|
|
|
|
|
|
|
|
|
|
|
|
|
|
|
|
|
|
|
|
|
|
|
|||||||||||||||||||||||||
| Balance, December 31, 2014 |
— | $ | — | — | $ | — | 12,186 | $ | 122 | $ | 287,660 | (1,411 | ) | $ | (8,579 | ) | $ | (238,272 | ) | $ | (63 | ) | $ | 40,868 | ||||||||||||||||||||||||
|
|
|
|
|
|
|
|
|
|
|
|
|
|
|
|
|
|
|
|
|
|
|
|
|
|||||||||||||||||||||||||
The accompanying notes to consolidated financial statements are an integral part of these financial statements.
F-6
Table of Contents
Columbia Laboratories, Inc.
Consolidated Statements of Cash Flows
| Year Ended December 31, | ||||||||||||
| 2014 | 2013 | 2012 | ||||||||||
| Operating activities: |
||||||||||||
| Net income |
$ | 3,390 | $ | 6,704 | $ | 9,917 | ||||||
| Reconciliation of net income to net cash provided by (used in) operating activities: |
||||||||||||
| Depreciation and amortization |
1,992 | 919 | 642 | |||||||||
| Change in fair value of common stock warrants |
(379 | ) | (794 | ) | (6,995 | ) | ||||||
| Provision for sales returns |
— | (26 | ) | (625 | ) | |||||||
| Write-off of inventories |
— | — | 970 | |||||||||
| Stock-based compensation expense |
607 | 475 | 668 | |||||||||
| Gain on sale of short-term investments |
— | (17 | ) | — | ||||||||
| Deferred income taxes |
542 | 57 | — | |||||||||
| Write-down of impaired assets |
— | — | 890 | |||||||||
| Loss on disposal of fixed assets |
— | 37 | 8 | |||||||||
| Changes in operating assets and liabilities: |
||||||||||||
| Accounts receivable |
1,705 | (2,347 | ) | 1,776 | ||||||||
| Due from related party |
900 | 1,295 | (68 | ) | ||||||||
| Inventories |
(619 | ) | 46 | 39 | ||||||||
| Prepaid expenses and other current assets |
(331 | ) | 1,439 | (616 | ) | |||||||
| Other non-current assets |
(5 | ) | (50 | ) | 425 | |||||||
| Accounts payable |
91 | 315 | (2,456 | ) | ||||||||
| Accrued expenses |
(559 | ) | (830 | ) | (218 | ) | ||||||
| Deferred revenue |
(405 | ) | (150 | ) | (13 | ) | ||||||
|
|
|
|
|
|
|
|||||||
| Net cash provided by operating activities |
6,929 | 7,073 | 4,344 | |||||||||
| Investing activities: |
||||||||||||
| Purchase of property and equipment |
(2,048 | ) | (522 | ) | (986 | ) | ||||||
| Additions to short-term investments |
— | — | (235 | ) | ||||||||
| Cash paid for acquisition, net of cash received |
— | (14,516 | ) | — | ||||||||
| Proceeds from the sale of short-term investments |
— | 15,353 | — | |||||||||
|
|
|
|
|
|
|
|||||||
| Net cash (used in) provided by investing activities |
(2,048 | ) | 315 | (1,221 | ) | |||||||
| Financing activities: |
||||||||||||
| Redemption of series C convertible preferred stock |
— | — | (50 | ) | ||||||||
| Proceeds from exercise of stock options |
33 | 11 | — | |||||||||
| Principal payments on notes payable |
(245 | ) | (72 | ) | — | |||||||
| Payments for the purchase of treasury stock |
(8,509 | ) | — | — | ||||||||
| Dividends paid |
(28 | ) | (28 | ) | (29 | ) | ||||||
|
|
|
|
|
|
|
|||||||
| Net cash used in financing activities |
(8,749 | ) | (89 | ) | (79 | ) | ||||||
| Effect of exchange rate changes on cash and cash equivalents |
(85 | ) | 212 | 46 | ||||||||
|
|
|
|
|
|
|
|||||||
| Net (decrease) increase in cash and cash equivalents |
(3,953 | ) | 7,511 | 3,090 | ||||||||
| Cash and cash equivalents, beginning of period |
20,715 | 13,204 | 10,114 | |||||||||
|
|
|
|
|
|
|
|||||||
| Cash and cash equivalents, end of period |
$ | 16,762 | $ | 20,715 | $ | 13,204 | ||||||
|
|
|
|
|
|
|
|||||||
| Supplemental cash flow information |
||||||||||||
| Cash paid for interest |
$ | 120 | $ | 25 | $ | — | ||||||
|
|
|
|
|
|
|
|||||||
| Cash paid for income taxes |
$ | 3 | $ | 3 | $ | — | ||||||
|
|
|
|
|
|
|
|||||||
| Supplemental noncash financing activities |
||||||||||||
| Common stock issued in connection with the acquisition of Molecular Profiles |
$ | — | $ | 7,295 | $ | — | ||||||
|
|
|
|
|
|
|
|||||||
| Conversion of series E convertible preferred stock into common stock |
$ | — | $ | 158 | $ | — | ||||||
|
|
|
|
|
|
|
|||||||
The accompanying notes are an integral part of these consolidated financial statements.
F-7
Table of Contents
Columbia Laboratories, Inc.
Notes to Consolidated Financial Statements
1. Organization
Columbia Laboratories, Inc. (the “Company” or “Columbia”) was incorporated as a Delaware corporation in December 1986. The Company has historically been in the business of developing, manufacturing, licensing and selling pharmaceutical products that utilize proprietary drug delivery technologies to treat various medical conditions to commercial partners. In September 2013, the Company acquired Nottingham, U.K. based Molecular Profiles, a pharmaceutical services company. Molecular Profiles provides a range of drug development and consulting services to the pharmaceutical industry and has provided Columbia with an additional revenue source and in-house expertise for internal pharmaceutical programs.
2. Summary of Significant Accounting Policies
Principles of Consolidation
The consolidated financial statements include the accounts of the Company and its wholly-owned subsidiaries; Columbia Laboratories Bermuda Ltd., Columbia Laboratories France SA , Columbia Laboratories UK Ltd, and Molecular Profiles Ltd. All significant intercompany balances and transactions have been eliminated in consolidation.
Reclassifications
For comparability purposes, certain prior year amounts in the consolidated financial statements have been reclassified to conform to the current year’s presentation within the consolidated balance sheets, consolidated statements of operations and consolidated statements of cash flows.
Basis of Presentation
On July 26, 2013, Columbia’s Board of Directors set a ratio of 1-for-8 for its previously approved reverse stock split which took effect on August 9, 2013. The reverse stock split was approved by Columbia’s shareholders at its annual meeting of shareholders on May 1, 2013. All share and per share amounts relating to the common stock, stock options and common stock warrants included in the financial statements and accompanying footnotes have been retroactively adjusted for all periods presented to give effect to this reverse stock split, including reclassifying an equal amount to the reduction in par value of common stock to additional paid-in capital. The reverse stock split did not result in a retroactive adjustment to the share amounts for any of the classes of the Company’s preferred stock.
Segments
The Company and its subsidiaries are engaged in two segments: product and service. The product segment includes supply chain management for CRINONE, the Company’s sole commercialized product. In certain foreign countries, these products may be classified as medical devices or cosmetics by those countries’ regulatory agencies. See Note 12 for information on foreign operations. The service segment includes pharmaceutical development, clinical trial manufacturing, and advanced analytical and consulting services for the Company’s customers as well as characterizing and developing pharmaceutical product candidates for the Company’s internal programs. In September 2013, the Company acquired Molecular Profiles, a U.K.-based provider of pharmaceutical development, clinical trial manufacturing, and advanced analytical and consulting services to the pharmaceutical industry. The Company has integrated its supply chain management for its sole commercialized product, CRINONE into those operations and have therefore sought to capture synergies by transferring all operational activities related to its historic business.
F-8
Table of Contents
The Chief Executive Officer, who is the Company’s Chief Operating Decision Maker (CODM), currently manages the business based on the expansion of our revenues and as such the Company has concluded that it is two segments, which consists of product and service. Segment information is consistent with the financial information regularly reviewed by our chief operating decision maker, who we have determined to be the chief executive officer, for purposes of evaluating performance, allocating resources, setting incentive compensation targets, and planning and forecasting future periods. Our chief operating decision maker evaluates the performance of our product and service segments based on gross profit. Our chief operating decision maker does not review our assets, operating expenses or non-operating income and expenses by business segment at this time.
Management Estimates
The preparation of financial statements in conformity with accounting principles generally accepted in the U.S. requires management to make estimates and assumptions that affect the reported amounts of assets, liabilities, revenues and expenses and related disclosures at the date of the financial statements during the reporting period. Significant estimates are used for, but are not limited to revenue recognition, sales return reserves, allowance for doubtful accounts, inventory reserve, impairment analysis of goodwill and intangibles including their useful lives, deferred tax assets, liabilities and valuation allowances, common stock warrant valuations, and fair value of stock options. On an ongoing basis, management evaluates its estimates. Actual results could differ from those estimates.
Foreign Currency
The assets and liabilities of the Company’s foreign subsidiaries are translated into U.S. dollars at current exchange rates and revenue and expense items are translated at average rates of exchange prevailing during the period. The functional currency of Columbia’s foreign subsidiaries is considered to be the local currency for each entity and, accordingly, translation adjustments for these subsidiaries are included in accumulated other comprehensive income within stockholders’ equity. Certain intercompany and third party foreign currency-denominated transactions generated foreign currency re-measurement losses of approximately $33,000, $47,000 and $0.1 million during the years ended December 31, 2014, 2013 and 2012, respectively, which are included in other expense, net in the consolidated statements of operations.
Cash Equivalents
The Company considers all investments purchased with an original maturity of three months or less to be cash equivalents.
Fair Value of Financial Instruments
U.S. GAAP establishes a framework for measuring fair value under generally accepted accounting principles and enhances disclosures about fair value measurements. Fair value is defined as the amount that would be received for an asset or paid to transfer a liability (i.e., an exit price) in the principal or most advantageous market for the asset or liability in an orderly transaction between market participants on the measurement date. Valuation techniques used to measure fair value maximize the use of observable inputs and minimize the use of unobservable inputs. The standard describes the following fair value hierarchy based on three levels of inputs, of which the first two are considered observable and the last unobservable, that may be used to measure fair value:
Level 1: Quoted prices in active markets for identical assets and liabilities.
Level 2: Inputs other than Level 1 that are observable, either directly or indirectly, such as quoted prices for similar assets or liabilities; quoted prices in markets that are not active; or other inputs that are observable or can be corroborated by observable market data for substantially the full term of the assets or liabilities.
F-9
Table of Contents
Level 3: Unobservable inputs that are supported by little or no market activity and that are significant to the fair value of the assets or liabilities.
The fair value of cash and cash equivalents are classified as Level 1 at December 31, 2014 and 2013.
The estimated fair value of the common stock warrant liability resulting from the October 2009 registered direct offering of 1,362,500 shares of the common stock and warrants to purchase 681,275 shares of common stock was $0.4 million as of December 31, 2013. There was no value associated with the common stock warrant liability as of December 31, 2014 as the Company nears the expiration of these warrants in April 2015. These values were determined by using the Black-Scholes option pricing model which is based on the Company’s stock price at measurement date, exercise price of this common stock warrant, risk-free rate and historical volatility, and are classified as a Level 2 measurement. During the years ended December 31, 2014, 2013 and 2012, the Company recorded income of $0.4 million, $0.8 million and $7.0 million, respectively, to adjust the value of the common stock warrant liability to market.
| 2014 | 2013 | 2012 | ||||||||||
| Stock Price |
$ | 5.60 | $ | 6.61 | $ | 5.12 | ||||||
| Exercise Price |
$ | 12.16 | $ | 12.16 | $ | 12.16 | ||||||
| Risk free interest rate |
0.030 | % | 0.20 | % | 0.25 | % | ||||||
| Expected term |
0.25 years | 1.25 years | 2.25 years | |||||||||
| Dividend yield |
— | — | — | |||||||||
| Expected volatility |
22.76 | % | 61.32 | % | 103.10 | % | ||||||
The fair value of accounts receivable and accounts payable approximate their carrying amount. The Company’s long-term debt is carried at amortized cost, which approximates fair value based on current market pricing of similar debt instruments and is categorized as a Level 2 measurement.
Inventories
Inventories are stated at the lower of cost (first-in, first-out) or market. Components of inventory cost include materials, labor and manufacturing overhead. Inventories consist of the following (in thousands):
| December 31, | ||||||||
| 2014 | 2013 | |||||||
| Raw materials |
$ | 761 | $ | 771 | ||||
| Work in process |
1,095 | 775 | ||||||
| Finished goods |
1,345 | 1,038 | ||||||
|
|
|
|
|
|||||
| Total |
$ | 3,201 | $ | 2,584 | ||||
|
|
|
|
|
|||||
Reserves for excess and obsolete inventory were $36,000 and $0.2 million at December 31, 2014 and 2013, respectively.
Columbia’s excess and obsolescence reserve policy is to establish inventory reserves when conditions exist which suggest that the inventory may be in excess of anticipated demand or is obsolete based upon assumptions about future demand for products and market conditions. Columbia only manufactures products to customer orders. Columbia regularly evaluates the ability to realize the value of inventory based upon a combination of factors. Assumptions used in determining management’s estimates of future product demand may prove to be incorrect, in which case the provision required for excess and obsolete inventory would have to be adjusted in the future.
F-10
Table of Contents
Accounts Receivable and Allowance for Doubtful Accounts
Accounts receivable are reported at their outstanding unpaid principal balances reduced by allowances for doubtful accounts. The Company estimates doubtful accounts based on historical bad debts, factors related to specific customers’ ability to pay and current economic trends. The Company writes off accounts receivable against the allowance when a balance is determined to be uncollectable.
Accounts receivable allowance activity consisted of the following for the years ended December 31 (in thousands):
| 2014 | 2013 | 2012 | ||||||||||
| Balance at beginning of year |
$ | 112 | $ | 100 | $ | 100 | ||||||
| Additions |
246 | 12 | — | |||||||||
| Deductions |
— | — | — | |||||||||
|
|
|
|
|
|
|
|||||||
| Balance at end of year |
$ | 358 | $ | 112 | $ | 100 | ||||||
|
|
|
|
|
|
|
|||||||
Columbia’s accounts receivable balance, net of allowance for doubtful accounts, was $5.3 million as of December 31, 2014, compared with $8.1 million as of December 31, 2013. Included in the accounts receivable balance at December 31, 2014 and 2013 were $0.7 million and $2.8 million of unbilled accounts receivable, respectively. Columbia’s unbilled accounts receivable is derived from services performed that have not been billed as of the balance sheet date.
Property and Equipment
Property and equipment is stated at cost less accumulated depreciation. Leasehold improvements are amortized over the lesser of the useful life or the term of the leases. Depreciation is computed on the straight-line basis over the estimated useful lives of the respective assets, as follows:
| Years | ||
| Machinery and equipment |
3-10 | |
| Furniture and fixtures |
3-5 | |
| Computer equipment and software |
3 | |
| Buildings |
Up to 39 | |
| Land |
Indefinite |
Costs of major additions and improvements are capitalized and expenditures for maintenance and repairs that do not extend the term of the assets are expensed. Upon sale or disposition of property and equipment, the cost and related accumulated depreciation are eliminated from the accounts and any resultant gain or loss is credited or charged to operations.
Columbia continually evaluates whether events or circumstances have occurred that indicate that the remaining useful life of its long-lived assets may warrant revision or that the carrying value of these assets may be impaired. Columbia evaluates the realizability of its long-lived assets based on profitability and cash flow expectations for the related asset. Any write-downs are treated as permanent reductions in the carrying amount of the assets. Based on this evaluation, Columbia believes, as of each balance sheet date presented, none of Columbia’s long-lived assets were impaired.
In the fourth quarter of 2012, the Company recorded an impairment charge on the net carrying value of certain machinery and equipment that was acquired in anticipation of increased capacity requirements for Progesterone production in anticipation of the approval of the preterm birth indication. The company recorded a loss of $0.9 million, which was recorded in general and administrative expense in the consolidated statements of operations.
F-11
Table of Contents
Concentration of Risk
The Company has two major customers – Actavis and Merck Serono. See Note 12 for customer and product concentrations.
The Company depends on one supplier for a key excipient (ingredient) used in its products and one supplier for one of the active pharmaceutical ingredients.
Goodwill
Goodwill represents the excess of the purchase price over the fair value of assets acquired and liabilities assumed in a business combination. The Company does not amortize its goodwill, but instead tests for impairment annually and more frequently whenever events or changes in circumstances indicate that the fair value of the asset may be less than its carrying value of the asset.
In accordance with Accounting Standards Codification, or ASC 350, Goodwill and Other Intangibles (“ASC 350”), we use the two step approach for each reporting unit. The first step compares the carrying amount of the reporting unit to its estimated fair value (Step 1) utilizing a discounted cash flow analysis based on the present value of estimated future cash flows to be generated using a risk-adjusted discount rate. To the extent that the carrying value of the reporting unit exceeds its estimated fair value, a second step is performed, wherein the reporting unit’s carrying value is compared to the implied fair value (Step 2). To the extent that the carrying value of goodwill exceeds the implied fair value of goodwill, impairment exists and must be recognized.
We have concluded that our business represents two reporting units for goodwill impairment testing, which are product and service. Our goodwill is assigned to our service reporting unit. We have performed our annual test for impairment and have determined that our goodwill is not impaired as of December 31, 2014.
Intangible Assets
The Company capitalizes and includes in intangible assets the costs of trademark, developed technology and customer relationships. Intangible assets are recorded at fair value and stated net of accumulated amortization. The Company amortizes its intangible assets that have finite lives using either the straight-line or accelerated method, based on the useful life of the asset over which it is expected to be consumed utilizing expected undiscounted future cash flows. Amortization is recorded over the estimated useful lives ranging from 3 to 7 years. The Company evaluates the realizability of its definite lived intangible assets whenever events or changes in circumstances or business conditions indicate that the carrying value of these assets may not be recoverable based on expectations of future undiscounted cash flows for each asset group. If the carrying value of an asset or asset group exceeds its undiscounted cash flows, the Company estimates the fair value of the assets, generally utilizing a discounted cash flow analysis based on the present value of estimated future cash flows to be generated by the assets using a risk-adjusted discount rate. To estimate the fair value of the assets, the Company uses market participant assumptions pursuant to ASC 820, Fair Value Measurements. If the estimate of an intangible asset’s remaining useful life is changed, the Company will amortize the remaining carrying value of the intangible asset prospectively over the revised useful life.
Income Taxes
Deferred tax assets or liabilities are determined based on timing differences between when income and expense items are recognized for financial statement purposes versus when they’re recognized for tax purposes, as measured by enacted tax rates. A valuation allowance is provided against deferred tax assets in circumstances where management believes it is more likely than not that all or a portion of the assets will not be realized. The Company has provided a full valuation allowance against its net domestic deferred tax assets as of December 31, 2014 and 2013. The Company has provided a full valuation allowance against its net foreign deferred tax assets as of December 31, 2014.
F-12
Table of Contents
Accumulated Other Comprehensive (Loss) Income
Changes to accumulated other comprehensive income during the year ended December 31, 2014 were as follows (in thousands):
| Translation Adjustment |
Accumulated Other Comprehensive Income |
|||||||
| Balance – December 31, 2013 |
$ | 1,370 | $ | 1,370 | ||||
| Current period other comprehensive income |
(1,433 | ) | (1,433 | ) | ||||
|
|
|
|
|
|||||
| Balance – December 31, 2014 |
$ | (63 | ) | $ | (63 | ) | ||
|
|
|
|
|
|||||
Revenue Recognition and Sales Returns Reserves
Revenues include product revenues, which primarily consist of sales of CRINONE to Merck Serono, royalty revenues, which primarily consist of royalty revenues from Actavis on sales of CRINONE, service revenues, which primarily consist of analytical and consulting services, pharmaceutical development and clinical trial manufacturing services and other revenues.
Revenues from the sale of products are recorded at the time goods are shipped to customers, except in the case of product shipments to Actavis, which were recognized when received at Actavis’ warehouse. Sales to Merck Serono for CRINONE (progesterone gel) are determined on a country-by-country basis and are the greater of (i) a percentage of Merck Serono’s net selling price, or (ii) Columbia’s direct manufacturing cost plus 20%. Columbia estimates net selling prices based on historical experience and other current information from Merck Serono; the amounts are reconciled on a quarterly basis when information is received from Merck Serono. In 2012 and 2013 certain quantity discounts applied to annual purchases over 10 million, 20 million, and 30 million units. Columbia accrues an estimated volume discount on a quarterly basis and reconciles it on an annual basis. Under the terms of the amended license and supply agreement, the Company continues to sell CRINONE to Merck Serono on a country-by-country basis at the greater of (i) cost plus 20% or (ii) a percentage of Merck Serono’s net selling price. From 2014 through 2020, the percentage of net selling price will be determined based on a tiered structure, which is based on volume sold. As sales volumes increase the Company’s percentage share of each incremental tier will decrease. These sales thresholds have been agreed to as an incentive for Merck Serono to continue to develop existing markets and to enter new markets.
Revenues associated with pharmaceutical services may include multiple-element arrangements, which are evaluated in accordance with the principles of Accounting Standards update (“ASU”) 2009-13, (Revenue Recognition Topic – Multiple Element Arrangements) and Columbia allocates revenue among the elements based upon each element’s relative fair value. These elements are recognized as revenue as the service for each element is performed.
Accordingly, when a sale combines multiple elements upon performance of multiple services, the Company allocates revenue for transactions that include multiple elements to each unit of accounting based on its relative selling price, and recognizes revenue for each unit of accounting when the revenue recognition criteria have been met. The Company follows the selling price hierarchy as outlined in the guidance Revenue Recognition (ASC Topic 605) – Multiple-Deliverable Revenue Arrangements. The guidance provides a hierarchy to determine the selling price to be used for allocating revenue to deliverables: (i) vendor-specific objective evidence (“VSOE”), (ii) third-party evidence (“TPE”) if available and when VSOE is not available, and (iii) best estimate of the selling price (“BESP”) if neither VSOE nor TPE is available. The Company uses BESP to determine the standalone selling price for such deliverables. The Company has a process for developing BESP, which incorporates, pricing practices, historical selling prices, the effect of market conditions as well as entity-specific factors. Estimated selling prices are monitored and evaluated on a regular basis to ensure that changes in circumstances are accounted for in a timely manner.
F-13
Table of Contents
Revenues from the sales of consulting services are recognized on a time and materials basis over the contract period as services are provided. Payments received by Columbia in advance of performance for services are deferred until earned.
Royalty revenues, based on sales by licensees, are recorded as revenues as those sales are made by the licensees.
License revenue consists of up-front, milestone and similar payments under license agreements and is recognized when earned under the terms of the applicable agreements. Milestone payments represent payments for the occurrence of contract-specified events and coincide with the achievement of a substantive element in a multi-element arrangement. License revenue, including milestone payments, is deferred and recognized in revenues over the estimated product life cycle or the length of relevant patents, whichever is shorter.
In accordance with the provisions of ASC 605-45, Revenue Recognitions Topic – Principal Agent Considerations, Columbia records shipping and handling costs billed to its customers as a component of revenue, and the underlying expense as a component of cost of revenue.
Columbia collects value added tax from its customers for revenues generated out of the United Kingdom for which the customer is not tax exempt and remits such taxes to the appropriate governmental authorities. Columbia presents its value added tax on a net basis; therefore, these taxes are excluded from revenues.
As of December 31, 2014 there is no sales returns reserve as the return rights obligation has elapsed for all products for which Columbia provided a right of return. Columbia is not responsible for returns on international sales. Sales adjustments for international sales were estimated to recognize changes in foreign exchange rates and changes in market prices that may fluctuate within a year. Columbia was responsible for sales returns for products sold to domestic customers prior to both the Actavis Transactions and the sale in April 2011 of STRIANT® (testosterone buccal system) to Auxilium Pharmaceuticals LLC (“Auxilium”). Revenues from the sale of products to domestic customers were recorded at the time goods were shipped to customers. Except for sales to licensees, Columbia’s return policy allowed product to be returned for a period beginning three months prior to the product expiration date and ending twelve months after the product expiration date. Products sold to Merck Serono and Actavis are not returnable to Columbia. Provisions for returns on sales to wholesalers, distributors and retail chain stores were estimated based on a percentage of sales, using such factors as historical sales information, distributor inventory levels and product prescription data, and were recorded as a reduction to sales in the same period as the related sales were recognized.
F-14
Table of Contents
An analysis of the reserve for sales returns at December 31, 2013 and 2014 is as follows (in thousands):
| Total | ||||
| Balance – December 31, 2012 |
$ | 484 | ||
| Provision: |
||||
| Related to current period sales |
— | |||
| Related to prior period sales |
(26 | ) | ||
|
|
|
|||
| (26 | ) | |||
|
|
|
|||
| Returns: |
||||
| Related to prior period sales |
(320 | ) | ||
|
|
|
|||
| (320 | ) | |||
|
|
|
|||
| Balance – December 31, 2013 |
$ | 138 | ||
| Provision: |
||||
| Related to current period sales |
— | |||
| Related to prior period sales |
(136 | ) | ||
|
|
|
|||
| (136 | ) | |||
|
|
|
|||
| Returns: |
||||
| Related to prior period sales |
(2 | ) | ||
|
|
|
|||
| (2 | ) | |||
|
|
|
|||
| Balance – December 31, 2014 |
$ | — | ||
|
|
|
|||
Deferred Revenue
As part of the acquisition of Molecular Profiles, Columbia assumed a $2.5 million obligation under a grant arrangement with the Regional Growth Fund on behalf of the Secretary of State for Business, Innovation, and Skills in the United Kingdom. Molecular Profiles used this grant to fund the building of its second facility, which includes analytical labs, office space, and a manufacturing facility. As a part of the arrangement, Molecular Profiles is required to create and maintain certain full-time equivalent personnel levels through October 2017. As of December 31, 2014, the Company is in compliance with the covenants of the arrangement.
The income from the Regional Growth Fund will be recognized on a decelerated basis through September 30, 2017. As of December 31, 2014, and 2013 the obligation is valued at $2.1 million and $2.6 million, respectively, due to foreign currency revaluation and is recorded in deferred revenue on the consolidated balance sheets.
Amounts paid but not yet earned on a sale are recorded as deferred revenue until such time as performance is rendered or the obligation to perform the service is completed.
Research and Development Costs
Research and development consist of consultants, material costs, salaries and other personnel related expenses including stock-based compensation of employees primarily engaged in research and development activities and materials used and other overhead expenses incurred. All research and development costs are expensed as incurred.
Columbia entered into an agreement with Actavis to collaborate on the development of progesterone products, specifically the PREGNANT study. The PREGNANT study expenses consisted of fees for preparation, filing and approval process of the related drug application. Under the terms of the agreement, Columbia performed certain research and development activities, the cost of which was partially funded by Actavis. Columbia recorded $0.4 million of reimbursements from Actavis as a reduction to research and development expenses in the years ended December 31, 2012.
F-15
Table of Contents
In 2013, there were no research and development expenses or reimbursements from Actavis.
In 2014, the Company completed its commercial and intellectual property assessment and clinical and regulatory diligence on COL-1077, extended-release lidocaine vaginal gel in addition to performing initial assessments of other potential proprietary product candidates. The target indication for COL-1077 is an acute use anesthetic for minimally invasive gynecological procedures. The Company is leveraging the technical capabilities of its Nottingham site to advance the COL-1077 development program.
Stock-based compensation
Columbia follows the fair value recognition provisions of ASC 718, Stock Compensation Topic (ASC 718). Columbia expenses the fair value of stock options over the requisite service period. Columbia records its stock-based compensation expense without a forfeiture rate. Accordingly, Columbia reviews its actual forfeitures and aligns its stock compensation expense with the options that are vesting. In December 2012, $0.2 million was credited to stock compensation related to the forfeiture of unvested options.
Columbia recorded stock-based compensation expense of $0.6 million, $0.5 million and $0.7 million for the years ended December 31, 2014, 2013 and 2012, respectively.
Total stock-based compensation expense was recorded to cost of revenues, and operating expenses based upon the functional responsibilities of the individuals holding the respective options as follows (in thousands):
| Years Ended December 31, |
||||||||||||
| 2014 | 2013 | 2012 | ||||||||||
| Cost of revenues |
$ | 44 | $ | 14 | $ | 23 | ||||||
| Sales and marketing |
28 | — | — | |||||||||
| Research and development |
2 | — | 40 | |||||||||
| General and administrative |
533 | 461 | 605 | |||||||||
|
|
|
|
|
|
|
|||||||
| Total employee stock-based compensation |
$ | 607 | $ | 475 | $ | 668 | ||||||
|
|
|
|
|
|
|
|||||||
As of December 31, 2014, total unamortized share-based compensation cost related to non-vested stock options was $1.1 million, which is expected to be recognized on a straight-line basis over a weighted average period of 3.1 years.
Cash received from option exercises was $33,000 and $11,000 during the years ending December 31, 2014 and 2013, respectively. There were no option exercises in the year ended December 31, 2012.
Columbia granted 312,000, 88,749 and 104,375 stock options during the years ended December 31, 2014, 2013 and 2012, respectively.
Stock based compensation for consultants amounted to $0.1 million in the year ended December 31, 2012. There was no stock-based compensation expense recorded for consultants in both years ended December 31, 2014 and 2013, respectively. No tax benefit has been recognized due to the net tax losses during the periods presented.
The Company uses the Black-Scholes option pricing model to determine the estimated fair value for stock-based awards. Option-pricing models require the input of various subjective assumptions, including the option’s expected life and the price volatility of the underlying stock. Accordingly the weighted-average fair value of the
F-16
Table of Contents
options granted during the years ended December 31, 2014, 2013 and 2012 was $4.27, $3.52 and $3.68, respectively based on the following assumptions:
| Years Ended December 31, | ||||||
| 2014 | 2013 | 2012 | ||||
| Risk free interest rate |
0.93%-1.64% | 0.71%-0.76% | 0.82% | |||
| Expected term |
4.75 years | 4.75 years | 4.75 years | |||
| Dividend yield |
— | — | — | |||
| Expected volatility |
78.27%-81.36% | 96.52%-97.02% | 93.57% | |||
Columbia’s estimated expected stock price volatility is based on its own historical volatility. Columbia’s expected term of options granted in the years ended December 31, 2014, 2013 and 2012 was derived from the simplified method. The risk-free rate for the expected term of the option is based on the U.S. Treasury yield curve in effect at the time of grant.
Net Income Per Common Share
The calculation of basic and diluted income per common and common equivalent share is as follows (in thousands except for per share data):
| Years Ended December 31, | ||||||||||||
| 2014 | 2013 | 2012 | ||||||||||
| Basic net income per common share |
||||||||||||
| Net income |
$ | 3,390 | $ | 6,704 | $ | 9,917 | ||||||
| Less: Preferred stock dividends |
(28 | ) | (28 | ) | (29 | ) | ||||||
|
|
|
|
|
|
|
|||||||
| Net income applicable to common stock |
$ | 3,362 | $ | 6,676 | $ | 9,888 | ||||||
|
|
|
|
|
|
|
|||||||
| Basic weighted average number of common shares outstanding |
10,992 | 11,259 | 10,914 | |||||||||
|
|
|
|
|
|
|
|||||||
| Basic net income per common share |
$ | 0.31 | $ | 0.59 | $ | 0.91 | ||||||
|
|
|
|
|
|
|
|||||||
| Diluted net income per common share |
||||||||||||
| Net income applicable to common stock |
$ | 3,362 | $ | 6,676 | $ | 9,888 | ||||||
| Add: Preferred stock dividends |
28 | 28 | 29 | |||||||||
| Less: Fair value of stock warrants for dilutive warrants |
(380 | ) | (794 | ) | (6,995 | ) | ||||||
|
|
|
|
|
|
|
|||||||
| Net income applicable to dilutive common stock |
$ | 3,010 | $ | 5,910 | $ | 2,922 | ||||||
|
|
|
|
|
|
|
|||||||
| Basic weighted average number of common shares outstanding |
10,992 | 11,259 | 10,914 | |||||||||
| Effect of dilutive securities |
||||||||||||
| Dilutive stock awards |
15 | 14 | 6 | |||||||||
| Dilutive warrants |
— | — | — | |||||||||
| Dilutive preferred share conversions |
— | — | 143 | |||||||||
|
|
|
|
|
|
|
|||||||
| 15 | 14 | 149 | ||||||||||
| Diluted weighted average number of common shares outstanding |
11,007 | 11,273 | 11,063 | |||||||||
|
|
|
|
|
|
|
|||||||
| Diluted net income per common share |
$ | 0.27 | $ | 0.52 | $ | 0.26 | ||||||
|
|
|
|
|
|
|
|||||||
Basic income per common share is computed by dividing the net income, plus preferred dividends by the weighted-average number of shares of common stock outstanding during a period. The diluted income per
F-17
Table of Contents
common share calculation gives effect to dilutive options, warrants, convertible notes, convertible preferred stock, and other potential dilutive common stock including selected restricted shares of common stock outstanding during the period. Diluted income per common share is based on the treasury stock method and includes the effect from potential issuance of common stock, such as shares issuable pursuant to the exercise of stock options, assuming the exercise of all in-the-money stock options. Common share equivalents have been excluded where their inclusion would be anti-dilutive.
Shares to be issued upon the exercise of the outstanding options and warrants, convertible preferred stock and selected restricted shares of common stock excluded from the income per share calculation amounted to 1,692,180, 1,599,551 and 1,841,857 for the years ended December 31, 2014, 2013 and 2012, respectively, because the awards were anti-dilutive.
Acquisition-Related Expenses
The Company’s acquisition-related expenses for 2013 were costs associated with the acquisition of Molecular Profiles and a failed transaction in the 2013 period. There were no acquisition-related expenses during the 2014 or 2012 periods.
Revision of Prior Interim Period Financial Statements
During the fourth quarter of 2014, the Company identified errors relating to the recognition of revenue for certain services transactions and contractual arrangements during 2014. Specifically, the Company determined that certain service revenues were recorded in the incorrect periods within 2014 and other services transactions for which revenue was recognized outside the conditions required under the Company’s accounting policies. The Company determined that, under U.S. GAAP rules, a net $0.2 million of its first quarter revenues and $0.2 million of second quarter revenues should not have been recognized. These errors had the cumulative effect of reducing the Company’s previously reported total revenues for the first three quarters of 2014 by $0.4 million, from $25.6 million to $25.2 million.
The Company assessed the effect of the revisions, individually and in the aggregate, on its prior interim periods financial statements in accordance with the SEC’s Staff Accounting Bulletins No. 99 – Materiality and 108 – Considering the Effects of Prior Period Misstatements when Quantifying Misstatements in Current Year Financial Statements. Based on an analysis of quantitative and qualitative factors, the Company determined that its prior interim period financial statements for 2014 needed to be revised and are included below in this Annual Report on Form 10-K. The Company concluded that the previously issued interim period financial statements were not misleading and could continue to be relied upon. The Company plans to include the revised financial information for the 2014 interim periods in its future filings containing such financial information to facilitate period-over-period comparisons.
F-18
Table of Contents
The following table presents the impact of these corrections on its consolidated statements of operations and comprehensive income for the quarters ended March 31, 2014, June 30, 2014 and September 30, 2014 (in thousands, except per share data):
| 2014 | ||||||||||||||||||||||||||||||||||||
| 1st Quarter | 2nd Quarter | 3rd Quarter | ||||||||||||||||||||||||||||||||||
| As Previously Reported |
Adjustment | As Revised | As Previously Reported |
Adjustment | As Revised | As Previously Reported |
Adjustment | As Revised | ||||||||||||||||||||||||||||
| Service revenues |
$ | 2,710 | $ | (232 | ) | $ | 2,478 | $ | 2,313 | $ | (203 | ) | $ | 2,110 | $ | 2,304 | $ | 74 | $ | 2,378 | ||||||||||||||||
| Total revenues |
7,248 | (232 | ) | 7,016 | 6,857 | (203 | ) | 6,654 | 11,463 | 74 | 11,537 | |||||||||||||||||||||||||
| Gross profit |
2,976 | (232 | ) | 2,744 | 2,988 | (203 | ) | 2,785 | 6,363 | 74 | 6,437 | |||||||||||||||||||||||||
| Income (loss) from operations |
124 | (232 | ) | (108 | ) | 282 | (203 | ) | 79 | 3,512 | 74 | 3,586 | ||||||||||||||||||||||||
| Other income (expense) |
42 | (45 | ) | (3 | ) | 36 | — | 36 | 76 | — | 76 | |||||||||||||||||||||||||
| Income before provision for income taxes |
441 | (277 | ) | 164 | 359 | (203 | ) | 156 | 3,560 | 74 | 3,634 | |||||||||||||||||||||||||
| Net income (loss) |
429 | (277 | ) | 152 | 193 | (203 | ) | (10 | ) | 3,670 | 74 | 3,744 | ||||||||||||||||||||||||
| Basic net income (loss) per share |
$ | 0.04 | $ | (0.02 | ) | $ | 0.02 | $ | 0.02 | $ | (0.02 | ) | $ | (0.00 | ) | $ | 0.34 | $ | 0.01 | $ | 0.35 | |||||||||||||||
|
|
|
|
|
|
|
|
|
|
|
|
|
|
|
|
|
|
|
|||||||||||||||||||
| Diluted net income (loss) per share |
$ | 0.01 | $ | (0.02 | ) | $ | (0.01 | ) | $ | 0.01 | $ | (0.02 | ) | $ | (0.01 | ) | $ | 0.34 | $ | 0.01 | $ | 0.35 | ||||||||||||||
| Comprehensive income |
$ | 635 | $ | (277 | ) | $ | 358 | $ | 804 | $ | (203 | ) | $ | 601 | $ | 2,479 | $ | 74 | $ | 2,553 | ||||||||||||||||
The following table presents the impact of these corrections on the Company’s consolidated statements of operations and comprehensive income for the year-to-date periods ending June 30, 2014 and September 30, 2014 (in thousands, except per share data):
| 6 Months Ended June 30, 2014 | 9 Months Ended September 30, 2014 | |||||||||||||||||||||||
| As Previously Reported |
Adjustment | As Revised | As Previously Reported |
Adjustment | As Revised | |||||||||||||||||||
| Service revenues |
$ | 5,023 | $ | (435 | ) | $ | 4,588 | $ | 7,327 | $ | (361 | ) | $ | 6,966 | ||||||||||
| Total revenues |
14,105 | (435 | ) | 13,670 | 25,568 | (361 | ) | 25,207 | ||||||||||||||||
| Gross profit |
5,964 | (435 | ) | 5,529 | 12,327 | (361 | ) | 11,966 | ||||||||||||||||
| Income (loss) from operations |
406 | (435 | ) | (29 | ) | 3,918 | (361 | ) | 3,557 | |||||||||||||||
| Other income (expense) |
78 | (45 | ) | 33 | 154 | (45 | ) | 109 | ||||||||||||||||
| Income before provision for income taxes |
800 | (480 | ) | 320 | 4,360 | (406 | ) | 3,954 | ||||||||||||||||
| Net income |
622 | (480 | ) | 142 | 4,292 | (406 | ) | 3,886 | ||||||||||||||||
| Basic net income per share |
$ | 0.05 | $ | (0.04 | ) | $ | 0.01 | $ | 0.38 | $ | (0.04 | ) | $ | 0.34 | ||||||||||
|
|
|
|
|
|
|
|
|
|
|
|
|
|||||||||||||
| Diluted net income (loss) per share |
$ | 0.02 | $ | (0.04 | ) | $ | (0.02 | ) | $ | 0.34 | $ | (0.04 | ) | $ | 0.31 | |||||||||
| Comprehensive income |
$ | 1,439 | $ | (480 | ) | $ | 959 | $ | 3,918 | $ | (406 | ) | $ | 3,512 | ||||||||||
The following table presents the impact of these corrections on the Company’s consolidated balance sheet items as of the end of each interim period (in thousands):
| 2014 | ||||||||||||||||||||||||||||||||||||
| March 31, | June 30, | September 30, | ||||||||||||||||||||||||||||||||||
| As Previously Reported |
Adjustment | As Revised | As Previously Reported |
Adjustment | As Revised | As Previously Reported |
Adjustment | As Revised | ||||||||||||||||||||||||||||
| Accounts receivable |
$ | 7,258 | $ | (241 | ) | $ | 7,017 | $ | 7,209 | $ | (241 | ) | $ | 6,968 | $ | 5,252 | $ | (331 | ) | $ | 4,921 | |||||||||||||||
| Total Current Assets |
23,165 | (241 | ) | 22,924 | 24,024 | (241 | ) | 23,783 | 25,834 | (331 | ) | 25,503 | ||||||||||||||||||||||||
| Total Assets |
51,613 | (241 | ) | 51,372 | 53,246 | (241 | ) | 53,005 | 53,722 | (331 | ) | 53,391 | ||||||||||||||||||||||||
| Deferred revenue |
637 | 36 | 673 | 764 | 239 | 1,003 | 904 | 75 | 979 | |||||||||||||||||||||||||||
| Total Current Liabilities |
5,971 | 36 | 6,007 | 6,825 | 239 | 7,064 | 5,181 | 75 | 5,256 | |||||||||||||||||||||||||||
| Total Liabilities |
11,890 | 36 | 11,926 | 12,609 | 239 | 12,848 | 10,502 | 75 | 10,577 | |||||||||||||||||||||||||||
| Accumulated deficit |
(241,233 | ) | (277 | ) | (241,510 | ) | (241,040 | ) | (480 | ) | (241,520 | ) | (237,370 | ) | (406 | ) | (237,776 | ) | ||||||||||||||||||
| Total Shareholders’ Equity |
39,173 | (277 | ) | 38,896 | 40,087 | (480 | ) | 39,607 | 42,670 | (406 | ) | 42,264 | ||||||||||||||||||||||||
| Total Liabilities & Shareholders’ Equity |
$ | 51,613 | $ | (241 | ) | $ | 51,372 | $ | 53,246 | $ | (241 | ) | $ | 53,005 | $ | 53,722 | $ | (331 | ) | $ | 53,391 | |||||||||||||||
F-19
Table of Contents
The following table presents the impact of these corrections on the Company’s consolidated statement of cash flows as of the end of each interim period (in thousands):
| 2014 | ||||||||||||||||||||||||||||||||||||
| March 31, | June 30, | September 30, | ||||||||||||||||||||||||||||||||||
| As Previously Reported |
Adjustment | As Revised | As Previously Reported |
Adjustment | As Revised | As Previously Reported |
Adjustment | As Revised | ||||||||||||||||||||||||||||
| Net income |
$ | 429 | $ | (277 | ) | $ | 152 | $ | 622 | $ | (480 | ) | $ | 142 | $ | 4,292 | $ | (406 | ) | $ | 3,886 | |||||||||||||||
| Changes in accounts receivable |
(17 | ) | 241 | 224 | 149 | 241 | 390 | 1,888 | 331 | 2,219 | ||||||||||||||||||||||||||
| Changes in deferred revenue |
(254 | ) | 36 | (218 | ) | (279 | ) | 239 | (40 | ) | (236 | ) | 75 | (161 | ) | |||||||||||||||||||||
There was no change to the total net cash provided by operating activities for any periods corrected.
The errors had the cumulative effect of reducing the Company’s previously reported total revenues during the first three quarters of 2014 by $0.4 million, from $25.6 million to $25.2 million. In addition, the Company has determined that $0.1 million of service revenues that were recognized in the first three quarters of 2014 will be recognized in 2015; and $0.2 million of revenues which were recognized during the second quarter of 2014 should have been recognized in the third quarter of 2014.
3. Goodwill and Intangible Assets
Changes to goodwill during the year ended December 31, 2014 were as follows (in thousands):
| Total | ||||
| Balance – December 31, 2013 |
$ | 11,152 | ||
| Translation adjustment |
(649 | ) | ||
|
|
|
|||
| Balance – December 31, 2014 |
$ | 10,503 | ||
|
|
|
|||
Intangible assets consist of the following at December 31, 2014 and December 31, 2013 (in thousands):
| Trademark | Developed Technology |
Customer Relationships |
Total | |||||||||||||
| Gross carrying amount – December 31, 2014 |
$ | 300 | $ | 1,370 | $ | 1,240 | $ | 2,910 | ||||||||
| Translation adjustment |
(5 | ) | (20 | ) | (18 | ) | (43 | ) | ||||||||
| Accumulated amortization |
(127 | ) | (333 | ) | (225 | ) | (685 | ) | ||||||||
|
|
|
|
|
|
|
|
|
|||||||||
| Balance – December 31, 2014 |
$ | 168 | $ | 1,017 | $ | 997 | $ | 2,182 | ||||||||
|
|
|
|
|
|
|
|
|
|||||||||
| Trademark | Developed Technology |
Customer Relationships |
Total | |||||||||||||
| Gross carrying amount – December 31, 2013 |
$ | 300 | $ | 1,370 | $ | 1,240 | $ | 2,910 | ||||||||
| Translation adjustment |
13 | 62 | 56 | 131 | ||||||||||||
| Accumulated amortization |
(36 | ) | (91 | ) | (86 | ) | (213 | ) | ||||||||
|
|
|
|
|
|
|
|
|
|||||||||
| Balance – December 31, 2013 |
$ | 277 | $ | 1,341 | $ | 1,210 | $ | 2,828 | ||||||||
|
|
|
|
|
|
|
|
|
|||||||||
Amortization expense related to the developed technology is classified as a component of cost of service revenues in the consolidated statements of operations. Amortization expense related to trademark and customer relationships is classified as a component of general and administrative expenses in the consolidated statements of operations.
F-20
Table of Contents
Acquired intangible assets are amortized over their estimated useful lives based on either the pattern in which the economic benefits of the intangible asset are consumed or on a straight-line method. The estimated useful life represents the anticipated term of the acquired intangible assets. The estimated useful lives for the trademark, developed technology and customer relationships are 3 years, 7 years and 7 years, respectively. The weighted average amortization period in total is 6.6 years.
Amortization expense for the years ended December 31, 2014 and 2013, was $0.7 million and $0.2 million, respectively. As of December 31, 2014, amortization expense on existing intangible assets for the next five years and beyond is as follows:
| Year |
Total | |||
| 2015 |
$ | 504 | ||
| 2016 |
458 | |||
| 2017 |
363 | |||
| 2018 |
333 | |||
| 2019 and thereafter |
524 | |||
|
|
|
|||
| Total |
$ | 2,182 | ||
|
|
|
|||
4. Debt and other Contractual Obligations
In September 2013, Columbia assumed debt of $3.9 million in connection with its acquisition of Molecular Profiles. Molecular Profiles entered into a Business Loan Agreement (“Loan Agreement”) covering three loan facilities with Lloyds TSB Bank (“Lloyds”), as administrative agent. Molecular Profiles had withdrawn $3.9 million and as of December 31, 2014 owed $3.5 million. The three loan facilities are each repayable by monthly installments, one started repayment in February 2013 and the remaining two commenced in October 2013. All facilities are due for repayment over 15 years from the date of drawdown. Two of the facilities bear interest at the Bank of England’s base rate plus 1.95% and 2.55%, respectively. The interest rate at December 31, 2013 for these two facilities was 2.45% and 3.05%, respectively. The third facility is a fixed rate agreement bearing interest at 3.52% per annum. The weighted average interest rate for the three loan facilities for the year ending December 31, 2014 was 3.00%. The Loan Agreement is secured by the mortgaged property and an unlimited lien on the other assets of Molecular Profiles. The Loan Agreement contains financial covenants that limit the amount of indebtedness Molecular Profiles may incur, requires Molecular Profiles to maintain certain levels of net worth, and restricts Molecular Profile’s ability to materially alter the character of its business. As of December 31, 2014 the Company is in compliance with all of the covenants under the Loan Agreement.
The Company’s significant outstanding contractual obligations relate to operating leases for the Company’s facilities and loan agreements assumed. The Company’s facility leases are non-cancellable and contain renewal options. The Company’s future contractual obligations include the following (in thousands):
| Total | 2015 | 2016 | 2017 | 2018 | 2019 | Thereafter | ||||||||||||||||||||||
| Operating lease obligations |
$ | 144 | $ | 108 | $ | 36 | $ | — | $ | — | $ | — | $ | — | ||||||||||||||
| Loan principal repayments |
3,532 | 243 | 250 | 257 | 265 | 273 | 2,244 | |||||||||||||||||||||
|
|
|
|
|
|
|
|
|
|
|
|
|
|
|
|||||||||||||||
| Total |
$ | 3,676 | $ | 351 | $ | 286 | $ | 257 | $ | 265 | $ | 273 | $ | 2,244 | ||||||||||||||
|
|
|
|
|
|
|
|
|
|
|
|
|
|
|
|||||||||||||||
Rent expense was $0.1 million for December 31, 2014 and $0.3 million for each of the years ended December 31, 2013 and 2012, respectively.
Interest expense, net was $0.1 million for December 31, 2014. Interest income, net was $0.1 million and $0.2 million for the years ended December 31, 2013 and 2012, respectively.
F-21
Table of Contents
As part of the acquisition of Molecular Profiles, Columbia assumed a $2.5 million obligation under a grant arrangement with the Regional Growth Fund on behalf of the Secretary of State for Business, Innovation, and Skills in the United Kingdom. Molecular Profiles used this grant to fund the building of its second facility, which includes analytical labs, office space, and a manufacturing facility. As a part of the arrangement, Molecular Profiles is required to create and maintain certain full-time equivalent personnel levels through October 2017. As of December 31, 2014, the Company is in compliance with the covenants of the arrangement.
The income from the Regional Growth Fund will be recognized on a decelerated basis over the next three years. As of December 31, 2014, the obligation is valued at $2.1 million due to foreign currency revaluation and is recorded in deferred revenue within the consolidated balance sheets. The amount of other income on the obligation that will be recognized provided the Company remains in compliance with the covenants would be the following (in thousands):
| Year |
Total | |||
| 2015 |
$ | 559 | ||
| 2016 |
808 | |||
| 2017 |
745 | |||
|
|
|
|||
| Total |
$ | 2,112 | ||
|
|
|
|||
5. Property and Equipment
Property and equipment consists of the following:
| December 31, | ||||||||||
| Estimated Useful Life (Years) |
2014 Cost |
2013 Cost |
||||||||
| Machinery and equipment |
3-10 | $ | 6,080 | $ | 4,288 | |||||
| Furniture and fixtures |
3-5 | 1,019 | 1,010 | |||||||
| Computer equipment and software |
3 | 188 | 183 | |||||||
| Buildings |
Up to 39 | 9,062 | 9,616 | |||||||
| Land |
Indefinite | 590 | 627 | |||||||
| Construction in-process |
107 | 104 | ||||||||
|
|
|
|
|
|||||||
| 17,046 | 15,828 | |||||||||
| Less: Accumulated depreciation |
(4,005 | ) | (2,602 | ) | ||||||
|
|
|
|
|
|||||||
| Total |
$ | 13,041 | $ | 13,226 | ||||||
|
|
|
|
|
|||||||
Depreciation expense for the years ended December 31, 2014, 2013, and 2012 was $1.4 million, $0.7 million and $0.6 million, respectively.
The net book value of property and equipment subject to lien is $7.2 million and $7.9 million as of December 31, 2014 and 2013, respectively.
6. Accrued Expenses
Accrued expenses consist of the following:
| December 31, | ||||||||
| 2014 | 2013 | |||||||
| Sales returns |
$ | — | $ | 138 | ||||
| Payroll |
660 | 1,012 | ||||||
| Professional fees |
610 | 892 | ||||||
| Other |
648 | 446 | ||||||
|
|
|
|
|
|||||
| Total |
$ | 1,918 | $ | 2,488 | ||||
|
|
|
|
|
|||||
F-22
Table of Contents
7. Income Taxes
(Loss) income before income taxes consists of the following (in thousands):
| Year Ended December 31, | ||||||||||||
| 2014 | 2013 | 2012 | ||||||||||
| Domestic |
$ | (489 | ) | $ | (4,091 | ) | $ | 3,462 | ||||
| Foreign |
4,867 | 10,817 | 6,458 | |||||||||
|
|
|
|
|
|
|
|||||||
| Income before income taxes |
$ | 4,378 | $ | 6,726 | $ | 9,920 | ||||||
|
|
|
|
|
|
|
|||||||
As of December 31, 2014, the Company does not have earnings in its foreign jurisdictions it currently does business. To the extent the Company has foreign earnings in the future, the Company will further assess whether or not it will permanently reinvest those earnings. As of December 31, 2014, the liability for repatriating foreign earnings is immaterial.
The components of the provision (benefit) for income taxes are as follows (in thousands):
| Year Ended December 31, | ||||||||||||
| 2014 | 2013 | 2012 | ||||||||||
| Current: |
||||||||||||
| Federal |
$ | 134 | $ | (20 | ) | $ | — | |||||
| State |
323 | (2 | ) | 3 | ||||||||
| Foreign |
531 | — | — | |||||||||
|
|
|
|
|
|
|
|||||||
| Total current |
988 | (22 | ) | 3 | ||||||||
| Deferred: |
||||||||||||
| Federal |
— | — | — | |||||||||
| State |
— | — | — | |||||||||
| Foreign |
— | 44 | — | |||||||||
|
|
|
|
|
|
|
|||||||
| Total deferred |
— | 44 | — | |||||||||
| Provision for income taxes |
$ | 988 | $ | 22 | $ | 3 | ||||||
|
|
|
|
|
|
|
|||||||
The reconciliation of the federal statutory rate to Columbia’s effective tax rate is as follows:
| 2014 | 2013 | 2012 | ||||||||||
| Federal income tax rate |
34.0 | % | 34.0 | % | 34.0 | % | ||||||
| Foreign rate differential |
(31.6 | )% | (53.9 | )% | (22.1 | )% | ||||||
| State tax, net of federal benefit |
77.8 | 8.5 | (19.7 | ) | ||||||||
| Permanent Items: |
||||||||||||
| Change in fair value of redeemable warrants |
— | — | — | |||||||||
| Change in fair market value of stock warrants |
(3.0 | ) | (4.0 | ) | (24.0 | ) | ||||||
| Incentive stock options |
2.4 | — | — | |||||||||
| Dividend from foreign subsidiary |
54.9 | — | — | |||||||||
| Subpart F inclusion |
— | 8.9 | — | |||||||||
| Acquisition costs capitalized |
— | 3.3 | — | |||||||||
| Amortization of technical rights |
(8.0 | ) | (5.2 | ) | (3.5 | ) | ||||||
| Deferred adjustments |
2.6 | (6.0 | ) | — | ||||||||
| Discrete prior year New Jersey liability |
7.3 | — | — | |||||||||
| Other |
0.8 | 1.1 | 3.9 | |||||||||
|
|
|
|
|
|
|
|||||||
| Effect of permanent differences |
57.0 | (1.9 | ) | (23.6 | ) | |||||||
|
|
|
|
|
|
|
|||||||
| Effective income tax rate |
137.2 | (13.3 | ) | (31.4 | ) | |||||||
| Change in valuation allowance |
(114.6 | ) | 13.6 | 31.4 | ||||||||
|
|
|
|
|
|
|
|||||||
| Effective income tax rate |
22.6 | % | 0.3 | % | 0.0 | % | ||||||
|
|
|
|
|
|
|
|||||||
F-23
Table of Contents
The Company follows the provisions of FASB ASC 740, “Accounting for Uncertainty in Income Taxes – An Interpretation of FASB No. 109.” FASB ASC 740 provides detailed guidance for the financial statement recognition, measurement and disclosure of uncertain tax positions recognized in the financial statements in accordance with ASC 740-20. Tax positions must meet a “more-likely-than-not” recognition threshold at the effective date to be recognized upon the adoption of FASB ASC 740 and in subsequent periods. Columbia recognizes interest and penalties, if any, related to uncertain tax positions in general and administrative expenses. No interest and penalties related to uncertain tax positions were accrued at December 31, 2014.
As a result of the Company’s relocation, certain state carryover attributes were remeasured and reduced in 2014, with a corresponding reduction to the valuation allowance. In addition, the Company realized a current one-time clawback expense under a New Jersey Economic Development Authority program of $0.3 million relating to the recapture of previously granted state incentives.
The Company operates in multiple countries. Accordingly, separate tax filings are required based on jurisdiction. Due to the separate tax filings of our U.S. and U.K jurisdictions, we have evaluated the need for a valuation allowance on a separate jurisdiction basis. As of December 31, 2014, we continue to maintain a full valuation allowance against all net domestic deferred tax assets. In 2014, the determination was made that it is not likely that the net deferred tax assets in the U.K. will be realized in the future. In the fourth quarter of 2014, it was determined that the utilization of our tax loss carryforwards in the U.K. was not likely to be realized based on updated forecasts and projections of product development efforts the Company is beginning to undertake, therefore, a full valuation allowance is recorded against all net U.K. deferred tax assets.
In assessing the realizability of deferred tax assets, management considers whether it is more likely than not that some portion or all deferred tax assets will not be realized. The ultimate realization of deferred tax assets is dependent upon the generation of future taxable income during the periods in which those temporary differences become deductible. Management considers the scheduled reversal of deferred tax liabilities, projected future taxable income, and tax-planning strategies in making this assessment. Management believes it is more likely than not that the results of future operations will not generate sufficient taxable income in the U.S. to realize the full benefits of its U.S. deferred tax assets.
As of December 31, 2014, the Company has U.S. tax net operating loss carryforwards of approximately $160 million, which expire through 2035. The Company also has unused tax credits of approximately $2.0 million, which expire at various dates through 2031. Utilization of the tax net operating loss carryforwards may be limited in any year due to limitations in the Internal Revenue Code. U.S. net operating loss carryforwards include no excess tax benefits from the exercise of share based awards due to the full valuation allowance that remains on the net domestic deferred tax assets. As of December 31, 2014, the Company had U.K. tax net operating loss carryforwards of approximately $12 million, which will not expire.
The Company files federal income tax returns as well as multiple state, local and foreign jurisdiction tax returns. Tax years ended December 31, 2012 or later remain subject to examination by the IRS. State and local jurisdiction tax returns remain subject to examination for tax years ended December 31, 2012 or later.
As of December 31, 2014, the Company’s open tax years subject to audit are 2012, 2013 and 2014. The Internal Revenue Service has concluded their audit of the 2010 and 2011 tax years. There were no material findings resulting from their audit.
F-24
Table of Contents
The components of Columbia’s net deferred tax assets and liabilities are as follows (in thousands):
| December 31, 2014 |
2013 | |||||||
| Share based awards compensation |
$ | 1,085 | $ | 1,128 | ||||
| Allowance for returns |
— | 56 | ||||||
| Inventory reserve |
— | 9 | ||||||
| Book accumulated depreciation net of tax |
(1,475 | ) | (1,655 | ) | ||||
| Other deferred revenue |
335 | 448 | ||||||
| Patents |
1,290 | 1,335 | ||||||
| Federal net operating loss |
52,050 | 54,572 | ||||||
| State net operating loss |
1,133 | 4,321 | ||||||
| Foreign losses |
2,368 | 2,269 | ||||||
| Unused R&D credit |
1,723 | 1,740 | ||||||
| Write-up of intangibles |
(443 | ) | (589 | ) | ||||
| Other |
201 | 114 | ||||||
| Net deferred tax assets |
58,267 | 63,748 | ||||||
| Less: valuation allowance: |
||||||||
| Federal |
(58,267 | ) | (63,178 | ) | ||||
|
|
|
|
|
|||||
| Deferred tax asset |
$ | — | $ | 570 | ||||
|
|
|
|
|
|||||
8. Shareholders’ Equity
Preferred Stock
Authorized Preferred Stock is 1,000,000 shares at a par value of 0.01 per share.
Each share of Series B Preferred Stock is convertible into 20 shares of common stock. At December 31, 2014, only 130 shares remain outstanding. Upon liquidation of the Company, the holders of the Series B Preferred Stock are entitled to $100 per share. The Series B Preferred Stock will be automatically converted into common stock upon the occurrence of certain events. Holders of the Series B Preferred Stock are entitled to one vote for each share of common stock into which the preferred stock is convertible.
The Series C Preferred Stock has a stated redemption value of $1,000 per share. The Series C Preferred Stock is convertible into common stock at the lower of: (i) $28.00 per common share or (ii) 100% of the average of the closing prices during the three trading days immediately preceding the conversion notice (not to exceed 294,045 shares). The Series C Preferred Stock pays a 5% dividend, payable quarterly in arrears on the last day of the quarter. In 2012, 50 shares of Series C Preferred Stock were redeemed for cash. Each holder of Series C Preferred Stock has the right to redeem all or a portion of their shares in cash and upon the occurrence of certain events under the Series C Preferred Stock certificate of designations.
In September 2012, a holder of 50 shares of the Company’s contingently redeemable Series C Convertible Preferred Stock redeemed those shares pursuant to Section 6.5 of the Certificate of Designations for the Series C Preferred (“Certificate of Designations”), which provides that following a “Triggering Event,” as defined therein, the holders of the Company’s shares of Series C Preferred have the right to require us to redeem their shares in cash plus all accrued and unpaid dividends thereon on the date such redemption is demanded. The Actavis Transactions were a Triggering Event. There is no deadline following a Triggering Event by which a holder is required to make a redemption request. As a result, the Company redeemed the 50 shares for $50,000 (the “Mandatory Redemption Price” as defined in the Certificate of Designations) plus accrued and unpaid dividends. Five hundred fifty (550) shares of Series C Convertible Preferred Stock remain outstanding.
F-25
Table of Contents
The Series E Preferred Stock has a stated value of $100 per share. In November 2013, 22,740 shares of Series E Preferred Stock were converted into 142,125 shares of common stock. As of December 31, 2014 and 2013 there are no shares outstanding.
In March 2002, the Company adopted a Stockholder Rights Plan (the “Rights Plan”) designed to protect company stockholders in the event of takeover activity that would deny them the full value of their investment. The Rights Plan was not adopted in response to any specific takeover threat. In adopting the Rights Plan, the Board declared a dividend distribution of one preferred stock purchase right for each outstanding share of common stock of the Company, payable to stockholders of record at the close of business on March 22, 2002. The rights will become exercisable only in the event, with certain exceptions, a person or group of affiliated or associated persons acquires a specified amount (the “Specified Amount”) (originally 15%) or more of the Company’s voting stock, or a person or group of affiliated or associated persons commences a tender or exchange offer which, if successfully consummated, would result in such person or group owning the Specified Amount or more of the Company’s voting stock. Each right, once exercisable, will entitle the holder (other than rights owned by an acquiring person or group) to buy one one-thousandth of a share of a series of the Company’s Series D Junior Participating Preferred Stock at a price of $30 per one-thousandth of a share, subject to adjustments. In addition, upon the occurrence of certain events, holders of the rights (other than rights owned by an acquiring person or group) would be entitled to purchase either the Company’s preferred stock or shares in an “acquiring entity” at approximately half of market value. Further, at any time after a person or group acquires the Specified Amount or more (but less than 50%) of the Company’s outstanding voting stock, subject to certain exceptions, the Board of Directors may, at its option, exchange part or all of the rights (other than rights held by an acquiring person or group) for shares of the Company’s common stock having a fair market value on the date of such acquisition equal to the excess of (i) the fair market value of preferred stock issuable upon exercise of the rights over (ii) the exercise price of the rights. The Company generally will be entitled to redeem the rights at $0.01 per right at any time prior to the close of business on the tenth day after there has been a public announcement of the beneficial ownership by any person or group of the Specified Amount or more of the Company’s voting stock, subject to certain exceptions.
In November 2010, the Board of Directors of the Company adopted an amendment and restatement (the “Amendment”) of the Rights Plan, dated as of March 13, 2002 (the “Original Rights Agreement”), between the Company and American Stock Transfer & Trust Company, LLC, as successor rights agent (as amended, the “Rights Plan”). In general, the Amendment leaves the Original Rights Agreement unchanged in all material respects, other than changing the trigger for the Rights becoming exercisable from 15% to 4.99% of the outstanding Voting Rights (as defined in the Rights Plan), expanding the concept of “beneficial ownership” to include shares owned (including those owned indirectly and constructively) under Section 382 of the Code and modifying the provisions relating to the exchange of Rights for common stock.
The Company adopted the Amendment to preserve the value of the Company’s net operating loss carry forwards (the “Tax Benefits”), because its ability to fully use the Tax Benefits on an annual basis to offset future income may be substantially limited if the Company experiences an “ownership change” for purposes of Section 382 of the Internal Revenue Code of 1986 (the “Code”). Generally, the Company would experience an “ownership change” under Section 382 of the Code if a greater than 50 percentage point change in ownership of the Voting Stock (as defined in the Rights Plan and described below) by stockholders who beneficially own (or who are deemed to own) 5% or more of the Company’s Voting Stock occurs over a rolling three year period.
In September 2011, the Company and American Stock Transfer and Trust Company, LLC, as rights agent, further amended the Rights Plan to extend the expiration date of the rights from March 12, 2012 to July 3, 2013. In March 2013, the Company further amended the Rights Plan to extend the expiration date from July 3, 2013, to July 3, 2016. Except for the extension of the expiration date, the Rights Plan otherwise remained unmodified. The extension was made to preserve the value of the Tax Benefits.
In January 2015, the Company’s Board of Directors approved an amendment that increases the threshold ownerslip trigger from 4.99% to 9.99%. Accordingly, the Rights Plan is presently designed to reduce the
F-26
Table of Contents
likelihood that the Company will experience an ownership change by discouraging any person (together with such person’s affiliates and associates), without the approval of the Board, (i) from acquiring 9.99% or more of the outstanding Voting Stock and (ii) that currently beneficially owns 9.99% or more of the outstanding Voting Stock from acquiring more shares of Voting Stock, other than by exercise or conversion of currently existing warrants, convertible securities or other equity-linked securities. There is no guarantee that the Rights Plan will prevent the Company from experiencing an ownership change.
Common Stock
The Company granted 23,562 shares of restricted stock to the Company’s independent Directors during the year ended December 31, 2014.
The Company granted 28,083 shares of restricted stock to the Company’s independent Directors during the year ended December 31, 2013. On September 12, 2013, as part of the total consideration paid for the acquisition of Molecular Profiles, the Company issued 1,051,323 shares of common stock.
During the second quarter of 2012, the Company granted 22,059 shares of restricted stock to the Company’s independent Directors.
Warrants
As of December 31, 2014, the Company had warrants outstanding for the purchase shares of common stock. Information on outstanding warrants is as follows:
| Weighted Average Exercise Price |
Warrants | Expiration Date | ||
| $10.80 |
502,907 | 07/02/2015 | ||
| $12.16 |
621,275 | 04/30/2015 | ||
|
|
|
| ||
| $11.55 |
1,124,182 | |||
|
|
During the years ended December 31, 2014 and 2013, there were no warrants issued or exercised.
9. Stock-based Compensation
Stock Option Plans
In May of 2008, the Company adopted the 2008 Long-term Incentive Plan (“2008 Plan”) which provides for the grant of stock options, stock appreciation rights and restricted stock to certain designated employees of the Company, Non-Employee directors of the Company and certain other persons performing significant services for the Company as designated by the Compensation Committee of the Board of Directors. At December 31, 2014, the number of common shares reserved for issuance under the 2008 plan was 1,250,000. Options granted under the plan vest either (i) over a 48-month period at the rate of 25% each year until fully vested or (ii) over a vesting period determined by the Board of Directors. As of December 31, 2014, there were 558,859 shares available for future grant under the 2008 plan.
The Company’s stock options have a maximum term of ten years from the date of grant. Options granted prior to 2006 have a ten-year term. Since 2006, the Company has been granting stock options with a seven-year term. Options generally vest over a four-year period, with 25% vesting on each of the first four anniversaries of the date of grant. The 2007 annual option grant to employees vested 25% of the grant upon the grant date with the balance to vest equally over the next three years. The 2008 annual grant vested over four years. The Company’s general policy is to issue new shares upon the exercise of stock options. The Company’s current policy is to utilize shares held in treasury to settle option exercises and issue new shares for restricted stock grants.
F-27
Table of Contents
A summary of the status of the Company’s stock option plans as of December 31, 2014 is as follows:
| Number of Options |
Weighted- Average Exercise Price |
Weighted- Average Remaining Contractual Life |
Aggregate Intrinsic Value (in thousands) |
|||||||||||||
| Outstanding, December 31, 2013 |
279,198 | 11.09 | 4.53 years | — | ||||||||||||
| Granted |
312,000 | 6.74 | ||||||||||||||
| Exercised |
(6,562 | ) | 5.02 | 10,161 | ||||||||||||
| Forfeited |
(138,952 | ) | 8.77 | |||||||||||||
|
|
|
|
|
|
|
|||||||||||
| Outstanding, December 31, 2014 |
445,684 | $ | 8.28 | 5.11 years | $ | 45,625 | ||||||||||
|
|
|
|
|
|
|
|||||||||||
| Vested |
131,654 | 11.76 | 2.99 years | 14,656 | ||||||||||||
| Unvested |
314,030 | 6.82 | 30,969 | |||||||||||||
|
|
|
|
|
|
|
|||||||||||
| Vested or expected to vest, December 31, 2014 |
445,684 | $ | 8.28 | 5.11 years | $ | 45,625 | ||||||||||
|
|
|
|
|
|
|
|||||||||||
| Exercisable, December 31, 2014 |
131,654 | $ | 11.76 | 2.99 years | $ | 14,656 | ||||||||||
The intrinsic value of options exercised in 2014, 2013, and 2012, respectively, were $10,161, $4,380, and $0.
Restricted stock grants consist of grants of the Company’s common stock that may vest in the future. The Board has set a one, two, or four year vesting period for most of the issued restricted shares except annual grants to independent Directors which vest at the next annual meeting of stockholders. The fair value of each restricted share grant is equal to the market price of the Company’s common stock at the date of grant. Expense relating to restricted shares is at the closing price amortized ratably over the vesting period.
A summary of the Company’s restricted stock activity and related information for the year ended December 31, 2014 is as follows:
| Shares | Weighted Average Grant Date Fair Value |
|||||||
| Unvested, December 31, 2013 |
28,083 | $ | 5.34 | |||||
| Granted |
23,562 | $ | 6.57 | |||||
| Vested |
(28,815 | ) | $ | 5.34 | ||||
| Forfeited |
— | $ | — | |||||
|
|
|
|||||||
| Unvested, December 31, 2014 |
22,830 | $ | 6.57 | |||||
|
|
|
|||||||
As of December 31, 2014, there were $0.1 million of total unrecognized compensation costs related to non-vested restricted share-based compensation. The remaining cost is expected to be recognized over a weighted average period of 0.46 years. The total fair value of shares vested during the year ended December 31, 2014 was $0.1 million.
10. Related Party Transactions
From July 2010 to November 2013 the Company manufactured and sold products to Actavis at Columbia’s cost plus 10%; the revenues generated from these sales were recorded within product revenues from related party. Pursuant to the Purchase and Collaboration Agreement dated July 2, 2010, Columbia receives royalties equal to a minimum of 10% of annual net sales of CRINONE by Actavis for annual net sales up to $150 million, 15% for sales above $150 million but less than $250 million; and 20% for annual net sales of $250 million and over.
F-28
Table of Contents
On March 7, 2014 the Company acquired all of its common stock beneficially owned by Actavis, which represented approximately 11.5% of the Company’s outstanding common stock. Immediately following the closing of the stock repurchase and as of December 31, 2014, Actavis did not own any of the Company’s outstanding common stock. Columbia purchased the 1.4 million shares held by Actavis at a price of $6.08 per share, which represented a 10.75% discount to the market closing price on March 6, 2014. The total purchase price was approximately $8.5 million. At December 31, 2013, Actavis owned 11.5% of the Company’s outstanding common stock.
The table below presents the related party transactions between the Company and Actavis for the years ended, December 31, 2014, 2013 and 2012 (in thousands):
| 2014 | 2013 | 2012 | ||||||||||
| Revenues: |
||||||||||||
| Product revenues |
$ | 167 | $ | — | $ | 4,305 | ||||||
| Royalties |
714 | 3,436 | 3,079 | |||||||||
| Other revenues |
— | 300 | — | |||||||||
|
|
|
|
|
|
|
|||||||
| Total revenues |
881 | 3,736 | 7,384 | |||||||||
|
|
|
|
|
|
|
|||||||
| Cost of product revenues: |
||||||||||||
| Cost of product revenues |
— | — | 3,913 | |||||||||
|
|
|
|
|
|
|
|||||||
| Gross profit |
$ | 881 | $ | 3,736 | $ | 3,471 | ||||||
|
|
|
|
|
|
|
|||||||
As of December 31, 2014 and December 31, 2013, amounts due from related party for these sales were $0 and $0.9 million, respectively. There were no amounts due to Actavis as of December 30, 2014 and December 31, 2013.
Other revenues for the year ended December 31, 2013, consisted of a $0.3 million one-time payment associated with the termination of the supply agreement with Actavis in fourth quarter of 2013.
In the year ended December 31, 2012, Actavis reimbursed Columbia $0.4 million, for certain research and development expenses pursuant to the purchase agreement. There are no further research and development expenses to be reimbursed by Actavis related to the purchase agreement.
11. Legal Proceedings
Claims and lawsuits are filed against the Company from time to time. Although the results of pending claims are always uncertain, the Company believes that it has adequate reserves or adequate insurance coverage in respect of these claims, but no assurance can be given as to the sufficiency of such reserves or insurance coverage in the event of any unfavorable outcome resulting from these actions.
Between February 1, 2012 and February 6, 2012, two putative securities class action complaints were filed against Columbia and certain of its officers and directors in the United States District Court for the District of New Jersey. These actions were filed under the captions Wright v. Columbia Laboratories, Inc., et al., and Shu v. Columbia Laboratories, Inc., et al. and asserted claims under sections 10(b) and 20(a) of the Securities Exchange Act of 1934 as amended (the “Exchange Act”) and Rule 10b-5 promulgated under the Exchange Act on behalf of an alleged class of purchasers of the common stock during the period from December 6, 2010 through January 20, 2012. Both actions were consolidated into a single proceeding entitled In re Columbia Laboratories, Inc., Securities Litigation, under which Actavis and three of its officers were added as defendants. The Consolidated Amended Complaint alleged that Columbia and two of its officers, one of whom is a director, omitted to state material facts that they were under a duty to disclose, and made materially false and misleading statements that related to the results of Columbia’s PREGNANT study and the likelihood of approval by the U.S. Food and Drug Administration (“FDA”) of a New Drug Application (“NDA”) to market progesterone
F-29
Table of Contents
vaginal gel 8% for the prevention of preterm birth in women with premature cervical shortening. According to the amended complaint, these alleged omissions and misleading statements had the effect of artificially inflating the market price of the common stock. The plaintiffs sought unspecified damages on behalf of the putative class and an award of costs and expenses, including attorney’s fees. On June 11, 2013, the Court dismissed the amended complaint for failure to state a claim upon which relief could be granted, holding that the plaintiffs did not adequately plead facts supporting an inference of an intent to deceive investors. The Court permitted the plaintiffs to file a second amended complaint, which they did on July 11, 2013. Columbia moved to dismiss the second amended complaint, which the court did on October 21, 2013. The Court ruled that changes the plaintiffs made to their first amended complaint “still do not create a strong inference that the Defendants acted with an intent to deceive, manipulate or defraud.” The Court ordered that if the plaintiffs sought to attempt to plead a cognizable action in a third amended complaint, they must do so within thirty days and specifically address why the attempt would not be futile. The plaintiffs chose not to file any further amendments and the case was dismissed with prejudice on December 2, 2013. On December 20, 2013, the plaintiffs appealed the dismissal to the United States Court of Appeals for the Third Circuit. The Court heard oral arguments on December 9, 2014. On March 10, 2015, the Court affirmed the dismissal in a written opinion. By rule, the plaintiffs may request a rehearing. Columbia believes that the action is without merit, and intends to defend it vigorously. At this time, it is not possible to determine the likely outcome of, or to estimate the potential liability related to this action, and Columbia has not made any provision for losses in connection with it.
12. Segments and Geographic Information
The Company currently operate in two segments; product and service. The product segment includes supply chain management for CRINONE, the Company’s sole commercialized product. The service segment includes pharmaceutical development, clinical trial manufacturing, and advanced analytical and consulting services for the Company’s customers as well as characterizing and developing pharmaceutical product candidates for the Company’s internal programs. The Company has consolidated and runs all of its operational functions in one location in Nottingham, United Kingdom. The Company owns certain plant and equipment physically located at third party contractor facilities in the United Kingdom and Switzerland. The Company conducts its advanced formulation, analytical and consulting services through its subsidiary, Molecular Profiles.
The Company’s largest customer, Merck Serono, utilizes a Switzerland-based subsidiary to acquire product from the Company, which it then sells throughout the world excluding the U.S. The Company’s primary domestic customer, Actavis, is responsible for the commercialization and sale of progesterone products in the United States. The following tables show selected information by geographic area:
Revenues:
| Year Ended December, 31 | ||||||||||||
| 2014 | 2013 | 2012 | ||||||||||
| United States |
$ | 10,374 | $ | 5,463 | $ | 8,567 | ||||||
| Switzerland |
17,860 | 21,729 | 17,261 | |||||||||
| Other countries |
4,230 | 2,034 | — | |||||||||
|
|
|
|
|
|
|
|||||||
| Subtotal international |
22,090 | 23,763 | 17,261 | |||||||||
|
|
|
|
|
|
|
|||||||
| Total |
$ | 32,464 | $ | 29,226 | $ | 25,828 | ||||||
|
|
|
|
|
|
|
|||||||
F-30
Table of Contents
Total assets:
| December 31, | ||||||||
| 2014 | 2013 | |||||||
| United States |
$ | 18,212 | $ | 20,278 | ||||
| Switzerland |
1,661 | 3,063 | ||||||
| United Kingdom |
32,140 | 36,486 | ||||||
| Other countries |
195 | 265 | ||||||
|
|
|
|
|
|||||
| Total |
$ | 52,208 | $ | 60,092 | ||||
|
|
|
|
|
|||||
Long-lived assets:
| December 31, | ||||||||
| 2014 | 2013 | |||||||
| United States |
$ | 245 | $ | 306 | ||||
| Switzerland |
529 | 22 | ||||||
| United Kingdom |
12,361 | 12,987 | ||||||
| Other countries |
2 | — | ||||||
|
|
|
|
|
|||||
| Total |
$ | 13,137 | $ | 13,315 | ||||
|
|
|
|
|
|||||
The decrease in the amount of total assets is due primarily to the Actavis share buyback.
The following summarizes other information by segment for the year ended December 31, 2014 (in thousands):
| Product | Service | Total | ||||||||||
| Revenues |
||||||||||||
| Product revenues |
$ | 17,381 | $ | — | $ | 17,381 | ||||||
| Service revenues |
— | 8,770 | 8,770 | |||||||||
| Royalties |
6,313 | — | 6,313 | |||||||||
| Other revenues |
— | — | — | |||||||||
|
|
|
|
|
|
|
|||||||
| Total revenues |
23,694 | 8,770 | 32,464 | |||||||||
|
|
|
|
|
|
|
|||||||
| Cost of product revenues |
10,470 | — | 10,470 | |||||||||
| Cost of service revenues |
— | 7,219 | 7,219 | |||||||||
|
|
|
|
|
|
|
|||||||
| Total cost of revenues |
10,470 | 7,219 | 17,689 | |||||||||
|
|
|
|
|
|
|
|||||||
| Gross profit |
13,224 | 1,551 | 14,775 | |||||||||
| Total operating expenses |
10,960 | |||||||||||
| Total non-operating income |
563 | |||||||||||
| Income before income taxes |
4,378 | |||||||||||
F-31
Table of Contents
The following summarizes other information by segment for the year ended December 31, 2013 (in thousands):
| Product | Service | Total | ||||||||||
| Revenues |
||||||||||||
| Product revenues |
$ | 21,336 | $ | — | $ | 21,336 | ||||||
| Service revenues |
— | 3,640 | 3,640 | |||||||||
| Royalties |
3,831 | — | 3,831 | |||||||||
| Other revenues |
419 | — | 419 | |||||||||
|
|
|
|
|
|
|
|||||||
| Total revenues |
25,586 | 3,640 | 29,226 | |||||||||
|
|
|
|
|
|
|
|||||||
| Cost of product revenues |
10,903 | — | 10,903 | |||||||||
| Cost of service revenues |
— | 2,347 | 2,347 | |||||||||
|
|
|
|
|
|
|
|||||||
| Total cost of revenues |
10,903 | 2,347 | 13,250 | |||||||||
|
|
|
|
|
|
|
|||||||
| Gross profit |
14,683 | 1,293 | 15,976 | |||||||||
| Total operating expenses |
10,101 | |||||||||||
| Total non-operating income |
851 | |||||||||||
| Income before income taxes |
6,726 | |||||||||||
The following summarizes other information by segment or the year ended December 31, 2012 (in thousands):
| Product | ||||
| Revenues |
||||
| Product revenues |
$ | 22,231 | ||
| Royalties |
3,459 | |||
| Other revenues |
138 | |||
|
|
|
|||
| Total revenues |
25,828 | |||
|
|
|
|||
| Cost of product revenues |
12,788 | |||
|
|
|
|||
| Total cost of revenues |
12,788 | |||
|
|
|
|||
| Gross profit |
13,040 | |||
| Total operating expenses |
10,231 | |||
| Total non-operating income |
7,111 | |||
| Income before income taxes |
9,920 | |||
Our chief operating decision maker evaluates the performance of our product and service segments based on gross profit. Our chief operating decision maker does not review our assets, operating expenses or non-operating income and expenses by business segment at this time. Therefore, such allocations by segment are not provided.
F-32
Table of Contents
Customer Concentration
The following table presents information about Columbia’s revenues by customer, including product sales, royalty and license revenue and service revenues for each customer accounting for 10% or more of consolidated revenues in any of the three years ended December 31 (in thousands) by segment:
Product
| Year Ended December, 31 |
||||||||||||
| 2014 | 2013 | 2012 | ||||||||||
| Merck Serono |
73 | % | 83 | % | 67 | % | ||||||
| Actavis |
17 | 15 | 31 | |||||||||
| Lil’ Drug Store |
10 | 2 | 1 | |||||||||
| All others |
— | — | 1 | |||||||||
|
|
|
|
|
|
|
|||||||
| Total |
100 | % | 100 | % | $ | 100 | % | |||||
|
|
|
|
|
|
|
|||||||
Service
Two of our customers in our service segment represented 11% and 10% of total service revenue for the year ended December 31, 2014. Three customers in our service segment represented 15%, 13% and 12% of total service revenue for the year ended December 31, 2013. No other customers accounted for 10% or more of total service revenue for the years ended December 31, 2014 and 2013. We had no service revenue for the year ended December 31, 2012.
13. Quarterly Financial Information (Unaudited)
For reasons discussed in the section entitled “Revisions of Prior Interim Period Financial Statements” of Note 2, Summary of Significant Accounting Policies, the Company has revised its previously issued consolidated interim financial statements for the quarterly periods ended March 31, 2014, June 30, 2014, and September 30, 2014. The revisions are being made to correct certain immaterial errors relating to the recognition of certain services transactions and contractual arrangements.
The following tables summarize the effects of the revisions on our previously issued unaudited condensed consolidated financial statements (in thousands except per share data):
| 2014 | ||||||||||||||||||||||||||||||||||||||||
| 1st Quarter | 2nd Quarter | 3rd Quarter | 4th Quarter |
|||||||||||||||||||||||||||||||||||||
| As Previously Reported |
Adjustment | As Revised | As Previously Reported |
Adjustment | As Revised | As Previously Reported |
Adjustment | As Revised | ||||||||||||||||||||||||||||||||
| Revenue |
$ | 7,248 | $ | (232 | ) | $ | 7,016 | $ | 6,857 | $ | (203 | ) | $ | 6,654 | $ | 11,463 | $ | 74 | $ | 11,537 | $ | 7,259 | ||||||||||||||||||
| Gross profit |
2,976 | (232 | ) | 2,744 | 2,988 | (203 | ) | 2,785 | 6,363 | 74 | 6,437 | 2,811 | ||||||||||||||||||||||||||||
| Operating expenses |
2,852 | 2,852 | 2,706 | 2,706 | 2,851 | 2,851 | 2,551 | |||||||||||||||||||||||||||||||||
| Income (loss) from operations |
124 | (232 | ) | (108 | ) | 282 | (203 | ) | 79 | 3,512 | 74 | 3,586 | 260 | |||||||||||||||||||||||||||
| Change in fair value of common stock warrants |
309 | 309 | 70 | 70 | 1 | 1 | — | |||||||||||||||||||||||||||||||||
| Net income (loss) |
429 | (277 | ) | 152 | 193 | (203 | ) | (10 | ) | 3,670 | 74 | 3,744 | (494 | ) | ||||||||||||||||||||||||||
| Income (loss) per common share: |
||||||||||||||||||||||||||||||||||||||||
| Basic |
$ | 0.04 | $ | (0.02 | ) | $ | 0.01 | $ | 0.02 | $ | (0.02 | ) | $ | (0.00 | ) | $ | 0.34 | $ | 0.01 | $ | 0.35 | $ | (0.05 | ) | ||||||||||||||||
|
|
|
|
|
|
|
|
|
|
|
|
|
|
|
|
|
|
|
|
|
|||||||||||||||||||||
| Diluted |
$ | 0.01 | $ | (0.02 | ) | $ | (0.01 | ) | $ | 0.01 | $ | (0.02 | ) | $ | (0.01 | ) | $ | 0.34 | $ | 0.01 | $ | 0.35 | $ | (0.05 | ) | |||||||||||||||
F-33
Table of Contents
The following table summarizes selected quarterly data for the years ended December 31, 2013 (in thousands except per share data):
| First Quarter |
Second Quarter |
Third Quarter |
Fourth Quarter |
|||||||||||||
| 2013 | ||||||||||||||||
| Revenues |
$ | 6,316 | $ | 7,978 | $ | 7,126 | $ | 7,806 | ||||||||
| Gross profit |
3,474 | 5,147 | 3,887 | 3,468 | ||||||||||||
| Operating expenses |
2,461 | 2,319 | 2,620 | 2,701 | ||||||||||||
| Income from operations |
1,013 | 2,828 | 1,267 | 767 | ||||||||||||
| Change in fair value of common stock warrants |
205 | (155 | ) | 428 | 316 | |||||||||||
| Net income |
1,242 | 2,657 | 1,718 | 1,087 | ||||||||||||
| Income per common share: |
||||||||||||||||
| Basic |
$ | 0.11 | $ | 0.24 | $ | 0.15 | $ | 0.09 | ||||||||
| Diluted |
$ | 0.09 | $ | 0.24 | $ | 0.11 | $ | 0.06 | ||||||||
The explanations for major variances from the fourth quarters for the years ended December 31, 2014 and 2013 are:
| 1. | In the fourth quarter of 2014, the Company recorded an income tax provision for approximately $0.9 million, associated with recording a valuation allowance of its net deferred tax assets in the United Kingdom jurisdiction. |
| 2. | In the fourth quarter of 2013, the Company recorded other revenues of $0.3 million for the termination of the supply agreement with Actavis. |
F-34
Table of Contents
EXHIBIT INDEX
| Exhibit | Index Description of Exhibit | |
| 2.1 | Purchase and Collaboration Agreement, dated March 3, 2010, by and between Columbia Laboratories, Inc. and Coventry Acquisition, Inc. (incorporated by reference to Exhibit 2.1 to the Registrant’s Current Report on Form 8-K (File No. 001-10352), filed on March 4, 2010) | |
| 2.2 | Share Purchase Agreement, dated September 2013, between the Sellers, Columbia Laboratories, Inc. and Molecular Profiles Limited (incorporated by reference to Exhibit 2.1 to the Registrant’s Current Report on Form 8-K (File No. 001-10352), filed on September 18, 2013) | |
| 2.3 | Stock Purchase Agreement, dated March 6, 2014, by and between Columbia Laboratories, Inc. and Coventry Acquisition, Inc. (incorporated by reference to Exhibit 10.1 to the Registrant’s Current Report on Form 8-K (File No. 001-10352), filed on March 7, 2014) | |
| 3.1 | Restated Certificate of Incorporation of the Company, as amended (incorporated by reference to Exhibit 3.1 to the Registrant’s Annual Report on Form 10-K (File No. 001-10352) for the year ended December 31, 2005, filed on March 13, 2006) | |
| 3.2 | Certificate of Amendment of Restated Certificate of Incorporation of the Company (incorporated by reference to Exhibit 3.1 to the Registrant’s Current Report on Form 8-K (File No. 001-10352), filed on July 6, 2010) | |
| 3.3 | Certificate of Amendment of Restated Certificate of Incorporation of the Company (incorporated by reference to Exhibit 3.1 to the Registrant’s Current Report on Form 8-K (File No. 001-10352), filed on August 8, 2013) | |
| 3.4 | Amended and Restated By-laws of Company (incorporated by reference to Exhibit 3.2 to the Registrant’s Current Report on Form 8-K (File No. 001-10352), filed on January 12, 2015) | |
| 4.1 | Certificate of Designations, Preferences and Rights of Series C Convertible Preferred Stock of the Company, dated as of January 7, 1999 (incorporated by reference to Exhibit 4.1 to the Registrant’s Annual Report on Form 10-K (File No. 001-10352) for the year ended December 31, 1998, filed on March 25, 1999) | |
| 4.2* | Form of Restricted Stock Agreement (incorporated by reference to Exhibit 10.62 of the Registrant’s Current Report on Form 8-K (File No. 001-10352), filed on May 17, 2006) | |
| 4.3* | Form of Option Agreement (incorporated by reference to Exhibit 4.10 to the Registrant’s Annual Report on Form 10-K (File No. 001-10352) for the year ended December 31, 2008, filed on March 16, 2009) | |
| 4.4 | Amended and Restated Rights Agreement by and between Columbia Laboratories, Inc. and American Stock Transfer & Trust Company, LLC dated January 28, 2015 (incorporated by reference to Exhibit 4.1 to the Registrant’s Current Report on Form 8-K (File No. 001-10352), filed on January 30, 2015) | |
| 4.5* | Form of Award Agreement under the Amended and Restated 2008 Long-term Incentive Plan of Columbia Laboratories, Inc. (incorporated by reference to Exhibit 4.4 to the Registrant’s Registration Statement on Form S-8 (File No. 333-18647), filed on May 16, 2013) | |
| 10.1* | 1996 Long-term Performance Plan, as amended, of the Company (incorporated by reference to Annex A to the Registrant’s Proxy Statement (File No. 001-10352), filed on May 10, 2000) | |
| 10.2 | License Agreement, dated April 18, 2000, between the Company and Lil’ Drug Store Products, Inc. (incorporated by reference to Exhibit 10.23 to the Registrant’s Quarterly Report on Form 10-Q (File No. 001-10352) for the quarter ended March 31, 2000, filed on May 15, 2000) | |
| 10.3* | Form of Indemnification Agreement for Officers and Directors (incorporated by reference to Exhibit 10.46 to the Registrant’s Annual Report on Form 10-K (File No. 001-10352) for the year ended December 31, 2003, filed on March 15, 2004) | |
Table of Contents
| 10.4 | Packaging Agreement, dated October 28, 1993, between Columbia Laboratories (Ireland) Ltd. and Maropack AG (incorporated by reference to Exhibit 10.32 to the Registrant’s Annual Report on Form 10-K (File No. 001-10352) for the year ended December 31, 2007, filed on March 28, 2008) | |
| 10.5* | Columbia Laboratories, Inc. Amended and Restated 2008 Long-Term Incentive Plan (incorporated by reference to Appendix B to the Registrant’s Proxy Statement (File No. 001-10352), filed on March 22, 2013) | |
| 10.6* | Columbia Laboratories, Inc. [Amended and Restated] Incentive Plan (incorporated by reference to Exhibit 10.24 to the Registrant’s Annual Report on Form 10-K (File No. 001-10352) for the year ended December 31, 2008, filed on March 16, 2009) | |
| 10.7* | Form of Executive Change of Control Severance Agreement (incorporated by reference to Exhibit 10.25 to the Registrant’s Annual Report on Form 10-K (File No. 001-10352) for the year ended December 31, 2008, filed on March 16, 2009) | |
| 10.8* | Columbia Laboratories Stock Ownership Guidelines for Officers and Directors (incorporated by reference to Exhibit 99.1 to the Registrant’s Current Report on Form 8-K (File No. 001-10352), filed November 23, 2009) | |
| 10.9 | Manufacturing and Supply Agreement, dated December 8, 2009, between Fleet Laboratories and Columbia Laboratories (Bermuda), Ltd. (incorporated by reference to Exhibit 10.1 to the Registrant’s Current Report on Form 8-K (File No. 001-10352), filed on December 9, 2009) | |
| 10.10 | Note Purchase and Amendment Agreement, dated March 3, 2010, by and between Columbia Laboratories, Inc. and holders listed on Schedule I thereto (incorporated by reference to Exhibit 10.1 to the Registrant’s Current Report on Form 8-K (File No. 001-10352), filed on March 4, 2010) | |
| 10.11* | Amended and Restated Employment Agreement, dated May 4, 2010, by and between Columbia Laboratories, Inc. and Frank C. Condella, Jr. (incorporated by reference to Exhibit 10.1 to the Registrant’s Current Report on Form 8-K (File No. 001-10352), filed on May 5, 2010) | |
| 10.12 | Second Amended and Restated License and Supply Agreement, dated May 14, 2010, between Columbia Laboratories, Inc. and Ares Trading S.A. (incorporated by reference to Exhibit 10.1 to the Registrant’s Current Report on Form 8-K (File No. 001-10352), filed on May 18, 2010) | |
| 10.13* | Addendum to Amended and Restated Employment Agreement, dated March 1, 2011, by and between Columbia Laboratories, Inc., and Frank C. Condella, Jr. (incorporated by reference to Exhibit 10.46 to the Registrant’s Annual Report on Form 10-K (File No. 001-10352) for the year ended December 31, 2010, filed on March 10, 2011) | |
| 10.24* | Employment Agreement, dated January 15, 2013, by and between Columbia Laboratories, Inc., and Jonathan B. Lloyd Jones (incorporated by reference to Exhibit 10.1 to the Registrant’s Current Report on Form 8-K (File No. 001-10352), filed on January 16, 2013) | |
| 10.25 | Amendment No. 1 to the Second Amended and Restated License and Supply Agreement, dated April 4, 2013, between Columbia Laboratories, Inc. and Ares Trading S.A. (incorporated by reference to Exhibit 10.1 to the Registrant’s Current Report on Form 8-K (File No. 001-10352), filed on April 9, 2013) | |
| 10.16 | Parent Guarantee of Columbia Laboratories, Inc., dated September 12, 2013 (incorporated by reference to Exhibit 10.1 to the Registrant’s Current Report on Form 8-K (File No. 001-10352), filed on September 18, 2013) | |
| 10.17* | Employment Agreement, dated September 12, 2013, between Dr. Nikin Patel and Columbia Laboratories, Inc. (incorporated by reference to Exhibit 10.2 to the Registrant’s Current Report on Form 8-K (File No. 001-10352), filed on September 18, 2013) | |
| 10.18 | Bank Loan Agreement, dated January 6, 2012, between Molecular Profiles Limited and Lloyds TSB Bank plc (incorporated by reference to Exhibit 10.3 the Registrant’s Quarterly Report on Form 10-Q (File No. 001-10352) for the quarter ended September 30, 2013, filed on November 7, 2013) | |
Table of Contents
| 10.19 | Amendment letter, dated September 16, 2013, between Molecular Profiles Limited and Lloyds TSB Bank plc (incorporated by reference to Exhibit 10.4 the Registrant’s Quarterly Report on Form 10-Q (File No. 001-10352) for the quarter ended September 30, 2013, filed on November 7, 2013) | |
| 10.20 | Amendment to Manufacturing and Supply Agreement, effective as of December 31, 2013, between Columbia Laboratories (Bermuda) Ltd., and Fleet Laboratories Limited (incorporated by reference to Exhibit 10.1 to the Registrant’s Current Report on Form 8-K (File No. 001-10352), filed on February 6, 2014) | |
| 10.21 | Employment Agreement, dated September 23, 2014, by and between Columbia Laboratories, Inc. and George O. Elston (incorporated by reference to Exhibit 10.1 to the Registrant’s Current Report on Form 8-K (Filed No. 001-10352), filed on September 26, 2014) | |
| 21 | Subsidiaries of the Company | |
| 23.1 | Consent of BDO USA, LLP, Independent Registered Public Accounting Firm | |
| 31(i).1 | Certification of Chief Executive Officer of the Company | |
| 31(i).2 | Certification of Chief Financial Officer of the Company | |
| 32.1 | Certification of Chief Executive Officer pursuant to 18 U.S.C. Section 1350, as adopted pursuant to Section 906 of the Sarbanes-Oxley Act of 2002 | |
| 32.2 | Certification of Chief Financial Officer pursuant to 18 U.S.C. Section 1350, as adopted pursuant to Section 906 of the Sarbanes-Oxley Act of 2002 | |
| 101 | The following materials from the Columbia Laboratories, Inc. Annual Report on Form 10-K for the year ended December 31, 2014, formatted in XBRL (eXtensible Business Reporting Language): (i) Consolidated Balance Sheets at December 31, 2014 and December 31, 2013, (ii) Consolidated Statements of Operations for the years ended December 31, 2014, 2013 and 2012, (iii) Consolidated Statements of Comprehensive Income for the years ended December 31, 2014, 2013 and 2012, (iv) Consolidated Statements of Shareholders’ Equity for the years ended December 31, 2014, 2013 and 2012, (v) Consolidated Statements of Cash Flows for the years ended December 31, 2014, 2013 and 2012, and (vi) Notes to Consolidated Financial Statements. | |
| † | Confidential treatment has been requested with respect to certain portions of this exhibit. Omitted portions have been filed separately with the SEC. | |
| * | Management contract or compensatory plans or arrangements | |