Attached files
| file | filename |
|---|---|
| 10-K - 10-K - CRA INTERNATIONAL, INC. | a2223362zf1_10-03.pdf |
| EX-10.23 - EX-10.23 - CRA INTERNATIONAL, INC. | a2223362zex-10_23.htm |
| EX-10.35 - EX-10.35 - CRA INTERNATIONAL, INC. | a2223362zex-10_35.htm |
| EX-21.1 - EX-21.1 - CRA INTERNATIONAL, INC. | a2223362zex-21_1.htm |
| EX-23.1 - EX-23.1 - CRA INTERNATIONAL, INC. | a2223362zex-23_1.htm |
| EX-23.2 - EX-23.2 - CRA INTERNATIONAL, INC. | a2223362zex-23_2.htm |
| EX-31.1 - EX-31.1 - CRA INTERNATIONAL, INC. | a2223362zex-31_1.htm |
| EX-31.2 - EX-31.2 - CRA INTERNATIONAL, INC. | a2223362zex-31_2.htm |
| EX-32.1 - EX-32.1 - CRA INTERNATIONAL, INC. | a2223362zex-32_1.htm |
| EXCEL - IDEA: XBRL DOCUMENT - CRA INTERNATIONAL, INC. | Financial_Report.xls |
Use these links to rapidly review the document
TABLE OF CONTENTS
CRA INTERNATIONAL, INC.
UNITED STATES
SECURITIES AND EXCHANGE COMMISSION
Washington, D.C. 20549
Form 10-K
o |
ANNUAL REPORT PURSUANT TO SECTION 13 or 15(d) OF THE SECURITIES EXCHANGE ACT OF 1934 |
For the fiscal year ended January 3, 2015
Commission file number: 000-24049
CRA International, Inc.
(Exact name of registrant as specified in its charter)
| Massachusetts (State or other jurisdiction of incorporation or organization) |
04-2372210 (I.R.S. Employer Identification No.) |
|
200 Clarendon Street, Boston, MA (Address of principal executive offices) |
02116-5092 (Zip code) |
|
617-425-3000 (Registrant's telephone number, including area code) |
||
Securities registered pursuant to Section 12(b) of the Act: |
||
| Title of Each Class | Name of Each Exchange on Which Registered | |
|---|---|---|
| Common Stock, no par value | Nasdaq Global Select Market |
Securities
registered pursuant to Section 12(g) of the Act:
None
Indicate by check mark if the registrant is a well-known seasoned issuer, as defined in Rule 405 of the Securities Act. Yes o No ý
Indicate by check mark if the registrant is not required to file reports pursuant to Section 13 or Section 15(d) of the Exchange Act. Yes o No ý
Indicate by check mark whether the registrant: (1) has filed all reports required to be filed by Section 13 or 15(d) of the Securities Exchange Act of 1934 during the preceding 12 months (or for such shorter period that the registrant was required to file such reports), and (2) has been subject to such filing requirements for the past 90 days. Yes ý No o
Indicate by check mark whether the registrant has submitted electronically and posted on its corporate Website, if any, every Interactive Data File required to be submitted and posted pursuant to Rule 405 of Regulation S-T during the preceding 12 months (or for such shorter period that the registrant was required to submit and post such files). Yes ý No o
Indicate by check mark if disclosure of delinquent filers pursuant to Item 405 of Regulation S-K is not contained herein, and will not be contained, to the best of registrant's knowledge, in definitive proxy or information statements incorporated by reference in Part III of this Form 10-K or any amendment to this Form 10-K. ý
Indicate by check mark whether the registrant is a large accelerated filer, an accelerated filer, a non-accelerated filer, or a smaller reporting company. See the definitions of "large accelerated filer," "accelerated filer" and "smaller reporting company" in Rule 12b-2 of the Exchange Act (Check one):
| Large accelerated filer o | Accelerated filer ý | Non-accelerated filer o (Do not check if a smaller reporting company) |
Smaller reporting company o |
Indicate by check mark whether the registrant is a shell company (as defined in Rule 12b-2 of the Exchange Act). Yes o No ý
The aggregate market value of the stock held by non-affiliates of the registrant as of June 28, 2014, the last business day of the registrant's most recently completed second fiscal quarter, based on the closing sale price of $23.03 as quoted on the NASDAQ Global Select Market as of the last trading day before that date, was approximately $220.3 million. Outstanding shares of common stock beneficially owned by executive officers and directors of the registrant and certain related entities have been excluded from this computation because these persons may be deemed to be affiliates. The fact that these persons have been deemed affiliates for purposes of this computation should not be considered a conclusive determination for any other purpose.
As of March 10, 2015, CRA had outstanding 9,205,740 shares of common stock.
DOCUMENTS INCORPORATED BY REFERENCE
The information required for Part III of this annual report is incorporated by reference from the registrant's definitive proxy statement for the 2015 special meeting in lieu of annual meeting of its shareholders to be filed with the Securities and Exchange Commission within 120 days after the end of the registrant's fiscal year ended January 3, 2015.
CRA INTERNATIONAL, INC.
ANNUAL REPORT ON FORM 10-K
FOR THE FISCAL YEAR ENDED JANUARY 3, 2015
TABLE OF CONTENTS
1
Forward-Looking Statements
Except for historical facts, the statements in this annual report are forward-looking statements. Forward-looking statements are merely our current predictions of future events. These statements are inherently uncertain, and actual events could differ materially from our predictions. Important factors that could cause actual events to vary from our predictions include those discussed in this annual report under the heading "Risk Factors." We assume no obligation to update our forward-looking statements to reflect new information or developments. We urge readers to review carefully the risk factors described in this annual report and in the other documents that we file with the Securities and Exchange Commission, or SEC. You can read these documents at www.sec.gov.
Additional Available Information
Our principal internet address is www.crai.com. Our website provides a link to a third-party website through which our annual, quarterly, and current reports, and amendments to those reports, are available free of charge. We believe these reports are made available as soon as reasonably practicable after we electronically file them with, or furnish them to, the SEC. We do not maintain or provide any information directly to the third-party website, and we do not check its accuracy.
Our website also includes information about our corporate governance practices. The Investor Relations page of our website provides a link to a web page where you can obtain a copy of our code of ethics applicable to our principal executive officer, principal financial officer, and principal accounting officer.
Fiscal Year
Our fiscal years periodically contain 53 weeks rather than 52 weeks. Fiscal 2014 was a 53-week year and fiscal 2013 and fiscal 2012 were 52-week years.
Introduction
We are a leading global consulting firm specializing in providing economic, financial and management consulting services. We advise clients on economic and financial matters pertaining to litigation and regulatory proceedings, and guide corporations through critical business strategy and performance-related issues. Since 1965, we have been engaged by clients for our unique combination of functional expertise and industry knowledge, and for our objective solutions to complex problems. We combine economic and financial analysis with expertise in litigation and regulatory support, business strategy and planning, market and demand forecasting, and policy analysis. We are often retained in high-stakes matters, such as multibillion-dollar mergers and acquisitions, new product introductions, major strategy and capital investment decisions, and complex litigation, the outcomes of which often have significant consequences for the parties involved. These matters often require independent analysis and, as a result, the parties involved must rely on outside experts. Our analytical strength enables us to reach objective, factual conclusions that help clients make important business and policy decisions and resolve critical disputes. Clients turn to us because we can provide highly credentialed and experienced economic and finance experts to address critical, tough assignments, with high-stakes outcomes.
We offer consulting services in two broad areas: litigation, regulatory, and financial consulting and management consulting. These two areas represented approximately 98% of our consolidated revenues for fiscal 2014. The remaining 2% came from our NeuCo subsidiary. We provide our services primarily through our highly credentialed and experienced staff of employee consultants. As of January 3, 2015 we employed 451 consultants, which consisted of 347 senior staff and 104 junior staff. Approximately three fourths of our senior staff has a doctorate or other advanced degree. Our employee consultants have backgrounds in a wide range of disciplines, including economics, business, corporate finance,
2
materials sciences, accounting, and engineering. We are extremely selective in our hiring of consultants, recruiting from leading universities, industry, and government. Many of our employee consultants are nationally or internationally recognized as experts in their respective fields and have published scholarly articles, lectured extensively, and have been quoted in the press. They combine outstanding intellectual acumen with practical experience and in-depth understanding of industries and markets. To enhance the expertise we provide to our clients, we maintain close working relationships with a select group of renowned academic and industry non-employee experts.
Our business is diversified across multiple dimensions, including service offerings and vertical industry coverage, as well as areas of functional expertise, client base, and geography. We believe this diversification reduces our dependence on any particular market, industry, or geographic area.
We provide consulting services to corporate clients and attorneys in a wide range of litigation and regulatory proceedings, providing high-quality research and analysis, expert testimony, and comprehensive support in litigation and regulatory proceedings in all areas of finance, accounting, economics, insurance, and forensic accounting and investigations. We also use our expertise in economics, finance, and business to offer law firms, businesses, and government agencies services related to class certification, damages analysis, expert reports and testimony, regulatory analysis, strategy development, valuation of tangible and intangible assets, risk management, and transaction support. In our management consulting services, we use our expertise in economics, finance, and business analysis to offer our clients such services as strategy development, performance improvement, corporate strategy and portfolio analysis, estimation of market demand, new product pricing strategies, valuation of intellectual property and other assets, assessment of competitors' actions, and analysis of new sources of supply. Our analytical expertise in advanced economic and financial methods is complemented by our in-depth expertise in specific industries, including agriculture; banking and capital markets; chemicals; communications and media; consumer products; energy; entertainment; financial services; health care; insurance; life sciences; manufacturing; metals, mining, and materials; oil and gas; real estate; retail; sports; telecommunications; transportation; and technology.
We have completed thousands of engagements for clients around the world, including domestic and foreign companies; Federal, state, and local domestic government agencies; governments of foreign countries; public and private utilities; and national and international trade associations. We also work with many of the world's leading law firms. We experience a high level of repeat business.
We deliver our services through an international network of coordinated offices. Headquartered in Boston, Massachusetts, we have offices throughout North America and Europe.
Industry Overview
Businesses are operating in an increasingly complex economic, legal, and regulatory environment. Our changing world economy has created immense challenges and opportunities for businesses. Companies across industry sectors are seeking new strategies appropriate for the current economic environment, as well as greater operational efficiencies. To accomplish these objectives, they must constantly gather, analyze, and use information wisely to assure that business decisions are well-informed. In addition, as markets have become global, companies have the opportunity to expand their presence throughout the world, which can expose them to increased competition and the uncertainties of foreign operations. Further, companies are increasingly relying on technological and business innovations to improve efficiency, thus increasing the importance of strategically analyzing their businesses and developing and protecting new technology. The increasing complexity and changing nature of the business environment are also forcing governments to modify their regulatory strategies. These constant changes in the regulatory environment and the pro-regulatory stance in the U.S. have led to frequent litigation and interaction with government agencies as companies attempt to interpret and react to the implications of this changing environment. Furthermore, as the general business and regulatory environment becomes more complex, corporate litigation has also become more complicated, protracted, expensive, and important to the parties involved.
3
As a result, companies are increasingly relying on sophisticated economic and financial analysis to solve complex problems and improve decision-making. Economic and financial models provide the tools necessary to analyze a variety of issues confronting businesses, such as interpretation of sales data, effects of price changes, valuation of assets, assessment of competitors' activities, evaluation of new products, and analysis of supply limitations. Governments are also relying, to an increasing extent, on economic and finance theory to measure the effects of anticompetitive activity, evaluate mergers and acquisitions, change regulations, implement auctions to allocate resources, and establish transfer pricing rules. Finally, litigants and law firms are using economic and finance theory to help determine liability and to calculate damages in complex and high-stakes litigation. As the need for complex economic and financial analysis becomes more widespread, companies and governments are turning to outside consulting firms, such as ours, for access to the independent, specialized expertise, experience, and prestige that are not available to them internally. In addition, companies' strategic, organizational, and operational problems have gotten more acute as a result of the economic environment, and companies are relying on management consultants for help in analyzing, addressing, and solving strategic business problems and performance-related issues involving market supply and demand dynamics, supply chain and sourcing, pricing, capital allocation, technology management, portfolio positioning, risk management, merger integration, and improving shareholder value.
Competitive Strengths
Since 1965, we have been committed to providing sophisticated consulting services to our clients. We believe that the following factors have been critical to our success.
Strong Reputation for High-Quality Consulting; High Level of Repeat Business. Since 1965, we have been a leader in providing sophisticated economic analysis and original, authoritative advice to clients involved in complex litigation and regulatory proceedings, and we also provide management consulting services to companies facing strategic, organizational, and operational challenges. As a result, we believe we have established a strong reputation among leading law firms and business clients as a preferred source of expertise in economics, finance, business, and management consulting, as evidenced by our high level of repeat business. In addition, we believe our significant name recognition, which we developed as a result of our work on many high-profile litigation and regulatory engagements, has enhanced the development of our management consulting practice.
Highly Educated, Experienced, and Versatile Consulting Staff. We believe our most important asset is our base of employee consultants, particularly our senior employee consultants. As of January 3, 2015 we employed 451 consultants, which consisted of 347 senior staff and 104 junior staff. Approximately three-fourths of our senior staff has a doctorate or other advanced degree. Many of these senior employee consultants are nationally or internationally recognized as experts in their respective fields. In addition to their expertise in a particular field, most of our employee consultants are able to apply their skills across numerous practice areas. This flexibility in staffing engagements is critical to our ability to apply our resources as needed to meet the demands of our clients. As a result, we seek to hire consultants who not only have strong analytical skills, but who are also creative, intellectually curious, and driven to develop expertise in new practice areas and industries.
International Presence. We deliver our services through an international network of coordinated offices. Headquartered in Boston, Massachusetts, we have offices throughout North America and Europe. Many of our clients are multinational firms with issues that cross international boundaries, and we believe our international presence provides us with an advantage to address complex issues that span countries and continents. Our international presence also gives us access to many of the leading experts around the world on a variety of issues, allowing us to expand our knowledge base and areas of functional expertise.
Diversified Business. Our business is diversified across multiple dimensions, including service offerings, vertical industry coverage, areas of functional expertise, client base, and geography. By maintaining expertise in multiple industries, we are able to offer clients creative and pragmatic advice
4
tailored to their specific markets. By offering clients litigation, regulatory, financial, and management consulting services, we are able to satisfy an array of client needs, ranging from expert testimony for complex lawsuits to designing global business strategies. This broad range of expertise enables us to take an interdisciplinary approach to certain engagements, combining economists and experts in one area with specialists in other disciplines. We believe this diversification reduces our dependence on any particular market, industry, or geographic area. Furthermore, our litigation, regulatory, and financial consulting businesses are driven primarily by regulatory changes and high-stakes legal proceedings. Our diversity also enhances our expertise and the range of issues that we can address on behalf of clients.
Integrated Business. We manage our business on an integrated basis through our international network of offices and areas of functional expertise. Many of our practice areas are represented in several of our offices and are managed across geographic borders. We view these cross-border practices as integral to our success and key to our management approach. Our practices share not only staff but also consulting approaches and marketing strategies. When we acquire companies, our practice is to rapidly integrate systems, procedures, and people into our business model. In addition to sharing our intellectual property assets globally, we encourage geographic collaboration among our practices by including a consultant's overall contribution to our practices as a factor in determining the consultant's annual bonus.
Diversified Client Base. We have completed thousands of engagements for clients in a broad range of industries around the world. Our clients are major firms, and national and international law firms representing such clients, across a multitude of industries that include banking and capital markets; chemicals; communications and media; consumer products; energy; entertainment; financial services; health care; insurance; life sciences; manufacturing; metals, mining, and materials; oil and gas; real estate; retail; sports; telecommunications; transportation; and technology.
Established Corporate Culture. Our success results in part from our established corporate culture. We believe we attract consultants because of our approximately 50-year history, our strong reputation, the credentials, experience, and reputations of our employee consultants, the opportunity to work on an array of matters with a broad group of renowned non-employee experts, and our collegial atmosphere where teamwork and collaboration are emphasized and valued by many clients.
Access to Leading Academic and Industry Experts. To enhance the expertise we provide to our clients and the depth and breadth of our insights, we maintain close working relationships with a select group of non-employee experts. Depending on client needs, we use non-employee experts for their specialized expertise, assistance in conceptual problem-solving, and expert witness testimony. We work regularly with renowned professors at such institutions as Cornell University, Georgetown University, The Graduate Institute of International and Development Studies, Harvard University, the Massachusetts Institute of Technology, Northwestern University, Texas A&M University, the University of California at Berkeley, the University of California at Los Angeles, the University of Chicago, University of Michigan College of Literature, Science and the Arts, the University of Toronto, Yale University, and other leading universities. These experts also generate business for us and provide us access to other leading academic and industry experts. By establishing affiliations with these prestigious experts, we further enhance our reputation as a leading source of sophisticated economic and financial analysis.
Services
We offer services in two broad areas: litigation, regulatory, and financial consulting and management consulting. Together, these two service areas comprised approximately 98% of our consolidated revenues for fiscal 2014, and approximately 2% of our consolidated revenues came from our NeuCo subsidiary.
5
Litigation, Regulatory, and Financial Consulting
In our litigation, regulatory, and financial consulting practices, we typically work closely with law firms on behalf of one or more companies involved in litigation or regulatory proceedings in such areas as antitrust, damages, and labor and employment. Many of the lawsuits and regulatory proceedings in which we are involved are critical assignments with high-stakes outcomes, such as obtaining regulatory approval of a pending merger or analyzing possible damages awards in a class action case. The ability to formulate and effectively communicate powerful economic and financial arguments to courts and regulatory agencies is often critical to a successful outcome in litigation and regulatory proceedings. Our consultants combine uncommon analytical rigor with practical experience and in-depth understanding of industries and markets. Our analytical strength enables us to reach objective, factual conclusions that help our clients make important business and policy decisions and resolve critical disputes. Our consultants work with law firms, corporate counsel, and regulatory agencies to assist in developing the theory of the case and in preparing the testimony of expert witnesses from among our employees and from among our non-employee experts and others in academia. In addition, our consultants provide general litigation support, including reviewing legal briefs and assisting in the appeals process.
The following is a summary of the areas of functional expertise that we offer in litigation, regulatory, and financial consulting engagements. We provide services, such as economic expertise, analyses, and expert testimony, in these areas:
Areas of Functional Expertise
|
Description of Area of Service | |
|---|---|---|
Damages & Valuation |
Disputes involving lost profits, breach of contract, purchase price, valuation, business interruption, product liability, and fraud, among other damages claims. Calculating damages, providing expert testimony, and critiquing opposing experts' damages analyses in matters involving disputes in antitrust; intellectual property; securities and other financial market issues; insolvency; property values; contract; employment discrimination; product liability; environmental contamination; and purchase price. Supporting clients with broader corporate valuation services, providing pre-trial evaluations of damages claims and methodologies, and evaluating proposed settlements in class action and other cases. | |
Financial Accounting & Valuation |
Commercial and shareholder disputes; corporate finance damages advisory; corporate investigations; due diligence; financial accounting; valuation and litigation support and expert testimony, including both liability and damages. |
|
Financial Economics |
Matters pertaining to financial markets, including regulatory analyses and litigation support for financial institutions in areas of fair lending compliance, credit risk, credit scoring, consumer and mortgage lending, housing markets, international mortgage markets, and securitization. Analyses of valuations and estimates of damages associated with breaches of contract, national laws, and international treaties and the effects of market rules, processes, and contracts on prices and competition. |
|
Securities and Financial Markets |
Application of financial economics and accounting to complex litigation and business problems in such areas as securities litigation; securities markets and financial institutions; valuation and damages; and other financial litigation. |
6
Areas of Functional Expertise
|
Description of Area of Service | |
|---|---|---|
Accounting & Forensic Services |
Complex accounting issues, significant quantum of loss calculations, economic and financial crime, fraud, corruption, bribery, and other issues that threaten the integrity or reputation of organizations. |
|
Antitrust & Competition |
Antitrust litigation, including economic analysis of the competitive effects of alleged collusion and cartels, monopolization, abuse of dominance, monopsony, and vertical restrictions. |
|
Insurance Economics |
Matters pertaining to advising insurers, regulators, and legislators in management, insurance products, and litigation and regulation. |
|
Intellectual Property |
Matters pertaining to all types of intellectual property assets including valuation, litigation, transaction and strategic advisory services, patents, trade secrets, copyrights, and trademarks as well as economic damages in intellectual property litigation, valuations of intellectual property assets for strategic and regulatory purposes, and transactional advisory services for licensing and other intellectual property-rich transactions. |
|
International Arbitration |
International arbitration cases brought under bilateral investment treaties and arbitration clauses in contracts between firms. Assessing causation and quantifying damages using sophisticated modeling and analytical techniques and presenting findings to arbitration authorities. |
|
Labor & Employment |
All facets of employment litigation including equal employment opportunity claims under Title VII, the Age Discrimination in Employment Act (ADEA), the Equal Pay Act (EPA), and the Americans with Disabilities Act (ADA). Providing expert witness and litigation support services, conducting proactive analyses of employment and contracting practices, monitoring consent decrees and settlement agreements, designing information systems to track relevant employment data, and analyzing liability and assessing damages under the Fair Labor Standards Act (FLSA), California overtime laws, and state-specific wage and hour laws. |
|
Mergers & Acquisitions |
Assisting clients in obtaining domestic and foreign regulatory approvals in proceedings before government agencies, such as the U.S. Federal Trade Commission, the U.S. Department of Justice, the Merger Task Force at the European Commission, and the Canadian Competition Bureau. Analyses include simulating the effects of mergers on prices, estimating demand elasticities, designing and administering customer and consumer surveys, and studying possible acquisition-related synergies. |
|
Regulatory Economics and Compliance |
Regulatory proceedings and assisting clients in understanding and mitigating regulatory risks and exposures, preparing policy studies that help develop the basis for sound regulatory policy, drafting regulatory filings, and advising on regulations pertaining to environmental protection, employment, and health and safety. |
|
Transfer Pricing |
All phases of the tax cycle, including planning, documentation, and tax valuation. Also includes audit defense and support in advanced pricing agreements, alternative dispute resolution, and litigation in proceedings involving the Internal Revenue Service, the Tax Division of the U.S. Department of Justice, state and municipal tax authorities, and foreign tax authorities. |
7
Management Consulting
Our management consulting practices offer a unique mix of industry and functional expertise to help companies address and solve their strategic, organizational, and operational business problems. We advise clients in a broad range of industries on how to succeed in uncertain, rapidly-changing environments by generating growth, creating value, and enhancing shareholder wealth.
Additionally, we challenge clients to develop fresh approaches by sharing industry insights, focusing on facts, and questioning tradition. We support clients in implementation by setting priorities, focusing resources, and aligning operations; and we get results by helping clients make distinctive, substantial improvements in their organizations' performance.
The following is a summary of the areas of functional expertise that we offer in management consulting.
Areas of Functional Expertise
|
Description of Area of Service | |
|---|---|---|
Auctions & Competitive Bidding |
Providing auction and market design, implementation, and monitoring services, as well as bidding support services, for businesses, industry organizations, and governments in various industries around the world, including commodities, energy and utilities, telecommunications, transportation, natural resources, and other industries. | |
Corporate & Business Strategy |
Advising on business strategy, corporate revitalizations, and organizational effectiveness by bringing new ways of thinking to companies and new ways of working to develop better strategies over time and identifying the highest-value opportunities that address critical challenges and transform business. Advising chief executive officers and executive management teams on corporate and business unit strategy, market analysis, portfolio management, pricing strategy, and product positioning. Areas of expertise include strategy, execution, organic growth, growth through acquisition, productivity, risk management, leadership and organization, and managing for value. |
|
Enterprise Risk Management |
Advising large financial institutions and corporations in areas of governance and strategy, process analytics, and technology related to risk management. |
|
Environmental and Energy Strategy |
Advising companies on the following: corporate strategy to address risks and uncertainties surrounding environmental policy developments; business models that adapt to future environmental policy; investment decision-making processes that account for environmental policy uncertainty; environmental strategic compliance options with regulations/legislation; emissions trading planning surrounding cap-and-trade policies; identification of business opportunities that could relate to environmental trends; and the economic and business issues surrounding clean and renewable energy, enterprise and asset management, global gas and liquefied natural gas services, and regulation and litigation. |
|
Intellectual Property & Technology Management |
Advising top management, investors, and boards on technology strategy and planning, research and development management, commercialization, technology market evaluation, intellectual property management, and portfolio and resource management. |
8
Areas of Functional Expertise
|
Description of Area of Service | |
|---|---|---|
Organization & Performance Improvement |
Advising corporate clients in areas of revenue growth drivers; operating margin drivers; asset efficiency drivers; key enablers; and performance management and metrics. |
|
Transaction Advisory Services |
Advising business leaders, including buyers and sellers, in the areas of due diligence, mergers and acquisitions, private equity, and valuation. |
Industry Expertise
We believe our ability to combine expertise in advanced economic and financial methods with in-depth knowledge of particular industries is one of our key competitive strengths. By maintaining expertise in certain industries, we provide clients practical advice tailored to their specific markets. This industry expertise, which we developed over decades of providing sophisticated consulting services to a diverse group of clients in many industries, differentiates us from many of our competitors. We believe that we have developed a strong reputation and substantial name recognition within specific industries, which has led to repeat business and new engagements from clients in those markets. While we provide services to clients in a wide variety of industries, we have particular expertise in the following industries:
- •
- Agriculture
- •
- Banking & Capital Markets
- •
- Chemicals
- •
- Communications & Media
- •
- Consumer Products
- •
- Energy
- •
- Entertainment
- •
- Financial Services
- •
- Health Care
- •
- Insurance
- •
- Life Sciences
- •
- Manufacturing
- •
- Metals, Mining, & Materials
- •
- Oil & Gas
- •
- Real Estate
- •
- Retail
- •
- Sports
- •
- Telecommunications
- •
- Transportation
- •
- Technology
9
Clients
We have completed thousands of engagements for clients around the world, including domestic and foreign corporations; Federal, state, and local domestic government agencies; governments of foreign countries; public and private utilities; accounting firms; and national and international trade associations. Frequently, we work with major law firms who approach us on behalf of their clients. While we have particular expertise in a number of industries, we provide services to a diverse group of clients in a broad range of industries. Our policy is to keep the identities of our clients confidential unless our work for the client is already publicly disclosed. Our clients come from a broad range of industries, with no single client accounting for more than 5% of our revenues in each of fiscal 2014, fiscal 2013, and fiscal 2012.
We derive a portion of our revenues from fixed-price contracts. We derived approximately 15%, 13%, and 15% of consolidated revenues from fixed-price engagements in fiscal 2014, fiscal 2013, and fiscal 2012, respectively. These contracts are more common in our management consulting area, and would likely grow in number with expansion of that area. Revenues outside of the U.S. accounted for approximately 22%, 22%, and 23% of our total revenues in fiscal 2014, fiscal 2013, and fiscal 2012, respectively. See Note 13 of our Notes to Consolidated Financial Statements for a breakdown of our revenue and long-lived assets by country.
Software Subsidiary
NeuCo, Inc. develops and markets a family of neural network software tools and complementary application consulting services that are currently focused on electric utilities. Although NeuCo had its origins in one of our consulting engagements, it is primarily a software company that operates independently from our consulting business. NeuCo's products and services are designed to help utilities optimize the use of their power plants by improving heat rate, reducing emissions, overcoming operating constraints, and increasing output capability.
Our ownership interest in NeuCo was 55.89% for each of fiscal 2014, fiscal 2013 and fiscal 2012. NeuCo's financial results have been consolidated with ours and the portion of NeuCo's results allocable to its other owners is shown as "noncontrolling interest."
NeuCo's revenues included in our consolidated statements of operations for fiscal 2014, fiscal 2013, and fiscal 2012 totaled approximately $4.8 million, $5.1 million, and $5.5 million, respectively. NeuCo's net loss included in our consolidated statements of operations for fiscal 2014 and fiscal 2013 was approximately $0.5 million and $0.3 million, respectively. NeuCo's net income included in our consolidated statements of operations for fiscal 2012 was approximately $0.3 million. NeuCo's net loss, net of amounts allocable to its other owners, included in our consolidated statements of operations for each of fiscal 2014 and fiscal 2013 was approximately $0.2 million. NeuCo's net income, net of amounts allocable to its other owners, included in our consolidated statements of operations for fiscal 2012 was approximately $0.2 million.
Human Capital
As of January 3, 2015 we employed 451 consultants, consisting of 347 senior staff and 104 junior staff. Approximately three-fourths of our senior staff has a doctorate or other advanced degree in addition to substantial management, technical, or industry expertise. We believe our financial results and reputation are directly related to the number and quality of our employee consultants.
We derive most of our revenues directly from the services provided by our employee consultants. Our employee consultants have backgrounds in many disciplines, including economics, business, corporate finance, accounting, materials sciences, life sciences, and engineering. We are highly selective in our hiring of consultants, recruiting primarily from a select group of leading universities and degree programs, industry, and government. We believe consultants choose to work for us because of our strong reputation; the credentials, experience, and reputations of our consultants; the opportunity to work on a diverse range of matters and with renowned non-employee experts; and our collegial
10
atmosphere where teamwork and collaboration are emphasized and valued by many clients. We use a decentralized, team hiring approach. Our training and career development program for our employee consultants focuses on three areas: mentoring, seminars, and scheduled courses. This program is designed to complement on-the-job experience and an employee's pursuit of his or her own career development. New employee consultants participate in a structured program in which they are partnered with an assigned mentor. Through our ongoing seminar program, outside speakers make presentations and conduct discussions with our employee consultants on various topics. In addition, employee consultants are expected to discuss significant projects and cases, present academic research papers or business articles, and outline new analytical techniques or marketing opportunities periodically at in-house seminars. We also provide scheduled courses designed to improve an employee's professional skills, such as written and oral presentation, marketing techniques, and business development. We also encourage our employee consultants to pursue their academic interests by writing articles for economic, business, and other journals.
Many of our vice presidents have signed non-solicitation agreements, which generally prohibit the employee from soliciting our clients or soliciting and/or hiring our employees for one year or longer following termination of the person's employment with us. In addition, many of the stock options we have issued between 2005 and 2008 contain a provision that they may only be exercised upon the execution of a non-competition agreement. We seek to align each vice president's interest with our overall interests, and many of our strongest contributors have an equity interest in us.
We maintain a discretionary bonus program through which we grant performance-based bonuses to our officers and other employees. In fiscal 2007, our shareholders approved a performance-based cash incentive plan designed to preserve the deductibility of the compensation paid to our executive officers. In 2012, our Board of Directors amended this plan to extend its effective date until the annual meeting of our shareholders held in 2017. In addition, during fiscal 2009, we implemented a long-term incentive program for certain key employees. Under this program, selected participants receive a mixture of stock options, time-vesting restricted stock units, and performance-vesting restricted stock units. The program is designed to reward key employees and provide participants the opportunity to share in the long-term growth of our business. The Compensation Committee of our Board of Directors is responsible for approving equity compensation grants, approving the total bonuses to be distributed, establishing performance-based goals under these programs and plans each year, and determining the performance-based compensation earned each year by our executive officers under our cash incentive plan, with respect to which they can apply negative discretion. Our chief executive officer, in his discretion and in consultation with the Compensation Committee of our Board of Directors, approves the bonuses to be granted to our other employees, based on recommendations of the various leaders supervising the employees' work.
In addition, we work closely with a select group of non-employee experts from leading universities and industry. These experts supplement the work of our employee consultants and generate business for us. We believe these experts choose to work with us because of the interesting and challenging nature of our work, the opportunity to work with our quality-oriented consultants, and the financially rewarding nature of the work. Several non-employee experts, generally comprising the more active of those with whom we work, have entered into restrictive covenant contracts with us of varying lengths, which, in some cases, include non-competition agreements.
Most of our revenues depend on the number of hours worked by our employee consultants. As a result, we experience certain seasonal effects that impact our revenue, such as holiday seasons and the summer vacation season.
Marketing and Business Development
We rely to a significant extent on the efforts of our employee consultants, particularly our vice presidents and principals, to market our services. We encourage our employee consultants to generate new business from both existing and new clients, and we reward our employee consultants with increased compensation and promotions for obtaining new business. In pursuing new business, our
11
consultants emphasize our institutional reputation, experience, and client service, while also promoting the expertise of the particular employees who will work on the matter. Many of our consultants have published articles in industry, business, economic, legal, or scientific journals, and have made speeches and presentations at industry conferences and seminars, which serve as a means of attracting new business and enhancing their reputations. On occasion, employee consultants work with one or more non-employee experts to market our services. In addition, we rely upon business development professionals to ensure that the value of our litigation consulting service offerings is fully realized in the marketplace. They are focused on deepening and broadening client relationships with law firms and general counsels, ensuring that both existing and potential clients have access to our broad array of services, as well as helping to bring the best talent to any given assignment.
We supplement the personal marketing efforts of our employee consultants with firm-wide initiatives. We rely primarily on our reputation and client referrals for new business and undertake traditional marketing activities. We regularly organize seminars for existing and potential clients featuring panel members that include our employee consultants, non-employee experts, and leading government officials. We have an extensive set of brochures organized around our service areas, which describe our experience and capabilities. We also provide information about our services on our corporate website. We distribute publications to existing and potential clients highlighting emerging trends and noteworthy engagements. Because existing clients are an important source of repeat business and referrals, we communicate regularly with our existing clients to keep them informed of developments that affect their markets and industries.
We derive the majority of new business from new engagements from existing clients. We have worked with leading law firms across the globe and believe we have developed a reputation among law firms as a preferred source of sophisticated economic advice for litigation and regulatory work. For our management consulting services, we also rely on referrals from existing clients, and supplement referrals with a significant amount of direct marketing to new clients through conferences, seminars, publications, presentations, and direct solicitations.
It is important to us that we conduct business ethically and in accordance with industry standards and our own rigorous professional standards. We carefully consider the pursuit of each specific market, client, and engagement.
Competition
The market for economic and management consulting services is intensely competitive, highly fragmented, and subject to rapid change. In general, there are few barriers to entry into our markets, and we expect to face additional competition from new entrants into the economic and management consulting industries. In the litigation, regulatory, and financial consulting markets, we compete primarily with other economic consulting firms and individual academics. We believe the principal competitive factors in this market are reputation, analytical ability, industry expertise, size, and service. In the management consulting market, we compete primarily with other business and management consulting firms, specialized or industry-specific consulting firms, the consulting practices of large accounting firms, and the internal professional resources of existing and potential clients. We believe the principal competitive factors in this market are reputation, industry expertise, analytical ability, service, and price.
Our operations are subject to a number of risks. You should carefully read and consider the following risk factors, together with all other information in this report, in evaluating our business. If any of these risks, or any risks not presently known to us or that we currently believe are not significant, develops into an actual event, then our business, financial condition, and results of operations could be adversely affected. If that happens, the market price of our common stock could decline, and you may lose all or part of your investment.
12
We depend upon key employees to generate revenue
Our business consists primarily of the delivery of professional services, and, accordingly, our success depends heavily on the efforts, abilities, business generation capabilities, and project execution capabilities of our employee consultants. In particular, our employee consultants' personal relationships with our clients are a critical element in obtaining and maintaining client engagements. If we lose the services of any employee consultant or group of employee consultants, or if our employee consultants fail to generate business or otherwise fail to perform effectively, that loss or failure could adversely affect our revenues and results of operations. We do not have non-competition agreements with a majority of our employee consultants, and they can terminate their relationships with us at will and without notice. The non-competition and non-solicitation agreements that we have with some of our employee consultants offer us only limited protection and may not be enforceable in every jurisdiction. In the event that an employee leaves, some clients may decide that they prefer to continue working with the employee rather than with us. In the event an employee departs and acts in a way that we believe violates the employee's non-competition or non-solicitation agreement, we will consider any legal remedies we may have against such person on a case-by-case basis. We may decide that preserving cooperation and a professional relationship with the former employee or clients that worked with the employee, or other concerns, outweigh the benefits of any possible legal recovery.
Our business could suffer if we are unable to hire and retain additional qualified consultants as employees
Our business continually requires us to hire highly qualified, highly educated consultants as employees. Our failure to recruit and retain a significant number of qualified employee consultants could limit our ability to accept or complete engagements and adversely affect our revenues and results of operations. Relatively few potential employees meet our hiring criteria, and we face significant competition for these employees from our direct competitors, academic institutions, government agencies, research firms, investment banking firms, and other enterprises. Many of these competing employers are able to offer potential employees greater compensation and benefits or more attractive lifestyle choices, career paths, or geographic locations than we can. Competition for these employee consultants has increased our labor costs, and a continuation of this trend could adversely affect our margins and results of operations.
Maintaining our professional reputation is crucial to our future success
Our ability to secure new engagements and hire qualified consultants as employees depends heavily on our overall reputation as well as the individual reputations of our employee consultants and principal non-employee experts. Because we obtain a majority of our new engagements from existing clients, any client that is dissatisfied with our performance on a single matter could seriously impair our ability to secure new engagements. Given the frequently high-profile nature of the matters on which we work, including work before and on behalf of government agencies, any factor that diminishes our reputation or the reputations of any of our employee consultants or non-employee experts could make it substantially more difficult for us to compete successfully for both new engagements and qualified consultants.
We depend on our non-employee experts
We depend on our relationships with our non-employee experts. We believe that these experts are highly regarded in their fields and that each offers a combination of knowledge, experience, and expertise that would be very difficult to replace. We also believe that we have been able to secure some engagements and attract consultants in part because we can offer the services of these experts. Most of these experts can limit their relationships with us at any time for any reason. These reasons could include affiliations with universities with policies that prohibit accepting specified engagements, termination of exclusive relationships, the pursuit of other interests, and retirement.
In many cases we seek to include restrictive covenant agreements in our agreements with our non-employee experts, which could include non-competition agreements, non-solicitation agreements
13
and non-hire agreements. The limitation or termination of any of their relationships with us, or competition from any of them after these agreements expire, could harm our reputation, reduce our business opportunities and adversely affect our revenues and results of operations. These restrictive covenant agreements that we may have with some of our non-employee experts offer us only limited protection and may not be enforceable in every jurisdiction. In the event that non-employee experts leave, clients working with these non-employee experts may decide that they prefer to continue working with them rather than with us. In the event a non-employee expert departs and acts in a way that we believe violates the expert's restrictive covenant agreements, we will consider any legal and equitable remedies we may have against such person on a case-by-case basis. We may decide that preserving cooperation and a professional relationship with the former non-employee expert or clients that worked with the non-employee expert, or other concerns, outweigh the benefits of any possible legal action or recovery.
To meet our long-term growth targets, we need to establish ongoing relationships with additional non-employee experts who have reputations as leading experts in their fields. We may be unable to establish relationships with any additional non-employee experts. In addition, any relationship that we do establish may not help us meet our objectives or generate the revenues or earnings that we anticipate.
Changes in global economic, business and political conditions could have a material adverse impact on our revenues, results of operations, and financial condition
Overall global economic, business and political conditions, as well as conditions specific to the industries we or our clients serve, can affect our clients' businesses and financial condition, their demand or ability to pay for our services, and the market for our services. These conditions, all of which are outside of our control, include merger and acquisition activity levels, the availability, cost and terms of credit, the state of the United States and global financial markets, the levels of litigation and regulatory and administrative investigations and proceedings, and general economic and business conditions. In addition, many of our clients are in highly regulated industries, and regulatory and legislative changes affecting these industries could impact the market for our service offerings, render our current service offerings obsolete, or increase the competition among providers of these services. Although we are not able to predict the positive or negative effects that general changes in global economic, business and political conditions will have on our individual practice areas or our business as a whole, any specific changes in these conditions could have a material adverse impact on our revenues, results of operations and financial condition.
Our results of operations and consequently our business may be adversely affected if we are not able to maintain current bill rates, compensation costs and/or utilization rate
Our revenues and profitability are largely based on the bill rates charged to our clients, compensation costs and the utilization of our consultants. We calculate utilization by dividing the total hours worked by our employee consultants on engagements during the measurement period by the total number of hours that our employee consultants were available to work during that period. If we are not able to maintain adequate bill rates for our services, maintain compensation costs or obtain appropriate utilization rates from our consultants, our results of operations may be adversely impacted. Bill rates, compensation costs and consultant utilization rates are affected by a number of factors, including:
- •
- Our clients' perceptions of our ability to add value through our services;
- •
- The market demand for our services;
- •
- Our competitors' pricing of services and compensation levels;
- •
- The market rate for consultant compensation;
14
- •
- Our ability to redeploy consultants from completed client engagements to new client engagements; and
- •
- Our ability to predict future demand for our services and maintain the appropriate staffing levels without significantly underutilizing consultants.
Our failure to execute our business strategy or manage future growth successfully could adversely affect our revenues and results of operations
Any failure on our part to execute our business strategy or manage future growth successfully could adversely affect our revenues and results of operations. In the future, we could open offices in new geographic areas, including foreign locations, and expand our employee base as a result of internal growth and acquisitions. Opening and managing new offices often requires extensive management supervision and increases our overall selling, general, and administrative expenses. Expansion creates new and increased management, consulting, and training responsibilities for our employee consultants. Expansion also increases the demands on our internal systems, procedures, and controls, and on our managerial, administrative, financial, marketing, and other resources. We depend heavily upon the managerial, operational, and administrative skills of our executive officers to manage our expansion and business strategy. New responsibilities and demands may adversely affect the overall quality of our work.
Competition from other litigation, regulatory, financial, and management consulting firms could hurt our business
The market for litigation, regulatory, financial, and management consulting services is intensely competitive, highly fragmented, and subject to rapid change. We may be unable to compete successfully with our existing competitors or with any new competitors. In general, there are few barriers to entry into our markets, and we expect to face additional competition from new entrants into the economic and management consulting industries. In the litigation, regulatory, and financial consulting markets, we compete primarily with other economic and financial consulting firms and individual academics. In the management consulting market, we compete primarily with other business and management consulting firms, specialized or industry-specific consulting firms, the consulting practices of large accounting firms, and the internal professional resources of existing and potential clients. Many of our competitors have national or international reputations as well as significantly greater personnel, financial, managerial, technical, and marketing resources than we do, which could enhance their ability to respond more quickly to technological changes, finance acquisitions, and fund internal growth. Some of our competitors also have a significantly broader geographic presence and significantly more resources than we do.
Clients can terminate engagements with us at any time
Many of our engagements depend upon disputes, proceedings, or transactions that involve our clients. Our clients may decide at any time to seek to resolve the dispute or proceeding, abandon the transaction, or file for bankruptcy. Our engagements can therefore terminate suddenly and without advance notice to us. If an engagement is terminated unexpectedly, our employee consultants working on the engagement could be underutilized until we assign them to other projects. In addition, because much of our work is project-based rather than recurring in nature, our consultants' utilization depends on our ability to secure additional engagements on a continual basis. Accordingly, the termination or significant reduction in the scope of a single large engagement could reduce our utilization and have an immediate adverse impact on our revenues and results of operations.
Information or technology systems failures, or a compromise of our or our client's confidential or proprietary information, could have a material adverse effect on our reputation, business and results of operations
We rely upon information and technology infrastructure and systems to operate, manage and run our business and to provide services to our clients. This includes infrastructure and systems for
15
receiving, storing, hosting, analyzing, transmitting and securing our and our clients' sensitive, confidential or proprietary information, including, but not limited to, health and other personally-identifiable information and commercial, financial and consumer data. Our ability to secure and maintain the confidentiality of this information is critical to our reputation and the success of our businesses. We may be affected by or subject to events that are out of our control, including, but not limited to, viruses, malicious software, worms, failures in our or our third party hosting sites' information and technology systems, disruptions in the Internet or electricity grids, natural disasters, terrorism and malicious attacks, and unauthorized intrusions by unknown third parties. Any of these events could disrupt our or our client's business operations or cause us or our clients to incur unanticipated losses and reputational damage, which could have a material adverse effect on our business and results of operations.
In addition, our or our clients' sensitive, confidential or proprietary information could be compromised, whether intentionally or unintentionally, by our employees, outside consultants, vendors, or rogue third-party "hackers" or enterprises. A breach or compromise of the security of our information technology systems or infrastructure, or our processes for securing sensitive, confidential or proprietary information, could result in the loss or misuse of this information. Any such loss or misuse could result in our suffering claims, fines, damages, losses or reputational damage, any of which could have a material adverse effect on our business and results of operations.
Potential conflicts of interests may preclude us from accepting some engagements
We provide our services primarily in connection with significant or complex transactions, disputes, or other matters that are usually adversarial or that involve sensitive client information. Our engagement by a client may preclude us from accepting engagements with the client's competitors or adversaries because of conflicts between their business interests or positions on disputed issues or other reasons. Accordingly, the nature of our business limits the number of both potential clients and potential engagements. Moreover, in many industries in which we provide consulting services, such as in the telecommunications industry, there has been a continuing trend toward business consolidations and strategic alliances. These consolidations and alliances reduce the number of potential clients for our services and increase the chances that we will be unable to continue some of our ongoing engagements or accept new engagements as a result of conflicts of interests.
We derive revenue from a limited number of large engagements
We derive a portion of our revenues from a limited number of large engagements. If we do not obtain a significant number of new large engagements each year, our business, financial condition, and results of operations could suffer. In general, the volume of work we perform for any particular client varies from year to year, and due to the specific engagement nature of our practice, a major client in one year may not hire us in the following year.
Our international operations create risks
Our international operations carry financial and business risks, including:
- •
- currency fluctuations that adversely affect our financial position and operating results;
- •
- unexpected changes in trading policies, regulatory requirements, tariffs, and other barriers;
- •
- restrictions on the repatriation of earnings;
- •
- potentially adverse tax consequences, such as trapped foreign losses or changes in statutory tax rates;
- •
- the impact of differences in the governmental, legal and regulatory environment in foreign jurisdictions, as well as U.S. laws and
regulations related to our foreign operations;
- •
- less stable political and economic environments; and
16
- •
- civil disturbances or other catastrophic events that reduce business activity.
If our international revenues increase relative to our total revenues, these factors could have a more pronounced effect on our operating results.
Our entry into new lines of business could adversely affect our results of operations
If we attempt to develop new practice areas or lines of business outside our core litigation, regulatory, financial, and management consulting services, those efforts could harm our results of operations. Our efforts in new practice areas or new lines of business involve inherent risks, including risks associated with inexperience and competition from mature participants in the markets we enter. Our inexperience in these new practice areas or lines of business may result in costly decisions that could harm our business.
Fluctuations in our quarterly revenues and results of operations could depress the market price of our common stock
We may experience significant fluctuations in our revenues and results of operations from one quarter to the next. If our revenues or net income in a quarter fall or falls below the expectations of securities analysts or investors, the market price of our common stock could fall significantly. Our results of operations in any quarter can fluctuate for many reasons, including:
- •
- our ability to implement rate increases or maintain rates;
- •
- the number, scope, and timing of ongoing client engagements;
- •
- the extent to which we can reassign our employee consultants efficiently from one engagement to the next;
- •
- the extent to which our employee consultants or clients take holiday, vacation, and sick time, including traditional seasonality
related to summer vacation and holiday schedules;
- •
- employee hiring;
- •
- the extent of revenue realization or cost overruns;
- •
- fluctuations in the results and continuity of the operations of our software subsidiary, NeuCo;
- •
- fluctuations in our provision for income taxes due to changes in income arising in various tax jurisdictions, valuation allowances,
non-deductible expenses, and changes in estimates of our uncertain tax positions;
- •
- fluctuations in interest rates; and
- •
- collectability of receivables and unbilled work in process.
Because we generate most of our revenues from consulting services that we provide on an hourly fee basis, our revenues in any period are directly related to the number of our employee consultants, their billing rates, and the number of billable hours they work in that period. We have a limited ability to increase any of these factors in the short term. Accordingly, if we underutilize our consultants during one part of a fiscal period, we may be unable to compensate by augmenting revenues during another part of that period. In addition, we are occasionally unable to utilize fully any additional consultants that we hire, particularly in the quarter in which we hire them. Moreover, a significant majority of our operating expenses, primarily office rent and salaries, are fixed in the short term. As a result, any failure of our revenues to meet our projections in any quarter could have a disproportionate adverse effect on our net income. For these reasons, we believe our historical results of operations are not necessarily indicative of our future performance.
17
Our engagements may result in professional liability and we may be subject to other litigation, claims or assessments
Our services typically involve difficult analytical assignments and carry risks of professional and other liability. Many of our engagements involve matters that could have a severe impact on a client's business, cause the client to lose significant amounts of money, or prevent the client from pursuing desirable business opportunities. Accordingly, if a client is dissatisfied with our performance, the client could threaten or bring litigation in order to recover damages or to contest its obligation to pay our fees. Litigation alleging that we performed negligently, disclosed client confidential information, or otherwise breached our obligations to the client could expose us to significant liabilities to our clients and other third parties and tarnish our reputation.
Despite our efforts to prevent litigation, from time to time we are party to various lawsuits, claims, or assessments in the ordinary course of business. Disputes may arise, for example, from business acquisitions, employment issues, regulatory actions, and other business transactions. The costs and outcome of any lawsuits or claims could have a material adverse effect on us.
Acquisitions may disrupt our operations or adversely affect our results
We regularly evaluate opportunities to acquire other businesses. The expenses we incur evaluating and pursuing acquisitions could adversely affect our results of operations. If we acquire a business, we may be unable to manage it profitably or successfully integrate its operations with our own. Moreover, we may be unable to realize the financial, operational, and other benefits we anticipate from these acquisitions or any other acquisition. Many potential acquisition targets do not meet our criteria, and, for those that do, we face significant competition for these acquisitions from our direct competitors, private equity funds, and other enterprises. Competition for future acquisition opportunities in our markets could increase the price we pay for businesses we acquire and could reduce the number of potential acquisition targets. Further, acquisitions may involve a number of special financial and business risks, such as:
- •
- diversion of our management's time, attention, and resources;
- •
- decreased utilization during the integration process;
- •
- loss of key acquired personnel;
- •
- increased costs to improve or coordinate managerial, operational, financial, and administrative systems including compliance with the
Sarbanes-Oxley Act of 2002;
- •
- dilutive issuances of equity securities, including convertible debt securities;
- •
- the assumption of legal liabilities;
- •
- amortization of acquired intangible assets;
- •
- potential write-offs related to the impairment of goodwill, including if our enterprise value declines below certain levels;
- •
- difficulties in integrating diverse corporate cultures; and
- •
- additional conflicts of interests.
Our clients may be unable or unwilling to pay us for our services
Our clients include some companies that may from time to time encounter financial difficulties, particularly during a downward trend in the economy, or may dispute the services we provide. If a client's financial difficulties become severe or a dispute arises, the client may be unwilling or unable to pay our invoices in the ordinary course of business, which could adversely affect collections of both our accounts receivable and unbilled services. On occasion, some of our clients have entered bankruptcy, which has prevented us from collecting amounts owed to us. The bankruptcy of a client with a
18
substantial accounts receivable could have a material adverse effect on our financial condition and results of operations. Historically, a small number of clients who have paid sizable invoices have later declared bankruptcy, and a court determination that we were not properly entitled to any of those payments may require repayment of some or all of them, which could adversely affect our financial condition and results of operations.
Additionally, from time to time, we may derive a significant amount of revenue from government agencies in the United States. Because we may derive a significant percentage of our revenue from contracts with the Federal government, changes in Federal government budgetary priorities could directly affect our financial performance. This could result in the cancellation of contracts and/or the incurrence of substantial costs without reimbursement under our contracts with the U.S. government, which could have a negative effect on our business, financial condition, results of operations and cash flows.
The market price of our common stock may be volatile
The market price of our common stock has fluctuated widely and may continue to do so. Many factors could cause the market price of our common stock to rise and fall. Some of these factors are:
- •
- variations in our quarterly results of operations;
- •
- the hiring or departure of key personnel or non-employee experts;
- •
- changes in our professional reputation;
- •
- the introduction of new services by us or our competitors;
- •
- acquisitions or strategic alliances involving us or our competitors;
- •
- changes in accounting principles or methods;
- •
- changes in estimates of our performance or recommendations by securities analysts;
- •
- future sales of shares of common stock in the public market; and
- •
- market conditions in the industry and the economy as a whole.
In addition, the stock market often experiences significant price and volume fluctuations. These fluctuations are often unrelated to the operating performance of particular companies. These broad market fluctuations may adversely affect the market price of our common stock. When the market price of a company's stock drops significantly, shareholders often institute securities class action litigation against that company. Any litigation against us could cause us to incur substantial costs, divert the time and attention of our management and other resources, or otherwise harm our business.
Our performance could be affected if employees and non-employee experts default on loans
We utilize forgivable loans and term loans with some of our employees and non-employee experts, other than our executive officers, as a way to attract and retain them. A portion of these loans is collateralized. Defaults under these loans could have a material adverse effect on our consolidated statements of operations, financial condition and liquidity.
Fluctuations in the types of service contracts we enter into may adversely impact revenue and results of operations
We derive a portion of our revenues from fixed-price contracts. These contracts are more common in our management consulting area, and would likely grow in number with expansion of that area. Fluctuations in the mix between time-and- material contracts, fixed-price contracts and arrangements with fees tied to performance-based criteria may result in fluctuations of revenue and results of operations. In addition, if we fail to estimate accurately the resources required for a fixed-price project or fail to satisfy our contractual obligations in a manner consistent with the project budget, we might
19
generate a smaller profit or incur a loss on the project. On occasion, we have had to commit unanticipated additional resources to complete projects, and we may have to take similar action in the future, which could adversely affect our revenues and results of operations.
Our stock repurchase program could affect the market price of our common stock and increase its volatility
Our Board of Directors has from time to time authorized repurchase programs of our outstanding common stock. Under these stock repurchase programs, we are authorized to repurchase, from time-to-time, shares of our outstanding common stock on the open market or in privately negotiated transactions. The timing and amount of stock repurchases will be determined based upon our evaluation of market conditions and other factors. The stock repurchase program may be suspended, modified or discontinued at any time, and we have no obligation to repurchase any amount of our common stock under the program. Repurchases pursuant to our stock repurchase program could affect the market price of our common stock and increase its volatility. Any termination of our stock repurchase programs could cause a decrease in the market price of our common stock price, and the existence of a stock repurchase program could cause our stock price to be higher than it would be in the absence of such a program and could potentially reduce the market liquidity of our common stock. There can be no assurance that any stock repurchases under these programs will enhance stockholder value because the market price of our common stock may decline below the levels at which those repurchases were made. Although our stock repurchase program is intended to enhance long-term stockholder value, short-term fluctuations in the market price of our common stock could reduce the program's effectiveness.
We may need to take material write-offs for the impairment of goodwill and other intangible assets, including if our market capitalization declines
As further described in our Notes to Consolidated Financial Statements, goodwill and intangible assets with indefinite lives are monitored annually for impairment, or more frequently, if events or circumstances exist that would more likely than not reduce our fair value below our carrying amount. In performing the first step of the goodwill impairment testing and measurement process, we compare our entity-wide estimated fair value to net book value to identify potential impairment. We estimate the entity-wide fair value utilizing our market capitalization, plus an appropriate control premium. Market capitalization is determined by multiplying the shares outstanding on the test date by the market price of our common stock on that date. We have utilized a control premium that considers appropriate industry, market and other pertinent factors, including indications of such premiums from data on recent acquisition transactions. If our fair value is less than our net book value, the second step is performed to determine if goodwill is impaired. If we determine through the impairment evaluation process that goodwill has been impaired, an impairment charge would be recorded in our consolidated income statement.
A goodwill impairment charge in any period would have the effect of decreasing our earnings in such period. If we are required to take a substantial impairment charge, our operating results would be materially adversely affected in such period, though such a charge would have no impact on cash flows or working capital.
Our debt obligations may adversely impact our financial performance
We have a revolving line of credit with our bank for $125.0 million. The amounts available under this line of credit are constrained by various financial covenants and reduced by certain letters of credit outstanding. Our loan agreement with the bank will mature on April 24, 2018. The degree to which we are leveraged could adversely affect our ability to obtain further financing for working capital, acquisitions or other purposes and could make us more vulnerable to industry downturns and competitive pressures. Our ability to secure short-term and long-term debt or equity financing in the future will depend on several factors, including our future profitability, the levels of our debt and
20
equity, restrictions under our existing revolving line of credit, and the overall credit and equity market environments.
We could incur substantial costs protecting our proprietary rights from infringement or defending against a claim of infringement
As a professional services organization, we rely on non-competition and non-solicitation agreements with many of our employees and non-employee experts to protect our proprietary rights. These agreements, however, may offer us only limited protection and may not be enforceable in every jurisdiction. In addition, we may incur substantial costs trying to enforce these agreements.
Our services may involve the development of custom business processes or solutions for specific clients. In some cases, the clients retain ownership or impose restrictions on our ability to use the business processes or solutions developed from these projects. Issues relating to the ownership of business processes or solutions can be complicated, and disputes could arise that affect our ability to resell or reuse business processes or solutions we develop for clients.
In recent years, there has been significant litigation in the U.S. involving patents and other intellectual property rights. We could incur substantial costs in prosecuting or defending any intellectual property litigation, which could adversely affect our operating results and financial condition.
Despite our efforts to protect our proprietary rights, unauthorized parties may attempt to obtain and use information that we regard as proprietary. Litigation may be necessary in the future to enforce our proprietary rights, to protect our trade secrets, to determine the validity and scope of the proprietary rights of others or to defend against claims of infringement or invalidity. Any such resulting litigation could result in substantial costs and diversion of resources and could adversely affect our business, operating results and financial condition. Any failure by us to protect our proprietary rights, or any court determination that we have either infringed or lost ownership of proprietary rights could adversely affect our business, operating results and financial condition.
Insurance and claims expenses could significantly reduce our profitability
We are exposed to claims related to group health insurance. We self-insure a portion of the risk associated with these claims. If the number or severity of claims increases, or we are required to accrue or pay additional amounts because the claims prove to be more severe than our original assessment, our operating results would be adversely affected. Our future insurance and claims expense might exceed historical levels, which could reduce our earnings. We expect to periodically assess our self-insurance strategy. We are required to periodically evaluate and adjust our claims reserves to reflect our experience. However, ultimate results may differ from our estimates, which could result in losses over our reserved amounts. We maintain individual and aggregate medical plan stop loss insurance with licensed insurance carriers to limit our ultimate risk exposure for any one case and for our total liability.
Many businesses are experiencing the impact of increased medical costs as well as greater variability in ongoing costs. As a result, our insurance and claims expense could increase, or we could raise our self-insured retention when our policies are renewed. If these expenses increase or we experience a claim for which coverage is not provided, results of our operations and financial condition could be materially and adversely affected.
Our charter and by-laws, and Massachusetts law may deter takeovers
Our amended and restated articles of organization and amended and restated by-laws and Massachusetts law contain provisions that could have anti-takeover effects and that could discourage, delay, or prevent a change in control or an acquisition that our shareholders may find attractive. These provisions may also discourage proxy contests and make it more difficult for our shareholders to take some corporate actions, including the election of directors. These provisions could limit the price that investors might be willing to pay for shares of our common stock.
21
Item 1B—Unresolved Staff Comments
Not applicable.
In the aggregate, as of January 3, 2015, we leased approximately 282,550 square feet of office space in locations around the world. Additionally, NeuCo leases approximately 9,713 square feet of office space. We have subleased to other companies approximately 50,497 square feet of our leased office space.
All of our offices are electronically linked and have access to our core consulting tools. We believe our existing facilities are adequate to meet our current requirements and that suitable space will be available as needed.
On February 24, 2015, we entered into an amendment to our lease with BP Hancock LLC for the office space we rent in the building at 200 Clarendon Street, Boston, Massachusetts. Under this amendment, we will lease an additional 10,057 square feet of office space on the twenty-fifth floor of this building, at an annual rate (excluding customary operating costs and expenses) of $49 per square foot, for a term beginning on June 15, 2015 (or, if later, when landlord completes certain improvements to the space) and ending on June 30, 2020, with the option to extend this term for an additional three-year period.
None.
Item 4—Mine Safety Disclosures
Not applicable.
Item 5—Market for Registrant's Common Equity, Related Shareholder Matters and Issuer Purchases of Equity Securities
Market Information. We first offered our common stock to the public on April 23, 1998. Our common stock is traded on the NASDAQ Global Select Market under the symbol CRAI. The following table provides the high and low sales prices of our common stock as reported on the NASDAQ Global Select Market for the periods indicated.
Fiscal Year Ended January 3, 2015
|
High | Low | |||||
|---|---|---|---|---|---|---|---|
December 29, 2013 to March 29, 2014 |
$ | 23.84 | $ | 17.63 | |||
March 30, 2014 to June 28, 2014 |
$ | 23.80 | $ | 19.10 | |||
June 29, 2014 to September 27, 2014 |
$ | 28.49 | $ | 22.62 | |||
September 28, 2014 to January 3, 2015 |
$ | 32.50 | $ | 24.64 | |||
Fiscal Year Ended December 28, 2013 |
High |
Low |
|||||
December 30, 2012 to March 30, 2013 |
$ | 22.76 | $ | 17.09 | |||
March 31, 2013 to June 29, 2013 |
$ | 23.10 | $ | 17.11 | |||
June 30, 2013 to September 28, 2013 |
$ | 21.88 | $ | 15.64 | |||
September 29, 2013 to December 28, 2013 |
$ | 21.40 | $ | 17.11 | |||
Shareholders. We had approximately 111 holders of record of our common stock as of March 10, 2015. This number does not include shareholders for whom shares were held in a "nominee" or "street" name.
22
Dividends. We have not paid any cash dividends in the past and we do not anticipate paying any cash dividends in the foreseeable future. In addition, the terms of our bank line of credit place restrictions on our ability to pay cash dividends on our common stock.
Repurchases of Equity Securities. The following table provides information about our repurchases of shares of our common stock during the quarter ended January 3, 2015. During that period, we did not act in concert with any affiliate or any other person to acquire any of our common stock and, accordingly, we do not believe that purchases by any such affiliate or other person (if any) are reportable in the following table. For purposes of this table, we have divided the quarter into three periods of four weeks, four weeks and six weeks to coincide with our reporting periods during the fourth quarter of fiscal 2014.
Issuer Purchases of Equity Securities
Period
|
(a) Total Number of Shares Purchased(1)(2) |
(b) Average Price Paid per Share(1)(2) |
(c) Total Number of Shares Purchased as Part of Publicly Announced Plans or Programs(2) |
(d) Maximum Number (or Approximate Dollar Value) of Shares that May Yet Be Purchased Under the Plans or Programs(2) |
|||||||||
|---|---|---|---|---|---|---|---|---|---|---|---|---|---|
September 28, 2014 to October 25, 2014 |
147,021 shares | $ | 25.55 per share | 145,121 | $ | 30,022,557 | |||||||
October 26, 2014 to November 22, 2014 |
279,175 shares | $ | 30.93 per share | 264,800 | $ | 21,834,184 | |||||||
November 23, 2014 to January 3, 2015 |
48,038 shares | $ | 30.75 per share | 29,900 | $ | 20,924,824 | |||||||
- (1)
- During
the four weeks ended October 25, 2014, we accepted 1,900 shares of our common stock as a tax withholding from certain of our employees, in
connection with the vesting of restricted shares that occurred during the indicated period, pursuant to the terms of our 2006 equity incentive plan, at an average price per share of $25.43. During the
four weeks ended November 22, 2014, we accepted pursuant to the terms of our 2006 equity incentive plan 14,375 shares of our common stock as tax withholding from certain of our employees, in
connection with the vesting of shares of restricted stock that occurred during the indicated period, at an average price per share of $31.10. During the six weeks ended January 3, 2015, we
accepted pursuant to the terms of our 2006 equity incentive plan 18,138 shares of our common stock as tax withholding from certain of our employees, in connection with the vesting of shares of
restricted stock that occurred during the indicated period, at an average price per share of $31.31.
- (2)
- On August 10, 2012, February 13, 2014, and October 23, 2014, we announced that our Board of Directors approved share repurchase programs of up to $5.0 million, $15.0 million, and $30.0 million, respectively, of our common stock. We may repurchase shares under any of these programs in open market purchases (including through any Rule 10b5-1 plan adopted by us) or in privately negotiated transactions in accordance with applicable insider trading and other securities laws and regulations. During the four weeks ended October 25, 2014, the four weeks ended November 22, 2014 and the six weeks ended January 3, 2015, we repurchased and retired 145,121 shares, 264,800 shares and 29,900 shares, respectively, under these programs at an average price per share of $25.55, $30.92 and $30.41, respectively. Approximately $20.9 million was available for future repurchases under these programs as of January 3, 2015.
Shareholder Return Performance Graph. The graph below compares the cumulative 5-year total return of holders of our common stock with the cumulative total returns of the NASDAQ Composite index, and a customized peer group of three companies that includes: FTI Consulting Inc, Huron Consulting Group Inc., and Navigant Consulting Inc. LECG Corporation was removed from the peer group as a result of its delisting during our fiscal 2011. Duff & Phelps Corp. was removed from the peer group as a result of its delisting during our fiscal 2013. Accordingly, LECG Corporation and
23
Duff & Phelps Corp. are not included in the peer index for all periods presented in the graph below. The graph tracks the performance of a $100 investment in our common stock, in the peer group, and in the index (with the reinvestment of all dividends) from November 28, 2009 to January 3, 2015. We paid no cash or stock dividends during the period shown. The performance of the market index and the peer group indices is shown on a total return (dividends reinvested) basis.
COMPARISON OF 5 YEAR CUMULATIVE TOTAL RETURN*
Among CRA International, Inc., the NASDAQ Composite Index, and a Peer Group
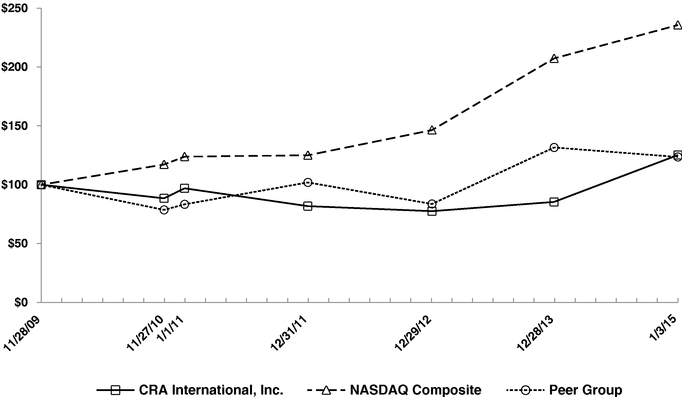
- *
- $100 invested on 11/28/09 in stock or 11/30/09 in index, including reinvestment of dividends. Index calculated on month-end basis.
| |
11/28/09 | 11/27/10 | 1/1/11 | 12/31/11 | 12/29/12 | 12/28/13 | 1/3/15 | |||||||||||||||
|---|---|---|---|---|---|---|---|---|---|---|---|---|---|---|---|---|---|---|---|---|---|---|
CRA International, Inc. |
$ | 100.00 | $ | 88.45 | $ | 96.95 | $ | 81.81 | $ | 77.53 | $ | 85.40 | $ | 125.20 | ||||||||
NASDAQ Composite |
100.00 | 117.18 | 123.88 | 125.02 | 146.41 | 207.32 | 235.67 | |||||||||||||||
Peer Group |
100.00 | 78.62 | 83.35 | 101.95 | 83.66 | 131.64 | 123.57 | |||||||||||||||
The stock price performance included in this graph is not necessarily indicative of future stock price performance
24
Item 6—Selected Financial Data
The following selected consolidated financial data for each of the fiscal years in the five-year period ended January 3, 2015, and as of the five weeks ended January 1, 2011, has been derived from our audited consolidated financial statements. The following selected consolidated financial data as of the five weeks ended January 2, 2010 has been derived from our unaudited consolidated financial statements.
| |
Fiscal Year Ended | |
|
|||||||||||||||||||
|---|---|---|---|---|---|---|---|---|---|---|---|---|---|---|---|---|---|---|---|---|---|---|
| |
January 3, 2015 (53 weeks) |
December 28, 2013 (52 weeks) |
December 29, 2012 (52 weeks) |
December 31, 2011 (52 weeks) |
November 27, 2010 (52 weeks) |
Transition Period January 1, 2011 (5 weeks) |
January 2, 2010 (5 weeks) |
|||||||||||||||
| |
(audited) |
(audited) |
(audited) |
(audited) |
(audited) |
(audited) |
(unaudited) |
|||||||||||||||
| |
(In thousands, except per share data) |
|||||||||||||||||||||
Consolidated Statements of Operations Data(1): |
||||||||||||||||||||||
Revenues |
$ | 306,371 | $ | 278,432 | $ | 270,390 | $ | 305,228 | $ | 287,424 | $ | 22,250 | $ | 20,360 | ||||||||
Costs of services |
206,813 | 189,262 | 182,381 | 199,383 | 197,140 | 16,400 | 15,009 | |||||||||||||||
| | | | | | | | | | | | | | | | | | | | | | | |
Gross profit |
99,558 | 89,170 | 88,009 | 105,845 | 90,284 | 5,850 | 5,351 | |||||||||||||||
Selling, general and administrative expenses |
69,074 | 64,242 | 67,235 | 71,752 | 73,900 | 6,144 | 6,390 | |||||||||||||||
Depreciation and amortization |
6,443 | 6,411 | 7,190 | 5,029 | 5,983 | 506 | 451 | |||||||||||||||
Goodwill impairment |
— | — | 71,394 | — | — | — | — | |||||||||||||||
| | | | | | | | | | | | | | | | | | | | | | | |
Income (loss) from operations |
24,041 | 18,517 | (57,810 | ) | 29,064 | 10,401 | (800 | ) | (1,490 | ) | ||||||||||||
Interest income |
163 | 155 | 264 | 332 | 361 | 29 | 30 | |||||||||||||||
Interest expense |
(594 | ) | (574 | ) | (300 | ) | (908 | ) | (3,356 | ) | (147 | ) | (396 | ) | ||||||||
Loss on extinguishment of convertible debentures |
— | — | — | — | (669 | ) | — | — | ||||||||||||||
Other income (expense), net |
(295 | ) | (180 | ) | (177 | ) | (405 | ) | (504 | ) | (28 | ) | 60 | |||||||||
| | | | | | | | | | | | | | | | | | | | | | | |
Income (loss) before (provision) benefit for income taxes and equity method investment loss, net of tax |
23,315 | 17,918 | (58,023 | ) | 28,083 | 6,233 | (946 | ) | (1,796 | ) | ||||||||||||
(Provision) benefit for income taxes |
(9,908 | ) | (6,683 | ) | 5,180 | (11,138 | ) | (4,273 | ) | 288 | 1,232 | |||||||||||
| | | | | | | | | | | | | | | | | | | | | | | |
Net income (loss) |
13,407 | 11,235 | (52,843 | ) | 16,945 | 1,960 | (658 | ) | (564 | ) | ||||||||||||
Net (income) loss attributable to noncontrolling interest, net of tax |
231 | 135 | (147 | ) | (94 | ) | 626 | 32 | 206 | |||||||||||||
| | | | | | | | | | | | | | | | | | | | | | | |
Net income (loss) attributable to CRA International, Inc.: |
$ | 13,638 | $ | 11,370 | $ | (52,990 | ) | $ | 16,851 | $ | 2,586 | $ | (626 | ) | $ | (358 | ) | |||||
| | | | | | | | | | | | | | | | | | | | | | | |
| | | | | | | | | | | | | | | | | | | | | | | |
| | | | | | | | | | | | | | | | | | | | | | | |
Net income (loss) per share attributable to CRA International, Inc.(2): |
||||||||||||||||||||||
Basic |
$ | 1.40 | $ | 1.13 | $ | (5.21 | ) | $ | 1.60 | $ | 0.24 | $ | (0.06 | ) | $ | (0.03 | ) | |||||
| | | | | | | | | | | | | | | | | | | | | | | |
| | | | | | | | | | | | | | | | | | | | | | | |
| | | | | | | | | | | | | | | | | | | | | | | |
Diluted |
$ | 1.38 | $ | 1.12 | $ | (5.21 | ) | $ | 1.57 | $ | 0.24 | $ | (0.06 | ) | $ | (0.03 | ) | |||||
| | | | | | | | | | | | | | | | | | | | | | | |
| | | | | | | | | | | | | | | | | | | | | | | |
| | | | | | | | | | | | | | | | | | | | | | | |
Weighted average number of shares outstanding(2): |
||||||||||||||||||||||
Basic |
9,747 | 10,084 | 10,167 | 10,555 | 10,643 | 10,567 | 10,639 | |||||||||||||||
| | | | | | | | | | | | | | | | | | | | | | | |
| | | | | | | | | | | | | | | | | | | | | | | |
| | | | | | | | | | | | | | | | | | | | | | | |
Diluted |
9,897 | 10,173 | 10,167 | 10,739 | 10,773 | 10,567 | 10,639 | |||||||||||||||
| | | | | | | | | | | | | | | | | | | | | | | |
| | | | | | | | | | | | | | | | | | | | | | | |
| | | | | | | | | | | | | | | | | | | | | | | |
25
| |
January 3, 2015 |
December 28, 2013 |
December 29, 2012 |
December 31, 2011 |
November 27, 2010 |
January 1, 2011 |
January 2, 2010 |
|||||||||||||||
|---|---|---|---|---|---|---|---|---|---|---|---|---|---|---|---|---|---|---|---|---|---|---|
| |
(audited) |
(audited) |
(audited) |
(audited) |
(audited) |
(audited) |
(unaudited) |
|||||||||||||||
| |
(In thousands) |
|||||||||||||||||||||
Consolidated Balance Sheet Data(1): |
||||||||||||||||||||||
Working capital |
$ | 76,773 | $ | 75,003 | $ | 102,467 | $ | 107,651 | $ | 99,353 | $ | 100,533 | $ | 144,972 | ||||||||
Total assets |
315,012 | 320,304 | 292,010 | 372,107 | 373,699 | 367,365 | 408,363 | |||||||||||||||
Total long-term debt |
981 | 1,007 | 1,007 | 1,631 | 2,211 | 2,069 | 62,821 | |||||||||||||||
Total shareholders' equity |
214,704 | 224,637 | 212,234 | 268,407 | 256,420 | 255,424 | 254,257 | |||||||||||||||
- (1)
- On
January 31, 2013, we announced that an approximate 40-person litigation consulting team had joined us, effective February 1, 2013. Under
the terms of the transaction, we acquired certain intangible assets, accounts receivable, and certain client projects currently underway.
This acquisition was accounted for under the purchase accounting method, and the results of operations for this acquisition have been included in the accompanying statements of operations from the date of acquisition.
- (2)
- Basic net income (loss) per share represents net income (loss) divided by the weighted average shares of common stock outstanding during the period. Diluted net income per share represents net income divided by the weighted average shares of common stock and common stock equivalents outstanding during the period, if applicable. Weighted average shares used in diluted net income per share include common stock equivalents arising from stock options, unvested restricted stock, time-vesting unvested restricted stock units, and shares underlying our debentures using the treasury stock method. All common stock equivalents were excluded in fiscal 2012 and the five weeks ended January 1, 2011 and January 2, 2010 because they were antidilutive due to the net loss.
Item 7—Management's Discussion and Analysis of Financial Condition and Results of Operations
Overview
We are a worldwide leading economic, financial, and management consulting firm that applies advanced analytic techniques and in-depth industry knowledge to complex engagements for a broad range of clients.
We derive revenues principally from professional services rendered by our employee consultants. In most instances, we charge clients on a time-and-materials basis and recognize revenues in the period when we provide our services. We charge consultants' time at hourly rates, which vary from consultant to consultant depending on a consultant's position, experience, expertise, and other factors. We derive a portion of our revenues from fixed-price contracts. Revenues from fixed-price engagements are recognized using a proportional performance method based on the ratio of costs incurred, substantially all of which are labor-related, to the total estimated project costs. We generate substantially all of our professional services fees from the work of our own employee consultants and a portion from the work of our non-employee experts. Factors that affect our professional services revenues include the number and scope of client engagements, the number of consultants we employ, the consultants' billing rates, and the number of hours our consultants work. Revenues also include reimbursements, which include reimbursements for travel and other out-of-pocket expenses, outside consultants, and other reimbursable expenses.
Our costs of services include the salaries, bonuses, share-based compensation expense, and benefits of our employee consultants. Our bonus program awards discretionary bonuses based on our revenues and profitability and individual performance. Costs of services also include out-of-pocket and other expenses, and the salaries of support staff whose time is billed directly to clients, such as librarians, editors, and programmers, as well as the amounts billed to us by our non-employee experts for services rendered while completing the applicable project. Selling, general, and administrative expenses include salaries, bonuses, share-based compensation expense, and benefits of our administrative and support staff, fees to non-employee experts for generating new business, office rent, marketing, and other costs.
26
Utilization and Seasonality
We derive the majority of our revenues from the number of hours worked by our employee consultants. Our utilization of those employee consultants is one key indicator that we use to measure our operating performance. We calculate utilization by dividing the total hours worked by our employee consultants on engagements during the measurement period by the total number of hours that our employee consultants were available to work during that period. Utilization was 76%, 73%, and 68% for fiscal 2014, fiscal 2013, and fiscal 2012, respectively. Select underperforming practice areas, including our Chemicals practice and Middle East operations, affected our overall performance in fiscal 2012. In connection with the restructuring plan we committed to in the third quarter of fiscal 2012, we eliminated our Chemicals practice, closed our Middle East operations and repositioned other select underperforming practice areas, amongst other actions. The lower utilization in fiscal 2012, compared to fiscal 2013 and fiscal 2014, reflects this underperformance and these restructuring actions.
We experience certain seasonal effects that impact our revenue. Concurrent vacations or holidays taken by a large number of consultants can adversely impact our revenue. For example, we usually experience fewer billable hours in our fiscal third quarter, as that is the summer vacation season for most of our offices, and in our fiscal fourth quarter, as that is the quarter that typically includes the December holiday season.
International Operations
Revenues outside of the U.S. accounted for approximately 22%, 22%, and 23% of our total revenues in fiscal 2014, fiscal 2013, and fiscal 2012, respectively. Revenue by country is detailed in Note 13 to our Notes to Consolidated Financial Statements.
Noncontrolling Interest
Our ownership interest in NeuCo is 55.89%. NeuCo's financial results have been consolidated with ours and the portion of NeuCo's results allocable to its other owners is shown as "noncontrolling interest."
NeuCo's revenues included in our consolidated statements of operations for fiscal 2014, fiscal 2013, and fiscal 2012 totaled approximately $4.8 million, $5.1 million, and $5.5 million, respectively. NeuCo's net loss included in our consolidated statements of operations for fiscal 2014 and fiscal 2013 was approximately $0.5 million and $0.3 million, respectively. NeuCo's net income included in our consolidated statements of operations for fiscal 2012 was approximately $0.3 million. NeuCo's net loss, net of amounts allocable to its other owners, included in our consolidated statements of operations for each of fiscal 2014 and fiscal 2013 was approximately $0.2 million. NeuCo's net income, net of amounts allocable to its other owners, included in our consolidated statements of operations for fiscal 2012 was approximately $0.2 million.
Critical Accounting Policies
The discussion and analysis of our financial condition and results of operations are based upon our consolidated financial statements, which have been prepared in accordance with U.S. GAAP. The preparation of these financial statements requires us to make significant estimates and judgments that affect the reported amounts of assets, liabilities, revenues, and expenses, as well as related disclosure of contingent assets and liabilities. Estimates in these consolidated financial statements include, but are not limited to, accounts and unbilled receivable allowances, revenue recognition on fixed price contracts, depreciation of property and equipment, share-based compensation, valuation of acquired intangible assets, impairment of long-lived assets and goodwill, accrued and deferred income taxes, valuation allowances on deferred tax assets, accrued compensation, accrued exit costs, and other accrued expenses. These items are monitored and analyzed by management for changes in facts and circumstances, and material changes in these estimates could occur in the future. Changes in estimates are recorded in the period in which they become known. We base our estimates on historical
27
experience and various other assumptions that we believe to be reasonable under the circumstances. Actual results may differ from our estimates if our assumptions based on past experience or our other assumptions do not turn out to be substantially accurate.
A summary of the accounting policies that we believe are most critical to understanding and evaluating our financial results is set forth below. This summary should be read in conjunction with our consolidated financial statements and the related notes included in Item 8 of this annual report on Form 10-K.
Revenue Recognition and Accounts Receivable Allowances. We derive substantially all of our revenues from the performance of professional services. The contracts that we enter into and operate under specify whether the engagement will be billed on a time-and-materials or a fixed-price basis. These engagements generally last three to six months, although some of our engagements can be much longer in duration. Each contract must be approved by one of our vice presidents.
We recognize substantially all of our revenues under written service contracts when the fee is fixed or determinable, as the services are provided, and only in those situations where collection from the client is reasonably assured. In certain cases we provide services to our clients without sufficient contractual documentation, or fees are tied to performance-based criteria, which require us to defer revenue in accordance with U.S. GAAP. In these cases, these amounts are fully reserved until all criteria for recognizing revenue are met.
Our revenues include projects secured by our non-employee experts as well as projects secured by our employees. We recognize all project revenue on a gross basis based on the consideration of the criteria set forth in Accounting Standards Codification ("ASC") Topic 605-45, Principal Agent Considerations.
Most of our revenue is derived from time-and-materials service contracts. Revenues from time-and-materials service contracts are recognized as the services are provided based upon hours worked and contractually agreed-upon hourly rates, as well as indirect fees based upon hours worked.
Revenues from a majority of our fixed-price engagements are recognized on a proportional performance method based on the ratio of costs incurred, substantially all of which are labor-related, to the total estimated project costs. We derived approximately 15%, 13%, and 15% of revenues from fixed-price engagements in fiscal 2014, fiscal 2013, and fiscal 2012, respectively. In general, project costs are classified in costs of services and are based on the direct salary of the consultants on the engagement plus all direct expenses incurred to complete the engagement, including any amounts billed to us by our non-employee experts. The proportional performance method is used for fixed-price contracts because reasonably dependable estimates of the revenues and costs applicable to various stages of a contract can be made, based on historical experience and the terms set forth in the contract, and are indicative of the level of benefit provided to our clients. Fixed-price contracts generally convert to time-and-materials contracts in the event the contract terminates. Our management maintains contact with project managers to discuss the status of the projects and, for fixed-price engagements, management is updated on the budgeted costs and resources required to complete the project. These budgets are then used to calculate revenue recognition and to estimate the anticipated income or loss on the project. Occasionally, we have been required to commit unanticipated additional resources to complete projects, which has resulted in lower than anticipated income or losses on those contracts. We may experience similar situations in the future. Provisions for estimated losses on contracts are made during the period in which such losses become probable and can be reasonably estimated. To date, such losses have not been significant.
28
Revenues also include reimbursements, which include reimbursement for travel and other out-of-pocket expenses, outside consultants, and other reimbursable expenses. Reimbursable expenses are as follows (in thousands):
| |
Fiscal Year Ended |
Fiscal Year Ended |
Fiscal Year Ended |
|||||||
|---|---|---|---|---|---|---|---|---|---|---|
| |
January 3, 2015 (53 weeks) |
December 28, 2013 (52 weeks) |
December 29, 2012 (52 weeks) |
|||||||
Reimbursable expenses |
$ | 36,676 | $ | 37,320 | $ | 33,530 | ||||
For fiscal 2014, fiscal 2013, and fiscal 2012 our average days sales outstanding (DSOs) at the end of the period were 99 days, 94 days, and 98 days, respectively. We calculate DSOs by dividing the sum of our accounts receivable and unbilled services balance, net of deferred revenue, at the end of the period by average daily revenues. Average daily revenues are calculated by dividing period revenues by the number of days in the period. Our project managers and finance personnel monitor payments from our clients and assess any collection issues. We maintain accounts receivable allowances for estimated losses resulting from disputed amounts or the inability of our clients to make required payments. We base our estimates on our historical collection experience, current trends, and credit policy. In determining these estimates, we examine historical write-offs of our receivables and review client accounts to identify any specific customer collection issues. If the financial condition of our customers were to deteriorate or disputes were to arise regarding the services provided, resulting in an impairment of their ability or intent to make payment, additional allowances may be required. A failure to estimate accurately the accounts receivable allowances and ensure that payments are received on a timely basis could have a material adverse effect on our business, financial condition, and results of operations. As of January 3, 2015 and December 28, 2013, $4.2 million, and $7.2 million were provided for accounts receivable allowances, respectively.
Share-Based Compensation Expense. Share-based compensation cost is estimated at the grant date based on the fair value of the award and is recognized as expense over the requisite service period of the award. We use the Black-Scholes option-pricing model to estimate the fair value of stock options. Option valuation models require the input of assumptions, including the expected life of the share-based awards, the expected stock price volatility, the risk-free interest rate, and the expected dividend yield. The expected volatility and expected life are based on our historical experience. The risk-free interest rate is based on U.S. Treasury interest rates with corresponding terms consistent with the expected life of the share-based award. Expected dividend yield is not considered in the option pricing formula because we have not paid dividends in the past and we do not anticipate paying any dividends in the foreseeable future. We will update these assumptions if changes are warranted. The forfeiture rate is based upon historical experience. We adjust the estimated forfeiture rate based upon our actual experience.
Valuation of Goodwill and Other Intangible Assets. We account for our acquisitions under the purchase method of accounting. Goodwill represents the purchase price of acquired businesses in excess of the fair market value of net assets acquired. Intangible assets that are separate from goodwill and have determinable useful lives are valued separately. These intangible assets typically consist of non-competition agreements, customer relationships, customer lists, developed technology, and trademarks, which are generally amortized on a straight-line basis over their estimated remaining useful lives of four to ten years.
In accordance with ASC Topic 350, "Intangibles—Goodwill and Other" ("ASC Topic 350"), goodwill and intangible assets with indefinite lives are not subject to amortization, but are monitored annually on October 15th for impairment, or more frequently, as necessary, if events or circumstances exist that would more likely than not reduce the fair value of the reporting unit below its carrying amount. For our goodwill impairment analysis, we operate under one reporting unit.
29
Under ASC Topic 350, in performing the first step of the goodwill impairment testing and measurement process, we compare our entity-wide estimated fair value to net book value to identify potential impairment. We estimate the entity-wide fair value utilizing our market capitalization, plus an appropriate control premium. Market capitalization is determined by multiplying our shares outstanding on the test date by the market price of our common stock on that date. We have utilized a control premium which considers appropriate industry, market and other pertinent factors, including indications of such premiums from data on recent acquisition transactions. If our estimated fair value is less than our net book value, the second step is performed to determine if goodwill is impaired. If we determine through the impairment evaluation process that goodwill has been impaired, we would record the impairment charge in our consolidated statement of operations.
We had no impairment losses related to goodwill during fiscal 2014 or fiscal 2013 as there were no events or circumstances that would more likely than not reduce our fair value below our carrying amount, and our estimated fair value was greater than our carrying value on October 15th of each respective year.
Late in the second quarter of fiscal 2012, our stock price experienced a decline. In the third quarter of fiscal 2012, our stock price improved but remained below the price levels experienced in fiscal 2011 and the first five months of fiscal 2012. We did not record any impairment losses related to goodwill or intangible assets during the fiscal year to date period ended September 29, 2012 as the stock price decline was not deemed to be more than temporary, there were no other events or circumstances that would more likely than not reduce our fair value below our carrying amount, and our management felt that an increase in our stock price was a reasonable expectation. However, the depressed stock price levels persisted into the fourth quarter of 2012 and through the date of our annual impairment test performed in the fourth quarter fiscal 2012. When we performed our annual impairment test, our book value exceeded our market capitalization plus an estimated control premium. Therefore, we were required to perform the second step of the goodwill impairment test. In this step, our fair value, as determined in the first step of the test, is allocated among all of our assets and liabilities, including any unrecognized intangible assets, in a hypothetical analysis that calculates the implied fair value of goodwill in the same manner as if we were being acquired in a business acquisition. If the implied fair value of goodwill is less than the recorded goodwill, an impairment charge is recorded for the difference. During the process of conducting the second step of the annual goodwill impairment test in the fourth quarter of fiscal 2012, we identified significant unrecognized intangible assets. The combination of these hypothetical unrecognized intangible assets and other hypothetical unrecognized fair value changes to the carrying values of other assets and liabilities, together with the lower fair value calculated in the first step of the annual impairment test, resulted in a non-cash goodwill impairment charge of $71.4 million in the fourth quarter of fiscal 2012.
The re-measurement of goodwill is classified as a Level 3 fair value assessment due to the significance of unobservable inputs developed using our specific information. We used a combination of the income, cost and market approach techniques to determine the fair value of our assets and liabilities. The fair value adjustment to goodwill was computed as the difference between our fair value and the fair value of underlying assets and liabilities. The unobservable inputs used to determine the fair value of the underlying assets and liabilities were based on our specific information such as estimates of revenue and cost growth rates, profit margins, discount rates, and cost estimates.
In the future, if our market capitalization plus an estimated control premium is below our net book value for a period we consider to be other-than-temporary, we may be required to record an impairment of goodwill either as a result of our annual assessment performed in the fourth quarter of our fiscal year or in a future quarter if events or circumstances exist that would more likely than not reduce the fair value of the reporting unit below its carrying amount. A goodwill impairment charge would have the effect of decreasing our earnings in such period. If we are required to take a substantial impairment charge, our operating results would be materially adversely affected in such period, though such a charge would have no impact on cash flows or working capital.
30
As of January 3, 2015, we had goodwill of approximately $82.3 million. The goodwill amount for acquisitions is initially recorded based upon a preliminary estimated purchase price allocation and is subject to change. Any preliminary purchase price allocation is based upon our estimate of fair value, and is finalized as we receive other information relevant to the acquisition.
We assess the impairment of amortizable intangible assets whenever events or changes in circumstances indicate that the carrying value may not be recoverable. Factors we consider important that could trigger an impairment review include the following:
- •
- a significant underperformance relative to expected historical or projected future operating results;
- •
- a significant change in the manner of our use of the acquired asset or the strategy for our overall business; and
- •
- a significant negative industry or economic trend.
If we were to determine that an impairment evaluation is required, we would review the expected future undiscounted cash flows to be generated by the assets. If we determine that the carrying value of intangible assets may not be recoverable, we measure any impairment based on a projected discounted cash flow method using a discount rate determined by our management to be commensurate with the risk inherent in our current business model. The net amount of intangible assets other than goodwill was approximately $4.8 million as of January 3, 2015.
Accounting for Income Taxes. We record income taxes using the asset and liability method. Deferred tax assets and liabilities are recognized based upon anticipated future tax consequences attributable to differences between the financial statement carrying amounts of existing assets and liabilities and their respective income tax bases, and operating loss and tax credit carryforwards. Deferred tax assets and liabilities are measured using enacted tax rates expected to apply to taxable income in the years in which those temporary differences are expected to be recovered or settled. The effect on deferred tax assets and liabilities of a change in tax rates is recognized in income in the period that includes the enactment date.
Our financial statements contain certain deferred tax assets and liabilities that result from temporary differences between book and tax accounting, as well as net operating loss carryforwards. ASC Topic 740, "Income Taxes" ("ASC Topic 740"), requires the establishment of a valuation allowance to reflect the likelihood of realization of deferred tax assets. Significant management judgment is required in determining our provision for income taxes, our deferred tax assets and liabilities, and any valuation allowance recorded against our net deferred tax assets. We evaluate the weight of all available evidence to determine whether it is more likely than not that some portion or all of the deferred income tax assets will not be realized. The decision to record a valuation allowance requires varying degrees of judgment based upon the nature of the item giving rise to the deferred tax asset. As a result of operating losses incurred in certain of our foreign subsidiaries, and uncertainty as to the extent and timing of profitability in future periods, we have recorded valuation allowances on our tax loss carryforwards. In certain of these jurisdictions, the tax loss carryforwards do not expire. However, a deferred tax asset is not realizable even if it can be carried forward indefinitely. Furthermore, an indefinite-lived intangible giving rise to a deferred tax liability may not be used as a source of future taxable income that changes the need for a valuation allowance. If the realization of deferred tax assets is considered more likely than not, the corresponding release of the valuation allowance would increase net income in the period such determination was made. The amount of the deferred tax asset considered realizable is based on significant estimates, including forecasts of future income, and it is possible that changes in these estimates in the near term could materially affect our financial condition and results of operations.
Our effective tax rate may vary from period to period based on changes in estimated taxable income or loss, changes to the valuation allowance, changes to federal, state, or foreign tax laws, future expansion into areas with varying country, state, and local income tax rates, deductibility of certain
31
costs, uncertain tax positions, and expenses by jurisdiction, and as a result of acquisitions or dispositions.
The calculation of our tax liabilities involves dealing with uncertainties in the application of complex tax regulations in several different tax jurisdictions. We are periodically reviewed by domestic and foreign tax authorities regarding the amount of taxes due. These reviews include questions regarding the timing and amount of deductions and the allocation of income among various tax jurisdictions. We account for uncertainties in income tax positions in accordance with ASC Topic 740. The number of years with open tax audits varies depending on the tax jurisdiction. Our major taxing jurisdiction is the United States. We are no longer subject to U.S. federal examinations by the Internal Revenue Service for years before fiscal 2011. Our United Kingdom subsidiary's corporate tax returns are no longer subject to examination by Her Majesty's Revenue and Customs for fiscal years before fiscal 2013. During this fiscal year, 2014, examinations have commenced in Germany for fiscal 2008 through fiscal 2011 and in France for fiscal 2011 and fiscal 2012. We believe that our reserves for uncertain tax positions are adequate.
Recent Accounting Standards
Reporting of Going-Concern Uncertainties
In August 2014, the Financial Accounting Standards Board ("FASB") issued ASU No. 2014-15, Presentation of Financial Statements—Going Concern (Subtopic 205-40): Disclosure of Uncertainties about an Entity's Ability to Continue as a Going Concern ("ASU 2014-15"). ASU 2014-15 is intended to define management's responsibility to evaluate whether there is substantial doubt about an organization's ability to continue as a going concern and provides guidance to an organization's management, with principles and definitions that are intended to reduce diversity in the timing and content of disclosures in the financial statement footnotes. ASU 2014-15 is effective for the annual period ending after December 15, 2016, and for annual periods and interim periods thereafter. Early application is permitted. We believe that the adoption of ASU 2014-15 will not have a material impact on our financial position, results of operations, cash flows, or disclosures.
Accounting for Share-Based Payments
In June 2014, the FASB issued ASU No. 2014-12, Accounting for Share-Based Payments When the Terms of an Award Provide That a Performance Target Could Be Achieved after the Requisite Service Period (a consensus of the FASB Emerging Issues Task Force) ("ASU 2014-12"). ASU 2014-12 clarifies that entities should treat performance targets that can be met after the requisite service period of a share-based payment award as performance conditions that affect vesting. Therefore, an entity would not record compensation expense (measured as of the grant date without taking into account the effect of the performance target) related to an award for which transfer to the employee is contingent on the entity's satisfaction of a performance target until it becomes probable that the performance target will be met. There are no new disclosures required under ASU 2014-12. ASU 2014-12 is effective for fiscal years, and interim periods within those years, beginning after December 15, 2015. We believe that the adoption of ASU 2014-12 will not have a material impact on our financial position, results of operations, cash flows, or disclosures.
Revenue from Contracts with Customers
In May 2014, the FASB issued ASU No. 2014-09, Revenue from Contracts with Customers ("ASU 2014-09"). The main provision of ASU 2014-09 is to recognize revenue when control of the goods or services transfers to the customer, as opposed to the existing guidance of recognizing revenue when the risks and rewards transfer to the customer. ASU 2014-09 is effective for fiscal years, and interim periods within those years, beginning after December 15, 2016. We have not yet determined the effects, if any, that the adoption of ASU 2014-09 may have on our financial position, results of operations, cash flows, or disclosures.
32
Presentation of Unrecognized Tax Benefits
In July 2013, the FASB issued ASU No. 2013-11, Presentation of an Unrecognized Tax Benefit When a Net Operating Loss Carryforward, a Similar Tax Loss, or a Tax Credit Carryforward Exists ("ASU 2013-11") to clarify the presentation of current and deferred income taxes on the balance sheet. Under ASU 2013-11, companies generally must present an unrecognized tax benefit, or a portion of an unrecognized tax benefit, for a net operating loss carryforward, similar tax loss, or tax credit carryforward using the "net presentation" approach as a reduction of a deferred tax asset, with some allowed exceptions. ASU 2013-11 is effective for fiscal years, and interim periods within those years, beginning after December 15, 2013. Our adoption of ASU 2013-11 in the first quarter of fiscal 2014 had no impact on our financial position, results of operations, cash flows, or disclosures.
Cumulative Translation Adjustment
In March 2013, the FASB issued ASU No. 2013-05, Parent's Accounting for the Cumulative Translation Adjustment upon Derecognition of Certain Subsidiaries or Groups of Assets within a Foreign Entity or of an Investment in a Foreign Entity ("ASU 2013-05"). ASU 2013-05 addresses the accounting for the cumulative translation adjustment when a parent either sells a part or all of its investment in a foreign entity or no longer holds a controlling financial interest in a subsidiary or group of assets that is a nonprofit activity or a business within a foreign entity. ASU 2013-05 is effective for fiscal years, and interim periods within those years, beginning after December 15, 2013 and should be applied prospectively. Our adoption of ASU 2013-05 in the first quarter of fiscal 2014 had no impact on our financial position, results of operations, cash flows, or disclosures.
Results of Operations
The following table provides operating information as a percentage of revenues for the periods indicated:
| |
Fiscal Year Ended | |||||||||
|---|---|---|---|---|---|---|---|---|---|---|
| |
January 3, 2015 (53 weeks) |
December 28, 2013 (52 weeks) |
December 29, 2012 (52 weeks) |
|||||||
| |
(audited) |
(audited) |
(audited) |
|||||||
Revenues |
100.0 | % | 100.0 | % | 100.0 | % | ||||
Costs of services |
67.5 | 68.0 | 67.5 | |||||||
| | | | | | | | | | | |
Gross profit |
32.5 | 32.0 | 32.5 | |||||||
Selling, general and administrative expenses |
22.5 | 23.1 | 24.9 | |||||||
Depreciation and amortization |
2.1 | 2.3 | 2.7 | |||||||
Goodwill impairment |
— | — | 26.4 | |||||||
| | | | | | | | | | | |
Income (loss) from operations |
7.8 | 6.7 | (21.4 | ) | ||||||
Interest income |
0.1 | 0.1 | 0.1 | |||||||
Interest expense |
(0.2 | ) | (0.2 | ) | (0.1 | ) | ||||
Other expense, net |
(0.1 | ) | (0.1 | ) | (0.1 | ) | ||||
| | | | | | | | | | | |
Income (loss) before (provision) benefit for income taxes |
7.6 | 6.4 | (21.5 | ) | ||||||
(Provision) benefit for income taxes |
(3.2 | ) | (2.4 | ) | 1.9 | |||||
| | | | | | | | | | | |
Net income (loss) |
4.4 | 4.0 | (19.5 | ) | ||||||
Net (income) loss attributable to noncontrolling interest, net of tax |
0.1 | 0.0 | (0.1 | ) | ||||||
| | | | | | | | | | | |
Net income (loss) attributable to CRA International, Inc. |
4.5 | % | 4.1 | % | (19.6 | )% | ||||
| | | | | | | | | | | |
| | | | | | | | | | | |
| | | | | | | | | | | |
33
Fiscal 2014 Compared to Fiscal 2013
CRA's fiscal year end is the Saturday nearest December 31 of each year. CRA's fiscal years periodically contain 53 weeks rather than 52 weeks. Fiscal 2014 was a 53-week year and fiscal 2013 was a 52-week year.
Revenues. Revenues increased by $27.9 million, or 10.0%, to $306.4 million for fiscal 2014 from $278.4 million for fiscal 2013. Our revenue increase was due primarily to the momentum from the strong performance in the latter part of fiscal 2013 that continued into fiscal 2014, compared to a slow start in the first half of fiscal 2013. Revenue increased in our litigation, regulatory, and financial consulting business and our management consulting business, principally through organic expansion. Our utilization increased to 76% for fiscal 2014 from 73% for fiscal 2013. Revenues in fiscal 2014 reflected a decrease in client reimbursable expenses, which are pass-through expenses that carry little to no margin, in fiscal 2014 as compared to fiscal 2013.
Overall, revenues outside of the U.S. represented approximately 22% of total revenues for each of fiscal 2014 and fiscal 2013. Revenues derived from fixed-price engagements increased to 15% of total revenues for fiscal 2014 compared with 13% for fiscal 2013. These percentages of revenue derived from fixed-price engagements depend largely on the proportion of our revenues derived from our management consulting business, as the management consulting business typically has a higher concentration of fixed-price service contracts.
Costs of Services. Costs of services increased by $17.6 million, or 9.3%, to $206.8 million for fiscal 2014 from $189.3 million for fiscal 2013. The increase in costs of services was due primarily to an increase in compensation expense for our employee consultants, specifically in incentive compensation which increases when our profitability increases, and the inclusion of fifty-three weeks of results in fiscal 2014 as compared with fifty-two weeks of results in fiscal 2013. These increases were partially offset by the decrease of $0.6 million in client reimbursable expenses. As a percentage of revenues, costs of services decreased to 67.5% for fiscal 2014 from 68.0% for fiscal 2013 due primarily to the increase in revenues outpacing the increases in costs of services in fiscal 2014 as compared with fiscal 2013.
Selling, General and Administrative Expenses. Selling, general and administrative expenses increased by $4.8 million, or 7.5%, to $69.1 million for fiscal 2014 from $64.2 million for fiscal 2013. The primary contributors to this increase were increases in compensation expense, professional fees, rent and office operating expenses, and commissions to our nonemployee experts for fiscal 2014 as compared to fiscal 2013 and the inclusion of fifty-three weeks of results in fiscal 2014 as compared with fifty-two weeks of results in fiscal 2013.
As a percentage of revenues, selling, general and administrative expenses decreased to 22.5% for fiscal 2014 from 23.1% for fiscal 2013 due primarily to the increase in revenues outpacing the increase in selling, general, and administrative expenses in fiscal 2014 as compared with fiscal 2013. Commissions to non-employee experts represented 3.0% of revenue in fiscal 2014 and 3.1% of revenue in fiscal 2013.
Other Expense, Net. Other expense, net increased by $115,000 to $295,000 for fiscal 2014 from $180,000 for fiscal 2013. Other expense, net consists primarily of foreign currency exchange transaction gains and losses. The multi-currency credit facility we entered into on April 24, 2013 helps us minimize such foreign exchange exposures. We continue to manage our foreign currency exchange exposure through frequent settling of intercompany account balances and by self-hedging movements in exchange rates between the value of the dollar and foreign currencies including the Euro and the British Pound.
Provision for Income Taxes. For fiscal 2014, our income tax provision was $9.9 million and the effective tax rate was 42.5% compared to a provision of $6.7 million and an effective tax rate of 37.3% for fiscal 2013. The effective tax rate in fiscal 2014 was higher than our combined Federal and state statutory tax rate primarily due to a non-cash tax expense recorded in the second quarter of fiscal 2014
34
to correct an immaterial error in our previously issued consolidated financial statements offset slightly by other prior period adjustments recorded in the fourth quarter. The effective tax rate also included a benefit for the release of a valuation allowance as a result of recording a deferred tax liability associated with acquisition-related intangibles and the utilization of certain historical net operating losses that previously had a valuation allowance which were realized due to the profitability of the acquired business. The effective tax rate for fiscal 2013 was lower than our combined Federal and state statutory tax rate primarily due to the favorable settlement of a tax matter in the first quarter of fiscal 2013, partially offset by a discrete tax adjustment recorded in the second quarter of fiscal 2013 and the effect of losses in foreign jurisdictions that provided no tax benefit.
Net (Income) Loss Attributable to Noncontrolling Interest, Net of Tax. Our ownership interest in NeuCo was 55.89% at the end of fiscal 2014 and fiscal 2013. As a result, NeuCo's financial results are consolidated with ours and allocations of the noncontrolling interest's share of NeuCo's net income result in deductions to our net income, while allocations of the noncontrolling interest's share of NeuCo's net loss result in additions to our net income. NeuCo's results of operations allocable to its other owners was a net loss of $231,000 for fiscal 2014 and net loss of $135,000 for fiscal 2013.
Net Income Attributable to CRA International, Inc. Net income attributable to CRA International, Inc. increased by $2.3 million to net income of $13.6 million for fiscal 2014 from net income of $11.4 million for fiscal 2013. The diluted net income per share was $1.38 per share for fiscal 2014, compared to diluted net income per share of $1.12 for fiscal 2013. Diluted weighted average shares outstanding decreased by approximately 276,000 shares to approximately 9,897,000 shares for fiscal 2014 from approximately 10,173,000 shares for fiscal 2013. The decrease in weighted average shares outstanding was primarily due to repurchases of common stock, offset in part by an increase as a result of shares of restricted stock and time-vesting restricted stock units that have vested or that have been issued, and stock options that have been exercised since December 28, 2013.
Fiscal 2013 Compared to Fiscal 2012
Revenues. Revenues increased by $8.0 million, or 3.0%, to $278.4 million for fiscal 2013 from $270.4 million for fiscal 2012 primarily due to increased revenue in our litigation, regulatory, and financial consulting business in the second half of fiscal 2013, reflecting organic growth and increasing contributions from the senior-level hires we welcomed to CRA during the latter part of fiscal 2012 and the first quarter of fiscal 2013. The increase in revenue was partially offset by a decrease of revenue in our management consulting business in fiscal 2013 as compared to fiscal 2012. Although our management consulting business started fiscal 2013 slowly, it experienced improvements in project backlog toward the end of the second quarter of fiscal 2013 that continued into the second half of fiscal 2013. Our utilization increased to 73% for fiscal 2013 from 68% for fiscal 2012. In addition, revenues were impacted by an increase in client reimbursable expenses, which are pass-through expenses that carry little to no margin, partially offset by a decrease in revenues of $0.4 million for NeuCo in fiscal 2013 as compared to fiscal 2012.
Overall, revenues outside of the U.S. represented approximately 22% of total revenues for fiscal 2013, compared with approximately 23% of total revenues for fiscal 2012. Revenues derived from fixed-price engagements decreased to 13% of total revenues for fiscal 2013 compared with 15% for fiscal 2012. This decrease was due primarily to the previously mentioned decrease in our management consulting business, as the management consulting business typically has a higher concentration of fixed-price service contracts.
Costs of Services. Costs of services increased by $6.9 million, or 3.8%, to $189.3 million for fiscal 2013 from $182.4 million for fiscal 2012. The increase in costs of services was due primarily to an increase in compensation expense, principally as a result of an increase in forgivable loan amortization of $7.1 million. As is common in our industry, we have issued forgivable loans to attract and retain certain significant revenue-producing employees and non-employee experts. We issued $38.8 million and $20.7 million of forgivable loans in fiscal 2013 and fiscal 2012, respectively. Costs of services also
35
had an increase of $3.8 million in client reimbursable expenses for fiscal 2013 as compared to fiscal 2012. The increases were offset by a decrease in cost of sales due to there being no restructuring expenses recorded in fiscal 2013 as compared to $3.8 million of expenses recorded in fiscal 2012 associated with the restructuring actions we announced in the third quarter of fiscal 2012.
As a percentage of revenues, costs of services increased to 68.0% for fiscal 2013 from 67.5% for fiscal 2012 due primarily to the increase in forgivable loan amortization and client reimbursable expenses as a percentage of revenues, partially offset by the decrease in in costs of services due to the $3.8 million of restructuring charges recorded during fiscal 2012 as compared with no restructuring charges in fiscal 2013.
Selling, General and Administrative Expenses. Selling, general and administrative expenses decreased by $3.0 million, or 4.5%, to $64.2 million for fiscal 2013 from $67.2 million for fiscal 2012. Selling, general and administrative expenses in fiscal 2012 included $1.5 million of restructuring charges associated principally with the restructuring actions we announced in the third quarter of fiscal 2012, the reduction of leased office space in our London, England office and adjustments to our leased office space in Houston, TX and Chicago, IL. There were no restructuring charges recorded in selling, general and administrative expenses in fiscal 2013. Additionally contributing to this decrease were decreased rent and office operating expenses resulting from our reduction of leased office space in London, England and Boston, Massachusetts during fiscal 2012. Furthermore, decreases in outside consultant charges, travel expense, and professional fees for fiscal 2013 as compared to fiscal 2012 resulted from the restructuring actions we announced in the third quarter of fiscal 2012. Partially offsetting these decreases was an increase in commissions to non-employee experts of $2.3 million in fiscal 2013 as compared to fiscal 2012.
As a percentage of revenues, selling, general and administrative expenses decreased to 23.1% for fiscal 2013 from 24.9% for fiscal 2012, which was primarily due to restructuring charges recorded in fiscal 2012 and the decreased rent and office operating expenses, outside consultant charges, travel expenses, and professional fees in fiscal 2013 as compared with fiscal 2012, partially offset by the increase in commissions to non-employee experts from 2.3% of revenues for fiscal 2012 to 3.1% of revenues for fiscal 2013.
Depreciation and Amortization. Depreciation and amortization decreased by $0.8 million, or 10.8%, to $6.4 million for fiscal 2013 from $7.2 million for fiscal 2012. Of this decrease, approximately $1.1 million was related to the write-off of unamortized leaseholds and other costs associated with restructuring costs recorded in fiscal 2012 for the reduction of leased office space in our London, England office, as compared to there being no restructuring expenses recorded in fiscal 2013. The decrease was partially offset by the amortization of intangibles arising from the acquisition of a 40-person litigation consulting team that joined us effective February 1, 2013.
Goodwill Impairment. In accordance with ASC Topic 350, goodwill and intangible assets with indefinite lives are not subject to amortization, but are monitored annually for impairment, or more frequently, as necessary, if events or circumstances exist that would more likely than not reduce the fair value of the reporting unit below its carrying amount. When we performed our annual impairment test in the fourth quarter of fiscal 2012, our net book value exceeded our market capitalization plus an estimated control premium. Therefore, we were required to perform the second step of the goodwill impairment test, which resulted in a goodwill impairment charge of $71.4 million. We recorded this non-cash goodwill impairment charge in the fourth quarter of fiscal 2012. We did not record any impairment charges in fiscal 2013.
Interest Expense. Interest expense increased by $0.3 million to $0.6 million for fiscal 2013 from $0.3 million for fiscal 2012. The increase was primarily due to interest expense related to the credit agreement we entered into on April 24, 2013 that provides us with a $125.0 million revolving credit facility. Upon entering into the credit agreement, we borrowed $15.0 million under the revolving credit facility, which we used, together with cash on hand, to repay in full all indebtedness outstanding under the previous credit agreement, whereupon such agreement was terminated. During the second quarter
36
of fiscal 2013, we borrowed an additional $2.3 million under the multi-currency portion of the credit agreement. We repaid $12.2 million during the second quarter of fiscal 2013 and the remaining $5.1 million during the third quarter of fiscal 2013.
Provision (Benefit) for Income Taxes. For fiscal 2013, our income tax provision was $6.7 million and the effective tax rate was 37.3% compared to an income tax benefit of $5.2 million and an effective tax rate of 8.9% for fiscal 2012. The effective tax rate for fiscal 2013 was lower than our combined Federal and state statutory tax rate primarily due to the favorable settlement of a tax matter in the first quarter of fiscal 2013, partially offset by a discrete tax adjustment recorded in the second quarter of fiscal 2013 and the effect of losses in foreign jurisdictions that provided no tax benefit. The effective tax rate for fiscal 2012 was lower than the statutory rate primarily due to the $71.4 million goodwill impairment charge we recorded in the fourth quarter of fiscal 2012, a portion of which provided a tax benefit, partially offset by losses in foreign locations that provided no tax benefit and lower pre-tax income.
Net (Income) Loss Attributable to Noncontrolling Interest, Net of Tax. Our ownership interest in NeuCo was 55.89% at the end of fiscal 2013 and fiscal 2012. As a result, NeuCo's financial results are consolidated with ours and allocations of the noncontrolling interest's share of NeuCo's net income result in deductions to our net income, while allocations of the noncontrolling interest's share of NeuCo's net loss result in additions to our net income. NeuCo's results of operations allocable to its other owners was a net loss of $135,000 for fiscal 2013 and net income of $147,000 for fiscal 2012.
Net Income Attributable to CRA International, Inc. Net income attributable to CRA International, Inc. increased by $64.4 million to net income of $11.4 million for fiscal 2013 from a net loss of $53.0 million for fiscal 2012. The diluted net income per share was $1.12 per share for fiscal 2013, compared to net loss per share of $5.21 for fiscal 2012. Diluted weighted average shares outstanding increased by approximately 6,000 shares to approximately 10,173,000 shares for fiscal 2013 from approximately 10,167,000 shares for fiscal 2012. The increase in weighted average shares outstanding was primarily the result of shares of restricted stock and time-vesting restricted stock units that have vested or that have been issued, and stock options that have been exercised since December 29, 2012, partially offset by repurchases of common stock.
Liquidity and Capital Resources
We believe that current cash, cash equivalents, cash generated from operations, and amounts available under our bank line of credit will be sufficient to meet our anticipated working capital and capital expenditure requirements for at least the next 12 months.
General. In fiscal 2014, cash and cash equivalents decreased by $3.1 million. We completed the period with cash and cash equivalents of $48.2 million and working capital (defined as current assets less current liabilities) of $76.8 million. The principal drivers of the reduction in cash were the payment of the majority of our fiscal 2013 performance bonuses in the first quarter of fiscal 2014, the increase in days sales outstanding from 94 days at the end of fiscal 2013 to 99 days at the end of fiscal 2014, and the repurchase and retirement of 971,515 shares of our common stock during fiscal 2014.
Of the total cash and cash equivalents of $48.2 million at January 3, 2015, $32.0 million was in the U.S. We have sufficient sources of cash in the U.S. to fund U.S. cash requirements without the need to repatriate any funds.
As of January 3, 2015, a substantial portion of our cash accounts was concentrated at a single financial institution, which potentially exposes us to credit risks. The financial institution has a short-term credit rating of A-2 by Standard & Poor's ratings services. We have not experienced any losses related to such accounts, and we do not believe that there is significant risk of non-performance by the financial institution. Our cash on deposit at this financial institution is fully liquid, and we continually monitor the credit ratings of such institution. A change in the credit ratings of this financial institution could materially affect our liquidity and working capital.
37
Sources and Uses of Cash. During fiscal 2014, net cash provided by operations was $30.2 million. Cash provided by operations included net income of $13.4 million, non-cash charges for depreciation and amortization expense of $6.4 million, share-based compensation expense of $5.6 million, and increased "deferred rent" of $0.2 million, partially offset by deferred income tax benefit of $1.4 million and excess tax benefits from share-based compensation of $0.4 million. The primary factor in cash provided by operations was the $8.2 million increase in the "accounts payable, accrued expenses, and other liabilities" line item of the cash flow statement, which includes approximately $53 million accrued during fiscal 2014 for bonuses, partially offset by the payment during fiscal 2014 of approximately $44 million of bonuses, the majority of which was for our fiscal 2013 performance bonuses. As of January 3, 2015, accrued performance bonuses for fiscal 2014 were approximately $49 million. We anticipate that most of this amount will be paid during the first quarter of fiscal 2015. Uses of cash included movements in the following cash flow statement line items: a $1.1 million decrease in "accounts receivable", net of "accounts receivable allowances", and a $0.7 million decrease in "unbilled services".
During fiscal 2014, net cash used in investing activities was $5.9 million, which included $4.2 million for capital expenditures and $1.8 million of net acquisition consideration payments, partially offset by $0.1 million of collections on notes receivable.
Net cash used in financing activities during fiscal 2014 was $25.9 million, primarily for repurchases and retirements of our common stock of $25.5 million and the redemption of $1.2 million in vested employee restricted shares for tax withholdings, partially offset by $0.5 million received upon the exercise of stock options and excess tax benefits from share-based compensation of $0.4 million.
Indebtedness
We are party to a credit agreement that provides us with a $125.0 million revolving credit facility and a $15 million sublimit for the issuance of letters of credit. We may use the proceeds of the revolving credit facility to provide working capital and for other general corporate purposes. Generally, we may repay any borrowings under the revolving credit facility at any time, but must repay all borrowings no later than April 24, 2018. There were no amounts outstanding under this revolving line of credit as of January 3, 2015.
The amount available under this revolving line of credit is reduced by certain letters of credit outstanding, which amounted to $1.3 million as of January 3, 2015.
Borrowings under the revolving credit facility bear interest at a rate per annum of either (i) the adjusted base rate, as defined in the credit agreement, plus an applicable margin, which varies between 0.50% and 1.50% depending on our total leverage ratio as determined under the credit agreement, or (ii) the adjusted eurocurrency rate, as defined in the credit agreement, plus an applicable margin, which varies between 1.50% and 2.50% depending on our total leverage ratio. We are required to pay a fee on the unused portion of the revolving credit facility at a rate per annum that varies between 0.25% and 0.375% depending on our total leverage ratio. Borrowings under the credit facility are secured by 100% of the stock of certain of our U.S. subsidiaries and 65% of the stock of certain of our foreign subsidiaries, which represent approximately $6.4 million in net assets as of January 3, 2015.
Under the credit agreement, we must comply with various financial and non-financial covenants. Compliance with these financial covenants is tested on a fiscal quarterly basis. Any indebtedness outstanding under the credit facility may become immediately due and payable upon the occurrence of stated events of default, including our failure to pay principal, interest or fees or a violation of any financial covenant. The financial covenants require us to maintain an adjusted consolidated EBITDA to consolidated interest expense ratio of more than 2.5 to 1.0 and to comply with a consolidated debt to adjusted consolidated EBITDA ratio of not more than 3.0 to 1.0. The non-financial covenant restrictions of the senior credit agreement include, but are not limited to, our ability to incur additional indebtedness, engage in acquisitions or dispositions, and enter into business combinations.
38
Forgivable Loans and Term Loans
In order to attract and retain highly skilled professionals, we may issue forgivable loans or term loans to employees and non-employee experts. A portion of these loans is collateralized. The forgivable loans have terms that are generally between three and eight years. The principal amount of forgivable loans and accrued interest is forgiven by us over the term of the loans, so long as the employee or non-employee expert continues employment or affiliation with us and complies with certain contractual requirements. The expense associated with the forgiveness of the principal amount of the loans is recorded as compensation expense over the service period, which is consistent with the term of the loans. During the fiscal year-to-date period ended January 3, 2015, we issued approximately $10.9 million in forgivable loans to employees and non-employee experts for future service.
Compensation Arrangements
We have entered into compensation arrangements for the payment of incentive performance awards to certain of our non-employee experts and employees if specific performance targets are met. The amounts of the awards to be paid under these compensation arrangements could fluctuate depending on future performance through the respective measurement periods. Changes in the estimated award are expensed prospectively over the remaining service period. We believe that we will have sufficient funds to satisfy any obligations related to the incentive performance awards. We expect to fund these payments, if any, from existing cash resources, cash generated from operations, or financing transactions.
Business Acquisition
As part of our business, we regularly evaluate opportunities to acquire other consulting firms, practices or groups or other businesses. In recent years, we have typically paid for acquisitions with cash, or a combination of cash and our common stock, and we may continue to do so in the future. To pay for an acquisition, we may use cash on hand, cash generated from our operations, borrowings under our revolving credit facility, or we may pursue other forms of financing. Our ability to secure short-term and long-term debt or equity financing in the future, including our ability to refinance our current senior loan agreement, will depend on several factors, including our future profitability, the levels of our debt and equity, restrictions under our existing revolving line of credit with our bank, and the overall credit and equity market environments.
Share Repurchases
On August 10, 2012, February 13, 2014, and October 23, 2014, our Board of Directors authorized the repurchase of up to $5.0 million, $15.0 million, and $30.0 million, respectively, of our common stock. We may repurchase shares under any of these programs in open market purchases (including through any Rule 10b5-1 plan adopted by CRA) or in privately negotiated transactions in accordance with applicable insider trading and other securities laws and regulations. During fiscal 2014, we repurchased and retired 971,515 shares under these programs at an average price per share of $26.27, resulting in approximately $20.9 million available for future repurchases as of January 3, 2015.
We will finance these programs with available cash and cash from future operations. We expect to continue to repurchase shares under these programs.
Impact of Inflation
To date, inflation has not had a material impact on our financial results. There can be no assurance, however, that inflation will not adversely affect our financial results in the future.
39
Contractual Obligations
The following table presents information about our known contractual obligations as of January 3, 2015. It does not reflect contractual obligations that may have arisen or may arise after that date. Except for historical facts, the information in this section is forward-looking information.
| |
Payments due by period | |||||||||||||||
|---|---|---|---|---|---|---|---|---|---|---|---|---|---|---|---|---|
Contractual Obligations
|
Total | Fiscal 2015 | Fiscal 2016-2017 | Fiscal 2018-2019 | After Fiscal 2019 | |||||||||||
| |
(in thousands) |
|||||||||||||||
Operating lease obligations(1) |
$ | 59,355 | $ | 9,683 | $ | 13,151 | $ | 9,192 | $ | 27,329 | ||||||
Other long-term liabilities(2) |
981 | — | 981 | — | — | |||||||||||
Purchase obligations(3) |
— | — | — | — | — | |||||||||||
Net unrecognized tax benefit obligation under Topic 740(4) |
608 | 222 | — | 386 | — | |||||||||||
| | | | | | | | | | | | | | | | | |
Total |
$ | 60,944 | $ | 9,905 | $ | 14,132 | $ | 9,578 | $ | 27,329 | ||||||
| | | | | | | | | | | | | | | | | |
| | | | | | | | | | | | | | | | | |
| | | | | | | | | | | | | | | | | |
- (1)
- Subsequent
event related to operating lease obligations:
On February 24, 2015, we entered into an amendment to our lease with BP Hancock LLC for the office space we rent in the building at 200 Clarendon Street, Boston, Massachusetts. Under this amendment, we will lease an additional 10,057 square feet of office space on the twenty-fifth floor of this building, at an annual rate (excluding customary operating costs and expenses) of $49 per square foot, for a term beginning on June 15, 2015 (or, if later, when landlord completes certain improvements to the space) and ending on June 30, 2020, with the option to extend this term for an additional three-year period.
- (2)
- Subsequent
event related to other long-term liabilities:
On January 8, 2015, NeuCo entered into an agreement to settle this note payable in exchange for aggregate payments of $375,000. Under the settlement order, the scheduled future payments are as follows: $150,000 on January 8, 2015, $150,000 on February 28, 2015, and $75,000 on February 29, 2016. NeuCo's timely payments of these scheduled installments will release NeuCo from its obligations under the settlement order.
- (3)
- In
connection with an acquisition we completed in fiscal 2014, we agreed to pay additional consideration, contingent upon the achievement of specific
performance targets. The amount of the award could fluctuate depending on future performance through the respective measurement periods.
- (4)
- This amount relates to tax and interest on tax audit liabilities.
We are party to standby letters of credit with RBS Citizens N.A. in support of the minimum future lease payments under leases for permanent office space and bonds required per the terms of certain project proposals and contracts amounting to $1.3 million as of January 3, 2015.
Factors Affecting Future Performance
Item 1A of this annual report sets forth risks and uncertainties that could cause actual results to differ materially from the results contemplated by the forward-looking statements contained in this annual report. If any of these risks, or any risks not presently known to us or that we currently believe are not significant, develops into an actual event, then our business, financial condition, and results of operations could be adversely affected.
40
Item 7A—Quantitative and Qualitative Disclosure About Market Risk
Foreign Exchange Risk
The majority of our operations are based in the U.S. and, accordingly, the majority of our transactions are denominated in U.S. Dollars. However, we have foreign-based operations where transactions are denominated in foreign currencies and are subject to market risk with respect to fluctuations in the relative value of foreign currencies. Our primary foreign currency exposures relate to our short-term intercompany balances with our foreign subsidiaries and accounts receivable and cash valued in the United Kingdom in U.S. Dollars or Euros. Our primary foreign subsidiaries have functional currencies denominated in the British Pound and Euro, and foreign denominated assets and liabilities are remeasured each reporting period with any exchange gains and losses recorded in our consolidated statements of operations. We continue to manage our foreign currency exchange exposure through frequent settling of intercompany account balances and by self-hedging movements in exchange rates between the value of the U.S. Dollar and foreign currencies and the Euro and the British Pound. Holding all other variables constant, fluctuations in foreign exchange rates may affect reported revenues and expenses, based on our currency exposures at January 3, 2015. A hypothetical 10% movement in foreign exchange rates on January 3, 2015 would have affected our income before provision for income taxes for the fourth quarter of fiscal 2014 by approximately $0.1 million. However, actual gains and losses in the future could differ materially from this analysis based on the timing and amount of both foreign currency exchange rate movements and our actual exposure.
From time to time, we may use derivative instruments to manage the risk of exchange rate fluctuations. However, at January 3, 2015, we had no outstanding derivative instruments. We do not use derivative instruments for trading or speculative purposes.
Interest Rate Risk
We maintain an investment portfolio consisting mainly of commercial paper and money market funds with maturities of three months or less when purchased. These held-to-maturity securities are subject to interest rate risk. However, a hypothetical change in the interest rate of 10% would not have a material impact to the fair values of these securities at January 3, 2015 primarily due to their short maturity.
Item 8—Financial Statements and Supplementary Data
We have included our consolidated financial statements in this annual report starting on page FS-1. We have provided an index to our consolidated financial statements on page FS-1.
Item 9—Changes in and Disagreements with Accountants on Accounting and Financial Disclosure
Not applicable.
Item 9A—Controls and Procedures
- (a)
- Evaluation of Disclosure Controls and Procedures
Under the supervision and with the participation of our management, including our President and Chief Executive Officer and our Chief Financial Officer, we evaluated the effectiveness of our disclosure controls and procedures as of the end of the period covered by this report. This is done in order to ensure that information the Company is required to disclose in reports that are filed or submitted under the Securities Exchange Act of 1934 is recorded, processed, summarized and reported within the time periods specified in SEC rules and forms.
Based upon that evaluation, our President and Chief Executive Officer and our Chief Financial Officer concluded that our disclosure controls and procedures were not effective as of January 3, 2015, because of a material weakness, described below in Management's Report on Internal Control over Financial Reporting.
41
Notwithstanding the material weakness discussed below, management has concluded that the consolidated financial statements included in this form 10-K present fairly, in all material aspects, the Company's financial position, results of operations and cash flows for the periods presented in conformity with accounting principles generally accepted in the United States.
- (b)
- Evaluation of Changes in Internal Control over Financial Reporting
During the year ended January 3, 2015, we implemented internal control procedures to address a previously identified material weakness related to income tax accounting and reporting for income taxes. After completing our testing of the design and operating effectiveness of our control enhancements, we concluded that we have remediated the previously identified material weakness as of January 3, 2015.
Except for the remediation noted above and a material weakness in internal control over financial reporting related to the accounting and reporting for non-routine compensation arrangements (for example, share-based compensation) discussed below, we have determined that, during the fourth quarter of fiscal 2014, there were no changes in our internal control over financial reporting that have affected, or are reasonably likely to affect, materially our internal control over financial reporting.
- (c)
- Management's Report on Internal Control over Financial Reporting
Our management is responsible for establishing and maintaining adequate internal control over financial reporting. Under the supervision and with the participation of our management, including our President and Chief Executive Officer and our Chief Financial Officer, we assessed the effectiveness of our internal control over financial reporting as of the end of the period covered by this report based on the framework in "Internal Control—Integrated Framework (2013)" issued by the Committee of Sponsoring Organizations of the Treadway Commission.
Based on that assessment, our President and Chief Executive Officer and our Chief Financial Officer concluded that our internal control over financial reporting was not effective to provide reasonable assurance regarding the reliability of our financial reporting and the preparation of our financial statements for external purposes in accordance with U.S. generally accepted accounting principles as of January 3, 2015 because of a material weakness in internal control described in the second succeeding paragraph.
A material weakness is a deficiency, or combination of deficiencies, in internal control over financial reporting such that there is a reasonable possibility that a material misstatement of the company's annual or interim financial statements will not be prevented or detected on a timely basis.
The Company's controls were not sufficiently complete and comprehensive to ensure that our accounting and reporting for non-routine compensation arrangements (for example, share-based compensation) were complete and accurate. Specifically, there was inadequate and ineffective analysis and review of the documentation and calculations supporting the Company's non-routine compensation arrangements (for example, share-based compensation). Although the amount related to misstatements was corrected in the Company's consolidated financial statements, the absence of sufficient controls creates a reasonable possibility that a material misstatement in the Company's annual or interim consolidated financial statements would not be prevented or detected in a timely manner.
Our independent registered public accounting firm, Ernst & Young LLP, has issued an audit report on their assessment of our internal control over financial reporting. The audit report is included herein.
- (d)
- Plan for Remediation of Material Weakness
Management has initiated a remediation plan which includes the following actions:
- •
- Processes, procedures and controls over compensation arrangements will be reviewed and modified to ensure greater oversight and transparency.
42
- •
- We will deploy additional resources to bolster our compensation process to ensure that all concepts and interpretations involving the
accounting for our compensation arrangements have been appropriately considered, documented and implemented.
- (e)
- Important Considerations
The effectiveness of our disclosure controls and procedures and our internal control over financial reporting is subject to various inherent limitations, including cost limitations, judgments used in decision making, assumptions about the likelihood of future events, the soundness of our systems, the possibility of human error, and the risk of fraud. Moreover, projections of any evaluation of effectiveness to future periods are subject to the risk that controls may become inadequate because of changes in conditions and the risk that the degree of compliance with policies or procedures may deteriorate over time. Because of these limitations, there can be no assurance that any system of disclosure controls and procedures or internal control over financial reporting will be successful in preventing all errors or fraud or in making all material information known in a timely manner to the appropriate levels of management.
43
REPORT OF INDEPENDENT REGISTERED PUBLIC ACCOUNTING FIRM
The Board of Directors and Shareholders of CRA International, Inc.:
We have audited CRA International, Inc.'s internal control over financial reporting as of January 3, 2015, based on criteria established in Internal Control—Integrated Framework issued by the Committee of Sponsoring Organizations of the Treadway Commission (2013 framework) (the COSO criteria). CRA International, Inc.'s management is responsible for maintaining effective internal control over financial reporting, and for its assessment of the effectiveness of internal control over financial reporting included in the accompanying Management's Report on Assessment of Internal Control over Financial Reporting in Item 9A. Our responsibility is to express an opinion on the company's internal control over financial reporting based on our audit.
We conducted our audit in accordance with the standards of the Public Company Accounting Oversight Board (United States). Those standards require that we plan and perform the audit to obtain reasonable assurance about whether effective internal control over financial reporting was maintained in all material respects. Our audit included obtaining an understanding of internal control over financial reporting, assessing the risk that a material weakness exists, testing and evaluating the design and operating effectiveness of internal control based on the assessed risk, and performing such other procedures as we considered necessary in the circumstances. We believe that our audit provides a reasonable basis for our opinion.
A company's internal control over financial reporting is a process designed to provide reasonable assurance regarding the reliability of financial reporting and the preparation of financial statements for external purposes in accordance with generally accepted accounting principles. A company's internal control over financial reporting includes those policies and procedures that (1) pertain to the maintenance of records that, in reasonable detail, accurately and fairly reflect the transactions and dispositions of the assets of the company; (2) provide reasonable assurance that transactions are recorded as necessary to permit preparation of financial statements in accordance with generally accepted accounting principles, and that receipts and expenditures of the company are being made only in accordance with authorizations of management and directors of the company; and (3) provide reasonable assurance regarding prevention or timely detection of unauthorized acquisition, use, or disposition of the company's assets that could have a material effect on the financial statements.
Because of its inherent limitations, internal control over financial reporting may not prevent or detect misstatements. Also, projections of any evaluation of effectiveness to future periods are subject to the risk that controls may become inadequate because of changes in conditions, or that the degree of compliance with the policies or procedures may deteriorate.
A material weakness is a deficiency, or a combination of deficiencies, in internal control over financial reporting, such that there is a reasonable possibility that a material misstatement of the company's annual or interim financial statements will not be prevented or detected on a timely basis. The following material weakness has been identified and included in management's assessment. Management has identified a material weakness in internal controls over accounting for non-routine compensation arrangements (for example, share-based compensation), specifically, that these internal controls were not sufficiently complete and comprehensive to ensure that the accounting and reporting for non-routine compensation arrangements (for example, share-based compensation) were complete and accurate and that there was inadequate and ineffective analysis and review of the documentation and calculations supporting the Company's non-routine compensation arrangements (for example, share-based compensation).
We also have audited, in accordance with the standards of the Public Company Accounting Oversight Board (United States), the consolidated balance sheet of CRA International Inc. as of January 3, 2015, and the related consolidated statements of operations, comprehensive income (loss), shareholders' equity and cash flows for the year ended January 3, 2015. This material weakness was considered in determining the nature, timing and extent of audit tests applied in our audit of the 2014
44
consolidated financial statements, and this report does not affect our report dated March 17, 2015, which expressed an unqualified opinion on those financial statements.
In our opinion, because of the effect of the material weakness described above on the achievement of the objectives of the control criteria, CRA International Inc. has not maintained effective internal control over financial reporting as of January 3, 2015, based on the COSO criteria.
| /s/ Ernst & Young LLP | ||
Boston, Massachusetts March 17, 2015 |
None.
45
We have omitted the information required in Part III of this annual report because we intend to include that information in our definitive proxy statement for the 2015 special meeting in lieu of annual meeting of shareholders, which we expect to file within 120 days (or such greater number as permitted by SEC rules) after the end of fiscal 2014. We incorporate that information in this annual report by reference to the proxy statement to be filed in connection with the 2015 annual meeting of our shareholders, which we will refer to herein as our "2015 annual proxy statement."
Item 10—Directors, Executive Officers and Corporate Governance
We incorporate the information required by this item by reference to the sections captioned "Executive Officers and Directors", "Corporate Governance", and "Section 16(a) Beneficial Ownership Reporting Compliance" in our 2015 annual proxy statement.
Item 11—Executive Compensation
We incorporate the information required by this item by reference to the section captioned "Compensation of Directors and Executive Officers" in our 2015 annual proxy statement.
Item 12—Security Ownership of Certain Beneficial Owners and Management and Related Shareholder Matters
We incorporate the information required by this item by reference to the sections captioned "Security Ownership of Certain Beneficial Owners and Management" and "Equity Compensation Plans" in our 2015 annual proxy statement.
Item 13—Certain Relationships and Related Transactions and Director Independence
We incorporate the information required by this item by reference to the sections captioned "Transactions with Related Parties" and "Corporate Governance" in our 2015 annual proxy statement.
Item 14—Principal Accountant Fees and Services
We incorporate the information required by this item by reference to the section captioned "Principal Accountant Fees and Services" in our 2015 annual proxy statement.
46
Item 15—Exhibits and Financial Statement Schedules
(a) Financial Statements, Schedules, and Exhibits. We have listed our consolidated financial statements filed as part of this annual report in the index to consolidated financial statements on page FS-1. We have listed the exhibits filed as part of this annual report in the accompanying exhibit index, which follows the signature page to this annual report.
(b) Exhibits. We have listed the exhibits filed as part of this annual report in the accompanying exhibit index, which follows the signature page to this annual report.
(c) Financial Statement Schedules. We have omitted all financial statement schedules because they are not applicable or not required or because we have included the necessary information in our consolidated financial statements or related notes.
47
Pursuant to the requirements of Section 13 or 15(d) of the Securities Exchange Act of 1934, the registrant has duly caused this report to be signed on its behalf by the undersigned, thereunto duly authorized.
| CRA INTERNATIONAL, INC. | ||||
By: |
/s/ PAUL A. MALEH Paul A. Maleh |
|||
| Date: March 17, 2015 | President, Chief Executive Officer and Director | |||
Pursuant to the requirements of the Securities Exchange Act of 1934, this report has been signed below by the following persons on behalf of the registrant in the capacities and on the dates indicated.
Signature
|
Title
|
Date
|
||
|---|---|---|---|---|
/s/ PAUL A. MALEH |
President, Chief Executive Officer, and Director (principal executive officer) |
March 17, 2015 | ||
|
|
|
||
|
|
|
||
|
|
|
||
|
|
|
||
|
|
|
||
|
|
|
||
|
|
|
||
|
|
|
48
| |
|
|
Incorporated by Reference | ||||||||
|---|---|---|---|---|---|---|---|---|---|---|---|
| Exhibit No. | Description | Filed with this Form 10-K |
Form | Filing Date | Exhibit No. | ||||||
| 3.1 | Amended and Restated Articles of Organization. | S-1/A | April 3, 1998 | 3.2 | |||||||
| 3.2 | Articles of Amendment to our Articles of Organization | 8-K | May 11, 2005 | 99.1 | |||||||
| 3.3 | Amended and Restated By-Laws, as amended. | 8-K | January 31, 2011 | 3.2 | |||||||
| 4.1 | Specimen certificate for common stock. | S-8 | April 21, 2006 | 4.4 | |||||||
| 10.1* | 1998 Incentive and Nonqualified Stock Option Plan, as amended. | 10-Q | June 20, 2002 | 10.1 | |||||||
| 10.2* | 1998 Employee Stock Purchase Plan. | S-1/A | April 3, 1998 | 10.2 | |||||||
| 10.3* | 2004 Nonqualified Inducement Stock Option Plan. | 10-Q | October 15, 2004 | 10.1 | |||||||
| 10.4* | Amended and Restated 2006 Equity Incentive Plan, as amended | 10-K | March 13, 2014 | 10.4 | |||||||
| 10.5* | 2009 Nonqualified Inducement Stock Option Plan | 10-Q | June 22, 2009 | 10.1 | |||||||
| 10.6* | Form of Incentive Stock Option under the 1998 Incentive and Nonqualified Stock Option Plan, as amended. | 10-K | February 10, 2005 | 10.4 | |||||||
| 10.7* | Form of Nonqualified Stock Option under the 1998 Incentive and Nonqualified Stock Option Plan, as amended. | 10-K | February 10, 2005 | 10.5 | |||||||
| 10.8* | Form of Nonqualified Stock Option under the 2004 Nonqualified Inducement Stock Option Plan. | 10-K | February 10, 2005 | 10.6 | |||||||
| 10.9* | Form of Restricted Stock Agreement for Non-Employee Director Award Pursuant to Section 6.9 of the 2006 Equity Incentive Plan. | 8-K | April 27, 2006 | 10.2 | |||||||
| 10.10* | Form of Restricted Stock Agreement for Non-Employee Director Award Pursuant to Section 6.9 of the 2006 Equity Incentive Plan with Company Right of First Refusal. | 10-K | February 12, 2009 | 10.9 | |||||||
| 10.11* | Form of Restricted Stock Agreement for Non-Employee Director Award Pursuant to Section 6.9 of the 2006 Equity Incentive Plan, as amended. | 10-K | March 2, 2012 | 10.11 | |||||||
| 10.12* | Form of Restricted Stock Agreement for Employee or Independent Contractor Awards under the 2006 Equity Incentive Plan. | 8-K | April 27, 2006 | 10.3 | |||||||
| 10.13* | Form of Restricted Stock Agreement for Employee or Independent Contractor Awards under the 2006 Equity Incentive Plan with Company Right of First Refusal. | 10-K | February 12, 2009 | 10.11 | |||||||
| 10.14* | Form of Restricted Stock Agreement for Employee or Independent Contractor Awards under the 2006 Equity Incentive Plan with Company, as amended. | 10-K | March 2, 2012 | 10.14 | |||||||
| 10.15* | Form of Nonqualified Stock Option under the 2006 Equity Incentive Plan. | 10-K | February 8, 2007 | 10.10 | |||||||
| 10.16* | Form of Nonqualified Stock Option under the 2006 Equity Incentive Plan with Stock Ownership Guidelines. | 10-K | March 2, 2012 | 10.16 | |||||||
| 10.17* | Form of Restricted Stock Unit Award Agreement under the 2006 Equity Incentive Plan. | 10-K | January 29, 2010 | 10.14 | |||||||
| 10.18* | Form of Restricted Stock Unit Award Agreement under the 2006 Equity Incentive Plan with Stock Ownership Guidelines. | 10-K | March 2, 2012 | 10.18 | |||||||
| 10.19* | Form of Restricted Stock Unit Award Agreement for Performance under the 2006 Equity Incentive Plan. | 10-K | January 29, 2010 | 10.15 | |||||||
| 10.20* | Form of Restricted Stock Unit Award Agreement for Performance under the 2006 Equity Incentive Plan with Stock Ownership Guidelines. | 10-K | March 2, 2012 | 10.20 | |||||||
| 10.21* | CRA International, Inc. Cash Incentive Plan, as amended. | 8-K | March 2, 2012 | 10.1 | |||||||
49
| |
|
|
Incorporated by Reference | ||||||||
|---|---|---|---|---|---|---|---|---|---|---|---|
| Exhibit No. | Description | Filed with this Form 10-K |
Form | Filing Date | Exhibit No. | ||||||
| 10.22* | Offer Letter with Wayne D. Mackie dated June 3, 2005. | 10-K | February 9, 2006 | 10.7 | |||||||
| 10.23* | Summary of Director Compensation. | X | |||||||||
| 10.24 | Office Lease Agreement dated as of March 1, 1978 between CRA and John Hancock Mutual Life Insurance Company, as amended by the First through Eleventh Amendments thereto. | S-1/A | April 3, 1998 | 10.6 | |||||||
| 10.25 | The Twelfth through Fourteenth Amendments to Office Lease Agreement dated March 1, 1978 between CRA and John Hancock Mutual Life Insurance Company, as amended. | 10-K | February 23, 2001 | 10.7 | |||||||
| 10.26 | Fifteenth Amendment to Office Lease Agreement dated March 1, 1978 between CRA and John Hancock Mutual Life Insurance Company, as amended. | 10-K | February 28, 2003 | 10.8 | |||||||
| 10.27 | Sixteenth Amendment to Office Lease Agreement dated March 1, 1978 between CRA and John Hancock Mutual Life Insurance Company, as amended. | 10-Q | June 28, 2004 | 10.1 | |||||||
| 10.28 | Seventeenth Amendment to Lease dated as of February 6, 2008 between CRA and 100 & 200 Clarendon LLC. | 8-K | August 4, 2008 | 10.1 | |||||||
| 10.29 | Eighteenth Amendment to Lease dated as of July 29, 2008 between CRA and 100 & 200 Clarendon LLC. | 8-K | August 4, 2008 | 10.2 | |||||||
| 10.30 | Nineteenth Amendment to Lease entered into on December 7, 2012 by and between CRA International, Inc. and BP Hancock LLC. | 8-K | December 11, 2012 | 10.1 | |||||||
| 10.31 | Twentieth Amendment to Lease dated as of February 24, 2014 by and between CRA International, Inc. and BP Hancock LLC | 8-K | February 27, 2014 | 10.2 | |||||||
| 10.32 | Lease dated February 24, 2014 by and between CRA International, Inc. and BP Hancock LLC | 8-K | February 27, 2014 | 10.1 | |||||||
| 10.33 | First Amendment to Lease dated as of February 24, 2015 by and between CRA International, Inc. and BP Hancock LLC | 8-K | March 2, 2015 | 10.1 | |||||||
| 10.34 | Office Lease dated as of November 29, 1999 between CRA and 1201 F Street, L.L.C., as amended. | 10-K | February 23, 2001 | 10.9 | |||||||
| 10.35 | Addenda Nos. 3 and 4 to Office Lease dated as of November 29, 1999 between CRA and 1201 F Street, L.L.C. (or its successor in interest, 1201 F Street, L.P.), as amended. | X | |||||||||
| 10.36 | Addendum No. 5 to Office Lease dated as of November 29, 1999 between CRA and 1201 F Street, L.P., as amended. | 8-K | December 30, 2014 | 10.1 | |||||||
| 10.37 | Agreement dated as of October 26, 2006 by and among 99 Bishopsgate (No.1) Limited and 99 Bishopsgate (No.2) Limited, Hammerson UK Properties PLC, 99 Bishopsgate Management Limited, CRA International (UK) Limited, and CRA International, Inc. (including forms of lease agreement). | 8-K | November 1, 2006 | 10.1 | |||||||
| 10.38 | Agreement for Surrender of Leases at 99 Bishopsgate, London EC2, dated April 2, 2012, between CRA International, Inc., CRA International (UK) Limited, Hammerson (99 Bishopsgate) Limited, Hammerson UK Properties PLC and 99 Bishopsgate Management Limited. | 8-K | April 6, 2012 | 10.1 | |||||||
| 10.39 | Form of consulting agreement with outside experts. | S-1/A | April 3, 1998 | 10.8 | |||||||
50
| |
|
|
Incorporated by Reference | ||||||||
|---|---|---|---|---|---|---|---|---|---|---|---|
| Exhibit No. | Description | Filed with this Form 10-K |
Form | Filing Date | Exhibit No. | ||||||
| 10.40 | Credit Agreement dated as of April 24, 2013 by and among CRA International, Inc. and CRA International (UK) Limited, as the Borrowers, RBS Citizens, N.A., as Administrative Agent, Bank of America, N.A., as Syndication Agent, and the Lenders party thereto. | 8-K | April 30, 2013 | 10.1 | |||||||
| 10.41 | Securities Pledge Agreement dated as of April 24, 2013 by and between CRA International, Inc., as Pledgor, and RBS Citizens, N.A., as Administrative Agent. | 8-K | April 30, 2013 | 10.2 | |||||||
| 14.1 | CRA International, Inc. Code of Business Conduct and Ethics, as amended. | 8-K | July 7, 2010 | 99.1 | |||||||
| 21.1 | Subsidiaries. | X | |||||||||
| 23.1 | Consent of Ernst & Young LLP, Independent Registered Public Accounting Firm. | X | |||||||||
| 23.2 | Consent of KPMG LLP, Independent Registered Public Accounting Firm. | X | |||||||||
| 31.1 | Rule 13a-14(a)/15d-14(a) certification of principal executive officer. | X | |||||||||
| 31.2 | Rule 13a-14(a)/15d-14(a) certification of principal financial officer. | X | |||||||||
| 32.1 | Section 1350 certification. | X | |||||||||
| 101 | The following financial statements from CRA International, Inc.'s Annual Report on Form 10-K for the fiscal year ended January 3, 2015, formatted in XBRL (eXtensible Business Reporting Language), as follows: (i) Consolidated Statements of Operations for the fiscal years ended January 3, 2015, December 28, 2013, and December 29, 2012, (ii) Consolidated Statements of Comprehensive Income (Loss) for the fiscal years ended January 3, 2015, December 28, 2013, and December 29, 2012, (iii) Consolidated Balance Sheets as at January 3, 2015 and December 28, 2013, (iv) Consolidated Statements of Cash Flows for the fiscal years ended January 3, 2015, December 28, 2013, and December 29, 2012, (v) Consolidated Statements of Shareholders' Equity for the fiscal years ended January 3, 2015, December 28, 2013, and December 29, 2012, and (vi) Notes to Consolidated Financial Statements. | X | |||||||||
- *
- Management contract or compensatory plan
51
INDEX TO
CONSOLIDATED FINANCIAL STATEMENTS
FS-1
Report of Independent Registered Public Accounting Firm
The Board of Directors and Shareholders of CRA International, Inc.:
We have audited the accompanying consolidated balance sheet of CRA International Inc. as of January 3, 2015, and the related consolidated statements of operations, comprehensive income (loss), shareholders' equity and cash flows for the year ended January 3, 2015. These financial statements are the responsibility of the Company's management. Our responsibility is to express an opinion on these financial statements based on our audit.
We conducted our audit in accordance with the standards of the Public Company Accounting Oversight Board (United States). Those standards require that we plan and perform the audit to obtain reasonable assurance about whether the financial statements are free of material misstatement. An audit includes examining, on a test basis, evidence supporting the amounts and disclosures in the financial statements. An audit also includes assessing the accounting principles used and significant estimates made by management, as well as evaluating the overall financial statement presentation. We believe that our audit provides a reasonable basis for our opinion.
In our opinion, the financial statements referred to above present fairly, in all material respects, the consolidated financial position of CRA International, Inc. at January 3, 2015, and the consolidated results of its operations and its cash flows for the fiscal year ended January 3, 2015, in conformity with U.S. generally accepted accounting principles.
We also have audited, in accordance with the standards of the Public Company Accounting Oversight Board (United States), CRA International, Inc.'s internal control over financial reporting as of January 3, 2015, based on criteria established in Internal Control—Integrated Framework issued by the Committee of Sponsoring Organizations of the Treadway Commission (2013 framework), and our report dated March 17, 2015 expressed an adverse opinion thereon.
| /s/ Ernst & Young LLP |
Boston,
Massachusetts
March 17, 2015
FS-2
Report of Independent Registered Public Accounting Firm
The
Board of Directors and Shareholders
CRA International, Inc.:
We have audited the accompanying consolidated balance sheet of CRA International, Inc. and subsidiaries as of December 28, 2013, and the related consolidated statements of operations, comprehensive income (loss), cash flows, and shareholders' equity for the fiscal years ended December 28, 2013 and December 29, 2012. These consolidated financial statements are the responsibility of the Company's management. Our responsibility is to express an opinion on these consolidated financial statements based on our audits.
We conducted our audits in accordance with the standards of the Public Company Accounting Oversight Board (United States). Those standards require that we plan and perform the audit to obtain reasonable assurance about whether the financial statements are free of material misstatement. An audit includes examining, on a test basis, evidence supporting the amounts and disclosures in the financial statements. An audit also includes assessing the accounting principles used and significant estimates made by management, as well as evaluating the overall financial statement presentation. We believe that our audits provide a reasonable basis for our opinion.
In our opinion, the consolidated financial statements referred to above present fairly, in all material respects, the financial position of CRA International, Inc. and subsidiaries as of December 28, 2013, and the results of their operations and their cash flows for the fiscal years ended December 28, 2013 and December 29, 2012, in conformity with U.S. generally accepted accounting principles.
| /s/ KPMG LLP |
Boston,
Massachusetts
March 13, 2014
FS-3
CRA INTERNATIONAL, INC.
CONSOLIDATED STATEMENTS OF OPERATIONS
| |
Year Ended | Year Ended | Year Ended | |||||||
|---|---|---|---|---|---|---|---|---|---|---|
| |
January 3, 2015 (53 weeks) |
December 28, 2013 (52 weeks) |
December 29, 2012 (52 weeks) |
|||||||
| |
(In thousands, except per share data) |
|||||||||
Revenues |
$ | 306,371 | $ | 278,432 | $ | 270,390 | ||||
Costs of services |
206,813 | 189,262 | 182,381 | |||||||
| | | | | | | | | | | |
Gross profit |
99,558 | 89,170 | 88,009 | |||||||
Selling, general and administrative expenses |
69,074 | 64,242 | 67,235 | |||||||
Depreciation and amortization |
6,443 | 6,411 | 7,190 | |||||||
Goodwill impairment |
— | — | 71,394 | |||||||
| | | | | | | | | | | |
Income (loss) from operations |
24,041 | 18,517 | (57,810 | ) | ||||||
Interest income |
163 | 155 | 264 | |||||||
Interest expense |
(594 | ) | (574 | ) | (300 | ) | ||||
Other expense, net |
(295 | ) | (180 | ) | (177 | ) | ||||
| | | | | | | | | | | |
Income (loss) before (provision) benefit for income taxes |
23,315 | 17,918 | (58,023 | ) | ||||||
(Provision) benefit for income taxes |
(9,908 | ) | (6,683 | ) | 5,180 | |||||
| | | | | | | | | | | |
Net income (loss) |
13,407 | 11,235 | (52,843 | ) | ||||||
Net (income) loss attributable to noncontrolling interest, net of tax |
231 | 135 | (147 | ) | ||||||
| | | | | | | | | | | |
Net income (loss) attributable to CRA International, Inc. |
13,638 | 11,370 | $ | (52,990 | ) | |||||
| | | | | | | | | | | |
| | | | | | | | | | | |
| | | | | | | | | | | |
Net income (loss) per share attributable to CRA International, Inc.: |
||||||||||
Basic |
$ | 1.40 | $ | 1.13 | $ | (5.21 | ) | |||
| | | | | | | | | | | |
| | | | | | | | | | | |
| | | | | | | | | | | |
Diluted |
$ | 1.38 | $ | 1.12 | $ | (5.21 | ) | |||
| | | | | | | | | | | |
| | | | | | | | | | | |
| | | | | | | | | | | |
Weighted average number of shares outstanding: |
||||||||||
Basic |
9,747 | 10,084 | 10,167 | |||||||
| | | | | | | | | | | |
| | | | | | | | | | | |
| | | | | | | | | | | |
Diluted |
9,897 | 10,173 | 10,167 | |||||||
| | | | | | | | | | | |
| | | | | | | | | | | |
| | | | | | | | | | | |
See accompanying notes to the consolidated financial statements.
FS-4
CRA INTERNATIONAL, INC.
CONSOLIDATED STATEMENTS OF COMPREHENSIVE INCOME (LOSS)
| |
Year Ended | Year Ended | Year Ended | |||||||
|---|---|---|---|---|---|---|---|---|---|---|
| |
January 3, 2015 (53 weeks) |
December 28, 2013 (52 weeks) |
December 29, 2012 (52 weeks) |
|||||||
| |
(In thousands) |
|||||||||
Net income (loss) |
$ | 13,407 | $ | 11,235 | $ | (52,843 | ) | |||
Other comprehensive income (loss): |
||||||||||
Foreign currency translation adjustments |
(3,280 | ) | 964 | 1,950 | ||||||
| | | | | | | | | | | |
Comprehensive income (loss) |
10,127 | 12,199 | (50,893 | ) | ||||||
Less: comprehensive (income) loss attributable to noncontrolling interest |
231 | 135 | (147 | ) | ||||||
| | | | | | | | | | | |
Comprehensive income (loss) attributable to CRA International, Inc. |
$ | 10,358 | $ | 12,334 | $ | (51,040 | ) | |||
| | | | | | | | | | | |
| | | | | | | | | | | |
| | | | | | | | | | | |
See accompanying notes to the consolidated financial statements
FS-5
CRA INTERNATIONAL, INC.
CONSOLIDATED BALANCE SHEETS
| |
January 3, 2015 |
December 28, 2013 |
|||||
|---|---|---|---|---|---|---|---|
| |
(In thousands, except share data) |
||||||
ASSETS |
|||||||
Current assets: |
|||||||
Cash and cash equivalents |
$ | 48,199 | $ | 51,251 | |||
Accounts receivable, net of allowances of $4,177 at January 3, 2015 and $7,210 at December 28, 2013 |
58,080 | 57,856 | |||||
Unbilled services, net of allowances of $2,233 at January 3, 2015 and at $1,827 at December 28, 2013 |
25,085 | 24,275 | |||||
Prepaid expenses and other current assets |
13,165 | 11,775 | |||||
Deferred income taxes |
20,638 | 17,806 | |||||
| | | | | | | | |
Total current assets |
165,167 | 162,963 | |||||
Property and equipment, net |
14,696 | 15,655 | |||||
Goodwill |
82,303 | 81,573 | |||||
Intangible assets, net of accumulated amortization of $9,584 at January 3, 2015 and $8,392 at December 28, 2013 |
4,757 | 4,537 | |||||
Deferred income taxes, net of current portion |
174 | 955 | |||||
Other assets |
47,915 | 54,621 | |||||
| | | | | | | | |
Total assets |
$ | 315,012 | $ | 320,304 | |||
| | | | | | | | |
| | | | | | | | |
| | | | | | | | |
LIABILITIES AND SHAREHOLDERS' EQUITY |
|||||||
Current liabilities: |
|||||||
Accounts payable |
$ | 13,700 | $ | 13,766 | |||
Accrued expenses |
66,548 | 65,657 | |||||
Deferred revenue and other liabilities |
6,220 | 6,098 | |||||
Deferred income taxes |
121 | — | |||||
Current portion of deferred rent |
1,623 | 2,322 | |||||
Current portion of deferred compensation |
182 | 117 | |||||
| | | | | | | | |
Total current liabilities |
88,394 | 87,960 | |||||
Notes payable, net of current portion |
981 | 1,007 | |||||
Deferred rent and facility-related non-current liabilities |
4,535 | 3,669 | |||||
Deferred compensation and other non-current liabilities |
3,371 | 1,446 | |||||
Deferred income taxes, net of current portion |
3,027 | 1,585 | |||||
Commitments and contingencies |
|||||||
Shareholders' equity: |
|||||||
Preferred stock, no par value; 1,000,000 shares authorized; none issued and outstanding |
— | — | |||||
Common stock, no par value; 25,000,000 shares authorized; 9,228,272 and 10,048,611 shares issued and outstanding at January 3, 2015 and December 28, 2013, respectively |
73,171 | 93,242 | |||||
Retained earnings |
147,618 | 133,980 | |||||
Accumulated other comprehensive loss |
(6,704 | ) | (3,424 | ) | |||
| | | | | | | | |
Total CRA International, Inc. shareholders' equity |
214,085 | 223,798 | |||||
Noncontrolling interest |
619 | 839 | |||||
| | | | | | | | |
Total shareholders' equity |
214,704 | 224,637 | |||||
| | | | | | | | |
Total liabilities and shareholders' equity |
$ | 315,012 | $ | 320,304 | |||
| | | | | | | | |
| | | | | | | | |
| | | | | | | | |
See accompanying notes to the consolidated financial statements.
FS-6
CRA INTERNATIONAL, INC.
CONSOLIDATED STATEMENTS OF CASH FLOWS
| |
Year Ended | Year Ended | Year Ended | |||||||
|---|---|---|---|---|---|---|---|---|---|---|
| |
January 3, 2015 (53 weeks) |
December 28, 2013 (52 weeks) |
December 29, 2012 (52 weeks) |
|||||||
| |
(In thousands) |
|||||||||
OPERATING ACTIVITIES: |
||||||||||
Net income (loss) |
$ | 13,407 | $ | 11,235 | $ | (52,843 | ) | |||
Adjustments to reconcile net income (loss) to net cash provided by (used in) operating activities, net of effect of acquired businesses: |
||||||||||
Depreciation and amortization |
6,438 | 6,460 | 5,841 | |||||||
Loss on disposal of property and equipment |
28 | 16 | 1,444 | |||||||
Goodwill impairment |
— | — | 71,394 | |||||||
Deferred rent |
220 | (1,903 | ) | (4,475 | ) | |||||
Deferred income taxes |
(1,431 | ) | 3,924 | (9,882 | ) | |||||
Share-based compensation expenses |
5,619 | 3,035 | 4,947 | |||||||
Excess tax benefits from share-based compensation |
(392 | ) | (7 | ) | (81 | ) | ||||
Accounts receivable allowances |
(2,996 | ) | (2,186 | ) | 2,814 | |||||
Changes in operating assets and liabilities: |
||||||||||
Accounts receivable |
1,929 | 9,917 | 10,271 | |||||||
Unbilled services |
(738 | ) | (2,997 | ) | (4,674 | ) | ||||
Prepaid expenses and other current assets, and other assets |
(86 | ) | (20,160 | ) | (19,870 | ) | ||||
Accounts payable, accrued expenses, and other liabilities |
8,152 | 11,114 | (13,411 | ) | ||||||
| | | | | | | | | | | |
Net cash provided by (used in) operating activities |
30,150 | 18,448 | (8,525 | ) | ||||||
INVESTING ACTIVITIES: |
||||||||||
Consideration relating to acquisitions, net |
(1,784 | ) | (15,591 | ) | — | |||||
Purchase of property and equipment |
(4,192 | ) | (2,816 | ) | (2,732 | ) | ||||
Purchase of investments |
— | — | (9,494 | ) | ||||||
Sale of investments |
— | — | 23,989 | |||||||
Collections on notes receivable |
114 | 14 | 989 | |||||||
| | | | | | | | | | | |
Net cash (used in) provided by investing activities |
(5,862 | ) | (18,393 | ) | 12,752 | |||||
FINANCING ACTIVITIES: |
||||||||||
Issuance of common stock, principally stock options exercises |
469 | 207 | 647 | |||||||
Borrowings under line of credit |
— | 17,320 | — | |||||||
Payments under line of credit |
— | (17,320 | ) | — | ||||||
Payments on notes payable |
(26 | ) | (700 | ) | (650 | ) | ||||
Payments of debt issuance costs |
— | (1,120 | ) | — | ||||||
Tax withholding payment reimbursed by restricted shares |
(1,222 | ) | (730 | ) | (1,360 | ) | ||||
Excess tax benefits from share-based compensation |
392 | 7 | 81 | |||||||
Repurchase of common stock. |
(25,492 | ) | (2,190 | ) | (9,062 | ) | ||||
| | | | | | | | | | | |
Net cash used in financing activities |
(25,879 | ) | (4,526 | ) | (10,344 | ) | ||||
Effect of foreign exchange rates on cash and cash equivalents |
(1,461 | ) | 271 | (19 | ) | |||||
| | | | | | | | | | | |
Net decrease in cash and cash equivalents |
(3,052 | ) | (4,200 | ) | (6,136 | ) | ||||
Cash and cash equivalents at beginning of period |
51,251 | 55,451 | 61,587 | |||||||
| | | | | | | | | | | |
Cash and cash equivalents at end of period |
$ | 48,199 | $ | 51,251 | $ | 55,451 | ||||
| | | | | | | | | | | |
| | | | | | | | | | | |
| | | | | | | | | | | |
Noncash investing and financing activities: |
||||||||||
Issuance of common stock for acquired business |
$ | 427 | $ | — | $ | — | ||||
| | | | | | | | | | | |
| | | | | | | | | | | |
| | | | | | | | | | | |
Supplemental cash flow information: |
||||||||||
Cash paid for taxes |
$ | 15,580 | $ | 2,887 | $ | 8,718 | ||||
| | | | | | | | | | | |
| | | | | | | | | | | |
| | | | | | | | | | | |
Cash paid for interest |
$ | 443 | $ | 339 | $ | 223 | ||||
| | | | | | | | | | | |
| | | | | | | | | | | |
| | | | | | | | | | | |
See accompanying notes to the consolidated financial statements.
FS-7
CRA INTERNATIONAL, INC.
CONSOLIDATED STATEMENTS OF SHAREHOLDERS' EQUITY
(in thousands, except share data)
| |
Common Stock | |
|
|
CRA International, Inc. Shareholders' Equity |
|
|
||||||||||||||||||
|---|---|---|---|---|---|---|---|---|---|---|---|---|---|---|---|---|---|---|---|---|---|---|---|---|---|
| |
|
|
Accumulated Other Comprehensive Income (Loss) |
|
|
||||||||||||||||||||
| |
Shares Issued |
Amount | Receivable From Shareholder |
Retained Earnings |
Noncontrolling Interest |
Total Shareholders' Equity |
|||||||||||||||||||
BALANCE AT DECEMBER 31, 2011 |
10,329,051 | $ | 98,578 | $ | (236 | ) | $ | 175,600 | $ | (6,338 | ) | $ | 267,604 | $ | 803 | $ | 268,407 | ||||||||
Net income (loss) |
(52,990 | ) | (52,990 | ) | 147 | (52,843 | ) | ||||||||||||||||||
Foreign currency translation adjustment |
1,950 | 1,950 | 1,950 | ||||||||||||||||||||||
Exercise of stock options |
47,185 | 647 | 647 | 647 | |||||||||||||||||||||
Share-based compensation expense for employees |
4,868 | 4,868 | 4,868 | ||||||||||||||||||||||
Restricted shares vesting |
216,528 | ||||||||||||||||||||||||
Redemption of vested employee restricted shares for tax withholding |
(69,207 | ) | (1,360 | ) | (1,360 | ) | (1,360 | ) | |||||||||||||||||
Tax deficit on stock option exercises and restricted share vesting |
(576 | ) | (576 | ) | (576 | ) | |||||||||||||||||||
Payments received on notes receivable from shareholders |
116 | 116 | 116 | ||||||||||||||||||||||
Shares repurchased |
(466,109 | ) | (9,062 | ) | (9,062 | ) | (9,062 | ) | |||||||||||||||||
Share-based compensation expense for non-employees |
79 | 79 | 79 | ||||||||||||||||||||||
Equity transactions of noncontrolling interest |
8 | 8 | |||||||||||||||||||||||
| | | | | | | | | | | | | | | | | | | | | | | | | | |
BALANCE AT DECEMBER 29, 2012 |
10,057,448 | $ | 93,174 | $ | (120 | ) | $ | 122,610 | $ | (4,388 | ) | $ | 211,276 | $ | 958 | $ | 212,234 | ||||||||
Net income (loss) |
11,370 | 11,370 | (135 | ) | 11,235 | ||||||||||||||||||||
Foreign currency translation adjustment |
964 | 964 | 964 | ||||||||||||||||||||||
Exercise of stock options |
13,389 | 207 | 207 | 207 | |||||||||||||||||||||
Share-based compensation expense for employees |
2,888 | 2,888 | 2,888 | ||||||||||||||||||||||
Restricted shares vesting |
134,384 | ||||||||||||||||||||||||
Redemption of vested employee restricted shares for tax withholding |
(37,642 | ) | (730 | ) | (730 | ) | (730 | ) | |||||||||||||||||
Tax deficit on stock option exercises and restricted share vesting |
(254 | ) | (254 | ) | (254 | ) | |||||||||||||||||||
Payments received on notes receivable from shareholders |
120 | 120 | 120 | ||||||||||||||||||||||
Shares repurchased |
(118,968 | ) | (2,190 | ) | (2,190 | ) | (2,190 | ) | |||||||||||||||||
Share-based compensation expense for non-employees |
147 | 147 | 147 | ||||||||||||||||||||||
Equity transactions of noncontrolling interest. |
16 | 16 | |||||||||||||||||||||||
| | | | | | | | | | | | | | | | | | | | | | | | | | |
BALANCE AT DECEMBER 28, 2013 |
10,048,611 | $ | 93,242 | $ | — | $ | 133,980 | $ | (3,424 | ) | $ | 223,798 | $ | 839 | $ | 224,637 | |||||||||
Net income (loss) |
13,638 | 13,638 | (231 | ) | 13,407 | ||||||||||||||||||||
Foreign currency translation adjustment |
(3,280 | ) | (3,280 | ) | (3,280 | ) | |||||||||||||||||||
Issuance of common stock |
22,520 | 427 | 427 | 427 | |||||||||||||||||||||
Exercise of stock options |
20,931 | 469 | 469 | 469 | |||||||||||||||||||||
Share-based compensation expense for employees |
5,348 | 5,348 | 5,348 | ||||||||||||||||||||||
Restricted shares vesting |
149,195 | ||||||||||||||||||||||||
Redemption of vested employee restricted shares for tax withholding |
(41,470 | ) | (1,222 | ) | (1,222 | ) | (1,222 | ) | |||||||||||||||||
Tax benefit on stock option exercises and restricted share vesting |
128 | 128 | 128 | ||||||||||||||||||||||
Shares repurchased |
(971,515 | ) | (25,492 | ) | (25,492 | ) | (25,492 | ) | |||||||||||||||||
Share-based compensation expense for non-employees |
271 | 271 | 271 | ||||||||||||||||||||||
Equity transactions of noncontrolling interest. |
11 | 11 | |||||||||||||||||||||||
| | | | | | | | | | | | | | | | | | | | | | | | | | |
BALANCE AT JANUARY 3, 2015 |
9,228,272 | $ | 73,171 | $ | — | $ | 147,618 | $ | (6,704 | ) | $ | 214,085 | $ | 619 | $ | 214,704 | |||||||||
| | | | | | | | | | | | | | | | | | | | | | | | | | |
| | | | | | | | | | | | | | | | | | | | | | | | | | |
| | | | | | | | | | | | | | | | | | | | | | | | | | |
See accompanying notes to the consolidated financial statements.
FS-8
CRA INTERNATIONAL, INC.
NOTES TO CONSOLIDATED FINANCIAL STATEMENTS
1. Summary of Significant Accounting Policies
Description of Business
CRA International, Inc. ("CRA") is a worldwide leading consulting services firm that applies advanced analytic techniques and in-depth industry knowledge to complex engagements for a broad range of clients. CRA offers services in two broad areas: litigation, regulatory, and financial consulting and management consulting. CRA operates in one business segment, which is consulting services. CRA operates its business under its registered trade name, Charles River Associates.
Fiscal Year
CRA's fiscal year end is the Saturday nearest December 31 of each year. CRA's fiscal years periodically contain 53 weeks rather than 52 weeks. Fiscal 2014 was a 53-week year; fiscal 2013 and fiscal 2012 were 52-week years.
Principles of Consolidation
The consolidated financial statements include the accounts of CRA and its wholly owned subsidiaries. In addition, as more fully explained below, the consolidated financial statements include CRA's interest in NeuCo, Inc. ("NeuCo"). All significant intercompany accounts have been eliminated.
NeuCo Interest
CRA's ownership interest in NeuCo is 55.89% for all periods presented. Therefore, NeuCo's financial results have been consolidated with CRA's and the portion of NeuCo's results allocable to its other owners is shown as "noncontrolling interest." NeuCo's revenues included in CRA's consolidated statements of operations for fiscal 2014, fiscal 2013, and fiscal 2012 totaled approximately $4.8 million, $5.1 million, and $5.5 million, respectively. NeuCo's net loss included in CRA's consolidated statements of operations for fiscal 2014 and fiscal 2013 was approximately $0.5 million and $0.3 million, respectively. NeuCo's net income included in CRA's consolidated statements of operations for fiscal fiscal 2012 was approximately $0.3 million. NeuCo's net loss, net of amounts allocable to its other owners, included in CRA's consolidated statements of operations for each of fiscal 2014 and fiscal 2013 was approximately $0.2 million. NeuCo's net income, net of amounts allocable to its other owners, included in CRA's consolidated statements of operations for fiscal 2012 was approximately $0.2 million. NeuCo's interim reporting schedule is based on calendar month-ends, and its fiscal year end is the last Saturday of November. CRA's quarterly results could include a few days reporting lag between CRA's quarter end and the most recent financial statements available from NeuCo. CRA does not believe that the reporting lag, if any, will have a significant impact on CRA's consolidated statements of operations or financial condition.
Estimates
The preparation of financial statements in conformity with accounting principles generally accepted in the U.S. requires management to make significant estimates and judgments that affect the reported amounts of assets and liabilities, and disclosure of contingent assets and liabilities, at the date of the financial statements, and the reported amounts of consolidated revenues and expenses during the reporting period. Estimates in these consolidated financial statements include, but are not limited to, accounts and unbilled receivable allowances, revenue recognition on fixed price contracts, depreciation of property and equipment, share-based compensation, valuation of acquired intangible assets, impairment of long lived assets and goodwill, accrued and deferred income taxes, valuation allowances on deferred tax assets, accrued compensation, accrued exit costs, and other accrued expenses. These
FS-9
CRA INTERNATIONAL, INC.
NOTES TO CONSOLIDATED FINANCIAL STATEMENTS (Continued)
items are monitored and analyzed by CRA for changes in facts and circumstances, and material changes in these estimates could occur in the future. Changes in estimates are recorded in the period in which they become known. CRA bases its estimates on historical experience and various other assumptions that CRA believes to be reasonable under the circumstances. Actual results may differ from those estimates if CRA's assumptions based on past experience or other assumptions do not turn out to be substantially accurate.
Revenue Recognition
CRA derives substantially all of its revenues from the performance of professional services. The contracts that CRA enters into and operates under specify whether the engagement will be billed on a time-and-materials or a fixed-price basis. These engagements generally last three to six months, although some of CRA's engagements can be much longer in duration. Each contract must be approved by one of CRA's vice presidents.
CRA recognizes substantially all of its revenues under written service contracts with its clients when the fee is fixed or determinable, as the services are provided, and only in those situations where collection from the client is reasonably assured and sufficient contractual documentation has been obtained. In certain cases CRA provides services to its clients without sufficient contractual documentation, or fees are tied to performance-based criteria, which require CRA to defer revenue in accordance with U.S. GAAP. In these cases, these amounts are fully reserved until all criteria for recognizing revenue are met.
CRA's revenues include projects secured by our non-employee experts as well as projects secured by our employees. CRA recognizes all project revenue on a gross basis based on the consideration of the criteria set forth in Accounting Standards Codification ("ASC") Topic 605-45, Principal Agent Considerations.
Most of CRA's revenue is derived from time-and-materials service contracts. Revenues from time-and-materials service contracts are recognized as services are provided based upon hours worked and contractually agreed-upon hourly rates, as well as indirect fees based upon hours worked.
Revenues from the majority of CRA's fixed-price engagements are recognized on a proportional performance method based on the ratio of costs incurred, substantially all of which are labor-related, to the total estimated project costs. CRA derived approximately 15%, 13%, and 15% of consolidated revenues from fixed-price engagements in fiscal 2014, fiscal 2013, and fiscal 2012, respectively. In general, project costs are classified as costs of services and are based on the direct salary of the consultants on the engagement plus all direct expenses incurred to complete the engagement, including any amounts billed to CRA by non-employee experts. The proportional performance method is used for fixed-price contracts because reasonably dependable estimates of the revenues and costs applicable to various stages of a contract can be made, based on historical experience and the terms set forth in the contract, and are indicative of the level of benefit provided to CRA's clients. Fixed-price contracts generally convert to time-and-materials contracts in the event the contract terminates. CRA's management maintains contact with project managers to discuss the status of the projects and, for fixed-price engagements, management is updated on the budgeted costs and resources required to complete the project. These budgets are then used to calculate revenue recognition and to estimate the anticipated income or loss on the project. Occasionally, CRA has been required to commit unanticipated additional resources to complete projects, which has resulted in lower than anticipated income or losses on those contracts. CRA may experience similar situations in the future. Provisions for estimated losses on contracts are made during the period in which such losses become probable and can be reasonably estimated. To date, such losses have not been significant.
FS-10
CRA INTERNATIONAL, INC.
NOTES TO CONSOLIDATED FINANCIAL STATEMENTS (Continued)
Revenues also include reimbursable expenses, which include reimbursements for travel and other out-of-pocket expenses, outside consultants, and other reimbursable expenses. Reimbursable expenses are as follows (in thousands):
| |
Year Ended | Year Ended | Year Ended | |||||||
|---|---|---|---|---|---|---|---|---|---|---|
| |
January 3, 2015 (53 weeks) |
December 28, 2013 (52 weeks) |
December 29, 2012 (52 weeks) |
|||||||
Reimbursable expenses |
$ | 36,676 | $ | 37,320 | $ | 33,530 | ||||
CRA maintains accounts receivable allowances for estimated losses and disputed amounts resulting from clients' failure to make required payments. CRA bases its estimates on historical collection experience, current trends, and credit policy. In determining these estimates, CRA examines historical write-offs of its receivables and reviews client accounts to identify any specific customer collection issues.
If the financial condition of CRA's customers were to deteriorate or disputes were to arise regarding the services provided, resulting in an impairment of their ability or intent to make payment, additional allowances may be required.
Unbilled services represent revenue recognized by CRA for services performed but not yet billed to the client. Deferred revenue represents amounts billed or collected in advance of services rendered.
CRA collects goods and services and value added taxes from customers and records these amounts on a net basis, which is within the scope of ASC Topic 605-45, Principal Agent Considerations.
Cash Equivalents
Cash equivalents consist principally of money market funds and commercial paper with maturities of three months or less when purchased. As of January 3, 2015, a substantial portion of CRA's cash accounts was concentrated at a single financial institution, which potentially exposes CRA to credit risks. The financial institution has a short-term credit rating of A-2 by Standard & Poor's ratings services. CRA has not experienced any losses related to such accounts. CRA does not believe that there is significant risk of non-performance by the financial institution. CRA's cash on deposit is fully liquid and CRA continually monitors the credit ratings of the institution.
The carrying amounts of these instruments classified as cash equivalents are stated at amortized cost, which approximates fair value because of their short-term maturity.
Fair Value of Financial Instruments
ASC Topic 820, Fair Value Measurements and Disclosures, establishes a fair value hierarchy that prioritizes the inputs used to measure fair value. The hierarchy gives the highest priority to quoted prices in active markets for identical assets or liabilities (Level 1 measurement), then priority to quoted prices for similar instruments in active markets, quoted prices for identical or similar instruments in markets that are not active and model-based valuation techniques for which all significant assumptions are observable in the market (Level 2 measurement), then the lowest priority to unobservable inputs (Level 3 measurement).
FS-11
CRA INTERNATIONAL, INC.
NOTES TO CONSOLIDATED FINANCIAL STATEMENTS (Continued)
The following table shows CRA's financial instruments as of January 3, 2015 and December 28, 2013 that are measured and recorded in the financial statements at fair value on a recurring basis (in thousands):
| |
January 3, 2015 | |||||||||
|---|---|---|---|---|---|---|---|---|---|---|
| |
Quoted Prices in Active Markets for Identical Assets or Liabilities |
Significant Other Observable Inputs |
Unobservable Inputs |
|||||||
| |
Level 1 | Level 2 | Level 3 | |||||||
Assets: |
||||||||||
Money market funds |
$ | 20,042 | $ | — | $ | — | ||||
Commercial paper |
— | — | — | |||||||
| | | | | | | | | | | |
Total Assets |
$ | 20,042 | $ | — | $ | — | ||||
| | | | | | | | | | | |
| | | | | | | | | | | |
| | | | | | | | | | | |
Liabilities: |
||||||||||
Contingent acquisition liability |
$ | — | $ | — | $ | 316 | ||||
| | | | | | | | | | | |
Total Liabilities |
$ | — | $ | — | $ | 316 | ||||
| | | | | | | | | | | |
| | | | | | | | | | | |
| | | | | | | | | | | |
| |
December 28, 2013 | |||||||||
|---|---|---|---|---|---|---|---|---|---|---|
| |
Quoted Prices in Active Markets for Identical Assets or Liabilities |
Significant Other Observable Inputs |
Unobservable Inputs |
|||||||
| |
Level 1 | Level 2 | Level 3 | |||||||
Assets: |
||||||||||
Money market funds |
$ | 21,034 | $ | — | $ | — | ||||
Commercial paper |
— | 9,000 | — | |||||||
| | | | | | | | | | | |
Total Assets |
$ | 21,034 | $ | 9,000 | $ | — | ||||
| | | | | | | | | | | |
| | | | | | | | | | | |
| | | | | | | | | | | |
Liabilities: |
||||||||||
Contingent acquisition liability |
$ | — | $ | — | $ | — | ||||
| | | | | | | | | | | |
Total Liabilities |
$ | — | $ | — | $ | — | ||||
| | | | | | | | | | | |
| | | | | | | | | | | |
| | | | | | | | | | | |
The fair values of CRA's money market funds are based on quotes received from third-party banks. The fair value of commercial paper is based on broker quotes that utilize observable market inputs.
The fair value of the contingent acquisition liability is based on the use of a Monte Carlo model. This fair value measure is based on significant inputs not observed in the market and thus represents a Level 3 measurement. The significant unobservable inputs used in the fair value measurements of this contingent acquisition liability are CRA's measures of the estimated payouts based on internally generated financial projections and discount rates.
CRA's financial instruments, including cash, accounts receivable, loans and advances to employees and non-employee experts, accounts payable, and accrued expenses, are carried at cost, which approximates their fair value because of the short-term maturity of these instruments or because their stated interest rates are indicative of market interest rates.
Goodwill
In accordance with ASC Topic 350, "Intangibles—Goodwill and Other", goodwill is not subject to amortization, but is monitored at least annually for impairment, or more frequently, as necessary, if events or circumstances exist that would more likely than not reduce the fair value of the reporting unit
FS-12
CRA INTERNATIONAL, INC.
NOTES TO CONSOLIDATED FINANCIAL STATEMENTS (Continued)
below its carrying amount. For the CRA's goodwill impairment analysis, CRA operates under one reporting unit. Under ASC Topic 350, in performing the first step of the goodwill impairment testing and measurement process, CRA compares its entity-wide estimated fair value to net book value to identify potential impairment. Management estimates the entity-wide fair value utilizing CRA's market capitalization, plus an appropriate control premium. Market capitalization is determined by multiplying the shares outstanding on the test date by the market price of CRA's common stock on that date. CRA has utilized a control premium which considers appropriate industry, market and other pertinent factors, including indications of such premiums from data on recent acquisition transactions. If the fair value of CRA is less than its net book value, the second step is performed to determine if goodwill is impaired. If CRA determines through the impairment evaluation process that goodwill has been impaired, an impairment charge would be recorded in the consolidated statement of operations.
There were no impairment losses related to goodwill during fiscal 2014 and fiscal 2013 as there were no events or circumstances that would more likely than not reduce CRA's fair value below its carrying amount.
When CRA performed its annual impairment test in the fourth quarter of fiscal 2012, its net book value exceeded its market capitalization plus an estimated control premium. Therefore, CRA was required to perform the second step of the goodwill impairment test. In this step, CRA's fair value is allocated among all of its assets and liabilities, including any unrecognized intangible assets, in a hypothetical analysis that calculates the implied fair value of goodwill in the same manner as if CRA were being acquired in a business acquisition. If the implied fair value of goodwill is less than the recorded goodwill, an impairment charge is recorded for the difference. During the process of conducting the second step of the annual goodwill impairment test in the fourth quarter of fiscal 2012, CRA identified significant unrecognized intangible assets. The combination of these hypothetical unrecognized intangible assets and other hypothetical unrecognized fair value changes to the carrying values of other assets and liabilities, together with the lower fair value calculated in the first step of the annual impairment test, resulted in a goodwill impairment charge of $71.4 million in the fourth quarter of fiscal 2012.
The re-measurement of goodwill is classified as a Level 3 fair value assessment due to the significance of unobservable inputs developed using CRA-specific information. CRA used a combination of the income, cost and market approach techniques to determine the fair value of its assets and liabilities. The fair value adjustment to goodwill was computed as the difference between CRA's fair value and the fair value of underlying assets and liabilities. The unobservable inputs used to determine the fair value of the underlying assets and liabilities were based on CRA-specific information such as estimates of revenue and cost growth rates, profit margins, discount rates, and cost estimates.
Intangible Assets
Intangible assets that are separable from goodwill and have determinable useful lives are valued separately and amortized over their estimated useful lives. Intangible assets consist of non-competition agreements, customer relationships, customer lists, developed technology, and trademarks, all of which are amortized on a straight-line basis over their remaining useful lives of four to ten years.
Property and Equipment
Property and equipment are recorded at cost. Depreciation is calculated using the straight-line method based on the estimated useful lives of three years for computer equipment, three to ten years for computer software, and ten years for furniture and fixtures. Amortization of leasehold improvements is calculated using the straight-line method over the shorter of the lease term or the estimated useful life of the leasehold improvements. Expenditures for maintenance and repairs are expensed as incurred. Expenditures for renewals and betterments are capitalized.
FS-13
CRA INTERNATIONAL, INC.
NOTES TO CONSOLIDATED FINANCIAL STATEMENTS (Continued)
Leases and Deferred Rent
CRA leases all of its office space. Leases are evaluated and classified as operating or capital leases for financial reporting purposes. For leases that contain rent escalations and rent holidays, CRA records the total rent payable during the lease term, as determined above, on a straight-line basis over the term of the lease and records the difference between the rents paid and the straight-line rent as deferred rent. Additionally, any tenant improvement allowances received from the lessor are recorded as a reduction to rent expense.
Impairment of Long-Lived Assets
CRA reviews the carrying value of its long-lived assets (primarily property and equipment and intangible assets) to assess the recoverability of these assets whenever events or circumstances indicate that impairment may have occurred. Factors CRA considers important that could trigger an impairment review include the following:
- •
- a significant underperformance relative to expected historical or projected future operating results;
- •
- a significant change in the manner of CRA's use of the acquired asset or the strategy for CRA's overall business; and
- •
- a significant negative industry or economic trend.
If CRA determines that an impairment review is required, CRA would review the expected future undiscounted cash flows to be generated by the assets or asset groups. If CRA determines that the carrying value of long-lived assets or asset groups may not be recoverable, CRA would measure any impairment based on a projected discounted cash flow method using a discount rate determined by CRA to be commensurate with the risk inherent in CRA's current business model. If impairment is indicated through this review, the carrying amount of the assets would be reduced to their estimated fair value.
Concentration of Credit Risk
CRA's billed and unbilled receivables consist of receivables from a broad range of clients in a variety of industries located throughout the U.S. and in other countries. CRA performs a credit evaluation of its clients to minimize its collectability risk. Periodically, CRA will require advance payment from certain clients. However, CRA does not require collateral or other security. CRA maintains accounts receivable allowances for estimated losses and disputed amounts resulting from clients' failures to make required payments. CRA bases its estimates on historical collection experience, current trends, and credit policy. In determining these estimates, CRA examines historical write-offs of its receivables and reviews client accounts to identify any specific customer collection issues. If the financial condition of any of CRA's customers were to deteriorate, resulting in an impairment of their ability or intent to make payment, additional allowances may be required.
FS-14
CRA INTERNATIONAL, INC.
NOTES TO CONSOLIDATED FINANCIAL STATEMENTS (Continued)
A rollforward of the accounts receivable allowances is as follows (in thousands):
| |
Fiscal Year |
Fiscal Year |
Fiscal Year |
|||||||
|---|---|---|---|---|---|---|---|---|---|---|
| |
2014 | 2013 | 2012 | |||||||
Balance at beginning of period |
$ | 7,210 | $ | 9,459 | $ | 6,548 | ||||
Change related to NeuCo |
(18 | ) | (2 | ) | — | |||||
Increases to reserve |
948 | 5,619 | 6,854 | |||||||
Amounts written off |
(3,993 | ) | (7,891 | ) | (3,897 | ) | ||||
Effects of foreign currency translation |
30 | 25 | (46 | ) | ||||||
| | | | | | | | | | | |
Balance at end of period |
$ | 4,177 | $ | 7,210 | $ | 9,459 | ||||
| | | | | | | | | | | |
| | | | | | | | | | | |
| | | | | | | | | | | |
A rollforward of the unbilled receivables allowances is as follows (in thousands):
| |
Fiscal Year |
Fiscal Year |
Fiscal Year |
|||||||
|---|---|---|---|---|---|---|---|---|---|---|
| |
2014 | 2013 | 2012 | |||||||
Balance at beginning of period |
$ | 1,827 | $ | 2,921 | $ | 2,521 | ||||
Increases to reserves |
5,242 | 443 | 1,329 | |||||||
Amounts written off |
(4,836 | ) | (1,538 | ) | (928 | ) | ||||
Effects of foreign currency translation |
— | 1 | (1 | ) | ||||||
| | | | | | | | | | | |
Balance at end of period |
$ | 2,233 | $ | 1,827 | $ | 2,921 | ||||
| | | | | | | | | | | |
| | | | | | | | | | | |
| | | | | | | | | | | |
Amounts deemed uncollectible are recorded as a reduction to revenues.
Share-Based Compensation
CRA accounts for equity-based compensation using a fair value based recognition method. Under the fair value recognition requirements of ASC Topic 718, "Compensation-Stock Compensation" ("ASC Topic 718"), share-based compensation cost is estimated at the grant date based on the fair value of the award and is recognized as expense over the requisite service period of the award. The amount of share-based compensation expense recognized at any date must at least equal the portion of grant date value of the award that is vested at that date. In accordance with ASC Topic 718, for performance-vesting restricted stock units awarded to employees, CRA estimates share-based compensation cost at the grant date based on the fair value of the award and recognizes the cost over the requisite service period using the graded acceleration method.
For share-based awards granted to non-employee experts, CRA accounts for the compensation under variable accounting in accordance with ASC Topic 718 and ASC Topic 505-50, "Equity-Based Payments to Non-Employees" (formerly Emerging Issues Task Force 96-18, "Accounting for Equity Instruments That Are Issued to Other Than Employees for Acquiring, or in Conjunction with Selling, Goods or Services"), and recognizes the cost over the related vesting period.
Income Taxes
CRA accounts for income taxes using the asset and liability method of accounting for income taxes. Deferred tax assets and liabilities are recognized based upon anticipated future tax consequences attributable to differences between the financial statement carrying amounts of existing assets and liabilities and their respective income tax bases, and operating loss and tax credit carryforwards. Deferred tax assets and liabilities are measured using enacted tax rates expected to apply to taxable income in the years in which those temporary differences are expected to be recovered or settled. The effect on deferred tax assets and liabilities of a change in tax rates is recognized in income in the
FS-15
CRA INTERNATIONAL, INC.
NOTES TO CONSOLIDATED FINANCIAL STATEMENTS (Continued)
period that includes the enactment date. A valuation allowance is recorded to reduce the carrying amounts of deferred tax assets if it is more likely than not that such assets will not be realized.
In addition, the calculation of CRA's tax liabilities involves dealing with uncertainties in the application of complex tax regulations in several different tax jurisdictions. CRA records liabilities for estimated tax obligations resulting in a provision for taxes that may become payable in the future, in accordance with ASC Topic 740-10, "Income Taxes," which prescribes a recognition threshold and measurement attribute for the financial statement recognition and measurement of a tax position taken or expected to be taken in a tax return and also provides guidance on derecognition, classification, interest and penalties, accounting in interim periods, and disclosure. CRA includes accrued interest and penalties, if any, related to uncertain tax positions in income tax expense.
Foreign Currency Translation
Balance sheet accounts of CRA's foreign subsidiaries are translated into U.S. dollars at year-end exchange rates and operating accounts are translated at average exchange rates for each year. The resulting translation adjustments are recorded in shareholders' equity as a component of accumulated other comprehensive income (loss). Foreign currency transactions are translated at current exchanges rates, with adjustments recorded in the statement of operations. The effect of transaction gains and losses recorded in income (loss) before (provision) benefit for income taxes amounted to losses of $0.3 million, $0.2 million, and $0.2 million for fiscal 2014, fiscal 2013, and fiscal 2012, respectively.
Recent Accounting Standards
Reporting of Going-Concern Uncertainties
In August 2014, the Financial Accounting Standards Board ("FASB") issued Accounting Standards Update ("ASU") No. 2014-15, Presentation of Financial Statements—Going Concern (Subtopic 205-40): Disclosure of Uncertainties about an Entity's Ability to Continue as a Going Concern ("ASU 2014-15"). ASU 2014-15 is intended to define management's responsibility to evaluate whether there is substantial doubt about an organization's ability to continue as a going concern and provides guidance to an organization's management, with principles and definitions that are intended to reduce diversity in the timing and content of disclosures in the financial statement footnotes. ASU 2014-15 is effective for the annual period ending after December 15, 2016, and for annual periods and interim periods thereafter. Early application is permitted. CRA believes that the adoption of ASU 2014-15 will not have a material impact on its financial position, results of operations, cash flows, or disclosures.
Accounting for Share-Based Payments
In June 2014, the FASB issued ASU No. 2014-12, Accounting for Share-Based Payments When the Terms of an Award Provide That a Performance Target Could Be Achieved after the Requisite Service Period (a consensus of the FASB Emerging Issues Task Force) ("ASU 2014-12"). ASU 2014-12 clarifies that entities should treat performance targets that can be met after the requisite service period of a share-based payment award as performance conditions that affect vesting. Therefore, an entity would not record compensation expense (measured as of the grant date without taking into account the effect of the performance target) related to an award for which transfer to the employee is contingent on the entity's satisfaction of a performance target until it becomes probable that the performance target will be met. There are no new disclosures required under ASU 2014-12. ASU 2014-12 is effective for fiscal years, and interim periods within those years, beginning after December 15, 2015. CRA believes that the adoption of ASU 2014-12 will not have a material impact on its financial position, results of operations, cash flows, or disclosures.
FS-16
CRA INTERNATIONAL, INC.
NOTES TO CONSOLIDATED FINANCIAL STATEMENTS (Continued)
Revenue from Contracts with Customers
In May 2014, the FASB issued ASU No. 2014-09, Revenue from Contracts with Customers ("ASU 2014-09"). The main provision of ASU 2014-09 is to recognize revenue when control of the goods or services transfers to the customer, as opposed to the existing guidance of recognizing revenue when the risks and rewards transfer to the customer. ASU 2014-09 is effective for fiscal years, and interim periods within those years, beginning after December 15, 2016. CRA has not yet determined the effects, if any, that the adoption of ASU 2014-09 may have on its financial position, results of operations, cash flows, or disclosures.
Presentation of Unrecognized Tax Benefits
In July 2013, the FASB issued ASU No. 2013-11, Presentation of an Unrecognized Tax Benefit When a Net Operating Loss Carryforward, a Similar Tax Loss, or a Tax Credit Carryforward Exists ("ASU 2013-11") to clarify the presentation of current and deferred income taxes on the balance sheet. Under ASU 2013-11, companies generally must present an unrecognized tax benefit, or a portion of an unrecognized tax benefit, for a net operating loss carryforward, similar tax loss, or tax credit carryforward using the "net presentation" approach as a reduction of a deferred tax asset, with some allowed exceptions. ASU 2013-11 is effective for fiscal years, and interim periods within those years, beginning after December 15, 2013. CRA's adoption of ASU 2013-11 in the first quarter of fiscal 2014 had no impact on its financial position, results of operations, cash flows, or disclosures.
Cumulative Translation Adjustment
In March 2013, the FASB issued ASU No. 2013-05, Parent's Accounting for the Cumulative Translation Adjustment upon Derecognition of Certain Subsidiaries or Groups of Assets within a Foreign Entity or of an Investment in a Foreign Entity ("ASU 2013-05"). ASU 2013-05 addresses the accounting for the cumulative translation adjustment when a parent either sells a part or all of its investment in a foreign entity or no longer holds a controlling financial interest in a subsidiary or group of assets that is a nonprofit activity or a business within a foreign entity. ASU 2013-05 is effective for fiscal years, and interim periods within those years, beginning after December 15, 2013 and should be applied prospectively. CRA's adoption of ASU 2013-05 in the first quarter of fiscal 2014 had no impact on its financial position, results of operations, cash flows, or disclosures.
2. Business Acquisition
On January 31, 2013, CRA announced that an approximate 40-person litigation consulting team joined CRA, effective February 1, 2013. Under an agreement to hire the team, CRA accelerated the previously announced start dates of certain key personnel from May 2013. Under the terms of the transaction, CRA acquired certain intangible assets, accounts receivable, and certain client projects currently underway. The fair values of the assets acquired and the liabilities assumed as part of the acquisition were finalized in the first quarter of fiscal 2014. The acquisition was not material. The acquisition was accounted for under the purchase method of accounting, and the results of operations have been included in the accompanying statements of operations from the date of acquisition.
FS-17
CRA INTERNATIONAL, INC.
NOTES TO CONSOLIDATED FINANCIAL STATEMENTS (Continued)
3. Prepaid Expenses and Other Current Assets, and Other Assets
Prepaid expenses and other current assets consist of the following (in thousands):
| |
January 3, 2015 |
December 28, 2013 |
|||||
|---|---|---|---|---|---|---|---|
Term loans to employees |
$ | 1,564 | $ | 1,764 | |||
Other |
11,601 | 10,011 | |||||
| | | | | | | | |
Total |
$ | 13,165 | $ | 11,775 | |||
| | | | | | | | |
| | | | | | | | |
| | | | | | | | |
Other assets consist of the following (in thousands):
| |
January 3, 2015 |
December 28, 2013 |
|||||
|---|---|---|---|---|---|---|---|
Forgivable loans to employees and non-employee experts |
$ | 42,907 | $ | 51,083 | |||
Other |
5,008 | 3,538 | |||||
| | | | | | | | |
Total |
$ | 47,915 | $ | 54,621 | |||
| | | | | | | | |
| | | | | | | | |
| | | | | | | | |
In order to attract and retain highly skilled professionals, CRA may issue forgivable loans or term loans to employees and non-employee experts which are classified in "prepaid expenses and other current assets" and "other assets" on the accompanying balance sheets as of January 3, 2015 and December 28, 2013. A portion of these loans is collateralized. The forgivable loans have terms that are generally between three and eight years. The principal amount of forgivable loans and accrued interest is forgiven by CRA over the term of the loans, so long as the employee or non-employee expert continues employment or affiliation with CRA and complies with certain contractual requirements. The expense associated with the forgiveness of the principal amount of the loans is recorded as compensation expense over the service period, which is consistent with the term of the loans. During fiscal 2014 and fiscal 2013, CRA issued approximately $10.9 million and $38.8 million, respectively, in forgivable loans to employees and non-employee experts for future service.
4. Goodwill and Intangible Assets
The changes in the carrying amount of goodwill for fiscal 2014 and fiscal 2013 are as follows (in thousands):
| |
Goodwill, gross |
Accumulated impairment losses |
Goodwill, net |
|||||||
|---|---|---|---|---|---|---|---|---|---|---|
Balance at December 28, 2013 |
$ | 153,466 | $ | (71,893 | ) | $ | 81,573 | |||
Goodwill adjustments related to acquisitions |
1,797 | — | 1,797 | |||||||
Effect of foreign currency translation |
(1,067 | ) | — | (1,067 | ) | |||||
| | | | | | | | | | | |
Balance at January 3, 2015 |
$ | 154,196 | $ | (71,893 | ) | $ | 82,303 | |||
| | | | | | | | | | | |
| | | | | | | | | | | |
| | | | | | | | | | | |
FS-18
CRA INTERNATIONAL, INC.
NOTES TO CONSOLIDATED FINANCIAL STATEMENTS (Continued)
| |
Goodwill, gross |
Accumulated impairment losses |
Goodwill, net |
|||||||
|---|---|---|---|---|---|---|---|---|---|---|
Balance at December 29, 2012 |
$ | 142,658 | $ | (71,893 | ) | $ | 70,765 | |||
Goodwill adjustments related to acquisitions |
10,563 | — | 10,563 | |||||||
Goodwill adjustments related to NeuCo |
(63 | ) | — | (63 | ) | |||||
Effect of foreign currency translation |
308 | — | 308 | |||||||
| | | | | | | | | | | |
Balance at December 28, 2013 |
$ | 153,466 | $ | (71,893 | ) | $ | 81,573 | |||
| | | | | | | | | | | |
| | | | | | | | | | | |
| | | | | | | | | | | |
There were no impairment losses related to goodwill during fiscal 2014 or fiscal 2013. When CRA performed its annual impairment test in the fourth quarter of fiscal 2012, its net book value exceeded its market capitalization plus an estimated control premium. Therefore, CRA was required to perform the second step of the goodwill impairment test, which resulted in a goodwill impairment charge of $71.4 million. CRA recorded this goodwill impairment charge in the fourth quarter of fiscal 2012.
Intangible assets that are separable from goodwill and have determinable useful lives are valued separately and amortized over their expected useful lives. There were no impairment losses related to intangible assets during fiscal 2014, fiscal 2013, or fiscal 2012.
The components of acquired identifiable intangible assets are as follows (in thousands):
| |
January 3, 2015 |
December 28, 2013 |
|||||
|---|---|---|---|---|---|---|---|
Non-competition agreements, net of accumulated amortization of $4,046 and $3,802, respectively |
$ | 236 | $ | 598 | |||
Customer relationships, net of accumulated amortization of $3,746 and $3,550, respectively |
4,521 | 3,909 | |||||
Other intangible assets, net of accumulated amortization of $1,792 and $1,040, respectively |
— | 30 | |||||
| | | | | | | | |
|
$ | 4,757 | $ | 4,537 | |||
| | | | | | | | |
| | | | | | | | |
| | | | | | | | |
Amortization of intangible assets was $1.4 million, $1.2 million, and $0.8 million in fiscal 2014, fiscal 2013, and fiscal 2012, respectively. Amortization of intangible assets held at January 3, 2015 for the next five fiscal years is expected to be as follows (in thousands):
Fiscal Year
|
Amortization Expense |
|||
|---|---|---|---|---|
2015 |
$ | 1,063 | ||
2016 |
899 | |||
2017 |
857 | |||
2018 |
831 | |||
2019 |
563 | |||
| | | | | |
|
$ | 4,213 | ||
| | | | | |
| | | | | |
| | | | | |
FS-19
CRA INTERNATIONAL, INC.
NOTES TO CONSOLIDATED FINANCIAL STATEMENTS (Continued)
5. Property and Equipment
Property and equipment consist of the following (in thousands):
| |
January 3, 2015 |
December 28, 2013 |
|||||
|---|---|---|---|---|---|---|---|
Computer, office equipment and software |
$ | 24,197 | $ | 25,034 | |||
Leasehold improvements |
21,613 | 21,388 | |||||
Furniture |
7,730 | 7,788 | |||||
| | | | | | | | |
|
53,540 | 54,210 | |||||
Accumulated depreciation and amortization |
(38,844 | ) | (38,555 | ) | |||
| | | | | | | | |
|
$ | 14,696 | $ | 15,655 | |||
| | | | | | | | |
| | | | | | | | |
| | | | | | | | |
Depreciation expense, including amounts recorded in costs of services, was $5.0 million, $5.2 million, and $5.0 million, in fiscal 2014, fiscal 2013, and fiscal 2012, respectively.
6. Accrued Expenses
Accrued expenses consist of the following (in thousands):
| |
January 3, 2015 |
December 28, 2013 |
|||||
|---|---|---|---|---|---|---|---|
Compensation and related expenses |
$ | 61,527 | $ | 51,960 | |||
Income taxes payable |
490 | 3,503 | |||||
Other |
4,531 | 10,194 | |||||
| | | | | | | | |
|
$ | 66,548 | $ | 65,657 | |||
| | | | | | | | |
| | | | | | | | |
| | | | | | | | |
As of January 3, 2015 and December 28, 2013, $49.2 million and $40.0 million of accrued bonuses for fiscal 2014 and fiscal 2013, respectively, were included above in "Compensation and related expenses".
7. Credit Agreement
CRA is party to a credit agreement that provides CRA with a $125.0 million revolving credit facility and a $15 million sublimit for the issuance of letters of credit. CRA may use the proceeds of the revolving credit facility for working capital and other general corporate purposes. CRA may repay any borrowings under the revolving credit facility at any time, but no later than April 24, 2018. There was no amount outstanding under this revolving line of credit as of January 3, 2015.
As of January 3, 2015, the amount available under this revolving line of credit was reduced by certain letters of credit outstanding, which amounted to $1.3 million. Borrowings under the revolving credit facility bear interest at a rate per annum of either (i) the adjusted base rate, as defined in the credit agreement, plus an applicable margin, which varies between 0.50% and 1.50% depending on CRA's total leverage ratio as determined under the credit agreement, or (ii) the adjusted eurocurrency rate, as defined in the credit agreement, plus an applicable margin, which varies between 1.50% and 2.50% depending on CRA's total leverage ratio. CRA is required to pay a fee on the unused portion of the revolving credit facility at a rate per annum that varies between 0.25% and 0.375% depending on its total leverage ratio. Borrowings under the credit facility are secured by 100% of the stock of certain of CRA's U.S. subsidiaries and 65% of the stock of certain of its foreign subsidiaries, which represent approximately $6.4 million in net assets as of January 3, 2015.
FS-20
CRA INTERNATIONAL, INC.
NOTES TO CONSOLIDATED FINANCIAL STATEMENTS (Continued)
Under the credit agreement, CRA must comply with various financial and non-financial covenants. Compliance with these financial covenants is tested on a fiscal quarterly basis. Any indebtedness outstanding under the credit facility may become immediately due and payable upon the occurrence of stated events of default, including CRA's failure to pay principal, interest or fees or a violation of any financial covenant. The financial covenants require CRA to maintain an adjusted consolidated EBITDA to consolidated interest expense ratio of more than 2.5 to 1.0 and to comply with a consolidated debt to adjusted consolidated EBITDA ratio of not more than 3.0 to 1.0. The non-financial covenant restrictions of the senior credit agreement include, but are not limited to, CRA's ability to incur additional indebtedness, engage in acquisitions or dispositions, and enter into business combinations. As of January 3, 2015, CRA was in compliance with the covenants of its credit agreement.
8. Employee Benefit Plans
CRA maintains qualified defined-contribution plans under Section 401(k) of the Internal Revenue Code, covering substantially all U.S. employees who meet specified age and service requirements. Company contributions are made at the discretion of CRA, and cannot exceed the maximum amount deductible under applicable provisions of the Internal Revenue Code. Effective in fiscal 2014, CRA also has a defined-contribution plan covering employees in the United Kingdom for which company contributions are made at the discretion of CRA. Company contributions under these plans amounted to approximately $1.6 million, $1.7 million, and $1.8 million for fiscal 2014, fiscal 2013, and fiscal 2012, respectively.
9. Leases
At January 3, 2015, CRA had the following minimum rental commitments for office space and equipment leases, all of which are under non-cancelable operating leases (in thousands):
Fiscal Year
|
Rental Commitments |
|||
|---|---|---|---|---|
2015 |
$ | 9,683 | ||
2016 |
7,160 | |||
2017 |
5,991 | |||
2018 |
5,020 | |||
2019 |
4,172 | |||
Thereafter |
27,329 | |||
| | | | | |
|
$ | 59,355 | ||
Future minimum rentals under sublease arrangements |
(457 | ) | ||
| | | | | |
|
$ | 58,898 | ||
| | | | | |
| | | | | |
| | | | | |
Certain office leases contain renewal options that CRA may exercise at its discretion, which were not included in the amounts above. Rent expense was approximately $10.0 million, $9.6 million, and $12.4 million in fiscal 2014, fiscal 2013, and fiscal 2012, respectively. Included in rent expense was $0.9 million in restructuring charges in fiscal 2012. There were no restructuring charges during fiscal 2014 and fiscal 2013.
CRA is party to standby letters of credit with its bank in support of the minimum future lease payments under leases for office space amounting to $1.3 million as of January 3, 2015.
See Note 18 for subsequent event related to operating lease obligations.
FS-21
CRA INTERNATIONAL, INC.
NOTES TO CONSOLIDATED FINANCIAL STATEMENTS (Continued)
10. Net Income (Loss) Per Share
Basic net income (loss) per share represents net income (loss) attributable to CRA International, Inc., divided by the weighted average shares of common stock outstanding during the period. Diluted net income per share represents net income divided by the weighted average shares of common stock and common stock equivalents, if applicable, outstanding during the period. Common stock equivalents arise from stock options, unvested shares of restricted stock and unvested restricted stock units, using the treasury stock method. Under the treasury stock method, the amount CRA would receive on the exercise of stock options, the vesting of shares of restricted stock and restricted stock units, the amount of compensation cost for future service that CRA has not yet recognized, and the amount of tax benefits that would be recorded in common stock when these stock options, shares of restricted stock, and restricted stock units become deductible are assumed to be used to repurchase shares at the average share price over the applicable fiscal period, and these repurchased shares are netted against the shares underlying these stock options, unvested shares of restricted stock, and unvested restricted stock units. CRA's unvested shares of restricted stock that contain rights to receive non-forfeitable dividends are considered participating securities, but net earnings available to these participating securities were not significant for fiscal 2014. A reconciliation of basic to diluted weighted average shares of common stock outstanding is as follows (in thousands):
| |
Fiscal Year 2014 |
Fiscal Year 2013 |
Fiscal Year 2012 |
|||||||
|---|---|---|---|---|---|---|---|---|---|---|
Basic weighted average shares outstanding |
9,747 | 10,084 | 10,167 | |||||||
Common stock equivalents: |
||||||||||
Stock options and restricted stock |
150 | 89 | — | |||||||
| | | | | | | | | | | |
Diluted weighted average shares outstanding |
9,897 | 10,173 | 10,167 | |||||||
| | | | | | | | | | | |
| | | | | | | | | | | |
| | | | | | | | | | | |
For fiscal 2014, fiscal 2013, and fiscal 2012, certain share-based awards, which amounted to 764,748, 1,138,411, and 1,947,992 shares, respectively, were excluded from the calculation of common stock equivalents for purposes of computing diluted weighted average shares outstanding because they were anti-dilutive. These share-based awards were anti-dilutive because their exercise price exceeded the average market price over the applicable period. Additionally, approximately 140,000 common stock equivalents were excluded from diluted weighted average shares outstanding for fiscal 2012 because they were anti-dilutive as CRA had a net loss for that period.
11. Common Stock
Share-Based Compensation. Approximately $5.3 million, $2.9 million, and $4.9 million of share-based compensation expense was recorded in fiscal 2014, fiscal 2013, and fiscal 2012, respectively, as an increase to common stock for share-based payment awards made to CRA's employees and directors, based on the estimated grant date fair values of stock options, shares of restricted stock, and restricted stock units vesting during the period.
CRA also recorded $271,000, $147,000, and $79,000 for fiscal 2014, fiscal 2013, and fiscal 2012, respectively, in shared-based compensation expense for grants to non-employees (other than directors).
Restricted Share Vesting. In fiscal 2014, fiscal 2013, and fiscal 2012, 149,195, 134,384, and 216,528 shares of restricted stock and restricted stock units vested, respectively. CRA redeemed 41,470, 37,642, and 69,207, of these shares from their holders in order to pay $1.2 million, $0.7 million, and $1.4 million, respectively, of employee tax withholdings.
Common Stock Repurchases and Retirements. On August 10, 2012, February 13, 2014, and October 23, 2014, CRA's Board of Directors authorized the repurchase of up to $5.0 million,
FS-22
CRA INTERNATIONAL, INC.
NOTES TO CONSOLIDATED FINANCIAL STATEMENTS (Continued)
$15.0 million, and $30.0 million, respectively, of CRA's common stock. CRA may repurchase shares under any of these programs in open market purchases (including through any Rule 10b5-1 plan adopted by CRA) or in privately negotiated transactions in accordance with applicable insider trading and other securities laws and regulations. CRA records the retirement of its repurchased shares as a reduction to common stock.
During fiscal 2014, CRA repurchased and retired 971,515 shares of its common stock under these programs at an aggregate price of approximately $25.5 million, resulting in approximately $20.9 million available for future repurchases as of January 3, 2015. During fiscal 2013, CRA repurchased and retired 118,968 shares of its common stock under these programs at an aggregate price of approximately $2.2 million. During fiscal 2012, CRA repurchased and retired 466,109 shares of its common stock under these programs at an aggregate price of approximately $9.1 million. CRA records the retirement of its repurchased common stock as a reduction to common stock.
During fiscal 2014, fiscal 2013, and fiscal 2012, CRA did not repurchase any shares of its common stock from non-employee experts or employees based on contractual rights of first purchase contained in their stock purchase agreement with CRA.
Exercise of Stock Options. During fiscal 2014, 20,931 options were exercised for $0.5 million of proceeds. During fiscal 2013, 13,389 options were exercised for $0.2 million of proceeds. During fiscal 2012, 47,185 options were exercised for $0.6 million of proceeds.
Tax Benefits and Deficits on Stock Option Exercises and Restricted Share Vesting. In fiscal 2014, CRA recorded $0.1 million of tax benefits on stock options exercises and the vesting of shares of restricted stock and restricted stock units as a decrease to common stock. CRA recorded tax deficits on stock options exercises and vesting of shares of restricted stock and restricted stock units as a decrease to common stock in fiscal 2013 and fiscal 2012, totaling $0.3 million and $0.6 million, respectively.
12. Share-Based Compensation
CRA recorded approximately $5.3 million, $2.9 million, and $4.9 million of compensation expense for fiscal 2014, fiscal 2013, and fiscal 2012, respectively, for share-based awards consisting of stock options, shares of restricted stock, time-vesting restricted stock units, and performance-vesting restricted stock units issued to employees and directors based on their respective estimated grant date fair values. Performance-vesting restricted stock units are expensed using the graded acceleration method.
In addition, CRA recorded $271,000, $147,000, and $79,000 of share-based compensation expense during fiscal 2014, fiscal 2013, and fiscal 2012, respectively, for share-based awards consisting of stock options and shares of restricted stock issued to non-employees (other than directors).
CRA maintains share-based compensation plans that use restricted stock, stock options, restricted stock units, as well as an employee stock purchase plan, to provide incentives to its directors, employees and independent contractors. Additionally, during fiscal 2009, CRA implemented a long-term incentive program ("LTIP") for certain key employees. Under this program, participants may receive a mixture of stock options, time-vesting restricted stock units, and performance-vesting restricted stock units. The program is designed to reward key employees and provide participants the opportunity to share in the long-term growth of CRA. CRA has granted options, time-vesting restricted stock units, and performance-vesting restricted stock units under this program during fiscal 2009 through fiscal 2014, except fiscal 2012. These awards are granted under the 2006 Incentive Plan discussed below.
CRA's Amended and Restated 2006 Equity Incentive Plan, as amended (the "2006 Incentive Plan"), authorizes the grant of a variety of incentive and performance awards to CRA's directors, employees and independent contractors, including incentive stock options, nonqualified stock options,
FS-23
CRA INTERNATIONAL, INC.
NOTES TO CONSOLIDATED FINANCIAL STATEMENTS (Continued)
restricted stock awards, restricted stock unit awards, performance awards and other share-based awards. Each share of CRA's common stock issued pursuant to an award (other than a stock option) granted under the 2006 Incentive Plan on or after April 30, 2010 counts as 1.83 shares against the maximum number of shares issuable under the plan, as does any restricted stock unit or other performance award granted under the plan on or after April 30, 2010 to the extent that shares of CRA's common stock were or will be used for measurement purposes. This "fungibility ratio" with respect to shares of CRA's common stock issued pursuant to awards (other than stock options) granted under the plan, as well as restricted stock unit and other performance awards granted under the plan to the extent that shares of CRA's common stock are used for measurement purposes, was 2.2 for grants made on or after March 12, 2008 and before April 30, 2010 and 1.8 for grants made before March 12, 2008. The maximum number of shares issuable under the 2006 Incentive Plan is 4,874,000, consisting of (1) 500,000 shares initially reserved for issuance under the 2006 Incentive Plan, (2) 1,000,000 shares that either remained for future awards under our 1998 Incentive and Nonqualified Stock Option Plan (the "1998 Plan") on April 21, 2006, the date CRA's shareholders initially approved the 2006 Incentive Plan, or were subject to stock options issued under the 1998 Plan that were forfeited or terminated after April 21, 2006, (3) 210,000 shares approved by CRA's shareholders in 2008, (4) 1,464,000 shares approved by CRA's shareholders in 2010, and (5) the 1,700,000 shares that CRA has determined to use of the 2,500,000 shares approved by CRA's shareholders in 2012.
The following is a rollforward of the maximum number of shares issuable under the 2006 Incentive Plan as of January 3, 2015:
| |
Actual Shares |
Shares Using Fungibility Ratio |
|||||
|---|---|---|---|---|---|---|---|
Maximum shares of common stock issuable under the 2006 Incentive Plan |
4,874,000 | ||||||
Restricted shares or units granted/reserved through March 12, 2008 |
471,827 | (849,289 | ) | ||||
Restricted shares or units granted/reserved from March 12, 2008 to April 29, 2010 |
352,932 | (776,450 | ) | ||||
Restricted shares or units granted/reserved on or after April 30, 2010 |
1,481,999 | (2,710,594 | ) | ||||
Cancellation of restricted shares or units through March 12, 2008 |
91,277 | 164,299 | |||||
Cancellation of restricted shares or units from March 12, 2008 to April 29, 2010 |
91,964 | 202,321 | |||||
Cancellation of restricted shares or units on or after April 30, 2010 |
470,424 | 860,877 | |||||
Options granted |
(1,094,726 | ) | |||||
Options cancelled |
193,183 | ||||||
Options forfeited |
27,731 | ||||||
| | | | | | | | |
Shares available for grant under the 2006 Incentive Plan |
891,352 | ||||||
| | | | | | | | |
| | | | | | | | |
| | | | | | | | |
Under the 1998 Plan, 3,839,216 options to purchase shares have been granted. With the adoption of the 2006 Incentive Plan, no new options will be granted under the 1998 Plan. Under the terms of the 1998 Plan, options have been granted at an exercise price equal to the fair market value of the shares of common stock at the date of grant. Vesting terms were determined at the discretion of the Board of Directors and generally range from immediate vesting to vesting at various rates up to five years. In general, stock options terminate 7 to 10 years after the date of grant.
FS-24
CRA INTERNATIONAL, INC.
NOTES TO CONSOLIDATED FINANCIAL STATEMENTS (Continued)
In addition, under CRA's 2004 Nonqualified Inducement Stock Option Plan, options to purchase 359,420 shares have been granted. With the adoption of the 2006 Incentive Plan, no new stock options will be granted under the 2004 Nonqualified Inducement Stock Option Plan.
Under CRA's 2009 Nonqualified Inducement Stock Option Plan, options to purchase 200,000 shares have been granted. A maximum of 250,000 shares may be issued pursuant to stock option grants under the 2009 Nonqualified Inducement Stock Option Plan. Accordingly, there are an additional 50,000 stock options available for grant under this plan. Each stock option granted under this plan vests over four years, has a term of seven years, and an exercise price equal to $50.00 per share.
A summary of option activity from all plans is as follows:
| |
Options | Weighted Average Exercise Price |
Weighted Average Remaining Contractual Term |
Aggregate Intrinsic Value |
|||||||||
|---|---|---|---|---|---|---|---|---|---|---|---|---|---|
| |
|
|
|
(in thousands) |
|||||||||
Outstanding at December 28, 2013 |
1,292,349 | $ | 30.43 | ||||||||||
Fiscal 2014: |
|||||||||||||
Granted |
178,608 | 30.97 | |||||||||||
Exercised |
(20,931 | ) | 22.40 | ||||||||||
Forfeited |
(295,081 | ) | 33.26 | ||||||||||
| | | | | | | | | | | | | | |
Outstanding at January 3, 2015 |
1,154,945 | 29.93 | 3.73 | $ | 6,403 | ||||||||
| | | | | | | | | | | | | | |
| | | | | | | | | | | | | | |
| | | | | | | | | | | | | | |
Options exercisable at January 3, 2015 |
737,760 | $ | 33.14 | 2.39 | $ | 3,746 | |||||||
| | | | | | | | | | | | | | |
| | | | | | | | | | | | | | |
| | | | | | | | | | | | | | |
The weighted average fair market value using the Black-Scholes option-pricing model of the stock options granted in fiscal 2014 and fiscal 2013 was $12.24 and $7.77, respectively. There were no stock options granted during fiscal 2012. The fair market value of the stock options at the date of grant was estimated using the Black-Scholes option-pricing model with the following weighted average assumptions:
| |
2014 | 2013 | |||||
|---|---|---|---|---|---|---|---|
Risk-free interest rate |
1.6 | % | 1.4 | % | |||
Expected volatility |
43 | % | 47 | % | |||
Weighted average expected life (in years) |
5.00 | 5.00 | |||||
Expected dividends |
— | — | |||||
The risk-free interest rate is based on U.S. Treasury interest rates with corresponding terms consistent with the expected life of the stock options. Expected volatility and expected life are based on CRA's historical experience. Expected dividend yield was not considered in the option-pricing formula because CRA does not pay dividends and has no current plans to do so in the future. The forfeiture rate used was based upon historical experience. CRA may adjust the estimated forfeiture rate based upon actual experience.
FS-25
CRA INTERNATIONAL, INC.
NOTES TO CONSOLIDATED FINANCIAL STATEMENTS (Continued)
The aggregate intrinsic value of stock options exercised in fiscal 2014, fiscal 2013, and fiscal 2012 was approximately $0.1 million, $0.1 million, and $0.4 million, respectively. The following table summarizes stock options outstanding and stock options exercisable as of January 3, 2015:
| |
Options Outstanding | Options Exercisable | ||||||||||||||
|---|---|---|---|---|---|---|---|---|---|---|---|---|---|---|---|---|
Range of Exercise Prices
|
Number Outstanding at January 3, 2015 |
Weighted-Average Remaining Contractual Life (years) |
Weighted-Average Exercise Price |
Number Exercisable at January 3, 2015 |
Weighted-Average Exercise Price |
|||||||||||
$18.48 |
254,355 | 5.88 | $ | 18.48 | 63,578 | $ | 18.48 | |||||||||
$18.49 - 22.81 |
328,253 | 3.39 | 21.68 | 284,453 | 21.64 | |||||||||||
$22.82 - 29.07 |
86,665 | 2.00 | 24.22 | 82,665 | 24.18 | |||||||||||
$29.08 - 32.26 |
178,608 | 6.93 | 30.97 | — | — | |||||||||||
$32.27 - 48.85 |
42,500 | 0.79 | 42.58 | 42,500 | 42.58 | |||||||||||
$48.86 - 50.00 |
150,000 | 1.50 | 50.00 | 150,000 | 50.00 | |||||||||||
$50.01 - 53.72 |
114,564 | 0.25 | 50.73 | 114,564 | 50.73 | |||||||||||
| | | | | | | | | | | | | | | | | |
Total |
1,154,945 | 3.73 | $ | 29.93 | 737,760 | $ | 33.14 | |||||||||
| | | | | | | | | | | | | | | | | |
| | | | | | | | | | | | | | | | | |
| | | | | | | | | | | | | | | | | |
The following table summarizes the status of CRA's non-vested stock options since December 28, 2013:
| |
Non-vested Options | ||||||
|---|---|---|---|---|---|---|---|
| |
Number of Shares |
Weighted-Average Fair Value |
|||||
Non-vested at December 28, 2013 |
401,678 | $ | 8.16 | ||||
Granted |
178,608 | 12.24 | |||||
Vested |
(153,126 | ) | 9.03 | ||||
Forfeited |
(9,975 | ) | 8.30 | ||||
| | | | | | | | |
Non-vested at January 3, 2015 |
417,185 | $ | 9.98 | ||||
| | | | | | | | |
| | | | | | | | |
| | | | | | | | |
The total fair value of stock options that vested during fiscal 2014, fiscal 2013, and fiscal 2012 was $1.4 million, $1.3 million, and $1.5 million, respectively. As of January 3, 2015, there was $3.6 million of total unrecognized compensation cost, net of expected forfeitures, related to non-vested stock options granted. That cost is expected to be recognized over a weighted-average period of 3.2 years.
CRA grants restricted stock and time-vesting restricted stock unit awards, which are subject to the execution of a restricted stock agreement or restricted stock unit agreement, as applicable. Generally, shares of restricted stock and time-vesting restricted stock units vest in four equal annual installments beginning on the first anniversary of the date of grant. Total unrecognized compensation cost, net of expected forfeitures, related to restricted stock and time-vesting restricted stock unit awards as of January 3, 2015 was $5.8 million, which is expected to be recognized over a weighted-average period of 3.1 years.
FS-26
CRA INTERNATIONAL, INC.
NOTES TO CONSOLIDATED FINANCIAL STATEMENTS (Continued)
The following table summarizes the status of CRA's non-vested restricted stock and time-vesting restricted stock unit awards since December 28, 2013:
| |
Non-vested Restricted Stock and Stock Units |
||||||
|---|---|---|---|---|---|---|---|
| |
Number of Shares |
Weighted-Average Fair Value |
|||||
Non-vested at December 28, 2013 |
309,038 | $ | 20.39 | ||||
Granted |
135,593 | 28.51 | |||||
Vested |
(149,195 | ) | 21.75 | ||||
Forfeited |
(9,294 | ) | 20.95 | ||||
| | | | | | | | |
Non-vested at January 3, 2015 |
286,142 | $ | 23.72 | ||||
| | | | | | | | |
| | | | | | | | |
| | | | | | | | |
In accordance with ASC Topic 718, for performance-vesting restricted stock units awarded to employees, CRA estimates share-based compensation cost at the grant date based on the fair value of the award and recognizes the cost over the requisite service period using the graded acceleration method. As of January 3, 2015, up to approximately 212,000 shares may become issuable under performance-vesting restricted stock unit awards upon achievement of certain financial performance goals, including revenue and profits, for a measurement period falling within the first quarter of fiscal 2014 through the fourth quarter of fiscal 2015, and up to approximately 149,000 shares may become issuable under performance-vesting restricted stock unit awards upon achievement of certain financial performance goals, including revenue and profits, for a measurement period falling within the first quarter of fiscal 2015 through the fourth quarter of fiscal 2016.
In fiscal 1998, CRA adopted its 1998 Employee Stock Purchase Plan. The 1998 Employee Stock Purchase Plan authorizes the issuance of up to an aggregate of 243,000 shares of common stock to participating employees at a purchase price equal to 85% of fair market value on either the first or the last day of the one-year offering period under the Stock Purchase Plan. In fiscal 2014, fiscal 2013, and fiscal 2012, there were no offering periods under this plan and no shares were issued.
13. Business Segment and Geographic Information
CRA operates in one business segment, which is consulting services. Revenue and long-lived assets by country, based on the physical location of the operation to which the revenues or the assets relate, are as follows (in thousands):
| |
Fiscal Year | Fiscal Year | Fiscal Year | |||||||
|---|---|---|---|---|---|---|---|---|---|---|
| |
2014 (53 weeks) |
2013 (52 weeks) |
2012 (52 weeks) |
|||||||
Revenue: |
||||||||||
United States |
$ | 238,466 | $ | 216,815 | $ | 207,779 | ||||
United Kingdom |
49,127 |
46,987 |
51,059 |
|||||||
Other |
18,778 | 14,630 | 11,552 | |||||||
| | | | | | | | | | | |
Total foreign |
67,905 | 61,617 | 62,611 | |||||||
| | | | | | | | | | | |
|
$ | 306,371 | $ | 278,432 | $ | 270,390 | ||||
| | | | | | | | | | | |
| | | | | | | | | | | |
| | | | | | | | | | | |
FS-27
CRA INTERNATIONAL, INC.
NOTES TO CONSOLIDATED FINANCIAL STATEMENTS (Continued)
| |
January 3, 2015 |
December 28, 2013 |
|||||
|---|---|---|---|---|---|---|---|
Long-lived assets (property and equipment, net): |
|||||||
United States |
$ | 12,753 | $ | 13,657 | |||
United Kingdom |
1,595 |
1,911 |
|||||
Other |
348 | 87 | |||||
| | | | | | | | |
Total foreign |
1,943 | 1,998 | |||||
| | | | | | | | |
|
$ | 14,696 | $ | 15,655 | |||
| | | | | | | | |
| | | | | | | | |
| | | | | | | | |
14. Income Taxes
The components of income (loss) before (provision) benefit for income taxes are as follows (in thousands):
| |
Fiscal Year | Fiscal Year | Fiscal Year | |||||||
|---|---|---|---|---|---|---|---|---|---|---|
| |
2014 (53 weeks) |
2013 (52 weeks) |
2012 (52 weeks) |
|||||||
Income (loss) before (provision) benefit for income taxes: |
||||||||||
U.S. |
$ | 20,899 | $ | 13,659 | $ | (27,290 | ) | |||
Foreign |
2,416 | 4,259 | (30,733 | ) | ||||||
| | | | | | | | | | | |
Total |
$ | 23,315 | $ | 17,918 | $ | (58,023 | ) | |||
| | | | | | | | | | | |
| | | | | | | | | | | |
| | | | | | | | | | | |
The provision (benefit) for income taxes consists of the following (in thousands):
| |
Fiscal Year | Fiscal Year | Fiscal Year | |||||||
|---|---|---|---|---|---|---|---|---|---|---|
| |
2014 (53 weeks) |
2013 (52 weeks) |
2012 (52 weeks) |
|||||||
Currently payable: |
||||||||||
Federal |
$ | 8,585 | $ | 1,241 | $ | 3,637 | ||||
Foreign |
876 | 1,264 | 50 | |||||||
State |
1,878 | 254 | 1,015 | |||||||
| | | | | | | | | | | |
|
11,339 | 2,759 | 4,702 | |||||||
Deferred: |
||||||||||
Federal |
(1,068 | ) | 3,592 | (8,163 | ) | |||||
Foreign |
(505 | ) | (238 | ) | 21 | |||||
State |
142 | 570 | (1,740 | ) | ||||||
| | | | | | | | | | | |
|
$ | (1,431 | ) | $ | 3,924 | $ | (9,882 | ) | ||
| | | | | | | | | | | |
|
$ | 9,908 | $ | 6,683 | $ | (5,180 | ) | |||
| | | | | | | | | | | |
| | | | | | | | | | | |
| | | | | | | | | | | |
FS-28
CRA INTERNATIONAL, INC.
NOTES TO CONSOLIDATED FINANCIAL STATEMENTS (Continued)
A reconciliation of CRA's tax rates with the Federal statutory rate is as follows:
| |
Fiscal Year | Fiscal Year | Fiscal Year | |||||||
|---|---|---|---|---|---|---|---|---|---|---|
| |
2014 | 2013 | 2012 | |||||||
Federal statutory rate |
35.0 | % | 35.0 | % | (35.0 | )% | ||||
State income taxes, net of federal income tax benefit |
3.6 | 4.4 | (1.3 | ) | ||||||
Goodwill impairment |
— | — | 20.6 | |||||||
Foreign losses benefited |
(1.8 | ) | (2.8 | ) | (0.1 | ) | ||||
Losses not benefited |
0.6 | 0.3 | 4.2 | |||||||
Foreign rate differential |
0.6 | (0.4 | ) | 2.1 | ||||||
Foreign tax credit |
— | (0.1 | ) | (0.5 | ) | |||||
Uncertain tax positions |
0.7 | (2.1 | ) | — | ||||||
Impact of NeuCo's tax provision charges |
0.9 | 1.5 | 0.1 | |||||||
Permanently disallowed expenses |
2.1 | 1.6 | 1.0 | |||||||
Prior period adjustments |
3.0 | — | — | |||||||
Release of valuation allowance |
(2.2 | ) | — | — | ||||||
Other |
— | (0.1 | ) | — | ||||||
| | | | | | | | | | | |
|
42.5 | % | 37.3 | % | (8.9 | )% | ||||
| | | | | | | | | | | |
| | | | | | | | | | | |
| | | | | | | | | | | |
The effective tax rate in fiscal 2014 was higher than CRA's combined Federal and state statutory tax rate primarily due to a non-cash tax expense recorded in the second quarter of fiscal 2014 to correct an immaterial error in our previously issued consolidated financial statements offset slightly by other prior period adjustments recorded in the fourth quarter. The effective tax rate also included a benefit for the release of a valuation allowance as a result of recording a deferred tax liability associated with acquisition-related intangibles and the utilization of certain historical net operating losses that previously had a valuation allowance which were realized due to the profitability of the acquired business.
The components of CRA's deferred tax assets (liabilities) are as follows (in thousands):
| |
January 3, 2015 |
December 28, 2013 |
|||||
|---|---|---|---|---|---|---|---|
Deferred tax assets: |
|||||||
Accrued compensation and related expense |
$ | 23,876 | $ | 21,064 | |||
Tax basis in excess of financial basis of net accounts receivable |
2,065 | 2,363 | |||||
Net operating loss carryforwards |
5,201 | 5,421 | |||||
Tax basis in excess of financial basis of fixed assets |
19 | 1,489 | |||||
Accrued expenses and other |
967 | 902 | |||||
| | | | | | | | |
Total gross deferred tax assets |
32,128 | 31,239 | |||||
Less: valuation allowance |
(4,912 | ) | (6,101 | ) | |||
| | | | | | | | |
Total deferred tax assets net of valuation allowance |
27,216 | 25,138 | |||||
Deferred tax liabilities: |
|||||||
Excess tax over book amortization |
5,708 | 2,938 | |||||
Tax basis in excess of financial basis of debentures |
3,844 | 5,024 | |||||
| | | | | | | | |
Total deferred tax liabilities |
9,552 | 7,962 | |||||
| | | | | | | | |
Net deferred tax assets |
$ | 17,664 | $ | 17,176 | |||
| | | | | | | | |
| | | | | | | | |
| | | | | | | | |
In general, a valuation allowance is recorded against deferred tax assets because CRA's management believes, after considering the available evidence, that it is more likely than not that the
FS-29
CRA INTERNATIONAL, INC.
NOTES TO CONSOLIDATED FINANCIAL STATEMENTS (Continued)
assets will not be realized. Reductions in valuation allowances are a result of management's consideration of historical profitability, future expected results and the nature of the related deferred tax assets.
The net change in the total valuation allowance for fiscal 2014 was a decrease of approximately $1.2 million compared to fiscal 2013. The $1.2 million decrease was primarily related to the recording of a $0.5 million deferred tax liability associated with acquisition-related intangibles, the utilization of $0.4 million net operating losses also as a result of the acquisition, as well as deferred tax changes that lowered the need for a valuation allowance by $0.2 million, offset partially by an additional valuation allowance recorded against certain foreign net operating losses of $0.1 million.
The ultimate realization of deferred tax assets that continue to be subject to valuation allowances is dependent upon the generation of future taxable income during the periods and in the tax jurisdictions in which those temporary differences become deductible.
At January 3, 2015 CRA had $9.9 million of foreign net operating loss carry forwards. The foreign operating losses have an indefinite life, except for $0.2 million that will begin to expire in fiscal 2016. NeuCo has net operating loss carryforwards for U.S. federal and U.S. state tax purposes of $10.4 million which are subject to a full valuation allowance and begin to expire in 2015. NeuCo files a separate U.S. federal tax return and none of its losses are available to offset CRA's consolidated taxable income.
The aggregate changes in the balances of gross unrecognized tax benefits were as follows (in thousands):
| |
January 3, 2015 |
December 28, 2013 |
|||||
|---|---|---|---|---|---|---|---|
Balance at beginning of period |
$ | 372 | $ | 3,032 | |||
Additions for tax positions taken during prior years |
127 | 372 | |||||
Additions for tax positions taken during the current year |
45 | — | |||||
Settlements with tax authorities |
(9 | ) | (3,032 | ) | |||
| | | | | | | | |
Balance at end of the period |
$ | 535 | $ | 372 | |||
| | | | | | | | |
| | | | | | | | |
| | | | | | | | |
CRA files income tax returns in the U.S. federal jurisdiction and various state and foreign jurisdictions. A number of years may elapse before an uncertain tax position, for which CRA has unrecognized tax benefits, is audited and finally resolved. While it is often difficult to predict the final outcome or the timing of resolution of any particular uncertain tax position, CRA believes that its unrecognized tax benefits reflect the most likely outcome. CRA adjusts these unrecognized tax benefits, and the associated interest, in light of changing facts and circumstances. At the end of fiscal 2014, CRA had $185,000 of interest accrued on its unrecognized tax benefit balance for a total unrecognized tax benefit balance on the balance sheet of $720,000. Of the total unrecognized tax benefit balance, $111,000 is offset by a future tax deduction when recognized. CRA reported $85,000 of interest and penalties related to unrecognized tax benefits in income tax expense during fiscal 2014 as compared to $67,000 during fiscal 2013. Settlement of any particular position could require the use of cash. Of the total $535,000 balance at the end of fiscal 2014, a favorable resolution would result in $467,000 being recognized as a reduction to the effective income tax rate in the period of resolution. It is reasonably likely that $162,000 of gross unrecognized tax benefits will reverse within the next twelve months.
The number of years with open tax audits varies depending on the tax jurisdiction. CRA's major taxing jurisdiction is the United States. CRA is no longer subject to U.S. federal examinations by the Internal Revenue Service for years before fiscal 2011. CRA's United Kingdom subsidiary's corporate tax returns are no longer subject to examination by Her Majesty's Revenue and Customs for fiscal years
FS-30
CRA INTERNATIONAL, INC.
NOTES TO CONSOLIDATED FINANCIAL STATEMENTS (Continued)
before fiscal 2013. CRA is currently under examination in Germany for fiscal 2008 through fiscal 2011 and in France for fiscal 2011 and fiscal 2012. CRA believes its reserves for uncertain tax positions are adequate.
CRA has not provided for deferred income taxes or foreign withholding taxes on undistributed earnings from its foreign subsidiaries of approximately $3.5 million as of January 3, 2015 because such earnings are considered to be indefinitely reinvested. CRA does not rely on these unremitted earnings as a source of funds for its domestic business as it expects to have sufficient cash flow in the U.S. to fund its U.S. operational and strategic needs. If CRA were to repatriate its foreign earnings that are indefinitely reinvested, it would accrue substantially no additional tax expense.
15. Related-Party Transactions
CRA made payments to shareholders of CRA who performed consulting services exclusively for CRA in the amounts of $10.2 million, $6.1 million, and $5.4 million in fiscal 2014, fiscal 2013, and fiscal 2012, respectively. These payments were to exclusive non-employee experts for consulting services performed for CRA's clients in the ordinary course of business.
16. Restructuring Charges
CRA did not incur any restructuring charges during fiscal 2014 and fiscal 2013.
During fiscal 2012, CRA incurred pre-tax restructuring expenses of $6.7 million, of which approximately $5.4 million was for termination benefits, facility-related charges, asset write-downs and other charges in connection with the plan committed to by CRA's management during the third quarter of fiscal 2012 to eliminate and restructure selected practice areas and reduce selling, general and administrative costs. In connection with this plan, CRA eliminated its Chemicals practice and closed its Middle East operations. These restructuring actions, along with the repositioning of other select underperforming practice areas, resulted in the reduction of more than 60 consulting positions. Commensurate with these consulting staff reductions, CRA also took significant actions to lower its selling, general and administrative costs by reducing CRA's administrative staff, eliminating excess office space capacity, better rationalizing remaining office space, and lowering administrative spending, particularly related to outside contractors and professional fees. These restructuring actions were designed to intensify the focus of CRA's portfolio, increase the cohesiveness of its services and improve its margins and profitability. The majority of these actions occurred during the third quarter of fiscal 2012, and the remainder was completed during the fourth quarter of fiscal 2012.
Additionally, during fiscal 2012, CRA entered into an agreement with the landlord of its London, England office to surrender the lease of one of the three floors it leased in the office building in London. Under this agreement, CRA surrendered its lease of this floor on June 30, 2012, instead of on the lease's original termination date of October 2, 2016, and paid the landlord approximately $1.2 million in connection with the surrender. In connection with this surrender, CRA incurred pre-tax restructuring charges of $1.7 million, which included the $1.2 million surrender charge and approximately $0.5 million of fixed asset write-offs and other charges or offsets. During fiscal 2012, CRA also recorded pre-tax restructuring credits of approximately $0.4 million related primarily to adjustments to its leased office space in Houston, TX and Chicago, IL. Of the $6.7 million of restructuring charges recorded during fiscal 2012, approximately $3.8 million was charged to cost of sales, $1.5 million was charged to selling, general and administrative expenses, and $1.4 million was charged to depreciation and amortization expense.
FS-31
CRA INTERNATIONAL, INC.
NOTES TO CONSOLIDATED FINANCIAL STATEMENTS (Continued)
The restructuring expenses and reserve balance are as follows as of January 3, 2015 and December 28, 2013 (in thousands):
| |
Office Vacancies |
Employee Workforce Reduction |
Total Restructuring |
|||||||
|---|---|---|---|---|---|---|---|---|---|---|
Balance at December 29, 2012 |
$ | 2,106 | $ | 873 | $ | 2,979 | ||||
Amounts paid, net of amounts received, during fiscal 2013 |
(759 | ) | (729 | ) | (1,488 | ) | ||||
Non-cash adjustments and effect of foreign currency translation during fiscal 2013 |
(177 | ) | (144 | ) | (321 | ) | ||||
| | | | | | | | | | | |
Balance at December 28, 2013 |
$ | 1,170 | $ | — | $ | 1,170 | ||||
Amounts paid, net of amounts received, during fiscal 2014 |
(750 | ) | — | (750 | ) | |||||
Non-cash adjustments and effect of foreign currency translation during fiscal 2014 |
42 | — | 42 | |||||||
| | | | | | | | | | | |
Balance at January 3, 2015 |
$ | 462 | $ | — | $ | 462 | ||||
| | | | | | | | | | | |
| | | | | | | | | | | |
| | | | | | | | | | | |
The $0.5 million restructuring liability as of January 3, 2015 is expected to be paid through the third quarter of fiscal 2015 and was classified in "current portion of deferred rent" on the accompanying balance sheet as of January 3, 2015.
17. Quarterly Financial Data (Unaudited)
| |
Quarter Ended | ||||||||||||
|---|---|---|---|---|---|---|---|---|---|---|---|---|---|
| |
March 29, 2014 |
June 28, 2014 |
September 27, 2014 |
January 3, 2015 |
|||||||||
| |
(In thousands, except per share data) |
||||||||||||
Revenues |
$ | 76,245 | $ | 78,184 | $ | 73,483 | $ | 78,459 | |||||
Gross profit |
24,379 | 25,515 | 24,066 | 25,598 | |||||||||
Income from operations |
5,629 | 6,493 | 5,795 | 6,124 | |||||||||
Income before provision for income taxes |
5,384 | 6,334 | 5,575 | 6,022 | |||||||||
Net income |
3,308 | 3,167 | 3,189 | 3,743 | |||||||||
Net loss attributable to noncontrolling interest, net of tax |
102 | 21 | 35 | 73 | |||||||||
Net income attributable to CRA International, Inc. |
$ | 3,410 | $ | 3,188 | $ | 3,224 | 3,816 | ||||||
Basic net income per share |
$ | 0.34 | $ | 0.32 | $ | 0.33 | $ | 0.41 | |||||
Diluted net income per share |
$ | 0.34 | $ | 0.32 | $ | 0.33 | $ | 0.40 | |||||
Weighted average number of shares outstanding: |
|||||||||||||
Basic |
10,029 | 9,919 | 9,729 | 9,344 | |||||||||
Diluted |
10,108 | 10,026 | 9,919 | 9,560 | |||||||||
FS-32
CRA INTERNATIONAL, INC.
NOTES TO CONSOLIDATED FINANCIAL STATEMENTS (Continued)
| |
Quarter Ended | ||||||||||||
|---|---|---|---|---|---|---|---|---|---|---|---|---|---|
| |
March 30, 2013 |
June 29, 2013 |
September 28, 2013 |
December 28, 2013 |
|||||||||
| |
(In thousands, except per share data) |
||||||||||||
Revenues |
$ | 63,130 | $ | 65,203 | $ | 74,427 | $ | 75,672 | |||||
Gross profit |
21,115 | 20,161 | 23,850 | 24,044 | |||||||||
Income (loss) from operations |
3,774 | 3,170 | 6,114 | 5,459 | |||||||||
Income (loss) before (provision) benefit for income taxes |
3,377 | 3,368 | 5,952 | 5,221 | |||||||||
Net income (loss) |
2,835 | 1,351 | 3,333 | 3,716 | |||||||||
Net (income) loss attributable to noncontrolling interest, net of tax |
134 | 58 | (63 | ) | 6 | ||||||||
Net income (loss) attributable to CRA International, Inc. |
2,969 | 1,409 | 3,270 | 3,722 | |||||||||
Basic net income (loss) per share |
$ | 0.30 | $ | 0.14 | $ | 0.32 | $ | 0.37 | |||||
Diluted net income (loss) per share |
$ | 0.29 | $ | 0.14 | $ | 0.32 | $ | 0.37 | |||||
Weighted average number of shares outstanding: |
|||||||||||||
Basic |
9,994 | 10,100 | 10,093 | 10,071 | |||||||||
Diluted |
10,084 | 10,188 | 10,192 | 10,148 | |||||||||
Earnings per share is calculated for each period, and the sum of the four quarters may not equal the full year amount.
During the second quarter of fiscal 2014, CRA identified a prior period error, which was related to the valuation of deferred tax assets in CRA's previously issued consolidated financial statements, and recorded a non-cash tax expense of approximately $0.8 million to correct this error. CRA concluded that this error was not material to its prior reporting periods.
18. Subsequent Event
On February 24, 2015, CRA entered into an amendment to its lease with BP Hancock LLC for the office space it rents in the building at 200 Clarendon Street, Boston, Massachusetts. Under this amendment, CRA will lease an additional 10,057 square feet of office space on the twenty-fifth floor of this building, at an annual rate (excluding customary operating costs and expenses) of $49 per square foot, for a term beginning on June 15, 2015 (or, if later, when landlord completes certain improvements to the space) and ending on June 30, 2020, with the option to extend this term for an additional three-year period.
FS-33