Attached files
| file | filename |
|---|---|
| 8-K - 8-K - Axalta Coating Systems Ltd. | d890100d8k.htm |
Exhibit 99.1
On February 1, 2013, Axalta Coating Systems Ltd. (“ACS”) acquired from E. I. du Pont de Nemours and Company (“DuPont”) all of the capital stock, other equity interests and assets of certain entities that, together with their subsidiaries, comprised the DuPont Performance Coatings business (“DPC”), which is referred to herein as the “Acquisition.” Following the Acquisition, we renamed our business Axalta Coating Systems (“Axalta”). References herein to the “Company,” “we,” “us,” “our” and “our company” refer to ACS and its consolidated subsidiaries. References herein to “fiscal year” refer to our fiscal years, which end on December 31. References herein to the financial measures “EBITDA” and “Adjusted EBITDA” refer to financial measures that do not comply with generally accepted accounting principles in the United States (“U.S. GAAP”).
Our Company
We are a leading global manufacturer, marketer and distributor of high performance coatings systems. We generate approximately 90% of our revenue in markets where we hold the #1 or #2 global market position, including the #1 position in our core automotive refinish end-market with approximately a 25% global market share. We have a nearly 150-year heritage in the coatings industry and are known for manufacturing high-quality products with well-recognized brands supported by market-leading technology and customer service. Over the course of our history we have remained at the forefront of our industry by continually developing innovative coatings technologies designed to enhance the performance and appearance of our customers’ products, while improving their productivity and profitability.
Our diverse global footprint of 35 manufacturing facilities, 7 technology centers, 45 customer training centers and approximately 12,600 employees allows us to meet the needs of customers in over 130 countries. We serve our customer base through an extensive sales force and technical support organization, as well as through over 4,000 independent, locally-based distributors. Our scale and strong local presence are critical to our success, allowing us to leverage our technology portfolio and customer relationships globally while meeting customer demands locally.
For the year ended December 31, 2014, our net sales were $4,362 million, Adjusted EBITDA was $841 million, or 19.3% of net sales, and net income was $35 million. We have renewed the organization’s focus on profitable growth, achieving year-over-year Adjusted EBITDA growth for each of the seven full quarters following the Acquisition. Additionally, we have undertaken several transformational initiatives that we believe have laid the foundation for future growth, resulting in significant new business wins, many of which we expect to contribute to sales beginning in 2015. We have also begun implementing several EBITDA enhancement initiatives that we believe will drive meaningful earnings growth over the next several years. As of December 31, 2014, we had cash and cash equivalents of $382 million and outstanding indebtedness of $3,696 million, which may limit the availability of financial resources to pursue our growth initiatives.
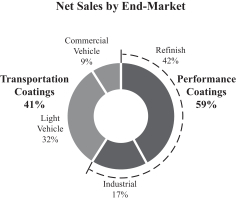
Our business is organized into two segments, Performance Coatings and Transportation Coatings, serving four end-markets globally as highlighted below:
|
|
1
Performance Coatings
Through our Performance Coatings segment, we provide high-quality liquid and powder coatings solutions to a fragmented and local customer base. We are one of only a few suppliers with the technology to provide precise color matching and highly durable coatings systems. The end-markets within this segment are refinish and industrial as described below.
Refinish End-Market (#1 global market position): We provide waterborne and solventborne coatings to approximately 80,000 independent body shops, dealers and multi-shop operators (“MSOs”) to facilitate high-quality, efficient automotive collision repairs. Our advanced color matching technology and library of over four million color variations comprise an advanced color system that enables body shops to refinish vehicles regardless of vehicle brand, color, age, or original paint supplier.
Industrial End-Market: We provide a wide range of liquid and powder coatings to customers who use them in diverse applications, including industrial machinery, electrical insulation, automotive components, architectural cladding and fittings, appliances, outdoor furniture and oil & gas pipelines. Our coatings are often used under severe operating conditions and require high performance such as high mechanical resistance, corrosion protection, elasticity and colorfastness.
Transportation Coatings
Through our Transportation Coatings segment, we provide advanced coatings technologies to original equipment manufacturers (“OEMs”) of light and commercial vehicles. These increasingly global customers require a high level of technical support coupled with cost-effective, environmentally responsible coatings systems that can be applied with a high degree of precision, consistency and speed.
Light Vehicle End-Market (#2 global market position): We provide light vehicle OEMs and Tier 1 component suppliers a full range of waterborne and solventborne coatings systems that are a critical, integrated step in the vehicle assembly process. We compete and win new business on the basis of our quality, service and proprietary products that generate significant energy and cost savings for our customers while enhancing productivity and first pass quality. Our global capabilities and focus on technology enable us to provide our global customers with next-generation offerings to enhance appearance, durability and corrosion protection and comply with increasingly strict environmental regulations.
Commercial Vehicle End-Market: We provide liquid coatings to commercial vehicle OEMs, including those in the heavy duty truck (“HDT”), bus, rail and agricultural and construction equipment (“ACE”) markets, as well as related markets such as trailers, recreational vehicles and personal sport vehicles. As the #1 global supplier in both the HDT and bus markets, we meet the demands of our customers with an extensive offering of over 70,000 colors.
Transformational Initiatives
Since the Acquisition, we have migrated from a business segment of DuPont to an independent global company exclusively focused on coatings. We have completed the separation from DuPont and implemented several initiatives designed to unlock our business’s full potential, including:
| • | Enhanced Senior Leadership Team: We have augmented our management team with world-class talent and significant end-market expertise, with 13 of our 17 most senior managers joining since the Acquisition, including our CEO and CFO. We have also recruited key regional and local managers with both operational and commercial leadership experience. |
| • | Implemented New Customer Strategies: We have realigned our resources to more effectively meet the varying demands of our customers. In end-markets characterized by large global customers such as light and commercial vehicle OEMs, we transitioned from a regional to a global management and sales model. In the refinish end-market, we have reorganized our sales force to target and meet the needs of additional customers in high-growth areas of the market. |
| • | Aligned Incentives: We have implemented a performance-based compensation structure that closely aligns the interests of our global leadership team with those of our shareholders. We have also transitioned to a more incentive-based compensation structure for our global sales force designed to increase their focus on profitable growth. |
2
| • | Investing for Growth: As an independent company, we are able to focus our time and capital exclusively on coatings. As a result, we are pursuing investments with attractive returns such as low-risk capacity expansion projects in China, Germany, Mexico and Brazil that will position us to grow with our customers. We are also investing in operational improvement initiatives such as the realignment of our European manufacturing operations, a global commercial and comprehensive cost improvement initiative, as well as growing our sales force in emerging markets and end-markets where we are currently underrepresented. |
Our Industry
In 2013, we were the fourth largest supplier in the $127 billion global coatings industry as measured by sales, according to Orr & Boss. The global coatings industry is characterized by multiple end-markets and applications. Market participants include a few global coatings suppliers and many smaller, regionally focused suppliers that maintain a presence in select product categories and local markets.
Within the broad global coatings market, we focus on the automotive refinish, light vehicle, commercial vehicle and industrial end-markets, which Orr & Boss estimates to collectively represent $37 billion of annual sales. The chart below illustrates the composition of the global coatings industry by application and indicates the end-markets in which we participate:
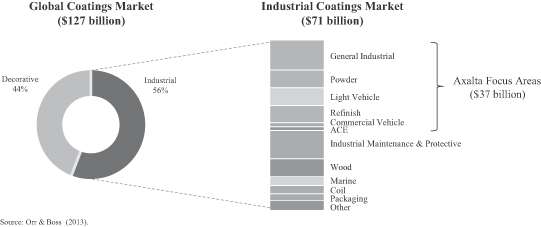
We operate in attractive end-markets, with the top four suppliers collectively holding an estimated 67% market share in the automotive refinish end-market and 74% market share in the light vehicle end-market. This structure is a result of few suppliers having the technological capabilities, global manufacturing footprint, efficient supply chain and overall scale to meet customer needs. These characteristics allow global coatings providers to serve customers locally while continuing to leverage global innovation, product platforms, relationships and best practices.
The refinish, industrial, light vehicle and commercial vehicle end-markets are collectively expected to grow at a compound annual growth rate (“CAGR”) of 5.8%, or $12.2 billion, from 2013 to 2018, according to Orr & Boss. This growth is due to specific end-market drivers as well as key industry trends, which favor large multi-national suppliers, including:
| • | Increasingly stringent environmental regulations: Evolving regulations in all major geographies have placed limits on the emission of volatile organic compounds (“VOCs”) and hazardous air pollutants (“HAPs”). As a result, customers are shifting toward regulation-compliant, low-VOC solventborne and waterborne coatings. Few coatings suppliers have the technology and products to meet these increasingly stringent requirements. |
| • | Global procurement model: Multi-national light vehicle OEMs are increasingly utilizing global procurement teams to stipulate product specifications and color standardization requirements, which are implemented at the local level. These customers select coatings providers on the basis of their ability to consistently deliver advanced technological solutions on a global basis. |
| • | Increased efficiency: Customers are encouraging coatings manufacturers to invest in new product offerings that require fewer application steps, resulting in lower capital and energy costs. |
3
| • | Vehicle light-weighting: With more stringent vehicle emissions and fuel consumption regulations, light vehicle OEMs are focused on reducing vehicle weight to improve fuel economy. This is driving the need for new, and frequently multiple, substrates on the exterior of the vehicle. Historically, OEMs have manufactured vehicles primarily with steel components but are now increasingly incorporating other materials, including aluminum, carbon fiber and plastics. These materials often require specialized primers and low-temperature curing formulations to achieve uniform appearance, color and finish. |
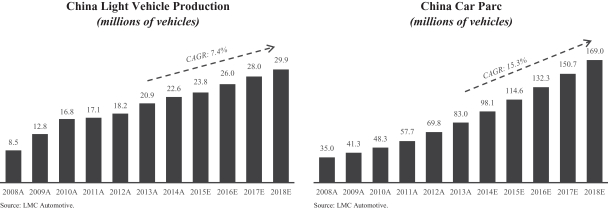
| • | Emerging market growth: Emerging market demand in our end-markets is expected to grow at a CAGR of approximately 8.4% from 2013 to 2018, according to Orr & Boss. This is primarily due to increased government infrastructure spending and increased middle class consumption, which will increase the car parc (the number of vehicles in use). As per-capita wealth expands, consumers are also demanding higher-quality products, driving demand for more advanced coatings systems in these markets. |
Performance Coatings
Refinish
The refinish end-market represented an estimated $7.3 billion in 2013 global sales, according to Orr & Boss. Sales in this end-market are driven by the number of vehicle collisions and owners’ propensity to repair their vehicles. The number of vehicle collisions in a given market is primarily determined by the size of the car parc and the aggregate number of miles driven in that market. The global automotive refinish end-market is expected to grow at a CAGR of approximately 4.3% from 2013 to 2018, with emerging markets expected to grow at a CAGR of approximately 7.7% over the same period, according to Orr & Boss.
Refinish products are critical to vehicle appearance and customer satisfaction but typically represent a small percentage of the overall cost of repair. As a result, body repair shop operators are most focused on coatings brands with a strong track record of performance and reliability. Such brands offer exact color matching technologies, productivity enhancements, regulatory compliance, consistent quality and ongoing technical support in order to facilitate timely repairs that restore a damaged vehicle’s appearance to its original condition.
Industrial
The industrial end-market represented an estimated $19.7 billion in 2013 global sales and is forecasted to grow at a CAGR of approximately 6.8% from 2013 to 2018, according to Orr & Boss. This end-market is comprised of liquid and powder coatings with demand driven by a wide variety of macroeconomic factors, such as growth in GDP and industrial production. Customers select industrial coatings based on protection, durability and appearance.
Transportation Coatings
Light Vehicle
The light vehicle end-market represented an estimated $7.3 billion in 2013 global sales and is expected to grow at a CAGR of approximately 4.9% from 2013 to 2018, according to Orr & Boss. Sales in this end-market are driven by new vehicle production, which is expected to grow in both the developed markets and the emerging markets. Light vehicle production growth is expected to be highest in emerging markets where OEMs plan to open 68 new assembly plants between 2014 and 2017.
Light vehicle OEMs select coatings providers on the basis of their global ability to deliver advanced technological solutions that improve exterior appearance and durability and provide long-term corrosion protection. Customers also look for suppliers that can enhance process efficiency to reduce overall manufacturing costs and provide on-site technical support. Rigorous environmental and durability testing as well as engineering approvals are also key criteria used by global light vehicle OEMs when selecting coatings providers.
4
Commercial Vehicle
The commercial vehicle end-market represented an estimated $3.3 billion in 2013 global sales and is expected to grow at a CAGR of approximately 4.8% from 2013 to 2018, according to Orr & Boss. Sales in this end-market are generated from a variety of applications including non-automotive transportation (e.g., HDT, bus and rail) and ACE as well as related markets such as trailers, recreational vehicles and personal sport vehicles. This end-market is primarily driven by global commercial vehicle production, which is influenced by overall economic activity, government infrastructure spending, equipment replacement cycles and evolving environmental standards.
Commercial vehicle OEMs select coatings providers on the basis of their ability to consistently deliver advanced technological solutions that improve exterior appearance, protection and durability and provide extensive color libraries and matching capabilities at the lowest total cost-in-use, while meeting stringent environmental requirements.
Our Competitive Strengths
Leading positions in attractive end-markets
We are a global leader in manufacturing, marketing and distributing advanced coatings systems with approximately 90% of our revenue generated in markets where we hold the #1 or #2 global market position. We are one of only a small number of global coatings suppliers in each of our end-markets, which positions us favorably in an industry where global scale is a competitive advantage.
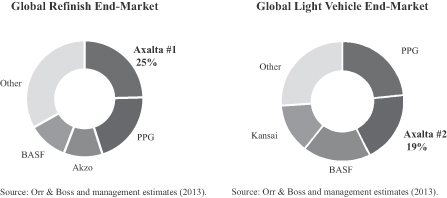
Market-leading refinish business driven by recurring aftermarket sales: We are the leading coatings supplier to the global automotive refinish end-market where we hold an estimated 25% share and the top four global suppliers hold an estimated 67% share. This end-market has consistently grown across economic cycles as the overall rate of collisions and repairs are not highly cyclical. Our refinish products offer quality, durability and superior color technology supported by a large color formula library that enables customers to precisely match colors. We supply our fragmented customer base of approximately 80,000 body shops through a global network of over 4,000 independent local distributors. Furthermore, body shops utilize our color matching system, inventory replacement process and training capabilities, which foster brand loyalty and have historically resulted in a high customer retention rate.
Well positioned in light vehicle end-market poised for growth: We are the second largest coatings provider to the global light vehicle end-market, which is expected to grow at a CAGR of approximately 4.9% from 2013 to 2018, according to Orr & Boss. In this end-market, the top four suppliers hold an estimated 74% share. We have developed a full complement of unique consolidated coating systems. These integrated solutions include our “Eco-Concept,” “3-Wet” and “2-Wet Monocoat” products that provide our customers with advanced, environmentally responsible systems that eliminate either a coatings layer or steps in the coatings process, thereby increasing productivity and reducing energy costs. In addition, we offer our customers on-site technical services as well as “just-in-time” product delivery. We are an integrated part of our customers’ assembly lines, which allows our technical support teams to improve operating efficiency and provide real-time performance feedback to our formulating chemists and manufacturing teams. We have been awarded new business in over 30 OEM plants globally since the beginning of 2013, demonstrating the strength of our competitive positioning. We expect to recognize sales from the majority of these new contracts in 2015, although we cannot provide any assurance regarding the amount of revenue or profit our new business awards will generate in the future.
5
Sustainable competitive advantages driven by global scale, established brands and technology
We believe we are one of only a few coatings providers that have the scale, manufacturing capabilities, brand reputation and technology to meet the purchasing criteria that are most critical to our customers on a global basis.
Our extensive manufacturing and distribution networks as well as our high-caliber technical capabilities enable us to meet customers’ volume and service requirements without interruption. Our global footprint also enables us to react quickly to changing local dynamics while leveraging our overall scale to cost-effectively develop and deliver leading edge technologies and solutions. In refinish, our scale gives us the ability to convert a large number of body shops to our systems in a short period of time, which has been a key competitive advantage in the growing North American MSO segment. Additionally, our scale and technical abilities enable us to meet the needs of our multi-national light vehicle customers, who increasingly require dedicated global account teams and high-quality, advanced coatings systems that can be applied consistently to global vehicle platforms.
Branding is another key factor that customers consider when choosing a coatings provider. Customers typically look to established brands when making their purchase decisions in our refinish, industrial and commercial vehicle end-markets. We have an extensive portfolio of established brands that leverage our advanced technology and a nearly 150-year heritage including our flagship global brand families of Cromax, Standox, Spies Hecker and Imron liquid products, our Alesta and Nap-Gard powder products and our Voltatex electrical insulation coatings.
Our technology is also a key competitive advantage. Our technology portfolio includes over 1,700 patents issued or pending and includes key assets such as our extensive color database and color matching technology, advanced multi-substrate formulations, process technology and VOC-compliant products. We also benefit from technology synergies across our end-markets. The colors, coatings properties and multi-substrate formulations we develop as a light vehicle coatings manufacturer help us sustain our leading refinish market position as we leverage insights from new light vehicle coatings to help develop innovative refinish coatings in the future.
Diverse revenue base
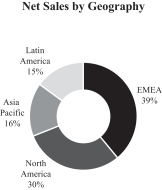
We generate our revenue from diverse end-markets, customers and geographies, which has historically reduced the financial impact of any single end-market, customer or region and limited the impact of economic cycles. Net sales in our end-markets of refinish, light vehicle, industrial and commercial vehicle represented 42%, 32%, 17% and 9% of net sales during the year ended December 31, 2014, respectively. We also serve a globally diverse and highly fragmented customer base, with no single customer representing more than 7.7% of our net sales and our top ten customers representing approximately 32% of our net sales during the year ended December 31, 2014. The percentage of our net sales generated by our top customers, however, may increase as we grow our sales to the light vehicle end-market. Additionally, we generated approximately 39% of our net sales in EMEA, 30% in North America, 16% in Asia Pacific and 15% in Latin America during the year ended December 31, 2014.
Strong financial performance and cash flow characteristics
We have an attractive financial profile with gross margins of 34.3% and Adjusted EBITDA margins of 19.3% for the year ended December 31, 2014.
6
The refinish end-market serves as the foundation of our financial profile, representing 42% of our consolidated net sales for the year ended December 31, 2014. Our track record of consistent price increases driving strong Adjusted EBITDA performance and low levels of maintenance capital expenditures has allowed us to consistently generate strong cash flows that we are re-investing in the business to position us for future earnings growth.
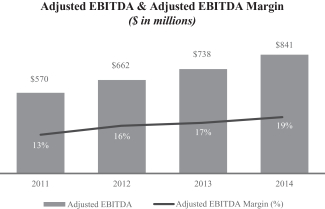
We have generated year-over-year Adjusted EBITDA growth for each of the seven full quarters since the Acquisition, driven in part by the initial impact of our transformational growth initiatives. In addition, we have implemented numerous initiatives intended to reduce our fixed and variable costs and improve working capital productivity. We believe that these initiatives will continue to generate significant cost savings in the future, although we cannot provide any assurance regarding the amount of cost savings these initiatives will generate. Many are in their early stages of implementation and have only recently begun to contribute to our financial results.
Experienced management team
We have augmented our management team with world-class talent and meaningful end-market expertise, with 13 of our 17 most senior managers joining since the Acquisition. This team has added new and diverse perspectives to the business from a range of industries. Our management team is led by our CEO, Charlie Shaver, who has over 34 years of chemical and global operating experience, including most recently President and CEO of TPC Group. He is supported by a senior management team comprised of global, regional and country focused leaders with diverse backgrounds and skill sets. The management team has extensive international experience with a strong track record of improving operations and executing strategic growth initiatives, including mergers and acquisitions.
Our Business Strategy
Pursue and execute new business wins in high-growth areas of our end-markets
We have aligned our resources to better serve the high-growth areas of our refinish and light vehicle end-markets. In the North American refinish end-market, we have created dedicated sales, conversion and service teams to serve MSOs, which are gaining share in the North American collision repair market by reducing insurance company costs and providing consistently high customer satisfaction. Through new business wins with MSO customers, we have become a leading coatings provider to the North American MSO market, which we expect to grow from 14% of the North American collision repair market in 2012 to 24% by 2017. We are targeting growth opportunities with both existing MSO and new MSO accounts and believe that we are well positioned to gain additional market share as a result of our dedicated account teams, high productivity offerings and broad distribution network.
We have been awarded new business in over 30 OEM plants globally since the beginning of 2013, with 16 of these plants located in China, where OEMs are rapidly expanding production to meet increasing demand for new vehicles. We expect that many of these new contracts will begin generating sales in 2015. Our success in this end-market has been driven by a new leadership team that has restructured our organization to mirror the increasingly global focus of OEMs. We will continue to pursue new business by leveraging our proprietary manufacturing processes, our broad range of VOC-compliant coatings and our substantial sales and technical support organizations.
7
Accelerate growth in emerging markets
We have a strong presence in emerging markets, which generated 25% of our sales during the year ended December 31, 2014. These markets are characterized by increasing levels of vehicle production, a growing car parc, an expanding middle class and GDP growth above the global average, all of which drive greater demand for coatings. We believe that we are well positioned to capitalize on this increasing demand with local manufacturing facilities and extensive sales and technical service teams dedicated to these markets. In China, where we have operated a wholly owned business for 30 years, we are expanding our sales force and have invested in new plant capacity, including a $50 million waterborne capacity expansion at our Jiading facility, which came on line in March 2015. We are also in the process of expanding our production capacity in Mexico and Brazil to drive future earnings growth.
Globalize existing product lines
Since the Acquisition, we have identified significant opportunities to leverage our existing products across geographies. For example, we are the market leader in the North American HDT market, but only recently began serving the Chinese market, which produces nearly four times the number of heavy duty trucks produced in the United States. This initiative has generated early positive results; for example, in 2014 we began serving Foton Daimler, one of the largest truck manufacturers in the region, with our high performance waterborne coatings. In refinish, we are leveraging legacy formulations from developed markets to satisfy growing mainstream demand in emerging markets. We also intend to pursue similar geographic opportunities with several of our other industrial and commercial vehicle product offerings.
Invest in high-return projects to drive earnings growth
We are in the early stages of implementing several initiatives that we believe will continue to generate significant earnings growth, including establishing a global procurement organization, executing improvement programs we have named “Fit-For Growth” and “The Axalta Way” and investing capital in growth projects with high expected returns. Since the Acquisition, we have built a global procurement organization, which is executing several programs to reduce costs by streamlining inputs, reducing the number of sole-sourced raw materials and partnering with new, high-quality suppliers to meet our purchasing needs. These purchasing programs are in their early stages and we believe they will continue to generate significant earnings growth over the next several years. Our Fit-For-Growth improvement initiative is focused in Europe, where we are investing to upgrade, automate and re-align disparate manufacturing operations to bring the region’s cost structure in line with the rest of the world and better position us to meet increasing local demand. We believe that Fit-For-Growth, which we began in 2014, will generate approximately $100 million of incremental Adjusted EBITDA by 2017 on a run-rate basis, of which we have already realized approximately $37 million. Our recently announced Axalta Way program, which will commence in 2015, is a global initiative focused on commercial alignment and cost reduction that we believe will generate an incremental $100 million of Adjusted EBITDA by the end of 2017 on a run-rate basis. Finally, we believe we have significant opportunities to pursue high return projects identified since the Acquisition. These include capacity expansion projects in China, Germany, Mexico and Brazil and productivity initiatives from which we expect to benefit over the next several years.
8
Maintain and further develop technology leadership
We will continue to build on our nearly 150-year heritage of developing market-leading technology. We leverage our intimate customer relationship and network of customer training centers to align product innovation with customer needs. For example, in the North American refinish end-market we have recently launched Cromax Mosaic, a new VOC-compliant solventborne coatings line, to complement our broad waterborne coatings portfolio. Body shops have embraced this product, which enables them to meet environmental regulations while using existing application equipment and techniques. We have a robust pipeline of over 100 new product innovations, the majority of which we intend to launch over the next two years, including several products focused on emerging markets. Similarly in the light vehicle end-market, our proprietary 3-Wet, Eco-Concept, 2-Wet monocoat systems and high throw electrocoat products have generated new customer wins as OEMs seek to increase efficiency and reduce costs. We believe this commitment to new product development will help us maintain our technology leadership and strong market position.
Capital Expenditures
Capital expenditures for 2015 are expected to be approximately $150 million, of which approximately $60 million will be related to maintenance capital expenditures and the remainder consists of growth and transition-related capital expenditures. The key growth projects include the following:
| • | In May 2013, we announced that we will expand our existing facility in Jiading, China to manufacture and supply paint to automobile manufacturers that are expanding into south and central China. We began expansion of the facility with production having begun earlier this year. |
| • | In February 2014, we began the next phase of construction to significantly expand our waterborne production capacity in Guarulhos, Brazil. The additional facility will more than double capacity, which will help meet the growing demands of the OEMs in South America where increases in the car parcs are forecast to continue. The additional production is expected to come on line in 2015. |
| • | In February 2014, we announced a commitment to build a next-generation facility that will expand capacity to provide waterborne industrial coatings within Wuppertal, Germany. Production at the new operations center is expected to begin in the third quarter of 2015. |
For years ending December 31, 2014, 2013 and 2012, our maintenance capital expenditures were approximately $60 million and our growth-related capital expenditures have ranged from approximately $10 million to $55 million. Capital expenditures during the 2014 fiscal year totaled approximately $188 million, which included approximately $75 million of transition-related capital expenditures.
9
COMPENSATION DISCUSSION AND ANALYSIS
Executive Summary
This Compensation Discussion and Analysis provides an overview and analysis of (i) the elements of our compensation program for our named executive officers identified below, (ii) the material compensation decisions made under that program and reflected in the executive compensation tables that follow this Compensation Discussion and Analysis and (iii) the material factors considered in making those decisions. As a company dedicated to a pay-for-performance culture, we intend to provide our named executive officers with compensation that is significantly performance based. Our executive compensation program is designed to: align executive pay with our performance on both short- and long-term bases; link executive pay to specific, measurable results intended to create value for shareholders; and utilize compensation as a tool to assist us in attracting and retaining the high-caliber executives that we believe are critical to our long-term success.
Compensation for our named executive officers consists primarily of the elements, and their corresponding objectives, identified in the following table.
| Compensation Element |
Primary Objective | |
| Base salary |
To recognize performance of job responsibilities and to attract and retain individuals with superior talent. | |
| Axalta Bonus Plan (annual non-equity incentive compensation, “ABP”) |
To promote our near-term performance objectives across our workforce and reward individual contributions to the achievement of those objectives. ABP awards for 2014 are shown in the Summary Compensation Table below under the heading “Non-Equity Incentive Plan Compensation.” | |
| Discretionary long-term equity incentive awards |
To emphasize our long-term performance objectives, encourage the maximization of shareholder value and retain key executives by providing an opportunity to participate in the ownership of our common shares. | |
| Retirement savings (401(k)) and nonqualified deferred compensation |
To provide an opportunity for tax-efficient savings and long-term financial security. | |
| Severance and change in control benefits |
To encourage the continued attention and dedication of key individuals when considering strategic alternatives. | |
| Other elements of compensation and perquisites |
To attract and retain talented executives in a cost-efficient manner by providing benefits with high perceived values at relatively low cost to us. | |
To serve the foregoing objectives, our overall compensation program is generally designed to be adaptive rather than purely formulaic. Our compensation committee has primary authority to determine and approve compensation decisions with respect to our named executive officers. For 2014, compensation for our named executive officers reflected the dynamics of the markets in which we compete for executive talent, as each of our named executive officers commenced service with us upon, or in some cases shortly following, the Acquisition in 2013. As a result, the 2014 compensation of our named executive officers (“NEOs”) was largely a function of recent arm’s-length negotiations with each NEO prior to his commencement of service with us.
For the year ended December 31, 2014, our NEOs are:
| • | Charles W. Shaver, Chairman and Chief Executive Officer; |
| • | Robert W. Bryant, Executive Vice President and Chief Financial Officer; |
| • | Steven R. Markevich, Senior Vice President and President, OEM; |
10
| • | Joseph F. McDougall, Senior Vice President and Chief Human Resources Officer; and |
| • | Michael F. Finn, Senior Vice President, General Counsel and Corporate Secretary. |
Our compensation decisions for the NEOs in 2014 are discussed below in relation to each of the above-described elements of our compensation program. The below discussion is intended to be read in conjunction with the executive compensation tables and related disclosures that follow this Compensation Discussion and Analysis.
Compensation Overview
Our overall compensation program is structured to attract, motivate and retain highly qualified executives by paying them competitively, consistent with our success and their contribution to that success. We believe compensation should be structured to ensure that a portion of an executive’s compensation opportunity will be related to factors that directly and indirectly influence shareholder value. Accordingly, we set goals designed to link each NEO’s compensation to our performance and the NEO’s own performance. Consistent with our performance-based philosophy, we pay our NEOs a compensation package which is predominantly performance based, including variable ABP awards based on our financial and operational performance and premium priced stock option awards. This performance-based compensation is intended to align our NEOs’ interests with our long-term performance and the interests of our shareholders.
Total compensation for our NEOs has been allocated between cash and equity compensation, taking into consideration the balance between providing short-term incentives and long-term investment in our financial performance, to align the interests of management with the interests of shareholders. The variable ABP awards and the equity awards are designed to ensure that total compensation reflects our overall success or failure and to motivate the NEOs to meet appropriate performance measures tied to maximizing total return to shareholders.
Determination of Compensation Awards
The compensation committee is provided with the primary authority to determine and approve the compensation paid to our NEOs. The compensation committee is charged with, among other things, reviewing compensation policies and practices to ensure (i) adherence to our compensation philosophies and (ii) that the total compensation paid to our NEOs is fair, reasonable and competitive, taking into account our position within our industry, including our comparative performance, and our NEOs’ level of expertise and experience in their respective positions. In furtherance of the considerations described above, the compensation committee is primarily responsible for (i) determining any future adjustments to base salary and target ABP levels (representing the non-equity incentive compensation that may be awarded expressed as a percentage of base salary or as a dollar amount for the year), (ii) assessing the performance of the Chief Executive Officer and other NEOs for each applicable performance period and (iii) determining the awards to be paid to our Chief Executive Officer and other NEOs under the ABP for each year. To aid the compensation committee in making its determinations, the Chief Executive Officer provides recommendations to the compensation committee regarding the compensation of all NEOs, excluding himself. The compensation committee annually reviews the performance and compensation of our senior executive management team.
In determining compensation levels for our NEOs, the compensation committee considers each NEO’s particular position and responsibility and relied upon the judgment and industry experience of the members of our board of directors, including their knowledge of competitive compensation levels in our industry. We believe that base salaries should be competitive with salaries for executive officers in similar positions and with similar responsibilities in our marketplace. However, in making compensation determinations for 2014, we did not rely on benchmarking or compensation consultants, did not directly compare compensation levels with any other companies, and did not refer to any specific compensation survey or other data. Rather, in alignment with the considerations described above, we determined the total amount of compensation for our NEOs, and the allocation of total compensation among each of our three main components of compensation, in reliance upon the
11
judgment and general industry knowledge of the members of our board of directors obtained through years of service with comparably-sized companies in our industry and other similar industries to ensure we attract, develop and retain superior talent.
Stock Ownership Requirements
To directly align the interests of our NEOs with us and our shareholders, our compensation committee has adopted stock ownership guidelines. The guidelines require that, within five years after our initial public offering, the Chief Executive Officer must directly or indirectly own an amount of our common shares equal to five times the Chief Executive Officer’s base salary, and the Chief Executive Officer’s executive and senior vice president direct reports must directly or indirectly own an amount of our common shares equal to two times their respective base salaries. If an executive is out of compliance with the ownership requirement, he or she must retain 50% of our common shares acquired upon stock option exercises and 75% of our common shares issued upon the vesting of restricted stock, restricted stock unit and performance share grants, in each case, net of applicable taxes until the executive satisfies the ownership requirement. The compensation committee will annually review each NEO’s compliance with the stock ownership guidelines based on the NEO’s current base salary and the price of our common shares as of the end of the prior year.
Base Compensation
Base Salaries
We set base salaries for our NEOs generally at a level we deem necessary to attract and retain individuals with superior talent. Each year, the compensation committee will determine base salary adjustments, if any, after evaluating the job responsibilities and demonstrated proficiency of the NEOs as assessed by the compensation committee, and for NEOs other than the Chief Executive Officer, in conjunction with recommendations to be made by the Chief Executive Officer. No formulaic base salary increases are provided to the NEOs, and no NEOs have received base salary increases since their commencement of service through December 31, 2014.
Sign-on and Retention Bonuses
Pursuant to our negotiations to retain the services of Messrs. Bryant, Markevich and McDougall in 2013, we agreed to pay each of them a retention and sign-on bonus. These payments were also intended to induce Messrs. Bryant, Markevich and McDougall to accept our offers of employment and to compensate them for relinquishing unvested equity compensation or other incentive opportunities from their prior employers. Under the terms of Mr. Markevich’s employment agreement, we paid the second and final installment of his retention bonus April 15, 2014 in the amount of $300,000. We do not presently have any intent to provide our NEOs with any new rights to payments of this type.
Annual Performance-Based Compensation
We structure our compensation programs to reward NEOs based on our performance and the individual executive’s relative contribution to that performance. This allows NEOs to receive ABP awards in the event certain specified corporate performance measures are achieved. The annual ABP pool is determined by the compensation committee based upon a pre-established formula with reference to the extent of achievement of corporate-level and segment-level performance goals established annually by the compensation committee. The ABP is designed to reward NEOs for contributions made to help us meet our annual performance goals. The amount actually received by NEOs will depend on our performance and individual performance during the year. The compensation committee may make discretionary adjustments to the formulaic ABP awards to reflect its subjective determination of an individual’s impact and contribution to overall corporate or segment performance, as discussed below.
12
Under the terms of the ABP, the NEOs’ formulaic ABP awards are based on a percentage of their base salaries and currently range from 60% to 100% for target-level performance achievement. Maximum formulaic ABP awards vary according to each executive and are set at levels that the compensation committee determines are necessary to maintain competitive compensation practices and properly motivate our NEOs by rewarding them for our short-term performance and their contributions to that performance.
Once the extent of achievement of corporate and segment ABP performance targets and the formulaic ABP calculations have been determined, the compensation committee may adjust the amount of ABP awards paid upward or downward based upon its overall assessment of each NEO’s performance, business impact, contributions, leadership and attainment of individual objectives established periodically throughout the year, as well as other related factors. In addition, ABP funding amounts may be adjusted by the compensation committee to account for unusual events such as significant foreign currency exchange rate fluctuations, extraordinary transactions, asset dispositions and purchases, and mergers and acquisitions if, and to the extent, the compensation committee does not consider the effect of such events indicative of our performance.
The following chart sets forth the formulaic ABP awards for threshold, target-level and maximum ABP awards for our NEOs:
| Name and Principal Position |
Formulaic ABP at threshold performance (% of base salary) |
Formulaic ABP at target-level performance (% of base salary) |
Maximum ABP award (% of base salary) |
|||||||||
| Charles W. Shaver |
50 | % | 100 | % | 200 | % | ||||||
| Chairman and Chief Executive Officer |
||||||||||||
| Robert W. Bryant |
37.5 | % | 75 | % | 150 | % | ||||||
| Executive Vice President and Chief Financial Officer |
||||||||||||
| Steven R. Markevich |
37.5 | % | 75 | % | 150 | % | ||||||
| Senior Vice President and President, OEM |
||||||||||||
| Joseph F. McDougall |
30 | % | 60 | % | 120 | % | ||||||
| Senior Vice President and Chief Human Resources Officer |
||||||||||||
| Michael F. Finn |
30 | % | 60 | % | 120 | % | ||||||
| Senior Vice President, General Counsel and Corporate Secretary |
||||||||||||
For the year ended December 31, 2014, ABP performance goals were based upon Adjusted EBITDA (as defined below), Gross Adjusted Free Cash Flow (as defined below), Adjusted Revenue (as defined below), and individual performance metrics. For this purpose, “Adjusted EBITDA” was defined as our consolidated earnings before interest expense or income, income tax expense or income, depreciation, amortization and other adjustments as defined in the credit agreement governing our Senior Secured Credit Facilities. “Adjusted Free Cash Flow” was defined as cash flows from operations less cash flows from investing activities adjusted for certain items which the Company believed due to discrete events not contemplated in our incentive compensation targets. “Adjusted Revenue” was defined as Net Sales assuming consistent translation rates as those assumed in our 2014 budgeting process. Individual performance is generally based on personal contributions, as described in more detail below.
For each performance year, the compensation committee assigns a target, threshold and maximum value to each performance metric. ABP award amounts for performance between the threshold and maximum levels are determined at the beginning of the applicable performance period and depend on the level of achievement for each metric relative to its assigned performance target, in accordance with a predetermined payout matrix. The minimum ABP award under the payout matrix (i.e., 50% of the target ABP award) is payable only upon achievement of the threshold performance goals for each performance metric (i.e., 93% of EBITDA, 75% of FCF and 96% of Revenue). The maximum ABP award under the payout matrix (i.e., 200% of the target ABP award) is payable only upon achievement of maximum-level performance goals for each performance metric (i.e., 128%
13
of EBITDA, 133% of FCF and 126% of Revenue). ABP award amounts increase linearly between threshold and target-level performance and linearly between target and maximum-level performance. The following chart sets forth the weighting of each performance metric, the threshold, target and maximum performance goals, and the actual performance achieved under our ABP program for the year ended December 31, 2014:
The performance metrics for the NEO’s 2014 ABP and the results achieved with respect to those metrics are as follows:
| Performance Metric |
Weighting (%) |
Threshold ($ MM) |
Target ($ MM) |
Maximum ($ MM) |
Achieved ($ MM) |
|||||||||||||||
| Corporate Adjusted EBITDA(1) |
40 | 768 | 828 | 1,060 | 841 | |||||||||||||||
| Corporate Adjusted Free Cash Flow |
20 | 133 | 177 | 236 | 187 | (2) | ||||||||||||||
| Corporate Adjusted Revenue(3) |
20 | 4,275 | 4,471 | 5,646 | 4,378 | |||||||||||||||
| Individual Performance(4) |
20 | — | — | — | — | |||||||||||||||
| (1) | Excluding one-time costs and transition expenses related to the Acquisition. The performance component of Mr. Markevich’s ABP also reflects the contributions of the OEM business to the overall Corporate Adjusted EBITDA. |
| (2) | As a result of the impact of certain Acquisition-related matters on our free cash flow for 2014, the compensation committee made certain adjustments to our 2014 Adjusted Free Cash Flow targets. This resulted in an achievement level at 5.4% above target and a resulting payout level for this component of 116%. |
| (3) | The performance component of Mr. Markevich’s ABP also reflects the contributions of the OEM business to the overall Corporate Adjusted Revenue. |
| (4) | Individual performance payouts vary by participant, as described below. |
For the individual performance component of the ABP, the compensation committee provides each NEO with an ABP individual performance factor reflecting the compensation committee’s assessment of each NEO’s performance, business impact, contributions and leadership, among other factors. For 2014, the compensation committee considered the following key achievements in determining the ABP individual performance component for each of our NEOs:
| • | Mr. Shaver’s individual performance factor reflected several elements, including his overall leadership of the Company. Under Mr. Shaver’s leadership, we continued to have financial performance that met or exceeded our board of directors’ expectations. In addition, Mr. Shaver led the company through the initial public offering process and was instrumental with the investment community. Mr. Shaver continues to personally recruit board members and senior executives to the Company who have contributed to our performance. |
| • | Mr. Bryant’s individual performance factor reflected his leadership of the overall finance function, the filing of our S-1 registration statement and the subsequent initial public offering. Mr. Bryant was instrumental in establishing a rigorous budget setting process and developing the necessary supporting finance processes. |
| • | Mr. Markevich’s individual performance factor reflected his development of the strategy for, and resulting performance of, our light vehicle OEM business. Mr. Markevich was also instrumental in recruiting key executives to the company and winning important business accounts. We believe that Mr. Markevich has established our light vehicle coatings business as a customer-centric, global business. |
| • | Mr. McDougall’s individual performance factor reflected his leadership and transformation of the human resources and communications function. Mr. McDougall has developed a strategy that recruits top talent to the Company and retains key internal talent. In addition, Mr. McDougall has built a strategy for the Company’s corporate communication effort that enhances the Axalta brand worldwide. |
14
| • | Mr. Finn’s individual performance factor reflected his overall leadership of the legal and compliance functions and his significant contribution to the initial public offering process. Mr. Finn was instrumental in helping the Company to navigate through the S-1 filing and IPO processes and in establishing its corporate governance practices. Mr. Finn also led the successful development and implementation of the Company’s compliance program, with a full suite of employee-facing compliance policies, a robust ethics training program and appropriate procedures for mitigating compliance risks. |
Based on the considerations described above and our level of performance in relation to the corporate and segment ABP performance targets, the ABP awards earned by Messrs. Shaver, Bryant, McDougall, and Finn equaled 125%, 94%, 75%, and 75% of their respective base salaries (or 125% of their respective target ABP awards). The total ABP award for Mr. Markevich equaled 100% of his base salary (or 133% of his target ABP award).
Discretionary Long-Term Equity Incentive Awards
Our NEOs, along with other key employees, were granted stock options to purchase our common shares in connection with the commencement of their employment with us, and are eligible to receive additional awards of stock options or other equity or equity-based awards under our equity incentive plan at the discretion of the compensation committee. However, we have not historically made annual or regular equity grants to our NEOs or other key employees, although Mr. Shaver received an incremental stock option award in 2014 that was intended to supplement his initial award received in 2013 in connection with his commencement of service with us, as described below.
Our Equity award grants, which largely consist of premium priced stock options, are designed to motivate and retain the recipients by providing an opportunity for the recipients to share in the value of increases in our common shares subject to a risk of forfeiture should the recipient’s employment terminate prior to the option vesting date. The equity award grants to members of the senior management team also promote our long-term compensation objectives by aligning the interests of the executives with the interests of our shareholders.
Generally, stock options granted under our equity incentive plan have vesting schedules that are designed to encourage an optionee’s continued employment and exercise prices that are designed to reward an optionee for our performance. Stock options generally expire ten years from the date of the grant and vest in five equal annual installments, subject to the optionee’s continued employment on each applicable vesting date. For stock options awarded to our NEOs in 2013, the first 20% of their options vested on January 1, 2014, and the remaining shares vest in 20% allotments on each anniversary of January 1, 2014. The stock options are also subject to vesting acceleration in certain circumstances. For more information about vesting acceleration of the stock options, see the discussion below under the heading “—Potential Payments Upon Termination or Change-in-Control.”
We have historically granted to key employees options with staggered exercise prices, such that the exercise price of a portion of the option is substantially greater than (generally in increments of 1.5 times and 2 times) the fair market value of the shares underlying the option on the date of grant, thereby creating incentives for our NEOs and other key employees to seek to increase shareholder value.
The number of the stock options awarded to our NEOs during the years ending December 31, 2013 and 2014 are listed below.
| Name |
Number of Options Granted 2013 |
Number of Options Granted 2014 |
||||||
| Charles W. Shaver |
4,463,805 | 496,015 | ||||||
| Robert W. Bryant |
1,517,692 | — | ||||||
| Steven R. Markevich |
1,031,635 | — | ||||||
| Joseph F. McDougall |
545,575 | — | ||||||
| Michael F. Finn |
495,977 | — | ||||||
15
These stock option awards were subject to individual negotiations between each NEO and us in connection with his commencement of employment. As part of these negotiations, we considered the NEO’s relative level of responsibility and authority within our organizational structure and his anticipated contributions to our success in driving stockholder value over the long term. In May 2014, Mr. Shaver received a supplemental option grant in recognition of his successful leadership through our transition to a stand-alone company throughout 2013 following the Acquisition.
Defined Contribution Plans
401(k) Plan
We maintain a defined contribution plan that is tax-qualified under Section 401(a) of the Code (the “401(k) Plan”). The 401(k) Plan permits our eligible employees to defer receipt of portions of their eligible compensation, subject to certain limitations imposed by the Code. Employees may make pre-tax contributions, Roth contributions, catch-up contributions and after-tax contributions to the 401(k) Plan. The 401(k) Plan provides matching contributions in an amount equal to 100% of each participant’s pre-tax contributions and/or Roth contributions up to a maximum of 4% of the participant’s annual eligible compensation, subject to certain other limits, and a discretionary company contribution of up to 2% of the participant’s annual eligible compensation. Participants are 100% vested in all contributions, including company contributions. The 401(k) Plan is offered on a nondiscriminatory basis to all of our salaried employees, including NEOs.
Deferred Compensation Plans
In addition to the 401(k) Plan, in 2014 we maintained two nonqualified deferred compensation plans for a select group of highly compensated, senior management employees, including NEOs.
The Axalta Coating Systems LLC Retirement Savings Restoration Plan (the “Restoration Plan”), which is now frozen to new participants, permitted participants to defer their base compensation in excess of the Code compensation limits (up to a maximum of 6%). The Restoration Plan provides matching contributions to Restoration Plan participants in an amount equal to 100% of the participant’s contributions. In addition, the Restoration Plan provides a nonelective contribution equal to 3% of the participant’s compensation that is in excess of the annual limit under section 401(a)(17) of the Code. A participant’s elective deferrals are always 100% fully vested. Company matching contributions and nonelective contributions vest after three years of service with the Company.
The Axalta Coating Systems, LLC Nonqualified Deferred Compensation Plan became effective June 1, 2014. A select group of highly compensated, senior management employees are eligible to defer base salary in excess of the annual limits under the Code to this plan in 2015, provided that these individuals first maximize their elective deferrals to the 401(k) Plan. This plan provides for a discretionary matching contribution, a discretionary nonelective contribution and a true discretionary contribution by the company. Employee deferrals and employer contributions to this plan did not occur in 2014.
The discretionary matching contribution amount, if granted, will generally be equivalent to the employer match that the participant would have received under the 401(k) Plan, if not for the annual contribution limits of the Code. The Board or its designee shall determine the maximum allowable matching contribution, as a percentage of compensation, annually.
The discretionary nonelective contribution, if granted, may be equivalent to the employer nonelective contribution that participant would have received under the 401(k) Plan if not for the annual contribution limits of the Code.
Any discretionary contribution amount, if granted, may be any amount determined by the Compensation Committee of the Board and is not subject to further limitations.
16
The compensation committee believes that matching and company contributions assist us in attracting and retaining talented employees and executives. The 401(k) Plan and the nonqualified deferred compensation plans provide an opportunity for participants to save money for retirement and to achieve financial security.
Employment and Severance Arrangements
The compensation committee considers the maintenance of a sound management team to be essential to protecting and enhancing our best interests. To that end, we recognize that the uncertainty that may exist among management with respect to their “at-will” employment with us may result in the departure or distraction of management personnel to our detriment. Accordingly, the compensation committee has determined that severance arrangements are appropriate to encourage the continued attention and dedication of certain members of our management and to allow them to focus on the value to shareholders of strategic alternatives without concern for the impact on their continued employment. Each of the NEOs has an employment agreement that provides for severance benefits upon termination of employment.
Mr. Shaver’s employment agreement has a term beginning on the date of the completion of the Acquisition, which was February 1, 2013, and ending on the third anniversary thereof. The agreement is extended automatically for successive 18 month periods thereafter unless either party delivers notice of non-renewal to the other no later than 45 days before the end of the applicable term. Upon our termination of Mr. Shaver’s employment without cause (which includes our non-extension of the term) or by Mr. Shaver for good reason, subject to his timely execution of a general release of claims against us, Mr. Shaver would be entitled to receive a payment equal to 3.0 times his annual base salary, payable in regular installments over an 18-month period in accordance with our regular payroll practices, and his ABP award earned in the year preceding his termination to the extent unpaid. In addition, if such a termination occurs within one year following a change in control, subject to Mr. Shaver’s timely execution of a general release of claims against us, Mr. Shaver would be entitled to receive a lump-sum payment equal to 4.0 times his annual base salary, instead of installment payments equal to 3.0 times his annual base salary, and an additional lump-sum payment of $60,000. During his employment and for 18 months following termination (or for 24 months following termination if he is entitled to change-in-control payments), Mr. Shaver’s employment agreement prohibits him from competing with our business and from soliciting our employees, customers or distributors to terminate their employment or arrangements with us. “Cause” is defined in Mr. Shaver’s employment agreement to mean: (i) his failure to substantially perform his duties (other than a failure resulting from disability) or materially comply with any of our policies; (ii) a determination by our board of directors that he has failed to carry out or comply with any lawful and reasonable directive of our board of directors; (iii) his breach of a material provision of his employment agreement; (iv) his conviction, plea of no contest, or imposition of unadjudicated probation for any felony or crime involving moral turpitude; (v) his unlawful use (including being under the influence) or possession of illegal drugs on our premises or while performing his duties and responsibilities; or (vi) his commission of an act of fraud, embezzlement, misappropriation, willful misconduct or breach of fiduciary duty against us. “Good reason” is defined in Mr. Shaver’s employment agreement to mean: (i) a decrease in Mr. Shaver’s annual base salary, other than a decrease of less than 10% in connection with a contemporaneous decrease in annual base salaries for other senior executives; (ii) a material reduction in authority or responsibilities; or (iii) a relocation of Mr. Shaver’s primary office by more than 35 miles from our headquarters.
Mr. Bryant’s employment agreement has a term beginning on the date of completion of the Acquisition, which was February 1, 2013, and ending on the third anniversary thereof. The agreement is extended automatically for successive 18 month periods thereafter unless either party delivers notice of non-renewal to the other no later than 45 days before the end of the applicable term. Upon our termination of Mr. Bryant’s employment without cause (which includes our non-extension of the term) or by Mr. Bryant for good reason, subject to his timely execution of a general release of claims against us, Mr. Bryant would be entitled to receive: (i) a payment equal to 1.0 times his annual base salary, payable in regular installments over a 12-month period in accordance with our regular payroll practices, (ii) his ABP award earned in the year preceding his termination to the extent unpaid and (iii) a prorated portion of his ABP award for the year in which termination occurs with the amount of the
17
award based on actual performance, as determined by our board of directors. In addition, if such a termination occurs within one year following a change in control, subject to Mr. Bryant’s timely execution of a general release of claims against us, Mr. Bryant would be entitled to receive a payment equal to 2.0 times his annual base salary, instead of 1.0 times, payable over a 24-month period, instead of a 12-month period. During his employment and for 12 months following termination (or for 18 months following termination if he is entitled to change-in-control payments), Mr. Bryant’s employment agreement prohibits him from competing with our business and from soliciting our employees, customers or distributors to terminate their employment or arrangements with us. “Cause” is defined in Mr. Bryant’s employment agreement to mean: (i) his substantial, repeated and willful failure to perform duties as reasonably directed by our board of directors; (ii) his material failure to carry out or comply with any lawful and reasonable directive of our board of directors or Chief Executive Officer that is not inconsistent with his employment agreement; (iii) his breach of a material provision of his employment agreement or material company policy; (iv) his conviction, plea of no contest or imposition of unadjudicated probation for any felony or crime involving moral turpitude; (v) his unlawful use (including being under the influence) or possession of illegal drugs on our premises or while performing his duties and responsibilities; (vi) his willful or prolonged and unexcused absence from work (other than by reason of disability due to physical or mental illness); or (vii) his commission of an act of fraud, embezzlement, misappropriation, willful misconduct or material breach of fiduciary duty against us. For purposes of Mr. Bryant’s employment agreement, “good reason” has the same meaning as in Mr. Shaver’s employment agreement.
Mr. Markevich’s employment agreement has a term beginning on May 2, 2013 and ending on the third anniversary thereof. The agreement is extended automatically for successive 12 month periods thereafter unless either party delivers notice of non-renewal to the other no later than 60 days before the end of the applicable term. Upon our termination of Mr. Markevich’s employment without cause (which includes our non-extension of the term) or by Mr. Markevich for good reason, subject to his timely execution of a general release of claims against us, Mr. Markevich would be entitled to receive: (i) a payment equal to 1.5 times his annual base salary, payable in regular installments over an 18-month period in accordance with our regular payroll practices; (ii) his sign-on or retention bonus payments to the extent unpaid; and (iii) his ABP award earned in the year preceding his termination to the extent unpaid. In addition, if such a termination occurs within 60 days prior to or one year following a change in control, subject to Mr. Markevich’s timely execution of a general release of claims against us, Mr. Markevich would be entitled to receive a payment equal to 2.0 times his annual base salary, instead of 1.5 times, payable over a 24-month period, instead of an 18-month period. During his employment and for 12 months following termination, Mr. Markevich’s employment agreement prohibits him from competing with our business and, for 18 months following termination, from soliciting our employees, customers or distributors to terminate their employment or arrangements with us. For purposes of Mr. Markevich’s employment agreement, “cause” and “good reason” have the same meanings as in Mr. Shaver’s employment agreement.
Mr. McDougall’s employment agreement has a term beginning on May 1, 2013 and ending on the third anniversary thereof. The agreement is extended automatically for successive 12 month periods thereafter unless either party delivers a notice of non-renewal to the other no later than 60 days before the end of the applicable term. Upon our termination of Mr. McDougall’s employment without cause (which includes our non-extension of the term) or by Mr. McDougall for good reason, subject to his timely execution of a general release of claims against us, Mr. McDougall would be entitled to receive: (i) a payment equal to 1.0 times his annual base salary, payable in regular installments over a 12-month period in accordance with our regular payroll practices; and (ii) his ABP award earned in the year preceding his termination to the extent unpaid. In addition, if such termination occurs within one year following a change in control, subject to Mr. McDougall’s timely execution of a general release of claims against us, Mr. McDougall would be entitled to receive a payment equal to 2.0 times his annual base salary, instead of 1.0 times, payable over a 24-month period, instead of an 12-month period. During his employment and for 12 months following termination, Mr. McDougall’s employment agreement prohibits him from competing with our business and, for 18 months following termination, from soliciting our employees, customers or distributors to terminate their employment or arrangements with us. For purposes of Mr. McDougall’s employment agreement, “cause” has substantially the same meaning as in
18
Mr. Shaver’s employment agreement, except that failing to substantially perform his duty or materially comply with our policies does not constitute “cause;” instead, “cause” includes the board of directors’ determination of gross of willful misconduct and mismanagement by Mr. McDougall that is injurious to us or that results in his inability to substantially perform his duties. “Good reason” has the same meaning as in Mr. Shaver’s employment agreement.
Mr. Finn’s employment agreement has a term beginning on March 26, 2013 and ending on the second anniversary thereof. The agreement is extended automatically for successive 12 month periods thereafter unless either party delivers a notice of non-renewal to the other no later than 60 days before the end of the applicable term. Upon our termination of Mr. Finn’s employment without cause (which includes our non-extension of the term) or by Mr. Finn for good reason, subject to his timely execution of a general release of claims against us, Mr. Finn would be entitled to receive: (i) a payment equal to 1.0 times his annual base salary, payable in regular installments over a 12-month period in accordance with our regular payroll practices; (ii) a prorated portion of his ABP award for the year in which termination occurs in a sum no less than his target percentage; and (iii) his ABP award earned in the year preceding his termination, to the extent unpaid, in a sum no less than his target percentage (except, if members of senior management generally receive less than target bonus payouts for the applicable year, then Mr. Finn is entitled to receive the average bonus payout levels provided generally to members of senior management). In addition, if such termination occurs within one year following a change in control, subject to Mr. Finn’s timely execution of a general release of claims against us, Mr. Finn would be entitled to receive payments equal to 2.0 times his target ABP award (instead of a prorated portion of his target ABP award), and payments equal to 2.0 times his annual base salary payable over a 24-month period (instead of 1.0 times his annual base salary payable over a 12-month period). During his employment and for 12 months following termination, Mr. Finn’s employment agreement prohibits him from competing with our business and, for 18 months following termination, from soliciting our employees, customers or distributors to terminate their employment or arrangements with us. For purposes of Mr. Finn’s employment agreement, “cause” and “good reason” have the same meanings as in Mr. Shaver’s employment agreement.
“Change in control” is defined in all of our NEOs’ employment agreements to mean: (i) the sale, in one transaction or a series of related transactions (including one or more stock sales, mergers, business combinations, recapitalizations, consolidations, reorganizations, restructurings or similar transactions) of all or substantially all of our consolidated assets to any person (other than Carlyle); or (ii) any transaction or series of related transactions resulting in any person (other than Carlyle) acquiring at least 50% of the aggregate voting power of all of our outstanding voting securities.
Other Elements of Compensation and Perquisites
We provide NEOs with certain relatively low-cost, personal benefits and perquisites, which we do not consider to be a significant component of executive compensation but which are an important factor in attracting and retaining talented executives. NEOs are eligible under the same plans as all other employees for medical, dental, vision and short-term disability insurance, and may participate to the same extent as all other employees in our tuition reimbursement program. To induce the NEOs to join the Company, we agreed to reimburse them for certain relocation and temporary living and commuting expenses. All of our NEOs’ employment agreements stipulate that these were one-time reimbursements for expenses incurred in connection with their commencing employment with us. In addition, beginning in 2014, we have determined to provide the following additional perquisites to our NEOs and certain other senior management personnel: executive physical, umbrella liability insurance, global travel insurance and parking benefits. The value of personal benefits and perquisites we provided to each of our NEOs is set forth below in our Summary Compensation Table.
19
Summary Compensation Table
The following table sets forth certain information with respect to the compensation paid to our NEOs for the year ending December 31, 2013 and 2014.
| Name and Principal Position |
Year | Salary ($) |
Bonus(1) ($) |
Option Awards(2) ($) |
Non-Equity Incentive Plan Compensation(3) ($) |
All Other Compensation(4) ($) |
Total ($) |
|||||||||||||||||||||
| Charles W. Shaver |
2014 | 750,000 | — | 986,042 | 937,500 | 213,418 | 2,886,960 | |||||||||||||||||||||
| Chairman and Chief Executive Officer |
2013 | 687,500 | — | 6,163,263 | 1,024,500 | 124,863 | 8,000,126 | |||||||||||||||||||||
| Robert W. Bryant |
2014 | 525,000 | — | — | 492,188 | 19,427 | 1,036,615 | |||||||||||||||||||||
| Executive Vice President and Chief Financial Officer |
2013 | 481,250 | 221,000 | 2,095,508 | 537,800 | 204,859 | 3,540,417 | |||||||||||||||||||||
| Steven R. Markevich |
2014 | 500,000 | 300,000 | — | 498,750 | 36,904 | 1,335,654 | |||||||||||||||||||||
| Senior Vice President and President, OEM |
2013 | 260,417 | 250,000 | 1,424,399 | 456,000 | 15,712 | 2,406,528 | |||||||||||||||||||||
| Joseph F. McDougall |
2014 | 385,000 | — | — | 288,750 | 39,610 | 713,360 | |||||||||||||||||||||
| Senior Vice President and Chief Human Resources Officer |
2013 | 252,482 | 460,000 | 753,288 | 315,500 | 19,836 | 1,801,106 | |||||||||||||||||||||
| Michael F. Finn |
2014 | 350,000 | — | — | 262,500 | 31,892 | 644,392 | |||||||||||||||||||||
| Senior Vice President, General Counsel and Corporate Secretary |
2013 | 235,985 | — | 684,807 | 287,200 | 257,989 | 1,465,582 | |||||||||||||||||||||
| (1) | Amounts represent the sign-on and retention bonuses paid to our NEOs in connection with their commencement of service with us in 2013 and 2014. For additional information, see “—Base Compensation for 2014—Sign-on and Retention Bonuses.” |
| (2) | Amounts represent the aggregate grant date fair value of stock option awards determined in accordance with FASB ASC Topic 718. Refer to Note 11 to our Audited Consolidated and Combined Financial Statements included in our annual report on Form 10-K for the year ended December 31, 2014 for information regarding the assumptions used to value these awards. |
| (3) | Amount represents awards earned under our ABP. For additional information, see “—Annual Performance-Based Compensation for 2014.” |
| (4) | Other compensation includes the value of relocation and temporary commuting expenses and other perquisites as well as our contributions to the NEOs’ 401(k) and deferred compensation plan accounts as set forth in the following table. |
| Name |
Year | Memberships ($) |
Parking ($) |
Executive Physical ($) |
Relocation ($) |
Employer Contribution to 401(k) ($) |
Employer Contribution to Restoration Plan ($) |
Total ($) |
||||||||||||||||||||||||
| Charles W. Shaver |
2014 | — | 5,400 | 3,000 | 191,314 | 13,704 | — | 213,418 | ||||||||||||||||||||||||
| Robert W. Bryant |
2014 | — | 4,500 | 3,000 | — | 11,927 | — | 19,427 | ||||||||||||||||||||||||
| Steven R. Markevich |
2014 | — | — | 3,000 | — | 15,385 | 18,519 | 36,904 | ||||||||||||||||||||||||
| Joseph F. McDougall |
2014 | 9,060 | 3,649 | 3,000 | — | 6,128 | 17,773 | 39,610 | ||||||||||||||||||||||||
| Michael F. Finn |
2014 | — | 3,649 | 3,000 | — | 12,279 | 12,963 | 31,892 | ||||||||||||||||||||||||
20
Grants of Plan-Based Awards
| Name |
Grant Date | Estimated Future Payouts Under Non- Equity Incentive Plan Awards |
All Other Option Awards: Number of Securities Underlying Options (#) |
Exercise or Base Price of Option Awards ($/sh) |
Grant Date Fair Value of Option Awards ($)(7) |
|||||||||||||||||||||||
| Thres- hold ($) |
Target ($) |
Maxi- mum ($) |
||||||||||||||||||||||||||
| Charles W. Shaver |
||||||||||||||||||||||||||||
| 2014 ABP |
375,000 | 750,000 | (1) | 1,500,000 | ||||||||||||||||||||||||
| 2014 Stock options(6) |
5/22/2014 | 198,406 | 11.84 | 302,468 | ||||||||||||||||||||||||
| 173,605 | 8.88 | 379,639 | ||||||||||||||||||||||||||
| 124,004 | 7.21 | 303,935 | ||||||||||||||||||||||||||
| Robert W. Bryant |
||||||||||||||||||||||||||||
| 2014 ABP |
196,875 | 393,750 | (2) | 787,500 | ||||||||||||||||||||||||
| Steven R. Markevich |
||||||||||||||||||||||||||||
| 2014 ABP |
187,500 | 375,000 | (3) | 750,000 | ||||||||||||||||||||||||
| Joseph F. McDougall |
||||||||||||||||||||||||||||
| 2014 ABP |
115,500 | 231,000 | (4) | 462,000 | ||||||||||||||||||||||||
| Michael F. Finn |
||||||||||||||||||||||||||||
| 2014 ABP |
105,000 | 210,000 | (5) | 420,000 | ||||||||||||||||||||||||
| (1) | Actual award earned under our annual ABP program for 2014 was $937,500. See “—Annual Performance-Based Compensation” above for a discussion of the calculation of this amount. |
| (2) | Actual award earned under our annual ABP program for 2014 was $492,188. See “—Annual Performance-Based Compensation” above for a discussion of the calculation of this amount. |
| (3) | Actual award earned under our annual ABP program for 2014 was $498,750. See “—Annual Performance-Based Compensation” above for a discussion of the calculation of this amount. |
| (4) | Actual award earned under our annual ABP program for 2014 was $288,750. See “—Annual Performance-Based Compensation” above for a discussion of the calculation of this amount. |
| (5) | Actual award earned under our annual ABP program for 2014 was $262,500. See “—Annual Performance-Based Compensation” above for a discussion of the calculation of this amount. |
| (6) | These options will become exercisable with respect to 20% of the underlying shares on each of May 22, 2015, May 22, 2016, May 22, 2017, May 22, 2018 and May 22, 2019 provided that the NEO remains employed by us through the applicable vesting date. |
| (7) | Amounts represent the aggregate grant date fair value of stock option awards determined in accordance with FASB ASC Topic 718. Refer to Note 11 to our Audited Consolidated and Combined Financial Statements included in our annual report on Form 10-K for the year ended December 31, 2014 for information regarding the assumptions used to value these awards. |
21
Outstanding Equity Awards
The following table provides information regarding the stock options held by the NEOs as of December 31, 2014.
| Name |
Number of Securities Underlying Unexercised Options (#) Exercisable (1) |
Number of Securities Underlying Unexercised Options (#) Unexercisable |
Equity Incentive Plan Awards: Number of Securities Underlying Unexercised Unearned Options (#) |
Option Exercise Price ($) |
Option Expiration Date |
|||||||||||||||
| Charles W. Shaver |
— | 198,406 | (3) | — | 11.84 | 5/22/2024 | ||||||||||||||
| — | 173,605 | (3) | — | 8.88 | 5/22/2024 | |||||||||||||||
| — | 124,004 | (3) | — | 7.21 | 5/22/2024 | |||||||||||||||
| 357,105 | 1,428,417 | (2) | — | 11.84 | 7/30/2023 | |||||||||||||||
| 312,467 | 1,249,865 | (2) | — | 8.88 | 7/30/2023 | |||||||||||||||
| 223,191 | 892,760 | (2) | — | 5.92 | 7/30/2023 | |||||||||||||||
| Robert W. Bryant |
121,416 | 485,660 | (2) | — | 11.84 | 7/30/2023 | ||||||||||||||
| 106,239 | 424,953 | (2) | — | 8.88 | 7/30/2023 | |||||||||||||||
| 75,885 | 303,539 | (2) | — | 5.92 | 7/30/2023 | |||||||||||||||
| Steven R. Markevich |
82,531 | 330,123 | (2) | — | 11.84 | 7/30/2023 | ||||||||||||||
| 72,215 | 288,856 | (2) | — | 8.88 | 7/30/2023 | |||||||||||||||
| 51,582 | 206,328 | (2) | — | 5.92 | 7/30/2023 | |||||||||||||||
| Joseph F. McDougall |
43,646 | 174,583 | (2) | — | 11.84 | 7/30/2023 | ||||||||||||||
| 38,191 | 152,760 | (2) | — | 8.88 | 7/30/2023 | |||||||||||||||
| 27,279 | 109,116 | (2) | — | 5.92 | 7/30/2023 | |||||||||||||||
| Michael F. Finn |
39,678 | 158,712 | (2) | — | 11.84 | 7/30/2023 | ||||||||||||||
| 34,719 | 138,872 | (2) | — | 8.88 | 7/30/2023 | |||||||||||||||
| 24,800 | 99,196 | (2) | — | 5.92 | 7/30/2023 | |||||||||||||||
| (1) | These options became exercisable on January 1, 2014. |
| (2) | These options became or will become exercisable with respect to 20% of the underlying shares on each of January 1, 2015, January 1, 2016, January 1, 2017 and January 1, 2018. |
| (3) | These options will become exercisable with respect to 20% of the underlying shares on each of May 22, 2015, May 22, 2016, May 22, 2017, May 22, 2018 and May 22, 2019. |
22
Options Exercised and Shares Vested
Our NEOs became vested with respect to 20% of their stock options granted in 2013 on January 1, 2014. Messrs. Markevich and Finn exercised portions of their vested stock options in August 2014. The value of these option exercises are set forth in the table below:
| Name |
Number of Shares Acquired on Exercise (#) |
Value Realized on Exercise ($)(1) |
Number of Shares Acquired on Vesting (#) |
Value Realized on Vesting ($) |
||||||||||||
| Charles W. Shaver |
— | — | — | — | ||||||||||||
| Robert W. Bryant |
— | — | — | — | ||||||||||||
| Steven R. Markevich |
51,582 | 66,233 | — | — | ||||||||||||
| Joseph F. McDougall |
— | — | — | — | ||||||||||||
| Michael F. Finn |
42,158 | 31,843 | — | — | ||||||||||||
| (1) | The value realized on exercise is equal to the difference between the option exercise price and the value of the shares on the exercise date, multiplied by the number of shares subject to the option, without taking into account any taxes that may be payable in connection with the transaction. As the option exercises occurred prior to our initial public offering, the market values shown reflect, as of the date of exercise, the fair market value of the shares as most recently determined by our board of directors. |
Pension Benefits for 2014
Our NEOs do not participate in any pension plans and received no pension benefits during the year ended December 31, 2014.
Nonqualified Deferred Compensation
Our NEOs participate in a nonqualified deferred compensation plan and received nonqualified deferred compensation during the years ending December 31, 2013 and 2014 to the extent their eligible compensation exceeded the limit established by the IRS for tax-qualified defined contribution plans. For additional information, see the discussion above under the heading “—Defined Contribution Plans—Deferred Compensation Plan.”
| Name |
Year | Executive Contributions in Last FY ($) |
Company Contributions in Last FY ($) |
Aggregate Earnings in Last FY ($) |
Aggregate Withdrawals/ Distributions ($) |
Aggregate Balance at Last FYE ($) |
||||||||||||||||||
| Charles W. Shaver |
2014 | — | — | 3,764 | — | 71,162 | ||||||||||||||||||
| Robert W. Bryant |
2014 | — | — | 2 | — | 33,941 | ||||||||||||||||||
| Steven R. Markevich |
2014 | 12,346 | 18,519 | 1,197 | — | 32,875 | ||||||||||||||||||
| Joseph F. McDougall |
2014 | 11,849 | 17,773 | 363 | — | 29,985 | ||||||||||||||||||
| Michael F. Finn |
2014 | 8,642 | 12,963 | 133 | — | 21,739 | ||||||||||||||||||
23
Potential Payments Upon Termination or Change-in-Control
Each of our NEOs has an employment agreement that provides for severance benefits upon termination of employment. See “—Employment and Severance Arrangements” above for a description of the employment and severance arrangements with our NEOs. Assuming a termination of employment effective as of December 31, 2014 (i) by us without cause, (ii) by the executive for good reason or (iii) by us without cause or the executive for good reason within one year following a change in control (or, for Mr. Markevich, within 60 days prior to or one year following a change in control), each of our NEOs would have received the following severance payments and benefits:
| Name |
Payment Type |
Termination Without Cause (Including Non-Extension of Term) ($) |
Resignation for Good Reason ($) |
Termination Without Cause or Resignation for Good Reason Following a Change in Control ($) |
||||||||||
| Charles W. Shaver |
Salary | 2,250,000 | 2,250,000 | 3,000,000 | ||||||||||
| Other(1) | 60,000 | |||||||||||||
| Total | 2,250,000 | 2,250,000 | 3,060,000 | |||||||||||
| Robert W. Bryant |
Salary | 525,000 | 525,000 | 1,050,000 | ||||||||||
| Bonus(2) | ||||||||||||||
| Total | 525,000 | 525,000 | 1,050,000 | |||||||||||
| Steven R. Markevich |
Salary | 750,000 | 750,000 | 1,000,000 | ||||||||||
| Total | 750,000 | 750,000 | 1,000,000 | |||||||||||
| Joseph F. McDougall |
Salary | 385,000 | 385,000 | 770,000 | ||||||||||
| Total | 385,000 | 385,000 | 770,000 | |||||||||||
| Michael F. Finn |
Salary | 350,000 | 350,000 | 700,000 | ||||||||||
| Bonus(3) | 210,000 | 210,000 | 420,000 | |||||||||||
| Total | 560,000 | 560,000 | 1,120,000 | |||||||||||
| (1) | Mr. Shaver would have been eligible to receive a payment of $60,000 to be used for medical and other expenses. |
| (2) | Mr. Bryant would have remained eligible to receive his 2014 ABP award, in an amount determined in the discretion of the compensation committee based on performance. The amount actually paid to Mr. Bryant with respect to his 2014 ABP award is set forth in the Summary Compensation Table above under the heading “Non-Equity Incentive Plan Compensation.” |
| (3) | Mr. Finn would have remained eligible to receive his 2014 ABP award in an amount no less than his target ABP amount of $210,000, or, if within one year following a change in control, 2.0 times that amount. The amount actually paid to Mr. Finn with respect to his 2014 ABP award is set forth in the Summary Compensation Table above under the heading “Non-Equity Incentive Plan Compensation.” |
In addition, pursuant to our NEOs’ stock option agreements, their stock options are subject to vesting acceleration in the following circumstances.
| • | Liquidity Event. A liquidity event generally would occur if Carlyle sold at least 50% of its equity investment in us, or if we sold substantially all of our assets (other than to Carlyle). A liquidity event could include a change in control, which is described below. Each NEO’s options vest and become exercisable immediately prior to a liquidity event if the NEO remains continuously employed from the option grant date through the liquidity event, or if the NEO is terminated by us without cause or by the NEO for good reason within six months prior to the liquidity event. |
| • | Change in Control. A change in control generally would occur if Carlyle sold at least 50% of our voting securities, or we sold substantially all of our assets (other than to Carlyle). The options vest and |
24
| become exercisable immediately prior to a change in control if the options do not remain outstanding, or if the successor entity does not assume the options or substitute an equivalent award. The options also vest and become exercisable if the NEO is terminated by us without cause or by the NEO for good reason in connection with a change in control. If such termination occurs within six months prior to a change in control, then the options vest and become exercisable immediately prior to the change in control. If such termination occurs following a change in control (and the options remain outstanding, or the successor entity assumes the options or substitutes an equivalent award), then the options vest and become exercisable immediately prior to the NEO’s termination. |
| • | Exchange of Shares. An exchange of shares generally would occur if our shares are exchanged for securities listed on a national securities exchange (other than in connection with an initial public offering). The options vest and become exercisable upon the earliest of: (i) six months after such transaction’s effective date; (ii) the date the NEO is terminated by us without cause or due to disability, or by the NEO for good reason, following such transaction or (iii) the date of the NEO’s death following such transaction. |
In the event a full acceleration event, such as a liquidity event as described above, had occurred with respect to our NEOs’ stock options on December 31, 2014, our NEOs would have realized the following amounts with respect to the accelerated vesting of their options, which amounts represent the number of unvested shares subject to unvested options as of such date multiplied by the closing price of our common stock on December 31, 2014 minus the aggregate exercise price of all such options: Mr. Shaver: $67,743,617; Mr. Bryant: $20,271,487; Mr. Markevich: $13,779,329; Mr. McDougall: $7,287,125; and Mr. Finn: $6,624,642.
Compensation Risk
The compensation committee has analyzed the potential risks arising from our compensation policies and practices, and it has determined that there are no such risks that are reasonably likely to have a material adverse effect on us.
Director Compensation
Directors employed by Carlyle or us receive no additional compensation for serving on our board of directors or its committees. Pursuant to our director compensation program as in effect prior to our initial public offering, we pay each of our other directors, whom we refer to as our non-employee directors, $75,000 per year in cash for service on our board of directors, payable quarterly in arrears. Our non-employee directors are also eligible to receive awards under our equity incentive plans to the same extent as other service providers, except with regard to incentive stock options. Messrs. McLaughlin and Kramvis each received an option award to purchase up to 55,048 of our common shares in 2014. The option awards were intended as one-time grants tied to the commencement of the director’s service with us. They were granted with an exercise price not less than fair market value on the date of grant and have escalating exercise prices similar to the options granted to our NEOs. The options vest in annual installments over five years beginning on the date of grant, except that for Mr. Bustos, the options were 20% vested as of the date of grant in recognition of his service with us during 2013.
Messrs. Bustos, McLaughlin and Kramvis were our only non-employee directors in 2014. In the year ending December 31, 2014, we provided the following compensation to Messrs. Bustos, McLaughlin and Kramvis:
| Name |
Year | Fees Earned or Paid in Cash ($)(1) |
Option Awards ($)(2) |
Total ($) |
||||||||||||
| Orlando Bustos |
2014 | 75,000 | 109,433 | 184,433 | ||||||||||||
| Robert M. McLaughlin |
2014 | 45,000 | (3) | 109,433 | 154,433 | |||||||||||
| Andreas C. Kramvis |
2014 | 18,750 | 108,450 | 127,200 | ||||||||||||
| (1) | Director stipends are paid quarterly in arrears and pro-rated for a partial year of service. |
25
| (2) | As of December 31, 2014, each of Messrs. McLaughlin and Kramvis held outstanding option awards to purchase up to 55,048 common shares and no outstanding stock awards. As of December 31, 2014, Mr. Bustos, through OHorizons Global, held outstanding option awards to purchase up to 407,191 Common Shares and no outstanding Stock awards. |
| (3) | Mr. McLaughlin receives an additional quarterly payment of $3,750 for his service as chair of the audit committee. |
Equity Compensation Plan Information
The following table provides information as of December 31, 2014, with respect to the shares of our common stock that may be issued under our existing equity compensation plans:
| Plan Category |
Number of Securities to be Issued Upon Exercise of Outstanding Options, Warrants and Rights (a) |
Weighted- Average Exercise Price of Outstanding Options, Warrants and Rights (b) |
Number of Securities Remaining Available for Future Issuance Under Equity Compensation Plans (Excluding Securities Reflected in Column(a)) (c) |
|||||||||
| Equity compensation plans approved by security holders |
17,097,036 | $ | 9.38 | 11,874,631 | ||||||||
| Equity compensation plans not approved by security holders |
— | — | — | |||||||||
|
|
|
|
|
|
|
|||||||
| Total |
17,097,036 | $ | 9.38 | 11,874,631 | ||||||||
26