Attached files
| file | filename |
|---|---|
| EXCEL - IDEA: XBRL DOCUMENT - TANGOE INC | Financial_Report.xls |
| EX-32.2 - EX-32.2 - TANGOE INC | a2223511zex-32_2.htm |
| EX-31.2 - EX-31.2 - TANGOE INC | a2223511zex-31_2.htm |
| EX-32.1 - EX-32.1 - TANGOE INC | a2223511zex-32_1.htm |
| EX-31.1 - EX-31.1 - TANGOE INC | a2223511zex-31_1.htm |
| EX-10.25 - EX-10.25 - TANGOE INC | a2223511zex-10_25.htm |
| EX-23.1 - EX-23.1 - TANGOE INC | a2223511zex-23_1.htm |
| EX-21.1 - EX-21.1 - TANGOE INC | a2223511zex-21_1.htm |
Use these links to rapidly review the document
TABLE OF CONTENTS
TANGOE, INC. INDEX TO CONSOLIDATED FINANCIAL STATEMENTS
UNITED STATES
SECURITIES AND EXCHANGE COMMISSION
WASHINGTON, D.C. 20549
FORM 10-K
| (Mark One) | ||
ý |
ANNUAL REPORT PURSUANT TO SECTION 13 OR 15(d) OF THE SECURITIES EXCHANGE ACT OF 1934 |
|
For the fiscal year ended December 31, 2014 |
||
or |
||
o |
TRANSITION REPORT PURSUANT TO SECTION 13 OR 15(d) OF THE SECURITIES EXCHANGE ACT OF 1934 |
|
For the transition period from to |
||
Commission file number 001-35247
TANGOE, INC.
(Exact Name of Registrant as Specified in Its Charter)
| Delaware (State or other jurisdiction of incorporation or organization) |
06-1571143 (I.R.S. Employer Identification No.) |
|
35 Executive Boulevard, Orange, Connecticut (Address of Principal Executive Offices) |
06477 (Zip Code) |
(203) 859-9300
(Registrant's telephone number, including area code)
Securities registered pursuant to Section 12(b) of the Act:
| Title of each class | Name of each exchange on which registered | |
|---|---|---|
| Common Stock, par value $0.0001 per share | The NASDAQ Global Select Market |
Securities registered pursuant to Section 12(g) of the Act: None
Indicate by check mark if the registrant is a well-known seasoned issuer, as defined in Rule 405 of the Securities Act. Yes o No ý
Indicate by check mark if the registrant is not required to file reports pursuant to Section 13 or Section 15(d) of the Act. Yes o No ý
Indicate by check mark whether the registrant (1) has filed all reports required to be filed by Section 13 or 15(d) of the Securities Exchange Act of 1934 during the preceding 12 months (or for such shorter period that the Registrant was required to file such reports), and (2) has been subject to such filing requirements for the past 90 days. Yes ý No o
Indicate by check mark whether the registrant has submitted electronically and posted on its corporate Web site, if any, every Interactive Data File required to be submitted and posted pursuant to Rule 405 of Regulation S-T (§232.405 of this chapter) during the preceding 12 months (or for such shorter period that the registrant was required to submit and post such files). Yes ý No o
Indicate by check mark if disclosure of delinquent filers pursuant to Item 405 of Regulation S-K (§229.405 of this chapter) is not contained herein, and will not be contained, to the best of the registrant's knowledge, in definitive proxy or information statements incorporated by reference in Part III of this Form 10-K or any amendment to this Form 10-K. o
Indicate by check mark whether the registrant is a large accelerated filer, an accelerated filer, a non-accelerated filer, or a smaller reporting company. See definitions of "large accelerated filer," "accelerated filer" and "smaller reporting company" in Rule 12b-2 of the Exchange Act. (Check one):
| Large accelerated filer o | Accelerated filer ý | Non-accelerated filer o (Do not check if a smaller reporting company) |
Smaller reporting company o |
Indicate by check mark whether the registrant is a shell company (as defined in Rule 12b-2 of the Exchange Act). Yes o No ý
Based on the closing price of the registrant's common stock on the NASDAQ Global Select Market on the last business day of the registrant's most recently completed second fiscal quarter, which was June 30, 2014, the aggregate market value of its shares held by non-affiliates held on that date was approximately $544,124,667.
As of March 6, 2015, 38,928,948 shares of common stock were outstanding.
DOCUMENTS INCORPORATED BY REFERENCE
The registrant intends to file a definitive proxy statement pursuant to Regulation 14A in connection with its 2015 Annual Meeting of Stockholders. Portions of such proxy statement are incorporated by reference into Part III of this report.
When we use the terms "Tangoe," the "Company," "we," "us" and "our," we mean Tangoe, Inc. and its consolidated subsidiaries.
Forward-Looking Statements
This annual report on Form 10-K contains forward-looking statements that involve substantial risks and uncertainties. All statements, other than statements of historical facts, included in this annual report regarding our strategy, future operations, future financial position, future revenue, projected costs, prospects, plans and objectives of management are forward-looking statements. The words "anticipate," "believe," "estimate," "expect," "intend," "may," "plan," "target," "would" and similar expressions are intended to identify forward-looking statements, although not all forward-looking statements contain these identifying words. These forward-looking statements include, among other things, statements about:
- •
- our estimates regarding expenses and future revenue;
- •
- our plans to develop, improve and market our products and services;
- •
- the advantages of our products and services as compared to those of others;
- •
- our ability to attract and retain customers;
- •
- our financial performance;
- •
- our ability to establish and maintain intellectual property rights;
- •
- our ability to retain and hire necessary employees and appropriately staff our operations; and
- •
- our estimates regarding capital requirements and needs for additional financing.
We may not actually achieve the plans, intentions or expectations disclosed in our forward-looking statements, and you should not place undue reliance on our forward-looking statements. Actual results or events could differ materially from the plans, intentions and expectations disclosed in the forward-looking statements we make. The important factors discussed below under Part I, Item 1A. "Risk Factors," among others, could cause actual results or events to differ materially from the forward-looking statements that we make. Our forward-looking statements do not reflect the potential impact of any future acquisitions, mergers, dispositions, joint ventures or investments we may make.
You should read this annual report and the documents that we have filed as exhibits to this annual report with the understanding that our actual future results may be materially different from what we expect. We do not assume any obligation to update any forward-looking statements, whether as a result of new information, future events or otherwise, except as required by law.
We expressly qualify in their entirety all forward-looking statements attributable to us or any person acting on our behalf by the cautionary statements contained or referred to in this section.
This annual report also contains market data related to our business and industry. These market data include projections that are based on a number of assumptions. If these assumptions turn out to be incorrect, actual results may differ from the projections based on these assumptions. As a result, our markets may not grow at the rates projected by these data, or at all. The failure of these markets to grow at these projected rates may have a material adverse effect on our business, results of operations, financial condition and the market price of our common stock.
1
Overview
Tangoe is a leading global provider of connection lifecycle management, or CLM, software and services to a wide range of global enterprises and service providers. CLM covers the entire spectrum of an enterprise's connection-based assets and services, such as voice and data services, mobile devices and usage, cloud software, infrastructure and services, machine-to-machine connections, enterprise social and information technology connections, and encompasses the entire lifecycle of these assets and services, including planning and sourcing, procurement and provisioning, inventory and usage management, mobile device management, or MDM, real-time telecommunications expense management, or rTEM, invoice processing and payment, expense allocation and accounting, and asset decommissioning and disposal. Our on-demand Matrix Solution Suite is a suite of software designed to manage IT expenses and to manage and optimize the complex processes and expenses associated with connection lifecycle management. Our Matrix Solution Suite and related services have historically focused on enterprises' fixed and mobile connections, and related assets, usage, expenses and analytics. We have and continue to enhance and expand our software and service offerings by developing and implementing additional capabilities, including capabilities designed to manage the entire range of an enterprise's IT expenses, and to turn on, track, manage, secure and support various connections in an enterprise's connection lifecycle, such as cloud software, infrastructure and services, machine-to-machine, enterprise social and information technology connections. We refer to our Matrix Solution Suite and related service offerings as Matrix.
Our solution can provide a significant return on investment by enabling an enterprise to identify and resolve billing errors, to optimize service plans, licenses and contracts based on usage patterns and needs, to manage used and unused connection assets and services, to proactively monitor usage, to conveniently and accurately pay vendors and to prevent bill overages. Our solution allows enterprises to improve the productivity of their employees by automating the provisioning of connection assets and services, and to reduce costs by controlling and allocating connection expenses. It also allows enterprises to enforce regulatory requirements and internal policies governing the use of connection assets and services. Further, our solution allows enterprises to manage their connection assets and services and helps them improve end user productivity.
Our total revenue increased from $68.5 million in 2010 to $104.9 million in 2011 to $154.5 million in 2012 to $188.9 million in 2013 to $212.5 million in 2014, which is the result of organic growth as well as growth from material acquisitions that we made during 2011 and 2012. We sell our on-demand software and related services primarily on a subscription basis under contracts that typically have terms ranging from 24 to 60 months. Since we began to fully realize the benefits of our recurring revenue model in 2009, our revenue retention rates have been higher than 90%. We measure revenue retention rates by assessing on a dollar basis the recurring technology and services revenue we retain for the same customer and product set in a given period versus the prior year period. We also provide strategic consulting services.
Industry Background and Trends
An enterprise's connections are critical to nearly every aspect of its operations. In the past, an enterprise's connections were largely fixed, consisting of telephones, lines, circuits, switches and fixed networks. However, connection types have expanded to encompass a growing number of diverse technologies and assets, including Voice over IP, virtual networking, converged voice and data communications, mobile computing, video conferencing, text messaging and mobile devices. These advances in communications technologies and the proliferation of mobile devices have greatly increased the financial and personnel resources required for an enterprise to operate and manage its various
2
connections. We estimate that enterprises globally spend approximately $510 billion annually on their fixed and mobile communications services alone. In addition, enterprises around the globe are now facing significant shifts in the complexity and composition of their network of connections, which has evolved to include larger data pipes, various mobile connections, laptops, smartphones, tablets, cloud infrastructure and applications and social networks.
Enterprises need to manage an increasing number of vendors, service options and connection points and a growing volume and complexity of contracts and billing arrangements that support these connection points. Inefficient management of these expenses, including overpayments as a result of billing errors, often results in enterprises incurring significant avoidable expenses.
Enterprises are increasingly seeking solutions to effectively and efficiently manage, control and optimize their expanding connection assets, services, usage and associated expenses. The CLM market provides solutions to help meet this demand. The CLM market consists of the telecommunications expense management, or TEM, market, the managed mobility services, or MMS, market, the enterprise mobility management, or EMM, market, the MDM market and the more general IT expense and connection lifecycle management market. There is currently a large and growing market for CLM.
A number of trends have increased the demand for CLM solutions as enterprises increasingly seek to control their expanding network of connections and IT expenses:
- •
- Growing Connection Types. The growing number of
connection points into the enterprise now requires that the enterprise turn on, track, manage, secure and support the entire lifecycle of various additional connections, such as cloud software,
infrastructure and services, machine-to-machine, enterprise social and information technology connections and related expenses. This complexity in connection points challenges the management
capabilities of many enterprises. The processes, operations and expenses of each connection must be managed in their entirety in order to satisfy the many users across the enterprise, and to ensure
that connection solutions conform with business policy, architecture and broader sourcing strategies.
- •
- Rise of Cloud-Based Solutions. With the continued rise of
cloud applications and infrastructure, designed for both personal and enterprise use, IT teams need visibility and control over all applications and infrastructure being used throughout the enterprise
in order to control spending, reduce risk, and increase productivity. Enterprises require solutions that provide the assurance that resources allocated to cloud are spent efficiently, allowing them to
centrally manage cloud services, infrastructure and expenses, apply automated audits to invoices, gain visibility into hidden charges, identify unused and unknown cloud resources, accurately allocate
cloud assets and expenses, eliminate multiple contracts with the same cloud vendors, obtain data to negotiate existing and future cloud contracts and manage multi-currency environments.
- •
- Complexity of communications service plans. As
communications carriers' offerings have expanded from traditional fixed services to include wireless, data, virtual networking and Voice over IP, service plans and pricing have grown in complexity.
The thousands of available service plans are further complicated by the myriad of available options and corresponding choices in technologies, features, device types and accessories, resulting in
almost limitless combinations.
- •
- Large volume and complexity of communications bills. Carriers maintain a large number of disparate billing systems that result in thousands of invoice formats in many different currencies and languages, making it difficult for global enterprises to normalize, aggregate and analyze their overall communications expenses. Carriers typically bill their enterprise customers on a monthly basis, often sending hundreds to thousands of invoices to many locations within an enterprise. These bills must be routed to the appropriate person, reviewed, validated and processed quickly in order for payment to be remitted on time to avoid penalties, service interruptions or
3
- •
- Growth of mobility. Mobile devices such as the Apple
iPhone and Apple iPad and devices running on Google Android and Microsoft Windows have become an increasingly significant channel for conducting business. While enterprises are deploying an ever
increasing number of mobile devices, employees are also increasingly using corporate applications on their personal mobile devices, a capability commonly referred to as "bring your own device," or
BYOD, and the number of business applications that enterprises are providing to both company-owned and employee-owned mobile devices is growing. Employees are also increasingly using applications not
provided to them by the enterprise to conduct business, known as "bring your own applications" or BYOA. All of these developments impose significant financial and security burdens on enterprises,
require them to rethink their management strategies and create a need for support, logistics and device lifecycle management from onboarding to replacement and end of life.
- •
- Increasing corporate risk and regulation. The
communication, dissemination and storage of data across thousands of mobile devices raise critical issues relating to the protection of sensitive corporation information, compliance with data privacy
regulations and the prevention of dissemination of inappropriate or confidential information. Consumerization of information technology and the increasing prevalence of BYOD are acute trends that
require enterprises to provide data and network access controls and capabilities that extend beyond traditional corporate network firewalls further exposing enterprises to such risks and regulations.
Enterprises need to implement usage policies and access security compliance gateways efficiently across systems and devices in order to comply with applicable laws and need to monitor devices remotely
in order to avoid inappropriate usage and disclosures.
- •
- Globalization of business. As enterprises become more global, they need to manage their communications assets and services in a centralized fashion across vendors, countries of origin and languages. Employees traveling internationally expect to continue to use their mobile devices, potentially creating significant roaming charges and complicating enterprises' ability to optimize their mobile coverage plans to minimize costs. Moreover, many international agencies have adopted regulations, resulting in the need for in-depth understanding of local rules, policies and practices, in addition to multi-lingual billing support.
terminations. Further, the proper allocation of those costs is often difficult due to the limitations and complexity of the billing data.
A variety of homegrown and third-party software products and services have been developed to manage communications and other IT assets, services and expenses. Many of these existing solutions lack the necessary functionality, reliability and scalability. Homegrown services are labor-intensive and have limited functionality. Third-party point solutions address only limited aspects of the connection lifecycle and general resource management software is not specialized for connection assets and services. All of these traditional solutions have proven inadequate to address the growing complexity of connection technologies, devices, service offerings and billing arrangements. As a result, enterprises increasingly are seeking a comprehensive CLM solution that can manage all of their IT and connection assets, services and expenses, provide global capabilities and integrate with third-party enterprise systems, including accounts payable, general ledger and human resources software applications.
Our Solution
We are a leading global provider of CLM software and services. Our on-demand software and related services enable enterprises to manage and optimize the complex processes, expenses and usage policies associated with the complete lifecycle of an enterprise's fixed and mobile connection assets and services. With the continued development of our Matrix Solution Suite, we have added and intend to add software designed to manage additional IT assets and expenses to turn on, track, manage, secure
4
and support various additional connections in an enterprise's connection lifecycle, such as cloud software, infrastructure and services, machine-to-machine, enterprise social and information technology connections.
As of December 31, 2014, we managed a total of $29.7 billion in annual communications expense, of which $7.5 billion is internationally generated and processed through our 97 global invoice processing centers. Our solution is implemented worldwide, currently providing service coverage in over 180 countries and territories in over 125 currencies with support for more than 2,400 different communications carriers and approximately 2,000 different billing formats. Our Matrix user interface is translated into 18 different languages and our solution supports compliance with the requirements of 63 regulatory committees around the world. Our global operations process 24/7 and we process billing and order transactions from communications carriers that represent over 80% of the global communications marketplace.
Key benefits of our solution include:
Comprehensive capabilities. Our solution manages the complex lifecycle of an enterprise's connection assets and services, including planning and sourcing, historic bill audit, procurement and provisioning, corporate systems integration, inventory and usage management, MDM, rTEM, invoice processing and payment, vendor dispute resolution, expense allocation and accounting, forward and reverse logistics, device replacement, help desk and asset decommissioning and disposal.
Reduced expenses. Our solution is designed to provide a significant return on investment by enabling an enterprise to identify and resolve billing errors, to proactively monitor usage and prevent bill overages, and to manage used and unused connection assets and services. Our solution provides additional savings through service plan, license or contract optimization, by preventing unauthorized use of fee-based services and by tracking inventory and usage to identify opportunities to consolidate and replace assets and services with more cost-effective alternatives.
Increased productivity. Our solution enables continuous enterprise connectivity through the rapid provisioning of connection assets and services to new and existing end users. Our solution helps ensure that these assets and services operate at optimal levels, increasing workforce productivity. Our support of customer help desks can alleviate the internal information technology constraints of our customers and can provide more efficient support to end users.
Optimized service agreements. We are able to assist our customers in optimizing their service arrangements and configuring the appropriate service capabilities, rate or fee structures and business terms to meet their overall corporate objectives and needs. To do so, we draw on our extensive experience, our technology, our knowledge of current trends in service contracts and licenses and our familiarity with specific regulatory requirements. We provide these capabilities to customers looking to source new services, negotiate new or existing contracts, or optimize costs and services within existing contracts.
Improved control and visibility. Our on-demand software organizes disparate billing, ordering, asset and usage data into a uniform format, allowing our customers to access, query and analyze their connection expense and asset profile information. Improved control of the billing process helps enterprises ensure they pay their bills on time, avoiding late payments and associated service interruptions. Our software provides our customers with improved visibility to allocate costs among their internal business units as well as to analyze usage patterns and costs. Our software also provides customers proactive and predictive mobile usage alerts allowing them to avoid significant mobile bill overages.
Stronger risk, security and policy management. Our solution allows our customers to manage the financial, legal and reputational risks associated with unauthorized or unintended use of their
5
connection assets and services. It provides our customers with enhanced device security capabilities, allowing additional control of sensitive data amidst the evolving dynamics of the modern communications environment. Our customers can administer user-specific policies, allowing or restricting access to certain applications or websites for designated classes of employees. Our software also permits enterprises to modify security policies wirelessly, including remotely erasing all data and information from a lost, stolen or unreturned mobile device.
Ease of adoption and use. Our on-demand model allows for rapid implementation and adoption of our software. Our software directly interfaces with vendor systems to enable enterprises to quickly transfer billing and order information to and from their vendors without the burden of costly and time-consuming customizations. Our streamlined self-service tools deliver comprehensive capabilities through intuitive, easy-to-use end-user portals. In addition, our software is highly scalable to accommodate the requirements of our customers as they add communications assets and services and is designed to satisfy strict security requirements.
Our Strategy
Our strategy is to maintain and enhance our position as a leading global provider of CLM solutions. In order to build upon our market and technology leadership, we intend to:
Extend solution leadership. We believe that the depth and breadth of our on-demand CLM solution provides us with significant competitive advantages, particularly in addressing the requirements of large enterprises deploying a variety of connection assets and services. We intend to further enhance our service offerings and improve the functionality and performance of our software by continuing to develop and implement additional capabilities and localize our applications for new geographies. In addition, with the continued development of our Matrix Solution Suite, we have added and plan to continue to add software and features designed to manage all IT expenses and to turn on, track, manage, secure and support various connections in an enterprise's connection lifecycle, such as cloud software, infrastructure and services, machine-to-machine, enterprise social and information technology connections.
Broaden existing customer relationships. We plan to leverage our historically high levels of customer satisfaction to increase the connection assets, expenses and services managed by our solution and to cross-sell additional functionality. For example, as its connection infrastructure grows and as we continue to expand our Matrix Solution Suite, a customer may increase the scope of its use of our solution to cover an increased volume and variety of IT expenses and connection points such as mobile devices and service contracts, cloud software, infrastructure and services, machine-to-machine, enterprise social and information technology connections, and also adopt our MDM solutions to obtain additional control over its mobile connections infrastructure.
Acquire new customers. We intend to acquire new customers by marketing our solution to enterprises that either do not currently have a CLM solution or have an inadequate connection asset and service management solution. In addition, many of our customers are divisions or subsidiaries of large enterprises, which provides us with the opportunity to market our solution to the rest of the enterprise, including line-of-business organizations within the enterprise. We intend to continue to expand our customer base, particularly among large enterprises, by hiring additional sales and marketing personnel and by developing and expanding strategic relationships with indirect channel partners.
Expand international presence. The global market for outsourced CLM solutions is at a relatively early stage of development, particularly in Europe, the Asia-Pacific region and Latin America. We intend to leverage the global capabilities of our software to increase our international sales. In addition, we intend to continue to build our global operations by further localizing our software, extending our
6
knowledge and capabilities to support local needs, hiring additional international sales and operations personnel, and targeting new customers in global markets and global operations of existing customers.
Leverage strategic alliances. We continue to develop strategic alliances that we believe will improve our access to additional markets and customers, while also providing incremental value to our customers. These alliances include large and widely recognized technology providers and outsourcers such as Airwatch, HP, IBM, MobileIron, SAP, Xerox Corporation (ACS) and UXC as well as consulting firms having specific presence, brand and value in particular geographic regions such as Advocate, Insight Enterprises, LinkSource Technologies, Liquid Networks, Mobile IT, Mobilit, Profit Enhancement Services, Simplify Corp., Torch and XCUTE BV. We intend to invest in and leverage our existing strategic relationships, package specific alliance solution offerings and build new relationships in order to complement our direct selling efforts and extend our market reach.
Deliver value to and leverage global carriers. Global carriers continually strive to reduce customer attrition, improve customer experience, deliver more value and expand revenue. Our solution helps carriers address these needs and we have seen increasing demand from the carrier market. We believe carriers see opportunity for white-labeling and reselling our solutions to their consumer and enterprise clients, as well as utilizing our solution to provide unique billing aggregation solutions to large strategic clients. We intend to invest in new relationships and leverage existing relationships with AT&T, Bell Mobility, Lime, MTN, Orange Business Services (OBS), Rogers Communications, Telefonica S.A., TMobile, Telstra and Verizon.
Pursue strategic acquisitions. Though it is not part of our current core strategy, we may selectively pursue acquisitions of, or investments in, businesses, services and technologies in an opportunistic manner in order to expand the functionality of our solution, provide access to new markets or customers, and otherwise complement our existing operations.
Software and Services
Matrix Solution Suite
The core of our solution is our Matrix Solution Suite, which is an on-demand suite of software designed to manage and optimize the complex processes and expenses associated with the complete lifecycle of an enterprise's connection assets and services. We have and continue to enhance and expand our software and service offerings by developing and implementing capabilities, including capabilities designed to manage the entire range of an enterprise's IT expenses and to turn on, track, manage, secure and support various connections in an enterprise's connection lifecycle, such as cloud software, infrastructure and services, machine-to-machine, enterprise social and information technology connections. In addition to offering our Matrix Solution Suite on an on-demand basis, our customers can also engage us through our client service group to manage their connection assets and services using a combination of the Matrix Solution Suite and our client services. The services we offer include planning and sourcing, historic bill audit, procurement and provisioning, corporate systems integration, inventory and usage management, MDM, rTEM, invoice processing and payment, dispute resolution, expense allocation and accounting, forward and reverse logistics, device replacement, help desk and asset decommissioning and disposal.
A critical component of the Matrix Solution Suite is our data management technology, which provides the key process automation and integration capabilities necessary for efficient, consolidated data management in the CLM environment. Our data management technology processes and normalizes vendor billing and order-related information for our customers. The Matrix Solution Suite also integrates with our customers' critical third-party enterprise systems, including enterprise resource planning, accounts payable, general ledger and human resources systems, which enables automated, real-time access to and synchronization with employee, accounting, user access authentication and
7
security policy information. The Matrix Solution Suite enables previously disparate, yet highly related, processes and information to be both unified and centralized, resulting in significant operational benefits and cost savings.
The Matrix Solution Suite implements the baseline policies that govern internal and external enterprise connection interactions. Internal policy, vendor contracts, security and business processing rules provide the basis for enterprises to enforce system and user behavior so that they remain in compliance with enterprise standards and regulations. The Matrix Solution Suite also provides our customers with comprehensive business intelligence, including historical, trend and predictive analytics, dashboards and reporting capabilities. Information is provided in real-time with flexible views of activity for all aspects and stages of the connection lifecycle.
Matrix includes software components in the following categories:
- •
- Asset Management;
- •
- Expense Management;
- •
- Usage Management; and
- •
- Analytics.
Each category contains baseline capabilities specific to the business function that it addresses, as well as optional capabilities and services that may be selected as a-la-carte extensions to meet specific customer requirements. Each category can be sold independently or in combination with others. The four categories share key capabilities provided in our core technology platform, including third-party system integration, compliance management, security and policy enforcement, status monitoring, configurable business process rules and business intelligence delivered via standard and ad hoc inquiries, dashboards and reports. Our pricing is based on the functions, software and services that our customers use, as well as the amount of expenses, the volume of transactions and the number of devices to be managed.
Asset Management
The Asset Management components of the Matrix Solution Suite provide full asset procurement, provisioning, tracking and disposal capabilities for fixed and mobile connection assets and services. The Asset Management components track and audit all add, move, change or disconnect service transaction orders and manage all customer assets and services by location, business unit and employee. Our MDM solutions allow our customers to manage and maintain their mobile inventory with wireless, real-time
8
monitoring and remote update functions. Key capabilities of the Asset Management components of the Matrix Solution Suite include:
Capability
|
Description | |
|---|---|---|
| Catalog Management | Customer-configurable catalog of services, devices, features and plans with dynamic access and presentation based on corporate policy and user profile. | |
Procure |
Capture, validation, approval, submission and tracking of fixed and mobile service and equipment orders. Multiple methods of order capture with full policy, authorization and security enforcement are provided based on customer's needs. |
|
Provision |
Establishment of mobile device enterprise connectivity with installation of corporate applications, usage and security policies utilizing wireless provisioning capabilities. |
|
Track |
Tracking of fixed and mobile assets, including information regarding characteristics, configurations, ownership and operational and connectivity status. |
|
Maintain |
Centralized management of mobile devices enabled through on-device software providing security and usage policy enforcement as well as automated mobile policy and mobile application deployments and updates. |
|
Dispose |
Collection, data cleansing and disposal of mobile devices. This service secures corporate data assets and completes the lifecycle of individual connection devices in an environmentally responsible manner. |
9
Expense Management
The Expense Management components of the Matrix Solution Suite provide automated processing and services to manage every aspect of the fixed and mobile connection billing function, from receipt to payment. Key capabilities of the Expense Management components of the Matrix Solution Suite include:
Capability
|
Description | |
|---|---|---|
| Contract Management | Standardized contract repository for all provider agreements, enabling compliance checks of performance and billing against contracted expectations and corporate policies. | |
Billing |
Loading of disparate service and equipment provider invoices into a centralized, normalized billing data repository of all vendor activity. As the billing data is loaded, multiple assurance processes verify all core information has been received and cross-checked for completeness. |
|
Audit |
Comparison of billing data against contracted rates, terms and asset inventories to identify potential discrepancies in actual versus expected charges. The audits are conducted at multiple levels of detail as well as varying degrees of precision based on customer requirements. |
|
Dispute |
Non-compliant billing, service and asset exceptions are disputed with the associated provider and tracked through resolution. |
|
Allocate |
Expense allocation to the appropriate business units, cost centers and employees, with optional accrual of bills not received by the cut-off dates for the accounting period. |
|
Payment |
Predefined business rules automate the invoice approval process to ensure that appropriate corporate controls are applied. Compliant, approved invoices are submitted for automated direct payment or to the customers' accounting systems for allocation and payment. |
|
Optimize |
Optimization of contracts and plans by matching the most efficient rate and term structures to actual usage patterns and trends, creating an optimal expense environment for our customers' unique business circumstances. |
10
Usage Management
The Usage Management components of the Matrix Solution Suite provide enterprises with visibility and control over how connection assets and services are being used through a combination of real-time and historical usage tracking as well as corporate connection and security policy enforcement. These capabilities allow our customers to reduce usage costs and risks while increasing corporate connection governance. Key capabilities of the Usage Management components of the Matrix Solution Suite include:
Capability
|
Description | |
|---|---|---|
| Secure | Containerization, disabling mobile devices and the deletion of corporate data from those devices executed by central administrators or the individual end user through a self-service portal. Enables control over lost or stolen devices. | |
Policy Management |
Rules-based, multi-level information technology security and asset usage policies deployed and managed from a centralized console. |
|
Monitor |
Real-time monitoring of multiple device characteristics for efficient planning and support as well as proactive problem identification and alerting. Our call accounting function monitors the usage of fixed voice assets for fraud detection and misuse of services. |
|
Real-Time |
Plan monitoring and device-specific, real-time management of usage costs, including expenses relating to international roaming, non-contracted services and use of services not compliant with corporate policies. |
|
Compliance |
Enforcement of corporate connection assets and services usage policies through the prevention of user actions and the tracking of non-compliant behavior based on customer requirements. |
|
Performance |
Monitoring and managing wireless server infrastructure performance and mobile device deployment configurations, profiles and policies. |
|
Support |
Multiple-level mobile device assistance available as a full service or in conjunction with existing enterprise help desks. |
Analytics
The Analytics components of the Matrix Solution Suite provide enterprises with visibility and insight into data across many applications, providing accurate, intelligent reporting and analytics, complete with flexible configurations to lower lifecycle connection management costs. Our Analytics solutions include:
Capability
|
Description | |
|---|---|---|
| Benchmarking | Providing enterprises with baseline information that allows them to identify performance gaps and insights and compare themselves with others in their industries or geographic areas. | |
Forecasting |
Enabling enterprises to plan, budget and forecast to transform their entire planning lifecycles, from target setting and budget rollout to reporting, analysis and reforecasting. Forecasting empowers enterprises to rapidly analyze data, model business requirements and collaborate on plans, budgets and forecasts to uncover hidden business options and optimize performance. |
|
Business Intelligence Insight |
Aggregating data from multiple sources, providing key performance indicators and helping enterprises respond to developing trends, and access, interact with and personalize content in a way that supports how they make decisions. |
11
Strategic Consulting and Other Services
We offer a comprehensive set of strategic consulting services that address all areas of CLM for fixed and mobile environments. These services can be contracted separately or in conjunction with the Matrix Solution Suite.
Our strategic consulting services offerings include:
- •
- Sourcing. We assist our customers with reviewing and
negotiating contracts with communications carriers and other vendors. Many of our consultants have past employment experience with major communications carriers and a broad and deep knowledge of the
various communications service plans and contracts currently available.
- •
- Strategic Advisory Service. We provide our clients with
peer comparison analysis and benchmarking, market insight into best practices and trends and key performance indictors aligned with long term performance measurements customized to meet their
strategic business initiatives.
- •
- Bill auditing. We work with our customers to identify
billing errors and other issues related to usage and contract activity.
- •
- Inventory optimization. We advise our customers on how to
align their current asset and service inventories with their business objectives.
- •
- Mobile Advisory Service. We provide our customers with a
mobile lifecycle advisory service designed to provide an objective assessment of mobile management maturity. The service evaluates how well-suited an enterprise's skill sets, operational processes and
management tools are to take full advantage of the mobile revolution. As part of our mobile lifecycle advisory service offerings, our BYOD advisory service provides enterprises access to a team of
experts and proprietary information and processes to help guide them through the assessment, execution and transition phases of implementing a BYOD model.
- •
- Mobile optimization. We aid our customers in aligning
their mobile policies, assets, contracts and requirements.
- •
- Policy administration. We work with our customers to
formulate policies concerning the appropriate use of connection assets and services. In addition, we help our customers develop best-practice policies regarding risk mitigation, entitlements, cost
management, liability models, cost allocation methodologies and positive behavioral management.
- •
- Mobile lifecycle. We can assess our customers' mobile
communications assets and networks, ranging from mobile devices, operating systems and application management to supporting processes around activation, management, expense and support services and
make recommendations about reducing expense and improving operational efficiency, utilization, service levels and end-user productivity. This service is able to take into account customers' desires to
leverage their mobile communications assets and networks to drive productivity as well as customers' other tactical challenges.
- •
- Cloud advisory service. We can assess our customers' cloud environments to help them make decisions around current and future investments, control costs and minimize risks.
We also offer standard implementation services, including data conversion, system configuration, process review and corporate system integration, to assist our customers in the setup and deployment of the Matrix Solution Suite.
12
Technology
Our on-demand Matrix Solution Suite is designed to be accessible, scalable and secure. Our customers access our software through a standard web browser without requiring any changes in their network or information technology infrastructures. Our applications are highly scalable to accommodate the requirements of our customers as they grow or add connection assets, services and users. The Matrix Solution Suite is also designed to satisfy strict security requirements. We use advanced security technologies and protocols to provide security for the data that is transmitted and transactions that are processed through our software. In addition, our technology segregates each customer's data to ensure that there is no comingling of confidential information. We also provide our customers with the ability to set extensive rules and permissions within their enterprises. The Matrix Solution Suite is also deployable on a customer's premises or as a dedicated hosted solution in our data centers to meet their specific information technology or business requirements. Currently a small minority of fixed telecom expense management customers and all MDM customers use our solutions as either a dedicated hosted or on-premise solution. Our data management middleware technology provides the key process automation and integration capabilities necessary for efficient consolidated data management in the CLM environment. Using our data management technology, the Matrix Solution Suite processes and normalizes the high volumes of disparate billing and ordering data from the legacy systems of hundreds of vendors globally into standardized, actionable information. Our flexible and scalable data management technology allows us to provide highly leveraged services to manage this information, removing significant processing complexity and maintenance responsibilities from our customers. Our data management technology and standard system interfaces provide bi-directional data processing transfer and integration with third-party service and equipment providers. The technology also integrates with third-party enterprise accounting and human resource systems to provide a closed-looped environment within existing enterprise systems.
Data Centers
We host our solutions in eleven data centers, all of which are either SAS70/SSAE16 or ISO 27001 certified. AT&T operates our data centers in Secaucus, New Jersey and the Netherlands; Data Foundry operates our data center in Austin, Texas; iWeb Technologies operates our data center in Montreal, Canada; NTT Communications operates one of our data centers in Slough, United Kingdom and our data center in London, United Kingdom; FireHost operates our other data center in Slough, United Kingdom; Amazon Web Services operates our data centers in Sydney, Australia and Dublin, Ireland; Verizon Business operates our data center in Billerica, Massachusetts and SunGard operates our data center in Nashville, Tennessee.
We operate all of the servers, systems and networks at the five colocation hosting facilities in the United States, and leverage data center personnel to help operate servers, systems and networks at our fully managed and virtual private data centers in England, Canada, the Netherlands, Ireland and Australia.
We utilize monitoring technology that continuously checks the servers and key underlying components at regular intervals for availability and performance, ensuring availability to our customers. We also have a site operations team for each data center that provides system management, maintenance, monitoring and back-up. Our agreements with our customers contain guarantees regarding specified levels of system availability, and we regularly provide our customers with performance reports against those standards.
Each data center provides security measures, redundant environmental controls, sophisticated fire suppression systems and redundant electrical generators. To facilitate data loss recovery, we operate a multi-tiered system configuration with load-balanced web server pools, replicated database servers and fault-tolerant storage devices. The architecture is designed to ensure near real-time data recovery in the
13
event of a malfunction of a primary server. Based on customer requirements, we can also provide near real-time asynchronous data replication between operational and disaster recovery backup sites.
Acquisitions and General Development of Business
In addition to developing and growing our business internally, we have selectively acquired businesses to address key emerging trends in our marketplace, expand our solution, increase our operational efficiencies and gain access to additional markets and customers. In 2005 and 2006, our solution focused primarily on fixed communications management, and we were in the initial stages of developing capabilities related to wireless communications management. Three acquisitions during 2007 and 2008 added wireless functionality to our pre-existing fixed communications products, international capabilities, enhancement of our product functionality, enlargement of our customer base and MDM capabilities.
On January 25, 2011, we acquired substantially all of the assets of HCL Expense Management Services Inc., or HCL-EMS, a provider of telecommunications expense management, invoice processing and mobility management solutions. On March 16, 2011, we acquired substantially all of the assets of the telecommunications expense management division of Telwares, Inc. and its subsidiary Vercuity Solutions, Inc., or Telwares. The objectives of these acquisitions were the strategic expansion of our operations and enlargement of our customer base, with the potential to cross-sell to the customers of HCL-EMS and Telwares the capabilities of our existing solution that were not encompassed by the product offerings of HCL-EMS and Telwares, respectively, and through these acquisitions we added more than 100 customers with aggregate annual telecommunications expense under management in excess of $3.0 billion as of March 31, 2011. We are substantially finished migrating the customers of HCL-EMS to our platforms, and the few remaining customers who have not migrated are in the process of migration or are in negotiations to extend their contracts with us. We have completed the migration of the acquired Telwares customers to our platforms, which has had a positive effect on our gross margins, as our platforms currently operate at higher gross margins than the legacy Telwares platform.
On December 19, 2011, we acquired ProfitLine, Inc., or ProfitLine, a provider of telecommunications expense management, invoice processing and mobility management solutions. The objectives of our acquisition of ProfitLine were the strategic expansion of our operations and enlargement of our customer base, with the potential to cross-sell to the customers of ProfitLine the capabilities of our existing solution that were not encompassed by the product offerings of ProfitLine. Through this acquisition we added more than 50 customers. We continue to migrate the customers of ProfitLine to our platforms.
On January 10, 2012, we acquired all of the outstanding equity of Anomalous Networks, Inc., or Anomalous, a provider of rTEM solutions. The objectives of our acquisition of Anomalous were the addition of rTEM and machine-to-machine expense management capabilities to our solution, as well as the establishment of strategic carrier alliance relationships through which to expand our sales channels for our existing solution capabilities. The integration of Anomalous allows us to cross-sell its capabilities to our existing customers as well as expand our CLM solution to include predictive cost intelligence, bill shock prevention, machine-to-machine and geo-fencing (GPS device tracking) capabilities. Anomalous also provides a rapid deployment, end-user configurable mobile cost management capability for businesses and carriers of all sizes. Through this acquisition we added more than 55 enterprise customers.
On February 21, 2012, we acquired all of the issued share capital of ttMobiles Limited, or ttMobiles, a provider of mobile communications management solutions and services based in the United Kingdom. The objectives of our acquisition of ttMobiles were the acceleration of our European expansion and enhancement of our ability to implement and service global programs by leveraging ttMobiles' industry experience and local expertise in Europe and the potential to cross-sell to the
14
customers of ttMobiles the capabilities of our existing solution that were not encompassed by ttMobiles' prior solution. Through this acquisition we added more than 50 enterprise customers.
On August 8, 2012, we acquired substantially all of the assets of the telecommunications expense management business of Symphony Teleca Services, Inc., or Symphony's TEM Business, a provider of telecommunications expense management, invoice processing and mobility management solutions. The objectives of our acquisition of Symphony's TEM Business were the strategic expansion of our operations and enlargement of our customer base, with the potential to cross-sell to the customers of Symphony's TEM Business the capabilities of our existing solution that were not encompassed by the product offerings of Symphony's TEM Business. We continue to migrate the customers of Symphony's TEM Business to our platforms.
On April 18, 2013, we acquired all of the issued share capital of oneTEM GmbH, or oneTEM, a provider of telecommunications-related strategic consulting services in Germany. The objectives of our acquisition of one TEM were to enhance our presence in Germany, to gain domain expertise and resources in the German market and to establish the initial foundation for driving sales of our solutions in the German market.
Though it is not part of our current core strategy, we may selectively pursue acquisitions of, or investments in, businesses, services and technologies in an opportunistic manner in order to expand the functionality of our solution, provide access to new markets or customers, and otherwise complement our existing operations.
Sales and Marketing
We market and sell our solution worldwide primarily through our direct sales force and through indirect distribution alliance and channel partners. Our direct sales efforts involve contact with multiple decision makers, frequently including the prospective customer's chief financial officer, chief information officer and chief technology officer.
Our marketing strategy is to generate qualified sales leads, build our brand and increase market awareness of Tangoe as a leading provider of CLM solutions. These efforts are specifically targeted to information technology executives, finance executives and managers of mobile connection assets and networks and other connection points.
We engage in a variety of marketing activities, including outbound lead generation, demand generation such as e-mail and direct mail campaigns, co-marketing strategies designed to leverage existing strategic relationships, website marketing, topical webcasts, public relations campaigns, speaking engagements and forums and industry analyst visibility initiatives. We participate in and sponsor conferences and demonstrate and promote our software and services at trade shows targeted to information technology and finance executives. We also publish white papers relating to CLM issues and develop customer reference programs, such as customer case studies.
During 2014, we continued to expand our global sales and marketing resources and programs, including modified programs specifically targeted at local markets and needs, complemented by in-region sales personnel. This on-going expansion included additional personnel and programs throughout Europe, Asia Pacific and Latin America.
We actively communicate with our existing customers to enhance customer satisfaction, gain input for future product strategy and promote the adoption of additional software and services throughout the year, including through our Tangoe User Group.
Strategic Alliances
In addition to our direct sales force, we have an indirect distribution channel consisting of strategic alliances. Our strategic alliance partners span a range of categories including value-added resellers,
15
systems integrators, telecommunications providers, communications alliances, consulting firms, technology service providers, business process outsourcers and independent software providers including companies such as Airwatch, Advocate, AT&T, Bell Mobility, IBM, LinkSource Technologies, MobiliseIT, MobileIron, Orange Business Services, Rogers Communications, SAP and Xerox Corporation (ACS). By taking advantage of the existing relationships, customer bases and geographic proximities of our strategic alliance partners, we are able to market our solution to additional markets and prospective customers.
Our strategic alliance partners are typically responsible for lead generation, sales cycle execution and ongoing management of the end customer accounts. In some cases, our strategic alliance partners also provide implementation, operational and value-added consulting services related to our solution, which are typically branded as being provided by the specific partner.
Customers
As of December 31, 2014, approximately 1,100 recurring revenue customers were using our software or services. We consider each independent division or subsidiary of a larger enterprise to be a separate customer due to the fact that each division or subsidiary typically involves a separate sales cycle and contractual relationship. Our customers range from large global, multi-location companies with more than 350,000 employees to single-location companies with as few as 150 employees. For the years ended December 31, 2012, 2013 and 2014, no single end customer or strategic alliance partner accounted for more than 10% of our total revenue.
Research and Development
Our current research and development activities focus on enhancements to our technology platform solutions. Our planned enhancements include:
- •
- substantial user experience and user interface updates;
- •
- a highly configurable and extensible end user portal;
- •
- interactive business intelligence functions;
- •
- key performance indicator and benchmarking functions;
- •
- an enhanced connection asset procurement portal;
- •
- capabilities to enable improved effectiveness and efficiency of interpersonal communications within the enterprise;
- •
- enhanced expense handling for corporate, individual and hybrid liable models, including BYOD;
- •
- expanded capabilities in cloud software and infrastructure asset, expense and usage management;
- •
- expanded capabilities in additional asset, expense and usage management categories and industry verticals;
- •
- creation of vendor interfaces and security models where service and asset providers can access and process expense, asset, usage and
service level agreements benchmarking data for their specific customers;
- •
- capabilities to identify, manage, monetize, allocate and optimize individual usage transactions currently aggregated and hidden within
usage data plans;
- •
- expansion of MDM capabilities and integration of our platform with other providers' MDM software;
- •
- enhanced real-time expense management solutions; and
- •
- enhanced integration middleware architecture.
16
We work closely with our customers while developing our software and services and are responsive to their feedback throughout the process. Our customers provide extensive input regarding a wide variety of user experiences, including through our Tangoe User Group and Customer Solution Groups which we then incorporate into our software and services. Our research and development personnel regularly assist our service and support personnel to address customer inquiries, which creates another mechanism for feedback into the development process.
Our development teams are comprised of both domestic and international employees and independent contractors. We have built the Matrix Solution Suite utilizing commercially available software, including Microsoft, MuleSoft, Oracle, Red Hat and SAP.
Our research and development expenses were $16.7 million, $19.6 million and $22.6 million for 2012, 2013 and 2014, respectively.
Competition
The CLM market is fragmented, competitive and rapidly evolving. We expect to encounter new and evolving competition as this market consolidates and matures and as enterprises become more aware of the advantages and efficiencies that can be attained from the use of specialized software and other technology solutions.
We believe that the principal factors that generally determine a company's competitive advantage in the CLM market include the following:
- •
- ability to deliver asset, expense and usage management globally;
- •
- global scale and capability with local presence, including;
- •
- working knowledge of and processes for handling local tax, regulatory, privacy, supplier and trade matters;
- •
- easily demonstrable cost-effective benefits for customers;
- •
- broad product functionality, vision and ability to provide additional solutions over time;
- •
- rapid deployment and adoption capabilities;
- •
- scalability of systems, business processes and company to handle large volumes of transactions and data effectively and efficiently;
- •
- ability to support large, complex global customer implementations;
- •
- solution bundling and option flexibility during customer purchases;
- •
- ease of use;
- •
- system performance, speed and reliability;
- •
- flexibility and configurability to meet multifaceted customer requirements;
- •
- financial stability and ongoing viability;
- •
- data and process security;
- •
- availability and quality of consulting, training and help-desk services;
- •
- ease of integration with existing applications and data; and
- •
- competitive sales and marketing capabilities.
We believe that we are able to compete effectively in all of these respects.
17
Currently, we categorize our competition as primarily coming from five sources:
- •
- Large multi-national communications providers and technology services companies not currently using our solutions, or offering the
marketplace a range of solutions including ours and competing capabilities such as those offered by Accenture, Dimension Data, IBM and Vodafone;
- •
- Large independent software vendors offering MDM and EMM capabilities such as Cisco (which purchased Meraki) and Good Technology (which
purchased BoxTone);
- •
- Independent software vendors offering cloud expense management solutions such as Aptio, Cloudability, Cloudyn, Cloud Cruiser and Cloud
Checker;
- •
- Independent TEM, MDM, EMM and MMS providers including Calero (which was formed from a merger of Veramark, Movero and Paetec's Pinnacle
business), MDSL and Telesoft; and
- •
- Solutions developed internally by enterprises.
We compete with technology providers and outsourced service providers selling a range of TEM, MDM, EMM, MMS and cloud expense management solutions. Many of our competitors focus on limited or specialized capabilities in one or more aspects of our overall solution such as either fixed or mobile communications, single devices or operating systems, mobile device monitoring, invoice processing, asset procurement, inventory management, bill auditing or contract sourcing, or specific geographic regions. We believe that we are able to compete successfully with these vendors due to our comprehensive, integrated solution, our proven ability to successfully manage large, complex implementations, our global operations, our scalable software that effectively and efficiently handles large volumes of complex transactions, our ability to rapidly deliver cost-effective benefits to our customers, our ability to innovate and continuously provide additional value-add solutions and our flexibility to meet our customers' complex CLM business challenges.
We also compete with resource management solutions and solutions developed internally by enterprises. Resource management solutions often do not have the functionality or tracking capabilities necessary to meet the requirements of the complex and dynamic connection lifecycle. Similarly, many enterprise legacy databases and software systems were not designed to support the connection lifecycle, and building and maintaining a custom solution often requires extensive financial and technical resources that may not be available or cost-effective for most enterprises.
Some of our actual and potential competitors may enjoy greater name recognition, longer operating histories, more varied products and services and larger marketing budgets, as well as substantially greater financial, technical and other resources than we do. In addition, we may also face future competition from new market entrants. For instance, a large communications carrier may develop an MDM solution that is competitive with ours. We believe that our large customer base and our comprehensive and integrated solution position us well to compete effectively in the future.
Intellectual Property
Our intellectual property rights are important to our business. We rely on a combination of patent, copyright, trademark, servicemark, trade secret and other rights in the United States and other jurisdictions, as well as confidentiality procedures and contractual provisions to protect our proprietary technology, processes and other intellectual property. We have twenty-two issued U.S. patents with expiration dates ranging from 2021 to 2032, have filed applications for an additional thirteen U.S. patents and have filed eleven additional patent applications in foreign jurisdictions.
We enter into confidentiality and other written agreements with our employees, customers, consultants and partners, and through these and other written agreements, we attempt to control access to and distribution of our software, documentation and other proprietary technology and other information. Despite our efforts to protect our proprietary rights, third parties may, in an unauthorized
18
manner, attempt to use, copy or otherwise obtain and market or distribute our intellectual property rights or technology or otherwise develop software or services with the same functionality as our software and services. In addition, U.S. patent filings are intended to provide the holder with a right to exclude others from making, using, selling or importing in the United States the inventions covered by the claims of granted patents. Our patents, including our pending patents, if granted, may be contested, circumvented or invalidated. Moreover, the rights that may be granted in those issued and pending patents may not provide us with proprietary protection or competitive advantages, and we may not be able to prevent third parties from infringing those patents. Therefore, the exact benefits of our issued patents and, if issued, our pending patents and the other steps that we have taken to protect our intellectual property cannot be predicted with certainty.
Although the protection afforded by patent, copyright, trademark, servicemark and trade secret law, written agreements and common law may provide some advantages, we believe that the following factors help us maintain a competitive advantage:
- •
- the technological skills of our research and development personnel;
- •
- frequent enhancements to our software and services;
- •
- continued expansion of our proprietary technology; and
- •
- high levels of customer service.
"Tangoe" is a registered trademark in the United States, four other countries and the European Union and is the subject of trademark applications in nine other countries.
Employees
As of December 31, 2014, we had 2,339 full-time employees, of which 716 were in expense management—invoice processing and payment, 235 were in account management, 199 were in help desk services, 169 were in asset management—provisioning, 127 were in implementation, 68 were in dispute management—bill audit, 172 were in sales and marketing, 73 were in strategic consulting, 435 were in research and development and 145 were in general and administration. Of the 2,339 full-time employees, 1,312 were employed in North America, 851 in Asia Pacific region, 161 in Europe and 15 in the Latin American region. None of our employees are represented by labor unions or covered by collective bargaining agreements, except for our subsidiary in Brazil which employs 15 employees, and was required to register as an employer with a Brazilian labor union. Our registration with the union is mandatory under Brazilian law and results in an annual collective bargaining convention that is entered into between our employers' union and applicable employee unions, setting forth minimum terms to be incorporated into our employment relationship, policies and individual employment agreements with our employees in Brazil. We consider our relationship with our employees to be good.
Corporate Information
We were incorporated in Delaware under the name TelecomRFQ, Inc. in February 2000 and changed our name to Tangoe, Inc. in December 2001. Our principal executive offices are located at 35 Executive Boulevard, Orange, Connecticut 06477, and our telephone number is (203) 859-9300. Our website address is www.tangoe.com. Information contained on our website is not incorporated by reference into this annual report. We make available free of charge, on or through the Investor Relations section of our website (investor.tangoe.com), our annual reports on Form 10-K, quarterly reports on Form 10-Q and current reports on Form 8-K, and all amendments to those reports, as soon as reasonably practicable after electronically filing such reports with the Securities and Exchange Commission.
19
Risks Related to Our Business and Our Industry
We have had a history of losses since our incorporation in February 2000.
We were incorporated in February 2000. While we had net income of $3.0 million in 2012, $5.0 million in 2013 and $2.9 million in 2014, we incurred net losses for every fiscal year prior to 2012. Although we were profitable for 2012, 2013 and 2014, we cannot predict if we will be able to maintain profitability in the future. We expect to continue making significant future expenditures to develop and expand our business. As a result of these increased expenditures, we will have to generate and sustain substantially increased revenue to maintain profitability, which we may be unable to do. We may also encounter unforeseen difficulties, complications, product delays and other unknown factors that require additional expenditures. In addition, the percentage growth rates we achieved in prior periods may not be sustainable and we may not be able to increase our revenue sufficiently in absolute dollars to maintain profitability and we may incur significant losses for the foreseeable future.
If the market for connection lifecycle management services does not grow as we expect, our business will be harmed.
The market for connection lifecycle management, or CLM, services is developing, and it is not certain whether these services will achieve market acceptance and sustain high demand. Some businesses have invested substantial personnel and financial resources into developing internal solutions for CLM, so they may not perceive the benefit of our external solution. If businesses do not perceive the benefits of outsourced CLM services, the CLM market may not continue to develop or may develop more slowly than we expect, either of which would reduce our revenue and adversely affect our ability to maintain profitability.
Our quarterly operating results may fluctuate in the future. As a result, we may fail to meet or exceed the expectations of research analysts or investors, which could cause our stock price to decline.
Our quarterly operating results may fluctuate as a result of a variety of factors, many of which are outside of our control. If our quarterly operating results or guidance fall below the expectations of research analysts or investors, the price of our common stock could decline substantially. Fluctuations in our quarterly operating results or guidance may be due to a number of factors, including, but not limited to:
- •
- our ability to attract new customers, obtain renewals from existing customers and increase sales to existing customers;
- •
- the purchasing and budgeting cycles of our customers;
- •
- changes in our pricing policies or those of our competitors;
- •
- the amount and timing of operating costs and capital expenditures related to the operation, maintenance and expansion of our business;
- •
- service outages or security breaches;
- •
- the timing and success of new service introductions and upgrades by us or our competitors;
- •
- the timing and success of implementations for new customers of, and conversions of existing customers to, our invoice and payment
processing software and service solution;
- •
- the timing of costs related to the development or acquisition of technologies, services or businesses;
- •
- the timing of collection of payments from channel partners;
20
- •
- the financial condition of our customers; and
- •
- general economic, industry and market conditions.
In addition, the accounting treatment of the warrant shares that may become issuable to Dell could have an impact on our quarterly operating results. We currently value the warrant shares that are deemed probable of becoming exercisable on a mark-to-market basis until they are earned. Increases or decreases in our stock price will affect the mark-to-market adjustments of the common stock warrant shares, which will increase or decrease contra-revenue charges. The value of the warrant shares will fluctuate until the warrant shares are deemed exercisable and the value is fixed. This accounting treatment is applicable whether or not our Dell-related revenue actually increases or decreases in line with the market value of our common stock, and thus could cause significant fluctuations in our quarterly operating results.
Because we collect and recognize revenue over the terms of our customer agreements, the lack of customer renewals or new customer agreements may not be immediately reflected in our operating results.
We collect and recognize revenue from our customers over the terms of their customer agreements with us. As a result, the aggregate effect of a decline in new or renewed customer agreements in any one quarter would not be fully recognized in our revenue for that quarter and would negatively affect our revenue in future quarters. Consequently, the aggregate effect of significant downturns in sales of our solution would not be fully reflected in our results of operations until future periods. Our subscription model also makes it difficult for us to rapidly increase our revenue through additional sales in any period, as revenue from new customers is generally collected and recognized over the applicable contract term.
If we are unable to retain our existing customers, our revenue and results of operations would grow more slowly than expected or decline and results of operations would be impaired.
We sell our on-demand software products and related services pursuant to agreements that are generally two to five years in duration, and have in some cases acquired businesses with customer contracts with shorter terms. Our customers have no obligation to renew their agreements after their terms expire and some of our customers may terminate their agreements for convenience. These agreements may not be maintained or renewed on the same or on more profitable terms. As a result, our ability to both maintain and grow our revenue depends in part on customer renewals. We may not be able to accurately predict future trends in customer renewals, and our customers' renewal rates may decline or fluctuate because of several factors, including their satisfaction or dissatisfaction with our software products, the prices of our software products, the prices of products and services offered by our competitors or reductions in our customers' spending levels. In addition, customers that are acquired by companies using competing service offerings may be required to begin using those competing service offerings, rather than renew their arrangements with us. If our customers do not renew their agreements for our software products, renew on less favorable terms, or do not purchase additional functionality, our revenue may grow more slowly than expected or decline.
We face intense competition, and our failure to compete successfully would make it difficult for us to add and retain customers and would impede the growth of our business.
The CLM market is highly fragmented, competitive and rapidly evolving. We compete with large multi-national communications providers, technology services companies, large independent software vendors, other independent technology and outsourced service providers selling telecommunications expense management and/or mobile device management solutions as well as with solutions developed internally by enterprises seeking to manage their communications expenses and assets. We compete with other technology and outsourced service providers primarily on the basis of customer references,
21
ability to deliver, breadth of solution and pricing. We and other technology and outsourced service providers compete with internally developed CLM solutions primarily on the basis of the relative cost of implementing a third-party solution as compared to inefficiencies or lack of functionality in internally developed CLM solutions.
The intensity of competition in the CLM market has resulted in pricing pressure as the market has developed. We expect the intensity of competition to increase in the future as existing competitors develop their capabilities and as new companies, which could include mobile technology and solution providers and one or more large independent software vendors, enter our market. Some of these competitors may offer telecommunications expense management and/or mobile device management solutions as part of a broad outsource offering for mobile communications services. Increased competition could result in additional pricing pressure, reduced sales, shorter term lengths for customer contracts, lower margins or the failure of our solution to achieve or maintain broad market acceptance. If we are unable to compete effectively, it will be difficult for us to maintain our pricing rates and add and retain customers, and our business, financial condition and results of operations will be harmed.
Some of our actual and potential competitors may enjoy competitive advantages over us, such as greater name recognition, longer operating histories, more varied services and larger marketing budgets, as well as greater financial, technical and other resources. As a result, our competitors may be able to respond more quickly than we can to new or changing opportunities, technologies, standards or customer requirements or devote greater resources to the promotion and sale of their products and services than we can.
Industry consolidation may result in increased competition.
The CLM market is highly fragmented, and we believe that it is likely that some of our existing competitors will consolidate or will be acquired. Some of our competitors have made or may make acquisitions or may enter into partnerships or other strategic relationships to offer a more comprehensive solution than they individually had offered. In addition, new entrants not currently considered to be competitors may enter the market through acquisitions, partnerships or strategic relationships, such as with Vodafone's acquisitions of TnT Expense Management and Quickcomm in October 2010, Emptoris' acquisition of Rivermine in January 2011 and the subsequent acquisition of Emptoris/Rivermine by IBM in February 2012, Dimension Data's acquisition of Xigo in December 2012 and the merger of Veramark, Movero and the Pinnacle business of Paetec to form Calero in December 2013. We expect these trends to continue as companies attempt to strengthen or maintain their market positions. The companies resulting from such combinations may create more compelling service offerings and may offer greater pricing flexibility than we can or may engage in business practices that make it more difficult for us to compete effectively, including on the basis of price, sales and marketing programs, technology or service functionality. In addition, combinations such as IBM's acquisition of Emptoris/Rivermine may result in situations in which we may begin to compete in some CLM offerings with companies with which we have partnerships or strategic relationships. Any of the competitive pressures described above could result in a substantial loss of customers or a reduction in our revenue.
Invoice and payment processing revenue is subject to risks that could limit this source of revenue.
A portion of our revenue is derived from our invoice and payment processing software and service solution. The processes involved in invoice and payment processing are complex and involve third parties, and if these third parties change their policies or practices, these changes could adversely affect our ability to generate revenues from this solution. In addition, where we bundle invoice and payment processing software and services with other software and services, the amount of invoice and payment processing revenue that we generate could affect the market's view of the overall pricing of our bundle of software and services.
22
We are currently migrating to our platforms the customers of several businesses that we recently acquired and we may in the future expand by acquiring or investing in other businesses, which may divert our management's attention and consume resources that are necessary to sustain our business.
We are currently migrating the customers of HCL-EMS, ProfitLine and Symphony's TEM Business, which we acquired during 2011 and 2012. While to date we have successfully migrated a number of these customers, there can be no assurance that we will complete the migration in a timely manner or at all and the cost of such migration may be more significant than we have estimated. Our business strategy includes the potential future acquisition of, or investment in, complementary businesses, services or technologies. These acquisitions, investments or new business relationships may result in unforeseen difficulties and expenditures. We may encounter difficulties assimilating or integrating the businesses, technologies, products, services, personnel or operations of companies we have acquired or companies that we may in the future acquire. These difficulties may arise if the key personnel of the acquired company choose not to work for us, the company's technology or services do not easily integrate with ours or we have difficulty retaining the acquired company's customers due to changes in its management or for other reasons. These acquisitions may also disrupt our business, divert our resources and require significant management attention that would otherwise be available for development of our business. Moreover, the anticipated benefits of any acquisition, investment or business relationship may not be realized or we may be exposed to unknown liabilities. In addition, any future acquisition may require us to:
- •
- issue additional equity securities that would dilute our stockholders;
- •
- use cash that we may need in the future to operate our business;
- •
- incur debt on terms unfavorable to us or that we are unable to repay;
- •
- incur large charges or substantial liabilities; or
- •
- become subject to adverse tax consequences, substantial depreciation or deferred compensation charges.
If any of these risks materializes, our business and operating results would be harmed.
Our sales cycles can be long, unpredictable and require considerable time and expense, which may cause our operating results to fluctuate.
Our sales cycle, which is the time between initial contact with a potential customer and the ultimate sale, is often lengthy and unpredictable. Some of our potential customers already have partial CLM solutions in place under fixed-term contracts, which limits their ability to commit to purchase our solution in a timely fashion. In addition, our potential customers typically undertake a significant evaluation process that can last six to nine months or more, and which requires us to expend substantial time, effort and money educating them about the capabilities of our offerings and the potential cost savings they can bring to an organization. Furthermore, the purchase of our solution typically also requires coordination and agreement across many departments within a potential customer's organization, which further contributes to our lengthy sales cycle. As a result, we have limited ability to forecast the timing and size of specific sales. Any delay in completing, or failure to complete, sales in a particular quarter or year could harm our business and could cause our operating results to vary significantly.
23
If a communications carrier prohibits customer disclosure of communications billing and usage data to us, the value of our solution to customers of that carrier would be impaired, which may limit our ability to compete for their business.
Certain of the software functionality and services we offer depend on our ability to access a customer's communications billing and usage data. For example, our ability to offer outsourced or automated communications bill auditing, billing dispute resolution, bill payment, cost allocation and expense optimization depends on our ability to access this data. If a communications carrier were to prohibit its customers from disclosing this information to us, those enterprises would only be able to use these billing-related aspects of our solution on a self-serve basis, which would impair the value of our solution to those enterprises. This in turn could limit our ability to compete with the internally developed CLM solutions of those enterprises, require us to incur additional expenses to license access to that billing and usage data from the communications carrier, if such a license is made available to us at all, or put us at a competitive disadvantage against any third-party CLM service provider that licenses access to that data.
Our long-term success depends, in part, on our ability to expand the sales of our solution to customers located outside of the United States, and thus our business is susceptible to risks associated with international sales and operations.
We are currently expanding our international sales and operations, including particularly in the United Kingdom, the Netherlands, Germany, other parts of Europe, Canada, India, China, Australia and Latin America. This international expansion will subject us to new risks that we have not faced in the United States and the countries in which we currently conduct business. These risks include:
- •
- continued geographic localization of our software products, including translation into foreign languages and adaptation for local
practices and regulatory requirements;
- •
- lack of familiarity with and unexpected changes in foreign regulatory requirements;
- •
- longer accounts receivable payment cycles and difficulties in collecting accounts receivable;
- •
- difficulties in managing and staffing international implementations and operations;
- •
- challenges in integrating our software with multiple country-specific billing or communications support systems for international
customers;
- •
- challenges in providing procurement, help desk and fulfillment capabilities for our international customers;
- •
- fluctuations in currency exchange rates;
- •
- potentially adverse tax consequences, including the complexities of foreign value added or other tax systems and restrictions on the
repatriation of earnings;
- •
- the burdens of complying with a wide variety of foreign laws and legal standards;
- •
- increased financial accounting and reporting burdens and complexities;
- •
- potentially slower adoption rates of CLM services internationally;
- •
- political, social and economic instability abroad, terrorist attacks and security concerns in general; and
- •
- reduced or varied protection for intellectual property rights in some countries.
Operating in international markets also requires significant management attention and financial resources. The investment and additional resources required to establish operations and manage growth in other countries may not produce desired levels of revenue or profitability.
24
Further expansion into international markets could require us to comply with additional billing, invoicing, communications, data privacy and similar regulations, which could make it costly or difficult to operate in these markets.
Many international regulatory agencies have adopted regulations related to where and how communications bills may be sent and how the data on such bills must be handled and protected. For instance, certain countries, such as Germany, restrict communications bills from being sent outside of the country, either physically or electronically, and certain countries, such as Brazil, Germany, Italy and Spain, require that certain information be encrypted or redacted before bills may be transmitted electronically. These regulations vary from jurisdiction to jurisdiction and international expansion of our business could subject us to additional similar regulations. Failure to comply with these regulations could result in significant monetary penalties and compliance with these regulations could require expenditure of significant financial and administrative resources.
In addition, personally identifiable information is increasingly subject to legislation and regulations in numerous jurisdictions around the world, the intent of which is to protect the privacy of personal information that is collected, processed and transmitted in or from the governing jurisdiction. Our failure to comply with applicable privacy laws and regulations or any security breakdown that results in the unauthorized release of personally identifiable information or other customer data could result in fines or proceedings by governmental agencies or private individuals, which could harm our results of operations.
If we fail to effectively manage and develop our strategic relationships with our channel partners, or if those third parties choose not to market and sell our solution, our operating results would suffer.
The successful implementation of our strategic goals is dependent in part on strategic relationships with our channel partners to offer our solution to a larger customer base than we can reach through our current direct sales and marketing efforts. Some of our strategic relationships are relatively new and, therefore, it is uncertain whether these third parties will be able to market and sell our solution successfully or provide the volume and quality of customers that we currently expect.
Our success depends in part on the ultimate success of our channel partners and their ability to market and sell our solution. Some of these third parties have previously entered, and may in the future enter, into strategic relationships with our competitors. For example, IBM acquired Emptoris in February 2012, and Rivermine is a subsidiary of Emptoris. Further, many of our channel partners have multiple strategic relationships and they may not regard us as significant to their businesses. Our channel partners may terminate their respective relationships with us, pursue other partnerships or relationships, or attempt to develop or acquire products or services that compete with our solution. Our channel partners also may interfere with our ability to enter into other desirable strategic relationships.
If we are unable to manage and develop our strategic relationships, our potential customer base may grow more slowly than we anticipate and we may have to devote substantially more resources to the distribution, sales and marketing of our solution, which would increase our costs and decrease our earnings.
If we fail to manage our growth effectively, we may be unable to execute our business plan, maintain high levels of service or address competitive challenges adequately.
We increased our number of full-time employees from 541 at December 31, 2010, to 1,004 at December 31, 2011, to 1,383 at December 31, 2012, to 2,059 at December 31, 2013 and to 2,339 at December 31, 2014, and our total revenue from $68.5 million in 2010, to $104.9 million in 2011, to $154.5 million in 2012, to $188.9 million in 2013 and to $212.5 in 2014. Our growth has placed, and may continue to place, a significant strain on our managerial, administrative, operational, financial and other resources. We intend to further expand our overall business, customer base, headcount and
25
operations both domestically and internationally. Growing and managing a global organization and a geographically dispersed workforce will require substantial management effort and significant additional investment in our infrastructure. We will be required to continue to improve our operational, financial and management controls and our reporting procedures and we may not be able to do so effectively.
The loss of key personnel or an inability to attract and retain additional personnel may impair our ability to grow our business.
We are highly dependent upon the continued service and performance of our senior management team and key technical and sales personnel, including our founder, President and Chief Executive Officer, and none of these individuals is party to an employment agreement with us. The replacement of these individuals likely would involve expenditure of significant time and financial resources, and their loss might significantly delay or prevent the achievement of our business objectives.
We plan to continue to expand our work force both domestically and internationally to increase our customer base and revenue. We face intense competition for qualified individuals from numerous technology, software and communications companies. Our ability to achieve significant revenue growth will depend, in large part, on our success in recruiting, training and retaining sufficient numbers of personnel to support our growth. New hires may require significant training and may take significant time before they achieve full productivity. Our recent hires and planned hires may not become as productive as we expect, and we may be unable to hire or retain sufficient numbers of qualified individuals. If our recruiting, training and retention efforts are not successful or do not generate a corresponding increase in revenue, our business will be harmed.
Our software manages and interfaces with our customers' mission-critical networks and systems. Disruptions in the functioning of these networks and systems caused by our software could subject us to substantial liability and damage our reputation.
We assist our customers in the management of their mission-critical communications networks and systems and our software directly interfaces with these networks and systems as well as with enterprise resource planning and other enterprise software and systems. Failures of software could result in significant interruptions in our customers' communications capabilities and enterprise operations. For example, unknown defects in our mobile device management software, or unknown incompatibilities of this software with our customers' mobile devices, could result in losses of functionality of these devices. If such interruptions occur, we may not be able to remedy them in a timely fashion and our customers' ability to operate their enterprises could be severely compromised. Such interruptions could cause our customers to lose revenue and could damage their reputations. In turn, these disruptions could subject us to substantial liabilities and result in irreparable damage to our reputation, delays in payments from our customers or refusals by our customers to make such payments, any of which could harm our business, financial condition or results of operations.
The emergence of one or more widely used, standardized communications devices or billing or operational support systems could limit the value and operability of our solution and our ability to compete with the manufacturers of such devices or the carriers using such systems in providing CLM services.
Our solution derives its value in significant part from our software's ability to interface with and support the interoperation of diverse communications devices, billing systems and operational support systems. The emergence of a single or a small number of widely used communications devices, billing systems or operational support systems using consolidated, consistent sets of standardized interfaces for the interaction between communications service providers and their enterprise customers could significantly reduce the value of our solution to our customers and potential customers. Furthermore, any such communications device, billing system or operational support system could make use of proprietary software or technology standards that our software might not be able to support. In
26
addition, the manufacturer of such device, or the carrier using such billing system or operational support system, might actively seek to limit the interoperability of such device, billing system or operational support system with our software products for competitive or other reasons. The resulting lack of compatibility of our software products would put us at a significant competitive disadvantage, or entirely prevent us from competing, in that segment of the potential CLM market if such manufacturer or carrier, or its authorized licensees, were to develop one or more CLM solutions competitive with our solution.
A continued proliferation and diversification of communications technologies or devices could increase the costs of providing our software products or limit our ability to provide our software products to potential customers.
Our ability to provide our software products is dependent on the technological compatibility of our systems with the communications infrastructures and devices of our customers and their communications service providers. The development and introduction of new communications technologies and devices requires us to expend significant personnel and financial resources to develop and maintain interoperability of our software products with these technologies and devices. The communications industry has recently been characterized by rapid change and diversification in both product and service offerings. Continued proliferation of communications products and services could significantly increase our research and development costs and increase the lag time between the initial release of new technologies and products and our ability to provide support for them in our software products, which would limit the potential market of customers that we have the ability to serve.
We may not successfully develop or introduce new and enhanced software and service offerings, and as a result we may lose existing customers or fail to attract new customers and our revenue may suffer.
Our future financial performance and revenue growth depend upon the successful development, introduction and customer acceptance of new and enhanced versions of our software and service offerings, including enhancements to Matrix to address additional connection types such as cloud software, infrastructure and services, machine-to-machine, enterprise social and information technology connections. We are continually seeking to develop and acquire enhancements to our solution as well as new offerings to supplement our existing solution and we are subject to all of the risks inherent in the development and integration of new technologies, including unanticipated performance, stability, and compatibility problems, any of which could result in material delays in introduction and acceptance, significantly increased costs, adverse publicity and loss of sales. If we are unable to deliver new solutions or upgrades or other enhancements to our existing solution on a timely and cost-effective basis, our business will be harmed.
We may not be able to respond to rapid technological changes with new software products and services, which could harm our sales and profitability.
The CLM market is characterized by rapid technological change and frequent new product and service introductions, driven in part by frequent introductions of new technologies and devices in the communications industry, frequent changes in, and resulting inconsistencies between, the billing platforms utilized by major communications carriers and the changing demands of customers regarding the means of delivery of CLM solutions. To achieve and maintain market acceptance for our solution, we must effectively anticipate these changes and offer software products and services that respond to them in a timely manner. Customers may require features and capabilities that our current solution does not have. If we fail to develop software products and services that satisfy customer preferences in a timely and cost-effective manner, our ability to renew our agreements with existing customers and our ability to create or increase demand for our solution will be harmed.
27
Actual or perceived breaches of our security measures, or governmental required disclosure of customer information could diminish demand for our solution and subject us to substantial liability.
In the processing of communications transactions, we receive, transmit and store a large volume of sensitive customer information, including call records, billing records, contractual terms, and financial and payment information, including credit card information, and we have entered into contractual obligations to maintain the confidentiality of certain of this information. Any person who circumvents our security measures could steal proprietary or confidential customer information or cause interruptions in our operations and any such lapse in security could expose us to litigation, substantial contractual liabilities and loss of customers or damage to our reputation or could otherwise harm our business. We incur significant costs to protect against security breaches and may incur significant additional costs to alleviate problems caused by any breaches. In addition, if we are required to disclose any of this sensitive customer information to governmental authorities, that disclosure could expose us to a risk of losing customers or could otherwise harm our business.
If customers believe that we may be subject to requirements to disclose sensitive customer information to governmental authorities, or that our systems and software products do not provide adequate security for the storage of confidential information or its transmission over the Internet or corporate extranets, or are otherwise inadequate for Internet or extranet use, our business will be harmed. Customers' concerns about security could deter them from using the Internet to conduct transactions that involve confidential information, including transactions of the types included in our solution, so our failure to prevent security breaches, or the occurrence of well-publicized security breaches affecting the Internet in general, could significantly harm our business and financial results.
If we are unable to protect our intellectual property rights and other proprietary information, it will reduce our ability to compete for business.
If we are unable to protect our intellectual property rights and other proprietary information, our competitors could use our intellectual property to market software products similar to our own, which could decrease demand for our solution. We rely on a combination of patent, copyright, trademark, service mark and trade secret laws, as well as confidentiality procedures and contractual restrictions, to establish and protect our intellectual property rights and proprietary information, all of which provide only limited protection. We have twenty-two issued patents and twenty-four patent applications pending. We cannot assure you that our issued patents, any patents that may issue from our patent applications pending or any other intellectual property rights that we currently hold or may in the future acquire will prove to be enforceable in actions against alleged infringers or otherwise provide sufficient protection of any competitive advantages that we may have. In addition, any action that we take to enforce our patents or other intellectual property rights may be costly, time-consuming and a significant diversion of management attention from the continued growth and development of our business.
We endeavor to enter into agreements with our employees and contractors and agreements with parties with whom we do business to limit access to and disclosure of our proprietary information. The steps we have taken, however, may not prevent unauthorized use or the reverse engineering of our technology. Moreover, others may independently develop technologies that are competitive with ours or infringe our intellectual property. Enforcement of our intellectual property rights also depends on our successful legal actions against these infringers, but these actions may not be successful, even when our rights have been infringed.
Furthermore, effective patent, copyright, trademark, service mark and trade secret protection may not be available in every country in which we offer our software products.
28
Assertions by a third party that our software products or technology infringes its intellectual property, whether or not correct, could subject us to costly and time-consuming litigation or expensive licenses.
There is frequent litigation in the communications and technology industries based on allegations of infringement or other violations of intellectual property rights. As we face increasing competition and become increasingly visible as a publicly traded company, the possibility of intellectual property rights claims against us may grow. These claims, whether or not successful, could:
- •
- divert management's attention;
- •
- result in costly and time-consuming litigation;
- •
- require us to enter into royalty or licensing agreements, which may not be available on acceptable terms, or at all; or
- •
- require us to redesign our software products to avoid infringement.
As a result, any third-party intellectual property claims against us could increase our expenses and impair our business.
In addition, although we have licensed proprietary technology, we cannot be certain that the owners' rights in such technology will not be challenged, invalidated or circumvented. Furthermore, many of our customer agreements require us to indemnify our customers for certain third-party intellectual property infringement claims, which could increase our costs as a result of defending such claims and may require that we pay damages if there were an adverse ruling related to any such claims. These types of claims could harm our relationships with our customers, may deter future customers from purchasing our software products or could expose us to litigation for these claims. Even if we are not a party to any litigation between a customer and a third party, an adverse outcome in any such litigation could make it more difficult for us to defend our intellectual property in any subsequent litigation in which we are a named party.
We outsource certain of our research and development activities to third-party contractors, and a loss of or deterioration in these relationships could adversely affect our ability to introduce new software products or enhancements in a timely fashion.
Certain of our research and development activities are carried out by third-party contractors, located both in the United States and abroad. The loss of or deterioration in any of these relationships for any reason could require us to establish alternative relationships or to complete these research and development activities using our internal research and development staff, either of which could result in increased costs to us and impair our ability to introduce new software products or enhancements in a timely fashion. Our use of such third-party contractors also increases the risk that our intellectual property could be misappropriated or otherwise disclosed to our competitors, either of which could harm our competitiveness and harm our future revenue.
Defects or errors in our software products could harm our reputation, impair our ability to sell our products and result in significant costs to us.
Our software products are highly complex and may contain undetected defects or errors, including defects and errors arising from the work of our outsourced development teams, that may result in product failures or otherwise cause our software products to fail to perform in accordance with customer expectations. Because our customers use our software products for important aspects of their businesses, any defects or errors in, or other performance problems with, our software products could hurt our reputation and may damage our customers' businesses. If that occurs, we could lose future sales or our existing customers could elect to not renew their customer agreements with us. Product performance problems could result in loss of market share, failure to achieve market acceptance and
29
the diversion of development resources from software enhancements. If our software products fail to perform or contain a technical defect, a customer might assert a claim against us for damages. We may not have contractual limitations on damages claims that could be asserted against us. Whether or not we are responsible for our software's failure or defect, we could be required to spend significant time and money in litigation, arbitration or other dispute resolution, and potentially pay significant settlements or damages.
We use a limited number of data centers to deliver our software products. Disruption of service at these facilities could harm our business.
We host our software products and serve all of our customers from eleven third-party data center facilities. We do not control the operation of these facilities. AT&T operates our data centers in Secaucus, New Jersey and the Netherlands; Data Foundry operates our data center in Austin, Texas; iWeb Technologies operates our data center in Montreal, Canada; NTT Communications operates one of our data centers in Slough, United Kingdom and our data center in London, United Kingdom; FireHost operates our other data center in Slough, United Kingdom; Amazon Web Services operates our data centers in Sydney, Australia and Dublin, Ireland; Verizon Business operates our data center in Billerica, Massachusetts; and SunGard operates our data center in Nashville, Tennessee. Our agreements for the use of these data center facilities vary in term length, some being month-to-month and others expiring at various dates from 2014 through 2017. The owners of these facilities have no obligation to continue such arrangements beyond their current terms, which are as short as the current month in the case of month-to-month arrangements, nor are they obligated to renew their agreements with us on commercially reasonable terms, or at all. If we are unable to continue such arrangements or renew these agreements on commercially reasonable terms, we may be required to transfer to new data center facilities and we may incur significant costs in connection with doing so. Any changes in third-party service levels at our data centers or any errors, defects, disruptions or other performance problems with our software products could harm our reputation and damage our business. Interruptions in the availability of our software products might reduce our revenue, cause us to issue credits to customers, subject us to potential liability, cause customers to terminate their subscriptions or harm our renewal rates.
While we take precautions such as data redundancy, back-up and disaster recovery plans to prevent service interruptions, our data centers are vulnerable to damage or interruption from human error, intentional bad acts, pandemics, earthquakes, hurricanes, floods, fires, war, terrorist attacks, power losses, hardware failures, systems failures, communications failures and similar events. The occurrence of a natural disaster or an act of terrorism, or vandalism or other misconduct, a decision to close the facilities without adequate notice or other unanticipated problems could result in lengthy interruptions in the availability of our software products.
If we fail to maintain proper and effective internal controls, our ability to produce accurate and timely financial statements could be impaired, which could harm our operating results, our ability to operate our business and investors' views of us.
Ensuring that we have adequate internal financial and accounting controls and procedures in place so that we can produce accurate financial statements on a timely basis is a costly and time-consuming effort that needs to be evaluated frequently. Our internal control over financial reporting constitutes a process designed to provide reasonable assurance regarding the reliability of financial reporting and the preparation of financial statements in accordance with generally accepted accounting principles in the United States of America. Under Section 404 of the Sarbanes-Oxley Act of 2002, or the Sarbanes-Oxley Act, our management is required to evaluate the effectiveness of our internal control over financial reporting as of the end of each fiscal year and to report on this evaluation in our Annual Report on Form 10-K for the year. In addition, so long as we remain an accelerated filer or a large accelerated
30
filer under the rules of the Securities and Exchange Commission, or the SEC, our independent registered public accounting firm will be required to audit our management's annual evaluation of internal control over financial reporting and report on this audit in our Annual Report on Form 10-K for the year. If we are not able to comply with the requirements of Section 404, or if we or our independent registered public accounting firm identify deficiencies in our internal control over financial reporting that are deemed to be material, the market price of our stock may decline and we could be subject to sanctions or investigations by the NASDAQ Stock Market, the SEC or other regulatory authorities.
The technologies in our software products may be subject to open source licenses, which may restrict how we can use or distribute our software products or require that we release the source code of our software products subject to those licenses.
Certain of our software products incorporate so-called "open source" software, and we may incorporate further open source software into our software products in the future. Such open source software is generally licensed by its authors or other third parties under open source licenses. If we fail to comply with these licenses, we may be subject to certain conditions, including requirements that we offer our software products that incorporate the open source software for no cost, that we make available the source code for modifications or derivative works we create based upon, incorporating or using the open source software and that we license such modifications or derivative works under the terms of the particular open source license. If an author or other third party that distributes such open source software were to allege that we had not complied with the conditions of one or more of these licenses, we could be required to incur significant legal expenses defending against such allegations and could be subject to significant damages, enjoined from the sale of our software products that contain the open source software and required to comply with the foregoing conditions.
We provide minimum service-level commitments to many of our customers, and our inability to meet those commitments could result in significant loss of customers, harm to our reputation and costs to us.
Many of our customer agreements currently, and may in the future, require that we meet minimum service level commitments regarding items such as platform availability, invoice processing speed and order processing speed. If we are unable to meet the stated service level commitments under these agreements many of our customers will have the right to terminate their agreements with us and we may be contractually obligated to provide our customers with credits or pay other penalties. If our software products are unavailable for significant periods of time we may lose a substantial number of our customers as a result of these contractual rights, we may suffer harm to our reputation and we may be required to provide our customers with significant credits or pay our customers significant contractual penalties, any of which could harm our business, financial condition, results of operations.
Risks Related to Ownership of Our Common Stock
Insiders have substantial control over us and will be able to influence corporate matters.
As of March 6, 2015, our directors, executive officers and their affiliates beneficially owned, in the aggregate, approximately 11.9% of our outstanding common stock. As a result, these stockholders may be able to exercise significant influence over matters requiring stockholder approval, including the election of directors and approval of significant corporate transactions, such as a merger or other sale of our company or its assets. The stock ownership of these stockholders could limit your ability to influence corporate matters and may have the effect of delaying or preventing a third party from acquiring control over us.
31
Our failure to raise additional capital or generate the cash flows necessary to expand our operations and invest in our software products could reduce our ability to compete successfully.
We may need to raise additional funds, and we may not be able to obtain additional debt or equity financing on favorable terms, if at all. If we raise additional equity financing, our stockholders may experience significant dilution of their ownership interests, and the per-share value of our common stock could decline. If we engage in debt financing, we may be required to accept terms that restrict our ability to incur additional indebtedness and force us to maintain specified liquidity or other ratios. If we need additional capital and cannot raise it on acceptable terms, we may not be able to, among other things:
- •
- develop or enhance our software products;
- •
- continue to expand our research and development and sales and marketing efforts;
- •
- acquire complementary technologies, products or businesses;
- •
- expand our operations, in the United States or internationally;
- •
- hire, train and retain employees; or
- •
- respond to competitive pressures or unanticipated working capital requirements.
An active trading market for our common stock may not be sustained, and investors may not be able to resell their shares at or above the price at which such shares were purchased.
Although we have listed our common stock on The NASDAQ Global Select Market, an active trading market for our shares may not be sustained. In the absence of an active trading market for our common stock, investors may not be able to sell their common stock at or above the prices at which they acquired their shares or at the time that they would like to sell.
Our stock price may be volatile, and the market price of our common stock may decrease.
The market price of our common stock may be subject to significant fluctuations. Our stock price is volatile, and from July 27, 2011, the first day of trading of our common stock, to March 6, 2015, the trading prices of our stock have ranged from $8.01 to $26.05 per share. As a result of this volatility, investors may not be able to sell their common stock at or above the price they paid for it. Some of the factors that may cause the market price of our common stock to fluctuate include:
- •
- fluctuations in our quarterly financial results or the quarterly financial results of companies perceived to be similar to us;
- •
- changes in estimates of our financial results or recommendations by securities analysts;
- •
- failure of any of our software products to achieve or maintain market acceptance;
- •
- changes in market valuations of similar companies;
- •
- success of competitive products or services;
- •
- changes in our capital structure, such as future issuances of securities or the incurrence of debt;
- •
- announcements by us or our competitors of significant products, services, contracts, acquisitions or strategic alliances;
- •
- regulatory developments in the United States, foreign countries or both;
- •
- litigation involving our company, our general industry or both;
- •
- additions or departures of key personnel;
32
- •
- general perception of the future of the CLM market or our software products;
- •
- investors' general perception of us; and
- •
- changes in general economic, industry and market conditions.
In addition, if the market for technology stocks or the stock market in general experiences a loss of investor confidence, the trading price of our common stock could decline for reasons unrelated to our business, financial condition or results of operations. If any of the foregoing occurs, it could cause our stock price to fall and may expose us to class action lawsuits that, even if unsuccessful, could be costly to defend and a distraction to management.
A significant portion of our total outstanding shares may be sold into the public market in the near future, which could cause the market price of our common stock to drop significantly, even if our business is doing well.
Sales of a substantial number of shares of our common stock in the public market could occur at any time. Our outstanding shares of common stock may be freely sold in the public market at any time to the extent permitted by Rules 144 and 701 under the Securities Act of 1933, as amended, which we refer to as the Securities Act, or to the extent such shares have already been registered under the Securities Act and are held by non-affiliates of ours.
In addition, as of March 6, 2015, there were 5,409,235 shares subject to outstanding options and 1,710,782 shares subject to issuance on vesting of outstanding restricted stock units, all of which we have registered under the Securities Act on registration statements on Form S-8. These shares will be able to be freely sold in the public market upon issuance as permitted by any applicable vesting requirements, to the extent applicable. Furthermore, as of March 6, 2015, there were 10,000 shares subject to outstanding warrants. These shares will become eligible for sale in the public market to the extent such warrants are exercised as permitted by any applicable vesting requirements and Rules 144 and 701 under the Securities Act.
If securities or industry analysts do not publish or cease publishing research or reports about us, our business or our market, or if they adversely change their recommendations regarding our stock or if others publish or disseminate unfavorable reports or analyses regarding us, our business, our market or our stock, our stock price could decline.
The trading market for our common stock will be influenced by the research and reports that industry or securities analysts may publish about us, our business, our market or our competitors. If any of the analysts who may cover us adversely change their recommendations regarding our stock, or provide relatively more favorable recommendations about our competitors, our stock price would likely decline. If any analyst who covers us were to cease coverage of our company or fail to regularly publish reports on us, we could lose visibility in the financial markets, which in turn could cause our stock price or trading volume to decline. If others publish or disseminate unfavorable reports or analyses about us, our business, our markets or our stock, our stock price could decline.
Our management will have broad discretion over the use of our cash reserves and might not use such funds in ways that increase the value of your investment.
Our management will have broad discretion to use our cash reserves, if any, and you will be relying on the judgment of our management regarding the application of these funds. Our management might not apply these funds in ways that increase the value of your investment. Our management might not be able to yield a significant return, if any, on any investment of these cash reserves. You will not have the opportunity to influence our decisions on how to use our cash reserves.
33
We do not expect to declare any dividends in the foreseeable future.
We do not anticipate declaring any cash dividends to holders of our common stock in the foreseeable future. Consequently, investors must rely on sales of their common stock after price appreciation, which may never occur, as the only way to realize any future gains on their investment. Investors seeking cash dividends should not purchase our common stock.
Anti-takeover provisions contained in our certificate of incorporation and bylaws, as well as provisions of Delaware law, could impair a takeover attempt.
Our certificate of incorporation, bylaws and Delaware law contain provisions that could have the effect of rendering more difficult or discouraging an acquisition deemed undesirable by our board of directors. Our corporate governance documents include provisions:
- •
- authorizing blank check preferred stock, which could be issued with voting, liquidation, dividend and other rights superior to our
common stock;
- •
- limiting the liability of, and providing indemnification to, our directors and officers;
- •
- limiting the ability of our stockholders to call and bring business before special meetings and to take action by written consent in
lieu of a meeting;
- •
- requiring advance notice of stockholder proposals for business to be conducted at meetings of our stockholders and for nominations of
candidates for election to our board of directors;
- •
- controlling the procedures for the conduct and scheduling of board of directors and stockholder meetings;
- •
- limiting the determination of the number of directors on our board of directors and the filling of vacancies or newly created seats on
the board to our board of directors then in office; and
- •
- providing that directors may be removed by stockholders only for cause.
These provisions, alone or together, could delay hostile takeovers and changes in control of our company or changes in our management.
As a Delaware corporation, we are also subject to provisions of Delaware law, including Section 203 of the Delaware General Corporation Law, which prevents some stockholders holding more than 15% of our outstanding common stock from engaging in certain business combinations without approval of the holders of substantially all of our outstanding common stock. Any provision of our certificate of incorporation or bylaws or Delaware law that has the effect of delaying or deterring a change in control could limit the opportunity for our stockholders to receive a premium for their shares of our common stock and could also affect the price that some investors are willing to pay for our common stock.
34
Item 1B. Unresolved Staff Comments
None.
Our corporate headquarters are located in Orange, Connecticut, where we lease approximately 66,000 square feet. We use this facility for administration, sales and marketing, research and development and customer operations. We lease other facilities throughout the United States as well as in Canada, China, Germany, India, the Netherlands, and the United Kingdom for administration, sales and marketing, research and development and operations and support. We believe that our current facilities are sufficient for our current needs. We intend to add new facilities and expand our existing facilities as we add employees and expand our markets, and we believe that suitable additional or substitute space will be available as needed to accommodate any such expansion of our operations.
We are from time to time subject to various legal proceedings and claims, either asserted or unasserted, which arise in the ordinary course of business. While the outcome of these claims cannot be predicted with certainty, our management does not believe that the outcome of any of these legal matters will have a material adverse effect on our consolidated financial statements.
Item 4. Mine Safety Disclosures
Not applicable.
35
Item 5. Market for Registrant's Common Equity, Related Stockholder Matters and Issuer Purchases of Equity Securities
Market Information
Our common stock has been listed on The NASDAQ Global Market, or alternatively The NASDAQ Global Select Market, under the symbol "TNGO" since July 27, 2011. The following table sets forth, for the periods indicated, the high and low sales prices of our common stock as reported by The NASDAQ Global Market or The NASDAQ Global Select Market, as applicable.
| |
High | Low | |||||
|---|---|---|---|---|---|---|---|
Fiscal Year Ended December 31, 2013 |
|||||||
First Quarter |
$ | 16.50 | $ | 11.68 | |||
Second Quarter |
$ | 16.38 | $ | 11.70 | |||
Third Quarter |
$ | 24.60 | $ | 14.75 | |||
Fourth Quarter |
$ | 26.05 | $ | 14.26 | |||
| |
High | Low | |||||
|---|---|---|---|---|---|---|---|
Fiscal Year Ended December 31, 2014 |
|||||||
First Quarter |
$ | 20.08 | $ | 16.21 | |||
Second Quarter |
$ | 19.12 | $ | 11.33 | |||
Third Quarter |
$ | 15.27 | $ | 12.71 | |||
Fourth Quarter |
$ | 15.13 | $ | 11.35 | |||
Holders
At March 6, 2015, there were 73 holders of record of our common stock.
Dividends
We have not declared or paid any cash dividends on our capital stock since our inception. We currently intend to retain earnings, if any, to finance the growth and development of our business, and we do not expect to pay any cash dividends on our common stock in the foreseeable future. Payment of future dividends, if any, will be at the discretion of our board of directors and will depend on our financial condition, results of operations, capital requirements, restrictions contained in current or future financing instruments, provisions of applicable law and other factors our board deems relevant.
Recent Sales of Unregistered Securities
On June 2, 2014, we issued 710 shares of common stock to Christopher Fraser pursuant to an exercise of a warrant we had granted to him on June 30, 2009. We received proceeds of $1,850 related to this warrant exercise. Such transaction was not registered under the Securities Act of 1933, as amended, which we refer to as the Securities Act. The shares issued upon this warrant exercise were issued in reliance upon the exemption from the registration requirements of the Securities Act provided by Section 4(a)(2) of the Securities Act. No underwriters were involved in such issuance.
36
Purchases of Equity Securities by the Issuer and Affiliated Purchasers
The following table provides information about our repurchases of equity securities during the periods indicated that are registered by us pursuant to Section 12 of the Securities Exchange Act of 1934, as amended:
| Period | (a) Total Number of Shares Purchased(1)(2) |
(b) Average Price Paid per Share(3) |
(c) Total Number of Shares Purchased as Part of Publicly Announced Programs |
(d) Maximum Number (or Approximate Dollar Value) of Shares that May Yet Be Purchased Under the Program(1)(2) |
|||||||||
|---|---|---|---|---|---|---|---|---|---|---|---|---|---|
October 1, 2014 - October 31, 2014 |
— | $ | — | — | $ | 4,711,145 | |||||||
November 1, 2014 - November 30, 2014 |
189,498 | $ | 12.75 | 189,498 | $ | 2,295,770 | |||||||
December 1, 2014 - December 31, 2014 |
117,101 | $ | 12.81 | 117,101 | $ | 28,500,007 | |||||||
| | | | | | | | | | | | | | |
Total |
306,599 | $ | 12.77 | 306,599 | $ | 28,500,007 | |||||||
- (1)
- On
November 28, 2012, we announced that our board of directors had authorized a share repurchase program under which we may repurchase up to
$20 million of our outstanding common stock on the open market or in privately negotiated transactions.
- (2)
- On
November 25, 2014, we announced that our board of directors had authorized another share repurchase program under which we may repurchase up to
$30 million of our outstanding common stock on the open market or in privately negotiated transactions. The $30 million includes $2.3 million of unused funds from the original
$20 million share repurchase program mentioned previously.
- (3)
- The Average Price Paid per Share includes broker commissions.
37
Performance Graph
The following graph compares the relative performance of our common stock, the NASDAQ Composite Index and the NASDAQ Computer & Data Processing Index. This graph covers the period from July 27, 2011 (date of the listing of our common stock on the NASDAQ Global Market in connection with our initial public offering) through December 31, 2014. The graph assumes the investment of $100.00 on July 27, 2011 in our common stock, the NASDAQ Composite Index and the NASDAQ Computer & Data Processing Index, and assumes any dividends are reinvested.
COMPARISON OF 41 MONTH CUMULATIVE TOTAL RETURN*
Among Tangoe, Inc., the NASDAQ Composite Index
and the NASDAQ Computer & Data Processing Index
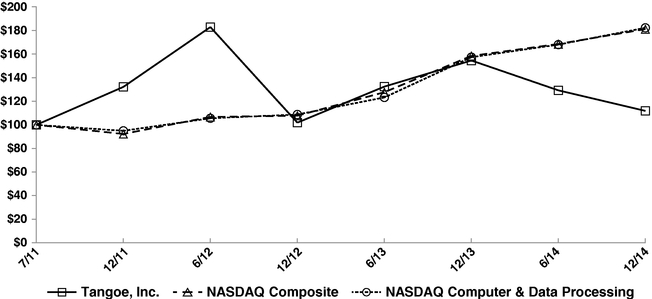
- *
- $100 invested on 7/27/11 in stock or 7/31/11 in index, including reinvestment of dividends. Fiscal year ending December 31.
Company/Index
|
7/27/11 | 12/31/11 | 06/30/12 | 12/31/12 | 6/30/13 | 12/31/13 | 06/30/14 | 12/31/14 | |||||||||||||||||
|---|---|---|---|---|---|---|---|---|---|---|---|---|---|---|---|---|---|---|---|---|---|---|---|---|---|
Tangoe, Inc. |
$ | 100.00 | $ | 132.19 | $ | 182.92 | $ | 101.89 | $ | 132.45 | $ | 154.59 | $ | 129.27 | $ | 111.85 | |||||||||
NASDAQ Composite |
100.00 | 92.31 | 106.75 | 107.77 | 127.69 | 158.44 | 168.59 | 181.19 | |||||||||||||||||
NASDAQ Computer & Data Processing |
100.00 | 94.96 | 105.59 | 108.80 | 123.26 | 157.39 | 168.04 | 182.29 | |||||||||||||||||
38
Item 6. Selected Financial Data
The following tables summarize our consolidated financial data for the periods presented. You should read the following selected consolidated financial data together with our consolidated financial statements and the related notes appearing in Part II, Item 8 of this Annual Report on Form 10-K, the "Management's Discussion and Analysis of Financial Condition and Results of Operations" section in Part II, Item 7 of this Annual Report on Form 10-K and the other financial information appearing elsewhere in this Annual Report on Form 10-K. We have derived the statement of operations data for the years ended December 31, 2012, 2013 and 2014 and the balance sheet data as of December 31, 2013 and 2014 from our audited consolidated financial statements, which are included in this Annual Report on Form 10-K. We have derived the statement of operations data for the year ended December 31, 2010 and 2011 and balance sheet data as of December 31, 2010, 2011 and 2012 from our audited financial statements not included in this Annual Report on Form 10-K. Our historical results for any prior period are not necessarily indicative of results to be expected in any future period.
| |
Years Ended December 31, | |||||||||||||||
|---|---|---|---|---|---|---|---|---|---|---|---|---|---|---|---|---|
| |
2010 | 2011 | 2012 | 2013 | 2014 | |||||||||||
| |
(dollars in thousands, except per share amounts) |
|||||||||||||||
Revenue: |
||||||||||||||||
Recurring technology and services |
$ | 57,703 | $ | 93,671 | $ | 137,979 | $ | 168,484 | $ | 189,467 | ||||||
Strategic consulting, software licenses and other |
10,771 | 11,270 | 16,533 | 20,430 | 23,009 | |||||||||||
| | | | | | | | | | | | | | | | | |
Total revenue |
68,474 | 104,941 | 154,512 | 188,914 | 212,476 | |||||||||||
| | | | | | | | | | | | | | | | | |
Cost of revenue: |
||||||||||||||||
Recurring technology and services |
26,349 | 44,814 | 63,976 | 76,228 | 88,510 | |||||||||||
Strategic consulting, software licenses and other |
3,874 | 5,165 | 6,627 | 8,750 | 8,954 | |||||||||||
| | | | | | | | | | | | | | | | | |
Total cost of revenue(1) |
30,223 | 49,979 | 70,603 | 84,978 | 97,464 | |||||||||||
| | | | | | | | | | | | | | | | | |
Gross profit |
38,251 | 54,962 | 83,909 | 103,936 | 115,012 | |||||||||||
Operating expenses: |
||||||||||||||||
Sales and marketing(1) |
12,281 | 16,648 | 24,840 | 33,382 | 39,433 | |||||||||||
General and administrative(1) |
11,709 | 17,777 | 29,317 | 34,765 | 37,963 | |||||||||||
Research and development(1) |
9,321 | 11,860 | 16,696 | 19,570 | 22,633 | |||||||||||
Depreciation and amortization |
3,529 | 4,551 | 8,666 | 10,452 | 9,779 | |||||||||||
Restructuring charge |
— | 1,549 | — | 654 | — | |||||||||||
| | | | | | | | | | | | | | | | | |
Income from operations |
1,411 | 2,577 | 4,390 | 5,113 | 5,204 | |||||||||||
Other income (expense), net: |
||||||||||||||||
Interest expense |
(2,007 | ) | (3,047 | ) | (943 | ) | (401 | ) | (103 | ) | ||||||
Interest income |
19 | 45 | 80 | 60 | 35 | |||||||||||
Other income (expense) |
3 | — | (9 | ) | 1,201 | 114 | ||||||||||
Increase in fair value of warrants for redeemable convertible preferred stock |
(884 | ) | (1,996 | ) | — | — | — | |||||||||
| | | | | | | | | | | | | | | | | |
(Loss) income before income tax provision |
(1,458 | ) | (2,421 | ) | 3,518 | 5,973 | 5,250 | |||||||||
Income tax provision |
294 | 534 | 480 | 1,011 | 2,314 | |||||||||||
| | | | | | | | | | | | | | | | | |
Net (loss) income |
(1,752 | ) | (2,955 | ) | 3,038 | 4,962 | 2,936 | |||||||||
Preferred dividends |
(3,715 | ) | (2,168 | ) | — | — | — | |||||||||
Accretion of redeemable convertible preferred stock |
(64 | ) | (37 | ) | — | — | — | |||||||||
| | | | | | | | | | | | | | | | | |
(Loss) income applicable to common stockholders |
$ | (5,531 | ) | $ | (5,160 | ) | $ | 3,038 | $ | 4,962 | $ | 2,936 | ||||
| | | | | | | | | | | | | | | | | |
| | | | | | | | | | | | | | | | | |
| | | | | | | | | | | | | | | | | |
(Loss) income per common share: |
||||||||||||||||
Basic |
$ | (1.26 | ) | $ | (0.31 | ) | $ | 0.08 | $ | 0.13 | $ | 0.08 | ||||
| | | | | | | | | | | | | | | | | |
| | | | | | | | | | | | | | | | | |
| | | | | | | | | | | | | | | | | |
Diluted |
$ | (1.26 | ) | $ | (0.31 | ) | $ | 0.08 | $ | 0.12 | $ | 0.07 | ||||
| | | | | | | | | | | | | | | | | |
| | | | | | | | | | | | | | | | | |
| | | | | | | | | | | | | | | | | |
Weighted average number of common share: |
||||||||||||||||
Basic |
4,399 | 16,412 | 36,492 | 37,706 | 38,642 | |||||||||||
| | | | | | | | | | | | | | | | | |
| | | | | | | | | | | | | | | | | |
| | | | | | | | | | | | | | | | | |
Diluted |
4,399 | 16,412 | 39,870 | 40,472 | 41,157 | |||||||||||
| | | | | | | | | | | | | | | | | |
| | | | | | | | | | | | | | | | | |
| | | | | | | | | | | | | | | | | |
39
| |
Years Ended December 31, | |||||||||||||||
|---|---|---|---|---|---|---|---|---|---|---|---|---|---|---|---|---|
| |
2010 | 2011 | 2012 | 2013 | 2014 | |||||||||||
| |
(dollars in thousands, except per share amounts) |
|||||||||||||||
Other financial data: |
||||||||||||||||
Adjusted EBITDA(2) |
$ | 6,894 | $ | 12,749 | $ | 22,296 | $ | 29,684 | $ | 33,875 | ||||||
| | | | | | | | | | | | | | | | | |
| | | | | | | | | | | | | | | | | |
| | | | | | | | | | | | | | | | | |
- (1)
- Includes stock-based compensation as follows:
| |
Years Ended December 31, | ||||||||||||||||
|---|---|---|---|---|---|---|---|---|---|---|---|---|---|---|---|---|---|
| |
2010 | 2011 | 2012 | 2013 | 2014 | ||||||||||||
| |
(dollars in thousands) |
||||||||||||||||
Cost of revenue: |
|||||||||||||||||
Stock-based compensation |
$ | 323 | $ | 669 | $ | 1,347 | $ | 2,108 | $ | 3,873 | |||||||
Sales and marketing: |
|||||||||||||||||
Stock-based compensation |
425 | 1,201 | 2,133 | 3,941 | 5,065 | ||||||||||||
General and administrative: |
|||||||||||||||||
Stock-based compensation |
1,032 | 1,934 | 5,105 | 6,220 | 6,802 | ||||||||||||
Research and development: |
|||||||||||||||||
Stock-based compensation |
148 | 176 | 580 | 990 | 2,758 | ||||||||||||
| | | | | | | | | | | | | | | | | | |
Total stock-based compensation |
$ | 1,928 | $ | 3,980 | $ | 9,165 | $ | 13,259 | $ | 18,498 | |||||||
| | | | | | | | | | | | | | | | | | |
| | | | | | | | | | | | | | | | | | |
| | | | | | | | | | | | | | | | | | |
Amortization of intangibles: |
|||||||||||||||||
Acquisition-related intangibles amortization |
$ | 2,276 | $ | 2,960 | $ | 6,669 | $ | 8,103 | $ | 7,156 | |||||||
| | | | | | | | | | | | | | | | | | |
| | | | | | | | | | | | | | | | | | |
| | | | | | | | | | | | | | | | | | |
- (2)
- We define Adjusted EBITDA as net income (loss) plus interest expense, other expense, income tax provision, depreciation and amortization, amortization of marketing agreement intangible assets, stock-based compensation expense, increase in fair value of warrants for redeemable convertible preferred stock and restructuring charge less amortization of leasehold interest, interest income and other income. Adjusted EBITDA is a financial measure that is not calculated in accordance with GAAP. The table below provides a reconciliation of this non-GAAP financial measure to the most directly comparable financial measure calculated and presented in accordance with GAAP. Adjusted EBITDA should not be considered as an alternative to net income (loss), operating income or any other measure of financial performance calculated and presented in accordance with GAAP. Our Adjusted EBITDA may not be comparable to similarly titled measures of other organizations because other organizations may not calculate Adjusted EBITDA in the same manner as we do. We prepare Adjusted EBITDA to eliminate the impact of items that we do not consider indicative of our core operating performance. You are encouraged to evaluate these adjustments and the reason we consider them appropriate.
We believe that Adjusted EBITDA is useful to investors in evaluating our operating performance for the following reasons:
- •
- Adjusted EBITDA is widely used by investors to measure a company's operating performance without regard to items, such as interest
expense, interest income, income tax provision, depreciation and amortization, and stock-based compensation expense, that can vary substantially from company to company depending upon their financing
and accounting methods, the book value of their assets, their capital structures and the method by which their assets were acquired;
- •
- securities analysts use Adjusted EBITDA as a supplemental measure to evaluate the overall operating performance of companies; and
- •
- we adopted the authoritative guidance for stock-based payments on January 1, 2006 and recorded stock-based compensation expense of approximately $1,928,000, $3,980,000, $9,165,000, $13,259,000 and $18,498,000 for the years ended December 31, 2010, 2011, 2012, 2013 and 2014, respectively. Prior to January 1, 2006, we accounted for stock-based compensation expense using the intrinsic value method under previously authorized guidance, which did not result in any stock-based compensation expense. By comparing our Adjusted EBITDA in different historical periods, our investors can evaluate our operating results without the additional variations caused by stock-based compensation expense, which is not comparable from year to year due to changes in accounting treatment and is a non-cash expense that is not a key measure of our operations.
40
Our management uses Adjusted EBITDA:
- •
- as a measure of operating performance because it does not include the impact of items not directly resulting from our core business;
- •
- for planning purposes, including the preparation of our annual operating budget;
- •
- to evaluate the effectiveness of our business strategies; and
- •
- in communications with our board of directors concerning our financial performance.
We understand that, although Adjusted EBITDA is frequently used by investors and securities analysts in their evaluations of companies, Adjusted EBITDA has limitations as an analytical tool, and you should not consider it in isolation or as a substitute for analysis of our results of operations as reported under GAAP. Some of these limitations are:
- •
- Adjusted EBITDA does not reflect our cash expenditures or future requirements for capital expenditures or other contractual
commitments;
- •
- Adjusted EBITDA does not reflect changes in, or cash requirements for, our working capital needs;
- •
- Adjusted EBITDA does not reflect interest expense or interest income;
- •
- Adjusted EBITDA does not reflect cash requirements for income taxes; and
- •
- Adjusted EBITDA may not be calculated similarly from company to company.
41
The following table represents a reconciliation of Adjusted EBITDA to net (loss) income, the most comparable GAAP measure, for each of the periods indicated.
| |
Years Ended December 31, | |||||||||||||||
|---|---|---|---|---|---|---|---|---|---|---|---|---|---|---|---|---|
Reconciliation of Adjusted EBITDA to Net (Loss) Income
|
2010 | 2011 | 2012 | 2013 | 2014 | |||||||||||
| |
(dollars in thousands) |
|||||||||||||||
Net (loss) income |
$ | (1,752 | ) | $ | (2,955 | ) | $ | 3,038 | $ | 4,962 | $ | 2,936 | ||||
Interest expense |
2,007 | 3,047 | 943 | 401 | 103 | |||||||||||
Interest income |
(19 | ) | (45 | ) | (80 | ) | (60 | ) | (35 | ) | ||||||
Income tax provision |
294 | 534 | 480 | 1,011 | 2,314 | |||||||||||
Depreciation and amortization |
3,529 | 4,551 | 8,666 | 10,452 | 9,779 | |||||||||||
Amortization of marketing agreement intangible assets |
26 | 92 | 174 | 305 | 493 | |||||||||||
Amortization of leasehold interest |
— | — | (99 | ) | (99 | ) | (99 | ) | ||||||||
Stock-based compensation expense |
1,928 | 3,980 | 9,165 | 13,259 | 18,498 | |||||||||||
Other (income) expense |
(3 | ) | — | 9 | (1,201 | ) | (114 | ) | ||||||||
Restructuring charge |
— | 1,549 | — | 654 | — | |||||||||||
Increase in fair value of warrants for redeemable convertible preferred stock |
884 | 1,996 | — | — | — | |||||||||||
| | | | | | | | | | | | | | | | | |
Adjusted EBITDA |
$ | 6,894 | $ | 12,749 | $ | 22,296 | $ | 29,684 | $ | 33,875 | ||||||
| | | | | | | | | | | | | | | | | |
| | | | | | | | | | | | | | | | | |
| | | | | | | | | | | | | | | | | |
Balance sheet data:
|
2010 | 2011 | 2012 | 2013 | 2014 | |||||||||||
|---|---|---|---|---|---|---|---|---|---|---|---|---|---|---|---|---|
| |
(dollars in thousands) |
|||||||||||||||
Cash and cash equivalents |
$ | 5,913 | $ | 43,407 | $ | 50,211 | $ | 43,182 | $ | 51,279 | ||||||
Accounts receivable, net |
14,295 | 25,311 | 38,309 | 43,273 | 56,948 | |||||||||||
Working capital (excluding deferred revenue- current portion)(1) |
8,591 | 48,572 | 47,993 | 70,560 | 93,712 | |||||||||||
Intangible assets |
15,785 | 28,800 | 44,249 | 36,637 | 28,753 | |||||||||||
Goodwill |
17,636 | 36,266 | 65,825 | 65,963 | 65,348 | |||||||||||
Total assets |
58,744 | 140,862 | 207,268 | 198,844 | 215,012 | |||||||||||
Accounts payable and accrued expenses |
6,667 | 13,666 | 21,163 | 18,441 | 19,016 | |||||||||||
Deferred revenue-current portion |
8,304 | 9,051 | 9,648 | 9,063 | 10,858 | |||||||||||
Notes payable, including current portion |
18,122 | 16,194 | 22,574 | 2,034 | 1,566 | |||||||||||
Redeemable convertible preferred stock |
61,441 | — | — | — | — | |||||||||||
Stockholders' (deficit) equity |
(42,022 | ) | 96,589 | 148,620 | 164,012 | 178,170 | ||||||||||
- (1)
- These amounts are derived by taking the working capital of $287 for 2010, $39,521 for 2011, $38,345 for 2012, $61,497 for 2013 and $82,854 for 2014, and excluding deferred revenue—current portion, which is a non-cash obligation.
42
Item 7. Management's Discussion and Analysis of Financial Condition and Results of Operations
You should read the following discussion and analysis of our financial condition and results of operations together with our financial statements and the related notes and other financial information included elsewhere in this Annual Report on Form 10-K. Some of the information contained in this discussion and analysis or set forth elsewhere in this Annual Report on Form 10-K, including information with respect to our plans and strategy for our business and related financing, include forward-looking statements that involve risks and uncertainties. You should review the "Risk Factors" and "Forward-Looking Statements" sections of this Annual Report on Form 10-K for a discussion of important factors that could cause actual results to differ materially from the results described in or implied by the forward-looking statements contained in the following discussion and analysis.
Overview
Tangoe is a leading global provider of connection lifecycle management, or CLM, software and services to a wide range of global enterprises and service providers. CLM covers the entire spectrum of an enterprise's connection-based assets and services, such as voice and data services, mobile devices and usage, cloud software, infrastructure and services, machine-to-machine connections, enterprise social and information technology connections, and encompasses the entire lifecycle of these assets and services, including planning and sourcing, procurement and provisioning, inventory and usage management, mobile device management, or MDM, real-time telecommunications expense management, or rTEM, invoice processing and payment, expense allocation and accounting, and asset decommissioning and disposal. Our on-demand Matrix Solution Suite is a suite of software designed to manage IT expenses and to manage and optimize the complex processes and expenses associated with this connection lifecycle management. Our Matrix Solution Suite and related services have historically focused on enterprises' fixed and mobile connections, and related assets, usage, expenses and analytics. We have and continue to enhance and expand our software and service offerings by developing and implementing additional capabilities, including capabilities designed to manage the entire range of an enterprise's IT expenses, and to turn on, track, manage, secure and support various connections in an enterprise's connection lifecycle, such as cloud software, infrastructure and services, machine-to-machine, enterprise social and information technology connections. We refer to our Matrix Solution Suite and related service offerings as Matrix.
Our solution can provide a significant return on investment by enabling an enterprise to identify and resolve billing errors, to optimize service plans, licenses and contracts based on usage patterns and needs, to manage used and unused connection assets and services, to proactively monitor usage, to conveniently and accurately pay vendors and to prevent bill overages. Our solution allows enterprises to improve the productivity of their employees by automating the provisioning of connection assets and services, and to reduce costs by controlling and allocating connection expenses. It also allows enterprises to enforce regulatory requirements and internal policies governing the use of connection assets and services. Further, our solution allows enterprises to manage their connection assets and services and helps them improve end user productivity.
We designed our business model to sell recurring technology and services leveraging our Matrix Solution Suite. We review three key business metrics to help us monitor the performance of our business model and to identify trends affecting our business. The measures that we believe are the primary indicators of our quarterly and annual performance are as follows:
Adjusted EBITDA. We define Adjusted EBITDA as net income (loss) plus interest expense, other expense, income tax provision, depreciation and amortization, amortization of marketing agreement intangible assets, stock-based compensation expense and restructuring charge less amortization of leasehold interest, interest income and other income. Our management uses Adjusted EBITDA to measure our operating performance because it does not include the impact of items not directly
43
resulting from our core business and certain non-cash expenses such as depreciation and amortization and stock-based compensation. We believe that this measure provides us with additional useful information to measure and understand our performance on a consistent basis, particularly with respect to changes in performance from period to period. We use Adjusted EBITDA in the preparation of our annual operating budgets and to measure and evaluate the effectiveness of our business strategies. Adjusted EBITDA is not calculated in accordance with generally accepted accounting principles in the United States of America, or GAAP, and is not a substitute for or superior to financial measures determined in accordance with GAAP. Other companies in our industry may calculate Adjusted EBITDA in a manner differently from us, which reduces its usefulness as a comparative measure. Our Adjusted EBITDA has increased annually for each fiscal year since 2007 and we expect it to continue to increase in our fiscal year ending December 31, 2015. For further discussion regarding Adjusted EBITDA and a reconciliation of Adjusted EBITDA to net (loss) income, see footnote 2 to the "Selected Financial Data" section of this Annual Report on Form 10-K.
Recurring technology and services revenue growth. We provide recurring technology-enabled services leveraging both our technology and communications industry experience. We regularly review our recurring revenue growth to measure our success.
We intend to continue to focus our sales and marketing efforts on increasing our recurring technology and services-related customer base, and we expect that our recurring technology and services revenue will increase in absolute dollars and remain consistent as a percentage of total revenue over the next 12 months due to our expectation that we will be able to:
- •
- retain a high percentage of the revenue we currently derive from our existing customers;
- •
- sell additional product and service offerings to our existing customers; and
- •
- add a significant number of new customers.
We believe that we will be able to retain a high percentage of our existing recurring technology and services revenue due to our revenue retention rates, and the current levels of customer usage of our products and services, which we review on a monthly basis to provide an indication of impending increases or decreases in billed revenue for future periods.
We believe that we will be able to sell additional product and service offerings to our existing customers in the next year based on our analysis of revenue on a per-customer basis for the last 12 months, which indicates that our customers on an aggregate basis have generally increased their usage of our solution on a quarterly basis.
We believe that we will be able to add a significant number of new customers over the next 12 months as we continue to expand internationally and increase our share of the domestic market.
Revenue retention rates. In addition, we consider our revenue retention rates. Since we began to fully realize the benefits of our recurring revenue model in 2009, our revenue retention rates have been higher than 90%. We measure revenue retention rates by assessing on a dollar basis the recurring technology and services revenue we retain for the same customer and product set in a given period versus the prior year period. We cannot predict our revenue retention rates in future periods. Our use of a revenue retention rate has limitations as an analytical tool, and you should not consider it in isolation. Other companies in our industry may calculate revenue retention rates differently, which reduces its usefulness as a comparative measure.
We also review a number of other quantitative and qualitative trends in monitoring our performance, including our share of the CLM market, our customer satisfaction rates, our ability to attract, hire and retain a sufficient number of talented employees to staff our growing business and the development and performance of our solutions. Our review of these factors can affect aspects of our
44
business and operations on an on-going basis, including potential acquisition strategies and investment in specific areas of product development or service support.
Certain Trends and Uncertainties
The following represents a summary of certain trends and uncertainties, which could have a significant impact on our financial condition and results of operations. This summary is not intended to be a complete list of potential trends and uncertainties that could impact our business in the long or short term. This summary, however, should be considered along with the factors identified in the "Risk Factors" section of this Annual Report on Form 10-K.
- •
- The CLM market is characterized by rapid technological change and frequent new product and service introductions, including frequent
introductions of new technologies and devices. To achieve and maintain market acceptance for our solution, and to generate additional revenue from existing and new customers, we must effectively
anticipate these changes and offer software products and services that respond to them in a timely manner. If we fail to develop software products and services that satisfy customer preferences in a
timely and cost-effective manner, or if we fail to effectively convert existing customers to these new products and services or add new customers, our ability to renew our agreements with existing
customers and our ability to create or increase demand for our solution and generate additional revenue will be harmed.
- •
- We believe that competition will continue to increase. Increased competition could result from existing competitors or new competitors
that enter the market because of the potential opportunity. We will continue to closely monitor competitive activity and respond accordingly. Increased competition could have an adverse effect on our
financial condition and results of operations.
- •
- We continue to closely monitor current economic conditions, as any decline in the general economic environment that negatively affects the financial condition of our customers could have an adverse effect on our financial condition and results of operations. For example, during the most recent economic downturn, our customer cancellation rate during the first quarter of 2009 increased to a quarterly rate of over three times the average of the prior four quarters, partly as a result of customer bankruptcies. If economic conditions in the United States and other countries decline, we may face greater risks in operating our business.
Acquisitions
On January 25, 2011, we acquired substantially all of the assets of HCL Expense Management Services Inc., or HCL-EMS, a provider of telecommunications expense management, invoice processing and mobility management solutions, for $3.0 million in cash plus earn-out payments, based on revenues derived from providing selected services to former HCL-EMS customers over the two years following the acquisition as well as transaction costs of approximately $140,000. These transaction costs were expensed as incurred. In May 2012, we agreed with HCL-EMS that the gross amount of the first year earn-out would be $1.9 million, and we paid that amount to HCL-EMS. In April 2013, we agreed with HCL-EMS that the gross amount of second year earn-out would be $1.9 million. In August 2013, we paid $1.0 million of the second year earn-out to HCL-EMS, and retained the balance of the second year earn-out in the amount of $0.9 million pending resolution of an outstanding indemnity matter. In September 2014, we paid $0.4 million in satisfaction of the third-party claim that triggered the indemnity matter and the contingent consideration balance was reduced by this amount.
On March 16, 2011, we acquired substantially all of the assets of the telecommunications expense management division of Telwares, Inc. and its subsidiary Vercuity Solutions, Inc., or Telwares, for $4.5 million in cash (excluding working capital adjustments) plus deferred cash of up to an additional $2.5 million payable in installments of $1.25 million each on March 16, 2012 and March 16, 2013. We
45
paid the first installment of $1.25 million on March 16, 2012. The installment payable on March 16, 2013 was subject to a potential reduction of up to $0.5 million relating to the achievement of certain recurring revenue goals during the three months ending June 30, 2012. We agreed with Telwares that the amount of the reduction would be $0.4 million and we paid the resulting installment of deferred cash consideration of $0.9 million in March 2013. In addition, we incurred transaction costs of approximately $0.2 million in connection with the transaction. These transaction costs were immaterial and expensed as incurred.
On December 19, 2011, we acquired ProfitLine, Inc., or ProfitLine, a provider of telecommunications expense management, invoice processing and mobility management solutions, through a merger with one of our subsidiaries for $14.5 million in cash paid at the closing plus deferred cash of an additional $9.0 million payable in cash installments of $4.5 million on each of December 19, 2012 and June 19, 2013, subject to set-off rights that we and ProfitLine, as our wholly owned subsidiary following the acquisition, held with respect to indemnities given by the former stockholders of ProfitLine under the merger agreement for the acquisition. We paid the former stockholders of ProfitLine $4.1 million in December 2012, consisting of the first installment of $4.5 million less indemnity claims of $0.4 million. In July 2013, we paid $4.1 million to the former stockholders of ProfitLine, which represented the second and final installment of $4.5 million less indemnity claims of $0.4 million. The transaction costs were immaterial and were expensed as incurred.
On January 10, 2012, we acquired all of the outstanding equity of Anomalous Networks Inc., or Anomalous, a provider of real-time telecommunications expense management solutions. The aggregate purchase price was approximately $9.0 million, which consisted of approximately $3.5 million in cash paid at the closing, approximately $1.0 million in cash payable on the first anniversary of the closing, 165,775 unregistered shares of our common stock and 132,617 unvested and unregistered shares of our common stock with vesting based on achievement of revenue targets relating to sales of Anomalous products and services for periods through January 31, 2013. We paid the full $1.0 million of deferred cash consideration in January 2013. In March 2013, we cancelled and retired the 132,617 unvested and unregistered shares of our common stock due to the revenue targets related to the sales of Anomalous products and services not being achieved. The transaction costs were immaterial and were expensed as incurred.
On February 21, 2012, we acquired all of the issued share capital of ttMobiles Limited, or ttMobiles, a provider of mobile communications management solutions and services based in the United Kingdom. The purchase price was £5.5 million, which consisted of £4.0 million in cash paid at the closing and £1.5 million in cash payable on the first anniversary of the closing. We paid the full £1.5 million of deferred cash consideration in February 2013. The transaction costs were immaterial and were expensed as incurred.
On August 8, 2012, we acquired substantially all of the assets of the telecommunications expense management division of Symphony Teleca Services, Inc., or Symphony, pursuant to an asset purchase agreement, or the Symphony Purchase Agreement. On the same date, a newly formed subsidiary of ours, Tangoe India Softek Services Private Limited, an Indian private limited company, or Tangoe India, entered into a business purchase agreement, or the Indian Purchase Agreement, with Symphony Services Corporation (India) Private Limited, or Symphony India, with respect to the purchase of certain assets and employees of the acquired business located in India. The net purchase price was $40.2 million, which consisted of $29.2 million in cash paid at the closing, approximately $4.4 million in cash payable on the six-month anniversary of the closing, and approximately $6.4 million in cash payable on the one-year anniversary of the closing. In addition, the acquisition consideration included an earn-out payable in the amount of up to $4.0 million based on achievement of revenue targets for the acquired business for periods through June 30, 2013. No earn-out is payable because the revenue targets were not achieved. We made the six-month anniversary payment of $4.4 million in February 2013. The full installment due on August 8, 2013 of approximately $6.4 million, and amounts that
46
potentially became payable under the earn-out, were subject to set-off rights that we had with respect to indemnities given by Symphony under the Symphony Purchase Agreement. Among other things, these indemnity obligations related to representations and warranties given by Symphony under the Symphony Purchase Agreement and by Symphony India under the Indian Purchase Agreement. Certain of the indemnities were subject to limitations, including a threshold and deductible, certain caps and limited survival periods. We made a payment on the one-year anniversary of the closing in the amount of $4.9 million, consisting of the one-year anniversary payment of $6.4 million less $1.3 million withheld pending the resolution of certain indemnity matters, and less a net asset adjustment based on the final closing balance sheet of $0.2 million. In October 2013, we and Symphony resolved the indemnity matters and we paid the $1.3 million that we had previously deducted from the one-year anniversary payment. During a post-closing transition period that lasted through February 2013, Symphony and Symphony India provided to us certain transition services, pending completion of the opening of certain Tangoe India facilities, the procurement of certain Indian tax registrations and the subsequent transfer to Tangoe India of the Indian assets and employees being hired. These services included making available to us on a continuing basis the services previously provided by Symphony India to Symphony. The transaction costs were immaterial and were expensed as incurred.
On April 18, 2013, we acquired all of the issued share capital of oneTEM GmbH, or oneTEM, a provider of strategic consulting services based in Germany. The purchase price was approximately €1.5 million, which consisted of €0.9 million in cash paid at the closing and €0.4 million in cash payable on the first anniversary of the closing. In addition, the acquisition consideration includes an earn-out payable pursuant to an earn-out formula based upon the business, whose historic revenue had been one-time consulting revenue, beginning to generate annual recurring revenue from specified customers and then year-over-year increases in annual recurring revenue from those specified customers during the earn-out periods. The earn-out period began with the first full month after the closing and continues for four consecutive 12-month periods. The fair value of the earn-out consideration was valued at €0.2 million, which was estimated by applying the income approach. We paid the full €0.4 million of deferred consideration that was payable on the first anniversary of the closing in April 2014. This payment did not include any amounts related to the earn-out, and no amounts became payable under the earn-out terms for the 12-month period from May 2013 to April 2014. The transaction costs were immaterial and were expensed as incurred.
We continue to migrate to our platforms some of the customers of the businesses that we acquired during 2011 and 2012. While, to date, we have successfully migrated a number of these customers, there can be no assurance that we will complete these migrations in a timely manner or at all and the cost of these migrations may be more significant than we have estimated. We may pursue additional acquisitions of, or investments in, businesses, services and technologies that will expand the functionality of our solution, provide access to new markets or customers, or otherwise complement our existing operations.
Sources of Revenue
Recurring technology and services revenue. We derive our recurring technology and services revenue primarily from subscriptions and services related to our Matrix Solution Suite. We recognize revenue for software and related services when all of the following conditions are met: (a) there is persuasive evidence of an arrangement; (b) the service has been provided to the customer; (c) the collection of the contracted fee is probable; and (d) the amount of the fees to be paid by the customer or partner is fixed or determinable. These services include help desk, asset procurement and provisioning, and carrier dispute resolution. The recurring technology and services revenue is recognized ratably over the contract term.
We license our on-demand software and sell related services primarily on a subscription basis under agreements that typically have terms ranging from 24 to 60 months. Our recurring technology
47
and services revenue is driven by the amount of communications spend that we manage and the scope of the products and services that we provide to our customers. Under our fixed line contracts, we typically charge our customers a percentage of managed communications spend that is determined based on the products and services that we provide. Under our mobile contracts, we typically charge our customers fees that are based on the mobile products and services that we provide and the number of devices for which we provide those products and services. We also derive recurring technology and services revenue from payment processing through MxPay, our bill pay solution. As of December 31, 2014, we managed a total of approximately $29.8 billion in annual communications expense as compared to approximately $27.5 billion in annual communications expense as of December 31, 2013. Our customers are typically subject to a minimum charge for up to a specified threshold amount of communications spend, transactional volume or number of mobile devices under management and additional charges to the extent the specified thresholds are exceeded. Any implementation fees associated with recurring technology and services engagements are recognized over the estimated expected life of the customer relationship, which we estimate to be equal to twice the contract life, and we recognize implementation fees ratably over this period. Many of our subscription contracts are non-cancelable, although customers have the right to terminate for cause if we materially fail to perform.
Strategic consulting, software licenses and other revenue. In addition to our subscription fees, revenue is generated to a lesser extent by strategic consulting, software licenses, mobile device activation fees and sales of telecommunication accessories. Strategic consulting consists primarily of fees charged for contract negotiations and bill audits. Contract negotiation fees include both fixed project fees and incentive fees driven by the amount of savings that we are able to generate over the customer's existing communications rates. These fees are recognized when fixed or determinable, usually when the customer and carrier execute the contract. Bill audit fees are driven by the amount of savings that we are able to generate by reviewing current and prior communications invoices against the customer's existing contracts. These fees are recognized when fixed or determinable, usually when the savings have been calculated and documented in our Matrix Solutions Suite.
On occasion, we license our Matrix Solution Suite to our customers on a perpetual basis. If we are able to derive vendor-specific objective evidence on the undelivered elements, the software portion is recognized when the revenue recognition criteria is met; otherwise the contract is recognized ratably over the contract life. Other professional services are recognized as the services are performed. We have an agreement with a carrier whereby we receive an activation fee for procuring a mobile device. The activation revenue is recognized upon confirmation from the carrier that the device has been procured. The revenue related to the sale of mobile telecommunication accessories is recognized upon shipment of the accessories to the customer.
We expect our strategic consulting, software licenses and other revenue to increase in absolute dollars and remain relatively constant as a percentage of total revenue.
We historically have derived primarily all of our revenue from United States-based customers. We have been building our international sales operations by increasing our direct sales force abroad and expect to continue this expansion. We expect our international revenue to increase in absolute dollars and as a percentage of total revenue.
Cost of Revenue and Gross Profit
Cost of recurring technology and services revenue. Cost of recurring technology and services revenue consists primarily of costs associated with our data center operations, customer product support centers and client services group. This includes personnel-related costs such as salary, stock-based compensation and other compensation-related costs, subcontractor fees, hosting fees,
48
communications costs and royalties related to third-party software included in our solution when our solution is licensed on a non-perpetual basis.
Cost of strategic consulting, software licenses and other revenue. Cost of strategic consulting, software licenses and other revenue consists primarily of personnel-related costs, including salary, stock-based compensation and other compensation-related costs and subcontractor fees directly related to delivering the service and to a lesser extent, the cost of the mobile telecommunications accessories sold.
As our customer base continues to grow, we expect our cost of revenue to increase in absolute dollars as we expand our data center and customer support operations to support our continued growth. Our cost of revenue could fluctuate as a percentage of revenue on a quarterly basis but remain relatively stable on an annual basis based on the mix of software and services sold and average contractual selling price.
Gross profit. Gross profit as a percentage of revenue is affected by two main factors—the mix of software and services sold and the average contractual selling price. We expect our gross profit in absolute dollars to increase, but that our gross profit as a percentage of revenue will be affected as we integrate the businesses of our recent acquisitions, which have historically operated with lower margins than our business. We believe that over time we will achieve improvements in those margins as we integrate the acquired operations and capture the operating efficiencies of the overall business.
Operating Expense
Operating expense consists of sales and marketing, general and administrative, research and development and depreciation and amortization. Other than for depreciation and amortization expense, personnel-related costs are the most significant component of all of these operating expenses. We expect to continue to hire a significant number of new employees in order to support our overall growth. In any particular period, the timing of additional hires could materially affect our operating results, both in absolute dollars and as a percentage of revenue.
Sales and marketing. Sales and marketing expense consists primarily of personnel-related costs, including salary, stock-based compensation and other compensation-related costs for our sales, marketing and business development employees, the cost of outside marketing programs such as on-line lead generation, promotional events, such as trade shows, user conferences, seminars and webinars, the cost of business development programs, travel-related costs and sales commissions. Sales commission rates are calculated at the time a contract is signed. The sales commission rate is applied to the contract's first year of revenue to calculate sales commission expense. Sales commission expense is accrued and expensed at the time we invoice the customer and is paid to the salesperson either when the invoice is collected or ratably over the next five quarters. Generally, new sales personnel require time to become familiar with our software and services and do not begin to generate sales immediately, which can result in increased sales and marketing expense without any immediate increase in revenue. We expect sales and marketing expense to increase in absolute dollars and as a percentage of revenue in the near term, as we continue to hire sales and marketing personnel in the United States and internationally to expand our solution globally.
General and administrative. General and administrative expense consists of personnel-related costs, including salary, stock-based compensation and other compensation-related costs for finance and accounting, executive, human resources, legal and information technology personnel, rent and facility costs, legal and other professional fees, and other corporate expenses. We are incurring and will continue to incur costs associated with being a public company, including corporate insurance costs as well as certain personnel costs and professional fees, including legal and accounting fees as they relate to financial reporting and maintaining compliance with Section 404 of the Sarbanes-Oxley Act. We expect general and administrative expense to increase in absolute dollars and to decrease as a percentage of revenue over the next several years.
49
Research and development. Research and development expense primarily consists of personnel-related costs, including salary, stock-based compensation and other compensation-related costs for development personnel, and fees to our outside contract development vendors. We anticipate that our research and development team will continue to focus on expanding our software and services and increasing the functionality of our current offerings. We expect research and development expense to increase in absolute dollars, but remain relatively constant as a percentage of revenue in the near term.
Depreciation and amortization. Depreciation and amortization expense primarily consists of the non-cash write-down of tangible and intangible assets over their expected economic lives. We expect this expense to remain relatively constant in absolute dollars and decrease as a percentage of revenue as we continue to grow and incur capital expenditures to improve our technological infrastructure and acquire assets through potential future acquisitions.
Other Income (Expense), Net
Other income (expense), net consists primarily of interest expense on our short and long-term debt, interest income on our cash and cash equivalents balance. We have historically invested our cash in money market investments. We expect our interest income to vary in each reporting period depending on our average cash balances and interest rates.
Income Tax Provision
Income tax provision consists of federal and state corporate income taxes resulting from our operations in the United States, as well as operations in various foreign jurisdictions. We expect income tax expense to vary each reporting period depending upon taxable income fluctuations and the availability of tax benefits from net loss carryforwards.
As of December 31, 2014, we had U.S. federal net operating loss carryforwards of approximately $30.5 million, which, if unused, expire from 2022 to 2032. In addition to this amount, we have approximately $44.7 million of federal income tax loss carryforwards resulting from tax deductions related to stock options awarded to employees, which will be realized only when these deductions reduce income taxes payable. We also have U.S. federal research and development tax credit carryforwards of approximately $3.8 million, which expire through 2032. We have engaged in several transactions since our inception that have resulted in a change in control as defined by Sections 382 and 383 of the Internal Revenue Code, which limits our ability to utilize these net operating loss and tax credit carryforwards in the future. As of December 31, 2014, $25.2 million of our net operating loss and tax credit carryforwards were so limited. At December 31, 2014, we had a valuation allowance against the full amount of our deferred tax assets, as management believes it is uncertain that they will be fully realized. If we determine in the future that we will be able to realize all or a portion of our net operating loss or tax credit carryforwards, an adjustment to our recorded valuation allowance would increase net income in the period in which we make such a determination.
Critical Accounting Policies
Our financial statements are prepared in accordance with GAAP. The preparation of our financial statements and related disclosures requires us to make estimates, assumptions and judgments that affect the reported amount of assets, liabilities, revenue, costs and expenses, and related disclosures. We base our estimates and assumptions on historical experience and other factors that we believe to be reasonable under the circumstances. We evaluate our estimates and assumptions on an ongoing basis. Our actual results may differ from these estimates under different assumptions and conditions. Our most critical accounting policies are summarized below. See Note 2 to our consolidated financial statements included elsewhere in this Annual Report on Form 10-K for additional information about these critical accounting policies, as well as a description of our other significant accounting policies.
50
Revenue recognition—Recurring technology and services revenue consists of subscription-based fees, software subscription license fees, software maintenance fees and hosting fees related to the use of our solution to manage our customers' communications expenses. Strategic consulting, software licenses and other revenue consists of fees for contract negotiations, bill audits, sale of mobile telecommunication accessories, professional services and perpetual software licenses. We recognize revenue when persuasive evidence of an arrangement exists, pricing is fixed or determinable, collection is reasonably assured and delivery or performance of service has occurred.
Recurring technology and services subscription-based fees, software subscription license fees, software maintenance fees and hosting fees are recognized ratably over the term of the period of service. The subscription-based services we provide include help desk, asset procurement and provisioning and carrier dispute resolution. We follow the provisions of Financial Accounting Standards Board (FASB) Accounting Standards Codification (ASC) 605-10-S99, Revenue Recognition, and ASC 605-25, Revenue Recognition with Multiple-Element Arrangements. When contracts contain multiple elements, we evaluate each element in the contract to determine whether it represents a separate unit of accounting. In order to account for deliverables in a multiple-deliverable arrangement as separate units of accounting, the deliverables must have stand-alone value upon delivery. When multiple deliverables included in an arrangement are separable into different units of accounting, the arrangement consideration is allocated to the identified separate units of accounting based on their relative selling price. Multiple-deliverable arrangements accounting guidance provides a hierarchy to use when determining the relative selling price for each unit of accounting. We use vendor-specific objective evidence, or VSOE, of selling price, based on the price at which the item is regularly sold by the vendor on a stand-alone basis, if it exists. If VSOE of selling price is not available, third-party evidence, or TPE, of selling price is used to establish the selling price, if it exists. If VSOE of selling price and TPE of selling price are not available, the best estimate of selling price, or BESP, is used. We determine the BESP for a product or service by considering multiple factors including, but not limited to, integration of project offerings, volume and location of telecommunication spend to be managed and discounting practices.
We have determined that implementation fees associated with recurring technology and services engagements do not have stand-alone value and therefore do not represent a separate unit of accounting. As such, they are recognized over the estimated expected life of the customer relationship, which we estimate to be equal to twice the contract life calculated on a per-customer basis, and we recognize implementation fees ratably over this period.
Software license fees consist of fees paid for a perpetual license agreement for our technology, which are recognized in accordance with ASC 985-605, Software Revenue Recognition. VSOE for maintenance and support is established by a stated renewal rate included in the license arrangement or rates charged in stand-alone sales of maintenance and support. If software maintenance fees are provided for in the license fee or at a discount pursuant to a license agreement, a portion of the license fee equal to the fair market value of these amounts is allocated to software maintenance revenue based on the value established by independent sales of such maintenance services to customers.
Professional services related to the implementation of our software products, which we refer to as consulting services, are generally performed on a fixed fee basis under separate service arrangements. Consulting services revenue is recognized as the services are performed by measuring progress towards completion based upon either costs or the achievement of certain milestones. We also provide contract negotiation and bill audit services, which we refer to as strategic sourcing services, on behalf of our customers, which are generally performed on a contingency fee basis, with our fees being based on a percentage of the savings we achieve for the customer. Revenue from strategic sourcing services engagements is recognized as savings are secured for the customer or as work is completed. The revenue is generally billed as a base fee and a contingency fee based upon the amount of savings secured multiplied by the contingency fee percentage to which we are entitled.
51
In accordance with ASC 985-605, Income Statement Characterization of Reimbursements Received for Out-of-Pocket Expenses, we classify reimbursed expenses as revenue and the related expense within cost of revenue in the accompanying consolidated statements of operations. For the years ended December 31, 2012, 2013 and 2014, reimbursed expenses of $0.2 million, $0.1 million and $0.1 million, respectively, were included in revenue.
Purchase accounting. We have accounted for all of our acquisitions using the purchase method of accounting for acquisitions. As a result, the purchase price for each of the transactions has been allocated to the tangible and intangible assets acquired and liabilities assumed based on their respective fair values at the date of acquisition. We applied significant judgment and estimates in determining the fair values of the assets acquired and their useful lives. The excess of the purchase price over the fair value of assets and liabilities was assigned to goodwill, which is not amortized for accounting purposes, but is subject to testing for impairment annually and more frequently if certain events occur. In the process of our annual impairment review, we use the step zero approach, which includes a qualitative evaluation of information to determine if it is more than 50% likely that the fair value of our intangible assets is less than its carrying value. Significant management judgment is required in the forecasts of future operating results that are used in the discounted cash flow method of valuation.
The estimates that we have used are consistent with the plans and estimates that we use to manage our business. If our actual results, or the plans and estimates used in future impairment analyses, are lower than the original estimates used to assess the recoverability of these assets, we could incur impairment charges.
Software development costs. We expense research and development costs as incurred. We evaluate the establishment of technological feasibility of our software in accordance with ASC 985, Accounting for the Costs of Computer Software to be Sold, Leased or Otherwise Marketed. We have concluded that technological feasibility is not established until the development stage of the software is nearly complete. The time period during which costs could be capitalized from the point of reaching technological feasibility until the time of general release is very short and, consequently, the amounts that could be capitalized are not material to our consolidated financial statements. Therefore, we charge all such costs to research and development in the period incurred.
Impairment of goodwill. Goodwill acquired in acquisition of a business is accounted for based upon the excess fair value of consideration transferred over the fair value of net assets acquired in the business combination. Goodwill is tested for impairment on an annual basis as of December 31, and, when specific circumstances dictate, between annual tests. We have one reporting unit. When impaired, the carrying value of goodwill is written down to fair value. The goodwill impairment test involves evaluating qualitative information to determine if it is more than 50% likely that the fair value of a reporting unit is less than its carrying value in determining if the traditional two-step goodwill impairment test described below must be applied. The first step, identifying a potential impairment, compares the fair value of a reporting unit with its carrying amount, including goodwill. If the carrying value of the reporting unit exceeds its fair value, the second step would need to be conducted; otherwise, no further steps are necessary as no potential impairment exists. The second step, measuring the impairment loss, compares the implied fair value of the reporting unit goodwill with the carrying amount of that goodwill. Any excess of the reporting unit goodwill carrying value over the respective implied fair value is recognized as an impairment loss. There was no impairment of goodwill for the years ended December 31, 2013 and 2014.
Impairment of other long-lived assets. Purchased-intangible assets are accounted for based upon the fair value of assets received. Purchased-intangible assets are amortized on a straight line, ranging from two to ten years. We perform a review of purchased-intangible assets whenever events or changes in circumstances indicate that the useful life is shorter than we had originally estimated or that the carrying amount of assets may not be recoverable. If such facts and circumstances exist, we assess the
52
recoverability of purchased-intangible assets by comparing the future undiscounted cash flows associated with the related asset or group of assets over their remaining lives against their respective carrying amounts. Impairments, if any, are based on the excess of the carrying amount over the fair value of those assets. If the useful life of the asset is shorter than originally estimated, we accelerate the rate of amortization and amortize the remaining carrying value over the new shorter useful life. There was no impairment of purchased-intangible assets identified for the years ended December 31, 2013 and 2014.
Stock-based compensation. We follow ASC 718, Share-Based Payment for recording stock-based compensation. ASC 718 supersedes Accounting Principles Board No. 25, Accounting for Stock Issued to Employees, and related interpretations. ASC 718 requires all stock-based compensation to employees, including grants of employee stock options, restricted stock units and common stock, to be valued at fair value on the date of grant, and to be expensed over the applicable service period. The fair value of a restricted stock unit award is determined based on the closing price of our stock price at the date of grant. We estimate the fair value of stock options using the Black-Scholes valuation model. Determining the fair value of stock-based awards requires the use of highly subjective assumptions, including the expected term of the award and expected stock price volatility. We did not grant any stock options in 2014. The assumptions used in calculating the fair value of stock option awards granted in 2012 and 2013 are set forth below:
| |
2012 | 2013 | ||
|---|---|---|---|---|
Expected dividend yield |
0% | 0% | ||
Risk-free interest rate |
0.79% to 1.16% | 1.04% to 1.86% | ||
Expected term (in years) |
5.5 - 6.1 years | 5.7 - 6.1 years | ||
Expected volatility |
58.09% - 59.92% | 56.34% - 56.84% |
The assumptions used in determining the fair value of stock option awards represent management's best estimates, but these estimates involve inherent uncertainties and the application of management's judgment. As a result, if factors change and we use different assumptions, our stock-based compensation could be materially different in the future. The risk-free interest rate used for each stock option grant is based on a U.S. Treasury instrument with a term similar to the expected term of the stock option award. The expected term of stock options has been estimated utilizing the vesting period of the stock option, the contractual life of the stock option and our stock option exercise history. Because there had been no public market for our common stock prior to our initial public offering, we believe that we have insufficient data from our limited public trading history to appropriately utilize company-specific historical and implied volatility information. Therefore, we estimate our expected stock volatility based on that of publicly traded peer companies, and we expect to continue to use this methodology until such time as we have adequate historical data regarding the volatility of our publicly traded stock price. Also, ASC 718 requires that we recognize stock-based compensation expense for only the portion of stock options that are expected to vest. Accordingly, we have estimated expected forfeitures of stock options upon the adoption of ASC 718 based on our historical forfeiture rate and used these rates in developing a future forfeiture rate. If our actual forfeiture rate varies from our historical rates and estimates, additional adjustments to stock-based compensation expense may be required in future periods.
Common Stock Warrant. We accounted for the shares of common stock issuable upon exercise of a warrant that we issued to IBM in accordance with ASC 505, Equity-Based Payments to Non-Employee. We issued the warrant to IBM in connection with the entry into a five-year strategic relationship agreement. Under the terms of the agreement, certain shares of common stock underlying the warrant vested at the time the agreement was signed, which we valued using the Black-Scholes valuation model at the time of the signing of the agreement and recorded the amount to equity and to intangible assets. Additional shares of common stock underlying the warrant were set to vest based on the achievement
53
of specified contractual billing thresholds over a three-year period. In June 2011, we amended the terms of the warrant to change the number of shares that were subject to vesting and the thresholds for achieving vesting. Under the terms of the amendment, certain shares of common stock underlying the warrant vested at the time the amendment was signed. These shares were valued using the Black-Scholes valuation model based on inputs as of the time of the signing of the amendment. Additional shares of common stock underlying the warrant were set to vest based on the achievement of specified contractual annual recurring revenue thresholds over a period from June 8, 2011 to June 30, 2012. As of June 30, 2012, the vesting terms of the amended agreement expired with IBM earning no additional warrant shares. As a result, no further warrants shares are issuable under this warrant agreement. In the first quarter of 2010, we began to amortize the asset, with the related charge recorded as contra-revenue. The related charge to revenue was in proportion to the total expected revenue from the agreement.
Income Taxes. We are subject to income taxes in the United States, and we use estimates in determining our income tax provisions. We account for income taxes in accordance with ASC 740, Accounting for Uncertainty in Income Taxes, which is the asset and liability method for accounting and reporting for income taxes. Under ASC 740, deferred tax assets and liabilities are recognized based on temporary differences between the financial reporting and income tax bases of assets and liabilities using statutory rates.
We assess the likelihood that deferred tax assets will be realized, and we recognize a valuation allowance if it is more likely than not that some portion of the deferred tax assets will not be realized. This assessment requires judgment as to the likelihood and amounts of future taxable income by tax jurisdiction. At December 31, 2014, we had a full valuation allowance against substantially all our deferred tax assets. Although we believe that our tax estimates are reasonable, the ultimate tax determination involves significant judgment that is subject to audit by tax authorities in the ordinary course of business.
ASC 740 prescribes a recognition threshold and a measurement attribute for the financial statement recognition and measurement of tax positions taken or expected to be taken in a tax return. For those benefits to be recognized, a tax position must be more likely than not to be sustained upon examination by taxing authorities.
We assess all material positions taken in any income tax return, including all significant uncertain positions, in all tax years that are still subject to assessment or challenge by relevant taxing authorities. Assessing an uncertain tax position begins with the initial determination of the position's sustainability and is measured at the largest amount of benefit that is greater than 50% likely of being realized upon ultimate settlement. As of each balance sheet date, unresolved uncertain tax positions must be reassessed, and we will determine whether (i) the factors underlying the sustainability assertion have changed and (ii) the amount of the recognized tax benefit is still appropriate. The recognition and measurement of tax benefits requires significant judgment. Judgments concerning the recognition and measurement of a tax benefit might change as new information becomes available.
Allowances for Bad Debt. We estimate and record allowances for potential bad debts and customer credits based on factors such as the write-off percentages, the current business environment and known concerns within our accounts receivable balances.
The allowance for bad debts is our estimate of bad debt expense that could result from the inability or refusal of our customers to pay for our services. Additions to the estimated allowance for bad debts are recorded as an increase in general and administrative expense and are based on factors such as historical write-off percentages, the current business environment and the known concerns within the current aging of accounts receivable. Reductions in the estimated allowance for bad debts due to subsequent cash recoveries are recorded as a decrease in general and administrative expenses. As specific bad debts are identified, they are written-off against the previously established estimated
54
allowance for bad debts and have no impact on operating expenses. This allowance also includes our estimate of adjustments for services that do not meet our customers' requirements. Additions to the estimated allowance for customer credits are recorded as a reduction in revenue and are based on a customer by customer basis of known concerns within the current aging. Reductions in the estimated allowance for customer credits are recorded as an increase in revenue. As specific customer credits are identified, they are written-off against the previously established estimated allowance for customer credits and have no impact on revenue.
If there is a decline in the general economic environment that negatively affects the financial condition of our customers or an increase in the number of customers that are dissatisfied with our software or services, additional estimated allowances for bad debts and customer credits may be required and the impact on our consolidated financial statements could be material.
55
Results of Operations
The following table sets forth selected statements of operations data for the periods indicated. These consolidated results of operations are not necessarily indicative of the consolidated results of operations that will be achieved in any future period.
| |
Years Ended December 31, | |||||||||
|---|---|---|---|---|---|---|---|---|---|---|
(in thousands, except percentages)
|
2012 | 2013 | 2014 | |||||||
Revenue: |
||||||||||
Recurring technology and services |
$ | 137,979 | $ | 168,484 | $ | 189,467 | ||||
Strategic consulting, software licenses and other |
16,533 | 20,430 | 23,009 | |||||||
| | | | | | | | | | | |
Total revenue |
154,512 | 188,914 | 212,476 | |||||||
| | | | | | | | | | | |
Cost of revenue: |
||||||||||
Recurring technology and services |
63,976 | 76,228 | 88,510 | |||||||
Strategic consulting, software licenses and other |
6,627 | 8,750 | 8,954 | |||||||
| | | | | | | | | | | |
Total cost of revenue(1) |
70,603 | 84,978 | 97,464 | |||||||
| | | | | | | | | | | |
Gross profit |
83,909 | 103,936 | 115,012 | |||||||
Operating expense: |
||||||||||
Sales and marketing(1) |
24,840 | 33,382 | 39,433 | |||||||
General and administrative(1) |
29,317 | 34,765 | 37,963 | |||||||
Research and development(1) |
16,696 | 19,570 | 22,633 | |||||||
Depreciation and amortization |
8,666 | 10,452 | 9,779 | |||||||
Restructuring charge |
— | 654 | — | |||||||
| | | | | | | | | | | |
Income from operations |
4,390 | 5,113 | 5,204 | |||||||
Other income (expense), net: |
||||||||||
Interest expense |
(943 | ) | (401 | ) | (103 | ) | ||||
Interest income |
80 | 60 | 35 | |||||||
Other (expense) income |
(9 | ) | 1,201 | 114 | ||||||
| | | | | | | | | | | |
Income before income tax provision |
3,518 | 5,973 | 5,250 | |||||||
Income tax provision |
480 | 1,011 | 2,314 | |||||||
| | | | | | | | | | | |
Net income |
$ | 3,038 | $ | 4,962 | $ | 2,936 | ||||
| | | | | | | | | | | |
| | | | | | | | | | | |
| | | | | | | | | | | |
- (1)
- Amounts in table above include stock-based compensation expense, as follows:
|
Cost of revenue |
$ | 1,347 | $ | 2,108 | $ | 3,873 | |||||
|
Sales and marketing |
2,133 | 3,941 | 5,065 | ||||||||
|
General and administrative |
5,105 | 6,220 | 6,802 | ||||||||
|
Research and development |
580 | 990 | 2,758 | ||||||||
| | | | | | | | | | | | | |
|
$ | 9,165 | $ | 13,259 | $ | 18,498 | ||||||
| | | | | | | | | | | | | |
| | | | | | | | | | | | | |
| | | | | | | | | | | | | |
56
Years Ended December 31, 2013 and 2014
Revenue
The following table presents our components of revenue for the periods presented:
| |
Years Ended December 31, |
Increase | |||||||||||
|---|---|---|---|---|---|---|---|---|---|---|---|---|---|
(in thousands, except percentages)
|
2013 | 2014 | $ | % | |||||||||
Recurring technology and services |
$ | 168,484 | $ | 189,467 | $ | 20,983 | 12 | % | |||||
Strategic consulting, software licenses and other |
20,430 | 23,009 | 2,579 | 13 | % | ||||||||
| | | | | | | | | | | | | | |
Total revenue |
$ | 188,914 | $ | 212,476 | $ | 23,562 | 12 | % | |||||
| | | | | | | | | | | | | | |
| | | | | | | | | | | | | | |
| | | | | | | | | | | | | | |
Our recurring technology and services revenue increased $21.0 million, or 12%, for the year ended December 31, 2014 as compared to the prior year. This increase was primarily attributable to $26.6 million in increased revenue from increases in the volume of fixed and mobile communications assets and service offerings being managed or provided through our on-demand communication management platform for existing and new customers, excluding customers acquired in acquisitions since January 1, 2011 except to the extent such acquisition customers purchased new products or services following the applicable acquisition. The increase was driven in part by a 17% increase in our total number of recurring revenue customers to 795 as of December 31, 2014, which amount excludes 288 acquisition customers for total recurring revenue customers of 1,083 as of December 31, 2014, an increase from 677 as of December 31, 2013, which amount excludes 332 acquisition customers for total recurring revenue customers of 1,009 as of December 31, 2013. This increase in revenue was partially offset by a $5.6 million decrease for the year ended December 31, 2014, as compared to the same period in 2013, in revenue from customers acquired in connection with acquisitions since January 1, 2011, to $50.4 million for the year ended December 31, 2014 from $56.0 million for the year ended December 31, 2013, including for purposes of this calculation revenue from acquisition customers who renewed their contracts with us after the applicable acquisition but excluding revenues from post-acquisition sales of new products and services. This decrease was principally attributable to normal and customary attrition in acquisition customers. Our recurring technology and services revenue includes contra-revenue related to the amortization of the value of a warrant to purchase common stock issued to IBM as part of a strategic marketing agreement. We recorded $305,000 and $493,000 of amortization as a contra-revenue charge during the years ended December 31, 2013 and 2014, respectively, related to the warrant.
Our strategic consulting, software licenses and other revenue increased $2.6 million, or 13%, for the year ended December 31, 2014 as compared to the prior year, primarily due to increases in strategic sourcing and consulting revenue of $2.4 million and mobile telecommunication accessories sales revenue of $0.5 million. These increases were slightly offset by decreases in other revenue of $0.3 million and software license fees revenue of $0.1 million.
57
Cost of Revenue and Gross Profit
The following table presents our cost of revenue and gross profit for the periods presented:
| |
Years Ended December 31, |
Increase | |||||||||||
|---|---|---|---|---|---|---|---|---|---|---|---|---|---|
(in thousands, except percentages)
|
2013 | 2014 | $ | % | |||||||||
Recurring technology and services |
$ | 76,228 | $ | 88,510 | $ | 12,282 | 16 | % | |||||
Strategic consulting, software licenses and other |
8,750 | 8,954 | 204 | 2 | % | ||||||||
| | | | | | | | | | | | | | |
Total cost of revenue |
$ | 84,978 | $ | 97,464 | $ | 12,486 | 15 | % | |||||
| | | | | | | | | | | | | | |
| | | | | | | | | | | | | | |
| | | | | | | | | | | | | | |
Gross profit |
$ | 103,936 | $ | 115,012 | $ | 11,076 | 11 | % | |||||
| | | | | | | | | | | | | | |
| | | | | | | | | | | | | | |
| | | | | | | | | | | | | | |
Gross margin |
55% | 54% | |||||||||||
| | | | | | | | | | | | | | |
| | | | | | | | | | | | | | |
| | | | | | | | | | | | | | |
Our recurring technology and services cost of revenue increased $12.3 million for the year ended December 31, 2014 as compared to the prior year. This increase is primarily due to an increase in personnel-related costs, including an increase in salary and other compensation-related costs, of $10.0 million, including an increase in stock-based compensation of $1.8 million, as well as increases of $1.3 million in other infrastructure costs and $1.0 million in one-time costs associated with invoice payment processing. The increases in personnel-related costs, other infrastructure costs and invoice payment processing costs were primarily attributable to providing support for customer growth in our recurring technology and services business. The increase in stock-based compensation was related to the stock-based equity awards granted in 2014 having shorter vesting periods than those granted in 2013 resulting in a greater portion of the associated expense being recognized during the period.
Our strategic consulting, software licenses and other cost of revenue increased $0.2 million for the year ended December 31, 2014 as compared to the prior year as a result of an increase in the costs associated with our sales of mobile telecommunications accessories as a result of increased sales volume.
As a percentage of revenue, gross profit decreased to 54% for the year ended December 31, 2014 as compared to 55% for the prior year. This decrease in gross margin was primarily due to the increase in stock-based compensation expense mentioned above and the one-time costs associated with invoice payment processing. The $11.1 million increase in gross profit in absolute dollars was primarily a result of increases in recurring technology and services revenue.
Operating Expense
The following table presents our components of operating expense for the periods presented:
| |
Years Ended December 31, | |
|
||||||||||||
|---|---|---|---|---|---|---|---|---|---|---|---|---|---|---|---|
| |
2013 | 2014 | Increase (decrease) |
||||||||||||
| |
|
% of Revenue |
|
% of Revenue |
|||||||||||
(in thousands, except percentages)
|
Amount | Amount | $ | % | |||||||||||
Sales and marketing |
$ | 33,382 | 18% | $ | 39,433 | 19% | $ | 6,051 | 18% | ||||||
General and administrative |
34,765 | 18% | 37,963 | 18% | 3,198 | 9% | |||||||||
Research and development |
19,570 | 10% | 22,633 | 11% | 3,063 | 16% | |||||||||
Depreciation and amortization |
10,452 | 6% | 9,779 | 5% | (673 | ) | –6% | ||||||||
Restructuring charge |
654 | 0% | — | 0% | (654 | ) | * | ||||||||
| | | | | | | | | | | | | | | | |
Total operating expense |
$ | 98,823 | 52% | $ | 109,808 | 52% | $ | 10,985 | 11% | ||||||
| | | | | | | | | | | | | | | | |
| | | | | | | | | | | | | | | | |
| | | | | | | | | | | | | | | | |
- *
- Not meaningful
58
Sales and marketing expense. Our sales and marketing expense increased $6.1 million for the year ended December 31, 2014 as compared to the prior year, primarily as a result of increases in personnel-related costs, including salary and other compensation-related costs, of $5.5 million, including increased employee compensation and benefits of $4.4 million and stock-based compensation expense of $1.1 million. The increases in employee compensation and benefits and stock-based compensation were due to increases in the number of global direct and indirect sales force employees to accommodate growth in sales opportunities and the grant of stock-based equity awards with shorter vesting periods than in the same period in 2013 resulting in a greater portion of the associated expense being recognized during the period. Our sales and marketing expense also increased as a result of an increase in outside marketing expense of $0.5 million, primarily as a result of increases in lead generation activities for new and existing geographies and customers, and an increase in travel and other sales and marketing expenses of $0.1 million, as a result of the increased headcount.
General and administrative expense. Our general and administrative expense increased $3.2 million for the year ended December 31, 2014 as compared to the prior year, primarily as a result of increases in personnel-related costs, including salary and other compensation-related costs, of $1.7 million, including increased employee compensation and benefits of $1.2 million as a result of increased headcount and stock-based compensation expense of $0.6 million as a result of stock-based equity awards granted in 2014 having shorter vesting periods than those granted in 2013 resulting in a greater portion of the associated expense being recognized during the period partially offset by a decrease in outside third-party contractor costs of $0.1 million. Our general and administrative expense also increased as a result of increases in facility and overhead costs of $0.6 million, primarily attributable to the rent and overhead costs associated with additional facilities, technology data center co-location costs of $0.5 million and other general and administrative costs of $0.4 million, related to increases in foreign currency translation costs, miscellaneous licenses and taxes, office supplies and corporate insurance.
Research and development expense. Our research and development expense increased $3.1 million for the year ended December 31, 2014 as compared to the prior year, primarily as a result of increases in personnel-related costs, including salary and other compensation-related costs, of $2.9 million, including increased employee compensation and benefits of $2.4 million, as a result of increased headcount related to our Matrix initiative to enhance the functionality of our products and improve our ability to scale for increased demand, and stock-based compensation expense of $1.8 million, as result of stock-based equity awards granted in 2014 having shorter vesting periods than those granted in 2013 resulting in a greater portion of the associated expense being recognized during the period. These increases were partially offset by a decrease in third-party contractor costs of $1.3 million. Research and development expense also increased as a result of increases in travel and other research and development expenses of $0.2 million as a direct result of increased headcount.
Depreciation and amortization expense. Our depreciation and amortization expense decreased $0.7 million for the year ended December 31, 2014 as compared to the prior year, primarily due to a decrease in amortization expense of $0.9 million, partly offset by an increase in depreciation expense of $0.2 million. The decrease in amortization expense was primarily due to an acquired identifiable intangible asset becoming fully amortized during the second quarter of 2014. The increase in depreciation expense was primarily due to an increase in capital expenditures to support our overall growth.
Restructuring charge. The restructuring charge recorded during the year ended December 31, 2013 was a result of a lease termination agreement executed with the landlord of our New Jersey office space acquired as part of our 2011acquisition of HCL-EMS. The agreement terminated the remaining term of the lease effective June 30, 2013 for a settlement fee of $0.9 million. We recorded an adjustment of $0.5 million to the restructuring charge as a result of the lease termination agreement and $0.1 million restructuring charge as a result of our inability to sublease the office space in the time period originally expected.
59
Other Income (Expense), Net
The following table presents our components of other income (expense), net for the periods presented:
| |
Years Ended December 31, |
Increase (decrease) |
|||||||||||
|---|---|---|---|---|---|---|---|---|---|---|---|---|---|
(in thousands, except percentages)
|
2013 | 2014 | $ | % | |||||||||
Interest expense |
$ | (401 | ) | $ | (103 | ) | 298 | –74 | % | ||||
Interest income |
60 | 35 | (25 | ) | –42 | % | |||||||
Other income |
1,201 | 114 | (1,087 | ) | * | ||||||||
- *
- Not meaningful
Interest expense. The decrease in interest expense for the year ended December 31, 2014 as compared to the prior year was a result of higher average debt balances in 2013 related to the HCL-EMS, ProfitLine, ttMobiles and Symphony deferred consideration balances and capital leases and other financing obligations.
Interest income. Interest income for the years ended December 31, 2014 and 2013 was comparable in each year.
Other income. Other income for the year ended December 31, 2013 primarily consisted of a $0.4 million reduction in the Telwares deferred cash consideration as a result of not achieving certain recurring revenue targets, a $0.3 million reduction in the ProfitLine deferred cash consideration as a result of the settlement of certain indemnity claims, a $0.2 million adjustment of the HCL-EMS year two earn-out estimate to actual, a $0.2 million reduction in the Symphony deferred cash consideration as a result of a net asset shortfall adjustment and $0.1 million received in foreign government incentives.
Income Tax Provision
Our income tax provision increased $1.3 million for the year ended December 31, 2014, as compared to the prior year, primarily as a result of income tax expense related to our foreign subsidiaries and state income tax.
Years Ended December 31, 2012 and 2013
Revenue
The following table presents our components of revenue for the periods presented:
| |
Years Ended December 31, |
Increase | |||||||||||
|---|---|---|---|---|---|---|---|---|---|---|---|---|---|
(in thousands, except percentages)
|
2012 | 2013 | $ | % | |||||||||
Recurring technology and services |
$ | 137,979 | $ | 168,484 | $ | 30,505 | 22 | % | |||||
Strategic consulting, software licenses and other |
16,533 | 20,430 | 3,897 | 24 | % | ||||||||
| | | | | | | | | | | | | | |
Total revenue |
$ | 154,512 | $ | 188,914 | $ | 34,402 | 22 | % | |||||
| | | | | | | | | | | | | | |
| | | | | | | | | | | | | | |
| | | | | | | | | | | | | | |
Our recurring technology and services revenue increased $30.5 million, or 22%, for the year ended December 31, 2013 as compared to the prior year. Of this increase, $23.5 million was attributable to an increase in the volume of fixed and mobile communications assets and service offerings being managed or provided through our on-demand communication management platform for existing and new customers, excluding customers acquired in acquisitions since January 1, 2011 except to the extent such acquisition customers purchased new products or services following the applicable acquisition. The increase was driven in part by a 23% increase in our total number of recurring revenue customers to 677 as of December 31, 2013, which amount excludes 332 acquisition customers for total recurring
60
revenue customers of 1,009 as of December 31, 2013, from 549 as of December 31, 2012, which amount excludes 349 acquisition customers for total recurring revenue customers of 898 as of December 31, 2012. The $7.0 million balance of our increase for the year ended December 31, 2013, as compared to the prior year, was attributable to an increase in revenue from customers acquired in connection with acquisitions since January 1, 2011 to $56.0 million for the year ended December 31, 2013 from $49.0 million for the year ended December 31, 2012, including for purposes of this calculation revenue from acquisition customers who renewed their contracts with us after the applicable acquisition but excluding revenues from post-acquisition sales of new products and services. This increase was principally attributable to revenues from customers acquired in connection with acquisitions in the year ended December 31, 2012 being included for the full year ended December 31, 2013 as compared to only the portion of the year ended December 31, 2012 following such acquisition. Our recurring technology and services revenue includes contra-revenue related to the amortization of the value of a warrant to purchase common stock issued to IBM as part of a strategic marketing agreement. We recorded $174,000 and $305,000 of amortization as a contra-revenue charge during the year ended December 31, 2012 and 2013, respectively, related to the warrant.
Our strategic consulting, software licenses and other revenue increased $3.9 million, or 24%, for the year ended December 31, 2013 as compared to the prior year, primarily due to increases in strategic sourcing and consulting revenue of $3.4 million, other revenue of $1.1 million and mobile telecommunication accessories sales revenue of $1.1 million. These increases were partially offset by a $1.2 million decrease in mobile activation revenues and $0.5 million decrease in software license fee revenues.
Cost of Revenue and Gross Profit
The following table presents our cost of revenue and gross profit for the periods presented:
| |
Years Ended December 31, |
Increase | |||||||||
|---|---|---|---|---|---|---|---|---|---|---|---|
(in thousands, except percentages)
|
2012 | 2013 | $ | % | |||||||
Recurring technology and services |
$ | 63,976 | $ | 76,228 | $ | 12,252 | 19% | ||||
Strategic consulting, software licenses and other |
6,627 | 8,750 | 2,123 | 32% | |||||||
| | | | | | | | | | | | |
Total cost of revenue |
$ | 70,603 | $ | 84,978 | $ | 14,375 | 20% | ||||
| | | | | | | | | | | | |
| | | | | | | | | | | | |
| | | | | | | | | | | | |
Gross profit |
$ | 83,909 | $ | 103,936 | $ | 20,027 | 24% | ||||
| | | | | | | | | | | | |
| | | | | | | | | | | | |
| | | | | | | | | | | | |
Gross margin |
54% | 55% | |||||||||
| | | | | | | | | | | | |
| | | | | | | | | | | | |
| | | | | | | | | | | | |
Our recurring technology and services cost of revenue increased $12.3 million for the year ended December 31, 2013 as compared to the prior year. This increase is primarily due to an increase in personnel-related costs, including an increase in salary and other compensation-related costs, of $11.6 million, and an increase in travel-related expenses and other infrastructure costs of $2.1 million. The increases in personnel-related, travel-related and other infrastructure costs were primarily attributable to providing support for customer growth in our recurring technology and services business. These increases were partially offset by a $1.6 million decrease in third-party contractor costs as acquired customers have migrated to our platforms.
Our strategic consulting, software licenses and other cost of revenue increased $2.1 million for the year ended December 31, 2013 as compared to the prior year, primarily as a result of a $1.1 million increase in salary and other compensated-related costs as a result of an increase in strategic consulting revenue and a $1.0 million increase in the costs associated with our sales of mobile telecommunication accessories as a result of increased sales volume.
As a percentage of revenue, gross profit increased to 55% for the year ended December 31, 2013 as compared to 54% for the prior year. This increase in gross margin was primarily due to the
61
migration of customers acquired in the HCL-EMS and Telwares acquisitions onto our platforms, which operate at a higher gross margin than the legacy HCL-EMS and Telwares platforms on which we serviced these customers immediately following the HCL-EMS and Telwares acquisitions. The $20.0 million increase in gross profit in absolute dollars was primarily due to increased revenue.
Operating Expense
The following table presents our components of operating expense for the periods presented:
| |
Years Ended December 31, | |
|
||||||||||||
|---|---|---|---|---|---|---|---|---|---|---|---|---|---|---|---|
| |
2012 | 2013 | |
|
|||||||||||
| |
Increase | ||||||||||||||
| |
|
% of Revenue |
|
% of Revenue |
|||||||||||
(in thousands, except percentages)
|
Amount | Amount | $ | % | |||||||||||
Sales and marketing |
$ | 24,840 | 16% | $ | 33,382 | 18% | $ | 8,542 | 34% | ||||||
General and administrative |
29,317 | 19% | 34,765 | 18% | 5,448 | 19% | |||||||||
Research and development |
16,696 | 11% | 19,570 | 10% | 2,874 | 17% | |||||||||
Depreciation and amortization |
8,666 | 6% | 10,452 | 6% | 1,786 | 21% | |||||||||
Restructuring charge |
— | 0% | 654 | 0% | 654 | * | |||||||||
| | | | | | | | | | | | | | | | |
Total operating expense |
$ | 79,519 | 51% | $ | 98,823 | 52% | $ | 19,304 | 24% | ||||||
| | | | | | | | | | | | | | | | |
| | | | | | | | | | | | | | | | |
| | | | | | | | | | | | | | | | |
- *
- Not meaningful
Sales and marketing expense. Our sales and marketing expense increased $8.5 million for the year ended December 31, 2013 as compared to the prior year, primarily due to an increase in personnel-related costs, including salary and other compensation-related costs, of $7.8 million, which includes an increase in stock-based compensation of $1.8 million, and an increase of $0.6 million in travel expenses. These increases were primarily due to an increase in the number of global direct and indirect sales force employees to accommodate growth in sales opportunities, as well as, with respect to stock-based compensation, an increase in the value of stock-based equity awards. Outside marketing expense was comparable for the years ended December 31, 2013 and 2012 at $1.2 million and $1.3 million, respectively.
General and administrative expense. Our general and administrative expense increased $5.4 million for the year ended December 31, 2013 as compared to the prior year, primarily as a result of an increase in personnel-related costs, including salary and other compensation-related costs, of $3.1 million, which consists of increases in employee compensation and benefits of $2.0 million and stock-based compensation of $1.1 million. These increases were primarily due to an increase in headcount as well as, with respect to stock-based compensation, an increase in the value of stock-based equity awards. In addition, we incurred a $2.0 million increase in facility and overhead costs, primarily attributable to the rent and overhead costs associated with additional facilities, and an increase in professional fees of $0.3 million, primarily attributable legal fees related to the purported class action lawsuits to which we were a party.
Research and development expense. Our research and development expense increased $2.9 million for the year ended December 31, 2013 as compared to the prior year, primarily due to increased personnel-related costs, including salary and other compensation-related costs, of $3.3 million, which consists of increases in employee compensation and benefits of $2.9 million and stock-based compensation of $0.4 million. These increases were primarily due to an increase in headcount as well as, with respect to stock-based compensation, an increase in the value of stock-based equity awards. These increases were offset by a decrease in third-party contractor costs of $0.5 million. The higher costs were primarily the result of an initiative to enhance the functionality of our products and improve our ability to scale to increased demand.
62
Depreciation and amortization expense. Our depreciation and amortization expense increased $1.8 million for the year ended December 31, 2013 as compared to the prior year, primarily due to increases in amortization expense of $1.4 million and depreciation expense of $0.4 million. The increase in amortization expense was the result of higher intangible assets as a result of the ttMobiles and Symphony acquisitions. The increase in depreciation expense was primarily due to an increase in capital expenditures to support our overall growth.
Restructuring charge. The restructuring charge recorded during the year ended December 31, 2013 was a result of a lease termination agreement executed with the landlord of our New Jersey office space acquired as part of the acquisition of HCL-EMS. The agreement terminated the remaining term of the lease effective June 30, 2013 for a settlement fee of $0.9 million. We recorded an adjustment of $0.5 million to the restructuring charge as a result of the lease termination agreement and $0.1 million restructuring charge as a result of our inability to sublease the office space in the time period originally expected.
Other Income (Expense), Net
The following table presents our components of other income (expense), net for the periods presented:
| |
Years Ended December 31, |
Change | |||||||||||
|---|---|---|---|---|---|---|---|---|---|---|---|---|---|
(in thousands, except percentages)
|
2012 | 2013 | $ | % | |||||||||
Interest expense |
$ | (943 | ) | $ | (401 | ) | 542 | –57 | % | ||||
Interest income |
80 | 60 | (20 | ) | –25 | % | |||||||
Other (expense) income |
(9 | ) | 1,201 | 1,210 | * | ||||||||
- *
- Not meaningful
Interest expense. The decrease in interest expense for the year ended December 31, 2013 as compared to the prior year was a result of higher average debt balances in 2012 related to the HCL-EMS, Telwares, Anomalous, ttMobiles and Symphony deferred consideration balances.
Interest income. Interest income for the years ended December 31, 2013 and 2012 was comparable at $0.1 million in each year.
Other income. Other income for the year ended December 31, 2013 primarily consisted of a $0.4 million reduction in the Telwares deferred cash consideration as a result of not achieving certain recurring revenue targets, a $0.3 million reduction in the ProfitLine deferred cash consideration as a result of the settlement of certain indemnity claims, a $0.2 million adjustment of the HCL-EMS year two earn-out estimate to actual, a $0.2 million reduction in the Symphony deferred cash consideration as a result of a net asset shortfall adjustment and $0.1 million received in foreign government incentives.
Income Tax Provision
Our income tax provision increased $0.5 million for the year ended December 31, 2013 as compared to the prior year, due to an increase in deferred income taxes related to tax amortization taken on indefinite-lived intangible assets from the Symphony acquisition, a reduction of Tangoe Canada's R&D tax credit reserve and income tax expense related to our Indian subsidiary.
Liquidity and Capital Resources
Sources of Liquidity
Since our inception, we have funded our operations primarily from cash from operations, private placements of preferred stock, subordinated notes, term loans, revolving credit facilities and public
63
offerings of equity. As of December 31, 2014, we had cash and cash equivalents of $51.3 million and accounts receivable of $56.9 million. As of December 31, 2014 we had amounts due under various debts and credit facilities of $1.6 million, which consisted of deferred consideration for the HCL-EMS and oneTEM acquisitions and capital lease and other financing obligations.
We believe that our existing cash and cash equivalents and our cash flow from operating activities will be sufficient to meet our anticipated cash needs for at least the next twelve months. To the extent our cash and cash equivalents and cash flow from operating activities are insufficient to fund our future activities, we may need to raise additional funds through bank credit arrangements or public or private equity or debt financings. We also may need to raise additional funds in the event we determine in the future to effect one or more acquisitions of, or investments in, businesses, services or technologies. If additional funding is required, we may not be able to obtain bank credit arrangements or to effect an equity or debt financing on terms acceptable to us or at all.
The following table sets forth our cash and cash equivalents and the major sources and uses of cash for each of the periods set forth below:
| |
As of December 31, | |||||||||
|---|---|---|---|---|---|---|---|---|---|---|
(in thousands)
|
2012 | 2013 | 2014 | |||||||
Cash and cash equivalents |
$ | 50,211 | $ | 43,182 | $ | 51,279 | ||||
| | | | | | | | | | | |
| | | | | | | | | | | |
| | | | | | | | | | | |
| |
Years Ended December 31, | |||||||||
|---|---|---|---|---|---|---|---|---|---|---|
(in thousands)
|
2012 | 2013 | 2014 | |||||||
Net cash provided by operating activities |
$ | 16,688 | $ | 21,413 | $ | 19,546 | ||||
Net cash used in investing activities |
(40,230 | ) | (23,488 | ) | (4,450 | ) | ||||
Net cash provided by (used in) financing activities |
30,398 | (4,735 | ) | (6,496 | ) | |||||
Effect of exchange rate on cash |
(52 | ) | (219 | ) | (503 | ) | ||||
| | | | | | | | | | | |
Net increase (decrease) in cash and cash equivalents |
$ | 6,804 | $ | (7,029 | ) | $ | 8,097 | |||
| | | | | | | | | | | |
| | | | | | | | | | | |
| | | | | | | | | | | |
Cash Flows from Operating Activities
Operating activities provided $19.5 million of net cash during the year ended December 31, 2014, which resulted from our net income of $2.9 million for the year ended December 31, 2014 principally supplemented by non-cash charges of stock-based compensation of $18.5 million, depreciation and amortization of $9.8 million, deferred income taxes of $1.0 million and other non-cash charges of $0.7 million. Cash flows from operating activities also includes a $1.1 million increase in accounts payable and accrued expenses and a $1.3 million increase in deferred revenue. Cash provided by operating activities was adversely impacted by a $14.3 million increase in accounts receivable, a $1.0 million increase in prepaid expenses and other current assets and a $0.5 million decrease in accrued expenses and other current liabilities during the year ended December 31, 2014.
Operating activities provided $21.4 million of net cash during the year ended December 31, 2013, which resulted from our net income of $5.0 million for the year ended December 31, 2013 principally supplemented by non-cash charges of stock-based compensation of $13.3 million, depreciation and amortization of $10.5 million and restructuring charge of $0.7 million. Cash provided by operating activities was adversely impacted by a $5.1 million increase in accounts receivable and a $2.4 million decrease in accrued expenses during the year ended December 31, 2013.
Operating activities provided $16.7 million of net cash during the year ended December 31, 2012, which resulted from our net income of $3.0 million for the year ended December 31, 2012 principally supplemented by non-cash charges of stock-based compensation of $9.2 million, depreciation and amortization of $8.7 million and debt discount amortization of $0.8 million and cash provided by an increase in accounts payable and accrued expenses of $2.2 million and prepaid expenses and other current assets of $0.2 million. Cash provided by operating activities was adversely impacted by a
64
$5.9 million increase in accounts receivable and a $1.9 million decrease in deferred revenue during the year ended December 31, 2012.
Cash Flows from Investing Activities
Cash used in investing activities totaled $4.5 million during the year ended December 31, 2014 and consisted of capital expenditures of $3.6 million primarily related to the purchase of computer equipment and software and $0.9 million paid in connection with the HCL and oneTEM acquisitions.
Cash used in investing activities totaled $23.5 million during the year ended December 31, 2013 and consisted of $20.8 million paid in connection with the HCL-EMS, Telwares, ProfitLine Anomalous, ttMobiles, Symphony and oneTEM acquisitions and capital expenditures of $2.6 million primarily related to the purchase of computer equipment and software.
Cash used in investing activities totaled $40.2 million during the year ended December 31, 2012 and consisted of $38.4 million paid in connection with the Anomalous, ttMobiles and Symphony acquisitions and capital expenditures of $1.8 million primarily related to the purchase of computer equipment and software.
Cash Flows from Financing Activities
Cash used in financing activities totaled $6.5 million during the year ended December 31, 2014 primarily consisting of $7.9 million of cash used to repurchase our common stock and $0.7 million of cash used for net repayments of debt partially offset by $2.1 million of proceeds from the exercise of stock options and stock warrants.
Cash flows used in financing activities totaled $4.7 million during the year ended December 31, 2013 primarily due to $8.6 million of cash used to repurchase our common stock and debt repayments of $1.0 million. Cash flows used in financing activities was favorably impacted by cash proceeds from the exercise of stock options and stock warrants of $4.9 million.
Cash flows provided by financing activities totaled $30.4 million during the year ended December 31, 2012 primarily due to $37.7 million of net proceeds from our follow-on offering, net of underwriting discounts and commissions and offering costs, and $4.2 million in proceeds from the exercise of stock options and stock warrants. Cash provided by financing activities was adversely impacted by net debt repayments of $8.9 million and $2.7 million of cash used to repurchase our common stock.
Contractual Obligations
The following table summarizes our material contractual obligations at December 31, 2014 and the effect such obligations are expected to have on our liquidity and cash flows in future periods.
| |
Payments due by period | |
||||||||||||||
|---|---|---|---|---|---|---|---|---|---|---|---|---|---|---|---|---|
(dollars in thousands)
|
Total | Less than 1 year |
1 - 3 years | 3 - 5 years | More than 5 Years |
|||||||||||
Operating lease obligations |
$ | 17,289 | $ | 6,441 | $ | 9,350 | $ | 1,408 | $ | 90 | ||||||
Capital leases and other obligations |
790 | 790 | — | — | — | |||||||||||
Interest on capital lease obligations |
24 | 24 | — | — | — | |||||||||||
HCL-EMS contingent consideration |
541 | 541 | — | — | — | |||||||||||
OneTEM deferred purchase price |
235 | 69 | 166 | — | — | |||||||||||
| | | | | | | | | | | | | | | | | |
|
$ | 18,879 | $ | 7,865 | $ | 9,516 | $ | 1,408 | $ | 90 | ||||||
| | | | | | | | | | | | | | | | | |
| | | | | | | | | | | | | | | | | |
| | | | | | | | | | | | | | | | | |
- •
- Operating lease obligations include minimum lease obligations with remaining terms in excess of one year primarily related to office space as well as certain equipment.
65
- •
- Capital lease and other obligations include minimum lease obligations with remaining terms in excess of one year related to computer
hardware and software.
- •
- HCL-EMS contingent consideration consists of an amount withheld from the payment due on the second anniversary of the HCL-EMS closing
date of January 25, 2011, pending resolution of certain indemnity matters.
- •
- oneTEM contingent consideration consists of contingent earn-out cash consideration payable on April 18 in each of 2015, 2016 and 2017.
Off-Balance Sheet Arrangements
We do not engage in any off-balance sheet financing activities, nor do we have any interest in entities referred to as variable interest entities.
Recent Accounting Pronouncements
In 2014, the Financial Accounting Standards Board issued Accounting Standards Update No. 2014-09, Revenue from Contracts with Customers, or ASU 2014-09, which supersedes nearly all existing revenue recognition guidance under GAAP. The core principle of ASU 2014-09 is to recognize revenues when promised goods or services are transferred to customers in an amount that reflects the consideration to which an entity expects to be entitled for those goods or services. ASU 2014-09 defines a five step process to achieve this core principle and, in doing so, more judgments and estimates may be required within the revenue recognition process than are required under existing GAAP. The standard is effective for annual periods beginning after December 15, 2016, and interim periods therein, using either of the following transition methods: (i) a full retrospective approach reflecting the application of the standard in each prior reporting period with the option to elect certain practical expedients, or (ii) a retrospective approach with the cumulative effect of initially adopting ASU 2014-09 recognized at the date of adoption (which includes additional footnote disclosures). We are currently evaluating the impact of our pending adoption of ASU 2014-09 on our consolidated financial statements and have not yet determined the method by which we will adopt the standard in 2017.
Also in 2014, the FASB issued ASU No. 2014-12 (Topic 718)—Compensation—Stock Compensation, ASU 2014-12, which provides guidance that a performance target that affects vesting of a share-based payment and that could be achieved after the requisite service period is a performance condition. As a result, the target is not reflected in the estimation of the award's grant date fair value. Compensation cost for such an award would be recognized over the required service period, if it is probable that the performance condition will be achieved. ASU 2014-12 is effective for all entities for annual periods beginning after December 15, 2015 and interim periods within those annual periods. ASU 2014-12 should be applied on a prospective basis to awards that are granted or modified on or after the effective date. The adoption of this standard is not expected to have an impact on our consolidated financial statements.
66
Item 7A. Quantitative and Qualitative Disclosures About Market Risk
Market risk represents the risk of loss that may impact our financial position due to adverse changes in financial market prices and rates. Our market risk exposure is primarily the result of fluctuations in interest rates as well as, to a lesser extent, inflation. We may also face exchange rate risk in the future, as we expand our business internationally.
Interest Rate Risk
At December 31, 2014, we had unrestricted cash and cash equivalents totaling $51.3 million. These amounts were held for working capital purposes and were invested primarily in deposits and money market funds. We do not enter into investments for trading or speculative purposes. Due to the short-term nature of these investments, we believe that we do not have any material exposure to changes in the fair value of our investment portfolio as a result of changes in interest rates. Declines in interest rates, however, would reduce future investment income.
Foreign Exchange Risk
We sell our solution worldwide. As a result, our financial results could be affected by factors such as changes in foreign currency exchange rates or weak economic conditions in foreign markets. Since our sales are currently denominated primarily in U.S. dollars, a strengthening of the dollar could make our products less competitive in foreign markets and our accounts receivable more difficult to collect. We do not currently hedge our exposure to foreign currency exchange rate fluctuations. We may, however, hedge such exposure to foreign currency exchange rate fluctuations in the future.
Inflation Risk
Inflation and changing prices have not had a material effect on our business, and we do not expect that they will materially affect our business in the foreseeable future. However, the impact of inflation on replacement costs of equipment, cost of revenue and operating expenses, especially employee compensation costs, may not be readily recoverable in the pricing of our offerings.
67
Item 8. Financial Statements and Supplementary Data
TANGOE, INC.
INDEX TO CONSOLIDATED FINANCIAL STATEMENTS
68
Report of Independent Registered Public Accounting Firm
To
the Board of Directors and Stockholders of
Tangoe, Inc.
Orange, Connecticut
We have audited the accompanying consolidated balance sheets of Tangoe, Inc. (the "Company") as of December 31, 2013 and 2014 and the related consolidated statements of operations, comprehensive income, changes in stockholders' equity, and cash flows for each of the three years in the period ended December 31, 2014. These financial statements are the responsibility of the Company's management. Our responsibility is to express an opinion on these financial statements based on our audits.
We conducted our audits in accordance with the standards of the Public Company Accounting Oversight Board (United States). Those standards require that we plan and perform the audit to obtain reasonable assurance about whether the financial statements are free of material misstatement. An audit includes examining, on a test basis, evidence supporting the amounts and disclosures in the financial statements, assessing the accounting principles used and significant estimates made by management, as well as evaluating the overall presentation of the financial statements. We believe that our audits provide a reasonable basis for our opinion.
In our opinion, the consolidated financial statements referred to above present fairly, in all material respects, the financial position of Tangoe, Inc. at December 31, 2013 and 2014, and the results of its operations and its cash flows for each of the three years in the period ended December 31, 2014, in conformity with accounting principles generally accepted in the United States of America.
We also have audited, in accordance with the standards of the Public Company Accounting Oversight Board (United States), Tangoe, Inc.'s internal control over financial reporting as of December 31, 2014, based on criteria established in Internal Control—Integrated Framework (2013) issued by the Committee of Sponsoring Organizations of the Treadway Commission ("COSO") and our report dated March 16, 2015 expressed an unqualified opinion thereon.
/s/ BDO USA, LLP
New York, NY
March 16, 2015
69
TANGOE, INC.
Consolidated Balance Sheets
(in thousands, except share and per share amounts)
| |
December 31, | ||||||
|---|---|---|---|---|---|---|---|
| |
2013 | 2014 | |||||
ASSETS |
|||||||
CURRENT ASSETS: |
|||||||
Cash and cash equivalents |
$ | 43,182 | $ | 51,279 | |||
Accounts receivable, less allowances of $283 and $588, respectively |
43,273 | 56,948 | |||||
Prepaid expenses and other current assets |
4,537 | 5,901 | |||||
| | | | | | | | |
Total current assets |
90,992 | 114,128 | |||||
COMPUTERS, FURNITURE AND EQUIPMENT-NET |
4,317 | 5,217 | |||||
OTHER ASSETS: |
|||||||
Intangible assets-net |
36,637 | 28,753 | |||||
Goodwill |
65,963 | 65,348 | |||||
Security deposits and other non-current assets |
935 | 1,566 | |||||
| | | | | | | | |
TOTAL ASSETS |
$ | 198,844 | $ | 215,012 | |||
| | | | | | | | |
| | | | | | | | |
| | | | | | | | |
LIABILITIES AND STOCKHOLDERS' EQUITY |
|||||||
CURRENT LIABILITIES: |
|||||||
Accounts payable |
$ | 9,570 | $ | 10,733 | |||
Accrued expenses |
8,871 | 8,283 | |||||
Deferred revenue-current portion |
9,063 | 10,858 | |||||
Notes payable-current portion |
1,831 | 1,400 | |||||
Other current liabilities |
160 | — | |||||
| | | | | | | | |
Total current liabilities |
29,495 | 31,274 | |||||
OTHER LIABILITIES: |
|||||||
Deferred taxes and other non-current liabilities |
3,598 | 4,372 | |||||
Deferred revenue-less current portion |
1,536 | 1,030 | |||||
Notes payable-less current portion |
203 | 166 | |||||
| | | | | | | | |
Total liabilities |
34,832 | 36,842 | |||||
| | | | | | | | |
COMMITMENT AND CONTINGENCIES (NOTE 15) |
|||||||
STOCKHOLDERS' EQUITY: |
|||||||
Common stock, par value $0.0001 per share—150,000,000 shares authorized as of December 31, 2013 and 2014; 38,160,928 and 38,621,169 shares issued and outstanding as of December 31, 2013 and 2014, respectively |
4 | 4 | |||||
Additional paid-in capital |
202,808 | 215,491 | |||||
Warrants for common stock |
10,610 | 10,610 | |||||
Accumulated deficit |
(48,795 | ) | (45,859 | ) | |||
Accumulated other comprehensive loss |
(615 | ) | (2,076 | ) | |||
| | | | | | | | |
Total stockholders' equity |
164,012 | 178,170 | |||||
| | | | | | | | |
TOTAL LIABILITIES AND STOCKHOLDERS' EQUITY |
$ | 198,844 | $ | 215,012 | |||
| | | | | | | | |
| | | | | | | | |
| | | | | | | | |
The accompanying notes are an integral part of these consolidated financial statements.
70
TANGOE, INC.
Consolidated Statements of Operations
(in thousands, except per share amounts)
| |
Years Ended December 31, | |||||||||
|---|---|---|---|---|---|---|---|---|---|---|
| |
2012 | 2013 | 2014 | |||||||
Revenue: |
||||||||||
Recurring technology and services |
$ | 137,979 | $ | 168,484 | $ | 189,467 | ||||
Strategic consulting, software licenses and other |
16,533 | 20,430 | 23,009 | |||||||
| | | | | | | | | | | |
Total revenue |
154,512 | 188,914 | 212,476 | |||||||
| | | | | | | | | | | |
Cost of revenue: |
||||||||||
Recurring technology and services |
63,976 | 76,228 | 88,510 | |||||||
Strategic consulting, software licenses and other |
6,627 | 8,750 | 8,954 | |||||||
| | | | | | | | | | | |
Total cost of revenue |
70,603 | 84,978 | 97,464 | |||||||
| | | | | | | | | | | |
Gross profit |
83,909 | 103,936 | 115,012 | |||||||
Operating expenses: |
||||||||||
Sales and marketing |
24,840 | 33,382 | 39,433 | |||||||
General and administrative |
29,317 | 34,765 | 37,963 | |||||||
Research and development |
16,696 | 19,570 | 22,633 | |||||||
Depreciation and amortization |
8,666 | 10,452 | 9,779 | |||||||
Restructuring charge |
— | 654 | — | |||||||
| | | | | | | | | | | |
Income from operations |
4,390 | 5,113 | 5,204 | |||||||
Other income (expense), net: |
||||||||||
Interest expense |
(943 | ) | (401 | ) | (103 | ) | ||||
Interest income |
80 | 60 | 35 | |||||||
Other (expense) income |
(9 | ) | 1,201 | 114 | ||||||
| | | | | | | | | | | |
Income before income tax provision |
3,518 | 5,973 | 5,250 | |||||||
Income tax provision |
480 | 1,011 | 2,314 | |||||||
| | | | | | | | | | | |
Net income |
$ | 3,038 | $ | 4,962 | $ | 2,936 | ||||
| | | | | | | | | | | |
| | | | | | | | | | | |
| | | | | | | | | | | |
Income per common share: |
||||||||||
Basic |
$ | 0.08 | $ | 0.13 | $ | 0.08 | ||||
| | | | | | | | | | | |
| | | | | | | | | | | |
| | | | | | | | | | | |
Diluted |
$ | 0.08 | $ | 0.12 | $ | 0.07 | ||||
| | | | | | | | | | | |
| | | | | | | | | | | |
| | | | | | | | | | | |
Weighted average number of common shares: |
||||||||||
Basic |
36,492 | 37,706 | 38,642 | |||||||
| | | | | | | | | | | |
| | | | | | | | | | | |
| | | | | | | | | | | |
Diluted |
39,870 | 40,472 | 41,157 | |||||||
| | | | | | | | | | | |
| | | | | | | | | | | |
| | | | | | | | | | | |
The accompanying notes are an integral part of these consolidated financial statements.
71
TANGOE, INC.
Consolidated Statements of Comprehensive Income
(in thousands)
| |
Years Ended December 31, | |||||||||
|---|---|---|---|---|---|---|---|---|---|---|
| |
2012 | 2013 | 2014 | |||||||
Net income |
$ | 3,038 | $ | 4,962 | $ | 2,936 | ||||
Foreign currency translation income (loss) adjustment |
223 | (797 | ) | (1,461 | ) | |||||
| | | | | | | | | | | |
Comprehensive income |
$ | 3,261 | $ | 4,165 | $ | 1,475 | ||||
| | | | | | | | | | | |
| | | | | | | | | | | |
| | | | | | | | | | | |
The accompanying notes are an integral part of these consolidated financial statements.
72
TANGOE, INC.
Consolidated Statements of Changes in Stockholders' Equity
For the Years Ended December 31, 2012, 2013 and 2014
(in thousands, except share amounts)
| |
Series A Convertible Preferred Stock |
|
|
|
|
|
|
|
|
||||||||||||||||||||||
|---|---|---|---|---|---|---|---|---|---|---|---|---|---|---|---|---|---|---|---|---|---|---|---|---|---|---|---|---|---|---|---|
| |
Common Stock | |
|
Notes Receivable for Purchase of Common Stock |
|
|
|
||||||||||||||||||||||||
| |
Number of Shares |
Amount | Number of Shares |
Amount | Additional Paid-In Capital |
Common Stock Warrants |
Accumulated Deficit |
Other Comprehensive (Loss) Income |
Total Stockholders' Equity |
||||||||||||||||||||||
Balance December 31, 2011 |
— | — | 33,152,592 | $ | 3 | $ | 142,905 | $ | 10,610 | $ | (93 | ) | $ | (56,795 | ) | $ | (41 | ) | $ | 96,589 | |||||||||||
Net income |
— | — | — | — | — | — | — | 3,038 | — | 3,038 | |||||||||||||||||||||
Foreign currency translation adjustment |
— | — | — | — | — | — | — | — | 223 | 223 | |||||||||||||||||||||
Securities issued in connection with acquisition |
— | — | 165,775 | — | 1,984 | — | — | — | — | 1,984 | |||||||||||||||||||||
Issuance of shares upon follow-on offering, net of issuance costs |
— | — | 2,200,000 | 1 | 37,728 | — | — | — | — | 37,729 | |||||||||||||||||||||
Issuance of shares from exercise of stock options |
— | — | 1,859,557 | — | 4,081 | — | — | — | — | 4,081 | |||||||||||||||||||||
Issuance of shares from exercise of stock warrants |
— | — | 449,877 | — | 93 | — | — | — | — | 93 | |||||||||||||||||||||
Issuance of shares in payment of board of director fees |
— | — | 1,021 | — | 21 | — | — | — | — | 21 | |||||||||||||||||||||
Issuance of shares from executive stock grant |
— | — | 9,639 | — | 150 | — | — | — | — | 150 | |||||||||||||||||||||
Repurchase of common stock |
— | — | (357,751 | ) | — | (4,396 | ) | — | — | — | — | (4,396 | ) | ||||||||||||||||||
Repayment of notes receivable |
— | — | — | — | — | — | 93 | — | — | 93 | |||||||||||||||||||||
Stock-based compensation—equity awards |
— | — | — | — | 9,015 | — | — | — | — | 9,015 | |||||||||||||||||||||
| | | | | | | | | | | | | | | | | | | | | | | | | | | | | | | | |
Balance December 31, 2012 |
— | — | 37,480,710 | 4 | 191,581 | 10,610 | — | (53,757 | ) | 182 | 148,620 | ||||||||||||||||||||
Net income |
— | — | — | — | — | — | — | 4,962 | — | 4,962 | |||||||||||||||||||||
Foreign currency translation adjustment |
— | — | — | — | — | — | — | — | (797 | ) | (797 | ) | |||||||||||||||||||
Issuance of shares to employees and board of directors |
— | — | 76,916 | — | 761 | — | — | — | — | 761 | |||||||||||||||||||||
Issuance of shares from exercise of stock options |
— | — | 1,015,817 | — | 4,826 | — | — | — | — | 4,826 | |||||||||||||||||||||
Issuance of shares from exercise of stock warrants |
— | — | 14,907 | — | 35 | — | — | — | — | 35 | |||||||||||||||||||||
Issuance of shares from vesting of restricted stock units |
— | — | 92,338 | — | — | — | — | — | — | — | |||||||||||||||||||||
Repurchase of common stock |
— | — | (519,760 | ) | — | (6,893 | ) | — | — | — | — | (6,893 | ) | ||||||||||||||||||
Stock-based compensation—equity awards |
— | — | — | — | 12,498 | — | — | — | — | 12,498 | |||||||||||||||||||||
| | | | | | | | | | | | | | | | | | | | | | | | | | | | | | | | |
Balance December 31, 2013 |
— | — | 38,160,928 | 4 | 202,808 | 10,610 | — | (48,795 | ) | (615 | ) | 164,012 | |||||||||||||||||||
Net income |
— | — | — | — | — | — | — | 2,936 | — | 2,936 | |||||||||||||||||||||
Foreign currency translation adjustment |
— | — | — | — | — | — | — | — | (1,461 | ) | (1,461 | ) | |||||||||||||||||||
Issuance of shares to employees and board of directors |
— | — | 301,204 | — | 4,479 | — | — | — | — | 4,479 | |||||||||||||||||||||
Issuance of shares from exercise of stock options |
— | — | 453,275 | — | 2,100 | — | — | — | — | 2,100 | |||||||||||||||||||||
Issuance of shares from exercise of stock warrants |
— | — | 710 | — | — | — | — | — | — | — | |||||||||||||||||||||
Issuance of shares from vesting of restricted stock units |
— | — | 284,303 | — | — | — | — | — | — | — | |||||||||||||||||||||
Repurchase of common stock |
— | — | (579,251 | ) | — | (7,915 | ) | — | — | — | — | (7,915 | ) | ||||||||||||||||||
Stock-based compensation—equity awards |
— | — | — | — | 14,019 | — | — | — | — | 14,019 | |||||||||||||||||||||
| | | | | | | | | | | | | | | | | | | | | | | | | | | | | | | | |
Balance December 31, 2014 |
— | $ | — | 38,621,169 | $ | 4 | $ | 215,491 | $ | 10,610 | $ | — | $ | (45,859 | ) | $ | (2,076 | ) | $ | 178,170 | |||||||||||
| | | | | | | | | | | | | | | | | | | | | | | | | | | | | | | | |
| | | | | | | | | | | | | | | | | | | | | | | | | | | | | | | | |
| | | | | | | | | | | | | | | | | | | | | | | | | | | | | | | | |
The accompanying notes are an integral part of these consolidated financial statements.
73
TANGOE, INC.
Consolidated Statements of Cash Flows
(in thousands)
| |
For the Years Ended December 31, | |||||||||
|---|---|---|---|---|---|---|---|---|---|---|
| |
2012 | 2013 | 2014 | |||||||
Operating activities: |
||||||||||
Net income |
$ | 3,038 | $ | 4,962 | $ | 2,936 | ||||
Adjustments to reconcile net income to net cash provided by operating activities: |
||||||||||
Amortization of debt discount |
801 |
305 |
50 |
|||||||
Amortization of leasehold interest |
(99 | ) | (99 | ) | (99 | ) | ||||
Depreciation and amortization |
8,666 | 10,452 | 9,779 | |||||||
Restructuring charge |
— | 654 | — | |||||||
Increase (decrease) in deferred rent liability |
19 | (47 | ) | (36 | ) | |||||
Amortization of marketing agreement intangible assets |
174 | 305 | 493 | |||||||
Allowance for doubtful accounts |
96 | 106 | 261 | |||||||
Deferred income taxes |
183 | 400 | 989 | |||||||
Stock based compensation |
9,165 | 13,259 | 18,498 | |||||||
Foreign exchange loss (gain) |
46 | (138 | ) | 39 | ||||||
Decrease in fair value of contingent consideration |
— | (1,041 | ) | — | ||||||
Changes in assets and liabilities, net of acquisitions: |
||||||||||
Accounts receivable |
(5,883 | ) | (5,089 | ) | (14,283 | ) | ||||
Prepaid expenses and other current assets |
170 | (407 | ) | (1,029 | ) | |||||
Other assets |
(19 | ) | 191 | (450 | ) | |||||
Accounts payable |
1,310 | 32 | 1,595 | |||||||
Accrued expenses |
885 | (2,409 | ) | (514 | ) | |||||
Deferred revenue |
(1,864 | ) | (23 | ) | 1,317 | |||||
| | | | | | | | | | | |
Net cash provided by operating activities |
16,688 | 21,413 | 19,546 | |||||||
| | | | | | | | | | | |
Investing activities: |
||||||||||
Purchases of computers, furniture and equipment |
(1,820 | ) | (2,643 | ) | (3,569 | ) | ||||
Cash paid in connection with acquisitions, net of cash received |
(38,410 | ) | (20,845 | ) | (881 | ) | ||||
| | | | | | | | | | | |
Net cash used in investing activities |
(40,230 | ) | (23,488 | ) | (4,450 | ) | ||||
| | | | | | | | | | | |
Financing activities: |
||||||||||
Repayment of debt |
(9,676 | ) | (1,006 | ) | (858 | ) | ||||
Borrowings of debt |
778 | — | 177 | |||||||
Proceeds from public offerings, net of issuance costs |
37,729 | — | — | |||||||
Repurchase of common stock |
(2,700 | ) | (8,590 | ) | (7,915 | ) | ||||
Proceeds from repayment of notes receivable |
93 | — | — | |||||||
Proceeds from exercise of stock options and stock warrants |
4,174 | 4,861 | 2,100 | |||||||
| | | | | | | | | | | |
Net cash provided by (used in) financing activities |
30,398 | (4,735 | ) | (6,496 | ) | |||||
| | | | | | | | | | | |
Effect of exchange rate on cash |
(52 | ) | (219 | ) | (503 | ) | ||||
Net increase (decrease) in cash and cash equivalents |
6,804 |
(7,029 |
) |
8,097 |
||||||
Cash and cash equivalents, beginning of period |
43,407 | 50,211 | 43,182 | |||||||
| | | | | | | | | | | |
Cash and cash equivalents, end of period |
$ | 50,211 | $ | 43,182 | $ | 51,279 | ||||
| | | | | | | | | | | |
| | | | | | | | | | | |
| | | | | | | | | | | |
The accompanying notes are an integral part of these consolidated financial statements.
74
TANGOE, INC.
NOTES TO CONSOLIDATED FINANCIAL STATEMENTS
1. Organization, Description of Business
Nature of Operations
Tangoe, Inc. (the "Company"), a Delaware corporation, was incorporated on February 9, 2000 as TelecomRFQ, Inc. During 2001, the Company changed its name to Tangoe, Inc. The Company provides connection lifecycle management software and related services to a wide range of global enterprises and service providers. Connection lifecycle management encompasses the entire spectrum of an enterprise's connection-based assets and services, such as voice and data services, mobile devices and usage, cloud software, infrastructure and services, machine-to-machine connections, enterprise social and information technology connections, including planning and sourcing, procurement and provisioning, inventory and usage management, mobile device management, or MDM, real-time telecommunication expense management, or rTEM, invoice processing and payment, expense allocation and accounting and asset decommissioning and disposal. The Company's on-demand Matrix Solution Suite is a suite of software designed to manage IT expenses and to manage and optimize the complex processes and expenses associated with this connection lifecycle management. The Company's Matrix Solution Suite and related services have historically focused on enterprises' fixed and mobile connections and related assets, usage, expenses and analytics. The Company has and continues to enhance and expand its software and service offerings by developing and implementing additional capabilities, including capabilities designed to manage the entire range of an enterprise's IT expenses, and to turn on, track, manage, secure and support various connections in an enterprise's connection lifecycle, such as cloud software, infrastructure and services, machine-to-machine, enterprise social and information technology connections. The Company refers to its Matrix Solution Suite and related service offerings as Matrix.
Public Offerings
In April 2012, the Company completed a public offering whereby it sold 2,200,000 shares of common stock at a price to the public of $18.50 per share. The Company received proceeds from this public offering of $37.7 million, net of underwriting discounts and commissions and other offering costs of $3.0 million.
As part of this public offering, an additional 7,000,000 shares of common stock were sold by certain existing stockholders at a price to the public of $18.50 per share, including 1,200,000 shares sold by such stockholders upon the exercise of the underwriters' option to purchase additional shares. The Company did not receive any proceeds from the sale of such shares by the selling stockholders.
The Company's common stock is traded on the NASDAQ Global Select Market.
2. Summary of Significant Accounting Policies
Consolidation and Basis of Preparation—The consolidated financial statements include the financial results of Tangoe, Inc. and its wholly owned subsidiaries Tangoe EU B.V., Tangoe (China) Co., Ltd., Tangoe-PL, Inc., Tangoe Canada, Inc., Tangoe Europe, Limited, Tangoe Deutschland GmbH (formerly oneTEM GmbH) acquired by the Company on April 18, 2013, Tangoe India Softek Services Private, Limited formed by the Company in August 2012, described further in Note 4, Tangoe PTY Ltd. (Australia), Tangoe do Brasil Servicos Tecnologicos LTDA (Brazil) and Tangoe (Singapore) Co., Pte. Ltd. formed on January 14, 2014. Intercompany balances and transactions have been eliminated in consolidation.
75
TANGOE, INC.
NOTES TO CONSOLIDATED FINANCIAL STATEMENTS (Continued)
2. Summary of Significant Accounting Policies (Continued)
Cash and Cash Equivalents—The Company considers all highly liquid investments with an original maturity of three months or less to be cash equivalents. Cash equivalents consist primarily of a variable interest rate account. As of December 31, 2014, the Company had no restrictions on its $51.3 million of cash and cash equivalents.
Revenue Recognition—Recurring technology and services revenue consists of subscription-based fees, software subscription license fees, software maintenance fees and hosting fees related to the use of the Company's solution to manage its customers' communications expenses. Strategic consulting, software licenses and other revenues consist of fees for contract negotiations, bill audits, sale of mobile telecommunication accessories, professional services and perpetual software licenses. The Company recognizes revenue when persuasive evidence of an arrangement exists, pricing is fixed or determinable, collection is reasonably assured and delivery or performance of service has occurred.
Recurring technology and services subscription-based fees, software subscription license fees, software maintenance fees and hosting fees are recognized ratably over the term of the period of service. The subscription-based services the Company provides include help desk, asset procurement and provisioning and carrier dispute resolution. The Company follows the provisions of Financial Accounting Standards Board ("FASB") Accounting Standards Codification ("ASC") 605-10-S99, Revenue Recognition, and ASC 605-25, Revenue Recognition with Multiple-Element Arrangements. When contracts contain multiple elements, the Company evaluates each element in the contract to determine whether it represents a separate unit of accounting. In order to account for deliverables in a multiple-deliverable arrangement as separate units of accounting, the deliverables must have stand-alone value upon delivery. When multiple deliverables included in an arrangement are separable into different units of accounting, the arrangement consideration is allocated to the identified separate units of accounting based on their relative selling price. Multiple-deliverable arrangements accounting guidance provides a hierarchy to use when determining the relative selling price for each unit of accounting. Vendor-specific objective evidence ("VSOE") of selling price, based on the price at which the item is regularly sold by the vendor on a stand-alone basis, is used if it exists. If VSOE of selling price is not available, third-party evidence ("TPE") of selling price is used to establish the selling price if it exists. If VSOE of selling price and TPE of selling price are not available, the best estimate of selling price ("BESP") is used. The Company determines the BESP for a product or service by considering multiple factors including, but not limited to, integration of project offerings, volume and location of telecommunication spend to be managed and discounting practices.
The Company has determined that implementation fees associated with recurring technology and services engagements do not have stand-alone value and therefore do not represent a separate unit of accounting. As such, they are recognized over the estimated expected life of the customer relationship which the Company estimates to be equal to twice the contract life calculated on a per-customer basis and the Company recognizes implementation fees ratably over this period.
Software license fees consist of fees paid for a perpetual license agreement for the Company's technology, which are recognized in accordance with ASC 985-605, Software Revenue Recognition. VSOE for maintenance and support is established by a stated renewal rate included in the license arrangement or rates charged in stand-alone sales of maintenance and support. If software maintenance fees are provided for in the license fee or at a discount pursuant to a license agreement, a portion of the license fee equal to the fair market value of these amounts is allocated to software maintenance
76
TANGOE, INC.
NOTES TO CONSOLIDATED FINANCIAL STATEMENTS (Continued)
2. Summary of Significant Accounting Policies (Continued)
revenue based on the value established by independent sales of such maintenance services to customers.
Professional services related to the implementation of the Company's software products ("Consulting Services") are generally performed on a fixed fee basis under separate service arrangements. Consulting Services revenue is recognized as the services are performed by measuring progress towards completion based upon either costs or the achievement of certain milestones. The Company also provides contract negotiation and bill audit services ("Strategic Sourcing Services") on behalf of its customers, which are generally performed on a contingency fee basis, with the Company's fees being based on a percentage of the savings the Company achieves for the customer. Revenue from Strategic Sourcing Services engagements is recognized as savings are secured for the customer or as work is completed. The revenue is generally billed as a base fee and a contingency fee based upon the amount of savings secured multiplied by the contingency fee percentage to which the Company is entitled.
In accordance with ASC 985-605, Income Statement Characterization of Reimbursements Received for Out-of-Pocket Expenses, the Company classifies reimbursed expenses as revenue and the related expense within cost of revenue in the accompanying consolidated statements of operations. For the years ended December 31, 2012, 2013 and 2014, reimbursed expenses of $0.2 million, $0.1 million and $0.1 million, respectively, were included in revenue.
Software Development Costs—The Company expenses research and development costs as incurred. The Company has evaluated the establishment of technological feasibility of its products in accordance with ASC 350, Accounting for the Costs of Computer Software to be Sold, Leased or Otherwise Marketed. The Company has concluded that technological feasibility is not established until the development stage of the product is nearly complete. The time period during which costs could be capitalized from the point of reaching technological feasibility until the time of general release is very short and, consequently, the amounts that could be capitalized are not material to the Company's financial position or results of operations. Therefore, the Company charges all such costs to research and development in the period incurred.
Computers, Furniture and Equipment—Computers, furniture and equipment are stated at historical cost. Depreciation of computers, furniture and equipment is provided for, commencing when the assets are placed in service, using the straight-line method over the estimated useful lives of the assets, which range from three to seven years. Leasehold improvements are amortized over the lease term, which is shorter than the useful lives.
Deferred Rent—The Company has operating leases for various office spaces, some of which include a rent escalation clause. GAAP requires that rental expense be reflected on a straight-line basis over the life of the lease. This results in deferred rent on the consolidated balance sheet.
Income Taxes—The Company recognizes deferred tax assets and liabilities for the expected future tax consequences of events that have been recognized in the Company's financial statements or tax returns. Deferred tax assets and liabilities are measured based on the difference between the financial statement carrying amounts and the respective tax basis of assets and liabilities and net operating loss carryforwards available for tax reporting purposes using the applicable tax rates for the years in which
77
TANGOE, INC.
NOTES TO CONSOLIDATED FINANCIAL STATEMENTS (Continued)
2. Summary of Significant Accounting Policies (Continued)
the differences are expected to reverse. A valuation allowance is recorded on deferred tax assets unless realization is determined to be more likely than not.
Concentration of Credit Risk—Financial instruments that subject the Company to risk of loss consist principally of accounts receivable. For the years ended December 31, 2012, 2013 and 2014, no strategic alliance partner or individual end customer represented greater than 10% of total revenue. As of December 31, 2013 and 2014, no strategic alliance partner or individual end customer represented a greater than 10% concentration of total accounts receivable. The Company has balances with financial institutions in excess of the Federal Deposit Insurance Corporation limit. The Company believes that credit risks associated with these concentrations are limited, as the amounts are held by major financial institutions in the United States.
Accounts Receivable and Allowance for Doubtful Accounts—Accounts receivable represent trade receivables from customers when the Company has invoiced for software solutions and/or services and the Company has not yet received payment. The Company presents accounts receivable net of an allowance for doubtful accounts for estimated losses resulting from the inability of customers to make required payments. The allowance for possible losses is estimated based upon a review of outstanding receivables, historical collection information and existing economic conditions. Accounts receivable are charged against the allowance (written-off) when substantially all collection efforts cease. Any change in the assumptions used in analyzing a specific account receivable might result in an additional allowance for doubtful accounts being recognized in the period in which the change occurs. Based on the information available, the Company's management believes that the allowance for doubtful accounts as of December 31, 2013 and 2014 is adequate. For certain transactions, the Company has met the requirements to recognize revenue in advance of physically invoicing the customer. In these instances, the Company records unbilled receivables for the amount that will be due from the customer upon invoicing. As of December 31, 2013 and 2014, unbilled receivables included on the accompanying consolidated balance sheets were $4.6 million and $11.2 million, respectively.
Cash Held on Behalf of Customers—The Company's services for some customers include the payment of the customer's communications invoices directly to the carrier. Such payments are made from separate bank accounts set up on behalf of each such customer, which are funded by the customer shortly in advance of the Company making any disbursements. These accounts are used only for the payment of the customer's invoices and the Company does not fund these accounts, therefore the balances in these accounts are not included on the accompanying consolidated balance sheets. As of December 31, 2013 and 2014, the total funds held by the Company on behalf of its customers were $11.1 million and $15.5 million, respectively.
Use of Estimates—The preparation of financial statements in conformity with accounting principles generally accepted in the United States of America ("GAAP") requires management to make estimates and assumptions that affect the reported amounts of assets and liabilities and disclosure of contingent assets and liabilities at the date of the financial statements and the reported amounts of revenue and expenses during the reported period. Actual results could differ from those estimates.
Income Per Share—Income per common share is calculated in accordance with the provisions of ASC 260, Earnings per Share. Under ASC 260, public companies are required to report both basic and diluted income per common share. Basic and diluted income per share is computed by dividing net income for the period by the weighted average number of shares of common stock outstanding during
78
TANGOE, INC.
NOTES TO CONSOLIDATED FINANCIAL STATEMENTS (Continued)
2. Summary of Significant Accounting Policies (Continued)
the period. The calculation of diluted income per share gives effect to potential common shares; however, potential common shares are excluded if their effect is antidilutive. Potential common shares are composed of shares of common stock issuable upon the exercise of outstanding stock options and warrants and on the vesting of restricted stock units.
Business Combinations and Valuation of Intangible Assets—The Company accounts for business combinations in accordance with ASC 805, Business Combinations. ASC 805 requires business combinations to be accounted for using the purchase method of accounting and includes specific criteria for recording intangible assets separate from goodwill and promotes greater use of fair values in financial reporting. Results of operations of acquired businesses are included in the financial statements of the acquiring company from the date of acquisition. Net assets of the acquired company are recorded at their fair value at the date of acquisition.
Impairment of Goodwill and Certain Other Long-Lived Assets—As required by ASC 350, Goodwill and Other Intangible Assets, the Company accounts for goodwill acquired in acquisition of a business based upon the excess fair value of consideration transferred over the fair value of net assets acquired in the business combination. Goodwill is tested for impairment on an annual basis as of December 31, and, when specific circumstances dictate, between annual tests. The Company has one reporting unit. When impaired, the carrying value of goodwill is written down to fair value. The goodwill impairment test involves evaluating qualitative information to determine if it is more than 50% likely that the fair value of a reporting unit is less than its carrying value in determining if the traditional two-step goodwill impairment test described below must be applied. The first step, identifying a potential impairment, compares the fair value of a reporting unit with its carrying amount, including goodwill. If the carrying value of the reporting unit exceeds its fair value, the second step would need to be conducted; otherwise, no further steps are necessary as no potential impairment exists. The second step, measuring the impairment loss, compares the implied fair value of the reporting unit goodwill with the carrying amount of that goodwill. Any excess of the reporting unit goodwill carrying value over the respective implied fair value is recognized as an impairment loss. There was no impairment of goodwill for the years ended December 31, 2013 and 2014.
The Company accounts for the impairment of long-lived assets other than goodwill in accordance with ASC 360, Accounting for the Impairment or Disposal of Long-Lived Asset. In accordance with ASC 360, the Company accounts for long lived assets, including purchased-intangible assets, based upon the fair value of assets received. Purchased-intangible assets are amortized on a straight line, ranging from two to ten years. The Company performs a review of purchased-intangible assets whenever events or changes in circumstances indicate that the useful life is shorter than the Company originally estimated or that the carrying amount of assets may not be recoverable. If such facts and circumstances exist, the Company assesses the recoverability of purchased-intangible assets by comparing the future undiscounted cash flows associated with the related asset or group of assets over their remaining lives against their respective carrying amounts. Impairments, if any, are based on the excess of the carrying amount over the fair value of those assets. If the useful life of the asset is shorter than originally estimated, the Company accelerates the rate of amortization and amortizes the remaining carrying value over the new shorter useful life. There was no impairment of purchased-intangible assets identified for the years ended December 31, 2013 and 2014.
Stock-Based Compensation—The Company follows ASC 718, Share-based Payment, for recording stock-based compensation. This statement requires recording stock-based awards at fair value. The
79
TANGOE, INC.
NOTES TO CONSOLIDATED FINANCIAL STATEMENTS (Continued)
2. Summary of Significant Accounting Policies (Continued)
Company also complies with the provisions of ASC 505, Accounting for Equity Instruments That Are Issued to Other Than Employees for Acquiring, or in Conjunction with Selling, Goods or Services, with respect to stock option grants to non-employees.
Foreign Currency Translation—In 2014, the Company had wholly owned international subsidiaries in the Netherlands, China, Canada, the United Kingdom, India, Germany, Australia, Brazil and Singapore. For 2013 and 2014, the international operations were immaterial to the overall consolidated financial statements of the Company. Gains and losses on foreign currency translation of the financial statements of foreign operations whose functional currency is other than the U.S. dollar are included in accumulated other comprehensive income. Assets and liabilities of foreign operations are translated at year-end exchange rates and revenue and expense are translated at average rates in effect during the year. Foreign currency exchange gains and losses from transactions and balances denominated in a currency other than the functional currency are recorded in general and administrative expenses on the consolidated statement of operations.
Comprehensive Income—Comprehensive income consists of net income and other comprehensive items. Other comprehensive items include foreign currency translation adjustments.
3. Recent Accounting Pronouncements
In May 2014, the Financial Accounting Standards Board issued Accounting Standards Update No. 2014-09, Revenue from Contracts with Customers ("ASU 2014-09"), which supersedes nearly all existing revenue recognition guidance under GAAP. The core principle of ASU 2014-09 is to recognize revenues when promised goods or services are transferred to customers in an amount that reflects the consideration to which an entity expects to be entitled for those goods or services. ASU 2014-09 defines a five step process to achieve this core principle and, in doing so, more judgments and estimates may be required within the revenue recognition process than are required under existing GAAP. The standard is effective for annual periods beginning after December 15, 2016, and interim periods therein, using either of the following transition methods: (i) a full retrospective approach reflecting the application of the standard in each prior reporting period with the option to elect certain practical expedients, or (ii) a retrospective approach with the cumulative effect of initially adopting ASU 2014-09 recognized at the date of adoption (which includes additional footnote disclosures). The Company is currently evaluating the impact of its pending adoption of ASU 2014-09 on its consolidated financial statements and has not yet determined the method by which it will adopt the standard in 2017.
In June 2014, the FASB issued ASU No. 2014-12 (Topic 718)—Compensation—Stock Compensation ("ASU 2014-12") which provides guidance that a performance target that affects vesting of a share-based payment and that could be achieved after the requisite service period is a performance condition. As a result, the target is not reflected in the estimation of the award's grant date fair value. Compensation cost for such an award would be recognized over the required service period, if it is probable that the performance condition will be achieved. ASU 2014-12 is effective for all entities for annual periods beginning after December 15, 2015 and interim periods within those annual periods. ASU 2014-12 should be applied on a prospective basis to awards that are granted or modified on or after the effective date. The adoption of this standard is not expected to have an impact on the Company's consolidated financial statements.
80
TANGOE, INC.
NOTES TO CONSOLIDATED FINANCIAL STATEMENTS (Continued)
4. Business Combinations
HCL Expense Management Services, Inc.
In December 2010, the Company entered into an Asset Purchase Agreement (the "HCL-EMS APA") to acquire substantially all of the assets and certain liabilities of HCL Expense Management Services, Inc. ("HCL-EMS"). Pursuant to the terms of the HCL-EMS APA, the Company paid $3.0 million in cash at closing, which took place on January 25, 2011 ("HCL-EMS Closing Date"). In addition, the Company was obligated to pay deferred cash consideration following each of the first and second anniversaries of the HCL-EMS Closing Date, pursuant to an earn-out formula based upon specified revenues from specified customers acquired from HCL-EMS, subject to set-off rights of the Company with respect to indemnities given by HCL-EMS under the HCL-EMS APA. The Company valued this contingent consideration at $3.4 million. In May 2012, the Company and HCL-EMS agreed that the amount of the first year earn-out would be $1.9 million and the Company paid that amount to HCL-EMS. In April 2013, the Company and HCL-EMS agreed that the gross amount of the second year earn-out would be $1.9 million. In early August 2013, the Company paid $1.0 million of the second year earn-out to HCL-EMS, and retained the balance of the second year earn-out in the amount of $0.9 million pending resolution of an outstanding indemnity matter. In September 2014, the Company paid $0.4 million in satisfaction of the third-party claim that triggered the indemnity matter and the contingent consideration balance was reduced by this amount. In connection with this transaction, the Company has recorded on its consolidated statement of operations in 2011 and 2013 a restructuring charge related to terminating the use of the former HCL-EMS leased facility in Rutherford, New Jersey that is subject to a lease assumed by the Company in connection with the acquisition.
HCL-EMS Purchase Price Allocation
The allocation of the total purchase price of HCL-EMS' net tangible and identifiable intangible assets was based upon the estimated fair value of those assets as of the HCL-EMS Closing Date. The Company allocated the excess of purchase price over the identifiable intangible and net tangible assets to goodwill. The following table presents the breakdown between cash and contingent consideration and the allocation of the total purchase price (in thousands):
Cash |
$ | 3,000 | ||
Fair value of contingent consideration |
3,390 | |||
| | | | | |
|
$ | 6,390 | ||
| | | | | |
| | | | | |
| | | | | |
Allocation of Purchase Consideration: |
||||
Accounts receivable |
$ | 2,269 | ||
Prepaid and other current assets |
125 | |||
Property and equipment |
273 | |||
Intangible assets |
2,700 | |||
Goodwill |
2,243 | |||
Deposits and non-current assets |
170 | |||
Accounts payable |
(229 | ) | ||
Accrued expenses |
(1,042 | ) | ||
Deferred revenue |
(119 | ) | ||
| | | | | |
|
$ | 6,390 | ||
| | | | | |
| | | | | |
| | | | | |
81
TANGOE, INC.
NOTES TO CONSOLIDATED FINANCIAL STATEMENTS (Continued)
4. Business Combinations (Continued)
The goodwill related to the HCL-EMS acquisition is tax deductible. The Company estimated the fair value of intangible assets using the income, cost and market approaches to value the identifiable intangible assets, which are subject to amortization. The following table presents the Company's estimates of fair value of the intangible assets acquired:
Description
|
Fair Value (in thousands) |
Weighted Average Useful Life (in years) |
|||||
|---|---|---|---|---|---|---|---|
Technology |
$ | 840 | 4.0 | ||||
Customer relationships |
1,860 | 9.0 | |||||
| | | | | | | | |
Total intangible assets |
$ | 2,700 | |||||
| | | | | | | | |
| | | | | | | | |
| | | | | | | | |
Anomalous Networks, Inc.
On January 10, 2012 (the "Anomalous Acquisition Date"), the Company entered into a Share Purchase Agreement (the "Anomalous Purchase Agreement") with Anomalous Networks Inc., a corporation incorporated under the laws of Canada ("Anomalous"), and the shareholders of Anomalous, under which the Company agreed to purchase all of the outstanding equity of Anomalous (the "Anomalous Share Purchase"). This acquisition reflects the Company's strategy to broaden its suite of offerings and to provide real-time telecommunication expense management capabilities. On the same day, the Anomalous Share Purchase was effected in accordance with the terms of the Anomalous Purchase Agreement with the Company acquiring all of the outstanding equity of Anomalous for aggregate consideration of (i) approximately $3,500,000 in cash paid at the closing, (ii) $979,000 in cash payable on the first anniversary of the closing, (iii) 165,775 unregistered shares of the Company's common stock and (iv) 132,617 unvested and unregistered shares of the Company's common stock with vesting based on achievement of revenue targets relating to sales of Anomalous products and services for periods through January 31, 2013. The Company paid the full $979,000 of deferred cash consideration in January 2013. In March 2013, the 132,617 unvested and unregistered shares of the Company's common stock were cancelled and retired because the revenue targets related to sales of Anomalous products and services were not achieved.
Anomalous Purchase Price Allocation
The allocation of the total purchase price of Anomalous' net tangible and identifiable intangible assets was based upon the estimated fair value of those assets as of January 10, 2012. In accordance with Accounting Standards Classification ("ASC") 805, Business Combinations, the Company valued the 165,775 of unregistered shares of common stock by using the closing price of the Company's common stock on the NASDAQ Global Market on the acquisition date and applying a 20% marketability discount to the fair value of the unregistered shares. The marketability discount was applied since the unregistered shares were subject to a lock-up period of one year. The Company allocated the excess of purchase price over the identifiable intangible and net tangible assets to goodwill. The following table
82
TANGOE, INC.
NOTES TO CONSOLIDATED FINANCIAL STATEMENTS (Continued)
4. Business Combinations (Continued)
presents the breakdown between cash and deferred purchase price and the allocation of the total purchase price (in thousands):
Purchase consideration: |
||||
Cash |
$ | 3,521 | ||
Common stock |
1,984 | |||
Deferred cash consideration |
1,495 | |||
| | | | | |
|
$ | 7,000 | ||
| | | | | |
| | | | | |
| | | | | |
Allocation of Purchase Consideration: |
||||
Current assets |
$ | 1,140 | ||
Property and equipment |
47 | |||
Other assets |
10 | |||
Identifiable intangible assets |
2,857 | |||
Goodwill |
4,477 | |||
| | | | | |
Total assets acquired |
8,531 | |||
Accounts payable and accrued expenses |
(394 | ) | ||
Deferred taxes |
(767 | ) | ||
Deferred revenue |
(370 | ) | ||
| | | | | |
|
$ | 7,000 | ||
| | | | | |
| | | | | |
| | | | | |
The goodwill and identifiable intangible assets related to the Anomalous acquisition are not tax deductible. The Company estimated the fair value of intangible assets using the income, cost and market approaches to value the identifiable intangible assets, which are subject to amortization. The following table presents the Company's estimates of fair value of the identifiable intangible assets acquired (in thousands):
Description
|
Fair Value (in thousands) |
Weighted Average Useful Life (in years) |
|||||
|---|---|---|---|---|---|---|---|
Technology |
$ | 2,017 | 5.0 | ||||
Non-compete covenants |
553 | 2.0 | |||||
Customer relationships |
236 | 4.0 | |||||
Tradenames |
51 | 3.0 | |||||
| | | | | | | | |
Total identifiable intangible assets |
$ | 2,857 | |||||
| | | | | | | | |
| | | | | | | | |
| | | | | | | | |
ttMobiles Limited
On February 21, 2012 (the "ttMobiles Acquisition Date"), the Company entered into a Share Purchase Agreement (the "ttMobiles Purchase Agreement"), with the holders of all of the issued share capital of ttMobiles Limited, a private limited company incorporated in England ("ttMobiles"), under which the Company agreed to purchase all of the issued share capital of ttMobiles (the "ttMobiles Share Purchase"). On the same day, the ttMobiles Share Purchase was effected in accordance with the terms of the ttMobiles Purchase Agreement, with the Company acquiring all of the outstanding equity
83
TANGOE, INC.
NOTES TO CONSOLIDATED FINANCIAL STATEMENTS (Continued)
4. Business Combinations (Continued)
of ttMobiles for aggregate consideration of (i) £4.0 million in cash paid at the closing, and (ii) £1.5 million in cash payable on the first anniversary of the closing (the "Deferred Consideration"). The Company paid the full £1.5 million of Deferred Consideration in February 2013.
ttMobiles Purchase Price Allocation
The allocation of the total purchase price of ttMobiles' net tangible and identifiable intangible assets was based upon the estimated fair value of those assets as of February 21, 2012. The Company allocated the excess of purchase price over the identifiable intangible and net tangible assets to goodwill. The following table presents the breakdown between cash and deferred purchase price and the allocation of the total purchase price (in thousands):
Purchase consideration: |
||||
Cash |
$ | 6,359 | ||
Deferred cash consideration |
2,315 | |||
| | | | | |
|
$ | 8,674 | ||
| | | | | |
| | | | | |
| | | | | |
Allocation of Purchase Consideration: |
||||
Current assets |
$ | 2,469 | ||
Property and equipment |
188 | |||
Identifiable intangible assets |
4,288 | |||
Goodwill |
3,557 | |||
| | | | | |
Total assets acquired |
10,502 | |||
Accounts payable and accrued expenses |
(848 | ) | ||
Deferred taxes |
(954 | ) | ||
Deferred revenue |
(26 | ) | ||
| | | | | |
|
$ | 8,674 | ||
| | | | | |
| | | | | |
| | | | | |
The goodwill and identifiable intangible assets related to the ttMobiles acquisition are not tax deductible. The Company estimated the fair value of intangible assets using the income, cost and market approaches to value the identifiable intangible assets, which are subject to amortization. The following table presents the Company's estimates of fair value of the identifiable intangible assets acquired (in thousands):
Description
|
Fair Value (in thousands) |
Weighted Average Useful Life (in years) |
|||||
|---|---|---|---|---|---|---|---|
Customer relationships |
$ | 2,606 | 9.0 | ||||
Technology |
1,178 | 5.0 | |||||
Tradenames |
388 | 4.0 | |||||
Non-compete covenants |
116 | 2.0 | |||||
| | | | | | | | |
Total identifiable intangible assets |
$ | 4,288 | |||||
| | | | | | | | |
| | | | | | | | |
| | | | | | | | |
84
TANGOE, INC.
NOTES TO CONSOLIDATED FINANCIAL STATEMENTS (Continued)
4. Business Combinations (Continued)
Symphony Teleca Services, Inc.
On August 8, 2012, the Company entered into an Asset Purchase Agreement (the "Symphony Purchase Agreement") with Symphony Teleca Services, Inc., a Delaware corporation ("Symphony"), under which the parties agreed to the purchase by the Company of Symphony's telecommunications expense management business (the "TEM Business") through an asset purchase (the "Symphony Acquisition"). As part of the Symphony Acquisition and also on August 8, 2012, a newly formed subsidiary of the Company, Tangoe India Softek Services Private Limited, an Indian private limited company ("Tangoe India"), entered into a Business Purchase Agreement (the "Indian Purchase Agreement") with Symphony Services Corporation (India) Private Limited ("Symphony India") with respect to the purchase of certain assets and hiring of employees of the acquired business located in India. On the same day, the Symphony Acquisition was effected in accordance with the terms of the Symphony Purchase Agreement. At the closing of the Symphony Acquisition, the Company acquired the TEM Business for net consideration of $40.2 million, subject to certain adjustments (the "Cash Purchase Price"), payable as described below, plus an earn-out payable in the amount of up to $4.0 million based on achievement of revenue targets for the acquired business for periods through June 30, 2013. No earn-out became payable because the revenue targets were not achieved. The Cash Purchase Price, after giving effect to certain adjustments, was payable as follows: (i) approximately $29.2 million in cash paid at the closing, (ii) approximately $4.4 million in cash payable on the six-month anniversary of the closing, which included $2.5 million related to the Indian Purchase Agreement, and (iii) approximately $6.4 million in cash payable on the one-year anniversary of the closing. As part of the Symphony Acquisition, the Company acquired a balance sheet for the TEM Business, which included net assets of approximately $5.4 million. The Company made the six-month anniversary payment of $4.4 million in February 2013. The full installment due on August 8, 2013 of approximately $6.4 million, and amounts that became payable under the earn-out, were subject to set-off rights of the Company with respect to indemnities given by Symphony under the Symphony Purchase Agreement. Among other things, these indemnity obligations related to representations and warranties given by Symphony under the Symphony Purchase Agreement and by Symphony India under the Indian Purchase Agreement. Certain of the indemnities were subject to limitations, including a threshold and deductible, certain caps and limited survival periods. The Company made a payment on the one-year anniversary of the closing in the amount of $4.9 million, consisting of the one-year anniversary payment of $6.4 million less $1.3 million withheld pending the resolution of certain indemnity matters, and less a net asset adjustment based on the final closing balance sheet of $0.2 million. In October 2013, the Company and Symphony resolved the indemnity matters and the Company paid the $1.3 million that it had previously deducted from the one-year anniversary payment. During a post-closing transition period that lasted through February 2013, Symphony and Symphony India provided to the Company certain transition services, pending completion of the opening of certain Tangoe India facilities, the procurement of certain Indian tax registrations and the subsequent transfer to Tangoe India of the Indian assets and employees being hired. These services included making available to the Company on a continuing basis the services previously provided by Symphony India to the TEM Business.
Symphony Purchase Price Allocation
The allocation of the total purchase price of Symphony's net tangible and identifiable intangible assets was based upon estimated fair values of those assets as of August 8, 2012. The Company
85
TANGOE, INC.
NOTES TO CONSOLIDATED FINANCIAL STATEMENTS (Continued)
4. Business Combinations (Continued)
allocated the excess of purchase price over the identifiable intangible and net tangible assets to goodwill. The following table presents the breakdown between cash and deferred purchase price and the allocation of the total purchase price (in thousands):
Purchase consideration: |
||||
Cash |
$ | 29,208 | ||
Deferred cash consideration |
10,793 | |||
| | | | | |
|
$ | 40,001 | ||
| | | | | |
| | | | | |
| | | | | |
Allocation of Purchase Consideration: |
||||
Current assets |
$ | 5,628 | ||
Property and equipment |
602 | |||
Identifiable intangible assets |
13,790 | |||
Goodwill |
20,936 | |||
| | | | | |
Total assets acquired |
40,956 | |||
Accounts payable and accrued expenses |
(335 | ) | ||
Deferred revenue |
(620 | ) | ||
| | | | | |
|
$ | 40,001 | ||
| | | | | |
| | | | | |
| | | | | |
The goodwill and identifiable intangible assets related to the Symphony's acquisition are tax deductible. The Company estimated the fair value of intangible assets using the income, cost and market approaches to value the identifiable intangible assets, which are subject to amortization. The following table presents the Company's estimates of fair value of the intangible assets acquired (in thousands):
Description
|
Fair Value | Weighted Average Useful Life (in years) |
|||||
|---|---|---|---|---|---|---|---|
Customer relationships |
$ | 9,680 | 9.0 | ||||
Technology |
4,050 | 5.0 | |||||
Tradename |
60 | 3.0 | |||||
| | | | | | | | |
Total identifiable intangible assets |
$ | 13,790 | |||||
| | | | | | | | |
| | | | | | | | |
| | | | | | | | |
oneTEM GmbH
On April 18, 2013 ("oneTEM Closing Date"), the Company entered into a Share Purchase Agreement (the "oneTEM Purchase Agreement"), with the holders of all of the issued share capital of oneTEM GmbH, a private limited company incorporated in Germany ("oneTEM"), under which the Company agreed to purchase all of the issued share capital of oneTEM (the "oneTEM Share Purchase"). On the oneTEM Closing Date, the oneTEM Share Purchase was effected in accordance with the terms of the oneTEM Purchase Agreement, with the Company acquiring all of the outstanding equity of oneTEM for aggregate consideration of (i) €0.9 million in cash paid at the closing and (ii) deferred consideration of €0.4 million in cash payable on the first anniversary of the closing. In addition, the Company is obligated to pay additional deferred cash consideration following the first four anniversaries of the oneTEM Closing Date, pursuant to an earn-out formula based upon the
86
TANGOE, INC.
NOTES TO CONSOLIDATED FINANCIAL STATEMENTS (Continued)
4. Business Combinations (Continued)
business, whose historic revenue had been one-time consulting revenue, beginning to generate annual recurring revenue from specified customers and then year-over-year increases in annual recurring revenue from those specified customers during the earn-out periods. The earn-out period begins with the first full month after the oneTEM Closing Date and continues for four consecutive 12-month periods. The Company valued this contingent consideration at €0.2 million. The purchase was subject to a net asset adjustment pursuant to which the purchase price would be increased or decreased to the extent the net asset position of oneTEM is more or less than a specified target. The deferred consideration is subject to set-off rights of the Company with respect to certain indemnities given by the former holders of the issued share capital of oneTEM under the oneTEM Purchase Agreement until the deferred consideration is paid in full. The Company included the operating results of oneTEM in its consolidated financial statements since the date of acquisition, including $0.6 million of strategic consulting, software licenses and other revenue.
oneTEM Purchase Price Allocation
The allocation of the total purchase price of oneTEM's net tangible and identifiable intangible assets was based upon management's preliminary estimate of the fair values of those assets taking into account all relevant information available. Actual amounts for each of the fair values of the assets acquired and liabilities assumed may vary. The Company allocated the excess of purchase price over the identifiable intangible and net tangible assets to goodwill. The following table presents the breakdown between cash and deferred purchase price and the allocation of the total purchase price (in thousands):
Purchase consideration: |
||||
Cash |
$ | 1,221 | ||
Deferred cash consideration |
433 | |||
Fair value of contingent consideration |
183 | |||
| | | | | |
|
$ | 1,837 | ||
| | | | | |
| | | | | |
| | | | | |
Allocation of Purchase Consideration: |
||||
Current assets |
$ | 565 | ||
Property and equipment |
10 | |||
Identifiable intangible assets |
870 | |||
Goodwill |
655 | |||
| | | | | |
Total assets acquired |
2,100 | |||
Accounts payable and accrued expenses |
(152 | ) | ||
Taxes payable |
(111 | ) | ||
| | | | | |
|
$ | 1,837 | ||
| | | | | |
| | | | | |
| | | | | |
The goodwill and identifiable intangible assets related to the oneTEM acquisition are not tax deductible. The Company estimated the fair value of intangible assets using the income, cost and market approaches to value the identifiable intangible assets, which are subject to amortization. The
87
TANGOE, INC.
NOTES TO CONSOLIDATED FINANCIAL STATEMENTS (Continued)
4. Business Combinations (Continued)
following table presents the Company's estimates of fair value of the identifiable intangible assets acquired (in thousands):
Description
|
Fair Value | Weighted Average Useful Life (in years) |
|||||
|---|---|---|---|---|---|---|---|
Customer relationships |
$ | 535 | 8.0 | ||||
Covenants not to compete |
298 | 2.0 | |||||
Tradename |
37 | 2.7 | |||||
| | | | | | | | |
Total identifiable intangible assets |
$ | 870 | |||||
| | | | | | | | |
| | | | | | | | |
| | | | | | | | |
5. Unaudited Pro Forma Results
The following table presents the unaudited pro forma results of the Company for the years ended December 31, 2013 and 2014 as if the acquisition of oneTEM occurred at the beginning of 2013. These results are not intended to reflect the actual operations of the Company had the acquisition occurred at January 1, 2013.
| |
Years Ended December 31, |
||||||
|---|---|---|---|---|---|---|---|
(in thousands, except per share amounts)
|
2013 | 2014 | |||||
Revenue |
$ | 189,165 | $ | 212,476 | |||
Operating income |
5,011 | 5,204 | |||||
Net income |
4,860 | 2,936 | |||||
Basic income per common share |
$ | 0.13 | $ | 0.08 | |||
Diluted income per common share |
$ | 0.12 | $ | 0.07 | |||
88
TANGOE, INC.
NOTES TO CONSOLIDATED FINANCIAL STATEMENTS (Continued)
6. Income per Share Applicable to Common Stockholders
The following table sets forth the computations of income per share applicable to common stockholders for the years ended December 31, 2012, 2013 and 2014:
| |
For the Years Ended December 31, |
|||||||||
|---|---|---|---|---|---|---|---|---|---|---|
(in thousands, except per share amounts)
|
2012 | 2013 | 2014 | |||||||
Basic and diluted net income per common share |
||||||||||
Net income |
$ | 3,038 | $ | 4,962 | $ | 2,936 | ||||
| | | | | | | | | | | |
| | | | | | | | | | | |
| | | | | | | | | | | |
Basic weighted-average common shares used to compute basic net income per share |
36,492 | 37,706 | 38,642 | |||||||
Outstanding stock options |
3,230 | 2,623 | 2,328 | |||||||
Outstanding restricted stock units |
— | 141 | 186 | |||||||
Common stock warrants |
15 | 2 | 1 | |||||||
Anomalous unvested and unregistrer shares |
133 | — | — | |||||||
| | | | | | | | | | | |
Diluted weighted-average common shares used to compute diluted net income per share |
39,870 | 40,472 | 41,157 | |||||||
| | | | | | | | | | | |
| | | | | | | | | | | |
| | | | | | | | | | | |
Basic income per common share |
$ | 0.08 | $ | 0.13 | $ | 0.08 | ||||
| | | | | | | | | | | |
| | | | | | | | | | | |
| | | | | | | | | | | |
Diluted income per common share |
$ | 0.08 | $ | 0.12 | $ | 0.07 | ||||
| | | | | | | | | | | |
| | | | | | | | | | | |
| | | | | | | | | | | |
Diluted income per common share for the periods presented does not reflect the following potential common shares as the effect would be anti-dilutive either because the proceeds under the treasury stock method were in excess of the average fair market value for the period or because the Company had a net loss in the period.
Outstanding stock options |
3,624 | 3,547 | 3,276 | |||||||
Outstanding restricted stock units |
221 | 670 | 986 | |||||||
Common stock warrants |
10 | 9 | 9 |
7. Computers, Furniture and Equipment-Net
Computers, furniture and equipment-net consists of:
| |
As of December 31, | ||||||
|---|---|---|---|---|---|---|---|
(in thousands)
|
2013 | 2014 | |||||
Computers and software |
$ | 12,316 | $ | 14,386 | |||
Furniture and fixtures |
1,194 | 1,345 | |||||
Leasehold improvements |
1,380 | 1,595 | |||||
| | | | | | | | |
|
14,890 | 17,326 | |||||
Less: accumulated depreciation |
(10,573 | ) | (12,109 | ) | |||
| | | | | | | | |
Computers, furniture and equipment-net |
$ | 4,317 | $ | 5,217 | |||
| | | | | | | | |
| | | | | | | | |
| | | | | | | | |
Computers and software includes equipment under capital leases totaling approximately $2.5 million at December 31, 2013 and 2014. Accumulated depreciation on equipment under capital
89
TANGOE, INC.
NOTES TO CONSOLIDATED FINANCIAL STATEMENTS (Continued)
7. Computers, Furniture and Equipment-Net (Continued)
leases totaled approximately $2.4 million and $2.5 million as of December 31, 2013 and 2014, respectively. Depreciation and amortization expense associated with computers, furniture and equipment was $2.0 million, $2.3 million and $2.6 million for the years ended December 31, 2012, 2013 and 2014, respectively.
8. Restructuring Charge
In September 2011, the Company recorded a restructuring charge as a result of the consolidation of office space in New Jersey. The consolidation of office space eliminated redundant office space acquired as part of the HCL-EMS acquisition in January 2011 and the Telwares acquisition in March 2011. The original charge reflected the fair value of the remaining rent payments for the office space the Company ceased using, net of estimated sublease income, plus real estate commissions and office relocation costs. During the year ended December 31, 2013, the Company recorded an adjustment of $0.1 million to the original restructuring charge as a result of the Company's inability to sublease the office space in the time period originally expected. Also, during the year ended December 31, 2013, the Company negotiated a lease termination agreement with the landlord of this New Jersey office space. The agreement terminated the remaining term of the lease effective June 30, 2013 for a termination fee of $0.9 million. The Company recorded an adjustment of $0.5 million to the restructuring charge as a result of the lease termination agreement. The liability related to the restructuring charge is included in other current liabilities on the Company's consolidated balance sheets. The following table summarizes the activity in the liabilities related to the restructuring charge for the years ended December 31, 2013 and 2014.
(in thousands)
|
Lease costs, net of estimated sublease income |
Other Costs | Total | |||||||
|---|---|---|---|---|---|---|---|---|---|---|
Remaining liability at December 31, 2012 |
$ | 613 | $ | (8 | ) | $ | 605 | |||
Cash payments |
(1,111 | ) | — | (1,111 | ) | |||||
Non-cash charges and other |
4 | 8 | 12 | |||||||
Restructuring charge |
654 | — | 654 | |||||||
| | | | | | | | | | | |
Remaining liability at December 31, 2013 |
$ | 160 | $ | — | $ | 160 | ||||
| | | | | | | | | | | |
Cash payments |
(160 | ) | — | (160 | ) | |||||
| | | | | | | | | | | |
Remaining liability at December 31, 2014 |
$ | 0 | $ | — | $ | 0 | ||||
| | | | | | | | | | | |
less: current portion |
0 | |||||||||
| | | | | | | | | | | |
Long-term portion |
$ | — | ||||||||
| | | | | | | | | | | |
90
TANGOE, INC.
NOTES TO CONSOLIDATED FINANCIAL STATEMENTS (Continued)
9. Intangible Assets and Goodwill
The following table presents the components of the Company's intangible assets as of December 31, 2013 and 2014:
| |
December 31, | |
||||||
|---|---|---|---|---|---|---|---|---|
| |
Weighted Average Useful Life (in years) |
|||||||
(in thousands)
|
2013 | 2014 | ||||||
Patents |
$ | 1,054 | $ | 1,054 | 8.0 | |||
Less: accumulated amortization |
(897 | ) | (1,029 | ) | ||||
Patents, net |
157 | 25 | ||||||
| | | | | | | | | |
Technological know-how |
15,033 | 14,802 | 6.1 | |||||
Less: accumulated amortization |
(7,853 | ) | (10,245 | ) | ||||
Technological know-how, net |
7,180 | 4,557 | ||||||
| | | | | | | | | |
Customer relationships |
37,935 | 37,758 | 8.7 | |||||
Less: accumulated amortization |
(15,155 | ) | (19,208 | ) | ||||
Customer relationships, net |
22,780 | 18,550 | ||||||
| | | | | | | | | |
Covenants not to compete |
1,144 | 1,094 | 2.0 | |||||
Less: accumulated amortization |
(935 | ) | (1,049 | ) | ||||
Covenants not to compete, net |
209 | 45 | ||||||
| | | | | | | | | |
Strategic marketing agreement |
6,203 | 6,203 | 10.0 | |||||
Less: accumulated amortization |
(597 | ) | (1,090 | ) | ||||
Strategic marketing agreement, net |
5,606 | 5,113 | ||||||
| | | | | | | | | |
Tradenames |
885 | 857 | 3.8 | |||||
Less: accumulated amortization |
(427 | ) | (641 | ) | ||||
Tradenames, net |
458 | 216 | ||||||
| | | | | | | | | |
Trademarks |
247 | 247 | Indefinite | |||||
| | | | | | | | | |
Intangible assets, net |
$ | 36,637 | $ | 28,753 | ||||
| | | | | | | | | |
| | | | | | | | | |
| | | | | | | | | |
In June 2012, the Company converted certain channel customers to direct customers by purchase of the customer contracts from Insight Direct USA Inc., which continues as a referral partner rather than a channel partner, in exchange for consideration of $1.25 million, which has been paid. The Company has included the purchase of these customer contracts in customer relationships.
91
TANGOE, INC.
NOTES TO CONSOLIDATED FINANCIAL STATEMENTS (Continued)
9. Intangible Assets and Goodwill (Continued)
The related amortization expense of intangible assets for 2012, 2013 and 2014 was $6.7 million, $8.1 million and $7.2 million, respectively. The Company's estimate of future amortization expense for acquired intangible assets that exist at December 31, 2014 is as follows:
(in thousands)
|
|
|||
|---|---|---|---|---|
2015 |
5,971 | |||
2016 |
5,565 | |||
2017 |
4,978 | |||
2018 |
4,578 | |||
2019 |
3,585 | |||
Thereafter |
3,829 | |||
| | | | | |
Total |
$ | 28,506 | ||
| | | | | |
| | | | | |
| | | | | |
The following table presents the changes in the carrying amounts of goodwill for the years ended December 31, 2013 and 2014.
(in thousands)
|
Carrying Amount |
|||
|---|---|---|---|---|
Balance at December 31, 2012 |
$ | 65,825 | ||
oneTEM |
655 | |||
Foreign exchange translation effect |
(517 | ) | ||
| | | | | |
Balance at December 31, 2013 |
$ | 65,963 | ||
Foreign exchange translation effect |
(615 | ) | ||
| | | | | |
Balance at December 31, 2014 |
$ | 65,348 | ||
| | | | | |
10. Debt
As of December 31, 2013 and 2014, borrowings outstanding included the following:
| |
December 31, | ||||||
|---|---|---|---|---|---|---|---|
(in thousands)
|
2013 | 2014 | |||||
HCL-EMS contingent consideration. Payable as described below. |
$ | 891 | $ | 541 | |||
Deferred oneTEM purchase price, net of unamortized discount of $87 and $37 at December 31, 2013 and 2014, respectively. Payable as described below. |
684 |
235 |
|||||
Capital lease and other obligations |
459 |
790 |
|||||
| | | | | | | | |
Total notes payable |
$ | 2,034 | $ | 1,566 | |||
Less current portion |
$ | (1,831 | ) | $ | (1,400 | ) | |
| | | | | | | | |
Notes payable, less current portion |
$ | 203 | $ | 166 | |||
| | | | | | | | |
| | | | | | | | |
| | | | | | | | |
Line of Credit
The Company has a line of credit of up to $8.0 million based upon 80% of the Company's eligible accounts receivable with JP Morgan Chase Bank, N.A., which line of credit the Company has not
92
TANGOE, INC.
NOTES TO CONSOLIDATED FINANCIAL STATEMENTS (Continued)
10. Debt (Continued)
utilized following its initial public offering in August 2011. The line of credit bears interest at the London Inter-Bank Offered Rate plus a 2.0% spread. The line of credit matures in September 2015. As of December 31, 2013 and 2014, there were no balances outstanding on the line of credit. The line of credit has a financial covenant relative to minimum cash balance requirements and is secured by all of the Company's tangible and intangible property.
Contingent HCL-EMS Consideration
As described in Note 4, the purchase consideration for the acquisition of HCL-EMS included deferred cash consideration. The deferred cash consideration included contingent cash payments following each of the first and second anniversaries of the HCL-EMS Closing Date, pursuant to an earn-out formula based upon specified revenues from specified customers acquired from HCL-EMS, subject to set-off rights of the Company with respect to indemnities given by HCL-EMS under the HCL-EMS APA. No interest accrued on the deferred cash consideration; however, the Company recorded imputed interest in the amount of $0.6 million based on the Company's weighted average cost of debt as of the date of the acquisition. The obligation to pay the deferred cash consideration is unsecured. In 2012, the Company and HCL-EMS agreed that the gross amount of the first year earn-out would be $1.9 million and the Company paid that amount to HCL-EMS. In April 2013, the Company and HCL-EMS agreed that the gross amount of the second year earn-out would be $1.9 million. In August 2013, the Company paid $1.0 million of the second year earn-out to HCL-EMS, and retained the balance of the second year earn-out in the amount of $0.9 million pending resolution of an outstanding indemnity matter. In September 2014, the Company paid $0.4 million in satisfaction of the third-party claim that triggered the indemnity matter and the contingent consideration balance was reduced by this amount.
Deferred oneTEM Purchase Price
As described in Note 4, the purchase consideration for the acquisition of oneTEM includes deferred cash consideration and contingent earn-out cash consideration. The deferred cash consideration consists of a payment of €0.4 million in cash payable on the first year anniversary of the closing of the oneTEM acquisition. The contingent earn-out cash consideration is payable pursuant to an earn-out formula based upon the business, whose historic revenue had been one-time consulting revenue, beginning to generate annual recurring revenue from specified customers and then year-over-year increases in annual recurring revenue from those specified customers during the earn-out periods. The earn-out period begins with the first full month after the oneTEM Closing Date and continues for four consecutive 12-month periods. The Company valued this contingent earn-out cash consideration at €0.2 million. No interest accrues on the deferred cash consideration or contingent earn-out consideration; however, the Company recorded imputed interest in the amount of €0.1 million based on weighted average cost of capital as of the date of the acquisition. The deferred consideration was and the contingent earn-out cash consideration is subject to set-off rights of the Company with respect to certain indemnities given by the former holders of the issued share capital of oneTEM under the oneTEM Purchase Agreement. In April, 2014, the Company paid the full €0.4 million of deferred consideration which was payable on the first anniversary of the oneTEM Closing Date. This payment did not include any amounts related to the earn-out and no amounts became payable under the earn-out terms for the 12-month period from May 2013 to April 2014.
93
TANGOE, INC.
NOTES TO CONSOLIDATED FINANCIAL STATEMENTS (Continued)
11. Stockholders' Equity
Common Stock—As of December 31, 2013 and 2014, the number of authorized shares of common stock, par value $0.0001 per share, was 150,000,000, of which 38,160,928 and 38,621,169 were issued and outstanding, respectively.
During the year ended December 31, 2012, the Company issued 165,775 unregistered shares of its common stock and 132,617 unvested and unregistered shares of its common stock as part of the Anomalous purchase consideration, as described in Note 4. During the year ended December 31, 2013, the Company cancelled and retired the 132,617 unvested and unregistered shares of its common stock.
During the year ended December 31, 2013, the Company issued 17,941 and 58,975 shares of its common stock to certain of its employees and members of its board of directors, respectively, under the Company's 2011 Stock Incentive Plan (the "2011 Plan"). During the year ended December 31, 2014, the Company issued 230,681 and 70,523 shares of its common stock to certain of its employees and members of its board of directors, respectively, under the provisions of the 2011 Plan. For the years ended December 31, 2013 and 2014, the Company recorded stock-based compensation expense of $0.8 million and $4.5 million, respectively, related to common stock issuances to certain of its employees and members of its board of directors.
At the June 5, 2014 annual meeting of the Company's stockholders, an amendment to the Company's 2011 Stock Incentive Plan (the "2011 Plan") to reserve an additional 950,000 shares of common stock for issuance under the 2011 Plan was approved by a majority of the Company's stockholders. The Company's board of directors had previously approved such amendment.
In November 2012, the Company's Board of Directors authorized a share repurchase program under which the Company may repurchase up to $20 million of its outstanding common stock on the open market or in privately negotiated transactions. During 2012, the Company repurchased 357,751 shares of common stock at an average price per share, including broker commissions, of $12.29, for an aggregate purchase price of $4.4 million. Of the 357,751 shares purchased in 2012, all were repurchased pursuant to trades entered into in 2012, with trades for 216,551 shares settling and such shares being retired in December 2012, and trades for the remaining 141,200 shares settling and such shares being retired in January 2013 as a result of the three trading day settlement convention. During the year ended December 31, 2013, the Company repurchased 519,760 shares of common stock at an average price per share, including broker commissions, of $13.26, for an aggregate purchase price of $6.9 million. In November 2014, the Company's board of directors authorized another share repurchase program under which the Company may repurchase up to $30 million of its outstanding common stock on the open market or in privately negotiated transactions. The $30 million includes $2.3 million of unused funds from the original $20 million share repurchase program announced in 2012. During the year ended December 31, 2014, the Company repurchased 579,251 shares of common stock at an average price per share, including broker commissions, of $13.66, for an aggregate purchase price of $7.9 million.
Preferred Stock—As of December 31, 2013 and 2014, the number of authorized shares of preferred stock, par value $0.0001 per share, was 5,000,000, of which 0 were issued and outstanding.
Common Stock Warrants—During the year ended December 31, 2013, warrant holders exercised warrants to purchase a total of 14,907 shares of common stock. The Company received proceeds of $34,747 related to these warrant exercises. During the year ended December 31, 2014, a warrant holder
94
TANGOE, INC.
NOTES TO CONSOLIDATED FINANCIAL STATEMENTS (Continued)
11. Stockholders' Equity (Continued)
exercised a warrant to purchase a total of 710 shares of common stock. The Company received proceeds of $1,850 related to this warrant exercise.
On March 22, 2011, the Company issued a warrant to purchase up to 1,282,789 shares of its common stock to Dell Products, L.P. ("Dell") in connection with the entry of the Company and Dell into a 49-month strategic relationship agreement. Under the terms of the warrant, the 1,282,789 shares of common stock may become exercisable upon the achievement of certain annual recurring revenue thresholds over the 49-month period. The warrant is exercisable at $5.987 per share. As of December 31, 2014, none of the shares that may become exercisable under this warrant were probable of being earned and becoming vested and accordingly no value was ascribed to this warrant. On a quarterly basis the Company reviews the actual annual recurring revenue related to the Dell strategic relationship agreement to determine if it is probable that Dell will reach any of the annual recurring revenue thresholds that would result in warrant shares being earned and becoming vested, and to the extent the Company deems it probable that any warrant shares will be earned and become vested, the Company will record the fair value of those shares to intangible assets and non-current liabilities using a Black-Scholes valuation model and mark to market each period thereafter until such time as the warrant shares are actually earned and vest.
A summary of warrants to purchase common stock issued and exercised during the years ended December 31, 2012, 2013 and 2014 is presented below:
| |
Common Stock Warrants |
|||
|---|---|---|---|---|
Outstanding at December 31, 2011 |
589,941 | |||
Exercised |
(449,877 | ) | ||
Issued |
10,000 | |||
Cancelled |
(124,447 | ) | ||
| | | | | |
Outstanding at December 31, 2012 |
25,617 | |||
Exercised |
(14,907 | ) | ||
| | | | | |
Outstanding at December 31, 2013 |
10,710 | |||
Exercised |
(710 | ) | ||
| | | | | |
Outstanding at December 31, 2014 |
10,000 | |||
| | | | | |
| | | | | |
| | | | | |
Weighted average exercise price |
$ | 14.02 | ||
| | | | | |
| | | | | |
| | | | | |
Stock Options—As of December 31, 2013, the Company had five stock-based compensation plans, the Employee Stock Option/Stock Issuance Plan (the "Employee Plan"), the Executive Stock Option/Stock Issuance Plan (the "Executive Plan"), the 2005 Stock Incentive Plan (the "2005 Plan"), the Traq Amended and Restated 1999 Stock Plan (the "1999 Plan") and the 2011 Stock Incentive Plan (the "2011 Plan"). The 2011 Plan provides for the grant of incentive stock options, nonstatutory stock options, restricted stock awards and other stock-based awards.
Under the provisions of the Employee Plan, the Executive Plan, the 2005 Plan, the 1999 Plan and the 2011 Plan (the "Plans"), the exercise price of each option is determined by the Company's board of directors or by a committee appointed by the board of directors. Under the 2011 Plan, the exercise price of all stock options must not be less than the fair market value of a share of common stock on
95
TANGOE, INC.
NOTES TO CONSOLIDATED FINANCIAL STATEMENTS (Continued)
11. Stockholders' Equity (Continued)
the date of grant. The period over which options vest and become exercisable, as well as the term of the options, is determined by the board of directors or the committee appointed by the board of directors. The options generally vest over four years and expire 10 years after the date of the grant. During the year ended December 31, 2013, the Company's board of directors granted stock options to purchase an aggregate of 463,475 shares of common stock under the 2011 Plan to employees and non-employees, at a weighted average exercise price of $14.25 per share. During the year ended December 31, 2014, the Company's board of directors did not grant any stock options.
For the years ended December 31, 2013 and 2014, the Company recorded stock-based compensation expense of $8.2 million and $6.6 million, respectively, related to stock options.
As of December 31, 2014, there was $6.3 million of total unrecognized stock-based compensation cost, net of estimated forfeitures, related to stock options. This amount will be amortized on a straight-line basis over the requisite service period related to the stock option grants
A summary of the status of stock options issued pursuant to the Plans during the years ended December 31, 2012, 2013 and 2014 is presented below:
Options
|
Number of Shares |
Weighted Average Exercise Price |
Weighted Average Contractual Life (years) |
|||||||
|---|---|---|---|---|---|---|---|---|---|---|
Outstanding at December 31, 2011 |
6,670,335 | $ | 3.60 | 7.3 | ||||||
Granted |
2,326,500 | $ | 15.83 | |||||||
Forfeited |
(282,909 | ) | $ | 8.67 | ||||||
Exercised |
(1,859,557 | ) | $ | 2.19 | ||||||
| | | | | | | | | | | |
Outstanding at December 31, 2012 |
6,854,369 | $ | 7.92 | 7.5 | ||||||
Granted |
463,475 | $ | 14.25 | |||||||
Forfeited |
(135,626 | ) | $ | 13.15 | ||||||
Exercised |
(1,015,817 | ) | $ | 4.75 | ||||||
| | | | | | | | | | | |
Outstanding at December 31, 2013 |
6,166,401 | $ | 8.81 | 6.9 | ||||||
Granted |
— | $ | — | |||||||
Forfeited |
(109,234 | ) | $ | 14.43 | ||||||
Exercised |
(453,275 | ) | $ | 4.62 | ||||||
| | | | | | | | | | | |
Outstanding at December 31, 2014 |
5,603,892 | $ | 9.04 | 5.9 | ||||||
Exercisable at end of the period |
4,762,752 |
$ |
8.05 |
5.6 |
||||||
| | | | | | | | | | | |
| | | | | | | | | | | |
| | | | | | | | | | | |
Available for future grants at December 31, 2014 |
1,068,405 | |||||||||
| | | | | | | | | | | |
| | | | | | | | | | | |
| | | | | | | | | | | |
96
TANGOE, INC.
NOTES TO CONSOLIDATED FINANCIAL STATEMENTS (Continued)
11. Stockholders' Equity (Continued)
The intrinsic values of options outstanding, vested and exercised during the years ended December 31, 2012, 2013 and 2014 were as follows:
| |
2012 | 2013 | 2014 | ||||||||||||||||
|---|---|---|---|---|---|---|---|---|---|---|---|---|---|---|---|---|---|---|---|
| |
Number of Options |
Intrinsic Value |
Number of Options |
Intrinsic Value |
Number of Options |
Intrinsic Value |
|||||||||||||
Outstanding |
6,854,369 | $ | 35,977,101 | 6,166,401 | $ | 57,358,729 | 5,603,892 | $ | 28,536,126 | ||||||||||
Vested |
3,226,280 | $ | 27,902,361 | 4,086,272 | $ | 46,133,626 | 4,762,752 | $ | 28,205,096 | ||||||||||
Exercised |
1,859,557 | $ | 29,851,276 | 1,015,817 | $ | 14,932,262 | 453,275 | $ | 5,451,897 | ||||||||||
During the year ended December 31, 2013, employees of the Company exercised options to purchase a total of 1,015,817 shares of common stock at exercise prices ranging from $0.25 to $20.39 per share. Proceeds from the stock option exercises totaled $4.8 million.
During the year ended December 31, 2014, employees of the Company exercised options to purchase a total of 453,275 shares of common stock at exercise prices ranging from $0.25 to $17.74 per share. Proceeds from the stock option exercises totaled $2.1 million.
Restricted Stock Units—During the year ended December 31, 2014, the Company issued 879,122 restricted stock units to certain employees under the provisions of the 2011 Plan, of which 135,912 were performance-based restricted stock units, and 284,303 restricted stock units vested resulting in an equal number of shares of common stock being issued. These grants of restricted stock units had an aggregate fair value of $16.1 million. The value of a restricted stock unit award is determined based on the closing price of the Company's stock price at the date of grant. A restricted stock unit award entitles the holder to receive shares of the Company's common stock as the award vests. The restricted stock units vest over periods that range from one to three years. Stock-based compensation expense is amortized on a straight-line basis over the vesting period.
During the year ended December 31, 2013, the Company issued 684,084 restricted stock units to certain employees under the provisions of the 2011 Plan. These grants of restricted stock units had an aggregate fair value of $10.2 million. The value of a restricted stock unit award is determined based on the closing price of the Company's stock price at the date of grant. A restricted stock unit award entitles the holder to receive shares of the Company's common stock as the award vests. The restricted stock units vest over periods that range from one to three years. Stock-based compensation expense is amortized on a straight-line basis over the vesting period.
For the years ended December 31, 2013 and 2014, the Company recorded stock-based compensation expenses of $4.2 million and $7.4 million, respectively, related to restricted stock unit awards.
As of December 31, 2014, there was $14.0 million of total unrecognized stock-based compensation cost, net of estimated forfeitures, related to unvested restricted stock units. This amount will be amortized on a straight-line basis over the requisite service period related to the restricted unit grants.
97
TANGOE, INC.
NOTES TO CONSOLIDATED FINANCIAL STATEMENTS (Continued)
11. Stockholders' Equity (Continued)
A summary of the status of restricted stock units issued pursuant to the 2011 Plan during the years ended December 31, 2012, 2013 and 2014 is presented below:
Restricted Stock Units
|
Number of Shares | Weighted Average Fair Value |
|||||
|---|---|---|---|---|---|---|---|
Outstanding at December 31, 2011 |
— | $ | — | ||||
Granted |
223,814 | $ | 17.30 | ||||
Forfeited |
(2,500 | ) | $ | 20.35 | |||
| | | | | | | | |
Outstanding at December 31, 2012 |
221,314 | $ | 17.27 | ||||
Granted |
684,084 | $ | 14.89 | ||||
Vested |
(92,338 | ) | $ | 17.05 | |||
Forfeited |
(4,267 | ) | $ | 15.70 | |||
| | | | | | | | |
Outstanding at December 31, 2013 |
808,793 | $ | 15.29 | ||||
Granted |
879,122 | $ | 18.36 | ||||
Vested |
(284,303 | ) | $ | 15.99 | |||
Forfeited |
(231,107 | ) | $ | 15.26 | |||
| | | | | | | | |
Outstanding at December 31, 2014 |
1,172,505 | $ | 17.36 | ||||
| | | | | | | | |
| | | | | | | | |
| | | | | | | | |
In accordance with Accounting Standards Classification ("ASC") 718, Share Based Payment ("ASC 718"), total compensation expense for stock-based compensation awards was $9.2 million, $13.3 million and $18.5 million for the years ended December 31, 2012, 2013 and 2014, respectively, which is included on the accompanying consolidated statements of operations as follows (in thousands):
| |
For the Years Ended December 31, |
|||||||||
|---|---|---|---|---|---|---|---|---|---|---|
| |
2012 | 2013 | 2014 | |||||||
Cost of goods sold |
$ | 1,347 | $ | 2,108 | $ | 3,873 | ||||
Sales and marketing expenses |
2,133 | 3,941 | 5,065 | |||||||
General and administrative expenses |
5,105 | 6,220 | 6,802 | |||||||
Research and development |
580 | 990 | 2,758 | |||||||
| | | | | | | | | | | |
Total stock-based employee compensation |
$ | 9,165 | $ | 13,259 | $ | 18,498 | ||||
| | | | | | | | | | | |
| | | | | | | | | | | |
| | | | | | | | | | | |
Stock-based compensation expense for the equity awards outstanding as of December 31, 2014 will be recognized over the following periods as follows (in thousands):
Years Ending December 31,
|
|
|||
|---|---|---|---|---|
2015 |
$ | 13,148 | ||
2016 |
6,610 | |||
2017 |
950 | |||
| | | | | |
|
$ | 20,708 | ||
| | | | | |
| | | | | |
| | | | | |
Stock-based compensation costs are generally based on the fair value calculated from the Black-Scholes valuation model on the date of grant for stock options. The Black-Scholes valuation model
98
TANGOE, INC.
NOTES TO CONSOLIDATED FINANCIAL STATEMENTS (Continued)
11. Stockholders' Equity (Continued)
requires the Company to estimate key assumptions such as expected volatility, expected terms, risk-free interest rates and dividend yields. The Company determined the assumptions in the Black-Scholes valuation model as follows: expected volatility is a combination of the Company's competitors' historical volatility; expected term is calculated using the "simplified" method prescribed in ASC 718; and the risk-free rate is based on the U.S. Treasury yield on 5- and 7-year instruments in effect at the time of grant. A dividend yield is not used, as the Company has never paid cash dividends and does not currently intend to pay cash dividends. The Company periodically reviews the assumptions and modifies the assumptions accordingly.
As part of the requirements of ASC 718, the Company is required to estimate potential forfeitures of stock grants and adjust compensation cost recorded accordingly. The estimate of forfeitures will be adjusted over the requisite service period to the extent that actual forfeitures differ, or are expected to differ, from such estimates. Changes in estimated forfeitures will be recognized through a cumulative catch-up adjustment in the period of change and will also impact the amount of stock-based compensation expense to be recognized in future periods. The fair values of stock grants are amortized as compensation expense on a straight-line basis over the vesting period of the grants. Compensation expense recognized is shown in the operating activities section of the statement of cash flows.
The Company did not grant any stock options during 2014. The fair value of the stock options granted during 2012 and 2013 was determined at the date of grant using the Black-Scholes valuation model with the following assumptions:
| |
2012 | 2013 | ||
|---|---|---|---|---|
Expected dividend yield |
0% | 0% | ||
Risk-free interest rate |
0.79% to 1.16% | 1.04% to 1.86% | ||
Expected term (in years) |
5.5 - 6.1 years | 5.7 - 6.1 years | ||
Expected volatility |
58.09% - 59.92% | 56.34% - 56.84% |
Based on the above assumptions, the weighted-average fair value per share of stock options granted during the years ended December 31, 2012 and 2013 was approximately $8.50 and $7.55, respectively.
12. Income Taxes
The components of income before income taxes for the years ended December 31, 2012, 2013, and 2014 are as follows (in thousands):
| |
2012 | 2013 | 2014 | |||||||
|---|---|---|---|---|---|---|---|---|---|---|
Domestic |
$ | 3,959 | $ | 8,237 | $ | 2,212 | ||||
Foreign |
(441 | ) | (2,264 | ) | 3,038 | |||||
| | | | | | | | | | | |
Income before income tax provision |
$ | 3,518 | $ | 5,973 | $ | 5,250 | ||||
| | | | | | | | | | | |
99
TANGOE, INC.
NOTES TO CONSOLIDATED FINANCIAL STATEMENTS (Continued)
12. Income Taxes (Continued)
The provision for income tax expense for the years ended December 31, 2012, 2013 and 2014 consists of the following components (in thousands):
| |
2012 | 2013 | 2014 | |||||||
|---|---|---|---|---|---|---|---|---|---|---|
Current tax provision: |
||||||||||
State |
$ | 330 | $ | 119 | $ | 548 | ||||
Foreign |
(33 | ) | 492 | 777 | ||||||
| | | | | | | | | | | |
Total current expense |
297 | 611 | 1,325 | |||||||
| | | | | | | | | | | |
Deferred tax provision: |
||||||||||
Federal |
$ | 458 | $ | 737 | $ | 737 | ||||
State |
40 | 273 | 126 | |||||||
Foreign |
(315 | ) | (610 | ) | 126 | |||||
| | | | | | | | | | | |
Total deferred expense |
183 | 400 | 989 | |||||||
| | | | | | | | | | | |
Total income tax provision |
$ | 480 | $ | 1,011 | $ | 2,314 | ||||
| | | | | | | | | | | |
| | | | | | | | | | | |
| | | | | | | | | | | |
Income taxes related to the Company's income from operations differ from the amount computed using the federal statutory income tax rate as follows (in thousands):
| |
Years Ended December 31, | |||||||||
|---|---|---|---|---|---|---|---|---|---|---|
| |
2012 | 2013 | 2014 | |||||||
Tax provision computed at the federal statutory rate |
$ | 1,231 | $ | 2,090 | $ | 1,837 | ||||
Foreign tax rate differential |
(127 | ) | (3 | ) | (580 | ) | ||||
Tax (benefit)/provision related to exercised stock options/warrants |
(9,996 | ) | (1,423 | ) | 704 | |||||
Research and development tax credits |
(205 | ) | 51 | (320 | ) | |||||
Adjustment to prior year deferred and other |
(1,439 | ) | 227 | 282 | ||||||
Change in valuation allowance |
10,302 | (1,008 | ) | (828 | ) | |||||
Taxable goodwill |
499 | 737 | 737 | |||||||
State income taxes |
215 | 340 | 482 | |||||||
| | | | | | | | | | | |
Provision for income taxes |
$ | 480 | $ | 1,011 | $ | 2,314 | ||||
| | | | | | | | | | | |
| | | | | | | | | | | |
| | | | | | | | | | | |
The provision for income taxes differs from the expected tax provision computed by applying the U.S. federal statutory rate to the income before income taxes because the Company has historically maintained a full valuation allowance on its deferred tax assets, as described more fully below, as well as differences in the tax-deductibility of certain items for income tax purposes as compared to the amounts that have been or will be expensed in the Company's consolidated statement of operations, including certain stock warrant and stock option exercises, foreign taxes and rate differentials, taxable goodwill and state income taxes.
100
TANGOE, INC.
NOTES TO CONSOLIDATED FINANCIAL STATEMENTS (Continued)
12. Income Taxes (Continued)
As of December 31, 2013 and 2014, the Company's deferred tax assets (liabilities) were as follows (in thousands):
| |
2013 | 2014 | |||||
|---|---|---|---|---|---|---|---|
Deferred tax assets: |
|||||||
Net operating losses |
$ | 19,675 | $ | 15,882 | |||
Unused research and development credits |
3,450 | 3,414 | |||||
Deferred revenue |
885 | 586 | |||||
Stock-based compensation |
4,235 | 5,741 | |||||
Accrued expenses |
570 | 827 | |||||
Deferred rent |
149 | 70 | |||||
Fixed Assets |
276 | 181 | |||||
Acquisition-related expenses |
68 | 68 | |||||
Allowance for doubtful accounts |
79 | 189 | |||||
Alternative Minimum Tax credit available |
34 | 34 | |||||
Other |
166 | 219 | |||||
Less: valuation allowance |
(25,930 | ) | (25,647 | ) | |||
| | | | | | | | |
|
$ | 3,657 | $ | 1,564 | |||
Deferred tax liabilities: |
|||||||
Intangible assets |
(6,727 | ) | (5,434 | ) | |||
Other |
(22 | ) | (207 | ) | |||
| | | | | | | | |
Net deferred tax liability |
$ | (3,092 | ) | $ | (4,077 | ) | |
| | | | | | | | |
| | | | | | | | |
| | | | | | | | |
The Company recorded no federal income tax provision in 2013 and 2014 due to the utilization of net operating loss carryforwards in both years. State income taxes have resulted primarily from taxes on capital, taxes on gross receipts and minimum taxes imposed by the various states in which the Company operates.
Prior to 2013, there were no foreign income taxes due to taxable losses incurred by the foreign entities. During the years ended December 31, 2013 and 2014, the Company recognized a current foreign tax expense attributable to overall taxable income produced by several foreign entities.
The Company recorded a deferred income tax provision of $0.2 million, $0.4 million and $1.0 million in the years ended December 31, 2012, 2013 and 2014, respectively, related to the different book and tax treatment for goodwill and other intangible assets. For tax purposes, certain goodwill and intangible assets are subject to different amortization allowances than for book purposes. The deferred tax liability of approximately $3.1 million and $4.1 million at December 31, 2013 and 2014, respectively, is included in the Company's consolidated balance sheets within other long-term liabilities.
The Company has provided a valuation allowance for the full amount of its deferred tax assets at December 31, 2013 and 2014, as it is not more likely than not that any future benefit from deductible temporary differences and net operating loss and tax credit carryforwards will be realized. In reaching this determination, the Company weighed both positive and negative evidence with regards to its position. Positive evidence that may support the release of the valuation allowance, such as three consecutive years of book income, was determined to be outweighed by negative evidence in support of maintaining the allowance, including a three-year cumulative tax loss, net operating losses since
101
TANGOE, INC.
NOTES TO CONSOLIDATED FINANCIAL STATEMENTS (Continued)
12. Income Taxes (Continued)
inception, and an overall inconsistent income pattern. Although the weight of positive evidence related to cumulative income is increasing, the Company has determined it does not yet have sufficient positive evidence to support a reversal of the valuation allowance at this time. However, continued improvement in operating results along with continued expectations of sustainable profitability could lead to a reversal of a significant portion of the Company's valuation allowance. The decrease in the valuation allowance of $0.2 million for the year ended December 31, 2014, as compared to the year ended December 31, 2013, is primarily attributable to the utilization net operating loss carryforwards partially offset by increases related to stock-based compensation deferred tax assets.
As of December 31, 2014, the Company has federal net operating loss carryforwards of approximately $30.5 million, which, if unused, expire from 2022 to 2032. In addition to this amount, the Company has approximately $44.7 million of federal income tax loss carryforwards resulting from tax deductions related to stock options awarded to employees. Pursuant to ASC 718-740-25-10, the tax benefits of these deductions will be realized only at the point at which the deductions reduce income taxes payable. The Company also has federal research and development credit carryforwards of approximately $3.8 million at December 31, 2014, which are available to offset future federal tax liabilities.
Sections 382 and 383 of the Internal Revenue Code, and similar state regulations, contain provisions that may limit the net operating loss carryforwards available to be used to offset income in any given year upon the occurrence of certain events, including changes in the ownership interests of significant stockholders. In the event of a cumulative change in ownership in excess of 50% over a three-year period, the amount of the net operating loss carryforwards that the Company may utilize in any one year may be limited. The Company has completed several financings since its inception, which, when combined with the purchasing stockholders' subsequent disposition, have resulted in a change in control as defined by Section 382, or could result in a change in control in the future. In addition, the net operating loss carryforwards assumed from the acquisition of ProfitLine are subject to the provisions of Section 382. In aggregate, approximately $50.0 million of the Company's $75.2 million net operating loss carryforwards are available to offset future taxable income as of December 31, 2014, and the remaining $25.2 million will become available in prescribed increments in each future year through December 31, 2031.
The Company files income tax returns in the U.S. federal jurisdiction, various state jurisdictions and various foreign jurisdictions. The Company's income tax returns are open to examination by federal, state and foreign tax authorities, generally for the years ended December 31, 2011 and later, with certain state jurisdictions open for audit for earlier years. The Company has no amount recorded for any unrecognized tax benefits as of December 31, 2013 and 2014, nor did the Company record any amount for the implementation of ASC 740. The Company's policy is to record estimated interest and penalty related to the underpayment of income taxes or unrecognized tax benefits as a component of its income tax provision. During the years ended 2012, 2013 and 2014, the Company did not recognize any interest or penalties in its statements of operations and there are no accruals for interest or penalties at December 31, 2013 or 2014.
Pursuant to ASC 740-30-25, provision has not been made for U.S. or additional foreign taxes on undistributed earnings of foreign subsidiaries as the Company maintains that those earnings are deemed indefinitely reinvested. The Company plans to utilize undistributed earnings to finance expansion and operating requirements of subsidiaries outside of the United States. As of December 31,
102
TANGOE, INC.
NOTES TO CONSOLIDATED FINANCIAL STATEMENTS (Continued)
12. Income Taxes (Continued)
2014, the Company has undistributed foreign earnings of approximately $5.5 million. Such earnings will be reinvested but could become subject to additional tax if they were remitted as dividends or were loaned to the Company or U.S. affiliates, or if the Company should sell or dispose of its stock in the foreign subsidiaries. It is not practical to determine the deferred tax liability, if any, that might be payable on foreign earnings because if the Company were to repatriate these earnings, the Company believes there would be various methods available to it, each with different U.S. tax consequences.
13. Fair Value Measurement
The Company records certain financial assets and liabilities at fair value on a recurring basis. The Company determines fair values based on that price it would receive to sell an asset or pay to transfer a liability in an orderly transaction between market participants at the measurement date and in the principal or most advantageous market for that asset or liability.
The prescribed fair value hierarchy and related valuation methodologies are as follows:
Level 1—Inputs are unadjusted quoted prices in active markets for identical assets or liabilities that the reporting entity has the ability to access at the measurement date.
Level 2—Inputs other than quoted prices included within Level 1 that are observable for the asset or liability, directly or indirectly, such as a quoted price for similar assets or liabilities in active markets.
Level 3—Inputs are unobservable and are only used to measure fair value when observable inputs are not available. The inputs reflect the entity's own assumptions and are based on the best information available. This allows for the fair value of an asset or liability to be measured when no active market for that asset or liability exists.
The following table discloses the assets and liabilities measured at fair value on a recurring basis as of December 31, 2013 and 2014 and the basis for that measurement:
| |
Fair Value Measurement at December 31, 2013 |
||||||||||||
|---|---|---|---|---|---|---|---|---|---|---|---|---|---|
(in thousands)
|
Total | Level 1 | Level 2 | Level 3 | |||||||||
Money market |
$ | 18,345 | $ | 18,345 | $ | — | $ | — | |||||
Contingent HCL-EMS acquisition consideration |
891 | — | — | 891 | |||||||||
Contingent oneTEM acquisition consideration |
206 | — | — | 206 | |||||||||
| | | | | | | | | | | | | | |
|
$ | 19,442 | $ | 18,345 | $ | — | $ | 1,097 | |||||
| | | | | | | | | | | | | | |
| | | | | | | | | | | | | | |
| | | | | | | | | | | | | | |
| |
Fair Value Measurement at December 31, 2014 |
||||||||||||
|---|---|---|---|---|---|---|---|---|---|---|---|---|---|
(in thousands)
|
Total | Level 1 | Level 2 | Level 3 | |||||||||
Money market |
$ | 18,372 | $ | 18,372 | $ | — | $ | — | |||||
Contingent HCL-EMS acquisition consideration |
541 | — | — | 541 | |||||||||
Contingent oneTEM acquisition consideration |
235 | — | — | 235 | |||||||||
| | | | | | | | | | | | | | |
|
$ | 19,148 | $ | 18,372 | $ | — | $ | 776 | |||||
| | | | | | | | | | | | | | |
| | | | | | | | | | | | | | |
| | | | | | | | | | | | | | |
103
TANGOE, INC.
NOTES TO CONSOLIDATED FINANCIAL STATEMENTS (Continued)
13. Fair Value Measurement (Continued)
The changes in the fair value of the Level 3 liability are as follows:
| |
Contingent acquisition consideration | ||||||||||||
|---|---|---|---|---|---|---|---|---|---|---|---|---|---|
| |
Years Ended December 31, | ||||||||||||
| |
2013 | 2014 | |||||||||||
(in thousands)
|
HCL-EMS | oneTEM | HCL-EMS | oneTEM | |||||||||
Balance, Beginning of Period |
$ | 2,046 | $ | — | $ | 891 | $ | 206 | |||||
Initial earn-out consideration |
— | 181 | — | — | |||||||||
Cash payments |
(1,000 | ) | — | (350 | ) | — | |||||||
Imputed interest |
12 | 25 | — | 29 | |||||||||
Second year earn-out adjustment |
(167 | ) | — | — | — | ||||||||
| | | | | | | | | | | | | | |
Balance, End of Period |
$ | 891 | $ | 206 | $ | 541 | $ | 235 | |||||
| | | | | | | | | | | | | | |
| | | | | | | | | | | | | | |
| | | | | | | | | | | | | | |
The Company's investment in overnight money market institutional funds, which amounted to $18.3 million and $18.4 million at December 31, 2013 and 2014, respectively, is included in cash and cash equivalents on the accompanying consolidated balance sheets and is classified as a Level 1 input.
The acquisition of HCL-EMS includes a contingent consideration agreement that requires additional consideration to be paid by the Company following each of the first and second anniversaries of the HCL-EMS Closing Date, pursuant to an earn-out formula ranging from 7.5% to 15% of specified revenues from specified customers acquired, subject to set-off rights of the Company with respect to indemnities given by HCL-EMS under the HCL-EMS APA. The fair value of the contingent consideration recognized was $3.4 million which was estimated by applying the income approach. The remaining balance of $0.5 million represents the balance retained by the Company pending resolution of an outstanding indemnity matter, after reduction for the $0.4 million payment mentioned below. The key assumptions include (a) a discount rate of 10.5% and (b) probability adjusted levels of revenue between approximately $12.6 million and $13.9 million. As of December 31, 2014, there were no changes in the recognized amounts from December 31, 2013, except for a $0.4 million payment to the third party in satisfaction of the claim that triggered the indemnity matter.
The acquisition of oneTEM includes a contingent earn-out cash consideration agreement that requires additional consideration to be paid by the Company following each of the first four anniversaries of the oneTEM Closing Date. Historically, the oneTEM business had generated one-time consulting revenue. Under the earn-out formula, the earn-out consideration is equal to 9% of annual recurring revenue that the business begins to generate from specified customers in the first year and then 9% of year-over-year increases in annual recurring revenue growth from those specified customers during the earn-out periods. The earn-out period begins with the first full month after the oneTEM Closing Date and continues for four consecutive 12-month periods. The contingent earn-out cash consideration is subject to set-off rights of the Company with respect to indemnities given by the former holders of the issued share capital of oneTEM under the oneTEM Purchase Agreement. The fair value of the contingent earn-out cash consideration recognized was $0.2 million, which was estimated by applying the income approach. The key assumptions include (a) a discount rate of 15% and (b) probability adjusted levels of initial and then increased annual recurring revenue between approximately $0.2 million and $0.3 million. As of December 31, 2014, there were no changes in the recognized amounts from December 31, 2013, except for the accretion of imputed interest.
104
TANGOE, INC.
NOTES TO CONSOLIDATED FINANCIAL STATEMENTS (Continued)
13. Fair Value Measurement (Continued)
The carrying amounts of the Company's other non-cash financial instruments including accounts receivable and accounts payable approximate their fair values due to the relatively short-term nature of these instruments.
14. Supplemental Cash Flow Information
Information about other cash flow activities during the years ended December 31, 2012, 2013 and 2014 are as follows:
(in thousands)
|
2012 | 2013 | 2014 | |||||||
|---|---|---|---|---|---|---|---|---|---|---|
SUPPLEMENTAL DISCLOSURES OF CASH FLOW INFORMATION: |
||||||||||
Cash paid for: |
||||||||||
Interest |
$ | 127 | $ | 86 | $ | 31 | ||||
Income tax payments |
$ | 284 | $ | 388 | $ | 585 | ||||
NON-CASH TRANSACTIONS: |
||||||||||
Deferred purchase price in connection with Anomalous acquisition |
$ | 950 | $ | — | $ | — | ||||
Deferred purchase price in connection with ttMobiles acquisition |
$ | 2,315 | $ | — | $ | — | ||||
Deferred purchase price in connection with Symphony acquisition |
$ | 10,942 | $ | — | $ | — | ||||
Deferred purchase price in connection with oneTEM acquisition |
$ | — | $ | 616 | $ | — | ||||
Issuance of common stock in payment of board of directors fees |
$ | 21 | $ | — | $ | — | ||||
Repurchase of common stock settled in January 2013 |
$ | 1,696 | $ | — | $ | — | ||||
15. Commitments and Contingencies
During the normal course of business, the Company becomes involved in various routine legal proceedings including issues pertaining to patent and trademark infringement, customer disputes, employee matters and acquisition-related post-closing disputes. The Company does not believe that the outcome of these matters will have a material adverse effect on its financial condition.
The Company has entered into non-cancellable operating leases for the rental of office space in various locations which expire between 2015 and 2023. Some of the leases provide for lower payments in the beginning of the term which gradually escalate during the term of the lease. The Company recognizes rent expense on a straight-line basis over the lease term, which gives rise to a deferred rent liability on the balance sheet. The Company also has entered into agreements with third-party hosting facilities, which expire between 2016 and 2017.
The Company is also obligated under several leases covering computer equipment and software, which the Company has classified as financed lease obligations. In March 2014, the Company signed a new lease for additional gross rental office space in Bangalore, India. In May 2014, the Company signed a new lease for additional gross rental office space in Dresden, Germany. In July 2014, the Company signed a lease addendum for additional gross rental office space in Abingdon, UK. In August 2014, the Company signed a new lease for additional gross rental office space in Waltham, MA., replacing the lease that expired in December 2014. In December 2014, the Company signed a lease addendum for additional gross rental office space in China and signed a lease addendum to reduce its gross rental office space in Montreal, Canada. All future minimum rental payments for these addendums have been included in the schedule below. Additionally, the Company has entered into
105
TANGOE, INC.
NOTES TO CONSOLIDATED FINANCIAL STATEMENTS (Continued)
15. Commitments and Contingencies (Continued)
several operating leases for various office equipment items, which expire between March 2015 and September 2018.
As of December 31, 2014, the Company's obligation for future minimum rental payments related to these leases is as follows:
(in thousands)
|
Operating Leases | Financed Lease Obligations |
|||||
|---|---|---|---|---|---|---|---|
2015 |
$ | 6,441 | $ | 814 | |||
2016 |
4,831 | — | |||||
2017 |
2,810 | — | |||||
2018 |
1,709 | — | |||||
2019 |
1,138 | — | |||||
thereafter |
360 | — | |||||
| | | | | | | | |
Total future minimum lease obligations |
$ | 17,289 | $ | 814 | |||
| | | | | | | | |
| | | | | | | | |
| | | | | | | | |
Less: amount representing interest |
(24 | ) | |||||
| | | | | | | | |
Present value of minimum lease obligations |
$ | 790 | |||||
| | | | | | | | |
| | | | | | | | |
| | | | | | | | |
Rent expense, included in general and administrative expense, was approximately $5.0 million, $5.6 million and $6.0 million for the years ended December 31, 2012, 2013 and 2014, respectively.
16. 401(k) Savings Plans
Effective January 2004, the Company adopted a defined contribution 401(k) savings plan (the "Plan") for substantially all of its employees. The Company's contributions to the Plan are discretionary. The Company matched a range of 5% to 10% of employees' contributions in 2012, 2013 and 2014. The cost of contributions made by the Company to the plan was $169,000, $195,000 and $263,000 for the years ended December 31, 2012, 2013 and 2014, respectively.
17. Valuation and Qualifying Accounts
(in thousands)
|
Balance at Beginning of Year |
Additions Charged to Costs and Expenses |
Deductions, Write-offs and Adjustments |
Balance at End of Year |
|||||||||
|---|---|---|---|---|---|---|---|---|---|---|---|---|---|
Allowance for doubtful accounts: |
|||||||||||||
Year ended December 31, 2012 |
$ | 102 | 96 | — | $ | 198 | |||||||
| | | | | | | | | | | | | | |
| | | | | | | | | | | | | | |
| | | | | | | | | | | | | | |
Year ended December 31, 2013 |
$ | 198 | 106 | 21 | $ | 283 | |||||||
| | | | | | | | | | | | | | |
| | | | | | | | | | | | | | |
| | | | | | | | | | | | | | |
Year ended December 31, 2014 |
$ | 283 | 261 | (44 | ) | $ | 588 | ||||||
| | | | | | | | | | | | | | |
| | | | | | | | | | | | | | |
| | | | | | | | | | | | | | |
106
TANGOE, INC.
NOTES TO CONSOLIDATED FINANCIAL STATEMENTS (Continued)
18. Summarized Unaudited Quarterly Results
The following table sets forth certain unaudited quarterly financial information for fiscal 2013 and 2014. This data should be read together with the Company's consolidated financial statements and the related notes included elsewhere in this Annual Report on Form 10-K. The Company has prepared the unaudited information on a basis consistent with its audited financial statements and has included all adjustments of a normal and recurring nature, which, in the opinion of management, are considered necessary to fairly present the Company's revenue and operating expenses for the quarters presented. The Company's historical operating results for any quarter are not necessarily indicative of results for any future period.
| |
For the three months ended | ||||||||||||||||||||||||
|---|---|---|---|---|---|---|---|---|---|---|---|---|---|---|---|---|---|---|---|---|---|---|---|---|---|
| |
March 31, 2013 |
June 30, 2013 |
September 30, 2013 |
December 31, 2013 |
March 31, 2014 |
June 30, 2014 |
September 30, 2014 |
December 31, 2014 |
|||||||||||||||||
Revenue |
$ | 44,860 | $ | 46,407 | $ | 47,620 | $ | 50,027 | $ | 50,394 | $ | 52,674 | $ | 54,481 | $ | 54,927 | |||||||||
Cost of revenue |
20,816 | 20,836 | 21,346 | 21,980 | 23,732 | 24,207 | 25,454 | 24,071 | |||||||||||||||||
| | | | | | | | | | | | | | | | | | | | | | | | | | |
Gross profit |
24,044 | 25,571 | 26,274 | 28,047 | 26,662 | 28,467 | 29,027 | 30,856 | |||||||||||||||||
Total operating expenses |
23,108 | 24,725 | 24,950 | 26,040 | 26,469 | 28,292 | 27,526 | 27,521 | |||||||||||||||||
| | | | | | | | | | | | | | | | | | | | | | | | | | |
Income from operations |
936 | 846 | 1,324 | 2,007 | 193 | 175 | 1,501 | 3,335 | |||||||||||||||||
Other income (expense), net |
420 | 119 | 253 | 68 | (15 | ) | (30 | ) | 69 | 22 | |||||||||||||||
| | | | | | | | | | | | | | | | | | | | | | | | | | |
Income before income taxes |
1,356 | 965 | 1,577 | 2,075 | 178 | 145 | 1,570 | 3,357 | |||||||||||||||||
Income tax provision |
231 | 415 | 22 | 343 | 445 | 548 | 635 | 686 | |||||||||||||||||
| | | | | | | | | | | | | | | | | | | | | | | | | | |
Net income (loss) |
$ | 1,125 | $ | 550 | $ | 1,555 | $ | 1,732 | $ | (267 | ) | $ | (403 | ) | $ | 935 | $ | 2,671 | |||||||
| | | | | | | | | | | | | | | | | | | | | | | | | | |
| | | | | | | | | | | | | | | | | | | | | | | | | | |
| | | | | | | | | | | | | | | | | | | | | | | | | | |
Income (loss) per common share |
|||||||||||||||||||||||||
Basic |
$ | 0.03 | $ | 0.01 | $ | 0.04 | $ | 0.05 | $ | (0.01 | ) | $ | (0.01 | ) | $ | 0.02 | $ | 0.07 | |||||||
Diluted |
$ | 0.03 | $ | 0.01 | $ | 0.04 | $ | 0.04 | $ | (0.01 | ) | $ | (0.01 | ) | $ | 0.02 | $ | 0.07 | |||||||
The sum of the quarterly income per common share amounts does not tie to the full year income per common share amount due to rounding.
107
Item 9. Changes In and Disagreements with Accountants on Accounting and Financial Disclosure
None.
Item 9A. Controls and Procedures
Evaluation of Disclosure Controls and Procedures
The term "disclosure controls and procedures," as defined in Rules 13a-15(e) and 15d-15(e) under the Securities Exchange Act of 1934, as amended (the "Exchange Act"), refers to controls and procedures that are designed to ensure that information required to be disclosed by a company in the reports that it files or submits under the Exchange Act is recorded, processed, summarized and reported, within the time periods specified in the SEC's rules and forms. Disclosure controls and procedures include, without limitation, controls and procedures designed to ensure that information required to be disclosed by a company in the reports that it files or submits under the Exchange Act is accumulated and communicated to the company's management, including its principal executive and principal financial officers, or persons performing similar functions, as appropriate to allow timely decisions regarding required disclosure. Our management recognizes that any controls and procedures, no matter how well designed and operated, can provide only reasonable assurance of achieving their objectives and our management necessarily applies its judgment in evaluating the cost-benefit relationship of possible controls and procedures. Our disclosure controls and procedures are designed to provide reasonable assurance of achieving their control objectives.
Our management, with the participation of our Chief Executive Officer and Chief Financial Officer, has evaluated the effectiveness of our disclosure controls and procedures as of December 31, 2014, the end of the period covered by this Annual Report on Form 10-K. Based upon such evaluation, our Chief Executive Officer and Chief Financial Officer have concluded that our disclosure controls and procedures were effective at the reasonable assurance level as of such date.
Management's Annual Report on Internal Control over Financial Reporting
Our management is responsible for establishing and maintaining adequate internal control over financial reporting. Internal control over financial reporting is defined in Rules 13a-15(f) and 15d-15(f) under the Exchange Act as a process designed by, or under the supervision of, a company's principal executive and principal financial officers, or persons performing similar functions, and effected by a company's board of directors, management and other personnel, to provide reasonable assurance regarding the reliability of financial reporting and the preparation of financial statements for external purposes in accordance with generally accepted accounting principles. Internal control over financial reporting includes those policies and procedures that:
- •
- pertain to the maintenance of records that, in reasonable detail, accurately and fairly reflect the transactions and dispositions of a
company's assets;
- •
- provide reasonable assurance that transactions are recorded as necessary to permit preparation of financial statements in accordance
with generally accepted accounting principles, and that a company's receipts and expenditures are being made only in accordance with authorizations of the company's management and directors; and
- •
- provide reasonable assurance regarding prevention or timely detection of unauthorized acquisition, use or disposition of a company's assets that could have a material effect on the financial statements.
Because of its inherent limitations, internal control over financial reporting may not prevent or detect misstatements. Also, projections of any evaluation of effectiveness to future periods are subject
108
to the risk that controls may become inadequate because of changes in conditions or that the degree of compliance with the policies or procedures may deteriorate.
Our management evaluated the effectiveness of our internal control over financial reporting as of December 31, 2014. In conducting this evaluation, our management used the criteria set forth by the Committee of Sponsoring Organizations of the Treadway Commission ("COSO") in Internal Control—Integrated Framework (2013). Based on its evaluation, our management concluded that, as of December 31, 2014, our internal control over financial reporting was effective based on those criteria.
The effectiveness of our internal control over financial reporting as of December 31, 2014 has been audited by BDO USA, LLP, our independent registered public accounting firm, which is stated in their report included in Part II, Item 8 of this Annual Report.
Changes in Internal Controls
There was no change in our internal control over financial reporting that occurred during the three months ended December 31, 2014 that has materially affected, or is reasonably likely to materially affect, our internal control over financial reporting.
109
Report of Independent Registered Public Accounting Firm
To
the Board of Directors and Stockholders of
Tangoe, Inc.
Orange, Connecticut
We have audited Tangoe, Inc.'s internal control over financial reporting as of December 31, 2014, based on criteria established in Internal Control—Integrated Framework (2013) issued by the Committee of Sponsoring Organizations of the Treadway Commission (the COSO criteria). Tangoe, Inc.'s management is responsible for maintaining effective internal control over financial reporting and for its assessment of the effectiveness of internal control over financial reporting, included in the accompanying Item 9A, Management's Annual Report on Internal Control over Financial Reporting. Our responsibility is to express an opinion on the company's internal control over financial reporting based on our audit.
We conducted our audit in accordance with the standards of the Public Company Accounting Oversight Board (United States). Those standards require that we plan and perform the audit to obtain reasonable assurance about whether effective internal control over financial reporting was maintained in all material respects. Our audit included obtaining an understanding of internal control over financial reporting, assessing the risk that a material weakness exists, and testing and evaluating the design and operating effectiveness of internal control based on the assessed risk. Our audit also included performing such other procedures as we considered necessary in the circumstances. We believe that our audit provides a reasonable basis for our opinion.
A company's internal control over financial reporting is a process designed to provide reasonable assurance regarding the reliability of financial reporting and the preparation of financial statements for external purposes in accordance with generally accepted accounting principles. A company's internal control over financial reporting includes those policies and procedures that (1) pertain to the maintenance of records that, in reasonable detail, accurately and fairly reflect the transactions and dispositions of the assets of the company; (2) provide reasonable assurance that transactions are recorded as necessary to permit preparation of financial statements in accordance with generally accepted accounting principles, and that receipts and expenditures of the company are being made only in accordance with authorizations of management and directors of the company; and (3) provide reasonable assurance regarding prevention or timely detection of unauthorized acquisition, use, or disposition of the company's assets that could have a material effect on the financial statements.
Because of its inherent limitations, internal control over financial reporting may not prevent or detect misstatements. Also, projections of any evaluation of effectiveness to future periods are subject to the risk that controls may become inadequate because of changes in conditions, or that the degree of compliance with the policies or procedures may deteriorate.
In our opinion, Tangoe, Inc. maintained, in all material respects, effective internal control over financial reporting as of December 31, 2014, based on the COSO criteria.
We also have audited, in accordance with the standards of the Public Company Accounting Oversight Board (United States), the consolidated balance sheets of Tangoe, Inc. as of December 31, 2014 and 2013, and the related consolidated statements of operations, comprehensive income, changes in stockholders' equity and cash flows for each of the three years in the period ended December 31, 2014 and our report dated March 16, 2015 expressed an unqualified opinion thereon.
/s/BDO USA, LLP
New
York, New York
March 16, 2015
110
Not applicable.
111
Item 10. Directors, Executive Officers and Corporate Governance
The information required by this Item 10 will be included under the captions "Our Named Executive Officers," "Board Processes—Director Nomination Process," "Board Policies," "Board Meetings and Attendance" and "Section 16(a) Beneficial Ownership Reporting Compliance" in our definitive proxy statement to be filed with the Securities and Exchange Commission with respect to our 2015 Annual Meeting of Stockholders and is incorporated herein by reference.
Item 11. Executive Compensation
The information required by this Item 11 will be included under the captions "Board Processes—Executive and Director Compensation Processes," "Compensation Discussion and Analysis," "Summary Compensation Table," "Grants of Plan-Based Awards Table," "Option Exercises and Stock Vested Table," "Employment Agreements and Severance Agreements with Executive Officers" and "Compensation Committee Interlocks and Insider Participation" in our definitive proxy statement to be filed with the Securities and Exchange Commission with respect to our 2015 Annual Meeting of Stockholders and is incorporated herein by reference.
Item 12. Security Ownership of Certain Beneficial Owners and Management and Related Stockholder Matters
The information required by this Item 12 will be included under the captions "Security Ownership of Certain Beneficial Owners and Management" and "Securities Authorized for Issuance Under Our Equity Compensation Plans" in our definitive proxy statement to be filed with the Securities and Exchange Commission with respect to our 2015 Annual Meeting of Stockholders and is incorporated herein by reference.
Item 13. Certain Relationships and Related Transactions, and Director Independence
The information required by this Item 13 will be included, as applicable, under the captions "Employment Agreements and Severance Agreements with Executive Officers," "Our Board of Directors—Board Determination of Independence" and "Board Policies—Related Person Transactions" in our definitive proxy statement to be filed with the Securities and Exchange Commission with respect to our 2015 Annual Meeting of Stockholders and is incorporated herein by reference.
Item 14. Principal Accountant Fees and Services
The information required by this Item 14 will be included under the captions "Audit Fees and Services" and "Policy for Approval of Services" in our definitive proxy statement to be filed with the Securities and Exchange Commission with respect to our 2015Annual Meeting of Stockholders and is incorporated herein by reference.
112
Item 15. Exhibits and Financial Statement Schedules
1) Financial Statements
Our consolidated financial statements are set forth in Part II, Item 8 of this Annual Report on Form 10-K and are incorporated herein by reference.
2) Financial Statement Schedules
Schedules have been omitted since they are either not required or not applicable or the information is otherwise included herein.
3) Exhibits
The exhibits filed as part of this Annual Report on Form 10-K are listed in the Exhibit Index immediately preceding such Exhibits, which Exhibit Index is incorporated herein by reference.
113
Pursuant to the requirements of Section 13 or 15(d) of the Securities Exchange Act of 1934, the registrant has duly caused this report to be signed on its behalf by the undersigned, thereunto duly authorized.
| TANGOE, INC. | ||||
March 16, 2015 |
By: |
/s/ ALBERT R. SUBBLOIE, JR. Albert R. Subbloie, Jr. President and Chief Executive Officer |
||
Pursuant to the requirements of the Securities Exchange Act of 1934, this report has been signed below by the following persons on behalf of the registrant and in the capacities and on the dates indicated:
Signature
|
Title
|
Date
|
||
|---|---|---|---|---|
| /s/ ALBERT R. SUBBLOIE, JR. Albert R. Subbloie, Jr. |
Director, President and Chief Executive Officer (Principal Executive Officer) | March 16, 2015 | ||
/s/ GARY R. MARTINO Gary R. Martino |
Chief Financial Officer (Principal Financial and Accounting Officer) |
March 16, 2015 |
||
/s/ DAVID M. COIT David M. Coit |
Director |
March 16, 2015 |
||
/s/ JAMES FOY James Foy |
Director |
March 16, 2015 |
||
/s/ GARY P. GOLDING Gary P. Golding |
Director |
March 16, 2015 |
||
/s/ RONALD W. KAISER Ronald W. Kaiser |
Director |
March 16, 2015 |
||
/s/ JACKIE R. KIMZEY Jackie R. Kimzey |
Director |
March 16, 2015 |
114
Signature
|
Title
|
Date
|
||
|---|---|---|---|---|
| /s/ GERALD G. KOKOS Gerald G. Kokos |
Director | March 16, 2015 | ||
/s/ RICHARD S. PONTIN Richard S. Pontin |
Director |
March 16, 2015 |
||
/s/ NOAH J. WALLEY Noah J. Walley |
Director |
March 16, 2015 |
115
| Exhibit Number |
Description | ||
|---|---|---|---|
| 2.1 | Asset Purchase Agreement, dated as of December 21, 2010, by and between the Registrant and HCL Expense Management Services Inc. (incorporated by reference to Exhibit 2.4 to Amendment No. 4 to the Registration Statement on Form S-1 (File No. 333-166123) filed by the registrant on May 2, 2011) | ||
| 2.2 | Asset Purchase Agreement, dated as of March 16, 2011, by and among the Registrant, Telwares, Inc. and Vercuity Solutions, Inc. (incorporated by reference to Exhibit 2.5 to Amendment No. 5 to the Registration Statement on Form S-1 (File No. 333-166123) filed by the registrant on June 1, 2011) | ||
| 2.3 | Agreement and Plan of Merger, dated as of December 19, 2011, by and among Tangoe, Inc., Snow Acquisition Sub, Inc., ProfitLine, Inc. and Doug Carlisle, solely in his capacity as Stockholder Representative (incorporated by reference to Exhibit 2.1 to the Current Report on Form 8-K (File No. 001-35247) filed by the registrant on December 19, 2011) | ||
| 2.4 | Share Purchase Agreement, dated as of January 10, 2012, by and among Tangoe, Inc., Anomalous Networks Inc. and the shareholders of Anomalous Networks Inc. named therein (incorporated by reference to Exhibit 2.1 to the Current Report on Form 8-K (File No. 001-35247) filed by the registrant on January 10, 2012) | ||
| 2.5 | Asset Purchase Agreement, dated as of August 8, 2012, by and among Tangoe, Inc. and Symphony Teleca Services, Inc. (incorporated by reference to Exhibit 2.1 to the Current Report on Form 8-K (File No. 001-35247) filed by the registrant on August 8, 2012) | ||
| 3.1 | Restated Certificate of Incorporation of the Registrant (incorporated by reference to Exhibit 3.1 to the Current Report on Form 8-K (File No. 001-35247) filed by the registrant on August 4, 2011) | ||
| 3.2 | Amended and Restated Bylaws of the Registrant (incorporated by reference to Exhibit 3.2 to the Current Report on Form 8-K (File No. 001-35247) filed by the registrant on August 4, 2011) | ||
| 10.1 | # | Amended and Restated 1999 Stock Plan, as amended (incorporated by reference to Exhibit 10.1 to the Registration Statement on Form S-1 (File No. 333-166123) filed by the registrant on April 16, 2010) | |
| 10.2 | # | Form of Notice of Stock Option Grant and Stock Option Agreement under the Amended and Restated 1999 Stock Plan, as amended (incorporated by reference to Exhibit 10.2 to the Registration Statement on Form S-1 (File No. 333-166123) filed by the registrant on April 16, 2010) | |
| 10.3 | # | Amended and Restated Employee Stock Option/Stock Issuance Plan, as amended (incorporated by reference to Exhibit 10.3 to the Registration Statement on Form S-1 (File No. 333-166123) filed by the registrant on April 16, 2010) | |
| 10.4 | # | Form of Stock Award Option Agreement under the Amended and Restated Employee Stock Option/Stock Issuance Plan, as amended (incorporated by reference to Exhibit 10.4 to the Registration Statement on Form S-1 (File No. 333-166123) filed by the registrant on April 16, 2010) | |
116
| Exhibit Number |
Description | ||
|---|---|---|---|
| 10.5 | # | Amended and Restated Executive Stock Option/Stock Issuance Plan, as amended (incorporated by reference to Exhibit 10.5 to the Registration Statement on Form S-1 (File No. 333-166123) filed by the registrant on April 16, 2010) | |
| 10.6 | # | Form of Stock Option Award Agreement under the Amended and Restated Executive Stock Option/Stock Issuance Plan, as amended (incorporated by reference to Exhibit 10.6 to the Registration Statement on Form S-1 (File No. 333-166123) filed by the registrant on April 16, 2010) | |
| 10.7 | # | 2005 Stock Incentive Plan, as amended (incorporated by reference to Exhibit 10.7 to Amendment No. 1 to the Registration Statement on Form S-1 (File No. 333-166123) filed by the registrant on May 27, 2010) | |
| 10.8 | # | Form of Stock Option Award Agreement under the 2005 Stock Incentive Plan, as amended (incorporated by reference to Exhibit 10.8 to the Registration Statement on Form S-1 (File No. 333-166123) filed by the registrant on April 16, 2010) | |
| 10.9 | # | 2011 Stock Incentive Plan, as amended (incorporated by reference to Appendix A to the definitive proxy statement on Schedule 14A filed by the registrant on April 22, 2014) | |
| 10.10 | # | Form of Incentive Stock Option Agreement under the 2011 Stock Incentive Plan (incorporated by reference to Exhibit 10.10 to Amendment No. 6 to the Registration Statement on Form S-1 (File No. 333-166123) filed by the registrant on June 21, 2011) | |
| 10.11 | # | Form of Nonstatutory Stock Option Agreement under the 2011 Stock Incentive Plan (incorporated by reference to Exhibit 10.11 to Amendment No. 6 to the Registration Statement on Form S-1 (File No. 333-166123) filed by the registrant on June 21, 2011) | |
| 10.12 | Eighth Amended and Restated Investor Rights Agreement, dated as of July 28, 2008, by and among the Registrant and the parties named therein, as amended (incorporated by reference to Exhibit 10.12 to Amendment No. 1 to the Registration Statement on Form S-1 (File No. 333-166123) filed by the registrant on May 27, 2010) | ||
| 10.13 | Lease of Improved Property, dated May 15, 2005, by and between the Registrant and Baker Properties Limited Partnership (incorporated by reference to Exhibit 10.25 to the Registration Statement on Form S-1 (File No. 333-166123) filed by the registrant on April 16, 2010) | ||
| 10.14 | Loan and Security Agreement, dated March 9, 2007, by and between the Registrant, Traq Wireless, Inc. and ORIX Venture Finance LLC, as amended (incorporated by reference to Exhibit 10.31 to Amendment No. 4 to the Registration Statement on Form S-1 (File No. 333-166123) filed by the registrant on May 2, 2011) | ||
| 10.15 | # | Form of Indemnification Agreement between the Registrant and each of David M. Coit, Gary P. Golding, Jackie R. Kimzey, Gerald G. Kokos and Noah J. Walley (incorporated by reference to Exhibit 10.32 to the Registration Statement on Form S-1 (File No. 333-166123) filed by the registrant on April 16, 2010) | |
| 10.16 | # | Form of Indemnification Agreement between the Registrant and each of James D. Foy, Ronald W. Kaiser, Richard S. Pontin and Albert R. Subbloie, Jr. (incorporated by reference to Exhibit 10.33 to the Registration Statement on Form S-1 (File No. 333-166123) filed by the registrant on April 16, 2010) | |
117
| Exhibit Number |
Description | ||
|---|---|---|---|
| 10.17 | + | Warrant to Purchase Common Stock, issued March 22, 2011 to Dell Products L.P. (incorporated by reference to Exhibit 10.35 to Amendment No. 4 to the Registration Statement on Form S-1 (File No. 333-166123) filed by the registrant on May 2, 2011) | |
| 10.18 | Advised Line of Credit Note, issued September 28, 2011 to JPMorgan Chase Bank, N.A. (incorporated by reference to Exhibit 10.36 to Amendment No. 1 to the Registration Statement on Form S-1 (File No. 333-180044) filed by the registrant on March 23, 2012) | ||
| 10.19 | # | Form of Indemnification Agreement between the Registrant and each of Charles D. Gamble, Gary R. Martino, and Scott E. Snyder (incorporated by reference to Exhibit 10.37 to Amendment No. 6 to the Registration Statement on Form S-1 (File No. 333-166123) filed by the registrant on June 10, 2011) | |
| 10.20 | # | Executive Retention Agreement, dated July 8, 2011, by and between the Registrant and Albert R. Subbloie, Jr. (incorporated by reference to Exhibit 10.38 to Amendment No. 7 to the Registration Statement on Form S-1 (File No. 333-166123) filed by the registrant on July 14, 2011) | |
| 10.21 | # | Executive Retention Agreement, dated July 8, 2011, by and between the Registrant and Gary R. Martino (incorporated by reference to Exhibit 10.39 to Amendment No. 7 to the Registration Statement on Form S-1 (File No. 333-166123) filed by the registrant on July 14, 2011) | |
| 10.22 | # | Executive Retention Agreement, dated July 8, 2011, by and between the Registrant and Charles D. Gamble (incorporated by reference to Exhibit 10.41 to Amendment No. 7 to the Registration Statement on Form S-1 (File No. 333-166123) filed by the registrant on July 14, 2011) | |
| 10.23 | # | Executive Retention Agreement, dated July 8, 2011, by and between the Registrant and Scott E. Snyder (incorporated by reference to Exhibit 10.42 to Amendment No. 7 to the Registration Statement on Form S-1 (File No. 333-166123) filed by the registrant on July 14, 2011) | |
| 10.24 | # | Executive Retention Agreement, dated March 22, 2012, by and between the Registrant and Christopher Mezzatesta (incorporated by reference to Exhibit 10.26 to the Annual Report on Form 10-K (File No. 001-35247) filed by the registrant on March 17, 2014) | |
| 10.25 | *# | Summary of Compensation Arrangements for Named Executive Officers and Directors | |
| 10.26 | # | Form of Restricted Stock Unit Agreement with Time-Based Vesting under the 2011 Stock Incentive Plan (incorporated by reference to Exhibit 10.1 to the Current Report on Form 8-K (File No. 001-35247) filed by the registrant on February 7, 2013) | |
| 10.27 | # | Form of Restricted Stock Unit Agreement with Performance-Based Vesting under the 2011 Stock Incentive Plan (incorporated by reference to Exhibit 10.2 to the Current Report on Form 8-K (File No. 001-35247) filed by the registrant on February 7, 2013) | |
| 10.28 | # | Form of Restricted Stock Unit Agreement for use under the 2011 Stock Incentive Plan (incorporated by reference to Exhibit 10.1 to the Current Report on Form 8-K (File No. 001-35247) filed by the registrant on February 6, 2014) | |
| 21.1 | * | Subsidiaries of the Registrant | |
| 23.1 | * | Consent of BDO USA, LLP | |
118
| Exhibit Number |
Description | ||
|---|---|---|---|
| 31.1 | * | Certification of President and Chief Executive Officer pursuant to Exchange Act Rule 13a-14(a) | |
| 31.2 | * | Certification of Chief Financial Officer pursuant to Exchange Act Rule 13a-14(a) | |
| 32.1 | * | Certification of President and Chief Executive Officer pursuant to 18 U.S.C. Section 1350, as adopted pursuant to Section 906 of the Sarbanes-Oxley Act of 2002. | |
| 32.2 | * | Certification of Chief Financial Officer pursuant to 18 U.S.C. Section 1350, as adopted pursuant to Section 906 of the Sarbanes-Oxley Act of 2002. | |
| 101.INS | * | XBRL Instance Document | |
| 101.SCH | * | XBRL Taxonomy Extension Schema Document | |
| 101.CAL | * | XBRL Taxonomy Extension Calculation Linkbase Document | |
| 101.DEF | * | XBRL Taxonomy Extension Definition Linkbase Document | |
| 101.LAB | * | XBRL Taxonomy Extension Label Linkbase Document | |
| 101.PRE | * | XBRL Taxonomy Extension Presentation Linkbase Document | |
- *
- Filed
herewith.
- #
- Management
contracts or compensatory plans or arrangements required to be filed as an exhibit hereto pursuant to Item 15(a) of Form 10-K.
- +
- Confidential treatment requested as to certain portions, which portions have been omitted and filed separately with the Securities and Exchange Commission.
119