Attached files
| file | filename |
|---|---|
| EX-4.13 - CERTIFICATE - Revolution Lighting Technologies, Inc. | d829524dex413.htm |
| EX-4.12 - CERTIFICATE - Revolution Lighting Technologies, Inc. | d829524dex412.htm |
| EX-4.11 - CERTIFICATE - Revolution Lighting Technologies, Inc. | d829524dex411.htm |
| EX-21.1 - SUBSIDIARIES - Revolution Lighting Technologies, Inc. | d829524dex211.htm |
| EX-4.14 - CERTIFICATE - Revolution Lighting Technologies, Inc. | d829524dex414.htm |
| EXCEL - IDEA: XBRL DOCUMENT - Revolution Lighting Technologies, Inc. | Financial_Report.xls |
| EX-32.1 - CERTIFICATION - Revolution Lighting Technologies, Inc. | d829524dex321.htm |
| EX-31.2 - CERTIFICATION - Revolution Lighting Technologies, Inc. | d829524dex312.htm |
| EX-23.1 - CONSENT - Revolution Lighting Technologies, Inc. | d829524dex231.htm |
| EX-31.1 - CERTIFICATION - Revolution Lighting Technologies, Inc. | d829524dex311.htm |
Table of Contents
UNITED STATES
SECURITIES AND EXCHANGE COMMISSION
WASHINGTON, D.C. 20549
FORM 10-K
| x | ANNUAL REPORT PURSUANT TO SECTION 13 OR 15(d) OF THE SECURITIES EXCHANGE ACT OF 1934 |
For the fiscal year ending December 31, 2014
OR
| ¨ | TRANSITION REPORT PURSUANT TO SECTION 13 OR 15(d) OF THE SECURITIES EXCHANGE ACT OF 1934 |
For the transition period from to
Commission File Number 0-23590
REVOLUTION LIGHTING TECHNOLOGIES, INC.
(Exact name of registrant as specified in its charter)
| Delaware (State or other jurisdiction of incorporation or organization) |
59-3046866 (I.R.S. Employer Identification No.) | |
| 177 Broad Street, 12th Floor, Stamford, CT (Address of principal executive offices) |
06901 (Zip Code) | |
Registrant’s telephone number: (203) 504-1111
Securities registered pursuant to Section 12 (b) of the Act:
| Title of each class |
Name of each exchange on which registered | |
| Common Stock, $.001 par value | The NASDAQ Stock Market LLC (NASDAQ Capital Market) |
Securities registered pursuant to Section 12(g) of the Act: None
Indicate by check mark if the registrant is a well-known seasoned issuer, as defined in Rule 405 of the Securities Act. Yes ¨ No x
Indicate by check mark if the registrant is not required to file reports pursuant to Section 13 or 15(d) of the Act. Yes ¨ No x.
Indicate by check mark whether the registrant (1) has filed all reports required to be filed by Section 13 or 15(d) of the Securities Exchange Act of 1934 during the preceding 12 months (or for such shorter period that the registrant was required to file such reports), and (2) has been subject to such filing requirements for the past 90 days. Yes x No ¨
Indicate by check mark whether the registrant has submitted electronically and posted on its corporate Web site, if any, every Interactive Data File required to be submitted and posted pursuant to Rule 405 of Regulation S-T (§232.405 of this chapter) during the preceding 12 months (or for such shorter period that the registrant was required to submit and post such files). Yes x No ¨
Indicate by check mark if disclosure of delinquent filers pursuant to Item 405 of Regulation S-K is not contained herein, and will not be contained, to the best of the registrant’s knowledge, in definitive proxy or information statements incorporated by reference in Part III of this Form 10-K or any amendment to this Form 10-K. ¨
Indicate by check mark whether the registrant is a large accelerated filer, an accelerated filer, a non-accelerated filer, or a smaller reporting company. See the definitions of “large accelerated filer,” “accelerated filer” and “smaller reporting company” in Rule 12b-2 of the Exchange Act. (Check one):
| Large accelerated filer | ¨ | Accelerated filer | x | |||
| Non-accelerated filer | ¨ (Do not check if a smaller reporting company) | Smaller reporting company | ¨ | |||
Indicate by check mark whether the registrant is a shell company (as defined in Rule 12b-2 of the Exchange Act). Yes ¨ No x
The aggregate market value of common equity held by non-affiliates of the registrant as of June 30, 2014, based upon the last sale price of such equity reported on The NASDAQ Capital Market, was approximately $81,742,350.
As of March 9, 2015, there were 130,257,531 shares of Common Stock, $.001 par value, of the registrant outstanding.
DOCUMENTS INCORPORATED BY REFERENCE
Certain information required by Part III of Form 10-K is incorporated by reference to the Registrant’s definitive proxy or information statement for the 2015 Annual Meeting of Stockholders, which will be filed with the Securities and Exchange Commission.
Table of Contents
Revolution Lighting Technologies, Inc.
Index to Annual Report on Form 10-K
For the Year Ended December 31, 2014
| Page | ||||||
| Item 1. |
3 | |||||
| Item 1A. |
11 | |||||
| Item 1B. |
18 | |||||
| Item 2. |
18 | |||||
| Item 3. |
18 | |||||
| Item 4. |
18 | |||||
| Item 5. |
19 | |||||
| Item 6. |
22 | |||||
| Item 7. |
Management’s Discussion and Analysis of Financial Condition and Results of Operations |
23 | ||||
| Item 7A. |
33 | |||||
| Item 8. |
33 | |||||
| Item 9. |
Change in and Disagreements with Accountants on Accounting and Financial Disclosure |
33 | ||||
| Item 9A. |
33 | |||||
| Item 9B. |
36 | |||||
| Item 10. |
36 | |||||
| Item 11. |
36 | |||||
| Item 12. |
Security Ownership of Certain Beneficial Owners and Management and Related Stockholder Matters |
36 | ||||
| Item 13. |
Certain Relationships and Related Transactions and Director Independence |
36 | ||||
| Item 14. |
36 | |||||
| Item 15. |
37 | |||||
| 73 | ||||||
1
Table of Contents
CAUTIONARY NOTE REGARDING FORWARD-LOOKING STATEMENTS
The information contained in this Annual Report on Form 10-K, other than historical information, may include “forward-looking statements” within the meaning of Section 27A of the Securities Act of 1933 and Section 21E of the Securities Exchange Act of 1934. The Private Securities Litigation Reform Act of 1995 (the “Act”) provides certain “safe harbor” provisions for forward-looking statements. All forward-looking statements made in this Annual Report on Form 10-K are made pursuant to the Act. Words such as “may,” “expect,” “intend,” “anticipate,” “believe,” “estimate,” “continue,” “plan” and similar expressions in this report identify forward-looking statements. The forward-looking statements are based on our current views with respect to future events and financial performance. Actual results may differ materially from those projected in the forward-looking statements. The forward-looking statements are subject to risks, uncertainties and assumptions, including, among other factors:
| • | our history of losses and that we may be unable to cover our cost of operations unless we generate sufficient operating income from the sale of our products, or raise additional debt or equity capital; |
| • | the future issuance of additional shares of common stock and/or preferred stock could dilute existing stockholders; |
| • | our loan agreement contains financial covenants that may limit our operating and strategic flexibility; |
| • | our growth strategy depends in part on our ability to execute successful strategic acquisitions; |
| • | we must successfully integrate and realize the expected benefits of our acquisitions, including our recent acquisitions of Tri-State DE LLC, Relume Technologies, Inc., Seesmart Technologies, Inc. and Value Lighting, Inc., or face the potential for losses and impairments; |
| • | we face competition from larger companies in each of our product areas; |
| • | the risk that demand for our LED products fails to emerge as anticipated; |
| • | we are dependent on the availability of components used in our finished products and if third-party manufacturers experience delays, or shipping or transportation is disrupted due to labor unrest or other factors, we may incur delays in shipment to our customers, which would damage our business; |
| • | if the companies to which we outsource the manufacture of our products fail to meet our requirements for quality, quantity and timeliness, our revenue and reputation in the marketplace could be harmed; |
| • | we depend on distributors and independent sales representatives for a portion of our revenue and sales, and the failure to successfully manage our relationships with these third-parties, or the termination of these relationships, could cause our revenue to decline and harm our business; |
| • | the risk that we may not be able to adequately protect our intellectual property rights or that infringement claims by others may subject us to significant costs; |
| • | we are a “controlled company” within the meaning of the rules of NASDAQ and, as a result, are exempt from certain corporate governance requirements that offer protections to stockholders of other NASDAQ-listed companies; and |
| • | our majority stockholder controls the outcome of all matters submitted for stockholder action, including the composition of our board of directors and the approval of significant corporate transactions. |
The factors listed under Item 1A. Risk Factors of this Annual Report on Form 10-K, as well as any other cautionary language in this report, provide examples of risks, uncertainties and events which may cause our actual results to differ materially from the expectations we described in our forward-looking statements. Although we believe that the assumptions underlying the forward-looking statements are reasonable, any of the assumptions could prove inaccurate and, therefore, there can be no assurance that the forward-looking information will prove to be accurate. In light of the significant uncertainties inherent in the forward-looking information included herein, the inclusion of such information should not be regarded as a representation by us or any other person that the objectives or plans of our company will be achieved. We do not undertake any obligation to publicly release the results of any revisions to these forward-looking statements.
2
Table of Contents
| Item 1. | Business. |
General
Revolution Lighting Technologies, Inc. and its wholly-owned subsidiaries (“the Company”, “we”, “our”, “us”) design, manufacture, market and sell commercial grade light-emitting diode (“LED”) and conventional lighting fixtures for outdoor and indoor applications, LED-based signage, channel-letter and contour lighting products, LED replacement lamps and high-performance, commercial grade smart grid control systems. We sell these products under the RVLT, Lumificient, Value Lighting, Array and CMG brand names. We are in the process of consolidating our Seesmart and Relume brand names under the RVLT umbrella. We believe that our product offerings and patented designs provide opportunities for significant savings in energy and maintenance costs without compromising the environment. We generate revenue by selling lighting products for use in the municipal and commercial markets, which include vertical markets such as industrial, commercial and government facilities, hospitality, institutional, educational, healthcare and signage markets. We market and distribute our products globally through networks of distributors, independent sales agencies and representatives, electrical supply companies, as well as internal marketing and sales forces.
Our operations comprise two reportable segments for financial reporting purposes: Lighting Fixtures and Lamps and Lighting Signage and Media. The Lighting Fixtures and Lamps reportable segment includes our Seesmart, Relume, LIT, Tri-State and Value Lighting businesses. The Lighting Signage and Media reportable segment is comprised of the Lumificient business. The Media business of Relume, previously included in the Lighting Fixtures and Lamps segment, was transferred to Lumificient effective January 1, 2014. It has been included in the Lighting Signage and Media reportable segment since that date.
History of Our Business
We were incorporated in Delaware on December 16, 1993. We are the successor by merger to a Florida corporation named Super Vision International, Inc., which was incorporated in January 1991. In April 2007, we changed our name from Super Vision International, Inc. to Nexxus Lighting, Inc. In November 2012, we changed our name from Nexxus Lighting, Inc. to Revolution Lighting Technologies, Inc.
We acquired Lumificient in 2008. We began shipping our line of Array LED replacement lamps in December 2008 and continued to launch Array products in 2009. We broadened the product line by adding additional lamp sizes and options, as well as upgrades to the original products.
On October 28, 2010, we sold substantially all of the assets of our legacy commercial/architectural lighting and pool and spa lighting businesses (which we refer to as the Legacy Commercial and Pool Lighting Businesses). Our Legacy Commercial and Pool Lighting Businesses consisted of the manufacture, marketing and sale of LED and fiber optic lighting products used for applications in commercial, architectural and pool and spa markets, excluding the Array business and the business of Lumificient. The divestiture of these businesses was consistent with our strategic plans to focus our resources on businesses where we see more significant long-term growth potential.
On September 25, 2012, we completed the transactions contemplated by an Investment Agreement (the “Series B Investment Agreement”) with RVL 1 LLC (“RVL”), an affiliate of Aston Capital, LLC (“Aston”), whereby the Company issued to RVL shares of Series B Convertible Preferred Stock (the “Series B Investment” or “Investment”), representing approximately 73% of the Company’s outstanding voting stock. The proceeds from the Series B Investment were used to extinguish approximately $2.5 million of existing short term debt, to fund a settlement payment in connection with the settlement of a lawsuit, to pay the fees and expenses in connection with the Investment and for working capital purposes. The Investment resulted in a change in control of the Company under applicable regulations of The NASDAQ Stock Market (“NASDAQ”) and was consummated pursuant to an exception from the NASDAQ stockholder approval rules pursuant to the “financial viability exception” set forth in NASDAQ Rule 5635(f).
On December 20, 2012, we acquired Seesmart Technologies, Inc. (“Seesmart”), headquartered in Simi Valley, California. Seesmart is an LED solutions provider serving the commercial lighting market. We completed the acquisition of Seesmart for consideration of approximately $10.1 million in cash, approximately 7.7 million shares of common stock valued at approximately $5.0 million and 11,915 shares of Series D convertible preferred stock valued at approximately $1.5 million. In connection with the funding of the Seesmart acquisition, the Company closed an investment agreement with RVL whereby the Company issued 10,000 shares of Series C preferred stock to RVL for cash of $10 million. With the acquisition of Seesmart, we targeted the commercial segment sales channel, moving away from the big box store model we previously pursued. We believe that Seesmart’s management combined with its exclusive network of experienced lighting distributors and sales representatives provides us with a customer and solution-focused advantage. We expect that Revolution’s other businesses will also leverage Seesmart’s distribution network.
3
Table of Contents
On August 22, 2013, we acquired Relume Technologies, Inc. (“Relume”), for a total purchase price of $11.6 million, of which $5 million was paid in cash (approximately $4.3 million net of an estimated working capital adjustment) and 2,174,000 shares of common stock valued at approximately $7.3 million based on the market price of the Company’s stock on the closing date. The cash portion of the purchase price was funded with the proceeds from the issuance of Series F preferred stock to RVL. Relume is a manufacturer of outdoor LED products and smart grid control systems for outdoor lighting applications. Relume services several outdoor LED markets, including municipal street and roadway lights, parking lots and garages, pedestrian areas, buildings and outdoor advertising displays. Approximately 75% of Relume’s business is made up of outdoor lighting, with the remaining part of the business split between smart grid control systems, and LED lighting for media and signage. Relume’s patented Silver Circuitry™ process for LED thermal management offers the first seven-year LED warranty, adding value to customers by improving LED performance, lowering operating temperature and extending LED life. We believe that combining Relume’s LED lighting applications with the suite of products offered by our existing Lumificient and Seesmart brands will help drive new market penetration.
On November 15, 2013, we completed the acquisition of Tri-State DE LLC (“Tri-State”), a distributor of Revolution’s Seesmart products, for cash at closing of $1.8 million, an obligation to pay another $1.5 million in cash in six months, 543,052 common shares of which one half were issued at closing, valued at $1.6 million, and an obligation to issue up to 365,628 additional common shares based on Tri-State achieving specified revenue targets within one year following the acquisition, valued at approximately $0.9 million. Tri-State has a strong management team and a significant client base in New York, New Jersey and Connecticut.
On April 17, 2014, we completed the acquisition of Value Lighting, Inc. (“Value Lighting”), a supplier of lighting solutions to the multifamily residential market. The purchase consideration aggregated to $39.3 million and consisted of cash of $10.6 million funded with a loan from an affiliate, an unconditional obligation to issue an aggregate of 8,468,192 shares of common stock in four installments at nine, twelve, eighteen and twenty-four months from the acquisition date, valued at $20.9 million, and contingent consideration payable in cash or common stock at the option of the Company, aggregating up to a total of $11 million, if certain revenue and EBITDA targets are achieved by Value Lighting for 2014 and 2015 (valued at $7.8 million). The purchase price was reduced by $0.1 million based on the closing working capital. We acquired Value Lighting for its presence in the multifamily residential and construction markets, the experience of the management team, its customer base, operational and business development synergies.
The Lighting Industry
The global lighting industry generally is divided between two major market segments: commercial and residential. Within these two market segments exist two broad product categories: fixtures and light bulbs (referred to as lamps in the lighting industry). The fixtures category includes all apparatuses, luminaires and power/heat-control systems, while lamps consist of the replaceable devices that emit light. Conventional lamps include incandescent, fluorescent and high-intensity discharge (HID) products. For residential applications within the general illumination market, inexpensive incandescent and, to a lesser extent, compact fluorescent (CFL) bulbs have been the preferred choice. For commercial applications, we believe that the more expensive and long-lasting fluorescent and HID bulbs and fixtures have the largest market share at this time.
With rapid advancements in the performance, efficiency and cost of energy-efficient lighting, including LED-based solutions, conventional light sources are beginning to be replaced by advanced technologies with lower operating costs over their useful lives. In addition, the energy-efficient nature of LED technology makes it an environmentally friendly light source, and the compact size of LEDs has created new possibilities in lighting fixture and lamp design. Product selection is influenced by a number of factors, including overall cost, energy efficiency, product life, lumen output and other product features, as well as regulatory, maintenance and environmental factors. We believe our unique advanced lighting solutions are well positioned to increasingly displace conventional lighting in each of our targeted markets.
In North America, lighting manufacturers typically sell products through independent manufacturer’s representatives and electrical supply and distribution companies. The distributors then market products to electrical contractors and other end-users. Representatives also have direct contact with lighting designers, electrical engineers, architects and general contractors that influence buying decisions. The manufacturer’s representatives often provide value-added services, such as product promotion or design and implementation assistance. The ability of smaller companies to compete against larger more-established rivals is heavily rooted in their capacity to leverage their unique product portfolios and customer service to garner maximum productivity from each representative.
4
Table of Contents
LED Lighting Industry Trends
LEDs are semiconductor-based devices that generate light. As the cost of LEDs decreases and their performance improves, we expect that they will continue to compete more effectively in the general illumination market versus traditional lighting. High-brightness LEDs are the core, light-producing components within an LED lighting system. We believe the LED lighting industry is experiencing the following trends:
Technological Innovations Expand LED Functionality. Since the introduction of the first visible LED in the 1960s, the technology has offered an increasingly wide variety of colored lighting, beginning with red and expanding to green, yellow and orange. Initial rudimentary applications included traffic lights, automotive brake lights and indicator lights. In the mid-1990s, LEDs became capable of emitting blue light. With the advent of blue LEDs, combined with phosphor technology, LEDs made another technological leap by emitting white light. This breakthrough enabled LEDs to compete with traditional lighting solutions for applications in residential, industrial and commercial markets.
In an effort to lower energy consumption, lighting companies are focusing on increasing “lumens per watt.” Lumens per watt (often referred to as “efficacy”) is an industry standard that measures the amount of light emitted per watt of electrical power used, meaning the more lumens per watt, the more energy-efficient the product. Traditional incandescent lighting sources can produce between 10 and 35 lumens per watt, while fluorescent and HID light sources can produce output of approximately 50 lumens per watt. Today’s LEDs are currently performing well over 100 lumens per watt at the LED level, making them comparable to, and often better than, fluorescent and HID light sources.
High Energy Costs Drive LED Adoption. As a result of high energy prices and the expectation that prices will continue to rise, businesses and consumers are increasingly adopting new technologies to reduce energy consumption. LED lighting technology is inherently more energy efficient and can result in more than 80% power savings over incandescent solutions. According to a leading consulting company, 20% of all energy consumption in the United States is from lighting applications. This combined rate represents approximately half of all energy consumption in commercial buildings as compared to approximately 15% for residential users and 7% for industrial companies. Despite safety issues and concerns, compact fluorescent (CFL) bulbs are used for lighting energy conservation. However, recent technological advancements to LED lighting have made it more commercially viable in terms of brightness, efficiency, lamp life, safety, maintenance reduction and color-rendering (CRI). In addition, competitive pressures, declining LED costs and greater manufacturing efficiencies are driving down LED lamp prices. As a result of these gains, the global lighting market is experiencing rapid LED adoption which is expected to continue for the foreseeable future. In 2012, an analysis of the global lighting market by a leading consulting company predicted that the LED market share will grow from 18%, or $12 billion, in 2012 to 70%, or $72 billion, in 2020.
Legislative Influences Spur Market Adoption of Energy Efficient LED Lighting. Government regulations, such as initiatives by the United States Department of Energy and the Environmental Protection Agency’s Energy Star Certification Program, are driving adoption of more energy efficient lighting solutions. Energy Star sets industry-wide international standards for lighting products that outline efficiency and performance criteria, helping manufacturers promote their products and purchasers better understand lighting products.
Governments are also adopting or proposing legislation to promote energy efficiency and conservation. Lower energy consumption translates into lower electricity generation, often from coal power plants, and thus can significantly lower carbon emissions. Legislative actions to promote energy efficiency can beneficially impact the LED lighting market in the countries adopting such legislation and other countries, as well. For example, several countries have effectively banned the 40, 60, and 100-watt light bulbs and are expected to progressively apply these restrictions to lower-wattage bulbs. In addition, LED lighting solutions are free of hazardous materials such as mercury, which can be harmful to the environment. Any restrictions on the use of hazardous substances could adversely affect one of the LED lamp’s primary competitors, the CFL market.
Utility Companies Are Rewarding Conservation Efforts. Demand on the existing power grid in the United States continues to rise. Coupled with this rising demand for energy, utility companies face many challenges to generate more power, including high investment costs to expand capacity or construct new facilities, costly and time-consuming regulatory approval processes, community and environmental protests, and extended construction periods. As a result, many utility companies are seeking ways to curb demand rather than expand capacity. One alternative is to reward customers’ conservation efforts with rebates or utility credits. In an effort to encourage the development of high-quality, energy-efficient LED lamps eligible for utility rebates, the DesignLights Consortium (DLC) was created. This organization works to establish rigorous performance standards for the LED lighting industry. LED products that meet DLC’s standards become listed on its qualified-products list, making them eligible for substantial rebates from utility
5
Table of Contents
companies. Seesmart and Relume currently offer 159 and 40 DLC-listed lighting products, respectively, and continue to develop and submit more products for DLC certification. At present utility subsidies are generally geared toward CFLs. Given the greater efficiency and more attractive conservation features of LED lighting, we believe subsidies for LEDs will become increasingly popular and drive up demand.
While LEDs are rapidly gaining popularity, one of the biggest challenges remaining is educating the end user on the true benefits that LED technology provides. Our go-to market strategy has given us a competitive edge, setting ourselves apart as both industry leaders and educators within the commercial LED lighting space.
The Benefits of LED Technology are Driving an Increase in Previous Technology Retrofit and Renovation. The energy savings and positive environmental effect of installing LED technology in both commercial and residential applications are increasing the market size of retrofit and renovation as compared to new construction. We believe we are expert in both retrofit and renovation. Retrofit consists of the replacement of a luminaire or lamp, one for one, without changing the location or type of luminaire. Renovation consists of redesign of the existing space with LED, potentially using new luminaires in a different location, and possibly adding a control system to further enhance the environment and the energy savings. There are billions of sockets currently operating with traditional light sources that we believe will be converted to LED. It is estimated that about 50% of the dollars spent on LED will be to replace existing technology.
Our Competitive Advantages
We believe the following strengths of our company provide us with competitive advantages in the marketplace:
Energy-Efficient and Environmentally Conscious Lighting Solutions. We feature company brands and product offerings for multiple markets looking to construct or convert to LED. Our brands offer indoor and outdoor luminaires and lamps designed for commercial and municipal applications, industrial and warehouse applications, education, hospitality, and healthcare applications, and parking and street lighting applications. Our Value Lighting brand offers luminaires and lamps designed and distributed primarily to the multi-family and residential markets, including both LED and conventional lighting fixtures. Our Lumificient brand produces LED products for the commercial sign, cove and accent markets. Our Sentinel brand designs and provides control systems that compliment and support all brands of LED and they deliver significant electrical and installation savings over and above the luminaire based on its superior design. Based upon our review of publicly available performance data from competitors, our products can provide a quicker return on investment than competitive products, and up to a 90% energy savings over incandescent lamps. We have designed our product lines to be value-engineered to produce cost-effective, high-quality lighting solutions. Four of our LED lamps were among the first lamps to be certified under the Energy Star program that began accepting applications in September 2010. In February 2012, our R30 lamps were the first LED reflector lamp replacements to earn the full 50,000-hour certification by Energy Star. This 50,000-hour life is equivalent to more than 10 years when the lamp is on for twelve hours per day.
Product Development. We have a proven product development process that produces high quality LED products utilizing what we believe is the newest and best technology. Our process is driven internally by staff engineers, who provide internal design specifications to our internal manufacturing capabilities and our certified third-party partners. By designing our products to utilize what we believe to be the best-in-class components, we are able to integrate the latest technology into our products. Our product design process, utilizing a combination of internal design and third party partners where applicable, allows us to maintain an agile position in the marketplace. We invest our research and product development resources and our engineering expertise to optimize our product designs, construction and performance. Exceptional quality, and success in the desired application vertical, are our primary goals.
Reliable, High-Quality and Cost-Competitive Solutions. We design, manufacture and sell high-quality and reliable products across all of our brands with demonstrable performance advantages that are cost competitive. Many of our products are designed to operate for up to 50,000 hours or more, and are backed by warranties of up to 10 years. We achieve this, in part, through a combination of sourcing high-quality LEDs, utilizing proprietary thermal management techniques and conducting rigorous third-party product testing. To deliver cost-competitive solutions, we are investing in product advancements, leveraging purchasing volume, capitalizing on strategic vendor relationships and migrating high-volume products to our proprietary manufacturing process. Additionally, several of our products have qualified with Energy Star and DLC for conservation-driven incentives with utilities, and we plan to apply for rebate programs with other utilities in the U.S. as they become available. This should translate into additional economic incentives for our customers to purchase our products.
Distributor, Dealer and Agency Networks. We have a distributor and dealer network that is well-educated in LED lighting technology. They are motivated entrepreneurs who are excited by the adoption of LED, and they desire to build a local business helping others benefit from this outstanding technology. As of March 1, 2015, we have 58 exclusive dealers, distributors and teaming partners in the United States, and distributors in four other countries. We are on track to continue to grow in selected domestic and international markets. Our distributor and dealer network provides us with a competitive advantage in delivering high-quality
6
Table of Contents
products rapidly to market and providing leading end-user education. We also have established relationships with approximately 38 independent commercial sales agencies, which are overseen by four regional sales directors, to provide a geographic footprint spanning the entire United States territory.
Experienced Management Team. Our senior management team includes individuals with diverse backgrounds and broad experience. We are led by our Chief Executive Officer, Robert V. LaPenta, a very successful leader with over 30 years of executive management experience in building billion-dollar companies, and our President and Chief Financial Officer, Charles Schafer, with over 30 years of executive management experience. Our management team has demonstrated the ability to drive organic growth and pursue and integrate strategic acquisitions.
Our Growth Strategy
Our objective is to become the leading provider of advanced LED lighting solutions. A key element of our growth strategy is servicing the following markets in all aspects of choosing LED and controls technology, and also being their expert and partner when they choose to retrofit or renovate. These markets are:
| • | Commercial and municipal |
| • | Industrial and warehouse |
| • | Education |
| • | Healthcare |
| • | Hospitality |
| • | Federal, state, and local government |
| • | Multi-family |
| • | Signs and media |
| • | Residential lamps |
Another Key Element of our Growth Strategy is Being an Education Resource to our Customer. We believe that end-user education about the benefits of LED lighting is extremely important. There is a growing need for unique advances in LED engineering and the market is beginning to embrace the technology. Through education, we have created a sales force and distribution network that provides the knowledge necessary to drive the commercial market. By introducing new products with longer life and lower cost we believe that the LED market and its acceptance will continue to grow at a rapid rate.
Expanding our White-Light LED Product Portfolio. We are expanding our white-light LED product portfolio for general illumination. We currently have over 16 categories of lighting products offering our customers the ability to retrofit 99%, if not 100% of their facilities with LED technology. As our goal is to serve our customers and create a quality experience in both product and service, we will continue to expand these categories and add necessary fixtures and lamps to increase our offering as an LED solution provider.
Developing and Protecting Our Intellectual Property. We have devoted significant resources to building an advanced research and development team for developing complementary intellectual property to expand our portfolio of advanced lighting technologies. Securing and defending intellectual property related to the design, manufacture and application of advanced lighting technology is expected to be a key element of our existing and future business. The strength of our intellectual property portfolio allows us to compete on the basis of our technology, which we believe gives us an advantage over many of our larger competitors.
Capitalizing on Opportunities in Our Target Markets. We believe there is a growing need for unique, advanced lighting solutions across our target markets. We expect to continue to introduce innovative advanced lighting products as we believe there exists significant opportunities to grow market share. By introducing new products and expanding sales of existing products, we believe that we can significantly improve operational efficiency by reducing our cost of materials, components and manufacturing. Expanding our products and increasing our sales also allows us to gain additional leverage from sales representatives within our distribution network.
Products
Commercial Lamps and Fixtures. The RVLT umbrella for commercial lamps and fixtures products includes the following commercial indoor and interior lighting products:
| • | Linear Tube Lighting |
7
Table of Contents
| • | Multi-Family Lighting |
| • | Commercial Lay-In (troffer) Lighting |
| • | Luminaire LED Retrofit Kits |
| • | Downlighting and Accent Lighting |
| • | Replacement LED Lamps |
| • | Garage and Parking Lot Lighting |
| • | Street Lighting |
| • | High- and Low-Bay Lighting |
| • | Multi-Purpose Lighting |
| • | Signage and Accent Lighting |
| • | Smart Grid Control Systems |
These categories encompass well over 1,000 different products with various color-temperature choices, optic angles, lens options, and wattages. Applications include interior use, outdoor use, new fixture installation, retrofit installation, smart grid control systems and integration of our LED technology into custom applications. We have standard-performance, high-performance and ultra-high-performance categories within our product offerings.
Multi-Family Lighting: Our Value Lighting business was founded in 2005 and has provided lighting solutions for over 200,000 family units over the past five years. The majority of this business is repeat business from satisfied customers and contractors. Value Lighting sells both our branded LED products and non-LED lighting fixtures sourced from others. We believe that the Value Lighting acquisition affords an opportunity to sell our LED solutions into Value Lighting’s established multifamily distribution channels.
Signage, Media and Strip Lighting: Our Lumificient business offers products that target the signage market, primarily with the Hyperion R-Lite™ and its patented Silver Circuitry. Increasingly, these products are expanding into non-signage applications, such as vending machines, illuminated display tables, and architectural applications. These products are energy-efficient, easy to install, and highly dependable. Lumificient’s LED products are ideally suited for corporate branding where long life, durability, ease of installation and uniform illumination, without scalloping or hot spots, are required. We believe that the Lumificient LED light engine is among the best available.
Competition
We currently face competition from both traditional lighting companies that provide general lighting products, including incandescent, fluorescent, high intensity discharge (HID), metal halide (MH) and neon lighting. We also have competitors from specialized lighting companies that are engaged in providing LED products. In general, we compete with both groups on the basis of design, innovation, and quality of light, maintenance costs, safety issues, energy consumption, price, product quality and brightness.
In the general illumination market, we compete with traditional lighting companies that include Acuity Brands Lighting, Inc., Cooper Lighting (a division of Cooper Industries, Inc.), Hubbell Lighting, Inc. (a division of Hubbell Incorporated), Juno Lighting Group (a division of Schneider Electric SA), Osram Sylvania, GE Lighting and Royal Philips Lighting (a division of Koninklijke Philips Electronics N.V.). Our LED products tend to be alternatives to conventional lighting sources for applications within the commercial market. In these markets, we compete on the basis of performance, energy savings, lamp life, and durability.
We also compete with providers of LED replacement lamps and other energy-efficient lighting products and fixtures. These companies include traditional lighting companies such as Sylvania and Philips; specialized lighting companies such as Cree, Inc.; certain packaged LED suppliers such as Cree, as well as multiple low-cost offshore providers. In the market for LED lighting products, we compete on the basis of design, innovation, light quality, maintenance costs, safety issues, energy consumption, price, product quality, brightness, and DLC, Energy Star and UL certifications.
8
Table of Contents
We believe that we will compete favorably in our markets, based on the following factors:
| • | Breadth and diversity of high-quality product offerings |
| • | Our expansive distribution network and developed relationships |
| • | Speed to market with the latest technology that works |
| • | Innovative products at competitive price points |
| • | UL, DLC and Energy Star certifications |
| • | Ability to offer various levels of products and a custom product program |
| • | Value-engineered products producing a fast return on investment |
| • | Responsiveness to customers |
We expect our markets to remain competitive and to reflect rapid technological evolution and continuously evolving customer and regulatory requirements. Our ability to remain competitive depends in part upon our success in developing new and advanced lighting solutions and introducing these products at competitive prices on a timely basis.
Sales and Marketing
We are an LED solutions provider; we believe that we furnish exceptional customer service and the highest-quality LED products available for commercial installation. Our Value Lighting division also sells conventional lighting products in the multifamily market based on customer needs.
We market and sell our LED products through our dedicated dealer and distribution network and commercial agency networks. All of our distributors, dealers and agencies are recruited, trained, and managed by us directly. We maintain a firm policy on the use of our name for branding our LED lighting products, and we control the message going to our end users in all of our self-generated collateral material.
We promote our brands and products through print media, online media, trade shows and educational seminars. Our advertising is geared toward lead generation, distributor and dealer recruitment, brand awareness, and end-user acceptance of LED technology.
We maintain a channel management team in-house that serves our distributor and dealer base for support. As we grow, we plan to grow our team to manage their accounts and give them the support they need to build their business and promote the brands we own.
Manufacturing and Suppliers
We design and engineer our products and outsource a significant portion of the manufacture and assembly of our products to a number of contract manufacturers both domestically and internationally. These contract manufacturers purchase components that we specify and provide the necessary facilities and labor to manufacture our products. We leverage the strength of the contract manufacturers and allocate the manufacture of specific products to the contract manufacturer best suited to the task. Quality control and lot testing is conducted in our facilities in Simi Valley, California and Oxford, Michigan where we also assemble and manufacture certain of our products.
Our Lumificient business operates a manufacturing facility in Maple Grove, Minnesota. Some of our products, however, use a custom LED package and are sourced from a limited number of suppliers. Although we currently are dependent on these suppliers, we believe that, if necessary, alternative sources of supply could be found. However, any interruption or delay at our third-party manufacturers or in the supply of the components, or in our ability to obtain components from alternate sources at acceptable prices in a timely manner, could harm our business, financial condition and results of operations.
Research and Product Development
The general focus of our research and development team is the design and integration of electronics, optics and thermal management solutions to create advanced lighting products. Through these efforts, we seek to enhance our existing products, design new products, and develop solutions for customer applications. We believe that quick responsiveness to customer demands and our ability to achieve industry certifications such as UL, DLC and Energy Star for certain products differentiates us from many of our competitors, as we rapidly introduce new products to address market needs. During 2014, we spent approximately $2.1 million on research and product development activities. We continue to invest in our product development, prototypes and specifications as we believe that increased levels of spending on research and development will be necessary to successfully develop advanced lighting products that will have the brightness of traditional lighting systems while being offered at acceptable prices.
9
Table of Contents
Patents and Proprietary Rights
We currently hold 73 patents related to our LED lighting intellectual property and have 33 patent applications currently filed with the United States Patent and Trademark Office or with the World Intellectual Property Organization or foreign patent offices.
Although we expect that several of our patent applications will issue, we cannot be certain that patents will be granted with respect to any of our pending patent applications or with respect to any patent applications filed by us in the future, nor can we be sure that any patents that may be granted to us in the future will be commercially useful in protecting our technology. In addition, despite our efforts to protect our intellectual property, unauthorized parties may attempt to copy aspects of our products or obtain and use information that we regard as proprietary.
Royalties
The Company has from time to time entered into agreements whereby we have agreed to pay royalties for the use of certain LED technologies. Royalty expense incurred under these agreements was immaterial for all years presented.
Regulations, Standards and Conventions
Our products are generally required to meet the electrical codes of the jurisdictions in which they are sold. Meeting the typically more stringent codes established in the United States and the European Union usually allows our products to meet the codes in other geographic regions.
Many of our customers require that our products be listed by UL. UL is a U.S., independent, nationally recognized testing laboratory and certification organization. UL develops standards and test procedures for products, materials, components, assemblies, tools and equipment, chiefly dealing with product safety. UL evaluates products, components, materials, and systems for compliance to specific requirements, and it permits acceptable products to carry a UL certification mark, as long as they remain compliant with the standards. UL offers several categories of certification. Products that are “UL Listed,” are identified by the distinctive UL mark. Many of our LED lighting products are UL-listed, which boosts demand by ensuring their quality and safety.
Today, many of our customers and end-users also expect our products to meet the applicable DLC or Energy Star requirements. DLC and Energy Star are industry standards for energy-efficient lighting products. To qualify for Energy Star certification, LED lighting products must pass a variety of rigorous tests to prove that the products have certain performance and efficiency characteristics. Four of our former Array-branded lamps were among the first lamps to be certified under the Energy Star program, which began accepting applications for lamps in September 2010. A variety of our LED products are DLC-listed, too, making them eligible for valuable rebates from utility companies. DLC currently lists 145 Revolution Lighting Technologies (formerly listed under Seesmart, Inc.) and over 309 Relume LED products on its Qualified Products List. Like Energy Star, DLC sets stringent product performance and efficiency requirements that manufacturers must meet to qualify for certification. In fact, DLC bases many of its performance requirements on the Energy Star model. However, unlike Energy Star, which primarily regulates products for the residential lighting market, DLC regulates lighting products manufactured for the commercial market. By designing and manufacturing LED products that meet DLC, Energy Star and UL standards, we expect to further improve our sales and industry reputation.
Seasonality
The business exhibits some seasonality, with net sales being affected by the impact of weather and seasonal demand on construction and installation programs, particularly during the winter months. Because of these seasonal factors, we have experienced, and generally expect to experience, our highest sales in the second and third quarters of each fiscal year.
Our lighting solutions are sold to customers in both the new construction and renovation and retrofit markets. The construction market is cyclical in nature and subject to change in general economic conditions. Unit sales volume has a major impact on our profitability. Economic downturns and the potential decline in key construction markets may have a material effect on net sales and operating income.
Financial Information about Foreign and Domestic Operations
See Note 13 to consolidated financial statements included in this Annual Report on Form 10K.
10
Table of Contents
Environmental Protection Regulations
We believe that compliance with environmental protection regulations will not have a material impact on our financial position and results of operations.
Employees
As of February 1, 2015, we had a total of 206 full-time employees and three part-time employees. We enjoy good employee relations. None of our employees are a member of any labor union, and we are not a party to any collective bargaining agreement.
Corporate Information
Our principal executive offices are located at 177 Broad Street, 12th Floor, Stamford, CT 06901. Our telephone number is (203) 504-1111 and our website is located at www.rvlti.com.
We are a public company and are subject to informational requirements of the Securities Exchange Act of 1934. Accordingly, we filed periodic reports, proxy statements and other information with the Securities and Exchange Commission (the “SEC”). Such reports, proxy statements and other information may be obtained by visiting the Public Reference Room of the SEC at 100 F Street NE, Room 1580, Washington D.C. 20549 on business days during the hours of 10 a.m. to 3 p.m. or by calling the SEC at 1-800-SEC-0330. In addition, the SEC maintains a website (http://www.sec.gov) that contains reports, proxy and information statements and other information regarding us and other issuers that file electronically. We maintain a corporate website at www.rvlti.com. We intend to use our website as a regular means of disclosing material information and for complying with disclosure obligations under Regulation FD promulgated by the SEC. Such disclosures will be included on the website under the heading “Investor Relations”. Accordingly, investors should monitor such portions of the website, in addition to following the Company’s press releases, SEC filings and public conference calls and webcasts.
| Item 1A. | Risk Factors |
The following are some of the factors that we believe could cause our actual results to differ materially from expected and historical results. The risks and uncertainties described below are not the only ones facing our company. Additional risks and uncertainties not currently known to us or that we currently deem immaterial may also affect our business operations.
We have a history of losses and may incur losses in the future. We may be unable to generate sufficient operating income from the sale of our products or raise additional debt or equity capital.
We have experienced net losses of approximately $5.2 million, $16.8 million and $8.6 million for the years ended December 31, 2014, 2013 and 2012, respectively. As of December 31, 2014, we had an accumulated deficit of approximately $72.3 million. In order for us to attain profitability and growth, we will need to successfully execute our production, marketing and sales plans for our product lines and improve our distribution and supply chain performance. We may fail to achieve profitability in the future, and our business may not be as successful as we envision. Continuing losses could exhaust our capital resources and force us to scale back, suspend or discontinue our operations. Our operating expenses may continue to increase as we spend resources on growing our business, and if our revenue does not correspondingly increase, our operating results and financial condition will suffer.
We have funded our operations primarily through the issuance of common and preferred stock. We have received financing primarily from our affiliate RVL 1, LLC (“RVL”), an entity affiliated with our Chairman and Chief Executive Officer. The actual amount of funds that we will need to meet our operating needs will be determined by a number of factors, many of which are beyond our control. These factors include the timing and volume of sales transactions, the success of our marketing strategy, market acceptance of our products, the success of our manufacturing and research and product development efforts (including any unanticipated delays), the costs associated with obtaining and enforcing our intellectual property rights, regulatory changes, competition, technological developments in the market, evolving industry standards and the amount of working capital investments we are required to make. If we raise funds by selling additional shares of our common stock or securities convertible or exercisable into our common stock, the ownership interest of our existing stockholders will be diluted. If we are unable to obtain sufficient outside capital when needed, our business and future prospects will be adversely affected and we could be forced to scale back, suspend or discontinue operations.
The future issuance of additional shares of common stock and/or preferred stock could dilute existing stockholders.
Pursuant to our Amended and Restated Certificate of Incorporation (the “Certificate of Incorporation”), we currently have authorized 150,000,000 shares of common stock and 5,000,000 shares of preferred stock. To the extent that common shares are available for issuance, subject to compliance with applicable stock exchange listing rules, our board of directors has the ability to issue additional shares of common stock in the future for such consideration as the board of directors may consider sufficient. The issuance of any additional securities could, among other things, result in substantial dilution of the percentage ownership of our stockholders at the time of issuance, result in substantial dilution of our earnings per share and adversely affect the prevailing market price for our common stock.
11
Table of Contents
In addition, our Certificate of Incorporation provides that our board of directors may designate the rights and preferences of preferred stock without a vote by the stockholders. A new series of preferred stock holders could adversely affect the rights of holders of common stock insofar as such series:
| • | provides for voting, redemption and conversion rights to the detriment of the holders of common stock; |
| • | provides for dividends that must be paid prior to any distributions on our common stock; |
| • | receives preferences over the holders of common stock or surplus funds in the event of our dissolution or liquidation; or |
| • | has the potential to delay, defer or prevent a change in control of our company, and discourage bids for our common stock. |
Our Loan Agreement contains financial covenants that may limit our operating and strategic flexibility.
Our loan and security agreement with Bank of America, N.A., as amended (which we refer to as the “Loan Agreement”) contains financial covenants and other restrictions that limit our ability to engage in certain types of transactions. For example, these restrictions require that we maintain certain solvency ratios tied to our ability to borrow under the terms of the Loan Agreement, and generally require us to obtain lender consents for acquisitions. There can be no assurance that we will be in compliance with all covenants in the future or that Bank of America will agree to modify the Loan Agreement, should that become necessary.
Events beyond our control could affect our ability to comply with these covenants and restrictions. Failure to comply with any of these covenants and restrictions would result in an event of default under the Loan Agreement. If we do not cure an event of default or obtain necessary waivers within the required time periods, Bank of America would be permitted to accelerate the maturity of the debt under the Loan Agreement, foreclose upon our assets securing the debt, and terminate any further commitments to lend to us. Under these circumstances, we may not have sufficient funds or other resources to satisfy our other obligations. In addition, the limitations imposed by the Loan Agreement may significantly impair our ability to obtain other debt or equity financing.
There can be no assurance that any waivers we request will be received on a timely basis, if at all, or that any waivers obtained will extend for a sufficient period of time to avoid an acceleration event, an event of default, or other restrictions on our business. The failure to obtain any necessary waivers could have a material adverse effect on our business, liquidity, and financial condition.
Our growth strategy depends in part on our ability to execute successful strategic acquisitions. We have made strategic acquisitions in the past and may do so in the future, and if the acquired companies do not perform as expected, this could adversely affect our operating results, financial condition and existing business.
We may continue to expand our business through strategic acquisitions. The success of any acquisition will depend on, among other things:
| • | the availability of suitable candidates; |
| • | higher than anticipated acquisition costs and expenses; |
| • | competition from other companies for the purchase of available candidates; |
| • | our ability to value those candidates accurately and negotiate favorable terms for those acquisitions; |
| • | the availability of funds to finance acquisitions and obtaining any consents necessary under our credit facility; |
| • | the ability to establish new informational, operational and financial systems to meet the needs of our business; |
| • | the ability to achieve anticipated synergies, including with respect to complementary products or services; and |
| • | the availability of management resources to oversee the integration and operation of the acquired businesses. |
We may not be successful in effectively integrating acquired businesses and completing acquisitions in the future. We also may incur substantial expenses and devote significant management time and resources in seeking to complete acquisitions. Acquired businesses may fail to meet our performance expectations. If we do not achieve the anticipated benefits of an acquisition as rapidly as expected, or at all, investors or analysts may not perceive the same benefits of the acquisition as we do. If these risks materialize, our stock price could be materially adversely affected.
12
Table of Contents
Integration of acquired businesses may be difficult to achieve and will consume significant financial and managerial resources which may adversely affect operations.
Part of our strategy to increase revenue and market share is to grow through strategic acquisitions in order to complement and expand our business. On December 20, 2012, we acquired Seesmart; on August 22, 2013, we acquired Relume; on November 15, 2013, we acquired Tri-State; and on April 17, 2014, we acquired Value Lighting. These acquisitions involve risks related to the integration and management of technology, operations and personnel of separate companies. The integration of these businesses will be a complex, time-consuming and expensive process and may disrupt our business if not completed in a timely and efficient manner.
We may encounter substantial difficulties, costs and delays involved in integrating the operations recently acquired, including:
| • | exposure to unknown liabilities of acquired companies or its assets; |
| • | higher than anticipated acquisition costs and expenses; |
| • | potential conflicts between business cultures; |
| • | adverse changes in business focus perceived by third-party constituencies; |
| • | disruption of our ongoing business; |
| • | potential conflicts in distribution, marketing or other important relationships; |
| • | potential constraints of management resources; |
| • | inability to implement uniform standards, controls, procedures and policies; |
| • | failure to maximize our financial and strategic position by the successful incorporation of acquired technology; |
| • | failure to realize the potential of acquired technology, complete product development, or properly obtain or secure appropriate protection of intellectual property rights; and |
| • | loss of key employees and/or the diversion of management’s attention from other ongoing business concerns. |
In addition, in the first quarter of 2013, we transitioned our corporate headquarters from Charlotte, North Carolina to Stamford, Connecticut. Seesmart has California and Illinois locations; Relume is headquartered in Michigan; and Value Lighting is headquartered in Georgia with facilities in Georgia, Texas and Maryland. The geographic distance between the companies and their respective offices and operations increases the risk that the integration will not be completed successfully or in a timely and cost-effective manner. We may not successfully overcome these risks or any other problems encountered in connection with the integration of the companies.
Our acquisitions could result in future impairment charges and other charges which could adversely affect our results of operations.
As a result of our acquisitions of Seesmart, Relume, Tri-State and Value Lighting, and in consideration of future acquisitions, goodwill and other intangible assets have been and will be recorded. At the purchase date, the recorded amounts for goodwill and other intangible assets represent fair values estimated at a point in time and are based on valuations that require significant estimates and assumptions about future events, which are derived from information obtained from the management of the acquired businesses and our business plans for the acquired businesses or intellectual property. If estimates and assumptions used to initially record goodwill and intangible assets do not materialize, ongoing reviews of the carrying amounts of such goodwill and intangible assets may result in impairments which will require us to record a charge in the period in which such an impairment is identified. Such charges could have a severe negative impact on our business, financial condition and results of operations. The following factors also could result in material charges that would adversely affect our results:
| • | Changes to our contingent consideration subsequent to the acquisition; |
| • | accrual of newly identified pre-acquisition contingent liabilities, in which case the related charge could be required to be included in earnings in the period in which the accrual is determined to the extent it is identified subsequent to the finalization of the purchase price allocation; and |
| • | charges to income to eliminate certain pre-acquisition activities that duplicate those of the combined company or to reduce our cost structure. |
13
Table of Contents
If we are not able to compete effectively against companies with greater resources, our prospects for future success will be jeopardized.
The lighting industry is highly competitive. In the high performance lighting markets in which we sell our LED lighting solutions, our products compete with lighting products utilizing traditional lighting technology provided by larger and better-established lighting operators. Management expects competition to intensify in the future. Many of our competitors have longer operating histories, larger customer bases, greater brand recognition and significantly greater financial, marketing, technical and other resources. Our competitors may acquire or be acquired by, receive investments from or enter into other commercial relationships with, larger, well established and well-financed competitors. Therefore, some of our competitors with other revenue sources may be able to devote greater resources to marketing and promotional campaigns, adopt more aggressive pricing policies, and devote substantially more resources to product development. It is difficult to effectively compete with companies that have these resources so we cannot assure that we will ever become a significant company in the industry.
In the replacement lamp market where we sell our Array and CMG line of LED products, we expect to encounter competition from an even greater number of companies. Our competitors are expected to include the large, established companies in the general lighting industry, such as GE Lighting, Osram Sylvania and Royal Philips Lighting. We believe each of these competitors has undertaken initiatives to develop white light LED technology. These companies have global marketing capabilities and substantially greater resources to devote to research and development and other aspects of the development, manufacture and marketing of LED lighting products than we do. We may also face increased competition from traditional lighting fixture companies, such as Acuity Brands, Cree, Cooper Lighting, Hubbell Lighting, Lithonia Lighting and Royal Philips Electronics. In each of our markets, we also anticipate the possibility that LED manufacturers, including those that currently supply us with LEDs, may seek to compete with us by introducing more complete systems that might not infringe on our patents. Our competitors’ lighting technologies and products may be more readily accepted by customers than our products. The relatively low barriers to entry into the lighting industry and the limited proprietary nature of many lighting products also permit new competitors to enter the industry easily. Increased competition may result in reduced operating margins, loss of market share and diminished value in our brands.
If our advanced lighting products do not gain wider market acceptance, prospects for our growth and profitability may be limited.
We face competition from both traditional lighting technologies, such as incandescent, florescent and neon lighting, and from competitors engaged in providing LED lighting products. Traditional lighting technologies have the advantage of a long history of market acceptance and familiarity as compared to our LED lighting solutions. Potential customers for our LED products may be reluctant to adopt these as alternatives to traditional lighting technologies because of their higher initial cost to achieve comparable light output, although our LED lighting products tend to be more energy efficient and require less maintenance.
Our success will depend upon both the increased acceptance of our LED products as an alternative to traditional lighting technologies and the development of higher lumen producing products to meet traditional lighting applications. Obstacles to adoption of LED lighting in the general lighting market include the high initial cost of high brightness white LEDs and the need for further advances in brightness, color characteristics, efficiency and the predicted life of the LEDs before they require replacement. Our future results are dependent upon sales growth in the commercial, hospitality, institutional, retail and sign markets. As part of our sales and marketing strategy, we actively seek to educate our target markets as to the advantages of our LED lighting solutions. We believe that achievement of this objective is critical to our future success. Our lighting products may not continue to gain market share within the overall lighting market or competitors may introduce better lighting technologies, displacing our LED and other lighting products in the market. If acceptance of our lighting products in general does not continue to grow, then opportunities to increase our revenue and operate profitably may be limited.
The reduction or elimination of investments in, or incentives to adopt, LED lighting or the elimination of, or changes in, policies, incentives or rebates in certain states or countries that encourage the use of LEDs over some traditional lighting technologies could cause the growth in demand for our products to slow, which could materially and adversely affect our revenues, profits and margins.
We believe the near-term growth of the LED market will be accelerated by government policies in certain countries that either directly promote the use of LEDs or discourage the use of some traditional lighting technologies. Today, the upfront cost of LED lighting exceeds the upfront cost for some traditional lighting technologies that provide similar lumen output in many applications. However, some governments around the world have used policy initiatives to accelerate the development and adoption of LED lighting and other non-traditional lighting technologies that are seen as more environmentally friendly compared to some traditional lighting technologies. Reductions in (including as a result of any budgetary constraints), or the elimination of, government investment and favorable energy policies could result in decreased demand for our products and decrease our revenues, profits and margins. Further, if our products fail to qualify for any financial incentives or rebates provided by governmental agencies or utilities for which our competitors’ products qualify, such programs may diminish or eliminate our ability to compete by offering products at lower prices than our competitors.
14
Table of Contents
We believe that certification and compliance issues are critical to adoption of our lighting systems, and failure to obtain such certification or compliance would harm our business.
We are required to comply with certain legal requirements governing the materials in our products. Although we are not aware of any efforts to amend any existing legal requirements or implement new legal requirements in a manner with which we cannot comply, our revenue might be materially harmed if such an amendment or implementation were to occur.
Moreover, although not legally required to do so, we strive to obtain certification for substantially all our products. In the United States, we seek, and to date have obtained, certification of substantially all of our products from Underwriters Laboratories (UL) or Intertek (ETL) and in Europe we seek to, and to date have appropriately self-certified substantially all of our products with Conformité Européenne (CE). Where appropriate in jurisdictions outside the United States and Europe, we seek to obtain other similar national or regional certifications for our products, such as Canadian Underwriters Laboratories (CUL) in Canada and Product Safety Electrical (PSE) in Japan. Although we believe that our broad knowledge and experience with electrical codes and safety standards have facilitated certification approvals, we cannot ensure that we will be able to obtain any such certifications for our new products or that, if certification standards are amended, we will be able to maintain any such certifications for our existing products, especially since existing codes and standards were not created with our lighting products in mind. Moreover, although we are not aware of any effort to amend any existing certification standard or implement a new certification standard in a manner that would render us unable to maintain certification for our existing products or obtain certification for new products, our revenue might be materially harmed if such an amendment or implementation were to occur.
New regulations related to conflict-free minerals may force us to incur additional expenses.
The Dodd-Frank Wall Street Reform and Consumer Protection Act contains provisions to improve transparency and accountability concerning the supply of minerals originating from the conflict zones of the Democratic Republic of the Congo (DRC) and adjoining countries. As a result, in August 2012, the SEC established new annual disclosure and reporting requirements for those companies who may use “conflict” minerals mined from the DRC and adjoining countries in their products. These new requirements require us to undertake due diligence efforts beginning in the 2013 calendar year, with initial disclosure requirements beginning in May 2014. These new requirements could affect the sourcing and availability of certain minerals used in the manufacture of our products. As a result, we may not be able to obtain the relevant minerals at competitive prices, and there will likely be additional costs associated with complying with the new due diligence procedures as required by the SEC. In addition, as our supply chain is complex, we may face reputational challenges with our customers and other stakeholders if we are unable to sufficiently verify the origins of all minerals used in our products through the due diligence procedures that we implement, and we may incur additional costs as a result of changes to product, processes or sources of supply as a consequence of these new requirements.
Customers may be unable to obtain financing to make purchases from us.
Some of our customers require financing in order to purchase our products. The potential inability of these customers to access the capital needed to finance purchases of our products and meet their payment obligations to us could adversely impact our financial condition and results of operations. If our customers become insolvent due to market and economic conditions or otherwise, it could have a material adverse impact on our business, financial condition and results of operations. Our affiliate Aston, has provided financing to some customers, but is under no obligation to continue to provide capital for future orders or other customers. Given the current economic conditions, there can be no assurance that Aston or other third party finance companies will continue to provide capital to our customers.
If components used in our finished products become unavailable, or third-party manufacturers otherwise experience delays, or shipping or transportation is disrupted due to labor unrest or other factors, we may incur delays in shipment to our customers, which would damage our business.
We depend on third-party suppliers for substantially all of our components and products. We purchase these products and components from third-party suppliers that serve the advanced lighting systems market and we believe that alternative sources of supply are readily available for most products and components. However, consolidation in the LED lighting industry could result in one or more current suppliers being acquired by a competitor, rendering us unable to continue purchasing necessary amounts of key components at competitive prices. In addition, for certain of our customized components, arrangements for additional or replacement suppliers will take time and result in delays. We purchase products and components pursuant to purchase orders placed from time to time in the ordinary course of business. This means we are vulnerable to unanticipated price increases and product shortages. Any interruption or delay in the supply of components and products, or our inability to obtain components and products from alternate sources at acceptable prices in a timely manner, could harm our business, financial condition and results of operations.
15
Table of Contents
In an effort to reduce manufacturing costs, we outsource the production of certain parts and components as well as finished goods in our product lines to a number of suppliers. There is no production overlap between our third-party manufacturers domestically and overseas.
While we believe alternative manufacturers for these products are available, we have selected these particular manufacturers based on their ability to consistently produce these products per our specifications ensuring the best quality product at the most cost effective price. We depend on our third-party manufacturers to satisfy performance and quality specifications and to dedicate sufficient production capacity within scheduled delivery times. Accordingly, the loss of all or one of these manufacturers or delays in obtaining shipments could have a material adverse effect on our operations until such time as an alternative manufacturer could be found.
We may be subject to various import duties applicable to materials manufactured in foreign countries and, in addition, may be affected by various other import and export restrictions, as well as other considerations or developments impacting international trade, including economic or political instability, shipping delays and product quotas. These international trade factors will, under certain circumstances, have an impact both on the cost of components (which will, in turn, have an impact on the cost to us of the manufactured product) and the wholesale and retail prices of our products.
In addition, there has been labor unrest, including strikes and work stoppages, among workers at various transportation providers and in industries affecting the transportation industry, such as port workers. We could lose business due to any significant work stoppage or slowdown and, if labor unrest results in increased rates for transportation providers, we may not be able to pass these cost increases on to our customers. Strikes among longshoreman and clerical workers at ports in the past few years have slowed down the ports for a time, creating a major impact on the transportation industry. West coast longshoremen have been operating without a union contract since the summer of 2014, and a risk of labor unrest and labor slowdowns continues although the parties recently reached a tentative agreement that still must be approved by the union membership. Any significant work stoppage, slowdown or other disruption involving ports, railroads, truckers or draymen could adversely affect our business and results of operations.
If the companies to which we outsource the manufacture of our products fail to meet our requirements for quality, quantity and timeliness, our revenue and reputation in the marketplace could be harmed.
We outsource a significant portion of the manufacture and assembly of our products. We currently depend on a small number of contract manufacturers to manufacture our products at plants in the U.S. and China. These manufacturers supply finished products, components and raw materials (in some cases we procure and provide our contract manufacturers with certain components, such as LEDs) and provide necessary facilities and labor to manufacture our products. If these companies were to terminate their arrangements with us without adequate notice, or fail to provide the required capacity and quality on a timely basis, we would be unable to manufacture and ship our lighting products until replacement manufacturing services could be obtained. To qualify a new contract manufacturer, familiarize it with our products, quality standards and other requirements, and commence volume production is a costly and time-consuming process. If it became necessary to do so, we may not be able to establish alternative manufacturing relationships on acceptable terms.
Our reliance on contract manufacturers involves certain additional risks, including the following:
| • | lack of direct control over production capacity and delivery schedules; |
| • | lack of direct control over quality assurance, manufacturing yields and production costs; |
| • | risk of loss of inventory while in transit from foreign manufacturers; and |
| • | risks associated with international commerce, particularly with China, including unexpected changes in legal and regulatory requirements, changes in tariffs and trade policies, risks associated with the protection of intellectual property and political and economic instability. |
Any interruption in our ability to manufacture and distribute products could result in delays in shipment, lost sales, reductions in revenue and damage to our reputation in the market, all of which would adversely affect our business.
We depend on distributors and independent sales representatives for a portion of our revenue and sales, and the failure to successfully manage our relationships with these third-parties, or the termination of these relationships, could cause our revenue to decline and harm our business.
We intend to continue to seek strategic relationships to distribute, license and sell certain products. We intend to maximize organic growth of our market. A portion of our revenue comes from sales to distributors including systems integrators, distributors and resellers. We may not be able to negotiate acceptable relationships in the future and cannot predict whether current or future relationships will be successful.
Some of these relationships have not been formalized in a detailed contract, and may be subject to termination at any time. The agreements that are formalized in a contract are generally short-term, non-exclusive, and can be cancelled by these sales channels
16
Table of Contents
without significant financial consequence. In addition, these parties provide technical sales support to end-users. We cannot control how these sales channels perform and cannot be certain that we or end-users will be satisfied with their performance. If these distributors and agents significantly change their terms with us, or change their historical pattern of ordering products from us, there could be a significant impact on our revenue and profits.
Claims by others that our products infringe their patents or other intellectual property rights could prevent us from manufacturing and selling some of our products or require us to pay royalties or incur substantial costs from litigation or development of non-infringing technology.
In recent years, there has been significant litigation in the United States involving patents and other intellectual property rights. We may receive notices that claim we have infringed upon the intellectual property of others. Even if these claims are not valid, they could subject us to significant costs. Any such claims, with or without merit, could be time-consuming to defend, result in costly litigation, divert our attention and resources, cause product shipment delays or require us to enter into royalty or licensing agreements. Such royalty or licensing agreements, if required, may not be available on terms acceptable to us or at all. We have engaged in litigation and litigation may be necessary in the future to enforce our intellectual property rights or to determine the validity and scope of the proprietary rights of others. Litigation may also be necessary to defend against claims of infringement or invalidity by others. A successful claim of intellectual property infringement against us and our failure or inability to license the infringed technology or develop or license technology with comparable functionality could have a material adverse effect on our business, financial condition and operating results.
Our products could contain defects or they may be installed or operated incorrectly, which could reduce sales of those products or result in claims against us.
Despite testing by us, defects have been found and may be found in the future in our existing or future products. This could result in, among other things, a delay in the recognition or loss of revenue, loss of market share or failure to achieve market acceptance. These defects could cause us to incur significant warranty, support and repair costs, divert the attention of our engineering personnel from our product development efforts and harm our relationships with our customers. The occurrence of these problems could result in the delay or loss of market acceptance of our lighting products and would likely harm our business. Defects, integration issues or other performance problems in our lighting products could result in personal injury or financial or other damages to end-users or could damage market acceptance of our products. Our customers and end-users could also seek damages from us for their losses. A product liability claim brought against us, even if unsuccessful, would likely be time consuming and costly to defend.
If we are unable to attract or retain qualified personnel, our business and product development efforts could be harmed.
To a significant extent, our success will depend on our senior management team, including the Chief Executive Officer, Robert V. LaPenta, the President, Charles Schafer, and other members of the executive team. The loss of any of these individuals could severely harm the business. Our success also depends on our continued ability to identify, attract, hire, train, retain and motivate highly skilled technical, managerial, manufacturing, administrative and sales and marketing personnel. Competition for these individuals is intense, and we may not be able to successfully recruit, assimilate or retain sufficiently qualified personnel. In particular, we may encounter difficulties in recruiting and retaining a sufficient number of qualified technical personnel, which could harm our ability to develop new products and adversely impact our relationships with existing and future customers. The inability to attract and retain necessary technical, managerial, manufacturing, administrative and sales and marketing personnel could harm our ability to obtain new customers and develop new products and could adversely affect our business and operating results.
We are a “controlled company” within the meaning of the rules of NASDAQ and, as a result, are exempt from certain corporate governance requirements that offer protections to stockholders of other NASDAQ-listed companies.
A majority of our outstanding stock is owned by RVL. We have approximately 129.7 million common shares outstanding, of which approximately 84.3 million shares, or 65%, are beneficially owned by RVL and its affiliates. As a result, we are a “controlled company” within the meaning of NASDAQ Marketplace Rule 5615. As a controlled company, we are exempt from certain NASDAQ corporate governance requirements, including that:
| • | compensation of officers be determined or recommended to the board of directors by a majority of its independent directors or by a compensation committee comprised solely of independent directors; and |
| • | director nominees be selected or recommended to the board of directors by a majority of its independent directors or by a nominating committee that is composed entirely of independent directors. |
We currently utilize these exemptions and intend to do so in the future. Accordingly, our stockholders are not and will not be afforded the same protections as stockholders of other NASDAQ-listed companies that are subject to the NASDAQ corporate governance requirements. As a result, it is possible that our directors will have interests and take actions that are in conflict with the interests of the stockholders.
17
Table of Contents
We are controlled by our majority stockholder, RVL, whose interests may not be aligned with the interests of our other stockholders.
RVL, an affiliate of our Chairman and Chief Executive Officer, beneficially owns a majority of our outstanding shares of common stock. Consequently, RVL controls the outcome of all matters submitted for stockholder action, including the composition of our board of directors and the approval of significant corporate transactions. Through its majority representation on our board of directors, RVL has a controlling influence on our strategic direction, policies and management, including the ability to appoint and remove officers. As a result, RVL may cause us to take actions that may not be aligned with the interests of other stockholders. For example, RVL may prevent, delay or accelerate any transaction involving a change in control of us or in which our stockholders might receive a premium over the prevailing market price for their shares, or may determine to pursue a transaction not involving a premium.
| Item 1B. | Unresolved Staff Comments. |
Not applicable.
| Item 2. | Properties. |
The following table summarizes information with respect to our facilities, which are all leased:
| Location |
Area (sq. feet) |
Year of |
||||||||
| Corporate headquarters |
Stamford, Connecticut | 6,626 | 2020 | |||||||
| Office and warehouse |
Simi Valley, California | 12,200 | 2015 | |||||||
| Office, distribution and light manufacturing |
Maple Grove, Minnesota | 13,200 | 2018 | |||||||
| Office and distribution center |
Greenwich, Connecticut | 5,230 | 2015 | |||||||
| Office and training center |
Crystal Lake, Illinois | 10,000 | 2015 | |||||||
| Office, distribution and light manufacturing, showroom and training |
Oxford, Michigan | 45,000 | 2017 | |||||||
| Office and warehouse |
Marietta, Georgia | 63,000 | 2024 | |||||||
| Warehouse and distribution center |
Marietta, Georgia | 14,372 | 2016 | |||||||
| Warehouse and distribution center |
Carrollton, Texas | 37,824 | 2016 | |||||||
| Office and warehouse |
Beltsville, Maryland | 28,800 | 2018 | |||||||
| Office and warehouse |
Friendswood, Texas | 4,065 | 2015 | |||||||
We consider our facilities adequate for our current needs and believe that suitable additional space would be available if necessary.
In the ordinary course of business, we may become a party to various legal proceedings generally involving contractual matters, infringement actions, product liability claims and other matters. The Company is not currently a party to any pending legal proceedings which it believes to be material.
Item 4. Mine Safety Disclosures
Not applicable.
18
Table of Contents
| Item 5. | Market for Registrant’s Common Equity, Related Stockholder Matters and Issuer Purchases of Equity Securities. |
(a) Our common stock is quoted on The NASDAQ Capital Market under the symbol “RVLT.” The following table sets forth the high and low sales prices for our Common Stock for the periods indicated as reported by The NASDAQ Capital Market:
| 2014 | 2013 | |||||||||||||||
| High | Low | High | Low | |||||||||||||
| First Quarter |
$ | 4.35 | $ | 2.81 | $ | 2.50 | $ | 0.60 | ||||||||
| Second Quarter |
3.40 | 2.01 | 4.58 | 1.77 | ||||||||||||
| Third Quarter |
2.67 | 1.63 | 5.50 | 2.19 | ||||||||||||
| Fourth Quarter |
2.17 | 0.98 | 4.54 | 2.67 | ||||||||||||
(b) The number of holders of record of our Common Stock on March 9, 2015 was 104. This number does not include beneficial owners of our Common Stock whose shares are held in the names of various dealers, clearing agencies, banks, brokers and other fiduciaries. On March 9, 2015, the last reported sale price of our common stock on the Nasdaq Capital Market was $1.11 per share.
(c) We have never paid a cash dividend on our Common Stock and intend to continue to follow a policy of retaining earnings to finance future growth. Accordingly, we do not anticipate the payment of cash dividends to holders of our Common Stock in the foreseeable future.
(d) Equity Compensation Plan Information as of December 31, 2014
The following table provides information as of December 31, 2014 with respect to shares of our Common Stock that may be issued under our equity compensation plans. For additional information regarding our stock option plans and the accounting effects of our stock-based compensation, please see Notes 1 and 11 of our Notes to Consolidated Financial Statements.
| Plan Category |
(a) Number of common shares to be issued upon exercise of outstanding options, warrants and rights |
(b) Weighted-average exercise price of outstanding options, warrants and rights |
(c) Number of common shares available for future issuance (excluding securities reflected in column (a)) |
|||||||||
| Equity compensation plans (stock options) approved by stockholders |
414,380 | $ | 4.29 | — | ||||||||
| Equity compensation plans (restricted share awards) approved by stockholders (a) |
291,000 | N/A | 724,501 | |||||||||
|
|
|
|
|
|
|
|||||||
| Totals |
705,380 | N/A | 724,501 | |||||||||
|
|
|
|
|
|
|
|||||||
| (a) | Includes 291,000 shares approved but unissued. Excludes previous grants of restricted stock totaling 1,949,500 shares. |
Recent Sales of Unregistered Securities
In connection with our acquisition of All Around Lighting, Inc. (“All Around”) we undertook the obligation to issue 1,600,000 unregistered shares of our common stock to the shareholders named in the merger agreement in 11 installments, with the first such installment to occur on May 1, 2015. The unregistered shares constituted a portion of the aggregate consideration paid for our acquisition.
Other than as described herein and disclosed in our Current Report on Form 8-K filed with the SEC on December 1, 2014, we did not sell any unregistered securities for the three months ended December 31, 2014.
19
Table of Contents
Stock Performance Graph
The following information contained in this Item 5 of this Annual Report on Form 10-K is not deemed to be “soliciting material” or to be “filed” with the SEC or subject to Regulation 14A or 14C under the Exchange Act or to the liabilities of Section 18 of the Exchange Act, and will not be deemed to be incorporated by reference into any filing under the Securities Act or the Exchange Act, except to the extent we specifically incorporate it by reference into such filing.
The following graph compares the cumulative total return on our common stock with the cumulative total returns of the NASDAQ Composite Index and the Dow Jones US Electrical Components and Equipment Index for the five-year period commencing on December 31, 2009. (In 2012, a change in control of the Company was effected when RVL purchased approximately 73% of the Company’s outstanding voting stock. A supplemental performance graph is provided following this one, which provides the same comparisons for the period commencing with announcement of the change in control). The stock price performance shown on the graph is not necessarily indicative of future price performance.
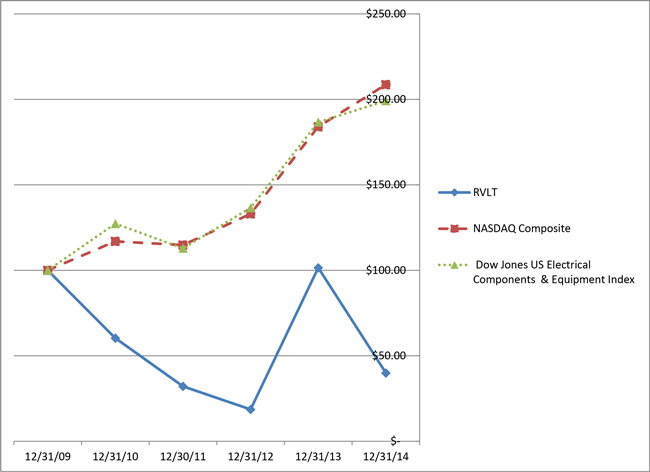
| As of December 31, | ||||||||||||||||||||||||
| 2009 | 2010 | 2011 | 2012 | 2013 | 2014 | |||||||||||||||||||
| Revolution Lighting Technologies, Inc. |
$ | 100.00 | $ | 60.31 | $ | 32.11 | $ | 18.62 | $ | 101.48 | $ | 39.92 | ||||||||||||
| NASDAQ Composite Index |
100.00 | 116.96 | 114.81 | 133.08 | 184.03 | 208.68 | ||||||||||||||||||
| Dow Jones US Electrical Components & Equipment Index |
100.00 | 127.30 | 112.86 | 136.56 | 186.65 | 199.19 | ||||||||||||||||||
20
Table of Contents
Supplemental stock performance chart
The following supplemental graph compares the cumulative total return on our common stock with the cumulative total returns of the NASDAQ Composite Index and the Dow Jones US Electrical Components and Equipment Index for the period commencing on September 12, 2012, the date when RVL announced its initial investment in the Company to December 31, 2014. The stock price performance shown on the graph is not necessarily indicative of future price performance.
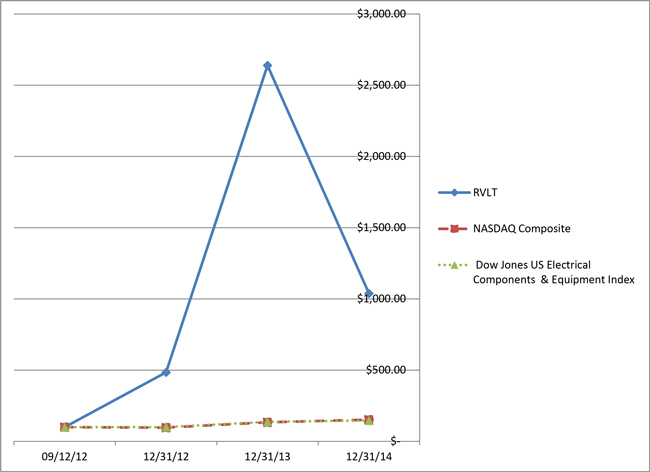
| 9/12/12 | 12/31/12 | 12/31/13 | 12/31/14 | |||||||||||||
| Revolution Lighting Technologies, Inc. |
$ | 100.00 | $ | 484.61 | $ | 2,638.68 | $ | 1,038.55 | ||||||||
| NASDAQ Composite |
100.00 | 96.92 | 133.97 | 151.89 | ||||||||||||
| Dow Jones US Electrical Components & Equipment Index |
100.00 | 100.45 | 137.26 | 146.50 | ||||||||||||
21
Table of Contents
| Item 6. | Selected Financial Data |
The following table presents selected historical consolidated financial data of Revolution Lighting Technologies, Inc. for the fiscal years ended December 31, 2014, 2013, 2012, 2011 and 2010. The selected historical consolidated financial data has been derived from Revolution Lighting Technologies Inc.’s audited consolidated financial statements for the respective dates and periods.
The information presented below should be read together with “Item 7. Management’s Discussion and Analysis of Financial Condition and Results of Operations” and the consolidated financial statements and notes thereto included in “Item 8. Financial Statements and Supplementary Data.”
| (in thousands, except per share data) |
Year Ended December 31, | |||||||||||||||||||
| 2014 (1) | 2013 (2) | 2012 (3) | 2011 | 2010 (4) | ||||||||||||||||
| Statement of Operations Data: |
||||||||||||||||||||
| Revenue |
$ | 76,840 | $ | 26,060 | $ | 4,481 | $ | 8,988 | $ | 5,423 | ||||||||||
| Cost of sales |
52,617 | 16,108 | 4,705 | 7,075 | 4,060 | |||||||||||||||
|
|
|
|
|
|
|
|
|
|
|
|||||||||||
| Gross profit (loss) |
24,223 | 9,952 | (224 | ) | 1,913 | 1,363 | ||||||||||||||
| Operating expenses: |
||||||||||||||||||||
| Selling, general and administrative: |
||||||||||||||||||||
| Severance and transition costs |
335 | 1,152 | — | — | — | |||||||||||||||
| Acquisition and other related expenses |
2,153 | 2,389 | 286 | — | — | |||||||||||||||
| Amortization and depreciation |
5,644 | 3,122 | 493 | 447 | 452 | |||||||||||||||
| Stock based compensation |
1,711 | 809 | 45 | 301 | 318 | |||||||||||||||
| Other selling, general and administrative |
23,204 | 11,193 | 4,417 | 5,233 | 5,327 | |||||||||||||||
| Research and development |
2,076 | 1,809 | 555 | 834 | 944 | |||||||||||||||
| Impairment expense |
— | — | 3,397 | 408 | — | |||||||||||||||
|
|
|
|
|
|
|
|
|
|
|
|||||||||||
| Total operating expenses |
35,123 | 20,474 | 9,193 | 7,223 | 7,041 | |||||||||||||||
|
|
|
|
|
|
|
|
|
|
|
|||||||||||
| Operating loss |
(10,900 | ) | (10,522 | ) | (9,417 | ) | (5,310 | ) | (5,678 | ) | ||||||||||
|
|
|
|
|
|
|
|
|
|
|
|||||||||||
| Other income (expense): |
||||||||||||||||||||
| Gain on debt restructuring |
— | — | 1,048 | — | — | |||||||||||||||
| Debt extinguishment costs |
— | — | — | — | (442 | ) | ||||||||||||||
| Change in fair value of embedded derivative |
— | (6,990 | ) | — | — | — | ||||||||||||||
| Gain on bargain purchase of business |
— | 743 | — | — | — | |||||||||||||||
| Interest expense |
(843 | ) | (52 | ) | (210 | ) | (127 | ) | (247 | ) | ||||||||||
| Other income |
13 | — | 1 | 12 | 2 | |||||||||||||||
|
|
|
|
|
|
|
|
|
|
|
|||||||||||
| Total other income (expense), net |
(830 | ) | (6,299 | ) | 839 | (115 | ) | (687 | ) | |||||||||||
|
|
|
|
|
|
|
|
|
|
|
|||||||||||
| Loss before taxes |
$ | (11,730 | ) | $ | (16,821 | ) | $ | (8,578 | ) | $ | (5,425 | ) | $ | (6,365 | ) | |||||
| Deferred income tax benefit |
6,550 | — | — | — | — | |||||||||||||||
|
|
|
|
|
|
|
|
|
|
|
|||||||||||
| Net loss |
$ | (5,180 | ) | $ | (16,821 | ) | $ | (8,578 | ) | $ | (5,425 | ) | $ | (6,365 | ) | |||||
| Accretion of preferred stock redemption value, beneficial conversion feature, and discount |
(919 | ) | (2,290 | ) | (5,195 | ) | — | — | ||||||||||||
| Accrual of preferred stock dividends |
(1,445 | ) | (1,360 | ) | (31 | ) | — | — | ||||||||||||
| Deemed distribution on exchange of preferred stock |
(5,301 | ) | — | — | — | — | ||||||||||||||
|
|
|
|
|
|
|
|
|
|
|
|||||||||||
| Net loss attributable to common stockholders |
$ | (12,845 | ) | $ | (20,471 | ) | $ | (13,804 | ) | $ | (5,425 | ) | $ | (6,365 | ) | |||||
|
|
|
|
|
|
|
|
|
|
|
|||||||||||
| Basic and diluted net loss per common share attributable to common stockholders |
$ | (0.14 | ) | $ | (0.26 | ) | $ | (0.63 | ) | $ | (0.33 | ) | $ | (0.39 | ) | |||||
|
|
|
|
|
|
|
|
|
|
|
|||||||||||
| (in thousands) |
As of December 31, | |||||||||||||||||||
| 2014 | 2013 | 2012 | 2011 | 2010 | ||||||||||||||||
| Balance Sheet Data (at end of period): |
||||||||||||||||||||
| Cash and cash equivalents |
$ | 6,033 | $ | 1,757 | $ | 4,434 | $ | 3,015 | $ | 5,309 | ||||||||||
| Working capital |
18,788 | (1,796 | ) | (1,815 | ) | 5,326 | 9,131 | |||||||||||||
| Total assets |
126,542 | 52,237 | 31,277 | 11,948 | 17,020 | |||||||||||||||
| Related party notes payable |
2,565 | — | — | 2,315 | 2,232 | |||||||||||||||
| Revolving credit facility |
8,760 | — | — | — | — | |||||||||||||||
| Total liabilities |
49,226 | 15,815 | 10,581 | 3,637 | 3,861 | |||||||||||||||
22
Table of Contents
| (in thousands, except per share data) |
Year Ended December 31, | |||||||||||||||||||
| 2014 (1) | 2013 (2) | 2012 (3) | 2011 | 2010 (4) | ||||||||||||||||
| Convertible redeemable preferred stock |
— | 10,966 | — | — | — | |||||||||||||||
| Total stockholders’ equity |
77,316 | 25,456 | 20,696 | 8,311 | 13,160 | |||||||||||||||
| (1) | Reflects the acquisition of Value Lighting on April 17, 2014, the Preferred Stock Exchange on December 1, 2014 (see Note 7 of the Notes to Consolidated Financial Statements), and the public offering of common stock on December 1, 2014. |
| (2) | Reflects acquisition of Relume on August 22, 2013 and Tri-State on November 15, 2013. |
| (3) | Reflects the acquisition of Seesmart on December 20, 2012 and the investment by RVL1 LLC on September 12, 2012. |
| (4) | Reflects the sale of the Commercial Lighting and Pool and Spa Business on October 28, 2010. |
| Item 7. | Management’s Discussion and Analysis of Financial Condition and Results of Operations |
The following discussion of our results of operations and financial condition is based upon, and should be read in conjunction with, our consolidated financial statements and accompanying notes thereto included elsewhere in this report. This discussion contains forward-looking statements. Actual results could differ materially from the results discussed in the forward-looking statements. Please see “Risk Factors” and “Cautionary Note Regarding Forward-Looking Statements” for a discussion of some of the uncertainties, risks and assumptions associated with these statements.
Overview
We design, manufacture, market and sell high-performance, commercial grade smart grid control systems, commercial grade light-emitting diode (“LED”) fixtures for outdoor and indoor applications, LED-based signage, channel-letter and contour lighting products, and LED replacement lamps, as well as conventional lighting fixtures. We sell our LED products under the RVLT, Lumificient, Value Lighting, Array and CMG brand names. We are in the process of consolidating our Seesmart and Relume brand names under the RVLT umbrella. Our products incorporate many proprietary and innovative features. We believe that our product offering and patented designs provide opportunities for significant savings in energy and maintenance costs without compromising the environment. We generate revenue by selling lighting products for use in the commercial market segment, which include vertical markets such as federal, state and local governments, industrial and commercial facilities, multifamily real estate construction, hospitality, institutional, educational, healthcare and signage. We market and distribute our products globally through networks of distributors, independent sales agencies and representatives, electrical supply companies, as well as internal marketing and sales forces.
On December 20, 2012, we acquired Seesmart, headquartered in Simi Valley, California. With the acquisition of Seesmart, we targeted the commercial segment sales channel, moving away from the big box store model the Company previously pursued. Seesmart is a leading LED solutions provider with a range of solutions serving the commercial lighting market. We believe that Seesmart’s management combined with its exclusive network of experienced lighting distributors and sales representatives provides us with a customer and solution-focused advantage. We expect that the Revolution’s other businesses will also leverage Seesmart’s distribution network.
On August 22, 2013, we acquired Relume. Relume is a manufacturer of outdoor LED products and smart grid control systems for outdoor lighting applications. Relume services several outdoor LED markets, including municipal street and roadway lights, parking lots and garages, pedestrian areas, buildings and outdoor advertising displays. Approximately 75% of Relume’s business is made up of outdoor lighting, with the remaining part of the business split between smart grid control systems, and LED lighting for media and signage. Relume’s patented Silver Circuitry™ process for LED thermal management offers the first seven-year LED warranty, adding value to Revolution Lighting customers by improving LED performance, lowering operating temperature and extending LED life. We believe that combining Relume’s LED lighting applications with the suite of products offered by our existing Lumificient and Seesmart brands will help drive new market penetration.
On November 15, 2013, we completed the acquisition of Tri-State, a distributor of Seesmart products. Tri-State has a strong management team and a significant client base in New York, New Jersey and Connecticut.
On April 17, 2014, we completed the acquisition of Value Lighting, a supplier of lighting solutions to the multifamily residential market. We acquired Value Lighting for its presence in the multifamily residential markets and construction, the experience of the management team, its customer base, and operational and business development synergies which we believe provide an opportunity to offer our LED solutions through Value Lighting’s existing distribution channels.
23
Table of Contents
Segment information
Our operations are comprised of two reportable segments for financial reporting purposes: Lighting Fixtures and Lamps and Lighting Signage and Media. The Lighting Fixtures and Lamps reportable segment includes the businesses of Seesmart, Relume, LIT, Tri-State and Value Lighting. The Lighting Signage and Media reportable segment is comprised of the Lumificient business. Effective January 1, 2014, the Media business of Relume, included in the Lighting Fixtures and Lamps segment since the acquisition of Relume, was transferred to Lumificient and is now included in the Lighting Signage and Media reportable segment.
See Note 13 of our consolidated financial statements for financial information on reportable segments included in this Annual Report on Form 10-K.
Results of operations
Revenue
Revenue is derived from sales of our advanced lighting products. These products consist of solid-state LED replacement lamps, lighting systems and controls, as well as conventional lighting fixtures. Revenue is subject to both quarterly and annual fluctuations and is impacted by the timing of individually large orders as well as delays in product orders or changes to the timing of shipments or deliveries. We sell our products pursuant to purchase orders and do not have any long-term contracts with our customers. We recognize revenue upon shipment or delivery to our customers in accordance with the respective contractual arrangements. The majority of our sales are to the North American market (which includes Canada, but excludes Mexico for our purposes), and we expect that region to continue to be a major source of revenue for us. However, we also derive a portion of our revenue from customers outside of the North American market. Substantially all of our revenue is denominated in U.S. dollars.
Cost of Goods Sold
Our cost of goods sold consists primarily of purchased components and products from our contract manufacturers and manufacturing-related overhead such as depreciation, rent and utilities. In addition, our cost of goods sold includes provisions for excess and obsolete inventory, inbound freight costs and other indirect costs of sale. We source our manufactured products based on sales expectations and customer orders.
Gross Profit
Our gross profit has been and will continue to be affected by a variety of factors, including average sales prices of our products, product mix, our ability to reduce manufacturing costs and fluctuations in the cost of our purchased components. We sometimes use the term of direct gross margin which we define as revenue less direct material costs.
Operating Expenses
Operating expenses consist primarily of salaries and associated costs for employees in sales, engineering, finance, and administrative activities. In addition, operating expenses include charges relating to accounting, legal, insurance and stock-based compensation.
24
Table of Contents
Summary of 2014 Results
For the year ended December 31, 2014, the Company reported revenues of approximately $76.8 million and a net loss of approximately $5.2 million compared to revenues of approximately $26.1 million and net loss of approximately $16.8 million for the corresponding period in 2013. The 2014 results reflect the acquisition of Value Lighting from the date of its acquisition. The Company’s reported net losses for the years ended December 31, 2014 and 2013 included the following:
| (in millions) |
2014 | 2013 | ||||||
| Change in fair value of embedded derivative |
$ | — | $ | (7.0 | ) | |||
| Gain on bargain purchase of business |
— | 0.7 | ||||||
| Severance and transition costs |
(0.3 | ) | (1.2 | ) | ||||
| Acquisition related costs |
(2.2 | ) | (2.4 | ) | ||||
| Amortization and depreciation |
(5.6 | ) | (3.1 | ) | ||||
| Stock-based compensation cost |
(1.7 | ) | (0.8 | ) | ||||
| Interest expense |
(0.8 | ) | (0.1 | ) | ||||
| Deferred income tax benefit |
6.6 | — | ||||||
|
|
|
|
|
|||||
| Total |
$ | (4.0 | ) | $ | (13.9 | ) | ||
|
|
|
|
|
|||||
In connection with the acquisitions in 2014, the Company recorded net deferred tax liabilities of approximately $6.6 million, primarily resulting from the recognition of amortizable intangible assets at the date of acquisition. These net deferred tax liabilities can be used to reduce net deferred tax assets for which the Company had provided a valuation allowance. Accordingly, the valuation allowance has been reduced by a corresponding amount during the year ended December 31, 2014.
The 2013 change in fair value of the embedded derivative relates to the Series E Preferred Stock (see Note 8 of the Notes to Consolidated Financial Statements). For the period from its issuance on February 21, 2013 to its modification on May 14, 2013, the Company recorded the changes in fair value of the embedded derivative in earnings. Following the modification, the Company ceased to record changes in fair values of the embedded derivative in earnings and reclassified the carrying amount of the embedded derivative liability to equity. The recorded changes in fair value of the derivative were principally related to the increases in the market value of the Company’s common stock. The Series E Preferred Stock was no longer outstanding as of December 31, 2014.
A significant portion of our 2014 and 2013 revenue is from acquisitions consummated during those years. On a pro forma basis, after giving effect to all the acquisitions as if they had been consummated on January 1, 2013, revenues for the year ended December 31, 2014 increased by approximately $12 million, or 14%, to $96 million from $84 million for the year ended December 31, 2013.
Revenue
| (in thousands) |
Year Ended December 31, | |||||||||||
| 2014 | 2013 | 2012 | ||||||||||
| Lighting fixtures and lamps |
$ | 72,373 | $ | 22,823 | $ | 792 | ||||||
| Lighting signage and media |
4,467 | 3,237 | 3,689 | |||||||||
|
|
|
|
|
|
|
|||||||
| Total revenue |
$ | 76,840 | $ | 26,060 | $ | 4,481 | ||||||
|
|
|
|
|
|
|
|||||||
Fiscal 2014 compared with fiscal 2013
Total revenue for the year ended December 31, 2014 increased approximately 195%, or $50.8 million, to $76.8 million as compared to $26.1 million for the year ended December 31, 2013. Of this increase, $46.2 million results from the 2014 acquisitions (see Note 2 of the Notes to Consolidated Financial Statements). Sales for our Lighting signage and media segment increased by $1.2 million. The remaining $3.4 million increase reflects the full-year effect of the 2013 acquisitions of Relume and Tri-State, partially offset by the 2013 impact of the fulfillment of several large orders from a group of related customers that did not recur in 2014.
Fiscal 2013 compared with fiscal 2012
Total revenue for the year ended December 31, 2013 increased approximately 500%, or $21.6 million, to $26.1 million as compared to $4.5 million for the year ended December 31, 2012. Sales for our Lighting signage and media segment decreased by $0.5 million in the year ended December 31, 2013 compared to the year ended December 31, 2012, reflecting the timing of certain orders during 2013. Revenues from LED lamps includes the impact of strong organic growth over the respective pre-acquisition period of Seesmart (acquired in 2012), and LIT, Relume and Tri-State (acquired in 2013). The results for the year ended December 31, 2013 reflect the one-time impact of the fulfillment of several large orders from a group of related customers.
25
Table of Contents
Profit and Cost of Goods Sold
| (in thousands) |
Year Ended December 31, | |||||||||||
| 2014 | 2013 | 2012 | ||||||||||
| Revenue |
$ | 76,840 | $ | 26,060 | $ | 4,481 | ||||||
| Cost of sales |
52,617 | 16,108 | 4,705 | |||||||||
|
|
|
|
|
|
|
|||||||
| Gross profit (loss) |
$ | 24,223 | $ | 9,952 | $ | (224 | ) | |||||
|
|
|
|
|
|
|
|||||||
| Gross margin % |
32% | 38% | -5% | |||||||||
Fiscal 2014 compared with fiscal 2013
Gross profit for the year ended December 31, 2014 was $24.2 million, or 32% of revenue, as compared to gross profit of approximately $10 million, or 38% of revenue, for the corresponding period of 2013. The increase in gross profit reflects the impact of the acquisitions noted above from their respective dates of acquisition. The 2013 results reflect the revenue and margin impact of several large, non-recurring orders.
Fiscal 2013 compared with fiscal 2012
Gross profit for the year ended December 31, 2013 was approximately $10 million, or 38% of revenue, as compared to gross loss of approximately $224,000, or a negative 5% of revenue, for the corresponding period of 2012. The increase in gross profit reflects the impact of the acquisitions noted above from their respective dates of acquisition. Additionally, the increase in gross margin reflects the revenue and margin impact of several large, non-recurring orders.
Operating Expenses
| (in thousands) |
Year Ended December 31, | |||||||||||
| 2014 | 2013 | 2012 | ||||||||||
| Operating expenses: |
||||||||||||
| Selling, general and administrative |
||||||||||||
| Severance and transition costs |
$ | 335 | $ | 1,152 | $ | — | ||||||
| Acquisition and related expenses |
2,153 | 2,389 | 286 | |||||||||
| Amortization and depreciation |
5,644 | 3,122 | 493 | |||||||||
| Stock based compensation |
1,711 | 809 | 45 | |||||||||
| Other selling, general and administrative |
23,204 | 11,193 | 4,417 | |||||||||
| Research and development |
2,076 | 1,809 | 555 | |||||||||
| Impairment expense |
— | — | 3,397 | |||||||||
|
|
|
|
|
|
|
|||||||
| Total operating expenses |
$ | 35,123 | $ | 20,474 | $ | 9,193 | ||||||
|
|
|
|
|
|
|
|||||||
Fiscal 2014 compared with fiscal 2013
Selling, general and administrative (“SG&A”) expenses, excluding research and development, were approximately $33.0 million for the year ended December 31, 2014 as compared to approximately $18.7 million for the same period in 2013, an increase of approximately $14.4 million, or 77%. This results from the 2014 acquisition of Value Lighting and the full-year effect of the 2013 acquisitions of Tri-State and Relume. As a percentage of net sales, SG&A decreased from 72% during 2013 to 43% during 2014, as increased revenue enables the Company to begin to realize economies of scale. We incurred non-cash amortization and depreciation of $5.6 million for the year ended December 31, 2014, an increase of approximately $2.5 million over the same period in 2013, primarily due to the amortization of intangible assets acquired in the Value Lighting acquisition.
Research and development costs increased approximately $0.3 million, or 15%, to $2.1 million during the year ended December 31, 2014, compared to the same period in 2013, reflecting our continued commitment to the development of high-quality LED technology.
Fiscal 2013 compared with fiscal 2012
SG&A expenses, excluding research and development and impairment expense, were approximately $18.7 million for the year ended December 31, 2013 as compared to approximately $5.2 million for the same period in 2012, an increase of approximately $13.5 million, or 260%. The year ended December 31, 2013 includes severance and transition expense of approximately $1.2 million
26
Table of Contents
relating to the transition of our corporate office to Stamford, Connecticut. In addition, we incurred approximately $2.4 million of expenses relating to our acquisitions of Seesmart, Relume, LIT and Tri-State. We incurred non-cash amortization, depreciation and stock-based compensation expenses of $3.9 million for the year ended December 31, 2013, an increase of approximately $3.5 million from the same period in 2012. This increase is primarily related to amortization of intangibles acquired in the acquisitions of Seesmart, Relume, Elite and Tri-State. Other SG&A increased approximately $6.6 million, or 146%, primarily as a result of the acquisitions of Seesmart, Relume, LIT and Tri-State.
As a result of the acquisitions of Seesmart and Relume, research and development costs increased approximately $1.3 million, or 226%, to approximately $1.8 million during the year ended December 31, 2013, compared to the same period in 2012.
Other Income and Expense
| (in thousands) |
Year Ended December 31, | |||||||||||
| 2014 | 2013 | 2012 | ||||||||||
| Gain on debt restructuring |
— | — | 1,048 | |||||||||
| Change in fair value of embedded derivative |
— | (6,990 | ) | — | ||||||||
| Gain on purchase of business |
— | 743 | — | |||||||||
| Interest expense |
(843 | ) | (52 | ) | (210 | ) | ||||||
| Other income |
13 | — | 1 | |||||||||
|
|
|
|
|
|
|
|||||||
| Total other expense, net |
$ | (830 | ) | $ | (6,299 | ) | $ | 839 | ||||
|
|
|
|
|
|
|
|||||||
In connection with the acquisition of the Elite business during the year ended December 31, 2013, we recognized a bargain purchase gain of approximately $0.7 million. See Note 2 of the Notes to Consolidated Financial Statements.
The change in fair value relates to the embedded conversion feature on the Series E Preferred Stock. See Note 8 of the Notes to Consolidated Financial Statements. The Series E Preferred Stock is no longer outstanding as of December 31, 2014.
For the year ended December 31, 2014, the Company recorded interest expense of approximately $0.8 million, primarily related to borrowings under the Bank of America revolving credit facility and certain borrowings from RVL and its affiliates (see Notes 15 and 16 of the Notes to Consolidated Financial Statements).
The 2012 gain on the debt restructuring results from the transactions described in Note 6 to the financial statements.
Income Tax
A tax benefit of $6.6 million was recognized in 2014. In connection with the 2014 acquisitions, we recorded deferred tax liabilities in this amount, primarily resulting from the recognition of amortizable intangible assets at the dates of acquisition. These net deferred tax liabilities can be used to reduce net deferred tax assets for which the Company provided a valuation allowance, accordingly the valuation allowance has been reduced by a corresponding amount. No income tax benefit was recorded for the years ended December 31, 2013 and 2012 since the tax benefits of the losses incurred were offset by a corresponding increase in the related deferred tax valuation allowance.
Net Loss
| Year Ended December 31, | ||||||||||||
| (in thousands, except per share data) |
2014 | 2013 | 2012 | |||||||||
| Net loss |
$ | (5,180 | ) | $ | (16,821 | ) | $ | (8,578 | ) | |||
| Net loss attributable to common stockholders |
(12,845 | ) | (20,471 | ) | (13,804 | ) | ||||||
| Basic and diluted loss per common share applicable to common stockholders |
$ | (0.14 | ) | $ | (0.26 | ) | $ | (0.63 | ) | |||
Net loss attributable to common stockholders for the year ended December 31, 2014 includes the $5.3 million effect of the Preferred Stock Exchange. See Notes 1 and 7 of the Notes to Consolidated Financial Statements.
Net loss attributable to common stockholders for the year ended December 31, 2013 includes the effects of the accretion to redemption value of the Series E and F Preferred Stock and accrual of preferred stock dividends. These amounts were greatly reduced in 2014 due to the June 2014 exchange of Series F Preferred Stock for Series G Preferred Stock, and the Preferred Stock Exchange. See Notes 1 and 8 of the Notes to Consolidated Financial Statements.
27
Table of Contents
Weighted average shares outstanding were 92.2 million, 77.3 million and 22.1 million for the years ended on December 31, 2014, 2013 and 2012, respectively.
LIQUIDITY, CAPITAL RESOURCES AND CASH FLOWS
Liquidity and capital resources
At December 31, 2014, we had cash and cash equivalents on hand of $6.0 million compared to $1.8 million at December 31, 2013. During the years ended December 31, 2014, 2013 and 2012, we reported negative cash flow from operations of $14.3 million, $8.1 million and $5.1 million, respectively. Negative operating cash flows during 2014 reflect our higher working capital investment to support our greatly expanded 2014 operations.
Cash flows during 2014 include net proceeds of approximately $8.6 million from an underwritten public offering of 8 million shares of our common stock, at an offering price of $1.25 per share.
During 2014, we received various loans from RVL and its affiliates aggregating $18.1 million, of which $10.6 million was used to pay the cash portion of the purchase price of Value Lighting. On June 30, 2014, approximately $12.6 million of outstanding principal and interest owed to RVL and its affiliates was exchanged for shares of our Series G Preferred Stock, including the amount borrowed to fund the cash portion of the purchase price of Value Lighting. On July 31, 2014, certain outstanding short-term loans and cash advances owed to RVL and its affiliates were consolidated into a longer-term note in the principal amount of approximately $5.7 million, due April 1, 2016. A portion of this note was repaid with proceeds from the Bank of America revolving credit facility (as described below), such that a balance of approximately $2.6 million remained outstanding under the note as of December 31, 2014.
During 2014 the Company entered into a loan and security agreement with Bank of America to borrow up to $25 million on a revolving basis, based upon specified percentages of eligible receivables and inventory. Borrowings under this facility aggregated $25.0 million, of which $16.2 million was repaid during the year. The Loan Agreement contains covenants which limit the ability of the Company to, among other things, (i) create, incur, guarantee or suffer to exist any indebtedness; (ii) create or suffer any lien upon any property; (iii) declare or make distributions to equity holders or create any restriction on the ability of a subsidiary to make such a distribution; (iv) make investments; (v) sell, lease, license, consign or otherwise dispose of any property; (vi) make loans or other advances of money to any person; (vii) make payments on certain indebtedness; and (viii) enter into transactions with affiliates. In addition, the Loan Agreement includes a financial covenant that, on a consolidated basis, requires the Company to maintain, for the most recent twelve fiscal months, a ratio of (i) EBITDA minus Capital Expenditures (as defined in the Loan Agreement) and cash taxes paid to (ii) Fixed Charges (as defined in the Loan Agreement), of not less than 1.1 to 1.0. We are in compliance with our covenants and obligations under the facility. As of December 31, 2014, we estimate that we are eligible to borrow an additional $4.5 million under the facility based upon current levels of inventory and accounts receivable.
On December 1, 2014, we converted all outstanding series of preferred stock, including accrued but unpaid dividends thereon, to an aggregate of 36,300,171 shares of our unregistered common stock (the “Preferred Stock Exchange”). All rights relating to the preferred stock were extinguished as a result of the transaction, accordingly we have been relieved of the ongoing obligation to pay dividends on preferred stock.
At December 31, 2014, the Company had positive working capital of $18.8 million, compared to negative working capital at December 31, 2013 of $1.8 million. The improvement reflects our use of the new revolving credit facility described above, as well as loans from RVL and its affiliates as they continue to provide support to us.
While the Company generated negative cash flows from operations in 2014, it did achieve positive cash flows from operations in the fourth quarter of 2014 and the Company believes it has adequate resources to meet its cash requirements in the foreseeable future.
Although we have realized revenues of approximately $76.8 million during the year ended December 31, 2014, we face challenges in order to achieve profitability, and there can be no assurance that we will sustain positive cash flows from operations in future periods or attain profitability. Our ability to meet our obligations in the ordinary course of business is dependent upon our ability to establish profitable operations, maintain our revolving credit facility, or raise additional capital through public or private debt or equity financing, or other sources of financing to fund operations, as well as support of our controlling stockholder. There can be no assurance such financing will be available on terms acceptable to us or that any financing transaction will not be dilutive to our current stockholders.
In addition, to accelerate the growth of our operations in response to new market opportunities or to acquire other technologies or businesses, we may need to raise additional capital. Additional capital may come from several sources, including the incurrence of indebtedness or the issuance of additional common stock, preferred stock, debt (whether convertible or not) or other securities. Increased indebtedness could negatively affect our liquidity and operating flexibility. The issuance of any additional securities could, among other things, result in substantial dilution of the percentage ownership of our stockholders at the time of issuance, result in substantial dilution of our earnings per share, and adversely affect the prevailing market price for our common stock. In addition, we
28
Table of Contents
may not be able to obtain additional financing on terms favorable to us, if at all. If additional funds become necessary and are not available on terms favorable to us, or at all, we may be unable to expand our business or pursue an acquisition and our business, results of operations and financial condition may be materially adversely affected.
Cash Flows
| Year ended December 31, | ||||||||||||
| (in thousands) |
2014 | 2013 | 2012 | |||||||||
| Operating activities |
$ | (14,303 | ) | $ | (8,146 | ) | $ | (5,130 | ) | |||
| Investing activities |
(12,006 | ) | (10,570 | ) | (7,686 | ) | ||||||
| Financing activities |
30,585 | 16,039 | 14,235 | |||||||||
|
|
|
|
|
|
|
|||||||
| Total |
$ | 4,276 | $ | (2,677 | ) | $ | 1,419 | |||||
|
|
|
|
|
|
|
|||||||
Fiscal 2014 compared with fiscal 2013
Net cash used in operating activities increased approximately $6.2 million, to approximately $14.3 million for the year ended December 31, 2014, as compared to approximately $8.1 million for the year ended December 31, 2013. Operating cash flows during 2014 reflect our higher working capital investment, particularly in accounts receivable, to support our greatly expanded 2014 operations.
Net cash used in investing activities increased by approximately $1.4 million for the year ended December 31, 2014 as compared to the same period in 2013. The increase in cash used in investing activities reflects $11.5 million of cash used for acquisitions in the year ended December 31, 2014 compared to $10.4 million in 2013.
Net cash provided by financing activities increased by approximately $14.5 million for the year ended December 31, 2014 as compared to the same period in 2013. This increase includes the net proceeds from a public offering of our common stock, borrowings against our new revolving credit facility, and related-party loans received during 2014.
Fiscal 2013 compared with fiscal 2012
Net cash used in operating activities for the year ended December 31, 2013 increased approximately $3.0 million, to approximately $8.1 million for the year ended December 31, 2013, as compared to approximately $5.1 million for the year ended December 31, 2012. Approximately $5.0 million of the cash flows used for operations in the year ended December 31, 2013 were used in the first quarter of 2013. The net loss, adjusted for non-cash items, was approximately $6.6 million in 2013 compared to approximately $5.5 million in 2012. The timing of collections and payments and the changes in assets and liabilities adversely impacted cash flow by $1.6 million in 2013 compared to a positive impact of $0.4 million in 2012.
Net cash used in investing activities increased by approximately $2.9 million for the year ended December 31, 2013 as compared to the same period in 2012. The increase in cash used in investing activities is primarily the result of approximately $10.4 million of cash used for acquisitions in the year ended December 31, 2013 compared to corresponding amounts of approximately $7.6 million in 2012. Cash used for the purchase of property and equipment increased by approximately $0.1 million for the year ended December 31, 2013, as compared to 2012.
Net cash provided by financing activities increased by approximately $1.8 million for the year ended December 31, 2013 as compared to the same period in 2012. This increase is primarily the result of the issuance of $15.0 million in equity securities during the year ended December 31, 2013 to fund our acquisitions and working capital, of which $10 million was provided by RVL. We also borrowed $0.9 million under an accounts receivable financing arrangement pursuant to which we could borrow up to $1.5 million.
During 2012, we issued convertible preferred stock to RVL for net cash proceeds aggregating approximately $15.1 million, which were used to fund the cash portion of the purchase price of Seesmart, to repay pre-existing debt and other liabilities and for working capital.
29
Table of Contents
CRITICAL ACCOUNTING POLICIES AND ESTIMATES
We use certain accounting policies and procedures to manage changes that occur in our business environment that may affect accounting estimates made in preparation of our financial statements. These estimates relate primarily to our allowance for doubtful accounts receivable, reserve for product returns, provision for inventories, warranties and product liability, revenue recognition, stock-based compensation, goodwill, intangible assets, income taxes and purchase price allocation.
Revenue recognition –We recognize revenue for our products upon shipment or delivery to customers in accordance with the respective contractual arrangements, provided no significant obligations remain and collection is probable. For sales that include customer acceptance terms, revenue is recorded after customer acceptance. It is our policy that all sales are final. Requests for returns are reviewed on a case by case basis. As revenue is recorded, we accrue an estimated amount for product returns as a reduction of revenue.
We from time to time enter into multiple element arrangements, primarily the delivery of products and installation services. The Company allocates the sales value to each element based on its best estimate of the selling price and recognizes revenues in accordance with the relevant standard for each element.
The Company has elected to record sales tax revenue on a gross basis (included in revenues and costs).
Accounts Receivable and Bad Debts - Our strategy for managing doubtful accounts includes centralized credit policies and collection procedures for all customer accounts. We use a credit risk rating system in order to measure the quality of individual credit transactions. We strive to identify potential problem receivables early, take appropriate collection actions, and maintain adequate reserve levels. As revenue is recorded, we accrue an estimated amount for product returns as a reduction of revenue. Our estimate for product returns is based on our historical return experience and our expectation of future returns. We believe that our allowance for doubtful accounts and reserve for product returns were adequate at December 31, 2014 and 2013.
Inventory Provisions - Our strategy for providing for inventory obsolescence includes the evaluation of existing inventory usage and realizable value. Typically, no provision is recorded for inventory items that are currently used and expected to be sold within one year of purchase. We believe that our provision for inventory obsolescence is adequate at December 31, 2014 and 2013.
Warranties and product liability - Our products typically carry a warranty that ranges from one to seven years and includes replacement of defective parts. A warranty reserve is recorded for the estimated costs associated with warranty expense related to recorded sales, which is included within accrued liabilities. The estimate is based on historical experience. If future experience proves to be different from historical experience, we may need to increase or decrease the reserve.
Stock-based Compensation - We account for stock-based compensation under the provisions of FASB ASC 718 “Compensation-Stock Compensation”. Under the fair value recognition provisions of this statement, share-based compensation cost is measured at the grant date based on the value of the award and is recognized as expense over the requisite service period, which is typically the vesting period. Determining the fair value of share-based option awards at the grant date requires judgment, including estimating volatility and expected lives. In addition, judgment is also required in estimating the amount of share-based awards that are expected to be forfeited. If actual results differ significantly from our estimates, our results of operations could be materially impacted.
Purchase Price Allocation - Valuations of acquired businesses require us to make significant estimates, which are derived from information obtained from the management of the acquired businesses, our business plans for the acquired businesses or intellectual property and other sources. Critical assumptions and estimates used in the initial valuation of goodwill and other intangible assets include, but are not limited to:
| • | Assessments of appropriate valuation methodologies in the circumstances; |
| • | Future expected cash flows from product sales, customer contracts and acquired developed technologies, patents and other intellectual property; |
| • | Expected costs to complete any in process research and development projects and commercialized viable products and estimated cash flows from the sales of such products; |
| • | The acquired company’s brand awareness and market position; |
| • | Assumptions about the period of time over which we will continue to use the acquired brand and intangible assets; and |
| • | Discount rates. |
The estimates and assumptions may not materialize because unanticipated events and circumstances may occur. If estimates and assumptions used to initially value goodwill and intangible assets prove to be different from actual results, ongoing reviews of the carrying values of such goodwill and intangible assets may indicate impairment, which will require us to record an impairment charge in the period in which it is identified.
30
Table of Contents
Goodwill and Intangible Assets - We record goodwill as the excess of purchase price over the fair value of the identifiable net assets acquired. FASB ASC 350 “Intangibles – Goodwill and Other” (“ASC 350”), prescribes a two-step process for annual impairment testing of goodwill. The first step tests for impairment, while the second step, if necessary, measures the impairment. Step one compares the fair value of our reporting units to their carrying amount. If the fair value of the reporting unit is greater than its carrying amount, there is no impairment. If the reporting unit’s carrying amount exceeds its fair value, then the second step must be completed to measure the amount of impairment, if any. Step two calculates the implied fair value of goodwill by deducting the fair value of all tangible and intangible net assets of the reporting unit from the fair value of the reporting unit as calculated in step one. In this step, the fair value of the reporting unit is allocated to all of the reporting unit’s assets and liabilities in a hypothetical purchase price allocation as if the reporting unit had been acquired on that date. If the carrying amount of goodwill exceeds the implied fair value of goodwill, an impairment loss will be recognized in an amount equal to the excess. Determining the fair value of a reporting unit is judgmental in nature and requires the use of significant estimates and assumptions, including revenue growth rates, strategic plans, future market conditions, cash flows and discount rates, among others. There can be no assurance that our estimates and assumptions made for purposes of the goodwill impairment testing will prove to be accurate predictions of the future. If our assumptions regarding forecasted revenue or margin growth rates are not achieved or changes in strategy or market conditions occur, we may be required to record goodwill impairment charges in future periods.
Income Taxes - We have recorded net deferred tax assets, before valuation allowance, of approximately $4,887,000 at December 31, 2014, including the tax benefits of net operating loss carryforwards aggregating approximately $11,860,000. We evaluate the adequacy of the valuation allowance annually and, if its assessment of whether it is more likely than not that the related tax benefits will be realized changes, the valuation allowance will be increased or reduced with a corresponding benefit or charge included in income. Management evaluated the adequacy of the valuation allowance at December 31, 2013 in light of the historical results of operations and concluded that a full valuation allowance for net deferred tax assets was required. In connection with the 2014 acquisitions, we recorded deferred tax liabilities of approximately $6.6 million. These net deferred tax liabilities were used to reduce net deferred tax assets and accordingly, we reduced our valuation allowance by this amount during 2014.
At December 31, 2014, we have U.S. Federal net operating carryforwards of approximately $27,019,000, which may be used to reduce future taxable income. Utilization of net operating loss carryforwards is dependent on generating future taxable income of the appropriate type and in the appropriate jurisdiction. In addition, as a result of transactions consummated during 2013 and 2012, including the issuance of common and preferred stock by the Company and the acquisitions of Seesmart and Relume, substantially all of our net operating loss carryforwards are subject to limitations imposed by Section 382 of the Internal Revenue Code. The determination of such limitations is complex and requires a significant amount of analysis and review of past transactions, including those related transactions involving acquired companies and their predecessors. During 2013 the Company performed an evaluation of the Section 382 limitations on the use of net operating loss carryforwards, and adjusted them accordingly. The Company has recognized a full valuation allowance related to its remaining net deferred tax assets, including the remaining net operating loss carryforwards.
Uncertain tax positions are recognized if we determine that it is more likely than not that a tax position will be sustained based on the technical merits of the position, on the presumption that the position will be examined by the appropriate taxing authority that would have full knowledge of all relevant information. The tax position is measured at the largest amount of benefit that is greater than 50 percent likely of being realized upon ultimate settlement.
CONTRACTUAL OBLIGATIONS
The following table sets forth our contractual obligations at December 31, 2014:
| Payments due by period | ||||||||||||
| (in thousands) |
2015 | 2016 - 2017 | 2018 - 2019 | |||||||||
| Operating lease obligations |
$ | 1,057 | $ | 2,111 | $ | 1,078 | ||||||
| Purchase price obligations |
6,269 | 6,086 | — | |||||||||
| Debt |
360 | 12,045 | 720 | |||||||||
|
|
|
|
|
|
|
|||||||
| Total |
$ | 7,686 | $ | 20,242 | $ | 1,798 | ||||||
|
|
|
|
|
|
|
|||||||
31
Table of Contents
Purchase Price Obligations
The Company is obligated to issue 543,052 additional shares to Tri-State, based in part on its achievement of certain financial goals. The Company has recorded a liability in its financial statements for the payment obligation and the contingent consideration obligation.
As a result of 2014 acquisitions, we have issued 2,032,363 shares of common stock and we are obligated to issue an additional 8,035,826 shares in installments through December 2017. Additionally, we are obligated to pay up to $11.7 million if certain performance targets are met during 2014, 2015 and 2016, which may be paid in cash or common stock at our option.
Purchase Obligations
We are not a party to any significant long-term service or supply contracts. We generally do not enter into any long-term purchase commitments in the ordinary course of business.
RECENT ACCOUNTING PRONOUNCEMENTS
See Note 1 to the consolidated financial statements included in this Annual Report on Form 10-K for information related to new accounting pronouncements that impact the Company.
OFF-BALANCE SHEET ARRANGEMENTS
We do not have any off-balance sheet arrangements that have or are reasonably likely to have a current or future effect on our financial condition, changes in financial condition, revenues or expenses, results of operations, liquidity, capital expenditures or capital resources that are material to our investors.
QUARTERLY RESULTS OF OPERATIONS (Unaudited):
| (in thousands, except per share data) |
First Quarter |
Second Quarter |
Third Quarter |
Fourth Quarter |
||||||||||||
| Fiscal year ended December 31, 2014: |
||||||||||||||||
| Revenues |
$ | 4,952 | $ | 17,517 | $ | 26,877 | $ | 27,494 | ||||||||
| Gross profit |
1,603 | 5,563 | 8,559 | 8,498 | ||||||||||||
| Net (loss) income |
(3,570 | ) | 2,410 | (1,404 | ) | (2,616 | ) | |||||||||
| Net (loss) income attributable to common stockholders |
(3,977 | ) | 1,100 | (2,055 | ) | (7,913 | ) | |||||||||
| Basic and diluted (loss) income per common share attributable to common stockholders (1) |
$ | (0.04 | ) | $ | 0.01 | $ | (0.02 | ) | $ | (0.07 | ) | |||||
|
|
|
|
|
|
|
|
|
|||||||||
| Fiscal year ended December 31, 2013: |
||||||||||||||||
| Revenues |
$ | 6,311 | $ | 7,357 | $ | 5,313 | $ | 7,079 | ||||||||
| Gross profit |
2,661 | 3,585 | 1,364 | 2,342 | ||||||||||||
| Net loss |
(5,318 | ) | (5,135 | ) | (3,080 | ) | (3,288 | ) | ||||||||
| Net loss attributable to common stockholders |
(7,766 | ) | (5,457 | ) | (3,545 | ) | (3,703 | ) | ||||||||
| Basic and diluted loss per common share attributable to common stockholders (1) |
$ | (0.11 | ) | $ | (0.07 | ) | $ | (0.04 | ) | $ | (0.05 | ) | ||||
|
|
|
|
|
|
|
|
|
|||||||||
| (1) | The quarterly earnings per share information is computed separately for each period. Therefore, the sum of such quarterly per share amounts may differ from the total for the year. |
32
Table of Contents
| Item 7A. | Quantitative and Qualitative Disclosures About Financial and Market Risk |
The Company is exposed to interest rate risk in connection with its variable-rate revolving credit facility pursuant to which it may borrow up to $25.0 million. See Note 16 of the Notes to Consolidated Financial Statements.
The Company sells its products principally in the United States of America in US dollars and thus is not exposed to foreign currency risk.
The Company sources components from its providers from manufacturers in Asia in US dollars and is thus not exposed to foreign exchange risk directly,
| Item 8. | Financial Statements and Supplementary Data |
The report of the independent registered public accounting firm and financial statements are filed as part of this Annual Report on Form 10-K. The following information appears in this Annual Report on Form 10-K beginning on page 40:
Report of Independent Registered Public Accounting Firm
Consolidated Balance Sheets as of December 31, 2014 and 2013
Consolidated Statements of Operations for the years ended December 31, 2014, 2013 and 2012
Consolidated Statements of Stockholders’ Equity for the years ended December 31, 2014, 2013 and 2012
Consolidated Statements of Cash Flows for the years ended December 31, 2014, 2013 and 2012
Notes to Consolidated Financial Statements
| Item 9. | Changes In and Disagreements with Accountants on Accounting and Financial Disclosure |
None
| Item 9A. | Controls and Procedures |
The certifications of our principal executive officer and principal financial officer in accordance with Rule 13a-14(a) under the Exchange Act are attached as exhibits to this Annual Report on Form 10-K. The disclosures set forth in this Item 9A contain information concerning the evaluation of our disclosure controls and procedures, and changes in our internal control over financial reporting referred to in paragraph 4 of such certifications. Such certifications should be read in conjunction with this Item 9A for a more complete understanding of the matters covered by the certifications.
| (a) | Evaluation of disclosure controls and procedures |
We maintain disclosure controls and procedures (as such term is defined in Rules 13a-15(e) and 15d-15(e) under the Securities Exchange Act of 1934, as amended) that are designed to ensure that information required to be disclosed in the reports we file under the Securities Exchange Act of 1934, as amended, is recorded, processed, summarized and reported within the time periods specified in the Securities and Exchange Commission’s rules and forms, and that such information is accumulated and communicated to our management, including our chief executive officer and chief financial officer as appropriate, to allow timely decisions regarding required disclosure.
In designing and evaluating the disclosure controls and procedures, our management recognizes that any controls and procedures, no matter how well designed and operated, can provide only reasonable assurance of achieving the desired control objectives, and our management necessarily was required to apply its judgment in evaluating the cost-benefit relationship of possible controls and procedures. Furthermore, our controls and procedures can be circumvented by the individual acts of some persons, by collusion of two or more people or by management override of the control and misstatements due to error or fraud may occur and not be detected on a timely basis.
An evaluation was performed under the supervision and with the participation of our management, including our chief executive officer and chief financial officer, of the effectiveness of our disclosure controls and procedures as of the end of the period covered by this Annual Report on Form 10-K. Based on this evaluation, our management concluded that our disclosure controls and procedures were effective at a reasonable assurance level as of the end of the period covered by this report.
| (b) | Management’s annual report on internal control over financial reporting |
Our management is responsible for establishing and maintaining adequate internal control over financial reporting for our Company. Internal control over financial reporting is a process to provide reasonable assurance regarding the reliability of our financial reporting and the preparation of financial statements for external purposes in accordance with accounting principles generally accepted in the United States of America. Internal control over financial reporting includes maintaining records that in reasonable detail accurately and fairly reflect our transactions; providing reasonable assurance that transactions are recorded as necessary for preparation of our
33
Table of Contents
financial statements; providing reasonable assurance that receipts and expenditures of our assets are made in accordance with management’s authorization; and providing reasonable assurance that unauthorized acquisition, use or disposition of our assets that could have a material effect on the financial statements would be prevented or detected on a timely basis. Because of its inherent limitations, internal control over financial reporting is not intended to provide absolute assurance that a misstatement of our financial statements would be prevented or detected. Furthermore, our controls and procedures can be circumvented by the individual acts of some persons, by collusion of two or more people or by management override of the control and misstatements due to error or fraud may occur and not be detected on a timely basis.
Management conducted its evaluation of the effectiveness of our company’s internal controls over financial reporting based on the framework in Internal Control — Integrated Framework issued by the Committee of Sponsoring Organizations of the Treadway Commission in 2013, and concluded that our Company’s internal control over financial reporting was effective as of December 31, 2014.
In conducting the Company’s evaluation of the effectiveness of its internal control over financial reporting, management determined that the internal control systems of Value Lighting and All Around, wholly-owned subsidiaries acquired on April 17, 2014 and December 18, 2014, respectively, would be excluded from its internal control assessment, as permitted by guidance issued by the Securities and Exchange Commission. Accordingly, as of and for the year ended December 31, 2014, internal control systems underlying to approximately 60% of consolidated revenues and 24% of consolidated assets (excluding goodwill and identifiable intangible assets), have been excluded from management’s evaluation of internal control over financial reporting.
The effectiveness of our internal control over financial reporting as of December 31, 2014 has been audited by McGladrey LLP, an independent registered public accounting firm, as stated in their attestation report, which is included below in Item 9A in this Annual Report.
c) Changes in internal controls
There was no change in our internal control over financial reporting that occurred during the quarter ended December 31, 2014 that has materially affected, or is reasonably likely to materially affect, our internal control over financial reporting below.
34
Table of Contents
REPORT OF INDEPENDENT REGISTERED PUBLIC ACCOUNTING FIRM
To the Board of Directors and Stockholders
Revolution Lighting Technologies, Inc.
We have audited Revolution Lighting Technologies, Inc. and subsidiaries’ internal control over financial reporting as of December 31, 2014, based on criteria established in Internal Control — Integrated Framework issued by the Committee of Sponsoring Organizations of the Treadway Commission in 2013. The Company’s management is responsible for maintaining effective internal control over financial reporting and for its assessment of the effectiveness of internal control over financial reporting included in the accompanying Management’s Report on Internal Control over Financial Reporting appearing under Item 9A. Our responsibility is to express an opinion on the company’s internal control over financial reporting based on our audit.
We conducted our audit in accordance with the standards of the Public Company Accounting Oversight Board (United States). Those standards require that we plan and perform the audit to obtain reasonable assurance about whether effective internal control over financial reporting was maintained in all material respects. Our audit included obtaining an understanding of internal control over financial reporting, assessing the risk that a material weakness exists, and testing and evaluating the design and operating effectiveness of internal control based on the assessed risk. Our audit also included performing such other procedures as we considered necessary in the circumstances. We believe that our audit provides a reasonable basis for our opinion.
As described in Management’s Report on Internal Control over Financial Reporting appearing under Item 9A, management has excluded Value Lighting, Inc. and All Around Lighting, LLC from its assessment of internal control over financial reporting as of December 31, 2014, because they were acquired by the Company in a purchase business combination in 2014. We have also excluded Value Lighting, Inc. and All Around Lighting, LLC from our audit of internal control over financial reporting. Value Lighting, Inc. and All Around Lighting, LLC are wholly owned subsidiaries whose revenues and total assets (excluding goodwill and identifiable intangible assets of 32%) represent approximately 60% and 24%, respectively, of the related consolidated financial statement amounts as of and for the year ended December 31, 2014.
A company’s internal control over financial reporting is a process designed to provide reasonable assurance regarding the reliability of financial reporting and the preparation of financial statements for external purposes in accordance with generally accepted accounting principles. A company’s internal control over financial reporting includes those policies and procedures that (a) pertain to the maintenance of records that, in reasonable detail, accurately and fairly reflect the transactions and dispositions of the assets of the company; (b) provide reasonable assurance that transactions are recorded as necessary to permit preparation of financial statements in accordance with generally accepted accounting principles, and that receipts and expenditures of the company are being made only in accordance with authorizations of management and directors of the company; and (c) provide reasonable assurance regarding prevention or timely detection of unauthorized acquisition, use, or disposition of the company’s assets that could have a material effect on the financial statements.
Because of its inherent limitations, internal control over financial reporting may not prevent or detect misstatements. Also, projections of any evaluation of effectiveness to future periods are subject to the risk that controls may become inadequate because of changes in conditions, or that the degree of compliance with the policies or procedures may deteriorate.
In our opinion, Revolution Lighting Technologies, Inc. maintained, in all material respects, effective internal control over financial reporting as of December 31, 2014, based on criteria established in Internal Control — Integrated Framework issued by the Committee of Sponsoring Organizations of the Treadway Commission in 2013.
We have also audited, in accordance with the standards of the Public Company Accounting Oversight Board (United States), the consolidated balance sheets of the Company as of December 31, 2014 and 2013, and the related consolidated statements of operations, stockholders’ equity, and cash flows for each of the three years in the period ended December 31, 2014, and our report dated March 13, 2015 expressed an unqualified opinion.
/s/ McGladrey LLP
Stamford, Connecticut
March 13, 2015
35
Table of Contents
| Item 9B. | Other Information |
On March 13, 2015, the Company filed with the office of the Secretary of State of the State of Delaware a Certificate of Elimination with respect to each of its Series B Convertible Preferred Stock, Series C Senior Convertible Preferred Stock, Series E Senior Convertible Redeemable Preferred Stock and Series G Senior Convertible Redeemable Preferred Stock, whereupon all matters set forth in the Certificate of Designation with respect to each such series of preferred stock were eliminated from the Company’s Certificate of Incorporation. Following the conversion of all of the Company’s outstanding shares of preferred stock into common stock on December 1, 2014, no shares of the Company’s preferred stock remained issued and outstanding.
| Item 10. | Directors, Executive Officers and Corporate Governance |
The information required by this item will be set forth in our definitive proxy or information statement to be filed with the Securities and Exchange Commission in connection with our 2015 annual meeting of stockholders and is incorporated herein by reference. Information relating to our Code of Business Conduct and Ethics and to compliance with Section 16(a) of the Securities Exchange Act of 1934, as amended, will be set forth in our definitive proxy or information statement relating to our 2015 annual meeting of stockholders and is incorporated herein by reference.
| Item 11. | Executive Compensation |
The information required by this item will be set forth in our definitive proxy or information statement to be filed with the Securities and Exchange Commission in connection with our 2015 annual meeting of stockholders and is incorporated herein by reference.
| Item 12. | Security Ownership of Certain Beneficial Owners and Management and Related Stockholder Matters |
The information required by this item will be set forth in our definitive proxy or information statement to be filed with the Securities and Exchange Commission in connection with our 2015 annual meeting of stockholders and is incorporated herein by reference.
| Item 13. | Certain Relationships and Related Transactions and Director Independence |
The information required by this item will be set forth in our definitive proxy or information statement to be filed with the Securities and Exchange Commission in connection with our 2015 annual meeting of stockholders and is incorporated herein by reference.
| Item 14. | Principal Accountant Fees and Services |
The information required by this item will be set forth in our definitive proxy or information statement to be filed with the Securities and Exchange Commission in connection with our 2015 annual meeting of stockholders and is incorporated herein by reference.
36
Table of Contents
| Item 15. | Exhibits and Financial Statement Schedules |
| Exhibit |
Description | |
| 2.1 | Agreement and Plan of Merger, dated as of December 1, 2012, by and among, Revolution Lighting Technologies, Inc., Seesmart Acquisition Company, Inc., Seesmart Merger Company, LLC, Seesmart Technologies, Inc. and Ken Ames as the Stockholder Representative (incorporated by reference to our Current Report on Form 8-K filed December 6, 2012) | |
| 2.2 | Agreement and Plan of Merger, dated as of August 9, 2013, by and among, Revolution Lighting Technologies, Inc., Relume Acquisition Company, Inc., Relume Technologies, Inc. Beringea Invest Michigan, as noteholder representative and the Noteholders named therein (incorporated by reference to our Current Report on Form 8-K filed August 5, 2013) | |
| 2.3 | Agreement and Plan of Merger, dated as of March 6, 2014, by and among, Revolution Lighting Technologies, Inc., Value MergerSub, LLC, Value Lighting, Inc., AL Enterprises, Inc., Value Lighting of Houston, LLC and the Stockholders named therein (incorporated by reference from our Current Report on Form 8-K filed March 10, 2014) | |
| 3.1 | Amended and Restated Certificate of Incorporation, as amended (incorporated by reference to our Quarterly Report on Form 10-Q filed on August 7, 2013) | |
| 3.2 | Amended and Restated Bylaws (incorporated by reference to our Current Report on Form 8-K filed on January 30, 2013) | |
| 4.1 | Certificate of Designations, Preferences and Rights of Series B Convertible Preferred Stock of Revolution Lighting Technologies, Inc. (incorporated by reference to our Current Report on Form 8-K filed on November 16, 2012) | |
| 4.2 | Certificate of Designations, Preferences and Rights of Series C Senior Convertible Preferred Stock of Revolution Lighting Technologies, Inc. (incorporated by reference to our Current Report on Form 8-K filed on December 27, 2012) | |
| 4.3 | Certificate of Designations, Preferences and Rights of Series D Senior Convertible Redeemable Preferred Stock of Revolution Lighting Technologies, Inc. (incorporated by reference to our Current Report on Form 8-K filed on December 27, 2012) | |
| 4.4 | Certificate of Designations, Preferences and Rights of Series E Senior Convertible Redeemable Preferred Stock of Revolution Lighting Technologies, Inc. (incorporated by reference to our Current Report on Form 8-K filed on February 22, 2013) | |
| 4.5 | Certificate of Elimination of the Series E Preferred Stock of Revolution Lighting Technologies, Inc. (incorporated by reference to our Quarterly Report on Form 10-Q filed on May 15, 2013) | |
| 4.6 | Certificate of Designations, Preferences and Rights of Series E Senior Convertible Redeemable Preferred Stock of Revolution Lighting Technologies, Inc. (incorporated by reference to our Quarterly Report on Form 10-Q filed on May 15, 2013) | |
| 4.7 | Certificate of Designations, Preferences and Rights of Series F Senior Convertible Redeemable Preferred Stock of Revolution Lighting Technologies, Inc. (incorporated by reference to our Current Report on Form 8-K filed on August 27, 2013) | |
| 4.8 | Certificate of Designations, Preferences and Rights of Series G Senior Convertible Redeemable Preferred Stock of Revolution Lighting Technologies, Inc. (incorporated by reference to our Current Report on Form 8-K filed on July 3, 2014) | |
| 4.9 | Certificate of Elimination of the Series D Convertible Preferred Stock of Revolution Lighting Technologies, Inc. (incorporated by reference to our Current Report on Form 8-K filed July 3, 2014) | |
| 4.10 | Certificate of Elimination of the Series F Senior Convertible Redeemable Preferred Stock of Revolution Lighting Technologies, Inc. (incorporated by reference to our Current Report on Form 8-K filed July 3, 2014) | |
| 4.11 | Certificate of Elimination of the Series B Convertible Preferred Stock of Revolution Lighting Technologies, Inc.* | |
37
Table of Contents
| Exhibit |
Description | |
| 4.12 | Certificate of Elimination of the Series C Senior Convertible Preferred Stock of Revolution Lighting Technologies, Inc.* | |
| 4.13 | Certificate of Elimination of the Series E Senior Convertible Redeemable Preferred Stock of Revolution Lighting Technologies, Inc.* | |
| 4.14 | Certificate of Elimination of the Series G Senior Convertible Redeemable Preferred Stock of Revolution Lighting Technologies, Inc.* | |
| 10.1 | Form of Indemnification Agreement (incorporated by reference to our Current Report on Form 8-K filed on November 16, 2012) | |
| 10.2 | 2003 Stock Incentive Plan (incorporated by reference to our Definitive Proxy Statement filed April 16, 2004) | |
| 10.3 | Form of Warrant Agreement between Revolution Lighting Technologies, Inc. and Brett M. Kingstone (incorporated by reference to our Definitive Proxy Statement filed November 3, 2005) | |
| 10.4 | Management Services Agreement, dated as of April 16, 2013, by and between the Company and Aston Capital LLC (incorporated by reference to our Annual Report on Form 10-K filed on April 16, 2013) | |
| 10.5 | Investment Agreement, dated as of September 12, 2012, by and between Revolution Lighting Technologies, Inc. and RVL 1 LLC (incorporated by reference to our Current Report on Form 8-K filed September 17, 2012) | |
| 10.6 | Termination and Exchange Agreement, dated as of September 12, 2012, by and between Revolution Lighting Technologies, Inc. and each holder of the Convertible Promissory Notes dated December 21, 2009 (incorporated by reference to our Current Report on Form 8-K filed September 17, 2012) | |
| 10.7 | Registration Rights Agreement, dated as of September 25, 2012, by and between Revolution Lighting Technologies, Inc. and RVL 1 LLC (incorporated by reference to our Current Report on Form 8-K filed September 26, 2012) | |
| 10.8 | Settlement and Patent License Agreement, dated as of August 1, 2012, by and between Revolution Lighting Technologies, Inc. and Koninklijke Philips Electronics N.V. (incorporated by reference to our Quarterly Report on Form 10-Q filed November 14, 2012) | |
| 10.9 | Separation and General Release Agreement, dated as of January 25, 2013, by and between Revolution Lighting Technologies, Inc. and Michael A. Bauer (incorporated by reference to our Current Report on Form 8-K filed January 30, 2013) | |
| 10.10 | Investment Agreement, dated as of February 21, 2013, by and between Revolution Lighting Technologies, Inc. and RVL 1 LLC (incorporated by reference to our Current Report on Form 8-K filed February 22, 2013) | |
| 10.11 | Transition, Separation and General Release Agreement, dated as of February 16, 2013, by and between Revolution Lighting Technologies, Inc. and Gary R. Langford (incorporated by reference to our Current Report on Form 8-K filed February 22, 2013) | |
| 10.12 | Investment Agreement, dated as of March 8, 2013, by and among Revolution Lighting Technologies, Inc., Great American Insurance Company, and Great American Life Insurance Company (incorporated by reference to our Current Report on Form 8-K filed March 14, 2013) | |
| 10.13 | Form of Restricted Share Award Agreement (incorporated by reference to our Quarterly Report on Form 10-Q filed May 15, 2013) | |
| 10.14 | Revolution Lighting Technologies, Inc. 2013 Stock Incentive Plan (incorporated by reference to our Definitive Information Statement filed on April 22, 2013) | |
| 10.15 | Promissory Note dated as of February 25, 2014 between the Company and Aston Capital LLC (incorporated by reference to our Annual Report on Form 10-K filed March 14, 2014) | |
| 10.16 | Promissory Note dated as of April 4, 2014 between the Company and Aston Capital LLC (incorporated herein by reference to our Current Report on Form 8-K filed April 23, 2014) | |
38
Table of Contents
| Exhibit |
Description | |
| 10.17 | Promissory Note dated as of April 17, 2014 between the Company and RVL 1 LLC (incorporated herein by reference to our Current Report on Form 8-K filed April 23, 2014) | |
| 10.18 | Amendment No. 1 to the Revolution Lighting Technologies, Inc. 2013 Stock Incentive Plan (incorporated by reference to our Definitive Information Statement filed on April 22, 2014) | |
| 10.19 | Exchange Agreement, dated June 30, 2014, by and among Revolution Lighting Technologies, Inc., RVL 1 LLC and Aston Capital, LLC. (incorporated by reference to our Current Report on Form 8-K filed July 3, 2014) | |
| 10.20 | Exchange Agreement dated as of July 31, 2014 between the Company and Aston Capital LLC (incorporated by reference to our Current Report on Form 8-K filed August 4, 2014) | |
| 10.21 | Promissory Note, dated as of July 31, 2014, by and between Revolution Lighting Technologies, Inc. and Aston Capital, LLC (incorporated by reference to our Current Report on Form 8-K filed August 4, 2014) | |
| 10.22 | Loan and Security Agreement, dated as of August 20, 2014, among Revolution Lighting Technologies, Inc., Lumificient Corporation, Lighting Integration Technologies, LLC, Seesmart Technologies, LLC, Relume Technologies, Inc., Tri-State LED DE, LLC, Value Lighting, LLC, the Guarantors party thereto and Bank of America, N.A (incorporated by reference to our Current Report on Form 8-K filed August 26, 2014) | |
| 10.23 | Guaranty, dated as of August 20, 2014, by each of Revolution Lighting Technologies, Inc., Lumificient Corporation, Lighting Integration Technologies, LLC, Seesmart Technologies, LLC, Relume Technologies, Inc., Tri-State LED DE, LLC, Value Lighting, LLC, Seesmart, Inc., Envirolight LED, LLC, Sentinel System, LLC and Value Lighting of Houston, LLC, in favor of Bank of America, N.A. and the Secured Parties (incorporated by reference to our Current Report on Form 8-K filed August 26, 2014) | |
| 10.24 | Pledge Agreement, dated as of August 20, 2014, by and among Revolution Lighting Technologies, Inc., the Borrowers listed on Schedule I thereto, the Guarantors listed on Schedule II thereto and Bank of America, N.A. (incorporated by reference to our Current Report on Form 8-K filed August 26, 2014) | |
| 10.25 | Underwriting Agreement, dated as of November 25, 2014, by and between Revolution Lighting Technologies, Inc. and Roth Capital Partners, LLC (incorporated by reference to our Current Report on Form 8-K filed November 26, 2014) | |
| 10.26 | Exchange Agreement, dated as of November 25, 2014, by and between Revolution Lighting Technologies, Inc. and RVL 1 LLC (incorporated by reference to our Current Report on Form 8-K filed November 26, 2014) | |
| 14 | Code of Business Conduct and Ethics (incorporated by reference to our Annual Report on Form 10-KSB filed March 26, 2004) | |
| 21 | Subsidiaries of Revolution Lighting Technologies, Inc.* | |
| 23.1 | Consent of McGladrey LLP, Independent Registered Public Accounting Firm* | |
| 31.1 | Certifications by our chief executive officer pursuant to Section 302 of the Sarbanes-Oxley Act of 2002* | |
| 31.2 | Certifications by our chief financial officer pursuant to Section 302 of the Sarbanes-Oxley Act of 2002* | |
| 32.1 | Certifications by our chief executive officer and chief financial officer pursuant to Section 906 of the Sarbanes-Oxley Act of 2002* | |
| 101** | The following financial statements from Revolution Lighting Technologies, Inc.’s Yearly Report on Form 10-K for the year ended December 31, 2014, filed on March 16, 2015, formatted in XBRL (eXtensible Business Reporting Language): (i) Consolidated Balance Sheets, (ii) Consolidated Statements of Operations (iii) Consolidated Statements of Stockholders’ Equity (iv) Consolidated Statements of Cash Flows, (v) Notes to Consolidated Financial Statements | |
| * | Filed herewith |
| ** | Submitted electronically with this Report pursuant to Rule 405 of Regulation S-T |
39
Table of Contents
REVOLUTION LIGHTING TECHNOLOGIES, INC.
INDEX TO CONSOLIDATED FINANCIAL STATEMENTS
40
Table of Contents
REPORT OF INDEPENDENT REGISTERED PUBLIC ACCOUNTING FIRM
To the Board of Directors and Stockholders
Revolution Lighting Technologies, Inc.
We have audited the accompanying consolidated balance sheets of Revolution Lighting Technologies, Inc. and subsidiaries (the “Company”) as of December 31, 2014 and 2013, and the related consolidated statements of operations, stockholders’ equity and cash flows for each of the three years in the period ended December 31, 2014. These financial statements are the responsibility of the Company’s management. Our responsibility is to express an opinion on these financial statements based on our audits.
We conducted our audits in accordance with the standards of the Public Company Accounting Oversight Board (United States). Those standards require that we plan and perform the audit to obtain reasonable assurance about whether the financial statements are free of material misstatement. An audit includes examining, on a test basis, evidence supporting the amounts and disclosures in the financial statements. An audit also includes assessing the accounting principles used and significant estimates made by management, as well as evaluating the overall financial statement presentation. We believe that our audits provide a reasonable basis for our opinion.
In our opinion, the consolidated financial statements referred to above present fairly, in all material respects, the financial position of Revolution Lighting Technologies, Inc. and subsidiaries as of December 31, 2014 and 2013, and the results of their operations and their cash flows for each of the three years in the period ended December 31, 2014, in conformity with U.S. generally accepted accounting principles.
We have also audited, in accordance with the standards of the Public Company Accounting Oversight Board (United States), Revolution Lighting Technologies, Inc. and subsidiaries’ internal control over financial reporting as of December 31, 2014, based on criteria established in Internal Control — Integrated Framework issued by the Committee of Sponsoring Organizations of the Treadway Commission in 2013, and our report dated March 13, 2015 expressed an unqualified opinion on the effectiveness of the Company’s internal control over financial reporting.
/s/ McGladrey LLP
Stamford, Connecticut
March 13, 2015
41
Table of Contents
REVOLUTION LIGHTING TECHNOLOGIES, INC.
CONSOLIDATED BALANCE SHEETS
| (in thousands, except per share data) | December 31, | |||||||
| 2014 | 2013 | |||||||
| ASSETS | ||||||||
| Current Assets: |
||||||||
| Cash and cash equivalents |
$ | 6,033 | $ | 1,757 | ||||
| Trade accounts receivable, less allowance for doubtful accounts of $108 and $210 |
23,779 | 4,353 | ||||||
| Inventories, less reserves of $1,669 and $1,708 |
13,673 | 4,969 | ||||||
| Other current assets |
3,157 | 743 | ||||||
|
|
|
|
|
|||||
| Total current assets |
46,642 | 11,822 | ||||||
| Property and equipment: |
||||||||
| Machinery and equipment |
1,004 | 751 | ||||||
| Furniture and fixtures |
263 | 204 | ||||||
| Computers and software |
598 | 239 | ||||||
| Construction in process |
251 | 63 | ||||||
| Leasehold improvements |
126 | 51 | ||||||
|
|
|
|
|
|||||
| 2,242 | 1,308 | |||||||
| Accumulated depreciation and amortization |
(1,031 | ) | (551 | ) | ||||
|
|
|
|
|
|||||
| Net property and equipment |
1,211 | 757 | ||||||
| Goodwill |
42,991 | 21,498 | ||||||
| Intangible assets, less accumulated amortization of $8,756 and $3,732 |
34,784 | 17,869 | ||||||
| Other assets, net |
914 | 291 | ||||||
|
|
|
|
|
|||||
| $ | 126,542 | $ | 52,237 | |||||
|
|
|
|
|
|||||
| LIABILITIES AND STOCKHOLDERS’ EQUITY | ||||||||
| Current Liabilities: |
||||||||
| Accounts payable |
$ | 11,573 | $ | 6,109 | ||||
| Accrued liabilities |
5,470 | 2,553 | ||||||
| Accrued compensation and benefits |
2,281 | 1,077 | ||||||
| Customer deposits |
1,295 | 132 | ||||||
| Other current liabilities |
966 | 1,820 | ||||||
| Purchase price obligations - current |
6,269 | 1,927 | ||||||
|
|
|
|
|
|||||
| Total current liabilities |
27,854 | 13,618 | ||||||
| Revolving credit facility |
8,760 | — | ||||||
| Related party payable |
2,565 | — | ||||||
| Note payable |
2,816 | — | ||||||
| Purchase price obligation - noncurrent |
6,086 | 960 | ||||||
| Dividends payable |
— | 1,044 | ||||||
| Other liabilities |
1,145 | 193 | ||||||
|
|
|
|
|
|||||
| Total liabilities |
49,226 | 15,815 | ||||||
| Temporary Equity: |
||||||||
| Series E Redeemable convertible preferred stock $.001 par value, aggregate liquidation preference of $5,738, 10 shares authorized, 5 shares issued and outstanding 2013 |
— | 5,738 | ||||||
| Series F Redeemable convertible preferred stock, $001 par value, aggregate liquidation preference of $5,228, 10 shares authorized, 5 shares issued and outstanding 2013 |
— | 5,228 | ||||||
|
|
|
|
|
|||||
| Total temporary equity |
— | 10,966 | ||||||
|
|
|
|
|
|||||
| Stockholders’ Equity: |
||||||||
| Series C convertible preferred stock, $.001 par value, aggregate liquidation preference of $10,031, 25 shares authorized, 10 issued and outstanding 2013 |
— | 9,936 | ||||||
| Series B convertible preferred stock, $.001 par value, aggregate liquidation preference of $0.02; 1,000 shares authorized, two issued and outstanding 2013 |
— | — | ||||||
| Common stock, $.001 par value, 150,000 shares authorized, 129,714 and 82,095 issued and outstanding at December 31, 2014 and 2013, respectively |
130 | 82 | ||||||
| Additional paid-in capital |
149,477 | 82,549 | ||||||
| Accumulated deficit |
(72,291 | ) | (67,111 | ) | ||||
|
|
|
|
|
|||||
| Total stockholders’ equity |
77,316 | 25,456 | ||||||
|
|
|
|
|
|||||
| $ | 126,542 | $ | 52,237 | |||||
|
|
|
|
|
|||||
See accompanying notes to consolidated financial statements.
42
Table of Contents
REVOLUTION LIGHTING TECHNOLOGIES, INC.
CONSOLIDATED STATEMENTS OF OPERATIONS
| (in thousands, except per share data) |
Year Ended December 31, | |||||||||||
| 2014 | 2013 | 2012 | ||||||||||
| Revenues |
$ | 76,840 | $ | 26,060 | $ | 4,481 | ||||||
| Cost of sales |
52,617 | 16,108 | 4,705 | |||||||||
|
|
|
|
|
|
|
|||||||
| Gross profit (loss) |
24,223 | 9,952 | (224 | ) | ||||||||
| Operating expenses: |
||||||||||||
| Selling, general and administrative: |
||||||||||||
| Severance and transition costs |
335 | 1,152 | — | |||||||||
| Acquisition and other related expenses |
2,153 | 2,389 | 286 | |||||||||
| Amortization and depreciation |
5,644 | 3,122 | 493 | |||||||||
| Stock based compensation |
1,711 | 809 | 45 | |||||||||
| Other selling, general and administrative |
23,204 | 11,193 | 4,417 | |||||||||
| Research and development |
2,076 | 1,809 | 555 | |||||||||
| Impairment expense |
— | — | 3,397 | |||||||||
|
|
|
|
|
|
|
|||||||
| Total operating expenses |
35,123 | 20,474 | 9,193 | |||||||||
|
|
|
|
|
|
|
|||||||
| Operating loss |
(10,900 | ) | (10,522 | ) | (9,417 | ) | ||||||
|
|
|
|
|
|
|
|||||||
| Other income (expense): |
||||||||||||
| Gain on debt restructuring |
— | — | 1,048 | |||||||||
| Change in fair value of embedded derivative |
— | (6,990 | ) | — | ||||||||
| Gain on bargain purchase of business |
— | 743 | — | |||||||||
| Interest expense |
(843 | ) | (52 | ) | (210 | ) | ||||||
| Other income |
13 | — | 1 | |||||||||
|
|
|
|
|
|
|
|||||||
| Total other income (expense), net |
(830 | ) | (6,299 | ) | 839 | |||||||
|
|
|
|
|
|
|
|||||||
| Loss before income taxes |
(11,730 | ) | (16,821 | ) | (8,578 | ) | ||||||
| Deferred income tax benefit |
6,550 | — | — | |||||||||
|
|
|
|
|
|
|
|||||||
| Net loss |
(5,180 | ) | (16,821 | ) | (8,578 | ) | ||||||
| Accretion of preferred stock to redemption value, beneficial conversion feature and discount |
(919 | ) | (2,290 | ) | (5,195 | ) | ||||||
| Accrual of preferred stock dividends |
(1,445 | ) | (1,360 | ) | (31 | ) | ||||||
| Deemed distribution on exchange of preferred stock |
(5,301 | ) | — | — | ||||||||
|
|
|
|
|
|
|
|||||||
| Net loss attributable to common stockholders |
$ | (12,845 | ) | $ | (20,471 | ) | $ | (13,804 | ) | |||
|
|
|
|
|
|
|
|||||||
| Basic and diluted loss per common share: |
||||||||||||
| Net loss attributable to common stockholders |
$ | (0.14 | ) | $ | (0.26 | ) | $ | (0.63 | ) | |||
|
|
|
|
|
|
|
|||||||
| Basic and diluted weighted average shares outstanding |
92,158 | 77,317 | 22,065 | |||||||||
|
|
|
|
|
|
|
|||||||
See accompanying notes to consolidated financial statements.
43
Table of Contents
REVOLUTION LIGHTING TECHNOLOGIES, INC.
CONSOLIDATED STATEMENTS OF STOCKHOLDERS’ EQUITY
Years Ended December 31, 2014, 2013 and 2012
| (in thousands, except per share data) |
Preferred Stock | Common Stock | Additional Paid- | Accumulated | Total Stockholders’ |
Temporary | ||||||||||||||||||||||||||
| Shares | Amount | Shares | Amount | in Capital | Deficit | Equity | Equity | |||||||||||||||||||||||||
| Balance, January 1, 2012 |
— | $ | — | 16,452 | $ | 16 | $ | 50,007 | $ | (41,712 | ) | $ | 8,311 | $ | — | |||||||||||||||||
| Stock-based compensation |
— | — | — | — | 45 | — | 45 | — | ||||||||||||||||||||||||
| Issuance of Series B convertible preferred stock, net of issuance costs |
600 | — | — | — | 5,195 | — | 5,195 | — | ||||||||||||||||||||||||
| Accretion of Series B preferred stock beneficial conversion feature |
— | 5,195 | — | — | (5,195 | ) | — | — | — | |||||||||||||||||||||||
| Conversion of Series B convertible preferred stock to common stock |
(600 | ) | (5,195 | ) | 46,154 | 46 | 5,149 | — | — | — | ||||||||||||||||||||||
| Issuance of Series C convertible preferred stock, net of issuance costs |
10 | 9,936 | — | — | — | — | 9,936 | — | ||||||||||||||||||||||||
| Accrual of dividends on Series C convertible preferred stock |
— | — | — | — | (31 | ) | — | (31 | ) | — | ||||||||||||||||||||||
| Issuance of Series D convertible preferred stock, net of issuance costs |
11 | 944 | — | — | — | — | 944 | — | ||||||||||||||||||||||||
| Issuance of common stock for convertible promissory notes, net of issuance costs |
— | — | 1,000 | 1 | 587 | — | 588 | — | ||||||||||||||||||||||||
| Issuance of common stock for Seesmart acquisition |
— | — | 6,607 | 7 | 4,288 | — | 4,295 | — | ||||||||||||||||||||||||
| Fees associated with issuances of common stock |
— | — | — | — | (9 | ) | — | (9 | ) | — | ||||||||||||||||||||||
| Net loss |
— | — | — | — | — | (8,578 | ) | (8,578 | ) | — | ||||||||||||||||||||||
|
|
|
|
|
|
|
|
|
|
|
|
|
|
|
|
|
|||||||||||||||||
| Balance, December 31, 2012 |
21 | 10,880 | 70,213 | 70 | 60,036 | (50,290 | ) | 20,696 | — | |||||||||||||||||||||||
| Exercise of stock options |
— | — | 108 | — | 265 | — | 265 | — | ||||||||||||||||||||||||
| Stock-based compensation for employees |
— | — | 191 | — | 302 | — | 302 | — | ||||||||||||||||||||||||
| Stock-based compensation for non-employees |
— | — | — | — | 507 | — | 507 | — | ||||||||||||||||||||||||
| Issuance of Series F redeemable convertible preferred stock, net of issuance costs |
— | — | — | — | — | — | — | 4,999 | ||||||||||||||||||||||||
44
Table of Contents
REVOLUTION LIGHTING TECHNOLOGIES, INC.
CONSOLIDATED STATEMENTS OF STOCKHOLDERS’ EQUITY
Years Ended December 31, 2014, 2013 and 2012 (continued)
| (in thousands, except per share data) |
Preferred Stock | Common Stock | Additional Paid- | Accumulated | Total Stockholders’ |
Temporary | ||||||||||||||||||||||||||
| Shares | Amount | Shares | Amount | in Capital | Deficit | Equity | Equity | |||||||||||||||||||||||||
| Issuance of Series E redeemable convertible preferred stock, net of issuance costs |
— | — | — | — | — | — | — | 4,968 | ||||||||||||||||||||||||
| Accrual of dividends on convertible preferred stock |
— | — | — | — | (1,360 | ) | — | (1,360 | ) | 346 | ||||||||||||||||||||||
| Embedded Conversion Liability |
— | — | — | — | 8,626 | — | 8,626 | (1,637 | ) | |||||||||||||||||||||||
| Issuance of Series D convertible preferred stock |
1 | 62 | — | — | — | — | 62 | — | ||||||||||||||||||||||||
| Conversion of preferred stock to common stock |
(12 | ) | (1,006 | ) | 1,712 | 1 | 1,005 | — | — | — | ||||||||||||||||||||||
| Accretion of Series E and F preferred stock to redemption value |
— | — | — | — | (2,290 | ) | — | (2,290 | ) | 2,290 | ||||||||||||||||||||||
| Issuance of common stock for cash, net of issuance costs |
— | — | 4,348 | 5 | 5,064 | — | 5,069 | — | ||||||||||||||||||||||||
| Issuance of restricted common stock for services |
— | — | 1,084 | 1 | (1 | ) | — | — | — | |||||||||||||||||||||||
| Issuance of common stock for acquisition – Seesmart |
— | — | 1,993 | 2 | 1,293 | — | 1,295 | — | ||||||||||||||||||||||||
| Issuance of common stock for acquisition – Relume |
— | — | 2,174 | 2 | 7,303 | — | 7,305 | — | ||||||||||||||||||||||||
| Issuance of common stock for acquisition – Tri-State |
— | — | 272 | 1 | 809 | — | 810 | — | ||||||||||||||||||||||||
| Fees associated with issuances of common stock |
— | — | — | — | (119 | ) | — | (119 | ) | — | ||||||||||||||||||||||
| Common stock to be issued |
— | — | — | — | 1,109 | — | 1,109 | — | ||||||||||||||||||||||||
| Net loss |
— | — | — | — | — | (16,821 | ) | (16,821 | ) | — | ||||||||||||||||||||||
|
|
|
|
|
|
|
|
|
|
|
|
|
|
|
|
|
|||||||||||||||||
| Balance, December 31, 2013 |
10 | $ | 9,936 | 82,095 | $ | 82 | $ | 82,549 | $ | (67,111 | ) | $ | 25,456 | $ | 10,966 | |||||||||||||||||
| Stock-based compensation for employees |
— | — | — | — | 840 | — | 840 | — | ||||||||||||||||||||||||
| Stock-based compensation for non-employees |
— | — | — | — | (40 | ) | — | (40 | ) | — | ||||||||||||||||||||||
| Accretion of Series E preferred stock to redemption value |
— | — | — | — | (19 | ) | — | (19 | ) | 19 | ||||||||||||||||||||||
| Accrual of dividends on convertible preferred stock |
— | — | — | — | (1,445 | ) | — | (1,445 | ) | 691 | ||||||||||||||||||||||
| Issuance of dividends on Series C |
— | 1,028 | — | — | (28 | ) | — | 1,000 | — | |||||||||||||||||||||||
| Issuance of common stock for services |
— | — | 849 | 1 | (1 | ) | — | — | — | |||||||||||||||||||||||
| Issuance of preferred stock Series E |
— | — | — | — | — | — | — | (56 | ) | |||||||||||||||||||||||
| Issuance of common stock for cash, net of issuance costs |
— | — | 8,000 | 8 | 8,606 | — | 8,614 | — | ||||||||||||||||||||||||
| Cancellation of Series F preferred stock |
— | — | — | — | — | — | — | (5,404 | ) | |||||||||||||||||||||||
45
Table of Contents
REVOLUTION LIGHTING TECHNOLOGIES, INC.
CONSOLIDATED STATEMENTS OF STOCKHOLDERS’ EQUITY
Years Ended December 31, 2014, 2013 and 2012 (continued)
| (in thousands, except per share data) |
Preferred Stock | Common Stock | Additional Paid- | Accumulated | Total Stockholders’ |
Temporary | ||||||||||||||||||||||||||
| Shares | Amount | Shares | Amount | in Capital | Deficit | Equity | Equity | |||||||||||||||||||||||||
| Issuance of preferred stock Series G and accretion to redemption value |
— | — | — | — | (900 | ) | — | (900 | ) | 18,392 | ||||||||||||||||||||||
| Forfeiture of restricted stock |
— | — | (130 | ) | — | — | — | — | — | |||||||||||||||||||||||
| Adjustment for shares issued for acquisition – Tri-State |
— | — | (7 | ) | — | — | — | — | — | |||||||||||||||||||||||
| Issuance of escrowed common stock for acquisition – Seesmart |
— | — | 575 | 1 | 373 | — | 374 | — | ||||||||||||||||||||||||
| Shares issued for acquisition – Value Lighting |
— | — | 2,032 | 2 | (2 | ) | — | — | — | |||||||||||||||||||||||
| Shares to be issued for acquisitions |
— | — | — | 22,737 | — | 22,737 | — | |||||||||||||||||||||||||
| Exchange of preferred stock for common stock |
(10 | ) | (10,964 | ) | 36,300 | 36 | 36,807 | — | 25,879 | (25,079 | ) | |||||||||||||||||||||
| Net loss |
— | — | — | — | — | (5,180 | ) | (5,180 | ) | — | ||||||||||||||||||||||
|
|
|
|
|
|
|
|
|
|
|
|
|
|
|
|
|
|||||||||||||||||
| Balance, December 31, 2014 |
— | $ | — | 129,714 | $ | 130 | $ | 149,477 | $ | (72,291 | ) | $ | 77,316 | $ | — | |||||||||||||||||
|
|
|
|
|
|
|
|
|
|
|
|
|
|
|
|
|
|||||||||||||||||
See accompanying notes to consolidated financial statements.
46
Table of Contents
REVOLUTION LIGHTING TECHNOLOGIES, INC.
CONSOLIDATED STATEMENTS OF CASH FLOWS
| (in thousands) |
Year Ended December 31, | |||||||||||
| 2014 | 2013 | 2012 | ||||||||||
| Cash Flows from Operating Activities: |
||||||||||||
| Net loss |
$ | (5,180 | ) | $ | (16,821 | ) | $ | (8,578 | ) | |||
| Adjustments to reconcile net loss to net cash used in operating activities: |
||||||||||||
| Deferred income tax benefit |
(6,550 | ) | — | — | ||||||||
| Depreciation |
495 | 263 | 228 | |||||||||
| Amortization of intangible and other assets |
5,149 | 2,859 | 265 | |||||||||
| Stock-based compensation |
1,711 | 809 | 45 | |||||||||
| Gain on bargain purchase of business |
— | (743 | ) | — | ||||||||
| Change in fair value of contingent consideration |
1,419 | 88 | — | |||||||||
| Impairment charges |
— | — | 3,397 | |||||||||
| Gain on debt restructuring |
— | — | (1,048 | ) | ||||||||
| Change in fair value of embedded derivative |
— | 6,990 | — | |||||||||
| Other |
18 | — | 147 | |||||||||
| Changes in operating assets and liabilities, net of the effect of the acquisitions (Note 2): |
||||||||||||
| (Increase) decrease in trade accounts receivable, net |
(10,291 | ) | (1,727 | ) | 306 | |||||||
| (Increase) decrease in inventories, net |
(60 | ) | (697 | ) | 1,753 | |||||||
| (Increase) decrease in other assets |
(977 | ) | (385 | ) | (126 | ) | ||||||
| (Decrease) increase in accounts payable, accrued liabilities and other liabilities |
(578 | ) | 2,175 | (1,381 | ) | |||||||
| (Decrease) increase in accrued compensation and benefits |
(116 | ) | 381 | (69 | ) | |||||||
| Increase (decrease) in customer deposits |
657 | (1,338 | ) | (69 | ) | |||||||
|
|
|
|
|
|
|
|||||||
| Net cash used in operating activities |
(14,303 | ) | (8,146 | ) | (5,130 | ) | ||||||
|
|
|
|
|
|
|
|||||||
| Cash Flows from Investing Activities: |
||||||||||||
| Acquisitions of businesses, net of cash acquired |
(11,521 | ) | (10,437 | ) | (7,591 | ) | ||||||
| Patents, trademarks and other |
— | — | (83 | ) | ||||||||
| Purchase of property and equipment |
(485 | ) | (133 | ) | (12 | ) | ||||||
|
|
|
|
|
|
|
|||||||
| Net cash used in investing activities |
(12,006 | ) | (10,570 | ) | (7,686 | ) | ||||||
|
|
|
|
|
|
|
|||||||
| Cash Flows from Financing Activities: |
||||||||||||
| Proceeds from issuance of common stock, net of issuance costs |
8,614 | 4,950 | (10 | ) | ||||||||
| Payment to extinguish convertible promissory notes |
— | — | (880 | ) | ||||||||
| Proceeds from issuances of preferred stock, net of issuance costs |
(94 | ) | 9,964 | 15,125 | ||||||||
| (Repayments) proceeds from short-term borrowings and notes payable |
(1,552 | ) | 860 | — | ||||||||
| Proceeds from revolving credit facility |
24,981 | — | — | |||||||||
| Repayments of revolving credit facility |
(16,221 | ) | — | — | ||||||||
| Proceeds from related party payable |
18,106 | — | — | |||||||||
| Repayments of related party payable |
(3,249 | ) | — | — | ||||||||
| Net proceeds from exercise of employee stock options and warrants |
— | 265 | — | |||||||||
|
|
|
|
|
|
|
|||||||
| Net cash provided by financing activities |
30,585 | 16,039 | 14,235 | |||||||||
|
|
|
|
|
|
|
|||||||
| Net increase (decrease) in cash and cash equivalents |
4,276 | (2,677 | ) | 1,419 | ||||||||
| Cash and cash equivalents, beginning of period |
1,757 | 4,434 | 3,015 | |||||||||
|
|
|
|
|
|
|
|||||||
| Cash and cash equivalents, end of period |
$ | 6,033 | $ | 1,757 | $ | 4,434 | ||||||
|
|
|
|
|
|
|
|||||||
| Supplemental Disclosure of Cash Flow Information: |
||||||||||||
| Cash paid during period for interest |
$ | 543 | $ | 21 | $ | — | ||||||
| Non-cash investing and financing activities: |
||||||||||||
| Issuance of common stock for acquisitions |
23,111 | 9,435 | 4,295 | |||||||||
| Contingent consideration for acquisitions |
9,976 | 960 | — | |||||||||
| Exchange of trade accounts payable for note |
3,736 | — | — | |||||||||
| Issuance of Series D preferred stock for acquisition |
— | 62 | 950 | |||||||||
| Issuance of Series G preferred stock for extinguishment of note payable ($12,600) and Series F preferred stock ($5,400) |
18,000 | — | — | |||||||||
| Conversion of preferred stock for common stock |
36,843 | 1,006 | — | |||||||||
| Issuance of common stock for convertible promissory notes |
— | — | 588 | |||||||||
| Accrual of dividends on preferred stock |
1,449 | 1,360 | — | |||||||||
| In-kind dividends on Series C preferred stock |
1,000 | — | — | |||||||||
See accompanying notes to consolidated financial statements.
47
Table of Contents
REVOLUTION LIGHTING TECHNOLOGIES, INC.
NOTES TO CONSOLIDATED FINANCIAL STATEMENTS
December 31, 2014
| 1. | Summary of Significant Accounting Policies: |
Business – Revolution Lighting Technologies, Inc. and its wholly-owned subsidiaries (“the Company”, “we”, “our”, “us”) design, manufacture, market and sell commercial grade light-emitting diode (“LED”) fixtures for outdoor and indoor applications, LED-based signage, channel-letter and contour lighting products, replacement lamps and high-performance, commercial grade smart grid control systems, as well as conventional lighting systems. We sell these products under the RVLT, Lumificient, Value Lighting, Array and CMG brand names. We are in the process of consolidating our Seesmart and Relume brand names under the RVLT umbrella. Our products incorporate many proprietary and innovative features. Our product offerings and patented designs provide opportunities for significant savings in energy and maintenance costs without compromising the environment. We generate revenue by selling lighting products for use in the municipal and commercial markets, which include vertical markets such as industrial, commercial and government facilities, hospitality, institutional, educational, healthcare and signage markets. We market and distribute our products globally through networks of distributors, independent sales agencies and representatives, electrical supply companies, as well as internal marketing and sales forces.
Our operations comprise two reportable segments for financial reporting purposes: Lighting Fixtures and Lamps and Lighting Signage and Media. The Lighting Fixtures and Lamps reportable segment includes our Seesmart, Relume, LIT, Tri-State and Value Lighting businesses. The Lighting Signage and Media reportable segment is comprised of the Lumificient business. The Media business of Relume, included in the Lighting Fixtures and Lamps segment since the 2013 acquisition of Relume was transferred to Lumificient effective January 1, 2014. It has been included in the Lighting Signage and Media reportable segment since that date.
On December 20, 2012, the Company completed the acquisition of Seesmart Technologies, Inc. (“Seesmart”). Seesmart is headquartered in Simi Valley, California.
Prior to 2013, the Company marketed and sold LED products through its Array Lighting division and through its subsidiary, Lumificient. In the first quarter of 2013, the Company consolidated its Array Lighting division into Seesmart.
On March 8, 2013, Lighting Integration Technologies, LLC (“LIT”), a wholly owned subsidiary of the Company, acquired certain assets of Elite LED Solutions, Inc. (“Elite”). LIT is headquartered in Palm Beach Gardens, Florida.
On August 22, 2013 the Company purchased all the equity interests of Relume Technologies, Inc. (“Relume”) pursuant to the terms of the Agreement and Plan of Merger, dated as of August 9, 2013. Relume is headquartered in Oxford Township, Michigan.
On November 15, 2013 the Company completed the acquisition of Tri-State DE LLC (“Tri-State”), a distributor of Seesmart products. Tri-State is headquartered in Greenwich, Connecticut.
On April 17, 2014, the Company completed the acquisition of Value Lighting Inc. and certain of its affiliates (“Value Lighting”), a supplier of lighting solutions to the multifamily residential market. Value Lighting is headquartered in Marietta, Georgia with facilities in Marietta, Georgia; Dallas, Texas; Houston, Texas and Beltsville, Maryland.
Liquidity – At December 31, 2014, the Company had positive working capital of $18.8 million, compared to negative working capital at December 31, 2013 of $1.8 million. The improvement reflects our use of the new revolving credit facility described below, as well as loans from our controlling shareholder, RVL 1 LLC (“RVL”) and its affiliates as they continue to provide support to us.
While the Company generated negative cash flows from operations in 2014, it did achieve positive cash flows from operations in the fourth quarter of 2014, and the Company believes it has adequate resources to meet its cash requirements in the foreseeable future.
On December 1, 2014, we exchanged all outstanding series of preferred stock, including accrued but unpaid dividends thereon, to an aggregate of 36,300,171 shares of our unregistered common stock (the “Preferred Stock Exchange”). All rights relating to the preferred stock were extinguished as a result of this transaction, accordingly we have been relieved of the ongoing obligation to pay dividends on preferred stock.
48
Table of Contents
Additionally, during 2014 the Company entered into a loan and security agreement with Bank of America to borrow up to $25 million on a revolving basis, based upon specified percentages of eligible receivables and inventory. Borrowings under this facility aggregated $8.8 million at December 31, 2014. We are in compliance with our covenants and obligations under the facility, and we estimate that as of December 31, 2014 we are eligible to borrow an additional $4.5 million under the facility based upon current levels of inventory and accounts receivable (see Note 16).
Although we have realized revenues of approximately $76.8 million during the year ended December 31, 2014, we face challenges in order to achieve profitability, and there can be no assurance that we will achieve or sustain positive cash flows from operations or profitability. Our ability to meet our obligations in the ordinary course of business is dependent upon our ability to establish profitable operations, maintain our revolving credit facility, or raise additional capital through public or private debt or equity financing, or other sources of financing to fund operations, as well as support of our controlling stockholder. There can be no assurance such financing will be available on terms acceptable to us or that any financing transaction will not be dilutive to our current stockholders.
In addition, to accelerate the growth of our operations in response to new market opportunities or to acquire other technologies or businesses, we may need to raise additional capital. Additional capital may come from several sources, including the incurrence of indebtedness or the issuance of additional common stock, preferred stock, debt (whether convertible or not) or other securities. Increased indebtedness could negatively affect our liquidity and operating flexibility. The issuance of any additional securities could, among other things, result in substantial dilution of the percentage ownership of our stockholders at the time of issuance, result in substantial dilution of our earnings per share, and adversely affect the prevailing market price for our common stock. In addition, we may not be able to obtain additional financing on terms favorable to us, if at all. If additional funds become necessary and are not available on terms favorable to us, or at all, we may be unable to expand our business or pursue an acquisition and our business, results of operations and financial condition may be materially adversely affected.
Principles of consolidation – The consolidated financial statements include the accounts of Revolution Lighting Technologies, Inc. and its wholly owned subsidiaries. Significant inter-company accounts and transactions have been eliminated.
Use of estimates – The preparation of financial statements in conformity with accounting principles generally accepted in the United States of America requires management to make estimates and assumptions that affect the reported amounts of assets and liabilities, the disclosure of contingent assets and liabilities at the date of the financial statements and the reported amounts of revenues and expenses during the reporting period. The most significant estimates relate to revenue recognition, valuation of accounts receivable and inventories, warranty obligations, purchase price allocation of acquired businesses, impairment of long lived assets and goodwill, valuation of financial instruments, income taxes, and contingencies. Actual results could differ from those estimates.
Revenue recognition – The Company recognizes revenue for its products upon shipment or delivery to customers in accordance with the respective contractual arrangements, provided no significant obligations remain and collection is probable. For sales that include customer acceptance terms, revenue is recorded after customer acceptance. It is the Company’s policy that all sales are final. Requests for returns are reviewed on a case by case basis. As revenue is recorded, the Company accrues an estimated amount for product returns as a reduction of revenue.
The Company from time to time enters into multiple element arrangements, primarily the delivery of products and installation services. The Company allocates the sales value to each element based on its best estimate of the selling price and recognizes revenues in accordance with the relevant standard for each element.
The Company records sales tax revenue on a gross basis (included in revenues and costs). For the years ended December 31, 2014 and 2013, revenues from sales taxes were approximately $2,679,000 and $547,000, respectively. Prior to 2013, sales taxes were immaterial.
Warranties and product liability – The Company’s products typically carry a warranty that ranges from one to ten years and includes replacement of defective parts. A warranty reserve is recorded for the estimated costs associated with warranty expense related to recorded sales, which is included within accrued liabilities. Changes in the Company’s warranty liability for the years ended December 31, 2014, 2013 and 2012 are as follows:
| (in thousands) |
Year Ended December 31, | |||||||||||
| 2014 | 2013 | 2012 | ||||||||||
| Warranty liability at January 1, |
$ | 597 | $ | 346 | $ | 43 | ||||||
| Warranty liability assumed in acquisitions |
— | 101 | 303 | |||||||||
| Revision of warranty estimate |
(185 | ) | — | — | ||||||||
| Provisions for current year sales |
196 | 348 | 6 | |||||||||
| Current year claims |
(165 | ) | (198 | ) | (6 | ) | ||||||
|
|
|
|
|
|
|
|||||||
| Warranty liability at December 31, |
$ | 443 | $ | 597 | $ | 346 | ||||||
|
|
|
|
|
|
|
|||||||
49
Table of Contents
Fair value measurements – The Financial Accounting Standards Board (“FASB”) Accounting Standards Codification (“ASC”) 820 “Fair Value Measurements and Disclosures” (“ASC 820”) defines fair value as the exchange price that would be received for an asset or paid to transfer a liability (an exit price) in the principal or most advantageous market for the asset or liability in an orderly transaction between market participants on the measurement date. ASC 820 also establishes a fair value hierarchy which requires an entity to maximize the use of observable inputs and minimize the use of unobservable inputs when measuring fair value. The standard describes three levels of inputs that may be used to measure fair value:
Level 1 - Quoted prices in active markets for identical assets or liabilities.
Level 2 - Inputs other than quoted prices included within Level 1 that are either directly or indirectly observable.
Level 3 - Unobservable inputs that are supported by little or no market activity, therefore requiring an entity to develop its own assumptions about the assumptions that market participants would use in pricing.
Fair value estimates discussed herein are based upon certain market assumptions and pertinent information available to management as of December 31, 2014. The Company uses the market approach to measure fair value for its Level 1 financial assets and liabilities, which includes cash equivalents of $107,000 at December 31, 2014 and 2013. The market approach uses prices and other relevant information generated by market transactions involving identical or comparable assets or liabilities. The respective carrying value of certain balance sheet financial instruments approximates its fair value. These financial instruments include cash, trade receivables, related party payables, accounts payable, accrued liabilities and short-term borrowings. Fair values were estimated to approximate carrying values for these financial instruments since they are short term in nature and they are receivable or payable on demand.
The estimated fair value of assets and liabilities acquired in business combinations and reporting units and long-lived assets used in the related asset impairment tests utilize inputs classified as Level 3 in the fair value hierarchy. Based on the borrowing rates currently available to the Company for bank loans with similar terms and average maturities, the fair value of borrowings under our Revolving Credit facility are equal to the carrying value (see Note 16).
The Company determines the fair value of contingent consideration based on a probability-weighted discounted cash flow analysis. The fair value remeasurement is based on significant inputs not observable in the market and thus represents a Level 3 measurement as defined in the fair value hierarchy. In each period, the Company reassesses its current estimates of performance relative to the stated targets and adjusts the liability to fair value. Any such adjustments are included as a component of Selling, general and administrative expense in the Consolidated Statement of Operations.
| (in thousands) |
2014 | |||
| Fair value, January 1 |
$ | 960 | ||
| Fair value of contingent consideration issued during the period |
9,976 | |||
| Change in fair value |
1,419 | |||
|
|
|
|||
| Fair value, December 31 |
$ | 12,355 | ||
|
|
|
|||
The Company used Level 1 and Level 2 inputs to estimate the fair value of the embedded derivative related to the Series E preferred stock. The Company used Level 2 inputs to value the Series D convertible preferred stock taking into account a lack of marketability discount, as well as the market value of the common shares in which the preferred stock can be converted on the issuance date. Such inputs are also utilized to value contingent consideration related to acquisitions.
Derivative financial instruments – The Company does not use derivative instruments to hedge exposures to cash flow, market or foreign currency risk. Terms of convertible preferred stock and convertible promissory note instruments are reviewed to determine whether or not they contain embedded derivative instruments that are required to be accounted for separately from the host contract, and recorded on the balance sheet at fair value. The fair value of derivative liabilities is required to be revalued at each reporting date, with corresponding changes in fair value recorded in current period operating results.
50
Table of Contents
Freestanding warrants issued by the Company in connection with the issuance or sale of debt and equity instruments are considered to be derivative instruments, and are evaluated and accounted for in accordance with the provisions of ASC 815. Pursuant to ASC 815, an evaluation of specifically identified conditions is made to determine whether the fair value of warrants issued is required to be classified as equity or as a derivative liability.
Beneficial conversion and warrant valuation - In accordance with FASB ASC 470-20, “Debt with Conversion and Other Options” the Company records a beneficial conversion feature (“BCF”) related to the issuance of convertible debt or preferred stock instruments that have conversion features at fixed rates that are in-the-money when issued. The BCF for the convertible instruments is recognized and measured by allocating a portion of the proceeds equal to the intrinsic value of that feature to additional paid-in capital. The intrinsic value is generally calculated at the commitment date as the difference between the conversion price and the fair value of the common stock or other securities into which the security is convertible, multiplied by the number of shares into which the security is convertible. If certain other securities, such as warrants, are issued with the convertible security, the proceeds are allocated among the different components. The portion of the proceeds allocated to the convertible security is divided by the contractual number of the conversion shares to determine the effective conversion price, which is used to measure the BCF. The effective conversion price is used to compute the intrinsic value. The value of the BCF is limited to the basis that is initially allocated to the convertible security.
Cash equivalents – Temporary cash investments with an original maturity of three months or less are considered to be cash equivalents.
Accounts receivable – Accounts receivable are customer obligations due under normal trade terms. The Company performs periodic credit evaluations of its customers’ financial condition. The Company records an allowance for doubtful accounts based upon factors surrounding the credit risk of certain customers and specifically identified amounts that it believes to be uncollectible. Recovery of bad debt amounts previously written off is recorded as a reduction of bad debt expense in the period the payment is collected. If the Company’s actual collection experience changes, revisions to its allowance may be required. After all attempts to collect a receivable have failed, the receivable is written off against the allowance. The following summarizes the changes in the allowance for doubtful accounts for the periods indicated.
| (in thousands) |
||||||||||||
| 2014 | 2013 | 2012 | ||||||||||
| Allowance for doubtful accounts at January 1, |
$ | 210 | $ | 57 | $ | 53 | ||||||
| Additions |
350 | 170 | 17 | |||||||||
| Write-offs |
(452 | ) | (17 | ) | (13 | ) | ||||||
|
|
|
|
|
|
|
|||||||
| Allowance for doubtful accounts at December 31, |
$ | 108 | $ | 210 | $ | 57 | ||||||
|
|
|
|
|
|
|
|||||||
Inventories – Inventories are stated at the lower of cost (first-in, first-out) or market. A reserve is recorded for any inventory deemed excessive or obsolete.
Property and equipment – Property and equipment are stated at cost or fair value if acquired as part of a business combination. Depreciation is computed by the straight-line method and is charged to operations over the estimated useful lives of the assets. Maintenance and repairs are charged to expense as incurred. The carrying amount and accumulated depreciation of assets sold or retired are removed from the accounts in the year of disposal and any resulting gain or loss is included in results of operations. The estimated useful lives of property and equipment are as follows:
| Estimated useful lives | ||
| Machinery and equipment | 3-7 years | |
| Furniture and fixtures | 5-7 years | |
| Computers and software | 3-7 years | |
| Motor vehicles | 5 years | |
| Leasehold improvements | Lesser of lease term or estimated useful life |
Intangible assets and goodwill – Goodwill is not amortized, but is subject to annual impairment testing unless circumstances dictate more frequent assessments. The Company performs an annual impairment assessment for goodwill during the fourth quarter of each year and more frequently whenever events or changes in circumstances indicate that the fair value of the asset may be less than the carrying amount. Goodwill impairment testing is a two-step process performed at the reporting unit level. Step one compares the fair value of the reporting unit to its carrying amount. The fair value of the reporting unit is determined by considering both the income approach and market approaches. The fair values calculated under the income approach and market approaches are weighted based on circumstances surrounding the reporting unit. Under the income approach, the Company determines fair value based on estimated future cash flows of the reporting unit, which are discounted to the present
51
Table of Contents
value using discount factors that consider the timing and risk of cash flows. For the discount rate, the Company relies on the capital asset pricing model approach, which includes an assessment of the risk-free interest rate, the rate of return from publicly traded stocks, the Company’s risk relative to the overall market, the Company’s size and industry and other Company specific risks. Other significant assumptions used in the income approach include the terminal value, growth rates, future capital expenditures and changes in future working capital requirements. The market approaches use key multiples from guideline businesses that are comparable and are traded on a public market. If the fair value of the reporting unit is greater than its carrying amount, there is no impairment. If the reporting unit’s carrying amount exceeds its fair value, then the second step must be completed to measure the amount of impairment, if any. Step two calculates the implied fair value of goodwill by deducting the fair value of all tangible and intangible net assets of the reporting unit from the fair value of the reporting unit as calculated in step one. In this step, the fair value of the reporting unit is allocated to all of the reporting unit’s assets and liabilities in a hypothetical purchase price allocation as if the reporting unit had been acquired on that date. If the carrying amount of goodwill exceeds the implied fair value of goodwill, an impairment loss is recognized in an amount equal to the excess.
Determining the fair value of a reporting unit is judgmental in nature and requires the use of significant estimates and assumptions, including revenue growth rates, strategic plans and future market conditions, among others. There can be no assurance that the Company’s estimates and assumptions made for purposes of the goodwill impairment testing will prove to be accurate predictions of the future. Changes in assumptions and estimates could cause the Company to perform impairment test prior to scheduled annual impairment tests scheduled in the fourth quarter.
Long-lived assets – The Company evaluates the recoverability of its long-lived assets whenever events or changes in circumstances have indicated that an asset may not be recoverable. The long-lived asset is grouped with other assets at the lowest level for which identifiable cash flows are largely independent of the cash flows of other groups of assets and liabilities. If the sum of the projected undiscounted cash flows is less than the carrying value of the assets, the assets are written down to the estimated fair value.
Deferred rent – The Company accounts for certain operating leases containing predetermined fixed increases of the base rental rate during the lease term as rental expense on a straight-line basis over the lease term. The Company has reported the difference between the amounts charged to operations and amounts payable under the leases as a liability in the accompanying consolidated balance sheets.
Shipping and handling costs – Shipping and handling costs related to the acquisition of goods from vendors are included in cost of sales.
Research and development – Research and development costs to develop new products are charged to expense as incurred.
Advertising – Advertising costs, included in selling, general and administrative expenses, are expensed when the advertising first takes place. The Company promotes its product lines primarily through print media and trade shows, including trade publications, and promotional brochures. Advertising expenses were $300,000, $339,000 and $171,000 for the years ended December 31, 2014, 2013 and 2012, respectively.
Income taxes – Income taxes are provided for the tax effects of transactions reported in the financial statements and consist of taxes currently due plus deferred taxes resulting from temporary differences. Such temporary differences result from differences in the carrying value of assets and liabilities for tax and financial reporting purposes. The deferred tax assets and liabilities represent the future tax consequences of those differences, which will either be taxable or deductible when the assets and liabilities are recovered or settled. Valuation allowances are established when necessary to reduce deferred tax assets to the amount expected to be realized.
The Company applies the provisions of FASB ASC 740-10, “Accounting for “Uncertainty in Income Taxes”, and has not recognized a liability pursuant to that standard. In addition, a reconciliation of the beginning and ending amount of unrecognized tax benefits has not been provided since there are no unrecognized benefits since the date of adoption. If there were an unrecognized tax benefit, the Company would recognize interest accrued related to unrecognized tax benefits in interest expense and penalties in operating expenses.
The Company evaluates the adequacy of the valuation allowance annually and, if its assessment of whether it is more likely than not that the related tax benefits will be realized changes, the valuation allowance will be increased or reduced with a corresponding benefit or charge included in income. Management evaluated the adequacy of the valuation allowance at December 31, 2013 in light of the historical results of operations and concluded that full valuation allowance for net deferred tax assets was required. In connection with the acquisitions in 2014, we recorded deferred tax liabilities of approximately $6.6 million. These net deferred tax liabilities can be used to reduce net deferred tax assets, accordingly we reduced our valuation allowance by this amount.
52
Table of Contents
No provision for income taxes has been recorded for the years ended December 31, 2013 and 2012 since the tax benefits of the losses incurred have been offset by a corresponding increase in the deferred tax valuation allowance.
Stock-based compensation – The Company recognizes the cost of employee or director services received in exchange for an award of equity instruments in the financial statements, which is measured based on the grant date fair value of the award. Stock-based compensation expense is recognized over the period during which an employee is required to provide service in exchange for the award (typically, the vesting period).
The Company values restricted stock awards to employees at the quoted market price on the grant date. The Company estimates the fair value of option awards issued under its stock option plans on the date of grant using a Black-Scholes option-pricing model that uses the assumptions noted below. The Company estimates the volatility of its common stock at the date of grant based on the historical volatility of its common stock. The Company determines the expected life based on historical experience with similar awards, giving consideration to the contractual terms, vesting schedules and post-vesting forfeitures. For shares that vest contingent upon achievement of certain performance criteria, an estimate of the probability of achievement is applied in the estimate of fair value. If the goals are not met, no compensation cost is recognized and any previously recognized compensation cost is reversed. The Company bases the risk-free interest rate on the implied yield currently available on U.S. Treasury issues with an equivalent remaining term approximately equal to the expected life of the award. The Company has never paid any cash dividends on its common stock and does not anticipate paying any cash dividends in the foreseeable future. For the years ended December 31, 2014 and 2012, the Company computed expense for each group utilizing the following assumptions:
| Years Ended December 31, | ||||||||
| 2014 | 2013 | 2012 | ||||||
| Expected volatility |
94.2% | — | 75.8% - 118.6% | |||||
| Weighted-average volatility |
94.2% | — | 78.1% | |||||
| Risk-free interest rate |
1.64% | — | 0.3% - 0.9% | |||||
| Expected dividend yield |
0% | — | 0% | |||||
| Expected life in years |
3.5 – 8.6 | — | 3.5 - 8.6 | |||||
The Company from time to time enters into arrangements with non-employee service providers pursuant to which it issues restricted stock vesting over specified periods for time-based services. These arrangements are accounted for under the provisions of FASB ASC 505-50 “Equity-Based Payments to Non-Employees”. Pursuant to this standard, the restricted stock is valued at the quoted price at the date of vesting. Prior to vesting, compensation is recorded on a cumulative basis based on the quoted market price at the end of the reporting period.
Loss per share – Basic loss per share is computed by dividing net loss attributable to common stockholders by the weighted average common shares outstanding for the period. Diluted loss per share is computed giving effect to all potentially dilutive common shares. Potentially dilutive common shares consist of incremental shares issuable upon the exercise of stock options and vesting of restricted shares and the conversion of outstanding convertible securities. In periods in which a net loss has been incurred, all potentially dilutive common shares are considered anti-dilutive and —thus are excluded from the calculation.
In connection with the 2014 acquisitions (see Note 2), the Company is unconditionally obligated to issue an additional 8,035,826 shares of its common stock during 2015, 2016 and 2017. These shares have been included in the 2014 computation of basic and diluted earnings per share. Also in connection with the 2014 acquisitions, the Company is contingently obligated to pay up to $11.7 million, or at its option, an equivalent amount of common shares based upon its then-current market value, if certain performance criteria have been met. These shares have been excluded from the 2014 computation of diluted earnings per share because the effect would be antidilutive.
At December 31, 2013 and 2012, 20,232,230 and 17,314,926 common shares, respectively, were issuable pursuant to convertible securities, and were not included in the computation of loss per share at December 31, 2013 and 2012 because the effect would have been anti-dilutive.
The Preferred Stock Exchange has been accounted for as provided in ASC S99-2, which states that in such an extinguishment of preferred stock, the difference between (1) the fair value of the consideration transferred to the holders of the preferred stock and (2) the carrying amount of the preferred stock in the Company’s balance sheet, should be reflected in a manner similar to a dividend on preferred stock and subtracted from net income to arrive at income attributable to common shareholders in the calculation of earnings per share. Under this method, $5.3 million has been included in Net loss attributable to common stockholders for the year ended December 31, 2014.
53
Table of Contents
Contingencies — In the ordinary course of business, the Company may become a party to various legal proceedings generally involving contractual matters, infringement actions, product liability claims and other matters. The Company evaluates such matters in accordance with the criteria set forth in Accounting Standards Codification 450. Based upon such evaluation, at December 31, 2014 the Company is not a party to any pending legal proceedings which it believes to be material.
Recent accounting pronouncements — In May 2014, the Financial Accounting Standards Board issued the standard “Revenue from Contracts with Customers” which supersedes existing revenue recognition standards including most industry-specific revenue recognition guidance. The standard is effective for annual periods beginning after December 31, 2016. Early adoption is not permitted. At this time, the Company has not determined the effect that this accounting pronouncement will have on its financial statements.
In June 2014, the FASB issued guidance that requires a performance target in a share-based payment that affects vesting and that could be achieved after the requisite service period be accounted for as a performance condition. The guidance is effective for annual periods beginning after December 15, 2015 and interim periods within the year, and early adoption is permitted. The guidance should be applied on a prospective basis to awards that are granted or modified on or after the effective date. The guidance may be applied on a modified retrospective basis for performance targets outstanding on or after the beginning of the first annual period presented as of the date of adoption. The Company does not expect to grant these type of awards, but will adopt this guidance on January 1, 2016 and will apply it prospectively to any awards granted on or after January 1, 2016 that include these terms.
In August 2014, the FASB issued ASU No. 2014-15 (“ASU 2014-15”), Presentation of Financial Statements—Going Concern (Subtopic 205-40): Disclosure of Uncertainties about an Entity’s Ability to Continue as a Going Concern. This ASU requires management to assess and evaluate whether conditions or events exist, considered in the aggregate, that raise substantial doubt about the entity’s ability to continue as a going concern within one year after the financial statements issue date. The provisions of ASU 2014-15 are effective for annual periods beginning after December 15, 2016 and for annual and interim periods thereafter; early adoption is permitted. The adoption of ASU 2014-15 is not expected to have a material effect on our consolidated financial statements.
In January 2015, the FASB issued ASU No. 2015-01, Income Statement – Extraordinary and Unusual Items (Subtopic 225-20), which eliminates the accounting concept of extraordinary items for periods beginning after December 15, 2015. The adoption of this ASU is not expected to have a material effect on our consolidated financial statements.
| 2. | Acquisitions: |
Value Lighting - On April 17, 2014, the Company completed the acquisition of Value Lighting, a supplier of lighting solutions to the multifamily residential market. The purchase consideration aggregated $39.3 million and consisted of cash of $10.6 million funded with a loan from an affiliate, an unconditional obligation to issue an aggregate of 8,468,192 shares of common stock in four installments at six, twelve, eighteen and twenty-four months from the acquisition date, valued at $20.9 million, and contingent consideration payable in cash or common stock at the option of the Company aggregating up to a total of $11 million, valued at $7.8 million, if certain revenue and EBITDA targets are achieved by Value Lighting during 2014 and 2015. The purchase price has been reduced by $0.1 million based on the closing working capital. The Company acquired Value Lighting for its presence in the multifamily residential and construction markets, the experience of the management team, its customer base, operational and business development synergies.
54
Table of Contents
The following amounts represent the determination of the fair value of identifiable assets acquired and liabilities assumed from the Value Lighting acquisition. The excess of the purchase price over the estimated fair value of the net tangible assets acquired was allocated to intangible assets of approximately $20.0 million and goodwill of approximately $18.6 million.
| (in thousands) |
||||
| Cash |
$ | 35 | ||
| Accounts receivable |
8,720 | |||
| Inventory |
7,505 | |||
| Goodwill |
18,635 | |||
| Customer relationships |
12,270 | |||
| Trade names |
4,800 | |||
| Backlog |
2,505 | |||
| Non-compete agreements |
260 | |||
| Other intangibles |
116 | |||
| Other assets |
2,901 | |||
|
|
|
|||
| Assets acquired |
57,747 | |||
|
|
|
|||
| Accounts payable |
8,683 | |||
| Accrued liabilities |
1,383 | |||
| Other current liabilities |
1,362 | |||
| Other liabilities |
1,185 | |||
| Deferred income tax liability |
5,825 | |||
|
|
|
|||
| Liabilities assumed |
18,438 | |||
|
|
|
|||
| Purchase price |
$ | 39,309 | ||
|
|
|
|||
55
Table of Contents
The acquired intangibles are being amortized consistent with the period the underlying cash flows are generated. All of the goodwill is included in the Lighting Fixtures and Lamps reportable segment. Goodwill is not expected to be deductible for income tax purposes.
Other - On December 18, 2014, the company acquired All Around Lighting, Inc., a supplier of lighting fixtures, for $5.0 million. The purchase price consists of $0.9 million cash, 1,600,000 unregistered shares of the Company’s restricted common stock, and additional cash consideration if certain revenue targets are achieved in 2015 and 2016 (preliminarily valued at $0.3 million). The unregistered shares of restricted common stock have been valued at $1.8 million, and will be issued in eleven installments beginning in May 2015. The shares are subject to a price floor of $2.00 per share (preliminarily valued at $1.9 million), which will terminate when total share consideration received is equal to $3.2 million. The aggregate purchase price of $5.0 million has been preliminarily allocated to $1.7 million of tangible assets, $2.2 million of identifiable intangible assets and $2.8 million of goodwill, reduced by $1.7 million of liabilities assumed. The acquired intangibles are being amortized consistent with the period the underlying cash flows are generated. All of the goodwill is included in the Lighting Fixtures and Lamps reportable segment. Goodwill is not expected to be deductible for income tax purposes. The final determination of the fair value of certain assets and liabilities including income taxes and contingencies will be completed within the one-year measurement period from the date of acquisition as required by ASC Topic 805, “Business Combinations.”
Tri-State – On November 15, 2013, the Company completed the acquisition of Tri-State, a distributor of Seesmart products, for cash at closing of approximately $1.8 million (including a working capital adjustment), an obligation to pay an additional $1.5 million in cash in six months bearing interest at 5% annually, 543,052 shares of common stock valued at approximately $1.6 million, of which one half were issued at closing and an obligation to issue up to 365,628 additional shares contingent on Tri-State achieving specified revenue targets within one year following the acquisition date which has been valued at approximately $0.9 million. Under the terms of the agreement the Company acquired Tri-State debt free and cash free. The Company acquired Tri-State for its management team, its client base in New York, New Jersey and Connecticut and operational and business development synergies. The purchase price exceeds the fair value of the tangible assets acquired and reflects the expected growth of the business.
The following amounts represent the determination of the fair value of identifiable assets acquired and liabilities assumed from the Tri-State acquisition.
| (in thousands) |
||||
| Accounts receivable |
$ | 468 | ||
| Inventory |
310 | |||
| Goodwill |
2,786 | |||
| Customer relationships |
1,680 | |||
| Non-compete agreements |
480 | |||
| Other intangibles |
738 | |||
| Other assets |
38 | |||
|
|
|
|||
| Assets acquired |
6,500 | |||
|
|
|
|||
| Accounts payable |
440 | |||
| Accrued liabilities |
208 | |||
| Other current liabilities |
80 | |||
|
|
|
|||
| Liabilities assumed |
728 | |||
|
|
|
|||
| Purchase price |
$ | 5,772 | ||
|
|
|
|||
The acquired intangibles are being amortized consistent with the period the underlying cash flows are generated. All of the goodwill is included in the Lighting Fixtures and Lamps reportable segment. Goodwill is expected to be deductible for income tax purposes. Goodwill was retroactively adjusted by $25,000 to reflect a working capital adjustment finalized in 2014.
Relume – On August 22, 2013 the Company purchased all the equity interests of Relume pursuant to the terms of the Agreement and Plan of Merger, dated as of August 9, 2013 (the “Relume Merger Agreement”) for $5.0 million in cash (approximately $4.3 million net of an estimated working capital adjustment) and 2,174,000 shares of common stock valued at approximately $7.3 million based on the market price of the Company’s stock on the closing date. The consideration paid is subject to further adjustment to the extent that the working capital (as defined in the Relume Merger Agreement) differs from the amount specified in the agreement. The amount of such adjustment has not been finalized. The cash portion of the purchase consideration was funded from the proceeds of the issuance of Series F Senior Convertible Redeemable Preferred Stock (the “Series F Preferred Stock”) to RVL for $5.0 million in cash, of which approximately $0.7 million was retained for working capital purposes. Under the terms of the Relume Merger Agreement, the Company acquired the Relume business debt free, except for capital lease obligations.
56
Table of Contents
The following amounts represent the determination of the fair value of identifiable assets acquired and liabilities assumed from the Relume acquisition.
| (in thousands) |
||||
| Cash |
$ | 61 | ||
| Accounts receivable |
851 | |||
| Inventory |
1,935 | |||
| Goodwill |
8,624 | |||
| Technology |
2,020 | |||
| Trademarks |
1,200 | |||
| Customer relationships |
680 | |||
| Other assets |
838 | |||
|
|
|
|||
| Assets acquired |
16,209 | |||
|
|
|
|||
| Accounts payable |
2,574 | |||
| Accrued liabilities |
1,891 | |||
| Other current liabilities |
26 | |||
| Capital lease obligations |
110 | |||
|
|
|
|||
| Liabilities assumed |
4,601 | |||
|
|
|
|||
| Purchase price |
$ | 11,608 | ||
|
|
|
|||
All of the goodwill is included in the Lighting Fixtures and Lamps reportable segment. None of the goodwill is expected to be deductible for income tax purposes. Goodwill was retroactively adjusted in 2014 by $454,000 to reflect a provision for unfavorable firm purchase commitments for inventory components.
Elite – On March 8, 2013, LIT, a wholly owned subsidiary of the Company, acquired certain assets of Elite LED Solutions (“Elite”) for $500,000 in cash, and 300,000 shares of the Company’s common stock, valued at $356,250, contingent on certain performance criteria that ultimately were not fulfilled. Concurrently, the Company entered into a five-year sales consulting agreement with the principals of the sellers pursuant to which the Company is obligated to pay a $20,000 monthly fee, additional fees based on achieving specified operational targets, and 850,000 shares of the Company’s common stock, which were to vest over the five-year term of the agreement.
The transaction has been accounted for as a business combination and the issuance of the common shares vesting over five years was to have been accounted for as compensation pursuant to ASC 505-50 “Equity-Based Payments to Non-Employees.” The following summarizes the purchase price allocation to the acquired assets:
| (in thousands) |
||||
| Customer revenue contracts |
$ | 1,599 | ||
| Gain on bargain purchase |
(743 | ) | ||
|
|
|
|||
| Purchase price |
$ | 856 | ||
|
|
|
|||
The Company acquired the business primarily for the unfulfilled customer revenue contracts acquired and the estimated operating synergies expected to be realized with Seesmart. The Company amortized the acquired contracts over the periods of the cash flows that they generated. Substantially all the contracts were amortized in 2013.
On October 9, 2013 the Company notified Elite of the termination of the sales consulting agreement and, accordingly, cancelled the 850,000 unvested shares of common stock. As a result, no stock-based compensation expense has been recognized related to these shares.
Seesmart – On December 20, 2012, the Company purchased all the equity interests of Seesmart pursuant to the terms of the Seesmart Merger Agreement (the “Agreement”), dated as of December 1, 2012 , for consideration of approximately $10.1 million in cash funded by the issuance of shares of Series C Senior Convertible Preferred Stock (the “Series C Preferred Stock”), approximately 7.7 million shares of common stock valued at approximately $5.0 million and 11,915 shares of Series D Preferred Stock, valued at approximately $1.0 million. A working capital adjustment reduced the purchase price by approximately $1.2 million, which has been reflected in the financial statements as a reduction of goodwill. As described below, the Company settled outstanding convertible note obligations of Seesmart, which resulted in a total purchase price of $18.3 million for the enterprise value of the business. In accordance with the relevant accounting standard, the Company’s December 31, 2012 balance sheet has been retroactively adjusted to reduce goodwill and the Seesmart purchase price obligations liability by approximately $1.3 million.
Under the Agreement, the Company was required to distribute additional consideration to Seesmart shareholders. During the year ended December 31, 2013, the Company issued 738 shares of Series D Preferred Stock and 1,992,996 shares of common stock and paid approximately $3.5 million in cash.
57
Table of Contents
On the acquisition date, Seesmart had outstanding convertible notes payable. In accordance with the terms of the notes, they were converted into the right to receive cash equal to the principal, a 20% premium on the principal, plus accrued interest. On the acquisition date, the Company’s cash obligation totaled approximately $3.4 million. During the first quarter of 2013, holders representing approximately $1 million of the cash obligation elected to receive a total of 1,479,947 shares of common stock. The remaining holders elected to be paid in cash and received approximately $2.4 million. The Seesmart convertible notes payable were completely extinguished during the first quarter of 2013.
The following amounts represent the final determination of the fair value of identifiable assets acquired and liabilities assumed from the Seesmart acquisition.
| (in thousands) |
||||
| Cash |
$ | 69 | ||
| Accounts receivable |
1,048 | |||
| Inventory |
1,352 | |||
| Goodwill |
10,166 | |||
| Customer relationships |
7,273 | |||
| Trademarks |
3,434 | |||
| Other assets |
334 | |||
|
|
|
|||
| Assets acquired |
23,676 | |||
|
|
|
|||
| Accounts payable |
2,692 | |||
| Accrued liabilities |
1,137 | |||
| Deferred revenue |
104 | |||
| Customer deposits |
1,467 | |||
|
|
|
|||
| Liabilities assumed |
5,400 | |||
|
|
|
|||
| Purchase price |
$ | 18,276 | ||
|
|
|
|||
All the goodwill is included in the Lighting Fixtures and Lamps reportable segment. None of the goodwill is expected to be deductible for income tax purposes.
Pro forma information. The following unaudited supplemental proforma information assumes the 2014 and 2013 acquisitions referred to above had been completed as of January 1, 2013 and is not indicative of the results of operations that would have been achieved had the transactions been consummated on such date or of results that might be achieved in the future.
| (in thousands) |
Year Ended December 31, 2014 |
Year Ended December 31, 2013 |
||||||
| Revenues |
$ | 96,190 | $ | 84,584 | ||||
| Operating loss |
$ | (9,837 | ) | $ | (13,709 | ) | ||
| Net Loss |
$ | (4,393 | ) | $ | (20,992 | ) | ||
The pro forma operating loss and net loss also reflect the following charges and credits directly attributable to the acquisitions:
| (in thousands) |
Year Ended December 31, 2014 |
Year Ended December 31, 2013 |
||||||
| Recorded by Company: |
||||||||
| Gain on bargain purchase of business |
$ | — | $ | 743 | ||||
| Recorded by Relume pre-acquisition: |
||||||||
| Fees incurred by the sellers |
— | (350 | ) | |||||
| Change in control payment from sellers to management |
— | (737 | ) | |||||
| Loss on settlement of debt from proceeds of merger |
— | (4,157 | ) | |||||
| Gain on deconsolidation of subsidiary in bankruptcy proceedings |
— | 1,573 | ||||||
| Recorded by Value Lighting pre-acquisition: |
||||||||
| Fee paid by sellers in connection with the transaction |
(528 | ) | — | |||||
| Pro Forma charge for amortization of the intangible assets related to acquired backlog, not expected to recur after the first year following the year of acquisition |
— | (2,370 | ) | |||||
|
|
|
|
|
|||||
| $ | (528 | ) | $ | (5,298 | ) | |||
|
|
|
|
|
|||||
58
Table of Contents
The pro forma loss from continuing operations and net loss for the year ended December 31, 2013 reflect a charge of $7.0 million representing the change in fair value of embedded derivative, which is included in the historical results of the Company and not directly attributed to the acquisitions.
The revenue of the 2014 acquisitions, included in our 2014 actual results operations from their respective acquisition dates through December 31, 2014 totaled $46.2 million. The net income of the 2014 acquisitions, included in our 2014 actual results of operations, from their respective acquisition dates through December 31, 2014 totaled $1.6 million.
The revenue of the 2013 acquisitions, included in our 2013 actual results operations from their respective acquisition dates through December 31, 2013 totaled $15.3 million. The net income of the 2013 acquisitions, included in our 2013 actual results of operations, from their respective acquisition dates through December 31, 2013 totaled $0.4 million.
| 3. | Inventories: |
Inventories, which are primarily purchased from third parties, consist of the following:
| (in thousands) |
December 31, | |||||||
| 2014 | 2013 | |||||||
| Raw materials |
$ | 3,895 | $ | 4,450 | ||||
| Finished goods |
11,447 | 2,227 | ||||||
|
|
|
|
|
|||||
| 15,342 | 6,677 | |||||||
| Less provision for obsolescence |
(1,669 | ) | (1,708 | ) | ||||
|
|
|
|
|
|||||
| Net inventories |
$ | 13,673 | $ | 4,969 | ||||
|
|
|
|
|
|||||
| (in thousands) |
Year Ended December 31, | |||||||||||
| 2014 | 2013 | 2012 | ||||||||||
| Inventory reserve at January 1, |
$ | 1,708 | $ | 1,669 | $ | 895 | ||||||
| Additions |
179 | 1,644 | 1,346 | |||||||||
| Write offs |
(218 | ) | (1,605 | ) | (572 | ) | ||||||
|
|
|
|
|
|
|
|||||||
| Inventory Reserve at December 31, |
$ | 1,669 | $ | 1,708 | $ | 1,669 | ||||||
|
|
|
|
|
|
|
|||||||
The Company terminated its relationship with Seesmart’s logistics supplier in 2013. All related inventories were returned to Seesmart during March 2013.
During 2012, as a result of deteriorating market conditions and aggressive pricing by competitors, the Company experienced a decrease in market price for certain Array products in its LED replacement lamps and fixtures segment. For the year ended December 31, 2012, the Company recorded a reserve for obsolete inventory of $387,000 due to this decrease in market price. In 2013 certain of these inventories were written off.
59
Table of Contents
| 4. | Intangible Assets: |
At December 31, 2014, the Company had the following intangible assets subject to amortization:
| (in thousands) |
Gross Carrying Amount |
Accumulated Amortization |
Net Carrying Amount |
|||||||||
| Patents |
$ | 268 | $ | (153 | ) | $ | 115 | |||||
| Trade names |
11,358 | (1,280 | ) | 10,078 | ||||||||
| Customer relationships |
24,455 | (2,942 | ) | 21,513 | ||||||||
| Customer contracts |
1,877 | (1,669 | ) | 208 | ||||||||
| Technology |
1,953 | (196 | ) | 1,757 | ||||||||
| Favorable leases |
334 | (64 | ) | 270 | ||||||||
| Non-compete agreements |
740 | (151 | ) | 589 | ||||||||
| Backlog |
2,619 | (2,369 | ) | 250 | ||||||||
| Product certification and licensing costs |
61 | (57 | ) | 4 | ||||||||
|
|
|
|
|
|
|
|||||||
| $ | 43,665 | $ | (8,881 | ) | $ | 34,784 | ||||||
|
|
|
|
|
|
|
|||||||
At December 31, 2013, the Company had the following intangible assets subject to amortization:
| (in thousands) |
||||||||||||
| Gross Carrying Amount |
Accumulated Amortization |
Net Carrying Amount |
||||||||||
| Patents |
$ | 268 | $ | (130 | ) | $ | 138 | |||||
| Trade names |
6,034 | (615 | ) | 5,419 | ||||||||
| Customer relationships |
10,643 | (1,248 | ) | 9,395 | ||||||||
| Customer contracts |
1,877 | (1,613 | ) | 264 | ||||||||
| Technology |
2,020 | (67 | ) | 1,953 | ||||||||
| Favorable lease |
218 | (3 | ) | 215 | ||||||||
| Non-compete agreements |
480 | (10 | ) | 470 | ||||||||
| Product certification and licensing costs |
61 | (46 | ) | 15 | ||||||||
|
|
|
|
|
|
|
|||||||
| $ | 21,601 | $ | (3,732 | ) | $ | 17,869 | ||||||
|
|
|
|
|
|
|
|||||||
Intangibles are amortized using the straight-line method over their estimated useful lives. Amortization expense during the years ended December 31, 2014, 2013 and 2012 is as follows:
| (in thousands) |
Estimated useful life |
2014 | 2013 | 2012 | ||||||||||
| Patents and trade names |
12 to 17 years | $ | 688 | $ | 388 | $ | 109 | |||||||
| Customer relationships |
10 to 15 years | 1,694 | 761 | 116 | ||||||||||
| Customer contracts |
1 to 3 years | 56 | 1,613 | — | ||||||||||
| Technology |
10 years | 129 | 67 | — | ||||||||||
| Favorable Leases |
10 years | 61 | 3 | — | ||||||||||
| Non-compete agreement |
6 years | 141 | 10 | — | ||||||||||
| Backlog |
1 year | 2,369 | — | — | ||||||||||
| Product certification and licensing costs |
3 years | 11 | 17 | 41 | ||||||||||
|
|
|
|
|
|
|
|||||||||
| Total |
$ | 5,149 | $ | 2,859 | $ | 266 | ||||||||
|
|
|
|
|
|
|
|||||||||
During 2012, as a result of our then-deteriorating business and significantly reduced market value, the Company performed impairment tests on long-lived assets as prescribed by Accounting Standards Codification Section 360 (“ASC 360), and determined that the carrying amounts of assets in the Company’s LED replacement lamps and fixtures asset group were not recoverable. In accordance with ASC 360, we recorded impairment charges aggregating $1.0 million on intangible assets, $0.4 million on property and equipment, and $0.02 million on additional intangible assets included in our corporate business unit. Amortization expense on intangible assets for the next five years is estimated as follows:
| (in thousands) |
2015 | 2016 | 2017 | 2018 | 2019 | |||||||||||||||
| Patents |
$ | 23 | $ | 23 | $ | 23 | $ | 23 | $ | 22 | ||||||||||
| Trade names |
815 | 815 | 815 | 815 | 815 | |||||||||||||||
| Customer relationships |
1,971 | 1,971 | 1,971 | 1,903 | 1,869 | |||||||||||||||
| Customer contracts |
56 | 56 | 56 | 42 | — | |||||||||||||||
| Technology |
195 | 195 | 195 | 195 | 195 | |||||||||||||||
| Favorable Leases |
74 | 45 | 22 | 22 | 22 | |||||||||||||||
| Non-compete agreement |
167 | 167 | 105 | 80 | 70 | |||||||||||||||
| Backlog |
250 | |||||||||||||||||||
| Product certification and licensing costs |
4 | — | — | — | — | |||||||||||||||
|
|
|
|
|
|
|
|
|
|
|
|||||||||||
| Total |
$ | 3,555 | $ | 3,272 | $ | 3,187 | $ | 3,080 | $ | 2,993 | ||||||||||
|
|
|
|
|
|
|
|
|
|
|
|||||||||||
60
Table of Contents
| 5. | Goodwill: |
The changes in the carrying amount of goodwill for the years ended December 31, 2014 and 2013 are presented below. Goodwill acquired during the year ended December 31, 2013 has been retroactively adjusted by approximately $430,000 as a result of the finalization of the Tri-State and Relume purchase price allocations (see Note 2).
| (in thousands) |
Lighting Fixtures and Lamps |
Lighting Signage and Media |
Total | |||||||||
| Balance, January 1, 2013 |
$ | 10,166 | $ | — | $ | 10,166 | ||||||
| Acquisitions |
11,332 | — | 11.332 | |||||||||
|
|
|
|
|
|
|
|||||||
| Balance, December 31, 2013 |
21,498 | — | 21,498 | |||||||||
| Acquisitions |
21,493 | — | 21,493 | |||||||||
| Transfer of Relume’s Media business |
(1,463 | ) | 1,463 | — | ||||||||
|
|
|
|
|
|
|
|||||||
| Balance, December 31, 2014 |
$ | 41,528 | $ | 1,463 | $ | 42,991 | ||||||
|
|
|
|
|
|
|
|||||||
| Accumulated Balances: |
||||||||||||
| Goodwill |
$ | 43,517 | $ | 1,870 | $ | 45,387 | ||||||
| Accumulated impairment losses |
(1,989 | ) | (407 | ) | (2,396 | ) | ||||||
|
|
|
|
|
|
|
|||||||
| Balance, December 31, 2014 |
$ | 41,528 | $ | 1,463 | $ | 42,991 | ||||||
|
|
|
|
|
|
|
|||||||
During 2012, as a result of the Company’s then-deteriorating business and significantly reduced market value, the Company performed impairment tests as prescribed by ASC 350. As a result, our Lighting Fixtures and Lamps segment recorded a goodwill impairment charge totaling $1,989,000.
During the fourth quarter of 2014, the Company performed step one of the impairment testing as described in Note 1 for each of its reporting units, which indicated the fair value of the reporting units exceeded the net carrying amount of the net assets of the reporting units. Accordingly, step two was not performed.
| 6. | Convertible Promissory Notes |
On September 25, 2012, the Company extinguished $2,400,000 principal amount of outstanding convertible promissory notes in exchange for $880,000 in cash and 1,000,000 newly-issued shares of the Company’s common stock. The Company accounted for this transaction as a troubled debt restructuring in accordance with Accounting Standards Codification 470-60, “Troubled Debt Restructurings by Debtors”. The Company recognized a gain on debt restructuring of $1,048,000, or $0.05 per share, representing the excess of the carrying amount of the notes and accrued interest thereon, over the fair value of the cash and common stock issued.
Also in September 2012, certain accounts payable vendors and service providers agreed to accept payments less than the outstanding balance owed to them. For the year ended December 31, 2012, the Company recognized a gain from vendor concessions of $154,000 which is included in selling, general and administrative expense and caused basic and diluted loss per share for the year ended December 31, 2012 to decrease by $0.01.
61
Table of Contents
| 7. | Common Stock Transactions: |
As of December 31, 2014, the Company had approximately 129.7 million shares of its common stock outstanding, of which approximately 84.3 million shares, or 65%, were constructively owned by RVL and its affiliates.
On December 1, 2014 the Company completed an underwritten public offering of 8 million shares of its common stock, at an offering price of $1.25. Net proceeds of the offering approximated $8.6 million, which was used for general corporate purposes.
Also on December 1, 2014, the Company completed the Preferred Stock Exchange, in which the Company exchanged all outstanding preferred stock, including accrued but unpaid dividends thereon, for 36,300,171 shares of unregistered common stock. All rights relating to the preferred stock were extinguished as a result of this transaction, and at December 31, 2014 the Company has no outstanding preferred stock. See Note 8 for additional information.
On May 15, 2013, all outstanding shares of Series D Preferred Stock, aggregating 11,915 shares, were automatically converted into 1,712,167 shares of common stock at a conversion price per share equal to $0.6959. See Note 8 for additional information.
On April 9, 2013 the Company entered into a Management Services Agreement (the “Management Agreement”) with Aston, an affiliate of RVL, under which Aston provides consulting services in connection with financing matters, budgeting, strategic planning and business development. In consideration of the services provided, the Company issued 500,000 shares of restricted common stock to Aston, vesting in three equal annual increments, with the first such vesting date being September 25, 2013.
On April 21, 2014, the Company granted an additional 300,000 shares of restricted stock to Aston pursuant to the Management Agreement, which vest in three annual installments with the first such vesting date being September 25, 2014. The Audit Committee of the Board will consider from time to time (at a minimum at such times when the Compensation Committee of the Board evaluates director compensation) whether additional compensation to Aston is appropriate given the nature of the services provided.
On March 8, 2013, the Company entered into an investment agreement with Great American Insurance Company and Great American Life Insurance Company (collectively, the “Investors”), each a wholly owned subsidiary of American Financial Group, Inc. The Company issued to each Investor (i) 2,136,752 shares of the Company’s common stock and (ii) the right to receive an aggregate of up to an additional 1,250,000 shares of common stock (such number of shares is the maximum number issuable to both Investors in the aggregate) for cash of $2.5 million each, for a total investment of $5 million. The proceeds from the investment are to be used for general corporate and working capital purposes. In connection with the investment, the Company paid $100,000 in cash and issued 42,735 shares of common stock as a finder’s fee for the transaction.
Stock warrants – The Company has granted a 10-year warrant (“Kingstone Warrants”) for 289,187 shares of common stock at an exercise price of $4.30 per share to Brett Kingstone. Mr. Kingstone was the Chief Executive Officer of the Company until December 31, 2005 and was the Chairman of the Board of the Company until March 11, 2009. The warrant was granted on September 9, 2005.
At December 31, 2014, the Company has reserved common stock for issuance in relation to the following:
| Employee stock options and restricted stock |
1,429,881 | |||
| Shares subject to warrants |
289,187 | |||
| Shares to be issued for acquisitions |
8,307,398 | |||
|
|
|
|||
| Total reserved shares |
10,026,466 | |||
|
|
|
|||
62
Table of Contents
| 8. | Preferred Stock |
The Company is authorized to issue up to 5,000,000 shares of preferred stock.
As a result of the Preferred Stock Exchange, all rights relating to the preferred stock were extinguished, and at December 31, 2014 the Company has no outstanding preferred stock.
Series A Preferred Stock—The Company has designated 3,000 shares of preferred stock as Series A Preferred Stock.
The Series A preferred stock has been eliminated and there were no shares of Series A preferred stock issued and outstanding during any of the years presented.
Series B Convertible Preferred Stock – The Company has designated 1,000,000 shares of preferred stock as Series B Convertible Preferred Stock, par value $0.001 per share (the “Series B Preferred Stock”).
On September 25, 2012, the Company issued to RVL 600,000 shares of Series B Preferred Stock in exchange for $6 million. The net proceeds of $5,195,000 were used to retire debt, to fund a settlement of certain litigation, and for working capital purposes. The Series B Preferred Stock was convertible into shares of the Company’s common stock at a conversion price per share equal to $0.13, subject to certain anti-dilution adjustments. After giving effect to the conversion feature of the Series B Preferred Stock and the other transactions, RVL owned 46,153,846 as-converted shares of common stock, or approximately 73% of the Company, which represented a change in control of the Company. RVL was entitled to vote the Series B Preferred Stock on an as-converted basis with the Company’s common stock. During the fourth quarter of 2012, RVL converted 599,998 shares of Series B Preferred Stock into 46,153,692 shares of common stock. The remaining two shares were converted to common stock in the Preferred Stock Exchange.
A beneficial conversion feature (“BCF”) is recorded when the consideration allocated to a convertible security, divided by the number of common shares into which the security converts, is below the fair value of the common stock at the commitment date. The Series B conversion price on the date of its issuance was $0.13 per share, and the Company’s common stock price had increased to $0.59 per share. As a result, the Company recognized a BCF. The value of the BCF is limited to the basis that is initially allocated to the convertible security, accordingly the Company allocated the entire net proceeds of $5,195,000 to the BCF, which was initially recorded in additional paid-in capital. The BCF was treated as a deemed dividend on the Series B Preferred Stock and was accreted to the Series B Preferred Stock using the effective interest method through the date of earliest conversion. As the Series B Preferred Stock is immediately convertible, the Company included a deduction of $5,195,000 in determining loss per share for the year ended December 31, 2012. The aforementioned deemed dividend had no impact on the Company’s stockholders’ equity.
Series C Convertible Preferred Stock – The Company has designated 25,000 shares of preferred stock as Series C Convertible Preferred Stock , par value $0.001 per share (the “Series C Preferred Stock”).
On December 20, 2012, the Company issued to RVL 10,000 shares of the Series C Preferred Stock, for cash of $10 million, which was used to fund the Seesmart acquisition (Note 2) and for working capital purposes.
The Series C Preferred Stock was initially non-voting and non-convertible. The Series C Preferred Stock became voting and convertible into shares of the Company’s common stock effective May 15, 2013, following the Company’s compliance with the requirements of Rule 14c-2 of the Securities Exchange Act of 1934, as amended. Additionally RVL was given the right to appoint four members to the Company’s board of directors (the “Board”), with the size of the Board not to exceed seven members. RVL’s right to appoint four directors will decline proportionately to take into account subsequent material reductions in RVL’s ownership position in the Company.
Each share of Series C Preferred Stock carried a liquidation preference and was entitled to receive cumulative dividends payable at a rate per annum of 10% of the Series C Stated Value on the date of issuance (i.e. $1,000). Such dividends were payable through the issuance of additional shares of Series C Preferred Stock on each anniversary of the date of issuance. Additionally, the Series C Preferred Stock shared ratably on an as-converted basis with the common stock in the payment of all other dividends and distributions. For the year ended December 31, 2013, the Company accrued dividends of approximately $1,014,000. On December 1, 2014, all outstanding shares of Series C Preferred were converted to common stock in the Preferred Stock Exchange.
Series D Convertible Preferred Stock – The Company has designated 13,000 shares of preferred stock as Series D Convertible Preferred Stock, par value $0.001 per share (the “Series D Preferred Stock”).
63
Table of Contents
On December 20, 2012, the Company issued 11,177 shares of Series D Preferred Stock, and in the first quarter of 2013, the Company issued 738 shares of Series D Preferred Stock, as partial consideration in the Seesmart acquisition (Note 2). The Series D Preferred Stock had a liquidation preference of $100 per share and shared ratably on an as-converted basis with the
Company’s common stock in the payment of dividends and distributions. The Series D Preferred Stock was non-voting and was initially non-convertible. On May 15, 2013, all 11,915 shares of Series D Preferred Stock were automatically converted into 1,712,167 shares of common stock at a conversion price per share equal to $0.6959 (the “Series D Conversion Price”).
Series E Redeemable Convertible Preferred Stock – The Company has designated 10,000 shares of preferred stock as Series E Convertible Redeemable Preferred Stock, par value $0.001 per share (the “Series E Preferred Stock”).
On February 21, 2013, the Company issued to RVL 5,000 shares of Series E Preferred Stock for cash of $5 million, which was used for working capital purposes. The Series E Preferred Stock was initially non-voting and non-convertible and became voting and convertible into shares of the Company’s common stock on May 15, 2013.
Each share of Series E Preferred Stock was entitled to receive cumulative dividends payable at a rate per annum of 5% of the Series E Stated Value then in effect. Additionally, the Series E Preferred Stock shared ratably on an as-converted basis with the common stock in the payment of all other dividends and distributions. For the year ended December 31, 2013, the Company accrued dividends of $218,000.
In accordance with Accounting Standards Codification 480 (ASC 480), the Company classified the Series E Preferred Stock as temporary equity in the financial statements as it was subject to mandatory redemption at the option of the holder. The Company concluded that the Series E Preferred Stock is more akin to a debt-type instrument than an equity-type instrument. Accordingly the Series E Preferred Stock was accreted to the redemption amount in effect on the balance sheet date.
The embedded conversion feature was not deemed to be closely and clearly related to the debt-type host instrument and before the modification described below did not meet the requirements for classification as equity. Accordingly, it was accounted as a liability at fair value with subsequent changes in fair value included in earnings. The change in fair value of the embedded derivative included in the statement of earnings was $ 7.0 million were for the year ended December 31, 2013. On May 14, 2013, the host instrument was modified by eliminating certain provisions that prevented the embedded conversion feature from meeting the criteria for classification as equity. Accordingly, the fair value of the embedded conversion liability of $8.6 million as of May 14, 2013 was reclassified to paid in capital. The following gives pro forma effect to the results of operations for the year ended December 31, 2013 had the modification been effective on February 21, 2013:
| (in thousands) |
||||||||||||
| As Reported | Series E Adjustments | Proforma | ||||||||||
| Revenue |
$ | 26,060 | $ | — | $ | 26,060 | ||||||
|
|
|
|
|
|
|
|||||||
| Gross profit |
9,952 | — | 9,952 | |||||||||
|
|
|
|
|
|
|
|||||||
| Operating loss |
(10,522 | ) | — | (10,522 | ) | |||||||
| Other income (expenses) |
(6,299 | ) | 6,990 | 691 | ||||||||
|
|
|
|
|
|
|
|||||||
| Net loss |
$ | (16,821 | ) | $ | 6,990 | $ | (9,831 | ) | ||||
| Dividends and accretion to redemption value of Series E and F |
(3,650 | ) | 1,636 | (2,014 | ) | |||||||
|
|
|
|
|
|
|
|||||||
| Net loss attributable to common stockholders |
$ | (20,471 | ) | $ | 8,626 | $ | (11,845 | ) | ||||
|
|
|
|
|
|
|
|||||||
| Basic and diluted loss per common share: |
||||||||||||
| Loss from continuing operations attributable to common stockholders |
$ | (0.26 | ) | $ | (0.15 | ) | ||||||
|
|
|
|
|
|||||||||
| Net loss attributable to common stockholders |
$ | (0.26 | ) | $ | (0.15 | ) | ||||||
|
|
|
|
|
|||||||||
On December 1, 2014, all outstanding shares of Series E Preferred were converted to common stock in the Preferred Stock Exchange described above.
Series F Redeemable Convertible Preferred Stock – The Company has designated 10,000 shares of preferred stock as Series F Senior Convertible Redeemable Preferred Stock, par value $0.001 per share (the “Series F Preferred Stock”).
On August 22, 2013, the Company issued to RVL 5,000 shares of Series F Preferred Stock for cash of $5 million, which was used for working capital purposes.
Each share of Series F Preferred Stock was voting and carried a liquidation preference. It was redeemable for cash at the option of the Company, and convertible to either common stock or cash at the option of the holder. Additionally, it was entitled to receive dividends at a rate per annum equal to 7% of the Series F Stated Value then in effect. For the year ended December 31, 2013, the Company accrued Series F Dividends of $129,000.
64
Table of Contents
All outstanding shares of Series F preferred stock were redeemed in connection with the exchange of Series F preferred stock for Series G preferred stock described below. Following the redemption, the Series F preferred stock was cancelled in June 2014.
In accordance with Accounting Standards Codification 489 (“ASC 480”), the Company classified the Series F Preferred Stock as temporary equity in the financial statements as it was subject to mandatory redemption at the option of the holder. The Company concluded that the Series F Preferred Stock is more akin to a debt-type instrument than an equity-type instrument. Accordingly the preferred stock was accreted to the redemption amount in effect on the balance sheet date.
Series G Redeemable Convertible Preferred stock – The Company designated 18,000 shares of preferred stock as Series G Convertible Redeemable Preferred Stock, par value $0.001 per share (the “Series G Preferred Stock”).
On June 30, 2014, the Company issued to RVL and its affiliate an aggregate of 18,000 shares Series G Preferred Stock as follows. The Company issued 10,956,000 shares in exchange for cancellation of the outstanding balance on the RVL Note (see Note 16), which aggregated $10,956,000 including accrued and unpaid interest thereon. An additional 5,404 shares were issued in exchange for the 5,000 shares (including accrued and unpaid dividends thereon) of the Company’s outstanding Series F Preferred Stock, and 1,640 shares were issued to Aston in exchange for $1,640,085, a portion of the outstanding balance on the February Note (see Note 15).
The Series G Preferred Stock carried a liquidation preference, and was voting and convertible into shares of the Company’s common stock at any time at the option of the holder at a conversion price equal to $2.30. In accordance with ASC 480, the Company classified the Series G Preferred Stock as temporary equity in the financial statements as it was subject to mandatory redemption at the option of the holder.
Additionally, the Company had the option to redeem all or any part of the Series G Preferred Stock for cash at any time subject to the holder’s right to convert and require delivery of shares of common stock. For so long as shares of Series G Preferred Stock were outstanding, the Company was prohibited from taking certain actions specified in the Series G certificate of designations without the consent of a majority of the holders.
Each share of Series G Preferred Stock was entitled to receive cumulative dividends payable at a rate per annum of nine percent (9%) of the Series G Stated Value.
On December 1, 2014, all outstanding shares of Series G Preferred were converted to common stock in the Preferred Stock Exchange.
| 9. | Stock Option Plans: |
On September 18, 2003, the Company adopted a new stock option plan (the “2003 Plan”) that provides for the grant of incentive stock options and nonqualified stock options. The option price of incentive stock options must be at least 100% of market value at the date of the grant and incentive stock options have a maximum term of 10 years. Options granted typically vest ratably over a three-year period or are based on achievement of performance criteria. The Company grants selected executives and other key employees share option awards, whose vesting is contingent upon meeting various departmental and company-wide performance goals including meeting sales targets and net profit targets. In March 2009, the Company amended the 2003 Plan to extend the post-service termination exercise period of non-statutory stock options granted to directors for their service to the Company as directors from three months after the director’s termination date to the tenth anniversary of the date of grant. The 2003 Plan does not contain any provisions which would trigger automatic vesting upon a change in control. The Board has determined that no further awards will be made pursuant to the 2003 Plan. As of December 31, 2014, 379,380 shares of common stock were vested and exercisable under the 2003 Plan, and 379,380 shares have been reserved for issuance under the 2003 Plan.
In May 2013, shareholders approved the 2013 Stock Incentive Plan (the “2013 Plan”). An aggregate of 3,000,000 shares of the Company’s common stock may be issued pursuant to the 2013 Plan, as amended, to officers, employees, non-employee directors and consultants of the Company and its affiliates. Awards under the plan may be in the form of stock options, which may constitute incentive stock options, or non-qualified stock options, restricted shares, restricted stock units, performance awards, stock bonus awards, share appreciation rights and other stock-based awards. Stock options will be issued at an exercise price not less than 100% of the market value at the date of grant and expire no later than ten years after the date of grant. Stock awards typically vest over three years but vesting periods for non-employees may be longer or based on the achievement of performance goals.
65
Table of Contents
Through December 31, 2014, 35,000 options and 1,949,499 restricted shares have been awarded, net of forfeitures, under the 2013 Plan. A total of 1,015,501 common shares are reserved for future issuance under the 2013 Plan, of which 291,000 are approved but unissued.
The following table summarizes option activity of the 2003 and 2013 Plans:
| Number of Shares Outstanding Under Option |
Weighted Average Exercise Price |
|||||||
| Balance, January 1, 2012 |
737,020 | $ | 4.26 | |||||
| Options granted at market |
54,250 | 0.54 | ||||||
| Options exercised |
— | — | ||||||
| Options forfeited or expired |
(84,467 | ) | 1.83 | |||||
|
|
|
|
|
|||||
| Balance, December 31, 2012 |
706,803 | $ | 4.27 | |||||
| Options granted at market |
— | — | ||||||
| Options exercised |
(108,146 | ) | 2.45 | |||||
| Options forfeited or expired |
(191,637 | ) | 4.76 | |||||
|
|
|
|
|
|||||
| Balance, December 31, 2013 |
407,020 | $ | 4.52 | |||||
| Options granted at market |
52,500 | 2.32 | ||||||
| Options exercised |
— | — | ||||||
| Options forfeited or expired |
(45,140 | ) | 2.82 | |||||
|
|
|
|
|
|||||
| Balance, December 31, 2014 |
414,380 | $ | 4.29 | |||||
|
|
|
|
|
|||||
A summary of the non-vested options as of December 31, 2014 and changes during the year ending December 31, 2014 is presented below:
| Non-vested Shares |
Shares | Weighted-Average Grant-Date Fair Value |
||||||
| Non-vested at January 1, 2014 |
667 | $ | 1.23 | |||||
| Granted |
52,500 | 3.02 | ||||||
| Vested |
(667 | ) | 1.23 | |||||
| Forfeited |
(17,500 | ) | 3.02 | |||||
|
|
|
|
|
|||||
| Non-vested at December 31, 2014 |
35,000 | $ | 3.02 | |||||
|
|
|
|
|
|||||
The total future compensation cost related to non-vested stock option awards is estimated to be nominal for the years ending December 31, 2015 and 2016. The average fair value of options granted at market during 2014 and 2012 was $3.02 and $0.39 per option, respectively. The total intrinsic value of options exercised during the year ended December 31, 2013 was $95,000. No options were exercised in 2014 and 2012. Options outstanding at December 31, 2014 had no intrinsic value. The total fair value of shares vested during the years ended December 31, 2014, 2013 and 2012 was approximately $1,000, $2,000 and $158,000, respectively.
Additionally, during the year ended December 31, 2014, the Company issued 848,000 restricted shares under the 2013 Plan to employees and non-employee service providers, and 130,000 were forfeited. The weighted average term of employee restricted stock is three years. Unrecognized compensation expense for employee restricted stock grants outstanding at December 31, 2014 amounted to $1,670,240. The weighted average grant date fair value is $3.00 per share.
Prior to 2012, the Company granted selected executives and other key employees share option awards, whose vesting is contingent upon meeting various departmental and company-wide performance goals including meeting sales targets and net profit targets. No performance options were granted during 2014 and 2013, and there was no unrecognized compensation cost related to non-vested performance options at December 31, 2014. A summary of activity of options that vested upon achievement of certain performance criteria under the 2003 Plan as of December 31, 2014 and changes during the year then ended is presented below. These shares were also included in the summary of activity of stock option plans for the year ended December 31, 2014 above.
66
Table of Contents
| Performance Based Shares |
Shares | Weighted Average Exercise Price |
Weighted Average Remaining Contractual Term |
Aggregate Intrinsic Value |
||||||||||||
| Outstanding at January 1, 2012 |
161,240 | $ | 3.79 | 5.91 | $ | — | ||||||||||
| Granted |
— | — | ||||||||||||||
| Options exercised |
— | — | ||||||||||||||
| Forfeited or expired |
— | — | ||||||||||||||
|
|
|
|
|
|
|
|
|
|||||||||
| Outstanding at December 31, 2012 |
161,240 | $ | 3.79 | 4.91 | $ | — | ||||||||||
| Granted |
— | — | ||||||||||||||
| Options exercised |
— | — | ||||||||||||||
| Forfeited or expired |
153,600 | 3.71 | 3.83 | — | ||||||||||||
|
|
|
|
|
|
|
|
|
|||||||||
| Outstanding at December 31, 2013 |
7,640 | 5.30 | 5.45 | — | ||||||||||||
| Granted |
— | — | ||||||||||||||
| Options exercised |
— | — | ||||||||||||||
| Forfeited or expired |
7,640 | 5.30 | 4.45 | — | ||||||||||||
|
|
|
|
|
|
|
|
|
|||||||||
| Outstanding at December 31, 2014 |
— | — | — | — | ||||||||||||
|
|
|
|
|
|
|
|
|
|||||||||
| Exercisable at December 31, 2014 |
— | $ | — | — | $ | — | ||||||||||
|
|
|
|
|
|
|
|
|
|||||||||
.Stock-based compensation expense for employees recognized in the accompanying statements of operations for the years ended December 31, 2014, 2013 and 2012 was $1,751,000, $302,000 and $45,000, respectively. Stock-based compensation expense (benefit) recorded with respect to non-employee service providers during the years ended December 31, 2014 and 2013 was ($40,000) and $506,000, respectively. There was no such compensation recorded for year ended December 31, 2012. Stock-based compensation for 2014 includes $911,000 of bonus and commissions to be paid in the form of common stock.
| 10. | Operating Leases: |
The Company leases office, warehouse and manufacturing facilities throughout the United States. Generally, the leases require the Company to pay the operating expenses of the properties, in some cases including property taxes. The majority of the Company’s leases include renewal options at existing or current market rates.
The following schedule shows the total rent expense under operating leases:
| (in thousands) |
Year Ended December 31, | |||||||||||
| 2014 | 2013 | 2012 | ||||||||||
| Rent expense |
$ | 953 | $ | 577 | $ | 301 | ||||||
| Less sublease rentals |
— | (47 | ) | (35 | ) | |||||||
|
|
|
|
|
|
|
|||||||
| Total rent expense |
$ | 953 | $ | 530 | $ | 266 | ||||||
|
|
|
|
|
|
|
|||||||
The future minimum payment obligations as of December 31, 2014 for operating leases are as follows:
| 2015 |
$ | 1,057 | ||
| 2016 |
1,094 | |||
| 2017 |
1,017 | |||
| 2018 |
688 | |||
| 2019 |
390 | |||
| Thereafter |
1,500 | |||
|
|
|
|||
| Total future payment obligations |
$ | 5,746 | ||
|
|
|
67
Table of Contents
| 11. | Risk Concentrations: |
The Company’s financial instruments that are exposed to concentrations of credit risk consist of cash, cash equivalents, trade accounts receivable and accounts payable. The Company places its cash and cash equivalents with high credit quality institutions. At times such balances may be in excess of the FDIC insurance limit.
Revenues from a group of related customers represented approximately 31% of the Company’s revenue for the year ended December 31, 2013. No customer represented more than 10% of the Company’s revenue for the years ended December 31, 2014 and 2012.
The Company made purchases from two suppliers representing approximately 14% and 10% of total net purchases for the year ended December 31, 2013, and four suppliers representing approximately 18%, 15%, 14% and 12% of total net purchases for the year ended December 31, 2012. No such concentrations existed during the year ended December 31, 2014.
A portion of the Company’s LEDs and LED lighting products and systems are manufactured by select contract manufacturers. While the Company believes alternative manufacturers for the production of these products are available, the Company has selected these particular manufacturers based on their ability to consistently produce these products per the Company’s specifications ensuring the best quality product at the most cost effective price.
The Company depends on these manufacturers to satisfy performance and quality specifications and to dedicate sufficient production capacity for finished products within scheduled delivery times. Accordingly, the loss of one or more of these manufacturers or delays in obtaining shipments could have a material adverse effect on the Company’s operations until such time as an alternative manufacturer could be found.
| 12. | Income Taxes: |
As of December 31, 2014, the Company reported net operating loss carry forwards for federal and state income tax purposes of $27,019,000 and $35,147,000, respectively, which expire between 2019 and 2034. As of December 31, 2013, the Company reported net operating loss carry forwards for federal and state income tax purposes of $22,505,000 and $34,993,000, respectively, which expire between 2018 and 2033. Utilization of net operating loss carryforwards is dependent on generating future taxable income of the appropriate type and in the appropriate jurisdiction. In addition, as a result of transactions consummated during 2012 and 2013, including the issuance of common and preferred stock by the Company and the acquisition of Seesmart and Relume, substantially all of the Company’s net operating loss carryforwards as of December 31, 2014 are subject to limitations imposed by Section 382 of the Internal Revenue Code. During 2013 the Company performed an evaluation of the Section 382 limitations on the use of net operating loss carryforwards and has adjusted them accordingly. The Company has recognized a full valuation allowance related to its remaining net deferred tax assets, including the remaining net operating loss carryforwards.
In conjunction with the 2014 acquisitions, the Company recorded a net deferred tax liability of $6.6 million in its purchase price allocation (see Note 2). This liability can be used to reduce the overall deferred tax asset of the Company and as a result, the Company recognized a corresponding tax benefit related to the reduction of the existing valuation allowance. This benefit resulted in a credit recorded in earnings of $6.6 million for 2014.
Components of deferred tax assets (liabilities) are as follows:
| (in thousands) |
December 31, | |||||||
| 2014 | 2013 | |||||||
| Accounts receivable |
$ | 233 | $ | 58 | ||||
| Inventories |
1,847 | 473 | ||||||
| Accrued expenses |
818 | 825 | ||||||
| Depreciation |
(5 | ) | 40 | |||||
| Intangible assets |
(11,232 | ) | (5,320 | ) | ||||
| Stock options |
1,339 | 1,015 | ||||||
| Deferred revenue |
22 | 46 | ||||||
| Other |
5 | 6 | ||||||
| Net operating loss carry forwards |
11,860 | 9,316 | ||||||
|
|
|
|
|
|||||
| Net deferred tax asset |
4,887 | 6,459 | ||||||
| Valuation allowance |
(4,887 | ) | (6,459 | ) | ||||
|
|
|
|
|
|||||
| $ | — | $ | — | |||||
|
|
|
|
|
|||||
68
Table of Contents
In accordance with FASB ASC 740 “Income Taxes”, valuation allowances are provided against deferred tax assets if, based on the weight of available evidence, it is more likely than not that some or all of the deferred tax assets will not be realized.
The Company has not recorded a provision for income taxes in 2013 and 2012 as the deferred tax benefits of the net losses were offset by a corresponding increase in the deferred tax valuation allowance. The following is a reconciliation of tax computed at the statutory federal rate to the income tax expense in the statements of operations for the years ended December 31, 2014, 2013 and 2012:
| December 31, | ||||||||||||||||||||||||
| (in thousands) |
2014 | 2013 | 2012 | |||||||||||||||||||||
| Amount | % | Amount | % | Amount | % | |||||||||||||||||||
| Tax benefit at statutory federal rate |
$ | (3,988 | ) | (34.0 | ) | $ | (5,719 | ) | (34.0 | ) | $ | (2,916 | ) | (34.0 | ) | |||||||||
| Deferred state tax benefit |
(383 | ) | (3.3 | ) | (258 | ) | (1.5 | ) | (618 | ) | (7.2 | ) | ||||||||||||
| Change in valuation allowance |
4,982 | 42.5 | (10,446 | ) | (62.1 | ) | 2,810 | 32.8 | ||||||||||||||||
| Tax benefit of acquisition |
(6,550 | ) | (55.8 | ) | — | — | — | — | ||||||||||||||||
| Goodwill impairment |
— | — | — | — | 676 | 7.9 | ||||||||||||||||||
| Adjustment to net operating loss carryforwards |
(120 | ) | (1.0 | ) | 13,828 | 82.2 | 41 | 0.5 | ||||||||||||||||
| Non-deductible expenses |
160 | 1.4 | 2,595 | 15.4 | 7 | 0.0 | ||||||||||||||||||
| Impact of rate change |
(651 | ) | (5.6 | ) | — | — | — | — | ||||||||||||||||
|
|
|
|
|
|
|
|
|
|
|
|
|
|||||||||||||
| Income tax benefit |
$ | (6,550 | ) | (55.8 | ) | $ | — | — | $ | — | — | |||||||||||||
|
|
|
|
|
|
|
|
|
|
|
|
|
|||||||||||||
| 13. | Segment Reporting: |
The Company’s operations are principally managed on a product basis and are comprised of two reportable segments for financial purposes: Lighting Fixtures and Lamps and the Lighting Signage and Media. The Lighting Fixtures and Lamps reportable segment includes the Seesmart business, the Relume business, the LIT business, the Tri-State business and the Value Lighting business. The Lighting Signage and Media reportable segment is comprised of the Lumificient business. Effective January 1, 2014 the Media business of Relume, included in the Lighting Fixtures and Lamps segment since the acquisition of Relume, was transferred to Lumificient and is now included in the Lighting Signage and Media reportable segment. Financial information relating to the reportable operating segments for the years ended December 31, 2014, 2013 and 2012 is presented below:
| (in thousands) | Year Ended December 31, | |||||||||||
| 2014 | 2013 | 2012 | ||||||||||
| Revenues from external customers: |
||||||||||||
| Lighting fixtures and lamps |
$ | 72,373 | $ | 22,823 | $ | 792 | ||||||
| Lighting signage and media |
4,467 | 3,237 | 3,689 | |||||||||
|
|
|
|
|
|
|
|||||||
| Total revenues from external customers |
$ | 76,840 | $ | 26,060 | $ | 4,481 | ||||||
|
|
|
|
|
|
|
|||||||
| Segment loss: |
||||||||||||
| Lighting fixtures and lamps |
$ | (4,213 | ) | $ | (3,495 | ) | $ | (5,820 | ) | |||
| Lighting signage and media |
(232 | ) | (174 | ) | (195 | ) | ||||||
|
|
|
|
|
|
|
|||||||
| Segment loss |
(4,445 | ) | (3,669 | ) | (6,015 | ) | ||||||
| Unallocated amounts: |
||||||||||||
| Corporate expenses |
(6,442 | ) | (6,853 | ) | (3,401 | ) | ||||||
| Change in fair value of embedded derivative |
— | (6,990 | ) | — | ||||||||
| Gain on debt restructuring |
— | — | 1,048 | |||||||||
| Gain on bargain purchase of business |
— | 743 | — | |||||||||
| Deferred income tax benefit |
6,550 | — | — | |||||||||
| Interest expense, net |
(843 | ) | (52 | ) | (210 | ) | ||||||
|
|
|
|
|
|
|
|||||||
| Net loss |
$ | (5,180 | ) | $ | (16,821 | ) | $ | (8,578 | ) | |||
|
|
|
|
|
|
|
|||||||
| Depreciation and amortization: |
||||||||||||
| Lighting fixtures and lamps |
$ | 5,307 | $ | 1,799 | $ | 156 | ||||||
| Lighting signage and media |
316 | 1,298 | 237 | |||||||||
|
|
|
|
|
|
|
|||||||
| Segment depreciation and amortization |
5,623 | 3,097 | 393 | |||||||||
| Corporate depreciation and amortization |
21 | 25 | 100 | |||||||||
|
|
|
|
|
|
|
|||||||
| Total depreciation and amortization |
$ | 5,644 | $ | 3,122 | $ | 493 | ||||||
|
|
|
|
|
|
|
|||||||
69
Table of Contents
| As of December 31, | ||||||||
| 2014 | 2013 | |||||||
| Segment assets: |
||||||||
| Lighting fixtures and lamps |
$ | 122,921 | $ | 52,989 | ||||
| Lighting signage and media |
6,859 | 4,524 | ||||||
|
|
|
|
|
|||||
| Total segment assets |
129,780 | 57,513 | ||||||
| Elimination of intercompany receivable |
(31,303 | ) | (14,231 | ) | ||||
| Other corporate assets |
28,065 | 8,955 | ||||||
|
|
|
|
|
|||||
| Total assets |
$ | 126,542 | $ | 52,237 | ||||
|
|
|
|
|
|||||
| Expenditures for segment assets: |
||||||||
| Lighting fixtures and lamps |
$ | 320 | $ | 100 | ||||
| Lighting signage and media |
39 | 11 | ||||||
|
|
|
|
|
|||||
| Total expenditures for segment assets |
359 | 111 | ||||||
| Corporate expenditures for assets |
126 | 22 | ||||||
|
|
|
|
|
|||||
| Total expenditures for assets |
$ | 485 | $ | 133 | ||||
|
|
|
|
|
|||||
Net revenues by geographic location, based on location of customers, were as follows:
| (in thousands) |
December 31, | |||||||||||
| 2014 | 2013 | 2012 | ||||||||||
| United States |
$ | 74,839 | $ | 25,243 | $ | 3,901 | ||||||
| Canada |
1,839 | 574 | 383 | |||||||||
| Other |
162 | 243 | 197 | |||||||||
|
|
|
|
|
|
|
|||||||
| Total |
$ | 76,840 | $ | 26,060 | $ | 4,481 | ||||||
|
|
|
|
|
|
|
|||||||
Net long-lived assets by geographic locations were as follows:
| (in thousands) |
December 31, | |||||||||||
| 2014 | 2013 | 2012 | ||||||||||
| United States |
$ | 35,883 | $ | 18,489 | $ | 12,364 | ||||||
| Other |
112 | 137 | 8 | |||||||||
|
|
|
|
|
|
|
|||||||
| Total |
$ | 35,995 | $ | 18,626 | $ | 12,372 | ||||||
|
|
|
|
|
|
|
|||||||
| 14. | Benefit Plans: |
The Company has established a profit sharing plan that permits participants to make contributions by salary reduction pursuant to Section 401(k) of the Internal Revenue Code of 1986, as amended. On November 1, 2008, the Company elected to cease matching contributions. The Company elected to reinstate the matching contribution during 2013. During 2014 and 2013, respectively, we had $120,000 and $39,000 in expenses related to the plan.
| 15. | Related Party Transactions: |
Financings – In February 2014 the Company entered in an arrangement with Aston, an affiliate of our Chairman and Chief Executive Officer, pursuant to which the Company borrowed $3.5 million for general corporate purposes (the “February Note”). The borrowing bore interest at 9% annually and originally had a scheduled maturity of April 1, 2015. The Company had the option to prepay the note at any time without penalty. In April 2014, the Company borrowed an additional $1 million from Aston for general corporate purposes on the same terms and conditions as the February Note (the “April Note”). Also in
70
Table of Contents
April 2014, the Company borrowed $10.8 million from RVL to fund the acquisition of Value Lighting (the “RVL Note”) which bore interest at 9% annually and originally had a scheduled maturity of the earliest of April 1, 2015 or the date on which the Company received proceeds from any debt, factoring or other similar facility or equity securities in the commercial banking, private placement or public markets.
In June 2014, the company exchanged the $10.8 million RVL Note and $1.6 million of the February Note plus related accrued interest, for an equivalent amount of Series G preferred stock. See Note 8.
In addition, Aston advanced an additional $ 2.7 million for general corporate purposes in four separate transactions during May and June 2014. As of July 31, 2014, the Audit Committee ratified these advances and approved the issuance of a promissory note in respect of such amount, which bears interest and matures on April 1, 2016 and can be prepaid at any time at the option of the Company.
The Company has accrued interest on such borrowings of $0.1 million at December 31, 2014 on debt outstanding at such date and recorded interest expense of $0.8 million for the year ended December 31, 2014.
Investment Agreements – The Company has entered into four separate investment agreements and an Exchange Agreement with RVL, an affiliate of Aston and the Company’s Chairman and Chief Executive Officer, whereby the Company issued to RVL Series B, C, E, F and G preferred stock. Cash received by the Company for the issuance for Series B, C, E, and F preferred stock aggregated to $26.0 million. Cash received for debt exchanged for Series G preferred stock aggregated to $12.5 million. On December 1, 2014, all outstanding preferred stock was exchanged for common stock of the Company. In addition, in 2013 an affiliate of RVL purchased 75,000 shares of common stock from the Company for $192,000, at the closing market price of the stock on the date purchased.
Customer Financing – In 2013, Aston provided $9.9 million in financing to a related group of customers of the Company who used the proceeds to repay its obligations to the Company for the purchase of Company products. The Company has no obligations to Aston with respect to the financing arrangements between the customer and Aston. The Company’s obligations to the customer are limited to the standard warranty obligation on the products sold.
Management Agreement - On April 9, 2013, the Company ratified a management services agreement with Aston (the “Management Agreement”) to memorialize certain management services that Aston has been providing to the Company since RVL acquired majority control of the Company’s voting securities in September 2012. Pursuant to the Management Agreement, Aston provides consulting services in connection with financing matters, budgeting, strategic planning and business development, including, without limitation, assisting the Company in (i) analyzing the operations and historical performance of target companies; (ii) analyzing and evaluating the transactions with such target companies; (iii) conducting financial, business and operational due diligence, and (iv) evaluating related structuring and other matters. In consideration of the services provided by Aston under the Management Agreement, the Company issued 500,000 shares of restricted common stock to Aston to vest in three equal annual increments, with the first such vesting date being September 25, 2013. On April 21, 2014, the Company granted an additional 300,000 shares of restricted stock to Aston which vest in three annual installments with the first such vesting date being September 25, 2014. The Audit Committee of the Board will consider from time to time (at a minimum at such times when the Compensation Committee of the Board evaluates director compensation) whether additional compensation to Aston is appropriate given the nature of the services provided.
Relocation of Corporate Headquarters - During the first quarter of 2013, the Company relocated its corporate headquarters to Stamford, Connecticut to a space also occupied by affiliates of the Company’s Chairman and Chief Executive Officer. The terms and conditions of the arrangement have not been finalized but the Audit Committee of the Board agreed to an allocation of the costs of the Stamford headquarters between Aston and the Company. The Company pays Aston $21,355 monthly, representing its proportionate share of the space under the underlying lease. Costs allocated to the Company amounted to $0.7 million and $.01 million for the years ended December 31, 2014 and 2013.
RVL Transaction Fees – Pursuant to the Series E and Series F Investment Agreement with RVL, the Company agreed to pay certain transaction costs incurred by RVL in connection with its investment. For the year ended December 31, 2013, the Company incurred $33,000 related to these costs. Pursuant to the Series G Exchange Agreement with Aston and RVL, the Company also agreed to pay certain transaction costs incurred by Aston in connection with the issuance of the Series G stock.
| 16. | Financings |
In August 2014, the Company entered into a three-year loan and security agreement with Bank of America (“the Revolving Credit Facility”) pursuant to which the Company can borrow up to specified percentages against eligible accounts receivable and inventory as defined in the Revolving Credit Facility (the “Borrowing Base”) up to a maximum of $25 million. Borrowings under the arrangement bears interest at a LIBOR rate or a defined base rate, each plus an applicable margin, depending on the
71
Table of Contents
nature of the loan. The Company is also obligated to pay various fees monthly. Outstanding loans become payable on demand to the extent that such loans exceed the Borrowing Base, and all outstanding amounts must be repaid on August 20, 2017. All obligations under the Revolving Credit Facility are secured by the assets of the Company and its subsidiaries and are guaranteed by the Company and its subsidiaries. Borrowings outstanding as of December 31, 2014 amount to approximately $8.8 million and are included in non-current liabilities in the accompanying Consolidated Balance Sheet. We are in compliance with our covenants and obligations under the facility, and we estimate that as of December 31, 2014 we are eligible to borrow an additional $4.5 million under the facility based upon current levels of inventory and accounts receivable.
The Loan Agreement contains covenants which limit the ability of the Company to, among other things, (i) create, incur, guarantee or suffer to exist any indebtedness; (ii) create or suffer any lien upon any property; (iii) declare or make distributions to equity holders or create any restriction on the ability of a subsidiary to make such a distribution; (iv) make investments; (v) sell, lease, license, consign or otherwise dispose of any property; (vi) make loans or other advances of money to any person; (vii) make payments on certain indebtedness; and (viii) enter into transactions with affiliates. In addition, the Loan Agreement includes a financial covenant that, on a consolidated basis, requires the Company to maintain, for the most recent twelve fiscal months, a ratio of (i) EBITDA minus Capital Expenditures (as defined in the Loan Agreement) and cash taxes paid to (ii) Fixed Charges (as defined in the Loan Agreement), of not less than 1.1 to 1.0.
From time to time the Company enters into financing arrangements with RVL and its affiliates. See Note 15.
In conjunction with the acquisition of Value Lighting (see Note 2), the Company refinanced $3.7 million of Value Lighting’s trade accounts payable by issuing a note payable to the creditor. The note is payable in installments through November 2018, at which time a balloon payment of $1.4 million is due.
In 2013 two subsidiaries of the Company entered into loan and finance agreements with a financial institution pursuant to which the subsidiaries could borrow against eligible accounts receivable as defined in the agreement, up to a maximum of $2 million. Borrowings bore interest at the prime rate plus 1.75%, but not less than 5%. The subsidiaries were also obligated to pay an annual fee and monthly maintenance fees. No amounts were outstanding under these arrangements as of December 31, 2014. Borrowings outstanding as of December 31, 2013 aggregated $0.9 million and are included in accrued liabilities in the accompanying Consolidated Balance Sheet.
Maturities of long-term borrowings for each of the next five years are as follows:
| 2015 |
$ | 360 | ||
| 2016 |
2,925 | |||
| 2017 |
9,120 | |||
| 2018 |
360 | |||
| 2019 |
360 |
| 17. | Quarterly Results of Operations (Unaudited): |
| (in thousands, except per share data) |
First Quarter |
Second Quarter |
Third Quarter |
Fourth Quarter |
||||||||||||
| Fiscal year ended December 31, 2014: |
||||||||||||||||
| Revenues |
$ | 4,952 | $ | 17,517 | $ | 26,877 | $ | 27,494 | ||||||||
| Gross profit |
1,603 | 5,563 | 8,559 | 8,498 | ||||||||||||
| Net (loss) income |
(3,570 | ) | 2,410 | (1,404 | ) | (2,616 | ) | |||||||||
| Net (loss) income attributable to common stockholders |
(3,977 | ) | 1,100 | (2,055 | ) | (7,913 | ) | |||||||||
| Basic and diluted (loss) income per common share attributable to common stockholders (1) |
$ | (0.04 | ) | $ | 0.01 | $ | (0.02 | ) | $ | (0.07 | ) | |||||
|
|
|
|
|
|
|
|
|
|||||||||
| Fiscal year ended December 31, 2013: |
||||||||||||||||
| Revenues |
$ | 6,311 | $ | 7,357 | $ | 5,313 | $ | 7,079 | ||||||||
| Gross profit |
2,661 | 3,585 | 1,364 | 2,342 | ||||||||||||
| Net loss |
(5,318 | ) | (5,135 | ) | (3,080 | ) | (3,288 | ) | ||||||||
| Net loss attributable to common stockholders |
(7,766 | ) | (5,457 | ) | (3,545 | ) | (3,703 | ) | ||||||||
| Basic and diluted loss per common share attributable to common stockholders (1) |
$ | (0.11 | ) | $ | (0.07 | ) | $ | (0.04 | ) | $ | (0.05 | ) | ||||
|
|
|
|
|
|
|
|
|
|||||||||
The 2014 and 2013 acquisitions are included in consolidated results of operations from their respective acquisition dates.
| (1) | The quarterly earnings per share information is computed separately for each period. Therefore, the sum of such quarterly per share amounts may differ from the total for the year. |
72
Table of Contents
Pursuant to the requirements of Section 13 or 15(d) of the Securities Exchange Act of 1934, the registrant has duly caused this report to be signed on its behalf by the undersigned, thereunto duly authorized.
| REVOLUTION LIGHTING TECHNOLOGIES, INC. | ||||||
| Date: March 13, 2015 | By: | /s/ Robert V. LaPenta | ||||
| Robert V. LaPenta | ||||||
| Chief Executive Officer | ||||||
Pursuant to the requirements of the Securities Exchange Act of 1934, this report has been signed below by the following persons on behalf of the registrant and in the capacities and on the dates indicated.
| /s/ Robert V. LaPenta |
||||
| Robert V. LaPenta | March 13, 2015 | |||
| Chief Executive Officer / Chairman | ||||
| (Principal Executive Officer) | ||||
| /s/ Charles J. Schafer |
March 13, 2015 | |||
| Charles J. Schafer – President and Chief Financial Officer |
||||
| (Principal Financial and Accounting Officer) | ||||
| /s/ Robert A. Basil, Jr. |
March 13, 2015 | |||
| Robert A. Basil, Jr.– Director | ||||
| /s/ James A. DePalma |
March 13, 2015 | |||
| James A. DePalma – Director | ||||
| /s/ Bill Ingram |
March 13, 2015 | |||
| Bill Ingram – Director | ||||
| /s/ Robert V. LaPenta, Jr. |
March 13, 2015 | |||
| Robert V. LaPenta, Jr.– Director | ||||
| /s/ Dennis McCarthy |
March 13, 2015 | |||
| Dennis McCarthy – Director | ||||
| /s/ Stephen G. Virtue |
March 13, 2015 | |||
| Stephen G. Virtue – Director | ||||
73