Attached files
| file | filename |
|---|---|
| 8-K - FORM 8-K - OLIN Corp | form8ksidotipresentation03.htm |

1 Sidoti & Company Emerging Growth Research Institutional Investor Forum March 17, 2015 Exhibit 99.1
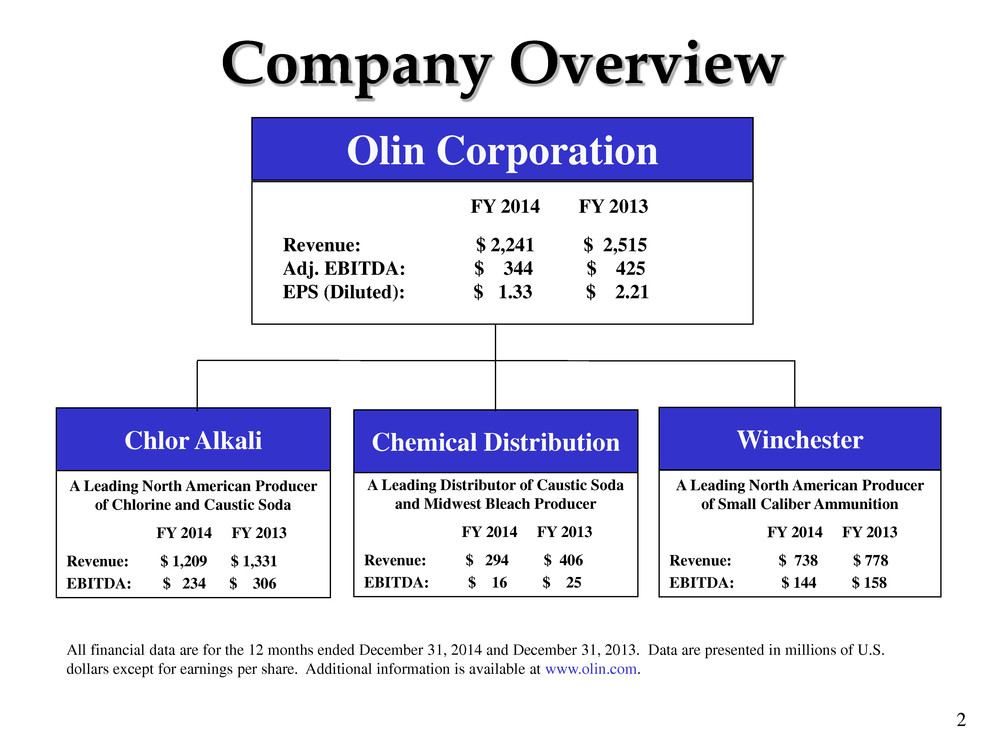
2 Company Overview All financial data are for the 12 months ended December 31, 2014 and December 31, 2013. Data are presented in millions of U.S. dollars except for earnings per share. Additional information is available at www.olin.com. Winchester Chlor Alkali A Leading North American Producer of Chlorine and Caustic Soda FY 2014 FY 2013 Revenue: $ 1,209 $ 1,331 EBITDA: $ 234 $ 306 A Leading North American Producer of Small Caliber Ammunition FY 2014 FY 2013 Revenue: $ 738 $ 778 EBITDA: $ 144 $ 158 Revenue: $ 2,241 $ 2,515 Adj. EBITDA: $ 344 $ 425 EPS (Diluted): $ 1.33 $ 2.21 Olin FY 2014 FY 2013 Olin Corporation A Leading Distributor of Caustic Soda and Midwest Bleach Producer FY 2014 FY 2013 Revenue: $ 294 $ 406 EBITDA: $ 16 $ 25 Chemical Distribution
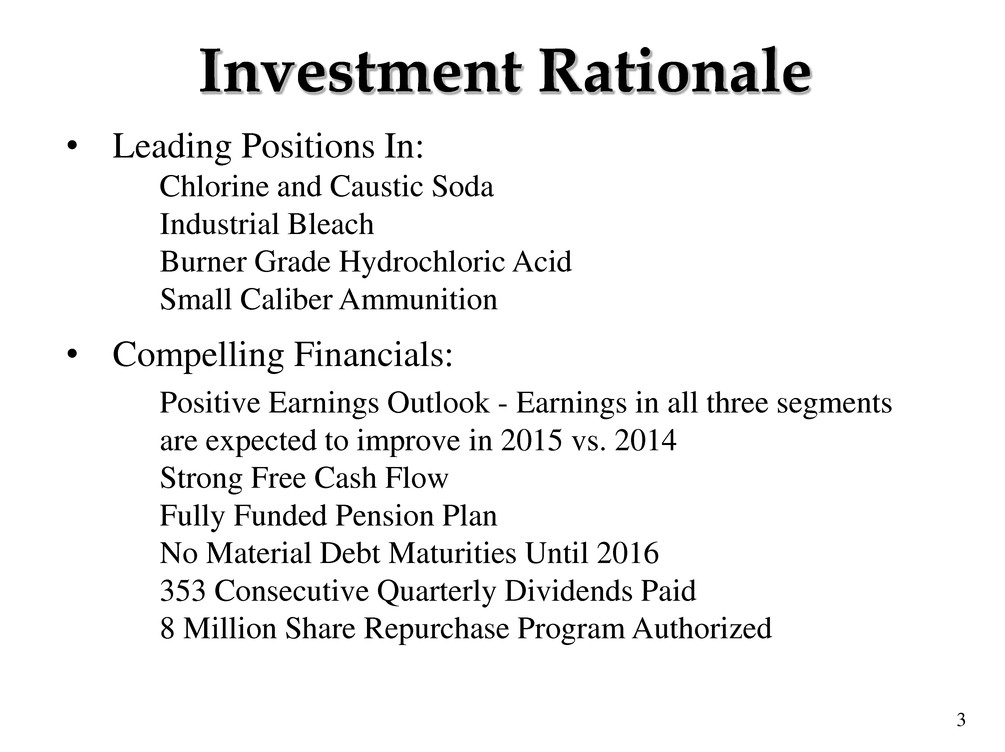
3 Investment Rationale • Leading Positions In: Chlorine and Caustic Soda Industrial Bleach Burner Grade Hydrochloric Acid Small Caliber Ammunition • Compelling Financials: Positive Earnings Outlook - Earnings in all three segments are expected to improve in 2015 vs. 2014 Strong Free Cash Flow Fully Funded Pension Plan No Material Debt Maturities Until 2016 353 Consecutive Quarterly Dividends Paid 8 Million Share Repurchase Program Authorized
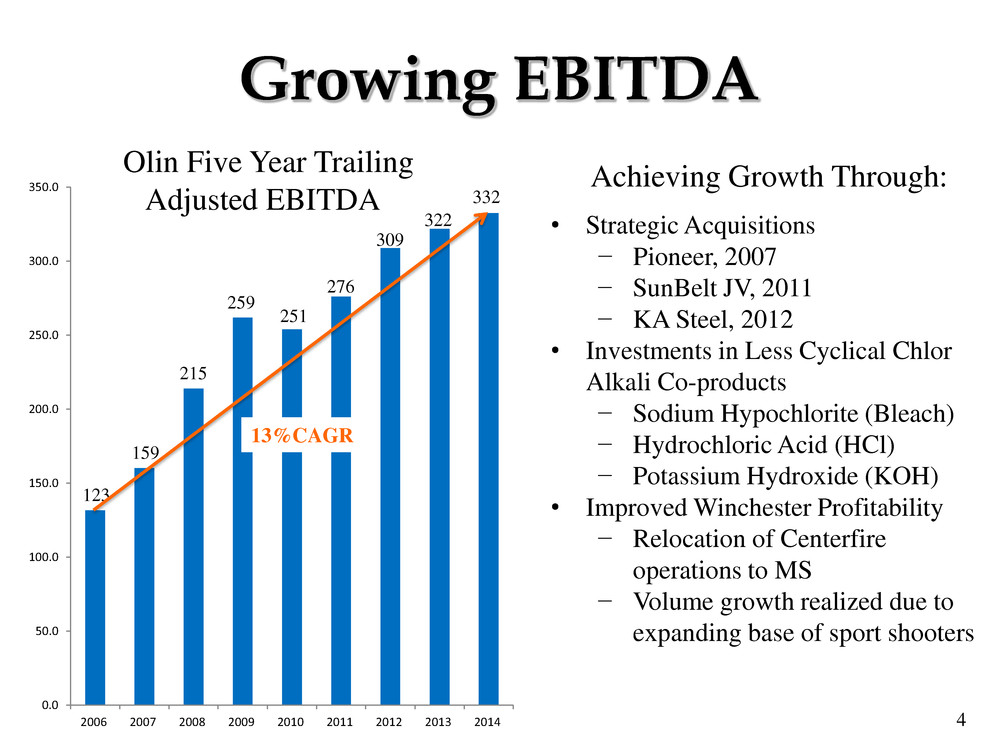
4 0.0 50.0 100.0 150.0 200.0 250.0 300.0 350.0 2006 2007 2008 2009 2010 2011 2012 2013 2014 Growing EBITDA • Strategic Acquisitions − Pioneer, 2007 − SunBelt JV, 2011 − KA Steel, 2012 • Investments in Less Cyclical Chlor Alkali Co-products − Sodium Hypochlorite (Bleach) − Hydrochloric Acid (HCl) − Potassium Hydroxide (KOH) • Improved Winchester Profitability − Relocation of Centerfire operations to MS − Volume growth realized due to expanding base of sport shooters Olin Five Year Trailing Adjusted EBITDA 123 159 259 215 251 276 309 322 13%CAGR 332 Achieving Growth Through:
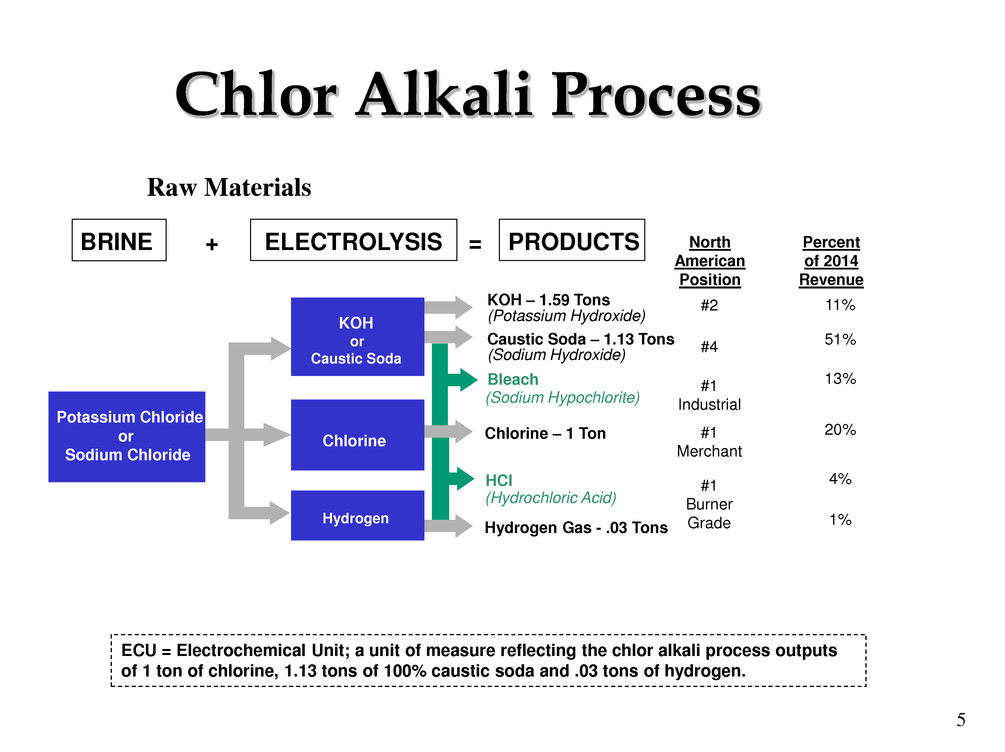
5 Chlor Alkali Process ECU = Electrochemical Unit; a unit of measure reflecting the chlor alkali process outputs of 1 ton of chlorine, 1.13 tons of 100% caustic soda and .03 tons of hydrogen. North American Position Percent of 2014 Revenue #2 #1 Industrial #1 Merchant #1 Burner Grade 51% 13% 4% 11% 20% 1% Raw Materials BRINE + ELECTROLYSIS = PRODUCTS Caustic Soda – 1.13 Tons (Sodium Hydroxide) (Potassium Hydroxide) Bleach (Sodium Hypochlorite) Chlorine – 1 Ton Potassium Chloride or Sodium Chloride KOH – 1.59 Tons HCl (Hydrochloric Acid) Hydrogen Gas - .03 Tons KOH or Caustic Soda Chlorine Hydrogen #4
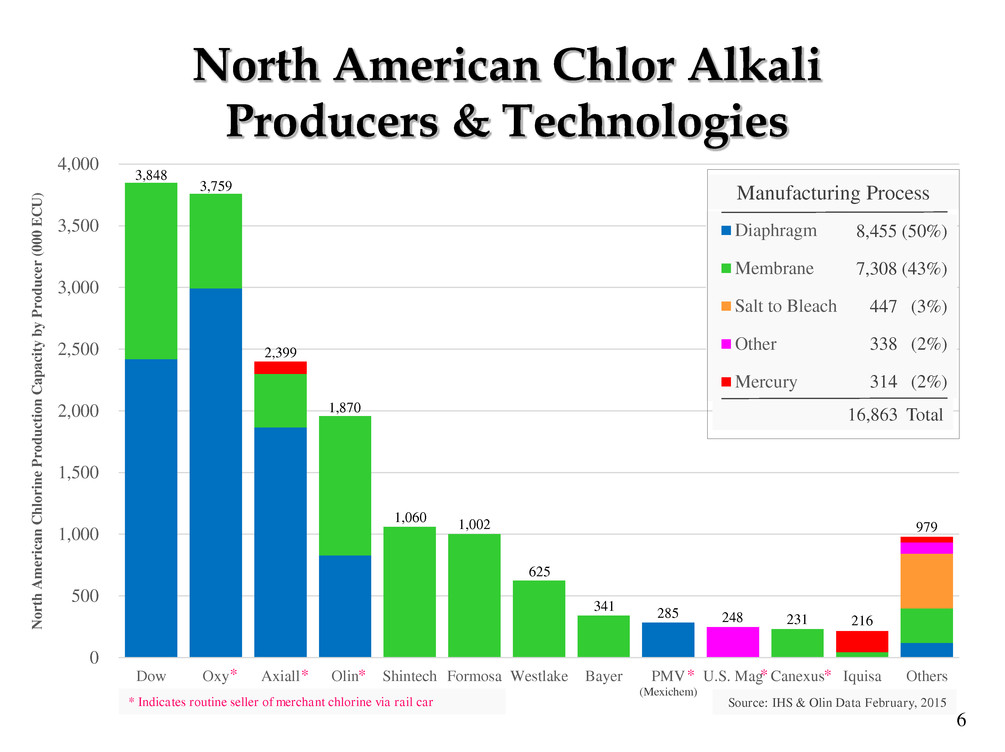
6 North American Chlor Alkali Producers & Technologies 0 500 1,000 1,500 2,000 2,500 3,000 3,500 4,000 Dow Oxy Axiall Olin Shintech Formosa Westlake Bayer PMV U.S. Mag Canexus Iquisa Others N or th A m er ican C hlo ri ne P roduc ti on C apac it y by P roduce r ( 000 E C U ) Diaphragm Membrane Salt to Bleach Other Mercury 3,848 3,759 2,399 1,870 1,060 1,002 625 341 285 248 231 216 979 8,455 (50%) 7,308 (43%) 447 (3%) 338 (2%) 314 (2%) Manufacturing Process * Indicates routine seller of merchant chlorine via rail car * * * * * * (Mexichem) 16,863 Total Source: IHS & Olin Data February, 2015
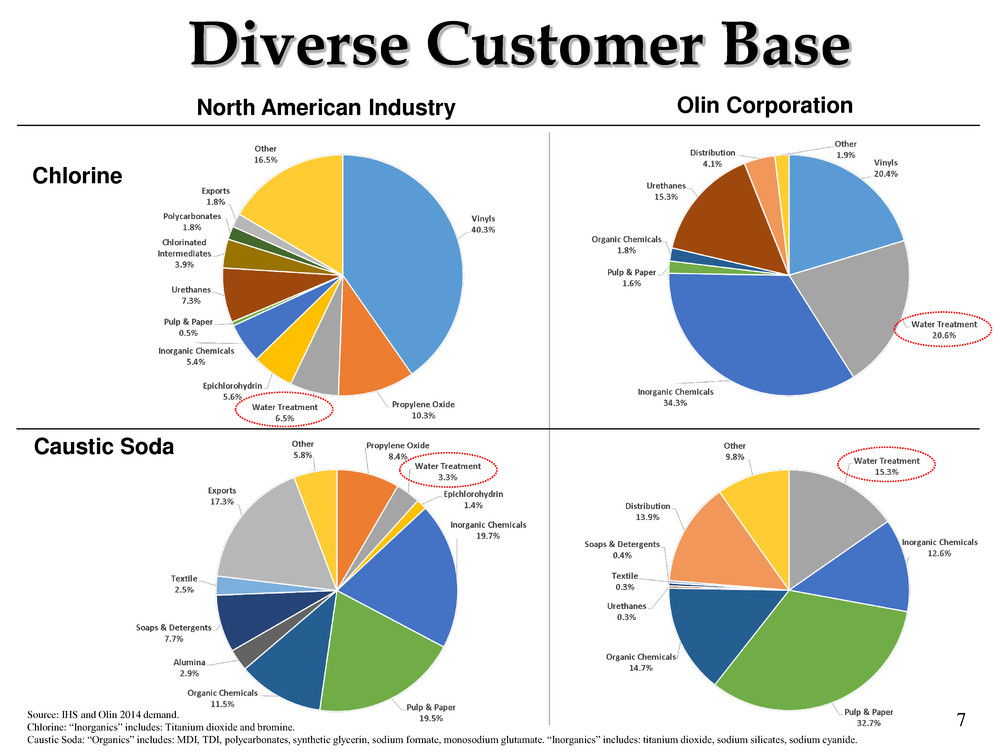
7 Diverse Customer Base Chlorine Caustic Soda North American Industry Olin Corporation Source: IHS and Olin 2014 demand. Chlorine: “Inorganics” includes: Titanium dioxide and bromine. Caustic Soda: “Organics” includes: MDI, TDI, polycarbonates, synthetic glycerin, sodium formate, monosodium glutamate. “Inorganics” includes: titanium dioxide, sodium silicates, sodium cyanide.
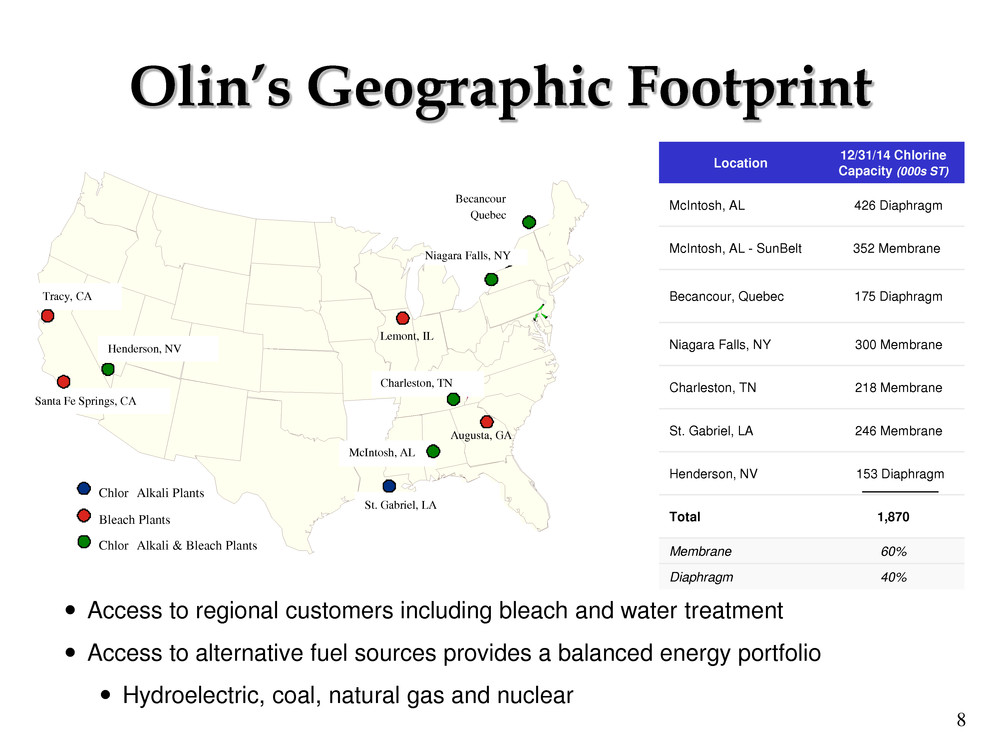
8 Location 12/31/14 Chlorine Capacity (000s ST) McIntosh, AL 426 Diaphragm McIntosh, AL - SunBelt 352 Membrane Becancour, Quebec 175 Diaphragm Niagara Falls, NY 300 Membrane Charleston, TN 218 Membrane St. Gabriel, LA 246 Membrane Henderson, NV 153 Diaphragm Total 1,870 Membrane 60% Diaphragm 40% Olin’s Geographic Footprint Access to regional customers including bleach and water treatment Access to alternative fuel sources provides a balanced energy portfolio Hydroelectric, coal, natural gas and nuclear 32 49 55 25 57 18 60 8 29 2 53 30 35 43 39 44 54 41 17 Chlor Alkali Plants Bleach Plants Chlor Alkali & Bleach Plants Tracy, CA Santa Fe Springs, CA Henderson, NV St. Gabriel, LA McIntosh, AL Charleston, TN Niagara Falls, NY Becancour Quebec Augusta, GA Lemont, IL
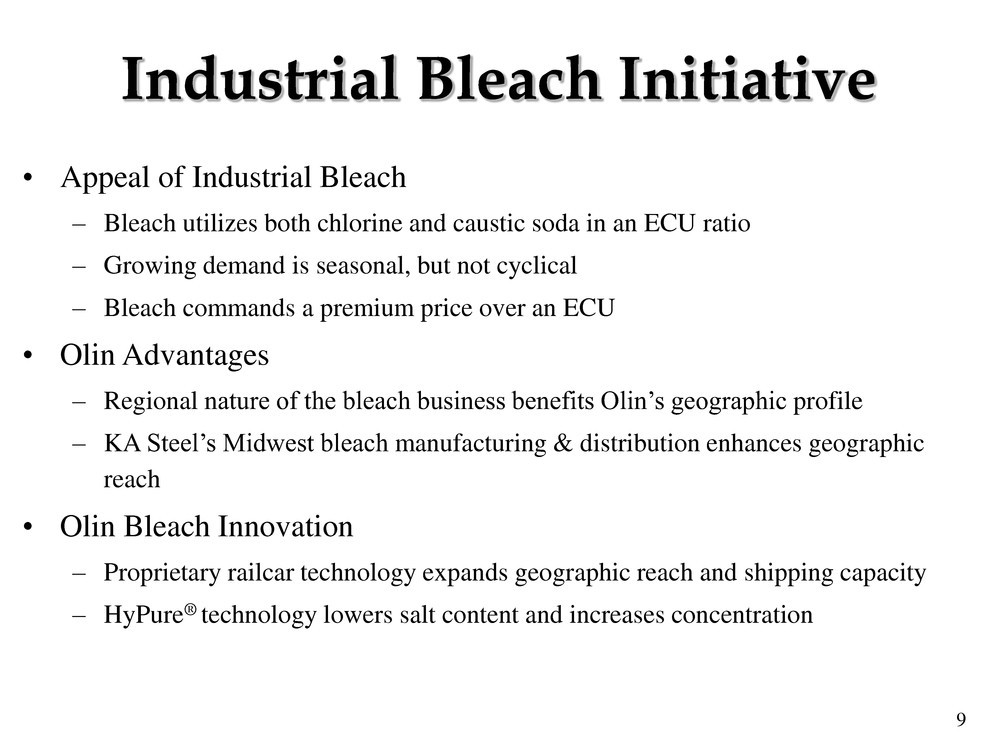
9 Industrial Bleach Initiative • Appeal of Industrial Bleach – Bleach utilizes both chlorine and caustic soda in an ECU ratio – Growing demand is seasonal, but not cyclical – Bleach commands a premium price over an ECU • Olin Advantages – Regional nature of the bleach business benefits Olin’s geographic profile – KA Steel’s Midwest bleach manufacturing & distribution enhances geographic reach • Olin Bleach Innovation – Proprietary railcar technology expands geographic reach and shipping capacity – HyPure® technology lowers salt content and increases concentration
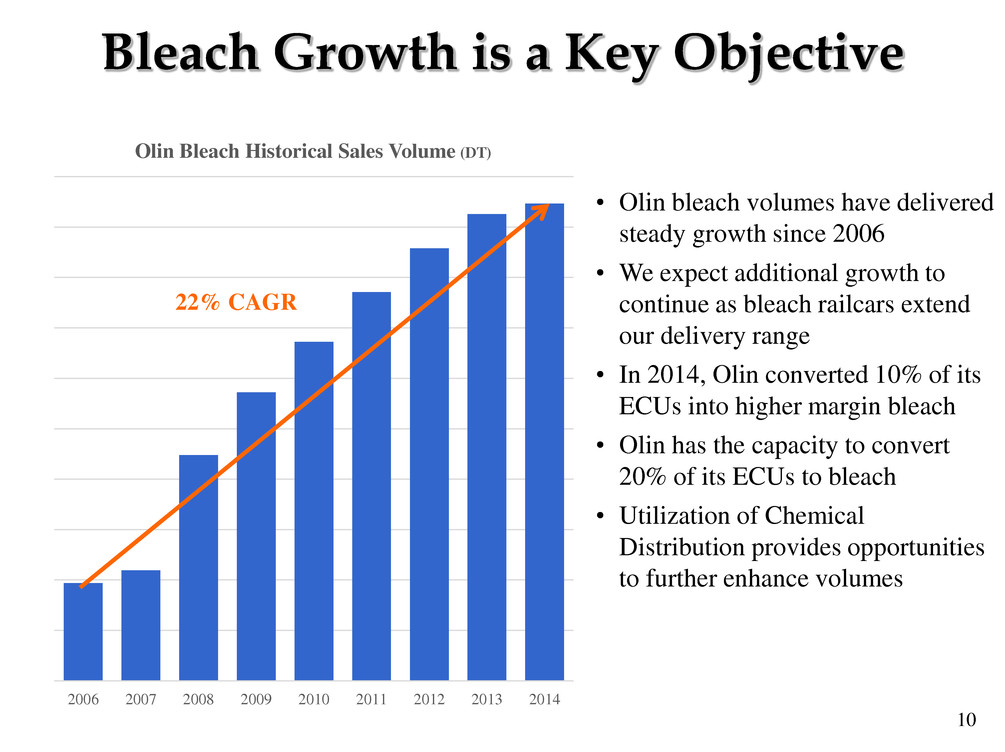
10 2006 2007 2008 2009 2010 2011 2012 2013 2014 Olin Bleach Historical Sales Volume (DT) 22% CAGR Bleach Growth is a Key Objective • Olin bleach volumes have delivered steady growth since 2006 • We expect additional growth to continue as bleach railcars extend our delivery range • In 2014, Olin converted 10% of its ECUs into higher margin bleach • Olin has the capacity to convert 20% of its ECUs to bleach • Utilization of Chemical Distribution provides opportunities to further enhance volumes
11 Hydrochloric Acid • Olin is the leading producer of Burner-grade HCl in North America with 5 manufacturing locations in the United States and Canada • Currently, Olin estimates that 50% of HCl supply is “Burner-grade” or “on-purpose” HCl • By-product outages and seasonality can reduce supply by as much as 20% creating short-term supply tightness • Burner grade HCl is a reliable source, and while a small cost component in oil and gas exploration, is critical to the process • Olin continues to expand capacity through de-bottlenecking and new burners • Distribution strategy is expected to increase volumes and enhance netbacks

12 2006 2007 2008 2009 2010 2011 2012 2013 2014 Olin HCl Historical Sales Volume (DT) Growing HCl Volumes • Olin HCl volumes have grown steadily since 2006 • We forecast that HCl volumes will continue to grow • HCl pricing continues to sell at a meaningful premium over chlorine • Olin currently has the capacity to convert 13% of its chlorine capacity into HCl • In 2014, Olin converted 8% of its chlorine capacity into higher margin HCl 14% CAGR
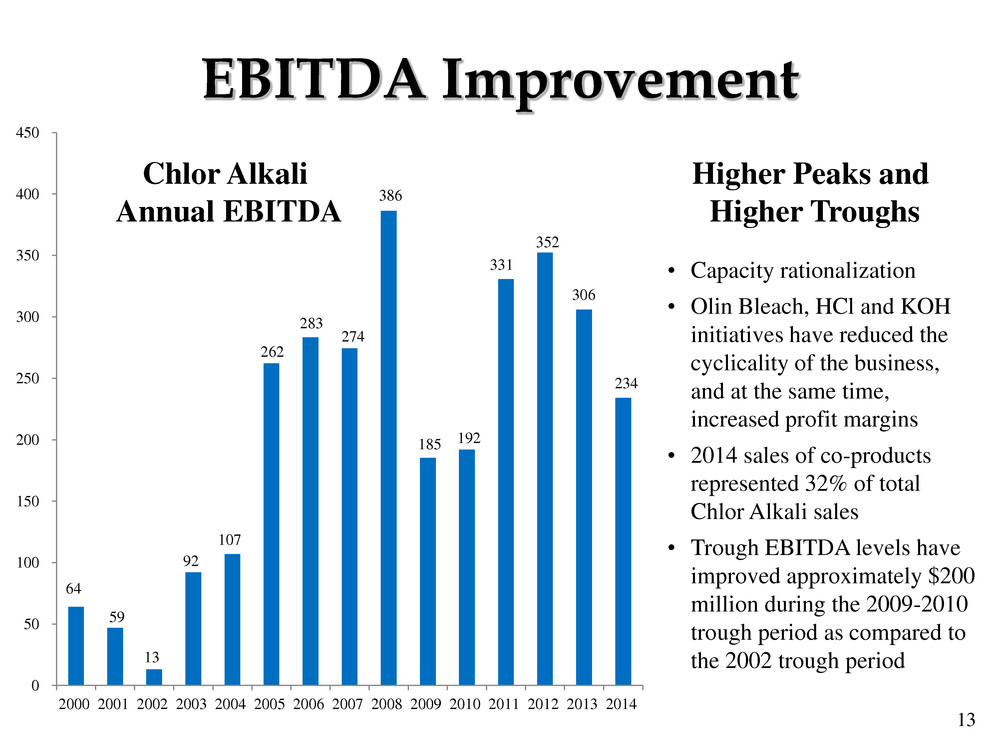
13 0 50 100 150 200 250 300 350 400 450 2000 2001 2002 2003 2004 2005 2006 2007 2008 2009 2010 2011 2012 2013 2014 EBITDA Improvement • Capacity rationalization • Olin Bleach, HCl and KOH initiatives have reduced the cyclicality of the business, and at the same time, increased profit margins • 2014 sales of co-products represented 32% of total Chlor Alkali sales • Trough EBITDA levels have improved approximately $200 million during the 2009-2010 trough period as compared to the 2002 trough period Higher Peaks and Higher Troughs 234 Chlor Alkali Annual EBITDA 64 59 13 262 92 107 386 274 283 185 192 331 352 306

14 Chemical Distribution • KA Steel is a chemical distributor uniquely focused on selling the products produced by Olin’s Chlor Alkali business • Strategic Initiatives: − Grow the sales of Olin-produced bleach, HCl and KOH − Improve the returns on caustic soda sales • KA Steel has generated approximately $50 million of after-tax cash flow since being acquired by Olin • Chemical Distribution 2014 EBITDA is forecast to double by 2016 • We also expect the Chlor Alkali business will realize $10 to $15 million of annual benefit from producing the co-products, as well as from logistics and infrastructure cost savings

15 Chemical Distribution • KA Steel caustic distribution infrastructure provides a strong fit with Olin’s chlor alkali assets: − Mature supply relationships − 90,000 tons of caustic storage − Expanded geographic coverage − Logistical savings through truck and barge shipments instead of rail • Provides scale and flexibility • Access to new customers, regions and industry segments • Combined network is capable of supporting higher caustic volumes and expansion of Bleach, HCl and KOH sales Only 3 locations out of 51 overlap 13 9 23 6
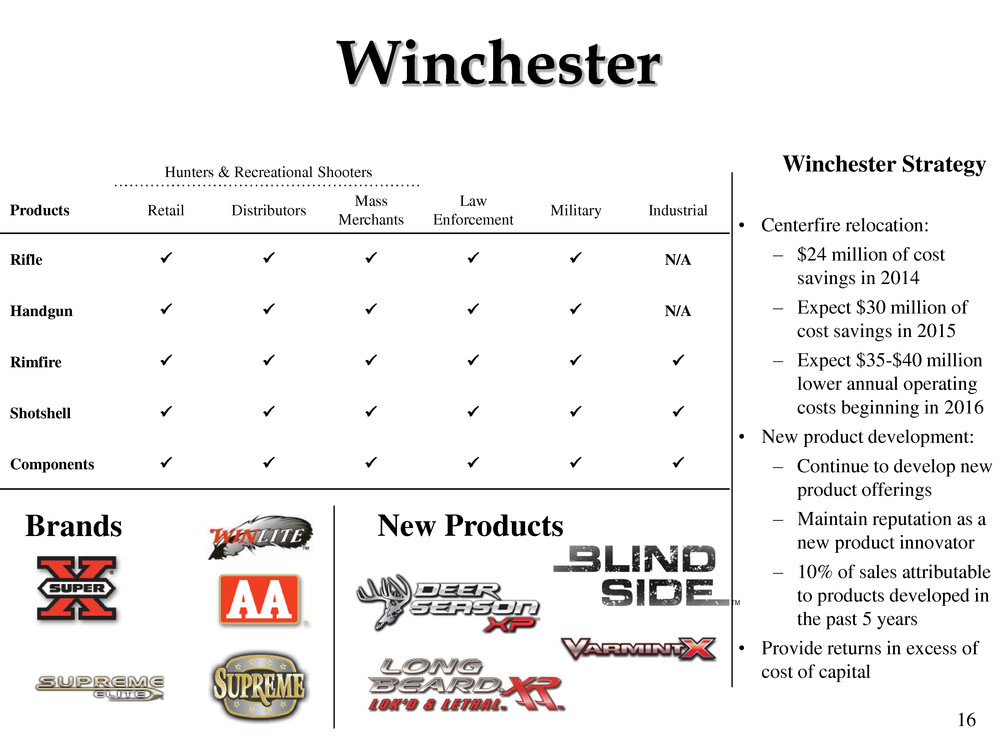
16 Winchester Brands Winchester Strategy • Centerfire relocation: – $24 million of cost savings in 2014 – Expect $30 million of cost savings in 2015 – Expect $35-$40 million lower annual operating costs beginning in 2016 • New product development: – Continue to develop new product offerings – Maintain reputation as a new product innovator – 10% of sales attributable to products developed in the past 5 years • Provide returns in excess of cost of capital Hunters & Recreational Shooters Products Retail Distributors Mass Merchants Law Enforcement Military Industrial Rifle N/A Handgun N/A Rimfire Shotshell Components New Products
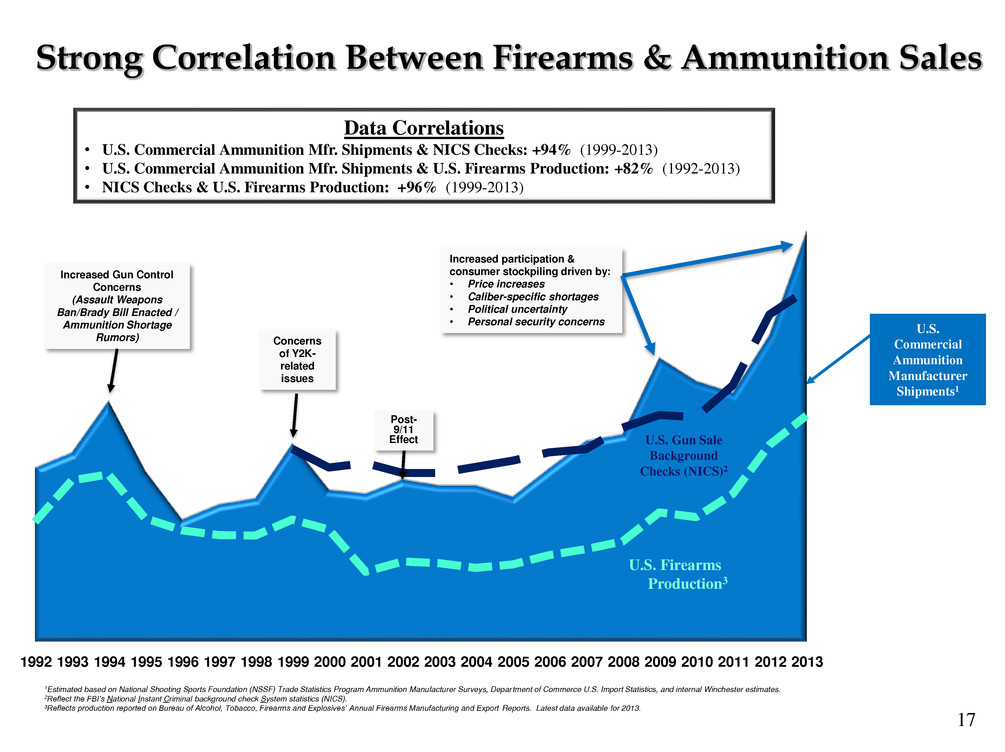
17 U.S. Commercial Ammunition Manufacturer Shipments1 Increased Gun Control Concerns (Assault Weapons Ban/Brady Bill Enacted / Ammunition Shortage Rumors) Concerns of Y2K- related issues Increased participation & consumer stockpiling driven by: • Price increases • Caliber-specific shortages • Political uncertainty • Personal security concerns 1Estimated based on National Shooting Sports Foundation (NSSF) Trade Statistics Program Ammunition Manufacturer Surveys, Department of Commerce U.S. Import Statistics, and internal Winchester estimates. 2Reflect the FBI’s National Instant Criminal background check System statistics (NICS). 3Reflects production reported on Bureau of Alcohol, Tobacco, Firearms and Explosives’ Annual Firearms Manufacturing and Export Reports. Latest data available for 2013. 1992 1993 1994 1995 1996 1997 1998 1999 2000 2001 2002 2003 2004 2005 2006 2007 2008 2009 2010 2011 2012 2013 Post- 9/11 Effect U.S. Firearms Production3 U.S. Gun Sale Background Checks (NICS)2 Data Correlations • U.S. Commercial Ammunition Mfr. Shipments & NICS Checks: +94% (1999-2013) • U.S. Commercial Ammunition Mfr. Shipments & U.S. Firearms Production: +82% (1992-2013) • NICS Checks & U.S. Firearms Production: +96% (1999-2013) Strong Correlation Between Firearms & Ammunition Sales
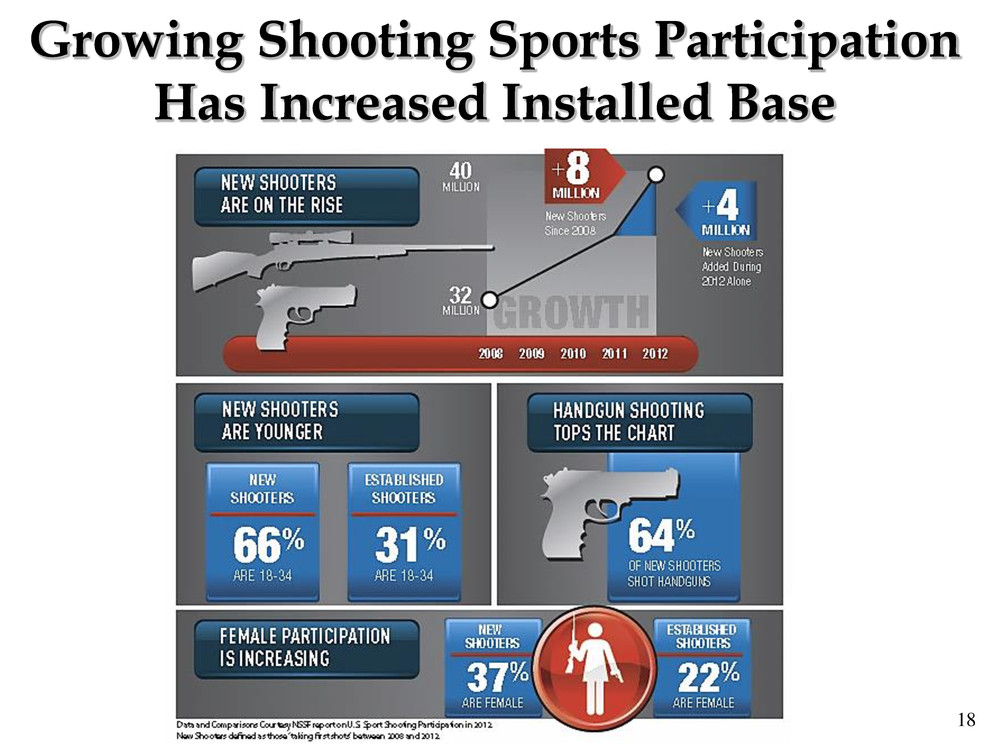
18 Growing Shooting Sports Participation Has Increased Installed Base
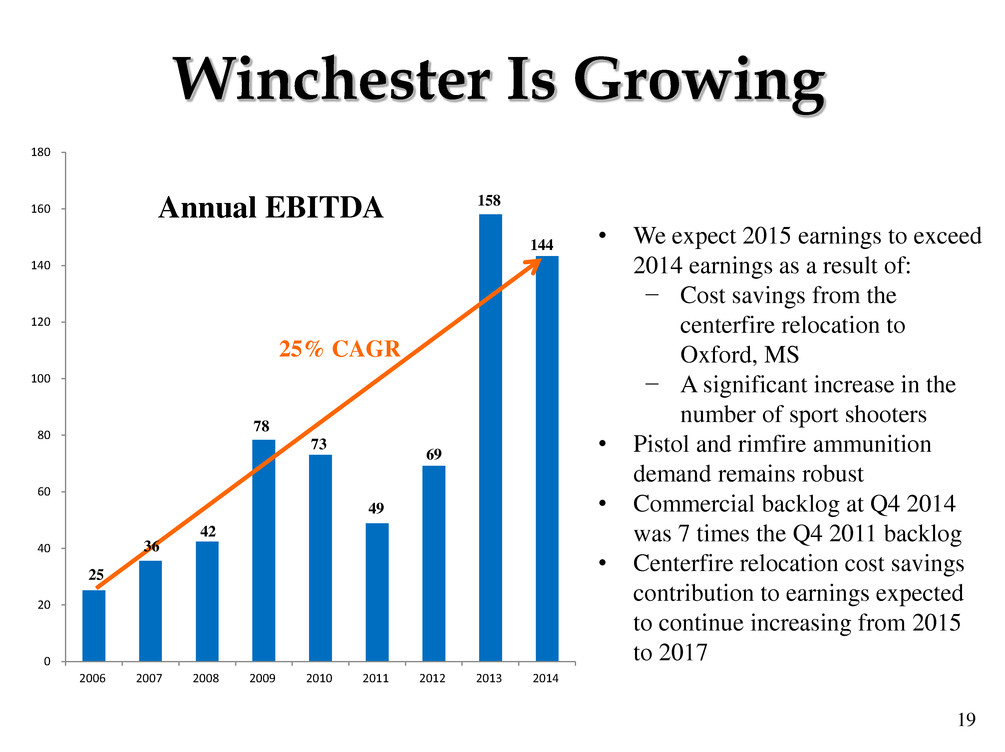
19 0 20 40 60 80 100 120 140 160 180 2006 2007 2008 2009 2010 2011 2012 2013 2014 Winchester Is Growing • We expect 2015 earnings to exceed 2014 earnings as a result of: − Cost savings from the centerfire relocation to Oxford, MS − A significant increase in the number of sport shooters • Pistol and rimfire ammunition demand remains robust • Commercial backlog at Q4 2014 was 7 times the Q4 2011 backlog • Centerfire relocation cost savings contribution to earnings expected to continue increasing from 2015 to 2017 25% CAGR Annual EBITDA 158 69 73 78 42 36 25 49 144

20 Strong Balance Sheet • Year end 2014 cash balance of $257 million • $72 million of CAPEX in 2014 vs. D&A expense of $139 million • During 2014, $128 million distributed to shareholders in the form of common stock dividends and 2.5 million of common share repurchases • 2015 CAPEX is expected to be in the $120 to $130 million range • 2015 D&A expense is expected to be in the $140 to $145 million range • No material debt maturities until 2016, with total debt due between now and 6/1/16 of approximately $18 million • The Olin defined benefit pension plans are frozen and remain fully funded with no contributions expected for several years
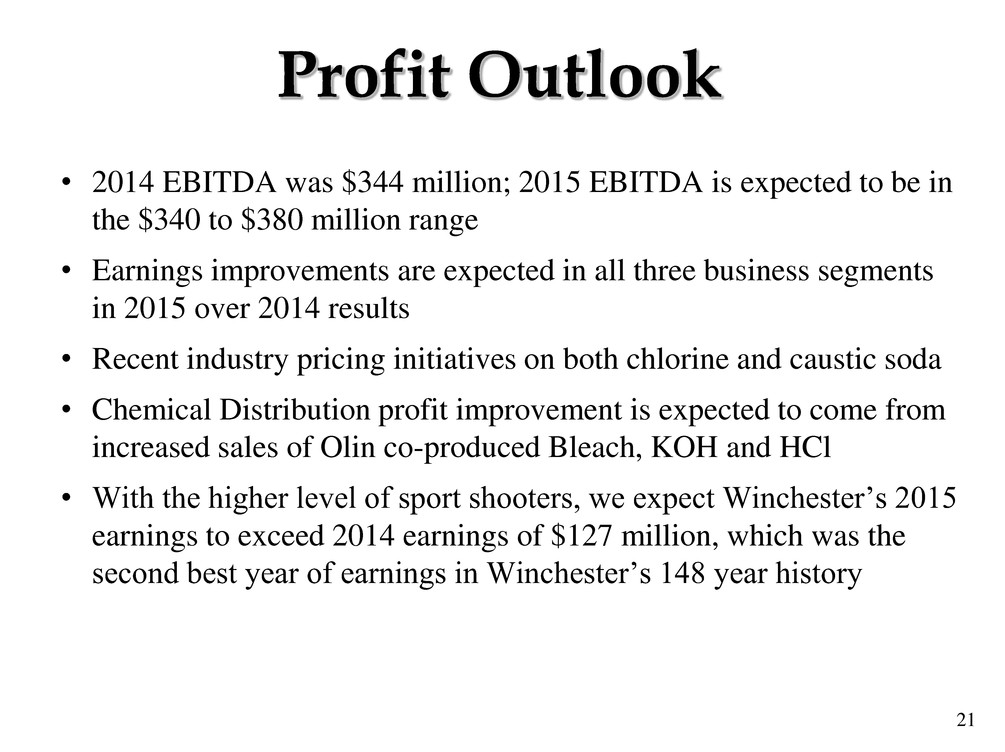
21 • 2014 EBITDA was $344 million; 2015 EBITDA is expected to be in the $340 to $380 million range • Earnings improvements are expected in all three business segments in 2015 over 2014 results • Recent industry pricing initiatives on both chlorine and caustic soda • Chemical Distribution profit improvement is expected to come from increased sales of Olin co-produced Bleach, KOH and HCl • With the higher level of sport shooters, we expect Winchester’s 2015 earnings to exceed 2014 earnings of $127 million, which was the second best year of earnings in Winchester’s 148 year history Profit Outlook
22 Forward-Looking Statements This presentation contains estimates of future performance, which are forward-looking statements and actual results could differ materially from those anticipated in the forward-looking statements. Some of the factors that could cause actual results to differ are described in the business and outlook sections of Olin’s Form 10-K for the year ended December 31, 2014. These reports are filed with the U.S. Securities and Exchange Commission.
