Attached files
| file | filename |
|---|---|
| EX-23.1 - EX-23.1 - OCI Partners LP | d838521dex231.htm |
| EX-31.2 - EX-31.2 - OCI Partners LP | d838521dex312.htm |
| EX-32.2 - EX-32.2 - OCI Partners LP | d838521dex322.htm |
| EX-32.1 - EX-32.1 - OCI Partners LP | d838521dex321.htm |
| EX-24.1 - EX-24.1 - OCI Partners LP | d838521dex241.htm |
| EX-31.1 - EX-31.1 - OCI Partners LP | d838521dex311.htm |
| EXCEL - IDEA: XBRL DOCUMENT - OCI Partners LP | Financial_Report.xls |
| EX-21.1 - EX-21.1 - OCI Partners LP | d838521dex211.htm |
Table of Contents
UNITED STATES
SECURITIES AND EXCHANGE COMMISSION
Washington, D.C. 20549
Form 10-K
(Mark One)
| x | ANNUAL REPORT PURSUANT TO SECTION 13 OR 15(d) OF THE SECURITIES EXCHANGE ACT OF 1934 |
For the fiscal year ended December 31, 2014
OR
| ¨ | TRANSITION REPORT PURSUANT TO SECTION 13 OR 15(d) OF THE SECURITIES EXCHANGE ACT OF 1934 |
For the transition period from to
Commission file number 001-36098
OCI Partners LP
(Exact name of registrant as specified in its charter)
| Delaware | 90-0936556 | |
| (State or other jurisdiction of incorporation or organization) |
(I.R.S. Employer Identification No.) |
| Mailing Address: | Physical Address: | |
| P.O. Box 1647 Nederland, Texas 77627 |
5470 N. Twin City Highway Nederland, Texas 77627 |
(Address of principal executive offices) (Zip Code)
(409) 723-1900
(Registrant’s telephone number, including area code)
Securities registered pursuant to Section 12(b) of the Act:
| Title of each class |
Name of each exchange on which registered | |
| Common Units Representing Limited Partner Interests | New York Stock Exchange |
Securities registered pursuant to Section 12(g) of the Act: None.
Indicate by check mark if the registrant is a well-known seasoned issuer, as defined in Rule 405 of the Securities Act. Yes ¨ No x
Indicate by check mark if the registrant is not required to file reports pursuant to Section 13 or Section 15(d) of the Act. Yes ¨ No x
Indicate by check mark whether the registrant (1) has filed all reports required to be filed by Section 13 or 15(d) of the Securities Exchange Act of 1934 during the preceding 12 months (or for such shorter period that the registrant was required to file such reports), and (2) has been subject to such filing requirements for the past 90 days. Yes x No ¨
Indicate by check mark whether the registrant has submitted electronically and posted on its corporate Web site, if any, every Interactive Data File required to be submitted and posted pursuant to Rule 405 of Regulation S-T (§232.405 of this chapter) during the preceding 12 months (or for such shorter period that the registrant was required to submit and post such files). Yes x No ¨
Indicate by check mark if disclosure of delinquent filers pursuant to Item 405 of Regulation S-K (§229.405 of this chapter) is not contained herein, and will not be contained, to the best of registrant’s knowledge, in definitive proxy or information statements incorporated by reference in Part III of this Form 10-K or any amendment to this Form 10-K. ¨
Indicate by check mark whether the registrant is a large accelerated filer, an accelerated filer, a non-accelerated filer, or a smaller reporting company. See the definitions of “large accelerated filer,” “accelerated filer” and “smaller reporting company” in Rule 12b-2 of the Exchange Act.
| Large accelerated filer | ¨ | Accelerated filer | x | |||
| Non-accelerated filer | ¨ (Do not check if a smaller reporting company) | Smaller reporting company | ¨ | |||
Indicate by check mark whether the registrant is a shell company (as defined in Rule 12b-2 of the Exchange Act). Yes ¨ No x
The aggregate market value of common units held by non-affiliates as of June 30, 2014 was approximately $371.9 million.
As of March 16, 2015, the registrant had 83,495,372 common units outstanding.
DOCUMENTS INCORPORATED BY REFERENCE: None
Table of Contents
i
Table of Contents
EXPLANATORY NOTE
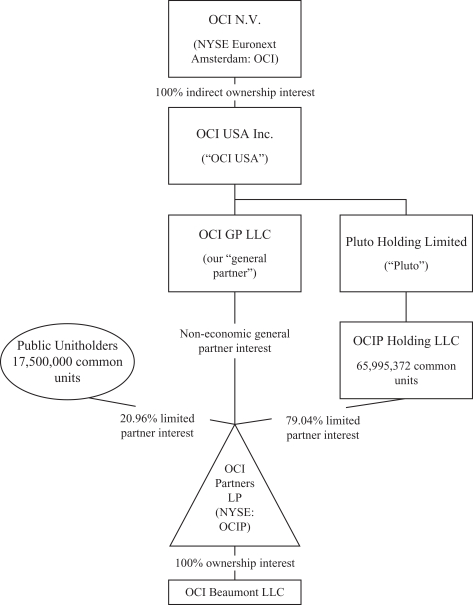
OCI Partners LP, a Delaware limited partnership (“OCIP”), closed its initial public offering (“IPO”) of common units representing limited partner interests (“common units”) on October 9, 2013 (the “IPO Closing Date”). As used in this report, the terms “the partnership,” “we,” “our,” “us” and similar terms, when used in a historical context for periods prior to the IPO Closing Date, refer to the business and operations of OCI Beaumont LLC, a Texas limited liability company (“OCIB”), that OCI USA Inc. contributed to OCIP in connection with the IPO. When used in the historical context for periods after the IPO Closing Date or when used in the present tense or future tense, those terms refer to OCIP and its subsidiary, OCIB. References to “our general partner” refer to OCI GP LLC, a Delaware limited liability company, and a direct, wholly-owned subsidiary of OCI USA Inc. References to “OCI” refer to OCI N.V., a Dutch public limited liability company, and its consolidated subsidiaries other than us, our subsidiaries and our general partner. References to “OCI USA” refer to OCI USA Inc., a Delaware corporation, which is an indirect, wholly-owned subsidiary of OCI. References to “OCI Fertilizer” refer to OCI Fertilizer International B.V., a Dutch private limited liability company, which is an indirect, wholly-owned subsidiary of OCI.
FORWARD-LOOKING STATEMENTS
This report contains forward-looking statements. Statements that are predictive in nature, that depend upon or refer to future events or conditions or that include the words “will,” “believe,” “expect,” “anticipate,” “intend,” “estimate” and other expressions that are predictions of or indicate future events and trends and that do not relate to historical matters identify forward-looking statements. Our forward-looking statements include statements about our business strategy, our industry, our expected revenues, our future profitability, our expected capital expenditures (including for maintenance or expansion projects and environmental expenditures) and the impact of such expenditures on our performance, and the costs of operating as a publicly traded partnership. These statements involve known and unknown risks, uncertainties and other factors, including the factors described under Item 1A—“Risk Factors” in this Annual Report that may cause our actual results and performance to be materially different from any future results or performance expressed or implied by these forward-looking statements. Such risks and uncertainties include, among other things:
| • | our ability to make cash distributions on our common units; |
| • | the volatile nature of our business, our ability to remain profitable and the variable nature of our cash distributions; |
| • | planned and unplanned downtime (including in connection with our debottlenecking project and maintenance turnarounds), shutdowns (either temporary or permanent) or restarts of existing methanol and ammonia facilities (including our own facility), including, without limitation, the timing and length of planned maintenance outages; |
| • | the ability of our general partner to modify or revoke our distribution policy at any time; |
| • | our ability to forecast our future financial condition or results of operations and our future revenues and expenses; |
| • | our reliance on a single facility for conducting our operations; |
| • | our limited operating history; |
| • | intense competition from other methanol and ammonia producers, including recent announcements by other producers, including other OCI affiliates, of their intentions to relocate, restart or construct methanol or ammonia plants in the Texas Gulf Coast region or elsewhere in the United States; |
| • | risks relating to our relationships with OCI or its affiliates, including competition from Natgasoline LLC, which plans to build a new methanol plant in Beaumont, Texas and Iowa Fertilizer Company, which is constructing a nitrogen fertilizer plant in Wever, Iowa; |
1
Table of Contents
| • | potential operating hazards from accidents, fire, severe weather, floods or other natural disasters; |
| • | our lack of contracts that provide for minimum commitments from our customers; |
| • | the cyclical nature of our business; |
| • | expected demand for methanol, ammonia and their derivatives; |
| • | expected methanol, ammonia and energy prices; |
| • | anticipated methanol and ammonia production rates at our plant; |
| • | our reliance on insurance policies that may not fully cover an accident or event that causes significant damage to our facility or causes extended business interruption; |
| • | our reliance on natural gas delivered to us by our suppliers, including a subsidiary of DCP Midstream Partners, LP (“DCP Midstream”) and a subsidiary of Kinder Morgan Energy Partners, L.P. (“Kinder Morgan”); |
| • | expected levels, timing and availability of economically priced natural gas and other feedstock supplies to our plant; |
| • | expected operating costs, including natural gas and other feedstock costs and logistics costs; |
| • | expected new methanol or ammonia supply or restart of idled plant capacity and timing for start-up of new or idled production facilities; |
| • | our expected capital expenditures; |
| • | the impact of regulatory developments on the demand for our products; |
| • | global and regional economic activity (including industrial production levels); |
| • | the dependence of our operations on a few third-party suppliers, including providers of transportation services and equipment; |
| • | the risk associated with changes, or potential changes, in governmental policies affecting the agricultural industry; |
| • | the hazardous nature of our products, potential liability for accidents involving our products that cause interruption to our business, severe damage to property or injury to the environment and human health and potential increased costs relating to the transport of our products; |
| • | our potential inability to obtain or renew permits; |
| • | existing and proposed environmental laws and regulations, including those relating to climate change, alternative energy or fuel sources, and the end-use and application of our products; |
| • | new regulations concerning the transportation of hazardous chemicals, risks of terrorism and the security of chemical manufacturing facilities; |
| • | our lack of asset and geographic diversification; |
| • | our dependence on a limited number of significant customers; |
| • | our ability to comply with employee safety laws and regulations; |
| • | the success of our debottlenecking project; |
| • | our potential inability to successfully implement our business strategies, including the completion of significant capital programs; |
| • | additional risks, compliance costs and liabilities from expansions or acquisitions; |
| • | our reliance on our senior management team; |
2
Table of Contents
| • | the potential shortage of skilled labor or loss of key personnel; |
| • | our ability to obtain debt or equity financing on satisfactory terms to fund additional acquisitions, expansion projects, working capital requirements and the repayment or refinancing of indebtedness; |
| • | restrictions in our debt agreements, including those on our ability to distribute cash or conduct our business; |
| • | potential increases in costs and distraction of management resulting from the requirements of being a publicly traded partnership; |
| • | exemptions we will rely on in connection with New York Stock Exchange corporate governance requirements; |
| • | control of our general partner by OCI; |
| • | the conflicts of interest faced by our senior management team, which manages both our business and the businesses of various affiliates of our general partner; |
| • | limitations on the fiduciary duties owed by our general partner to us and our limited partners under our partnership agreement; and |
| • | changes in our treatment as a partnership for U.S. federal income or state tax purposes. |
You should not place undue reliance on our forward-looking statements. Although forward-looking statements reflect our good faith beliefs, forward-looking statements involve known and unknown risks, uncertainties and other factors, which may cause our actual results, performance or achievements to differ materially from anticipated future results, performance or achievements expressed or implied by such forward-looking statements. We undertake no obligation to publicly update or revise any forward-looking statement, whether as a result of new information, future events, changed circumstances or otherwise, unless required by law.
3
Table of Contents
| ITEM | 1. BUSINESS |
OVERVIEW
We are a Delaware limited partnership formed in February 2013 to own and operate an integrated methanol and ammonia production facility that is strategically located on the Texas Gulf Coast near Beaumont.
We are currently one of the largest merchant methanol producers in the United States with a maximum annual methanol production capacity of approximately 730,000 metric tons. We also have a maximum annual ammonia production capacity of approximately 265,000 metric tons. During the first quarter of 2014, we began a debottlenecking project that includes a maintenance turnaround and environmental upgrades, which we collectively refer to as our “debottlenecking project.” This debottlenecking project is expected to increase our maximum annual methanol production capacity by 25% to approximately 912,500 metric tons and our maximum annual ammonia production capacity by 15% to approximately 305,000 metric tons. Beginning in January 2015, we shut down our facility, in order to complete our debottlenecking project. We expect to complete the project by the end of March 2015.
Both methanol and ammonia are global commodities that are essential building blocks for numerous end-use products. Methanol is a liquid petrochemical that is used in a variety of industrial and energy-related applications. The primary use of methanol is to make other chemicals, with approximately 60% of global methanol demand being used to produce formaldehyde, acetic acid and a variety of other chemicals that form the foundation of a large number of chemical derivatives. These derivatives are used to produce a wide range of products, including adhesives for the lumber industry, plywood, particle board and laminates, resins to treat paper and plastic products, and also paint and varnish removers, solvents for the textile industry and polyester fibers for clothing and carpeting. Energy related applications consume the remaining 40% of methanol demand. In recent years, there has been a strong demand for methanol in energy applications such as gasoline blending, biodiesel and as a feedstock in the production of dimethyl ether (“DME”) and Methyl tertiary-butyl ether (“MTBE”), particularly in China. Methanol blending in gasoline is currently not permitted in the United States, but outside of the United States, methanol is used as a direct fuel for automobile engines, as a fuel blended with gasoline and as an octane booster in reformulated gasoline. Ammonia, produced in anhydrous form (containing no water) from the reaction of nitrogen and hydrogen, constitutes the base feedstock for nearly all of the world’s nitrogen chemical production. In the United States, ammonia is primarily used as a feedstock to produce nitrogen fertilizers, such as urea and ammonium sulfate, and is also directly applied to soil as a fertilizer. In addition, ammonia is widely used in industrial applications, particularly in the Texas Gulf Coast market, including in the production of plastics, synthetic fibers, resins and numerous other chemical derivatives.
4
Table of Contents
Organizational Structure
The following diagram depicts our organizational structure as of March 16, 2015:
Our Facility
We purchase natural gas from third parties and process the natural gas into synthesis gas, which we then further process in the production of methanol and ammonia. We store and sell the processed methanol and ammonia to industrial and commercial customers for further processing or distribution.
Our integrated methanol and ammonia production facility is located on a 62-acre site south of Beaumont, Texas on the Neches River. We acquired our facility (which had been idled by the previous owners since 2004) in May 2011, commenced an upgrade that was completed in July 2012 and began operating our facility at full
5
Table of Contents
capacity in the fourth quarter of 2012. Our facility began ammonia production in December 2011 and began methanol production in July 2012, with revenues first generated from ammonia sales in the first quarter of 2012 and from methanol sales in the third quarter of 2012.
The following table sets forth our facility’s production capacity and storage capacity:
| Maximum Production Capacity as of December 31, 2014 |
Production during the Year Ended December 31, 2014 |
Expected Maximum Production Capacity after Completion of Debottlenecking Project |
Product Storage Capacity as of December 31, 2014 (Metric Tons) |
|||||||||||||||||||||
| Product |
Metric Tons/Day |
Metric Tons/Year (1) |
Metric Tons | Metric Tons/Day |
Metric Tons/Year (1) |
|||||||||||||||||||
| Methanol |
2,000 | 730,000 | 617,031 | 2,500 | 912,500 | 42,000 (2 tanks | ) | |||||||||||||||||
| Ammonia |
726 | 264,990 | 259,214 | 836 | 305,000 | 33,000 (2 tanks | ) | |||||||||||||||||
| (1) | Assumes facility operates 365 days per year. |
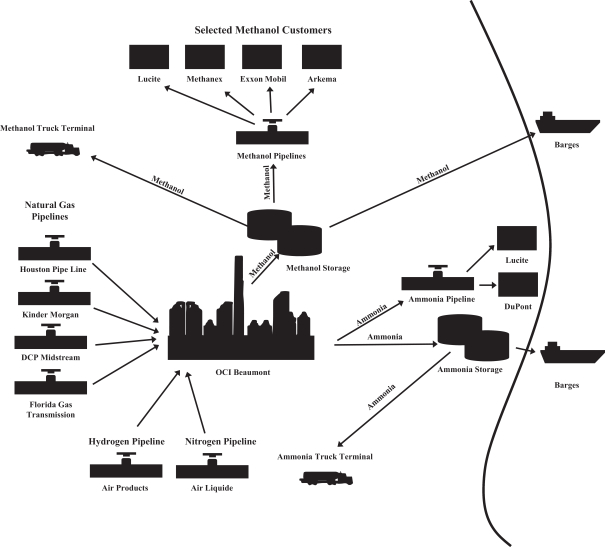
Our facility is located on the Texas Gulf Coast, which provides us access and connectivity to our existing and prospective customers and to natural gas feedstock supplies. Our facility is connected to established infrastructure and transportation facilities, including pipeline connections to adjacent customers and port access with dedicated methanol and ammonia export barge docks. In May 2014, we completed our state-of-the-art methanol truck loading facility, which has improved delivery options for our customers. We own a 15-acre tract of land adjacent to our facility that provides us access to an ammonia pipeline and the flexibility to install an ammonia truck and railcar loading facility. In addition, we also own a 19-acre tract of land adjacent to our facility that will serve as the future location of our corporate office.
We have connections to one major interstate and three major intrastate natural gas pipelines that provide us access to significantly more natural gas supply than our facility requires and flexibility in sourcing our natural gas feedstock. We are currently receiving our natural gas from the Kinder Morgan and DCP Midstream pipelines, and we have recently connected our facility to a natural gas pipeline owned by Florida Gas Transmission and a natural gas pipeline owned by Houston Pipe Line Company. Our facility is located in close proximity to many of our major customers, which allows us to deliver our products to those customers at competitive prices compared to overseas suppliers that are subject to significant transportation costs associated with transporting product to our markets.
The following table indicates ownership of the pipelines connected to our facility. Although we transport methanol and ammonia to various customers, we do not have ownership of all the pipelines that we use.
Manufactured Product:
| Pipeline |
Product |
Ownership | ||
| ExxonMobil/Arkema Pipeline | Methanol | OCI Partners LP | ||
| Oiltanking (Huntsman) | Methanol | OCI Partners LP | ||
| Lucite/DuPont | Ammonia | OCI Partners LP |
6
Table of Contents
Feedstocks:
| Pipeline |
Product |
Ownership | ||
| Kinder Morgan Pipeline | Natural Gas | Kinder Morgan | ||
| DCP Midstream Pipeline | Natural Gas | DCP Midstream | ||
| Florida Gas Transmission Natural Gas Pipeline | Natural Gas | OCI Partners LP/Florida Gas Transmission Company | ||
| Houston Pipeline | Natural Gas | Houston Pipe Line Company LP | ||
| Air Liquide Nitrogen Pipeline | Nitrogen | Air Liquide | ||
| Air Products Hydrogen Pipeline | Hydrogen | Air Products |
The following diagram illustrates key elements of our methanol and ammonia value chain:
7
Table of Contents
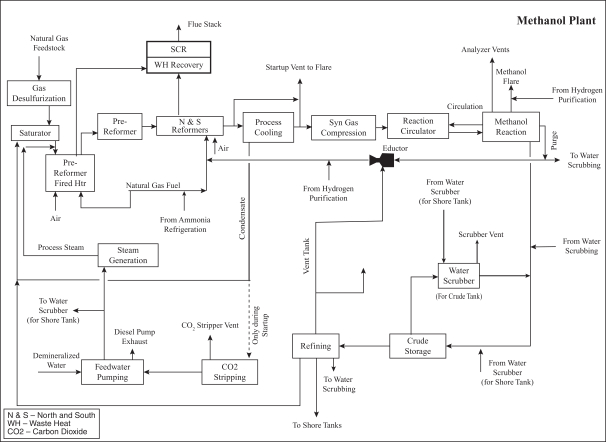
Our Methanol Production Unit
Our methanol production unit is a 730,000 metric ton per year unit that is comprised of Foster-Wheeler-designed twin steam methane reformers for synthesis gas production, two Lurgi-designed parallel low-pressure, water-cooled reactors and four distillation columns. Our debottlenecking project is expected to increase the maximum annual production capacity of our methanol production unit by approximately 25%. Our methanol production unit contains two 21,000 metric ton storage tanks. In addition, our methanol production unit has a crude methanol surge tank, refined receiver tank, storage tank scrubber and crude tank scrubber. During the year ended December 31, 2014, our methanol production unit produced approximately 617,031 metric tons of methanol. We expect our methanol production unit to undergo an approximate four-week turnaround once approximately every four years. Please see below for a simplified process flow diagram.
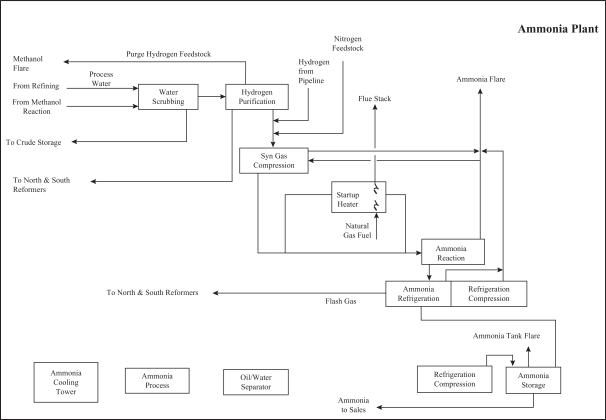
Our Ammonia Production Unit
Our ammonia production unit is a 264,990 metric ton per year unit. Our debottlenecking project is expected to increase the maximum annual production capacity of our ammonia production unit by approximately 15%. The Haldor-Topsøe-designed ammonia synthesis loop at our facility processes hydrogen produced by our methanol production process as the feedstock to produce ammonia. Our ammonia production unit also uses hydrogen we purchase from third parties to supplement the hydrogen produced by our methanol production process. Our ammonia production unit contains two refrigerated ammonia storage tanks with a combined storage capacity of 33,000 metric tons. During the year ended December 31, 2014, our ammonia production unit produced approximately 259,214 metric tons of ammonia. We expect our ammonia production unit to undergo an
8
Table of Contents
approximate four-week turnaround once approximately every four years coinciding with the turnaround of our methanol production unit. Please see below for a simplified process flow diagram.
Our Initial Upgrade of the Original Facility
We commenced an upgrade of our facility in May 2011 that was completed in July 2012. In connection with our upgrade, we installed an advanced distributed control system at our facility to efficiently control our integrated production process. We opened, inspected and hydrostatically tested all of the static equipment at our facility. We also hydrostatically tested the piping at our facility and performed other integrity tests, including thickness measurements, and we replaced connecting gaskets and bolts and any out-of-code piping. We completely refurbished our rotating equipment, including pumps, compressors and fans, and we cleaned and, if necessary, re-tubed our heat exchangers. In addition, our storage tanks were emptied, cleaned and inspected. Moreover, our furnaces were inspected and the related burners and refractory were overhauled. After completing our upgrades, our methanol and ammonia production units underwent commissioning and testing of the safety interlocks.
Our Debottlenecking Project
As a means of maximizing our production efficiencies and reducing our energy consumption, we are in the final stages of a debottlenecking project on our production facility that includes a maintenance turnaround and environmental upgrades, which we collectively refer to as our “debottlenecking project.” This project is expected to increase our maximum annual methanol production capacity by 25% to approximately 912,500 metric tons and our maximum annual ammonia production capacity by 15% to approximately 305,000 metric tons. Beginning in January 2015, we shut down our facility in order to complete our debottlenecking project. We
9
Table of Contents
expect to complete the project by the end of March 2015. As of December 31, 2014, we had incurred approximately $228.0 million in total expenditures ($175.6 million in cash expenditures) related to our debottlenecking project, as shown in the table below.
Below is a summary of the debottlenecking project costs incurred as of December 31, 2014:
Debottlenecking Project Costs
As of December 31, 2014
(in millions)
| Project Expenditures paid as of December 31, 2014 |
$ | 175.6 | ||
| Accrued Project Expenditures |
46.0 | |||
| Capitalized Interest |
6.4 | |||
|
|
|
|||
| Total |
$ | 228.0 | ||
|
|
|
On November 10, 2014, the Partnership received a capital contribution of $60.0 million from OCIP Holding LLC (“OCIP Holding”), an indirect, wholly-owned subsidiary of OCI, to provide a portion of the estimated remaining funding required to complete the debottlenecking project, and, in exchange, the Partnership issued 2,995,372 common units to OCIP Holding. Please read “Management’s Discussion and Analysis of Financial Condition and Results of Operations—Liquidity and Capital Resources—Credit Facilities” and note 7 to the consolidated financial statements included in this report for additional information.
In connection with our third quarter 2014 earnings release, we disclosed that our then-current estimate of the total cost of the debottlenecking project and concurrent turnaround was approximately $240.0 million to $250.0 million. Although we are nearing completion of the debottlenecking project, substantial work is ongoing and we believe that additional costs are likely to be incurred in excess of our previously estimated range. We have sufficient funding available from our sponsor, OCI, including our Intercompany Equity Commitment (as defined in note 7 to the consolidated financial statements) and Intercompany Term Facility (as defined in note 6(a) to the consolidated financial statements), to fund any reasonably anticipated additional costs related to the debottlenecking project. Please read “Management’s Discussion and Analysis of Financial Condition and Results of Operations—Liquidity and Capital Resources—Credit Facilities” included in this report for additional information.
As part of our debottlenecking project, we have completed or will undertake the following:
| • | install a selective catalytic reduction unit; |
| • | replace reformer tubes, which will result in increased synthesis gas production; |
| • | install a pre-reformer; |
| • | install a saturator; |
| • | install an additional flare; |
| • | modify the synthesis gas compressor and steam turbine to handle the increased volume of synthesis gas; |
| • | modify the convection section and the heat exchangers; |
| • | replace refractories; |
| • | increase the capacity of the synthesis gas compressor and the refrigeration compressor on our ammonia production unit and replace several heat exchangers and vessels to handle the higher volume; and |
| • | replace and/or refurbish equipment that caused unplanned downtime. |
10
Table of Contents
The goal of our debottlenecking project is to maximize our production capacity and reduce our energy consumption. As part of the debottlenecking project, we will complete a maintenance turnaround as well as various mandatory and discretionary environmental upgrades to the facility. In June 2013, we entered into a procurement and construction contract with Orascom E&C USA Inc., an indirect, wholly-owned construction subsidiary of OCI, for our debottlenecking project. Please read Item 13—“Certain Relationships and Related Transactions, and Director Independence—Construction Agreement with Orascom E&C USA Inc.” and note 7 to the consolidated financial statements included in this report for additional information.
Feedstock Supply
The primary feedstock that we use to produce methanol and ammonia is natural gas. Operating at full capacity, our methanol and ammonia production units together require approximately 80,000 to 90,000 MMBtu per day of natural gas, as of December 31, 2014. For the year ended December 31, 2014, natural gas feedstock costs represented approximately 59.6% of our cost of goods sold (exclusive of depreciation). Accordingly, our profitability depends in large part on the price of our natural gas feedstock. Please read Item 7A—“Quantitative and Qualitative Disclosure about Market Risk” included in this report for additional information.
We have connections to one major interstate and three major intrastate natural gas pipelines that provide us access to significantly more natural gas supply than our facility requires and flexibility in sourcing our natural gas feedstock. We are currently receiving our natural gas from the Kinder Morgan and DCP Midstream pipelines, and we have recently connected our facility to a natural gas pipeline owned by Florida Gas Transmission and a natural gas pipeline owned by Houston Pipe Line Company. We believe that we have ready access to an abundant supply of natural gas for the foreseeable future due to our location and connectivity to major natural gas pipelines.
We procure our hydrogen and nitrogen supply needs from Air Products LLC (“Air Products”) and Air Liquide Large Industries U.S. LP (“Air Liquide”), respectively. Our supply contract with Air Products provides for 25.0 MMscf per day of hydrogen and expires in 2021. The price we pay under the Air Products contract is linked to natural gas prices. Our supply contract with Air Liquide provides for up to 20.4 MMscf of nitrogen per day, expiring in 2023. The price we pay under our contract with Air Liquide is based on a combination of the cost of electric power, average gross hourly earnings and the latest value of the U.S. Bureau of Statistics Producer Price Index for Industrial Commodities.
Customers and Contracts
We generate our revenues from the sale of methanol and ammonia manufactured at our facility. We sell our products, primarily under contract, to industrial users and commercial traders for further processing or distribution. For the years ended December 31, 2014 and 2013, we derived approximately 58.4% and 64.4%, respectively, of our revenues from the sale of our products to commercial traders for further processing or distribution and derived approximately 41.6% and 35.6%, respectively, of our revenues from the sale of our products to industrial users. In addition, we derive a portion of our revenues from uncontracted ammonia sales. For the years ended December 31, 2014 and 2013, we derived approximately 0% and 3%, respectively, of our revenues from uncontracted sales of ammonia.
We are party to methanol sales contracts with Methanex, Koch Methanol LLC, ExxonMobil, Arkema and Lucite. Our customers have no minimum volume purchase obligations under these contracts, may determine not to purchase any more methanol from us at any time and may purchase methanol from other suppliers. Consistent with industry practice, our methanol sales contracts set our pricing terms to reflect a specified discount to a published monthly benchmark methanol price (Argus or Southern Chemical), and our methanol is sold on an Free on Board (“FOB”) basis when transported by barge, pipeline, and our methanol truck loading facility. The payment terms under our methanol sales contacts are net 25-30 days. For the year ended December 31, 2014, methanol sales contracts with Methanex and Koch Methanol LLC accounted for approximately 32.7% and
11
Table of Contents
21.0%, respectively, of our total revenues. For the year ended December 31, 2013, methanol sales contracts with Methanex and Koch Methanol LLC accounted for approximately 33.6% and 23.0%, respectively, of our total revenues.
We are party to ammonia sales contracts with Rentech, Koch Nitrogen LLC, Trammo, Inc. (f/k/a Transammonia), Lucite, and DuPont. Our customers have no minimum volume purchase obligations under these contracts, may determine not to purchase any more ammonia from us at any time and may purchase ammonia from other suppliers. Consistent with industry practice, these contracts set our pricing terms to reflect a specified discount to a published monthly benchmark ammonia price (CFR Tampa), and our ammonia is sold on an FOB basis when delivered by barge and pipeline. The payment terms under our ammonia sales contacts are net 30 days. For the year ended December 31, 2014, ammonia sales contracts with Rentech and Trammo accounted for approximately 14.9% and 5.2%, respectively, of our total revenues. For the year ended December 31, 2013, ammonia sales contracts with Rentech and Trammo accounted for approximately 12.4% and 15.4%, respectively, of our total revenues.
During the year ended December 31, 2014, we delivered approximately 49.4% of our total sales by barge, 48.6% of our total sales by pipeline, and approximately 2.0% of our total sales through our truck loading facility.
Competition
The industries in which we operate are highly competitive. Methanol and ammonia are global commodities, and we compete with a number of domestic and foreign producers of methanol and ammonia. In addition, a long period of low natural gas prices in the United States has made it economical for companies to upgrade existing plants and initiate construction of new methanol and nitrogen projects. For example, Methanex, Celanese Corporation (“Celanese”), Valero Energy Corporation (“Valero”), and OCI have each announced plans to relocate, restart or construct methanol plants in the U.S. Gulf Coast region over the next few years, which will increase overall U.S. production capacity and the availability of methanol supply to our customers from competing sources. However, over the past three years, several nitrogen projects have been cancelled as a result of higher capital expenditure estimates than originally anticipated. For example, in the first quarter of 2014, a large chemical company abandoned its standalone ammonia project in Victoria, Texas, which was originally announced in August 2013.
While the methanol and ammonia industries are global in nature, we believe that our strategic location on the Texas Gulf Coast positions us as a key local supplier. Our proximity to customers and access to major infrastructure and transportation facilities, including pipeline connections to adjacent customers and port access with dedicated methanol and ammonia barge docks, provide us with as a competitive advantage over other suppliers. Furthermore, because the majority of our competitors are based outside of the United States or are commodity traders, we believe that we are well positioned to offer our products at attractive prices to our customers while maintaining strong margins in the near term.
The majority of methanol consumed in the U.S. Gulf Coast is either sourced from Trinidad or produced in-house by U.S.-based chemical companies as part of a vertically integrated industrial process. Producers in Trinidad have been facing significant natural gas feedstock shortages, thereby reducing the supply of all natural gas-based products from Trinidad to the United States. Furthermore, we believe that transportation and port-handling costs for methanol imported from Trinidad and other countries provide us with a cost advantage over foreign producers.
Similarly, the majority of ammonia consumed in our market is sourced overseas, particularly from Trinidad, and is transported through the U.S. Gulf Coast. Our close proximity to our customers allows us to maintain a significant cost advantage over foreign producers that import ammonia into the U.S. Gulf Coast. Ammonia sourced from Trinidad accounts for approximately 60% of total imported ammonia in the United States. Although ammonia sourced from Trinidad historically enjoyed a competitive cost advantage, natural gas supply
12
Table of Contents
shortages and higher production costs in recent years have eroded this competitive advantage. Furthermore, we believe that transportation and port-handling costs for all imported ammonia provide us with a cost advantage over foreign producers.
Our major competitors in the methanol industry include Methanex, Koch Methanol, Mitsui, Mitsibushi and Southern Chemical Corporation and our major competitors in the ammonia industry include Agrium, Koch Nitrogen, Potash Corporation and CF Industries. Based on 2014 data regarding total United States use of methanol and ammonia, we estimate that our production in 2014 represented approximately 11.0% and 1.6%, respectively, of total United States methanol and ammonia use.
Seasonality and Volatility
While most U.S. methanol is sold pursuant to long-term contracts based on market index pricing and fixed volumes, the market price of methanol can be volatile. Methanol is an internationally traded commodity chemical, and the methanol industry has historically been characterized by cycles of oversupply caused by either excess supply or reduced demand, resulting in lower prices and idling of capacity, followed by periods of shortage and rising prices as demand exceeds supply until increased prices lead to new plant investment or the restart of idled capacity. Methanol prices have historically been cyclical and sensitive to overall production capacity relative to demand, the price of feedstock (primarily natural gas or coal), energy prices and general economic conditions.
The seasonality of the U.S. ammonia business largely tracks the seasonality of the fertilizer business in the United States because the substantial majority of all domestic ammonia consumption in the United States is for fertilizer use. The fertilizer business is seasonal, based upon the planting, growing and harvesting cycles. Inventories must be accumulated to allow for customer shipments during the spring and fall fertilizer application seasons, which require significant storage capacity. The accumulation of inventory to be available for seasonal sales requires fertilizer producers to maintain significant working capital. This seasonality generally results in higher fertilizer prices during peak periods, with prices normally reaching their highest point in the spring, decreasing in the summer, and increasing again in the fall. Fertilizer products are sold both on the spot market for immediate delivery and under product prepayment contracts for future delivery at fixed prices. The terms of the product prepayment contracts, including the percentage of the purchase price paid as a down payment, can vary from season to season. Variations in the proportion of product sold through forward sales and variations in the terms of the product prepayment contracts can increase the seasonal volatility of fertilizer producers’ cash flows and cause changes in the patterns of seasonal volatility from year to year. Nitrogen fertilizer prices can also be volatile as a result of a number of other factors, including weather patterns, field conditions, quantities of fertilizers imported to the United States, current and projected grain inventories and prices and fluctuations in natural gas prices. In addition, governmental policies may directly or indirectly influence the number of acres planted, the level of grain inventories, the mix of crops planted and crop prices, which would also affect nitrogen fertilizer prices.
Environmental Matters
Our business is subject to extensive and frequently changing federal, state and local, environmental, health and safety regulations governing the emission and release of hazardous substances into the environment, the treatment and discharge of waste water and the storage, handling, use and transportation of our methanol and ammonia. These laws include the federal Clean Air Act (“CAA”), the federal Water Pollution Control Act (also known as the Clean Water Act, or the “CWA”), the Resource Conservation and Recovery Act, the Comprehensive Environmental Response, Compensation and Liability Act (“CERCLA”), the Toxic Substances Control Act and various other federal, state and local laws and regulations. These laws, their underlying regulatory requirements and the enforcement thereof impact us by imposing:
| • | restrictions on operations or the need to install enhanced or additional controls; |
| • | the need to obtain and comply with permits and authorizations; |
13
Table of Contents
| • | liability for the investigation and remediation of contaminated soil and groundwater at current and former facilities (if any) and off-site waste disposal locations; and |
| • | specifications for the products we market. |
Our operations require numerous permits and authorizations. Failure to comply with these permits or environmental laws generally could result in substantial fines, penalties or other sanctions, court orders to install pollution-control equipment, permit revocations and facility shutdowns. In addition, environmental, health and safety laws may impose joint and several liability, without regard to fault, for cleanup costs on potentially responsible parties who have released or disposed of hazardous substances into the environment. We may experience delays in obtaining or be unable to obtain required permits, which may delay or interrupt our operations and limit our growth and revenue. Private parties, including the owners of properties adjacent to other facilities where our wastes are taken for disposal, also may have the right to pursue legal actions to enforce compliance as well as to seek damages for non-compliance with environmental laws and regulations or for personal injury or property or natural resource damage. In addition, the risk of accidental spills or releases could expose us to significant liabilities that could have a material adverse effect on our business, financial condition, results of operations and cash flows.
The laws and regulations to which we are subject are complex, change frequently and have tended to become more stringent over time. The ultimate impact on our business of complying with existing laws and regulations is not always clearly known or determinable due in part to the fact that our operations may change over time and certain implementing regulations for laws, such as the CAA, have not yet been finalized, are under governmental or judicial review or are being revised. These laws and regulations could increase our capital, operating and compliance costs.
Our facility has experienced some level of regulatory scrutiny in the past, and we may be subject to further regulatory inspections, future requests for investigation or assertions of liability relating to environmental issues. In the future, we could incur material liabilities or costs related to environmental matters, and these environmental liabilities or costs (including fines or other sanctions) could have a material adverse effect on our results of operations, financial condition and ability to make cash distributions.
The principal environmental regulations and risks associated with our business are outlined below.
The Federal Clean Air Act. The CAA and its implementing regulations, as well as the corresponding state laws and regulations that regulate emissions of pollutants into the air, affect us through the CAA’s permitting requirements and emission control requirements relating to specific air pollutants, as well as the requirement to maintain a risk management program to help prevent accidental releases of certain substances. Some or all of the standards promulgated pursuant to the CAA, or any future promulgations of standards, may require the installation of controls or changes to our facility in order to comply. If new controls or changes to operations are needed, the costs could be significant. In addition, failure to comply with the requirements of the CAA and its implementing regulations could result in fines, penalties or other sanctions.
The regulation of air emissions under the CAA requires that we obtain various construction and operating permits, including Title V and Prevention of Significant Deterioration (“PSD”) air permits issued by the Texas Commission on Environmental Quality (the “TCEQ”). Requirements under these permits will cause us to incur capital expenditures for the installation of certain air pollution control devices at our operations. Various regulations specific to our operations have been implemented, such as National Emission Standard for Hazardous Air Pollutants, New Source Performance Standards and New Source Review. We have incurred, and expect to continue to incur, substantial capital expenditures to maintain compliance with these and other air emission regulations that have been promulgated or may be promulgated or revised in the future, including in connection with the projects discussed below under “—Material Estimated Capital Expenditures for Environmental Matters” that are designed to comply with our emission limits and requirements of our Title V CAA permit.
14
Table of Contents
Release Reporting. The release of hazardous substances or extremely hazardous substances into the environment is subject to release reporting requirements under federal and state environmental laws, including the Emergency Planning and Community Right-to-Know Act. We occasionally experience minor releases of hazardous or extremely hazardous substances from our equipment. We report such releases to the U.S. Environmental Protection Agency (the “EPA”), TCEQ and other relevant state and local agencies as required by applicable laws and regulations. If we fail to properly report a release, or if the release violates the law or our permits, it could cause us to become the subject of a governmental enforcement action or third-party claims. Government enforcement or third-party claims relating to releases of hazardous or extremely hazardous substances could result in significant expenditures and liability.
Clean Water Act. The CWA and analogous state laws impose restrictions and strict controls with respect to the discharge of pollutants, including spills and leaks of oil and other substances, into regulated waters. The discharge of pollutants into regulated waters is prohibited, except in accordance with the terms of a permit issued by the EPA or an analogous state agency. The CWA and regulations implemented thereunder also prohibit the discharge of dredge and fill material into regulated waters, including wetlands, unless authorized by an appropriately issued permit. In addition, the CWA and analogous state laws require individual permits or coverage under general permits for discharges of storm water runoff from certain types of facilities. Spill prevention, control and countermeasure requirements of federal laws require appropriate containment berms and similar structures to help prevent the contamination of navigable waters by a petroleum hydrocarbon tank spill, rupture or leak. Federal and state regulatory agencies can impose administrative, civil and criminal penalties for non-compliance with discharge permits or other requirements of the CWA and analogous state laws and regulations.
Greenhouse Gas Emissions. Currently, legislative and regulatory measures to address greenhouse gas (“GHG”) emissions (including CO2, methane and nitrous oxides) are in various phases of discussion or implementation. At the federal legislative level, Congress has previously considered legislation requiring a mandatory reduction of GHG emissions. Although Congressional passage of such legislation does not appear likely at this time, it could be adopted at a future date. It is also possible that Congress may pass alternative climate change bills that do not mandate a nationwide cap-and-trade program and instead focus on promoting renewable energy and energy efficiency.
In the absence of congressional legislation curbing GHG emissions, the EPA is moving ahead administratively under its CAA authority. In October 2009, the EPA finalized a rule requiring certain large emitters of GHGs to inventory and report their GHG emissions to the EPA. In accordance with the rule, we monitor our GHG emissions from our facility and have reported the emissions to the EPA annually beginning in September 2011. On December 7, 2009, the EPA finalized its “endangerment finding” that GHG emissions, including CO2, pose a threat to human health and welfare. The finding allows the EPA to regulate GHG emissions as air pollutants under the CAA. In May 2010, the EPA finalized the “Greenhouse Gas Tailoring Rule,” which establishes new GHG emissions thresholds that determine when stationary sources, such as our facility, must obtain permits under the PSD and Title V programs of the CAA. The permitting requirements of the PSD program apply only to newly constructed or modified major sources. Obtaining a PSD or Title V permit requires a source to install best available control technology (“BACT”) for those regulated pollutants that are emitted in certain quantities. In June 2014, the U.S. Supreme Court recently invalidated that portion of the rule that would require facilities that only emitted GHG emissions (and not other regulated pollutants) in excess of specified thresholds to obtain PSD and Title V permits. Sources that emit other regulated pollutants in excess of specified thresholds that also trigger greenhouse gas emissions thresholds still must obtain a PSD permit for greenhouse gas emissions. Our debottlenecking project is a major modification for other pollutants, which require us to obtain a PSD permit for greenhouse gas emissions. We received our PSD permit from the EPA in August 2014.
On May 21, 2013, the Texas Legislature passed H.B. 788 which is intended to streamline GHG permitting in Texas by directing the TCEQ to promulgate rules to be approved by the EPA that would replace EPA
15
Table of Contents
permitting of GHGs in Texas with TCEQ permitting. The bill was signed by the Governor of Texas on June 14, 2013 and is effective. The TCEQ adopted regulations to implement H.B. 788 on March 26, 2014, that went into effect on April 17, 2014. The EPA approved TCEQ’s greenhouse gas permitting program on October 31, 2014. We are evaluating the potential impact of these regulations on our business, but it is not anticipated that they will have a material adverse effect on our operations.
The implementation of additional EPA regulations and/or the passage of federal or state climate change legislation will likely result in increased costs to (i) operate and maintain our facilities, (ii) install new emission controls on our facilities and (iii) administer and manage any GHG emissions program. Increased costs associated with compliance with any future legislation or regulation of GHG emissions, if it occurs, may have a material adverse effect on our results of operations, financial condition and ability to make cash distributions. In addition, climate change legislation and regulations may result in increased costs not only for our business but also for our customers that utilize our products, thereby potentially decreasing demand for our products. Decreased demand for our products may have a material adverse effect on our results of operations, financial condition and ability to make cash distributions.
Environmental Remediation. Under CERCLA and related state laws, certain persons may be liable for the release or threatened release of hazardous substances. These persons can include the current owner or operator of property where a release or threatened release occurred, any persons who owned or operated the property when the release occurred and any persons who disposed of, or arranged for the transportation or disposal of, hazardous substances at a contaminated property. Liability under CERCLA is strict, retroactive and, under certain circumstances, joint and several, so that any responsible party may be held liable for the entire cost of investigating and remediating the release of hazardous substances. As is the case with all companies engaged in similar industries, depending on the underlying facts and circumstances, we face potential exposure from future claims and lawsuits involving environmental matters, including soil and water contamination, personal injury or property damage allegedly caused by hazardous substances that we manufactured, handled, used, stored, transported, spilled, disposed of or released. We cannot assure you that we will not become involved in future proceedings related to our release of hazardous or extremely hazardous substances or that, if we were held responsible for damages in any existing or future proceedings, such costs would be covered by insurance or would not be material.
Government Assessments of Methanol. In September 2013, EPA issued a final Toxicological Review of Methanol under its Integrated Risk Information System (“IRIS”). This Review concluded that daily exposures to the human population (including sensitive subgroups) are “likely to be without an appreciable risk of deleterious effectives during a lifetime”. This Review did not address carcinogenicity, however, which is the subject of a separate IRIS process with a completion date yet to be determined. The European Chemicals Agency (“ECHA”) is currently evaluating two proposals pertaining to methanol: (1) a proposal from Italy and Holland that methanol be reclassified to include Reproductive Toxicity Category 1B and (2) a proposal from Poland to restrict the sale of methanol to the general public and to limit its presence as an additive in consumer products. Any ECHA decision to endorse either proposal could result in action by the European Commission to restrict methanol sales and uses for certain markets and products, which could have a material adverse effect on our business.
Derivatives of Methanol—Formaldehyde. Methanol has many commercial uses, including as a building block to manufacture formaldehyde, among other chemicals. Formaldehyde is a component of resins used as wood adhesives and as a raw material for engineering plastics and a variety of other products, including elastomers, paints, building products, foams, polyurethane and automotive products. As discussed below, changes in environmental, health and safety laws, regulations or requirements relating to formaldehyde are being considered, and if adopted, could restrict formaldehyde uses and exposures, and as a result, could lead to a material adverse impact on our business by reducing the demand for methanol to manufacture formaldehyde.
Formaldehyde has been classified as a known human carcinogen by the International Agency for Research on Cancer and as a probable human carcinogen by EPA. On July 7, 2010, President Obama signed the
16
Table of Contents
Formaldehyde Standards for Composite Wood Products Act into law. This legislation, which adds a Title VI to the Toxic Substances Control Act, establishes limits for formaldehyde emissions from composite wood products and requires EPA to evaluate and establish limits for other types of wood products. EPA has proposed two regulations to implement this Act: (1) formaldehyde emissions standards for hardwood plywood, medium-density fiberboard, particleboard, and finished goods containing these products that are sold, supplied, offered for sale, or manufactured (including imported) in the United States and (2) a third-party certification program to assure compliance by composite wood panel producers with the formaldehyde emissions limits established directly in the Act. EPA has indicated that it plans to finalize these regulations in September of 2015.
As of April 1, 2015, formaldehyde will be reclassified in the European Union as a category 1B carcinogen. No decision has yet been made, however, whether this reclassification will result in obligations or restrictions under REACH, including in particular whether formaldehyde should be designated as a Substance of Very High Concern Candidate.
Derivatives of Methanol—methyl tertiary butyl ether (“MTBE”). Changes in environmental, health and safety laws, regulations or requirements could also impact methanol demand for the production of MTBE. Several years ago, environmental concerns and legislative action related to gasoline leaking into water supplies from underground gasoline storage tanks in the United States resulted in the phase-out of MTBE as a gasoline additive in the United States. However, methanol is used in the United States to produce MTBE for export markets, where demand for MTBE has continued at strong levels. While we currently expect demand for methanol for use in MTBE production in the United States to remain steady or to decline slightly, it could decline materially if export demand is impacted by governmental legislation or policy changes. The EPA is currently reviewing the human health effects of MTBE, including its potential carcinogenicity. The European Union issued a final risk assessment report on MTBE in 2002 that permitted the continued use of MTBE, although several risk reduction measures relating to the storage and handling of fuels were recommended. Governmental efforts in recent years in some countries, primarily in the European Union and Latin America, to promote biofuels and alternative fuels through legislation or tax policy are also putting competitive pressures on the use of MTBE in gasoline in these countries. Declines in demand for methanol for use in MTBE production could have an adverse impact on our results of operations, financial condition and ability to make cash distributions.
Material Estimated Capital Expenditures for Environmental Matters. We incurred approximately $27.5 million and $9.9 million in capital expenditures for the years ended December 31, 2014 and 2013, respectively, relating to the installation of a selective catalytic reduction (“SCR”) unit for nitrogen oxide control; the installation of a saturator column system to improve plant efficiency, decrease nitrogen oxide emissions and decrease wastewater treatment from distillation; and the installation of a new flare to decrease carbon monoxide emissions during start-ups and shutdowns of our facility. We expect to incur approximately $4.0 million in capital expenditures on equipment relating to the SCR unit, the saturator column system and an additional flare for the year ending December 31, 2015. We received the Standard Permit authorization for the SCR unit on February 6, 2014. This authorization is independent from the final NSR permit authorization for the remainder of the debottlenecking project. These capital expenditures will assist us in complying with federal, state and local environmental, health and safety regulations.
Safety, Health and Security Matters
We are subject to a number of federal and state laws and regulations related to safety, including the Occupational Safety and Health Act (“OSHA”), and comparable state statutes, the purpose of which are to protect the health and safety of workers. We also are subject to OSHA Process Safety Management regulations, which are designed to prevent or minimize the consequences of catastrophic releases of toxic, reactive, flammable or explosive chemicals. These regulations apply to any process that involves a chemical at or above the specified thresholds or any process that involves flammable liquid or gas, pressurized tanks, caverns and wells in excess of 10,000 pounds at various locations. We have an internal safety, health and security program designed to monitor and enforce compliance with worker safety requirements, and we routinely review and
17
Table of Contents
consider improvements in our programs. We also are subject to EPA Chemical Accident Prevention Provisions, known as the Risk Management Plan requirements, which are designed to prevent the accidental release of toxic, reactive, flammable or explosive materials, and the U.S. Coast Guard’s Maritime Security Standards for Facilities, which are designed to regulate the security of high-risk maritime facilities.
Employees
We are managed and operated by the board of directors and executive officers of OCI GP LLC, our general partner. Neither we nor our subsidiary have any employees. Our general partner has the sole responsibility for providing the employees and other personnel necessary to conduct our operations. All of the employees that conduct our business are employed by our general partner or its affiliates. Our general partner and its affiliates have approximately 120 employees performing services for our operations. We believe that our general partner and its affiliates have a satisfactory relationship with those employees.
Insurance
Our assets may experience physical damage as a result of an accident or natural disaster. These hazards can also cause personal injury and loss of life, severe damage to and destruction of property and equipment, pollution or environmental damage, and suspension of operations. We are currently insured under casualty, environmental, property and business interruption insurance policies. The following conversions from Euros to U.S. dollars with respect to our insurance policies are based on a conversion rate of €1.00 to $1.33641 as of August 3, 2014, as reported by Oanda. The property and business interruption insurance policies have a €450 million (or approximately $601.4 million) limit, with a €500,000 (or approximately $668,205) deductible for physical damage (€500,000 (or approximately $668,205) for property damage from a major machinery breakdown). Business interruption losses are subject to an annual aggregate of $23.4 million that is applied to the business interruption deductible and an annual time aggregate of 30 working days. Once the annual aggregate is exhausted, the fall back deductible of €2.3 million (or approximately $3.1 million) is applied per occurrence.
Our current property policy contains a specific sub-limit of €100 million (or approximately $133.6 million) for losses due to physical damage and business interruptions caused by machinery breakdown. Our current excess property policy contains a limit of €350 million (or approximately $467.7 million) for damage caused by fire, lightning, explosion or aircraft to be triggered once the €450 million (or approximately $601.4 million) primary policy is consumed, and €48.5 million (or approximately $66.1 million using a contracted exchange rate of €1.00 to $1.3637) for damage caused by named windstorm. Our current named windstorm property policy contains an additional limit of $85.0 million for damage caused by named windstorms to be triggered once the €48.5 million (or approximately $66.1 million using a contracted exchange rate of €1.00 to $1.3637) primary policy is consumed. We are fully exposed to all losses in excess of the applicable limits and sub-limits and for losses due to business interruptions caused by machinery breakdown of fewer than 30 days and less than $23.4 million plus the fall back deductible of €2.3 million (or approximately $3.1 million) per occurrence. With regard to environmental claims due to pollution, we currently have a policy limit of $25 million, and this policy has a deductible of $250,000. Our current construction floater policy contains a specific limit of $18.5 million for losses incurred during the construction of any equipment or facilities at our site. As we continue to grow, we will continue to evaluate our policy limits and risk retentions as they relate to the overall cost and scope of our insurance program.
During July and August 2013, we experienced 13 days of unplanned downtime as we took our methanol unit offline to repair its syngas machine, including replacing a rotor and installing new bearings. Our claim for losses associated with this unplanned downtime was approximately $11.3 million with a target net recovery of approximately $6.4 million (after incurring a deductible of approximately $4.9 million). We received insurance proceeds of $5.1 million in connection with this insurance claim during the fourth quarter of 2013, and the effect of the receipt of these insurance proceeds was included in other income (expense) in our consolidated statement of operations for the year ended December 31, 2013. On April 15, 2014, we reached a final settlement under this
18
Table of Contents
insurance claim, whereby the insurance provider agreed and paid a final installment of $0.6 million, and the effect of the receipt of these insurance proceeds is presented in other income (expense) in the accompanying consolidated statement of operations.
Available Information
Our website address is www.ocipartnerslp.com. Our Annual Report on Form 10-K, Quarterly Reports on Form 10-Q, Current Reports on Form 8-K and amendments to those reports are available free of charge through our website under “Investor and Media Relations,” as soon as reasonably practical after they are filed with or furnished to the SEC. In addition, our Corporate Governance Guidelines, Code of Business Conduct and Ethics and the Charter of the Audit Committee and the Conflicts Committee of the Board of Directors of our general partner are available on our website. These guidelines, policies and charters are also available in print without charge to any unitholder requesting them. Materials we file with the SEC may be read and copied at the SEC’s Public Reference Room at 100 F Street, NE, Washington, D.C. 20549. Information on the operation of the Public Reference Room may be obtained by calling the SEC at 1-800-SEC-0330. The SEC also maintains an Internet website at www.sec.gov that contains reports, proxy and information statements and other information regarding issuers that file electronically with the SEC. The information contained on our website does not constitute part of this report.
| ITEM | 1A—RISK FACTORS |
Set forth below are certain risk factors related to our business, our partnership structure and tax matters. Actual results could differ materially from those anticipated as a result of these and various other factors, including those set forth in our other periodic and current reports filed with the SEC from time to time. If any risks or uncertainties develop into an actual event, our business, financial condition, cash flow or results of operations could be materially adversely affected. In that case, the trading price of our common units could decline and you could lose all or part of your investment. The risks described in this report are not the only risks we face. Additional risks and uncertainties not currently known to us or that we currently deem to be immaterial may materially adversely affect our business, cash flow and ability to make cash distributions to our unitholders.
Risks Related to Our Business
We may not have sufficient cash available for distribution to pay any quarterly distribution on our common units.
We may not have sufficient cash available for distribution each quarter to enable us to pay any distributions to our common unitholders. The amount of cash we will be able to distribute on our common units principally depends on the amount of cash we generate from our operations, which is directly dependent upon the operating margins we generate. Our profit margins are significantly affected by the level of our cost of goods sold (exclusive of depreciation), including the cost of natural gas, our primary feedstock, as well as the costs of hydrogen and nitrogen and other costs, the market-driven prices for methanol and ammonia we are able to charge our customers, seasonality, weather conditions, governmental regulation and global and domestic economic conditions and demand for methanol and ammonia, among other factors. In addition, our results of operations and our ability to pay distributions are affected by:
| • | planned and unplanned maintenance at our facility, which may result in downtime and thus negatively impact our cash flows in the quarter in which such maintenance occurs; |
| • | the level of our capital expenditures; |
| • | our debt service requirements; |
| • | the level of our expenses that are incurred by our general partner and its affiliates on our behalf and reimbursed by us; |
19
Table of Contents
| • | fluctuations in our working capital needs; |
| • | our ability to access capital markets; |
| • | fluctuations in interest rates; |
| • | the level of competition in our market and industry; |
| • | restrictions on distributions and on our ability to make working capital borrowings; and |
| • | the amount of cash reserves established by our general partner, including for turnarounds and related expenses. |
Our partnership agreement does not require us to pay a minimum quarterly distribution. The amount of distributions that we pay, if any, and the decision to pay any distribution at all, will be determined by the board of directors of our general partner. Our quarterly distributions, if any, will be subject to significant fluctuations based on the above-listed factors.
The amount of our quarterly cash distributions, if any, will vary significantly both quarterly and annually and will be directly dependent on the performance of our business. Unlike most publicly traded partnerships, we do not have a minimum quarterly distribution or employ structures intended to maintain or increase quarterly cash distributions over time.
Investors who are looking for an investment that will pay regular and predictable quarterly distributions should not invest in our common units. We expect our business performance will be more volatile, and our cash flows will be less stable, than the business performance and cash flows of most publicly traded partnerships. As a result, our quarterly cash distributions will be volatile and are expected to vary quarterly and annually. Unlike most publicly traded partnerships, we do not have a minimum quarterly distribution or employ structures intended to maintain or increase quarterly cash distributions over time. The amount of our quarterly cash distributions will be directly dependent on the performance of our business, which is subject to volatility. Methanol prices have historically been, and are expected to continue to be, characterized by significant cyclicality. Additionally, ammonia and natural gas prices are volatile, and seasonal and global fluctuations in demand for nitrogen fertilizer products and other ammonia-based products could affect our revenues. Because our quarterly cash distributions will be subject to significant fluctuations directly related to the cash we generate after payment of our fixed and variable expenses and other cash reserves established by our general partner, future quarterly cash distributions paid to our unitholders will vary significantly from quarter to quarter and may be zero. Given the volatile nature of our business, we expect that our unitholders will have direct exposure to fluctuations in the price of methanol and ammonia and the cost of natural gas.
The amount of cash we have available for distribution to unitholders depends primarily on our cash flow and not solely on profitability.
You should be aware that the amount of cash we have available for distribution depends primarily on our cash flow and not solely on our profitability, which may be affected by non-cash items. As a result, we may make cash distributions during periods when we record losses for financial accounting purposes and may not make cash distributions during periods when we record net earnings for financial accounting purposes. Please read “Management’s Discussion and Analysis of Financial Condition and Results of Operations—Liquidity and Capital Resources—Capital Expenditures.” As a result, we may make cash distributions during periods when we report losses and may not make cash distributions during periods when we report net income.
The board of directors of our general partner may modify or revoke our cash distribution policy at any time at its discretion. Our partnership agreement does not require us to pay any distributions at all.
Under our current cash distribution policy, we intend to distribute 100% of the cash available for distribution that we generate each quarter to unitholders of record on a pro rata basis. However, the board of
20
Table of Contents
directors may change such policy at any time at its discretion and could elect not to pay distributions for one or more quarters. For example, due to our facility being shut down for the first quarter of 2015, in order to complete the debottlenecking project, we do not expect to have any cash available for distribution and will not likely make a distribution in respect to the first quarter of 2015.
Our partnership agreement does not require us to pay any distributions at all. Accordingly, investors are cautioned not to place undue reliance on the permanence of such a policy in making a decision to invest in our common units. Any modification or revocation of our cash distribution policy could substantially reduce or eliminate the amounts of distributions to our unitholders. The amount of distributions we make, if any, and the decision to make any distribution at all will be determined by the board of directors of our general partner, whose interests may differ from those of our common unitholders. Our general partner has limited fiduciary and contractual duties, which may permit it to favor its own interests or the interests of OCI to the detriment of our common unitholders.
We have a limited operating history. As a result, you may have difficulty evaluating our ability to pay quarterly cash distributions to our unitholders or our ability to be successful in implementing our business strategy.
The operating performance of our facility over the long-term is not yet proven. We have already encountered and will continue to encounter risks and difficulties frequently experienced by companies whose performance is dependent upon newly constructed or recently upgraded world-scale processing or manufacturing facilities, such as the risks described elsewhere in this report. We may not achieve the efficiencies and utilization rates we expect from our facility.
We acquired our facility (which had been idled by the previous owners since 2004) in May 2011, commenced an upgrade that was completed in July 2012 and began operating our facility at full capacity in the fourth quarter of 2012. Our facility began ammonia production in December 2011 and began methanol production in July 2012 (with no significant methanol production until August 2012), with revenues first generated from ammonia sales in the first quarter of 2012 and from methanol sales in the third quarter of 2012. We did not achieve maximum daily production rates at our current capacity until the fourth quarter of 2012, after an approximate 20-month start-up phase. During this period, we experienced unplanned downtime. For example, in the third quarter of 2012, our facility experienced approximately four weeks of unplanned downtime as we took our facility offline to resolve certain start-up issues and to complete other capital and maintenance projects. In addition, during the third quarter of 2013, we experienced 13 days of unplanned downtime as we took our methanol unit offline to repair our syngas machine, including replacing a rotor and installing new bearings. We made and settled a business interruption claim with our insurance providers to cover a portion of our losses associated with this unplanned downtime. During the year ended December 31, 2014, our methanol and ammonia production units were shut down for 45 days and 28 days, respectively, due to a period of unplanned downtime early in the first quarter of 2014, as a result of an electrical power outage and in the third quarter of 2014, as a result of electrical power outages and repairs to our reformer.
Because of our limited operating history and performance record, it is difficult for you to evaluate our business and results of operations to date and to assess our future prospects. Further, our historical financial statements present a period of limited operations and therefore do not provide a meaningful basis for you to evaluate our operations or our ability to achieve our business strategy. We may be less successful than a seasoned company in achieving a consistent operating level at our facility capable of generating cash flows from our operations sufficient to regularly pay a quarterly cash distribution or to pay any quarterly cash distribution to our unitholders. We may also be less successful in implementing our business strategy than a seasoned company with a longer operating history. Finally, we may be less equipped to identify and address operating risks and hazards in the conduct of our business than those companies whose major facilities have longer operating histories.
21
Table of Contents
Our management has limited experience in managing our business as a U.S. publicly traded partnership.
Our executive management team and internal accounting staff have limited experience in managing our business and reporting as a U.S. publicly traded partnership. As a result, we may not be able to anticipate or respond to material changes or other events in our business as effectively as if our executive management team and accounting staff had such experience. Furthermore, growth projects may place significant strain on our management resources, thereby limiting our ability to execute our business strategy.
Our facility faces operating hazards and interruptions, including unscheduled maintenance or downtime. We could face significant reductions in revenues and increases in expenses to the extent these hazards or interruptions cause a material decline in production and are not fully covered by our existing insurance coverage. Insurance companies that currently insure companies in our industry may cease to do so, may change the coverage provided or may substantially increase premiums in the future.
Our operations, located at a single location, are subject to significant operating hazards and interruptions. Any significant curtailing of production at our facility or individual units within our facility could result in materially lower levels of revenues and cash flow and materially increased expenses for the duration of any downtime and materially adversely impact our results of operations, financial condition and ability to make cash distributions. Operations at our facility could be curtailed or partially or completely shut down, temporarily or permanently, as the result of a number of circumstances, most of which are not within our control, such as:
| • | unscheduled maintenance or catastrophic events such as a major accident, fire, damage by severe weather, flooding or other natural disaster; |
| • | labor difficulties that result in a work stoppage or slowdown; |
| • | environmental proceedings or other litigation that compel the cessation of all or a portion of the operations at our facility; |
| • | increasingly stringent environmental regulations; |
| • | a disruption in the supply of natural gas to our facility; and |
| • | governmental limitations on the use of our products, either generally or specifically those manufactured at our plant. |
For example, during July and August 2013, we experienced 13 days of unplanned downtime as we took our methanol unit offline to repair our syngas machine, including replacing a rotor and installing new bearings. Additionally, during the year ended December 31, 2014, our methanol and ammonia production units were shut down for 45 days and 28 days, respectively, due to a period of unplanned downtime early in the first quarter of 2014, as a result of an electrical power outage and in the third quarter of 2014, as a result of electrical power outages and repairs to our reformer. Please read “Management’s Discussion and Analysis of Financial Condition and Results of Operations—Key Operational Factors—Facility Reliability.”
The magnitude of the effect on us of any downtime will depend on the length of the downtime and the extent our operations are affected by the downtime. We expect to perform maintenance turnarounds approximately every four years, which will typically last approximately four weeks and cost approximately $24 million per turnaround. Such turnarounds may have a material impact on our cash flows and ability to make cash distributions in the quarter or quarters in which they occur. We are undertaking a turnaround as part of our debottlenecking project that we expect to be complete by the end of March 2015. Scheduled and unscheduled maintenance or downtime could have a material adverse effect on our results of operations, financial condition and ability to make cash distributions during the period of time that either of our units is not operating. During downtime, we will be required to fulfill certain of our customer contracts with product purchased from third parties at spot prices, and we may incur losses in connection with those sales. In addition, a major accident, fire, flood or other event could damage our facility or the environment and the surrounding community or result in injuries or loss of life.
22
Table of Contents
For example, in the quarter(s) preceding our planned downtime for major turnarounds, the board of directors of our general partner may elect to reserve amounts to fund (i) the capital costs associated with our major turnarounds, (ii) all or a portion of the revenues projected to be forgone as a result of the loss of production during the downtime associated with a turnaround or (iii) both. Based upon the decision(s) made by the board of directors of our general partner, the cash available for distribution in the quarter(s) preceding such a planned maintenance event in which the reserves are withheld may be adversely impacted. Conversely, additional amounts may be required to be reserved from cash available for distribution generated in a quarter subsequent to such a planned maintenance event should the scope or cost of the actual work performed during such period be materially different than that planned.
If we experience significant property damage, business interruption, environmental claims or other liabilities, our business could be materially adversely affected to the extent the damages or claims exceed the amount of valid and collectible insurance available to us. We are currently insured under casualty, environmental, property and business interruption insurance policies. These policies contain exclusions and conditions that could have a materially adverse impact on our ability to receive indemnification thereunder, as well as customary sub-limits for particular types of losses.
We are not fully insured against all risks related to our business and, if an accident or event occurs that is not fully insured, it could materially adversely affect our business.
A major accident, fire, flood or other event could damage our facility or the environment and the surrounding community or result in injuries or loss of life. If we experience significant property damage, business interruption, environmental claims or other liabilities, our business could be materially adversely affected to the extent the damages or claims exceed the amount of valid and collectible insurance available to us. We are currently insured under casualty, environmental, property and business interruption insurance policies. The following conversions from Euros to U.S. dollars with respect to our insurance policies are based on a conversion rate of €1.00 to $1.33641 as of August 3, 2014, as reported by Oanda. The property and business interruption insurance policies have a €450 million (or approximately $601.4 million) limit, with a €500,000 (or approximately $668,205) deductible for physical damage (€500,000 (or approximately $668,205) for property damage from a major machinery breakdown). Business interruption losses are subject to an annual aggregate of $23.4 million that is applied to the business interruption deductible and an annual time aggregate of 30 working days. Once the annual aggregate is exhausted, the fall back deductible of €2.3 million (or approximately $3.1 million) is applied per occurrence.
Our current property policy contains a specific sub-limit of €100 million (or approximately $133.6 million) for losses due to physical damage and business interruptions caused by machinery breakdown. Our current excess property policy contains a limit of €350 million (or approximately $467.7 million) for damage caused by fire, lightning, explosion or aircraft to be triggered once the €450 million (or approximately $601.4 million) primary policy is consumed, and €48.5 million (or approximately $66.1 million using a contracted exchange rate of €1.00 to $1.3637) for damage caused by named windstorm. Our current named windstorm property policy contains an additional limit of $85.0 million for damage caused by named windstorms to be triggered once the €48.5 million (or approximately $66.1 million using a contracted exchange rate of €1.00 to $1.3637) primary policy is consumed. We are fully exposed to all losses in excess of the applicable limits and sub-limits and for losses due to business interruptions caused by machinery breakdown of fewer than 30 days and less than $23.4 million plus the fall back deductible of €2.3 million (or approximately $3.1 million) per occurrence. With regard to environmental claims due to pollution, we currently have a policy limit of $25 million, and this policy has a deductible of $250,000. Our current construction floater policy contains a specific limit of $18.5 million for losses incurred during the construction of any equipment or facilities at our site. The occurrence of any operating risk not covered by our insurance could have a material adverse effect on our business, financial condition, results of operations and ability to pay distributions to our unitholders. Market factors, including but not limited to catastrophic perils that impact our industry, significant changes in the investment returns of insurance companies, insurance company solvency trends and industry loss ratios and loss trends, can negatively impact the
23
Table of Contents
future cost and availability of insurance. There can be no assurance that we will be able to buy and maintain insurance in the future with adequate limits, reasonable pricing terms and conditions.
None of our contracts provide for a minimum commitment from our customers. The prices we receive for our products are determined by reference to pricing indices and thus could be subject to significant variations.
None of our contracts provide for a minimum commitment from our customers. Although our contracts set pricing terms, they generally do not obligate the counterparty to purchase a specified minimum volume of methanol or ammonia from us. As such, many of our customers could source their methanol or ammonia supply elsewhere and cease buying our products at any time and for any reason, and we will have no recourse in the event such customer decides not to purchase our products. If customers representing a significant amount of our revenues elect not to purchase the methanol and ammonia we produce, it could materially adversely affect our results of operations, financial condition and ability to make cash distributions.
Methanol and ammonia are global commodities, with little or no product differentiation, and customers make their purchasing decisions principally on the basis of delivered price and availability of the product. As a result, the prevailing market sales prices for methanol and ammonia are subject to volatile, cyclical and seasonal changes in respect to relatively small changes in demand. Since none of our contracts provide for a minimum commitment from our customers and the prices at which we sell our products are determined by reference to specific pricing indices that change in response to changes in prevailing market conditions, the revenue we receive for the sales of our products will be subject to significant variations from period to period in response to changes in prevailing market prices for methanol and ammonia, which variations will result in changes in our cash available for distribution and distributions per common unit.
The methanol industry is subject to commodity price volatility and supply and demand uncertainty, which could potentially affect our operating and financial results, and expose our unitholders to substantial volatility in our quarterly cash distributions and material reductions in the trading price of our common units.
The methanol industry has historically been characterized by cycles of oversupply caused by either excess supply or reduced demand, resulting in lower prices and idling of capacity, followed by periods of shortage and rising prices as demand exceeds supply until increased prices lead to new plant investment or the restart of idled capacity. The methanol industry has historically operated significantly below stated capacity on a consistent basis, even in periods of high methanol prices, due primarily to shutdowns for planned and unplanned repairs and maintenance, temporary closures of marginal production facilities, as well as shortages of feedstock and other production inputs.
The methanol business is a highly competitive commodity industry, and prices are affected by supply and demand fundamentals and global energy prices. Methanol prices have historically been, and are expected to continue to be, characterized by significant cyclicality. New methanol plants are expected to be built in the United States, and this will increase overall production capacity. For example, Methanex, Celanese, Valero and OCI have each announced plans to relocate, restart or construct methanol plants in the U.S. Gulf Coast region over the next few years, which will increase overall U.S. production capacity and the availability of methanol supply to our customers from competing sources. Additional methanol supply can also become available in the future by restarting idle methanol plants, carrying out major expansions of existing plants or debottlenecking existing plants to increase their production capacity. Historically, higher-cost plants have been shut down or idled when methanol prices are low, but there can be no assurance that this practice will occur in the future or that such plants will remain idle. Relatively low prices for natural gas have led to reduced idling at the current time.
Demand for methanol largely depends upon levels of global industrial production, changes in general economic conditions and energy prices. We are not able to predict future methanol supply and demand balances, market conditions, global economic activity, methanol prices or energy prices, all of which are affected by numerous factors beyond our control. Since methanol constitutes a significant portion of the products we produce
24
Table of Contents
and market, a decline in the price of methanol would have an adverse impact on our financial condition, cash flows and results of operations, which could result in significant volatility or material reductions in the price of our common units or an inability to make quarterly cash distributions on our common units.
The ammonia business is, and ammonia prices are, cyclical and highly volatile and have experienced substantial downturns. Cycles in demand and seasonal fluctuations in pricing could potentially affect our operating and financial results, and expose our unitholders to substantial volatility in our quarterly cash distributions and material reductions in the trading price of our common units.
Ammonia is a commodity, and demand for and prices of ammonia can be highly volatile. In particular, our ammonia business is exposed to fluctuations in the demand for nitrogen fertilizer from the agricultural industry. These fluctuations historically have had and could in the future have significant effects on prices across all ammonia-based products and, in turn, our financial condition, cash flows and results of operations, which could result in significant volatility or material reductions in the price of our common units or an inability to make quarterly cash distributions on our common units.
The ammonia industry is generally seasonal. Farmers tend to apply nitrogen fertilizer during two short application periods, one in the spring and the other in the fall. The strongest demand for nitrogen fertilizers typically occurs during the planting season. In contrast, we and other ammonia producers generally produce our products throughout the year. As a result, ammonia producers generally build inventories during the low demand periods of the year in order to ensure timely product availability during the peak sales seasons. The seasonality of nitrogen fertilizer demand results in ammonia producers’ sales volumes being highest during the North American spring season and their working capital requirements typically being highest just prior to the start of the spring season. The degree of seasonality of the ammonia industry can change significantly from year to year due to conditions in the agricultural industry and other factors. As a consequence of this seasonality, we expect that our distributions will be volatile and will vary quarterly and annually.
If seasonal demand exceeds the projections on which we base our production, we will not have enough product and our customers may acquire ammonia from our competitors, which will negatively impact our profitability. If seasonal demand is less than we expect, we will be left with excess inventory and higher working capital and liquidity requirements associated with the liquidation or storage of such inventory. Additionally, because our inventory storage capacity is not significant, during periods of peak demand we may be required to acquire ammonia at spot prices in order to fulfill our supply obligations to customers. The prices at which we purchase ammonia for sale to our customers may negatively impact our profitability.
The pricing and demand for nitrogen fertilizer products is also dependent on demand for crop nutrients by the global agricultural industry. The agricultural products business can be affected by a number of factors. The most important of these factors, for U.S. markets, are:
| • | weather patterns and field conditions (particularly during periods of traditionally high nitrogen fertilizer consumption); |
| • | quantities of nitrogen fertilizers imported to and exported from North America; |
| • | current and projected grain inventories and prices, which are heavily influenced by U.S. exports and world-wide grain markets; and |
| • | U.S. governmental policies, including farm and biofuel policies, which may directly or indirectly influence the number of acres planted, the level of grain inventories, the mix of crops planted or crop prices. |
International market conditions may also significantly influence our operating results. The international market for nitrogen fertilizers is influenced by such factors as the relative value of the U.S. dollar and its impact upon the cost of importing nitrogen fertilizers, foreign agricultural policies, the existence of, or changes in,
25
Table of Contents
import or foreign currency exchange barriers in certain foreign markets, changes in the hard currency demands of certain countries and other regulatory policies of foreign governments, as well as the laws and policies of the United States affecting foreign trade and investment.
Since ammonia constitutes a significant portion of the products we produce and market, a decline in the price of or demand for nitrogen fertilizers would have a material adverse effect on our business, cash flow and ability to make distributions.
Methanol and ammonia are global commodities, and we face intense competition from other producers.
Our business is subject to intense price competition from both U.S. and foreign sources, including competitors operating in Trinidad with respect to methanol and in the Persian Gulf, the Asia-Pacific region, the Caribbean, Russia and the Ukraine with respect to ammonia. Both methanol and ammonia are global commodities, with little product differentiation, and customers make their purchasing decisions principally on the basis of delivered price and availability of the product. We compete with a number of domestic and foreign producers, including state-owned and government-subsidized entities. Most significantly, producers in Trinidad have historically been the largest suppliers of methanol to the United States. These companies have significant experience and expertise in production, transportation, marketing and sales of methanol in the United States. Some competitors have greater total resources and are less dependent on earnings from methanol or ammonia sales, which makes them less vulnerable to industry downturns and better positioned to pursue new expansion and development opportunities. In addition, Methanex, Celanese, Valero and OCI have each announced plans to relocate, restart or construct methanol plants in the U.S. Gulf Coast region over the next few years, which would compete directly with our facility. If we are unable to provide customers with a reliable supply of methanol or ammonia at competitive prices, we may lose market share to our competitors, which could have an adverse impact on our results of operations, financial condition and ability to make cash distributions.
Our profitability is vulnerable to fluctuations in the cost of natural gas, our primary feedstock.
Our profitability is significantly dependent on the cost of our natural gas feedstock, and a significant increase in the price of natural gas would adversely affect our ability to operate our facility on a profitable basis. In recent history, the price of natural gas has been very volatile, with prices at the New York Mercantile Exchange (“NYMEX”) pricing point, Henry Hub, spiking to near-record high prices in 2008 and approaching ten-year lows at the beginning of 2015. This is due to various supply and demand factors, including the increasing overall demand for natural gas from industrial users, which is affected, in part, by the general conditions of the U.S. and global economies, and other factors. We currently procure our natural gas through two main suppliers, Kinder Morgan and DCP Midstream, through supply agreements that are based on spot pricing, making us susceptible to fluctuations in the price of natural gas. In addition, we have recently connected our facility to a natural gas pipeline owned by Florida Gas Transmission and a natural gas pipeline owned by Houston Pipe Line Company. Operating at full capacity, our methanol and ammonia production units together require approximately 80,000 to 90,000 MMBtu per day of natural gas, as of December 31, 2014. A hypothetical increase or decrease of $1.00 per MMBtu of natural gas would increase or decrease our annual cost of goods sold (exclusive of depreciation) by approximately $29.2 million to $32.9 million. A material increase in natural gas prices could materially and adversely affect our results of operations, financial condition and ability to make cash distributions.
Our facility operates under a number of federal and state permits, licenses and approvals, and failure to comply with or obtain necessary permits, licenses and approvals may result in unanticipated costs or liabilities, which could reduce our profitability.
Our facility operates under a number of federal and state permits, licenses and approvals with terms and conditions containing a significant number of prescriptive limits and performance standards in order to operate. All of these permits, licenses, approvals and standards require a significant amount of monitoring, record keeping
26
Table of Contents
and reporting in order to demonstrate compliance with the underlying permit, license, approval or standard. Incomplete documentation of compliance status may result in the imposition of fines, penalties and injunctive relief. Additionally, due to the nature of our manufacturing processes, there may be times when we are unable to meet the standards and terms and conditions of these permits and licenses due to operational upsets or malfunctions, which may lead to violations or enforcement from regulatory agencies that could potentially result in operating restrictions. This could have a direct material adverse effect on our ability to operate our facilities and, accordingly, our results of operations, financial condition and ability to make cash distributions.
We are undertaking a debottlenecking project that we expect to complete in March 2015 that we expect will increase output from our methanol and ammonia production units. Our debottlenecking project and any other expansion of our operations is also predicated upon securing the necessary environmental or other permits or approvals, including necessary amendments to current permits to account for increased output. We received our GHG permit from the EPA in connection with our debottlenecking project on August 1, 2014. However, a decision by a government agency to deny or delay issuing a new or renewed material permit or approval, or to revoke or substantially modify an existing permit or approval, could have a material adverse effect on our ability to continue operations.
Our expansion of existing assets and construction of new assets may not result in revenue increases and will be subject to regulatory, environmental, political, legal and economic risks, which could adversely affect our results of operations, financial condition and ability to make cash distributions.
In order to optimize our existing asset base, we intend to evaluate and capitalize on organic opportunities for expansion projects in order to increase revenue. The expansion of production capacity (such as our debottlenecking project), or the construction of new assets, involves numerous regulatory, environmental, political and legal uncertainties, most of which are beyond our control. These risks include:
| • | changes to plans and specifications; |
| • | engineering problems, including defective plans and specifications; |
| • | shortages of, and price increases in, raw materials and skilled and unskilled labor; |
| • | inflation in key supply markets; |
| • | changes in laws and regulations, or in the interpretations and enforcement of laws and regulations, applicable to construction projects; |
| • | poor workmanship, labor disputes or work stoppages; |
| • | failure by subcontractors to comply with applicable laws and regulations; |
| • | injuries sustained by workers or patrons on the job site; |
| • | disputes with and defaults by contractors and subcontractors; |
| • | claims asserted against us for construction defects, personal injury or property damage; |
| • | environmental issues; |
| • | health and safety incidents and site accidents; |
| • | weather interferences or delays; |
| • | fires and other natural disasters; and |
| • | other unanticipated circumstances or cost increases. |
If we undertake any expansion projects, they may not be completed on schedule or at all or at the budgeted cost. If the actual cost to complete budgeted capital projects is greater than the budgeted cost, we would be
27
Table of Contents
required to use our cash flow from operations or seek additional sources of financing to complete those projects. We may not have sufficient cash flow from operations, or additional sources of financing may not be available on commercially reasonable terms or at all. Using cash flow from operations or incurring debt to fund our expansion projects (and paying the interest related to such incremental debt) could adversely impact our ability to make cash distributions. If our expansion projects take longer than their contemplated schedules, then our facility could experience prolonged downtime, which could adversely affect our results of operations, financial condition and ability to make cash distributions. For example, although we believe that we will have sufficient funding available from our sponsor, OCI, including under our Intercompany Equity Commitment and Intercompany Term Facility, to fund any reasonably anticipated additional costs related to the debottlenecking project, the actual cost to complete the project may be greater than anticipated, which could require us to use our cash flow from operations or seek additional sources of financing to complete the project and could adversely impact our ability to make cash distributions.
Future demand for methanol for MTBE production may be adversely affected by regulatory developments.
Changes in environmental, health and safety laws, regulations or requirements could impact methanol demand for the production of MTBE. Several years ago, environmental concerns and legislative action related to gasoline leaking into water supplies from underground gasoline storage tanks in the United States resulted in the phase-out of MTBE as a gasoline additive in the United States. However, methanol is used in the United States to produce MTBE for export markets, where demand for MTBE has continued at strong levels. Demand for methanol for use in MTBE production in the United States could decline materially if export demand is impacted by governmental legislation or policy changes. The EPA is currently reviewing the human health effects of MTBE, including its potential carcinogenicity. The European Union issued a final risk assessment report on MTBE in 2002 that permitted the continued use of MTBE, although several risk reduction measures relating to the storage and handling of fuels were recommended. Governmental efforts in recent years in some countries, primarily in the European Union and Latin America, to promote biofuels and alternative fuels through legislation or tax policy are also putting competitive pressures on the use of MTBE in gasoline in these countries. Declines in demand for methanol for use in MTBE production could have an adverse impact on our results of operations, financial condition and ability to make cash distributions.
Future demand for methanol may be adversely affected by regulatory developments.
Some of our customers use methanol that we supply to manufacture formaldehyde, among other chemicals. Formaldehyde currently represents the largest single demand use for methanol in the United States. Formaldehyde, a component of resins used as wood adhesives and as a raw material for engineered plastics and a variety of other products, including elastomers, paints, building products, foams, polyurethane and automotive products, has been classified as a known human carcinogen by the International Agency for Research on Cancer and as a probable human carcinogen by the EPA. On July 7, 2010, President Obama signed the Formaldehyde Standards for Composite Wood Products Act into law, which establishes limits for formaldehyde emissions from composite wood products and requires EPA to evaluate and establish limits for other types of wood products. EPA has proposed two regulations to implement this Act: (1) formaldehyde emissions standards for hardwood plywood, medium-density fiberboard, particleboard, and finished goods containing these products that are sold, supplied, offered for sale, or manufactured (including imported) in the United States and (2) a third-party certification program to assure compliance by composite wood panel producers with the formaldehyde emissions limits established directly in the Act. EPA has indicated that it plans to finalize these regulations in September of 2015. As of April 1, 2015, formaldehyde will be reclassified in the European Union as a category 1B carcinogen. No decision has yet been made, however, whether this reclassification will result in obligations or restrictions under the Regulation on Registration, Evaluation, Authorization and Restrictions of Chemicals in the European Union, including in particular whether formaldehyde should be designated as a Substance of Very High Concern Candidate. Changes in environmental, health and safety laws, regulations or requirements relating to formaldehyde could impact methanol demand, which could indirectly have a material adverse effect on our business.
28
Table of Contents
Any limitations on the use of nitrogen fertilizer for agricultural purposes could have a material adverse effect on the market for ammonia and on our results of operations, financial condition and ability to make cash distributions.
Conditions in the U.S. agricultural industry may significantly impact our operating results. State and federal governmental regulations and policies, including farm and biofuel subsidies and commodity support programs, as well as the prices of fertilizer products, may also directly or indirectly influence the number of acres planted, the mix of crops planted and the use of ammonia for particular agricultural applications. Developments in crop technology, such as nitrogen fixation, which is the conversion of atmospheric nitrogen into compounds that plants can assimilate, could also reduce the use of chemical fertilizers and adversely affect the demand for nitrogen fertilizer and thus affect general demand for and pricing of ammonia. Unfavorable industry conditions and new technological developments could have a material adverse effect on our results of operations, financial condition and ability to make cash distributions.
In addition, future federal or state environmental laws and regulations, or new interpretations of existing laws or regulations, could limit our ability to market and sell our products to end users. From time to time, various state legislatures have considered limitations on the use and application of chemical fertilizers due to concerns about the impact of these products on the environment. In addition, a number of states have adopted or proposed numeric nutrient water quality criteria that could result in decreased demand for fertilizer products in those states, which could have a material adverse effect on our results of operations, financial condition and ability to make cash distributions.
A major factor underlying the current high level of demand for nitrogen-based fertilizer products is the expanding production of ethanol. A decrease in ethanol production, an increase in ethanol imports or a shift away from corn as a principal raw material used to produce ethanol could have a material adverse effect on our results of operations, financial condition and ability to make cash distributions.
A major factor underlying the current high level of demand for nitrogen-based fertilizer products is the expanding production of ethanol in the United States and the expanded use of corn in ethanol production. Ethanol production in the United States is highly dependent upon numerous federal and state laws and regulations, and is made significantly more competitive by various federal and state incentives, mandated production of ethanol pursuant to federal renewable fuel standards, and permitted increases in ethanol percentages in gasoline blends, such as E15, a gasoline blend containing 15% ethanol. However, a number of factors, including a continuing “food versus fuel” debate and studies showing that expanded ethanol production may increase the level of GHGs in the environment, have resulted in calls to reduce subsidies for ethanol, allow increased ethanol imports and adopt temporary waivers of the current renewable fuel standard levels, any of which could have an adverse effect on corn-based ethanol production, planted corn acreage and fertilizer demand. Therefore, ethanol incentive programs may not be renewed, or if renewed, they may be renewed on terms significantly less favorable to ethanol producers than current incentive programs. For example, on December 31, 2011, Congress allowed both the 45 cents per gallon ethanol tax credit and the 54 cents per gallon ethanol import tariff to expire. In addition, in December 2013, bipartisan legislation was introduced in the U.S. Senate to eliminate the corn-ethanol blending requirement for refiners. Similarly, the EPA’s waivers partially approving the use of E15 could be revised, rescinded or delayed. These actions could have a material adverse effect on ethanol production in the United States, which could reduce the demand for ammonia for use as a nitrogen fertilizer. If such reduced demand for nitrogen fertilizer in the United States were significant and prolonged, it could adversely affect the prices we receive on sales of our ammonia products to industrial customers, which could have a material adverse effect on our results of operations, financial condition and ability to make cash distributions.
Furthermore, most ethanol is currently produced from corn and other raw grains, such as milo or sorghum, especially in the Midwest. The current trend in ethanol production research is to develop an efficient method of producing ethanol from cellulose-based biomass, such as agricultural waste, forest residue, municipal solid waste and energy crops (plants grown for use to make biofuels or directly exploited for their energy content). If an
29
Table of Contents
efficient method of producing ethanol from cellulose-based biomass is developed, the demand for corn may decrease significantly, which could reduce demand for nitrogen fertilizer products and have a material adverse effect on the prices we receive on sales of our ammonia products and our results of operations, financial condition and ability to make cash distributions.
Evolving environmental laws and regulations on hydraulic fracturing could have an indirect effect on our financial performance.
Hydraulic fracturing is an important and increasingly common practice that is used to stimulate production of crude oil and/or natural gas from dense subsurface rock formations, and is primarily presently regulated by state agencies. However, Congress has in the past and may in the future consider legislation to regulate hydraulic fracturing by federal agencies. Many states have already adopted laws and/or regulations that require disclosure of the chemicals used in hydraulic fracturing, and are considering legal requirements that could impose more stringent permitting, disclosure and well construction requirements on oil and/or natural gas drilling activities. The EPA is also moving forward with various related regulatory actions, including approving, on April 17, 2012, new regulations requiring, among other matters, “green completions” of hydraulically-fractured wells by 2015. We do not believe these new regulations will have a direct effect on our operations, but because oil and/or natural gas production using hydraulic fracturing is growing rapidly in the United States, if new or more stringent federal, state or local legal restrictions relating to such drilling activities or to the hydraulic fracturing process are adopted, this could result in a reduction in the supply of natural gas and an increase in the price of natural gas. An increase in the price of natural gas could adversely affect our gross margins. In addition, a significant and sustained increase in domestic natural gas prices could make it more attractive for international producers of methanol and ammonia to import their products into the United States, which competition could adversely affect our results of operations, financial condition and ability to make cash distributions.
Our operations are dependent on third parties and their pipelines to provide us with our natural gas, hydrogen and nitrogen feedstock. A deterioration in the financial condition of a third-party supplier, the inability of a third-party supplier to perform in accordance with its contractual obligations or the unavailability of a supplier’s pipeline could have a material adverse effect on our results of operations, financial condition and our ability to make cash distributions.
Our operations depend in large part on the performance of third-party suppliers, including Kinder Morgan, DCP Midstream, Florida Gas Transmission, Houston Pipeline Company, Air Products and Air Liquide for the supply of natural gas, hydrogen and nitrogen. Our ability to obtain natural gas and other inputs necessary for the production of methanol and ammonia is dependent upon the availability of these third parties’ pipeline systems interconnected to our facility. Because we do not own these pipelines, their continuing operation is not within our control. These pipelines may become unavailable for a number of reasons, including testing, maintenance, capacity constraints, accidents, government regulation, weather-related events or other third-party actions. If third-party pipelines become partially or completely unavailable, our ability to operate could be restricted and the transportation costs of our feedstock supply could increase, thereby reducing our profitability. In addition, should any of our third-party suppliers fail to perform in accordance with existing contractual arrangements, our operations could be forced to halt. Alternative sources of supply could be difficult to obtain. Any downtime associated with our operations, even for a limited period, could have a material adverse effect on our results of operations, financial condition and ability to make cash distributions.
Delays, interruptions or other limitations in the transportation of the products we produce could affect our operations.
Transportation logistics play an important role in allowing us to supply products to our customers. Any significant delays, interruptions or other limitations on the ability to transport our products could negatively affect our operations. Currently, approximately 31.4% of our methanol and approximately 88.6% of our ammonia is transported by barge along the Gulf Coast, and approximately 65.6% of our methanol and
30
Table of Contents
approximately 11.4% of our ammonia is transported directly to certain customers through their pipelines. We may experience risks associated with distribution of our products by barge or pipelines. Delays and interruptions may be caused by weather-related events, including hurricanes that would prevent the operation of barges for transport of our methanol and ammonia. Transport by pipeline may be interrupted because of accidents, earthquakes, hurricanes, governmental regulation, terrorism or other third-party actions. Prolonged interruptions in the transport of our products by barge or pipeline could have a material adverse effect on our results of operations, financial condition and ability to make cash distributions.
Our customers purchase our methanol and ammonia on an FOB delivered basis at our facility and then arrange and pay to transport it to their final destinations by barge according to customary practice in our market. Methanol and ammonia are also distributed to certain customers through pipelines connected directly to their facilities. However, in the future, our customers’ transportation needs and preferences may change and our customers may no longer be willing or able to transport purchased product from our facility or accept our product through their pipelines. In the event that our competitors are able to transport their products more efficiently or cost effectively than we do or work with our customers to develop direct pipelines to those customers, those customers may reduce or cease purchases of our products. If this were to occur, we could be forced to make a substantial investment in transportation capabilities to meet our customers’ delivery needs, and this would be expensive and time consuming. We may not be able to obtain transportation capabilities on a timely basis or at all, and our inability to provide transportation for products could have a material adverse effect on our results of operations, financial condition and ability to make cash distributions.
We currently derive substantially all of our revenues from a limited number of customers, and the loss of any of these customers without replacement on comparable terms would affect our results of operations, financial condition and ability to make cash distributions.
We derive, and believe that we will continue to derive, substantially all of our revenues from a limited number of customers. For the year ended December 31, 2014, Methanex, Koch and Rentech accounted for approximately 32.7%, 28.8%, and 14.8%, respectively, of our total revenues. Our customers, at any time, may decide to purchase fewer metric tons of methanol or ammonia from us. If our customers decide to purchase fewer metric tons of methanol or ammonia or at lower prices, and we are unable to find replacement counterparties on terms as favorable as our current arrangements, our results of operations, financial condition and ability to make cash distributions may be materially adversely affected.
We compete with certain of our customers which may result in conflicts of interest between us and those customers.
We compete with certain of our customers, including Methanex, Koch and Rentech. As competitors, our customers may take actions that would not be in our best interest. These customers may determine that it is strategically advantageous for them to reduce purchases of our product. In addition, they may sell our product to our other customers in an effort to reduce our market share. Any of these actions by our customers could have an adverse effect on our results of operations, financial condition and ability to make cash distributions.
All of our operations are located at a single facility in Texas, which makes us vulnerable to risks associated with operating in one geographic area.
The geographic concentration of our production facility in the Texas Gulf Coast means that we may be disproportionately exposed to disruptions in our operations if the region experiences severe weather, transportation capacity constraints, constraints on the availability of required equipment, facilities, personnel or services, significant governmental regulation or natural disasters. Although we maintain insurance coverage to cover a portion of these types of risks, there are potential risks associated with our operations not covered by insurance. There also may be certain risks covered by insurance where the policy does not reimburse us for all of the costs related to a loss. Downtime or other delays or interruptions to our operations from any of such factors could have a material adverse effect on our results of operations, financial condition and ability to make cash distributions.
31
Table of Contents
Anhydrous ammonia is extremely hazardous. Any liability for accidents involving anhydrous ammonia that cause severe damage to property or injury to the environment and human health could have a material adverse effect on our results of operations, financial condition and ability to make cash distributions. In addition, the costs of transporting anhydrous ammonia could increase significantly in the future.
We manufacture, process, store, handle, distribute and transport anhydrous ammonia, which is extremely hazardous. Major accidents or releases involving anhydrous ammonia could cause severe damage or injury to property, the environment and human health, as well as a possible disruption of supplies and markets. Such an event could result in civil lawsuits, fines, penalties and regulatory enforcement proceedings, all of which could lead to significant liabilities. Any damage to persons, equipment or property or other disruption of our ability to produce or distribute our products could result in a significant decrease in operating revenues and significant additional cost to replace or repair and insure our assets, which could have a material adverse effect on our results of operations, financial condition and ability to make cash distributions.
In addition, we may incur significant losses or costs relating to the operation of barges used for the purpose of transporting our anhydrous ammonia. Due to the dangerous and potentially toxic nature of the cargo, a barge accident may result in fires, explosions and pollution. These circumstances may result in sudden, severe damage or injury to property, the environment and human health. In the event of pollution, we may be held responsible even if we are not at fault and complied with the laws and regulations in effect at the time of the accident. Litigation arising from accidents involving anhydrous ammonia may result in our being named as a defendant in lawsuits asserting claims for large amounts of damages, which could have a material adverse effect on our results of operations, financial condition and ability to make cash distributions.
Environmental laws and regulations could require us to make substantial capital expenditures to remain in compliance or to remediate contamination that could give rise to material liabilities.
Our operations are subject to a variety of federal, state and local environmental laws and regulations relating to the protection of the environment, including those governing the emission or discharge of pollutants into the environment, product specifications and the generation, treatment, storage, transportation, disposal and remediation of solid and hazardous waste and materials. Violations of these laws and regulations or permit conditions can result in substantial penalties, injunctive orders compelling installation of additional controls, civil and criminal sanctions, permit revocations or facility shutdowns.
In addition, new environmental laws and regulations, new interpretations of existing laws and regulations, increased governmental enforcement of laws and regulations or other developments could require us to make additional unforeseen expenditures. Many of these laws and regulations are becoming increasingly stringent, and the cost of compliance with these requirements can be expected to increase over time. The requirements to be met, as well as the technology and length of time available to meet those requirements, continue to develop and change. These expenditures or costs for environmental compliance could have a material adverse effect on our results of operations, financial condition and ability to make cash distributions.
Our business is subject to accidental spills, discharges or other releases of hazardous substances into the environment. Past or future spills related to our facility or transportation of products or hazardous substances from our facility may give rise to liability (including strict liability, or liability without fault, and potential cleanup responsibility) to governmental entities or private parties under federal, state or local environmental laws, as well as under common law. For example, we could be held strictly liable under CERCLA for past or future spills without regard to fault or whether our actions were in compliance with the law at the time of the spills. Pursuant to CERCLA and similar state statutes, we could be held liable for contamination associated with the facility we currently own and operate, facilities we formerly owned or operated (if any) and facilities to which we transported or arranged for the transportation of wastes or by-products containing hazardous substances for treatment, storage or disposal. The potential penalties and cleanup costs for past or future releases or spills, liability to third parties for damage to their property or exposure to hazardous substances, or the need to
32
Table of Contents
address newly discovered information or conditions that may require response actions could be significant and could have a material adverse effect on our results of operations, financial condition and ability to make cash distributions.
In addition, we may incur liability for alleged personal injury or property damage due to exposure to chemicals or other hazardous substances located at or released from our facility. We may also face liability for personal injury, property damage, natural resource damage or for cleanup costs for the alleged migration of contamination or other hazardous substances from our facility to adjacent and other nearby properties.
We may incur future costs relating to the off-site disposal of hazardous wastes. Companies that dispose of, or arrange for the transportation or disposal of, hazardous substances at off-site locations may be held jointly and severally liable for the costs of investigation and remediation of contamination at those off-site locations, regardless of fault. We could become involved in litigation or other proceedings involving off-site waste disposal and the damages or costs in any such proceedings could be material.
Climate change laws and regulations could have a material adverse effect on our results of operations, financial condition and ability to make cash distributions.
Currently, various legislative and regulatory measures to address GHG emissions (including carbon dioxide, methane and nitrous oxides) are in various phases of discussion or implementation. At the federal legislative level, Congress could adopt some form of federal mandatory GHG emission reduction laws, although the specific requirements and timing of any such laws are uncertain at this time. It is also possible that Congress may pass alternative climate change bills that do not mandate a nationwide cap-and-trade program and instead focus on promoting renewable energy and energy efficiency.
In the absence of congressional legislation curbing GHG emissions, the EPA is moving ahead administratively under its CAA authority. In October 2009, the EPA finalized a rule requiring certain large emitters of GHGs to inventory and report their GHG emissions to the EPA. In accordance with the rule, we have begun monitoring our GHG emissions from our facility and have reported the emissions to the EPA beginning in 2011. On December 7, 2009, the EPA finalized its “endangerment finding” that GHG emissions, including CO2, pose a threat to human health and welfare. The finding allows the EPA to regulate GHG emissions as air pollutants under the CAA. In May 2010, the EPA finalized the “Greenhouse Gas Tailoring Rule,” which establishes new GHG emissions thresholds that determine when certain large stationary sources, such as our facility, must obtain permits under the PSD and Title V programs of the CAA. The significance of the permitting requirement is that, in cases where a new source is constructed or an existing source undergoes a major modification, such as our debottlenecking project, the facility would need to evaluate and install BACT for its GHG emissions.
On May 21, 2013, the Texas Legislature passed H.B. 788 which is intended to streamline GHG permitting in Texas by directing the TCEQ to promulgate rules to be approved by the EPA that would replace EPA permitting of GHGs in Texas with TCEQ permitting. The bill was signed by the Governor of Texas on June 14, 2013 and is effective. TCEQ adopted regulations implementing H.B. 788 on March 26, 2014 that went into effect on April 17, 2014. We are evaluating the potential impact of these regulations on our business, but it is not anticipated that they will have a material adverse effect on our operations.
The implementation of EPA regulations and/or the passage of federal or state climate change legislation will likely result in increased costs to (i) operate and maintain our facility, (ii) install new emission controls on our facility and (iii) administer and manage any GHG emissions program. Increased costs associated with compliance with any future legislation or regulation of GHG emissions, if it occurs, may have a material adverse effect on our results of operations, financial condition and ability to make cash distributions.
33
Table of Contents
In addition, climate change legislation and regulations may result in increased costs not only for our business but also for our customers that utilize our products, thereby potentially decreasing demand for our products. Decreased demand for our products may have a material adverse effect on our results of operations, financial condition and ability to make cash distributions.
New regulations concerning the transportation of hazardous chemicals, risks of terrorism and the security of chemical manufacturing facilities could result in higher operating costs.
The costs of complying with regulations relating to the transportation of hazardous chemicals and security associated with our facility may have a material adverse effect on our results of operations, financial condition and ability to make cash distributions. Targets such as chemical manufacturing facilities may be at greater risk of future terrorist attacks than other targets in the United States. The chemical industry has responded to the issues that arose in response to the terrorist attacks on September 11, 2001 by starting new initiatives relating to the security of chemical industry facilities and the transportation of hazardous chemicals in the United States. Future terrorist attacks could lead to even stronger, more costly initiatives. Simultaneously, local, state and federal governments have begun a regulatory process that could lead to new regulations impacting the security of chemical plant locations and the transportation of hazardous chemicals. Our business could be materially adversely affected by the cost of complying with new regulations.
We are subject to strict laws and regulations regarding employee and process safety, and failure to comply with these laws and regulations could have a material adverse effect on our results of operations, financial condition and ability to make cash distributions.
Our facility is subject to the requirements of OSHA and comparable state statutes that regulate the protection of the health and safety of workers. In addition, OSHA requires that we maintain information about hazardous materials used or produced in our operations and that we provide this information to employees, state and local governmental authorities, and local residents. Failure to comply with OSHA requirements, including general industry standards, record keeping requirements and monitoring and control of occupational exposure to regulated substances, could have a material adverse effect on our results of operations, financial condition and ability to make cash distributions if we are subjected to significant fines or compliance costs.
Our indebtedness could adversely affect our financial condition or make us more vulnerable to adverse economic conditions.
Our level of indebtedness could have significant effects on our business, financial condition, results of operations and cash flows and, therefore, important consequences to your investment in our securities, such as:
| • | we may be limited in our ability to obtain additional financing to fund our working capital needs, capital expenditures and debt service requirements or our other operational needs; |
| • | we may be limited in our ability to use operating cash flow in other areas of our business because we must dedicate a substantial portion of these funds to make principal and interest payments on our debt; |
| • | we may be at a competitive disadvantage compared to competitors with less leverage since we may be less capable of responding to adverse economic and industry conditions; |
| • | we may not have sufficient flexibility to react to adverse changes in the economy, our business or the industries in which we operate; |
| • | to the extent that we are unable to refinance our debt at maturity on favorable terms, or at all, our ability to fund our operations and our ability to make cash distributions could be adversely affected; and |
| • | an event of default under our credit agreements (such as failure to maintain financial covenants) could cause our debt to be accelerated which could impair our ability to fund our operations and our ability to make cash distributions. |
34
Table of Contents
Cost overruns related to our debottlenecking project could raise the likelihood that we breach a financial covenant contained in our debt agreements. If we were unable to comply with applicable financial covenants contained in our debt agreements in any quarter, our ability to pay distributions to unitholders could be adversely affected.
Cost overruns related to our debottlenecking project could impair our ability to comply with financial and other covenants contained in our term loan credit facility and revolving credit facility. As of December 31, 2014, we had incurred approximately $228.0 million in total expenditures ($175.6 million in cash expenditures) related to our debottlenecking project. As of December 31, 2014, we had $395.0 million of debt outstanding, excluding an unamortized debt discount of approximately $3.4 million. Our ability to pay distributions to our unitholders is subject to covenant restrictions under the agreements governing our indebtedness. We expect that our ability to make distributions to our unitholders will depend, in part, on our ability to satisfy applicable covenants as well as the absence of a default or event of default under the agreements governing our indebtedness. If we were unable to comply with any such covenant restrictions in any quarter, our ability to pay distributions to unitholders would be adversely affected. In addition, any failure to comply with these covenants could result in a default under our debt agreements. Our ability to comply with the covenant restrictions contained in our debt agreements is affected by, among other things, the timing and costs to complete, and operating results following the completion of, the debottlenecking project. Upon a default, unless waived or cured, our lenders would have all remedies available to a secured lender and could elect to terminate their commitments, cease making further loans, cause their loans to become due and payable in full, institute foreclosure proceedings against us or our assets and force us and our subsidiaries into bankruptcy or liquidation. Please read “Management’s Discussion and Analysis of Financial Condition and Results of Operations—Liquidity and Capital Resources—Credit Facilities.”
Our ability to service our indebtedness will depend on our ability to generate cash in the future.
Our ability to make payments on our indebtedness will depend on our ability to generate cash in the future. As of March 16, 2015, our current debt service requirements on an annualized basis are approximately $24.0 million per year of interest and principal payments on our Term Loan B Credit Facility (as defined in note 6 of the consolidated financial statements). Our ability to generate cash is subject to general economic and market conditions and financial, competitive, legislative, regulatory and other factors that are beyond our control. We cannot assure you that our business will generate sufficient cash to fund our working capital requirements, capital expenditures, debt service requirements and other liquidity needs, which could result in our inability to comply with financial and other covenants contained in our debt agreements, our being unable to repay the principal of or pay interest on our indebtedness, and our inability to fund our other liquidity needs. If we are unable to service our debt obligations, fund our other liquidity needs and maintain compliance with our financial and other covenants, we could be forced to curtail our operations, our creditors could accelerate our indebtedness and exercise other remedies and we could be required to pursue one or more alternative strategies, such as selling assets or refinancing or restructuring our indebtedness. However, we cannot assure you that any such alternatives would be feasible or prove adequate.
Restrictions in the agreements governing our current and future indebtedness contain or will contain significant limitations on our business operations, including our ability to pay distributions and other payments.
As of December 31, 2014, we had $395.0 million of debt outstanding, excluding an unamortized debt discount of approximately $3.4 million. We and OCIB may incur significant additional indebtedness in the future. Our ability to pay distributions to our unitholders will be subject to covenant restrictions under the agreements governing our indebtedness. We expect that our ability to make distributions to our unitholders will depend, in part, on our ability to satisfy applicable covenants as well as the absence of a default or event of default under the agreements governing our indebtedness. If we were unable to comply with any such covenant restrictions in any quarter, our ability to pay distributions to unitholders would be curtailed. Please read “Management’s Discussion and Analysis of Financial Condition and Results of Operations—Liquidity and Capital Resources—Credit Facilities.”
35
Table of Contents
In addition, we will be subject to covenants contained in our debt agreements and any agreement governing other future indebtedness that will, subject to significant exceptions, limit our ability and the ability of OCIB or any of our future subsidiaries to, among other things, incur additional indebtedness, create liens on assets, engage in mergers or consolidations, sell assets, pay dividends and distributions or repurchase our common units, make investments, loans or advances, prepay certain subordinated indebtedness, make certain acquisitions or enter into agreements with respect to our equity interests, and engage in certain transactions with affiliates. Please read “Management’s Discussion and Analysis of Financial Condition and Results of Operations—Liquidity and Capital Resources—Credit Facilities.” Any failure to comply with these covenants could result in a default under our debt agreements. Upon a default, unless waived, our lenders would have all remedies available to a secured lender and could elect to terminate their commitments, cease making further loans, cause their loans to become due and payable in full, institute foreclosure proceedings against us or our assets and force us and our subsidiaries into bankruptcy or liquidation.
We are a holding company and depend upon our operating subsidiary, OCIB, for our cash flows.
We are a holding company. All of our operations are conducted and all of our assets are owned by OCIB, our wholly-owned subsidiary and our sole direct or indirect subsidiary. Consequently, our cash flow and our ability to meet our obligations or to make cash distributions in the future will depend upon the cash flow of OCIB and the payment of funds by OCIB to us in the form of distributions or otherwise. The ability of OCIB to make any payments to us will depend on its earnings, the terms of its indebtedness, including the terms of any debt agreements, and legal restrictions. In particular, future debt agreements entered into by OCIB may impose significant limitations on the ability of OCIB to make distributions to us and consequently our ability to make distributions to our unitholders.
Security breaches and other disruptions could compromise our information and expose us to liability, which would cause our business and reputation to suffer.
In the ordinary course of our business, we collect and store sensitive data, including intellectual property, our proprietary business information and that of our customers and suppliers, and personally identifiable information of our employees, in our facilities and on our networks. The secure processing, maintenance and transmission of this information is critical to our operations. Despite our security measures, our information technology and infrastructure may be vulnerable to attacks by hackers or breached due to employee error, malfeasance or other disruptions. Any such breach could compromise our networks and the information stored there could be accessed, publicly disclosed, lost or stolen. Any such access, disclosure or other loss of information could result in legal claims or proceedings, disrupt our operations, damage our reputation, and cause a loss of confidence, which could adversely affect our business.
We incur increased costs as a result of being a publicly traded partnership, including costs related to compliance with Section 404 of Sarbanes-Oxley.
As a publicly traded partnership, we incur significant legal, accounting and other expenses that we did not incur as a private company, including costs associated with our public company reporting requirements. We also anticipate that we will incur costs associated with corporate governance requirements, including requirements under the Sarbanes-Oxley Act of 2002 (the “Sarbanes-Oxley Act”), as well as rules implemented by the SEC and the Financial Industry Regulatory Authority (“FINRA”). We expect these rules and regulations to increase our legal and financial compliance costs and to make some activities more time-consuming and costly, particularly after we are no longer an emerging growth company under the Jumpstart Our Business Startups Act of 2012 (the “JOBS Act”). We also expect these rules and regulations may make it more difficult and more expensive for us to obtain director and officer liability insurance and we may be required to accept reduced policy limits and coverage or incur substantially higher costs to obtain the same or similar coverage. As a result, it may be more difficult for us to attract and retain qualified individuals to serve on the board of directors of our general partner or as executive officers.
36
Table of Contents
We will remain an emerging growth company under the JOBS Act for up to five years after becoming a publicly traded partnership. We are already incurring significantly higher costs due to being a publicly listed company in comparison to a privately owned company. After we are no longer an emerging growth company, we expect to incur additional expenses and devote substantial management effort toward ensuring compliance with those requirements applicable to companies that are not emerging growth companies, including Section 404 of the Sarbanes-Oxley Act. If we are unable to timely comply with Section 404 or if the costs related to compliance are significant, our results of operations and financial condition may be materially adversely affected. In order to comply with the requirements of Section 404 of Sarbanes-Oxley, we will need to implement new financial systems and procedures. We cannot assure you that we will be able to implement appropriate procedures on a timely basis. Failure to implement such procedures could have an adverse effect on our ability to satisfy applicable obligations under the Securities Exchange Act of 1934, as amended (the “Exchange Act”), and Sarbanes-Oxley. Since our inception, we have identified a number of material weaknesses in internal control over financial reporting, as described below:
Accounts Payable
In 2013 we identified and corrected errors associated with debit balances in the financial statement caption “Accounts payable” that should have been written off as of and for the periods ended March 31, 2013, December 31, 2012 and March 31, 2012. As such, we restated our financial statements as of and for the periods ended March 31, 2013, December 31, 2012 and March 31, 2012. As a result, we identified a deficiency constituting a material weakness in our internal control over financial reporting as of December 31, 2012. Specifically, we determined that we did not have adequate internal controls in place as of December 31, 2012 to reconcile certain accounts payable sub-ledger accounts. During 2013, we implemented new internal controls that remediated the identified material weakness through redesigning certain internal reports, establishing additional reviews and matching of transactions, and periodic reconciliations of accounts payable sub-ledger accounts. Therefore, management believes that this material weakness was remediated as of December 31, 2013.
Information Technology General Controls
During 2013, we identified a number of deficiencies related to the design, implementation and effectiveness of our information technology general controls that have a direct impact on our financial reporting. In response to those deficiencies, we implemented compensating manual controls, but were not able to test the design and operating effectiveness of the manual compensating controls prior to December 31, 2013. As such and because of the pervasive nature of information technology general control deficiencies, we concluded that those deficiencies, in the aggregate, result in a reasonable possibility that material misstatements in our interim or annual financial statements would not be prevented or detected on a timely basis and, as such, constitute a material weakness as of December 31, 2013. In particular, these deficiencies related to the configuration set-up of the information technology system and related financial applications, segregation of duties, user access and change management controls that are intended to ensure that access to financial applications and data is adequately restricted to appropriate personnel and that all changes affecting the financial applications and underlying account records are identified, tested and implemented appropriately. During 2014, we implemented internal controls that remediated the identified material weakness through written policies that addresses the needed improvements on change management, user access security and segregation of duties. Therefore, management believes that this material weakness has been remediated as of December 31, 2014.
Risks Inherent in an Investment in Us
Under our current cash distribution policy, we intend to distribute 100% of the cash available for distribution that we generate each quarter, which could limit our ability to grow and make acquisitions.
Under our current cash distribution policy, we intend to distribute 100% of the cash available for distribution that we generate each quarter to our unitholders. Please read Item 5—“Market for Registrant’s
37
Table of Contents
Common Equity, Related Unitholder Matters and Issuer Purchases of Equity Securities” included in this report for additional information. As a result, our general partner will rely primarily upon external financing sources, including commercial bank or intercompany borrowings or issuances of debt or equity securities, to fund our acquisitions and expansion capital expenditures. To the extent we are unable to finance growth externally, our cash distribution policy will significantly impair our ability to grow.
In addition, because we intend to distribute 100% of the cash available for distribution that we generate each quarter, our growth may not be as fast as that of businesses that reinvest their available cash to expand ongoing operations. To the extent we issue additional partnership interests in connection with any acquisitions or expansion capital expenditures, the payment of distributions on those additional partnership interests will decrease the amount we distribute on each outstanding common unit. There are no limitations in our partnership agreement on our ability to issue additional partnership interests, including partnership interests ranking senior to the common units. The incurrence of additional commercial borrowings or other debt to finance our growth strategy would result in increased interest expense, which, in turn, would reduce the cash available for distribution that we have to distribute to our unitholders.
Our general partner and its affiliates, including OCI, have conflicts of interest with us and limited duties to us and our unitholders, and they may favor their own interests to our detriment and that of our unitholders. Additionally, we have no control over the business decisions and operations of OCI, and OCI is under no obligation to adopt a business strategy that favors us.
OCI indirectly owns a non-economic general partner interest and a 79.04% limited partner interest in us and indirectly owns and controls our general partner. Although our general partner has a duty to manage us in a manner that is in the best interests of our partnership and our unitholders, the directors and officers of our general partner also have a duty to manage our general partner in a manner that is in the best interests of its owner, OCI. Conflicts of interest may arise between OCI and its affiliates, including our general partner, on the one hand, and us and our unitholders, on the other hand. In resolving these conflicts, the general partner may favor its own interests and the interests of its affiliates, including OCI, over the interests of our common unitholders. These conflicts include, among others, the following situations:
| • | neither our partnership agreement nor any other agreement requires OCI to pursue a business strategy that favors us or utilizes our assets, which could involve decisions by OCI to increase or decrease production, shut down or reconfigure our plant, pursue and grow particular markets, or undertake acquisition opportunities for itself. OCI’s directors and officers have a fiduciary duty to make these decisions in the best interests of the stockholders of OCI; |
| • | OCI may be constrained by the terms of its debt instruments from taking actions, or refraining from taking actions, that may be in our best interests; |
| • | as a lender under the Intercompany Term Facility and Intercompany Revolving Facility, OCI Fertilizer, an indirect, wholly-owned subsidiary of OCI, may have interests that differ from holders of our common units; |
| • | our partnership agreement replaces the fiduciary duties that would otherwise be owed by our general partner with contractual standards governing its duties, limiting our general partner’s liabilities and restricting the remedies available to our unitholders for actions that, without the limitations, might constitute breaches of fiduciary duty; |
| • | except in limited circumstances, our general partner has the power and authority to conduct our business without unitholder approval; |
| • | our general partner will determine the amount and timing of asset purchases and sales, capital expenditures, borrowings, repayment of indebtedness, issuances of additional partnership interests and the creation, reduction or increase of cash reserves, each of which can affect the amount of cash that is available for distribution to our common unitholders; |
38
Table of Contents
| • | our general partner will determine which costs incurred by it are reimbursable by us; |
| • | our general partner may cause us to borrow funds in order to permit the payment of cash distributions; |
| • | our partnership agreement does not restrict our general partner from causing us to pay it or its affiliates for any services rendered to us or entering into additional contractual arrangements with any of these entities on our behalf; |
| • | our general partner intends to limit its liability regarding our contractual and other obligations; |
| • | our general partner may exercise its right to call and purchase all of the common units not owned by it and its affiliates if it and its affiliates own more than a specified percentage of our common units; |
| • | our general partner controls the enforcement of obligations owed to us by our general partner and its affiliates, including our commercial agreements with OCI; and |
| • | our general partner decides whether to retain separate counsel, accountants or others to perform services for us. |
Under the terms of our partnership agreement, the doctrine of corporate opportunity, or any analogous doctrine, does not apply to our general partner or any of its affiliates, including its executive officers, directors and owners. Any such person or entity that becomes aware of a potential transaction, agreement, arrangement or other matter that may be an opportunity for us will not have any duty to communicate or offer such opportunity to us. Any such person or entity will not be liable to us or to any limited partner for breach of any fiduciary duty or other duty by reason of the fact that such person or entity pursues or acquires such opportunity for itself, directs such opportunity to another person or entity or does not communicate such opportunity or information to us. This may create actual and potential conflicts of interest between us and affiliates of our general partner and result in less than favorable treatment of us and our unitholders. For example, Iowa Fertilizer Company, a subsidiary of OCI, is currently constructing a nitrogen fertilizer plant in Wever, Iowa, and Natgasoline LLC, a subsidiary of OCI, plans to construct a methanol plant adjacent to our facility in Beaumont, Texas. These facilities will compete directly or indirectly with our facility to one degree or another, and OCI has no obligation to offer, and we have no right to acquire, any interest in either of these facilities. OCI may also acquire or construct additional facilities in the future that may compete with us.
Our partnership agreement restricts the remedies available to holders of our common units for actions taken by our general partner that might otherwise constitute breaches of fiduciary duty.
Our partnership agreement contains provisions that restrict the remedies available to unitholders for actions taken by our general partner that might otherwise constitute breaches of fiduciary duty under state fiduciary duty law. For example, our partnership agreement:
| • | provides that whenever our general partner makes a determination or takes, or declines to take, any other action in its capacity as our general partner as opposed to in its individual capacity, our general partner is required to make such determination, or take or decline to take such other action, in good faith and will not be subject to any other or different standard imposed by our partnership agreement, Delaware law, or any other law, rule or regulation, or at equity; |
| • | provides that our general partner will not have any liability to us or our unitholders for decisions made in its capacity as a general partner so long as it acted in good faith reliance on the provisions of our partnership agreement; |
| • | provides that our general partner and its officers and directors will not be liable for monetary damages to us or our limited partners resulting from any act or omission unless there has been a final and non-appealable judgment entered by a court of competent jurisdiction determining that our general partner or its officers and directors, as the case may be, acted in bad faith or engaged in intentional fraud or willful misconduct or, in the case of a criminal matter, acted with knowledge that the conduct was unlawful; and |
39
Table of Contents
| • | provides that our general partner will not be in breach of its obligations under our partnership agreement or its fiduciary duties to us or our limited partners if a transaction with an affiliate or the resolution of a conflict of interest is approved in accordance with, or otherwise meets the standards set forth in, our partnership agreement. |
In connection with a situation involving a transaction with an affiliate or a conflict of interest, our partnership agreement provides that any determination by our general partner must be made in good faith, and that our conflicts committee and the board of directors of our general partner are entitled to a presumption that they acted in good faith. In any proceeding brought by or on behalf of any limited partner or the partnership, the person bringing or prosecuting such proceeding will have the burden of overcoming such presumption. By purchasing a common unit, a unitholder will become bound by the provisions of our partnership agreement, including the provisions described above.
Common units are subject to our general partner’s limited call right.
If at any time our general partner and its affiliates own more than 90% of the common units, our general partner will have the right, which it may assign to any of its affiliates or to us, but not the obligation, to acquire all, but not less than all, of the common units held by public unitholders at a price not less than their then-current market price, as calculated pursuant to the terms of our partnership agreement. If our general partner and its affiliates reduce their ownership percentage to below 70% of the outstanding common units, then concurrently with such reduction in percentage ownership, the ownership threshold to exercise the limited call right will be permanently reduced to 80%. As a result, you may be required to sell your common units at an undesirable time or at a price that is less than the market price on the date of purchase and may not receive any return on your investment. You may also incur a tax liability upon a sale of your common units. Our general partner is not obligated to obtain a fairness opinion regarding the value of the common units to be repurchased by it upon exercise of the limited call right. There is no restriction in our partnership agreement that prevents our general partner from issuing additional common units and then exercising its limited call right. Our general partner may use its own discretion, free of fiduciary duty restrictions, in determining whether to exercise this right.
Unitholders have very limited voting rights and, even if they are dissatisfied, they cannot remove our general partner without its consent.
Unlike the holders of common stock in a corporation, unitholders have only limited voting rights on matters affecting our business and, therefore, limited ability to influence management’s decisions regarding our business. For example, unlike holders of stock in a public corporation, unitholders will not have “say-on-pay” advisory voting rights. Unitholders did not elect our general partner or the board of directors of our general partner and will have no right to elect our general partner or the board of directors of our general partner on an annual or other continuing basis. The board of directors of our general partner is chosen by the member of our general partner, which is an indirect, wholly-owned subsidiary of OCI. Furthermore, if the unitholders are dissatisfied with the performance of our general partner, they will have little ability to remove our general partner. As a result of these limitations, the price at which our common units will trade could be diminished because of the absence or reduction of a takeover premium in the trading price.
Our unitholders are currently unable to remove our general partner without its consent because our general partner and its affiliates own sufficient units to prevent its removal. The vote of the holders of at least 66 2⁄3% of all outstanding units voting together as a single class is required to remove our general partner. As of March 16, 2015, our general partner and its affiliates own 79.04% of the common units issued and outstanding.
Furthermore, unitholders’ voting rights are further restricted by the partnership agreement provision providing that any units held by a person that owns 20% or more of any class of units then outstanding, other than our general partner, its affiliates, their transferees and persons who acquired such units with the prior approval of the board of directors of our general partner, cannot vote on any matter.
40
Table of Contents
Our partnership agreement also contains provisions limiting the ability of unitholders to call meetings or to acquire information about our operations, as well as other provisions limiting the unitholders’ ability to influence the manner or direction of management.
Unitholders may have liability to repay distributions.
In the event that: (1) we make distributions to our unitholders when our nonrecourse liabilities exceed the sum of (a) the fair market value of our assets not subject to recourse liability and (b) the excess of the fair market value of our assets subject to recourse liability over such liability, or a distribution causes such a result, and (2) a unitholder knows at the time of the distribution of such circumstances, such unitholder will be liable for a period of three years from the time of the impermissible distribution to repay the distribution under Section 17-607 of the Delaware Revised Uniform Limited Partnership Act (the “Delaware Act”).
Likewise, upon the winding up of the partnership, in the event that (1) we do not distribute assets in the following order: (a) to creditors in satisfaction of their liabilities; (b) to partners and former partners in satisfaction of liabilities for distributions owed under our partnership agreement; (c) to partners for the return of their contribution; and finally (d) to the partners in the proportions in which the partners share in distributions and (2) a unitholder knows at the time of such circumstances, then such unitholder will be liable for a period of three years from the impermissible distribution to repay the distribution under Section 17-807 of the Delaware Act.
A purchaser of common units who becomes a limited partner is liable for the obligations of the transferring limited partner to make contributions to us that are known by the purchaser at the time it became a limited partner and for unknown obligations if the liabilities could be determined from our partnership agreement.
Our general partner interest or the control of our general partner may be transferred to a third party without unitholder consent.
Our general partner may transfer its general partner interest to a third party in a merger or in a sale of all or substantially all of its assets without the consent of the unitholders. Furthermore, there is no restriction in our partnership agreement on the ability of OCI to transfer its membership interest in our general partner to a third party. The new owner of our general partner would then be in a position to replace the board of directors and officers of our general partner with its own choices.
Our unitholders who fail to furnish certain information requested by our general partner or who our general partner, upon receipt of such information, determines are not eligible citizens may not be entitled to receive distributions in kind upon our liquidation and their common units will be subject to redemption.
Our general partner may require each limited partner to furnish information about such limited partner’s nationality, citizenship or related status. If a limited partner fails to furnish information about such limited partner’s nationality, citizenship or other related status within a reasonable period after a request for the information or our general partner determines after receipt of the information that the limited partner is not an eligible citizen, the limited partner may be treated as an ineligible holder. An ineligible holder does not have the right to direct the voting of such holder’s common units and may not receive distributions in kind upon our liquidation. Furthermore, we have the right to redeem all of the common units of any holder that is an ineligible holder. The redemption price will be paid in cash or by delivery of a promissory note, as determined by our general partner.
We may issue additional partnership interests without unitholder approval, which would dilute common unitholder interests.
At any time, we may issue an unlimited number of limited partner interests of any type without the approval of our unitholders, and our unitholders will have no preemptive or other rights (solely as a result of their status as
41
Table of Contents
unitholders) to purchase any such limited partner interests. Further, there are no limitations in our partnership agreement on our ability to issue equity securities that rank equal or senior to our common units as to distributions or in liquidation or that have special voting rights and other rights. The issuance by us of additional common units or other partnership interests of equal or senior rank will have the following effects:
| • | our common unitholders’ proportionate ownership interest in us will decrease; |
| • | the amount of cash distributions on each common unit may decrease; |
| • | the ratio of taxable income to distributions may increase; |
| • | the relative voting strength of each previously outstanding common unit may be diminished; and |
| • | the market price of our common units may decline. |
OCIP Holding may sell common units in the public or private markets, and such sales could have an adverse impact on the trading price of the common units.
OCIP Holding, an indirect, wholly-owned subsidiary of OCI, owns 65,995,372 common units, representing approximately 79.04% of our outstanding common units. We have agreed to provide OCIP Holding with certain registration rights under applicable securities laws. The sale of these common units in the public or private markets could have an adverse impact on the market for our common units and the price at which they trade.
As a publicly traded partnership we qualify for, and are relying on, certain exemptions from the NYSE’s corporate governance requirements. Accordingly, holders of our common units will not have the same protections afforded to equity holders of companies subject to such corporate governance requirements.
As a publicly traded partnership, we qualify for, and are relying on, certain exemptions from the NYSE’s corporate governance requirements, including:
| • | the requirement that a majority of the board of directors of our general partner consist of independent directors; |
| • | the requirement that the board of directors of our general partner have a nominating/corporate governance committee that is composed entirely of independent directors; and |
| • | the requirement that the board of directors of our general partner have a compensation committee that is composed entirely of independent directors. |
As a result of these exemptions, our general partner’s board of directors will not be comprised of a majority of independent directors. Our general partner’s board of directors does not currently intend to establish a nominating/corporate governance committee or a compensation committee. Accordingly, unitholders will not have the same protections afforded to equity holders of companies that are subject to all of the corporate governance requirements of the NYSE.
Tax Risks
Our tax treatment depends on our status as a partnership for U.S. federal income tax purposes. If the Internal Revenue Service (“IRS”) were to treat us as a corporation for U.S. federal income tax purposes, which would subject us to entity-level taxation, or if we were otherwise subjected to a material amount of entity-level taxation, then our cash available for distribution to our unitholders would be substantially reduced.
The anticipated after-tax economic benefit of an investment in our common units depends largely on our being treated as a partnership for U.S. federal income tax purposes.
42
Table of Contents
Despite the fact that we are a limited partnership under Delaware law, it is possible in certain circumstances for a partnership such as ours to be treated as a corporation for U.S. federal income tax purposes. A change in our business or a change in current law could cause us to be treated as a corporation for federal income tax purposes or otherwise subject us to taxation as an entity.
If we were treated as a corporation for U.S. federal income tax purposes, we would pay U.S. federal income tax on our taxable income at the corporate tax rate, which is currently a maximum of 35%, and would likely pay state and local income tax at varying rates. Distributions would generally be taxed again as corporate dividends (to the extent of our current and accumulated earnings and profits), and no income, gain, loss, deduction or credits would flow through to you. Because a tax would be imposed upon us as a corporation, our cash available for distribution to you would be substantially reduced. In addition, changes in current state law may subject us to additional entity-level taxation by individual states. Because of widespread state budget deficits and other reasons, several states are evaluating ways to subject partnerships to entity-level taxation through the imposition of state income, franchise and other forms of taxation. Therefore, if we were treated as a corporation for U.S. federal income tax purposes, or otherwise subjected to a material amount of entity-level taxation, there would be a material reduction in the anticipated cash flow and after-tax return to our unitholders, likely causing a substantial reduction in the value of our common units.
The tax treatment of publicly traded partnerships or an investment in our common units could be subject to potential legislative, judicial or administrative changes and differing interpretations, possibly on a retroactive basis.
The present U.S. federal income tax treatment of publicly traded partnerships, including us, or an investment in our common units may be modified by administrative, legislative or judicial interpretation at any time. For example, from time to time, members of Congress propose and consider substantive changes to the existing U.S. federal income tax laws that affect publicly traded partnerships, including the elimination of the qualifying income exception upon which we rely for our treatment as a partnership for U.S. federal income tax purposes. Any modification to the U.S. federal income tax laws and interpretations thereof may or may not be retroactively applied and could make it more difficult or impossible to meet the exception for us to be treated as a partnership for federal income tax purposes. We are unable to predict whether any of these changes or other proposals will ultimately be enacted. However, it is possible that a change in law could affect us, and any such changes could negatively impact the value of an investment in our common units.
If the IRS contests the U.S. federal income tax positions we take, the market for our common units may be adversely impacted, the cost of any IRS contest will reduce our cash available for distribution to our unitholders, and any adjustments to our tax returns may cause adjustments to our unitholders’ tax returns.
We intend to furnish to each unitholder, within 90 days after the close of each calendar year, specific tax information, including a Schedule K-1, which describes his or her share of our income, gain, loss and deduction for our preceding taxable year. In preparing this information we will take various accounting and reporting positions. The IRS may adopt positions that differ from the positions we take, and the IRS’s positions may ultimately be sustained in an audit of our federal income tax information returns. It may be necessary to resort to administrative or court proceedings to sustain some or all of the positions we take and such positions may not ultimately be sustained. A court may not agree with some or all of the positions we take. Any contest with the IRS, and the outcome of any IRS contest, may have a materially adverse impact on the market for our common units and the price at which they trade. In addition, our costs of any contest with the IRS will be borne indirectly by our unitholders because the costs will reduce our cash available for distribution. Adjustments resulting from an IRS audit may require each unitholder to adjust a prior year’s tax liability, and possibly may result in an audit of his or her return. Any audit of a unitholder’s return could result in adjustments not related to our returns, as well as those related to our returns.
43
Table of Contents
Our unitholders’ share of our income will be taxable to them for U.S. federal income tax purposes even if they do not receive any cash distributions from us.
Because a unitholder will be treated as a partner to whom we will allocate taxable income that could be different in amount than the cash we distribute, a unitholder’s allocable share of our taxable income will be taxable to him, which may require the payment of U.S. federal income taxes and, in some cases, state and local income taxes on his share of our taxable income, even if he receives no cash distributions from us. Our unitholders may not receive cash distributions from us equal to their share of our taxable income or even equal to the actual tax liability that results from that income.
Tax gain or loss on the disposition of our common units could be more or less than expected.
If our unitholders sell common units, they will recognize a gain or loss for U.S. federal income tax purposes equal to the difference between the amount realized and their tax basis in those common units. Because distributions in excess of their allocable share of our net taxable income decrease their tax basis in their common units, the amount, if any, of such prior excess distributions with respect to the common units a unitholder sells will, in effect, become taxable income to the unitholder if it sells such common units at a price greater than its tax basis in those common units, even if the price received is less than its original cost. Furthermore, a substantial portion of the amount realized on any sale of your common units, whether or not representing gain, may be taxed as ordinary income due to potential recapture items, including depreciation recapture. In addition, because the amount realized includes a unitholder’s share of our nonrecourse liabilities, a unitholder that sells common units may incur a tax liability in excess of the amount of cash received from the sale.
Tax-exempt entities and non-U.S. persons face unique tax issues from owning our common units that may result in adverse tax consequences to them.
Investment in our common units by tax-exempt entities, such as employee benefit plans and individual retirement accounts (known as IRAs), and non-U.S. persons raises issues unique to them. For example, virtually all of our income allocated to organizations that are exempt from U.S. federal income tax, including IRAs and other retirement plans, will be unrelated business taxable income and will be taxable to them. Distributions to non-U.S. persons will be reduced by withholding taxes at the highest applicable effective tax rate, and non-U.S. persons will be required to file U.S. federal income tax returns and pay tax on their share of our taxable income. If you are a tax-exempt entity or a non-U.S. person, you should consult a tax advisor before investing in our common units.
We will treat each purchaser of common units as having the same tax benefits without regard to the actual common units purchased. The IRS may challenge this treatment, which could adversely affect the value of our common units.
Because we cannot match transferors and transferees of common units and because of other reasons, we have adopted depreciation and amortization positions that may not conform to all aspects of existing Treasury Regulations promulgated under the Internal Revenue Code of 1986 (the “Code”), referred to as “Treasury Regulations.” A successful IRS challenge to those positions could adversely affect the amount of tax benefits available to you. It also could affect the timing of these tax benefits or the amount of gain from your sale of common units and could have a negative impact on the value of our common units or result in audit adjustments to your tax returns.
44
Table of Contents
We will prorate our items of income, gain, loss and deduction, for U.S. federal income tax purposes, between transferors and transferees of our common units each month based upon the ownership of our common units on the first business day of each month, instead of on the basis of the date a particular common unit is transferred. The IRS may challenge this treatment, which could change the allocation of items of income, gain, loss and deduction among our unitholders.
We will prorate our items of income, gain, loss and deduction for federal income tax purposes between transferors and transferees of our common units each month based upon the ownership of our common units on the first business day of each month, instead of on the basis of the date a particular common unit is transferred. The use of this proration method may not be permitted under existing Treasury Regulations. The U.S. Treasury Department has issued proposed regulations that provide a safe harbor pursuant to which publicly traded partnerships may use a similar monthly simplifying convention to allocate tax items among transferor and transferee unitholders. Nonetheless, the proposed regulations do not specifically authorize the use of the proration method we have adopted. If the IRS were to challenge this method or new Treasury Regulations were issued, we may be required to change the allocation of items of income, gain, loss and deduction among our unitholders.
A unitholder whose common units are loaned to a “short seller” to effect a short sale of common units may be considered as having disposed of those common units. If so, he would no longer be treated for U.S. federal income tax purposes as a partner with respect to those common units during the period of the loan and may recognize gain or loss from the disposition.
Because a unitholder whose common units are loaned to a “short seller” to effect a short sale of common units may be considered as having disposed of the loaned common units, he may no longer be treated for U.S. federal income tax purposes as a partner with respect to those common units during the period of the loan to the short seller and the unitholder may recognize gain or loss from such disposition. Moreover, during the period of the loan to the short seller, any of our income, gain, loss or deduction with respect to those common units may not be reportable by the unitholder and any cash distributions received by the common unitholder as to those common units could be fully taxable as ordinary income. Unitholders desiring to assure their status as partners and avoid the risk of gain recognition from a loan to a short seller are urged to consult a tax advisor to discuss whether it is advisable to modify any applicable brokerage account agreements to prohibit their brokers from loaning their common units.
The sale or exchange of 50% or more of our capital and profits interests during any twelve-month period will result in the termination of our partnership for U.S. federal income tax purposes.
We will be considered to have technically terminated as a partnership for U.S. federal income tax purposes if there is a sale or exchange of 50% or more of the total interests in our capital and profits within a twelve-month period. For purposes of determining whether the 50% threshold has been met, multiple sales of the same common unit will be counted only once. Our technical termination would, among other things, result in the closing of our taxable year for all unitholders, which would result in us filing two tax returns (and our unitholders could receive two Schedules K-1 if relief was not available, as described below) for one fiscal year and could result in a deferral of depreciation deductions allowable in computing our taxable income. In the case of a unitholder reporting on a taxable year other than a fiscal year ending December 31, the closing of our taxable year may also result in more than twelve months of our taxable income or loss being includable in his taxable income for the year of termination. Our termination currently would not affect our classification as a partnership for federal income tax purposes, but instead we would be treated as a new partnership for federal income tax purposes. If treated as a new partnership, we must make new tax elections, including a new election under Section 754 of the Code, and could be subject to penalties if we are unable to determine that a termination occurred. The IRS has announced publicly traded partnership technical termination relief whereby, if a publicly traded partnership that technically terminated requests publicly traded partnership technical termination relief and such relief is granted by the IRS, among other things, the partnership will only have to provide one Schedule K-1 to unitholders for the year notwithstanding two partnership tax years.
45
Table of Contents
As a result of investing in our common units, you may become subject to state and local taxes and return filing requirements in jurisdictions where we operate or own or acquire properties.
In addition to U.S. federal income taxes, unitholders will likely be subject to other taxes, including state and local taxes, unincorporated business taxes and estate, inheritance or intangible taxes that are imposed by the various jurisdictions in which we conduct business or control property now or in the future, even if they do not live in any of those jurisdictions. Our unitholders will likely be required to file state and local income tax returns and pay state and local income taxes in some or all of these various jurisdictions. Further, our unitholders may be subject to penalties for failure to comply with those requirements. We currently conduct business in Texas. As we make acquisitions or expand our business, we may control assets or conduct business in additional states that impose a personal income tax. It is your responsibility to file all federal, state and local tax returns.
| ITEM | 1B. UNRESOLVED STAFF COMMENTS |
None.
| ITEM | 2. PROPERTIES |
The location and general character of our methanol and ammonia production facility has been described under Item 1—“Business” and are incorporated herein by reference. Our facility is located on a 62-acre site that is part of a large chemical refining and industrial complex located six miles south of Beaumont, Texas, on the Neches River. We own the land, plant and processing equipment at our facility. We believe that the land, plant and processing equipment at our facility are adequate for our current operations.
| ITEM | 3. LEGAL PROCEEDINGS |
We are, and will continue to be, subject to litigation from time to time in the ordinary course of our business. We also incorporate by reference into this Part I, Item 3 of this Report, the information regarding the lawsuits and proceedings described and referenced in note 11, “Commitments and Contingencies” to our Consolidated Financial Statements as set forth in Part II, Item 8 of this Annual Report. In accordance with accounting principles generally accepted in the United States of America (“GAAP”), we record a liability when it is both probable that a liability has been incurred and the amount of the loss can be reasonably estimated. These provisions are reviewed at least quarterly and adjusted to reflect the impacts of negotiations, settlements, rulings, advice of legal counsel, and other information and events pertaining to a particular case. Although we cannot predict with certainty the ultimate resolution of lawsuits, investigations or claims asserted against us, we do not believe that any currently pending legal proceeding or proceedings to which we are a party will have a material adverse effect, individually or in the aggregate, on our business, financial condition or results of operations.
| ITEM | 4. MINE SAFETY DISCLOSURES |
Not Applicable.
46
Table of Contents
| ITEM 5. | MARKET FOR REGISTRANT’S COMMON EQUITY, RELATED UNITHOLDER MATTERS AND ISSUER PURCHASES OF EQUITY SECURITIES |
Our common units began trading on the NYSE under the symbol “OCIP” on October 4, 2013. On March 12, 2015, the closing price for our common units was $16.96 per unit. The number of unitholders of record as of March 12, 2015 was four. Based upon the securities position listings maintained for our common units by registered clearing agencies, we estimate the number of beneficial owners is 2,424. As of March 16, 2015, there were 83,495,372 common units outstanding.
The following table sets forth the range of high and low closing prices for our common units as reported by the NYSE:
| Year Ended December 31, 2014 |
High | Low | ||||||
| Fourth Quarter, ended December 31, 2014 |
$ | 20.77 | $ | 14.77 | ||||
| Third Quarter, ended September 30, 2014 |
$ | 21.48 | $ | 18.00 | ||||
| Second Quarter, ended June 30, 2014 |
$ | 22.64 | $ | 19.68 | ||||
| First Quarter, ended March 31, 2014 |
$ | 28.08 | $ | 21.44 | ||||
| Year Ended December 31, 2013 |
High | Low | ||||||
| Fourth Quarter, ended December 31, 2013 (from October 4, 2013) |
$ | 28.08 | $ | 18.42 | ||||
| Third Quarter, ended September 30, 2013(1) |
N/A | N/A | ||||||
| Second Quarter, ended June 30, 2013(1) |
N/A | N/A | ||||||
| First Quarter, ended March 31, 2013(1) |
N/A | N/A | ||||||
| (1) | Our common units did not commence trading on the NYSE until October 4, 2013. |
Cash Distribution Policy
Under our current cash distribution policy, we intend to distribute 100% of the cash available for distribution that we generate each quarter. Cash available for distribution for each quarter will be determined by the board of directors of our general partner following the end of such quarter. We expect that cash available for distribution for each quarter will generally equal our cash flow from operations for the quarter less cash needed for capital expenditures, debt service and other contractual obligations, and reserves for future operating or capital needs that the board of directors of our general partner deems necessary or appropriate. We do not intend to maintain excess distribution coverage for the purpose of maintaining stability or growth in our quarterly distribution or otherwise to reserve cash for distributions, nor do we intend to incur debt to pay quarterly distributions.
Because our policy is to distribute 100% of cash available for distribution each quarter, without reserving cash for future distributions or borrowing to pay distributions during periods of low cash flow from operations, our unitholders will have direct exposure to fluctuations in the amount of cash generated by our business. We expect that the amount of our quarterly distributions, if any, will vary based on our operating cash flow during each quarter. Our quarterly cash distributions, if any, will not be stable and will vary from quarter to quarter as a direct result of, among other things, variations in our operating performance and variations in our cash flow caused by fluctuations in the price of natural gas, methanol and ammonia as well as our working capital requirements, planned and unplanned downtime and capital expenditures and our margins from selling our products. These variations may be significant. For example, due to our facility being shut down for the first quarter of 2015, in order to complete the debottlenecking project, we do not expect to have any cash available for distribution and will not likely make a distribution in respect to the first quarter of 2015. The board of directors of our general partner may change our cash distribution policy at any time and from time to time. Our partnership agreement does not require us to pay cash distributions to our unitholders on a quarterly or other basis.
47
Table of Contents
The following is a summary of cash distributions paid to unitholders during the year ended December 31, 2014 for the respective quarters to which the distributions relate:
| December 31, 2013 |
March 31, 2014 |
June 30, 2014 |
September 30, 2014 |
Total Distribution Paid in 2014 |
||||||||||||||||
| ($ in millions, except per common units amounts) | ||||||||||||||||||||
| Amount paid to OCI |
$ | 38.6 | $ | 25.8 | $ | 30.2 | $ | 17.2 | $ | 111.8 | ||||||||||
| Amount paid to public unitholders |
10.8 | 7.2 | 8.4 | 4.5 | 30.9 | |||||||||||||||
|
|
|
|
|
|
|
|
|
|
|
|||||||||||
| Total amount paid |
$ | 49.4 | $ | 33.0 | $ | 38.6 | $ | 21.7 | $ | 142.70 | ||||||||||
|
|
|
|
|
|
|
|
|
|
|
|||||||||||
| Per common unit |
$ | 0.61367 | $ | 0.41 | $ | 0.48 | $ | 0.26 | $ | 1.76367 | ||||||||||
|
|
|
|
|
|
|
|
|
|
|
|||||||||||
| Common units outstanding |
80,500,000 | 80,500,000 | 80,500,000 | 83,495,372 | ||||||||||||||||
On March 16, 2015, the board of directors of our general partner declared a cash distribution to our common unitholders for the period October 1, 2014 through and including December 31, 2014 of $0.33 per unit, or approximately $27.6 million in the aggregate. The cash distribution will be paid on April 10, 2015 to unitholders of record at the close of business on March 26, 2015.
The terms of our Term B Credit Facility provide that distributions from us and OCIB are permitted so long as (1) no event of default shall have occurred and be continuing and (2) OCIB has been in compliance with the terms of the Term B Credit Facility, including its financial covenants on a pro forma basis for the most recently completed four fiscal quarters as of the date of such distribution. As of December 31, 2014, we are in compliance with all of these covenants. Please read “Management’s Discussion and Analysis of Financial Condition and Results of Operations—Liquidity and Capital Resources—Credit Facilities.”
Long-Term Incentive Plan Information
See Item 12—“Security Ownership of Certain Beneficial Owners and Management and Related Unitholder Matters” for information regarding securities authorized for issuance under our long-term incentive plan.
Issuer Purchases of Equity Securities
We did not repurchase any of our common units during the year ended December 31, 2014, and we do not have any announced or existing plans to repurchase any of our common units.
48
Table of Contents
| ITEM 6. | SELECTED FINANCIAL DATA |
The following table includes selected summary financial data for the years ended December 31, 2014, 2013, 2012 and 2011. The selected financial information presented below under the caption “Statements of Operations Data” for the fiscal years ended December 31, 2014, 2013, 2012 and 2011 and the selected financial information presented below under the caption “Balance Sheet Data” as of December 31, 2014 and 2013 have been derived from our audited financial statements included elsewhere in this report. The data below should be read in conjunction with Item 7—“Management’s Discussion and Analysis of Financial Condition and Results of Operations” and Item 8—“Financial Statements and Supplementary Data.” The data below is in thousands, except for per unit data and product pricing.
| Years Ended December 31, | ||||||||||||||||
| 2014 | 2013 | 2012 | 2011 | |||||||||||||
| STATEMENTS OF OPERATIONS DATA |
||||||||||||||||
| Revenues(1) |
$ | 402,780 | $ | 427,964 | $ | 224,629 | $ | — | ||||||||
| Cost of goods sold (exclusive of depreciation) |
218,795 | 190,954 | 133,430 | — | ||||||||||||
|
|
|
|
|
|
|
|
|
|||||||||
| Expenses: |
||||||||||||||||
| Depreciation expense |
23,105 | 22,229 | 11,355 | — | ||||||||||||
| Selling, general and administrative |
22,356 | 26,774 | 14,980 | 236 | ||||||||||||
|
|
|
|
|
|
|
|
|
|||||||||
| Income (loss) from operations before interest expense, other income and income tax expense |
138,524 | 188,007 | 64,864 | (236 | ) | |||||||||||
| Interest expense |
18,250 | 16,684 | 5,718 | — | ||||||||||||
| Interest expense—related party |
203 | 14,038 | 6,469 | — | ||||||||||||
| Loss on extinguishment of debt |
— | 6,689 | — | — | ||||||||||||
| Other income |
941 | 5,154 | 202 | 523 | ||||||||||||
|
|
|
|
|
|
|
|
|
|||||||||
| Income from operations before tax expense |
121,012 | 155,750 | 52,879 | 287 | ||||||||||||
| Income tax expense |
1,564 | 1,399 | 1,048 | — | ||||||||||||
|
|
|
|
|
|
|
|
|
|||||||||
| Net income |
$ | 119,448 | $ | 154,351 | $ | 51,831 | $ | 287 | ||||||||
|
|
|
|
|
|
|
|
|
|||||||||
| Net income subsequent to initial public offering (October 9, 2013 through December 31, 2013) |
$ | 47,380 | ||||||||||||||
|
|
|
|
|
|||||||||||||
| Net income per common unit—Basic and Diluted(2) |
$ | 1.48 | $ | 0.59 | ||||||||||||
|
|
|
|
|
|||||||||||||
| Weighted-average units used to compute net income per common unit: |
||||||||||||||||
| Basic and Diluted |
80,918,531 | 79,656,250 | ||||||||||||||
|
|
|
|
|
|||||||||||||
| BALANCE SHEET DATA |
||||||||||||||||
| Cash and cash equivalents |
$ | 71,810 | $ | 182,977 | $ | 41,708 | $ | 1,034 | ||||||||
| Total assets |
674,340 | 604,380 | 405,345 | 154,682 | ||||||||||||
| Total liabilities |
486,276 | 453,009 | 349,227 | 150,395 | ||||||||||||
| Total partners’ capital/member’s equity |
188,064 | 151,371 | 56,118 | 4,287 | ||||||||||||
| OTHER FINANCIAL DATA |
||||||||||||||||
| EBITDA(3) |
$ | 162,570 | $ | 215,390 | $ | 76,421 | $ | 287 | ||||||||
| Capital expenditures for property, plant and equipment |
152,160 | 52,634 | 193,965 | 130,214 | ||||||||||||
| Total debt (excluding accrued interest) |
391,580 | 394,876 | 295,482 | 132,500 | ||||||||||||
49
Table of Contents
| Years Ended December 31, | ||||||||||||||||
| 2014 | 2013 | 2012 | 2011 | |||||||||||||
| KEY OPERATING DATA |
||||||||||||||||
| Products sold (thousand tons): |
||||||||||||||||
| Ammonia |
252.2 | 259.2 | 221.8 | — | ||||||||||||
| Methanol—procured |
— | 3.6 | 51.2 | — | ||||||||||||
| Methanol—produced |
614.2 | 652.0 | 201.0 | — | ||||||||||||
| Products pricing (average dollars per ton): |
||||||||||||||||
| Ammonia |
$ | 503 | $ | 525 | $ | 581 | $ | — | ||||||||
| Methanol—procured |
— | $ | 447 | $ | 398 | $ | — | |||||||||
| Methanol—produced |
$ | 449 | $ | 444 | $ | 375 | $ | — | ||||||||
| Production (thousand tons): |
||||||||||||||||
| Ammonia |
259.2 | 259.8 | 215.3 | 8.8 | ||||||||||||
| Methanol |
617.0 | 642.8 | 217.8 | — | ||||||||||||
| Days in Operations: |
||||||||||||||||
| Ammonia |
338 | 344 | 333 | 16 | ||||||||||||
| Methanol |
320 | 336 | 130 | — | ||||||||||||
| Capacity Utilization Rate(4): |
||||||||||||||||
| Ammonia |
98 | % | 98 | % | 81 | % | 76 | % | ||||||||
| Methanol |
85 | % | 88 | % | 59 | % | — | |||||||||
| Price of Natural Gas(5): |
4.52 | 3.78 | 3.30 | — | ||||||||||||
| (1) | Our ammonia production unit commenced production in December 2011, and our methanol production unit commenced production in July 2012. Although we began producing ammonia in December 2011, we did not sell the produced ammonia volumes until January 2012 in order to build inventories. As there were no ammonia or methanol revenues for the year ended December 31, 2011, no costs of goods sold were recorded in the period. |
| (2) | The 2013 amounts represent basic and diluted earnings per unit for the period from October 9, 2013 (the closing of our IPO) through December 31, 2013. Please see note 1 “Description of Business” in the notes to consolidated financial statements included in this report for additional information. |
| (3) | EBITDA is defined as net income plus (i) interest expense and other financing costs, (ii) depreciation expense, (iii) income tax expense and (iv) net loss on extinguishment of debt. We present EBITDA because it is a material component in our calculation of cash available for distribution. EBITDA is used as a supplemental financial measure by management and by external users of our financial statements, such as investors and commercial banks, to assess: |
| • | the financial performance of our assets without regard to financing methods, capital structure or historical cost basis; and |
| • | our operating performance and return on invested capital compared to those of other publicly traded limited partnerships and other public companies, without regard to financing methods and capital structure. |
| (4) | Calculated by total production volumes for a production unit for a given period, divided by the production capacity of that production unit. |
| (5) | Average purchase price of natural gas ($ per MMBtu) which is the Houston Ship Channel price plus a delivery fee, for a given period. |
EBITDA is a non-GAAP measure and should not be considered an alternative to net income, operating income, net cash provided by operating activities or any other measure of financial performance or liquidity presented in accordance with GAAP. EBITDA may have material limitations as a performance measure because it excludes items that are necessary elements of our costs and operations. In addition, EBITDA presented by other companies may not be comparable to our presentation, since each company may define this term differently.
50
Table of Contents
The table below reconciles EBITDA to net income for the periods ended December 31, 2014, 2013, 2012 and 2011 (dollars in thousands).
| Years Ended December 31, | October 9, 2013 through December 31, 2013 |
|||||||||||||||||||
| 2014 | 2013 | 2012 | 2011 | |||||||||||||||||
| Net income |
$ | 119,448 | $ | 154,351 | $ | 51,831 | $ | 287 | $ | 47,380 | ||||||||||
| Add: |
||||||||||||||||||||
| Interest expense |
18,250 | 16,684 | 5,718 | — | 4,574 | |||||||||||||||
| Interest expense—related party |
203 | 14,038 | 6,469 | — | 1,353 | |||||||||||||||
| Depreciation expense |
23,105 | 22,229 | 11,355 | — | 5,124 | |||||||||||||||
| Income tax expense (benefit) |
1,564 | 1,399 | 1,048 | — | (44 | ) | ||||||||||||||
| Loss on extinguishment of debt |
— | 6,689 | — | — | 3,035 | |||||||||||||||
|
|
|
|
|
|
|
|
|
|
|
|||||||||||
| EBITDA |
$ | 162,570 | $ | 215,390 | $ | 76,421 | $ | 287 | $ | 61,422 | ||||||||||
| ITEM 7. | MANAGEMENT’S DISCUSSION AND ANALYSIS OF FINANCIAL CONDITION AND RESULTS OF OPERATIONS |
You should read the following discussion and analysis of our financial condition, results of operations and cash flows in conjunction with our consolidated financial statements and the related notes presented in this report. This discussion contains forward-looking statements that are based on the views and beliefs of our management, as well as assumptions and estimates made by our management. Actual results could differ materially from such forward-looking statements as a result of various risk factors, including those that may not be in control of management. Factors that could cause or contribute to these differences include those discussed elsewhere in this report, particularly, but not limited to, those set forth in Item 1A—“Risk Factors” and under “Forward-Looking Statements.”
OVERVIEW
We are a Delaware limited partnership formed in February 2013 to own and operate a recently upgraded, integrated methanol and ammonia production facility that is strategically located on the Texas Gulf Coast near Beaumont.
We are currently one of the largest merchant methanol producers in the United States with a maximum annual methanol production capacity of approximately 730,000 metric tons. We also have a maximum annual ammonia production capacity of approximately 265,000 metric tons. During the first quarter of 2014, we began construction on a debottlenecking project that includes a maintenance turnaround and environmental upgrades, which we collectively refer to as our “debottlenecking project.” This debottlenecking project is expected to increase our maximum annual methanol production capacity by 25% to approximately 912,500 metric tons and our maximum annual ammonia production capacity by 15% to approximately 305,000 metric tons. Beginning in January of 2015, we shut down our facility, in order to complete our debottlenecking project. We expect the project to be complete by the end of March 2015.
Both methanol and ammonia are global commodities that are essential building blocks for numerous end-use products. Methanol is a liquid petrochemical that is used in a variety of industrial and energy-related applications. The primary use of methanol is to make other chemicals, with approximately two-thirds of global methanol demand being used to produce formaldehyde, acetic acid and a variety of other chemicals that form the foundation of a large number of chemical derivatives. These derivatives are used to produce a wide range of products, including adhesives for the lumber industry, plywood, particle board and laminates, resins to treat paper and plastic products, and also paint and varnish removers, solvents for the textile industry and polyester fibers for clothing and carpeting. Methanol is also used outside of the United States as a direct fuel for automobile engines, as a fuel blended with gasoline and as an octane booster in reformulated gasoline. Ammonia,
51
Table of Contents
produced in anhydrous form (containing no water) from the reaction of nitrogen and hydrogen, constitutes the base feedstock for nearly all of the world’s nitrogen chemical production. In the United States, ammonia is primarily used as a feedstock to produce nitrogen fertilizers, such as urea and ammonium sulfate, and is also directly applied to soil as a fertilizer. In addition, ammonia is widely used in industrial applications, particularly in the Texas Gulf Coast market, including in the production of plastics, synthetic fibers, resins and numerous other chemical derivatives.
FACTORS AFFECTING COMPARABILITY OF FINANCIAL INFORMATION
Our historical results of operations for periods prior to our IPO in October 2013 are not comparable with our results of operations for the years ended December 31, 2014 or 2013, or in the future for the reasons discussed below.
Start-Up of Our Facility
We did not achieve maximum daily production rates at our current capacity until the fourth quarter of 2012, after an approximate 20-month start-up phase. We acquired our facility (which had been idled by the previous owners since 2004) in May 2011, commenced an upgrade that was completed in July 2012 and began operating our facility at full capacity in the fourth quarter of 2012. Our facility began ammonia production in December 2011 and began methanol production in July 2012 with revenues first generated from ammonia sales in the first quarter of 2012 and from methanol sales in the third quarter of 2012. As a result of our limited history of operations due to an extended start-up phase, our results of operations and our operating cash flows presented below for the years ended December 31, 2012 and 2011 do not reflect full utilization of our facility and are not indicative of our expected results of operations and operating cash flows for future periods. In addition, prior to the start-up of our methanol production unit, we purchased and sold methanol to meet sales commitments to our customers and to take advantage of opportunities that we identified in the market.
Publicly Traded Limited Partnership Expenses
Since our IPO in October 2013, we have incurred additional general and administrative expenses as a consequence of being a publicly traded partnership, including expenses associated with SEC reporting requirements, tax return and Schedule K-1 preparation and distribution, Sarbanes-Oxley Act compliance, listing our common units on the NYSE, independent auditor fees, legal fees, investor relations costs, registrar and transfer agent fees, directors and officers insurance and director compensation. We incurred incremental general and administrative expense of approximately $4.6 million in 2014.
Our Debottlenecking Project
We have begun a project to expand our existing methanol and ammonia production capacity and have incurred, and expect to incur additional, significant costs and expenses for the construction and development of the project. Please read Item 1—“Overview—Our Debottlenecking Project”.
Key Industry and Operational Factors
Supply and Demand
Revenues and cash flow from operations are significantly affected by methanol and ammonia prices. The price at which we ultimately sell our methanol and ammonia depends on numerous factors, including the global supply and demand for methanol and ammonia.
Methanol. The primary use of methanol is to make other chemicals, with approximately 60-65% of global methanol demand being used to produce formaldehyde, acetic acid and a variety of other chemicals that form the
52
Table of Contents
foundation of a large number of chemical derivatives. These derivatives are used to produce a wide range of products, including adhesives for the lumber industry, plywood, particle board and laminates, resins to treat paper and plastic products, paint and varnish removers, solvents for the textile industry and polyester fibers for clothing and carpeting.
Energy-related applications consume the remaining 35-40% of global methanol demand. In recent years, there has been a strong demand for methanol in energy applications such as gasoline blending, biodiesel and as a feedstock in the production of dimethyl ether (“DME”) and Methyl tertiary-butyl ether (“MTBE”), particularly in China. Methanol blending in gasoline is currently not permitted in the United States, but outside of the United States, methanol is used as a direct fuel for automobile engines, as a fuel blended with gasoline and as an octane booster in reformulated gasoline. Despite the recent declines in crude oil prices, we do not expect a corresponding decrease in demand for methanol for fuel application as we believe blending methanol into gasoline at the current price levels remains economical for most producers.
Historically, demand for methanol in chemical derivatives has been closely correlated to levels of global economic activity, energy prices and industrial production. Because methanol derivatives are used extensively in the building industry, demand for these derivatives rises and falls with building and construction cycles, as well as the level of production of wood products, housing starts, refurbishments and related customer spending. Demand for methanol is also affected by automobile production, durable goods production, industrial investment and environmental and health trends. Methanol is predominately produced from natural gas, but is also produced from coal, particularly in China. Lower natural gas prices and improving economic conditions have recently resulted in an increase in methanol supply in the United States.
The methanol industry experienced a wave of global plant closures between 1998-2007 due to high natural gas prices as well as generally weaker demand for chemicals. During this period, numerous U.S. methanol facilities were shut down or relocated to other countries, resulting in the inability of current U.S. production capacity to meet current U.S. methanol demand. However, a long period of low natural gas prices in the United States has made it economical for companies to upgrade existing plants and initiate construction of new methanol and nitrogen projects. For example, Methanex Corporation (“Methanex”), Celanese Corporation (“Celanese”), Valero Energy Corporation (“Valero”) and OCI N.V. (“OCI”) have each announced plans to relocate, restart or construct methanol plants in the U.S. Gulf Coast region over the next few years, which will increase overall U.S. production capacity and the availability of methanol supply.
Ammonia. The fertilizer industry is the major end-user of ammonia, with approximately 80% used for the production of various fertilizers or, to a much lesser extent, for direct application into the ground. Ammonia is also used to produce various industrial products including blasting/mining compounds (ammonium nitrate); fibers and plastics (acrylonitrile, caprolactam and other nylon intermediates, isocyanates and other urethane intermediates, amino resins); and NOx emission reducing agents (ammonia, urea) among others. While these non-fertilizer applications only account for approximately 20% of global ammonia demand, this sector plays a much more significant role in demand for imported ammonia, accounting for more than one-third of global trade in ammonia.
In the United States, there is a meaningful correlation between demand for nitrogen fertilizer products and crop prices. Demand for fertilizers is affected by the aggregate crop planting decisions and fertilizer application rate decisions of individual farmers. Individual farmers make planting decisions based largely on the prospective profitability of a harvest, while the specific varieties and amounts of fertilizer they apply depend on many factors, including crop prices, their current liquidity, soil conditions, weather patterns and the types of crops planted. High crop prices incentivize farmers to increase fertilizer application in order to maximize crop yields. Thus, high crop prices tend to buoy fertilizer demand, resulting in higher demand for ammonia.
The ammonia industry experienced a wave of global plant closures during 1998-2007 due to high natural gas prices. During this period, numerous U.S. ammonia facilities were shut down or relocated to other countries,
53
Table of Contents
resulting in the inability of current U.S. production capacity to meet current U.S. ammonia demand, which ultimately led to higher imports into the United States of ammonia and nitrogen fertilizers. More recently, the development of low-cost shale natural gas reserves in the United States has reduced the price of natural gas and has made it economical for companies to upgrade existing ammonia and nitrogen fertilizer plants and initiate construction of new ammonia and nitrogen projects. Conversely, over the past three years, several nitrogen projects have been cancelled as a result of higher capital expenditure estimates than originally anticipated. For example, in the first quarter of 2014, a large chemical company abandoned its standalone ammonia project in Victoria, Texas, which was originally announced in August 2013.
Natural Gas Prices
Natural gas is the primary feedstock for our production of methanol and ammonia. Operating at full capacity, our methanol and ammonia production units together require approximately 80,000 to 90,000 MMBtu per day of natural gas, as of December 31, 2014. Accordingly, our profitability depends in large part on the cost of our natural gas feedstock, which approached ten-year lows at the beginning of 2015. In recent years, increased natural gas production from shale formations in the United States has increased domestic supplies of natural gas, resulting in a relatively low natural gas price environment. As a result, the competitive position of U.S. methanol and ammonia producers has been positively impacted relative to the competitive position of methanol and ammonia producers outside of the United States where the natural gas price environment is generally higher.
We completed the refurbishment of our natural gas reformer and the upgrade of our methanol production unit in July 2012. Prior to the successful completion of our upgrade, we used hydrogen as our primary feedstock and spent an insignificant amount on natural gas feedstock. Since the completion of our upgrade, natural gas has been our primary feedstock. For the year ended December 31, 2014, natural gas feedstock costs represented approximately 59.6% of our total cost of goods sold (exclusive of depreciation), as compared to 58.9% during the year ended December 31, 2013. During the year ended December 31, 2014, we spent approximately $130.6 million on natural gas feedstock supplies, which equaled an average cost per MMBtu of approximately $4.52, as compared to approximately $112.5 million on natural gas feedstock supplies, and an average cost per MMBtu of approximately $3.78 during the year ended December 31, 2013.
We have connections to one major interstate and three major intrastate natural gas pipelines that provide us access to significantly more natural gas supply than our facility requires and flexibility in sourcing our natural gas feedstock. We currently source natural gas from DCP Midstream and Kinder Morgan. In addition, we have recently connected our facility to a natural gas pipeline owned by Florida Gas Transmission and a natural gas pipeline owned by Houston Pipe Line Company. We believe that we have ready access to an abundant supply of natural gas for the foreseeable future due to our location and connectivity to major natural gas pipelines.
According to the Short-Term Energy Outlook published by the Energy Information Administration (the “EIA”) in February 2015, the Henry Hub natural gas spot price is expected to average $3.05 MMBtu during 2015 and $3.47 MMBtu in 2016. The EIA projects that U.S. total natural gas consumption will increase 1.4% in 2015 and 1.2% in 2016. The growth is largely driven by demand in the industrial and electrical power sectors, while residential and commercial consumption is projected to decline in 2015 and 2016. During the same time period, U.S. natural gas production is expected to increase by approximately 3.8% in 2015 and 2.2% in 2016. As natural gas is the feedstock for the majority of global methanol and ammonia production, having a low cost natural gas feedstock is a significant competitive advantage for U.S. producers.
Oil Prices
During the second half of 2014 and the first quarter of 2015 oil prices have dramatically dropped due to the increase of oil production in the United States, resistance of OPEC to cut oil output, slowdown of economic growth globally, and currency fluctuations in a number of countries. As a result, we believe lower crude oil prices could potentially have a negative impact on methanol prices.
54
Table of Contents
Global methanol demand is driven by approximately 60-65% for traditional chemical derivatives (formaldehyde, acetic acid, and other GDP-cyclical products) and 35-40% for energy applications (DME, MTBE and other fuel additives and blendstocks). The energy-based applications are directly impacted by the movement of crude oil prices; therefore, lower crude oil prices could negatively impact demand for methanol used in energy-based applications.
Historically, olefin prices and crude oil prices have been strongly correlated. Lower olefin prices make MTO production less economical since methanol is a feedstock for the production of olefins. However, since both methanol and olefin prices declined simultaneously along with crude oil prices, MTO producers in China are still generating healthy margins.
Historically, ammonia prices have been positively correlated with crude oil prices but have decoupled over the past five years. While lower crude oil prices could negatively impact ammonia prices, the price of natural gas to Ukrainian ammonia producers is more relevant to understanding the global ammonia production floor than is the price of crude oil.
We believe potential price pressure on methanol and ammonia producers will be partly mitigated by lower natural gas feedstock costs.
Product Sales Contracts
We are party to methanol sales contracts with Methanex, Koch Methanol LLC, ExxonMobil, Arkema and Lucite. Our customers have no minimum volume purchase obligations under these contracts, may determine not to purchase any more methanol from us at any time and may purchase methanol from other suppliers. Consistent with industry practice, our methanol sales contracts set our pricing terms to reflect a specified discount to a published monthly benchmark methanol price (Argus or Southern Chemical), and our methanol is sold on an FOB basis when transported by barge, pipeline, and our methanol truck loading facility. The payment terms under our methanol sales contacts are net 25-30 days. For the year ended December 31, 2014, methanol sales contracts with Methanex and Koch Methanol LLC accounted for approximately 32.7% and 21.0%, respectively, of our total revenues.
We are party to ammonia sales contracts with Rentech, Koch Nitrogen LLC, Trammo, Lucite, and DuPont. Our customers have no minimum volume purchase obligations under these contracts, may determine not to purchase any more ammonia from us at any time and may purchase ammonia from other suppliers. Consistent with industry practice, these contracts set our pricing terms to reflect a specified discount to a published monthly benchmark ammonia price (CFR Tampa), and our ammonia is sold on an FOB basis when delivered by barge and pipeline. The payment terms under our ammonia sales contacts are net 30 days. For the year ended December 31, 2014, ammonia sales contracts with Rentech and Trammo accounted for approximately 14.9% and 5.2%, respectively, of our total revenues.
During the year ended December 31, 2014, we delivered approximately 49.4% of our total sales by barge, 48.6% of our total sales by pipeline, and approximately 2.0% of our total sales through our methanol truck loading facility.
Facility Reliability
The amount of revenue we generate primarily depends on the sales and production volumes of methanol and ammonia. These volumes are primarily affected by the utilization rates of our production units, which is the total production volume for a production unit for a given period divided by the production capacity of that production unit. Production capacity is 726 metric tons per day for our ammonia production unit and 2,000 metric tons per day for our methanol production unit. Maintaining consistent, safe and reliable operations at our facility are critical to our financial performance and results of operations. Efficient production of methanol and ammonia
55
Table of Contents
requires reliable and stable operations at our facility due to the high costs associated with planned and unplanned downtime, which may result in lost margin opportunity, increased maintenance expense and a temporary decrease in working capital investment and related inventory position. As of December 31, 2014, we estimate for each day of unplanned downtime our lost opportunity cost to be approximately $0.7 million to $0.8 million, per day. This estimate does not include the additional repair and maintenance costs associated with unplanned downtime.
We expect to perform maintenance turnarounds approximately every four years, which will typically last approximately four weeks and cost approximately $24.0 million per turnaround. We will perform significant maintenance capital projects at our facility during a turnaround to minimize disruption to our operations and to maintain or improve reliability. We plan to undertake a turnaround as part of our debottlenecking project that we expected to complete by the end of March 2015. We expect that the next turnaround after the completion of the debottlenecking project will occur in 2019.
How We Evaluate Our Operations
Our management uses a variety of financial and operating metrics to analyze our performance. These metrics are significant factors in assessing our results of operations and profitability and include capacity utilization and EBITDA (as defined below). We view these metrics as important factors in evaluating our profitability and frequently review these measurements to analyze trends and make decisions.
Capacity Utilization
During the year ended December 31, 2014, our ammonia and methanol production units were in operation for 338 days and 320 days, respectively, as compared to 344 and 336 days, respectively, during the year ended December 31, 2013. During the year ended December 31, 2014, our ammonia and methanol production units were shut down for 28 days and 45 days, respectively, due to a period of unplanned downtime early in the first quarter of 2014, as a result of an electrical power outage, and in the third quarter of 2014, as a result of electrical power outages and repairs to our reformer. During the year ended December 31, 2013, our ammonia and methanol production units were shut down for 21 days and 29 days, respectively, due to repairs to our syngas machine.
We produced approximately 259,214 metric tons of ammonia and approximately 617,031 metric tons of methanol during the year ended December 31, 2014, representing capacity utilization rates of 98% and 85% for the ammonia and methanol production units, respectively, as compared to production of approximately 259,788 metric tons of ammonia and 642,824 metric tons of methanol during the year ended December 31, 2013, representing capacity utilization rates of 98% and 88% for the ammonia and methanol production units, respectively. Our methanol capacity utilization rate for the year ended December 31, 2014 was lower than the capacity utilization rate for the year ended December 31, 2013 due to the unplanned downtime experienced in the first and third quarters of 2014.
EBITDA
EBITDA is defined as net income plus (i) interest expense and other financing costs, (ii) depreciation expense, (iii) income tax expense and (iv) net loss on extinguishment of debt. EBITDA is used as a supplemental financial measure by management and by external users of our financial statements, such as investors and commercial banks, to assess:
| • | the financial performance of our assets without regard to financing methods, capital structure or historical cost basis; and |
| • | our operating performance and return on invested capital compared to those of other publicly traded partnerships, without regard to financing methods and capital structure. |
56
Table of Contents
EBITDA should not be considered an alternative to net income, operating income, net cash provided by operating activities or any other measure of financial performance or liquidity presented in accordance with GAAP. EBITDA may have material limitations as a performance measure because it excludes items that are necessary elements of our costs and operations. In addition, EBITDA presented by other companies may not be comparable to our presentation because each company may define EBITDA differently.
RESULTS OF OPERATIONS
Comparison of the Results of Operations for the Years Ended December 31, 2014 and 2013:
Revenues
| For the Years Ended December 31, |
||||||||
| 2014 | 2013 | |||||||
| (in thousands) | ||||||||
| Total revenues |
$ | 402,780 | $ | 427,964 | ||||
|
|
|
|
|
|||||
| For the Year Ended December 31, 2014 |
For the Year Ended December 31, 2013 |
|||||||||||||||
| Metric Tons | Revenue | Metric Tons | Revenue | |||||||||||||
| (in thousands) | (in thousands) | |||||||||||||||
| Revenues: |
||||||||||||||||
| Ammonia |
252.2 | $ | 126,808 | 259.2 | $ | 136,150 | ||||||||||
| Methanol—Procured |
— | — | 3.6 | 1,589 | ||||||||||||
| Methanol—Produced |
614.3 | 275,553 | 652.0 | 289,717 | ||||||||||||
| Other |
— | 419 | — | 508 | ||||||||||||
|
|
|
|
|
|
|
|
|
|||||||||
| Total |
866.5 | $ | 402,780 | 914.8 | $ | 427,964 | ||||||||||
|
|
|
|
|
|
|
|
|
|||||||||
Our total revenues were approximately $402.8 million for the year ended December 31, 2014 compared to approximately $428.0 million for the year ended December 31, 2013. Our methanol revenues were approximately $275.6 million for the year ended December 31, 2014 compared to approximately $291.3 million for the year ended December 31, 2013, which is a 5.4% decrease. This decrease was due to a reduction in methanol production volumes of 4.0%, caused by the unplanned downtime experienced during the first and third quarters of 2014. The decrease in production volumes led to a 6.3% decrease in methanol sales volumes for the year ended December 31, 2014 compared to the year ended December 31, 2013. Our ammonia revenues were approximately $126.8 million for the year ended December 31, 2014 compared to approximately $136.2 million for the year ended December 31, 2013, representing a 6.9% decrease. This decrease in ammonia revenues is attributed to the 4.3% decrease in average sales price per metric ton of ammonia and to the 2.7% decrease in ammonia sales volumes for the year ended December 31, 2014 compared to the year ended December 31, 2013.
We sold approximately 614,213 metric tons of produced methanol during the year ended December 31, 2014 compared to approximately 652,000 metric tons of produced methanol and approximately 3,600 metric tons of procured methanol during the year ended December 31, 2013. This decrease in sales volumes was due to the corresponding decrease in production volumes. The average sales prices per metric ton of methanol sold during the year ended December 31, 2014 was $448.56 per metric ton compared to $444.33 per metric ton for the year ended December 31, 2013, representing an increase of 1.0%. During early 2014, our average methanol sales prices was elevated due to global supply disruptions caused by production issues, natural gas supply restrictions or, in some cases, higher natural gas prices. During March 2014 and lasting through August 2014, methanol prices declined due to an increase in global supply from the recovery of global production, which outpaced demand growth. During September through November 2014, our average methanol sales prices increased due to global supply disruptions caused by production issues and natural gas supply restrictions. Sales of methanol comprised approximately 68.4% of our total revenues for the year ended December 31, 2014 compared to 68.1% of our total revenues for the year ended December 31, 2013.
57
Table of Contents
Set forth below is a table showing average methanol sales prices per metric ton, per quarter for the previous twelve fiscal quarters.
| Average Methanol Sales Prices | ||||||||||||
| 2014 | 2013 | 2012 | ||||||||||
| For the Three-Months Ended: |
||||||||||||
| March 31 |
$ | 529.43 | $ | 410.97 | $ | 458.08 | ||||||
| June 30 |
$ | 470.09 | $ | 443.43 | $ | 398.54 | ||||||
| September 30 |
$ | 393.86 | $ | 440.22 | $ | 367.12 | ||||||
| December 31 |
$ | 405.07 | $ | 484.92 | $ | 378.50 | ||||||
We sold approximately 252,208 metric tons of ammonia during the year ended December 31, 2014 compared to approximately 259,200 metric tons of ammonia during the year ended December 31, 2013, which represents a decrease of 2.7%. The average sales prices per metric ton of ammonia sold during the year ended December 31, 2014 was $502.81 per metric ton compared to $525.27 per metric ton for the year ended December 31, 2013, which represents a decrease of 4.3%. Ammonia prices fell during late 2013 and early 2014, due to poor weather conditions in the United States, which is unfavorable for the fall fertilizer application of ammonia. During April 2014 and May 2014, ammonia prices increased due to the spring application season, and during late October 2014 and November 2014, ammonia prices increased due to supply constraints caused by global production issues and the fall application season. Sales of ammonia comprised approximately 31.5% of our total revenues for the year ended December 31, 2014 compared to 31.8% of our total revenues for the year ended December 31, 2013.
Set forth below is a table showing average ammonia sales prices per metric ton, per quarter for the previous twelve fiscal quarters.
| Average Ammonia Sales Prices | ||||||||||||
| 2014 | 2013 | 2012 | ||||||||||
| For the Three-Months Ended: |
||||||||||||
| March 31 |
$ | 408.18 | $ | 640.76 | $ | 442.66 | ||||||
| June 30 |
$ | 511.46 | $ | 569.84 | $ | 491.53 | ||||||
| September 30 |
$ | 508.14 | $ | 471.44 | $ | 662.71 | ||||||
| December 31 |
$ | 568.22 | $ | 452.61 | $ | 679.92 | ||||||
Cost of Sales (exclusive of depreciation)
| For the Year Ended December 31, 2014 |
For the Year Ended December 31, 2013 |
|||||||||||||||
| $ in thousands | % of Total | $ in thousands | % of Total | |||||||||||||
| Natural Gas |
$ | 130,613 | 59.6 | % | $ | 112,492 | 58.9 | % | ||||||||
| Hydrogen |
24,514 | 11.2 | 23,054 | 12.1 | ||||||||||||
| Nitrogen |
6,354 | 2.9 | 6,485 | 3.4 | ||||||||||||
| Maintenance |
27,287 | 12.5 | 19,425 | 10.2 | ||||||||||||
| Labor |
15,890 | 7.3 | 10,423 | 5.5 | ||||||||||||
| Other |
14,137 | 6.5 | 19,075 | 10.0 | ||||||||||||
| Total |
$ | 218,795 | 100.0 | % | $ | 190,954 | 100.0 | % | ||||||||
Cost of goods sold (exclusive of depreciation) was approximately $218.8 million and 54.3% of revenue for the year ended December 31, 2014 compared to cost of goods sold (exclusive of depreciation) of approximately $191.0 million and 44.6% of revenues for the year ended December 31, 2013. This increase in cost of goods sold (exclusive of depreciation) for the year ended December 31, 2014 compared to the year ended December 31, 2013 was primarily due to increased natural gas prices. Our purchase price for natural gas increased from an
58
Table of Contents
average of $3.78 per MMBtu for the year ended December 31, 2013 to an average of $4.52 per MMBtu for the year ended December 31, 2014, an increase of 19.6%. During the first quarter of 2014, our purchase price of natural gas rose to $5.07 due to the extremely cold winter weather experienced in the United States which resulted in an increase in demand and a reduction in supply reserves. For the remainder of 2014, the purchase price of natural gas remained higher than 2013 prices. Due to the additional unplanned downtime during the year ended December 31, 2014, maintenance and labor costs increased by 40.5% and 52.5%, respectively, as compared to the year ended December 31, 2013.
Set forth below is a table showing our purchase price for natural gas per MMBtu, per quarter for the previous twelve fiscal quarters.
| Natural Gas Purchase Prices | ||||||||||||
| 2014 | 2013 | 2012 | ||||||||||
| For the Three-Months Ended: |
||||||||||||
| March 31 |
$ | 5.07 | $ | 3.46 | $ | 3.06 | ||||||
| June 30 |
$ | 4.66 | $ | 4.20 | $ | 2.87 | ||||||
| September 30 |
$ | 4.28 | $ | 3.74 | $ | 3.03 | ||||||
| December 31 |
$ | 4.07 | $ | 3.72 | $ | 3.51 | ||||||
Depreciation Expense
Depreciation expense was approximately $23.1 million for the year ended December 31, 2014 compared to approximately $22.2 million for the year ended December 31, 2013.
Selling, General and Administrative Expense
Selling, general and administrative expenses were approximately $22.4 million for the year ended December 31, 2014 compared to approximately $26.8 million for the year ended December 31, 2013. This 16.5% decrease is due to a management fee paid to Orascom Construction Industries (“OCI Egypt”) that was terminated and subsequently replaced with the Omnibus Agreement (as defined below) upon the completion of the IPO and a consulting contract that has since been terminated. Please read note 7 to the consolidated financial statements and “Item 13—Certain Relationships and Related Transactions and Director Independence.”
On October 9, 2013, in connection with the closing of the IPO, we entered into an omnibus agreement by and between us, OCI, OCI USA, OCI GP LLC and OCIB (the “Omnibus Agreement”) pursuant to which OCI USA and its affiliates agreed to provide us with selling, general and administrative services, and we will reimburse OCI USA and its affiliates for all direct or allocated costs and expenses incurred by OCI USA and its affiliates in providing such services. In addition, our partnership agreement requires us to reimburse our general partner for (i) direct and indirect expenses it incurs or payments it makes on our behalf (including salary, bonus, incentive compensation and other amounts paid to any person, including affiliates of our general partner, to perform services for us or our subsidiaries or for our general partner in the discharge of its duties to us and our subsidiaries), and (ii) all other expenses reasonably allocable to us or our subsidiaries or otherwise incurred by our general partner in connection with operating our business (including expenses allocated to our general partner by its affiliates). Our general partner is entitled to determine the expenses that are allocable to us and our subsidiaries.
Interest Expense
Interest expense was approximately $18.3 million for the year ended December 31, 2014 compared to $16.7 million for the year ended December 31, 2013. During 2014, interest expense increased due to the incremental $165.0 million Term B-2 loan (as defined in note 6 of the consolidated financial statements) entered into on November 27, 2013. We capitalized $6.4 million of interest expense during the year ended December 31, 2014, as compared to $0.6 million of interest capitalized during the year ended December 31, 2013. Capitalized
59
Table of Contents
interest costs are determined by applying a weighted average interest rate paid on borrowings to the average amount of accumulated capital expenditures in the period. This increase in capitalized interest is due to the commencement of the debottlenecking project.
Interest expense–related party was approximately $0.2 million for the year ended December 31, 2014 compared to $14.0 million for the year ended December 31, 2013. Interest expense–related party relates to interest on our intercompany debt and the commitment fee on the unused portion of our Intercompany Revolving Facility owed to OCI Fertilizer International B.V. (“OCI Fertilizer”). This decrease in interest expense – related party is due to the repayment of our Intercompany Term Facility on November 27, 2013. We capitalized no interest expense—related party during the year ended December 31, 2014, as compared to $0.4 million during the year ended December 31, 2013.
Loss on extinguishment of debt
Loss on extinguishment of debt was approximately $6.7 million for the year ended December 31, 2013. This loss was due to the repayment of our borrowings under the Bridge Term Loan Credit Facility in August 2013, the extinguishment of our $125 million Term B-1 Loan (as defined in note 6 to the consolidated financial statements) in October 2013 and the resulting recognition of an expense for all remaining deferred loan fees. There were no such losses on extinguishment of debt in the year ended December 31, 2014.
Other Income
Other income was approximately $0.9 million for the year ended December 31, 2014 compared to approximately $5.2 million for the year ended December 31, 2013. During 2013, we made a business interruption claim with its insurance providers to cover a portion of its losses associated with 13 days of unplanned downtime, as we took our methanol unit offline to repair its syngas machine, including replacing a rotor and installing new bearings. We received insurance proceeds of $5.1 million in connection with this insurance claim during the fourth quarter of 2013, and the effect of the receipt of these insurance proceeds was included in other income (expense) in our consolidated statement of operations for the year ended December 31, 2013. On April 15, 2014, we reached a final settlement under this insurance claim, whereby the insurance provider agreed and paid a final installment of $0.6 million, and the effect of the receipt of these insurance proceeds is presented in other income (expense) in the accompanying consolidated statement of operations. Please read note 11—“Commitments, Contingencies, and Legal Proceedings” included in this report for additional information.
Comparison of the Results of Operations for the Years Ended December 31, 2013 and 2012:
Revenues
| For the Years Ended December 31, |
||||||||
| 2013 | 2012 | |||||||
| (in thousands) | ||||||||
| Total revenues |
$ | 427,964 | $ | 224,629 | ||||
|
|
|
|
|
|||||
| For the Year Ended December 31, 2013 |
For the Year Ended December 31, 2012 |
|||||||||||||||
| Metric Tons | Revenue | Metric Tons | Revenue | |||||||||||||
| (in thousands) | (in thousands) | |||||||||||||||
| Revenues: |
||||||||||||||||
| Ammonia |
259.2 | $ | 136,150 | 221.8 | $ | 128,954 | ||||||||||
| Methanol—Procured |
3.6 | 1,589 | 51.2 | 20,382 | ||||||||||||
| Methanol—Produced |
652.0 | 289,717 | 201.0 | 75,293 | ||||||||||||
| Other |
— | 508 | — | — | ||||||||||||
|
|
|
|
|
|
|
|
|
|||||||||
| Total |
914.8 | $ | 427,964 | 474.0 | $ | 224,629 | ||||||||||
|
|
|
|
|
|
|
|
|
|||||||||
60
Table of Contents
Our total revenues were approximately $428.0 million for the year ended December 31, 2013 compared to approximately $224.6 million for the year ended December 31, 2012. Our methanol revenues were approximately $291.3 million for the year ended December 31, 2013 compared to approximately $95.7 million for the year ended December 31, 2012. This increase was due to start-up downtime associated with our methanol production unit during 2012, which commenced methanol production in July 2012, ramped up production during the third and fourth quarters of 2012 and achieved maximum daily production rates at our current capacity in the fourth quarter of 2012. Our methanol production unit was in operation for 336 days during the year ended December 31, 2013 as compared to 130 days during the year ended December 31, 2012. Prior to the start-up of our methanol production unit, we purchased and sold methanol to meet sales commitments to our customers and to take advantage of opportunities that we identified in the market. During July and August 2013, we experienced 13 days of unplanned downtime as we took our methanol unit offline to repair the syngas machine, including replacing a rotor and installing new bearings. During this unplanned downtime, and during our production ramp up in 2012, we purchased and sold methanol to meet additional sales commitments to our customers. Our ammonia revenues were approximately $136.2 million for the year ended December 31, 2013 compared to approximately $129.0 million for the year ended December 31, 2012. This increase was due to continuing upgrades at our ammonia production unit during 2012. Although our ammonia production began in December 2011, we did not achieve maximum daily production rates of ammonia at our current capacity until August 2012.
We sold approximately 652,000 metric tons of produced methanol and approximately 3,600 metric tons of procured methanol during the year ended December 31, 2013 compared to approximately 201,000 metric tons of produced methanol and approximately 51,200 metric tons of procured methanol during the year ended December 31, 2012. This increase in sales volumes was due to the completion of the refurbishment of our methanol unit in July 2012 and the ongoing ramp up of production throughout the year. The average sales prices per metric ton of methanol sold during the year ended December 31, 2013 was $444 per metric ton compared to $379 per metric ton for the year ended December 31, 2012. This represents an increase of 17.2%. Stronger prices were predominantly due to supply issues over the course of the year caused by political unrest, natural gas supply restrictions or, in some cases, higher natural gas prices, whereas overall methanol demand has increased steadily. Sales of methanol comprised approximately 68.1% of our total revenues for the year ended December 31, 2013 compared to 42.7% of our total revenues for the year ended December 31, 2012.
Set forth below is a table showing average methanol sales prices per metric ton, per quarter for the previous eight fiscal quarters.
| Average Methanol Sales Prices |
||||||||
| 2013 | 2012 | |||||||
| For the Three-Months Ended: |
||||||||
| March 31 |
$ | 410.97 | $ | 458.08 | ||||
| June 30 |
$ | 443.43 | $ | 398.54 | ||||
| September 30 |
$ | 440.22 | $ | 367.12 | ||||
| December 31 |
$ | 484.92 | $ | 378.50 | ||||
We sold approximately 259,200 metric tons of ammonia during the year ended December 31, 2013 compared to approximately 221,800 metric tons of ammonia during the year ended December 31, 2012. This represents an increase of 16.9% compared to the ammonia sales volume during the year ended December 31, 2012. This increase is due to continuing upgrades at our ammonia production unit during 2012. Although our ammonia production began in December 2011, we did not achieve maximum daily production rates of ammonia at our current capacity until August 2012. The average sales prices per metric ton of ammonia sold during the year ended December 31, 2013 was $525 per metric ton compared to $581 per metric ton for the year ended December 31, 2012. This represents a decrease of 9.6% due to oversupply as a result of low consumption in the United States due to poor weather conditions and globally due to lower demand for phosphate fertilizers, which are significant users of ammonia. Sales of ammonia comprised approximately 31.8% of our total revenues for the year ended December 31, 2013 compared to 57.3% of our total revenues for the year ended December 31, 2012.
61
Table of Contents
Set forth below is a table showing average ammonia sales prices per metric ton, per quarter for the previous eight fiscal quarters.
| Average Ammonia Sales Prices |
||||||||
| 2013 | 2012 | |||||||
| For the Three-Months Ended: |
||||||||
| March 31 |
$ | 640.76 | $ | 442.66 | ||||
| June 30 |
$ | 569.84 | $ | 491.53 | ||||
| September 30 |
$ | 471.44 | $ | 662.71 | ||||
| December 31 |
$ | 452.61 | $ | 679.92 | ||||
Cost of Sales (exclusive of depreciation)
| For the Year Ended December 31, 2013 |
For the Year Ended December 31, 2012 |
|||||||||||||||
| $ in thousands | % of Total | $ in thousands | % of Total | |||||||||||||
| Natural Gas |
$ | 112,492 | 58.9 | % | $ | 35,129 | 26.3 | % | ||||||||
| Hydrogen |
23,054 | 12.1 | 34,566 | 25.9 | ||||||||||||
| Nitrogen |
6,485 | 3.4 | 3,707 | 2.8 | ||||||||||||
| Maintenance |
19,425 | 10.2 | 14,580 | 10.9 | ||||||||||||
| Labor |
10,423 | 5.5 | 7,530 | 5.6 | ||||||||||||
| Other |
19,075 | 10.0 | 37,918 | 28.4 | ||||||||||||
| Total |
$ | 190,954 | 100.0 | % | $ | 133,430 | 100.0 | % | ||||||||
Cost of goods sold (exclusive of depreciation) was approximately $191.0 million for the year ended December 31, 2013 compared to cost of goods sold (exclusive of depreciation) of approximately $133.4 million for the year ended December 31, 2012. The increase in cost of goods sold (exclusive of depreciation) for the year ended December 31, 2013 compared to the year ended December 31, 2012 was primarily due to our commencing methanol production in July 2012 and to higher ammonia sales volume for the year ended December 31, 2013 as compared to the year ended December 31, 2012 as we did not achieve maximum daily production rates until August 2012. Sales of produced methanol increased from 201,000 metric tons for the year ended December 31, 2012 to 652,000 metric tons for the year ended December 31, 2013, while sales of procured methanol decreased from 51,200 metric tons for the year ended December 31, 2012 to 3,600 metric tons for the year ended December 31, 2013. Ammonia sales increased from 221,800 metric tons for the year ended December 31, 2012 to 259,200 metric tons for the year ended December 31, 2013. In addition, our purchase price for natural gas increased from an average of $3.30 per MMBtu for the year ended December 31, 2012 to an average of $3.78 per MMBtu for the year ended December 31, 2013, an increase of 14.5%.
Set forth below is a table showing our purchase price for natural gas per MMBtu, per quarter for the previous eight fiscal quarters.
| Natural Gas Purchase Prices |
||||||||
| 2013 | 2012 | |||||||
| For the Three-Months Ended: |
||||||||
| March 31 |
$ | 3.46 | $ | 3.06 | ||||
| June 30 |
$ | 4.20 | $ | 2.87 | ||||
| September 30 |
$ | 3.74 | $ | 3.03 | ||||
| December 31 |
$ | 3.72 | $ | 3.51 | ||||
62
Table of Contents
Cost of goods sold (exclusive of depreciation) was approximately 44.6% of revenue for the year ended December 31, 2013 compared to approximately 59.4% of revenue for the year ended December 31, 2012. The decrease in cost of goods sold (exclusive of depreciation) as a percentage of revenue for the year ended December 31, 2013 compared to the year ended December 31, 2012 was primarily due to us purchasing methanol and hydrogen during the year ended December 31, 2012 to meet sales commitments to our customers. Prior to the start-up of the methanol production unit in July 2012, we purchased methanol and sold it to our customers to meet sales commitments. The purchase of methanol during the year ended December 31, 2013 was isolated to the 13 days of downtime in the third quarter of 2013, in which we took our methanol unit offline to repair the syngas machine, including replacing a rotor and installing new bearings. During this period of unplanned downtime, we purchased 3,600 metric tons of methanol in order to meet our sales commitments. We also purchased hydrogen during the year ended December 31, 2012 for use as the primary feedstock in the production of ammonia. When our facility became fully operational, we began obtaining approximately 50% of the hydrogen necessary to produce ammonia as a by-product of our methanol production process. Until our methanol unit became fully operational, we acquired all of our hydrogen from the local market.
Depreciation Expense
Depreciation expense was approximately $22.2 million for the year ended December 31, 2013 compared to approximately $11.4 million for the year ended December 31, 2012. This increase was primarily due to depreciation expense associated with our methanol production unit that was placed into service in July 2012, and our ammonia production unit, which commenced production in December 2011, but did not achieve maximum daily production rates at our current capacity until August 2012.
Selling, General and Administrative Expense
Selling, general and administrative expenses were approximately $26.8 million for the year ended December 31, 2013 compared to approximately $15.0 million for the year ended December 31, 2012. This increase was primarily due to additional insurance expense related to our upgraded facility, an increase in administrative and personnel expenses due to the addition of employees during the periods after July 1, 2012 and an increase in legal and professional services expense and corporate costs of $6.3 million in the aggregate related to a management fee paid to OCI that was terminated and replaced with the Omnibus Agreement upon the completion of our IPO and a consulting contract that has since been terminated. Please read note 7 to the consolidated financial statements and “Item 13—Certain Relationships and Related Transactions and Director Independence.”
Since our IPO in October 2013, our general and administrative expenses have increased due to the costs of operating as a publicly traded partnership, including expenses associated with SEC reporting requirements, tax return and Schedule K-1 preparation and distribution, Sarbanes-Oxley Act compliance, listing our common units on the NYSE, independent auditor fees, legal fees, investor relations costs, registrar and transfer agent fees, directors and officers insurance and director compensation. We incurred incremental general and administrative expense of approximately $2.7 million in 2013, excluding the costs associated with the IPO.
Interest Expense
Interest expense was approximately $16.7 million for the year ended December 31, 2013 compared to $5.7 million for the year ended December 31, 2012. This increase is due to an increase in borrowings of $235 million at a rate of 6.25%, as well as an increase in our interest rate on the $125 million of borrowings that were in place in 2012 to 6.25% in 2013, as compared to 4.82% in 2012. We capitalized interest expense in the year ended December 31, 2013 of $0.6 million, as compared to $0.7 million in the year ended December 31, 2012.
63
Table of Contents
Interest expense–related party was approximately $14.0 million for the year ended December 31, 2013 compared to $6.5 million for the year ended December 31, 2012. Interest expense–related party relates to interest on our intercompany debt owed to OCI Fertilizer. We capitalized interest expense-related party in the year ended December 31, 2013 of $0.4 million as compared to $10.3 million in the year ended December 31, 2012. This increase in interest expense-related party was primarily due to the completion of the refurbishment of the ammonia and methanol plants. Prior to the completion of the upgrade of our facility, interest incurred was capitalized in accordance with our accounting policy to capitalize interest on indebtedness incurred during the construction of major projects. Capitalized interest costs are determined by applying a weighted average interest rate paid on borrowings to the average amount of accumulated capital expenditures in the period. Due to the upgrade and refurbishment of the ammonia and methanol plants, fixed assets increased in the year ended December 31, 2012 by 123%; whereas during the year ended December 31, 2013, fixed assets increased by 9%. The significant fixed assets expenditures in the year ended December 31, 2012 led to the capitalization of a significant amount of interest, therefore, lowering interest expense during the period. Similarly, the reduction in capital expenditures for the year ended December 31, 2013 resulted in a significant reduction to capitalized interest in the period, and consequently, an increase in interest expense.
Loss on extinguishment of debt
Loss on extinguishment of debt was approximately $6.7 million for the year ended December 31, 2013. This loss was due to the repayment of our borrowings under the Bridge Term Loan Credit Facility (as defined in note 6 in the consolidated financial statements) in August 2013, the extinguishment of our $125 million Term B-1 Loan (as defined in note 6 in the consolidated financial statements) in October 2013 and the resulting recognition of an expense for all remaining deferred loan fees. There were no such losses on extinguishment of debt in the year ended December 31, 2012.
Other Income
Other income was approximately $5.2 million for the year ended December 31, 2013 compared to approximately $0.2 million for the year ended December 31, 2012. This increase was primarily due to the business interruption claim we made with its insurance providers to cover a portion of its losses associated with 13 days of unplanned downtime, as we took our methanol unit offline to repair our syngas machine, including replacing a rotor and installing new bearings. We received insurance proceeds of $5.1 million in connection with this insurance claim during the fourth quarter of 2013, and the effect of the receipt of these insurance proceeds has been included in other income (expense) in our consolidated statement of operations for the year ended December 31, 2013. Please read note 11—“Commitments, Contingencies, and Legal Proceedings” included in this report for additional information.
LIQUIDITY AND CAPITAL RESOURCES
Our principal liquidity requirements are to finance current operations, pay distributions to our partners, fund capital expenditures, including our debottlenecking project, and service our debt.
Under our current cash distribution policy, we intend to distribute 100% of the cash available for distribution that we generate each quarter. Please read Item 5—“Market for Registrant’s Common Equity, Related Unitholder Matters and Issuer Purchases of Equity Securities” included in this report for additional information.
We have sufficient funding available from our sponsor, OCI, including our Intercompany Equity Commitment (as defined below) and Intercompany Term Facility (as defined below), to fund any reasonably anticipated additional costs related to the debottlenecking project. Please read Item 1—“Overview—Our Debottlenecking Project”.
Our sources of liquidity include cash flow from operations, cash on hand and the credit facilities described below (other than the Term Loan B Credit Facility). We believe that our current and expected sources of liquidity will be adequate to fund these operating needs and capital expenditures for the next 12 months.
64
Table of Contents
Credit Facilities
Described below are the credit facilities under which OCIB may draw extra liquidity as of December 31, 2014. Please read Item 8—“Financial Statements and Supplementary Data”, note 6 and note 15 to the consolidated financial statements included in this report for additional information relating to OCIB’s credit facilities.
Term Loan B Credit Facility
On August 20, 2013, OCIB, as borrower, and OCI USA, as guarantor, entered into a senior secured term loan credit facility (as supplemented by a credit agreement joinder, dated as of October 18, 2013, under which the Partnership became a party to such credit facility as a guarantor, and as subsequently amended through and in effect as of December 31, 2014, the “Term Loan B Credit Facility”) with a syndicate of institutional lenders and investors and Bank of America, N.A., as administrative agent. As of December 31, 2014, the principal outstanding under the Term Loan B Credit Facility was $395.0 million. We do not have any additional committed capacity from identified lenders or investors under the Term Loan B Credit Facility, and we do not believe that the Term Loan B Credit Facility is a source of further liquidity for OCIB. Furthermore, the Term Loan B Credit Facility contains customary covenants and conditions based on the maintenance of certain senior secured net leverage ratios and interest coverage ratios (see note 6 and note 15 to the consolidated financial statements below for a complete description). As a result of such covenants, we will be limited in the manner in which we conduct our business and we may be unable to engage in favorable business activities or finance future operations or capital needs. In addition, to the extent that we are unable to refinance our debt at maturity on favorable terms, or at all, our ability to fund our operations and our ability to make cash distributions could be adversely affected. Upon the occurrence of certain events of default under the Term Loan B Credit Facility, OCIB’s obligations under the Term Loan B Credit Facility may be accelerated which could impair our ability to fund our operations and our ability to make cash distributions.
On March 12, 2015, OCIB, the Partnership and OCI USA entered into Amendment No. 4 (“Term Loan Amendment No. 4”) to the Term Loan B Credit Facility (such facility as amended by Term Loan Amendment No. 4, the “Amended Term Loan Facility”), with Bank of America, as administrative agent, and the other lenders party thereto to (i) increase the maximum consolidated senior secured net leverage ratio from 1.75 to 2.25 for the quarter ending March 31, 2015, (ii) increase the maximum consolidated senior secured net leverage ratio from 1.75 to 2.50 for the quarters ending June 30, 2015 and September 30, 2015, (iii) increase the maximum consolidated senior secured net leverage ratio from 1.75 to 2.25 for the quarter ending December 31, 2015, (iv) increase the interest rate margin on the outstanding term loans under the Amended Term Loan Facility such that OCIB may select an interest rate of (a) 4.50% above LIBOR for LIBO Rate Term Loans (as defined in the Amended Term Loan Facility) or (b) 3.25% above the Base Rate for Base Rate Term Loans (as each such term is defined in the Amended Term Loan Facility), (v) applied a prepayment premium (A) with respect to any voluntary prepayment of Term B-3 Loans (as defined in note 6 in the consolidated financial statements) (including in connection with the incurrence of refinancing indebtedness), of 3% of the principal amount of the Term B-3 Loans so prepaid on or prior to the first anniversary of the Amendment No. 4 Effective Date, stepping down to 2% after the first anniversary thereof but on or prior to the second anniversary thereof, and to par thereafter and (B) with respect to any amendment to the Amended Term Loan Facility resulting in a Repricing Transaction, of 3% of the principal amount of the Term B-3 Loans so repriced on or prior to the first anniversary of the Amendment No. 4 Effective Date, stepping down to 2% after the first anniversary thereof but on or prior to the second anniversary thereof and to 1% after the second anniversary thereof but on or prior to the third anniversary thereof and to par thereafter and (vi) make certain technical changes to certain defined terms.
Revolving Credit Facility
On April 4, 2014, OCIB as borrower, the Partnership as a guarantor, Bank of America, N.A. as administrative agent and a syndicate of lenders entered into a new revolving credit agreement (as subsequently amended through and in effect as of December 31, 2014, the “Revolving Credit Facility”), with an initial
65
Table of Contents
aggregate borrowing capacity of up to $40.0 million (less any amounts borrowed under the Intercompany Revolving Facility (as defined below)), including a $20.0 million sublimit for letters of credit. The Revolving Credit Facility has a one-year term that may be extended for additional one-year periods subject to the consent of the lenders. Outstanding principal amounts under the Revolving Credit Facility bear interest at OCIB’s option at either LIBOR plus a margin of 2.75% or a base rate plus a margin of 1.75%. OCIB pays a commitment fee of 1.10% per annum on the unused portion of the Revolving Credit Facility. The Revolving Credit Facility contains customary covenants and conditions based on the maintenance of certain senior secured net leverage ratios and interest coverage ratios (see note 6 and note 15 to the consolidated financial statements below for a complete description). As a result of such covenants, we will be limited in the manner in which we conduct our business and we may be unable to engage in favorable business activities or finance future operations or capital needs. In addition, to the extent that we are unable to refinance our debt at maturity on favorable terms, or at all, our ability to fund our operations and our ability to make cash distributions could be adversely affected. Upon the occurrence of certain events of default under the Revolving Credit Facility, OCIB’s obligations under the Revolving Credit Facility may be accelerated which could impair our ability to fund our operations and our ability to make cash distributions. As of December 31, 2014, OCIB had no amounts outstanding under the Revolving Credit Facility.
On March 12, 2015, OCIB and the Partnership entered into Revolving Credit Amendment No. 2 (“Revolving Credit Amendment No. 2”) to the Revolving Credit Facility (such facility as amended by Revolving Credit Amendment No. 2, the “Amended Revolving Credit Facility”), with Bank of America, as administrative agent, and the other lenders party thereto to (i) increase the maximum consolidated senior secured net leverage ratio from 1.75 to 2.25 for the quarter ending March 31, 2015, (ii) increase the maximum consolidated senior secured net leverage ratio from 1.75 to 2.50 for the quarters ending June 30, 2015 and September 30, 2015, (iii) increase the maximum consolidated senior secured net leverage ratio from 1.75 to 2.25 for the quarter ending December 31, 2015, (iv) extend the maturity of the Amended Revolving Credit Facility until March 12, 2016, (v) suspended the requirement to repay in full all outstanding revolving loans under the Amended Revolving Credit Facility on the last business day of each June and December for the calendar year 2015 and (vii) made certain technical changes to certain defined terms.
Intercompany Revolving Facility
On August 20, 2013, OCI Beaumont (“OCIB”) entered into an intercompany revolving credit facility agreement (the “Intercompany Revolving Facility”) with OCI Fertilizer, as the lender, which will mature on January 20, 2020. The amount that can be drawn under the Intercompany Revolving Facility is limited by the Revolving Credit Facility (as defined above) to $40.0 million minus the amount of indebtedness outstanding under the Revolving Credit Facility. Interest on borrowings under the Intercompany Revolving Facility accrue at the rate equal to the sum of (i) the rate per annum applicable to the Term Loan B Credit Facility plus (ii) 25 basis points. We pay a commitment fee to OCI Fertilizer on the unused portion of the Intercompany Revolving Facility equal to 0.5% per annum, which is included as a component of interest expense—related party on the consolidated statements of operations. Borrowings under the facility are subordinated to indebtedness under the Term Loan B Credit Facility and the Revolving Credit Facility. As of December 31, 2014, OCIB has not drawn under the Intercompany Revolving Facility.
Intercompany Term Facility
On September 15, 2013, OCIB entered into a new intercompany term facility agreement (as amended on November 27, 2013, the “Intercompany Term Facility”) with OCI Fertilizer, which replaced three separate intercompany loan agreements between OCIB and OCI Fertilizer and provides OCIB with an aggregate borrowing capacity of up to $100.0 million. As of December 31, 2014, OCIB had no borrowings outstanding under the Intercompany Term Facility. The Intercompany Term Facility was initially established to fund the upgrade of our facility that was completed in July 2012, satisfy working capital requirements and for general corporate purposes. The Intercompany Term Facility matures on January 20, 2020 and borrowings under the facility are subordinated to indebtedness under the Term Loan B Credit Facility and the Revolving Credit Facility. Borrowings under the Intercompany Term Facility bear interest at an interest rate equal to the sum of
66
Table of Contents
(i) the rate per annum applicable to the Term Loan B Credit Facility, plus (ii) 0.25%. As of December 31, 2014, OCIB has not drawn under the Intercompany Term Facility.
Intercompany Equity Commitment
On November 27, 2013, we and OCI USA entered into a letter agreement providing for OCI USA’s obligation to make equity contributions to us under certain circumstances (the “Intercompany Equity Commitment”). Pursuant to the Intercompany Equity Commitment, (i) if, prior to the completion of our debottlenecking project, we or OCIB have liquidity needs for working capital or other purposes and the restrictions under the Term Loan B Credit Facility or any other debt instruments of ours or OCIB prohibit us or OCIB from incurring sufficient additional debt to fund such liquidity needs, then upon notice from us, OCI USA (or an affiliate designated by OCI USA) will provide such liquidity to the extent of such needs in the form of an equity contribution to us and (ii) in the event OCIB fails to comply with any of the financial covenants contained in the Term Loan B Credit Facility as of the last day of any fiscal quarter, then upon notice from us, OCI USA (or an affiliate designated by OCI USA that is not a party to the Term Loan B Credit Facility) will make cash contributions to us as common equity in the amount of the cure amount and by the date required by the Term Loan B Credit Facility, so that we can further contribute such funds to OCIB to cure such non-compliance, subject to and in accordance with the terms and conditions of the Term Loan B Credit Facility. OCI USA will not be obligated to make aggregate equity contributions to us in excess of $100.0 million pursuant to the Intercompany Equity Commitment.
On November 10, 2014, OCIP Holding LLC (“OCIP Holding”), an indirect, wholly-owned subsidiary of OCI, made a $60.0 million capital contribution to use pursuant to the Intercompany Equity Commitment in exchange for 2,995,372 common units. As of December 31, 2014, OCIB has $40.0 million of remaining liquidity available through the Intercompany Equity Commitment, following the $60.0 million capital contribution on November 10, 2014.
Capital Expenditures
We divide our capital expenditures into two categories: maintenance capital expenditures and expansion capital expenditures. Maintenance capital expenditures are capital expenditures (including expenditures for the addition or improvement to, or the replacement of, our capital assets or for the acquisition of existing or the construction or development of new capital assets) made to maintain, including over the long term, our production capacity, operating income or asset base (including capital expenditures relating to turnarounds), or to comply with environmental, health, safety or other regulations. Maintenance capital expenditures that are required to comply with regulations may also improve the output, efficiency or reliability of our facility. Major maintenance capital expenditures that extend the life or improve the safety or efficiency of the asset are capitalized and amortized over the period of expected benefits. Routine maintenance costs are expensed as incurred. A turnaround is capitalized and amortized over a four year period, which is the time lapse between turnarounds. Expansion capital expenditures are capital expenditures incurred for acquisitions or capital improvements that we expect will increase our production capacity, operating income or asset base over the long term. Expansion capital expenditures are capitalized and amortized over the period of expected benefits.
For the year ended December 31, 2014 and 2013, we recorded approximately $17.1 million and $1.4 million, respectively, in maintenance capital expenditures related to the turnaround and our capital spares project. During the fourth quarter of 2013, we began a project to purchase critical spares that are essential to our operations. This project will improve the reliability of our facility. We expect to perform maintenance turnarounds approximately every four years, which will typically last approximately four weeks and cost approximately $24.0 million per turnaround. We will perform significant maintenance capital projects at our facility during a turnaround to minimize disruption to our operations. We will capitalize the costs related to these projects as property, plant and equipment and will classify the amounts as maintenance capital expenditures. We plan to undertake a turnaround as part of our debottlenecking project that we expect to complete by the end of March 2015. We expect that the next turnaround after the completion of the debottlenecking project will occur in 2019.
67
Table of Contents
Our expansion capital expenditures totaled approximately $180.0 million and $55.7 million for the years ended December 31, 2014 and 2013, respectively, for expenditures related to our debottlenecking project and other budgeted capital projects. Please read Item 1—“Overview—Our Debottlenecking Project” for total expenditures already incurred.
Our estimated capital expenditures are subject to change due to unanticipated increases in the cost, scope and completion time for our capital projects. For example, we may experience increases in labor or equipment costs necessary to comply with government regulations or to complete projects that sustain or improve the profitability of our facility. Our future capital expenditures will be approved by the board of directors of our general partner.
In May 2014, we announced implementation of our state-of-the-art methanol truck loading facility, a former expansion capital expenditure. We have sold approximately 19,370 metric tons of methanol as of December 31, 2014, and expect to sell up to approximately 80,000 metric tons of methanol on an annual basis via the new truck loading facility.
CASH FLOWS
Our profits, operating cash flows and cash available for distribution are subject to changes in the prices of our products and natural gas, which is our primary feedstock. Our products and feedstocks are commodities and, as such, their prices can be volatile in response to numerous factors outside of our control.
The following table summarizes our consolidated statements of cash flows:
| For the Year Ended December 31, |
||||||||
| 2014 | 2013 | |||||||
| (in thousands) | ||||||||
| Net cash provided by (used in): |
||||||||
| Operating activities |
$ | 151,237 | $ | 141,545 | ||||
| Investing activities |
(152,160 | ) | (52,634 | ) | ||||
| Financing activities |
(110,244 | ) | 52,358 | |||||
| Net increase (decrease) in cash and cash equivalents |
$ | (111,167 | ) | $ | 141,269 | |||
Operating Activities
Net cash provided by operating activities for the year ended December 31, 2014 was approximately $151.2 million. We had net income of approximately $119.4 million for the year ended December 31, 2014. During this period, we recorded depreciation expense of $23.1 million and amortization of debt issuance costs of $2.8 million. Accounts receivable, which is approximately equal to one month of revenue, decreased by $9.2 million during the year ended December 31, 2014. The decrease in accounts receivable is due to a decrease in the realized methanol sales prices and volumes in December 2014 compared to December 2013. Monthly sales decreased to $37.8 million in December 2014 as compared to $45.3 million in December 2013. Inventories increased $2.2 million due to the buildup of inventory in anticipation of planned downtime associated with the debottlenecking project. Other current assets and prepaid expenses decreased by $0.6 million due to the amortization of prepaid insurance policies. Accounts payable (excluding non-cash accruals of property, plant and equipment) increased by $2.2 million due to additional maintenance costs associated with the increase in unplanned downtime during 2014. Accounts payable—related party (excluding non-cash accruals of property, plant and equipment) decreased by $0.7 million due to settlements of obligations to our suppliers. Other payables, accruals and current liabilities (excluding non-cash accruals of property, plant and equipment) increased by $3.4 million due to a realization of expenses in connection with a long-term incentive bonus that was paid out to employees of our general partner in January 2015. Accrued interest (excluding capitalized interest) decreased by $6.7 million due to the capitalization of $6.4 million in interest expense in connection with the debottlenecking project.
68
Table of Contents
Net cash provided by operating activities for the year ended December 31, 2013 was approximately $141.5 million. We had net income of $154.4 million for the year ended December 31, 2013. During this period, we recorded depreciation expense of $22.2 million, amortization of debt issuance costs of $3.5 million, and a loss on the extinguishment of debt of $6.7 million, due to the extinguishment of the Bridge Term Loan Credit Facility and Term B-1 Loan (as defined in note 6 to the consolidated financial statements). Accrued interest increased by $1.0 million during the year ended December 31, 2013 as we entered into additional term loans in 2013 at higher interest rates than our previous loans. Our third party loans outstanding in 2012 accrued interest at a rate of 4.5%, while our loans in place at December 31, 2013 accrue interest at a rate of 6.25%. Accrued interest (related party) decreased by $20.6 million during the year ended December 31, 2013 as we paid $35.0 million in March 2013, of which $24.6 million was applied to accrued interest (related party), and left a $10.4 million prepaid interest (related party) balance to OCI Fertilizer. Monthly interest expense (related party) on the OCI Fertilizer intercompany loan was offset against the original $10.4 million of prepaid interest (related party). As of December 2, 2013, the balance of prepaid interest (related party) was $0.4 million and was applied against the OCI Fertilizer intercompany loan balance as a reduction of principal upon repayment of the Intercompany Term Facility on December 2, 2013. Other non-current assets, other current assets and prepaid expenses increased by $4.0 million during the year ended December 31, 2013 as we paid $4.0 million to obtain a new business interruption insurance policy in August 2013. Accounts receivable increased by $16.9 million during the year ended December 31, 2013 due to our increase in sales in the quarter ended December 31, 2013 to $113.1 million as compared to the quarter ended December 31, 2012 of $89.4 million. This increase in sales activity was due to us not reaching full production capacity until December 2012 after the completion of the upgrade of our ammonia and methanol production facilities. Other payables, accruals and current liabilities (excluding non-cash accruals of property, plant and equipment) decreased by $3.6 million due to the timing of the receipt of our property tax invoice. Property taxes were recorded in accruals at December 31, 2012, but have been recorded in accounts payable at December 31, 2013. Remaining reductions in other payables, accruals and current liabilities is due to the settlement of obligations to contractors that assisted with the refurbishment of our methanol unit. Accounts payable—related party decreased by $1.9 million due to costs incurred under the omnibus agreement for the provision of selling, general and administrative services by our general partner.
Investing Activities
Net cash used in investing activities was approximately $152.2 million and $52.6 million, respectively, for the year ended December 31, 2014 and 2013. The increase in net additions of property, plant, equipment and construction in progress of $99.6 million for the year ended December 31, 2014 compared to the year ended December 31, 2013 was due the commencement of the debottlenecking project.
Financing Activities
Net cash used by financing activities was approximately $110.2 million for the year ended December 31, 2014. During the year ended December 31, 2014, we repaid borrowings of $4.0 million on the Term B Loan Credit Facility, remitted $17.5 million of the transferred trade receivables to OCI USA, paid cash distributions to unitholders of $142.8 million and paid $6.0 million in deferred financing costs associated with Amendment No. 2 to the Term Loan B Credit Facility and the Revolving Credit Facility. Please read note 6—“Debt” to the consolidated financial statements included in this report for additional information. We also received a capital contribution of $60.0 million from OCIP Holding, pursuant to the Intercompany Equity Commitment. Please read note 7—“Related-Party Transactions—Other Transactions with Related Parties—Equity Commitment Agreement” to the consolidated financial statements included in this report for additional information.
Net cash provided by financing activities was approximately $52.4 million for the year ended December 31, 2013. During the year ended December 31, 2013, we received net proceeds from the completion of our IPO of approximately $295.3 million, received net proceeds from borrowings of approximately $505.4 million (after debt issuance costs of $13.4 million), repaid borrowings of $251.0 million, repaid related party borrowings of $168.3 million, made distributions of $316.7 million to OCI USA, distributed advances due from a related party
69
Table of Contents
of $8.1 million to OCI USA, and paid expenses of $4.3 million related to the IPO, which were offset against the IPO proceeds shown in Partners’ Capital.
CONTRACTUAL OBLIGATIONS
The following table lists our significant contractual obligations and their future payments at December 31, 2014:
| Contractual Obligations |
Total | Less than 1 Year |
1-3 Years |
3-5 Years |
More than 5 Years |
|||||||||||||||
| (in thousands) | ||||||||||||||||||||
| Term Loan B Credit Facility—Principal Payments |
395,015 | 3,980 | 7,960 | 383,075 | — | |||||||||||||||
| Interest Payments on third party debt(1) |
90,943 | 20,064 | 39,347 | 31,532 | — | |||||||||||||||
| Interest Payments on related party debt |
1,026 | 203 | 406 | 406 | 11 | |||||||||||||||
| Hydrogen supply contract(2) |
164,000 | 24,000 | 48,000 | 48,000 | 44,000 | |||||||||||||||
| Natural gas supply contract(2) |
10,908 | 10,908 | — | — | — | |||||||||||||||
| Nitrogen supply contract(2) |
51,517 | 6,869 | 13,738 | 13,738 | 17,172 | |||||||||||||||
| Purchase commitments |
41,489 | 41,489 | — | — | — | |||||||||||||||
| Orascom E&C USA Inc.(3) |
6,151 | 6,151 | — | — | — | |||||||||||||||
| Total |
761,049 | 113,664 | 109,451 | 476,751 | 61,183 | |||||||||||||||
| (1) | Interest rate on floating rate debt is based on the rate of 5.00% for the Term Loan B Credit Facility. |
| (2) | Quantities of feedstock to be purchased are subject to change based on our current and expected production, market dynamics and market reports. |
| (3) | Please read Item 13—“Certain Relationships and Related Transactions, and Director Independence—Construction Agreement with Orascom E&C USA Inc.” and note 7 to the consolidated financial statements included in this report for additional information. |
OFF-BALANCE SHEET ARRANGEMENTS
We have no material off-balance sheet arrangements.
RECENTLY ISSUED ACCOUNTING STANDARDS
Refer to note 3 to the consolidated financial statements, “Recent Accounting Pronouncements,” included in Item 8 of this report.
Critical Accounting Policies
The preparation of financial statements in conformity with GAAP requires management to make estimates and assumptions that affect the reported amounts of assets and liabilities, the disclosure of contingent assets and liabilities at the dates of the financial statements and the reported amounts of revenues and expenses during the reporting periods. Accuracy of estimates is based on the accuracy of information used. Described below are the most significant policies we apply in preparing our financial statements, some of which are subject to alternative treatments under GAAP. We also describe the most significant estimates and assumptions we make in applying these policies. Our accounting policies are described in the notes to our financial statements included in Item 8 of this report.
Trade Accounts Receivable. Trade accounts receivable are recorded at the invoiced amount and do not bear interest. We maintain a customer specific allowance for doubtful accounts for estimated losses inherent in our accounts receivable portfolio. In establishing the required allowance, management considers customers’ financial condition, the amount of receivables in dispute, the current receivables aging and current payment patterns. We review our allowance for doubtful accounts monthly. Past due balances over 90 days and over a specified amount are reviewed individually for collectability. Account balances are charged off against the allowance after all means of collection have been exhausted and the potential for recovery is considered remote. There was no
70
Table of Contents
allowance for doubtful accounts and no bad debt write-offs during the years ended December 31, 2014 and 2013. We do not have any off-balance-sheet credit exposure related to our customers.
Property, Plant and Equipment. Property, plant and equipment are stated at cost. Depreciation on plant and equipment is calculated on the straight-line method over the estimated useful lives of the assets. The estimated useful lives of our assets are as follows:
| Asset |
Useful Lives, in Years |
|||
| Buildings |
30 | |||
| Machinery and equipment |
15 | |||
| Automotive equipment |
5 | |||
| Furniture and fixtures |
5 | |||
Our policy is to report cost of goods sold separately of depreciation. We estimate initial useful lives based on experience and current technology. These estimates may be extended through sustaining capital programs. Factors affecting the fair value of our assets may also affect the estimated useful lives of our assets and these factors can change. Therefore, we periodically review the estimated remaining lives of our facilities and other significant assets and adjust our depreciation rates prospectively where appropriate. No events or changes in circumstances occurred during the years ended December 31, 2014 and 2013 that indicated the estimated remaining lives of our facilities and other significant assets required adjustment.
We are currently executing a debottlenecking project to expand our existing methanol and ammonia production capacity and have incurred, and expect to incur additional, significant costs and expenses for the construction and development of the project. Beginning in January 2015, we shut down our facility in order to complete our debottlenecking project (including completion of the associated turnaround and environmental upgrades). We expect to complete the project by the end of March 2015. As part of the debottlenecking project, management will be reassessing the useful lives of our machinery and equipment. We do not expect this will have a significant impact on our financial statements.
Maintenance Activities. We incur maintenance costs on our facilities and equipment. Routine repair and maintenance costs are expensed as incurred. For the years ended December 31, 2014 and 2013, we expensed approximately $27.3 million and $19.4 million, respectively, of routine repair and maintenance costs. Major maintenance capital expenditures that extend the life, increase the capacity or improve the safety or efficiency of the asset are capitalized and amortized over the period of expected benefits. Plant turnarounds are performed to help ensure the long-term reliability and safety of integrated plant machinery at our continuous process production facility.
Preceding a turnaround, facilities experience decreased efficiency in resource conversion to finished products. Replacement or overhaul of equipment and items such as compressors, turbines, pumps, motors, valves, piping and other parts that have an estimated useful life of at least four years, the internal assessment of production equipment, replacement of aged catalysts, and new installation/recalibration of measurement and control devices result in increased production output and/or improved plant efficiency after the turnaround. Turnaround activities are betterments either extend equipment useful life, or increase the output and/or efficiency. As a result, we follow the deferral method of accounting for major maintenance costs; and thus, expenditures associated with the turnaround are capitalized as property, plant and equipment and amortized over a four year period, which is the time lapse between turnarounds. For the year ended December 31, 2014 and 2013, we capitalized approximately $17.1 million and $1.4 million, respectively, in maintenance capital expenditures related to the turnaround and our capital spares project.
We classify deferred maintenance cost as an investing activity under the caption “Purchase of property, plant, and equipment” in the Consolidated Statement of Cash Flows, since this cash outflow relates to expenditures related to long-lived productive assets. Repair, maintenance and related labor costs are expensed as incurred and are included in operating cash flows.
71
Table of Contents
Commitments and Contingencies. Liabilities for loss contingencies, including environmental remediation costs not within the scope of Financial Accounting Standards Board (“FASB”) Accounting Standards Codification (ASC) Topic 410, Asset Retirement and Environmental Obligations, arising from claims, assessments, litigation, fines and penalties and other sources, are recorded when it is probable that a liability has been incurred and the amount of the assessment and/or remediation can be reasonably estimated. Legal costs incurred in connection with loss contingencies are expensed as incurred. Accruals for estimated losses from environmental remediation obligations generally are recognized no later than completion of the remedial feasibility study. Such accruals are adjusted as further information develops or circumstances change. Costs of expected future expenditures for environment remediation obligations are not discounted to their present value. We regularly assess the likelihood of material adverse judgments or outcomes as well as potential ranges or probability of losses. We determine the amount of accruals required, if any, for contingencies after carefully analyzing each individual matter. Actual costs incurred in future periods may vary from the estimates, given the inherent uncertainties in evaluating environmental exposures. As of December 31, 2014 and 2013, we had no environmental remediation obligations.
Impairment of Long-Lived Assets. Long-lived assets, such as property, plant and equipment, are reviewed for impairment whenever events or changes in circumstances indicate that the carrying amount of an asset may not be recoverable. The carrying amount of a long-lived asset group is not recoverable if it exceeds the sum of the undiscounted cash flows expected to result from the use and eventual disposition of the asset group. If circumstances require a long-lived asset or asset group be tested for possible impairment, we first compare undiscounted cash flows expected to be generated by that asset or asset group to its carrying value. If the carrying value of the long-lived asset or asset group is not recoverable on an undiscounted cash flow basis, an impairment is recognized to the extent that the carrying value exceeds its fair value. Fair value is determined through various valuation techniques including discounted cash flow models, quoted market values and third-party independent appraisals, as considered necessary. Assessing the potential impairment of long-lived assets involves estimates that require significant management judgment, and include inherent uncertainties that are often interdependent and do not change in isolation. Factors that management must estimate include, among others, industry and market conditions, the economic life of the asset, sales volume and prices, inflation, raw materials costs, cost of capital, and capital spending. No events or changes in circumstances occurred during the years ended December 31, 2014 and 2013 that indicated the carrying amount of an asset may not be recoverable.
| ITEM 7A. | QUANTITATIVE AND QUALITATIVE DISCLOSURES ABOUT MARKET RISK |
Interest Rate Risk. We are exposed to interest rate risk related to our borrowings. As of December 31, 2014, interest on borrowings under the Term Loan B Credit Facility accrued, at OCIB’s option, at adjusted LIBOR plus 4.00% per annum or the alternate base rate plus 3.00%. Interest on borrowings under the Intercompany Revolving Facility and the Intercompany Term Facility, will accrue at the rate equal to the sum of (a) the rate per annum applicable to the loans under the Term Loan B Credit Facility (including as such per annum rate may fluctuate from time to time in accordance with the terms of the agreement governing the Term Loan B Credit Facility), plus (b) 25 basis points. Based upon the outstanding balances of our variable-interest rate debt at December 31, 2014, and assuming interest rates are above the applicable minimum, a hypothetical increase or decrease of 100 basis points would result in an increase or decrease to our annual interest expense of approximately $3.9 million.
Commodity Price Risk. We are exposed to significant market risk due to potential changes in prices for methanol, ammonia and natural gas. Natural gas is the primary raw material used in the production of the methanol and ammonia manufactured at our facility. Operating at full capacity, our methanol and ammonia production units together require approximately 80,000 to 90,000 MMBtu per day of natural gas, as of December 31, 2014. We have supply agreements with Kinder Morgan, DCP Midstream, Florida Gas Transmission Natural Gas Pipeline and Houston Pipeline to supply natural gas required for our production of methanol and ammonia. As of December 31, 2014, a hypothetical increase or decrease of $1.00 per MMBtu of
72
Table of Contents
natural gas would result in an increase or decrease to our annual cost of goods sold (exclusive of depreciation) of approximately $29.2 million to $32.9 million.
In the normal course of business, we produce methanol and ammonia throughout the year to supply the needs of our customers. Our inventory is subject to market risk due to fluctuations in the price of methanol and ammonia, changes in demand, natural gas feedstock costs and other factors. Methanol prices have historically been, and are expected to continue to be, characterized by significant cyclicality. As of December 31, 2014, a hypothetical increase or decrease of $50 per ton in the price of methanol would result in an increase or decrease to our annual revenue of approximately $36.5 million, based on an annual methanol volume of 730,000 metric tons. As of December 31, 2014, a hypothetical increase or decrease of $50 per ton in the price of ammonia would result in an increase or decrease to our annual revenue of approximately $13.3 million, based on an annual ammonia volume of 265,000 metric tons.
| ITEM 8. | FINANCIAL STATEMENTS AND SUPPLEMENTARY DATA |
OCI PARTNERS LP
INDEX TO CONSOLIDATED FINANCIAL STATEMENTS
| Page | ||||
| Consolidated Financial Statements: |
||||
| 74 | ||||
| 75 | ||||
| 76 | ||||
| Consolidated Statements of Member’s Capital and Partners’ Capital |
77 | |||
| 78 | ||||
| 79 | ||||
73
Table of Contents
Report of Independent Registered Public Accounting Firm
The Board of Directors and Unitholders
OCI Partners LP:
We have audited the accompanying consolidated balance sheets of OCI Partners LP and subsidiary (the “Partnership”) as of December 31, 2014 and 2013 and the related consolidated statements of operations, member’s capital and partners’ capital, and cash flows for each of the years in the three-year period ended December 31, 2014. These consolidated financial statements are the responsibility of the Partnership’s management. Our responsibility is to express an opinion on these consolidated financial statements based on our audits.
We conducted our audits in accordance with the standards of the Public Company Accounting Oversight Board (United States). Those standards require that we plan and perform the audit to obtain reasonable assurance about whether the financial statements are free of material misstatement. An audit includes examining, on a test basis, evidence supporting the amounts and disclosures in the financial statements. An audit also includes assessing the accounting principles used and significant estimates made by management, as well as evaluating the overall financial statement presentation. We believe that our audits provide a reasonable basis for our opinion.
In our opinion, the consolidated financial statements referred to above present fairly, in all material respects, the financial position of OCI Partners LP and subsidiary as of December 31, 2014 and 2013, and the results of their operations and their cash flows for each of the years in the three-year period ended December 31, 2014, in conformity with accounting principles generally accepted in the United States of America.
/s/ KPMG LLP
Houston, Texas
March 16, 2015
74
Table of Contents
OCI PARTNERS LP
December 31, 2014 and 2013
(Dollars in thousands, except per unit data)
| 2014 | 2013 | |||||||
| Assets | ||||||||
| Current assets: |
||||||||
| Cash and cash equivalents |
$ | 71,810 | $ | 182,977 | ||||
| Restricted cash |
— | 282 | ||||||
| Accounts receivable |
35,807 | 45,014 | ||||||
| Inventories |
6,152 | 3,986 | ||||||
| Advances due from related parties |
97 | 350 | ||||||
| Other current assets and prepaid expenses |
3,664 | 3,629 | ||||||
|
|
|
|
|
|||||
| Total current assets |
117,530 | 236,238 | ||||||
| Property, plant, and equipment, net of accumulated depreciation of $56,689 and $33,584, respectively |
545,258 | 361,007 | ||||||
| Other non-current assets |
11,552 | 7,135 | ||||||
|
|
|
|
|
|||||
| Total assets |
$ | 674,340 | $ | 604,380 | ||||
|
|
|
|
|
|||||
| Liabilities and Member’s/Partners’ Capital | ||||||||
| Current liabilities: |
||||||||
| Accounts payable |
$ | 37,144 | $ | 19,430 | ||||
| Accounts payable—related party |
37,278 | 30,097 | ||||||
| Other payables and accruals |
11,285 | 2,603 | ||||||
| Current maturities of the term loan facility |
3,980 | 4,000 | ||||||
| Accrued interest |
2,310 | 2,647 | ||||||
| Accrued interest—related party |
220 | — | ||||||
| Other current liabilities |
5,282 | 2,581 | ||||||
|
|
|
|
|
|||||
| Total current liabilities |
97,499 | 61,358 | ||||||
| Accrued interest—related party |
— | 17 | ||||||
| Term loan facility |
387,600 | 390,876 | ||||||
| Other non-current liabilities |
1,177 | 758 | ||||||
|
|
|
|
|
|||||
| Total liabilities |
486,276 | 453,009 | ||||||
|
|
|
|
|
|||||
| Partners’ capital: |
||||||||
| Common unitholders—83,495,372 and 80,500,000 units issued and outstanding at December 31, 2014 and 2013, respectively |
188,064 | 151,371 | ||||||
| General partner’s interest |
— | — | ||||||
|
|
|
|
|
|||||
| Total partners’ capital |
188,064 | 151,371 | ||||||
|
|
|
|
|
|||||
| Total liabilities and partners’ capital |
$ | 674,340 | $ | 604,380 | ||||
|
|
|
|
|
|||||
See accompanying notes to consolidated financial statements.
75
Table of Contents
OCI PARTNERS LP
Consolidated Statements of Operations
Years Ended December 31, 2014, 2013 and 2012
(Dollars in thousands, except per unit data)
| 2014 | 2013 | 2012 | ||||||||||
| Revenues |
$ | 402,780 | $ | 427,964 | $ | 224,629 | ||||||
| Cost of goods sold (exclusive of depreciation) |
218,795 | 190,954 | 133,430 | |||||||||
| Depreciation expense |
23,105 | 22,229 | 11,355 | |||||||||
| Selling, general, and administrative expenses |
22,356 | 26,774 | 14,980 | |||||||||
|
|
|
|
|
|
|
|||||||
| Income (loss) from operations before interest expense, other income (expense) and income tax expense |
138,524 | 188,007 | 64,864 | |||||||||
| Interest expense |
18,250 | 16,684 | 5,718 | |||||||||
| Interest expense—related party |
203 | 14,038 | 6,469 | |||||||||
| Loss on extinguishment of debt |
— | 6,689 | — | |||||||||
| Other income (expense) |
941 | 5,154 | 202 | |||||||||
|
|
|
|
|
|
|
|||||||
| Income from operations before tax expense |
121,012 | 155,750 | 52,879 | |||||||||
| Income tax expense |
1,564 | 1,399 | 1,048 | |||||||||
|
|
|
|
|
|
|
|||||||
| Net income |
$ | 119,448 | $ | 154,351 | $ | 51,831 | ||||||
|
|
|
|
|
|
|
|||||||
| Allocation of 2013 net income for earnings per unit calculation: |
||||||||||||
| Net income |
$ | — | $ | 154,351 | ||||||||
| Net income prior to initial public offering on October 9, 2013 |
— | 106,971 | ||||||||||
|
|
|
|||||||||||
| Net income subsequent to initial public offering on October 9, 2013 |
$ | — | $ | 47,380 | ||||||||
|
|
|
|||||||||||
| Earnings per limited partner unit:(1) |
||||||||||||
| Common unit (basic and diluted) |
$ | 1.48 | $ | 0.59 | ||||||||
|
|
|
|||||||||||
| Weighted average number of limited partner units outstanding: |
||||||||||||
| Common units (basic and diluted) |
80,918,531 | 79,656,250 | ||||||||||
|
|
|
|||||||||||
| (1) | Amounts attributable to 2013 are reflective of limited partner interest in net income subsequent to the closing of the Partnership’s initial public offering on October 9, 2013. |
See accompanying notes to consolidated financial statements.
76
Table of Contents
OCI PARTNERS LP
Consolidated Statements of Member’s Capital and Partners’ Capital
Years Ended December 31, 2014, 2013 and 2012
(Dollars in thousands, except per unit data)
| Member’s capital (deficit) |
Retained Earnings |
Total Member’s Capital |
Common Units | Total Partners’ Capital |
||||||||||||||||||||
| Units | Amount | |||||||||||||||||||||||
| Balance, January 1, 2011 |
$ | — | $ | — | $ | — | — | $ | — | $ | — | |||||||||||||
| Capital contributions |
4,000 | — | 4,000 | — | — | — | ||||||||||||||||||
| Net income |
— | 287 | 287 | — | — | — | ||||||||||||||||||
|
|
|
|
|
|
|
|
|
|
|
|
|
|||||||||||||
| Balance, December 31, 2011 |
$ | 4,000 | $ | 287 | $ | 4,287 | — | $ | — | $ | — | |||||||||||||
| Capital contributions |
— | — | — | — | — | — | ||||||||||||||||||
| Net income |
— | 51,831 | 51,831 | — | — | — | ||||||||||||||||||
|
|
|
|
|
|
|
|
|
|
|
|
|
|||||||||||||
| Balance, December 31, 2012 |
$ | 4,000 | $ | 52,118 | $ | 56,118 | — | $ | — | $ | — | |||||||||||||
| Distributions |
(352,316 | ) | — | (352,316 | ) | — | — | — | ||||||||||||||||
| Net income attributable to period from January 1, 2013 through October 8, 2013 |
— | 106,971 | 106,971 | — | — | — | ||||||||||||||||||
|
|
|
|
|
|
|
|
|
|
|
|
|
|||||||||||||
| $ | (348,316 | ) | $ | 159,089 | $ | (189,227 | ) | — | $ | — | $ | — | ||||||||||||
| Contribution of net assets to OCI Partners LP in exchange for common units on October 9, 2013, including expiration of underwriters’ over-allotment option on November 4, 2013 |
348,316 | (159,089 | ) | 189,227 | 63,000,000 | (189,227 | ) | (189,227 | ) | |||||||||||||||
| Issuance of common units to public on October 9, 2013, net of underwriter discounts and offering costs |
— | — | — | 17,500,000 | 291,046 | 291,046 | ||||||||||||||||||
| Capital contribution |
— | — | — | — | 2,172 | 2,172 | ||||||||||||||||||
| Net income attributable to period from October 9, 2013 through December 31, 2013 |
— | — | — | — | 47,380 | 47,380 | ||||||||||||||||||
|
|
|
|
|
|
|
|
|
|
|
|
|
|||||||||||||
| Balance, December 31, 2013 |
$ | — | $ | — | $ | — | 80,500,000 | $ | 151,371 | $ | 151,371 | |||||||||||||
| Distributions |
— | — | — | — | (142,755 | ) | (142,755 | ) | ||||||||||||||||
| Capital Contribution |
— | — | — | 2,995,372 | 60,000 | 60,000 | ||||||||||||||||||
| Net Income |
— | — | — | — | 119,448 | 119,448 | ||||||||||||||||||
|
|
|
|
|
|
|
|
|
|
|
|
|
|||||||||||||
| Balance, December 31, 2014 |
$ | — | $ | — | $ | — | 83,495,372 | 188,064 | 188,064 | |||||||||||||||
|
|
|
|
|
|
|
|
|
|
|
|
|
|||||||||||||
See accompanying notes to consolidated financial statements.
77
Table of Contents
OCI PARTNERS LP
Consolidated Statements of Cash Flows
Years Ended December 31, 2014, 2013 and 2012
(Dollars in thousands, except per unit data)
| 2014 | 2013 | 2012 | ||||||||||
| Cash flows from operating activities: |
||||||||||||
| Net income |
$ | 119,448 | $ | 154,351 | $ | 51,831 | ||||||
| Adjustments to reconcile net income to net cash provided by operating activities: |
||||||||||||
| Depreciation expense |
23,105 | 22,229 | 11,355 | |||||||||
| Amortization of debt issuance costs |
2,815 | 3,499 | 2,000 | |||||||||
| Loss on extinguishment of debt |
— | 6,689 | — | |||||||||
| Deferred income tax expense |
419 | 758 | — | |||||||||
| Decrease (increase) in: |
||||||||||||
| Restricted cash |
282 | — | (282 | ) | ||||||||
| Accounts receivable |
9,207 | (16,915 | ) | (28,099 | ) | |||||||
| Inventories |
(2,166 | ) | 444 | 463 | ||||||||
| Advances due from related parties |
253 | (350 | ) | — | ||||||||
| Other non-current assets, other current assets and prepaid expenses |
(596 | ) | (3,958 | ) | 373 | |||||||
| Increase (decrease) in: |
||||||||||||
| Accounts payable |
2,246 | (66 | ) | 18,691 | ||||||||
| Accounts payable—related party |
(671 | ) | (1,939 | ) | 3,793 | |||||||
| Other payables, accruals, and current liabilities |
3,438 | (3,599 | ) | 7,703 | ||||||||
| Accrued interest |
(6,746 | ) | 973 | 360 | ||||||||
| Accrued interest—related party |
203 | (20,571 | ) | 6,469 | ||||||||
|
|
|
|
|
|
|
|||||||
| Net cash provided by operating activities |
151,237 | 141,545 | 74,657 | |||||||||
|
|
|
|
|
|
|
|||||||
| Cash flows from investing activities: |
||||||||||||
| Purchase of property, plant, and equipment |
(152,160 | ) | (52,634 | ) | (193,965 | ) | ||||||
|
|
|
|
|
|
|
|||||||
| Net cash used in investing activities |
(152,160 | ) | (52,634 | ) | (193,965 | ) | ||||||
|
|
|
|
|
|
|
|||||||
| Cash flows from financing activities: |
||||||||||||
| Proceeds from borrowings |
— | 518,775 | 125,000 | |||||||||
| Proceeds from borrowings—related party |
— | — | 132,482 | |||||||||
| Repayment of debt |
(3,985 | ) | (251,000 | ) | — | |||||||
| Repayment of debt—related party |
— | (168,310 | ) | (94,500 | ) | |||||||
| Cash contributions by member |
60,000 | — | — | |||||||||
| Debt issuance costs |
(5,982 | ) | (13,397 | ) | (3,000 | ) | ||||||
| Cash distributions to member |
— | (316,700 | ) | — | ||||||||
| Remittance of cash to OCI USA for transferred trade receivables |
(17,522 | ) | (8,056 | ) | — | |||||||
| Net proceeds from issuance of common units |
— | 295,312 | — | |||||||||
| Initial public offering costs |
— | (4,266 | ) | — | ||||||||
| Distribution to Unitholders |
(142,755 | ) | — | — | ||||||||
|
|
|
|
|
|
|
|||||||
| Net cash provided by financing activities |
(110,244 | ) | 52,358 | 159,982 | ||||||||
|
|
|
|
|
|
|
|||||||
| Net increase (decrease) in cash and cash equivalents |
(111,167 | ) | 141,269 | 40,674 | ||||||||
| Cash and cash equivalents, beginning of period |
182,977 | 41,708 | 1,034 | |||||||||
|
|
|
|
|
|
|
|||||||
| Cash and cash equivalents, end of period |
$ | 71,810 | $ | 182,977 | $ | 41,708 | ||||||
|
|
|
|
|
|
|
|||||||
| Supplemental cash disclosures: |
||||||||||||
| Cash paid for income taxes |
$ | 1,350 | $ | 298 | $ | — | ||||||
| Cash paid for interest, net of amount capitalized |
15,772 | 11,531 | 2,699 | |||||||||
| Cash paid for interest, net of amount capitalized—related party |
— | 34,223 | — | |||||||||
| Supplemental non-cash disclosures: |
||||||||||||
| Accruals of property, plant and equipment purchases |
$ | 25,298 | $ | 1,885 | $ | 2,115 | ||||||
| Accruals of property, plant and equipment purchases—related party |
25,834 | 460 | — | |||||||||
| Capitalized interest |
6,410 | 655 | 659 | |||||||||
| Capitalized interest—related party |
— | 387 | 10,270 | |||||||||
| Distribution of accounts receivable to member |
17,522 | 27,560 | — | |||||||||
| Contributions by member |
— | 2,172 | — | |||||||||
See accompanying notes to consolidated financial statements.
78
Table of Contents
OCI Partners LP
Notes to Consolidated Financial Statements
(Dollars in thousands, except per unit data)
Note 1—Description of Business
Description of Business
OCI Partners LP (the “Partnership,” “OCIP,” “we,” “us,” or “our”) is a Delaware limited liability partnership formed on February 7, 2013 to own and operate a recently upgraded methanol and anhydrous ammonia production facility that is strategically located on the U.S. Gulf Coast near Beaumont, Texas. The facility commenced full operations during August 2012. In addition, OCIP has pipeline connections to adjacent customers and port access with dedicated methanol and ammonia import/export jetties, allowing it to ship both products along the Gulf Coast.
We are currently one of the largest merchant methanol producers in the United States with a maximum annual methanol production capacity of approximately 730,000 metric tons and a maximum annual ammonia production capacity of approximately 265,000 metric tons. During the first quarter of 2014, we began construction on a debottlenecking project that includes a maintenance turnaround and environmental upgrades, which we collectively refer to as our “debottlenecking project.” This project is expected to increase our maximum annual methanol production capacity by 25% to approximately 912,500 metric tons and our maximum annual ammonia production capacity by 15% to approximately 305,000 metric tons. Beginning in January of 2015, we shut down our facility, in order to complete our debottlenecking project. We expect to complete the project by the end of March 2015.
As discussed further below, the Partnership completed its initial public offering (“IPO”), and OCI USA, Inc. (“OCI USA”) contributed all of its equity interests in OCI Beaumont LLC (“OCIB”) to the Partnership on October 9, 2013. Prior to the completion of the IPO, OCIB was a direct, wholly-owned subsidiary of OCI USA, a Delaware corporation, which is an indirect, wholly-owned subsidiary of OCI Fertilizer International B.V. (“OCI Fertilizer”), a Dutch private limited liability company. OCI Fertilizer is an indirect, wholly-owned subsidiary of OCI N.V. (“OCI”), a Dutch public limited liability company, which is the ultimate parent for a group of related entities. OCIB is a Texas limited liability company formed on December 10, 2010 as the acquisition vehicle to purchase the manufacturing facility and related assets offered for sale by Eastman Chemical Company on May 5, 2011 for $26,500. OCI, through its subsidiaries, is a global, nitrogen-based fertilizer producer and engineering and construction contractor. OCI is listed on the NYSE Euronext Amsterdam and trades under the symbol “OCI.”
Initial Public Offering
On October 3, 2013, the Partnership priced 17,500,000 common units in its IPO to the public at a price of $18.00 per unit, and the aggregate gross proceeds totaled $315,000. The net proceeds from the IPO of approximately $295,313, after deducting the underwriting discount of $18,900 and the structuring fee of approximately $787, were used to: (i) repay the Term B-1 Loan (as defined below) in the amount of approximately $125,000 and accrued interest on the Term B-1 Loan of approximately $1,085 and (ii) provide us additional cash of approximately $169,228, with the funds to be utilized to fund post-IPO working capital balances, and to pay a portion of the costs of our debottlenecking project and other capital projects incurred after the completion of the IPO. During the year ended December 31, 2013, we incurred and charged to Partners’ Capital $4,266 of costs directly attributable to the IPO.
On October 4, 2013, the Partnership’s common units began trading on the New York Stock Exchange (“NYSE”) under the symbol “OCIP.” On October 9, 2013, the Partnership closed its IPO of 17,500,000 common units. In connection with the closing of the IPO, OCI USA contributed its interests in OCIB to the Partnership, and the Partnership issued an aggregate of 60,375,000 common units to OCI USA on October 9, 2013. On
79
Table of Contents
November 4, 2013, in connection with the expiration of the underwriters’ over-allotment option period, the Partnership issued an additional 2,625,000 common units to OCI USA pursuant to the terms of the underwriting agreement and contribution agreement entered into in connection with the IPO.
Unless the context otherwise requires, references in this report to the “Predecessor,” “Company,” “we,” “our,” “us,” or like terms, when used in a historical context (periods prior to October 9, 2013, the closing date of the IPO), refer to OCIB, our Predecessor for accounting purposes. References in this report to “OCI Partners LP,” “Partnership,” “we,” “our,” “us,” or like terms, when used in the present tense or prospectively (after October 9, 2013, the closing date of the IPO), refer to OCI Partners LP and its subsidiaries.
Prior to the completion of the IPO, certain assets of OCIB were distributed to OCI USA. In October 2013, OCIB distributed $56,700 of cash and $35,616 of accounts receivable to OCI USA, which was comprised of $8,056 of advances due from related party and $27,560 of trade receivables. All collections of transferred advances due from related parties have been received directly by OCI USA and all collections of transferred trade receivables have been received by the Partnership and will be remitted to OCI USA. As of December 31, 2014, we have remitted $17,522 of the collections of the transferred trade receivables to OCI USA, and the remaining balance of $10,038 is recorded in accounts payable—related party on the consolidated balance sheet as of December 31, 2014.
Presentation
The consolidated financial statements include the accounts of the Partnership and its subsidiary. A subsidiary is an entity over which the Partnership has control. Subsidiaries are fully consolidated from the date on which control is transferred to the Partnership and are deconsolidated from the date that control ceases.
Note 2—Summary of Significant Accounting Policies
(a) Use of Estimates
The preparation of financial statements in conformity with accounting principles generally accepted in the United States of America (“GAAP”) requires management to make estimates and assumptions that affect the reported amounts of assets and liabilities and disclosure of contingent assets and liabilities at the date of the financial statements and the reported amounts of revenues and expenses during the reporting period. Accuracy of estimates is based on accuracy of information used. Significant items subject to such estimates and assumptions include the useful lives of property, plant, and equipment, the valuation of property, plant, and equipment, and other contingencies.
(b) Cash and Cash Equivalents
Cash and cash equivalents consist of balances held in the Partnership’s bank accounts less outstanding payments.
(c) Restricted Cash
Restricted cash represents amounts that were set aside by the Partnership in accordance with OCIB’s Letter of Credit with a certain financial institution (see note 7). These cash amounts were designated for the purpose of paying OCI USA’s office lease obligations in the event that OCI USA fails to comply with the terms or conditions of its office lease agreement. Due to the short-term nature of this obligation, the corresponding restricted cash balances were classified as current in the consolidated balance sheets.
80
Table of Contents
(d) Trade Accounts Receivable
Trade accounts receivable are recorded at the invoiced amount and do not bear interest. Amounts collected on trade accounts receivable are included in net cash provided by operating activities in the consolidated statements of cash flows. The Partnership maintains a customer-specific allowance for doubtful accounts for estimated losses inherent in its accounts receivable portfolio. In establishing the required allowance, management considers customers’ financial condition, the amount of receivables in dispute, the current receivables aging, and current payment patterns. The Partnership reviews its allowance for doubtful accounts monthly. Past–due balances over 90 days and over a specified amount are reviewed individually for collectability. Account balances are charged off against the allowance after all means of collection have been exhausted and the potential for recovery is considered remote. There was no allowance for doubtful accounts and no bad debt write-offs during the years ended December 31, 2014 and 2013. The Partnership does not have any off-balance-sheet credit exposure related to its customers. During the years ended December 31, 2014, 2013 and 2012, the following customers accounted for 10% or more of the Partnership’s revenues:
| Percentage of Revenues | ||||||||||||
| Customer name |
2014 | 2013 | 2012 | |||||||||
| Methanex |
33 | % | 34 | % | 11 | % | ||||||
| Koch(1) |
29 | % | 26 | % | 19 | % | ||||||
| Rentech |
15 | % | 12 | % | * | |||||||
| Arkema |
* | * | 10 | % | ||||||||
| Trammo |
* | 15 | % | 51 | % | |||||||
| (1) | Figure presented includes sales to Koch Nitrogen International Sarl, Koch Nitrogen LLC and Koch Methanol LLC. |
| * | Customer accounted for less than 10% of the Partnership’s revenues for the period presented. |
The loss of any one or more of the Partnership’s significant customers noted above may have a material adverse effect on the Partnership’s future results of operations.
(e) Inventories
Inventories are stated at the lower of cost or market, using standard cost method for finished goods, work in process, raw materials, and supplies inventory. The cost of all inventories is determined based on the first-in, first-out (FIFO) method. The standard cost of finished goods is the product of the standard cost of our raw materials and quantities of raw materials consumed, based on normal capacity. We review our standard costs monthly and update them as appropriate to approximate actual costs. We also allocate a portion of fixed production overhead to inventory based on the normal capacity of our production facilities. Normal capacity is defined as “the production expected to be achieved over a number of periods under normal circumstances, taking into account the loss of capacity resulting from planned maintenance.” The Partnership records variances, abnormal amounts of idle facility expense, freight, handling costs, and wasted material (spoilage) as current period charges. The Partnership’s raw materials are consumed immediately upon delivery.
(f) Revenue Recognition
The Partnership recognizes revenue when products are shipped and the customer takes ownership and assumes risk of loss, collection of the relevant receivable is probable, persuasive evidence of an arrangement exists, and the sales price is fixed or determinable. Revenue for barge sales is recognized when risk and title to the product transfer to the customer, which occurs at the time shipment is made (free on board shipping point). Revenue for pipeline sales is recognized when risk and title to the product transfer to the customer, which occurs at the time when meter ticket delivery is received (free on board shipping destination). Revenue for truck sales is recognized when risk and title to the product transfer to the customer, which occurs when the Partnership’s product is received by the common carrier (free on board shipping point).
81
Table of Contents
Below is a summary of revenues by product for the years ended December 31, 2014, 2013 and 2012:
| 2014 | 2013 | 2012 | ||||||||||
| Ammonia |
$ | 126,808 | $ | 136,150 | $ | 128,954 | ||||||
| Methanol |
275,553 | 291,306 | 95,675 | |||||||||
| Other |
419 | 508 | — | |||||||||
|
|
|
|
|
|
|
|||||||
| Total |
$ | 402,780 | $ | 427,964 | $ | 224,629 | ||||||
|
|
|
|
|
|
|
|||||||
(g) Property, Plant, and Equipment
Property, plant, and equipment are stated at cost. Depreciation is computed using principally the straight-line method over the estimated useful life of the various classes of depreciable assets. The lives used in computing depreciation for such assets are as follows:
| Asset |
Range of Useful Lives, in Years | |
| Buildings |
30 | |
| Machinery and equipment |
5 to 15 | |
| Automotive equipment |
5 | |
| Furniture and fixtures |
3 to 7 |
In the accompanying consolidated statements of operations, the Partnership’s policy is to exclude depreciation expense from cost of sales.
(h) Maintenance and Turnaround Activities
The Partnership incurs maintenance costs on its facilities and equipment. Routine repair and maintenance costs are expensed as incurred. For the years ended December 31, 2014, 2013 and 2012, we expensed approximately $27,287, $19,425 and $7,812, respectively, of routine repair and maintenance costs.
(i) Income Taxes
The Partnership is a Delaware limited partnership and is not a taxable entity; however, the Partnership is subject to Texas Margin Taxes. Each partner of a partnership is required to take into account his share of items of income, gain, loss and deduction of the Partnership in computing his federal income tax liability. As of December 31, 2014, the tax basis of our assets and liabilities were $178,673 less than the reported amount of our assets and liabilities. OCIB is a Texas limited liability company with disregarded tax status (i.e., nontaxable pass-through entity) for U.S. federal income tax purposes and, therefore, is not subject to U.S. federal income taxes; however, OCIB is subject to Texas Margin Taxes. As of and for the years ended December 31, 2014, 2013 and 2012, we recorded Texas Margin Taxes of $1,564, $1,399 and $1,048, respectively, in income tax expense in the accompanying consolidated statements of operations.
(j) Commitments and Contingencies
Liabilities for loss contingencies, including environmental remediation costs not within the scope of Financial Accounting Standards Board (“FASB”) Accounting Standards Codification (“ASC”) Topic 410, Asset Retirement and Environmental Obligations, arising from claims, assessments, litigation, fines, and penalties and other sources, are recorded when it is probable that a liability has been incurred and the amount of the assessment and/or remediation can be reasonably estimated.
Legal costs incurred in connection with loss contingencies are expensed as incurred.
82
Table of Contents
Accruals for estimated losses from environmental remediation obligations generally are recognized no later than completion of the remedial feasibility study. Such accruals are adjusted as further information develops or circumstances change. Costs of expected future expenditures for environment remediation obligations are not discounted to their present value. As of December 31, 2014, 2013 and 2012, the Partnership had no environmental remediation obligations.
(k) Impairment of Long-Lived Assets
Long-lived assets, such as property, plant, and equipment, are reviewed for impairment whenever events or changes in circumstances indicate that the carrying amount of an asset may not be recoverable. If circumstances require a long-lived asset or asset group be tested for possible impairment, the Partnership first compares undiscounted cash flows expected to be generated by that asset or asset group to its carrying amount. If the carrying amount of the long-lived asset or asset group is not recoverable on an undiscounted cash flow basis, an impairment is recognized to the extent that the carrying amount exceeds its fair value. Fair value is determined through various valuation techniques including discounted cash flow models, quoted market values, and third-party independent appraisals, as considered necessary. No events or changes in circumstances occurred during the years ended December 31, 2014, 2013 and 2012, that indicated the carrying amount of an asset may not be recoverable.
(l) Capitalized Interest
The Partnership’s policy is to capitalize interest costs incurred on indebtedness during the construction of major projects. A reconciliation of total interest costs to interest expense as reported in the consolidated statements of operations for 2014, 2013 and 2012 is as follows:
| 2014 | 2013 | 2012 | ||||||||||
| Interest cost capitalized |
$ | 6,410 | $ | 655 | $ | 659 | ||||||
| Interest cost capitalized—related party |
— | 387 | 10,270 | |||||||||
| Interest cost charged to income (1) |
18,250 | 16,684 | 5,718 | |||||||||
| Interest cost charged to income—related party |
203 | 14,038 | 6,469 | |||||||||
|
|
|
|
|
|
|
|||||||
| Total interest cost |
$ | 24,863 | $ | 31,764 | $ | 23,116 | ||||||
|
|
|
|
|
|
|
|||||||
| (1) | Includes $2,815, $3,499 and $2,000 of amortized debt issuance costs for the years ended December 31, 2014, 2013 and 2012 (note 6(b)). |
(m) Fair Value Measurement
The Partnership’s receivables and payables are short–term nature and therefore, the carrying amount approximates their respective fair values as of December 31, 2014 and 2013. Debt accrues interest at a variable rate, and as such, the fair value approximates its carrying amount as of December 31, 2014 and 2013.
Note 3—New Accounting Pronouncements
On May 28, 2014 the FASB issued ASU No. 2014-09, Revenue from Contracts with Customers, which requires an entity to recognize the amount of revenue which it expects to be entitled for the transfer of promised goods or services to customers. The ASU will replace most existing revenue recognition guidance in U.S. GAAP when it becomes effective. The new standard is effective for the Partnership on January 1, 2017. Early application is not permitted. The standard permits the use of either the retrospective or cumulative effect transition method. The Partnership is evaluating the effect that ASU 2014-09 will have on its consolidated financial statements and related disclosures. The Partnership has not yet selected a transition method nor has it determined the effect of the standard on its ongoing financial reporting.
83
Table of Contents
Note 4—Property, Plant and Equipment
| 2014 | 2013 | |||||||
| Land |
$ | 3,371 | $ | 3,371 | ||||
| Plant and equipment |
347,001 | 337,093 | ||||||
| Vehicles |
104 | 63 | ||||||
| Furniture, Fixtures & Office Equipment |
164 | — | ||||||
| Construction in progress |
251,307 | 54,064 | ||||||
|
|
|
|
|
|||||
| 601,947 | 394,591 | |||||||
| Less: accumulated depreciation |
56,689 | 33,584 | ||||||
|
|
|
|
|
|||||
| $ | 545,258 | $ | 361,007 | |||||
|
|
|
|
|
|||||
Note 5—Inventories
As of December 31, 2014 and 2013, the Partnership’s inventories consisted of finished goods produced from normal production, and the Partnership had no raw materials and/or work-in-progress inventories. Below is a summary of inventories balances by product as of December 31, 2014 and 2013:
| 2014 | 2013 | |||||||
| Ammonia |
$ | 3,475 | $ | 2,090 | ||||
| Methanol |
2,677 | 1,896 | ||||||
|
|
|
|
|
|||||
| Total |
$ | 6,152 | $ | 3,986 | ||||
|
|
|
|
|
|||||
Note 6—Debt
(a) Debt—Related Party
On August 20, 2013, OCIB entered into a $40,000 intercompany revolving facility agreement with OCI Fertilizer (the “Intercompany Revolving Facility”), with a maturity date of January 20, 2020. The amount that can be drawn under the Intercompany Revolving Facility is limited by the Revolving Credit Facility (as defined below) to $40,000 minus the amount of indebtedness outstanding under the Revolving Credit Facility. Borrowings under the Intercompany Revolving Facility bear interest at a rate equal to the sum of (i) the rate per annum applicable to the Term B-3 Loans discussed in note 6(b), plus (ii) 0.25%. OCIB pays a commitment fee to OCI Fertilizer under the Intercompany Revolving Facility on the undrawn available portion at a rate of 0.5% per annum, which is included as a component of interest expense—related party on the condensed consolidated statements of operations. The Intercompany Revolving Facility is subordinated to indebtedness under the Term Loan B Credit Facility (as defined below) and the Revolving Credit Facility. As of December 31, 2014, OCIB has not drawn under the Intercompany Revolving Facility.
On September 15, 2013, three separate intercompany loan agreements between OCIB and OCI Fertilizer were replaced with a new intercompany term facility agreement with OCI Fertilizer (the “Intercompany Term Facility”), with a borrowing capacity of $200,000, and a maturity date of January 20, 2020. Borrowings under the Intercompany Term Facility are subordinated to the Term B-3 Loans (as defined below) under the Term Loan B Credit Facility and the Revolving Credit Facility. Prior to the completion of the IPO, borrowings under the Intercompany Term Facility accrued interest at an interest rate equal to the one-month London Interbank Offered Rate (“LIBOR”) plus 9.25%. Upon the completion of the IPO, borrowings under the Intercompany Term Facility bear interest at a rate equal to the sum of (i) the rate per annum applicable to the Term B-3 Loans discussed in note 6(b) plus (ii) 0.25%.
84
Table of Contents
On November 27, 2013, OCIB utilized the funds borrowed under the Incremental Term Loan (see note 6(b)) to repay amounts owing under the Intercompany Term Facility and entered into Amendment No. 1 to the Intercompany Term Facility (the “Intercompany Term Amendment”). Under the terms of the Intercompany Term Amendment, the borrowing capacity under the Intercompany Term Facility was reduced to $100,000. As of December 31, 2014, OCIB has not drawn under the Intercompany Term Facility.
(b) Debt—External Party
| December 31, 2014 |
Interest Rate |
Interest Rate as of December 31, 2014 |
Maturity Date | |||||||||
| Term Loan B Credit Facility |
$ | 395,015 | 4% + Adjusted LIBOR | 5.00 | % | August 20, 2019 | ||||||
| Less: Current Portion |
3,980 | |||||||||||
| Less: Debt Discount |
3,435 | |||||||||||
|
|
|
|||||||||||
| Total Long-term |
$ | 387,600 | ||||||||||
|
|
|
|||||||||||
| December 31, 2013 |
Interest Rate |
Interest Rate as of December 31, 2013 |
Maturity Date | |||||||||
| Term Loan B Credit Facility |
$ | 399,000 | 5% + Adjusted LIBOR | 6.25 | % | August 20, 2019 | ||||||
| Less: Current Portion |
4,000 | |||||||||||
| Less: Debt Discount |
4,124 | |||||||||||
|
|
|
|||||||||||
| Total Long-term |
$ | 390,876 | ||||||||||
|
|
|
|||||||||||
Prior Credit Facility
On April 26, 2012, OCIB entered into a term loan facility agreement with a syndicate of lenders, including Credit Agricole Corporate and Investment Bank, as facility agent (the “Prior Credit Facility”), and borrowed $125,000 under the Prior Credit Facility. On April 30, 2012, OCIB utilized the borrowings under the Prior Credit Facility to repay in full all of $92,500 of debt outstanding and subsequently terminate its then-existing related party term loan and revolving loan. The Prior Credit Facility was repaid in full with the proceeds of the Bridge Term Loan Credit Facility discussed below.
Bridge Term Loan Credit Facility
On May 21, 2013, OCIB entered into a $360,000 senior secured term loan credit facility agreement with a group of lenders (the “Bridge Term Loan Credit Facility”). The Bridge Term Loan Credit Facility was comprised of a $125,000 Bridge Term B-1 Loan and $235,000 Bridge Term B-2 Loan. OCIB utilized $125,000 of the funds borrowed under the Bridge Term B-1 Loan to repay amounts owed under the Prior Credit Facility. Approximately $230,000 of proceeds from the Bridge Term B-2 Loan was distributed to OCI USA and approximately $4,025 of proceeds from the Bridge Term B-2 Loan was used to pay bank and legal fees associated with the Bridge Term Loan Credit Facility.
Term Loan B Credit Facility and Amendments Thereto
On August 20, 2013, OCIB and OCI USA entered into a $360,000 senior secured term loan facility agreement (the “Original Term Loan B Credit Facility”) with a syndicate of lenders, comprised of two tranches of term debt in the amounts of $125,000 (the “Term B-1 Loan”) and $235,000 (the “Term B-2 Loan” and together with the Term B-1 Loan, the “Term B Loans”), respectively. Upon entry into the Original Term Loan B Credit Facility, OCIB utilized the funds borrowed under the facility to repay amounts owing under the Bridge Term Loan Credit Facility, after which the Bridge Term Loan Credit Facility was terminated. Prior to the completion of the IPO, interest on the
85
Table of Contents
Term B Loans accrued, at OCIB’s option, at adjusted LIBOR plus 5.00% per annum or the alternate base rate plus 4.00%. Pursuant to the terms of the Original Term Loan B Credit Facility, upon the completion of the IPO, the Partnership utilized proceeds of approximately $126,085 received from the IPO to repay in full outstanding borrowings under the Term B-1 Loan of approximately $125,000 and $1,085 of accrued interest, leaving only the Term B-2 Loan outstanding. The Partnership subsequently became a party to the Original Term Loan B Credit Facility through a credit agreement joinder, dated as of October 18, 2013.
On November 27, 2013, OCIB, the Partnership and OCI USA entered into Amendment No. 1 to the Original Term Loan B Credit Facility (the “Term Loan Amendment No. 1”) with Bank of America, as administrative agent, collateral agent and incremental term loan lender, and the other lenders party thereto. Pursuant to the terms of Term Loan Amendment No. 1, OCIB borrowed an incremental $165,000 term B-2 loan (the “Incremental Term Loan”) under the Original Term Loan B Credit Facility (collectively with the existing Term B-2 Loan, the “Term B-2 Loans”). OCIB utilized the proceeds of the Incremental Term Loan to repay amounts owing under the Intercompany Term Facility (see note 6(a)). Term Loan Amendment No. 1 also adjusted the amortization schedule for the Term B-2 Loans to encompass the new tranche composed of the Incremental Term Loan. In addition, Term Loan Amendment No. 1 clarified that the maximum principal amount of Incremental Term Loans that may be incurred under the Original Term Loan B Credit Facility (as amended by Term Loan Amendment No. 1) is the sum of (and not the greater of) (a) $100.0 million and (b) such other amount such that, after giving effect on a pro forma basis to any such incremental facility and other applicable pro forma adjustments, the first lien net leverage ratio is equal to or less than 1.25 to 1.00.
On April 4, 2014, OCIB, the Partnership and OCI USA entered into Amendment No. 2 and Waiver (“Term Loan Amendment No. 2”) to the Original Term Loan B Credit Facility, with Bank of America, as administrative agent, collateral agent and additional term loan lender, and the other lenders party thereto. Pursuant to the terms of Term Loan Amendment No. 2, OCIB refinanced the Term B-2 Loans through the cashless repayment of the Term B-2 Loans and the simultaneous incurrence of a new tranche of loans (the “Term B-3 Loans”). The Term B-3 Loans have terms and provisions identical to the Term B-2 Loans, except as specifically modified by Term Loan Amendment No. 2. Term Loan Amendment No. 2 (i) reduced the interest rate margin on the outstanding term loans under the Term Loan B Credit Facility such that OCIB may select an interest rate of (a) 4.00% above LIBOR for LIBO Rate Term Loans (as defined in the Term Loan B Credit Facility) or (b) 3.00% above the Base Rate for Base Rate Loans (as each such term is defined in the Term Loan B Credit Facility) (but see note 15 for subsequent amendments to these margins), (ii) decreased the minimum LIBO Rate (as defined in the Term Loan B Credit Facility) from 1.25% to 1.00%, (iii) reset the prepayment premium of 101% on voluntary prepayments of the Term B-3 Loans for twelve months after the closing of Term Loan Amendment No. 2, and (iv) provided for delivery of financial information from the Partnership instead of OCIB, with reconciliation information to the financial information for OCIB.
On June 13, 2014, OCIB, the Partnership and OCI USA entered into Amendment No. 3 (“Term Loan Amendment No. 3”) to the Original Term Loan B Credit Facility (the Original Term Loan B Credit Facility as amended by Term Loan Amendment No. 1, Term Loan Amendment No. 2 and Term Loan Amendment No. 3, the “Term Loan B Credit Facility”) with Bank of America, as administrative agent. Term Loan Amendment No. 3 (i) corrected an inconsistency in the definition of “Hedging Agreement”, (ii) amended Section 10.01(ii) by adding that the liens permitted by such section cannot be for debt that is overdue, (iii) revised the intercompany subordination agreement entered into in connection with the Original Term Loan B Credit Facility to clarify that intercompany debt will be subordinate to the obligations owed to counterparties under hedge agreements that are secured pursuant to the terms of the Term Loan B Credit Facility and (iv) made certain technical changes to certain defined terms.
The Term B-3 Loans mature on August 20, 2019 and are subject to certain mandatory prepayment obligations upon the disposition of certain assets and the incurrence of certain indebtedness. The Term B-3 Loans are also subject to mandatory quarterly repayments equal to 0.25% of all Term B-3 Loans outstanding on the Term Loan Amendment No. 2 effective date.
86
Table of Contents
Scheduled maturities with respect to the Term Loan B Credit Facility are as follows:
| Fiscal Year |
||||
| 2015 |
$ | 3,980 | ||
| 2016 |
3,980 | |||
| 2017 |
3,980 | |||
| 2018 |
3,980 | |||
| Thereafter |
379,095 | |||
|
|
|
|||
| Total |
$ | 395,015 | ||
|
|
|
|||
The Term B-3 Loans, as well as related fees and expenses, are unconditionally guaranteed by OCI USA, the Partnership and certain of its future subsidiaries other than OCIB. The Term B-3 Loans, and related fees and expenses, are secured by a first priority lien on substantially all of OCIB’s and the Partnership’s assets (OCI USA does not provide any security with its guarantee; upon completion of the IPO, all security provided by OCI USA was released, and the Partnership entered into an all-assets pledge, including its ownership interest in OCIB).
The Term Loan B Credit Facility contains customary covenants and conditions, including limitations on our ability to finance future operations or capital needs or to engage in other business activities. These restrictions and covenants will limit our ability, among other things, to:
| • | incur additional indebtedness; |
| • | create liens on assets; |
| • | engage in mergers or consolidations; |
| • | sell assets; |
| • | pay dividends and distributions or repurchase our common units; |
| • | make investments, loans or advances; |
| • | prepay certain subordinated indebtedness; |
| • | make certain acquisitions or enter into agreements with respect to our equity interests; and |
| • | engage in certain transactions with affiliates. |
In addition, OCIB may not permit, on the last day of any fiscal quarter, beginning December 31, 2013 (i) the consolidated senior secured net leverage ratio to exceed (x) in the case of each fiscal quarter ending prior to March 31, 2015, 2.00 to 1.00 and (y) in the case of the fiscal quarter ending March 31, 2015 and each fiscal quarter ending thereafter, 1.75 to 1.00 (but see note 15 for subsequent amendments to these ratios), and (ii) the consolidated interest coverage ratio on the last day of any fiscal quarter to be less than 5.00 to 1.00. The consolidated senior secured net leverage ratio is defined as the ratio of (i) (A) consolidated senior secured debt less (B) the aggregate amount of unrestricted cash and cash equivalents included on the consolidated balance sheet to (ii) consolidated EBITDA for the last four quarters. The consolidated interest coverage ratio is defined as the ratio of (i) consolidated EBITDA for the last four quarters to (ii) consolidated interest expense for the last four quarters. For the period ending December 31, 2014, we applied the Consolidated EBITDA Material Project Adjustments (as defined in the Term Loan B Credit Facility) to our calculation of Consolidated EBITDA (as defined in the Term Loan B Credit Facility) in computing the aforementioned ratios. As of December 31, 2014, OCIB’s consolidated senior secured net leverage ratio was 1.58 to 1.00, and its consolidated interest coverage ratio was 11.08 to 1.00. Upon the occurrence of certain events of default under the Term Loan B Credit Facility OCIB’s obligations under the Term Loan B Credit Facility may be accelerated.
87
Table of Contents
The Term Loan B Credit Facility also contains various nonfinancial covenants, which include, among others, undertaking with respect to reporting requirements, maintenance of specified insurance coverage, and compliance with applicable laws and regulations. As of December 31, 2014, the Partnership was in compliance with all these covenants.
The Term Loan B Credit Facility contains events of default customary for credit facilities of this nature, including, but not limited to, the failure to pay any principal, interest or fees when due, failure to satisfy any covenant, untrue representations or warranties, impairment of liens, events of default under any other loan document, default under any other material debt agreements, insolvency, certain bankruptcy proceedings, change of control and material litigation resulting in a final judgment against any borrower or subsidiary guarantor. Upon the occurrence and during the continuation of an event of default under the Term Loan B Credit Facility, the lenders may, among other things, accelerate and declare the outstanding loans to be immediately due and payable and exercise remedies against OCIB, the Partnership and the collateral as may be available to the lenders under the Term Loan B Credit Facility and other loan documents.
Revolving Credit Facility and Amendments Thereto
On April 4, 2014, OCIB as borrower, the Partnership as a guarantor, Bank of America, N.A. as administrative agent and a syndicate of lenders entered into a new revolving credit facility agreement (the “Original Revolving Credit Facility”), with an initial aggregate borrowing capacity of up to $40,000 (less any amounts borrowed under the Intercompany Revolving Facility (as defined in note 6(a)), including a $20,000 sublimit for letters of credit. All proceeds from this facility will be used by OCIB for working capital, capital expenditures and other general corporate purposes.
On June 13, 2014, OCIB, the Partnership and OCI USA entered into Amendment No. 1 (“Revolving Credit Amendment No. 1”) to the Original Revolving Credit Facility (the Original Revolving Credit Facility as so amended, the “Revolving Credit Facility”) with Bank of America, as administrative agent. Revolving Credit Amendment No. 1 (i) amended Section 10.01(ii) by adding that the liens permitted by such section cannot be for debt that is overdue, (ii) amended Section 10.01(xiv) to clarify that such sub-section permits the granting of liens in connection with hedge agreements permitted under the terms of the Revolving Credit Facility, (iii) revised the intercompany subordination agreement entered into in connection with the Original Revolving Credit Facility to clarify that intercompany debt will be subordinate to the obligations owed to counterparties under hedge agreements that are secured pursuant to the terms of the Revolving Credit Facility and (iv) made certain technical changes to certain defined terms.
Outstanding principal amounts under the Revolving Credit Facility bear interest at OCIB’s option at either LIBOR plus a margin of 2.75% or a base rate plus a margin of 1.75% (but see note 15 for subsequent amendments to these margins). OCIB also pays a commitment fee of 1.10% per annum on the unused portion of the Revolving Credit Facility. The Revolving Credit Facility has a one-year term that may be extended for additional one-year periods subject to the consent of the lenders. OCIB is required to repay in full all outstanding revolving loans under the Revolving Credit Facility on the last business day of each June and December.
OCIB’s obligations under the Revolving Credit Facility are guaranteed by the Partnership and certain of its future subsidiaries other than OCIB. OCIB’s obligations under the Revolving Credit Facility are secured by a first priority lien (which is pari passu with the first priority lien securing obligations under the Term Loan B Credit Facility) on substantially all of the tangible and intangible assets of OCIB and the Partnership.
In addition, the Revolving Credit Facility contains covenants and provisions that affect OCIB and the Partnership, including, among others, customary covenants and provisions:
| • | prohibiting OCIB from incurring indebtedness (subject to customary exceptions); |
| • | limiting OCIB’s ability and that of the Partnership from creating or incurring specified liens on their respective properties (subject to customary exceptions); |
88
Table of Contents
| • | limiting OCIB’s ability and that of the Partnership to make distributions and equity repurchases (which shall be permitted if no default exists and in the case of distributions and equity repurchases from a subsidiary to its parent); and |
| • | prohibiting consolidations, mergers and asset transfers by OCIB and the Partnership (subject to customary exceptions). |
Under the Revolving Credit Facility, OCIB is also subject to certain financial covenants that are tested on a quarterly basis. OCIB must maintain a consolidated senior secured net leverage ratio not greater than 2.00 to 1.00 for each fiscal quarter ending prior to March 31, 2015, and not greater than 1.75 to 1.00 thereafter (but see note 15 for subsequent amendments to these ratios). Furthermore, OCIB may not permit the consolidated interest coverage ratio to be less than 5.00 to 1.00. The consolidated senior secured net leverage ratio is defined as the ratio of (i) (A) consolidated senior secured debt less (B) the aggregate amount of unrestricted cash and cash equivalents included on the consolidated balance sheet to (ii) consolidated EBITDA for the last four quarters. The consolidated interest coverage ratio is defined as the ratio of (i) consolidated EBITDA for the last four quarters to (ii) consolidated interest expense for the last four quarters. For the period ending December 31, 2014, we applied the Consolidated EBITDA Material Project Adjustments (as defined in the Revolving Credit Facility) to our calculation of Consolidated EBITDA (as defined in the Revolving Credit Facility) in computing the aforementioned ratios. As of December 31, 2014, OCIB’s consolidated senior secured net leverage ratio was 1.58 to 1.00, and its consolidated interest coverage ratio was 11.08 to 1.00. Upon the occurrence of certain events of default under the Revolving Credit Facility OCIB’s obligations under the Revolving Credit Facility may be accelerated.
The Revolving Credit Facility also contains various nonfinancial covenants, which include, among others, undertaking with respect to reporting requirements, maintenance of specified insurance coverage, and compliance with applicable laws and regulations. As of December 31, 2014, the Partnership was in compliance with all these covenants.
The Revolving Credit Facility contains events of default customary for credit facilities of this nature, including, but not limited to, the failure to pay any principal, interest or fees when due, failure to satisfy any covenant, untrue representations or warranties, impairment of liens, events of default under any other loan document under the new credit facility, default under any other material debt agreements, insolvency, certain bankruptcy proceedings, change of control and material litigation resulting in a final judgment against any borrower or subsidiary guarantor. Upon the occurrence and during the continuation of an event of default under the Revolving Credit Facility, the lenders may, among other things, accelerate and declare the outstanding loans to be immediately due and payable and exercise remedies against OCIB, the Partnership and the collateral as may be available to the lenders under the Revolving Credit Facility and other loan documents.
(c) Debt Issuance Costs
Prior Credit Facility
OCIB incurred $3,000 of debt issuance costs related to the Prior Credit Facility during April 2012. The debt issuance costs related to investment banking fees, legal, and other professional fees directly associated with entering into the Prior Credit Facility. OCIB amortized debt issuance costs related to the Prior Credit Facility of $0, $1,000, and $2,000 during the years ended December 31, 2014, 2013, and 2012, respectively. The amortization of the debt issuance costs is presented as a component of interest expense in the accompanying consolidated statements of operations.
Bridge Term Loan Credit Facility
The Bridge Term Loan Credit Facility included $4,025 of debt issuance costs related to investment banking fees, legal, and other professional fees directly associated with entering into the Bridge Term Loan Credit
89
Table of Contents
Facility. OCIB recorded the debt issuance costs in other long-term assets in the accompanying consolidated balance sheets and was amortizing them over the term of the Bridge Term Loan Credit Facility using the straight-line method. OCIB amortized debt issuance costs related to the Bridge Term Loan Credit Facility of $0, $1,834, and $0 during the years ended December 31, 2014, 2013, and 2012, respectively. The amortization of the debt issuance costs is presented as a component of interest expense in the accompanying consolidated statement of operations. These debt issuance costs were written off in connection with the repayment of the Bridge Term B-1 Loan and Bridge Term B-2 Loan on August 20, 2013, resulting in a loss on extinguishment of debt in the year ended December 31, 2013 of $2,191.
Term Loan B Credit Facility and Amendments Thereto
The Original Term Loan B Credit Facility included a 1.5% debt discount of $5,400 that was withheld from the proceeds of the loans, a 1.5% arranger fee of $5,400, as well as $2,500 of associated legal and structuring fees. OCIB recorded the debt discount as a reduction of long-term debt, and the arranger fees and legal and structuring fees in other long-term assets in the accompanying consolidated balance sheet. Upon the completion of our IPO, the Partnership repaid in full all amounts outstanding under the Term B-1 Loan, and wrote off the debt discount and debt issue costs that were deferred relating the Term B-1 Loan, resulting in a loss on extinguishment of debt in the year ended December 31, 2013 of $4,498.
The Incremental Term Loan included a 0.5% debt discount of $825 that was withheld from the loan proceeds, a 0.75% arranger fee of $1,237, as well as $295 of associated legal and structuring fees. OCIB and OCI Fertilizer agreed to reduce the amount owing under the Intercompany Term Facility by a total of $2,562, $2,172 of which was comprised of debt discount, arranger fee and a portion of the associated legal and structuring fees, and the remaining $390 represented the amount of prepaid interest – related party. OCIB recorded the debt discount as a reduction of long-term debt, and the arranger fees and the legal and structuring fees in other long-term assets in the accompanying consolidated balance sheet. OCIB recorded the reduction of the amount owing under the Intercompany Term Facility as a contribution of partners’ capital.
The Term Loan Amendment No. 2 included a 1.0% soft-call fee of $3,980, a 0.25% arranger fee of $995, as well as $25 of other fees and expenses. OCIB recorded the soft-call fee, arranger fee and other fees and expenses in other long-term assets as a deferred financing cost.
All debt discount and debt issuance costs are being amortized over the term of the Term Loan B Credit Facility using the effective-interest method. The amortization of the debt issuance costs related to the Term Loan B Credit Facility was $2,420, $665 and $0 during the years ended December 31, 2014, 2013 and 2012, respectively. The amortization of the debt issuance costs is presented as a component of interest expense in the accompanying consolidated statements of operations.
Revolving Credit Facility and Amendments Thereto
The Revolving Credit Facility included $539 of debt issuance costs related to closing fees, legal, and other professional fees directly associated with entering into the Revolving Credit Facility. OCIB recorded the debt issuance costs in other long-term assets in the accompanying consolidated balance sheets and is amortizing them over the term of the Revolving Credit Facility using the straight-line method. OCIB amortized debt issuance costs related to the Revolving Credit Facility of $395, $0 and $0 during the years ended December 31, 2014, 2013 and 2012, respectively. The amortization of the debt issuance costs is presented as a component of interest expense in the accompanying consolidated statement of operations.
Note 7—Related–Party Transactions
The Partnership has maintained and been involved with certain arrangements and transactions with OCI and its affiliates. The material effects of such arrangements and transactions are reported in the accompanying
90
Table of Contents
consolidated financial statements as related party transactions. The Partnership’s IPO on October 9, 2013 and associated contribution by OCI USA of its interests in OCIB gave rise to certain transfers, contributions, and capital distributions described in note 1. In addition, the Partnership entered into certain new contractual arrangements with related parties in connection with the IPO, such as the Omnibus Agreement and other agreements discussed below.
The following table represents the effect of related party transactions of the consolidated results of operations for the years ended December 31, 2014, 2013 and 2012:
| Years Ended December 31, | ||||||||||||
| 2014 | 2013 | 2012 | ||||||||||
| Cost of goods sold (exclusive of depreciation) |
$ | 13,266 | $ | 2,324 | $ | — | ||||||
| Selling, general and administrative expenses(1) |
4,428 | 8,686 | 5,070 | |||||||||
| Interest expense |
203 | 14,038 | 6,469 | |||||||||
| (1) | Amounts represented in selling, general and administrative expense were incurred to the following related parties: |
| Years Ended December 31, | ||||||||||||
| 2014 | 2013 | 2012 | ||||||||||
| OCI GP LLC |
$ | 2,563 | $ | 643 | $ | — | ||||||
| OCI Nitrogen B.V. |
183 | 1,357 | 704 | |||||||||
| OCI Personnel B.V. |
857 | — | — | |||||||||
| Contrack International Inc. |
805 | 276 | — | |||||||||
| OCI Fertilizer BV |
20 | — | — | |||||||||
| OCI Fertilizer International BV |
— | 43 | 17 | |||||||||
| Orascom Construction Industries (“OCI Egypt”) |
— | 6,367 | 4,349 | |||||||||
|
|
|
|
|
|
|
|||||||
| Total selling, general and administrative expenses—related party |
$ | 4,428 | $ | 8,686 | $ | 5,070 | ||||||
|
|
|
|
|
|
|
|||||||
Our Agreements with OCI
Omnibus Agreement
On October 9, 2013, in connection with the closing of the IPO, the Partnership entered into an omnibus agreement by and between the Partnership, OCI, OCI USA, OCI GP LLC and OCIB (the “Omnibus Agreement”). The Omnibus Agreement addresses certain aspects of the Partnership’s relationship with OCI and OCI USA, including: (i) certain indemnification obligations, (ii) the provision by OCI USA to the Partnership of certain services, including selling, general and administrative services and management and operating services relating to operating the Partnership’s business, (iii) the Partnership’s use of the name “OCI” and related marks and (iv) the allocation among the Partnership and OCI USA of certain tax attributes.
Under the Omnibus Agreement, OCI USA will provide, or cause one or more of its affiliates to provide, the Partnership with such selling, general and administrative services and management and operating services as may be necessary to manage and operate the business and affairs of the Partnership. Pursuant to the Omnibus Agreement, the Partnership will reimburse OCI USA for all reasonable direct or indirect costs and expenses incurred by OCI USA or its affiliates in connection with the provision of such services, including the compensation and employee benefits of employees of OCI USA or its affiliates.
During the years ended December 31, 2014, 2013 and 2012, costs totaling $15,829, $2,967 and $0, respectively, were incurred under this contract and payable to OCI GP LLC in connection with reimbursement of
91
Table of Contents
providing selling, general and administrative services and management and operating services to manage and operate the business and affairs of the Partnership. Of this amount, $13,266, $2,324 and $0 were included in cost of goods sold (exclusive of depreciation) for the wages directly attributable to revenue-producing operations during the years ended December 31, 2014, 2013 and 2012, respectively. Accounts payable—related party include amounts incurred but unpaid to OCI GP LLC of $1,117 and $1,776 as of December 31, 2014 and December 31, 2013, respectively.
The Partnership recorded amounts due to (i) OCI Nitrogen B.V. (“OCI Nitrogen”), an indirect, wholly-owned subsidiary of OCI, (ii) OCI Personnel B.V. (“OCI Personnel”), an indirect, wholly-owned subsidiary of OCI, (iii) Contrack International Inc. (“Contrack”), an indirect, wholly-owned construction subsidiary of OCI, (iv) OCI Fertilizer BV, and indirect, wholly-owned subsidiary of OCI, and (v) OCI Fertilizer, in selling, general and administrative expense as shown on the consolidated statement of operations, in relation to officers’ salaries, wages and travel expenses, and asset management information-technology-related project expenses in the amount of $1,865, $1,676 and $721 during the years ended December 31, 2014, 2013 and 2012, respectively. Accounts payable—related party include amounts incurred but unpaid to the aforementioned parties of $298 and $301 as of December 31, 2014 and December 31, 2013, respectively.
Contribution Agreement
On October 9, 2013, in connection with the closing of the IPO, the Partnership entered into a Contribution, Conveyance and Assumption Agreement (the “Contribution Agreement”) with its general partner, OCI USA and OCIB. Immediately prior to the closing of the IPO, OCI USA contributed to the Partnership its right, title and interest in and to all of the limited liability company interests in OCIB in exchange for 60,375,000 common units. These transactions, among others, were made in a series of steps outlined in the Contribution Agreement. On November 4, 2013, after the expiration of the underwriters’ over-allotment option period, pursuant to the IPO underwriting agreement and the Contribution Agreement, the Partnership issued 2,625,000 additional common units that were subject to the underwriters’ over-allotment option to OCI USA for no additional consideration as part of OCI USA’s contribution of its membership interests in OCIB to the Partnership.
Distributions and Payments to OCI USA and Its Affiliates
Prior to the completion of the IPO, certain assets of OCIB were distributed to OCI USA. In May 2013, OCIB distributed $30,000 of cash and $230,000 of proceeds from the Bridge Term B-2 Loan to OCI USA as a capital distribution. In October 2013, OCIB distributed $56,700 of cash and $35,616 of accounts receivable to OCI USA, which was comprised of $8,056 of advances due from related party and $27,560 of trade receivables. All collections of transferred advances due from related parties have been received directly by OCI USA, and all collections of transferred trade receivables have been received by the Partnership and will be remitted to OCI USA. As of December 31, 2014, we have remitted $17,522 of the collections of the transferred trade receivables to OCI USA, and the remaining balance of $10,038 is recorded in accounts payable—related party on the consolidated balance sheet as of December 31, 2014.
Intercompany Revolving Facility and Intercompany Term Facility
As indicated above in note 6(a), OCIB had related party debt during the years ended December 31, 2014, 2013 and 2012 and had recorded interest expense of $203, $14,038 and $6,469 during the years ended December 31, 2014, 2013 and 2012, respectively.
Construction Agreement with Orascom E&C USA Inc.
In March 2013, OCIB entered into a technical service agreement with OCI Construction Limited (“OCICL”), an indirect, wholly-owned construction subsidiary of OCI, for OCICL’s provision of management and construction services relating to the debottlenecking of OCIB’s methanol and ammonia production units (the
92
Table of Contents
“Technical Service Agreement”). OCIB incurred $0, $1,500 and $0 during the years ended December 31, 2014, 2013 and 2012, respectively, of OCICL fees for the provision of management and construction services. All amounts incurred under this contact were capitalized into construction in progress, which is a component of property plant and equipment shown in the consolidated balance sheet. Accounts Payable—related party include amounts incurred but unpaid to OCICL of $0 and $375 as of December 31, 2014 and December 31, 2013, respectively.
In June 2013, OCIB entered into a procurement and construction contract with Orascom E&C USA Inc., an indirect, wholly-owned construction subsidiary of OCI, pursuant to which Orascom E&C USA Inc. will undertake the debottlenecking of OCIB’s methanol and ammonia production units (the “Construction Contract”). Upon execution of the Construction Contract, the Technical Service Agreement was subsumed within the Construction Contract. Under the terms of the Construction Contract, Orascom E&C USA Inc. will be paid on a cost-reimbursable basis, plus a fixed fee that will equal 9% of the costs of the project, excluding any discounts. The contract allocates customary responsibilities to OCIB and Orascom E&C USA Inc. The agreement does not provide for the imposition of liquidated or consequential damages. Costs (including the fixed fee) were incurred under the Construction Contract in the amount of $101,454, $32,561 and $0 during the years ended December 31, 2014, 2013 and 2012, respectively. All amounts incurred under this contact have been capitalized into construction in progress, which is a component of property plant and equipment shown in the consolidated balance sheet. Accounts Payable – related party include amounts incurred but unpaid to Orascom E&C USA Inc. of $25,834 and $85 as of December 31, 2014 and December 31, 2013, respectively.
Other Transactions with Related Parties
Equity Commitment Agreement
On November 27, 2013, the Partnership entered into a new intercompany equity commitment agreement with OCI USA (the “Intercompany Equity Commitment”). Under the terms of the Intercompany Equity Commitment, OCI USA shall make an equity contribution not to exceed $100,000 to the Partnership if (a) prior to the completion of the debottlenecking project, the Partnership or OCIB have liquidity needs for working capital or other needs and the restrictions under the Term Loan B Credit Facility or any other debt instrument prohibit the Partnership or OCIB from incurring sufficient additional debt to fund such liquidity needs; or (b) OCIB fails to comply with any of the financial covenants as of the last day of any fiscal quarter.
On November 10, 2014, pursuant to the Intercompany Equity Commitment, the Partnership received a capital contribution of $60,000 from OCIP Holding LLC (“OCIP Holding”), an indirect, wholly-owned subsidiary of OCI, to help finance the funding required to complete the debottlenecking project, and, in exchange, the Partnership issued 2,995,372 common units to OCIP Holding. The common units were issued pursuant to a contribution agreement, dated November 10, 2014, by and among the Partnership, OCIP Holding and OCI USA, at a price per common unit equal to $20.0309 (the volume-weighted average trading price of a common unit on the NYSE, calculated over the consecutive 20-trading day period ending on the close of trading on the trading day immediately prior to the issue date). Immediately following the issuance of common units to OCIP Holding on November 10, 2014, OCIP Holding held 65,995,372 common units in the Partnership, representing a 79.04% limited partner interest.
Guarantee of Term Loan B Credit Facility and Revolving Credit Facility
The term loans under the Term Loan B Credit Facility and related fees and expenses are unconditionally guaranteed by OCIP and OCI USA and are each secured by pari passu senior secured liens on substantially all of OCIB’s and OCIP’s assets, as well as the assets of certain future subsidiaries of OCIP (OCI USA does not provide any security in connection with its guarantee). The revolving loans and letters of credit under the Revolving Credit Facility and related fees and expenses, are unconditionally guaranteed by OCIP and are secured by pari passu senior secured liens on substantially all of OCIB’s and OCIP’s assets, as well as the assets of certain future subsidiaries of OCIP .
93
Table of Contents
Standby Letter of Credit
On August 28, 2012, OCIB obtained a standby letter of credit (the “Letter of Credit”) from Citibank, N.A., in the amount of $282 in support of OCI USA’s office lease obligations. On August 10, 2014 OCIB assigned all duties, liabilities and obligations under the Letter of Credit to OCI USA, and in return, OCI USA remitted $282 to OCIB.
Management Support Fees
During the years ended December 31, 2014, 2013 and 2012, OCIB had related-party transactions with Orascom Construction Industries (“OCI Egypt”) in the amount of $0, $6,367 and $4,349, respectively, related to management support fees, which are recorded in selling, general and administrative expenses in the accompanying consolidated statements of operations. As indicated above, on October 9, 2013, in connection with the closing of the IPO, the Partnership entered into the Omnibus Agreement that, among other things, addresses certain aspects of the Partnership’s relationship with OCI and OCI USA, including the provision by OCI USA to the Partnership of certain services, including selling, general and administrative services and management and operating services relating to operating the Partnership’s business. Our obligation to pay management support fees to OCI Egypt was terminated after the completion of the IPO.
Note 8—Partners’ Capital
Summary of Changes in Outstanding Units
The following is a reconciliation of our limited partner units outstanding for the periods indicated:
| Limited Partner Units |
||||
| Limited partner units outstanding at December 31, 2012 |
— | |||
| Units issued in exchange for contribution of net assets to OCIP |
60,375,000 | |||
| Units issued in IPO |
17,500,000 | |||
| Units issued to OCI USA on expiry of the underwriters’ overallotment option on November 4, 2013 |
2,625,000 | |||
|
|
|
|||
| Limited partner units outstanding at December 31, 2013 |
80,500,000 | |||
|
|
|
|||
| Units issues in connection with the Equity Commitment Agreement |
2,995,372 | |||
|
|
|
|||
| Limited partner units outstanding at December 31, 2014 |
83,495,372 | |||
|
|
|
|||
Initial Public Offering
On October 3, 2013, the Partnership priced 17,500,000 common units in its IPO to the public at a price of $18.00 per unit, and on October 4, 2013, the Partnership’s common units began trading on the NYSE under the symbol “OCIP.” On October 9, 2013, the Partnership closed its IPO of 17,500,000 common units, and issued 60,375,000 common units to OCI USA. On November 4, 2013, in connection with the expiration of the underwriters’ over-allotment option period, the Partnership issued an additional 2,625,000 common units to OCI USA pursuant to the terms of the underwriting agreement and Contribution Agreement entered into in connection with the IPO. The net proceeds from the IPO of approximately $295,313, after deducting the underwriting discount and the structuring fee, were used to: (i) repay the Term B-1 Loan in the amount of approximately $125,000 and associated accrued interest on the Term B-1 Loan of approximately $1,085 and (ii) provide the Partnership additional cash of approximately $169,228, with the funds to be utilized to fund post-IPO working capital and to pay a portion of the costs of our debottlenecking project and other capital projects incurred after the completion of the IPO. During the year ended December 31, 2013, the Partnership incurred and capitalized $4,266 of costs directly attributable to the IPO. Those costs are recorded as a reduction of partners’ capital in the accompanying consolidated balance sheet as of December 31, 2013. On April 14, 2014, OCI USA contributed the 63,000,000 common units to its indirect subsidiary, OCIP Holding.
94
Table of Contents
On November 10, 2014, pursuant to the Intercompany Equity Commitment, the Partnership received a capital contribution of $60,000 from OCIP Holding, to help finance the funding required to complete the debottlenecking project, and, in exchange, the Partnership issued 2,995,372 common units to OCIP Holding. The common units were issued pursuant to a contribution agreement, dated November 10, 2014, by and among the Partnership, OCIP Holding and OCI USA, at a price per common unit equal to $20.0309 (the volume-weighted average trading price of a common unit on the NYSE, calculated over the consecutive 20-trading day period ending on the close of trading on the trading day immediately prior to the issue date). Immediately following the issuance of common units to OCIP Holding on November 10, 2014, OCIP Holding held 65,995,372 common units in the Partnership, representing a 79.04% limited partner interest.
Note 9—Retention Bonus Plan
On November 29, 2013, the Board of Directors approved a retention bonus plan to reinforce and encourage the continued dedication of the employees of OCI GP LLC, our general partner, and its affiliates who provide services to the Partnership by providing a retention bonus opportunity. Each non-executive employee is eligible to receive up to two retention bonuses, pursuant to this plan. Each retention bonus equal three times the employee’s base monthly salary or wages in effect on the applicable retention bonus payment date. The first retention bonus of $2,190 was accrued during the year-ended December 31, 2014 and paid during January 2015, and the second retention bonus will be recorded during the year-ended December 31 2015 and paid during January 2016, in each case subject to the employee’s continued employment with the Partnership and its affiliates and continued provision of services for the benefit of the Partnership through the applicable retention bonus payment date.
Note 10—Fair Value
The Partnership’s receivables and payables are short-term in nature and, therefore, the carrying values approximate their respective values as of December 31, 2014. Debt accrues interest at a variable rate, and as such, the fair value approximates its carrying value as of December 31, 2014 and December 31, 2013.
Note 11—Commitments, Contingencies and Legal Proceedings
In the ordinary course of business, we are, and will continue to be, involved in various claims and legal proceedings, some of which are covered in whole or in part by insurance. We may not be able to predict the timing or outcome of these or future claims and proceedings with certainty, and an unfavorable resolution of one or more of such matters could have a material adverse effect on our financial condition, results of operations or cash flows. Currently, we are not party to any legal proceedings that, individually or in the aggregate, are reasonably likely to have a material adverse effect on our financial condition, results of operations or cash flows.
On October 30, 2014, we received notice of a lawsuit filed by the employee of a delivery contractor in the 136th Judicial District Court of Jefferson County, Texas, at Cause No. D-196,315, for injuries alleged to have occurred in May 2014. The Partnership removed the case to the United States District Court for the Eastern District of Texas, Beaumont Division, at Cause No. 1:15-cv-00028 in January 2015. Plaintiff alleges injuries from his delivery of acid to the Partnership’s Beaumont plant. He claims that the Partnership was negligent in failing to properly inspect and maintain the premises, and to provide a safe place to work. Discovery has not yet commenced. We have a claim for contractual defense and indemnity from a contractor, and the matter is covered under a general liability insurance policy (subject to a deductible and a reservation of rights). We do not expect the cost of any settlement or eventual judgment, if any, to be material to our operations or financial position.
During July and August 2013, the Partnership experienced 13 days of unplanned downtime as the Partnership took its methanol unit offline to repair its syngas machine, including replacing a rotor and installing new bearings. The Partnership’s claim for losses associated with this unplanned downtime was approximately $11,300 with a net recovery of approximately $6,400 (after incurring a deductible of approximately $4,900). The
95
Table of Contents
Partnership received insurance proceeds of $5,085 in connection with this insurance claim during the fourth quarter of 2013, and the effect of the receipt of these insurance proceeds was included in other income (expense) in the Partnership’s Consolidated Statement of Operations for the year ended December 31, 2013. On April 15, 2014, the Partnership reached a final settlement under this insurance claim, whereby the insurance provider agreed and paid a final installment of $600, and the effect of the receipt of these insurance proceeds is presented in other income (expense) in the accompanying consolidated statement of operations.
The Partnership’s facilities could be subject to potential environmental liabilities primarily relating to contamination caused by current and/or former operations at those facilities. Some environmental laws could impose on the Partnership the entire costs of cleanup regardless of fault, legality of the original disposal or ownership of the disposal site. In some cases, the governmental entity with jurisdiction could seek an assessment for damage to the natural resources caused by contamination from those sites. The Partnership had no significant operating expenditures for environmental fines, penalties or government-imposed remedial or corrective actions during the years ended December 31, 2014 and 2013.
Note 12—Earnings per Limited Partner Unit
The following table sets forth the computation of basic and diluted earnings per limited partner unit for the period indicated:
| Year Ended December 31, 2014 |
October 9, 2013 through December 31, 2013 |
|||||||
| Net income |
$ | 119,448 | $ | 47,380 | ||||
| Basic and diluted weighted average number of limited partner units outstanding |
80,918,531 | 79,656,250 | ||||||
|
|
|
|
|
|||||
| Basic and diluted net income per limited partner unit |
$ | 1.48 | $ | 0.59 | ||||
|
|
|
|
|
|||||
The Partnership has omitted net income per unit data prior to October 9, 2013, as the Partnership operated under a different capital structure prior to the closing of the IPO; therefore, the per unit information is not meaningful to investors.
Note 13—Selected Quarterly Financial Data (Unaudited)
Selected unaudited condensed financial information for the fiscal years ended December 31, 2014 and 2013 is presented in the tables below.
| First Quarter |
Second Quarter |
Third Quarter |
Fourth Quarter |
|||||||||||||
| For the 2014 Fiscal Year |
||||||||||||||||
| Revenues |
99,579 | 113,447 | 90,471 | 99,283 | ||||||||||||
| Income from operations before interest expense, other income and income tax expense |
35,130 | 45,577 | 23,010 | 34,807 | ||||||||||||
| Income from operations before tax expense |
29,421 | 41,403 | 18,882 | 31,306 | ||||||||||||
| Net income |
29,007 | 40,926 | 18,599 | 30,916 | ||||||||||||
| First Quarter |
Second Quarter |
Third Quarter |
Fourth Quarter |
|||||||||||||
| For the 2013 Fiscal Year |
||||||||||||||||
| Revenues |
$ | 112,161 | $ | 106,901 | $ | 95,790 | $ | 113,112 | ||||||||
| Income from operations before interest expense, other income and income tax expense |
52,599 | 44,486 | 36,059 | 54,863 | ||||||||||||
| Income from operations before tax expense |
45,938 | 36,038 | 24,560 | 49,214 | ||||||||||||
| Net income |
45,464 | 35,538 | 24,132 | 49,217 | ||||||||||||
96
Table of Contents
Note 14—Distributions
The Partnership declared the following cash distributions to its unitholders of record for the periods presented:
| Period of Cash Distribution |
Distribution Per Common Unit(1) |
Total Cash Distribution |
Date of Record |
Date of Distribution |
||||||||||||
| First Quarter, ended March 31, 2013(2) |
N/A | N/A | N/A | N/A | ||||||||||||
| Second Quarter, ended June 30, 2013(2) |
N/A | N/A | N/A | N/A | ||||||||||||
| Third Quarter, ended September 30, 2013(2) |
N/A | N/A | N/A | N/A | ||||||||||||
| Fourth Quarter, ended December 31, 2013 (from October 9, 2013)(3) |
$ | 0.61367 | $ | 49,400 | March 31, 2014 | April 7, 2014 | ||||||||||
| First Quarter, ended March 31, 2014 |
$ | 0.41 | $ | 33,005 | May 22, 2014 | May 29, 2014 | ||||||||||
| Second Quarter, ended June 30, 2014 |
$ | 0.48 | $ | 38,640 | August 22, 2014 | August 28, 2014 | ||||||||||
| Third Quarter, ended September 30, 2014 |
$ | 0.26 | $ | 21,709 | November 21, 2014 | December 03, 2014 | ||||||||||
| Fourth Quarter, ended December 31, 2014 |
$ | 0.33 | $ | 27,553 | March 26, 2015 | April 10, 2015 | ||||||||||
| (1) | Cash distributions for a quarter are declared and paid in the following quarter. |
| (2) | Our common units did not commence trading on the NYSE until October 4, 2013, and consequently, no distributions were declared or paid for any periods prior to this date. |
| (3) | The distribution paid for the fourth quarter of 2013 represents our quarterly distribution prorated for the period beginning immediately after the date of the closing of our IPO, October 9, 2013, and ending on December 31, 2013. |
Note 15—Subsequent Events
On March 16, 2015, the board of directors of our general partner declared a cash distribution to our common unitholders for the period from October 1, 2014 through and including December 31, 2014 of $0.33 per unit, or approximately $27,553 in the aggregate. The cash distribution will be paid on April 10, 2015 to unitholders of record at the close of business on March 26, 2015.
Term Loan B Credit Facility
On March 12, 2015, OCIB, the Partnership and OCI USA entered into Amendment No. 4 (“Term Loan Amendment No. 4”) to the Term Loan B Credit Facility (such facility as previously supplemented by that certain credit agreement joinder, dated as of October 18, 2013, as previously amended by that certain Amendment No. 1 dated as of November 27, 2013, that certain Amendment No. 2 and Waiver dated as of April 4, 2014, that certain Amendment No. 3 dated as of June 13, 2014 and as amended by Term Loan Amendment No. 4, the “Amended Term Loan Facility”), with Bank of America, as administrative agent, and the other lenders party thereto to (i) increase the maximum consolidated senior secured net leverage ratio from 1.75 to 2.25 for the quarter ending March 31, 2015, (ii) increase the maximum consolidated senior secured net leverage ratio from 1.75 to 2.50 for the quarters ending June 30, 2015 and September 30, 2015, (iii) increase the maximum consolidated senior secured net leverage ratio from 1.75 to 2.25 for the quarter ending December 31, 2015, (iv) increase the interest rate margin on the outstanding term loans under the Amended Term Loan Facility such that OCIB may select an interest rate of (a) 4.50% above LIBOR for LIBO Rate Term Loans (as defined in the Amended Term Loan Facility) or (b) 3.25% above the Base Rate for Base Rate Term Loans (as each such term is defined in the Amended Term Loan Facility), (v) applied a prepayment premium (A) with respect to any voluntary prepayment of Term B-3 Loans (including in connection with the incurrence of refinancing indebtedness), of 3% of the principal amount of the Term B-3 Loans so prepaid on or prior to the first anniversary of the Amendment No. 4 Effective Date, stepping down to 2% after the first anniversary thereof but on or prior to the second anniversary thereof, and to par thereafter and (B) with respect to any amendment to the Amended Term Loan Facility resulting in a Repricing Transaction, of 3% of the principal amount of the Term B-3 Loans so repriced on or prior to the first anniversary of the Amendment No. 4 Effective Date, stepping down to 2% after the first anniversary thereof but on or prior to the second anniversary thereof and to 1% after the second anniversary thereof but on or prior to the third anniversary thereof and to par thereafter and (vi) make certain technical changes to certain defined terms.
97
Table of Contents
In conjunction with this transaction, we incurred a 0.75% consent fee of $2,963, a 0.25% arranger fee of $988, as well as $44 of other fees and expenses.
Revolving Credit Facility
On March 12, 2015, OCIB and the Partnership entered into Amendment No. 2 (“Revolving Credit Amendment No. 2”) to the Revolving Credit Facility (such facility as previously amended by that certain Amendment No. 1 dated as of June 13, 2014 and as amended by Revolving Credit Amendment No. 2, the “Amended Revolving Credit Facility”), with Bank of America, as administrative agent, and the other lenders party thereto to (i) increase the maximum consolidated senior secured net leverage ratio from 1.75 to 2.25 for the quarter ending March 31, 2015, (ii) increase the maximum consolidated senior secured net leverage ratio from 1.75 to 2.50 for the quarters ending June 30, 2015 and September 30, 2015, (iii) increase the maximum consolidated senior secured net leverage ratio from 1.75 to 2.25 for the quarter ending December 31, 2015, (iv) extend the maturity of the Amended Revolving Credit Facility until March 12, 2016, (v) suspended the requirement to repay in full all outstanding revolving loans under the Amended Revolving Credit Facility on the last business day of each June and December for the calendar year 2015 and (vii) made certain technical changes to certain defined terms.
In conjunction with this transaction, we incurred a 0.25% consent fee of $100 and $24 of other fees and expenses.
98
Table of Contents
| ITEM 9. | CHANGES IN AND DISAGREEMENTS WITH ACCOUNTANTS ON ACCOUNTING AND FINANCIAL DISCLOSURE |
None.
| ITEM 9A. | CONTROLS AND PROCEDURES |
Disclosure Controls and Procedures
An evaluation of the effectiveness of the design and operation of our disclosure controls and procedures (as defined in Rules 13a-15(e) and 15d-15(e) under the Exchange Act) was carried out under the supervision and with the participation of management, including the Chief Executive Officer and Chief Financial Officer of our general partner. Based upon that evaluation, the Chief Executive Officer and Chief Financial Officer of our general partner concluded that the design and operation of these disclosure controls and procedures were effective as of December 31, 2014, the end of the period covered by this Annual Report on Form 10-K.
Changes in Internal Control over Financial Reporting
As described below in the Information Technology General Controls section, there were changes in our internal control over financial reporting (as such term is defined in Rules 13a-15(f) and 15d-15(f) under the Exchange Act) during the fourth fiscal quarter of 2014 to remediate the previously reporting material weakness related to the design, implementation and effectiveness of our information technology general controls.
Management’s Annual Report on Internal Control over Financial Reporting
It is the responsibility of the management of OCI Partners LP to establish and maintain adequate internal control over financial reporting (as defined in Rules 13a—15(f) and 15d—15(f) under the Securities Exchange Act of 1934). Our internal controls over financial reporting are designed to provide reasonable assurance to our management and board of directors regarding the preparation and fair presentation of financial statements in accordance with accounting principles generally accepted in the United States. Our internal control over financial reporting includes those policies and procedures that (i) pertain to the maintenance of records that, in reasonable detail, accurately and fairly reflect the transactions and dispositions of our assets; (ii) provide reasonable assurance that transactions are recorded as to permit preparation of financial statements in accordance with generally accepted accounting principles, and that our receipts and expenditures are being made only in accordance with authorization of our management and board of directors; and (iii) provide reasonable assurance regarding prevention or timely detection of unauthorized acquisition, use or disposition of our assets that could have a material effect on our financial statements.
All internal control systems, no matter how well designed, have inherent limitations including the possibility of human error and the circumvention or overriding of controls. Therefore, even those systems determined to be effective can provide only reasonable assurance with respect to financial statement preparation and presentation.
Under the supervision and with the participation of our management, including the Chief Executive Officer and Chief Financial Officer, we assessed the effectiveness of our internal control over financial reporting as of December 31, 2014, based on the criteria set forth by the Committee of Sponsoring Organizations of the Treadway Commission (COSO) in 2013 Internal Control—Integrated Framework. Based on our assessment, we concluded that, as of December 31, 2014, our internal control over financial reporting was effective.
As an emerging growth company, management’s report on internal control over financial reporting was not subject to attestation by our independent registered public accounting firm in accordance with rules of the SEC that permit us to provide only the management’s report in this Form 10-K.
99
Table of Contents
We will remain an emerging growth company under the JOBS Act for up to five years after becoming a publicly traded partnership. After we are no longer an emerging growth company, we expect to incur additional expenses and devote substantial management effort toward ensuring compliance with those requirements applicable to companies that are not emerging growth companies, including Section 404 of the Sarbanes-Oxley Act. If we are unable to timely comply with Section 404 or if the costs related to compliance are significant, our results of operations and financial condition may be materially adversely affected. In order to comply with the requirements of Section 404 of Sarbanes-Oxley, we will need to implement new financial systems and procedures. We cannot assure you that we will be able to implement appropriate procedures on a timely basis. Failure to implement such procedures could have an adverse effect on our ability to satisfy applicable obligations under the Securities Exchange Act of 1934, as amended (the “Exchange Act”), and Sarbanes-Oxley. Since our inception, we have identified a number of material weaknesses in internal control over financial reporting, including the below, which was remediated in 2014:
Information Technology General Controls
During 2013, we identified a number of deficiencies related to the design, implementation and effectiveness of our information technology general controls that have a direct impact on our financial reporting. In response to those deficiencies, we implemented compensating manual controls, but were not able to test the design and operating effectiveness of the manual compensating controls prior to December 31, 2013. As such and because of the pervasive nature of information technology general control deficiencies, we concluded that those deficiencies, in the aggregate, resulted in a reasonable possibility that material misstatements in our interim or annual financial statements would not be prevented or detected on a timely basis and, as such, constitute a material weakness as of December 31, 2013. In particular, these deficiencies related to the configuration set-up of the information technology system and related financial applications, segregation of duties, user access and change management controls that are intended to ensure that access to financial applications and data is adequately restricted to appropriate personnel and that all changes affecting the financial applications and underlying account records are identified, tested and implemented appropriately. During 2014, we implemented internal controls that remediated the identified material weakness through written policies that addresses the needed improvements on change management, user access security and segregation of duties. Therefore, management believes that this material weakness has been remediated as of December 31, 2014.
| ITEM 9B. | OTHER INFORMATION |
Not Applicable.
100
Table of Contents
| ITEM 10. | DIRECTORS, EXECUTIVE OFFICERS AND CORPORATE GOVERNANCE |
Management of OCI Partners LP
We are managed by the directors and executive officers of our general partner, OCI GP LLC. OCI USA, an indirect, wholly-owned subsidiary of OCI, owns all of the membership interests in our general partner and has the right to appoint the entire board of directors of our general partner, including our independent directors. Our unitholders are not entitled to elect the directors of our general partner’s board of directors or to directly or indirectly participate in our management or operations. Our general partner will be liable, as general partner, for all of our debts (to the extent not paid from our assets), except for indebtedness or other obligations that are made specifically nonrecourse to it. Whenever possible, we intend to incur indebtedness that is nonrecourse to our general partner.
Our general partner currently has seven directors, including our three independent directors (Francis G. Meyer, Dod A. Fraser and Nathaniel A. Gregory). OCI USA will appoint all of the members to the board of directors of our general partner.
In evaluating director candidates, OCI USA will assess whether a candidate possesses the integrity, judgment, knowledge, experience, skill and expertise that are likely to enhance the ability of our board of directors to manage and direct our affairs and business, including, when applicable, to enhance the ability of committees of the board of directors of our general partner to fulfill their duties.
As a publicly traded partnership, we qualify for, and are relying on, certain exemptions from the NYSE’s corporate governance requirements, including:
| • | the requirement that a majority of the board of directors of our general partner consist of independent directors; |
| • | the requirement that the board of directors of our general partner have a nominating/corporate governance committee that is composed entirely of independent directors; and |
| • | the requirement that the board of directors of our general partner have a compensation committee that is composed entirely of independent directors. |
As a result of these exemptions, we do not expect that our general partner’s board of directors will be comprised of a majority of independent directors. Our board of directors does not currently intend to establish a nominating/corporate governance committee or a compensation committee. Accordingly, unitholders will not have the same protections afforded to equity holders of companies that are subject to all of the corporate governance requirements of the NYSE.
Committees of the Board of Directors
The board of directors of our general partner has an audit committee and a conflicts committee, and may have such other committees as the board of directors shall determine from time to time. Each of the standing committees of the board of directors will have the composition and responsibilities described below.
Audit Committee
We are required to have an audit committee of at least three members, and all of its members are required to meet the independence and experience standards established by the NYSE and the Exchange Act. The audit committee of the board of directors of our general partner assists the board of directors in its oversight of the integrity of our financial statements and our compliance with legal and regulatory requirements and partnership
101
Table of Contents
policies and controls. The audit committee has the sole authority to (1) retain and terminate our independent registered public accounting firm, (2) approve all auditing services and related fees and the terms thereof performed by our independent registered public accounting firm and (3) pre-approve any non-audit services and tax services to be rendered by our independent registered public accounting firm. The audit committee is also responsible for confirming the independence and objectivity of our independent registered public accounting firm. Our independent registered public accounting firm will be given unrestricted access to the audit committee and our management, as necessary. Messrs. Meyer, Fraser and Gregory currently serve on the audit committee. Mr. Meyer satisfies the definition of audit committee financial expert for purposes of the SEC’s rules.
Conflicts Committee
At least two members of the board of directors of our general partner will serve on our conflicts committee to review specific matters that may involve conflicts of interest in accordance with the terms of our partnership agreement. The board of directors of our general partner will determine whether to refer a matter to the conflicts committee on a case-by-case basis. The members of our conflicts committee may not be officers or employees of our general partner or directors, officers or employees of its affiliates (including OCI), and must meet the independence and experience standards established by the NYSE and the Exchange Act to serve on an audit committee of a board of directors. In addition, the members of our conflicts committee may not own any interest in our general partner or any interest in us or our subsidiaries other than common units or awards under our incentive compensation plan. Any matters approved by our conflicts committee in good faith will be deemed to be approved by all of our partners and not a breach by our general partner of any duties it may owe us or our unitholders. Messrs. Meyer, Fraser and Gregory currently serve on the conflicts committee. Mr. Meyer is the chairman of the conflicts committee.
Meetings and Other Information
During the year ended December 31, 2014 the board of directors of our general partner held eight meetings, our audit committee held seven meetings, and our conflicts committee held no meetings. None of the directors attended fewer than 75% of the aggregate number of meetings of the board of directors and committees of the board on which the director served.
Our committee charters and governance guidelines, including our Code of Business Conduct and Ethics and Corporate Governance Guidelines, are available on our website at http://www.ocipartnerslp.com. We intend to disclose any amendment to or waiver of our Code of Business Conduct and Ethics either on our website or by filing a Current Report on Form 8-K. Our website address referenced above is not intended to be an active hyperlink, and the contents of our website shall not be deemed to be incorporated herein.
Communication with Directors
Unitholders and other interested parties wishing to communicate with our Board may send a written communication addressed to:
OCI GP LLC
P.O. Box 1647
Nederland, TX 77627
Our Lead Director, Mr. Mike Bennett, is responsible for leading the meetings of the independent directors in executive session. Our Lead Director will forward all appropriate communications directly to our board of directors or any individual director or directors, depending upon the facts and circumstances outlined in the communication. Any unitholder or other interested party who is interested in contacting only the independent directors or non-management director as a group, may also send written communications to the contact above in an envelope marked “Confidential” addressed to the “Independent Members of the Board of Directors”.
102
Table of Contents
Section 16(a) Beneficial Ownership Reporting Compliance
Section 16(a) of the Exchange Act requires the executive officers and directors of our general partner, and persons who own more than ten percent of a registered class of our equity securities, or, collectively, the Insiders, to file initial reports of ownership and reports of changes in ownership with the SEC. Insiders are required by SEC regulations to furnish us with copies of all Section 16(a) forms they file. To our knowledge, based solely on our review of the copies of such reports furnished to us or written representations from certain Insiders, all such reports concerning beneficial ownership were filed in a timely manner by reporting persons during the year ended December 31, 2014, except that, due to an administrative oversight, a Form 4 required by Renso Zwiers in connection with a purchase on April 9, 2014 in the open market of 1,000 common units at $22.05 per unit was not timely filed. On February 6, 2015, a Form 5 was filed to report the purchase by Mr. Zwiers.
Report of the Audit Committee
The audit committee of our general partner oversees our financial reporting process on behalf of the board of directors. Management has the primary responsibility for the financial statements and the reporting process. In fulfilling its oversight responsibilities, the audit committee reviewed and discussed with management the audited financial statements contained in this report.
Our independent registered public accounting firm, KPMG LLP, is responsible for expressing an opinion on the conformity of the audited financial statements with accounting principles generally accepted in the United States of America. The audit committee reviewed with KPMG LLP their judgment as to the quality, not just the acceptability, of our accounting principles and such other matters as are required to be discussed with the audit committee under auditing standards of the Public Company Accounting Oversight Board (United States) (“PCAOB”).
The audit committee discussed with KPMG LLP the matters required to be discussed by PCAOB Auditing Standard No. 16. The committee received written disclosures and the letter from KPMG LLP required by PCAOB Rule 3526, Communication with Audit Committees Concerning Independence, as may be modified or supplemented, and has discussed with KPMG LLP its independence from management and the Partnership.
Based on the reviews and discussions referred to above, the audit committee recommended to the board of directors that the audited financial statements be included in this report for filing with the SEC.
Directors and Executive Officers of OCI GP LLC
Directors are appointed by OCI USA, the sole member of our general partner, and hold office until their successors have been appointed or qualified or until their earlier death, resignation, removal or disqualification. Executive officers are appointed by, and serve at the discretion of, the board of directors of our general partner. The following table shows information about the directors and executive officers of OCI GP LLC as of March 16, 2015.
| Name |
Age | Position with Our General Partner | ||||
| Michael L. Bennett |
61 | Chairman of the Board of Directors | ||||
| Frank Bakker |
49 | President, Chief Executive Officer and Director | ||||
| Nassef Sawiris |
54 | Director | ||||
| Renso Zwiers |
59 | Director | ||||
| Francis G. Meyer |
63 | Director | ||||
| Dod A. Fraser |
64 | Director | ||||
| Nathaniel A. Gregory |
66 | Director | ||||
| Fady Kiama |
47 | Vice President, Chief Financial Officer | ||||
103
Table of Contents
Michael L. Bennett—Chairman of the Board. Mr. Bennett was appointed chairman of the board of directors of our general partner in June 2013. Mr. Bennett has served as chairman of the board of directors of OCI since January 2013. Mr. Bennett served as chief executive officer and director of Terra Industries Inc., a publicly traded producer of nitrogen fertilizer, from 2001 until its acquisition by CF Industries Holdings, Inc. in 2010. From 2001 until 2010, Mr. Bennett served as chairman of the board and chief executive officer of Terra Nitrogen GP Inc., the general partner of Terra Nitrogen Company, L.P. (NYSE: TNH). Mr. Bennett is a past chairman of both The Fertilizer Institute and the Methanol Institute in the United States. Mr. Bennett currently serves as a director of Alliant Energy Corporation and Arclin, Inc., a privately held manufacturer of resins and surfaces, as well as chairman of the board at Morningside College in Sioux City, Iowa. We believe that Mr. Bennett’s knowledge of our industry, historical understanding of our operations and the significant executive leadership experience he gained through his employment with Terra Industries Inc. and Terra Nitrogen GP Inc. brings valuable experience, skill and leadership to the board of directors of our general partner.
Frank Bakker—President, Chief Executive Officer and Director. Mr. Bakker was appointed President, Chief Executive Officer and director of our general partner in June 2013. Prior to his appointment, Mr. Bakker served as vice president and general manager of OCIB from September 2011 to June 2013. Prior to joining OCIB, Mr. Bakker served as site manager at DSM-Neoresins from September 2010 to September 2011 and manufacturing director at DSM Sarlink from 2007 to 2010. Mr. Bakker holds an M.B.A. from the University of Massachusetts at Amherst and a M.S. in mechanical engineering from Twente University. We believe that Mr. Bakker’s extensive manufacturing experience in the chemicals industry and, in particular, his leadership experience in operating our facility brings unique operational and technical experience and skill to the board of directors of our general partner.
Nassef Sawiris—Director. Mr. Sawiris was appointed as a member of the board of directors of our general partner in June 2013. Mr. Sawiris has served as chief executive officer and director of OCI since January 2013. Mr. Sawiris has also served as chief executive officer and director of Orascom Construction Industries S.A.E. (“OCI SAE”), a publicly traded Egyptian company, since its incorporation in 1998. Prior to the incorporation of OCI SAE, Mr. Sawiris oversaw the construction activities of Orascom (Onsi Sawiris & Co.). Since 2008, Mr. Sawiris has served as a director of Lafarge S.A., a publicly traded French building materials company. Mr. Sawiris holds a B.A. in economics from the University of Chicago. We believe that Mr. Sawiris’ extensive experience in the fertilizer and construction industries and his position as chief executive officer and director of OCI brings significant strategic and operational experience to the board of directors of our general partner.
Renso Zwiers—Director. Mr. Zwiers was appointed as a member of the board of directors of our general partner in June 2013. Mr. Zwiers has served as chief operating officer of OCI’s Fertilizer Group since March 2011. Mr. Zwiers has served as chief executive officer of OCI Nitrogen, a Netherlands-based fertilizer producer, since its acquisition from DSM in May 2010 from May 2010 to October 2014. Mr. Zwiers was the president of DSM Agro from April 2003 to May 2010, the Chief Executive Officer (“CEO”) of DEXPlastomers v.o.f. (a joint venture of DSM and ExxonMobil Chemical) from May 2001 to March 2003 and the CEO of Methanor v.o.f. (a joint venture of AkzoNobel, DSM and Dynea) from May 1999 to April 2001. Mr. Zwiers holds a Bachelor degree in Chemistry and an M.S. in Polymer Chemistry from the University of Groningen. We believe that Mr. Zwiers’ extensive experience in the fertilizer industry, including his position as chief operating officer of OCI’s Fertilizer Group, brings valuable financial experience and skill to the board of directors of our general partner.
Francis G. Meyer—Director. Mr. Meyer was appointed as a member of the board of directors of our general partner in September 2013. Mr. Meyer served as executive vice president of Terra Industries Inc. from 2007 until his retirement in April 2008 and as senior vice president and chief financial officer from 1995 until 2007. Mr. Meyer served as a director of Terra Nitrogen GP Inc., which is the general partner of Terra Nitrogen Company, L.P. from 1995 until 2008. Mr. Meyer served in various management positions for Terra Industries Inc. from 1986 to 1995. Mr. Meyer has a B.B.A. in accounting from the University of Iowa. We believe that Mr. Meyer’s extensive industry experience and knowledge of industry accounting and financial practices he
104
Table of Contents
gained during his employment with Terra Industries Inc. and Terra Nitrogen GP Inc. brings important financial leadership, experience and skill to the board of directors of our general partner.
Dod A. Fraser—Director. Mr. Fraser was appointed as a member of the board of directors of our general partner in November 2013. Mr. Fraser has served as President of Sackett Partners Inc. since its formation in 2000 upon retiring from a 27-year career in Investment Banking. Mr. Fraser served as Managing Director and Group Executive of the Global Oil and Gas Group of Chase Securities Inc., a subsidiary of The Chase Manhattan Bank (now JP Morgan Chase & Co.) from August 1995 until his retirement in January 2000. Mr. Fraser served as General Partner of Lazard Freres & Co. until 1995. Mr. Fraser served in various positions for Lazard Freres & Co. from 1978 to 1995. Mr. Fraser has been a Director of Subsea 7 SA since December 2009 and Rayonier Inc. since July 2014. Mr. Fraser served as a Director of Smith International Inc. from December 2004 to August 2010, of Terra Industries Inc. from 2003 to April 2010, and of Forest Oil Corporation from May 2000 to January 2015. Mr. Fraser holds a bachelor of arts degree from Princeton University. We believe that Mr. Fraser’s extensive experience and knowledge of accounting and financial practices brings significant financial experience and skill to the board of directors of our general partner.
Nathaniel A. Gregory—Director. Nathaniel A. Gregory was appointed as a member of the board of directors of our general partner in March 2014. He is currently a Senior Lecturer in Finance at the MIT Sloan School of Management, where he teaches courses in Mergers & Acquisitions and Advanced Corporate Finance. Prior to Sloan, he was at the University of Chicago Booth Graduate School of Business, where he taught courses in corporate finance and corporate control & governance. He had been on the faculty at Chicago Booth since 2009 and had taught there on a full-time basis since 2005 and was Clinical Professor of Finance from 2009 to 2013. Between 1993 and 2004, Mr. Gregory was Chairman of the Board and Chief Executive Officer of NATCO Group, Inc., a publicly traded oilfield equipment and services company. Prior to his service at NATCO, he held a number of different positions in business and finance, including as Chief Economist and vice president of financial services at Bechtel Group from 1980 to 1983, and as a banker at Lazard Freres & Co. from 1983 to 1986 and general partner of the firm from 1987 through 1989. He was also a member of the private equity firm, Capricorn Partners LLC, from 1995 to 2009. Mr. Gregory has served on several private and public boards of directors, including most recently the board of Rotech Healthcare Inc. from 2012 to 2013, and Plainfield Direct, Inc. from 2007 to 2011. Mr. Gregory holds a Bachelor of Arts degree from the University of North Carolina at Chapel Hill, and a Doctorate of Economics from the University of Chicago. The Board believes that Mr. Gregory’s expertise in finance and extensive knowledge and experience in corporate strategy, management and governance will bring considerable value to the deliberations of the Board.
Fady Kiama—Vice President and Chief Financial Officer. Mr. Kiama was appointed vice president and chief financial officer of our general partner in June 2013. Mr. Kiama has more than 22 years of financial management experience and has served as corporate planning director and group controller of OCI SAE from 2001 until May 2013. Mr. Kiama served as chief financial officer of Misr Gulf Oil Processing Co. in Egypt from 1999 to 2001, Planning Director for PepsiCo Foods Egypt from 1997 to 1999, Chief Financial Officer for PepsiCo Foods Saudi Arabia from 1995 to 1997 and as a financial analyst and group finance manager for Procter & Gamble Egypt from 1990 to 1995. Mr. Kiama holds a B.A. and a M. A. in economics from the American University in Cairo.
| ITEM 11. | EXECUTIVE COMPENSATION |
OCI GP LLC, our general partner, manages our operations and activities on our behalf through its officers and directors and is solely responsible for providing the employees and other personnel necessary for us to conduct our operations. Although all of the employees that conduct our business are employed by our general partner, its affiliates and certain of our subsidiaries, we sometimes refer to these individuals as our officers and
105
Table of Contents
employees for ease of reference. This executive compensation disclosure provides an overview of our executive compensation program offered to our two named executive officers (“NEOs”), who are:
| • | Frank Bakker, our President and Chief Executive Officer; and |
| • | Fady Kiama, our Vice President and Chief Financial Officer. |
The compensation-related sections of this document are intended to comply with the reduced disclosure requirements provided under the JOBS Act.
Summary Compensation Table for 2014 and 2013
The following table summarizes the total compensation paid to our NEOs for their services to us in 2014 and 2013. For Mr. Bakker this represents compensation paid in his role as President and Chief Executive Officer of our general partner, a position to which he was appointed in June of 2013. Mr. Bakker devotes 100% of his working time to our business. Total compensation for Mr. Kiama represents compensation paid in his role as Vice President and Chief Financial Officer of our general partner, a position to which he was appointed in June of 2013. Mr. Kiama devotes approximately 75% of his working time to our business. The remainder of Mr. Kiama’s time is allocated to certain responsibilities for OCI and its other subsidiaries. Accordingly, the amounts shown below reflect only that portion of Mr. Kiama’s compensation that is allocated to us. Certain amounts provided to Mr. Bakker were paid in Euros. Amounts shown below have been converted to U.S. Dollars based on the average daily exchange rate during 2014.
| Name and Principal Position |
Year | Salary(1) ($) |
Non-Equity Incentive Plan Compensation(2) ($) |
All Other Compensation(3) ($) |
Total ($) |
|||||||||||||||
| Frank Bakker |
2014 | 279,103 | — | 255,511 | 534,614 | |||||||||||||||
| President and Chief Executive Officer |
2013 | 198,759 | 300,000 | 240,146 | 738,905 | |||||||||||||||
| Fady Kiama* |
2014 | 282,907 | 169,047 | 118,311 | 570,265 | |||||||||||||||
| Vice President and Chief Financial Officer |
2013 | 172,240 | 71,628 | 29,858 | 273,726 | |||||||||||||||
| * | Amount shown for Mr. Kiama for 2013 reflects amounts paid for services provided to us beginning in June 2013. |
| (1) | Amount shown represents base salary amounts actually paid to our NEOs for service to our general partner. |
| (2) | Amount shown for 2014 represents the annual cash incentive award for 2014. For Mr. Bakker, the award amount had not yet been determined as of the date of this report. Mr. Bakker’s annual cash incentive award for 2014 is expected to be determined on or around April 2015 and will be reported at such time as required by the SEC rules. |
| (3) | Amount shown includes the components set forth in the table below. |
| Name and Principal Position |
Year | Housing Allowance ($) |
Dependent Tuition Assistance ($) |
International Assignment Allowance ($) |
Representation Fee ($) |
Automobile Provision(1) ($) |
Professional Services ($) |
Home Leave Expenses ($) |
Pension Contribution(2) ($) |
All Other Compensation(3) ($) |
||||||||||||||||||||||||||||||
| Frank Bakker |
2014 | 51,275 | 17,185 | 38,522 | 1,929 | 19,323 | 2,026 | 35,880 | 89,371 | 255,511 | ||||||||||||||||||||||||||||||
| President and Chief Executive Officer |
2013 | 56,394 | 17,975 | 37,102 | 2,004 | 21,178 | 20,714 | 84,779 | 240,146 | |||||||||||||||||||||||||||||||
| Fady Kiama* |
2014 | 30,000 | 41,012 | — | — | 27,664 | 12,395 | 7,240 | — | 118,311 | ||||||||||||||||||||||||||||||
| Vice President and Chief Financial Officer |
2013 | 16,250 | — | — | — | 11,359 | 2,249 | — | — | 29,858 | ||||||||||||||||||||||||||||||
| (1) | For Mr. Bakker, amount shown represents the value of a company-provided vehicle used for personal purposes. For Mr. Kiama, amount shown represents the value of leased car expenses. |
| (2) | Amount shown represents an employer pension contribution of $64,854 and Mr. Bakker’s personal pension contribution of $24,517 in 2014. The pension contribution and social security premium are paid to entities within the Netherlands and, therefore, are treated as wages under the current United States tax treaty. |
106
Table of Contents
| (3) | Amount shown represents benefits provided in conjunction with our NEOs’ international assignment to the United States, which also includes tax make-whole payments provided to our NEOs. For Messrs. Bakker and Kiama, the estimated tax make-whole payments in 2014 were $63,878 and $37,944, respectively. |
Narrative Disclosure to Summary Compensation Table
The primary elements of compensation for our NEOs are base salary, an annual cash incentive award, and certain additional benefits as described below. Since our NEOs, who have historically been employed by OCI, provide services to us pursuant to an international assignment to the United States, their compensation packages include components related to their international assignment in accordance with OCI’s policies for expatriate employees. In the future, different and/or additional compensation components, benefits and/or perquisites may be provided to our NEOs to ensure a balanced, comprehensive and competitive compensation structure.
Base Salary. Base salaries were initially set by OCI at levels deemed necessary to attract and retain individuals with superior talent and which were consistent with competitive pay practices. Salaries may be adjusted from time to time to reflect changes in responsibility, company performance, cost of living or such other factors as our general partner may consider.
Pursuant to a tax equalization arrangement in connection with Mr. Bakker’s international assignment to the United States, Mr. Bakker’s base salary was initially determined with reference to a nominal base salary amount of $300,000. To calculate the actual base salary paid to Mr. Bakker, the nominal amount is reduced by a hypothetical tax amount based on tax rates in the Netherlands, Mr. Bakker’s home jurisdiction. Mr. Bakker’s actual base salary is then set at an amount that achieves the same net “after-tax” pay he would receive were he employed in the Netherlands.
Annual Cash Incentive Awards. In 2014, Mr. Bakker and Mr. Kiama were eligible for an annual cash incentive award with a target value of $300,000 for Mr. Bakker and 25% of base salary for Mr. Kiama. For Mr. Bakker, award amounts are determined by comparing our attainment of production volume targets with our initial budget for the year and taking into account such other factors as determined by OCI to be appropriate. As of the date of this report, the 2014 annual cash incentive award for Bakker had not yet been determined. Mr. Bakker’s annual cash incentive award for 2014 is expected to be determined on or around April 2015.
For Mr. Kiama, award amounts are generally determined on a discretionary basis with reference to levels of achievement of certain financial performance metrics as well as individual and team based objectives, which include certain strategic imperatives, and financial results. For 2014, these objectives included maintaining compliance with securities law requirements, attaining financial goals generally related to EBITDA and distribution targets and increasing organizational capacity and efficiency.
Retirement, Health, Welfare and Additional Benefits. Employee benefit plans and programs are offered to our employees, subject to the terms and eligibility requirements of those plans, as in effect from time to time. Our NEOs are also eligible to participate in these programs to the same extent as all employees generally. However, due to their international assignment to the United States, our NEOs did not participate in our tax-qualified 401(k) defined contribution plan in 2014. Mr. Bakker is eligible to participate in a pension scheme maintained for OCI executives in the Netherlands, pursuant to which a company contribution equal to approximately 20% of Mr. Bakker’s nominal base salary is made each year.
In connection with their international assignment to the United States, Mr. Bakker and Mr. Kiama also receive certain benefits under OCI’s international relocation policy. For 2014, these benefits included housing assistance, dependent tuition assistance, international assignment allowance, representation fee (incidentals), automobile provisions, home leave expenses and healthcare benefits. The amounts of these benefits are included in the Summary Compensation Table above, under the column labeled “All Other Compensation.” Mr. Bakker and Mr. Kiama also receive certain tax make-whole payments in relation to these benefits in accordance with OCI’s policies.
107
Table of Contents
Outstanding Equity Awards at December 31, 2014
Our NEOs have not previously received any awards or grants of equity or equity-based compensation in us or in relation to their services for us or our general partner, and our NEOs do not hold any outstanding equity or equity-based awards.
Employment, Severance and Change in Control Arrangements
Our NEOs are generally subject to the same employment conditions and policies as other employees of our organization. In addition, our NEOs do not have any agreements with us that provide for severance payments upon termination of employment or in connection with a change in control. However, our NEOs have entered into agreements with OCI pursuant to which they would be entitled to certain payments from OCI in the event their employment is terminated. For Mr. Bakker, in the event his employment is terminated by OCI other than for fraud, misconduct or similar offenses, Mr. Bakker would be entitled to receive a severance payment from OCI equal to two times his gross annual salary. For Mr. Kiama, in the event his employment is terminated by OCI, Mr. Kiama would be entitled to receive an end of service compensation payment from OCI equal to two months’ salary for each year of service with OCI that was completed prior to the termination (currently this amount equals approximately 2 years of salary).
Compensation of Our Directors
The officers or employees of our general partner or of OCI or its affiliates who also serve as directors of our general partner do not receive additional compensation for their service as a director of our general partner. Our general partner has approved a director compensation program pursuant to which directors of our general partner who are not officers or employees of our general partner or of OCI or its affiliates receive compensation as “non-employee directors,” which consists of an annual cash retainer of $150,000. We paid retainers of $150,000 for the year ended December 31, 2014 to our non-employee directors in two installments of $75,000 each, which were paid in April and July of 2014.
DIRECTOR COMPENSATION
| Name |
Fees Earned or Paid in Cash | |||
| Michael L. Bennett |
$ | 150,000 | ||
| Francis G. Meyer |
$ | 150,000 | ||
| Dod A. Fraser |
$ | 150,000 | ||
| Nathaniel A. Gregory* |
$ | 118,923 | ||
| * | Amount shown for Mr. Gregory reflects amounts paid for services provided to us beginning in March 2014. |
None of our non-employee directors held any outstanding equity or equity-based awards in us as of December 31, 2014.
| ITEM 12. | SECURITY OWNERSHIP OF CERTAIN BENEFICIAL OWNERS AND MANAGEMENT AND RELATED UNITHOLDER MATTERS |
The following table presents information regarding beneficial ownership of our common units as of March 16, 2014 by:
| • | our general partner; |
| • | each of our general partner’s directors; |
| • | each of our general partner’s named executive officers; |
108
Table of Contents
| • | each unitholder known by us to beneficially hold five percent or more of our outstanding common units; and |
| • | all of our general partner’s executive officers and directors as a group. |
Beneficial ownership is determined under the rules of the SEC and generally includes voting or investment power with respect to securities. Unless indicated below, to our knowledge, the persons and entities named in the table have sole voting and sole investment power with respect to all common units beneficially owned by them, subject to community property laws where applicable. Except as otherwise indicated, the business address for each of our beneficial owners is c/o OCI Partners LP, 5470 N. Twin City Highway, Nederland, Texas 77627.
| Name and Address of Beneficial Owner |
Amount of Common Units Beneficially Owned |
Percentage of Total Common Units Beneficially Owned(1) |
||||||
| OCI GP LLC(2) |
— | — | ||||||
| OCIP Holding LLC(3) |
65,995,372 | 79.04 | % | |||||
| Michael L. Bennett |
15,000 | * | ||||||
| Frank Bakker |
5,200 | * | ||||||
| Nassef Sawiris |
288,976 | * | ||||||
| Renso Zwiers |
1,000 | * | ||||||
| Francis G. Meyer |
— | — | ||||||
| Dod A. Fraser |
1,000 | * | ||||||
| Nathaniel A. Gregory |
5,000 | — | ||||||
| Fady Kiama |
— | — | ||||||
| All directors and executive officers of our general partner as a group (eight persons) |
316,176 | * | ||||||
| * | Less than 1%. |
| (1) | Based on 83,495,372 common units outstanding as of March 16, 2015. |
| (2) | OCI GP LLC, is a wholly-owned subsidiary of OCI USA, is our general partner and manages and operates our business and has a non-economic general partner interest in us. |
| (3) | OCIP Holding LLC, is an indirect, wholly-owned subsidiary of OCI USA, which is an indirect, wholly-owned subsidiary of OCI. |
The following table sets forth, as of March 16, 2015, the number of ordinary shares of OCI owned by each of the named executive officers and directors of our general partner and all executive officers and directors of our general partner as a group. The percentage of total ordinary shares is based on 210,113,854 ordinary shares outstanding as of March 16, 2015.
Beneficial ownership is determined under the rules of the SEC and generally includes voting or investment power with respect to securities. Unless indicated below, to our knowledge, the persons and entities named in the table have sole voting and sole investment power with respect to all shares of common stock beneficially owned
109
Table of Contents
by them, subject to community property laws where applicable. Except as otherwise indicated, the business address for each of the following persons is c/o OCI USA Inc., 660 Madison Avenue, 19th Floor, New York, New York 10065.
| Name and Address of Beneficial Owner |
Number of Ordinary Shares Beneficially Owned |
Percentage of Total Ordinary Shares (1) |
||||||
| Michael L. Bennett |
— | — | ||||||
| Frank Bakker |
— | — | ||||||
| Nassef Sawiris |
61,846,099 | 29.43 | % | |||||
| Renso Zwiers |
2,550 | * | ||||||
| Francis G. Meyer |
— | — | ||||||
| Dod A. Fraser |
— | — | ||||||
| Nathaniel A. Gregory |
— | — | ||||||
| Fady Kiama |
— | — | ||||||
| All directors and executive officers of our general partner as a group (eight persons) |
61,848,649 | 29.44 | % | |||||
| * | Less than 1% |
| (1) | Based on 210,113,854 common shares outstanding as of March 16, 2015. |
Securities Authorized for Issuance under Equity Compensation Plans
The following table provides information as of December 31, 2014 with respect to common units that may be issued under our LTIP:
| Plan category |
Number of securities to be issued upon exercise of outstanding options, warrants and rights |
Weighted-average exercise price of outstanding options, warrants and rights |
Number of securities remaining available for future issuance under equity compensation plans(1) |
|||||||||
| Equity compensation plans approved by security holders |
— | — | 8,050,000 | |||||||||
| Equity compensation plans not approved by security holders |
— | — | — | |||||||||
|
|
|
|
|
|
|
|||||||
| Total |
— | — | 8,050,000 | |||||||||
|
|
|
|
|
|
|
|||||||
| (1) | Reflects the common units available for issuance pursuant to our LTIP. |
110
Table of Contents
| ITEM 13. | CERTAIN RELATIONSHIPS AND RELATED TRANSACTIONS, AND DIRECTOR INDEPENDENCE |
For a discussion of director independence, see Item 10—“Directors, Executive Officers and Corporate Governance.”
OCIP Holding, an indirect, wholly-owned subsidiary of OCI, owns (i) 65,995,372 common units, representing approximately 79.04% of our outstanding common units and (ii) all of the member interests in our general partner, which owns a non-economic general partner interest in us.
Distributions and Payments to OCI and Its Affiliates
The following summarizes the distributions and payments made or to be made by us to OCI and its affiliates (including our general partner) in connection with the formation, ongoing operation and any liquidation of us. These distributions and payments were or will be determined by and among affiliated entities and, consequently, are not the result of arm’s-length negotiations.
| Formation Stage | ||
| The consideration received by OCI and its affiliates for our formation | • a non-economic general partner interest; and • 100% of our limited partner interests | |
| IPO Stage | ||
| The consideration received by OCI and its affiliates for the contribution of OCIB to us | • 63,000,000 common units; and • approximately $56.7 million in cash and approximately $27.6 million in trade accounts receivable and $8.1 million in advances to related parties. | |
| Post-IPO Operational Stage | ||
| Distributions to OCI and its affiliates | • We will generally make cash distributions to our unitholders pro rata, including to OCIP Holding as a holder of common units. OCIP Holding owns 65,995,372 common units, representing approximately 79.04 % of our outstanding common units and will receive a pro rata percentage of the cash available for distribution that we distribute in respect thereof. | |
| Payments to our general partner and its affiliates | • We will reimburse our general partner and its affiliates for all expenses incurred on our behalf. | |
| Liquidation Stage | ||
| Liquidation | • Upon our liquidation, our unitholders will be entitled to receive liquidating distributions according to their respective capital account balances. | |
Our Agreements with OCI
In connection with the completion of the IPO, we, our general partner and OCI entered into the following agreements that govern the business relations among us, our general partner and OCI. These agreements were not the result of arm’s-length negotiations and the terms of these agreements are not necessarily at least as favorable to each party to these agreements as terms which could have been obtained from unaffiliated third parties.
111
Table of Contents
Omnibus Agreement
On October 9, 2013, in connection with the closing of the IPO, we entered into an omnibus agreement (the “Omnibus Agreement”) by and between us, OCI, OCI USA, our general partner, and OCIB. The Omnibus Agreement addresses certain aspects of our relationship with OCI and OCI USA, including: (i) certain indemnification obligations, (ii) the provision by OCI USA to us of certain services, including selling, general and administrative services and management and operating services relating to operating our business, (iii) our use of the name “OCI” and related marks and (iv) the allocation among us and OCI USA of certain tax attributes.
Under the Omnibus Agreement, OCI USA will indemnify us for certain environmental losses suffered or incurred by us, directly or indirectly, by reason of or arising out of (i) any violation of environmental laws, (ii) any environmental event, condition or matter associated with or arising from the ownership or operation of the assets contributed to us and (iii) any environmental event, condition or matter associated with or arising from the assets retained by OCI USA, whether occurring before, on or after the closing of the IPO and whether occurring under environmental laws as in effect prior to, at or after the closing of the IPO. With respect to clause (i) or clause (ii) of the preceding sentence, OCI USA will be obligated to indemnify us only to the extent that such violation or environmental event, condition or matter was caused by the consummation of the transactions contemplated by the Contribution Agreement or commenced, occurred or existed before the closing of the IPO under environmental laws as in effect prior to the closing of the IPO. OCI USA’s indemnification obligations for covered environmental losses will be subject to a deductible of $250,000 per claim before we are entitled to indemnification. There is no limit on the amount for which OCI USA will indemnify us under the Omnibus Agreement once we meets the deductible, if applicable.
OCI USA will also indemnify us from and against any losses suffered or incurred by us by reason of or arising out of:
| • | our transfer of employees to OCI USA or to our general partner prior to the closing of the IPO; |
| • | the failure of us to be the owner of valid and indefeasible easement rights or fee ownership or leasehold interests in and to the lands on which the contributed assets are located, (ii) the failure of us to have the consents, licenses and permits necessary to allow any pipeline included in the contributed assets to cross roads, waterways, railroads or other areas or the transfer of any of the contributed assets to us and (iii) the cost of curing the conditions set forth in clause (i) or clause (ii), in each case to the extent asserted prior to the third anniversary of the closing of the IPO; |
| • | the consummation of the transactions contemplated by the Contribution Agreement or events and conditions associated with the ownership or operation of the contributed assets and occurring before the closing of the IPO (other than covered environmental losses); |
| • | events and conditions associated with any assets retained by OCI USA; |
| • | federal, state and local tax liabilities attributable to the ownership or operation of the contributed assets on or prior to the closing of the IPO; and |
| • | the failure of us to have on the closing date of the IPO any consent, license, permit or approval necessary to allow us to own or operate the contributed assets in substantially the same manner that the contributed assets were owned or operated immediately prior to the closing date of the IPO. |
We will indemnify OCI USA for events and conditions associated with the ownership or operation of the contributed assets that occur after the closing of the IPO and for environmental liabilities related to the contributed assets to the extent OCI USA is not required to indemnify us as described above. There is no limit on the amount for which we will indemnify OCI USA under the Omnibus Agreement.
In addition, under the Omnibus Agreement, OCI USA will provide, or cause one or more of its affiliates to provide, us with such selling, general and administrative services and management and operating services as may
112
Table of Contents
be necessary to manage and operate our business and affairs. Pursuant to the Omnibus Agreement, we will reimburse OCI USA for all reasonable direct or indirect costs and expenses incurred by OCI USA or its affiliates in connection with the provision of such services, including the compensation and employee benefits of employees of OCI USA or its affiliates.
Subject to the terms and conditions of the Omnibus Agreement, OCI granted and conveyed to us a nontransferable, nonexclusive, royalty-free right and license to use the “OCI” logo and trademark and all other trademarks and tradenames owned by OCI.
We will also reimburse OCI USA for our share of state and local income or other taxes borne by OCI USA as a result of our income being included in a combined or consolidated state or local tax return filed by OCI USA with respect to taxable periods including or beginning on the closing date of the IPO.
The Omnibus Agreement, other than the indemnification provisions set forth therein, may be terminated (i) by the written agreement of all of the parties thereto or (ii) by OCI or us immediately upon a “Partnership Change of Control” (as defined in the Omnibus Agreement) by written notice given to the other parties to the Omnibus Agreement.
Intercompany Revolving Facility
On August 20, 2013, OCIB entered into a $40.0 million intercompany revolving credit facility with OCI Fertilizer, as the lender, which will mature on January 20, 2020. For a description of the intercompany revolving credit facility, please read “Management’s Discussion and Analysis of Financial Condition and Results of Operations—Liquidity and Capital Resources—Credit Facilities—Intercompany Revolving Facility.”
Intercompany Term Facility
On September 15, 2013, OCIB entered into an intercompany term facility agreement with OCI Fertilizer, as lender. For a description of the intercompany term credit facility, please read “Management’s Discussion and Analysis of Financial Condition and Results of Operations—Liquidity and Capital Resources—Credit Facilities—Intercompany Term Facility.”
Construction Agreement with Orascom E&C USA Inc.
In March 2013, OCIB entered into a technical service agreement with OCI Construction Limited (“OCICL”), an indirect, wholly-owned construction subsidiary of OCI, for OCICL’s provision of management and construction services relating to the debottlenecking of OCIB’s methanol and ammonia production units (the “Technical Service Agreement”). OCIB incurred $0 and $1.5 million during the years ended December 31, 2014 and 2013, respectively, of OCICL fees for the provision of management and construction services. All amounts incurred under this contact were capitalized into construction in progress, which is a component of property plant and equipment shown in the consolidated balance sheet. Accounts Payable—related party include amounts incurred but unpaid to OCICL of $0 and $375,000 as of December 31, 2014 and December 31, 2013, respectively.
In June 2013, OCIB entered into a procurement and construction contract with Orascom E&C USA Inc., an indirect, wholly-owned construction subsidiary of OCI, pursuant to which Orascom E&C USA Inc. will undertake the debottlenecking of OCIB’s methanol and ammonia production units (the “Construction Contract”). Upon execution of the Construction Contract, the Technical Service Agreement was subsumed within the Construction Contract. Under the terms of the Construction Contract, Orascom E&C USA Inc. will be paid on a cost-reimbursable basis, plus a fixed fee that will equal 9% of the costs of the project, excluding any discounts. The contract allocates customary responsibilities to OCIB and Orascom E&C USA Inc. The agreement does not provide for the imposition of liquidated or consequential damages. Costs (including the fixed fee) were incurred
113
Table of Contents
under the Construction Contract in the amount of $101.5 million and $32.6 million during the years ended December 31, 2014 and 2013, respectively. All amounts incurred under this contact have been capitalized into construction in progress, which is a component of property plant and equipment shown in the consolidated balance sheet. Accounts Payable—related party include amounts incurred but unpaid to Orascom E&C USA Inc. of $25.8 million and $85,000 as of December 31, 2014 and December 31, 2013, respectively.
Contribution Agreement
On October 9, 2013, in connection with the closing of the IPO, we entered into a contribution, conveyance and assumption agreement (the “Contribution Agreement”) with our general partner, OCI USA and OCIB. Immediately prior to the closing of the IPO, OCI USA contributed to us its right, title and interest in and to all of the limited liability company interests in OCIB in exchange for 60,375,000 common units. These transactions, among others, were made in a series of steps outlined in the Contribution Agreement. On November 4, 2013, after the expiration of the underwriters’ over-allotment option period, pursuant to the IPO underwriting agreement and the Contribution Agreement, we issued 2,625,000 additional common units that were subject to the underwriters’ over-allotment option to OCI USA for no additional consideration as part of OCI USA’s contribution of its membership interests in OCIB to us.
Other Transactions with Related Parties
Guarantee of Term Loan B Credit Facility
The term loans under the Term Loan B Credit Facility, and related fees and expenses, are unconditionally guaranteed by OCIP and OCI USA and are secured by a first priority lien on substantially all of OCIB’s assets and a pledge by OCIP of its ownership interest in OCIB (OCI USA does not provide any security in connection with its guarantee). Please read “Management’s Discussion and Analysis of Financial Condition and Results of Operations—Liquidity and Capital Resources—Credit Facilities—Term Loan B Credit Facility.”
Intercompany Equity Commitment
On November 27, 2013, the Partnership entered into a new intercompany equity commitment agreement with OCI USA (the “Intercompany Equity Commitment”). Under the terms of the Intercompany Equity Commitment, OCI USA shall make an equity contribution not to exceed $100.0 million to the Partnership if (a) prior to the completion of the debottlenecking project, the Partnership or OCIB have liquidity needs for working capital or other needs and the restrictions under the Term Loan B Credit Facility or any other debt instrument prohibit the Partnership or OCIB from incurring sufficient additional debt to fund such liquidity needs; or (b) OCIB fails to comply with any of the financial covenants as of the last day of any fiscal quarter.
On November 10, 2014, pursuant to the Intercompany Equity Commitment, the Partnership received a capital contribution of $60.0 million from OCIP Holding, to help finance the funding required to complete the debottlenecking project, and, in exchange, the Partnership issued 2,995,372 common units to OCIP Holding. The common units were issued pursuant to a contribution agreement, dated November 10, 2014, by and among the Partnership, OCIP Holding and OCI USA, at a price per common unit equal to $20.0309 (the volume-weighted average trading price of a common unit on the NYSE, calculated over the consecutive 20-trading day period ending on the close of trading on the trading day immediately prior to the issue date). Immediately following the issuance of common units to OCIP Holding on November 10, 2014, OCIP Holding held 65,995,372 common units in the Partnership, representing a 79.04% limited partner interest.
Standby Letter of Credit
On August 28, 2012, OCIB obtained a standby letter of credit (the “Letter of Credit”) from Citibank, N.A., in the amount of $282,000 in support of OCI USA’s office lease obligations. On August 10, 2014 OCIB assigned all duties, liabilities and obligations under the Letter of Credit to OCI USA, and in return, OCI USA remitted $282,000 to OCIB.
114
Table of Contents
Management Support Fees
During the year ended December 31, 2012 and the period from January 1, 2013 through October 8, 2013, OCIB incurred approximately $4.0 million and $6.3 million, respectively, in management support fees for OCI Egypt’s provision of certain services in connection with managing and operating OCIB’s business. Our obligation to pay management support fees was terminated after the completion of the IPO.
Procedures for Review, Approval and Ratification of Related Person Transactions
The board of directors of our general partner adopted a code of business conduct and ethics in connection with the completion of the IPO that provides that the board of directors of our general partner or an authorized committee of the board of directors periodically will review all transactions with a related person that are required to be disclosed under SEC rules and, when appropriate, initially authorize or ratify all such transactions. In the event that the board of directors of our general partner or the authorized committee considers ratification of a related person transaction and determines not to so ratify such transaction, our code of business conduct and ethics requires that the officers of our general partner make all reasonable efforts to cancel or annul the transaction.
The code of business conduct and ethics provides that, in determining whether or not to recommend the initial approval or ratification of a transaction with a related person, the board of directors of our general partner or the authorized committee should consider all of the relevant facts and circumstances available, including (if applicable) but not limited to: (i) whether there is an appropriate business justification for the transaction; (ii) the benefits that accrue to our partnership as a result of the transaction; (iii) the terms available to unrelated third parties entering into similar transactions; (iv) the impact of the transaction on a director’s independence (in the event the related person is a director, an immediate family member of a director or an entity in which a director is a partner, shareholder or executive officer); (v) the availability of other sources for comparable products or services; (vi) whether it is a single transaction or a series of ongoing, related transactions; and (vii) whether entering into the transaction would be consistent with our code of business conduct and ethics.
The code of business conduct and ethics described above was adopted in connection with the completion of the IPO, and, therefore, the transactions described above were not reviewed under such policy.
| ITEM 14. | PRINCIPAL ACCOUNTING FEES AND SERVICES |
The charter of the audit committee of the board of directors of our general partner, which is available on our website at www.ocipartnerslp.com, requires the audit committee to pre-approve all audit services and non-audit services (other than de minimis non-audit services as defined by the Sarbanes-Oxley Act of 2002) to be provided by our independent registered public accounting firm. Our audit committee pre-approved all fees incurred in fiscal years 2014 and 2013.
The following table presents fees billed and expected to be billed for professional audit services rendered by KPMG LLP for fiscal years 2014, 2013 and 2012 and fees billed and expected to be billed for other services rendered by KPMG LLP for fiscal years 2014, 2013 and 2012.
| Fiscal Year 2014 |
Fiscal Year 2013 |
Fiscal Year 2012 |
||||||||||
| KPMG LLP: |
||||||||||||
| Audit Fees(1) |
1,414,226 | $ | 2,358,000 | $ | 890,000 | |||||||
| Tax Fees(2) |
150,000 | 441,500 | 178,000 | |||||||||
| Total |
1,564,226 | $ | 2,799,500 | $ | 1,068,000 | |||||||
| (1) | Represents the aggregate fees billed and expected to be billed for professional services rendered for the audit of our financial statements, quarterly reviews, Securities Act filings and related matters, and consents issued in connection with Securities Act filings arising during the course of the audit for fiscal years 2014, 2013 and 2012. |
| (2) | Represents fees for professional services rendered in connection with tax compliance. |
115
Table of Contents
| ITEM 15. | EXHIBITS AND FINANCIAL STATEMENT SCHEDULES |
(a)(1) and (2) Financial Statements and Schedules.
The information required by this Item is included in Part II, Item 8 of this report. Financial statement schedules required under SEC rules but not included in this Annual Report on Form 10-K are omitted because they are not applicable or the required information is contained in the consolidated financial statements or notes thereto.
(b) Exhibits.
See Exhibit Index.
116
Table of Contents
EXHIBIT INDEX
| Incorporated by Reference | ||||||||||||||||||
| Exhibit |
Exhibit Description |
Form |
Exhibit |
Filing Date | SEC File No. |
|||||||||||||
| 3.1* | Certificate of Limited Partnership of OCI Partners LP | S-1 | 3.1 | June 14, 2013 | 333-189350 | |||||||||||||
| 3.2* | Certificate of Amendment to Certificate of Limited Partnership of OCI Partners LP | S-1 | 3.2 | June 14, 2013 | 333-189350 | |||||||||||||
| 3.3* | First Amended and Restated Agreement of Limited Partnership of OCI Partners LP, dated as of October 9, 2013 | 8-K | 3.1 | October 15, 2013 | 001-36098 | |||||||||||||
| 3.4* | Amendment No. 1 to First Amended and Restated Agreement of Limited Partnership of OCI Partners LP, dated as of March 26, 2014 | 8-K | 3.1 | March 26,2014 | 001-36098 | |||||||||||||
| 10.1* | Contribution, Conveyance and Assumption Agreement, dated as of October 9, 2013, by and among OCI Partners LP, OCI GP LLC, OCI USA Inc. and OCI Beaumont LLC | 8-K | 3.1 | October 15, 2013 | 001-36098 | |||||||||||||
| 10.2* | Omnibus Agreement, entered into and effective as of October 9, 2013, by and between OCI N.V., OCI USA Inc., OCI Partners LP, OCI GP LLC and OCI Beaumont LLC | 8-K | 3.2 | October 15, 2013 | 001-36098 | |||||||||||||
| 10.3*# | OCI Partners LP 2013 Long-Term Incentive Plan | 8-K | 3.3 | October 15, 2013 | 001-36098 | |||||||||||||
| 10.4A* | Term Loan Credit Agreement, dated as of August 20, 2013, among OCI Beaumont LLC, as borrower, OCI USA Inc., as guarantor, various lenders, Barclays Bank PLC, as syndication agent, Citibank, N.A., as documentation agent, and Bank of America, N.A., as administrative agent | S-1/A | 10.7 | September 9, 2013 | 333-189350 | |||||||||||||
| 10.4B* | Amendment No. 1, dated as of November 27, 2013, to Term Loan Credit Agreement, dated as of August 20, 2013, among OCI Beaumont LLC, as borrower, OCI USA Inc., OCI Partners LP, various lenders and Bank of America, N.A., as administrative agent | 8-K | 10.2 | December 4, 2013 | 001-36098 | |||||||||||||
| 10.4C* | Amendment No. 2, dated as of April 4, 2014, to Term Loan Credit Agreement, dated as of August 20, 2013, among OCI Beaumont LLC, as borrower, OCI USA Inc., OCI Partners LP, various lenders and Bank of America, N.A., as administrative agent | 8-K | 10.2 | April 4, 2014 | 001-36098 | |||||||||||||
| 10.4D* | Amendment No. 3, dated as of June 13, 2014, among OCI Beaumont LLC, OCI USA Inc., OCI Partners LP and Bank of America, N.A., as administrative agent, to the Term Loan Credit Agreement dated as of August 20, 2013 | 8-K | 10.2 | June 19, 2014 | 001-36098 | |||||||||||||
Table of Contents
| 10.5* | Intercompany Revolving Facility, dated as of August 20, 2013, between OCI Fertilizer International B.V., as lender, and OCI Beaumont LLC, as borrower | S-1/A | 10.3 | September 9, 2013 | 333-189350 | |||||||||||||
| 10.6A* | Intercompany Term Facility Agreement, dated as of September 15, 2013, between OCI Fertilizer International B.V., as lender, and OCI Beaumont LLC, as borrower | S-1/A | 10.8 | September 23, 2013 | 333-189350 | |||||||||||||
| 10.6B* | Amendment No. 1, dated as of November 27, 2013, to Intercompany Term Facility Agreement, dated as of September 15, 2013, between OCI Fertilizer International B.V., as lender, and OCI Beaumont LLC, as borrower | 8-K | 10.3 | December 4, 2013 | 001-36098 | |||||||||||||
| 10.7* | Beaumont Fertilizer Plant Contract Agreement for Methanol and Ammonia Debottlenecking and Plant Turnaround, dated June 5, 2013, between OCI Beaumont LLC and Orascom E&C USA Inc. | S-1/A | 10.4 | July 23, 2013 | 333-189350 | |||||||||||||
| 10.8* | Equity Commitment Letter, dated as of November 27, 2013, between OCI USA Inc. and OCI Partners LP | 8-K | 10.1 | December 4, 2013 | 001-36098 | |||||||||||||
| 10.9A* | Revolving Credit Agreement, dated as of April 4, 2014, among OCI Beaumont LLC, OCI Partners LP and Bank of America, N.A., as administrative agent, lead arranger and bookrunner | 8-K | 10.1 | April 9,2014 | 001-36098 | |||||||||||||
| 10.9B* | Amendment No. 1, dated as of June 13, 2014, among OCI Beaumont LLC, OCI Partners LP and Bank of America, N.A., as administrative agent and a lender, to the Revolving Credit Agreement dated as of April 4, 2014 | 8-K | 10.1 | June 19, 2014 | 001-36098 | |||||||||||||
| 10.10* | Contribution Agreement, dated November 10, 2014, by and among OCI Partners LP, OCI USA Inc. and OCIP Holding LLC | 8-K | 10.1 | November 12, 2014 | 001-36098 | |||||||||||||
| 21.1† | List of Subsidiaries | |||||||||||||||||
| 23.1† | Consent of Independent Registered Accounting Firm | |||||||||||||||||
| 24.1† | Power of Attorney of Directors and Officers of OCI GP LLC | |||||||||||||||||
| 31.1† | Certification of Chief Executive Officer pursuant to Rule 13a-14(a) under the Securities Exchange Act of 1934 | |||||||||||||||||
| 31.2† | Certification of Chief Financial Officer pursuant to Rule 13a-14(a) under the Securities Exchange Act of 1934 |
|||||||||||||||||
Table of Contents
| 32.1† | Certification of Chief Executive Officer pursuant to 18 U.S.C. Section 1350 | |||||||||
| 32.1† | Certification of Chief Financial Officer pursuant to 18 U.S.C. Section 1350 | |||||||||
| 101.INS+ | XBRL Instance Document | |||||||||
| 101.SCH+ | XBRL Schema Document | |||||||||
| 101.CAL+ | XBRL Calculation Linkbase Document | |||||||||
| 101.LAB+ | XBRL Labels Linkbase Document | |||||||||
| 101.PRE+ | XBRL Presentation Linkbase Document | |||||||||
| 101.DEF+ | XBRL Definition Linkbase Document | |||||||||
| * | Incorporated by reference into this Annual Report on Form 10-K as indicated. |
| † | Filed or furnished, as applicable, herewith. |
| # | Compensatory plan or arrangement. |
| + | Interactive Data File. |
Table of Contents
SIGNATURES
Pursuant to the requirements of Section 13 or 15(d) of the Securities Exchange Act of 1934, the registrant has duly caused this report to be signed on its behalf by the undersigned, thereunto duly authorized.
| OCI Partners LP |
| By: OCI GP LLC, ITS GENERAL PARTNER |
| /s/ Frank Bakker |
| Frank Bakker, Chief Executive Officer and President |
Date: March 16, 2015
Pursuant to the requirements of the Securities Exchange Act of 1934, this report has been signed below by the following persons on behalf of the registrant and in the capacities indicated on March 16, 2015.
| /s/ Frank Bakker |
| Frank Bakker, |
| Chief Executive Officer, President and Director (principal executive officer) |
| /s/ Fady Kiama |
| Fady Kiama, |
| Vice President and Chief Financial Officer (principal financial officer and principal accounting officer) |
| * |
| Michael L. Bennett |
| Chairman and Director |
| * |
| Nassef Sawiris, |
| Director |
| * |
| Renso Zwiers, |
| Director |
| * |
| Francis G. Meyer, |
| Director |
| * |
| Dod A. Fraser, |
| Director |
| * |
| Nathaniel A. Gregory, |
| Director |
| * | The undersigned, by signing his name hereto, does sign and execute this report pursuant to the Power of Attorney executed by the above-named directors and officers of the general partner of the registrant, which is being filed herewith on behalf of such directors and officers. |
| By: | /s/ Fady Kiama | |
| Fady Kiama | ||
| Attorney-in-Fact |