Attached files
| file | filename |
|---|---|
| EX-23.1 - EX-23.1 - GLOBAL BRASS & COPPER HOLDINGS, INC. | d849722dex231.htm |
| EX-12.1 - EX-12.1 - GLOBAL BRASS & COPPER HOLDINGS, INC. | d849722dex121.htm |
| EX-10.7 - EX-10.7 - GLOBAL BRASS & COPPER HOLDINGS, INC. | d849722dex107.htm |
| EX-10.9 - EX-10.9 - GLOBAL BRASS & COPPER HOLDINGS, INC. | d849722dex109.htm |
| EX-21.1 - EX-21.1 - GLOBAL BRASS & COPPER HOLDINGS, INC. | d849722dex211.htm |
| EX-10.8 - EX-10.8 - GLOBAL BRASS & COPPER HOLDINGS, INC. | d849722dex108.htm |
| EX-31.1 - EX-31.1 - GLOBAL BRASS & COPPER HOLDINGS, INC. | d849722dex311.htm |
| EXCEL - IDEA: XBRL DOCUMENT - GLOBAL BRASS & COPPER HOLDINGS, INC. | Financial_Report.xls |
| EX-31.2 - EX-31.2 - GLOBAL BRASS & COPPER HOLDINGS, INC. | d849722dex312.htm |
| EX-32.1 - EX-32.1 - GLOBAL BRASS & COPPER HOLDINGS, INC. | d849722dex321.htm |
Table of Contents
UNITED STATES
SECURITIES AND EXCHANGE COMMISSION
Washington, D.C. 20549
FORM 10-K
| x | ANNUAL REPORT PURSUANT TO SECTION 13 OR 15(d) OF THE SECURITIES EXCHANGE ACT OF 1934 |
For the fiscal year ended December 31, 2014
or
| ¨ | TRANSITION REPORT PURSUANT TO SECTION 13 OR 15(d) OF THE SECURITIES EXCHANGE ACT OF 1934 |
For the transition period from to
Commission File No. 001-35938

GLOBAL BRASS AND COPPER HOLDINGS, INC.
(Exact name of registrant as specified in its charter)
| Delaware | 06-1826563 | |
| (State or other jurisdiction of incorporation or organization) |
(I.R.S. Employer Identification Number) | |
| 475 N. Martingale Road Suite 1050 Schaumburg, IL |
60173 | |
| (Address of principal executive offices) | (Zip Code) | |
(847) 240-4700
(Registrant’s telephone number, including area code)
Indicate by check mark if the registrant is a well-known seasoned issuer, as defined in Rule 405 of the Securities Act. Yes ¨ No x
Indicate by check mark if the registrant is not required to file reports pursuant to Section 13 or Section 15(d) of the Act. Yes ¨ No x
Indicate by check mark whether the registrant (1) has filed all reports required to be filed by Section 13 or 15(d) of the Securities Exchange Act of 1934 during the preceding 12 months (or for such shorter period that the registrant was required to file such reports), and (2) has been subject to such filing requirements for the past 90 days. Yes x No ¨
Indicate by check mark whether the registrant has submitted electronically and posted on its corporate Web site, if any, every Interactive Data File required to be submitted and posted pursuant to Rule 405 of Regulation S-T (§232.405 of this chapter) during the preceding 12 months (or for such shorter period that the registrant was required to submit and post such files). Yes x No ¨
Indicate by check mark if disclosure of delinquent filers pursuant to Item 405 of Regulation S-K (§229.405 of this chapter) is not contained herein, and will not be contained, to the best of registrant’s knowledge, in definitive proxy or information statements incorporated by reference in Part III of this Form 10-K or any amendment to this Form 10-K. ¨
Indicate by check mark whether the registrant is a large accelerated filer, an accelerated filer, a non-accelerated filer or a smaller reporting company. See the definitions of “large accelerated filer,” “accelerated filer” and “smaller reporting company” in Rule 12b-2 of the Exchange Act.
| Large accelerated filer | ¨ | Accelerated filer | x | |||
| Non-accelerated filer | ¨ (Do not check if a smaller reporting company) | Smaller reporting company | ¨ |
Indicate by check mark whether the registrant is a shell company (as defined in Rule 12b-2 of the Exchange Act). Yes ¨ No x
The aggregate market value of the registrant’s common stock held by non-affiliates of the registrant on June 30, 2014, the last business day of the registrant’s most recently completed second fiscal quarter, was approximately $356.7 million (based upon the closing price per share of the registrant’s common stock on the New York Stock Exchange on that date).
On February 24, 2015, there were 21,478,746 shares of common stock outstanding.
DOCUMENTS INCORPORATED BY REFERENCE
Portions of this Form 10-K incorporate by reference certain information from the Registrant’s definitive Proxy Statement for its Annual Meeting of Shareholders to be held on May 21, 2015.
Table of Contents
| PART I | ||||||
| Item 1. | 1 | |||||
| Item 1A. | 16 | |||||
| Item 1B. | 42 | |||||
| Item 2. | 42 | |||||
| Item 3. | 43 | |||||
| Item 4. | 43 | |||||
| PART II | ||||||
| Item 5. | 44 | |||||
| Item 6. | 46 | |||||
| Item 7. | Management’s Discussion and Analysis of Financial Condition and Results of Operations |
47 | ||||
| Item 7A. | 80 | |||||
| Item 8. | 82 | |||||
| Item 9. | Changes in and Disagreements With Accountants on Accounting and Financial Disclosure |
136 | ||||
| Item 9A. | 136 | |||||
| Item 9B. | 137 | |||||
| PART III | ||||||
| Item 10. | 138 | |||||
| Item 11. | 138 | |||||
| Item 12. | Security Ownership of Certain Beneficial Owners and Management and Related Stockholder Matters |
138 | ||||
| Item 13. | Certain Relationships and Related Transactions, and Director Independence |
139 | ||||
| Item 14. | 139 | |||||
| PART IV | ||||||
| Item 15. | 139 | |||||
| SIGNATURES | 143 | |||||
i
Table of Contents
Our Company
Global Brass and Copper Holdings, Inc. (“Holdings,” the “Company,” “we,” “us,” or “our”) was incorporated in Delaware on October 10, 2007. Holdings, through its wholly-owned principal operating subsidiary, Global Brass and Copper, Inc. (“GBC”), commenced commercial operations on November 19, 2007 following the acquisition of the worldwide metals business from Olin Corporation. The majority of our operations and sales activities are focused in North America under the Olin Brass, Chase Brass and A.J. Oster brand names.
We are a leading, value-added converter, fabricator, processor and distributor of specialized copper and brass products, including a wide range of sheet, strip, foil, rod, tube and fabricated metal component products. While we primarily process copper and copper-alloys, we also reroll and form certain other metals such as stainless steel, carbon steel and aluminum. Using processed scrap, copper cathode and other refined metals, we engage in metal melting and casting, rolling, drawing, extruding, welding and stamping to fabricate finished and semi-finished alloy products.
Our products are used in a variety of applications across diversified end markets, including the building and housing, munitions, automotive, transportation, coinage, electronics/electrical components, industrial machinery and equipment and general consumer end markets. We access these end markets through direct mill sales, our captive distribution network and third-party distributors. We hold the exclusive production and distribution rights in North America for a free machining, lead-free brass rod product, which we sell under the Green Dot™ and Eco Brass® brand names. The vertical integration of the manufacturing capabilities of Olin Brass and the distribution capabilities of A.J. Oster allows us to access a wide variety of customers with both high and low volume demand for our products.
We service nearly 1,700 customers in 29 countries across five continents. We employ approximately 1,900 people and operate 11 manufacturing facilities and distribution centers across the United States (“U.S.”), Puerto Rico and Mexico to service our North American customers.
We have an 80% ownership interest in a value-added service center in Guangzhou, China (“Olin Luotong Metals”) and the other 20% is owned by Chinalco Luoyang Copper Co. Ltd. (“Chinalco”). We participate in Dowa-Olin Metal Corporation (“Dowa Joint Venture”), a 50% owned marketing and sales joint venture with DOWA Metaltech Co. Ltd. (“Dowa Co.”) located in Hamamatsu, Japan. Through Olin Luotong Metals and the Dowa Joint Venture, together with our sales offices in China and Singapore, we supply our products in China and throughout Asia. We service our European customers through distribution arrangements in the United Kingdom and Germany.
Unlike traditional metals companies, including those that engage in mining, smelting and refining activities, we are purely a metal converter, fabricator, processor and distributor and do not attempt to generate profits from fluctuations in metal prices. Our financial performance is primarily driven by metal conversion economics, not by the underlying movements in the price of copper and the other metals we use. Through our “balanced book” approach (as further described under “Management’s Discussion and Analysis of Financial Condition and Results of Operations—Key Factors Affecting Our Results of Operations—Balanced Book”), we strive to match the timing, quantity and price of our metal sales with the timing, quantity and price of our replacement metal purchases. This practice substantially reduces the financial impact of metal price movements on our earnings and operating margins.
Recent Transactions
On February 3, 2014 the Company completed an additional follow-on public offering (“Additional Follow-on Public Offering”) of 7,310,000 shares of its common stock, including 910,000 shares of common stock sold in
1
Table of Contents
connection with the full exercise of the option to purchase additional shares granted to the underwriters. Halkos Holdings, LLC, (“Halkos”), a 34.4% stockholder of the Company prior to the Additional Follow-on Public Offering sold all of the shares in the Additional Follow-on Public Offering and received all of the net proceeds from the offering. After giving effect to the Additional Follow-on Public Offering, Halkos no longer owns any shares of our common stock.
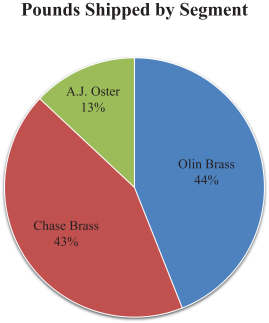
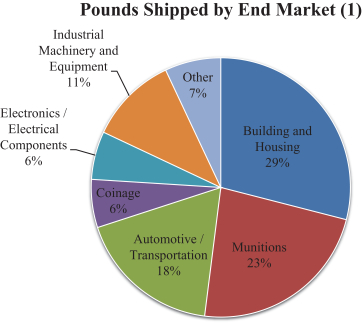
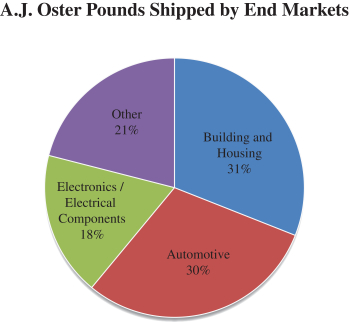
Shipment Overview
The following charts show our pounds shipped to external customers by our three operating segments and key end markets for the year ended December 31, 2014.
2
Table of Contents
| (1) | Pounds shipped by end markets in the above chart reflects management’s allocation among end markets of pounds shipped by Chase Brass to distributors, job shops and forging shops. See Item 1, “Business—Chase Brass.” |
Financial information for the last three years concerning our business segments and the geographic areas of our operations is incorporated herein by reference from “Note 18, Segment Information.”
Segments Overview
We have three operating segments: Olin Brass, Chase Brass and A.J. Oster.

|

|

| ||||
| Description | • Leading manufacturer, fabricator and converter of specialized copper and brass sheet, strip, foil, tube and fabricated products |
• Leading manufacturer and supplier of brass rod |
• Leading processor and distributor of copper and brass products | |||
| Key End Markets | • Munitions, Automotive, Coinage, Building and Housing, Electronics/ Electrical Components |
• Building and Housing, Transportation, Electronics/Electrical Components and Industrial Machinery and Equipment |
• Building and Housing, Automotive, Electronics/ Electrical Components |
Olin Brass
Olin Brass is a leading manufacturer and converter of specialized copper and brass sheet, strip and fabricated products. The Olin Brass segment also rerolls and forms other alloys such as stainless steel, carbon steel and aluminum. Key attributes of sheet and strip are conductivity, corrosion resistance, strength, malleability, cosmetic appearance and bactericidal properties. Sheet and strip is generally manufactured from copper and copper-alloy scrap.
Olin Brass manufactures its products through four sites in North America, employs 1,287 people as of December 31, 2014 and produces a wide variety of products. During the year ended December 31, 2014, it produced 51 alloys, including 16 high performance alloys (“HPAs”). Olin Brass is working to expand its market portfolio further by capitalizing on certain trends, including applications that utilize the bactericidal properties of copper and possible transition to the dollar coin in the U.S.
Olin Brass’ integrated brass mill in East Alton, Illinois is our main operating facility, which produces strip products that are either sold directly to external customers, sold to its affiliate, A.J. Oster, or shipped to Olin Brass’ downstream operations for further value-added processing. Olin Brass’ downstream operations include:
| • | a stamping operation located in East Alton; |
| • | a rolling mill in Waterbury, Connecticut with rolling, annealing, leveling, plating and slitting capabilities for various products (“Somers Thin Strip”); |
| • | a manufacturing facility in Bryan, Ohio specializing in products sold in the automotive and electronics/electrical components end markets; and |
| • | a manufacturing facility in Cuba, Missouri that produces high frequency welded copper-alloy tube for heat transfer, utility, decorative, automotive and plumbing applications. |
3
Table of Contents
Olin Brass’ products are sold to original equipment manufacturers (“OEMs”), external customers, distributors/rerollers or to its affiliate, A.J. Oster. In the year ended December 31, 2014, approximately 17% of Olin Brass’ products were shipped to supply chain customers, of which management estimates that approximately 60% were directly associated with the building and housing or automotive sectors. For the year ended December 31, 2014, Olin Brass sold approximately 15% of its domestic copper-based products to A.J. Oster.
The following chart shows the primary end markets for Olin Brass’ products and the percentage of shipments for each during the year ended December 31, 2014.
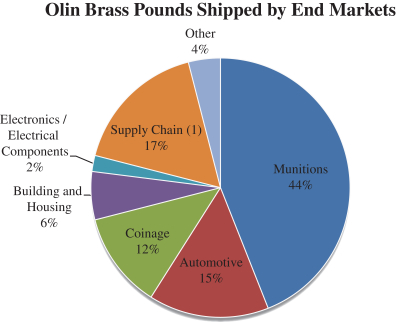
| (1) | Approximately 60% of supply chain customer shipments are directly associated with the building and housing and automotive end markets according to management estimates. Shipments to A.J. Oster are reflected in the supply chain end market and are eliminated in consolidation. |
Munitions End Market
Olin Brass manufactures products utilized in both the military and commercial munitions markets, such as strip and cups, including for uses in shot shells, bullet jackets, centerfire, rimfire and small caliber military munitions.
Customers in this end market include major munitions producers in the U.S., as well as government facilities producing small caliber ammunition. Demand within this market is affected by the U.S. government’s security policies, as well as consumer demand for firearms and munitions. While munitions demand is predominantly domestic, occasional opportunities arise to supply U.S. alliance partners with these products.
Automotive End Market
Olin Brass manufactures both strip and fabricated products used as electronic and electrical connectors for use in automobiles. These products are made with HPAs, suitable for applications requiring high reliability, high temperature and low insertion force. For example, these electrical connectors, along with lead frames
4
Table of Contents
manufactured by us, are used in junction boxes, wiring harnesses, ignition systems, lighting and automotive entertainment systems.
Customers in this end market include primary automotive connector suppliers in the U.S. Although historically the business in this end market remained largely regional in the U.S., Olin Brass and A.J. Oster are collectively working to capitalize on the migration of automotive production to Mexico, where an A.J. Oster service center is located. Demand within this end market is affected by the level of consumer spending on automobiles, which is significantly dependent on overall economic conditions.
Coinage End Market
Olin Brass supplies coinage strip for use in the production of dollar coins, quarters, dimes and nickels. Customers in this end market include the United States Mint, for which we are a supplier contracted through 2017. Olin Brass has been a supplier to the United States Mint for over 30 years and expects to continue to renew its contract periodically with the United States Mint for the foreseeable future.
The demand within this end market is affected by the level of activities in retail transactions.
Building and Housing End Market
Olin Brass manufactures a variety of strip, welded tube and stamped parts used in commercial and residential buildings, such as faucets, locksets, decorative door hardware and hinges, which require workability, corrosion resistance and attractive appearance. Olin Brass also manufactures strip used in products that require electrical conductivity such as plug outlets, switches, lamp shells, other wiring devices, industrial controls, circuit breakers and switchgears. These products are generally manufactured with copper and copper-alloy sheet and strip, both HPAs and standard alloys, as well as copper-alloy welded tube.
Customers in this end market are OEMs producing building and housing products. These products are supplied either directly to customers or to A.J. Oster. Olin Brass also supplies building and housing products in China through Olin Luotong Metals.
While demand within this end market is affected by new residential housing, existing home sales and commercial construction, all of which are significantly dependent on overall economic conditions, the correlation between housing statistics and our sales is not entirely direct. Our key products are typically installed near the completion of construction, meaning there is an inherent lag time compared to housing starts, and sales of our building and housing products can be affected by factors such as housing mix (unit size, unit price point and the mix of multi-family versus single-family construction). Sales of our products can also be impacted by changes in the composition of materials and fixtures used in construction as well as import and export dynamics.
Electronics/Electrical Components End Market
Olin Brass manufactures strip used in integrated circuit sockets for circuit boards, electrical connectors for laptop computers, consumer electronics and appliances, and foils for flexible circuit applications. The strip manufactured in this end market is high in HPA content and is sold directly to end-use customers and distributors.
Customers in this end market are primarily electronics manufacturers that operate globally. A portion of these customers is serviced through A.J. Oster, and the remainder is supplied directly by Olin Brass, with our Somers Thin Strip facility providing the foil products on a global scale.
Demand within this end market is affected by consumer spending on electronics, which may fluctuate significantly as a result of economic conditions.
5
Table of Contents
International
Asia
Olin Brass’ operations in Asia primarily consist of Olin Luotong Metals; GBC Metals Asia Pacific PTE, a 100% owned subsidiary in Singapore; and the Dowa Joint Venture.
Established in 2002, Olin Luotong Metals is a service center that distributes HPAs, which are manufactured by Olin Brass in the U.S., into the Chinese market and other standard alloys, which are manufactured by Chinalco. Olin Luotong Metals performs value-added slitting and winding operations to these alloys prior to distribution. Its primary customers include major multinational manufacturers of components used in automotive, electronic and electrical applications. Almost all of Olin Luotong Metals’ sales are settled in U.S. dollars. During the year ended December 31, 2014, Olin Luotong Metals generated $38.4 million of net sales, which represented 5% of Olin Brass’ net sales (excluding sales to other Olin Brass affiliates). During the year ended December 31, 2014, 3% of Olin Brass’ product was shipped from Olin Luotong Metals.
Established in 1987, the main function of the Dowa Joint Venture is to market and sell HPAs licensed from Olin Brass and manufactured at Dowa Co.’s strip mills to key customers in Japan and southeast Asia. The primary markets served include electronic lead frames and electrical connectors. During the year ended December 31, 2014, the Dowa Joint Venture generated $72.2 million of net sales. As the Dowa Joint Venture is accounted for as a non-consolidated entity, these sales are not included in our total net sales or the net sales of Olin Brass.
GBC Metals Asia Pacific PTE markets and sells HPAs supplied primarily by Olin Brass and the Dowa Joint Venture into key electronics markets in Asia, including Singapore, Malaysia, South Korea, Taiwan and China. During the year ended December 31, 2014, GBC Metals Asia Pacific PTE generated $12.3 million of net sales, which represented 2% of Olin Brass’ net sales (excluding sales to other Olin Brass affiliates). During the year ended December 31, 2014, less than 1% of Olin Brass’ product was shipped from GBC Metals Asia Pacific PTE.
Sales volume of Olin Brass in Asia (excluding the Dowa Joint Venture), which includes pounds shipped from Olin Luotong Metals, GBC Metals Asia Pacific PTE and exports to Asia from our domestic Olin Brass locations, was 10.8 million pounds during the year ended December 31, 2014 (4% of total pounds shipped by Olin Brass) and primarily served the automotive, electronics/electrical components and building and housing end markets.
Europe
Olin Brass’ business in Europe is conducted through distribution arrangements with Aurubis U.K. in the United Kingdom and Türkis GmbH in Germany.
Sales volume of Olin Brass in the European region was 0.8 million pounds during the year ended December 31, 2014 (less than 1% of total pounds shipped by Olin Brass) and primarily served the munitions end market.
Others
Sales volume from Olin Brass’ international business in regions other than Asia and Europe, including sales shipments in Mexico and Canada, was 11.6 million pounds during the year ended December 31, 2014 (4% of total pounds shipped by Olin Brass) and primarily served the automotive and electronics/electrical components end markets.
Chase Brass
Chase Brass primarily manufactures brass rod, including round, hexagonal and other shapes, ranging from 1/4 inch to 4.5 inches in diameter. Its customers machine or otherwise process the rod for applications used in
6
Table of Contents
various end markets. Brass rod is primarily used for forging and machining products, such as valves and fittings. Key attributes of brass rod include its machinability, corrosion resistance and moderate strength. Brass rod is generally manufactured from copper or copper-alloy scrap.
All of Chase Brass’ rod is manufactured at its Montpelier, Ohio facility. In January 2008, Chase Brass acquired the order book, customer list and certain other assets of the North American operations of Bolton Metals Product Company (“Bolton”). This acquisition boosted Chase Brass’ capabilities and customer base.
Chase Brass has been able to capitalize on opportunities arising from regulation limiting lead content in potable water plumbing fixtures. We believe this legislation will continue to increase the need for low-lead and lead-free materials, including Eco Brass®.
Chase Brass’ products are sold directly to OEMs or to supply chain customers, including distributors, job shops and forging shops. During the year ended December 31, 2014, approximately 32% of Chase Brass’ products were sold to distributors, job shops and forging shops, which were allocated by management to Chase Brass’ end markets based on information gathered by management from these customers.
The following chart shows the primary end markets for Chase Brass’ products and the percentage of shipments for each during the year ended December 31, 2014. Note, during the year ended December 31, 2014, Chase Brass shipped a total of 221.3 million pounds, including 70.0 million pounds shipped to distributors, job shops and forging shops, which were allocated by management to Chase Brass’ end markets based on information gathered by management from such distributors, job shops and forging shops to calculate the pounds shipped to the various end markets presented below.
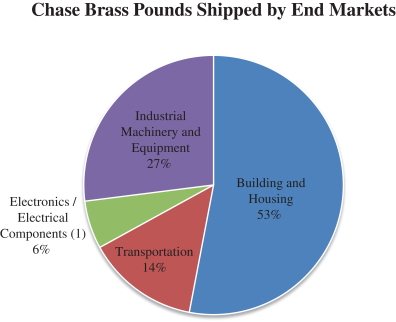
| (1) | Substantially all of Chase Brass’ electronics/electrical components shipments are directly associated with the building and housing and transportation end markets. |
Building and Housing End Market
Chase Brass manufactures brass rod for use in faucets, valves and fittings used in residential and commercial construction.
7
Table of Contents
Chase Brass produces a number of low-lead and lead-free products, or “green portfolio” products, which comply with state laws in California and Vermont as well as Federal standards (patterned after legislation enacted in California and Vermont) that became effective in January 2014. This legislation defines the allowed level of lead content in products used in plumbing and drinking water applications. Chase Brass’ Green Dot rod (Eco Brass®) and Eco Brass® ingot products are part of the green portfolio, and Chase Brass is the exclusive licensee of the intellectual property rights for their production, sale and distribution in North America. Chase Brass also manufactures other non-patented green portfolio products. Our green portfolio products accounted for approximately 15% of pounds shipped by Chase Brass during the year ended December 31, 2014. Customers in this end market include major faucet, valve and fitting manufacturers who are producing multiple products using green portfolio materials.
While demand within this end market is affected by new residential housing, existing home sales and commercial construction, all of which are significantly dependent on overall economic conditions, the correlation between housing statistics and our sales is not entirely direct. Our key products are typically installed near the completion of construction, meaning there is an inherent lag time compared to housing starts, and sales of our building and housing products can be affected by factors such as housing mix (unit size, unit price point and the mix of multi-family versus single-family construction). Sales of our products can also be impacted by changes in the composition of materials and fixtures used in construction, as well as import and export dynamics.
Transportation End Market
Chase Brass manufactures brass rod for uses in automobiles and heavy trucks. Specific applications include heavy truck braking systems, tire valves, temperature sensors and various truck and automotive fittings. Demand within this end market is affected by levels of transportation activity, levels of maintenance capital spending by transportation companies and the level of commercial truck fleet replacement activity, all of which are affected significantly by overall economic conditions. Customers in this end market include major OEMs in the transport industry and customers who support domestic automotive production.
Electronics/Electrical Components End Market
Chase Brass manufactures brass rod used for telecommunication applications, including products such as coaxial connectors and traps and filters for cable television, as well as larger connectors supporting the cell tower industry. Demand within this end market is affected by consumer spending along with new home construction.
Customers within these end markets include major manufacturers of specialty products for use in home and commercial construction, both of which are very dependent on overall economic conditions. Management believes that substantially all of the shipments in this market segment are directly associated with the building and housing market and transportation end markets.
Industrial Machinery and Equipment End Market
Chase Brass manufactures brass rod used in industrial valves and fittings. Demand within this end market is affected by capital spending levels, U.S. GDP growth and industrial production growth in the U.S.
Customers in this end market include various major diversified manufacturers and a variety of screw machine companies supporting OEMs.
International
Chase Brass primarily supplies products within North America. Sales volume to Canada and Mexico was 19.4 million pounds (9% of total pounds shipped by Chase Brass) during the year ended December 31, 2014.
8
Table of Contents
A.J. Oster
A.J. Oster is a processor and distributor of primarily copper and copper-alloy sheet, strip and foil, operating six strategically-located service centers in the U.S., Puerto Rico and Mexico. Key A.J. Oster competitive advantages are short lead-times with high reliability, small-quantity deliveries and a wide range of high-quality, copper-based products.
For the year ended December 31, 2014, Olin Brass provided A.J. Oster with 54% of its copper-based products. Aurubis is A.J. Oster’s second largest supplier after Olin Brass, supplying approximately 30% of A.J. Oster’s copper-based products in the year ended December 31, 2014. Many of the coils purchased from Olin Brass and Aurubis are full-width and require slitting.
Each A.J. Oster service center reliably provides a broad range of high-quality products at quick lead-times in small quantities. These capabilities, combined with A.J. Oster’s operations of precision slitting, hot tinning, traverse winding, cutting, edging and special packaging, provide value to a broad customer base.
The following chart shows the primary end markets for A.J. Oster’s products and the percentage of shipments for each during the year ended December 31, 2014.
Building and Housing End Market
A.J. Oster slits and distributes copper-alloy strip and aluminum foil used for products in commercial and residential buildings. The two primary applications are electrical and hardware.
Electrical products are primarily for wiring devices. Other applications include switchgears, switches, controls and circuit breakers. Several of our customers for these products are in Puerto Rico or Mexico. These customers require short lead-times, small quantities and numerous specifications. A.J. Oster’s capabilities are well-suited for these geographic locations and the stringent service requirements of the electrical end market because A.J. Oster is able to provide customers with high-quality metals, in less-than-truckload quantities, and can deliver products shortly after receiving orders.
9
Table of Contents
Hardware products include products such as faucets, window trim, locksets, hinges and kick plates.
While demand in the building and housing end market is affected by new residential housing existing home sales and commercial construction, all of which are significantly dependent on overall economic conditions, the correlation between housing statistics and our sales is not entirely direct. Our key products are typically installed late in the housing construction cycle, meaning there is an inherent lag in volumes, and sales of our building and housing products can be affected by factors such as housing mix (unit size, unit price point and the mix of multi-family versus single-family construction). Sales of our products can also be impacted by the actual timing of housing starts and completions as well as to changes in the materials and fixtures used in construction that may contain fewer copper products or materials and fixtures than were used in the past as well as import and export dynamics.
Automotive End Market
A.J. Oster slits, traverse winds, hot tin dips, coats and distributes copper-alloy strip and aluminum foil used in automobile production. Primary customer products are electrical connectors, automotive trim and heat exchangers.
A.J Oster has excellent geographic coverage to service this market. Our A.J. Oster subsidiary in Queretaro, Mexico is well-positioned to take advantage of the growing number of second-tier automobile component suppliers that are growing in Mexico.
Demand within this end market is affected by the level of consumer spending on automobiles, which is significantly dependent on overall economic conditions.
Electronics/Electrical Components End Market
A.J. Oster slits, traverse winds, hot tin dips, coats and distributes copper-alloy strip used for electrical connectors in computers, consumer electronics and automobiles. The markets served by A.J. Oster are service intensive and therefore require A.J. Oster capabilities.
The demand within this end market is affected by consumer spending on electronics, which may fluctuate significantly as a result of economic conditions.
International
A.J. Oster’s North American operations include a service center in central Mexico. The facility is located in Queretaro in the center of Mexico’s industrial triangle marked by Mexico City, Monterey and Guadalajara and is easily accessible by highway connections to the United States.
Automakers in Mexico produce approximately three million automobiles per year. Automotive sub-suppliers that consume copper-alloy strip are now locating facilities in central Mexico in order to support primary automotive manufacturing.
A.J. Oster is well positioned to capture growth in the Mexican market for copper-alloy strip because of its ability to provide Mexican customers with high-quality metals, in less-than-truckload quantities and to deliver the products shortly after receiving orders. Our customers located in Mexico will require first-class service and quality levels traditionally demanded by the electrical, electronics and automotive industries. Meeting these demands is a core competency of A.J. Oster.
Net sales from A.J. Oster Mexico were $46.9 million during the year ended December 31, 2014 (15% of A.J. Oster net sales). During the year ended December 31, 2014, 14% of A.J. Oster’s product was shipped from Mexico.
10
Table of Contents
Raw Materials and Supply
We manufacture our products from scrap metal (both internally generated and externally sourced) or virgin raw materials. During the year ended December 31, 2014, 88% of our metal came from scrap metal, and the remainder came from virgin raw materials. Olin Brass utilizes both scrap and virgin raw materials, while Chase Brass primarily uses scrap.
Virgin raw materials, including copper cathode, are purchased at a premium on the London Metal Exchange (“LME”) or Commodities Exchange (“COMEX”) or directly from key dealers that support producers around the world. Although virgin raw materials are more expensive compared to scrap, we use them to produce HPAs and other products that require exact specifications.
Customers
Our customer base is broadly diversified, spanning various North American end markets, including building and housing, munitions, automotive, transportation, coinage, electronics/electrical components, industrial machinery and equipment and general consumer end markets. In the year ended December 31, 2014, we sold over 15,000 different stock keeping units (“SKUs”) to nearly 1,700 customers.
In the year ended December 31, 2014, net sales from our foreign entities were $97.6 million. We have long-term relationships with our customers, many of which are secured through short-term contracts. Our relationships with many of our significant customers have lasted more than 30 years.
Each of our three operating segments has at least 10% of their net sales concentrated in a large customer during the year ended December 31, 2014. Olin Brass generated 21% of its total net sales from one customer and 19% of its total net sales from another customer. A.J. Oster generated 13% of its total net sales from one customer. Chase Brass generated 14% of its total net sales from one customer. On a consolidated basis, we did not generate more than 10% of our total net sales from any one customer for the year ended December 31, 2014.
Competition
We compete with other companies on price, service, quality, breadth, and availability of product both domestically and internationally. We believe we have been able to compete effectively because of our high levels of service, breadth of product offering, knowledgeable and trained sales force, modern equipment, numerous locations, geographic dispersion, economies of scale, and sales volume.
The North American market for brass and copper strip and sheet and brass rod consists of a few large participants and a few smaller competitors for Olin Brass and Chase Brass. A.J. Oster’s competition consists of a number of smaller competitors. Our international competitors are based principally in Europe and Asia.
Our largest competitors in each of the markets in which we operate are the following:
| • | Aurubis and PMX Industries, Inc.: manufacturers of copper and copper-alloys in the form of strip, sheet and plate (Olin Brass); |
| • | ThyssenKrupp Materials NA, Copper and Brass Sales Division: processor and distributor of copper, brass, stainless and aluminum products; Wieland Metals, Inc.: re-roll mill and service center for copper and copper-alloy strip (A.J. Oster); |
| • | Mueller Industries, Inc.: manufacturer of brass rod (Chase Brass). |
We use data published by Copper Development Association Inc. (“CDA”), Copper and Brass Servicenter Association, Inc. (both independent industry associations) and management estimates to determine our market share. Using this information, for the year ending December 31, 2014:
| • | Olin Brass accounted for 33% of North American shipments (including shipments to A.J. Oster) of copper and brass alloys in the form of sheet, strip and plate; |
11
Table of Contents
| • | A.J. Oster accounted for 32% of North American shipments of copper and brass, sheet and strip products from distribution centers and rerolling facilities; and |
| • | Chase Brass accounted for 48% of North American shipments of brass rod, not including imports. |
Government Regulation and Environmental Matters
Bactericidal Products
Through its membership in the CDA, Olin Brass has completed the required Federal Environmental Protection Agency (“EPA”) and applicable state registration processes that allow it to market its CuVerro™ products with certain approved bactericidal claims. Laboratory testing has shown that bactericidal copper touch surfaces made with CuVerro™ kill more than 99.9% of bacteria within two hours. We believe that Olin Brass’ copper-based CuVerro™ materials are in compliance, in all material respects, with EPA standards for products recognized by the EPA as having bactericidal properties.
In connection with these EPA registrations, the CDA is required to implement a “stewardship” plan that is designed to ensure that bactericidal copper alloys are properly used and marketed. The stewardship requirement reflects the EPA’s concern that the improper marketing of bactericidal copper alloys could lead users to mistakenly believe that the use of these products is a simple solution to fight infections. The stewardship efforts are intended to emphasize that all marketing statements are consistent with the approved EPA product label, including the need to state clearly that the alloys are intended as a supplement to, but are not a substitute for, standard cleaning and sanitization procedures. These standards also apply to marketing by our customers who use CuVerro™ in their products.
Even though the marketing of copper products as bactericidal started in 2008, the manufacturers of such products are still in the process of determining what specific bactericidal claims may be made in compliance with the EPA’s and Federal Insecticide, Fungicide and Rodenticide Act’s (“FIFRA”) requirements. Therefore, there remains some uncertainty when determining whether a particular marketing approach is consistent with the EPA registration requirements. Accordingly, it is possible that we or other manufacturers may be found to be non-compliant by the EPA for current, past or future marketing claims and activities, despite efforts to comply. The EPA can impose administrative or judicial sanctions and penalties against those violating federal regulations, including corrective disclosures, civil administrative penalties, stop sale orders, cancellations of registrations, seizures, injunctions and criminal sanctions. Any failure by us or our customers who use CuVerro™ in their products to comply with FIFRA’s requirements with respect to CuVerro™ could therefore expose us to various enforcement actions or other claims or adverse impacts to our reputation. The stewardship program required under the EPA registration is an industry-wide activity, and the actions of other CDA members could jeopardize the marketing of all bactericidal copper products registered through the CDA (including CuVerro™). If the EPA were to determine that the stewardship program is not being implemented effectively, the EPA may initiate a variety of corrective actions, which could adversely affect us and other CDA members, including cancelling all CDA registrations. If the EPA were to initiate an enforcement action that affects us or our customers, it may have a material adverse effect on our ability to market CuVerro™ as an bactericidal product.
Lead-free and Low-lead Plumbing Products
New regulations designed to reduce lead content in drinking water plumbing devices provide an opportunity for future growth. Chase Brass is a premier provider of specialized lead-free products and low-lead alloys. Federal legislation in the United States (the Reduction of Lead in Drinking Water Act, which was patterned after legislation enacted in California and Vermont) required the reduction of lead content in all drinking water plumbing devices beginning in January 2014. This legislation presents a significant growth opportunity for Chase Brass. Our Eco Brass® products meet Federal, California and Vermont standards and can be used to produce cast, machined and forged faucet parts. We currently supply major faucet, valve and fitting manufacturers who produce multiple products using machined Eco Brass® parts.
12
Table of Contents
Environmental
Our operations are subject to a number of Federal, state and local laws and regulations relating to the protection of the environment and to workplace health and safety. In particular, our operations are subject to extensive Federal, state and local laws and regulations governing the creation, transportation, use, release and disposal of wastes, air and water emissions, the storage and handling of hazardous substances, environmental protection, remediation, workplace exposure and other matters. Hazardous materials used in our operations include general commercial lubricants, cleaning solvents and cutting oils. Among the regulated activities that occur at some of our facilities are: the accumulation of scrap metal, which is sold for recycling; and the generation of hazardous waste, solid wastes and wastewaters, such as water from burning tables operated at some of our facilities. The generation, storage, and disposal of these wastes is done in accordance with the Federal Water Pollution Control Act, the Comprehensive Environmental Response, Compensation, and Liability Act (“CERCLA”) and the Resource Conservation and Recovery Act, and we use third-party commercial disposal services as permitted by these laws for the removal and disposal of these wastes. The storage, handling and use of lubricating and cutting oils and small quantities of maintenance-related products and chemicals are also regulated under environmental laws, and the health hazards of these materials are communicated to employees pursuant to the Occupational Safety and Health Act.
In general, our facilities’ operations do not involve the types of emissions of air pollutants, discharges of pollutants to land or surface water, or treatment, storage or disposal of hazardous waste which would ordinarily require Federal or state environmental permits. Some of our facilities possess authorizations under the Clean Air Act for air emissions from paints and coatings. At some locations, we also possess hazardous materials storage permits under local fire codes or ordinances for the storage of combustible materials such as oils or paints. At some facilities we possess state or local permits for on-site septic systems. Our cost of obtaining and complying with such permits has not been, and is not anticipated to be, material.
We believe that we are in substantial compliance with all applicable environmental and workplace health and safety laws and do not currently anticipate that we will be required to expend any substantial amounts in the foreseeable future in order to meet such requirements. Nevertheless, some of the properties we own or lease are located in areas with a history of heavy industrial use, and are near sites listed on the CERCLA National Priority List, CERCLIS and comparable state listings. CERCLA establishes responsibility for clean-up without regard to fault for persons who have released or arranged for disposal of hazardous substances at sites that have become contaminated and for persons who own or operate contaminated facilities. In many cases, courts have imposed joint and severable liability on parties at CERCLA clean-up sites. We have a number of properties located in or near industrial or light industrial use areas; accordingly, these properties may have been contaminated by pollutants which may have migrated from neighboring facilities or have been released by prior occupants. Some of our properties have been affected by releases of cutting oils and similar materials and we are investigating and remediating such known contamination pursuant to applicable environmental laws. The costs of these clean-ups have not been material in the past. We are not currently subject to any material claims or notices with respect to clean-up or remediation under CERCLA or similar laws for contamination at our leased or owned properties or at any off-site location. However, we could be notified of such claims in the future. It is also possible that we could be identified by the EPA, a state agency, or one or more third parties as a potentially responsible party under CERCLA or under analogous state laws.
Pursuant to the agreement, dated November 19, 2007, by which we purchased our current operating locations from Olin Corporation, Olin Corporation agreed to retain responsibility for a wide range of liabilities under environmental laws arising out of existing contamination on our properties, and agreed to indemnify us without limitation with respect to these liabilities. Specifically, Olin Corporation retained responsibility for:
| • | compliance with all obligations to perform investigations and remedial action required under the Connecticut Real Property Transfer Act at properties in Connecticut; |
| • | pending corrective action/compliance obligations under the Federal Resource Conservation and Recovery Act for certain areas of concern at our East Alton, Illinois facility; and |
13
Table of Contents
| • | all obligations under environmental laws arising out of 24 additional specifically identified areas of concern on various of our properties. |
Olin Corporation also retained complete responsibility for all liabilities arising out of then pending governmental inquiries relating to environmental matters; for “any liability or obligation in connection with a facility of the Business to the extent related to pre-Closing human exposure to Hazardous Materials, including asbestos-containing materials”; and for “any liability or obligation in connection with the off-site transportation or disposal of Hazardous Materials arising out of any pre-Closing operations of the Business”.
Since 2007, Olin Corporation has continued to perform environmental remedial actions on our properties, including the East Alton, Illinois and Waterbury, Connecticut properties, and continues to work closely with us to address matters covered by the indemnity. Because of the Olin Corporation indemnity, we have not been required to engage in any significant environmental cleanup activity on our properties and do not currently have any material reserves established to address environmental remedial requirements.
Employees
The following table shows the composition of our workforce by operating segment and Corporate as of December 31, 2014.
| Employees | % of Total | |||||||
| Olin Brass |
1,287 | 68 | % | |||||
| A.J. Oster |
276 | 15 | % | |||||
| Chase Brass |
310 | 16 | % | |||||
| Corporate |
23 | 1 | % | |||||
|
|
|
|
|
|||||
| Total |
1,896 | 100 | % | |||||
|
|
|
|
|
|||||
As of December 31, 2014, 1,182, or approximately 62%, of our employees at various sites were members of unions. We have generally maintained good relationships with all unions and employees, which has been an important aspect of our ability to be competitive in our industry. Generally, our various agreements with unions in the United States have contractual terms which range from 1 to 4 years.
Since our acquisition of the worldwide metals business of Olin Corporation in November 2007, we have not experienced any work stoppages at any of our facilities. We believe we will continue to be able to renew the outstanding collective bargaining agreements upon acceptable terms. Historically, we have succeeded in negotiating new collective bargaining agreements without a strike.
Research and Development
As of December 31, 2014, we employed six scientists in metallurgy and electrochemistry. We intend to continue to invest in research and development to develop new products and to expand our value-added services to meet our customers’ needs.
Our research and development expenditures for the year ended December 31, 2014 were $1.6 million (less than 1% of total net sales).
Risk Management and Insurance
The primary risks in our operations are personal injury, property damage, transportation, criminal acts, risks associated with international operations, directors’ and officers’ liability and general commercial liabilities. We are insured against general commercial liabilities, automobile accidents (including injury to employees and physical damage of goods and property and employer liabilities), directors’ and officers’ liability, crime, foreign
14
Table of Contents
risks, environmental liability, aircraft products liability, ocean cargo liability and flood through insurance policies provided by various insurance companies up to amounts we consider sufficient to protect against losses due to claims associated with these risks.
We also maintain bonds with certain Federal, state and international authorities to insure against risks relating to, among other things, delays due to customs clearances, compliance with certain laws and regulations and import and export of goods.
Safety
Consistent with other strategic initiatives, management is pursuing a ‘Best in Class’ performance status for employee safety. Our management has committed itself to achieving a formal ‘Star’ certification within the Occupational Safety and Health Administration (“OSHA”) sponsored Voluntary Protection Program, or VPP. A formal VPP Star certification is OSHA’s official recognition for outstanding efforts between employers and employees for achieving exemplary occupational safety and health. The Safety Excellence / VPP initiative shifts the safety paradigm to an aggressive proactive approach that stresses strong employee participation and collaboration, management accountability, employee training and hazard elimination as core foundational elements.
Patents, Trademarks and Other Intellectual Property Rights
Chase Brass has an exclusive intellectual property license, valid through the expiration of the U.S. patents in 2027, to produce and sell Eco Brass® rod and ingot in North America, granted by Mitsubishi Shindoh Company, Ltd., the Japanese company that owns the relevant intellectual property rights. We have sublicensed our rights to three sublicensees, none of which is currently a competitor of any of our subsidiaries or segments. These sublicensing arrangements are valid until the expiration of the relevant patents in North America. In addition, we have alloy licensing arrangements with companies in Germany, Japan and China.
As of December 31, 2014, we owned 182 patents, of which 49 were U.S. patents. We also own various trademarks relating to our products. As of December 31, 2014, we owned 26 trademarks, of which 12 are U.S. trademarks. Most of these are owned by GBC Metals, LLC, a wholly owned subsidiary of ours. We license the marks OLIN BRASS and OLIN METALS for metal products from Olin Corporation. These licenses continue unless we breach the license agreement. We also license stylized versions of these marks from Olin Corporation and the license to the stylized version includes an annual termination option.
We license the intellectual property rights related to certain proprietary alloy systems to other major brass mills around the world, including Dowa Co. As of December 31, 2014, there were nine such licenses.
Government Contract
The United States Mint is a significant customer of Olin Brass, which has been an authorized supplier to the United States Mint since 1969 and currently has a contractual arrangement to supply nickel and brass coinage strip to multiple United States Mint facilities through 2017. The United States Mint can terminate our contract in whole or in part when it is in the best interest of the United States Mint to do so and any damages payable to us by the United States Mint for such termination would not include lost profits.
Seasonality and Backlog
There is a slight decrease in our net sales in the fourth quarter as a result of the decrease in demand due to customer shutdowns for the holidays and year-end maintenance of plants and inventory by customers. We also typically experience slight working capital increases in the first fiscal quarter.
15
Table of Contents
Available Information
Our website address is http://www.gbcholdings.com. We make available on our website, free of charge, the periodic reports that we file with or furnish to the Securities and Exchange Commission (“SEC”), as well as all amendments to these reports, as soon as reasonably practicable after such reports are filed with or furnished to the SEC. We also make available on our website or in printed form upon request, free of charge, our Corporate Governance Guidelines, Code of Business Conduct and Ethics, charters for the standing committees of our Board of Directors and other information related to the Company. We are not including the information contained on our website as a part of, or incorporating it by reference into, this report.
The public may read and copy any materials that we file with the SEC at the SEC’s Public Reference Room at 100 F Street, N.E., Washington D.C. 20549. The public may obtain information about the operation of the Public Reference Room by calling the SEC at 1-800-SEC-0330. The SEC maintains an internet site (http://www.sec.gov) that contains reports, proxy and information statements and other information related to issuers that file electronically with the SEC.
We are exposed to various risks as we operate our businesses. To provide a framework to understand our operating environment of the Company, we are providing a brief explanation of the more significant risks associated with our businesses. Although we have tried to identify and discuss key risk factors, others could emerge in the future.
Risks Related to Our Business
Our business, financial condition and results of operations or cash flows could be negatively affected by downturns in economic cycles in general or cyclicality in our end markets, both inside and outside of the U.S. Our future growth also depends, to a significant extent, on improvements in general economic conditions and in conditions in our end markets.
Many of our products are used in industries that are, to varying degrees, cyclical and have historically experienced periodic downturns due to factors such as economic conditions, energy prices, the availability of credit, consumer sentiment, demand and other factors beyond our control. These economic and industry downturns have resulted in diminished product demand and excess capacity for our products. The significant deterioration in economic conditions that occurred during the second half of 2008 and continued into 2009 resulted in disruptions in a number of our end markets. Any future economic disruptions may negatively impact our end markets or the consumers served by those end markets, which would adversely affect our operating results.
Future disruptions in the commercial credit markets may impact liquidity in the global credit market, and we are not able to predict the impact any such worsening conditions would have on our customers in general, and our results of operations specifically. Businesses in one or more of the end markets that we serve, or consumers in one or more of the end markets that our customers serve, may postpone or choose not to make purchases in response to economic uncertainty, tighter credit, negative financial news, unemployment, interest rates, adverse consumer sentiment and declines in housing prices or other asset values.
In particular, the historically cyclical and volatile building and housing sector in the U.S. has not yet fully recovered from the downturn that began in 2007. If the housing, remodeling and residential and commercial construction markets stagnate or deteriorate, demand from such markets for our products, especially our brass rod products, is likely to be adversely affected. Any recovery in such markets will not necessarily directly correlate with increased sales or profitability. Our key products are typically installed late in the housing construction cycle, meaning there is an inherent lag in volumes, and sales of our building and housing products
16
Table of Contents
can be affected by factors such as housing mix (unit size, unit price point and the mix of multi-family versus single-family construction). Sales of our products can also be impacted by the actual timing of housing starts and completions as well as to changes in the materials and fixtures used in construction that may contain fewer copper products or materials and fixtures than were used in the past. In addition, competition from imports and other sources may also dampen the effects of any such recovery on our results of operations.
Similarly, the automotive end market has in the past experienced significant downturns in connection with, or in anticipation of, declines in general economic conditions. Demand for vehicles depends largely on the strength of the economy, employment levels, consumer confidence levels, the availability and cost of credit and the cost of fuel. Negative economic developments could reduce demand for new vehicles, causing our customers to reduce their vehicle and automotive component part production in North America.
The coinage and general consumer end markets are also affected by economic cycles. Demand for coinage-related products generally increases with the number of cash transactions that occur, and the number of cash transactions generally increases during periods of economic growth. Demand for consumer goods is also very sensitive to economic conditions and drives demand in our electronics/ electrical components end market.
As a result, cyclicality in economic conditions and in the end markets that we serve could have a material adverse effect on our business, financial condition, results of operations and cash flows. Our growth prospects also depend, to a significant extent, on the degree by which general economic conditions and conditions in the end markets that we serve continue to improve.
Failure to maintain our balanced book approach would cause increased volatility in our profitability and our operating results and may result in significant losses.
Copper scrap and cathode are subject to significant cyclical price fluctuations. The availability and price of copper scrap and cathode depend on a number of factors outside our control, including general economic conditions, international demand for metal and internal recycling activities by primary copper producers and other consumers of copper. The cost of copper scrap and cathode represents the largest component of our cost of sales.
We use our balanced book approach to substantially reduce the impact of metal price movements on operating margins from our non-toll sales, which are sales for which we assume responsibility for metal procurement and then recover the metal replacement cost from the customer. Non-toll sales represented approximately 75% of our unit sales volume during the year ended December 31, 2014. Under our balanced book approach, we seek to match the timing, quantity and price of the metal component of net sales with the timing, quantity and price of replacement metal purchases on all of our non-toll sales. We use a combination of matching price date of shipment terms, firm price terms and derivatives transactions to achieve our balanced book. See “Management’s Discussion and Analysis of Financial Condition and Results of Operations—Key Factors Affecting Our Results of Operations—Balanced Book”.
We may not be able to maintain our balanced book if our customers become unwilling to bear metal price risk through the matching of price date of shipment terms. We may also not be able to find counterparties for the derivatives transactions entered into in connection with firm price terms, and the cost of those derivatives transactions may increase such that entering into such transactions is no longer cost-effective to us. Those risks may increase during periods of very high copper prices or increased volatility in those prices.
If we fail to effectively maintain our balanced book, our profitability will be significantly affected by fluctuations in metal costs and our ability to recoup metal costs through product pricing. As a result, the volatility of our results of operations would increase dramatically. Furthermore, if we are unable to maintain our balanced book approach, we will potentially replace metal at a different price than the price recovered from the customer, generating a loss in circumstances where the replacement price is higher than the price recovered from the customer.
17
Table of Contents
Although we maintain our balanced book approach, metal costs still affect our profitability through “shrinkage” and inventory valuation adjustments.
Shrinkage loss, which is primarily the loss of raw metal that occurs in the melting and casting operations, is an inherent part of a metal fabrication and conversion business. Despite our use of our balanced book approach to mitigate the impact of metal price fluctuations, we must bear the cost of any shrinkage during production, which may increase the volatility of our results of operations. Because we process a large amount of metal in our operations, a small increase in our shrinkage rates can have a significant effect on our margins and profitability. In addition, if metal prices increase, the same amount of shrinkage will have a greater effect on our manufacturing costs and have a more significant negative impact on our margins and profitability.
The market price of metals and related scrap used in production is subject to significant volatility. During periods when open-market prices decline below net book value, we may need to record a provision to reduce the carrying value of our inventory and increase cost of sales. Additionally, the cost of our inventories is primarily determined using the last-in, first-out (“LIFO”) method. Under the LIFO inventory valuation method, changes in the cost of raw materials and production activities are recognized in cost of sales in the current period. In a period of rising raw material prices, cost of sales expense recognized under LIFO is generally higher than the cash costs incurred to acquire the inventory sold. Conversely, in a period of declining raw material prices, cost of sales recognized under LIFO is generally lower than cash costs incurred to acquire the inventory sold. The impact of LIFO accounting on our financial results may be significant with respect to period-to-period comparisons. During 2013, certain domestic metal inventory quantities were reduced, resulting in a liquidation of LIFO inventory layers carried at lower costs prevailing in prior years as compared with metal prices prevailing in the market at the time of the inventory depletion and the effect of this reduction of inventory decreased cost of sales by $2.0 million. During 2014, certain domestic metal inventory quantities were reduced, resulting in a liquidation of LIFO inventory layers carried at higher costs prevailing in prior years as compared with metal prices prevailing in the market at the time of the inventory depletion and the effect of this reduction of inventory increased cost of sales by $0.6 million. See “Management’s Discussion and Analysis of Operating Results and Financial Condition—Key Factors Affecting Our Results of Operations—Metal Cost”.
Because our balanced book approach does not reduce the effects of fluctuations in metal prices on our working capital requirements, higher metal prices could have a negative effect on our liquidity.
Our balanced book approach does not reduce the impact of the volatility in metal prices on our working capital requirements. Metal prices impact our investment in working capital because our collection terms with our customers are longer than our payment terms to our suppliers. As a result, when metal prices are rising, even if the number of pounds of metal we process does not change, we tend to use more cash or draw more on our asset-based revolving loan facility (“ABL Facility”) to cover the cash flow delay from material replacement purchase to cash collection. Thus, when metal prices increase, our working capital may be negatively affected as we are required to draw more on our cash or available financing sources to pay for raw materials. As a result, our liquidity may be negatively affected by increasing metal prices. Metal price volatility may also require us to draw on working capital sources more quickly and unpredictably, and therefore at higher cost. See “Management’s Discussion and Analysis of Operating Results and Financial Condition—Key Factors Affecting Our Results of Operations—Metal Cost”.
Limited access to raw materials, infrastructure or fuel could negatively affect our business, financial condition or results of operations or cash flows.
Our ability to fulfill our customer orders in a timely and cost-effective manner depends on our ability to secure a sufficient and constant supply of raw materials and fuel and access to infrastructure adequate to fulfill our business needs. Although we often seek to source our copper from scrap, including internally generated scrap and repurchases of our customers’ scrap, where scrap is either not available or is not appropriate for use, we use virgin raw materials such as copper cathode, which are generally more expensive than scrap. We depend on natural gas for our manufacturing operations and source natural gas through open-market purchases.
18
Table of Contents
We depend on scrap for our operations and acquire our scrap inventory from numerous sources. These suppliers generally are not bound by long-term contracts and have no obligation to sell scrap metals to us. In periods of low metal prices, suppliers may elect to hold scrap waiting for higher prices. The supply of scrap metal available to us could be adversely impacted at any time due to slowdowns in industrial production or consumer consumption. If an adequate supply of scrap metal is not available to us, we would be unable to use scrap as a source of supply at desired volumes, forcing us to use a larger amount of more expensive virgin raw materials and our results of operations and financial condition would be materially and adversely affected. Furthermore, with the growth of the economy of China, the demand for certain raw materials has increased significantly while the supply of such raw materials may not have increased correspondingly. In addition, the SEC has recently issued an order amending a rule to allow shares of a physically backed copper exchange traded fund (“ETF”) to be listed and publicly traded. Such fund, and other copper ETFs like it, hold copper cathode as collateral against their shares. The acquisition of copper cathode by copper ETFs and other similar entities may materially decrease or interrupt the availability of copper for immediate delivery in the United States, which could materially increase our cost of copper and copper scrap, result in potential supply shortages, and increase price volatility for copper and copper scrap. All of the above factors may affect our ability to secure the necessary raw materials in a cost-effective manner for production of our products.
We may experience disruptions in the supply of natural gas as a result of delivery curtailments to industrial customers due to extremely cold weather. We may also experience disruptions or increases in cost with respect to our access to water, electrical power, transport and wastewater treatment services and other infrastructure (including those subject to our transition services agreement with the parent of our predecessor). We may also experience other delays or shortages in the supply of raw materials. If we are unable to obtain adequate, cost efficient or timely deliveries of required raw materials and fuel or adequate and cost-effective access to infrastructure, we may be unable to manufacture sufficient quantities of products on a timely basis. This could cause us to lose sales, incur additional costs, delay new product introductions or harm our reputation in the end markets that we serve. An inability to find an adequate and timely supply of raw materials or adequate and cost-effective access to infrastructure could have a material adverse effect on our profit margin, and in turn on our business, financial condition, results of operations or cash flows.
Increases in the cost of energy could cause our cost of sales to increase, thereby reducing operating results and limiting our operating flexibility.
In 2014, the cost of energy and utilities represented approximately 7% of our non-metal cost of sales. The prices of natural gas and electricity can be particularly volatile. As a result, our natural gas and electricity costs may fluctuate dramatically, and we may not be able to mitigate the effect of higher natural gas and electricity costs on our cost of sales. A substantial increase in energy costs could cause our operating costs to increase and our business, financial condition, results of operations and cash flows may be materially and adversely affected. Although we attempt to mitigate short-term volatility in natural gas and electricity costs through the use of derivatives contracts, we may not be able to eliminate the long-term effects of such cost volatility. Furthermore, in an effort to offset the effect of increasing costs, we may have also limited our potential benefit from declining costs.
Our substantial leverage and debt service obligations may adversely affect our financial condition and restrict our operating flexibility, including our ability to raise additional capital to fund our operations, limit our ability to react to changes in the economy or our industry and prevent us from meeting our obligations under our indebtedness.
We are highly leveraged. As of December 31, 2014, our total indebtedness was $380.8 million. We also had an additional $199.5 million available for borrowing under the ABL Facility as of that date. Based on the amount of indebtedness outstanding and applicable interest rates at December 31, 2014, our annualized cash interest expense would be $36.1 million, which includes $0.5 million of interest expense related to our capital lease obligations. Additionally, we may potentially borrow under the ABL Facility, which is a floating-rate obligation, and thus, the related interest expense is subject to increase in the event interest rates were to rise.
19
Table of Contents
Our substantial indebtedness and debt service obligations could have important consequences for investors, including:
| • | they may impose, along with the financial and other restrictive covenants under our credit agreements, significant operating and financial restrictions, including our ability to borrow money, dispose of assets or raise equity for our working capital, capital expenditures, dividend payments, debt service requirements, strategic initiatives or other purposes; |
| • | they may limit our flexibility in planning for, or reacting to, changes in our operations or business; |
| • | we may be more highly leveraged than some of our competitors, which may place us at a competitive disadvantage; and |
| • | they may make us more vulnerable to downturns in our business or the economy. |
Any of these consequences could have a material adverse effect on our business, financial condition, results of operations, prospects and ability to satisfy our obligations under our indebtedness. In addition, there would be a material adverse effect on our business, financial condition, results of operations and cash flows if we were unable to service our indebtedness or obtain additional financing, as needed.
Covenants under our debt agreements impose operating and financial restrictions. Failure to comply with these covenants could have a material adverse effect on our business, financial condition, results of operations or cash flows.
The agreement governing the ABL Facility and the indenture governing the 9.50% Senior Secured Notes due 2019 (“Senior Secured Notes”) contain various covenants that limit or prohibit our ability, among other things, to:
| • | incur or guarantee additional indebtedness; |
| • | pay dividends on our capital stock or redeem, repurchase, retire or make distributions in respect of our capital stock or subordinated indebtedness or make certain other restricted payments; |
| • | make certain loans, acquisitions, capital expenditures or investments; |
| • | sell certain assets, including stock of our subsidiaries; |
| • | enter into certain sale and leaseback transactions; |
| • | create or incur certain liens; |
| • | consolidate, merge, sell, transfer or otherwise dispose of all or substantially all of our assets; |
| • | enter into certain transactions with our affiliates; and |
| • | engage in certain business activities. |
The agreement governing the ABL Facility also contains a financial covenant that requires us to maintain a fixed charge coverage ratio that is tested whenever excess availability, as defined in such agreement, falls below a certain level. The fixed charge coverage ratio, as defined in the agreement, requires us to maintain a minimum ratio of “EBITDA” (as defined in the agreement governing the ABL Facility) to the amount of our fixed charges for the twelve consecutive months prior to the date on which the ratio is tested. The agreement governing the ABL Facility also requires excess availability to remain above a certain level to avoid default. For more information regarding these covenants, please see “Management’s Discussion and Analysis of Financial Condition and Results of Operations—Liquidity and Capital Resources—Covenant Compliance” and “Outstanding Indebtedness”.
As of December 31, 2014, we were in compliance with all of the covenants contained in our debt agreements. A violation of covenants may result in default or an event of default under our debt agreements.
20
Table of Contents
Upon the occurrence of an event of default under the agreement governing the ABL Facility or the indenture governing the Senior Secured Notes, the requisite lenders under the ABL Facility or the requisite noteholders under the indenture could elect to declare all amounts of such indebtedness outstanding to be immediately due and payable and, in the case of the ABL Facility, terminate any commitments to extend further credit. If we are unable to repay those amounts, the lenders under such facilities may proceed against the collateral granted to them to secure such indebtedness. Substantially all of our assets are pledged as collateral under the ABL Facility and to secure the Senior Secured Notes. If the lenders or noteholders, as applicable, accelerate the repayment of borrowings, such acceleration would have a material adverse effect on our business, financial condition, results of operations or cash flows. Furthermore, cross-default provisions in the ABL Facility provide that any default under the indenture governing the Senior Secured Notes or other significant debt agreements could trigger a cross-default under the ABL Facility. If we are unable to repay the amounts outstanding under these agreements or obtain replacement financing on acceptable terms, which ability will depend in part upon the impact of economic conditions on the liquidity of credit markets, our creditors may exercise their rights and remedies against us and the assets that serve as collateral for the debt, including initiating a bankruptcy proceeding.
Although the terms of the credit agreement governing the ABL Facility and the indenture governing the Senior Secured Notes contain restrictions on our ability to incur additional indebtedness, these restrictions are subject to a number of important qualifications and exceptions, which would allow us to borrow additional indebtedness. Additional leverage could have a material adverse effect on our business, financial condition and results of operations and could increase other risks harmful to our financial condition and results of operations.
For a more detailed description on the limitations on our ability to incur additional indebtedness and our compliance with financial covenants, please see “Management’s Discussion and Analysis of Financial Condition and Results of Operations—Liquidity and Capital Resources—Covenant Compliance” and “Outstanding Indebtedness”.
To service our indebtedness, we will require a significant amount of cash. Our ability to generate cash and the availability of our cash to service our indebtedness depends on many factors beyond our control, and any failure to meet our debt service obligations could harm our business, financial condition and results of operations.
Our ability to satisfy our debt obligations will primarily depend upon our future operating performance. As a result, prevailing economic conditions and financial, business and other factors, many of which are beyond our control, will affect our ability to generate cash to satisfy our debt obligations. Included in such factors are the requirements, under certain scenarios, of our counterparties that we post cash collateral to maintain our hedging positions. In addition, metal price declines, by reducing our borrowing base, could limit availability under the ABL Facility and further constrain our liquidity.
If we do not generate sufficient cash flow from operations to satisfy our debt service obligations, including payments required to be made on the ABL Facility and the Senior Secured Notes, we may have to undertake alternative financing plans, such as refinancing or restructuring our indebtedness, selling assets, reducing or delaying capital investments or seeking to raise additional capital. Our ability to restructure or refinance our indebtedness will depend on the condition of the capital markets and our financial condition at such time. Any refinancing of our indebtedness could be at higher interest rates and may require us to comply with more onerous covenants, which could further restrict our business operations. The terms of existing or future debt instruments (including the ABL Facility and the Senior Secured Notes) may restrict us from adopting some of these alternatives, which in turn could exacerbate the effects of any failure to generate sufficient cash flow to satisfy our debt service obligations. In addition, any failure to make payments of interest and principal on our outstanding indebtedness on a timely basis would likely result in a reduction of our credit ratings, which could harm our ability to incur additional indebtedness or refinance our indebtedness on acceptable terms.
Our inability to generate sufficient cash flow to satisfy our debt service obligations, or to refinance our obligations at all or on commercially reasonable terms, would have an adverse effect, which could be material,
21
Table of Contents
on our business, financial condition and results of operations, may restrict our current and future operations, particularly our ability to respond to business changes or to take certain actions, as well as on our ability to satisfy our obligations in respect of the ABL Facility and the Senior Secured Notes.
Because some of our indebtedness bears interest at rates that fluctuate with changes in certain prevailing short-term interest rates, we are vulnerable to interest rate increases.
As of December 31, 2014, we had no amounts outstanding under the ABL Facility, which bears interest at rates that fluctuate with changes in certain prevailing short-term interest rates. If we borrow under the ABL Facility and if interest rates increase dramatically, we could be unable to service our debt, which could have a material adverse effect on our business, financial condition, results of operations or cash flows.
If we were to lose order volumes from any of our largest customers, our sales volumes, revenues and cash flows could be reduced.
Our business is exposed to risks related to customer concentration. Our five largest customers were responsible for 30% of our net sales for the year ended December 31, 2014. A loss of order volumes from, or a loss of industry share by, any major customer could negatively affect our business, financial condition or results of operations by lowering sales volumes, increasing costs and lowering profitability. In addition, adverse economic and market conditions could also harm our business by negatively affecting our customers, which could impair their ability to pay for products they have purchased from our Company. Our balance sheet reflected an allowance for doubtful accounts totaling $1.0 million at both December 31, 2014 and 2013. If adverse economic and market conditions impair the ability of our customers to pay us in the future, our allowance for doubtful accounts and write-offs of accounts receivable from the Company’s customers may increase in the future, which could materially and adversely affect our financial condition and results of operations.
We do not have long-term contractual arrangements with a substantial number of our customers, and our sales volumes and net sales could be reduced if our customers switch some or all of their business with us to other suppliers.
During the year ended December 31, 2014, a majority of our net sales were generated from customers who do not have long-term contractual arrangements with us, including several of our largest customers. These customers purchase products and services from us on a purchase order basis and may choose not to continue to purchase our products and services. A significant loss of these customers or a significant reduction in their purchase orders could have a material negative impact on our sales volume and business, or cause us to reduce our prices, which could have a material adverse effect on our business, financial condition, results of operations and cash flows.
Our business could be disrupted if our customers shift either their manufacturing or sourcing offshore.
Much of our business depends on maintaining close geographical proximity to our customers because the costs of transporting metals across large distances can be prohibitive. If the general trend in relocating or contracting manufacturing capacity to foreign countries continues, especially those in the automotive parts, electrical connectors, and building and housing components industries, such relocations or contracting may disrupt or end our relationships with some customers and could lead to losing business to foreign competitors. In addition, some customers may seek to source their finished products offshore, thereby also increasing the amount of manufacturing offshore and thereby reducing demand for brass rod in the United States. These risks would increase to the extent we are unable to expand internationally when our customers do so.
Decreased demand from the United States Mint could have a material adverse effect on our business, financial condition and results of operations.
The United States Mint is a significant customer of Olin Brass. Olin Brass has a contractual arrangement to supply nickel and brass coinage strip to the two United States Mint locations. Our supply agreement with the
22
Table of Contents
United States Mint runs through 2017. The United States Mint can also terminate the contract in whole or in part for convenience, and the damages payable to us by the United States Mint for such a termination do not include lost profits. The loss or reduction of any authorized supplier arrangement with the United States Mint for coin manufacture could have a material adverse effect on our business, financial condition and results of operations. In addition, the United States Government contracting and procurement cycle can be affected by the timing of, and delays in, the legislative process. As a result, our net sales and operating income may fluctuate, causing us to occasionally experience declines in net sales or earnings as compared to the immediately preceding quarter, and comparisons of our operating results on a period-to-period basis may not be meaningful.
Additionally, the U.S. Treasury department announced in December 2011 a halt in the production of Presidential $1 coins for circulation due to a lack of demand (which is primarily the result of the U.S. continuing the use of the dollar bill). Although their production will continue for the collectibles market, it is uncertain when their production for circulation will be resumed. This action has adversely impacted our business and is expected to adversely impact our business over the next several years. In addition, in December 2013, three members of the Federal Reserve Board of Governors issued a report that concluded that a transition to the $1 coin would result in higher net costs to the Federal government and to the public, which contrasts with previous reports by the Government Accountability Office that there would be a net benefit from a transition. Further actions to curtail coin production could have an adverse effect on our business, financial condition or results of operations.
Following trends in electronic commerce, the United States Mint in the future may reduce its output of coinage and thus reduce its demand for coinage strip. A reduction in demand for coinage strip could have a material adverse effect on our business, financial condition and results of operations.
Decreased demand from Alliant Techsystems (“ATK”) could have a material adverse effect on our business, financial condition and results of operations.
Currently, a sizeable share of the production of our Olin Brass segment supports ATK, a supplier of munitions to the U.S. Army. ATK uses our product to service its contract with the U.S. Army to supply the U.S. Army’s arsenal located at Independence, Missouri. ATK is under contract with the U.S. Army to supply it with small-caliber ammunition and Olin Brass is under contract to supply ATK. In spite of these contractual arrangements, any decrease in demand from ATK or other disruption of our relationship with ATK could have a material adverse effect on our business, financial condition and results of operations.
Competition in our industry could adversely affect our business, financial condition and results of operations.
We are engaged in a highly competitive industry. Each of our segments competes with a limited number of companies. The Olin Brass segment competes with domestic and foreign manufacturers of copper and brass alloys in the form of strip, sheet and foil. The Chase Brass segment competes with domestic as well as foreign manufacturers of brass rod and beginning in 2013, encountered increased competition from foreign rod suppliers. The A.J. Oster segment primarily competes with distributors, mills and processors of copper and brass products. Furthermore, we believe that domestic sales to customers that are not made by major companies, including us, are fragmented among many smaller companies. In the future, these smaller companies may choose to combine, creating a more significant domestic competitor against our business. We may be required to explore additional initiatives in each of our segments in order to maintain our sales volume at a competitive level. Increased competition in any of the fields in which our segments operate could adversely affect our business, financial condition and results of operations.
Currently, anti-dumping orders impose import duties on copper and brass products from France, Germany, Italy and Japan which allow us and our domestic competitors to compete more fairly against French, German, Italian and Japanese producers in the U.S. copper and brass product market. On March 21, 2012, the International Trade Commission (“ITC”) Commissioners voted to continue anti-dumping orders for brass sheet and strip from Germany, Italy, France and Japan. While domestic manufacturers lobby for the continued extension of these
23
Table of Contents
orders, if they expire, import duties on metal products from these countries will be significantly reduced, increasing the ability of such foreign producers to compete with our products domestically. Additionally, on March 15, 2012, the United States-Korea Free Trade Agreement (“KORUS FTA”) became effective, which largely eliminates tariffs on Korean industrial products imported to the United States. The reduction in prices of Korean products resulting from the KORUS FTA has increased the ability of Korean manufacturers to compete with our products and has had a negative effect on our business. Furthermore, the termination of any anti-dumping orders or other changes to international trade regimes could adversely affect our business, financial condition and results of operations.
Adverse developments in our relationship with our employees could have a material adverse effect on our business, financial condition, results of operations and cash flows.
As of December 31, 2014, we had 1,896 employees, 1,182, or approximately 62%, of whom at various sites were members of unions. See “Business—Employees” for a discussion of our collective bargaining agreements and labor unions. We have generally maintained good relationships with all unions and employees, which has been an important aspect of our ability to be competitive in our industry. The current collective bargaining agreements that are in place are a meaningful determinant of our labor costs and are very important to our ability to maintain flexibility to fulfill our customers’ needs. As we attempt to renew our collective bargaining agreements, labor negotiations may not conclude successfully and, in that case, may result in a significant increase in the cost of labor or may result in work stoppages or labor disturbances, disrupting our operations. Any such cost increases, stoppages or disturbances could have a material adverse effect on our business, financial condition, results of operations and cash flows by limiting plant production, sales volumes and profitability.
Our participation in multi-employer union pension plans may have a material adverse effect on our financial performance.
We are required to make contributions to the IAM National Pension Plan (“IAM Plan”), a multi-employer pension plan that covers certain of our union employees. Our U.S. multi-employer pension plan expense totaled $3.7 million in 2014. Our obligations may be impacted by the funded status of the plan, the plan’s investment performance, changes in the participant demographics, financial stability of contributing employers and changes in actuarial assumptions. In addition, if a participating employer becomes insolvent and ceases to contribute to a multiemployer plan, the unfunded obligation of the plan will be borne by the remaining participating employers. Under current law, an employer that withdraws or partially withdraws from a multi-employer pension plan may incur withdrawal liability to the plan. If, in the future, we choose to withdraw from the multi-employer pension plan in which we participate, we will likely need to record withdrawal liabilities, which could negatively impact our financial performance in the applicable periods.
Our operations are subject to risks of natural disasters, acts of war, terrorism or widespread illness at our domestic and international locations, any one of which could result in a business stoppage and negatively affect our business, financial condition or results of operations.
Our business operations depend on our ability to maintain and protect our facilities, computer systems and personnel. Our facilities and transportation for our employees are susceptible to damage from earthquakes and other natural disasters such as fires, floods, hurricanes, tornadoes and similar events. We have facilities located throughout North America, including in Illinois, Ohio, Connecticut, Rhode Island, Missouri, California, Puerto Rico and Mexico, as well as in China and Japan. We take precautions to safeguard our facilities, including obtaining insurance and maintaining health and safety protocols. However, a natural disaster, such as a tornado, fire, flood, hurricane or earthquake, could cause a substantial interruption in our operations, damage or destroy our facilities or inventory and cause us to incur additional expenses. The insurance we maintain against natural disasters may not be adequate to cover our losses in any particular case, which would require us to expend significant resources to replace any destroyed assets, thereby harming our financial condition and prospects significantly.
24
Table of Contents
For example, Olin Brass’ manufacturing facilities and A.J. Oster’s California facility are located near geologic fault zones, and therefore are subject to greater risk of earthquakes which could result in increased costs and a disruption in our operations, which could harm our operating results and financial condition significantly. Our facility in East Alton, Illinois is located in a flood zone, and all of our facilities in the Midwestern United States are subject to the risk of tornadoes and damaging winds. Should earthquakes or other catastrophes, such as fires, tornadoes, hurricanes, floods, power outages, communication failures or similar events disable our facilities, we do not have readily available alternative facilities from which we could continue our operations, and any resulting stoppage could have a negative effect on our operating results. Acts of terrorism, widespread illness and war could also have a negative effect at our international and domestic facilities.
Any prolonged disruptions at or failures of our manufacturing facilities and equipment could have a material adverse effect on our business, financial condition, results of operations and cash flows.
Our ability to satisfy our customers’ orders in an efficient manner and to effectively manage inventory levels is dependent on the proper operation of our facilities and equipment. On-time delivery and accurate order fulfillment are essential to maintaining customer satisfaction and generating repeat business. To the extent we experience prolonged equipment failures, quality control incidents or other disruptions such as a major fire at our manufacturing facilities, our ability to satisfy our customers could be negatively impacted, and if, as a result, customer satisfaction decreased, this would have a material adverse effect on our business, financial condition, results of operations and cash flows.
In addition, we do not have redundancy in our operations on certain critical pieces of equipment, including the Olin Brass hot and cold mills and Chase Brass extruders. If this equipment were damaged, we would have to make alternative arrangements to replicate these processes, which could be costly and result in manufacturing delays, which could materially adversely affect our business, financial condition and results of operations.
Inclement weather conditions could adversely affect our business, financial condition and results of operations.
Inclement weather conditions in the areas where our facilities are located could have an adverse effect on our business, financial condition and results of operations. For example, extreme cold, such as that experienced during the first quarter of 2014, heavy snowfall or other extreme weather conditions over a prolonged period could result in temporary facility closures, disruptions in our access to natural gas, electricity, fuel and other raw materials and delayed shipments of our products. Furthermore, inclement weather conditions also could disrupt the operations of one or more of our suppliers and result in production delays. Any of these events or circumstances could materially disrupt our business operations and thereby adversely affect our business, financial condition and results of operations.
Failure to meet the capital expenditure requirements for the introduction of new products or substantial further increases in the production of existing products could have a material adverse effect on our business, financial condition and results of operations.
Certain of our existing products, such as Eco Brass® and other potential “green portfolio” products, require separate production streams from those used for our other products in order to comply with applicable standards. As a result, in order to meet expected increased demand for such products, we will be required to make additional capital expenditures to modify or expand our facilities. In addition, if we introduce new products in the future, those products may also require modification or expansion of our production facilities. To accommodate any such production changes, we will be required to make additional capital expenditures to expand or modify our facilities. If we are unable to meet our capital expenditure requirements, we may not be able to timely respond to our customers’ needs and may lose their business to our competitors who may be better equipped to meet these needs, which could have a material adverse effect on our business, financial condition and results of operations.
25
Table of Contents
The increased use of substitute materials and miniaturization may adversely affect our business.
In many applications, copper and other commodities may be replaced by other materials such as aluminum, stainless steel, plastic and other materials and the use of copper and other commodities may be reduced by the miniaturization of components. Increased prices of copper could encourage our customers to use substitute materials and/or miniaturization to limit the amount of copper in their products and applications in an attempt to control their overall product costs. For example, historically, there has been discussion over reducing or eliminating copper content in coins in reaction to the rising prices of copper. Such increased use of substitute materials and/or miniaturization could have a material adverse effect on prices and demand for our products.
In order to operate our business successfully, we must meet evolving customer requirements for copper and copper-alloy products and invest in the development of new products.
If we fail to develop or enhance our products to satisfy evolving customer demands, our business, operating results, financial condition and prospects may be harmed significantly. The market for copper and copper-alloy products is characterized by changing technologies, periodic new product introductions and evolving customer and industry standards. Eco Brass® and other products in our “green portfolio” are examples of new products based on new technologies that have been developed as a result of evolving customer and industry standards. Our competitors are continuously searching for more cost-effective alloys and substitutes for copper and copper-alloys, including products in our “green portfolio”. Our current and prospective customers may choose products that might be offered at a lower price than our products. To achieve market acceptance for our products, we must effectively and timely anticipate and adapt to customer requirements and offer products and services that meet customer demands. This strategy may cause us to pursue other technologies or capabilities through acquisitions or strategic alliances. We may experience design, engineering and other difficulties that could delay or prevent the development, introduction or marketing of new products and services. Our failure to successfully develop and offer products or services that satisfy customer requirements may significantly weaken demand for our products and services, which would likely cause a decrease in our net sales and harm our operating results. In addition, if our competitors introduce products and/or services based on new or alternative technologies, our existing and future products and/or services could become obsolete, which would also weaken demand for our products or services, thereby decreasing our net sales and harming our operating results.
If we fail to implement our business strategy, including our growth initiatives, our business, financial condition, results of operations or cash flows could be adversely affected.
Our future financial performance and success depend in large part on our ability to successfully implement our business strategy. We may not be able to successfully implement our business strategy or be able to continue improving our operating results. In particular, we may not be able to continue to achieve all operating cost savings, further enhance our product mix, expand into selected targeted regions or continue to mitigate our exposure to metal price fluctuations.
The implementation of our business strategy may be affected by a number of factors beyond our control, such as increased competition, legal and regulatory developments, general economic conditions, the increase of operating costs or our ability to introduce new products and end-use applications. Any failure to successfully implement our business strategy could adversely affect our business, financial condition, results of operations or cash flows. We may, in addition, decide to alter or discontinue certain aspects of our business strategy at any time.
Furthermore, we may not be successful in our growth initiatives and may not be able to effectively manage expanded or acquired operations. See “—We face a number of risks related to future acquisitions and joint ventures”.
26
Table of Contents
A portion of our net sales is derived from our international operations, which exposes us to certain risks inherent in doing business abroad.
In the aggregate, our international operations accounted for 6% of our net sales in 2014. We have operations in China through Olin Luotong Metals, in Singapore through our subsidiary GBC Metals Asia Pacific PTE, and in Japan through our Dowa Joint Venture. We also have distribution arrangements in the United Kingdom and Germany. In addition, we have various licensing agreements around the world and our products are distributed globally. We plan to continue to explore opportunities to expand our international operations. Our international operations generally are subject to risks, including:
| • | changes in U.S. and international governmental regulations, trade restrictions and laws, including tax laws and regulations; |
| • | currency exchange rate fluctuations; |
| • | tariffs and other trade barriers; |
| • | the potential for nationalization of enterprises or government policies favoring local production; |
| • | interest rate fluctuations; |
| • | high rates of inflation; |
| • | currency restrictions and limitations on repatriation of profits; |
| • | differing protections for intellectual property and enforcement thereof; |
| • | divergent environmental laws and regulations; |
| • | political, economic and social instability; |
| • | unfamiliarity with foreign laws and regulations and ability to enforce obligations of foreign counterparties; |
| • | difficulties in staffing and managing international operations and labor unrest; |
| • | language and cultural barriers; |
| • | natural disasters and widespread illness; |
| • | geopolitical conditions, such as terrorist attacks, war, or other military action; and |
| • | a divergence between the price of copper on the copper exchange in China and the LME, and the COMEX. |
The occurrence of any of these events could cause our costs to rise, limit growth opportunities or have a negative effect on our operations and our ability to plan for future periods, and subject us to risks not generally prevalent in North America.
New governmental regulations or legislation, or changes in existing regulations or legislation, may subject us to significant costs, taxes and restrictions on our operations.
Our operations are subject to a wide variety of U.S. Federal, state, local and non-U.S. laws and regulations, including those relating to taxation, international trade and competition and firearms.
For example, the Olin Brass segment provides strip and cups to both the military and commercial munitions markets. In the year ended December 31, 2014, the shipments by Olin Brass to the munitions end market accounted for 44% of its total shipments. The private use of firearms is subject to extensive regulation. Recent U.S. Federal legislative activities generally seek either to restrict or ban the sale and, in some cases, the ownership of various types of firearms and ammunition. Several states currently have laws in effect similar to
27
Table of Contents
that legislation. Any restriction on the use of firearms and ammunition could affect the demand for munitions, and in turn could negatively affect our business, financial condition or results of operations. Moreover, any changes in the government budget or policy over military spending may adversely affect our contracts with customers in the munitions end market.
Changes in U.S. or foreign tax laws, including possibly with retroactive effect, and audits by tax authorities could result in unanticipated increases in our tax expense and affect profitability and cash flows. For example, recent proposals to lower the U.S. corporate tax rate would require us to reduce our net deferred tax assets upon enactment of the related tax legislation, with a corresponding material, one-time increase to income tax expense, but our income tax expense and payments would be materially reduced in subsequent years. The cost of our inventories is primarily determined using LIFO. Under the LIFO inventory valuation method, changes in the cost of raw materials and production activities are recognized in cost of sales in the current period. Generally in a period of rising prices, LIFO recognizes higher costs of goods sold, which both reduces current income and assigns a lower value to the year-end inventory. There have been legislative proposals to repeal the election to use the LIFO method for U.S. Federal income tax purposes. According to these proposals, taxpayers that currently use the LIFO method would be required to revalue their beginning LIFO inventory to its first-in, first-out (“FIFO”) value. As of December 31, 2014, if the FIFO method had been used instead of the LIFO method, our inventories would have been $100.9 million higher than the value reflected in our December 31, 2014 balance sheet. This increase in the carrying value of inventory would result in a one-time increase in taxable income of $46.3 million after taking into consideration total current differences in book-to-tax valuations of inventory. The repeal of the election to use the LIFO method could result in a substantial cash tax liability, which could adversely impact our liquidity and financial condition. Furthermore, a transition to the FIFO method could result in an increase in the volatility of our earnings, a greater disparity between our earnings and net sales in our financial statements, and an increase in the costs associated with our derivative transactions to mitigate metal price fluctuations.
In addition, any termination or expiration of trade restrictions imposed on copper products by foreign governments could adversely affect our business as such products become freely tradable into the U.S. This may increase competition against our products and adversely affect our business, financial condition or results of operations. See “—Competition in our industry could adversely affect our business, financial condition and results of operations”.
We may not be able to sustain the annual cost savings realized as part of our cost-reduction initiatives.
We will continue to undertake productivity and cost-reduction initiatives intended to improve performance and improve operating cash flow. Although we believe that the cost savings we have realized through our efforts so far are permanent reductions, we may not be able to sustain some or all of these cost savings on an annual basis in the future, which could have an adverse effect on our business, financial condition, results of operations and cash flows. Moreover, there can be no assurance that any new initiatives undertaken in the future will be completed or beneficial to us or that any estimated cost savings from such activities will be realized.
Our operations expose our employees to risk of injury or death. We may be subject to claims that are not covered by, or exceed, our insurance. Additional safety measures or rules imposed by regulatory agencies may reduce productivity, require additional capital expenditure or reduce profitability.
Because of the manufacturing activities conducted at our facilities, there exists a risk of injury or death to our employees or other visitors, notwithstanding the safety precautions we take. Our operations are subject to regulation by Federal, state and local agencies responsible for employee health and safety, including the Occupational Safety and Health Administration, which has from time to time taken various actions with respect to our facilities, including imposing fines for certain isolated incidents. Despite policies and standards that are designed to minimize such risks, we may nevertheless be unable to avoid material liabilities for any employee death or injury that may occur in the future. These types of incidents may not be covered by or may exceed our insurance coverage and may have a material adverse effect on our results of operations and financial condition.
28
Table of Contents
In addition, various regulatory agencies may impose additional safety measures or other rules designed to increase workplace safety. Compliance with such requirements could require additional capital expenditure or cause process changes that could reduce the productivity of the affected facilities, which could increase our costs and reduce our profitability.
Our ability to retain our senior management team is critical to the success of our business, and failure to do so could materially adversely affect our business, financial condition, results of operations and cash flows.
We are dependent on our senior management team to remain competitive in our industry. We have employment contracts or severance agreements with members of our senior management team, including John Wasz, Robert Micchelli, Kevin Bense, Devin Denner and William Toler. Failure to renew the employment contracts or other agreements of a significant portion of our senior management team could have a material adverse effect on our business, financial condition, results of operations and cash flows. Members of our senior management team are subject to employment conditions or arrangements that permit the employees to terminate their employment without notice. We do not maintain any life insurance policies for our benefit covering our key employees.
If our senior management team were not able to dedicate adequate time to our business, due to personal or other factors, if we lose or suffer an extended interruption in the services of a significant portion of our senior management team, or if a significant portion of our senior management team were to terminate employment within a short period it could have a material adverse effect on our business, financial condition, results of operations and cash flows. In addition, the market for qualified individuals may be highly competitive and we may not be able to attract and retain qualified personnel to replace or succeed members of our senior management team, should the need arise.
Rising employee medical costs may adversely affect operating results.
The extent to which our employee medical costs will increase in the future is difficult to assess at this time. During the year ended December 31, 2014, our costs related to employee health benefits were $18.6 million. Because the implementation of various laws regarding employee medical costs and health insurance, including the Patient Protection and Affordable Care Act of 2010 and other related regulations, is currently in progress, there is some uncertainty as to how these current and future laws and regulations will affect our employee medical and other benefit costs. In addition, the cost of health care has been rising generally over time, and such increases have been in the past and will in the future be unpredictable and at times significant. If we were to incur significant increases in employee medical costs and related items, whether due to such laws and regulations or otherwise, it could adversely impact our operating results.
Environmental costs could decrease our net cash flow and adversely affect our profitability.
Our operations are subject to extensive regulations governing the creation, use, transportation and disposal of wastes and hazardous substances, air and water emissions, remediation, workplace exposure and other environmental matters. The costs of complying with such laws and regulations, including participation in assessments and clean-ups of sites, as well as internal voluntary programs, can be significant and will continue to be so for the foreseeable future. Future environmental regulations could impose stricter compliance requirements on us and the end markets that we serve. Additional pollution control equipment, process changes, or other environmental control measures may be needed at some of our facilities to meet future requirements. Additionally, evolving regulatory standards and expectations could result in increased litigation and/or increased costs of compliance with environmental laws, all of which could have a material and adverse effect on our business, financial condition, results of operations and cash flows.
Environmental matters for which we may be liable may arise in the future at our present sites, at previously owned sites, sites previously operated by us, sites owned by our predecessors or sites that we may acquire in the
29
Table of Contents
future. Our operations or liquidity in a particular period could be affected by certain health, safety or environmental matters, including remediation costs and damages related to several sites. The properties we own or lease are located in areas with a history of heavy industrial use. See “Business—Government Regulation and Environmental Matters”. The CERCLA established responsibility for clean-up without regard to fault for persons who have released or arranged for disposal of hazardous substances at sites that have become contaminated and for persons who own or operate contaminated facilities. In many cases, courts have imposed joint and several liability on parties at CERCLA clean-up sites. Because a number of our properties are located in or near industrial or light industrial use areas, they may have been contaminated by pollutants which may have migrated from neighboring facilities or have been released by prior occupants. Some of our properties have been affected by releases of cutting oils and similar materials, and we are investigating and remediating such known contamination pursuant to applicable environmental laws. The costs of these clean-ups have not been material in the past. We are not currently subject to any material claims or notices with respect to clean-up or remediation under CERCLA or similar laws for contamination at our leased or owned properties or at any off-site location. However, we cannot rule out the possibility that we could be notified of such claims in the future. It is also possible that we could be identified by the Environmental Protection Agency, a state agency or one or more third parties as a potentially responsible party under CERCLA or under analogous state laws.
On November 19, 2007, we acquired the assets and operations relating to the worldwide metals business of Olin Corporation. Olin Corporation agreed to retain liability arising out of then existing conditions on certain of our properties for any remedial actions required by environmental laws, and agreed to indemnify us for all or part of a number of other environmental liabilities. Since 2007, Olin Corporation has been performing remedial actions at the facilities in East Alton, Illinois and Waterbury, Connecticut, and has been participating in remedial actions at our other properties as well. If Olin Corporation were to stop its environmental remedial activities at our properties, we could be required to assume responsibility for these activities, the cost of which could be material. For additional information concerning the indemnity granted to us by Olin Corporation for environmental liabilities, see “Business—Government Regulation and Environmental Matters”.
New governmental regulation of greenhouse gas emissions may subject us to significant new costs and restrictions on our operations.
In the past, Congress has considered legislation that would regulate greenhouse gas emissions, including a cap-and-trade system, under which emitters would be required to buy allowances to offset emissions of greenhouse gas. In addition, several states, including states where we have manufacturing plants, are considering various greenhouse gas registration and reduction programs. The EPA has also proposed several comprehensive regulations that would require reductions in greenhouse gas emissions by several types of sources. Certain of our manufacturing plants use significant amounts of energy, including electricity and natural gas, and certain of our plants emit amounts of greenhouse gas above certain minimum thresholds that are likely to be regulated. Greenhouse gas regulation could increase the price of the electricity we purchase, increase costs for our use of natural gas, potentially restrict access to, or the use of, natural gas, require us to purchase allowances to offset our own emissions, require operational changes or the use of new equipment or result in an overall increase in our costs of raw materials, any one of which could significantly increase our costs or capital expenditures, reduce our competitiveness or otherwise negatively affect our business, financial condition or results of operations. It is too early to predict how any potential greenhouse gas regulation may affect us.
We may be subject to litigation that could strain our resources and distract management.
From time to time, we are involved in a variety of claims, lawsuits and other disputes arising in the ordinary course of business. These suits concern issues including product liability, contract disputes, employee-related matters and personal injury matters. It is not feasible to predict the outcome of all pending suits and claims, and the ultimate resolution of these matters as well as future lawsuits could have a material adverse effect on our business, financial condition, results of operations, cash flows or reputation.
30
Table of Contents
We may face product liability claims that are costly and create adverse publicity.
If any of the products that we sell cause harm to any of our customers, we could be exposed to product liability lawsuits. If we were found liable under product liability claims, we could be required to pay substantial monetary damages and see a decrease in demand for our products. Further, even if we successfully defended ourselves against this type of claim, we could be forced to spend a substantial amount of money in litigation expenses, our management could be required to spend time and resources to defend against these claims, we could face negative publicity or our reputation could otherwise suffer, any of which could result in a decrease in demand for our products or otherwise harm our business.
New derivatives legislation could have an adverse impact on our ability to use derivative contracts to manage risks associated with our business and on the cost of our derivative contracts.
We use over-the-counter, or OTC, derivatives products to manage our metal commodity, natural gas and electricity price risks. The Dodd-Frank Act Wall Street Reform and Consumer Protection Act (the “Dodd-Frank Act”) has increased regulatory oversight of OTC derivatives markets and imposed restrictions on certain derivative transactions, which could affect the use of derivatives in hedging transactions. Not all implementing regulations of the Dodd-Frank Act have been finalized. If final regulations subject us to heightened capital or margin requirements or otherwise increase our costs, directly or indirectly through costs passed on to us by our trading counterparties, of entering into OTC derivatives transactions, they could have an adverse effect on our ability to hedge risks associated with our business and on the cost of maintaining our derivative contracts.
We have recently remediated a material weakness in our internal control over financial reporting; if we are unable to maintain the effectiveness of our internal controls, our financial results may not be accurately reported.
In connection with the preparation of our financial statements for the quarter ended June 30, 2014, we concluded there was a material weakness in our internal control over financial reporting related to deficiencies in the execution, supervision and review related to the financial statement close process of our Olin Brass reportable segment. The Exchange Act Rule 12b-2 and Rule 1-02(a)(4) of Regulation S-X define a material weakness as a deficiency, or combination of deficiencies, in internal control over financial reporting, such that there is a reasonable possibility that a material misstatement of our annual or interim financial statements will not be prevented or detected and corrected on a timely basis.
With the oversight of senior management and our audit committee, during the third and fourth quarters of 2014, management took significant steps to remediate the underlying causes of the material weakness. Steps taken include specific training and communication of our established financial statement close processes and procedures to Olin Brass reportable segment management and financial reporting personnel. Additionally, we implemented formal monitoring and supervision of the execution of monthly reportable segment closing processes and procedures by finance personnel in our corporate office to ensure established closing processes at our Olin Brass reportable segment are properly executed on a timely basis during our monthly closing process and documentation of the execution and completion of the closing procedures is maintained. Further, we hired additional finance personnel in our Olin Brass operating segment to ensure adequate staffing is in place to properly complete monthly closing processes. Management believes that the actions described above have been fully implemented and tested and that the material weakness in our internal control over financial reporting has now been remediated.
Although we consider this material weakness to have been fully remediated, if our remediation proves ineffective, or if in the future we are unable to maintain effective internal controls, additional resulting material restatements could occur, regulatory actions could be taken, and a resulting loss of investor confidence in the reliability of our financial statements could materially adversely affect the value of our common stock. We may be required to expend substantial funds and resources in order to rectify any deficiencies in our internal controls.
31
Table of Contents
Further, if lenders and/or investors lose confidence in the reliability of our financial statements, it could have a material adverse effect on our ability to fund our operations.
Increasing costs of insurance may adversely impact our results of operations.
While we are insured against certain claims, including in respect of general liability, property damage (including natural disasters and fire), equipment damage and injury to our personnel, our insurance may not cover all of the claims to which we may become subject, and future coverage of such claims may not be available on commercially reasonable terms, if at all. If we are unable to obtain adequate insurance coverage, substantial property or equipment damage, personal injury or other claims could materially impact our earnings and cash flows. Continued increases in insurance costs, additional coverage restrictions or unavailability of certain insurance products and other factors could increase our operating costs and further increase our exposure to natural disasters and other causes of catastrophic loss, as well as personal injury and other claims.
Failure to protect, or uncertainty regarding the validity, enforceability or scope of, our intellectual property rights could impair our competitive position.
Our products are covered by a variety of proprietary rights that are important to our competitive position and success. Because the intellectual property associated with our products, including Eco Brass® technology, is evolving and rapidly changing, our current intellectual property rights may not protect us adequately. We rely on a combination of patents, trademarks, trade secrets and other intellectual property rights, in addition to contractual rights, to protect the intellectual property we use in our business. However, it is possible that our intellectual property rights could be challenged, invalidated or violated. Our pending patent applications may not be granted or, if granted, the resulting patent may be challenged or invalidated by our competitors or by other third parties. Despite our efforts to protect our proprietary rights, third parties may attempt to copy or otherwise obtain and use our intellectual property without our authorization. In addition, monitoring unauthorized use of our intellectual property is difficult, and we cannot be certain the steps we take to protect our intellectual property will prevent infringement or identify all unauthorized users of our intellectual property.
Because the extent to which any new technologies will enjoy intellectual property protection is uncertain, there can be no assurance that we will be able to maintain our competitive position by enforcing intellectual property rights in the future. Furthermore, our competitors independently may develop similar or improved technologies that limit the value of our intellectual property or design around patents issued to us. If competitors or third parties are able to use our intellectual property or are able to successfully challenge, circumvent, invalidate or render unenforceable our intellectual property, we likely would lose a significant portion of our competitive advantage in the market for products covered by such intellectual property. We may not be successful in securing or maintaining proprietary or patent protection for the technology used in our products and services, and protection that is secured may be challenged and possibly lost. We may have to prosecute unauthorized uses of our intellectual property and the expense, time, delay and burden on management of such litigation could prevent us from maintaining or increasing our business. Our inability to protect our intellectual property adequately for these and other reasons could result in weakened demand for our products and services, which could result in a material adverse effect on our business, financial condition, results of operations or cash flows.
In addition, Chase Brass has entered into agreements with Mitsubishi Shindoh pursuant to which Chase Brass has access to and the right to use certain of its technologies including lead-free Eco-Brass rod and the sublicensing of lead-free Eco-Brass ingot. To the extent that Mitsubishi Shindoh faces challenges to its intellectual property rights in its technologies or fails to protect or enforce such intellectual property rights, it could have an adverse effect on our ability to market our products and/or services that incorporate those technologies or could permit competitors using infringing or similar technology to compete more effectively against us, which would result in a decline in our net sales.
32
Table of Contents
We could become subject to litigation regarding intellectual property rights, which could harm our business significantly.
Our commercial success will continue to depend in part on our ability to make and sell our products or provide our services without infringing the patents or proprietary rights of third parties. We face these risks with respect to intellectual property that we have developed internally, as well as with respect to intellectual property rights we have acquired from third parties. For example, pursuant to a license agreement, we have access to and the right to use certain technologies owned by Mitsubishi Shindoh, including our lead-free Eco-Brass rod. To the extent that Mitsubishi Shindoh fails to adequately protect the technologies upon which we rely, our competitors may be able to use such technologies or develop similar technologies independently. Recently in July 2014, a complaint was filed against Mitsubishi Shindoh alleging that, among other things, certain patents owned by Mitsubishi Shindoh (including those used in our Eco-Brass technology) are invalid and unenforceable. While we do not anticipate such litigation will have a material impact on our results of operations, there can be no assurances that a favorable outcome will be achieved, and any of the foregoing events, including an adverse result in this litigation, could lead to increased competition and negatively impact our volumes and/or margins.
Additionally, if the technologies upon which we rely infringe upon the patents or proprietary rights of third parties, we may be unable to continue using such technologies or we may face lawsuits related to our past use of these technologies. Furthermore, our competitors, who have made significant investments in competing technologies or products, may seek to apply for and obtain patents that will prevent, limit or interfere with our ability to make or sell our products or provide our services.
If we are unsuccessful in defending against any challenge to our rights to market and sell our products, our rights to use third-party technologies or to provide our services, we may, among other things, be required to:
| • | pay actual damages, royalties, lost profits and/or increased damages and the third party’s attorneys’ fees, which may be substantial; |
| • | cease the development, manufacture and/or marketing of our products or services that use the intellectual property in question through a court-imposed injunction or settlement agreement; |
| • | expend significant resources to modify or redesign our products or other technology or services so that they do not infringe the intellectual property rights of others or to develop or acquire non-infringing technology, which may not be possible; or |
| • | obtain licenses to the disputed rights, which could require us to pay substantial upfront fees and future royalty payments and may not be available to us on acceptable terms, if at all. |
Even if we successfully defend any infringement claims, the expense, time, delay and burden on management of litigation could prevent us from maintaining or increasing our business. Further, negative publicity could decrease demand for our products and services and cause our revenues to decline, thus harming our operating results significantly.
If we are unable to protect the confidentiality of our proprietary information and know-how, the value of our technology, products and services could be harmed significantly.
We rely on trade secrets, know-how and other proprietary information in operating our business. We seek to protect this information, in part, through the use of confidentiality agreements with employees, consultants, advisors and others who may have access to such proprietary information upon commencement of their relationships with us. These agreements require that all confidential information developed by the individual or made known to the individual by us during the course of the individual’s relationship with us be kept confidential and not disclosed to third parties. Our agreements with employees also provide that any inventions conceived by the individual in the course of rendering services to us are our exclusive property. Nonetheless, those agreements may not provide adequate protection for our trade secrets, know-how or other proprietary information and
33
Table of Contents
prevent their unauthorized use or disclosure. In the event of unauthorized use or disclosure of our trade secrets or proprietary information, these agreements may not provide meaningful protection, particularly for our trade secrets or other confidential information.
To the extent that consultants, key employees or other third parties apply technological information independently developed by them or by others to our proposed products, disputes may arise as to the proprietary rights to such information, which may not be resolved in our favor. The risk that other parties may breach confidentiality agreements or that our trade secrets become known or independently discovered by competitors, could harm us by enabling our competitors, who may have greater experience and financial resources, to copy or use our trade secrets and other proprietary information in the advancement of their products, methods or technologies. The disclosure of our trade secrets would impair our competitive position, thereby weakening demand for our products or services and harming our ability to maintain or increase our customer base.
In addition, to the extent that we do not fulfill our contractual or other obligations to adequately protect the technologies to which we have been granted access by Mitsubishi Shindoh, we could be liable for any resulting harm to its business or could lose further access to this technology, which could harm our business, operating results or financial condition.
Disruption or failures of our information technology systems could have a material adverse effect on our business.
The operation of the Company’s business depends on the Company’s information technology systems, most of which have not been updated for many years. As a result, our information technology systems are more susceptible to security breaches, operational data loss, general disruptions in functionality, and may not be compatible with new technology. We depend on our information technology systems for the effectiveness of our operations and to interface with our customers, as well as to maintain financial records and accuracy. Disruption or failures of our information technology systems or security breaches could impair our ability to effectively and timely provide our services and products and maintain our financial records, which could damage our reputation and have a material adverse effect on our business. Olin Brass began the process of implementing a fully integrated enterprise resource planning (“ERP”) system to replace its current management information systems and plans to implement the system in a phased approach over the course of the next several years, and such implementation may present challenges. Such challenges include, among other things, training of personnel, communication of new rules and procedures, changes in corporate culture, migration of data and the potential instability of the new system. Furthermore, large-scale system implementations are complex and time-consuming projects that are capital intensive and can span several months or even years. Certain of our business and financial processes also may require transformation in order to effectively leverage the ERP system’s benefits. The ERP system implementation may not result in the anticipated improvements and the cost of implementation may outweigh the benefits. There can be no assurance that the ERP system will be successfully implemented, and failure to do so could adversely affect our business, financial condition, results of operations and the effectiveness of our internal controls over financial reporting.
Our liquidity, financial condition and ability to operate our business could be adversely affected by the failure of financial institutions to fulfill their commitments under committed credit facilities.
The ABL Facility is an asset-based revolving loan facility with a maximum availability of $200.0 million, subject to a borrowing base calculation. We may request an increase in the maximum commitments, at our option and under certain circumstances, of up to $50.0 million (but the lenders are not obligated to grant such an increase). If one or more of the financial institutions that are lenders under the ABL Facility were to default on its obligations to provide available borrowings under the ABL Facility, such a default could have a material adverse effect on our liquidity, and we might not be able to fulfill our cash needs using other sources, which could have a material and adverse effect on our financial condition and ability to operate our business.
34
Table of Contents
Global Brass and Copper Holdings, Inc. is a holding company and relies on future dividends and other payments, advances and transfers of funds from its subsidiaries to meet its financial obligations and provide cash for any dividends it might pay in the future.
Global Brass and Copper Holdings, Inc. has no direct operations and derives all of its cash flow from its subsidiaries. Because Global Brass and Copper Holdings, Inc. conducts its operations through its subsidiaries, Global Brass and Copper Holdings, Inc. depends on those entities for dividends and other payments to generate the funds necessary to meet its financial obligations, and to pay any dividends with respect to its common stock. Legal and contractual restrictions in the credit agreement governing the ABL Facility, the indenture governing the Senior Secured Notes and other debt agreements governing current and future indebtedness of Global Brass and Copper Holdings, Inc.’s subsidiaries, as well as the financial condition and operating requirements of Global Brass and Copper Holdings, Inc.’s subsidiaries, may limit the ability of Global Brass and Copper Holdings, Inc. to obtain cash from its subsidiaries. The earnings from, or other available assets of, Global Brass and Copper Holdings, Inc.’s subsidiaries may not be sufficient to pay dividends or make distributions or loans to enable Global Brass and Copper Holdings, Inc.’s to pay any dividends on our common stock. See “Risks Related to an Investment in our Common Stock—Our ability to pay regular dividends to our shareholders is subject to the discretion of our Board of Directors and may be limited by our debt agreements and limitations in Delaware law.”
We face a number of risks related to future acquisitions and joint ventures.
We may continue to seek opportunities for further acquisitions to supplement our operations and for expansion of our international presence, particularly in Asia, through joint ventures.
Acquisitions and joint ventures involve a number of risks which could have an adverse effect on our business, financial condition, results of operations and cash flows, including the following:
| • | we may experience adverse short-term effects on our operating results; |
| • | we may be unable to successfully and rapidly integrate the new businesses, personnel and products with our existing business, including financial reporting, management and information technology systems; |
| • | we may experience higher than anticipated costs of integration and unforeseen operating difficulties and expenditures, including potential disruption of our ongoing business and distraction of management; |
| • | an acquisition may be in a market or geographical area in which we have little experience and could increase the scope, geographic diversity and complexity of our operations; |
| • | the acquisition or joint venture formation process may require significant attention by our senior management and the engagement of outside advisors (and the payment of related fees), and proposed acquisitions and joint ventures may not be successfully completed; |
| • | we may lose key employees or customers of the acquired company; and |
| • | we may encounter unknown contingent liabilities that could be material. |
In addition, we may require additional debt or equity financing for future acquisitions, and such financing may not be available on favorable terms, if available at all. We may not be able to successfully integrate or profitably operate any new business we acquire, and we cannot assure you that any such acquisition will meet our expectations. The process of integrating acquired operations into our existing operations may result in unforeseen operating difficulties and may require significant financial resources that would otherwise be available for the ongoing development or expansion of existing operations. Finally, in the event we decide to discontinue pursuit of a potential acquisition, we will be required to immediately expense all costs incurred in pursuit of the possible acquisition, which may have an adverse effect on our results of operations in the period in which the expense is recognized.
35
Table of Contents
Certain of our operations are conducted through joint ventures which have unique risks.
Certain of our operations are conducted through two joint ventures, one located in China and one located in Japan. With respect to our joint ventures, we may share ownership and management responsibilities with one or more partners that may not share our goals and objectives. Operating a joint venture requires us to operate the business pursuant to the terms of the agreement that we entered into with our partners, including additional organizational formalities, as well as to share information and decision making. As a result, our investments in joint ventures involve risks that are different from the risks involved in owning facilities and operations independently. These risks include the possibility that our joint ventures or our partners: have economic or business interests or goals that are or become inconsistent with our business interests or goals; are in a position to take action contrary to our instructions, requests, policies or objectives; subject the joint venture to liabilities exceeding those contemplated; take actions that reduce our return on investment; or take actions that harm our reputation or restrict our ability to run our business. Additionally, our ability to sell our interest in a joint venture may be subject to contractual and other limitations. Accordingly, any such occurrences could adversely affect our financial condition, operating results and cash flows.
Risks Related to an Investment in Our Common Stock
Our common stock has a limited trading history, and the trading price of our common stock may be adversely affected if an active trading market in our common stock is not sustained. Our stock price may be volatile, and you may be unable to resell your shares at or above the purchase price or at all.
Our common stock began trading on the New York Stock Exchange (“NYSE”) on May 23, 2013 and as a result has a limited trading history. We cannot predict the extent to which investor interest will sustain an active trading market. The market price of our common stock will be subject to significant fluctuations in response to, among other factors, variations in our operating results and market conditions specific to our industry. If an active public market is not sustained, it may be difficult for you to sell your shares at a price that is attractive to you, or at all.
The price of our common stock may fluctuate significantly and you could lose all or part of your investment.
Our stock price may be volatile. Volatility in the market price of our common stock may prevent you from being able to sell your common stock at or above the price you paid for your common stock. The market price for our common stock could fluctuate for various reasons, including:
| • | our operating and financial performance and prospects; |
| • | the price outlook for copper and copper-alloys; |
| • | our quarterly or annual earnings or those of other companies in our or other industries; |
| • | conditions that impact demand for our products and services; |
| • | future announcements concerning our business or our competitors’ businesses; |
| • | our results of operations that vary from those of our competitors; |
| • | shrinkage from our processing operations; |
| • | the public’s reaction to our press releases, other public announcements and filings with the SEC; |
| • | changes in earnings estimates or recommendations by securities analysts who track our common stock; |
| • | market and industry perception of our success, or lack thereof, in pursuing our growth strategy; |
| • | general market, economic and political conditions; |
| • | strategic actions by us or our competitors, such as acquisitions or restructurings; |
36
Table of Contents
| • | changes in government and environmental regulation; |
| • | changes in accounting standards, policies, guidance, interpretations or principles; |
| • | arrival and departure of key personnel; |
| • | the number of shares to be publicly traded in the future; |
| • | sales of common stock by us, members of our management team or other holders; |
| • | adverse resolution of new or pending litigation against us; |
| • | business disruptions, costs and future events related to proxy contests or other shareholder activity; |
| • | any announcements by third parties of significant claims or proceedings against us; |
| • | changes in general market, economic and political conditions and their effects on global economies or financial markets, including those resulting from natural disasters, terrorist attacks, acts of war, widespread illness and responses to such events; or |
| • | any material weakness in our internal control over financial reporting. |
See “—Risks Related to Our Business”. These and other factors may lower the market price of our common stock, regardless of our actual operating performance. As a result, our common stock may trade at prices significantly below the price at which it was purchased.
Furthermore, in recent years the stock market has experienced significant price and volume fluctuations. This volatility has had a significant impact on the market price of securities issued by many companies, including companies in our industry. The changes frequently appear to occur without regard to the operating performance of the affected companies. Hence, the price of our common stock could fluctuate based upon factors that have little or nothing to do with us, and these fluctuations could materially reduce our share price and materially affect the value of your investment.
Future sales of shares of our common stock in the public market could cause our stock price to fall significantly even if our business is profitable.
We may issue shares of our common stock or other securities from time to time as consideration for future acquisitions or investments. If any such acquisition or investment is significant, the number of shares of our common stock, or the number or aggregate principal amount, as the case may be, of other securities that we may issue may in turn be substantial. We may also grant registration rights covering those shares of our common stock or other securities in connection with any such acquisitions or investments.
We cannot predict the size of future issuance of our common stock or the effect, if any, that future issuances and sales of our common stock will have on the market price of our common stock. Sales of substantial amounts of our common stock (including shares of our common stock issued in connection with an acquisition or investment), or the perception that such sales could occur, may adversely affect prevailing market prices for our common stock.
Our ability to pay regular dividends to our shareholders is subject to the discretion of our Board of Directors and may be limited by our debt agreements and limitations in Delaware law.
On November 7, 2013, we announced that our Board of Directors had approved the initiation of a quarterly dividend of $0.0375 per share of our common stock to our stockholders and the Board of Directors has declared a dividend of $0.0375 per share of common stock in every subsequent quarter to date. Any future determination to pay dividends, however, will be at the discretion of the Board of Directors and will be dependent on then-existing conditions, including our financial condition, earnings, legal requirements including limitations in Delaware law, restrictions in our debt agreements, including those governing the ABL Facility and the Senior Secured Notes,
37
Table of Contents
that limit our ability to pay dividends to stockholders, our strategic opportunities and other factors the Board of Directors deems relevant. The Board of Directors may, in its sole discretion, change the amount or frequency of dividends or discontinue the payment of dividends entirely. At this time, the agreement governing the ABL Facility and the indenture governing the Senior Secured Notes generally restrict or limit the payment of dividends to shareholders. The indenture governing the Senior Secured Notes includes a “restricted payments” basket based on Consolidated Net Income (as defined in the indenture). It increases based on 50% of Consolidated Net Income (as so defined) and decreases by 100% of Consolidated Net Loss (as so defined). The basket may be negative or insufficient to pay dividends. For the foregoing reasons, you will not be able to rely on dividends to receive a return on your investment. Accordingly, if you purchase shares, realization of a gain on your investment may depend on the appreciation of the price of our common stock, which may never occur.
Provisions in our charter and bylaws and provisions of Delaware law may delay or prevent our acquisition by a third party, which might diminish the value of our common stock.
The amended and restated certificate of incorporation and amended and restated bylaws of Global Brass and Copper Holdings, Inc. contain several provisions that may make it more difficult or expensive for a third party to acquire control of us without the approval of the Board of Directors. These provisions also may delay, prevent or deter a merger, acquisition, tender offer, proxy contest or other transaction that might otherwise result in our stockholders receiving a premium over the market price for their common stock. The provisions include, among others:
| • | a prohibition on actions by written consent of the stockholders; |
| • | removal of directors only for cause; |
| • | vacancies on the Board of Directors may be filled only by the Board of Directors; |
| • | no cumulative voting; |
| • | advance notice requirements for stockholder proposals and director nominations; and |
| • | supermajority approval requirement for an amendment of the amended and restated certificate of incorporation or amended and restated bylaws. |
Section 203 of the Delaware General Corporation Law may affect the ability of an “interested stockholder” to engage in certain business combinations, including mergers, consolidations or acquisitions of additional shares, for a period of three years following the time that the stockholder becomes an “interested stockholder.” An “interested stockholder” is defined to include persons owning directly or indirectly 15% or more of the outstanding voting stock of a corporation. Global Brass and Copper Holdings, Inc. has elected in its amended and restated certificate of incorporation not to be subject to Section 203 of the Delaware General Corporation Law. Nevertheless, the amended and restated certificate of incorporation contains provisions that have the same effect as Section 203 of the Delaware General Corporation Law.
The provisions of the amended and restated certificate of incorporation and amended and restated bylaws of Global Brass and Copper Holdings, Inc. and the ability of the Board of Directors to create and issue a new series of preferred stock or implement a stockholder rights plan could discourage potential takeover attempts and reduce the price that investors might be willing to pay for shares of our common stock in the future, which could reduce the market price of our common stock.
If securities analysts do not publish research or reports about our company, or if they issue unfavorable commentary about us or our industry or downgrade our common stock, the price of our common stock could decline.
The trading market for our common stock depends in part on the research and reports that third- party securities analysts publish about our company and our industry. One or more analysts could downgrade our
38
Table of Contents
common stock or issue other negative commentary about our company or our industry. In addition, we may be unable or be slow to attract research coverage. Alternatively, if one or more of these analysts cease coverage of our company, we could lose visibility in the market. As a result of one or more of these factors, the trading price of our common stock could decline.
The requirements of being a public company may strain our resources, divert management’s attention and affect our ability to attract and retain qualified board members.
As a public company, we incur significant legal, accounting and other expenses that we did not incur as a private company, including costs associated with public company reporting requirements. We also have incurred and will incur costs associated with the Sarbanes-Oxley Act, the Dodd-Frank Wall Street Reform and Consumer Protection Act and related rules implemented or to be implemented by the SEC and the NYSE. The expenses incurred by public companies generally for reporting and corporate governance purposes have been increasing, and the costs we incur for such purposes may strain our resources. We expect these rules and regulations to increase our legal and financial compliance costs, divert management’s attention to ensuring compliance and to make some activities more time-consuming and costly, although we are currently unable to estimate these costs with any degree of certainty. We have hired a number of people to assist with the enhanced requirements of being a public company but may still need to hire more people for that purpose. In addition, these laws and regulations could make it more difficult or costly for us to obtain certain types of insurance, including director and officer liability insurance, and we may be forced to accept reduced policy limits and coverage or incur substantially higher costs to obtain the same or similar coverage. In addition, these laws and regulations could make it more difficult for us to attract and retain qualified persons to serve on the Board of Directors, its board committees or as its executive officers and may divert management’s attention. Furthermore, if Global Brass and Copper Holdings, Inc. is unable to satisfy its obligations as a public company, we could be subject to delisting of our common stock, fines, sanctions and other regulatory action.
Any issuance of preferred stock could make it difficult for another company to acquire us or could otherwise adversely affect holders of our common stock, which could depress the price of our common stock.
The Board of Directors has the authority to issue preferred stock and to determine the preferences, limitations and relative rights of shares of preferred stock and to fix the number of shares constituting any series and the designation of such series, without any further vote or action by its stockholders. Such preferred stock could be issued with voting, liquidation, dividend and other rights superior to the rights of common stock. The potential issuance of preferred stock may delay or prevent a change in control of Global Brass and Copper Holdings, Inc., discouraging bids for our common stock at a premium over the market price, and adversely affect the market price and the voting and other rights of the holders of our common stock.
39
Table of Contents
CAUTIONARY STATEMENT CONCERNING FORWARD-LOOKING STATEMENTS
This report contains “forward-looking statements” that involve risks and uncertainties. You can identify forward-looking statements because they contain words such as “believes,” “expects,” “projects,” “may,” “would,” “should,” “seeks,” “approximately,” “intends,” “plans,” “estimates,” “anticipates,” or similar expressions that relate to our strategy, plans or intentions. All statements we make relating to our estimated and projected earnings, margins, costs, expenditures, cash flows, growth rates and financial results or to our expectations regarding future industry trends are forward-looking statements. In addition, we, through our senior management, from time to time make or may make forward-looking public statements concerning our expected future operations and performance and other developments. These forward-looking statements are subject to known and unknown risks, uncertainties and other factors that may change at any time, and, therefore, our actual results may differ materially from those that we expected. We derive many of our forward-looking statements from our operating budgets and forecasts, which are based upon many detailed assumptions. While we believe that our assumptions are reasonable, we caution that it is very difficult to predict the impact of known factors, and, of course, it is impossible for us to anticipate all factors that could affect our actual results. All forward-looking statements contained in this report are based upon information available to us on the date of this report.
Important factors that could cause actual results to differ materially from our expectations, which we refer to as “cautionary statements”, are disclosed under the “Risk Factors” section in Item 1A in this annual report on Form 10-K. All forward-looking information in this report and subsequent written and oral forward-looking statements attributable to us, or persons acting on our behalf, are expressly qualified in their entirety by the cautionary statements. Some of the factors that we believe could affect our results include, but are not limited to:
| • | the impact of our substantial indebtedness, including the effect of our ability to borrow money, fund working capital and operations and make new investments; |
| • | general economic conditions affecting the markets in which our products are sold; |
| • | our ability to implement our business strategies, including acquisition activities; |
| • | our ability to continue implementing our balanced book approach to substantially reduce the impact of fluctuations in metal prices on our earnings and operating margins; |
| • | shrinkage from processing operations and metal price fluctuations, particularly copper; |
| • | the condition of various markets in which our customers operate, including the housing and commercial construction industries; |
| • | our ability to maintain business relationships with our customers on favorable terms; |
| • | the impact of a loss in customer volume or demand or a shift by customers of their manufacturing or sourcing offshore; |
| • | our ability to compete effectively with existing and new competitors; |
| • | limitations on our ability to purchase raw materials, particularly copper; |
| • | fluctuations in commodity and energy prices and costs; |
| • | our ability to maintain sufficient liquidity as commodity and energy prices rise; |
| • | the effects of industry consolidation or competition in our business lines; |
| • | operational factors affecting the ongoing commercial operations of our facilities, including technology failures, catastrophic weather-related damage, regulatory approvals, permit issues, unscheduled blackouts, outages or repairs or unanticipated changes in energy costs; |
| • | operational factors affecting ongoing commercial operations of our facilities resulting from inclement weather conditions; |
40
Table of Contents
| • | supply, demand, prices and other market conditions for our products; |
| • | our ability to accommodate increases in production to meet demand for our products; |
| • | our ability to continue our operations internationally and the risks applicable to international operations; |
| • | government regulations relating to our products and services, including new legislation relating to derivatives and the elimination of the dollar bill and EPA regulations regarding the registration and marketing of bactericidal copper products; |
| • | our ability to maintain effective internal control over financial reporting as we become subject to public company requirements; |
| • | our ability to realize the planned cost savings and efficiency gains as part of our various initiatives; |
| • | our ability to successfully execute acquisitions and joint ventures; |
| • | workplace safety issues; |
| • | our ability to retain key employees; |
| • | adverse developments in our relationship with our employees or the future terms of our collective bargaining agreements; |
| • | rising employee medical costs; |
| • | environmental costs and our exposure to environmental claims; |
| • | our exposure to product liability claims; |
| • | our ability to successfully manage litigation; |
| • | our ability to maintain cost-effective insurance policies; |
| • | our ability to maintain the confidentiality of our proprietary information, to protect the validity, enforceability or scope of our intellectual property rights and manage litigation regarding our intellectual property rights; |
| • | litigation regarding our intellectual property rights could affect us and harm our business; |
| • | our limited experience managing and operating as an SEC reporting company; |
| • | our ability to service our substantial indebtedness; |
| • | fluctuations in interest rates; and |
| • | restrictive covenants in our indebtedness that may adversely affect our operational flexibility. |
We caution you that the foregoing list of factors may not contain all of the material factors that are important to you. In addition, in light of these risks and uncertainties, the matters referred to in the forward-looking statements contained in this report may not in fact occur. Accordingly, investors should not place undue reliance on those statements. We undertake no obligation to publicly update or revise any forward-looking statement as a result of new information, future events or otherwise, except as otherwise required by law.
41
Table of Contents
Item 1B. Unresolved Staff Comments.
None.
The following table summarizes our major facilities as of December 31, 2014:
| Entity |
Operation |
Location |
Owned or Leased |
Products | ||||
| Corporate | Corporate Headquarters | Schaumburg, Illinois | Leased | N/A | ||||
| Olin Brass segment(1) | Mill Products | East Alton, Illinois(2) | Owned(3) | Copper-based strip Clad copper & copper-alloy strip | ||||
| Fabricated Products | East Alton, Illinois | Owned(3) | Stamped & drawn copper-based parts | |||||
| Fineweld Tube | Cuba, Missouri | Owned | Welded copper-alloy tube | |||||
| Bryan Metals | Bryan, Ohio | Owned | Copper-based strip | |||||
| Copper-based strip and foil | ||||||||
| Somers Thin Strip | Waterbury, Connecticut | Owned | Stainless steel light gauge strip | |||||
| Olin Luotong Metals | Guangzhou, China | Owned building; 50-year lease on land | Copper-based strip | |||||
| Olin Brass Headquarters |
Louisville, Kentucky | Leased | N/A | |||||
| Chase Brass segment | Manufacturing | Montpelier, Ohio(4) | Owned | Alloy-rod | ||||
| Warehouse | Los Angeles, California | Leased | Alloy-rod | |||||
| A.J. Oster segment (5) | Processing and Distribution | Warwick, Rhode Island | Leased | Copper-alloy strip, aluminum foil, specialty stainless steel, specialty rod and wire | ||||
| Processing and Distribution | Alliance, Ohio | Owned | ||||||
| Processing and Distribution | Carol Stream, Illinois | Owned | ||||||
| Processing and Distribution | Yorba Linda, California | Leased | ||||||
| Processing and Distribution | Caguas, Puerto Rico | Owned | ||||||
| Processing and Distribution | Queretaro, Mexico | Owned | ||||||
| A.J. Oster Headquarters |
Warwick, Rhode Island | Leased | N/A |
| (1) | All of Olin Brass’ copper and copper-alloy sheet and strip mills are ISO 9001-2008 certified. |
| (2) | The East Alton, Illinois facility is TS 16949 certified. |
| (3) | Certain utility infrastructure at the East Alton, Illinois facility is leased by Olin Brass from Olin Corporation. |
| (4) | The Montpelier, Ohio facility is ISO 9001-2008 certified. |
| (5) | All of A.J. Oster’s processing and distribution centers are ISO 9001-2008 certified. |
Pursuant to a 2007 transition services agreement, Olin Corporation supplies Olin Brass with natural gas, water, steam and waste water disposal, among other things, at its East Alton, Illinois facility. According to the transition services agreement, Olin Corporation has agreed to provide utility services until Olin Corporation ceases operations at its East Alton, Illinois facility, at which time Olin Brass has the option to acquire the utilities infrastructure at fair market value. The initial five-year term of the transition services agreement expired in November 2012 and automatically renews for one-year terms thereafter, subject to termination by either party upon one year’s notice. The transition services agreement renewed automatically in November 2014, and we are currently negotiating an extension to the transition services agreement.
42
Table of Contents
We are currently and from time to time involved in a variety of claims, lawsuits and other disputes arising in the ordinary course of business, none of which management currently believes are, or will be, material to our business.
Item 4. Mine Safety Disclosures.
Not applicable.
43
Table of Contents
| Item 5. | Market for Registrant’s Common Equity, Related Stockholder Matters and Issuer Purchases of Equity Securities. |
Secondary Offering
On February 3, 2014, the Company completed an additional follow-on public offering of 7,310,000 shares of its common stock, including 910,000 shares of common stock sold in connection with the full exercise of the option to purchase additional shares granted to the underwriters. Halkos sold all of the shares in the offerings and received all of the net proceeds.
Holders of Record
Our common stock is traded on the New York Stock Exchange (ticker symbol BRSS). As of February 24, 2015, the number of holders of record of our common stock was approximately 75.
Market Information for Common Stock
Shares of our common stock have been trading since May 23, 2013. As a result, our table below only provides data beginning with the second quarter of 2013. The high and low selling prices per share of our common stock, as well as the cash dividend declared per share of our common stock, for quarters during 2013 and 2014 were as follows:
| 2014 | ||||||||||||||||
| First Quarter |
Second Quarter |
Third Quarter |
Fourth Quarter |
|||||||||||||
| High |
$ | 18.13 | $ | 17.30 | $ | 17.41 | $ | 14.73 | ||||||||
| Low |
15.04 | 14.31 | 14.45 | 11.49 | ||||||||||||
| Cash dividends declared |
0.0375 | 0.0375 | 0.0375 | 0.0375 | ||||||||||||
| 2013 | ||||||||||||||||
| First Quarter |
Second Quarter |
Third Quarter |
Fourth Quarter |
|||||||||||||
| High |
n/a | $ | 14.98 | $ | 21.45 | $ | 19.74 | |||||||||
| Low |
n/a | 11.75 | 13.34 | 15.63 | ||||||||||||
| Cash dividends declared |
n/a | n/a | n/a | 0.0375 | ||||||||||||
For certain information regarding our equity compensation plans, see Part III—Item 12, “Security Ownership of Certain Beneficial Owners and Management and Related Stockholder Matters”.
Dividends
Both the ABL Facility and the indenture governing the Senior Secured Notes contain restrictions as to the payment of dividends. See “Management’s Discussion and Analysis of Financial Condition and Results of Operations—Liquidity and Capital Resources” included elsewhere in this annual report for further discussion of these restrictive covenants.
Issuer Purchases of Equity Securities
None
44
Table of Contents
Performance Graph
This performance graph shall not be deemed “soliciting material” or to be “filed” with the SEC for purposes of Section 18 of the Securities Exchange Act of 1934, as amended (Exchange Act), or otherwise subject to the liabilities under that Section, and shall not be deemed to be incorporated by reference into any filing of Global Brass and Copper Holdings, Inc. under the Securities Act of 1933, as amended, or the Exchange Act.
The following graph shows a comparison from May 23, 2013 (the date our common stock commenced trading on the New York Stock Exchange) through December 31, 2014 of the cumulative total return for our common stock, the Russell 2000 Index (“Total Market Index”) and the S&P SmallCap 600 Index—Materials (“Materials Index”). The graph assumes that $100 was invested at the market close on May 23, 2013 in the common stock of Global Brass and Copper Holdings, Inc., the Total Market Index and the Materials Index and data assumes reinvestments of dividends. The stock price performance of the following graph is not necessarily indicative of future stock price performance.
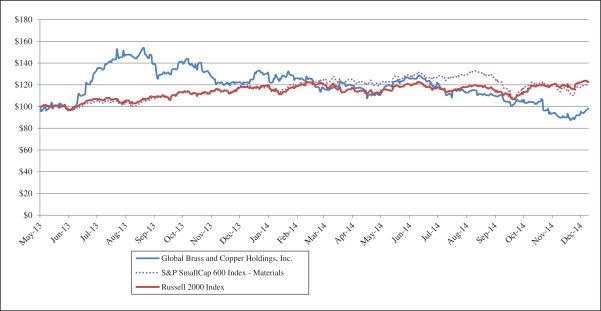
45
Table of Contents
Item 6. Selected Financial Data.
Set forth below is selected historical consolidated financial data of our business as of the dates and for the periods indicated. The selected historical consolidated financial data for the years ended December 31, 2014, 2013 and 2012 and as of December 31, 2014 and 2013 have been derived from our audited consolidated financial statements included elsewhere in this annual report. The selected historical consolidated financial data as of December 31, 2012, 2011 and 2010 and for the years ended December 31, 2011 and 2010 have been derived from our audited consolidated financial statements not included in this annual report.
The selected historical consolidated financial data should be read in conjunction with the information about the limitations on comparability of our financial results, including as a result of acquisitions. See Item 7, “Management’s Discussion and Analysis of Financial Condition and Results of Operations”, Item 1A, “Risk Factors”, and our consolidated financial statements and related notes included in Item 8 to this annual report.
| (in millions, except per share data) | Year Ended December 31, | |||||||||||||||||||
| 2014 | 2013 | 2012 | 2011 | 2010 | ||||||||||||||||
| Statements of Operations Data: |
||||||||||||||||||||
| Net sales |
$ | 1,711.4 | $ | 1,758.5 | $ | 1,650.5 | $ | 1,779.1 | $ | 1,658.7 | ||||||||||
| Cost of sales |
1,546.8 | 1,576.2 | 1,467.3 | 1,583.5 | 1,496.7 | |||||||||||||||
|
|
|
|
|
|
|
|
|
|
|
|||||||||||
| Gross profit |
164.6 | 182.3 | 183.2 | 195.6 | 162.0 | |||||||||||||||
| Selling, general and administrative expenses (1) |
76.9 | 110.8 | 92.7 | 69.4 | 68.9 | |||||||||||||||
|
|
|
|
|
|
|
|
|
|
|
|||||||||||
| Operating income |
87.7 | 71.5 | 90.5 | 126.2 | 93.1 | |||||||||||||||
| Interest expense |
39.6 | 39.8 | 39.7 | 40.0 | 25.1 | |||||||||||||||
| Loss on extinguishment of debt |
— | — | 19.6 | — | — | |||||||||||||||
| Other expense, net |
0.5 | 0.3 | 0.1 | 0.4 | 0.8 | |||||||||||||||
|
|
|
|
|
|
|
|
|
|
|
|||||||||||
| Income before provision for income taxes and equity income |
47.6 | 31.4 | 31.1 | 85.8 | 67.2 | |||||||||||||||
| Provision for income taxes |
16.6 | 22.2 | 19.2 | 31.4 | 26.6 | |||||||||||||||
|
|
|
|
|
|
|
|
|
|
|
|||||||||||
| Income before equity income |
31.0 | 9.2 | 11.9 | 54.4 | 40.6 | |||||||||||||||
| Equity income, net of tax |
1.1 | 1.5 | 1.0 | 0.9 | 1.5 | |||||||||||||||
|
|
|
|
|
|
|
|
|
|
|
|||||||||||
| Net income |
32.1 | 10.7 | 12.9 | 55.3 | 42.1 | |||||||||||||||
|
|
|
|
|
|
|
|
|
|
|
|||||||||||
| Less: Net income attributable to noncontrolling interest |
0.4 | 0.3 | 0.4 | 0.2 | 0.5 | |||||||||||||||
|
|
|
|
|
|
|
|
|
|
|
|||||||||||
| Net income attributable to Global Brass and Copper Holdings, Inc. |
$ | 31.7 | $ | 10.4 | $ | 12.5 | $ | 55.1 | $ | 41.6 | ||||||||||
|
|
|
|
|
|
|
|
|
|
|
|||||||||||
| Per Share Data: |
||||||||||||||||||||
| Cash dividends declared per common share (2) |
$ | 0.1500 | $ | 0.0375 | $ | 7.5793 | $ | — | $ | 2.0133 | ||||||||||
| Basic net income attributable to Global Brass and Copper Holdings, Inc. per common share |
$ | 1.50 | $ | 0.49 | $ | 0.59 | $ | 2.61 | $ | 1.97 | ||||||||||
| Diluted net income attributable to Global Brass and Copper Holdings, Inc. per common share |
$ | 1.49 | $ | 0.49 | $ | 0.59 | $ | 2.61 | $ | 1.97 | ||||||||||
| Number of common shares used in basic per share calculations |
21.2 | 21.1 | 21.1 | 21.1 | 21.1 | |||||||||||||||
| Number of common shares used in diluted per share calculations |
21.3 | 21.2 | 21.1 | 21.1 | 21.1 | |||||||||||||||
| Balance Sheet Data: |
||||||||||||||||||||
| Cash |
$ | 44.6 | $ | 10.8 | $ | 13.9 | $ | 49.5 | $ | 15.5 | ||||||||||
| Total assets |
576.5 | 548.7 | 502.7 | 548.7 | 537.7 | |||||||||||||||
| Total debt (3) |
380.8 | 380.5 | 389.5 | 303.6 | 306.2 | |||||||||||||||
| Total liabilities |
550.5 | 552.1 | 550.5 | 466.0 | 509.3 | |||||||||||||||
| Total equity (deficit) |
26.0 | (3.4 | ) | (47.8 | ) | 82.7 | 28.4 | |||||||||||||
46
Table of Contents
| (1) | For the years ended December 31, 2013, 2012, 2011 and 2010, includes non-cash profits interest compensation expense of $29.3 million, $19.5 million, $0.9 million and $3.5 million, respectively. No non-cash profits interest compensation expense was recorded in 2014. |
| (2) | In 2014 and 2013, the Company declared dividends of $3.2 million and $0.8 million, respectively, to the Company’s stockholders. In 2012, the Company used a portion of the net proceeds from the issuance of senior secured notes to pay a $160.0 million distribution to Halkos, the sole stockholder of the Company prior to the Company’s initial public offering in May 2013. In 2010, the Company used a portion of the proceeds from the refinancing of its term loan facility to pay a $42.5 million distribution to Halkos. |
| (3) | Consists of long-term debt, capital lease obligations and current maturities of long-term debt. |
Item 7. Management’s Discussion and Analysis of Financial Condition and Results of Operations.
Readers should refer to the information presented under the caption “Risk Factors” for risk factors that may affect our future performance. The following discussion and analysis of financial condition and results of operations should be read in conjunction with “Selected Financial Data” and our consolidated financial statements and related notes included elsewhere in this annual report. In addition to historical data, this discussion contains forward-looking statements about our business, operations and financial performance based on current expectations that involve risks, uncertainties and assumptions. Our actual results may differ materially from those discussed in the forward-looking statements as a result of various factors, including but not limited to those discussed in the sections entitled “Risk Factors” and “Cautionary Statements Concerning Forward-Looking Statements” included elsewhere in this annual report.
Overview
Our Company
Global Brass and Copper Holdings, Inc. (“Holdings,” the “Company,” “we,” “us,” or “our”) was incorporated in Delaware on October 10, 2007. Holdings, through its wholly-owned principal operating subsidiary, Global Brass and Copper, Inc. (“GBC”), commenced commercial operations on November 19, 2007 following the acquisition of the worldwide metals business from Olin Corporation. The majority of our operations and sales activities are focused in North America under the Olin Brass, Chase Brass and A.J. Oster brand names.
We are a leading, value-added converter, fabricator, processor and distributor of specialized copper and brass products including a wide range of sheet, strip, foil, rod, tube and fabricated metal component products. While we primarily process copper and copper-alloys, we also reroll and form certain other metals such as stainless steel, carbon steel and aluminum. Using processed scrap, copper cathode and other refined metals, we engage in metal melting and casting, rolling, drawing, extruding, welding and stamping to fabricate finished and semi-finished alloy products.
Our products are used in a variety of applications across diversified end markets, including the building and housing, munitions, automotive, transportation, coinage, electronics/electrical components, industrial machinery and equipment and general consumer end markets. We access these end markets through direct mill sales, our captive distribution network and third-party distributors. We hold the exclusive production and distribution rights in North America for a free machining, lead-free brass rod product, which we sell under the Green Dot™ and Eco Brass® brand names. The vertical integration of the manufacturing capabilities of Olin Brass and the distribution capabilities of A.J. Oster allows us to access a wide variety of customers with both high and low volume demand for our products.
Unlike traditional metals companies, including those that engage in mining, smelting and refining activities, we are purely a metal converter, fabricator, processor and distributor and do not attempt to generate profits from fluctuations in metal prices. Our financial performance is primarily driven by metal conversion economics, not
47
Table of Contents
by the underlying movements in the price of copper and the other metals we use. Through our “balanced book” approach (as further described below), we strive to match the timing, quantity and price of our metal sales with the timing, quantity and price of our replacement metal purchases. This practice substantially reduces the financial impact of metal price movements on our earnings and operating margins.
Our Operating Segments
We operate through three reportable operating segments: Olin Brass, Chase Brass and A.J. Oster.
Our Olin Brass segment is the leading manufacturer and converter of copper and copper-alloy sheet, strip, foil and tube and fabricated components in North America. While primarily processing copper and copper-alloys, the segment also rerolls and forms other metals such as stainless and carbon steel. Olin Brass’ products are used in five primary end markets: building and housing, munitions, automotive, coinage, and electronics/electrical components. For the year ended December 31, 2014, Olin Brass sold approximately 15% of its domestic copper-based products to A.J. Oster.
Chase Brass is a leading North American manufacturer of brass rod. The segment principally produces brass rod in sizes ranging from 1/4 inch to 4.5 inches in diameter. The key attributes of brass rod include its machinability, corrosion resistance and moderate strength, making it especially suitable for forging and machining into products such as valves and fittings. Chase Brass produces brass rod to customers in the following four end markets: building and housing, transportation, electronics/electrical components and industrial machinery and equipment.
Our A.J. Oster segment is a leading copper-alloy processor and distributor. The segment, through its family of metal service centers, is strategically focused on satisfying its customers’ needs for brass and copper strip and other products, with a high level of service, quality and flexibility by offering customization and just-in-time delivery. Our value-added processing services include precision slitting and traverse winding to provide greater customer press up-time, hot air level tinning for superior corrosion resistance and product enhancements such as edging and cutting. Important A.J. Oster end markets include building and housing, automotive and electronics/electrical components (primarily for housing and commercial construction). For the year ended December 31, 2014, 54% of A.J. Oster’s brass and copper material requirements have been supplied by our Olin Brass segment.
All three segments generate revenue from product sales and earn a premium margin over the cost of metal as a result of our metal conversion, value-added processing, and service capabilities.
Corporate and Other includes compensation for corporate executives and officers, corporate office and administrative salaries, and professional fees for accounting, tax and legal services. Corporate and Other also includes interest expense, state and Federal income taxes, overhead costs that management has not allocated to the operating segments, share-based compensation expense, costs related to other long-term incentive programs and the elimination of intercompany balances.
Formation and Acquisition of the Worldwide Metals Business of Olin Corporation
On October 10, 2007, Holdings was formed by affiliates of KPS Capital Partners, L.P. (“KPS”) as an acquisition vehicle to acquire the worldwide metals business of Olin Corporation.
On November 19, 2007, we acquired Olin Corporation’s worldwide metals business. The transaction was accounted for under the purchase method of accounting, and the assets and liabilities of the business were recorded at fair value at the acquisition date.
In accordance with accounting principles generally accepted in the United States of America (“U.S. GAAP”) at the time of the transaction, the fair market value of the net assets acquired exceeded the purchase
48
Table of Contents
price in the acquisition. This resulted in a bargain purchase, and we reduced the value of all identified intangible assets and other noncurrent assets, including the acquired property, plant and equipment, to zero in the opening balance sheet as of the acquisition date. Accordingly, our fixed assets reflect only post-acquisition capital investments, and our cost of sales and selling, general and administrative expense, depending on the nature and use of the underlying asset, includes depreciation only on capital investments made after the acquisition date.
Recent Transactions
Initial Public Offering
On May 29, 2013, we completed our initial public offering of 8,050,000 shares of our common stock (the “initial public offering” or “IPO”), including 1,050,000 shares of common stock sold in connection with the full exercise of the option to purchase additional shares granted to the underwriters, at a price to the public of $11.00 per share. The shares began trading on the New York Stock Exchange on May 23, 2013 under the ticker symbol “BRSS.” Halkos Holdings, LLC (“Halkos”), the sole stockholder of the Company prior to the IPO, sold all of the shares in the initial public offering and received all of the net proceeds from the offering. KPS and its affiliates are the majority shareholders of Halkos.
Follow-on Public Offering
On October 1, 2013, we completed a follow-on public offering of 5,750,000 shares of our common stock (the “Follow-on Public Offering”), including 750,000 shares of common stock sold in connection with the full exercise of the option to purchase additional shares granted to the underwriters, at a price to the public of $16.50 per share. Halkos sold all of the shares in the Follow-on Public Offering and received all of the net proceeds from the offering. After giving effect to the Follow-on Public Offering, Halkos beneficially owned approximately 34.4% of our outstanding common stock, and as a result we ceased to be a “controlled company” under the New York Stock Exchange listing rules.
Additional Follow-on Public Offering
On February 3, 2014 the Company completed an additional follow-on public offering (“Additional Follow-on Public Offering”) of 7,310,000 shares of its common stock, including 910,000 shares of common stock sold in connection with the full exercise of the option to purchase additional shares granted to the underwriters. Halkos sold all of the shares in the Additional Follow-on Public Offering and received all of the net proceeds from the offering. After giving effect to the Additional Follow-on Public Offering, Halkos no longer owns any of our outstanding common stock.
Issuance of the Senior Secured Notes and the Refinancing of the Term Loan Facility
On June 1, 2012, we completed a refinancing, which included the issuance of $375.0 million in aggregate principal amount of 9.50% Senior Secured Notes due 2019 (the “Senior Secured Notes”). On October 7, 2013, we completed a registered “A/B exchange offer” that was required by the registration rights agreement relating to such Senior Secured Notes (the “Exchange Offer”).
We used a portion of the proceeds from the Senior Secured Notes to repay in full the $266.5 million of principal outstanding under our prior $315.0 million five-year senior term loan facility (the “Term Loan Facility”), which we refer to as the “Term Loan Refinancing.” In the Term Loan Refinancing, we paid our lenders a total of $275.5 million, including the $266.5 million of principal, an early repayment premium of $8.0 million and accrued and unpaid interest of $1.0 million, and we recognized a $19.6 million loss on extinguishment of debt.
49
Table of Contents
Amendment of the ABL Facility
Concurrent with the issuance of the Senior Secured Notes and the Term Loan Refinancing on June 1, 2012, we amended the agreement governing our $150.0 million asset-based revolving loan facility (the “2010 ABL Facility”, and, as currently amended, the “ABL Facility”) to:
| • | increase the commitments under the facility to $200.0 million; |
| • | extend the maturity of the ABL Facility to June 1, 2017; |
| • | permit the Transactions (as defined below); |
| • | lower the applicable margin and unused line fee under the ABL Facility; |
| • | permit us to make additional acquisitions, investments, restricted payments, asset sales and debt incurrences if certain conditions are satisfied; |
| • | increase the inventory loan limit for the borrowing base; |
| • | adjust certain reporting requirements and collateral audit requirements to make them less restrictive; and |
| • | reduce the excess availability threshold which requires us to test our fixed charge coverage ratio covenant. |
We refer to these amendments collectively as the “ABL Amendment”.
Distribution to Halkos
In connection with the offering of the Senior Secured Notes, the Term Loan Refinancing and the ABL Amendment, we used a portion of the net proceeds of the issuance of the Senior Secured Notes, together with cash on hand, to make a cash distribution of $160.0 million to Halkos, which we refer to as the “Parent Distribution”. Halkos distributed the proceeds of the Parent Distribution pro rata to its equityholders (which include certain of our officers and directors) in accordance with the terms of its operating agreement.
We refer to the Term Loan Refinancing, the ABL Amendment and the Parent Distribution collectively as the “Transactions”.
Key Factors Affecting Our Results of Operations
Metal Cost
We are a leading, value-added converter, fabricator, processor and distributor of specialized copper and brass products in North America. Our profitability is primarily driven by the value added from the manufacturing and fabrication of metal products, and not by fluctuations in the price of copper and other metals. Our business model uses various methods to substantially reduce the financial impact of fluctuations in metal prices, such that our operating margins are largely unaffected by metal price trends. Nevertheless, metal price fluctuations will impact the total amount of our net sales, the cost of shrinkage loss, the impact of LIFO (hereinafter defined) liquidations and our working capital requirements.
Shrinkage loss, which is primarily the loss of raw material that occurs in the melting and casting operations, is an inherent part of our metal casting process. While the shrinkage loss rate is very low relative to the total volume of metal casting, the cost of the shrinkage loss and its impact on financial performance increases as metal prices increase.
We process and sell our products on a “toll” and “non-toll” basis. Over the last three years, approximately 75% of our unit sales volume occurred on a non-toll basis. For metal processed on a toll basis, our customers
50
Table of Contents
procure and own the metal in our facilities and we charge them a processing or conversion fee. For metal processed on a non-toll basis, we procure and own the metal until we sell it to the customer, whereby we charge them not only a conversion fee but also a metal replacement fee. For sales on a non-toll basis, we use our balanced book approach, discussed below, to substantially reduce the impact of metal price movements on earnings and operating margins.
The metals component of inventories that is valued on last-in, first-out (“LIFO”) basis comprises approximately 71% and 70% of total inventory at December 31, 2014 and December 31, 2013, respectively. The impact of LIFO accounting on our financial results may be significant with respect to period-to-period comparisons depending on the fluctuations in our inventory levels. During 2014, certain domestic metal inventory quantities were reduced, resulting in a liquidation of LIFO inventory layers that were created in prior years when metal prices were higher than those of the current period. Thus, the LIFO inventory layer liquidation increased cost of sales by $0.6 million. During 2013 and 2012, certain domestic metal inventory quantities were reduced, resulting in a liquidation of LIFO inventory layers that were created in prior years when metal prices were lower than those prevailing at the time of the depletion. Thus, the LIFO inventory layer liquidations decreased cost of sales by $2.0 million and $4.8 million during 2013 and 2012, respectively.
Metal prices also impact our investment in working capital because our collection terms with our customers are longer than our payment terms to our suppliers, so when metal prices increase, even if the number of pounds processed does not change, our working capital requirements will also increase. As a result, when metal prices are rising, we tend to draw more on the ABL Facility to cover the cash flow delay between material replacement purchase and cash collection. When metal prices fall, we replace our metal at a lower cost than the metal content of cash collections and generally reduce our use of the ABL Facility. We believe that our cash flow from operations, supplemented with cash available under the ABL Facility, will provide sufficient liquidity to meet our needs in the current metal price environment.
Balanced Book
The majority of our sales volume is from non-toll customers. To substantially reduce the financial impact of metal price volatility on earnings and operating margins on these non-toll sales, we use a balanced book approach to hedge the impact of metal price fluctuations. Using our balanced book approach, we seek to minimize the financial impact of metal price movements in the period between date of order and date of shipment by matching the timing, quantity and price of the metal cost recovery component of net sales made on a non-toll basis with the timing, quantity and price of the replacement metal purchases. For any non-toll sale we seek to achieve our balanced book through one of the following three mechanisms:
| • | Metal sales and replacement purchases on “price date of shipment” terms, meaning that metal sale prices and the metal replacement prices are set on the date of shipment. The customer bears the risk of metal price changes from the date of order to the date of shipment, so all fluctuations in metal costs are passed through to the customer. |
| • | Metal sales and replacement purchases on a “firm price basis”, meaning that metal sale prices are fixed on the order date, and a matching replacement purchase at a fixed price is established with a metal supplier. The supplier therefore bears the risk of metal price changes from the date of order to the date of shipment. |
| • | Metal sales on a firm price basis in circumstances where a matching firm price replacement purchase is unavailable. In this situation, we execute a forward purchase on “price date of shipment” terms and enter into a financial derivative transaction in the form of a forward purchase contract. The impact of price changes from date of order to the date of shipment on the previously required metal replacement purchase is offset by gains or losses on the derivative contract. The derivative counterparty bears the risk of metal price changes from the date of order to the date of shipment. |
51
Table of Contents
For the year ended December 31, 2014, approximately 68% of our non-toll unit sales volumes were conducted with price date of shipment terms. All other non-toll unit sales volumes were conducted with firm price replacement purchases or price date of shipment replacement purchases plus a derivative contract.
Metal Derivatives
As discussed above, we use derivative contracts in support of our balanced book approach. These derivative contracts are not designated as hedges for accounting purposes and are recorded at fair value in accordance with ASC 820. Thus, we include the unrealized and realized gains and losses on these derivatives within cost of sales in our consolidated statements of operations.
Industry Dynamics and Demand for Our Products
Demand for our product is driven predominantly by five end markets: 1) building and housing, 2) munitions, 3) automotive, 4) electronics / electrical components and 5) coinage.
| • | Building and Housing |
The health of the building and housing sector can be partially represented by new housing starts and existing home sales, which have generally increased over the past three years. According to management estimates, U.S. housing starts are expected to grow from 1.0 million in 2014 at a compound annual growth rate (“CAGR”) of 12.5% through 2017 and U.S. existing home sales are expected to grow from 4.9 million in 2014 at a CAGR of 3.3% through 2017.
In 2014, we have seen positive trends in leading market indicators related to housing, although the housing market recovery has been uneven at times due to changes in the actual or potential interest rate environment as well as other factors.
While demand within this end market is affected by new residential housing, existing home sales and commercial construction, all of which are significantly dependent on overall economic conditions, the correlation between housing statistics and our sales is not entirely direct. Our key products are typically installed near the completion of construction, meaning there is an inherent lag time compared to housing starts, and sales of our building and housing products can be affected by factors such as housing mix (unit size, unit price point and the mix of multi-family versus single-family construction). Sales of our products can also be impacted by changes in the composition of materials and fixtures used in construction.
| • | Munitions |
Olin Brass experienced a reduction in volume within this end market in 2014 following an unprecedented peak in 2013. It is our view that the nature of the reduction in munitions volumes is the result of destocking throughout the supply chain, and we anticipate this trend to continue into 2015.
| • | Automotive |
The automotive end market is dependent on the level of consumer spending and replacement needs. According to management estimates, North American light vehicle production is expected to grow from 17.0 million in 2014 at a CAGR of 2.1% through 2017.
Demand in the automotive end market improved in 2014 and we expect this trend to continue for the foreseeable future as automotive production is expected to increase over the course of the next three years.
| • | Electronics / electrical components |
Electronics / electrical components end uses include a wide range of applications, from medical to computers to aviation, and demand is largely correlated to general economic activity.
52
Table of Contents
| • | Coinage |
Demand for coinage is directly tied to consumer transactions and, with the exception of volumes related to the $1 coin (whose production was suspended at the end of 2011), coinage demand has improved in the last three years. In addition, Olin Brass renewed a long-term contract with the U.S. Mint in 2012 to extend the supply agreement through 2017.
Industry Dynamics Affecting Growth Opportunities
Regarding demand for copper and copper-alloy sheet, strip and plate (“SSP”), while we expect 2015 to be a year of slowing demand in the munitions end market, we are encouraged by the anticipated increase in automotive build rates, as strip demand is expected to track proportionately. Further, there are a number of growth opportunities that could increase the demand for SSP products, including CuVerro™ bactericidal products. Olin Brass completed the Federal and state registration processes necessary to market its CuVerro™ materials as having bactericidal properties. It has also licensed more than 20 exclusive component manufacturers to market CuVerro™ products.
Additionally, the Currency Optimization, Innovation and National Savings Act (“COINS Act”) is intended to modernize the U.S. currency system by replacing $1 notes with $1 coins. Legislation to replace the $1 notes with $1 coins keeps receiving attention in Congress, most recently by the Unified Savings and Accountability Act (“USA Act”) which was introduced in July of 2014. Among other matters, the USA Act brings added focus and support to replace the $1 note with the $1 coin. We anticipate a significant increase in the size of the coinage market if the U.S. transitions to the $1 coin and eliminates the $1 dollar note.
Regarding demand for brass rod, we anticipate growth influenced by increasing demand from building and construction. The Federal Reduction of Lead in Drinking Water Act mandates the use of lead-free and low-lead water pathways in all drinking water plumbing devices sold after January 2014. This regulatory shift represents a significant growth opportunity for North American manufacturers of lead-free and low-lead materials made from brass rod. We anticipate this regulatory change to accelerate the already existing demand for these high-quality, lead-free and low-lead products arising from existing state regulations.
In our distribution business, we anticipate consolidation and rationalization to occur given the amount of excess processing capacity in the United States. We anticipate distributors will continue to be an important supply-channel alternative as end users work to mitigate the increased costs associated with financing their working capital needs, which are driven, in part, by high metal prices.
Finally, the North American market may be affected by certain events related to the supply of brass and copper from offshore manufacturers, who have historically comprised a small portion of the North American supply. For example, in one instance, the International Trade Commission voted in March 2012 to continue antidumping orders for brass sheet and strip from Germany, Italy, France, and Japan. In another, the KORUS FTA became effective in March 2012. The agreement increases the competitiveness of Korean manufacturers in the U.S. by reducing the import price of Korean products. While this legislation has had a slight adverse effect on the competitiveness of our products, competition from offshore suppliers could become more significant in the future. Future levels of imported rod will be influenced by factors including currency values, domestic capacity and pricing levels, as well as costs in the import supply chain.
Non-GAAP Measures
In addition to the results reported in accordance with U.S. GAAP, we also report “Adjusted EBITDA” and “Adjusted sales”, which are non-GAAP financial measures as defined below.
Adjusted EBITDA is not intended as an alternative to net income (loss), as an indicator of our operating performance, as an alternative to any other measure of performance in conformity with U.S. GAAP or as an
53
Table of Contents
alternative to cash flow provided by (used in) operating activities as a measure of liquidity. Adjusted sales may not be comparable to similarly titled measures presented by other companies and is not a measure of operating performance or liquidity defined by U.S. GAAP.
You should therefore not place undue reliance on Adjusted EBITDA, Adjusted Sales, or any ratios calculated using them. Our U.S. GAAP-based measures can be found in our consolidated financial statements and the related notes thereto included elsewhere in this annual report.
Adjusted EBITDA
Adjusted EBITDA is earnings before interest, taxes, depreciation and amortization (“EBITDA”) adjusted to exclude the following: unrealized gains and losses on derivative contracts in support of our balanced book approach, unrealized gains and losses associated with derivative contracts related to electricity and natural gas costs, non-cash losses due to lower of cost or market adjustments to inventory, non-cash gains and losses due to the depletion of a LIFO layer of metal inventory, non-cash profits interest compensation expense related to payments made to certain members of our management by Halkos, share-based compensation expense, losses on the extinguishment of debt, non-cash income accretion related to Dowa-Olin Metal Corporation (the “Dowa Joint Venture”), management fees paid to affiliates of KPS, restructuring and other business transformation charges, specified legal and professional expenses, and certain other items.
We believe Adjusted EBITDA represents a meaningful presentation of the financial performance of our core operations, without the impact of the various items excluded, in order to provide period-to-period comparisons that are more consistent and more easily understood. We also believe it is an important supplemental measure that is frequently used by securities analysts, investors and other interested parties in the evaluation of companies in our industry.
Adjusted EBITDA is the key metric used by our Chief Operating Decision Maker to evaluate the business performance of our segments in comparison to budgets, forecasts and prior-year financial results, providing a measure that management believes reflects our core operating performance. For example, we use Adjusted EBITDA per pound in order to measure the effectiveness of the balanced book approach in reducing the financial impact of metal price volatility on earnings and operating margins, and to measure the effectiveness of our business transformation initiatives in improving earnings and operating margins. In addition, measures similar to Adjusted EBITDA are defined and used in the agreements governing the ABL Facility and the Senior Secured Notes to determine compliance with various financial covenants and tests.
However, our Adjusted EBITDA may not be comparable to similarly titled measures presented by other companies. In addition, it has limitations as an analytical tool, and you should not consider it in isolation or as a substitute for analysis of our results as reported under U.S. GAAP. Some of these limitations are that Adjusted EBITDA:
| • | does not reflect every expenditure, future requirements for capital expenditures or contractual commitments; |
| • | does not reflect the significant interest expense or the amounts necessary to service interest or principal payments on our debt; |
| • | does not reflect income tax expense and therefore the cost of complying with applicable laws; |
| • | is an imperfect substitute for cash flow as it eliminates depreciation and amortization expense but does not include cash expended for capital expenditures required to operate our business; |
| • | does not reflect the impact of earnings or charges resulting from matters we consider not to be indicative of our ongoing operations; and |
| • | does not reflect limitations on our costs related to transferring earnings from our subsidiaries to us. |
54
Table of Contents
We compensate for these limitations by using Adjusted EBITDA along with other comparative tools, together with U.S. GAAP measurements, to assist in the evaluation of operating performance. Such U.S. GAAP measurements include operating income (loss), net income (loss), cash flows from operations and other cash flow data. We have significant uses of cash, including capital expenditures, interest payments, debt principal repayments, taxes and other non-recurring charges, which are not reflected in Adjusted EBITDA.
Adjusted sales
Adjusted sales is defined as net sales less the metal component of net sales. Net sales is the most directly comparable U.S. GAAP measure to adjusted sales. Adjusted sales represents the value-added premium we earn over our conversion and fabrication costs. We use adjusted sales on a consolidated basis to monitor the revenues that are generated from our value-added conversion and fabrication processes excluding the effects of fluctuations in metal costs. We believe that adjusted sales supplements our U.S. GAAP results to provide a more complete understanding of the results of our business, and we believe it is useful to our investors and other parties for these same reasons.
Results of Operations
Consolidated Results of Operations for the Year Ended December 31, 2014, Compared to the Year Ended December 31, 2013.
The statement of operations data presented below for the years ended December 31, 2014 and 2013 are derived from our audited consolidated financial statements included elsewhere in this annual report.
| For the Year Ended December 31, | Change: 2014 vs. 2013 |
|||||||||||||||||||||||
| (in millions) | 2014 | % of Net Sales | 2013 | % of Net Sales | Amount | Percent | ||||||||||||||||||
| Net sales |
$ | 1,711.4 | 100.0 | % | $ | 1,758.5 | 100.0 | % | $ | (47.1 | ) | (2.7 | %) | |||||||||||
| Cost of sales |
1,546.8 | 90.4 | % | 1,576.2 | 89.6 | % | (29.4 | ) | (1.9 | %) | ||||||||||||||
|
|
|
|
|
|
|
|||||||||||||||||||
| Gross profit |
164.6 | 9.6 | % | 182.3 | 10.4 | % | (17.7 | ) | (9.7 | %) | ||||||||||||||
| Selling, general and administrative expenses (a) |
76.9 | 4.5 | % | 110.8 | 6.3 | % | (33.9 | ) | (30.6 | %) | ||||||||||||||
|
|
|
|
|
|
|
|||||||||||||||||||
| Operating income |
87.7 | 5.1 | % | 71.5 | 4.1 | % | 16.2 | 22.7 | % | |||||||||||||||
| Interest expense |
39.6 | 2.3 | % | 39.8 | 2.3 | % | (0.2 | ) | (0.5 | %) | ||||||||||||||
| Other expense,net |
0.5 | 0.0 | % | 0.3 | 0.0 | % | 0.2 | 66.7 | % | |||||||||||||||
|
|
|
|
|
|
|
|||||||||||||||||||
| Income before provision for income taxes and equity income |
47.6 | 2.8 | % | 31.4 | 1.8 | % | 16.2 | 51.6 | % | |||||||||||||||
| Provision for income taxes |
16.6 | 1.0 | % | 22.2 | 1.3 | % | (5.6 | ) | (25.2 | %) | ||||||||||||||
|
|
|
|
|
|
|
|||||||||||||||||||
| Income before equity income |
31.0 | 1.8 | % | 9.2 | 0.5 | % | 21.8 | 237.0 | % | |||||||||||||||
| Equity income, net of tax |
1.1 | 0.1 | % | 1.5 | 0.1 | % | (0.4 | ) | (26.7 | %) | ||||||||||||||
|
|
|
|
|
|
|
|||||||||||||||||||
| Net income |
32.1 | 1.9 | % | 10.7 | 0.6 | % | 21.4 | 200.0 | % | |||||||||||||||
| Less: Net income attributable to noncontrolling interest |
0.4 | 0.0 | % | 0.3 | 0.0 | % | 0.1 | 33.3 | % | |||||||||||||||
|
|
|
|
|
|
|
|||||||||||||||||||
| Net income attributable to Global Brass and Copper Holdings, Inc. |
$ | 31.7 | 1.9 | % | $ | 10.4 | 0.6 | % | $ | 21.3 | 204.8 | % | ||||||||||||
|
|
|
|
|
|
|
|||||||||||||||||||
| Adjusted EBITDA (b) |
$ | 109.7 | 6.4 | % | $ | 118.0 | 6.7 | % | $ | (8.3 | ) | (7.0 | %) | |||||||||||
| (a) | The 2013 amount includes $29.3 million of non-cash profits interest compensation expense. There was no such non-cash profits interest compensation expense in 2014. |
| (b) | See “—Non-GAAP Measures—Adjusted EBITDA” and the reconciliation included elsewhere in this annual report. |
55
Table of Contents
Net sales
Net sales decreased by $47.1 million, or 2.7%, from $1,758.5 million for the year ended December 31, 2013 to $1,711.4 million for the year ended December 31, 2014. Net sales decreased by $41.6 million due to lower metal prices, by $2.3 million due to a decrease in volume, by $1.5 million as a result of lower sales of unprocessed metal and by $1.7 million resulting from the net effect of a shift in product mix and increases in average selling prices. Metal prices reflect the replacement cost recovery from the customer, whereas the average selling prices represent the pricing component of adjusted sales, which we define as the excess of net sales over the metal cost recovery component of net sales.
Volume decreased by 2.6 million pounds, or 0.5%, from 523.0 million pounds for the year ended December 31, 2013 to 520.4 million pounds for the year ended December 31, 2014. The decrease in volume was primarily attributable to lower demand in the electronics/electrical components end market resulting primarily from a customer sourcing their finished products offshore, which negatively impacted demand for brass rod in this end market. Additionally, volume in the munitions end market was lower as the result of destocking throughout the supply chain and reduced demand following an unprecedented peak in demand in 2013. The decrease in volume was partially offset by higher demand in the building and housing, automotive, coinage and transportation end markets.
The metal cost recovery component of net sales decreased by $40.4 million, or 3.3%, from $1,209.2 million for the year ended December 31, 2013 to $1,168.8 million for the year ended December 31, 2014. Lower metal prices decreased the cost recovery component of net sales by $41.6 million. Additionally, lower sales of unprocessed metal decreased the metal cost recovery component of net sales by $1.5 million in the year ended December 31, 2014 as compared to the year ended December 31, 2013. The decrease was partially offset by the net effect of changes in volume by segment, which increased the metal cost recovery component of net sales by $2.7 million in the year ended December 31, 2014 as compared to the same period in 2013.
Adjusted sales
Adjusted sales, the excess of net sales over the metal cost recovery component of net sales, decreased by $6.7 million, or 1.2%, from $549.3 million for the year ended December 31, 2013 to $542.6 million for the year ended December 31, 2014. Lower volume contributed $5.0 million to the decrease, while the net effect associated with the shift in product mix and increases in average selling prices contributed $1.7 million to the decrease. Adjusted sales per pound decreased slightly in the year ended December 31, 2014 compared to the same period in 2013, which was the net effect of the shift in product mix and increases in average selling prices.
56
Table of Contents
Adjusted sales is a non-GAAP financial measure. See “—Non-GAAP Measures—Adjusted sales”. The following table presents a reconciliation of net sales to adjusted sales and net sales per pound to adjusted sales per pound:
| For the Year Ended December 31, |
Change: 2014 vs. 2013 |
|||||||||||||||
| (in millions, except per pound values) | 2014 | 2013 | Amount | Percent | ||||||||||||
| Pounds shipped (a) |
520.4 | 523.0 | (2.6 | ) | (0.5 | %) | ||||||||||
| Net sales |
$ | 1,711.4 | $ | 1,758.5 | $ | (47.1 | ) | (2.7 | %) | |||||||
| Metal component of net sales |
1,168.8 | 1,209.2 | (40.4 | ) | (3.3 | %) | ||||||||||
|
|
|
|
|
|
|
|||||||||||
| Adjusted sales |
$ | 542.6 | $ | 549.3 | $ | (6.7 | ) | (1.2 | %) | |||||||
|
|
|
|
|
|
|
|||||||||||
| $ per pound shipped |
||||||||||||||||
| Net sales per pound |
$ | 3.29 | $ | 3.36 | $ | (0.07 | ) | (2.1 | %) | |||||||
| Metal component of net sales per pound |
2.25 | 2.31 | (0.06 | ) | (2.6 | %) | ||||||||||
|
|
|
|
|
|
|
|||||||||||
| Adjusted sales per pound |
$ | 1.04 | $ | 1.05 | $ | (0.01 | ) | (1.0 | %) | |||||||
|
|
|
|
|
|
|
|||||||||||
| Average copper price per pound (b) |
$ | 3.12 | $ | 3.34 | $ | (0.22 | ) | (6.6 | %) | |||||||
| (a) | Amounts exclude quantity of unprocessed metal sold. |
| (b) | Copper prices reported by the Commodity Exchange (“COMEX”). |
Gross profit
Gross profit decreased by $17.7 million, or 9.7%, from $182.3 million for the year ended December 31, 2013 to $164.6 million for the year ended December 31, 2014. Gross profit per pound shipped decreased from $0.35 for the year ended December 31, 2013 to $0.32 for the year ended December 31, 2014.
Gross profit for the year ended December 31, 2014 included a loss of $3.0 million related to net unrealized losses on derivative contracts. Gross profit for the year ended December 31, 2013 included a gain of $0.2 million related to net unrealized gains on derivative contracts.
Gross profit in the years ended December 31, 2014 and 2013 also reflects the reduction of certain domestic metal inventory quantities and a decrement in the base LIFO layer, resulting in a LIFO loss of $0.6 million for the year ended December 31, 2014, compared to a LIFO gain of $2.0 million in the year ended December 31, 2013. We also reduced the recorded value of inventory by $0.2 million and $0.3 million in the years ended December 31, 2014 and 2013, respectively, related to a non-cash lower of cost or market adjustment, which is reflected in gross profit as a component of cost of sales.
Depreciation expense included in gross profit increased from $7.6 million for the year ended December 31, 2013 to $10.2 million for the year ended December 31, 2014. The increase is attributable to an increase in our depreciable asset base from December 31, 2013 to December 31, 2014.
In the year ended December 31, 2014, we incurred restructuring and other business transformation charges of $0.1 million related to severance charges at Olin Brass, which are reflected in gross profit as a component of cost of sales.
Several other factors decreased gross profit by $9.3 million in the year ended December 31, 2014 as compared to the same period in 2013. The decrease was due to higher manufacturing conversion costs of $8.4 million, primarily due to inclement weather in the first quarter of 2014 and operational issues that continued into the first half of 2014 which adversely impacted product flow and yield at Olin Brass. Additionally, gross profit decreased by $1.7 million resulting from the net effect of the shift in product mix and increases in average selling prices and by $0.7 million due to lower volume. The decrease was partially offset by lower shrinkage costs of $0.6 million due to lower metal costs and a decrease of $0.9 million in costs associated with our
57
Table of Contents
continuous improvement efforts, marketing and product development, labor contract negotiations and development of our information systems.
Selling, general and administrative expenses
Selling, general and administrative expenses decreased by $33.9 million, or 30.6%, from $110.8 million for the year ended December 31, 2013 to $76.9 million for the year ended December 31, 2014.
Non-cash compensation charges for vested profits interest shares included in selling, general and administrative expenses were $8.9 million for the year ended December 31, 2013 and $0 in 2014. Additionally, during the year ended December 31, 2013, Halkos modified the Halkos Holdings, LLC Executive Equity Incentive Plan (“Halkos Equity Plan”) to eliminate its right to acquire all or a portion of non-voting membership interests to select members of the Company’s management (entitled “Class B Shares”) for less than fair market value under certain conditions. The Class B Shares were profits interests in Halkos. This modification to the Halkos Equity Plan triggered the recognition of $20.4 million of incremental non-cash compensation expense during and only in the year ended December 31, 2013.
During the year ended December 31, 2013, in connection with the Company’s IPO, the Company terminated its agreement whereby the affiliates charged the Company for services of their personnel engaged in line or staff functions relating specifically to the operations of the Company (“Management Services Agreement”) with affiliates of KPS Special Situations Fund II, L.P., KPS Special Situations Fund II (A), L.P., KPS Special Situations Fund III, L.P. and KPS Special Situations Fund III (A), L.P. (together, “KPS Funds”) prior to the expiration of the initial term and was required to pay an early termination fee equal to the value of the advisory fee that would have otherwise been payable to affiliates of KPS Funds through the end of the term of the Management Services Agreement. The Company paid affiliates of KPS Funds $4.5 million related to the Company’s early termination representing all unpaid management advisory fees and recorded the charges in selling, general and administrative expenses. The management advisory fees for the year ended December 31, 2013 were $0.3 million.
We incurred professional fees for accounting, tax, legal and consulting services related to costs incurred as a publicly traded company, including Additional Follow-on Public Offering costs, of $4.3 million during the year ended December 31, 2014. We incurred professional fees for accounting, tax, legal and consulting services related to costs incurred as a publicly traded company, including IPO efforts, the Company’s Follow-on Public Offering and costs associated with the Exchange Offer of $4.3 million during the year ended December 31, 2013. Additionally, for the year ended December 31, 2014 and 2013, we recognized $1.7 million and $1.2 million, respectively, in share-based compensation expense resulting from the grant of non-qualified stock options, restricted stock and performance-based shares to certain employees, members of our management and our Board of Directors.
Depreciation expense included in selling, general and administrative expenses increased from $0.9 million for the year ended December 31, 2013 to $2.0 million for the year ended December 31, 2014. The increase is attributable to an increase in our depreciable asset base from December 31, 2013 to December 31, 2014.
In the year ended December 31, 2014, we incurred restructuring and other business transformation charges of $0.3 million related to severance charges at Olin Brass, which are included in selling, general and administrative expenses.
For the year ended December 31, 2013, we decreased the allowance for doubtful accounts by $0.2 million, which was due to management’s change in the estimate of the recoverability of accounts receivable. No such adjustment was necessary in 2014.
Several other factors contributed to the remaining $1.9 million decrease in selling, general and administrative expenses in the year ended December 31, 2014 as compared to the same period in 2013. Salaries,
58
Table of Contents
benefits and incentive compensation decreased by $1.0 million, other professional fees for accounting, tax, legal and consulting services decreased by $0.4 million not related to the above matters, other miscellaneous selling, general expenses decreased by $0.5 million and selling, general and administrative expenses associated with continuous improvement efforts, marketing and product development, labor contract negotiations and development of our information systems decreased by $0.5 million. The decrease was partially offset by an increase in outside services of $0.5 million.
Interest expense
The following table summarizes the components of interest expense:
| For the Year Ended December 31, |
||||||||
| (in millions) | 2014 | 2013 | ||||||
| Interest on principal |
$ | 36.1 | $ | 36.5 | ||||
| Amortization of debt issuance costs |
2.7 | 2.5 | ||||||
| Capitalized interest |
(0.2 | ) | (0.1 | ) | ||||
| Other borrowing costs (a) |
1.0 | 0.9 | ||||||
|
|
|
|
|
|||||
| Interest expense |
$ | 39.6 | $ | 39.8 | ||||
|
|
|
|
|
|||||
| (a) | Includes fees related to letters of credit and unused line of credit fees. |
Provision for income taxes
The change in the provision for income taxes was primarily due to lower taxable income even though pre-tax income for the year ended December 31, 2013 includes $29.3 million of non-cash profits interest compensation expense because that expense is non-deductible for tax purposes. Our effective tax rate in 2014 was 34.9%, a decrease from 70.7% in 2013 due largely to this non-deductible non-cash profits interest expense.
Net income attributable to Global Brass and Copper Holdings, Inc.
Net income attributable to Global Brass and Copper Holdings, Inc. increased from $10.4 million for the year ended December 31, 2013 to $31.7 million for the year ended December 31, 2014 due to a decrease in non-cash compensation expense, management fees, other miscellaneous selling, general and administrative expenses and the provision for income taxes, partially offset by a decrease in gross profit, which are described above.
Adjusted EBITDA
Adjusted EBITDA decreased by $8.3 million, or 7.0%, from $118.0 million for the year ended December 31, 2013 to $109.7 million for the year ended December 31, 2014. The decrease was due to higher manufacturing conversion costs of $8.4 million, primarily due to inclement weather in the first quarter of 2014 and operational issues at Olin Brass that continued through the first half of 2014, the net effect associated with the shift in product mix and increases in average selling prices of $1.7 million, an increase of $0.5 million in outside services, a decrease in volume of $0.7 million, a decrease in other adjustments included in the calculation of Adjusted EBITDA of $0.7 million, as well as the change in accounts receivable recoverability estimate resulting in the decrease in the allowance for doubtful accounts of $0.2 million in the year ended December 31, 2013 as compared to no net change to accounts receivable recoverability estimate in the year ended December 31, 2014. Partially offsetting these decreases were a decrease of $1.0 million in salaries, benefits and incentive compensation, a decrease of $0.4 million in other professional fees for accounting, tax, legal and consulting services, lower shrinkage costs of $0.6 million due to lower metal costs, a decrease of $0.5 million in other miscellaneous selling, general and administrative expenses, as well as a decrease of $0.5 million in selling, general and administrative expenses associated with continuous improvement efforts, marketing and product development, labor negotiations and development of our information systems. Additionally, costs within gross profit associated with our continuous improvement efforts and marketing and product development, labor contract negotiations and development of our information systems decreased by $0.9 million.
59
Table of Contents
Below is a reconciliation of net income attributable to Global Brass and Copper Holdings, Inc. to Adjusted EBITDA:
| For the Year Ended December 31, |
||||||||
| (in millions) | 2014 | 2013 | ||||||
| Net income attributable to Global Brass and Copper Holdings, Inc. |
$ | 31.7 | $ | 10.4 | ||||
| Interest expense |
39.6 | 39.8 | ||||||
| Provision for income taxes |
16.6 | 22.2 | ||||||
| Depreciation expense |
12.2 | 8.5 | ||||||
| Amortization expense |
0.1 | 0.1 | ||||||
| Unrealized loss (gain) on derivative contracts (a) |
3.0 | (0.2 | ) | |||||
| Loss (gain) from LIFO layer depletion (b) |
0.6 | (2.0 | ) | |||||
| Non-cash accretion of income of Dowa Joint Venture (c) |
(0.7 | ) | (0.7 | ) | ||||
| Non-cash Halkos profits interest compensation expense (d) |
— | 29.3 | ||||||
| Management fees (e) |
— | 4.8 | ||||||
| Specified legal/professional expenses (f) |
4.3 | 4.3 | ||||||
| Lower of cost or market adjustment to inventory (g) |
0.2 | 0.3 | ||||||
| Share-based compensation expense (h) |
1.7 | 1.2 | ||||||
| Restructuring and other business transformation charges (i) |
0.4 | — | ||||||
|
|
|
|
|
|||||
| Adjusted EBITDA |
$ | 109.7 | $ | 118.0 | ||||
|
|
|
|
|
|||||
| (a) | Represents unrealized gains and losses on derivative contracts. |
| (b) | Calculated based on the difference between the base year LIFO carrying value and the metal prices prevailing in the market at the time of inventory depletion. |
| (c) | As a result of the application of purchase accounting in connection with the November 2007 acquisition, no carrying value was initially assigned to our equity investment in the Dowa Joint Venture. This adjustment represents the accretion of equity in the Dowa Joint Venture at the date of the acquisition over a 13-year period (which represents the estimated useful life of the technology and patents of the joint venture). See the notes to the consolidated financial statements, which are included elsewhere in this annual report. |
| (d) | The 2013 amount includes $20.4 million that represents incremental non-cash compensation as a result of the modification made to the Halkos LLC Agreement to eliminate Halkos’ right to acquire all or a portion of the Class B Shares. The 2013 amount also includes $8.9 million that represents dividend payments made by Halkos to members of our management that resulted in a non-cash compensation charge in connection with the IPO that occurred in May 2013. See the notes to the consolidated financial statements, which are included elsewhere in this annual report. |
| (e) | The 2013 amount includes a $4.5 million early termination fee, which is equal to the value of the advisory fee that would have otherwise been payable to affiliates of KPS through the end of the agreement. |
| (f) | Specified legal/professional expenses for the year ended December 31, 2014 includes $4.3 million of professional fees for accounting, tax, legal and consulting services related to costs incurred as a publicly traded company, including Additional Follow-On Public Offering costs. |
Specified legal/professional expenses for the year ended December 31, 2013 includes $4.3 million of professional fees for accounting, tax, legal and consulting services related to costs incurred as a publicly traded company, including IPO efforts, Follow-on Public Offering costs, Additional Follow-on Public Offering costs and costs associated with the Exchange Offer and certain regulatory and compliance matters.
| (g) | Represents non-cash lower of cost or market charges for the write down of inventory recorded during the year ended December 31, 2014 and 2013. |
| (h) | Represents share-based compensation expense resulting from the grant of non-qualified stock options, restricted stock and performance-based shares to certain employees, members of our management and our Board of Directors. |
| (i) | Restructuring and other business transformation charges for the year ended December 31, 2014 represent severance charges at Olin Brass. |
60
Table of Contents
Segment Results of Operations
Segment Results of Operations for the Year Ended December 31, 2014, Compared to the Year Ended December 31, 2013
| For the Year Ended December 31, |
Change 2014 vs. 2013 |
|||||||||||||||
| (in millions) | 2014 | 2013 | Amount | Percent | ||||||||||||
| Pounds shipped (1) |
||||||||||||||||
| Olin Brass |
269.1 | 279.4 | (10.3 | ) | (3.7 | %) | ||||||||||
| Chase Brass |
221.3 | 216.0 | 5.3 | 2.5 | % | |||||||||||
| A.J. Oster |
68.7 | 66.9 | 1.8 | 2.7 | % | |||||||||||
| Corporate and other (2) |
(38.7 | ) | (39.3 | ) | 0.6 | 1.5 | % | |||||||||
|
|
|
|
|
|
|
|||||||||||
| Total |
520.4 | 523.0 | (2.6 | ) | (0.5 | %) | ||||||||||
|
|
|
|
|
|
|
|||||||||||
| Net Sales |
||||||||||||||||
| Olin Brass |
$ | 847.8 | $ | 874.1 | $ | (26.3 | ) | (3.0 | %) | |||||||
| Chase Brass |
603.7 | 622.0 | (18.3 | ) | (2.9 | %) | ||||||||||
| A.J. Oster |
313.9 | 316.2 | (2.3 | ) | (0.7 | %) | ||||||||||
| Corporate and other (2) |
(54.0 | ) | (53.8 | ) | (0.2 | ) | (0.4 | %) | ||||||||
|
|
|
|
|
|
|
|||||||||||
| Total |
$ | 1,711.4 | $ | 1,758.5 | $ | (47.1 | ) | (2.7 | %) | |||||||
|
|
|
|
|
|
|
|||||||||||
| Adjusted EBITDA |
||||||||||||||||
| Olin Brass |
$ | 36.9 | $ | 48.3 | $ | (11.4 | ) | (23.6 | %) | |||||||
| Chase Brass |
69.2 | 67.2 | 2.0 | 3.0 | % | |||||||||||
| A.J. Oster |
16.2 | 16.9 | (0.7 | ) | (4.1 | %) | ||||||||||
|
|
|
|
|
|
|
|||||||||||
| Total for operating segments |
$ | 122.3 | $ | 132.4 | $ | (10.1 | ) | (7.6 | %) | |||||||
|
|
|
|
|
|
|
|||||||||||
| (1) | Amounts exclude quantity of unprocessed metal sold. |
| (2) | Amounts represent intercompany eliminations. |
See the notes to the consolidated financial statements included elsewhere in this annual report for additional information regarding our segment reporting and a reconciliation of Adjusted EBITDA of segments to income before provision for income taxes and equity income.
Olin Brass
Olin Brass net sales decreased by $26.3 million, or 3.0%, from $874.1 million for the year ended December 31, 2013 to $847.8 million for the year ended December 31, 2014. The decrease was due almost entirely to lower volume.
Volume decreased by 10.3 million pounds, or 3.7%, from 279.4 million pounds for the year ended December 31, 2013 to 269.1 million pounds for the year ended December 31, 2014. The decrease in volume was primarily the result of lower demand in the munitions end market as well as the electronics/electrical components end market. Lower demand in the munitions end market was attributable to destocking throughout the supply chain, as well as due to the reduced demand following an unprecedented peak in demand in 2013. The decrease in demand was partially offset by higher demand in the automotive and coinage end markets.
Adjusted EBITDA of Olin Brass decreased by $11.4 million, from $48.3 million for the year ended December 31, 2013 to $36.9 million for the year ended December 31, 2014. The decrease was due primarily to higher manufacturing conversion costs due to inclement weather in the first quarter of 2014, operational issues that continued into the first half of 2014 which adversely impacted product flow and yield at Olin Brass, lower
61
Table of Contents
volume and a shift in product mix, and a decrease in other adjustments to Adjusted EBITDA. Partially offsetting the decrease were higher average selling prices, including increases in sales prices to A.J. Oster (which are eliminated in our consolidated results), a decrease in salaries, benefits and incentive compensation, a decrease in other professional fees for accounting, tax, legal and consulting services and a decrease in other miscellaneous selling, general and administrative expenses.
Chase Brass
Chase Brass net sales decreased by $18.3 million, or 2.9%, from $622.0 million for the year ended December 31, 2013 to $603.7 million for the year ended December 31, 2014. The decrease was due primarily to lower metal prices of $33.8 million, which was partially offset by increased volume.
The increase in volume was attributable to higher demand in the building and housing and transportation end markets. These increases were partially offset by lower demand in the electronics/electrical components end market resulting primarily from a customer sourcing their finished products offshore, which negatively impacted demand for brass rod in this end market.
Adjusted EBITDA of Chase Brass increased by $2.0 million, from $67.2 million for the year ended December 31, 2013 to $69.2 million for the year ended December 31, 2014 due to the aforementioned increase in volume.
A.J. Oster
A. J. Oster net sales decreased by $2.3 million, or 0.7%, from $316.2 million for the year ended December 31, 2013 to $313.9 million for the year ended December 31, 2014. The decrease was due primarily to lower metal prices of $11.0 million, partially offset by increased volume.
Volume increased by 1.8 million pounds, or 2.7%, from 66.9 million pounds for the year ended December 31, 2013 to 68.7 million pounds for the year ended December 31, 2014. The increase in volume was primarily the result of increased demand in the automotive and building and housing end markets partially offset by lower demand in the electronics/electrical components end market.
Adjusted EBITDA of A.J. Oster decreased by $0.7 million, from $16.9 million for the year ended December 31, 2013 to $16.2 million for the year ended December 31, 2014. The decrease was due primarily to increased salaries, benefits and incentive compensation, higher prices on purchases from Olin Brass, which resulted in higher conversion costs (which are eliminated in our consolidated results) and an increase in professional and outside services, partially offset by increased volume and a variety of other individually insignificant items.
62
Table of Contents
Consolidated Results of Operations for the Year Ended December 31, 2013, Compared to the Year Ended December 31, 2012.
The statement of operations data presented below for the years ended December 31, 2013 and 2012 are derived from our audited consolidated financial statements included elsewhere in this annual report.
| For the Year Ended December 31, | Change: 2013 vs. 2012 |
|||||||||||||||||||||||
| (in millions) | 2013 | % of Net Sales | 2012 | % of Net Sales | Amount | Percent | ||||||||||||||||||
| Net sales |
$ | 1,758.5 | 100.0 | % | $ | 1,650.5 | 100.0 | % | $ | 108.0 | 6.5 | % | ||||||||||||
| Cost of sales |
1,576.2 | 89.6 | % | 1,467.3 | 88.9 | % | 108.9 | 7.4 | % | |||||||||||||||
|
|
|
|
|
|
|
|||||||||||||||||||
| Gross profit |
182.3 | 10.4 | % | 183.2 | 11.1 | % | (0.9 | ) | (0.5 | %) | ||||||||||||||
| Selling, general and administrative expenses (a) |
110.8 | 6.3 | % | 92.7 | 5.6 | % | 18.1 | 19.5 | % | |||||||||||||||
|
|
|
|
|
|
|
|||||||||||||||||||
| Operating income |
71.5 | 4.1 | % | 90.5 | 5.5 | % | (19.0 | ) | (21.0 | %) | ||||||||||||||
| Interest expense |
39.8 | 2.3 | % | 39.7 | 2.4 | % | 0.1 | 0.3 | % | |||||||||||||||
| Loss on extinguishment of debt |
— | 0.0 | % | 19.6 | 1.2 | % | (19.6 | ) | N/A | |||||||||||||||
| Other expense,net |
0.3 | 0.0 | % | 0.1 | 0.0 | % | 0.2 | 200.0 | % | |||||||||||||||
|
|
|
|
|
|
|
|||||||||||||||||||
| Income before provision for income taxes and equity income |
31.4 | 1.8 | % | 31.1 | 1.9 | % | 0.3 | 1.0 | % | |||||||||||||||
| Provision for income taxes |
22.2 | 1.3 | % | 19.2 | 1.2 | % | 3.0 | 15.6 | % | |||||||||||||||
|
|
|
|
|
|
|
|||||||||||||||||||
| Income before equity income |
9.2 | 0.5 | % | 11.9 | 0.7 | % | (2.7 | ) | (22.7 | %) | ||||||||||||||
| Equity income, net of tax |
1.5 | 0.1 | % | 1.0 | 0.1 | % | 0.5 | 50.0 | % | |||||||||||||||
|
|
|
|
|
|
|
|||||||||||||||||||
| Net income |
10.7 | 0.6 | % | 12.9 | 0.8 | % | (2.2 | ) | (17.1 | %) | ||||||||||||||
| Less: Net income attributable to noncontrolling interest |
0.3 | 0.0 | % | 0.4 | 0.0 | % | (0.1 | ) | (25.0 | %) | ||||||||||||||
|
|
|
|
|
|
|
|||||||||||||||||||
| Net income attributable to Global Brass and Copper Holdings, Inc. |
$ | 10.4 | 0.6 | % | $ | 12.5 | 0.8 | % | $ | (2.1 | ) | (16.8 | %) | |||||||||||
|
|
|
|
|
|
|
|||||||||||||||||||
| Adjusted EBITDA |
$ | 118.0 | 6.7 | % | $ | 115.4 | 7.0 | % | $ | 2.6 | 2.3 | % | ||||||||||||
| (a) | Amounts include non-cash profits interest compensation expense of $29.3 million and $19.5 million for the years ended December 31, 2013 and 2012, respectively. |
| (b) | See “—Non-GAAP Measures—Adjusted EBITDA” and the reconciliation included elsewhere in this annual report. |
Net sales
Net sales increased by $108.0 million, or 6.5%, from $1,650.5 million for the year ended December 31, 2012 to $1,758.5 million for the year ended December 31, 2013. Net sales increased by $38.4 million due to an increase in volume, by $105.8 million as a result of the sales of unprocessed metal and by $2.5 million as a result of higher average selling prices in the year ended December 31, 2013. These increases were partially offset by lower metal prices, which decreased net sales by $38.7 million. Metal prices reflect the replacement cost recovery from the customer, whereas the average selling prices represent the pricing component of adjusted sales, which we define as the excess of net sales over the metal cost recovery component of net sales.
Volume increased by 19.8 million pounds, or 3.9%, from 503.2 million pounds for the year ended December 31, 2012 to 523.0 million pounds for the year ended December 31, 2013. The increase in volume was the result of higher demand in building and housing, munitions, coinage and automotive end markets. These increases were partially offset by lower demand in the electronics/ electrical components end market resulting
63
Table of Contents
from increased competition from foreign imports and customers sourcing their finished products offshore, thereby also increasing the amount of manufacturing offshore and consequently reducing demand for brass rod in the United States. Additionally, volume growth in the building and housing end market was dampened by foreign competition.
The metal cost recovery component of net sales increased by $83.6 million, or 7.4%, from $1,125.6 million for the year ended December 31, 2012 to $1,209.2 million for the year ended December 31, 2013.
Higher volume increased the metal cost recovery component of net sales by $16.5 million in the year ended December 31, 2013 as compared to the same period in 2012. Additionally, sales of unprocessed metal increased the metal cost recovery component of net sales by $105.8 million in the year ended December 31, 2013 as compared to the year ended December 31, 2012. Partially offsetting the increase in the metal cost recovery component of net sales was the change in customer mix and lower metal prices, which decreased the metal cost recovery component of net sales by $38.7 million. The metal cost recovery component of net sales per pound of finished product shipped increased by 3.1%, due primarily to the inclusion of the sales of unprocessed metal, the quantity of which is not included in pounds shipped. The metal cost recovery component of net sales per pound of finished product sold excluding the sales of unprocessed metal (the quantity of which is not included in pounds shipped) decreased by 5.7%, primarily as a result of a 7.5% decrease in the average daily copper prices.
Adjusted sales
Adjusted sales, the excess of net sales over the metal cost recovery component of net sales, increased by $24.4 million, or 4.6%, from $524.9 million for the year ended December 31, 2012 to $549.3 million for the year ended December 31, 2013. Higher volume and higher average selling prices contributed $21.9 million and $2.5 million, respectively, to the increase. Adjusted sales per pound increased in the year ended December 31, 2013 by 1.0% compared to the same period in 2012 which was the effect of changes in the mix of sales by segment relative to our consolidated sales as a whole and a net increase in average selling prices at the segment level resulting from the net effect of price increases and the shift in product mix within each segment.
| For the Year Ended December 31, |
Change: 2013 vs. 2012 |
|||||||||||||||
| (in millions, except per pound values) | 2013 | 2012 | Amount | Percent | ||||||||||||
| Pounds shipped (a) |
523.0 | 503.2 | 19.8 | 3.9 | % | |||||||||||
| Net sales |
$ | 1,758.5 | $ | 1,650.5 | $ | 108.0 | 6.5 | % | ||||||||
| Metal component of net sales |
1,209.2 | 1,125.6 | 83.6 | 7.4 | % | |||||||||||
|
|
|
|
|
|
|
|||||||||||
| Adjusted sales |
$ | 549.3 | $ | 524.9 | $ | 24.4 | 4.6 | % | ||||||||
|
|
|
|
|
|
|
|||||||||||
| $ per pound shipped |
||||||||||||||||
| Net sales per pound |
$ | 3.36 | $ | 3.28 | $ | 0.08 | 2.4 | % | ||||||||
| Metal component of net sales per pound |
2.31 | 2.24 | 0.07 | 3.1 | % | |||||||||||
|
|
|
|
|
|
|
|||||||||||
| Adjusted sales per pound |
$ | 1.05 | $ | 1.04 | $ | 0.01 | 1.0 | % | ||||||||
|
|
|
|
|
|
|
|||||||||||
| Average copper price per pound (b) |
$ | 3.34 | $ | 3.61 | $ | (0.27 | ) | (7.5 | %) | |||||||
| (a) | Amounts exclude quantity of unprocessed metal sold. |
| (b) | Copper prices reported by the Commodity Exchange (“COMEX”). |
Gross profit
Gross profit decreased by $0.9 million, or 0.5%, from $183.2 million for the year ended December 31, 2012 to $182.3 million for the year ended December 31, 2013. Gross profit per pound shipped decreased from $0.36 for the year ended December 31, 2012 as compared to $0.35 for the year ended December 31, 2013.
64
Table of Contents
Gross profit for the year ended December 31, 2013 included a gain of $0.2 million related to net unrealized gains on derivative contracts. Gross profit for the year ended December 31, 2012 included a gain of $1.6 million related to net unrealized gains on derivative contracts.
Gross profit in the years ended December 31, 2013 and 2012 also reflects the reduction of certain domestic metal inventory quantities and a decrement in the base LIFO layer, resulting in a LIFO gain of $2.0 million for the year ended December 31, 2013, compared to a LIFO gain of $4.8 million in the year ended December 31, 2012. We also reduced the recorded value of inventory by $0.3 million in both the year ended December 31, 2013 and 2012 related to a non-cash lower of cost or market adjustment, which is reflected in gross profit as a component of cost of sales.
Depreciation expense included in gross profit increased from $5.9 million for the year ended December 31, 2012 to $7.6 million for the year ended December 31, 2013. The increase is attributable to an increase in our depreciable asset base from December 31, 2012 to December 31, 2013.
Several other offsetting factors increased gross profit by $5.0 million in the year ended December 31, 2013 as compared to the same period in 2012. Higher volume, higher average selling prices and lower shrinkage costs due to lower metal costs and higher yields contributed $4.8 million, $2.5 million and $2.1 million, respectively, to the increase in gross profit. These factors were partially offset by higher manufacturing conversion costs of $3.0 million and an estimated $1.4 million of costs associated with our continuous improvement efforts and marketing and product development, labor contract negotiations and development of our information systems.
Selling, general and administrative expenses
Selling, general and administrative expenses increased by $18.1 million, or 19.5%, from $92.7 million for the year ended December 31, 2012 to $110.8 million for the year ended December 31, 2013.
Non-cash compensation charges for vested profits interest shares included in selling, general and administrative expenses were $8.9 million and $19.5 million for the year ended December 31, 2013 and 2012, respectively. Additionally, in the year ended December 31, 2013, Halkos modified its operating agreement to eliminate its right to acquire all or a portion of the Class B Shares. This modification to its operating agreement triggered the recognition of $20.4 million of incremental non-cash compensation expense and no additional expense will be incurred by the Company in any future period.
During the year ended December 31, 2013, in connection with the IPO, we terminated our Management Services Agreement with affiliates of the KPS Funds prior to the expiration of the initial term and were required to pay an early termination fee equal to the value of the advisory fee that would have otherwise been payable to affiliates of the KPS Funds through the end of the Management Services Agreement. We paid affiliates of the KPS Funds $4.5 million related to our early termination and all unpaid management advisory fees and recorded the charges in selling, general and administrative expenses. The management advisory fees for the year ended December 31, 2013 and 2012 were $0.3 million and $1.0 million, respectively.
We incurred professional fees for accounting, tax, legal and consulting services related to costs incurred as a publicly traded company, including IPO efforts, costs related to the Follow-on Public Offering and the Additional Follow-on Public Offering and costs associated with the Exchange Offer, of $4.3 million during the year ended December 31, 2013. We incurred professional fees for accounting, tax, legal and consulting services related to our Exchange Offer and public company readiness efforts of $3.3 million during the year ended December 31, 2012. Additionally, for the year ended December 31, 2013, we recognized $1.2 million related to share-based compensation resulting from the grant of non-qualified stock options, restricted stock and performance-based shares to certain employees, members of our management and our Board of Directors.
Depreciation expense included in selling, general and administrative expenses remained flat at $0.9 million for each of the years ended December 31, 2013 and 2012.
65
Table of Contents
For the year ended December 31, 2013, we decreased the allowance for doubtful accounts by $0.2 million compared to a decrease of $0.8 million for the year ended December 31, 2012, which in both cases was due to management’s change in the estimate of the recoverability of accounts receivable.
Several other offsetting factors contributed to the remaining $1.7 million increase in selling, general and administrative expenses in the year ended December 31, 2013 as compared to the same period in 2012. Other selling, general and administrative costs associated with continuous improvement efforts and marketing and product development, labor contract negotiations and development of our information systems increased by an estimated $1.4 million, salaries, benefits and incentive compensation increased by $0.8 million and outside services increased by $0.4 million, partially offset by a decrease in other professional fees for accounting, tax, legal and consulting services of $0.9 million.
Interest expense
Interest expense increased from $39.7 million for the year ended December 31, 2012 compared to $39.8 million for the year ended December 31, 2013. The increase was primarily due to higher average borrowings on our debt facilities of $389.8 in 2013 as compared to $355.4 million in 2012, offset by lower non-cash interest expense associated with interest rate cap agreements, lower interest rates (a weighted average of 9.2% per annum during 2013 compared to 9.6% per annum during 2012) and a net decrease in amortization of debt discount and debt issuance costs.
The following table summarizes the components of interest expense:
| For the Year Ended December 31, |
||||||||
| (in millions) | 2013 | 2012 | ||||||
| Interest on principal |
$ | 36.5 | $ | 34.0 | ||||
| Interest rate cap agreements |
— | 0.2 | ||||||
| Amortization of debt discount and issuance costs |
2.5 | 4.6 | ||||||
| Capitalized interest |
(0.1 | ) | — | |||||
| Other borrowing costs (a) |
0.9 | 0.9 | ||||||
|
|
|
|
|
|||||
| Interest expense |
$ | 39.8 | $ | 39.7 | ||||
|
|
|
|
|
|||||
| (a) | Includes fees related to letters of credit and unused line of credit fees. |
Loss on extinguishment of debt
In connection with the termination prior to maturity of the Term Loan Facility, we recognized $19.6 million as loss from extinguishment of debt for the year ended December 31, 2012. The loss on extinguishment of debt includes $7.1 million of unamortized debt issuance costs and $4.9 million of unamortized debt discount as well as $6.4 million of call premium and $0.1 million of professional service fees related to the early termination. Additionally, $1.1 million of costs associated with the issuance of the Senior Secured Notes was expensed as incurred in accordance with ASC 470-50, Modifications and Extinguishments.
Provision for income taxes
The provision for income taxes was $22.2 million for the year ended December 31, 2013 compared to $19.2 million for the year ended December 31, 2012. The change in the provision for income taxes was primarily due to the increase in non-deductible non-cash compensation of $9.8 million for the year ended December 31, 2013, as compared to the same period in 2012. The effective income tax rate was 70.7% and 61.7% for the years ended December 31, 2013 and 2012, respectively, which was primarily due to the aforementioned non-deductible non-cash compensation of $29.3 million and $19.5 million in the years ended December 31, 2013 and 2012, respectively.
66
Table of Contents
Net income attributable to Global Brass and Copper Holdings, Inc.
Net income attributable to Global Brass and Copper Holdings, Inc. decreased by $2.1 million, or 16.8%, from $12.5 million for the year ended December 31, 2012 to $10.4 million for the year ended December 31, 2013 due to an increase in selling, general and administrative expenses, including non-cash compensation expense for vested profits interest shares and early termination management advisory fees in connection with the IPO, as well as an increase in the provision for income taxes, partially offset by the loss on extinguishment of debt in 2012, as described above.
Adjusted EBITDA
Adjusted EBITDA increased by $2.6 million, or 2.3%, from $115.4 million for the year ended December 31, 2012 to $118.0 million for the year ended December 31, 2013. The increase was due to higher volume of $4.8 million, higher average selling prices of $2.5 million, lower shrinkage cost due to lower metal costs and higher yields of $2.1 million and a decrease of $0.9 million in other professional fees for accounting, tax, legal and consulting services. Partially offsetting the increase were higher manufacturing conversion costs of $3.0 million, an estimated $1.4 million of costs associated with our continuous improvement efforts and marketing and product development, labor contract negotiations and development of our information systems, an increase in salaries, benefits and incentive compensation of $0.8 million, an increase in outside services of $0.4 million, and an increase in other selling, general and administrative expenses of $1.4 million associated with continuous improvement efforts and marketing and product development, labor contract negotiations and development of our information systems, a net decrease in other adjustments included in the calculation of Adjusted EBITDA of $0.1 million, as well as the change in accounts receivable recoverability estimate resulting in the decrease in the allowance for doubtful accounts of $0.2 million in the year ended December 31, 2013 (compared to a decrease of $0.8 million for the year ended December 31, 2012).
Below is a reconciliation of net income attributable to Global Brass and Copper Holdings, Inc. to Adjusted EBITDA:
| For the Year Ended December 31, |
||||||||
| (in millions) | 2013 | 2012 | ||||||
| Net income attributable to Global Brass and Copper Holdings, Inc. |
$ | 10.4 | $ | 12.5 | ||||
| Interest expense |
39.8 | 39.7 | ||||||
| Provision for income taxes |
22.2 | 19.2 | ||||||
| Depreciation expense |
8.5 | 6.8 | ||||||
| Amortization expense |
0.1 | 0.1 | ||||||
| Unrealized gain on derivative contracts (a) |
(0.2 | ) | (1.6 | ) | ||||
| Gain from LIFO layer depletion (b) |
(2.0 | ) | (4.8 | ) | ||||
| Loss on extinguishment of debt (c) |
— | 19.6 | ||||||
| Non-cash accretion of income of Dowa Joint Venture (d) |
(0.7 | ) | (0.7 | ) | ||||
| Non-cash Halkos profits interest compensation expense (e) |
29.3 | 19.5 | ||||||
| Management fees (f) |
4.8 | 1.0 | ||||||
| Specified legal/professional expenses (g) |
4.3 | 3.3 | ||||||
| Lower of cost or market adjustment to inventory (h) |
0.3 | 0.3 | ||||||
| Share-based compensation expense (i) |
1.2 | — | ||||||
| Other adjustments (j) |
— | 0.5 | ||||||
|
|
|
|
|
|||||
| Adjusted EBITDA |
$ | 118.0 | $ | 115.4 | ||||
|
|
|
|
|
|||||
| (a) | Represents unrealized gains and losses on derivative contracts. |
| (b) | Calculated based on the difference between the base year LIFO carrying value and the metal prices prevailing in the market at the time of inventory depletion. |
| (c) | Represents the loss on the extinguishment of debt recognized in connection with the termination prior to maturity of our Term Loan Facility. |
67
Table of Contents
| (d) | As a result of the application of purchase accounting in connection with the November 2007 acquisition, no carrying value was initially assigned to our equity investment in the Dowa Joint Venture. This adjustment represents the accretion of equity in the Dowa Joint Venture at the date of the acquisition over a 13-year period (which represents the estimated useful life of the technology and patents of the joint venture). See the notes to the consolidated financial statements, which are included elsewhere in this annual report. |
| (e) | The 2013 amount includes $20.4 million that represents incremental non-cash compensation as a result of the modification made to the Halkos LLC Agreement to eliminate Halkos’ right to acquire all or a portion of the Class B Shares. The 2013 amount also includes $8.9 million that represents dividend payments made by Halkos to members of our management that resulted in a non-cash compensation charge in connection with the IPO that occurred in May 2013. |
The 2012 amount represents the dividend payment made by Halkos to certain members of our management that resulted in a non-cash compensation charge in connection with the Parent Distribution that occurred on June 1, 2012. See the notes to the consolidated financial statements, which are included elsewhere in this annual report.
| (f) | The 2013 amount includes a $4.5 million early termination fee, which is equal to the value of the advisory fee that would have otherwise been payable to affiliates of KPS through the end of the agreement. The 2012 amount represents the annual advisory fees payable to affiliates of KPS. See the notes to the consolidated financial statements, which are included elsewhere in this annual report. |
| (g) | Specified legal/professional expenses for the year ended December 31, 2013 includes $4.3 million of professional fees for accounting, tax, legal and consulting services related to costs incurred as a publicly traded company, including IPO efforts, Follow-on Public Offering costs, Additional Follow-on Public Offering costs, costs associated with the Exchange Offer and certain regulatory and compliance matters. |
Specified legal/professional expenses for the year ended December 31, 2012 includes $3.3 million of professional fees for accounting, tax, legal and consulting services related to the Exchange Offer and public company readiness efforts.
| (h) | Represents non-cash lower of cost or market charges for the write down of inventory recorded during the year ended December 31, 2013 and 2012. |
| (i) | Represents share-based compensation expense resulting from the grant of non-qualified stock options, restricted stock and performance-based shares to certain employees, members of our management and our Board of Directors. |
| (j) | Represents a call premium of $0.5 million as a result of a voluntary prepayment of $15.0 million on our Term Loan Facility in April 2012. |
68
Table of Contents
Segment Results of Operations
Segment Results of Operations for the Year Ended December 31, 2013, Compared to the Year Ended December 31, 2012
| For the Year Ended December 31, |
Change 2013 vs. 2012 |
|||||||||||||||
| (in millions) | 2013 | 2012 | Amount | Percent | ||||||||||||
| Pounds shipped (1) |
||||||||||||||||
| Olin Brass |
279.4 | 266.2 | 13.2 | 5.0 | % | |||||||||||
| Chase Brass |
216.0 | 216.9 | (0.9 | ) | (0.4 | %) | ||||||||||
| A.J. Oster |
66.9 | 67.2 | (0.3 | ) | (0.4 | %) | ||||||||||
| Corporate and other (2) |
(39.3 | ) | (47.1 | ) | 7.8 | 16.6 | % | |||||||||
|
|
|
|
|
|
|
|||||||||||
| Total |
523.0 | 503.2 | 19.8 | 3.9 | % | |||||||||||
|
|
|
|
|
|
|
|||||||||||
| Net Sales |
||||||||||||||||
| Olin Brass |
$ | 874.1 | $ | 722.9 | $ | 151.2 | 20.9 | % | ||||||||
| Chase Brass |
622.0 | 648.0 | (26.0 | ) | (4.0 | %) | ||||||||||
| A.J. Oster |
316.2 | 326.4 | (10.2 | ) | (3.1 | %) | ||||||||||
| Corporate and other (2) |
(53.8 | ) | (46.8 | ) | (7.0 | ) | (15.0 | %) | ||||||||
|
|
|
|
|
|
|
|||||||||||
| Total |
$ | 1,758.5 | $ | 1,650.5 | $ | 108.0 | 6.5 | % | ||||||||
|
|
|
|
|
|
|
|||||||||||
| Adjusted EBITDA |
||||||||||||||||
| Olin Brass |
$ | 48.3 | $ | 45.1 | $ | 3.2 | 7.1 | % | ||||||||
| Chase Brass |
67.2 | 66.6 | 0.6 | 0.9 | % | |||||||||||
| A.J. Oster |
16.9 | 19.5 | (2.6 | ) | (13.3 | %) | ||||||||||
|
|
|
|
|
|
|
|||||||||||
| Total for operating segments |
$ | 132.4 | $ | 131.2 | $ | 1.2 | 0.9 | % | ||||||||
|
|
|
|
|
|
|
|||||||||||
| (1) | Amounts exclude quantity of unprocessed metal sold. |
| (2) | Amounts represent intercompany eliminations. |
See the notes to the consolidated financial statements included elsewhere in this annual report for additional information regarding our segment reporting and a reconciliation of Adjusted EBITDA of segments to income before provision for income taxes and equity income.
Olin Brass
Olin Brass net sales increased by $151.2 million, or 20.9%, from $722.9 million for the year ended December 31, 2012 to $874.1 million for the year ended December 31, 2013. The increase was due to the sales of unprocessed metal, higher volume and higher average selling prices, including increases in sales prices to A.J. Oster (which are eliminated in our consolidated results) and partially offset by a shift in product mix as well as lower metal prices.
The sales of unprocessed metal and higher average selling prices, partially offset by lower metal prices, increased net sales by $116.3 million for the year ended December 31, 2013 as compared to the same period in 2012.
Volume increased by 13.2 million pounds, or 5.0%, from 266.2 million pounds for the year ended December 31, 2012 to 279.4 million pounds for the year ended December 31, 2013. The increase in volume, which contributed $34.9 million to the increase in net sales, was the result of higher demand in the building and housing, munitions, coinage and automotive end markets. These increases were partially offset by a lower demand in the electronics/electrical components end market as well as lower shipments to A.J. Oster. During the
69
Table of Contents
year ended December 31, 2013, A.J. Oster reduced purchases from Olin Brass and increased purchases from third party suppliers by approximately 7.8 million pounds compared to the same period in 2012. Excluding sales to A.J. Oster, Olin Brass volumes increased by 21.0 million pounds, or 9.6%, for the year ended December 31, 2013 compared to the same period in 2012.
Adjusted EBITDA of Olin Brass increased by $3.2 million, from $45.1 million for the year ended December 31, 2012 to $48.3 million for the year ended December 31, 2013. The increase was due primarily to higher volume, lower shrinkage costs due to lower metal costs and higher yields and higher average selling prices, including increases in sales prices to A.J. Oster (which are eliminated in our consolidated results) and partially offset by a shift in product mix. Other factors partially offsetting the increase were higher manufacturing conversion costs due to product mix and operational issues which adversely impacted product flow and yield at Olin Brass, additional expenses associated with our continuous improvement efforts and development of our information systems, an increase in outside services, an increase in salaries, benefits and incentive compensation, an increase in other selling, general and administrative expenses incurred in support of our marketing and product development, labor contract negotiations and development of our information systems and a net decrease in other adjustments included in the calculation of Adjusted EBITDA.
Chase Brass
Chase Brass net sales decreased by $26.0 million, or 4.0%, from $648.0 million for the year ended December 31, 2012 to $622.0 million for the year ended December 31, 2013. The decrease was due primarily to lower metal prices and lower volume, partially offset by higher average selling prices.
Lower metal prices, partially offset by higher average selling prices for the year ended December 31, 2013, contributed $23.1 million to the decrease in net sales as compared to the same period in 2012.
Volume decreased by 0.9 million pounds, or 0.4%, from 216.9 million pounds for the year ended December 31, 2012 to 216.0 million pounds for the year ended December 31, 2013. The decrease in volume, which contributed $2.9 million to the decrease in net sales, was the result of lower demand in the electronics/electrical components end market resulting from increased competition from foreign imports and customers sourcing their finished products offshore, thereby also increasing the amount of manufacturing offshore and consequently reducing demand for brass rod in the United States. This decrease was partially offset by higher demand in the building and housing end market, which was also was dampened by foreign competition.
Adjusted EBITDA of Chase Brass increased by $0.6 million, from $66.6 million for the year ended December 31, 2012 to $67.2 million for the year ended December 31, 2013. The increase was due primarily to higher average selling prices and lower shrinkage costs due to lower metal costs and higher yields, partially offset by a decrease in volume, the change in management’s estimate of the recoverability of accounts receivable resulting in the reversal of the provision for bad debt in 2012 greater than 2013, an increase in manufacturing conversion costs, additional expenses associated with our continuous improvement efforts and labor contract negotiations, and an increase in other selling, general and administrative expenses incurred in support of marketing and product development and development of our information systems.
A.J. Oster
A.J. Oster net sales decreased by $10.2 million, or 3.1%, from $326.4 million for the year ended December 31, 2012 to $316.2 million for the year ended December 31, 2013. The decrease was due primarily to lower metal prices and lower volume in the year ended December 31, 2013 compared to the same period in 2012, partially offset by higher average selling prices.
Lower metal prices, partially offset by higher average selling prices for the year ended December 31, 2013 contributed $8.6 million to the decrease in net sales as compared to the same period in 2012.
70
Table of Contents
Volume decreased by 0.3 million pounds, or 0.4%, from 67.2 million pounds for the year ended December 31, 2012 to 66.9 million pounds for the year ended December 31, 2013. The decrease in volume, which contributed $1.6 million to the decrease in net sales, was primarily the result of lower demand in the building and housing end market, which was influenced by lower shipments to specific customers, that are partially offset by the overall recovery in the building and housing end market, and lower demand in the electronics/electrical components end market, partially offset by the higher demand in the automotive end market.
Adjusted EBITDA of A.J. Oster decreased by $2.6 million, from $19.5 million for the year ended December 31, 2012 to $16.9 million for the year ended December 31, 2013. The decrease was due to higher prices on purchases from Olin Brass, which resulted in higher conversion costs (which are eliminated in our consolidated results), as well as lower volume, an increase in outside services, partially offset by higher average selling prices and a decrease in salaries, benefits and incentive compensation.
Liquidity and Capital Resources
Sources and Uses of Cash
Our primary uses of cash are to fund working capital, operating expenses, debt service and capital expenditures. Historically, our primary sources of short-term liquidity have been cash flow from operations and borrowings under our ABL Facility. Holdings derives all its cash flow from its subsidiaries, including GBC, and receives dividends, distributions and other payments from them to generate the funds necessary to meet its financial obligations. However, Holdings is a holding company with no operations, no employees and no assets other than its investment in GBC. All of our operations are conducted at GBC and its subsidiaries. GBC is also the primary obligor on our indebtedness, and Holdings has no indebtedness other than its guarantee of GBC’s indebtedness.
The ABL Facility and the Senior Secured Notes limit the ability of GBC and its subsidiaries to dividend or distribute cash to Holdings and to its equityholders, although ordinary course dividends and distributions to meet the limited holding company expenses and related obligations at Holdings of up to $5.0 million per year are permitted under those agreements. Under the Senior Secured Notes, GBC is also permitted to dividend or distribute to Holdings and its equityholders up to 50% of its Consolidated Net Income (as defined in the indenture governing the Senior Secured Notes) from April 1, 2012 to the end of GBC’s most recently ended quarter. As of December 31, 2014, all of the net assets of the subsidiaries are restricted except for $54.0 million, which are permitted dividend distributions under the indenture governing the Senior Secured Notes.
We do not believe that the restrictions on dividends and distributions to Holdings and its equityholders imposed by the terms of our debt agreements have any impact on our liquidity, financial condition or results of operations. We believe that these resources will be sufficient to meet our working capital and debt service needs for the foreseeable future, including costs that we may incur in connection with our growth strategy.
At December 31, 2014, we did not have any outstanding borrowings under our ABL Facility. We had borrowing availability of $199.5 million after giving effect to $0.5 million of letters of credit outstanding. The letters of credit primarily represent collateral against certain workers compensation liabilities assumed from Olin Corporation.
Our borrowing base under our current ABL Facility fluctuates with changes in eligible collateral, less outstanding borrowings and letters of credit. As of December 31, 2014, the value of our eligible collateral against which we can borrow exceeded our maximum committed amounts of $200.0 million. Consequently, increases in eligible collateral due to increases in volume, metal prices or inventory balances will not increase the borrowing base but may increase our borrowing requirements. Conversely, decreases in volume, metal prices or inventory
71
Table of Contents
balances will not have an immediate impact on the borrowing base due to the excess of eligible collateral over the maximum borrowing base, but may decrease our borrowing requirements. In the event of increased commodity prices as indicated by the terms of the ABL Facility agreement, we may request, but the lenders are not obligated to, increase the maximum borrowings available up to $250.0 million. At any time, if the amount outstanding under the ABL Facility exceeds the maximum allowable borrowings, we are required to make a mandatory prepayment for the amount of the excess borrowings. At any time after the occurrence and during the continuance of a Trigger Event (as defined in the agreement governing the ABL Facility), subject to certain thresholds, reinvestment rights and other exceptions, proceeds received from asset sales, equity issuances or other specified events will be required to be applied (as mandatory prepayments) in whole or in part towards the extinguishment of outstanding amounts due under the ABL Facility.
We are a value-added converter, fabricator, processor and distributor and not a commodity metal producer. We employ our balanced book approach in order to substantially reduce the financial impact of fluctuations in metal costs on our earnings and operating margins. While changes in metal prices do not have a substantial impact on our earnings or margins, except for increased costs attributable to shrinkage loss that occur as a result of increased metal prices and the potential effect higher metal prices may have on our customers’ demand for our products, changes in metal prices do affect our liquidity because of the difference between our payment terms for metal purchases and our credit terms with our customers. As a result, when metal prices are rising, we tend to use more cash or draw more on the ABL Facility to cover the cash flow delay between cash collection from our customers and metal replacement purchases. When metal prices fall, we replace our metal at a lower cost than the metal content of cash collections and generally increase our cash balances or reduce our use of the ABL Facility. Because the financial instruments that we use to effectuate the balanced-book approach are designed to hedge against the replacement cost of metal used in our operations, those financial instruments do not have a material impact on our liquidity. We believe that our cash flow from operations, supplemented with cash available under the ABL Facility, will provide sufficient liquidity to meet our needs in the current metal price environment.
In June 2012, GBC issued $375.0 million aggregate principal amount of Senior Secured Notes and used a portion of the net proceeds to repay all outstanding amounts (including premium and unpaid interest) under the Term Loan Facility. We also used a portion of the net proceeds to pay a $160.0 million distribution to Halkos. The Senior Secured Notes bear interest at a rate of 9.50% per annum, payable in cash semi-annually on each June 1 and December 1, beginning on December 1, 2012.
We manage our levels of inventory in order to be able to satisfy customers’ needs in a timely fashion, while limiting our working capital investments, to the extent possible. Generally, we use cash on hand or borrowings under the ABL Facility to acquire inventory.
We acquired a substantial amount of property, plant and equipment when we acquired the worldwide metals business of Olin Corporation and therefore have operating capacity available to support growth in our base business. As such, capital improvements and replacement costs account for the majority of our capital expenditures, which we expect to be in line with our historical spend over the foreseeable future.
We generally meet long-term liquidity requirements, the repayment of debt and investment funding needs through cash flow from operations and additional borrowing under the ABL Facility. We believe that cash flow from operations, supplemented by cash available under the ABL Facility will be sufficient to enable us to meet our capital investment, debt service and operational obligations as they continue for the foreseeable future.
72
Table of Contents
Cash Flows
The following table presents the summary components of net cash provided by or used in operating, investing and financing activities for the periods indicated. As of December 31, 2014 we had cash of $44.6 million, compared to $10.8 million at December 31, 2013. The accompanying discussion should be read in conjunction with our consolidated statements of cash flows in our audited consolidated financial statements included elsewhere in this annual report.
| Cash Flow Analysis | For the Year Ended December 31, | |||||||||||
| (in millions) | 2014 | 2013 | 2012 | |||||||||
| Cash flows provided by operating activities |
$ | 64.5 | $ | 28.0 | $ | 80.1 | ||||||
| Cash flows used in investing activities |
$ | (22.3 | ) | $ | (26.0 | ) | $ | (18.6 | ) | |||
| Cash flows used in financing activities |
$ | (9.0 | ) | $ | (4.9 | ) | $ | (96.8 | ) | |||
Our consolidated statements of cash flows for years ended December 31, 2013 and 2012 reflect revisions discussed in the notes to consolidated financial statements included elsewhere in this annual report.
Cash flows from operating activities
During the year ended December 31, 2014, net cash provided by operating activities was $64.5 million. This amount was primarily attributable to net income of $32.1 million, adjustments to net income of $25.4 million and a decrease in assets net of liabilities of $7.0 million.
The cash effect of the decrease in assets net of liabilities is comprised of (i) a decrease in accounts receivable net of accounts payable, (ii) a decrease in inventory and (iii) an increase in accrued liabilities. The decrease in assets net of liabilities was partially offset by (i) an increase in prepaid expenses and other current assets, (ii) an increase in income taxes receivable net of income taxes payable, (iii) an increase in other assets net of liabilities and (iv) a decrease in accrued interest. The overall decrease in assets net of liabilities was due to improved management of working capital.
The decrease in accounts receivable was mainly due to a decrease in trade receivables as a result of the decrease in day’s sales outstanding (“DSO”) from 42 days as of December 31, 2013 to 36 days at December 31, 2014. The change in DSO was due primarily to customer mix and to seasonal and intra-month fluctuations in the timing of shipments and collections. The decrease in accounts payable was mainly due to the decrease in the purchase payment cycle from 23 days at December 31, 2013 to 21 days at December 31, 2014. The decrease in the purchase payment cycle was due primarily to vendor mix and to seasonal and intra-month fluctuations in the timing of material receipts and payments.
During the year ended December 31, 2013, net cash provided by operating activities was $28.0 million. This amount was primarily attributable to net income of $10.7 million, adjustments to net income of $42.6 million, partially offset by an increase in assets net of liabilities of $25.3 million. The $42.6 million in adjustments was primarily due to the non-cash profits interest compensation expense of $8.9 million and $20.4 million of incremental non-cash compensation expense related to the modification to the Halkos LLC Agreement.
The cash effect of the increase in assets net of liabilities was comprised of (i) an increase in accounts receivable net of accounts payable, (ii) an increase in inventory, (iii) an increase in prepaid expenses and other current assets, primarily due to the deferred expense related to the sales of unprocessed metal to toll customers, (iv) an increase in other assets net of liabilities and (v) an increase in income taxes receivable net of income taxes payable. The increase was partially offset by an increase in accrued liabilities, which was primarily due to the increase in deferred revenue related to the sales of unprocessed metal to toll customers.
73
Table of Contents
The increase in inventory is primarily due to a shift in the product mix at Olin Brass to items requiring more processing steps and operational issues affecting product flow and yield within the brass mill and downstream cupping operation.
The increase in accounts receivable was due to an increase in trade receivables as a result of higher sales during the fourth quarter of 2013 as compared to the fourth quarter of 2012, partially offset by the decrease in DSO from 44 days as of December 31, 2012 to 42 days at December 31, 2013. The change in DSO was due primarily to customer mix and to seasonal and intra-month fluctuations in the timing of shipments and collections. The increase in accounts payable was due to higher volume in the fourth quarter of 2013 as compared to the fourth quarter of 2012, partially offset by the decrease in the purchase payment cycle from 24 days at December 31, 2012 to 23 days at December 31, 2013. The decrease in the purchase payment cycle was due primarily to vendor mix and to seasonal and intra-month fluctuations in the timing of material receipts and payments.
During the year ended December 31, 2012, net cash provided by operating activities was $80.1 million. This amount was primarily attributable to net income of $12.9 million, adjustments to net income of $47.5 million, and a decrease in assets net of liabilities of $19.7 million. The $47.5 million in adjustments included the loss on extinguishment of debt in connection with the Term Loan Refinancing of $19.6 million and non-cash profits interest compensation expense of $19.5 million.
The cash effect of the decrease in assets net of liabilities was comprised of (i) a reduction in inventory due primarily to commercial and manufacturing process improvements, (ii) a decrease of prepaid expenses and other current assets, (iii) a decrease in income taxes receivable net of income taxes payable, (iv) a decrease in accounts receivable net of accounts payable and (v) an increase in accrued liabilities. The decrease was partially offset by (i) an increase in other assets net of liabilities and (ii) a decrease in accrued interest.
The increase in accounts receivable was due primarily to an increase in trade receivables as a result of higher volume in the fourth quarter of 2012 as compared to the fourth quarter of 2011, as well as due to a slight increase in the DSO from 43 days at December 31, 2011 to 44 days at December 31, 2012. The increase in accounts payable was due to higher volume in the fourth quarter of 2012 as compared to the fourth quarter of 2011, as well as due to a slight increase in the purchase payment cycle from 23 days at December 31, 2011 to 24 days at December 31, 2012.
Cash flows from investing activities
Net cash used in investing activities was $22.3 million for the year ended December 31, 2014, which consisted primarily of $23.4 million of capital improvements or replacement of existing capital items, including upgrading of our information systems, or replacement of existing capital items, partially offset by $1.1 million of proceeds from the sale of property, plant and equipment.
Net cash used in investing activities was $26.0 million for the year ended December 31, 2013, which consisted primarily of $26.2 million of capital improvements or replacement of existing capital items, partially offset by $0.2 million of proceeds from the sale of property, plant and equipment.
Net cash used in investing activities was $18.6 million for the year ended December 31, 2012, which consisted primarily of capital improvements or replacement of existing capital items.
Cash flows from financing activities
Net cash used in financing activities was $9.0 million for the year ended December 31, 2014, which consisted primarily of net repayments under the ABL Facility of $5.5 million, principal payments under our
74
Table of Contents
capital lease obligation of $0.2 million, dividends paid of $3.2 million and share repurchases to satisfy employee minimum tax withholdings of $0.4 million, offset by the proceeds from the exercise of stock options of $0.1 million and the excess tax benefit from share-based compensation of $0.2 million.
Net cash used in financing activities was $4.9 million for the year ended December 31, 2013, which consisted primarily of net repayments under the ABL Facility of $9.0 million and dividends paid of $0.8 million, partially offset by a decrease of $4.9 million in the receivable due from stockholder as all amounts were received pertaining to reimbursable expenses incurred in connection with our IPO efforts.
Net cash used in financing activities was $96.8 million for the year ended December 31, 2012, which was a result of the repayment of the term loan of $310.9 million (including $266.5 million associated with the Term Loan Refinancing, a voluntary prepayment of $15.0 million, a mandatory prepayment of $28.6 million and a scheduled payment of $0.8 million), the Parent Distribution to Halkos of $160.0 million, payment of $12.9 million of costs associated with the issuance of the Senior Secured Notes and the ABL Amendment, and $2.5 million receivable due from stockholder pertaining to reimbursable expenses, offset by the proceeds from the Senior Secured Notes of $375.0 million and net borrowings on the ABL Facility of $14.5 million.
Covenant Compliance
We are subject to various affirmative and negative covenants as covered by our ABL Facility and Senior Secured Notes, especially those regarding fixed charge coverage rations and minimum excess availability. As of December 31, 2014, we were in compliance with all covenants and ratios.
Outstanding Indebtedness
The ABL Facility
Our borrowing base is equal to a percentage of receivables and inventories less reserves. In the event of increased commodity prices as indicated by the terms of the ABL Facility agreement, we may request, but the lenders are not obligated to, increase the maximum borrowings available up to $250.0 million. At any time, if the amount outstanding under the ABL Facility exceeds the maximum allowable borrowings, we may be required to make a mandatory prepayment for the amount of the excess borrowings. As of December 31, 2014, we had $199.5 million available for borrowing under the ABL Facility.
We may elect to receive advances under the ABL Facility in the form of either prime rate advances or LIBOR rate advances, as defined by the agreement governing the ABL Facility. The unused portion under the ABL Facility determines the applicable spread added to the LIBOR rate. Outstanding borrowings under the ABL Facility bear interest at a rate equal to either (i) for prime rate loans, a prime rate plus a spread between 1.0% and 1.5%, depending on excess availability levels or (ii) for LIBOR rate loans, LIBOR plus a spread of 2.0% to 2.5% depending on excess availability levels. As of December 31, 2014 and 2013, amounts outstanding under the ABL Facility accrued interest at a rate of 4.25%.
The ABL Facility has an expiration date of June 1, 2017 and contains various debt covenants to which we are subject on an ongoing basis. As of December 31, 2014, we were in compliance with all such covenants.
Senior Secured Notes
On June 1, 2012, GBC issued $375.0 million in aggregate principal amount of 9.50% Senior Secured Notes due 2019. A portion of the net proceeds of the Senior Secured Notes was used in the Term Loan Refinancing while $160.0 million was used to make the Parent Distribution to Halkos. The Senior Secured Notes are guaranteed by Holdings, and substantially all of GBC’s existing and future 100%-owned U.S. subsidiaries and by any future Restricted Subsidiaries (as defined in the indenture governing the Senior Secured Notes) who
75
Table of Contents
guarantee or incur certain types of permitted debt under the indenture governing the Senior Secured Notes. The Senior Secured Notes are secured by a senior-priority security interest in our fixed assets (which secure the ABL Facility on a junior-priority basis) and by a junior-priority security interest in our accounts receivable and inventory (which secure the ABL Facility on a senior-priority basis).
The indenture governing the Senior Secured Notes contains certain covenants, obligations and restrictions that are customary in these types of indebtedness. We are in compliance with all covenants relating to the Senior Secured Notes as of December 31, 2014.
The Senior Secured Notes mature on June 1, 2019 and accrue interest at the rate of 9.50% per annum. Interest is paid semiannually in arrears on June 1 and December 1, commencing on December 1, 2012.
Pursuant to a registration rights agreement, on October 7, 2013, GBC completed the Exchange Offer to issue registered notes (with substantially the same terms as the Senior Secured Notes) in exchange for the Senior Secured Notes that GBC issued in a private offering on June 1, 2012.
Contractual Obligations
The following table illustrates our contractual commitments as of December 31, 2014:
| Contractual commitments | ||||||||||||||||||||||||||||
| (in millions) | 2015 | 2016 | 2017 | 2018 | 2019 | Beyond | Total | |||||||||||||||||||||
| Senior Secured Notes—Principal |
$ | — | $ | — | $ | — | $ | — | $ | 375.0 | $ | — | $ | 375.0 | ||||||||||||||
| Senior Secured Notes—Interest |
35.6 | 35.6 | 35.6 | 35.6 | 14.8 | — | 157.2 | |||||||||||||||||||||
| Capital Lease Obligation—Principal |
1.0 | 1.1 | 1.3 | 1.4 | 1.0 | — | 5.8 | |||||||||||||||||||||
| Capital Lease Obligation—Interest |
0.4 | 0.4 | 0.2 | 0.2 | — | — | 1.2 | |||||||||||||||||||||
| Purchase Obligations |
246.9 | 3.4 | 3.2 | 2.7 | 0.7 | — | 256.9 | |||||||||||||||||||||
| IAM National Pension Fund |
3.8 | 4.0 | 3.5 | — | — | — | 11.3 | |||||||||||||||||||||
| Leases |
2.4 | 1.9 | 1.4 | 1.0 | 0.4 | — | 7.1 | |||||||||||||||||||||
|
|
|
|
|
|
|
|
|
|
|
|
|
|
|
|||||||||||||||
| Total |
$ | 290.1 | $ | 46.4 | $ | 45.2 | $ | 40.9 | $ | 391.9 | $ | — | $ | 814.5 | ||||||||||||||
|
|
|
|
|
|
|
|
|
|
|
|
|
|
|
|||||||||||||||
We are obligated to make future payments under various contracts such as debt agreements, lease agreements and collective bargaining agreements. Operating lease obligations are payment obligations under leases classified as operating leases. Most leases are for a period of three years but some last up to five years and are primarily for equipment used in our manufacturing and distribution operations. Our purchase obligations are agreements to purchase goods or services that are enforceable and legally binding on us that specify all significant terms, including fixed or minimum quantities, fixed or variable prices and the approximate timing of the transaction. Purchase obligations include the pricing of anticipated metal purchases using contractual metal prices, or where pricing is dependent on prevailing COMEX or London Metal Exchange (“LME”) prices at the time of delivery, market metal prices as of December 31, 2014, as well as natural gas and electricity prices. As a result of the variability in the pricing of many of our metal purchasing obligations, actual amounts may vary from the amounts shown above.
We participate in a multi-employer pension plan under the collective bargaining agreement that covers the East Alton, Illinois operations of our Olin Brass segment and the Alliance, Ohio operations of our A.J. Oster segment. The collective bargaining agreement for our Olin Brass segment runs through November 2017 and the collective bargaining agreement for our A.J. Oster segment runs through February 2017 and both obligate us to contribute to the plan at a rate per eligible hour per covered employee as specified in the agreement. The contributions to the multi-employer plan are a function of employment levels and eligible work hours. As a result, actual amounts may vary from the amounts shown above.
76
Table of Contents
The ABL Facility bears interest at variable rates, and the outstanding amounts under the ABL Facility will vary from time to time, so estimating future interest and principal payments under the ABL Facility is not practicable. The ABL Facility matures on June 1, 2017.
At December 31, 2014, we had a liability for uncertain tax positions, including interest and penalties, of $25.3 million, but as we are unable to reasonably estimate the ultimate amount or timing of settlement or other resolution, it is not practical to present annual payment information.
Off-Balance Sheet Arrangements
We have not created, and are not party to, any special-purpose or off-balance sheet entities for the purpose of raising capital, incurring debt or operating our business. We do not have any off-balance sheet arrangements or relationships with entities that are not consolidated into our financial statements that have or are reasonably likely to have a material current or future effect on our financial condition, changes in financial condition, sales, expenses, results of operations, liquidity, capital expenditures or capital resources.
Critical Accounting Policies and Estimates
The preparation of our consolidated financial statements in accordance with U.S. GAAP requires us to make estimates and judgments that affect the reported amounts of assets, liabilities, revenues and expenses, and related disclosures of contingent assets and liabilities. Estimates are based on historical experience and on various other assumptions that are believed to be reasonable under the circumstances. The result of this process forms the basis for making judgments about the carrying value of assets and liabilities that are not readily apparent from other sources. We review our estimates and judgments on a regular, ongoing basis. Actual results may differ from these estimates due to changed circumstances and conditions.
The following accounting policies and estimates are considered critical in light of the potentially material impact that the estimates, judgments and uncertainties affecting the application of these policies might have on our reported financial information.
Our accounting policies are more fully described in note 2 “Summary of Significant Accounting Policies” to our audited consolidated financial statements included elsewhere in this annual report. There have been no significant changes to our critical accounting policies or estimates for the year ended December 31, 2014.
Revenue Recognition
We recognize revenue when title and risk of loss are transferred to customers, which is generally the date the product is shipped. Estimates for future rebates on certain product lines and product returns are recognized in the period in which the revenue is recorded. Rebates and returns are estimated based upon our historical experience, combined with a review of current developments. The allowance for doubtful accounts is estimated based upon our historical experience, combined with a review of current developments and the specific identification method of accounts for which payment has become unlikely. Billings to customers for shipping costs are included in net sales and the cost of shipping product to those customers is reflected as a component of cost of sales.
The Company defers the revenue from the sales of the unprocessed metal to toll customers (and the corresponding deferred expense for the sales) until the finished product has been shipped. The deferred revenue is recorded within accrued liabilities and the related deferred expense is recorded within prepaid expenses and other current assets on the consolidated balance sheets.
77
Table of Contents
Inventories
Inventories include costs attributable to direct labor and manufacturing overhead but are primarily comprised of material costs. The metals component of inventories that is valued on a LIFO basis comprises approximately 71% and 70% of total inventory at December 31, 2014 and 2013, respectively.
Other manufactured inventories, including the non-material components and certain non-U.S. inventories, are valued on a first-in, first-out (“FIFO”) basis. Elements of cost in finished goods inventory in addition to the cost of material include depreciation, amortization, utilities, consumable production supplies, maintenance, production wages and transportation costs.
Inventories are stated at the lower of cost or market. The market price of metals used in production and related scrap is subject to volatility. During periods when open-market prices decline below net book value, we may need to record a provision to reduce the carrying value of our inventory. We analyze the carrying value of inventory for impairment if circumstances indicate impairment may have occurred. If an impairment occurs, the amount of impairment loss is determined by measuring the excess of the carrying value of inventory over the net realizable value of inventory.
We record an estimate for slow moving and obsolete inventory based upon product knowledge, physical inventory observation, estimated future demand, market conditions and an aging analysis of the inventory on hand. Our policy is to evaluate all inventories including raw material, work-in-process and finished goods. Inventory in excess of our estimated usage requirements is written down to its estimated net realizable value.
Purchase Accounting
Determining the fair value of certain assets, liabilities and subsidiaries assumed in a business combination is judgmental in nature and often involves the use of significant estimates and assumptions. Some of the more significant estimates and assumptions used in valuing our acquisition of the worldwide metals business of Olin Corporation in 2007 and our acquisition of the order book, customer list and certain other assets of the North American operations of Bolton Metals Product Company (“Bolton”) in January 2008 included projected future cash flows and discount rates reflecting the risk inherent in future cash flows.
We recognized goodwill related to the acquisition of the order book, customer list and certain other assets of Bolton’s North American operations, as the purchase price exceeded the fair value of net assets. For the acquisition of the worldwide metals business of Olin Corporation, the estimated fair value of the net assets exceeded the purchase price, thus creating negative goodwill under then current GAAP guidance. As such, noncurrent assets were assigned no value in the acquisition from Olin Corporation.
We own a 50% interest in the Dowa Joint Venture, a joint venture with Dowa Co. based in Japan. As a result of the purchase method of accounting, a negative basis difference was created between the Company’s books and our share of the Dowa Joint Venture’s equity as of November 19, 2007. U.S. GAAP at the time of the transaction provided that the basis difference between the investor cost and underlying equity in net assets of the investee at the date of investment required recognition unless it is attributable to a non-amortizing asset such as goodwill. The negative basis difference was created due to the bargain purchase event associated with the worldwide metals business acquired from Olin Corporation and was not attributable to any specific element of the joint venture itself. As the difference was not attributable to any of the specific assets of the Dowa Joint Venture, the equity investment as a whole was assessed to determine the appropriate accretion period for the basis difference. The purpose of the joint venture is to provide Olin Brass’ high performance alloy materials to the Asia market through the licensing of Olin Brass technology. Given consideration of this use, the negative basis difference is being accreted over a period of 13 years.
78
Table of Contents
Uncertain Tax Positions
Our management evaluates the recognition and measurement of uncertain tax positions based on applicable tax law, regulations, case law, administrative rulings and pronouncements and the facts and circumstances surrounding the tax position. Changes in our estimates related to the recognition and measurement of the amount recorded for uncertain tax positions could result in significant changes in our provision for (benefit from) income taxes, which could be material to our consolidated statements of operations.
Derivative Contracts
We measure the fair value of our derivative contract positions under the provisions of ASC 820, which defines fair value, establishes a framework for measuring fair value and enhances disclosures about fair value measures required under other accounting pronouncements but does not change existing guidance as to whether or not an instrument is carried at fair value. This guidance also specifies a fair value hierarchy based upon the observability of inputs used in valuation techniques.
In accordance with this guidance, fair value measurements are classified under the following hierarchy:
| • | Level 1—Quoted prices for identical instruments in active markets. |
| • | Level 2—Quoted prices for similar instruments in active markets; quoted prices for identical or similar instruments in markets that are not active and model-derived valuations in which all significant inputs or significant value-drivers are observable in active markets. |
| • | Level 3—Model-derived valuations in which one or more significant inputs or significant value-drivers are unobservable. |
In accordance with ASC 820, we determine the fair value of derivative contracts using Level 2 inputs. As of December 31, 2014, we did not hold assets or liabilities requiring a Level 3 measurement, and there were not any transfers between the hierarchy levels during 2014 or 2013. We do not use hedge accounting for our derivative contracts. All gains and losses are recorded as operating expense in the consolidated statements of operations as these contracts are marked to market each period.
Recently Issued and Recently Adopted Accounting Pronouncements
For information on recently issued and recently adopted accounting pronouncements, see the notes to the consolidated financial statements, which are included elsewhere in this annual report.
Inflation and Seasonality
We experience effects of inflation on input costs, such as wages, natural gas, electricity, plating and other key inputs. We may not be able to offset fully the impact of inflation on these input costs or energy costs through price increases, productivity improvements or cost reduction programs.
There is a slight decrease in our net sales in each fourth quarter as a result of a decrease in demand due to customer shutdowns for the holidays and holiday and year-end maintenance of plants and inventory by customers. We also typically experience slight working capital increases in the first quarter. We do not foresee these seasonality trends to change materially.
79
Table of Contents
Item 7A. Quantitative and Qualitative Disclosures About Market Risk.
Market risk represents the risk of changes in the value of market risk sensitive instruments caused by fluctuations in interest rates, commodity prices and foreign exchange rates. Changes in these factors could cause fluctuations in the results of our operations and cash flows. In the ordinary course of business, we are primarily exposed to changes in commodity prices, interest rates and foreign currency exchange rates. To manage the volatility related to these exposures we use various financial instruments, including some derivatives, to help us manage our metal price, energy price, and interest rate risk. We also use offsetting forward sale and purchase agreements to help mitigate commodity price risks on operating margins. These agreements generally do not contain minimum purchase requirements.
We do not use derivative instruments for trading or speculative purposes and have not elected to use hedge accounting. We manage counterparty credit risk in our derivatives by entering into derivative instruments only with financial institutions with investment-grade credit ratings.
The following tables set forth the impact of a 10% price change on our hedging positions as of December 31, 2014 and December 31, 2013, respectively.
| (in millions) | ||||||||||||||||
| December 31, 2014 |
Nominal value | Fair value | Unrealized losses |
Impact of 10% price change on fair value |
||||||||||||
| Metals |
$ | 13.4 | $ | 12.5 | $ | (0.9 | ) | $ | 1.3 | |||||||
| Natural Gas |
2.6 | 1.9 | (0.7 | ) | 0.2 | |||||||||||
| Electricity |
5.9 | 5.5 | (0.4 | ) | 0.6 | |||||||||||
|
|
|
|
|
|
|
|
|
|||||||||
| Totals |
$ | 21.9 | $ | 19.9 | $ | (2.0 | ) | $ | 2.1 | |||||||
|
|
|
|
|
|
|
|
|
|||||||||
| December 31, 2013 |
Nominal value | Fair value | Unrealized gains |
Impact of 10% price change on fair value |
||||||||||||
| Metals |
$ | 10.4 | $ | 10.9 | $ | 0.5 | $ | 1.1 | ||||||||
| Natural Gas |
1.2 | 1.4 | 0.2 | 0.1 | ||||||||||||
| Electricity |
3.4 | 3.6 | 0.2 | 0.4 | ||||||||||||
|
|
|
|
|
|
|
|
|
|||||||||
| Totals |
$ | 15.0 | $ | 15.9 | $ | 0.9 | $ | 1.6 | ||||||||
|
|
|
|
|
|
|
|
|
|||||||||
Commodity Prices
In the ordinary course of business, we are exposed to earnings and cash flow volatility resulting from fluctuations in metal, natural gas and electricity costs. We use our balanced book approach, supported, where required, by derivative contracts, to substantially reduce the impact of metal price fluctuations on operating margins. Despite our use of our balanced book approach to mitigate the impact of metal price fluctuations on our operating margins, we must bear the cost of any shrinkage during production, which may increase the volatility of our results of operations. We also use derivative contracts to reduce uncertainty and volatility in natural gas and electricity costs.
Interest Rates
We are exposed to volatility in interest rates and expense under the terms of our credit agreement. Interest rates under the ABL Facility are comprised of a base rate and margin. The ABL Facility provides the option of a LIBOR or prime base rate. While we had no amounts outstanding under the ABL Facility as of December 31, 2014, if and when we borrow under the ABL Facility and if interest rates increase, our debt service obligations on variable rate debt would increase even though the amount borrowed would not increase.
80
Table of Contents
Foreign Exchange
We have international operations that accounted for approximately 6% of our net sales in 2014. The functional currency of our operating subsidiaries is the related local currency and the currency effects of translating the financial statements are included in accumulated other comprehensive income and do not impact earnings unless there is a liquidation or sale of those foreign subsidiaries. During 2014, the fluctuation of the U.S. dollar against other currencies resulted in an unrealized currency translation loss that decreased our equity by $1.1 million. Gains or losses from currency translation are primarily related to our equity investment in the Dowa Joint Venture.
We also have exposure to foreign exchange risk on transactions that can potentially be denominated in foreign currencies other than the U.S. dollar. We do not attempt to hedge foreign currency exposure in a manner that would eliminate the effect of changes in foreign currency exchange rates on net income and cash flow. We do not speculate in foreign currency nor do we hedge the foreign currency translation of our international business to the U.S. dollar for purposes of consolidating our financial results, or other foreign currency net asset positions. During 2014, foreign currency transaction gains and losses resulted in a reduction of net income of approximately $0.1 million.
81
Table of Contents
Item 8. Financial Statements and Supplementary Data.
Report of Independent Registered Public Accounting Firm
To the Board of Directors and Stockholders of Global Brass and Copper Holdings, Inc.
In our opinion, the consolidated financial statements listed in the index appearing under Item 15(a)(1) present fairly, in all material respects, the financial position of Global Brass and Copper Holdings, Inc. and its subsidiaries at December 31, 2014 and 2013, and the results of their operations and their cash flows for each of the three years in the period ended December 31, 2014 in conformity with accounting principles generally accepted in the United States of America. In addition, in our opinion, the financial statement schedule listed in the index appearing under Item 15(a)(1) presents fairly, in all material respects, the information set forth therein when read in conjunction with the related consolidated financial statements. Also in our opinion, the Company maintained, in all material respects, effective internal control over financial reporting as of December 31, 2014, based on criteria established in Internal Control—Integrated Framework (2013) issued by the Committee of Sponsoring Organizations of the Treadway Commission (COSO). The Company’s management is responsible for these financial statements and financial statement schedule, for maintaining effective internal control over financial reporting and for its assessment of the effectiveness of internal control over financial reporting, included in Management’s Annual Report on Internal Control Over Financial Reporting appearing under Item 9A. Our responsibility is to express opinions on these financial statements, on the financial statement schedule, and on the Company’s internal control over financial reporting based on our audits (which was an integrated audit in 2014). We conducted our audits in accordance with the standards of the Public Company Accounting Oversight Board (United States). Those standards require that we plan and perform the audits to obtain reasonable assurance about whether the financial statements are free of material misstatement and whether effective internal control over financial reporting was maintained in all material respects. Our audits of the financial statements included examining, on a test basis, evidence supporting the amounts and disclosures in the financial statements, assessing the accounting principles used and significant estimates made by management, and evaluating the overall financial statement presentation. Our audit of internal control over financial reporting included obtaining an understanding of internal control over financial reporting, assessing the risk that a material weakness exists, and testing and evaluating the design and operating effectiveness of internal control based on the assessed risk. Our audits also included performing such other procedures as we considered necessary in the circumstances. We believe that our audits provide a reasonable basis for our opinions.
A company’s internal control over financial reporting is a process designed to provide reasonable assurance regarding the reliability of financial reporting and the preparation of financial statements for external purposes in accordance with generally accepted accounting principles. A company’s internal control over financial reporting includes those policies and procedures that (i) pertain to the maintenance of records that, in reasonable detail, accurately and fairly reflect the transactions and dispositions of the assets of the company; (ii) provide reasonable assurance that transactions are recorded as necessary to permit preparation of financial statements in accordance with generally accepted accounting principles, and that receipts and expenditures of the company are being made only in accordance with authorizations of management and directors of the company; and (iii) provide reasonable assurance regarding prevention or timely detection of unauthorized acquisition, use, or disposition of the company’s assets that could have a material effect on the financial statements.
Because of its inherent limitations, internal control over financial reporting may not prevent or detect misstatements. Also, projections of any evaluation of effectiveness to future periods are subject to the risk that controls may become inadequate because of changes in conditions, or that the degree of compliance with the policies or procedures may deteriorate.
| /s/ PricewaterhouseCoopers LLP |
| Chicago, Illinois |
| March 16, 2015 |
82
Table of Contents
Global Brass and Copper Holdings, Inc.
Consolidated Balance Sheets
| As of December 31, | ||||||||
| (In millions, except share and par value data) | 2014 | 2013 | ||||||
| Assets |
||||||||
| Current assets: |
||||||||
| Cash |
$ | 44.6 | $ | 10.8 | ||||
| Accounts receivable (net of allowance of $1.0 and $1.0 at 2014 and 2013, respectively) |
152.3 | 171.8 | ||||||
| Inventories |
189.0 | 190.9 | ||||||
| Prepaid expenses and other current assets |
26.2 | 22.2 | ||||||
| Deferred income taxes |
30.1 | 32.2 | ||||||
| Income tax receivable |
8.3 | 4.3 | ||||||
|
|
|
|
|
|||||
| Total current assets |
450.5 | 432.2 | ||||||
| Property, plant and equipment, net |
103.5 | 88.0 | ||||||
| Investment in joint venture |
2.0 | 2.2 | ||||||
| Goodwill |
4.4 | 4.4 | ||||||
| Intangible assets, net |
0.6 | 0.7 | ||||||
| Deferred income taxes |
0.8 | 4.6 | ||||||
| Other noncurrent assets |
14.7 | 16.6 | ||||||
|
|
|
|
|
|||||
| Total assets |
$ | 576.5 | $ | 548.7 | ||||
|
|
|
|
|
|||||
| Liabilities and equity / (deficit) |
||||||||
| Current liabilities: |
||||||||
| Current maturities of long-term debt |
$ | 1.0 | $ | — | ||||
| Accounts payable |
82.5 | 85.4 | ||||||
| Accrued liabilities |
57.3 | 56.1 | ||||||
| Accrued interest |
3.2 | 3.3 | ||||||
| Income tax payable |
0.5 | 0.5 | ||||||
|
|
|
|
|
|||||
| Total current liabilities |
144.5 | 145.3 | ||||||
| Long-term debt |
379.8 | 380.5 | ||||||
| Deferred income taxes |
0.8 | — | ||||||
| Other noncurrent liabilities |
25.4 | 26.3 | ||||||
|
|
|
|
|
|||||
| Total liabilities |
550.5 | 552.1 | ||||||
|
|
|
|
|
|||||
| Commitments and contingencies (Note 16) |
||||||||
| Global Brass and Copper Holdings, Inc. stockholders’ equity / (deficit): |
||||||||
| Common stock—$0.01 par value; 80,000,000 shares authorized; 21,369,407 and 21,251,486 shares issued at 2014 and 2013, respectively |
0.2 | 0.2 | ||||||
| Additional paid-in capital |
32.5 | 30.5 | ||||||
| Accumulated deficit |
(10.1 | ) | (38.6 | ) | ||||
| Treasury stock—29,200 and 0 shares at 2014 and 2013, respectively |
(0.4 | ) | — | |||||
| Accumulated other comprehensive (loss) income |
(0.6 | ) | 0.5 | |||||
|
|
|
|
|
|||||
| Total Global Brass and Copper Holdings, Inc. stockholders’ equity / (deficit) |
21.6 | (7.4 | ) | |||||
| Noncontrolling interest |
4.4 | 4.0 | ||||||
|
|
|
|
|
|||||
| Total equity / (deficit) |
26.0 | (3.4 | ) | |||||
|
|
|
|
|
|||||
| Total liabilities and equity / (deficit) |
$ | 576.5 | $ | 548.7 | ||||
|
|
|
|
|
|||||
The accompanying notes are an integral part of these consolidated financial statements.
83
Table of Contents
Global Brass and Copper Holdings, Inc.
Consolidated Statements of Operations
| Year Ended December 31, | ||||||||||||
| (In millions, except per share data) | 2014 | 2013 | 2012 | |||||||||
| Net sales |
$ | 1,711.4 | $ | 1,758.5 | $ | 1,650.5 | ||||||
| Cost of sales |
1,546.8 | 1,576.2 | 1,467.3 | |||||||||
|
|
|
|
|
|
|
|||||||
| Gross profit |
164.6 | 182.3 | 183.2 | |||||||||
| Selling, general and administrative expenses (including non-cash profits interest expense of $0.0, $29.3 and $19.5 in 2014, 2013 and 2012, respectively) |
76.9 | 110.8 | 92.7 | |||||||||
|
|
|
|
|
|
|
|||||||
| Operating income |
87.7 | 71.5 | 90.5 | |||||||||
| Interest expense |
39.6 | 39.8 | 39.7 | |||||||||
| Loss on extinguishment of debt |
— | — | 19.6 | |||||||||
| Other expense, net |
0.5 | 0.3 | 0.1 | |||||||||
|
|
|
|
|
|
|
|||||||
| Income before provision for income taxes and equity income |
47.6 | 31.4 | 31.1 | |||||||||
| Provision for income taxes |
16.6 | 22.2 | 19.2 | |||||||||
|
|
|
|
|
|
|
|||||||
| Income before equity income |
31.0 | 9.2 | 11.9 | |||||||||
| Equity income, net of tax |
1.1 | 1.5 | 1.0 | |||||||||
|
|
|
|
|
|
|
|||||||
| Net income |
32.1 | 10.7 | 12.9 | |||||||||
| Less: Net income attributable to noncontrolling interest |
0.4 | 0.3 | 0.4 | |||||||||
|
|
|
|
|
|
|
|||||||
| Net income attributable to Global Brass and Copper Holdings, Inc. |
$ | 31.7 | $ | 10.4 | $ | 12.5 | ||||||
|
|
|
|
|
|
|
|||||||
| Net income attributable to Global Brass and Copper Holdings, Inc. per common share: |
||||||||||||
| Basic |
$ | 1.50 | $ | 0.49 | $ | 0.59 | ||||||
| Diluted |
$ | 1.49 | $ | 0.49 | $ | 0.59 | ||||||
| Weighted average common shares outstanding: |
||||||||||||
| Basic |
21.2 | 21.1 | 21.1 | |||||||||
| Diluted |
21.3 | 21.2 | 21.1 | |||||||||
| Dividends declared per common share |
$ | 0.1500 | $ | 0.0375 | $ | 7.5793 | ||||||
The accompanying notes are an integral part of these consolidated financial statements.
84
Table of Contents
Global Brass and Copper Holdings, Inc.
Consolidated Statements of Comprehensive Income
| Year Ended December 31, | ||||||||||||
| (In millions) | 2014 | 2013 | 2012 | |||||||||
| Net income |
$ | 32.1 | $ | 10.7 | $ | 12.9 | ||||||
| Other comprehensive loss: |
||||||||||||
| Foreign currency translation adjustment |
(1.7 | ) | (1.5 | ) | (0.5 | ) | ||||||
| Less: Income tax benefit on foreign currency translation adjustment |
(0.6 | ) | (0.6 | ) | (0.1 | ) | ||||||
|
|
|
|
|
|
|
|||||||
| Comprehensive income |
31.0 | 9.8 | 12.5 | |||||||||
| Less: Comprehensive income attributable to noncontrolling interest |
0.4 | 0.4 | 0.4 | |||||||||
|
|
|
|
|
|
|
|||||||
| Comprehensive income attributable to Global Brass and Copper Holdings, Inc. |
$ | 30.6 | $ | 9.4 | $ | 12.1 | ||||||
|
|
|
|
|
|
|
|||||||
The accompanying notes are an integral part of these consolidated financial statements.
85
Table of Contents
Global Brass and Copper Holdings, Inc.
Consolidated Statements of Changes in Equity / (Deficit)
| (In millions) | Common stock |
Additional paid-in capital |
(Accumulated deficit)/ retained earnings |
Treasury stock |
Accumulated other comprehensive (loss) income |
Receivable from stockholder |
Total Global Brass and Copper Holdings, Inc. stockholders’ equity/(deficit) |
Noncontrolling interest |
Total equity/ (deficit) |
|||||||||||||||||||||||||||
| Balance at December 31, 2011 |
$ | 0.2 | $ | 11.1 | $ | 68.7 | $ | — | $ | 1.9 | $ | (2.4 | ) | $ | 79.5 | $ | 3.2 | $ | 82.7 | |||||||||||||||||
| Profits interest compensation |
— | 19.5 | — | — | — | — | 19.5 | — | 19.5 | |||||||||||||||||||||||||||
| Distribution to stockholder |
— | (30.6 | ) | (129.4 | ) | — | — | — | (160.0 | ) | — | (160.0 | ) | |||||||||||||||||||||||
| Amounts due from stockholder |
— | — | — | — | — | (2.5 | ) | (2.5 | ) | — | (2.5 | ) | ||||||||||||||||||||||||
| Net income |
— | — | 12.5 | — | — | — | 12.5 | 0.4 | 12.9 | |||||||||||||||||||||||||||
| Other comprehensive loss, net of tax |
— | — | — | — | (0.4 | ) | — | (0.4 | ) | — | (0.4 | ) | ||||||||||||||||||||||||
|
|
|
|
|
|
|
|
|
|
|
|
|
|
|
|
|
|
|
|||||||||||||||||||
| Balance at December 31, 2012 |
$ | 0.2 | $ | — | $ | (48.2 | ) | $ | — | $ | 1.5 | $ | (4.9 | ) | $ | (51.4 | ) | $ | 3.6 | $ | (47.8 | ) | ||||||||||||||
| Profits interest compensation |
— | 29.3 | — | — | — | — | 29.3 | — | 29.3 | |||||||||||||||||||||||||||
| Share-based compensation (141,486 shares) |
— | 1.2 | — | — | — | — | 1.2 | — | 1.2 | |||||||||||||||||||||||||||
| Payment from stockholder |
— | — | — | — | — | 4.9 | 4.9 | — | 4.9 | |||||||||||||||||||||||||||
| Dividends declared |
— | — | (0.8 | ) | — | — | — | (0.8 | ) | — | (0.8 | ) | ||||||||||||||||||||||||
| Net income |
— | — | 10.4 | — | — | — | 10.4 | 0.3 | 10.7 | |||||||||||||||||||||||||||
| Other comprehensive (loss) income, net of tax |
— | — | — | — | (1.0 | ) | — | (1.0 | ) | 0.1 | (0.9 | ) | ||||||||||||||||||||||||
|
|
|
|
|
|
|
|
|
|
|
|
|
|
|
|
|
|
|
|||||||||||||||||||
| Balance at December 31, 2013 |
$ | 0.2 | $ | 30.5 | $ | (38.6 | ) | $ | — | $ | 0.5 | $ | — | $ | (7.4 | ) | $ | 4.0 | $ | (3.4 | ) | |||||||||||||||
| Share-based compensation (106,316 shares) |
— | 1.7 | — | — | — | — | 1.7 | — | 1.7 | |||||||||||||||||||||||||||
| Exercise of stock options (11,605 shares) |
— | 0.1 | — | — | — | — | 0.1 | — | 0.1 | |||||||||||||||||||||||||||
| Share repurchases (29,200 shares) |
— | — | — | (0.4 | ) | — | — | (0.4 | ) | — | (0.4 | ) | ||||||||||||||||||||||||
| Excess tax benefit on share-based compensation |
— | 0.2 | — | — | — | — | 0.2 | — | 0.2 | |||||||||||||||||||||||||||
| Dividends declared |
— | — | (3.2 | ) | — | — | — | (3.2 | ) | — | (3.2 | ) | ||||||||||||||||||||||||
| Net income |
— | — | 31.7 | — | — | — | 31.7 | 0.4 | 32.1 | |||||||||||||||||||||||||||
| Other comprehensive loss, net of tax |
— | — | — | — | (1.1 | ) | — | (1.1 | ) | — | (1.1 | ) | ||||||||||||||||||||||||
|
|
|
|
|
|
|
|
|
|
|
|
|
|
|
|
|
|
|
|||||||||||||||||||
| Balance at December 31, 2014 |
$ | 0.2 | $ | 32.5 | $ | (10.1 | ) | $ | (0.4 | ) | $ | (0.6 | ) | $ | — | $ | 21.6 | $ | 4.4 | $ | 26.0 | |||||||||||||||
|
|
|
|
|
|
|
|
|
|
|
|
|
|
|
|
|
|
|
|||||||||||||||||||
The accompanying notes are an integral part of these consolidated financial statements.
86
Table of Contents
Global Brass and Copper Holdings, Inc.
Consolidated Statements of Cash Flows
| Year Ended December 31, | ||||||||||||
| (In millions) | 2014 | 2013 | 2012 | |||||||||
| Cash flows from operating activities |
||||||||||||
| Net income |
$ | 32.1 | $ | 10.7 | $ | 12.9 | ||||||
| Adjustments to reconcile net income to net cash provided by operating activities: |
||||||||||||
| Lower of cost or market adjustment to inventory |
0.2 | 0.3 | 0.3 | |||||||||
| Unrealized loss (gain) on derivatives |
3.0 | (0.2 | ) | (1.6 | ) | |||||||
| Mark to market on interest rate cap agreements |
— | — | 0.2 | |||||||||
| Depreciation |
12.2 | 8.5 | 6.8 | |||||||||
| Amortization of intangible assets |
0.1 | 0.1 | 0.1 | |||||||||
| Amortization of debt discount and issuance costs |
2.7 | 2.5 | 4.6 | |||||||||
| Term loan call premium |
— | — | (6.4 | ) | ||||||||
| Loss on debt extinguishment |
— | — | 19.6 | |||||||||
| Profits interest compensation expense |
— | 29.3 | 19.5 | |||||||||
| Share-based compensation expense |
1.7 | 1.2 | — | |||||||||
| Excess tax benefit from share-based compensation |
(0.2 | ) | — | — | ||||||||
| Provision for bad debts, net of reductions |
— | (0.2 | ) | (0.8 | ) | |||||||
| Deferred income taxes |
6.4 | 2.1 | 5.2 | |||||||||
| Undistributed equity earnings |
(0.7 | ) | (1.0 | ) | — | |||||||
| Change in assets and liabilities: |
||||||||||||
| Accounts receivable |
18.9 | (7.1 | ) | (1.6 | ) | |||||||
| Inventories |
0.9 | (16.7 | ) | 11.5 | ||||||||
| Prepaid expenses and other current assets |
(7.0 | ) | (9.7 | ) | 4.7 | |||||||
| Accounts payable |
(2.3 | ) | 4.5 | 2.3 | ||||||||
| Accrued liabilities |
1.3 | 7.4 | 0.5 | |||||||||
| Accrued interest |
(0.1 | ) | — | (0.8 | ) | |||||||
| Income taxes, net |
(3.8 | ) | (2.7 | ) | 3.7 | |||||||
| Other, net |
(0.9 | ) | (1.0 | ) | (0.6 | ) | ||||||
|
|
|
|
|
|
|
|||||||
| Net cash provided by operating activities |
64.5 | 28.0 | 80.1 | |||||||||
| Cash flows from investing activities |
||||||||||||
| Capital expenditures |
(23.4 | ) | (26.2 | ) | (18.6 | ) | ||||||
| Proceeds from sale of property, plant and equipment |
1.1 | 0.2 | — | |||||||||
|
|
|
|
|
|
|
|||||||
| Net cash used in investing activities |
(22.3 | ) | (26.0 | ) | (18.6 | ) | ||||||
| Cash flows from financing activities |
||||||||||||
| Deferred financing fees |
— | — | (12.9 | ) | ||||||||
| Proceeds from senior secured notes |
— | — | 375.0 | |||||||||
| Payments on term loan |
— | — | (310.9 | ) | ||||||||
| Borrowings on ABL Facility |
248.4 | 420.8 | 204.3 | |||||||||
| Payments on ABL Facility |
(253.9 | ) | (429.8 | ) | (189.8 | ) | ||||||
| Principal payments under capital lease obligation |
(0.2 | ) | — | — | ||||||||
| Distribution to stockholder |
— | — | (160.0 | ) | ||||||||
| Dividends paid |
(3.2 | ) | (0.8 | ) | — | |||||||
| Proceeds from exercise of stock options |
0.1 | — | — | |||||||||
| Excess tax benefit from share-based compensation |
0.2 | — | — | |||||||||
| Share repurchases |
(0.4 | ) | — | — | ||||||||
| Net payment (amount due) from stockholder |
— | 4.9 | (2.5 | ) | ||||||||
|
|
|
|
|
|
|
|||||||
| Net cash used in financing activities |
(9.0 | ) | (4.9 | ) | (96.8 | ) | ||||||
| Effect of foreign currency exchange rates |
0.6 | (0.2 | ) | (0.3 | ) | |||||||
|
|
|
|
|
|
|
|||||||
| Net increase (decrease) in cash |
33.8 | (3.1 | ) | (35.6 | ) | |||||||
| Cash at beginning of year |
10.8 | 13.9 | 49.5 | |||||||||
|
|
|
|
|
|
|
|||||||
| Cash at end of year |
$ | 44.6 | $ | 10.8 | $ | 13.9 | ||||||
|
|
|
|
|
|
|
|||||||
| Noncash investing and financing activities |
||||||||||||
| Acquisition of assets under capital lease obligation |
$ | 6.0 | $ | — | $ | — | ||||||
| Purchases of property, plant and equipment not yet paid |
$ | 4.1 | $ | 4.7 | $ | 5.3 | ||||||
| Supplemental disclosure of cash flows information |
||||||||||||
| Cash paid during the period for: |
||||||||||||
| Interest, net of amount capitalized |
$ | 37.0 | $ | 37.3 | $ | 35.8 | ||||||
| Income taxes, net of refunds |
$ | 14.4 | $ | 22.9 | $ | 10.2 | ||||||
The accompanying notes are an integral part of these consolidated financial statements.
87
Table of Contents
Global Brass and Copper Holdings, Inc.
Notes to Consolidated Financial Statements
| 1. | Organization and Formation of the Company |
Global Brass and Copper Holdings, Inc. (“Holdings” or the “Company”) was incorporated in Delaware, on October 10, 2007. Holdings, through its wholly-owned principal operating subsidiary, Global Brass and Copper, Inc. (“GBC”), commenced commercial operations on November 19, 2007 through the acquisition of the worldwide metals business from Olin Corporation. GBC is a leading, value-added converter, fabricator, processor and distributor of specialized copper and brass products in North America. On May 29, 2013, the Company completed its initial public offering of 8,050,000 shares of its common stock (the “initial public offering” or “IPO”). The shares began trading on the New York Stock Exchange on May 23, 2013 under the ticker symbol “BRSS”. Halkos Holdings, LLC (“Halkos”), the sole stockholder of the Company prior to the IPO, sold all of the shares in the initial public offering and received all of the net proceeds from the offering. KPS Capital Partners, L.P. and its affiliates (“KPS”) are the majority shareholders of Halkos. On October 1, 2013, the Company completed its follow-on public offering of 5,750,000 shares of its common stock (the “Follow-on Public Offering”). Halkos sold all of the shares and received all of the net proceeds from the Follow-on Public Offering. After giving effect to the Follow-on Public Offering, Halkos beneficially owned approximately 34.4% of the outstanding common stock of the Company as of December 31, 2013. On February 3, 2014, the Company completed an additional follow-on public offering of 7,310,000 shares of its common stock, including 910,000 shares of common stock in connection with the full exercise of the option to purchase additional shares granted to the underwriters pursuant to the offering that commenced on January 28, 2014 (the “Additional Follow-on Public Offering”). Halkos sold all of the shares and received all of the net proceeds from Additional Follow-on Public Offering. After giving effect to the Additional Follow-on Public Offering, Halkos no longer owns any of the outstanding common stock of the Company.
The Company is operated and managed through three distinct divisions which are also the Company’s reportable segments: GBC Metals, LLC (“Olin Brass”), Chase Brass and Copper Company, LLC (“Chase Brass”) and A.J. Oster, LLC (“A.J. Oster”).
| 2. | Summary of Significant Accounting Policies |
Principles of Consolidation
The consolidated financial statements include the accounts of the Company, its wholly-owned subsidiaries and its majority-owned subsidiaries, in which the Company holds a controlling interest. All intercompany accounts and transactions are eliminated in consolidation. The equity method is used to account for investments in affiliated companies that are 20% to 50% owned, and in cases where the Company does not hold a controlling voting interest and does not direct the matters that most significantly impact the investee’s operations.
The Company owns an 80% interest in Olin Luotong (GZ) Corporation (“Olin Luotong Metals”), based in China, and Olin Luotong Metals’ financial information is consolidated herein, with the net results attributable to the 20% noncontrolling interest reflected in the consolidated financial statements.
Use of Estimates and Assumptions
The preparation of financial statements in conformity with accounting principles generally accepted in the United States of America (“U.S. GAAP”) requires management to make estimates and assumptions that affect the reported amounts of assets and liabilities and disclosure of contingent assets and liabilities at the date of the financial statements. In addition, it requires management to make estimates and assumptions that
88
Table of Contents
Global Brass and Copper Holdings, Inc.
Notes to Consolidated Financial Statements
affect the reported amount of net sales and expenses during the reporting period. Actual amounts could differ from those estimates.
Revision of Prior Period Statements of Cash Flows
The Company revised its consolidated statements of cash flows for the years ended December 31, 2013 and 2012 to correct errors related to the treatment of purchases of property, plant and equipment for which cash had not yet been paid. These non-cash purchases were previously reflected as a component of net cash provided by operating activities and net cash used in investing activities. The Company assessed the materiality of this error and determined that the error is not material to any previously reported annual or interim financial statements. The revision of prior reported amounts has no impact on the reported change in cash or amounts reported in the consolidated balance sheets, statements of operations, statements of comprehensive income or statements of changes in equity (deficit).
For the year ended December 31, 2013, the correction to cash flows from operating activities was to adjust the cash effect of the change in accounts payable and the change in accrued liabilities by $0.7 million and $0.1 million, respectively, from $3.8 million and $7.5 million, respectively, to $4.5 million and $7.4 million, respectively. The correction to cash flows from investing activities was to adjust capital expenditures by $0.6 million, from $25.6 million to $26.2 million. The revision resulted in an increase of $0.6 million to the Company’s “net cash provided by operating activities” for the year ended December 31, 2013, with a corresponding increase to “net cash used in investing activities”.
For the year ended December 31, 2012, the correction to cash flows from operating activities was to adjust the cash effect of the change in accounts payable and the change in accrued liabilities, by $1.4 million and $0.4 million, respectively, from $3.7 million and $0.9 million, respectively, to $2.3 million and $0.5 million, respectively. The correction to cash flows from investing activities was to adjust capital expenditures by $1.8 million, from $20.4 million, to $18.6 million. The revision resulted in a decrease of $1.8 million to the Company’s “net cash provided by operating activities” for the year December 31, 2012, with a corresponding decrease to “net cash used in investing activities”.
Accounts Receivable and Allowance for Doubtful Accounts
Accounts receivable primarily consists of trade receivables for amounts billed to customers for products sold and other receivables. The determination of collectibility of the Company’s accounts receivable requires management to make frequent judgments and estimates in order to determine the appropriate amount of allowance needed for doubtful accounts. In circumstances where the Company is aware of a customer’s inability to meet its financial obligations (e.g., bankruptcy filings or substantial down-grading of credit ratings), it records an allowance for bad debts equal to the amount the Company does not believe to be collectible. For all other customers, the Company recognizes allowances for bad debts based on its historical collection experience. If circumstances change (e.g., greater than expected defaults or an unexpected material change in a major customer’s ability to meet its financial obligations), the Company’s estimate of the recoverability of amounts due could be changed by a material amount. Accounts are written off once deemed to be uncollectible.
Inventories
Inventories include costs attributable to direct labor and manufacturing overhead but are primarily comprised of material costs. The metals component of inventories that is valued on a last-in, first-out (“LIFO”) basis comprised approximately 71% and 70% of total inventory at December 31, 2014 and 2013,
89
Table of Contents
Global Brass and Copper Holdings, Inc.
Notes to Consolidated Financial Statements
respectively. Other manufactured inventories, including the direct labor and manufacturing overhead components and certain non-U.S. inventories, are valued on a first-in, first-out (“FIFO”) basis. Elements of cost in finished goods inventory in addition to the cost of material include depreciation, utilities, consumable production supplies, maintenance, production wages and transportation costs.
Inventories are stated at the lower of cost or market. The market price of metals used in production and related scrap is subject to volatility. Management evaluates the need to record adjustments for inventory on a regular basis. During periods when open market prices decline below carrying value, the Company records a provision to reduce the carrying value of its inventory. Additionally, the Company records an estimate for slow moving and obsolete inventory based upon product knowledge, physical inventory observation, future demand, market conditions and an aging analysis of the inventory on hand. The Company’s policy is to evaluate all inventories including raw material, work-in-process, finished goods, and spare parts. Inventory in excess of estimated usage requirements is written down to its estimated net realizable value.
Property, Plant and Equipment
Property, plant and equipment are recorded at cost. Depreciation of property, plant and equipment, which includes the depreciation of assets under capital leases, is computed using the straight-line method based on the estimated useful lives of the assets as they are placed into service. Property, plant and equipment are generally depreciated over the useful lives, which are detailed in the notes to the consolidated financial statements. Depreciation expense is recorded in cost of sales or selling, general and administrative costs depending on the nature and use of the underlying asset.
Expenditures for repairs and maintenance are expensed as incurred. Expenditures which improve an asset or extend its estimated useful life are capitalized. Interest costs related to the construction of qualifying assets are capitalized as part of the construction costs. When assets are retired or otherwise disposed of, the related cost and accumulated depreciation are removed from the accounts and any gain or loss is included in the accompanying consolidated statements of operations.
The Company reviews property, plant and equipment for impairment when a change in events or circumstances indicates that the carrying value of the assets may not be recoverable. The Company determines the fair value of its asset group through various valuation techniques, including discounted cash flow models, quoted market values and third-party independent appraisals, as considered necessary.
Acquisitions and Goodwill
All acquisitions are accounted for using the acquisition method as prescribed by ASC 805, Business Combinations. The purchase price paid is allocated to the assets acquired and liabilities assumed based on their estimated fair values. Any excess purchase price over the fair value of the net assets acquired is recorded as goodwill.
Goodwill is not amortized but is tested for impairment annually and whenever events or changes in circumstances indicate that impairment may have occurred. Management performs its annual goodwill impairment test as of October 31 and monitors for interim triggering events on an ongoing basis.
Management has an option to make a qualitative assessment of a reporting unit’s goodwill for impairment, referred to as the “Step 0” assessment; however, for the year ended December 31, 2014, the Company opted to utilize the two-step quantitative assessment to test for impairment. The first step involves a comparison of the fair value of the reporting unit with its carrying value. If the carrying value of the reporting unit exceeds
90
Table of Contents
Global Brass and Copper Holdings, Inc.
Notes to Consolidated Financial Statements
its fair value, the second step of the process involves a comparison of the implied fair value and carrying value of the goodwill of the reporting unit. If the carrying value of the goodwill of the reporting unit exceeds the implied fair value of that goodwill, an impairment loss is recognized in an amount equal to the excess.
In evaluating the recoverability of goodwill, management estimates the fair value of the reporting unit based on a discounted cash flow valuation method and a market multiple method. Significant inputs to the discounted cash flow valuation method include discount rates, long-term sales growth rates and forecasted operating margins. The market multiple method estimates fair value by comparing the reporting unit to similar public companies.
For the year ended December 31, 2014, no impairment loss to goodwill was required as management concluded that the fair value of the Company’s reporting unit was substantially in excess of its carrying amount.
Intangible Assets
Definite-lived intangible assets are recorded at fair value under the purchase method of accounting as of the respective acquisition dates and are amortized using the straight-line method over the estimated useful lives of the assets. Amortization expense related to intangible assets is reflected in selling, general and administrative expenses. Identifiable definite-lived intangible assets are reviewed for impairment whenever events or circumstances indicate that the carrying value may not be recoverable. The Company does not have any indefinite-lived intangible assets.
Investment in Joint Venture
The Company owns a 50% interest in Dowa-Olin Metal Corporation (“Dowa Joint Venture”), a joint venture based in Japan. The Company accounts for the Dowa Joint Venture under the equity method of accounting. Due to the timing of the receipt of available financial information, the results of the Dowa Joint Venture are recorded on a one-month lag basis.
The Company reviews its equity method investment for impairment using an other-than-temporary model when triggering events are identified. An impairment loss is recognized when the investment’s carrying amount exceeds its fair value and this decline in fair value is deemed to be other-than-temporary.
Deferred Financing Fees
Deferred financing fees incurred in connection with the issuance of debt are amortized as non-cash interest expense over the terms of the debt agreements. The unamortized balance of deferred financing fees is presented in other noncurrent assets in the consolidated balance sheets.
Deferred financing fees incurred in connection with the issuance of the Senior Secured Notes, as defined in the notes to the consolidated financial statements, are amortized using the effective interest method over the term of the Senior Secured Notes. Deferred financing fees incurred in connection with the issuance of the ABL Facility, also defined in the notes to the consolidated financial statements, are amortized on a straight-line basis over the term of the ABL Facility.
91
Table of Contents
Global Brass and Copper Holdings, Inc.
Notes to Consolidated Financial Statements
Derivative Contracts
The Company’s operating activities expose it to a variety of market risks, including risks related to the effects of commodity prices and interest rates. These financial exposures are monitored and managed by the Company as an integral part of its overall risk-management program. The Company does not enter into derivative contracts for speculation purposes where the objective is to generate profits. The Company has not applied hedge accounting to its derivative contracts in any of the years ended December 31, 2014, 2013 or 2012. The Company includes the fair value of the derivative contracts as assets or liabilities in its consolidated balance sheet and recognizes all amounts paid and received and changes in fair value of derivative contracts, including unrealized gains and losses, as adjustments to income.
Treasury Stock
The Company’s Board of Directors has not enacted a program to repurchase the Company’s common stock on the open market. However, management periodically repurchases shares of the Company’s common stock from employees as part of equity based compensation programs. These repurchases are reflected at cost within treasury stock in the consolidated balance sheets. The Company repurchased 29,200 shares for $0.4 million during the year ended December 31, 2014. No shares were repurchased during the years ended December 31, 2013 or 2012.
Revenue Recognition
The Company recognizes revenue when title and risk of loss are transferred to customers, which is generally the date products are shipped. Estimates for future rebates on certain product lines and product returns are recognized in the period in which the revenue is recorded. Such rebates were not material for the years ended December 31, 2014, 2013 and 2012. Billings to customers for shipping costs are included in net sales and the cost of shipping product to those customers is reflected in cost of sales in the consolidated statements of operations.
In connection with sales of unprocessed metal to toll customers, the Company records deferred expense and deferred revenue in prepaid expenses and other current assets and in accrued liabilities, respectively, in the consolidated balance sheets. The unprocessed metal is held for the account of the toll customers at the Company‘s premises, together with the other inventory of the Company. Deferred expense represents the deferral of cost of sales and deferred revenue represents the deferral of sales revenue, in each case, associated with such sales of unprocessed metal to toll customers. When a toll customer orders a finished product, metal is taken from the common inventory to make the finished product. The Company defers the expense for such unprocessed metal sales (and the corresponding revenue from sales of unprocessed metal) to toll customers until the finished product has been shipped at which time risk of loss and title passes to the customer.
Research and Development
The Company conducts research and development primarily through the Olin Brass reportable segment, the costs for which are expensed as incurred. Research and development expenditures for the years ended December 31, 2014, 2013 and 2012 were $1.6 million, $1.5 million and $1.5 million, respectively, and are included as a component of selling, general and administrative expenses in the consolidated statements of operations.
92
Table of Contents
Global Brass and Copper Holdings, Inc.
Notes to Consolidated Financial Statements
Income Taxes
The provision for income taxes is determined using the asset and liability approach. The current and deferred tax consequences are measured by applying the provisions of enacted tax laws to determine the amount of taxes payable currently or in future years. Deferred income taxes are provided for temporary differences between the income tax basis of assets and liabilities and their carrying amounts for financial reporting purposes. A valuation allowance is recorded to reduce deferred tax assets when management determines it is “more likely than not” that some portion or all of the deferred tax assets will not be realized.
Profits Interest Compensation
Halkos previously granted, pursuant to the Halkos Holdings, LLC Executive Equity Incentive Plan (“Halkos Equity Plan”), non-voting membership interests to select members of the Company’s management in the form of shares. The shares were profits interests in Halkos.
The shares were accounted for as a profit sharing arrangement under ASC 710, Compensation—General. Expense was recorded in the period in which distributions to award holders were determined to be probable. These distributions were accounted for by the Company as non-cash compensation expense with a corresponding increase in additional paid-in capital.
Foreign Currency Translation
The financial statements of foreign subsidiaries are translated into United States dollars in accordance with ASC 830, Foreign Currency Matters. The functional currency of the Company’s foreign subsidiaries is the local currency. The consolidated statements of foreign operations are translated at weighted-average exchange rates for the periods. Assets and liabilities are translated at period-end exchange rates and equity transactions are translated at historical rates. Gains and losses resulting from the translation adjustment are reported as a component of other comprehensive income (loss). The income tax effect of currency translation adjustments related to foreign subsidiaries and joint ventures that are not considered indefinitely reinvested are recorded as a component of deferred taxes with an offset to other comprehensive income (loss).
Concentrations of Credit Risk and Certain Other Exposures
The Company sells and distributes its products to a wide range of companies primarily in the building and housing, munitions, automotive, transportation, coinage, electronics/electrical components and industrial machinery and equipment end markets. The Company performs ongoing credit evaluations of its customers and generally does not require collateral. For the year ended December 31, 2013, sales to one major customer amounted to 10.4% of net sales. For the years ended December 31, 2014 and 2012, sales to any one customer did not exceed 10% of consolidated net sales.
The Company uses various strategies to minimize the impact of changes in the base metal prices between the date of order from a customer and the date of sale to a customer. Generally, the Company prices a forward replacement purchase of an equivalent amount of copper and other metals under flexible pricing arrangements it maintains with its suppliers, at the same time it determines the forward selling price of finished products to its customers. The Company has various sources of raw materials and is not materially dependent on any one supplier.
93
Table of Contents
Global Brass and Copper Holdings, Inc.
Notes to Consolidated Financial Statements
As of December 31, 2014, approximately 62% of the Company’s employees at various sites were members of unions. Generally, the Company’s various agreements with unions in the United States have contractual terms which range from 1 to 4 years. Since the Company’s establishment in November 2007, the Company has not experienced any work stoppages at any of its facilities.
Self-Insurance Programs
The Company is self-insured for workers’ compensation claims and benefits paid under employee health care programs. Accruals for employee health care are primarily based on estimated undiscounted cost of claims, which includes incurred but not reported claims. Accruals for workers’ compensation benefits and related expenses for claims are estimated, in part, by considering historical claims experience and undiscounted claims estimates provided by insurance carriers, third-party administrators and actuaries. Self-insurance accruals are deemed to be sufficient to cover outstanding claims, including those incurred but not reported as of the estimation date.
Workers’ compensation claims relating to activity after November 19, 2007 are covered by a loss funding insurance arrangement whereby the Company makes a fixed payment to the insurer which is used to pay submitted claims. Loss fund payments to the insurer in excess of workers’ compensation claim payments are classified as prepaid expenses and other current assets. The amount of the loss fund payments to the insurer is based on a combination of claims experience and a contractually agreed upon loss development factor.
Environmental Reserves and Environmental Expenses
The Company recognizes an environmental liability when it is probable the liability exists and the amount is reasonably estimable. The Company estimates the duration and extent of its remediation obligations based upon internal analyses of clean-up costs, ongoing monitoring costs and estimated legal fees, communications with regulatory agencies and changes in environmental law. If the Company were to determine that its estimates of the duration or extent of its environmental obligations were no longer accurate, the Company would adjust its environmental liabilities accordingly in the period that such determination is made. Estimated future expenditures for environmental remediation are not discounted to their present value. Accrued environmental liabilities are not reduced by potential insurance reimbursements.
Environmental expenses that relate to ongoing operations are included as a component of cost of sales.
Recently Issued and Recently Adopted Accounting Pronouncements
In August 2014, the Financial Accounting Standards Board (“FASB”) issued Accounting Standards Update (“ASU”) No. 2014-15, Disclosure of Uncertainties About an Entity’s Ability to Continue as a Going Concern (“ASU 2014-15”). The guidance requires management to perform interim and annual assessments of an entity’s ability to continue as a going concern within one year of the date the financial statements are issued and provides guidance on determining when and how to disclose going concern uncertainties in the financial statements. Certain disclosures will be required if conditions give rise to substantial doubt about an entity’s ability to continue as a going concern. ASU 2014-15 applies to all entities and is effective for annual and interim reporting periods ending after December 15, 2016, with early adoption permitted. The Company does not expect that the adoption of this standard will have a material effect on its financial statements.
94
Table of Contents
Global Brass and Copper Holdings, Inc.
Notes to Consolidated Financial Statements
In May 2014, the FASB issued ASU No. 2014-09, Revenue from Contracts with Customers (“ASU 2014-09”). The guidance provides companies with a single model for use in accounting for revenue arising from contracts with customers and supersedes current revenue recognition guidance, including industry-specific revenue guidance. The core principle of the model is that an entity will recognize revenue to depict the transfer of goods or services to customers in an amount that the entity expects to be entitled to in exchange for those goods or services, as opposed to recognizing revenue when the risks and rewards transfer to the customer under the existing revenue guidance. The new standard also will result in enhanced disclosures about revenue and provide guidance for transactions that were not previously addressed comprehensively (for example, service revenue and contract modifications). ASU 2014-09 is effective for the first interim period within annual reporting periods beginning after December 15, 2016 and early adoption is not permitted. The guidance permits companies to either apply the requirements retrospectively to all prior periods presented, or apply the requirements in the year of adoption, through a cumulative adjustment. The Company is in the process of evaluating the impact of adoption on its consolidated financial statements.
| 3. | Inventories |
The Company’s inventories are as follows:
| As of December 31, | ||||||||
| (in millions) | 2014 | 2013 | ||||||
| Raw materials and supplies |
$ | 29.7 | $ | 37.2 | ||||
| Work-in-process |
78.7 | 75.5 | ||||||
| Finished goods |
80.6 | 78.2 | ||||||
|
|
|
|
|
|||||
| Total inventories |
$ | 189.0 | $ | 190.9 | ||||
|
|
|
|
|
|||||
During 2014, certain domestic metal inventory quantities were reduced resulting in a liquidation of LIFO inventory layers carried at higher costs prevailing in prior years as compared with current costs. In 2014, the effect of this reduction of inventory increased cost of sales by $0.6 million and decreased net income by $0.4 million. During 2013 and 2012, certain domestic metal inventory quantities were reduced resulting in a liquidation of LIFO inventory layers carried at lower costs prevailing in prior years as compared to the costs at each of those year-ends. In 2013, the effect of this reduction of inventory decreased cost of sales by $2.0 million and increased net income by $1.2 million. In 2012, the effect of this reduction of inventory decreased cost of sales by $4.8 million and increased net income by $2.9 million. If all inventories had been valued at period-end market values, inventories would have been approximately $280.1 million and $318.2 million at December 31, 2014 and December 31, 2013, respectively.
| 4. | Prepaid Expenses and Other Current Assets |
The Company’s prepaid expenses and other current assets are as follows:
| As of December 31, | ||||||||
| (in millions) | 2014 | 2013 | ||||||
| Deferred cost of sales-toll customers |
$ | 12.7 | $ | 9.8 | ||||
| Workers’ compensation plan deposits |
6.2 | 6.2 | ||||||
| Prepaid insurance |
2.8 | 1.9 | ||||||
| Prepaid tooling |
1.2 | 1.0 | ||||||
| Derivative contract assets |
1.3 | 1.2 | ||||||
| Other |
2.0 | 2.1 | ||||||
|
|
|
|
|
|||||
| Total prepaid expenses and other current assets |
$ | 26.2 | $ | 22.2 | ||||
|
|
|
|
|
|||||
95
Table of Contents
Global Brass and Copper Holdings, Inc.
Notes to Consolidated Financial Statements
Deferred cost of sales-toll customers represents the deferral of cost of sales associated with sales of unprocessed metal to toll customers. The Company defers the expense and corresponding revenue until the finished product has been shipped to the customer. See the notes to the consolidated financial statements for the corresponding deferred revenue related to the sales of unprocessed metal to toll customers.
| 5. | Property, Plant and Equipment |
The Company’s property, plant and equipment balances, including assets under capital lease, are as follows:
| As of December 31, | Useful Life (in years) |
|||||||||||
| (in millions) | 2014 | 2013 | ||||||||||
| Land improvements |
$ | 2.9 | $ | 2.5 | 12 - 20 | |||||||
| Buildings and building improvements |
17.2 | 11.8 | 20 - 50 | |||||||||
| Machinery and equipment |
87.8 | 68.5 | 10 - 12 | |||||||||
| Information technology |
8.5 | 5.4 | 3 - 5 | |||||||||
| Motor vehicles |
7.1 | 2.9 | 5 | |||||||||
| Leasehold improvements |
0.7 | 1.1 | ||||||||||
| Construction-in-process |
14.4 | 20.4 | ||||||||||
|
|
|
|
|
|||||||||
| Gross property, plant and equipment |
138.6 | 112.6 | ||||||||||
| Accumulated depreciation |
(35.1 | ) | (24.6 | ) | ||||||||
|
|
|
|
|
|||||||||
| Property, plant and equipment, net |
$ | 103.5 | $ | 88.0 | ||||||||
|
|
|
|
|
|||||||||
Leasehold improvements are amortized over the lesser of their useful lives or the remaining lease term.
The Company capitalized interest relating to the construction of long-term assets in the amount of $0.2 million in 2014 and $0.1 million in 2013. No interest was capitalized in 2012.
See the notes to the consolidated financial statements for further information regarding the capital lease.
| 6. | Intangible Assets |
Intangible assets other than goodwill consisted of the following:
| (in millions) | As of December 31, | Amortization Period (in years) |
||||||||||
| 2014 | 2013 | |||||||||||
| Gross carrying amount: |
||||||||||||
| Customer relationships |
$ | 1.3 | $ | 1.3 | 13 | |||||||
| Non-compete agreement |
0.4 | 0.4 | 4 | |||||||||
|
|
|
|
|
|||||||||
| Total gross intangible assets |
1.7 | 1.7 | ||||||||||
| Accumulated amortization: |
||||||||||||
| Customer relationships |
(0.7 | ) | (0.6 | ) | ||||||||
| Non-compete agreement |
(0.4 | ) | (0.4 | ) | ||||||||
|
|
|
|
|
|||||||||
| Total accumulated amortization |
(1.1 | ) | (1.0 | ) | ||||||||
|
|
|
|
|
|||||||||
| Intangible assets, net |
$ | 0.6 | $ | 0.7 | ||||||||
|
|
|
|
|
|||||||||
96
Table of Contents
Global Brass and Copper Holdings, Inc.
Notes to Consolidated Financial Statements
Amortization expense is expected to be incurred in subsequent years as follows:
| (in millions) | ||||
| Year |
Amortization | |||
| 2015 |
$ | 0.1 | ||
| 2016 |
0.1 | |||
| 2017 |
0.1 | |||
| 2018 |
0.1 | |||
| 2019 |
0.1 | |||
| Thereafter |
0.1 | |||
|
|
|
|||
| $ | 0.6 | |||
|
|
|
|||
| 7. | Investment in Joint Venture |
In November 2007, the equity investment in the Dowa Joint Venture, which was purchased as part of the worldwide metals business acquired from Olin Corporation, was accounted for under the purchase method of accounting. Consequently, management recorded it at zero carrying value due to a bargain purchase of the worldwide metals business from Olin Corporation, even though the underlying book value of the Dowa Joint Venture’s assets was $9.4 million. As a result and based on the Company’s estimates as to the underlying commercial utility of the alloys that the Dowa Joint Venture manufactures, the Company is accreting the $9.4 million difference as an increase to equity earnings on a straight-line basis over 13 years. The Company recorded $0.7 million in equity income, net of tax in the accompanying consolidated statements of operations for each of the years ended December 31, 2014, 2013 and 2012 to accrete this difference. At December 31, 2014 and 2013, the remaining negative basis difference was $4.3 million and $5.0 million, respectively.
During the years ended December 31, 2014, 2013 and 2012, the Company received cash dividends from the Dowa Joint Venture of $0.4 million, $0.5 million and $1.0 million, respectively, which were recorded as reductions in the Company’s investment in the Dowa Joint Venture. During the years ended December 31, 2014, 2013 and 2012, the Company recorded $1.1 million, $1.5 million and $1.0 million, respectively, of equity income, net of tax, including $0.7 million of accretion of the negative basis difference in each year. The undistributed earnings of the Dowa Joint Venture in GBC’s retained earnings as of December 31, 2014 and 2013 totaled $1.8 million and $1.1 million, respectively.
| 8. | Other Noncurrent Assets |
Other noncurrent assets consisted of the following:
| As of December 31, | ||||||||
| (in millions) | 2014 | 2013 | ||||||
| Deferred financing fees, net |
$ | 11.9 | $ | 14.6 | ||||
| Utility and other deposits |
1.4 | 1.2 | ||||||
| Other |
1.4 | 0.8 | ||||||
|
|
|
|
|
|||||
| Total other noncurrent assets |
$ | 14.7 | $ | 16.6 | ||||
|
|
|
|
|
|||||
97
Table of Contents
Global Brass and Copper Holdings, Inc.
Notes to Consolidated Financial Statements
| 9. | Accrued Liabilities |
Accrued liabilities consisted of the following:
| As of December 31, | ||||||||
| (in millions) | 2014 | 2013 | ||||||
| Compensation and benefits |
$ | 18.1 | $ | 19.4 | ||||
| Workers’ compensation |
14.2 | 14.5 | ||||||
| Deferred sales revenue – toll customers |
12.7 | 9.8 | ||||||
| Insurance |
2.5 | 2.4 | ||||||
| Professional fees |
2.1 | 2.7 | ||||||
| Taxes |
1.7 | 1.6 | ||||||
| Utilities |
1.5 | 1.6 | ||||||
| Tooling |
0.8 | 0.7 | ||||||
| Other |
3.7 | 3.4 | ||||||
|
|
|
|
|
|||||
| Total accrued liabilities |
$ | 57.3 | $ | 56.1 | ||||
|
|
|
|
|
|||||
Deferred sales revenue-toll customers represents the deferral of revenue associated with sales of unprocessed metal to toll customers. The Company defers the revenue and corresponding expense until the finished product has been shipped to the customer. See the notes to the consolidated financial statements for the corresponding deferred expense related to the sales of unprocessed metal to toll customers.
| 10. | Financing |
Long-term debt consisted of the following:
| As of December 31, | ||||||||
| (in millions) | 2014 | 2013 | ||||||
| Senior Secured Notes |
$ | 375.0 | $ | 375.0 | ||||
| ABL Facility |
— | 5.5 | ||||||
| Obligations under capital lease |
5.8 | — | ||||||
|
|
|
|
|
|||||
| 380.8 | 380.5 | |||||||
| Less: Current maturities of capital lease obligations |
1.0 | — | ||||||
|
|
|
|
|
|||||
| Total long-term debt |
$ | 379.8 | $ | 380.5 | ||||
|
|
|
|
|
|||||
Senior Secured Notes
On June 1, 2012, GBC issued $375.0 million in aggregate principal amount of 9.50% Senior Secured Notes due 2019 (the “Senior Secured Notes”). The Senior Secured Notes are guaranteed by Holdings and substantially all of the existing and future 100%-owned U.S. subsidiaries. The Senior Secured Notes are secured by a senior-priority security interest in the Company’s fixed assets (which secure the ABL Facility, hereinafter defined, on a junior-priority basis) and by a junior-priority security interest in the Company’s accounts receivable and inventory (which secure the Company’s ABL Facility on a senior-priority basis). The Senior Secured Notes mature on June 1, 2019. Interest on the Senior Secured Notes accrues at the rate of 9.50% per annum and is payable semiannually in arrears on June 1 and December 1, commencing on December 1, 2012.
98
Table of Contents
Global Brass and Copper Holdings, Inc.
Notes to Consolidated Financial Statements
The credit agreement governing the ABL Facility (hereinafter defined) and the indenture governing the Senior Secured Notes (the “Indenture”) limit the ability of GBC and its subsidiaries to dividend or distribute cash to Holdings and to its equityholders, although ordinary course dividends and distributions to meet the limited holding company expenses and related obligations at Holdings of up to $5.0 million per year are permitted under those agreements. Under the terms of the Indenture, GBC is also permitted to dividend or distribute to Holdings and its equityholders up to 50% of its “Consolidated Net Income” (as such term is used in the Indenture) from April 1, 2012 to the end of GBC’s most recently ended quarter. As of December 31, 2014, all of the net assets of the subsidiaries are restricted except for $54.0 million, which are permitted for dividend distributions under the Indenture. As of December 31, 2014, GBC was in compliance with all of its covenants relating to the Senior Secured Notes.
GBC is required to offer to redeem the Senior Secured Notes at a purchase price of 101% of their principal amount (plus accrued and unpaid interest) upon the occurrence of certain change of control events. In addition, upon the completion of certain asset dispositions, GBC may be required to offer to redeem the Senior Secured Notes at a purchase price of 100% of their principal amount (plus accrued and unpaid interest) if it does not apply the proceeds of such asset dispositions in accordance with the indenture by certain specified deadlines.
On and after June 1, 2016, GBC may redeem the Senior Secured Notes at its option at the following redemption prices (expressed as a percentage of principal amount), plus accrued and unpaid interest and additional interest, if any, if redeemed during the 12-month period commencing on June 1 of the years set forth below:
| Period |
Redemption Price | |||
| 2016 |
104.750 | % | ||
| 2017 |
102.375 | % | ||
| 2018 and thereafter |
100.000 | % | ||
Prior to June 1, 2016, GBC may redeem some or all of the Senior Secured Notes at a redemption price equal to 100% of the principal amount of the notes redeemed plus accrued and unpaid interest, if any, to the applicable redemption date plus a specified “make-whole” premium.
In addition, at any time prior to June 1, 2015, GBC may redeem up to 25% of the aggregate principal amount of the Senior Secured Notes with the net cash proceeds of certain equity offerings at a redemption price of 109.50%, plus accrued and unpaid interest, if any, to the redemption date.
Pursuant to a registration rights agreement, on October 7, 2013, GBC completed an exchange offer to issue registered new notes (with substantially the same terms as the Senior Secured Notes) in exchange for the Senior Secured Notes that GBC issued in a private offering on June 1, 2012.
ABL Facility
Concurrent with the issuance of the Senior Secured Notes in 2012, the Company amended the agreement governing its asset-based revolving loan facility (the “ABL Facility”).
The ABL Facility provides for borrowings up to the lesser of $200.0 million or the borrowing base, in each case, less outstanding loans and letters of credit. The unused portion of the ABL Facility was $199.5 million and $194.0 million as of December 31, 2014 and 2013, respectively. As of December 31, 2014 and 2013, amounts outstanding under the ABL Facility accrued interest at a rate of 4.25%. Unused amounts under the ABL Facility incur an unused line fee of 0.50% per annum, payable in full on a quarterly basis.
99
Table of Contents
Global Brass and Copper Holdings, Inc.
Notes to Consolidated Financial Statements
The ABL Facility has an expiration date of June 1, 2017 and contains various debt covenants to which the Company is subject on an ongoing basis. As of December 31, 2014, the Company was in compliance with all of its covenants under the ABL Facility.
Capital Lease Obligations
During 2014, the Company incurred capital lease obligations related to its acquisition of assets. As of December 31, 2014, assets recorded under capital lease obligations totaled $6.0 million and related accumulated depreciation totaled $0.7 million. Interest recorded on capital lease obligations is included in interest expense in the accompanying consolidated statements of operations.
Future minimum capital lease payments at December 31, 2014 are as follows:
| (in millions) | ||||
| 2015 |
$ | 1.4 | ||
| 2016 |
1.5 | |||
| 2017 |
1.5 | |||
| 2018 |
1.6 | |||
| 2019 |
1.0 | |||
|
|
|
|||
| Total |
$ | 7.0 | ||
| Amount representing interest |
(1.2 | ) | ||
|
|
|
|||
| Present value of minimum lease payments |
$ | 5.8 | ||
| Current maturities of capital lease obligations |
(1.0 | ) | ||
|
|
|
|||
| Total long-term maturities of capital lease obligations |
$ | 4.8 | ||
|
|
|
|||
| 11. | Income Taxes |
Income before provision for income taxes and equity income is comprised of the following:
| Year Ended December 31, | ||||||||||||
| (in millions) | 2014 | 2013 | 2012 | |||||||||
| Domestic |
$ | 42.9 | $ | 26.6 | $ | 24.6 | ||||||
| Foreign |
4.7 | 4.8 | 6.5 | |||||||||
|
|
|
|
|
|
|
|||||||
| Total |
$ | 47.6 | $ | 31.4 | $ | 31.1 | ||||||
|
|
|
|
|
|
|
|||||||
The provision for income taxes is summarized as follows:
| (in millions) | Year Ended December 31, | |||||||||||
| 2014 | 2013 | 2012 | ||||||||||
| Current tax provision |
||||||||||||
| U.S. federal |
$ | 8.2 | $ | 15.7 | $ | 10.4 | ||||||
| State and local |
0.9 | 2.5 | 1.9 | |||||||||
| Foreign |
1.1 | 1.9 | 1.7 | |||||||||
|
|
|
|
|
|
|
|||||||
| Total current |
10.2 | 20.1 | 14.0 | |||||||||
|
|
|
|
|
|
|
|||||||
| Deferred tax provision |
||||||||||||
| U.S. federal |
4.9 | 2.2 | 4.4 | |||||||||
| State and local |
1.2 | 0.3 | 0.5 | |||||||||
| Foreign |
0.3 | (0.4 | ) | 0.3 | ||||||||
|
|
|
|
|
|
|
|||||||
| Total deferred |
6.4 | 2.1 | 5.2 | |||||||||
|
|
|
|
|
|
|
|||||||
| Total provision |
$ | 16.6 | $ | 22.2 | $ | 19.2 | ||||||
|
|
|
|
|
|
|
|||||||
100
Table of Contents
Global Brass and Copper Holdings, Inc.
Notes to Consolidated Financial Statements
The effective income tax rate differs from the amount determined by applying the applicable U.S. statutory federal income tax rate to pretax results primarily as a result of the following:
| Year Ended December 31, | ||||||||||||
| 2014 | 2013 | 2012 | ||||||||||
| Statutory provision rate |
35.0 | % | 35.0 | % | 35.0 | % | ||||||
| Permanent differences and other items |
||||||||||||
| State tax provision |
2.4 | % | 6.1 | % | 6.7 | % | ||||||
| Section 199 manufacturing credit |
(2.0 | %) | (5.2 | %) | (3.2 | %) | ||||||
| Incremental tax effects of foreign earnings |
(2.1 | %) | 0.6 | % | 1.8 | % | ||||||
| Return to provision adjustments |
(0.8 | %) | (0.6 | %) | 1.2 | % | ||||||
| Valuation allowance |
2.9 | % | 0.9 | % | — | |||||||
| Re-rate of deferred taxes |
0.4 | % | 0.4 | % | (0.8 | %) | ||||||
| Non-deductible non-cash compensation |
— | 32.7 | % | 22.0 | % | |||||||
| Other |
(0.9 | %) | 0.8 | % | (1.0 | %) | ||||||
|
|
|
|
|
|
|
|||||||
| Effective income tax rate |
34.9 | % | 70.7 | % | 61.7 | % | ||||||
|
|
|
|
|
|
|
|||||||
The “Non-deductible non-cash compensation” expense as described further in the notes to the consolidated financial statements is not deductible in the Company’s tax returns and has been reflected as a permanent difference in the effective tax rate reconciliations above.
Deferred tax assets and liabilities are comprised of the following:
| (in millions) | As of December 31, | |||||||
| 2014 | 2013 | |||||||
| Deferred tax assets |
||||||||
| Inventory |
$ | 45.9 | $ | 47.1 | ||||
| Accruals and other reserves |
5.3 | 7.5 | ||||||
| Accounts receivable |
0.8 | 0.8 | ||||||
| UNICAP adjustment |
1.8 | 1.7 | ||||||
| Derivative contracts |
1.5 | 0.4 | ||||||
| Other |
2.0 | 1.6 | ||||||
| Less: Valuation Allowance |
1.7 | 0.3 | ||||||
|
|
|
|
|
|||||
| Gross deferred tax assets |
$ | 55.6 | $ | 58.8 | ||||
|
|
|
|
|
|||||
| Deferred tax liabilities |
||||||||
| Investments in foreign entities |
$ | 7.1 | $ | 7.7 | ||||
| Fixed assets and intangibles |
17.0 | 12.5 | ||||||
| Financing fees |
1.4 | 1.8 | ||||||
|
|
|
|
|
|||||
| Gross deferred tax liability |
25.5 | 22.0 | ||||||
|
|
|
|
|
|||||
| Net deferred tax asset |
$ | 30.1 | $ | 36.8 | ||||
|
|
|
|
|
|||||
| Net current deferred tax asset |
$ | 30.1 | $ | 32.2 | ||||
| Net noncurrent deferred tax asset |
0.8 | 4.6 | ||||||
| Less: Net noncurrent deferred tax liability |
0.8 | — | ||||||
|
|
|
|
|
|||||
| Net deferred tax asset |
$ | 30.1 | $ | 36.8 | ||||
|
|
|
|
|
|||||
101
Table of Contents
Global Brass and Copper Holdings, Inc.
Notes to Consolidated Financial Statements
At December 31, 2014 and 2013, the inventory deferred tax asset includes $24.0 million and $24.5 million, respectively, related to the impact of the November 19, 2007 purchase price allocations to LIFO inventories for tax purposes, which resulted in a bargain purchase gain. There is a corresponding liability recorded in the Company’s other noncurrent liabilities in the consolidated balance sheets in accordance with the provisions of ASC 740, Income Taxes.
At December 31, 2014, the Company has a foreign tax credit carryforward of $1.7 million which can be utilized through 2024.
Deferred tax assets are recorded for the estimated future benefit of foreign tax credits and other temporary differences to the extent management believes these assets will be realized. A valuation allowance is recorded when management cannot reach the conclusion that it is more likely than not that the deferred tax assets will be realized. Based on this evaluation, in 2014 and 2013, management increased the valuation allowance against the Company’s foreign tax credits by $1.4 million and $0.3 million, respectively. The Company also recorded $0.2 million of state net operating loss benefits in 2014. The majority of the state net operating losses expire in the years from 2029 through 2034.
The Company does not assert permanent reinvestment on the excess of its financial reporting over tax basis of its foreign investments. As a result, deferred tax liabilities of $7.1 million and $7.7 million have been established for the U.S. federal and state income taxes, net of applicable credits, on the excess financial reporting over tax basis of its foreign entities at December 31, 2014 and 2013, respectively. The Company plans foreign remittance amounts based on projected cash flow needs as well as the working capital and long-term investment requirements of its foreign subsidiaries and its domestic operations.
Uncertain Tax Positions
The Company is subject to income taxation in several jurisdictions around the world. Management believes that an adequate provision has been made for any adjustments that may result from tax examinations. However, the outcome of tax audits cannot be predicted with certainty. If any issues addressed in the Company’s tax audits are resolved in a manner not consistent with management’s expectations, the Company could be required to adjust its provision for income taxes in the period such resolution occurs. Although timing of the resolution and/or closure of audits is not certain, the Company believes it has adequately reserved for any potential tax exposures at December 31, 2014. The Internal Revenue Service completed its examination of the Company’s income tax returns through the period ended December 31, 2010. The Company’s U.S. federal returns for the period ended December 31, 2011 and all subsequent periods remain open for audit. The majority of state returns for the period ended December 31, 2010 and all subsequent periods remain open for audit.
At December 31, 2014 and 2013, the Company had $25.2 million and $26.0 million, respectively, of unrecognized tax benefits, none of which would impact the effective tax rate, if recognized. Estimated interest and penalties related to the underpayment of income taxes are classified as a component the provision for income taxes in the accompanying consolidated statements of operations. Accrued interest and penalties as of both December 31, 2014 and 2013 were $0.1 million. The Company’s liability for uncertain tax positions, including accrued interest and penalties, of $25.3 million and $26.1 million at December 31, 2014 and 2013, respectively, are presented in other noncurrent liabilities in the consolidated balance sheets.
102
Table of Contents
Global Brass and Copper Holdings, Inc.
Notes to Consolidated Financial Statements
A reconciliation of the summary of activity of the Company’s uncertain tax positions is summarized as follows:
| (in millions) | ||||
| Balance at January 1, 2013 |
$ | 27.4 | ||
| Additions for tax positions related to prior years |
— | |||
| Reductions for tax positions related to prior years |
(1.4 | ) | ||
| Reductions due to tax settlements |
— | |||
| Reductions due to tax statute of limitations |
— | |||
|
|
|
|||
| Balance at December 31, 2013 |
$ | 26.0 | ||
| Additions for tax positions related to prior years |
— | |||
| Reductions for tax positions related to prior years |
(0.8 | ) | ||
| Reductions due to tax settlements |
— | |||
| Reductions due to tax statute of limitations |
— | |||
|
|
|
|||
| Balance at December 31, 2014 |
$ | 25.2 | ||
|
|
|
|||
| 12. | Employee Defined Contribution Plans and Multi-Employer Pension Plans |
The Company has a retirement savings plan (the “Plan”) for all of its domestic subsidiaries under section 401(k) of the Internal Revenue Code that covers all U.S. salaried and most hourly employees. Participants may elect to defer a percentage of their compensation to the Plan, subject to aggregate limits required by the Internal Revenue Code. The Plan provides for discretionary matching contributions under certain circumstances, for employees based on location, pay status and membership in a collective bargaining unit. In addition, the Company provides a retirement contribution to certain employees based on location and age. The Company contributed $8.1 million, $7.9 million and $7.4 million to the Plan for the years ended December 31, 2014, 2013 and 2012, respectively.
Bargaining unit employees in East Alton, IL and Alliance, OH participate in the IAM National Pension Plan (“IAM Plan”). The IAM Plan is a multi-employer pension plan with negotiated fixed company costs per employee hour worked. The risks of participating in these multi-employer plans are different from single-employer plans, as the Company can be subject to additional risks if other employers do not meet their obligations. The Company recorded expense for contributions to the IAM Plan of $3.7 million, $3.3 million and $2.7 million for the years ended December 31, 2014, 2013 and 2012, respectively, which are included in cost of sales in the consolidated statements of operations. The Company’s participation in the IAM Plan for the annual period ended December 31, 2014, is outlined in the table below. There have been no significant changes that affect the comparability of 2014 and 2013 contributions. The IAM Plan’s year-end is December 31 and the plan reported $365.8 million and $351.0 million in employers’ contributions for the years ended December 31, 2013 and 2012, respectively.
| Pension Fund | IAM National Pension Fund | |
| EIN/ Pension Plan Number | 51-6031295 / 002 | |
| Pension Protection Act Zone Status (2014 and 2013)* | Green Zone | |
| FIP/RP Status Pending/Implemented | No | |
| Company Contributions (FY 2014) | $3.7 million | |
| Company Contributions (FY 2013) | $3.3 million | |
| Surcharge Imposed | No | |
| Expiration Date of Collective-Bargaining Agreement | November 5, 2017 |
| * | Plans in the green zone are at least 80 percent funded. |
103
Table of Contents
Global Brass and Copper Holdings, Inc.
Notes to Consolidated Financial Statements
As of the date of this filing, Forms 5500 were not available for the plan year ended in 2014.
| 13. | Derivative Contracts |
The Company maintains a metal, natural gas and electricity pricing risk-management strategy that uses commodity derivative contracts to minimize significant, unanticipated gains or losses that may arise from volatility of the commodity indices.
The Company’s commodity derivative contracts consist of delivery contracts matched in quantity, price and maturity to firm price sales orders in order to protect sales margins from metal price fluctuations between the firm price sale order date and shipment date.
The prices of natural gas and electricity can be particularly volatile. The Company attempts to mitigate short-term volatility in natural gas and electricity costs through the use of derivatives contracts in an effort to offset the effect of increasing costs.
The Company also utilized interest rate cap agreements in compliance with the requirement under its prior senior secured term loan credit facility (the “Term Loan Facility”) to provide that at least 50% of the Term Loan Facility be subject to a fixed rate or interest rate protection for a period of not less than three years. These interest rate cap agreements were not designated as an accounting hedge and changes in the fair value of the interest rate cap agreements have been recorded as non-cash interest expense. The agreements expired in August 2013.
By using derivative contracts to limit exposures to fluctuations in metal, natural gas and electricity prices and interest rate movements, the Company exposes itself to credit risk and market risk. Credit risk is the risk that the counterparty might fail to fulfill its performance obligations under the terms of the derivative contract. Market risk is the risk that the value of a derivative instrument might be adversely affected by a change in commodity price or interest rates. The Company manages the market risk associated with derivative contracts by establishing and monitoring parameters that limit the types and degree of market risk that may be undertaken.
The Company manages credit risk associated with derivative contracts by only executing derivative instruments with counterparties with investment-grade credit ratings. The amount of such credit risk is limited to the fair value of the derivative contract plus the unpaid portion of amounts due to the Company pursuant to terms of the derivative contracts, if any. If a downgrade in the credit rating of these counterparties occurs, management believes that this exposure is mitigated by provisions in the derivative arrangements which allow for the legal right of offset of any amounts due to the Company from the counterparties with any amounts payable to the counterparties by the Company.
The fair values of derivative contracts in the consolidated balance sheets include the impact of netting derivative assets and liabilities when a legally enforceable master netting arrangement exists. The following tables summarize the gross amounts of recognized derivative assets and liabilities, the net amounts
104
Table of Contents
Global Brass and Copper Holdings, Inc.
Notes to Consolidated Financial Statements
presented in the consolidated balance sheets, and the net amounts after deducting collateral that has been deposited with counterparties:
| As of December 31, 2014 | ||||||||||||
| (in millions, except contract data) | ||||||||||||
| Gross Amounts of Recognized Assets |
Gross Amounts Offset in Consolidated Balance Sheet |
Net Amounts of Assets Presented in Consolidated Balance Sheet |
||||||||||
| Open metal contracts (a) |
$ | 0.5 | $ | (0.5 | ) | $ | — | |||||
| Open natural gas contracts (a) |
— | — | — | |||||||||
| Open electricity contracts (a) |
0.2 | (0.2 | ) | — | ||||||||
| Collateral on deposit |
3.3 | (2.0 | ) | 1.3 | ||||||||
|
|
|
|
|
|
|
|||||||
| Total |
$ | 4.0 | $ | (2.7 | ) | $ | 1.3 | |||||
|
|
|
|
|
|
|
|||||||
| (a) | As of December 31, 2014, the Company had open metal, natural gas and electricity contracts of 84, 4 and 19, respectively, the values for which are presented above under the caption “Gross Amounts of Recognized Assets”. |
| Consolidated balance sheet location: |
||||||||
| Prepaid expenses and other current assets |
$ | 1.3 | ||||||
|
|
|
|||||||
| Total |
$ | 1.3 | ||||||
|
|
|
| Gross Amounts of Recognized Liabilities |
Gross Amounts Offset in Consolidated Balance Sheet |
Net Amounts of Liabilities Presented in Consolidated Balance Sheet |
||||||||||
| Open metal contracts (b) |
$ | 1.4 | $ | (1.4 | ) | $ | — | |||||
| Open natural gas contracts (b) |
0.7 | (0.7 | ) | — | ||||||||
| Open electricity contracts (b) |
0.6 | (0.6 | ) | — | ||||||||
|
|
|
|
|
|
|
|||||||
| Total |
$ | 2.7 | $ | (2.7 | ) | $ | — | |||||
|
|
|
|
|
|
|
|||||||
| (b) | As of December 31, 2014, the Company had open metal, natural gas and electricity contracts of 316, 74 and 58, respectively, the values for which are presented above under the caption “Gross Amounts of Recognized Liabilities”. |
105
Table of Contents
Global Brass and Copper Holdings, Inc.
Notes to Consolidated Financial Statements
| As of December 31, 2013 | ||||||||||||
| (in millions, except contract data) | ||||||||||||
| Gross Amounts of Recognized Assets |
Gross Amounts Offset in Consolidated Balance Sheet |
Net Amounts of Assets Presented in Consolidated Balance Sheet |
||||||||||
| Open metal contracts (a) |
$ | 0.8 | $ | (0.3 | ) | $ | 0.5 | |||||
| Open natural gas contracts (a) |
0.2 | — | 0.2 | |||||||||
| Open electricity contracts (a) |
0.3 | (0.1 | ) | 0.2 | ||||||||
| Collateral on deposit |
0.3 | — | 0.3 | |||||||||
|
|
|
|
|
|
|
|||||||
| Total |
$ | 1.6 | $ | (0.4 | ) | $ | 1.2 | |||||
|
|
|
|
|
|
|
|||||||
| (a) | As of December 31, 2013, the Company had open metal, natural gas and electricity contracts of 265, 39 and 37, respectively, the values for which are presented above under the caption “Gross Amounts of Recognized Assets”. |
| Consolidated balance sheet location: |
||||||||
| Prepaid expenses and other current assets |
$ | 1.2 | ||||||
|
|
|
|||||||
| Total |
$ | 1.2 | ||||||
|
|
|
| Gross Amounts of Recognized Liabilities |
Gross Amounts Offset in Consolidated Balance Sheet |
Net Amounts of Liabilities Presented in Consolidated Balance Sheet |
||||||||||
| Open metal contracts (b) |
$ | 0.3 | $ | (0.3 | ) | $ | — | |||||
| Open natural gas contracts (b) |
— | — | — | |||||||||
| Open electricity contracts (b) |
0.1 | (0.1 | ) | — | ||||||||
|
|
|
|
|
|
|
|||||||
| Total |
$ | 0.4 | $ | (0.4 | ) | $ | — | |||||
|
|
|
|
|
|
|
|||||||
| (b) | As of December 31, 2013, the Company had open metal, natural gas and electricity contracts of 132, 4 and 20, respectively, the values for which are presented above under the caption “Gross Amounts of Recognized Liabilities”. |
106
Table of Contents
Global Brass and Copper Holdings, Inc.
Notes to Consolidated Financial Statements
The following table summarizes the realized and unrealized gains and losses on derivative contracts in the consolidated statements of operations:
| (in millions) | Year Ended December 31, | |||||||||||
| 2014 | 2013 | 2012 | ||||||||||
| Losses (gains) in cost of sales for: |
||||||||||||
| Metal contracts |
$ | (0.4 | ) | $ | (0.9 | ) | $ | 1.3 | ||||
| Natural gas contracts |
0.6 | (0.2 | ) | 0.1 | ||||||||
| Electricity contracts |
(0.6 | ) | 0.1 | 0.2 | ||||||||
|
|
|
|
|
|
|
|||||||
| Total |
$ | (0.4 | ) | $ | (1.0 | ) | $ | 1.6 | ||||
|
|
|
|
|
|
|
|||||||
| Interest expense for: |
||||||||||||
| Interest rate cap agreements |
$ | — | $ | — | $ | 0.2 | ||||||
|
|
|
|
|
|
|
|||||||
| 14. | Fair Value Measurements |
ASC 820 defines fair value, establishes a framework for measuring fair value and enhances disclosures about fair value measures required under other accounting pronouncements but does not change existing guidance as to whether or not an instrument is carried at fair value. This guidance also specifies a fair value hierarchy based upon the observability of inputs used in valuation techniques. In accordance with this guidance, fair value measurements are classified under the following hierarchy:
| • | Level 1—Quoted prices for identical instruments in active markets. |
| • | Level 2—Quoted prices for similar instruments in active markets; quoted prices for identical or similar instruments in markets that are not active and model-derived valuations in which all significant inputs or significant value-drivers are observable in active markets. |
| • | Level 3—Model-derived valuations in which one or more significant inputs or significant value-drivers are unobservable. |
The following tables provide the hierarchy of inputs used to derive the fair value of the Company’s assets and liabilities measured at fair value on a recurring basis as of December 31, 2014 and December 31, 2013:
| (in millions) | As of December 31, 2014 | |||||||||||||||
| Level 1 | Level 2 | Level 3 | Total | |||||||||||||
| Derivative contracts |
$ | — | $ | 1.3 | $ | — | $ | 1.3 | ||||||||
|
|
|
|
|
|
|
|
|
|||||||||
| Total assets |
$ | — | $ | 1.3 | $ | — | $ | 1.3 | ||||||||
|
|
|
|
|
|
|
|
|
|||||||||
| (in millions) | As of December 31, 2013 | |||||||||||||||
| Level 1 | Level 2 | Level 3 | Total | |||||||||||||
| Derivative contracts |
$ | — | $ | 1.2 | $ | — | $ | 1.2 | ||||||||
|
|
|
|
|
|
|
|
|
|||||||||
| Total assets |
$ | — | $ | 1.2 | $ | — | $ | 1.2 | ||||||||
|
|
|
|
|
|
|
|
|
|||||||||
In accordance with ASC 820, the Company determines the fair value of its commodity derivative contracts using Level 2 inputs.
107
Table of Contents
Global Brass and Copper Holdings, Inc.
Notes to Consolidated Financial Statements
The Company’s metal, natural gas and electricity commodity derivative contracts are considered Level 2 as fair value measurements consist of both quoted price inputs and inputs provided by a third party that are derived principally from or corroborated by observable market data by correlation. These assumptions include, but are not limited to, those concerning interest rates, credit rates, discount rates, default rates and other factors. All derivative commodity contracts have a set term of 24 months or less.
The Company does not hold assets or liabilities requiring a Level 3 measurement and there have not been any transfers between the hierarchy levels during 2014 or 2013.
For purposes of financial reporting, the Company has determined that the carrying value of cash, accounts receivable, accounts payable, and accrued liabilities approximates fair value due to the short maturities of these instruments. Additionally, given the revolving nature and the variable interest rates, the Company has determined that the carrying value of the ABL Facility also approximates fair value. As of December 31, 2014 and 2013, the fair value of the Company’s Senior Secured Notes approximated $405.0 million and $428.4 million, respectively. The fair value of the Senior Secured Notes was based upon quotes from financial institutions (Level 2 in the fair value hierarchy as defined by ASC 820).
| 15. | Related Parties |
As of December 31, 2013, Halkos beneficially owned 34.4% of the outstanding shares of the Company. On February 3, 2014 the Company completed the Additional Follow-on Public Offering of 7,310,000 shares of its common stock, including 910,000 shares of common stock sold in connection with the full exercise of the option to purchase additional shares granted to the underwriters. After giving effect to the Additional Follow-on Public Offering, Halkos no longer owns any of the outstanding common stock of the Company.
The Company and affiliates of Halkos had previously entered into an agreement whereby the affiliates charged the Company for services of their personnel engaged in line or staff functions relating specifically to the operations of the Company (the “Management Services Agreement”). In May 2013, in connection with the IPO, the Company terminated the Management Services Agreement prior to the expiration of its initial term and was required to pay the affiliates of KPS Funds an early termination fee equal to the value of the advisory fee that would have otherwise been payable to the affiliates of KPS Funds through the end of the term of the Management Services Agreement. The Company paid $4.5 million to the affiliates of KPS Funds related to the Company’s early termination representing all unpaid management advisory fees. The total charges, which are included in selling, general and administrative expenses, were $4.8 million for the year ended December 31, 2013. The total charges incurred pursuant to the Management Services Agreement were $1.0 million for the year ended December 31, 2012. As the Management Services Agreement was terminated in May 2013, there were no management advisory fees for the year ended December 31, 2014.
Additionally, pursuant to the Management Services Agreement, the Company was required to reimburse the affiliates of KPS Funds for all reasonable costs and expenses incurred in connection with the services provided. These costs were $0.1 million for the year ended December 31, 2012 and the costs were inconsequential for the years ended December 31, 2014 and 2013.
The Company and KPS Funds entered into an agreement dated October 18, 2011 whereby the KPS Funds agreed to reimburse the Company for specific incremental costs directly attributable to an offering of equity securities (the “KPS Reimbursement Obligation”). As of December 31, 2012, the Company had recorded $4.9 million as a receivable from stockholder pertaining to the KPS Reimbursement Obligation. In the year ended December 31, 2013, pursuant to the completion of the offering that occurred on May 29, 2013, KPS Funds reimbursed the Company all amounts owed in connection with the KPS Reimbursement Obligation.
108
Table of Contents
Global Brass and Copper Holdings, Inc.
Notes to Consolidated Financial Statements
Pursuant to an amendment to the investor rights agreement, dated as of November 22, 2013, Halkos agreed to pay, subject to certain exceptions and qualifications, 50% of the registration expenses (as defined in the investor rights agreement) relating to the Additional Follow-on Public Offering. As of December 31, 2013, the Company had recorded a receivable of $0.2 million in prepaid expenses and other current assets in the consolidated balance sheets. During the first quarter of 2014, Halkos reimbursed the Company all amounts owed for registration expenses relating to the Additional Follow-on Public Offering.
| 16. | Commitments and Contingencies |
Environmental Considerations
The Company is subject to a variety of environmental laws and regulations governing discharges to air and water, the handling, storage and disposal of hazardous or solid waste materials and the remediation of contamination associated with releases of hazardous substances. Although the Company believes it is in material compliance with all of the various regulations applicable to its business, there can be no assurance that requirements will not change in the future or that the Company will not incur significant costs to comply with such requirements. The Company employs responsible personnel at each facility, along with various environmental engineering consultants from time to time to assist with ongoing management of environmental, health and safety requirements. Management expenses environmental costs related to existing conditions resulting from past or current operations and from which no current or future benefit is discernible. Expenditures that extend the life of the related property are capitalized. The Company determines its liability on a location by location basis and records a liability at the time it is deemed probable and can be reasonably estimated. The Company is currently not aware of any environmental matters which may have a material impact on the Company’s financial position, results of operations, or liquidity.
On November 19, 2007 (the date of inception of Holdings), the Company acquired the assets and operations relating to the worldwide metals business of Olin Corporation. Olin Corporation agreed to retain liability arising out of the existing conditions on certain of the Company’s properties for any remedial actions required by environmental laws, and agreed to indemnify the Company for all or part of a number of other environmental liabilities. Since 2007, Olin Corporation has been performing remedial actions at the facilities in East Alton, Illinois and Waterbury, Connecticut, and has been participating in remedial actions at certain other properties as well. If Olin Corporation were to stop its environmental remedial activities at the Company’s properties, the Company could be required to assume responsibility for these activities, the cost of which could be material.
Insurance Coverage
The Company maintains Comprehensive Medical Plans for employees of GBC and its subsidiaries (the “Plans”) to provide health insurance for eligible employees on a self-insured basis. The Plans are covered by a stop loss policy for those benefits provided on a self-insured basis with a deductible of $0.3 million per participant for all GBC employees, except for employees of the Chase Brass division, which has a deductible of $0.1 million per participant and a specific stop loss maximum of $2.0 million.
The Company is self-insured for workers’ compensation claims assumed from its predecessor company for activity prior to November 19, 2007. The Company is self-insured for annual workers’ compensation costs relating to activity after November 19, 2007 of up to $0.5 million per occurrence. Workers’ compensation claims relating to activity after November 19, 2007 are covered by a loss funding insurance arrangement whereby the Company makes a fixed payment to the insurer which is used to pay submitted claims.
109
Table of Contents
Global Brass and Copper Holdings, Inc.
Notes to Consolidated Financial Statements
Legal Considerations
The Company is party to various legal proceedings arising in the ordinary course of business. The Company believes that none of its lawsuits are individually material or that the aggregate exposure of all of its lawsuits, including those that are probable and those that are only reasonably possible, is material to its financial condition, results of operations or cash flows.
Operating Leases
The Company has operating leases covering certain of its facilities and equipment under non-cancelable lease agreements.
As of December 31, 2014, future minimum lease payments under non-cancelable leases in effect are as follows:
| (in millions) | ||||
| Year |
Payment | |||
| 2015 |
$ | 2.4 | ||
| 2016 |
1.9 | |||
| 2017 |
1.4 | |||
| 2018 |
1.0 | |||
| 2019 |
0.4 | |||
| Thereafter |
— | |||
|
|
|
|||
| Total minimum lease payments |
$ | 7.1 | ||
|
|
|
|||
Rental expense under all operating leases was approximately $3.2 million, $3.3 million and $3.6 million for the years ended December 31, 2014, 2013 and 2012, respectively, and is recorded in the consolidated statements of operations as cost of sales or selling, general and administrative costs depending on the nature and use of the underlying asset being leased.
| 17. | Profits Interest Awards |
Halkos granted, pursuant to the Halkos Equity Plan, non-voting membership interests to select members of the Company’s management titled Class B Shares.
Despite the fact that these Class B Shares are in the form of equity, the Class B Shares were considered a profit sharing arrangement due to certain aspects of the plan, primarily the ability of Halkos to repurchase the Shares at no cost from the employee holding such shares. Award recipients substantively derive economic value in the instrument through profit sharing distributions. Accordingly, the Class B Shares were a compensation liability award accounted for as a profit sharing arrangement by Halkos. Because the awards were granted by Halkos, an economic interest holder of the Company, to employees of the Company, distributions were accounted for by the Company as non-cash compensation expense with a corresponding increase in additional paid-in capital to reflect the deemed capital contribution by Halkos. Expense on the Class B Shares was recorded in the period in which distributions to Class B award holders were determined to be probable.
Non-cash compensation expense of $8.9 million and $19.5 million is included as a component of selling, general and administrative expenses in the consolidated statements of operations for the years ended December 31, 2013 and 2012, respectively. There are no such amounts for the year ended December 31, 2014.
110
Table of Contents
Global Brass and Copper Holdings, Inc.
Notes to Consolidated Financial Statements
In June 2013, Halkos modified the Halkos LLC Agreement to eliminate its right to acquire all or a portion of the Class B Shares. This modification to the Halkos LLC Agreement triggered the recognition of additional non-cash compensation expense reflecting the fair value of vested Class B Shares as of the date of modification. The observable market price of the Company’s publicly traded shares was used to determine the fair value of the Class B Shares. In June 2013, the Company recognized $20.4 million of incremental non-cash compensation expense as a result of the modification and no additional expense will be incurred by the Company in any future period.
| 18. | Segment Information |
The Company’s chief executive officer and chief financial officer are the Company’s Chief Operating Decision Maker, who allocate resources and evaluate performance at the divisional level. As such, the Company has determined that it has three reportable segments: Olin Brass, Chase Brass and A.J. Oster.
Olin Brass is a leading manufacturer and converter of copper and brass sheet, strip and fabricated products. Olin Brass also rerolls and forms other alloys such as stainless, carbon steel and aluminum. Olin Brass’ products are used in five primary end markets: building and housing, munitions, automotive, coinage, and electronics/electrical components.
Chase Brass is a leading manufacturer of brass rod in North America. Chase Brass primarily manufactures brass rod, including round and other shapes, ranging from 1/4 inch to 4.5 inches in diameter. The key attributes of brass rod include its machinability, corrosion resistance and moderate strength, making it especially suitable for forging and machining products such as valves and fittings. Brass rod is generally manufactured from copper or copper-alloy scrap. Chase Brass produces brass rod used in production applications which can be grouped into four primary end markets: building and housing, transportation, electronics/electrical components and industrial machinery and equipment.
A.J. Oster is a processor and distributor of primarily copper and copper-alloy sheet, strip and foil. Oster operates six strategically-located service centers in the United States, Puerto Rico and Mexico. Each A.J. Oster service center reliably provides a broad range of high quality products at quick lead-times in small quantities. These capabilities, combined with A.J. Oster’s operations of precision slitting, hot tinning, traverse winding, cutting, edging and special packaging, provide value to a broad customer base. Oster’s products are used in three primary end markets: building and housing, automotive and electronics/electrical components.
Corporate and Other includes compensation for corporate executives and officers, corporate office and administrative salaries, and professional fees for accounting, tax and legal services. Corporate and Other also includes interest expense, state and Federal income taxes, overhead costs that management has not allocated to the operating segments, share-based compensation expense, costs related to other long-term incentive programs and the elimination of intercompany balances.
The Chief Operating Decision Maker evaluates performance and determines resource allocations based on a number of factors, the primary performance measure being Adjusted EBITDA.
Adjusted EBITDA is earnings before interest, taxes, depreciation and amortization (“EBITDA”) adjusted to exclude unrealized gains and losses on derivative contracts in support of the balanced book approach, unrealized gains and losses associated with derivative contracts related to electricity and natural gas costs, non-cash losses due to lower of cost or market adjustments to inventory, LIFO-based gains and losses due to the depletion of a LIFO layer of metal inventory, non-cash profits interest compensation expense related to payments made to certain members of management by Halkos, share-based compensation expense, loss on extinguishment of debt, non-cash income accretion related to the Dowa Joint Venture, management fees
111
Table of Contents
Global Brass and Copper Holdings, Inc.
Notes to Consolidated Financial Statements
paid to affiliates of KPS, restructuring and other business transformation charges, specified legal and professional expenses and certain other items, each of which are excluded because management believes they are not indicative of the ongoing performance of the Company’s core operations.
Below is a reconciliation of the Company’s Adjusted EBITDA to income before provision for income taxes and equity income:
| (in millions) | ||||||||||||
| Year Ended December 31, | ||||||||||||
| 2014 | 2013 | 2012 | ||||||||||
| Net Sales, External Customers |
||||||||||||
| Olin Brass |
$ | 794.2 | $ | 820.5 | $ | 676.6 | ||||||
| Chase Brass |
603.6 | 622.0 | 647.7 | |||||||||
| A.J. Oster |
313.6 | 316.0 | 326.2 | |||||||||
|
|
|
|
|
|
|
|||||||
| Total net sales, external customers |
$ | 1,711.4 | $ | 1,758.5 | $ | 1,650.5 | ||||||
|
|
|
|
|
|
|
|||||||
| Intersegment Net Sales |
||||||||||||
| Olin Brass |
$ | 53.6 | $ | 53.6 | $ | 46.3 | ||||||
| Chase Brass |
0.1 | — | 0.3 | |||||||||
| A.J. Oster |
0.3 | 0.2 | 0.2 | |||||||||
|
|
|
|
|
|
|
|||||||
| Total intersegment net sales |
$ | 54.0 | $ | 53.8 | $ | 46.8 | ||||||
|
|
|
|
|
|
|
|||||||
| Adjusted EBITDA |
||||||||||||
| Olin Brass |
$ | 36.9 | $ | 48.3 | $ | 45.1 | ||||||
| Chase Brass |
69.2 | 67.2 | 66.6 | |||||||||
| A.J. Oster |
16.2 | 16.9 | 19.5 | |||||||||
|
|
|
|
|
|
|
|||||||
| Total Adjusted EBITDA of segments |
122.3 | 132.4 | 131.2 | |||||||||
| Corporate and Other |
(12.6 | ) | (14.4 | ) | (15.8 | ) | ||||||
| Depreciation expense |
(12.2 | ) | (8.5 | ) | (6.8 | ) | ||||||
| Amortization expense |
(0.1 | ) | (0.1 | ) | (0.1 | ) | ||||||
| Interest expense |
(39.6 | ) | (39.8 | ) | (39.7 | ) | ||||||
| Net income attributable to noncontrolling interest |
0.4 | 0.3 | 0.4 | |||||||||
| Unrealized (loss) gain on derivative contracts (a) |
(3.0 | ) | 0.2 | 1.6 | ||||||||
| LIFO liquidation (loss) gain (b) |
(0.6 | ) | 2.0 | 4.8 | ||||||||
| Loss on extinguishment of debt (c) |
— | — | (19.6 | ) | ||||||||
| Equity method investment income (d) |
(0.4 | ) | (0.8 | ) | (0.3 | ) | ||||||
| Non-cash Halkos profits interest compensation expense (e) |
— | (29.3 | ) | (19.5 | ) | |||||||
| Management fees (f) |
— | (4.8 | ) | (1.0 | ) | |||||||
| Specified legal/professional expenses (g) |
(4.3 | ) | (4.3 | ) | (3.3 | ) | ||||||
| Lower of cost or market adjustment to inventory (h) |
(0.2 | ) | (0.3 | ) | (0.3 | ) | ||||||
| Share-based compensation expense (i) |
(1.7 | ) | (1.2 | ) | — | |||||||
| Restructuring and other business transformation charges (j) |
(0.4 | ) | — | — | ||||||||
| Other (k) |
— | — | (0.5 | ) | ||||||||
|
|
|
|
|
|
|
|||||||
| Income before provision for income taxes and equity income |
$ | 47.6 | $ | 31.4 | $ | 31.1 | ||||||
|
|
|
|
|
|
|
|||||||
| (a) | Represents unrealized gains and losses on derivative contracts. |
| (b) | Calculated based on the difference between the base year LIFO carrying value and the metal prices prevailing in the market at the time of inventory depletion. |
112
Table of Contents
Global Brass and Copper Holdings, Inc.
Notes to Consolidated Financial Statements
| (c) | Represents the loss on the extinguishment of debt recognized in connection with the termination prior to maturity of the Term Loan Facility. |
| (d) | Excludes accretion income of $0.7 million in each of the years ended December 31, 2014, 2013 and 2012. Equity method investment income is exclusive to Olin Brass. |
| (e) | The 2013 amount includes $20.4 million that represents incremental non-cash compensation as a result of the modification made to the Halkos Equity Plan to eliminate Halkos’ right to acquire all or a portion of the Class B Shares for less than fair market value upon certain conditions. The 2013 amount also includes $8.9 million that represents dividend payments made by Halkos to members of the Company’s management that resulted in a non-cash compensation charge in connection with the IPO that occurred in May 2013. |
The 2012 amount represents the dividend payment made by Halkos to certain members of management that resulted in a non-cash compensation charge in connection with the cash contribution of $160.0 million to Halkos that occurred on June 1, 2012.
| (f) | The 2013 amount represents an early termination fee equal to the value of the advisory fee that would have otherwise been payable to affiliates of KPS through the end of the agreement, as well as a portion of the annual advisory fees paid to affiliates of KPS prior to the termination of the agreement. |
| (g) | Specified legal/professional expenses for the year ended December 31, 2014 includes $4.3 million of professional fees for accounting, tax, legal and consulting services related to costs incurred as a publicly traded company, including Additional Follow-On Public Offering costs. |
Specified legal/professional expenses for the year ended December 31, 2013 includes $4.3 million of professional fees for accounting, tax, legal and consulting services related to costs incurred as a publicly traded company, including IPO efforts, Follow-on Public Offering costs, Additional Follow-On Public Offering costs, costs associated with the registered “A/B exchange offer” that was required by the registration rights agreement relating to such Senior Secured Notes (“Exchange Offer”) and certain regulatory and compliance matters.
Specified legal/professional expenses for the year ended December 31, 2012 includes $3.3 million of professional fees for accounting, tax, legal and consulting services related to the Exchange Offer and public company readiness efforts.
| (h) | Represents non-cash lower of cost or market charges for the write down of inventory recorded during the years ended December 31, 2014, 2013 and 2012. |
| (i) | Represents share-based compensation expense resulting from the grant of non-qualified stock options, restricted stock and performance-based shares to certain employees, members of the Company’s management and the Company’s Board of Directors. |
| (j) | Restructuring and other business transformation charges for the year ended December 31, 2014 represent severance charges at Olin Brass. |
| (k) | Represents a call premium of $0.5 million as a result of a voluntary prepayment of $15.0 million on the Term Loan Facility in April 2012. |
| (in millions) | Year Ended December 31, |
|||||||||||
| 2014 | 2013 | 2012 | ||||||||||
| Depreciation and amortization |
||||||||||||
| Olin Brass |
$ | 7.9 | $ | 5.0 | $ | 3.8 | ||||||
| Chase Brass |
3.6 | 3.0 | 2.5 | |||||||||
| A.J. Oster |
0.5 | 0.3 | 0.3 | |||||||||
| Corporate and Eliminations |
0.3 | 0.3 | 0.3 | |||||||||
|
|
|
|
|
|
|
|||||||
| Total depreciation and amortization |
$ | 12.3 | $ | 8.6 | $ | 6.9 | ||||||
|
|
|
|
|
|
|
|||||||
113
Table of Contents
Global Brass and Copper Holdings, Inc.
Notes to Consolidated Financial Statements
| (in millions) | Year Ended December 31, | |||||||||||
| 2014 | 2013 | 2012 | ||||||||||
| LIFO liquidation (loss)/gain |
||||||||||||
| Olin Brass |
$ | (1.5 | ) | $ | 0.1 | $ | 0.2 | |||||
| Chase Brass |
— | 1.9 | 1.6 | |||||||||
| A.J. Oster |
— | — | 4.5 | |||||||||
| Corporate and Eliminations |
0.9 | — | (1.5 | ) | ||||||||
|
|
|
|
|
|
|
|||||||
| Total LIFO liquidation (loss)/gain |
$ | (0.6 | ) | $ | 2.0 | $ | 4.8 | |||||
|
|
|
|
|
|
|
|||||||
| Interest Expense |
||||||||||||
| Olin Brass |
$ | 0.3 | $ | — | $ | — | ||||||
| Corporate and Eliminations |
39.3 | 39.8 | 39.7 | |||||||||
|
|
|
|
|
|
|
|||||||
| Total interest expense |
$ | 39.6 | $ | 39.8 | $ | 39.7 | ||||||
|
|
|
|
|
|
|
|||||||
| Capital expenditures |
||||||||||||
| Olin Brass |
$ | 16.9 | $ | 18.3 | $ | 11.7 | ||||||
| Chase Brass |
5.3 | 7.2 | 5.8 | |||||||||
| A.J. Oster |
1.1 | 0.6 | 0.6 | |||||||||
| Corporate and Eliminations |
0.1 | 0.1 | 0.5 | |||||||||
|
|
|
|
|
|
|
|||||||
| Total capital expenditures |
$ | 23.4 | $ | 26.2 | $ | 18.6 | ||||||
|
|
|
|
|
|
|
|||||||
As discussed in note 2, the Company’s consolidated statements of cash flows for the years ended December 31, 2013 and 2012 reflect revisions to correct errors related to the treatment of purchases of property, plant and equipment for which cash had not yet been paid. The Company increased its capital expenditures for its Chase Brass segment by $0.3 million to $7.2 million for the year ended December 31, 2013. The Company increased its capital expenditures for its Olin Brass segment by $0.3 million to $18.3 million for the year ended December 31, 2013. The Company decreased its capital expenditures for its Chase Brass segment by $1.0 million to $5.8 million for the year ended December 31, 2012. The Company decreased its capital expenditures for its Olin Brass segment by $0.8 million to $11.7 million for the year ended December 31, 2012.
| As of December 31, | ||||||||
| 2014 | 2013 | |||||||
| Total Assets |
||||||||
| Olin Brass |
$ | 258.2 | $ | 262.9 | ||||
| Chase Brass |
125.6 | 124.9 | ||||||
| A.J. Oster |
92.0 | 86.3 | ||||||
| Corporate and Eliminations |
100.7 | 74.6 | ||||||
|
|
|
|
|
|||||
| Total assets |
$ | 576.5 | $ | 548.7 | ||||
|
|
|
|
|
|||||
114
Table of Contents
Global Brass and Copper Holdings, Inc.
Notes to Consolidated Financial Statements
Summarized geographic information is shown in the following table. Net sales are attributed to individual countries based on the location from which the products are shipped.
| (in millions) | Year Ended December 31, | |||||||||||
| 2014 | 2013 | 2012 | ||||||||||
| Net sales: |
||||||||||||
| United States |
$ | 1,613.9 | $ | 1,660.1 | $ | 1,556.9 | ||||||
| Asia Pacific |
50.6 | 56.5 | 53.6 | |||||||||
| Mexico |
46.9 | 41.9 | 40.0 | |||||||||
|
|
|
|
|
|
|
|||||||
| Total net sales |
$ | 1,711.4 | $ | 1,758.5 | $ | 1,650.5 | ||||||
|
|
|
|
|
|
|
|||||||
Substantially all long-lived assets are maintained in the United States.
During the year ended December 31, 2013, net sales to one major customer amounted to $182.4 million, which represents 10.4% of the Company’s consolidated net sales to external customers for 2013. The Company’s Olin Brass segment sells to this major customer. No customer represented 10 percent or more of consolidated revenues during the years ended December 31, 2014 or 2012.
| 19. | Earnings Per Share |
Basic earnings per share is computed based on the weighted-average number of common shares outstanding and diluted earnings per share is computed based on the weighted-average number of common shares outstanding adjusted by the number of additional shares that would have been outstanding had potentially dilutive common shares been issued. Potentially dilutive securities include nonvested share awards and stock options for which the exercise price was less than the average market price of the Company’s outstanding common stock. Nonvested performance-based share awards are included in the average diluted shares outstanding for each period if established performance criteria have been met at the end of the respective periods.
The following table sets forth the computation of basic and diluted earnings per share attributable to the Company:
| (in millions, except per share data) | Year Ended December 31, | |||||||||||
| 2014 | 2013 | 2012 | ||||||||||
| Numerator |
||||||||||||
| Net income attributable to Global Brass and Copper Holdings, Inc. |
$ | 31.7 | $ | 10.4 | $ | 12.5 | ||||||
| Denominator |
||||||||||||
| Weighted-average common shares outstanding |
21.2 | 21.1 | 21.1 | |||||||||
| Effect of potentially dilutive securities: |
||||||||||||
| Stock options and nonvested share awards |
0.1 | 0.1 | — | |||||||||
|
|
|
|
|
|
|
|||||||
| Weighted-average common shares outstanding, assuming dilution |
21.3 | 21.2 | 21.1 | |||||||||
|
|
|
|
|
|
|
|||||||
| Net income attributable to Global Brass and Copper Holdings, Inc. per common share: |
||||||||||||
| Basic |
$ | 1.50 | $ | 0.49 | $ | 0.59 | ||||||
| Diluted |
$ | 1.49 | $ | 0.49 | $ | 0.59 | ||||||
115
Table of Contents
Global Brass and Copper Holdings, Inc.
Notes to Consolidated Financial Statements
The computation of weighted-average common shares outstanding, assuming dilution, for the periods presented, includes the average common shares outstanding that would result from the assumed exercise of outstanding stock options, vesting of restricted stock awards and vesting of the portion of performance-based shares for which the established performance criterion has been met. Weighted-average common shares outstanding, assuming dilution, for the year ended December 31, 2014 and 2013 excludes stock options to purchase 147,136 and 3,451 shares, respectively, because they were anti-dilutive.
| 20. | Share-based Compensation |
The Global Brass and Copper Holdings, Inc. 2013 Omnibus Equity Incentive Plan (“2013 Plan”) was adopted by the Board of Directors and approved by shareholders on April 10, 2013. The 2013 Plan provides for an aggregate of 1,111,053 shares of Global Brass and Copper Holdings, Inc.’s common stock to be available for awards in the form of options, restricted stock, restricted stock units, performance-based shares and other equity-based awards. Pursuant to the 2013 Plan, in the years ended December 31, 2014 and 2013, the Company granted non-qualified options, restricted stock and performance-based shares to certain employees and members of the Company’s management and its Board of Directors. At December 31, 2014, 628,764 shares were available for future grant in the form of options, restricted shares or stock appreciation rights.
The Company will satisfy the requirement for common stock for share-based payments by issuing shares out of authorized but unissued common stock or treasury stock.
Stock Options
The exercise prices of stock options are equal to no less than the fair market value of common stock at the time of grant. Stock options will generally vest in three equal installments on the anniversary of the date of grant and have a maximum term of ten years. Management uses the straight-line attribution method to recognize expense for all stock options. Stock options are generally subject to immediate forfeiture if employment terminates prior to vesting, except under certain conditions, in which case the options expire no more than 90 days after the date of such termination. The fair value of each option grant is estimated on the date of grant using the Black-Scholes option-pricing model and the following weighted-average inputs for the option pricing model:
| 2014 | 2013 | |||||||
| Expected volatility |
53 | % | 55 | % | ||||
| Risk-free interest rate |
2.2 | % | 1.3 | % | ||||
| Dividend yield |
0.9 | % | 1.3 | % | ||||
| Expected term |
6.0 years | 6.0 years | ||||||
Because the Company has only been a public company since May 2013, there is limited historical data on the volatility of its common stock. As a result, the expected volatility of the 2014 and 2013 option grants was estimated based on the average volatility of the common stock of a group of its publicly traded peers.
The risk-free interest rate assumption in the Black-Scholes option-pricing model is based upon the U.S. Treasury bond rate consistent with the expected term assumption. The dividend yield assumption is based on Global Brass and Copper Holdings, Inc.’s expectation of dividend payouts.
Because the Company has only very limited historical information concerning stock option exercise behavior by its employees and such information is not readily available from a peer group of companies, the expected term was estimated using the “simplified” method permitted by Staff Accounting Bulletin Topic 14 issued by the Securities and Exchange Commission (“SEC”).
116
Table of Contents
Global Brass and Copper Holdings, Inc.
Notes to Consolidated Financial Statements
A summary of the stock option activity is summarized as follows:
| Shares | Weighted Average Exercise Price of Shares |
Average Remaining Contractual Term (in years) |
Aggregate Intrinsic Value (in millions) |
|||||||||||||
| Outstanding at December 31, 2012 |
— | $ | — | |||||||||||||
| Granted |
107,895 | 11.27 | ||||||||||||||
| Exercised |
— | — | ||||||||||||||
| Forfeited or expired |
— | — | ||||||||||||||
|
|
|
|||||||||||||||
| Outstanding at December 31, 2013 |
107,895 | $ | 11.27 | 9.4 | $ | 0.6 | ||||||||||
|
|
|
|||||||||||||||
| Granted |
143,685 | 16.06 | ||||||||||||||
| Exercised |
(11,605 | ) | 11.00 | |||||||||||||
| Forfeited or expired |
— | — | ||||||||||||||
|
|
|
|||||||||||||||
| Outstanding at December 31, 2014 |
239,975 | $ | 14.15 | 8.9 | $ | 0.2 | ||||||||||
|
|
|
|||||||||||||||
| Options exercisable at December 31, 2014 |
39,832 | $ | 11.25 | 8.4 | $ | 0.1 | ||||||||||
The weighted-average grant date fair value of stock options granted during 2014 and 2013 was $7.64 and $5.21, respectively.
As of December 31, 2014, the Company had $0.9 million of total unrecognized compensation expense related to stock option grants that will be recognized over the weighted average period of 1.9 years.
Restricted Stock
Restricted stock is granted to certain employees and non-employee directors and the cost of these awards is determined using the market price of the Company’s common stock on the date of grant. Restricted stock shares granted represent newly issued shares and have the same cash dividend and voting rights as other common stock and are considered to be currently issued and outstanding. Restricted stock awards granted to employees vest over periods ranging from one to three years after the grant date, and awards granted to non-employee directors generally vest from 218 days to one year following the grant date. Management uses the straight-line attribution method to recognize expense for all restricted stock awards. The awards are generally subject to forfeiture if employment terminates prior to vesting, except under certain conditions. The cash dividends on restricted stock shares are forfeitable, and payments of cash dividends on restricted stock shares are withheld until the shares vest. Compensation is recognized over the period during which the employees provide the requisite service to the Company. A summary of the changes in restricted stock under the 2013 Plan is presented below:
| Shares | Weighted Average Grant Date Fair Value |
|||||||
| Nonvested restricted stock—December 31, 2012 |
— | $ | — | |||||
| Granted |
141,486 | 11.34 | ||||||
| Vested |
(10,938 | ) | 11.00 | |||||
| Forfeited |
— | — | ||||||
|
|
|
|||||||
| Nonvested restricted stock—December 31, 2013 |
130,548 | $ | 11.37 | |||||
|
|
|
|||||||
| Granted |
104,563 | 15.66 | ||||||
| Vested |
(106,010 | ) | 11.43 | |||||
| Forfeited |
(7,952 | ) | 14.30 | |||||
|
|
|
|||||||
| Nonvested restricted stock—December 31, 2014 |
121,149 | $ | 14.83 | |||||
|
|
|
|||||||
117
Table of Contents
Global Brass and Copper Holdings, Inc.
Notes to Consolidated Financial Statements
The total fair value of restricted stock that vested during 2014 and 2013 was $1.7 million and $0.2 million, respectively.
At December 31, 2014, total unrecognized compensation cost related to nonvested restricted stock was $1.1 million and is expected to be recognized over a weighted average period of 1.7 years.
Performance Shares
The fair value of performance share grants is determined based on the market price of the Company’s common stock on the date of grant. The number of common shares that will be issued is dependent upon vesting and actual performance of the Company relative to the established financial targets. For the performance shares issued in 2014 and 2013, the financial target is the Company’s return on net assets (“RONA”) as of the end of 2014 and 2013, respectively. The number of shares earned in each year could range from 0% to 205% of the performance shares granted and the amount of compensation expense recognized reflects management’s assessment of the probability that performance goals will be achieved. The number of performance shares earned generally vest in three equal installments on the anniversary date of the grant. Performance shares that have not vested are generally subject to forfeiture if employment terminates, except under certain conditions. Cash dividends accrue on performance shares once the performance conditions have been met, but the dividends are forfeitable if the performance shares do not vest. The Company recognizes compensation expense related to performance share grants using the graded-vesting method over the vesting periods.
A summary of the performance share award activity is summarized as follows:
| Shares | Weighted-Average Grant-Date Fair Value |
|||||||
| Nonvested performance shares—December 31, 2012 |
— | $ | — | |||||
| Granted |
103,273 | 11.35 | ||||||
| Vested |
(3,646 | ) | 13.14 | |||||
| Unearned or forfeited (a) |
(81,461 | ) | 11.28 | |||||
|
|
|
|||||||
| Nonvested performance shares—December 31, 2013 |
18,166 | $ | 11.31 | |||||
|
|
|
|||||||
| Granted |
257,067 | 16.06 | ||||||
| Vested |
(6,059 | ) | 11.31 | |||||
| Unearned or forfeited (a) |
(257,067 | ) | 16.06 | |||||
|
|
|
|||||||
| Nonvested performance shares—December 31, 2014 |
12,107 | $ | 11.31 | |||||
|
|
|
|||||||
| (a) | Includes shares granted in 2014 and 2013 that were not earned based on performance provisions of the award grants. |
The total fair value of performance shares that vested during 2014 and 2013 was $0.1 million.
At December 31, 2014, total unrecognized compensation cost related to the performance share awards granted of approximately $0.1 million is expected to be recognized over a weighted average period of 1.1 years.
118
Table of Contents
Global Brass and Copper Holdings, Inc.
Notes to Consolidated Financial Statements
Share-Based Compensation Expense
The following table summarizes share-based compensation expense, reported as a component of selling, general, and administrative expense, related to the Company’s stock options, restricted stock and performance share awards:
| (in millions) | Year Ended December 31, | |||||||
| 2014 | 2013 | |||||||
| Stock options |
$ | 0.5 | $ | 0.2 | ||||
| Restricted stock |
1.1 | 0.9 | ||||||
| Performance shares |
0.1 | 0.1 | ||||||
|
|
|
|
|
|||||
| Total pre-tax share-based compensation expense |
$ | 1.7 | $ | 1.2 | ||||
|
|
|
|
|
|||||
| Net tax benefit related to share-based compensation expense |
$ | 0.7 | $ | 0.5 | ||||
|
|
|
|
|
|||||
Tax benefits realized from the exercise of stock options and the vesting of restricted stock and performance shares were $0.6 million in 2014. No tax benefits were realized in 2013, because no stock options were exercised and the compensation cost for restricted stock and performance shares that vested was not currently deductible.
| 21. | Condensed Consolidating Financial Information |
In June 2012, Holdings (presented as “Parent” in the following tables), through its wholly-owned principal operating subsidiary, GBC (presented as “Issuer” in the following tables), issued Senior Secured Notes as further described in the notes to the consolidated financial statements. The Senior Secured Notes are jointly and severally guaranteed on a senior secured basis by Holdings and substantially all existing 100%-owned U.S. subsidiaries of GBC and any future restricted subsidiaries who guarantee or incur certain types of Permitted Debt, as such term is defined under the Indenture (individually, a “Guarantor” and collectively, the “Guarantors”). The guarantees are full and unconditional, except that a Guarantor can be automatically released and relieved of its obligations under certain customary provisions contained in the Indenture. Under these customary provisions, a Guarantor is automatically released from its obligations as a guarantor upon the sale of the Guarantor or substantially all of its assets to a third party, the designation of the Guarantor as an unrestricted subsidiary in accordance with the terms of the Indenture, the release or discharge of all guarantees by such Guarantor and the repayment of all indebtedness, or upon the Issuer’s exercise of its legal defeasance option or covenant defeasance option or if the obligations under the Indenture are discharged in accordance with the terms of the Indenture. All other subsidiaries of GBC, whether direct or indirect, do not guarantee the Senior Secured Notes (collectively, the “Non-Guarantors”).
Holdings is also a guarantor of the ABL Facility and substantially all of its 100%-owned U.S. subsidiaries are borrowers under, or guarantors of, the ABL Facility on a senior secured basis.
The following condensed consolidating financial information presents the financial position, results of operations, comprehensive income and cash flows of (1) the Parent, (2) the Issuer, (3) the Guarantors, (4) the Non-Guarantors and (5) eliminations to arrive at the information for the Company on a consolidated basis. The condensed consolidating financial information presented below is not necessarily indicative of the financial position, results of operations, comprehensive income or cash flows of the Parent, the Issuer, the Guarantors or the Non-Guarantors on a stand-alone basis.
119
Table of Contents
Global Brass and Copper Holdings, Inc.
Notes to Consolidated Financial Statements
As discussed in note 2, the Company’s consolidated statements of cash flows for years ended December 31, 2013 and 2012 reflect revisions to correct errors related to the treatment of purchases of property, plant and equipment for which cash had not yet been paid. The revision resulted in an increase of $0.6 million and a decrease of $1.8 million to the Company’s and Guarantor Subsidiaries “net cash provided by operating activities” for the years ended December 31, 2013 and 2012, respectively, with a corresponding increase and decrease to “net cash used in investing activities”, respectively. The Company will also revise the Guarantor Subsidiaries column for the same quarterly periods and for the same amounts as discussed elsewhere in these notes to the consolidated financial statements.
120
Table of Contents
Global Brass and Copper Holdings, Inc.
Notes to Consolidated Financial Statements
| (in millions) | Condensed Consolidating Balance Sheet As of December 31, 2014 |
|||||||||||||||||||||||
| Parent | Issuer | Guarantor Subsidiaries |
Non- Guarantor Subsidiaries |
Eliminations | Consolidated | |||||||||||||||||||
| Assets |
||||||||||||||||||||||||
| Current assets: |
||||||||||||||||||||||||
| Cash |
$ | — | $ | 37.6 | $ | 3.8 | $ | 4.6 | $ | (1.4 | ) | $ | 44.6 | |||||||||||
| Accounts receivable, net of allowance |
— | 2.6 | 131.6 | 18.1 | — | 152.3 | ||||||||||||||||||
| Inventories |
— | — | 173.5 | 15.8 | (0.3 | ) | 189.0 | |||||||||||||||||
| Prepaid expenses and other current assets |
— | 10.1 | 16.0 | 0.1 | — | 26.2 | ||||||||||||||||||
| Deferred income taxes |
— | 30.1 | — | — | — | 30.1 | ||||||||||||||||||
| Income tax receivable |
— | 8.4 | — | — | (0.1 | ) | 8.3 | |||||||||||||||||
|
|
|
|
|
|
|
|
|
|
|
|
|
|||||||||||||
| Total current assets |
— | 88.8 | 324.9 | 38.6 | (1.8 | ) | 450.5 | |||||||||||||||||
| Property, plant and equipment, net |
— | 0.7 | 102.4 | 0.4 | — | 103.5 | ||||||||||||||||||
| Investment in joint venture |
— | — | 2.0 | — | — | 2.0 | ||||||||||||||||||
| Investment in subsidiaries |
29.8 | 752.5 | 23.1 | — | (805.4 | ) | — | |||||||||||||||||
| Intercompany accounts |
— | — | 419.3 | — | (419.3 | ) | — | |||||||||||||||||
| Goodwill |
— | — | 4.4 | — | — | 4.4 | ||||||||||||||||||
| Intangible assets, net |
— | — | 0.6 | — | — | 0.6 | ||||||||||||||||||
| Deferred income taxes |
— | 0.8 | — | — | — | 0.8 | ||||||||||||||||||
| Other noncurrent assets |
— | 12.5 | 2.2 | — | — | 14.7 | ||||||||||||||||||
|
|
|
|
|
|
|
|
|
|
|
|
|
|||||||||||||
| Total assets |
$ | 29.8 | $ | 855.3 | $ | 878.9 | $ | 39.0 | $ | (1,226.5 | ) | $ | 576.5 | |||||||||||
|
|
|
|
|
|
|
|
|
|
|
|
|
|||||||||||||
| Liabilities and equity / (deficit) |
||||||||||||||||||||||||
| Current liabilities: |
||||||||||||||||||||||||
| Current maturities of long-term debt |
$ | — | $ | — | $ | 1.0 | $ | — | $ | — | $ | 1.0 | ||||||||||||
| Accounts payable |
— | 0.6 | 82.0 | 1.6 | (1.7 | ) | 82.5 | |||||||||||||||||
| Accrued liabilities |
— | 18.4 | 38.3 | 0.6 | — | 57.3 | ||||||||||||||||||
| Accrued interest |
— | 3.2 | — | — | — | 3.2 | ||||||||||||||||||
| Income tax payable |
— | — | 0.2 | 0.4 | (0.1 | ) | 0.5 | |||||||||||||||||
|
|
|
|
|
|
|
|
|
|
|
|
|
|||||||||||||
| Total current liabilities |
— | 22.2 | 121.5 | 2.6 | (1.8 | ) | 144.5 | |||||||||||||||||
| Long-term debt |
— | 375.0 | 4.8 | — | — | 379.8 | ||||||||||||||||||
| Deferred income taxes |
— | 0.8 | — | — | — | 0.8 | ||||||||||||||||||
| Other noncurrent liabilities |
— | 25.3 | 0.1 | — | — | 25.4 | ||||||||||||||||||
| Intercompany accounts |
8.2 | 402.2 | — | 8.9 | (419.3 | ) | — | |||||||||||||||||
|
|
|
|
|
|
|
|
|
|
|
|
|
|||||||||||||
| Total liabilities |
8.2 | 825.5 | 126.4 | 11.5 | (421.1 | ) | 550.5 | |||||||||||||||||
|
|
|
|
|
|
|
|
|
|
|
|
|
|||||||||||||
| Global Brass and Copper Holdings, Inc. stockholders’ equity / (deficit) |
21.6 | 29.8 | 752.5 | 23.1 | (805.4 | ) | 21.6 | |||||||||||||||||
| Noncontrolling interest |
— | — | — | 4.4 | — | 4.4 | ||||||||||||||||||
|
|
|
|
|
|
|
|
|
|
|
|
|
|||||||||||||
| Total equity / (deficit) |
21.6 | 29.8 | 752.5 | 27.5 | (805.4 | ) | 26.0 | |||||||||||||||||
|
|
|
|
|
|
|
|
|
|
|
|
|
|||||||||||||
| Total liabilities and equity / (deficit) |
$ | 29.8 | $ | 855.3 | $ | 878.9 | $ | 39.0 | $ | (1,226.5 | ) | $ | 576.5 | |||||||||||
|
|
|
|
|
|
|
|
|
|
|
|
|
|||||||||||||
121
Table of Contents
Global Brass and Copper Holdings, Inc.
Notes to Consolidated Financial Statements
| (in millions) | Condensed Consolidating Balance Sheet As of December 31, 2013 |
|||||||||||||||||||||||
| Parent | Issuer | Guarantor Subsidiaries |
Non- Guarantor Subsidiaries |
Eliminations | Consolidated | |||||||||||||||||||
| Assets |
||||||||||||||||||||||||
| Current assets: |
||||||||||||||||||||||||
| Cash |
$ | — | $ | 3.3 | $ | 3.9 | $ | 3.6 | $ | — | $ | 10.8 | ||||||||||||
| Accounts receivable, net of allowance |
— | 5.2 | 150.3 | 16.3 | — | 171.8 | ||||||||||||||||||
| Inventories |
— | 0.1 | 172.4 | 18.4 | — | 190.9 | ||||||||||||||||||
| Prepaid expenses and other current assets |
— | 8.9 | 13.1 | 0.2 | — | 22.2 | ||||||||||||||||||
| Deferred income taxes |
— | 32.2 | — | — | — | 32.2 | ||||||||||||||||||
| Income tax receivable |
— | 4.3 | — | — | — | 4.3 | ||||||||||||||||||
|
|
|
|
|
|
|
|
|
|
|
|
|
|||||||||||||
| Total current assets |
— | 54.0 | 339.7 | 38.5 | — | 432.2 | ||||||||||||||||||
| Property, plant and equipment, net |
— | 0.9 | 86.7 | 0.4 | — | 88.0 | ||||||||||||||||||
| Investment in joint venture |
— | — | 2.2 | — | — | 2.2 | ||||||||||||||||||
| Investment in subsidiaries |
0.2 | 646.6 | 21.1 | — | (667.9 | ) | — | |||||||||||||||||
| Intercompany accounts |
— | — | 310.5 | — | (310.5 | ) | — | |||||||||||||||||
| Goodwill |
— | — | 4.4 | — | — | 4.4 | ||||||||||||||||||
| Intangible assets, net |
— | — | 0.7 | — | — | 0.7 | ||||||||||||||||||
| Deferred income taxes |
— | 4.6 | — | — | — | 4.6 | ||||||||||||||||||
| Other noncurrent assets |
— | 15.1 | 1.5 | — | — | 16.6 | ||||||||||||||||||
|
|
|
|
|
|
|
|
|
|
|
|
|
|||||||||||||
| Total assets |
$ | 0.2 | $ | 721.2 | $ | 766.8 | $ | 38.9 | $ | (978.4 | ) | $ | 548.7 | |||||||||||
|
|
|
|
|
|
|
|
|
|
|
|
|
|||||||||||||
| Liabilities and (deficit) / equity |
||||||||||||||||||||||||
| Current liabilities: |
||||||||||||||||||||||||
| Accounts payable |
$ | — | $ | 0.3 | $ | 83.4 | $ | 1.7 | $ | — | $ | 85.4 | ||||||||||||
| Accrued liabilities |
— | 18.7 | 36.7 | 0.7 | — | 56.1 | ||||||||||||||||||
| Accrued interest |
— | 3.3 | — | — | — | 3.3 | ||||||||||||||||||
| Income tax payable |
— | 0.1 | 0.1 | 0.3 | — | 0.5 | ||||||||||||||||||
|
|
|
|
|
|
|
|
|
|
|
|
|
|||||||||||||
| Total current liabilities |
— | 22.4 | 120.2 | 2.7 | — | 145.3 | ||||||||||||||||||
| Long-term debt |
— | 380.5 | — | — | — | 380.5 | ||||||||||||||||||
| Other noncurrent liabilities |
— | 26.3 | — | — | — | 26.3 | ||||||||||||||||||
| Intercompany accounts |
7.6 | 291.8 | — | 11.1 | (310.5 | ) | — | |||||||||||||||||
|
|
|
|
|
|
|
|
|
|
|
|
|
|||||||||||||
| Total liabilities |
7.6 | 721.0 | 120.2 | 13.8 | (310.5 | ) | 552.1 | |||||||||||||||||
|
|
|
|
|
|
|
|
|
|
|
|
|
|||||||||||||
| Global Brass and Copper Holdings, Inc. stockholders’ (deficit) / equity |
(7.4 | ) | 0.2 | 646.6 | 21.1 | (667.9 | ) | (7.4 | ) | |||||||||||||||
| Noncontrolling interest |
— | — | — | 4.0 | — | 4.0 | ||||||||||||||||||
|
|
|
|
|
|
|
|
|
|
|
|
|
|||||||||||||
| Total (deficit) / equity |
(7.4 | ) | 0.2 | 646.6 | 25.1 | (667.9 | ) | (3.4 | ) | |||||||||||||||
|
|
|
|
|
|
|
|
|
|
|
|
|
|||||||||||||
| Total liabilities and (deficit) / equity |
$ | 0.2 | $ | 721.2 | $ | 766.8 | $ | 38.9 | $ | (978.4 | ) | $ | 548.7 | |||||||||||
|
|
|
|
|
|
|
|
|
|
|
|
|
|||||||||||||
122
Table of Contents
Global Brass and Copper Holdings, Inc.
Notes to Consolidated Financial Statements
| (in millions) | Condensed Consolidating Statement of Operations Year Ended December 31, 2014 |
|||||||||||||||||||||||
| Parent | Issuer | Guarantor Subsidiaries |
Non- Guarantor Subsidiaries |
Eliminations | Consolidated | |||||||||||||||||||
| Net sales |
$ | — | $ | — | $ | 1,641.3 | $ | 97.6 | $ | (27.5 | ) | $ | 1,711.4 | |||||||||||
| Cost of sales |
— | 1.0 | 1,483.7 | 89.6 | (27.5 | ) | 1,546.8 | |||||||||||||||||
|
|
|
|
|
|
|
|
|
|
|
|
|
|||||||||||||
| Gross profit (loss) |
— | (1.0 | ) | 157.6 | 8.0 | — | 164.6 | |||||||||||||||||
| Selling, general and administrative expenses |
1.1 | 18.2 | 54.3 | 3.3 | — | 76.9 | ||||||||||||||||||
|
|
|
|
|
|
|
|
|
|
|
|
|
|||||||||||||
| Operating income (loss) |
(1.1 | ) | (19.2 | ) | 103.3 | 4.7 | — | 87.7 | ||||||||||||||||
| Interest expense |
— | 39.3 | 0.3 | — | — | 39.6 | ||||||||||||||||||
| Other (income) expense, net |
— | 0.4 | 0.1 | — | — | 0.5 | ||||||||||||||||||
|
|
|
|
|
|
|
|
|
|
|
|
|
|||||||||||||
| Income (loss) before provision for (benefit from) income taxes and equity income |
(1.1 | ) | (58.9 | ) | 102.9 | 4.7 | — | 47.6 | ||||||||||||||||
| Provision for (benefit from) income taxes |
(0.5 | ) | (20.9 | ) | 36.6 | 1.4 | — | 16.6 | ||||||||||||||||
|
|
|
|
|
|
|
|
|
|
|
|
|
|||||||||||||
| Income (loss) before equity income |
(0.6 | ) | (38.0 | ) | 66.3 | 3.3 | — | 31.0 | ||||||||||||||||
| Equity income, net of tax |
32.3 | 70.3 | 4.0 | — | (105.5 | ) | 1.1 | |||||||||||||||||
|
|
|
|
|
|
|
|
|
|
|
|
|
|||||||||||||
| Net income |
31.7 | 32.3 | 70.3 | 3.3 | (105.5 | ) | 32.1 | |||||||||||||||||
| Less: Net income attributable to noncontrolling interest |
— | — | — | 0.4 | — | 0.4 | ||||||||||||||||||
|
|
|
|
|
|
|
|
|
|
|
|
|
|||||||||||||
| Net income attributable to Global Brass and Copper Holdings, Inc. |
$ | 31.7 | $ | 32.3 | $ | 70.3 | $ | 2.9 | $ | (105.5 | ) | $ | 31.7 | |||||||||||
|
|
|
|
|
|
|
|
|
|
|
|
|
|||||||||||||
123
Table of Contents
Global Brass and Copper Holdings, Inc.
Notes to Consolidated Financial Statements
| Condensed Consolidating Statement of Operations | ||||||||||||||||||||||||
| (in millions) | Year Ended December 31, 2013 | |||||||||||||||||||||||
| Parent | Issuer | Guarantor Subsidiaries |
Non- Guarantor Subsidiaries |
Eliminations | Consolidated | |||||||||||||||||||
| Net sales |
$ | — | $ | — | $ | 1,693.9 | $ | 98.4 | $ | (33.8 | ) | $ | 1,758.5 | |||||||||||
| Cost of sales |
— | 0.1 | 1,519.3 | 90.6 | (33.8 | ) | 1,576.2 | |||||||||||||||||
|
|
|
|
|
|
|
|
|
|
|
|
|
|||||||||||||
| Gross profit (loss) |
— | (0.1 | ) | 174.6 | 7.8 | — | 182.3 | |||||||||||||||||
| Selling, general and administrative expenses |
5.9 | 36.8 | 65.1 | 3.0 | — | 110.8 | ||||||||||||||||||
|
|
|
|
|
|
|
|
|
|
|
|
|
|||||||||||||
| Operating income (loss) |
(5.9 | ) | (36.9 | ) | 109.5 | 4.8 | — | 71.5 | ||||||||||||||||
| Interest expense |
— | 39.8 | — | — | — | 39.8 | ||||||||||||||||||
| Other (income) expense, net |
— | 0.4 | (0.1 | ) | — | — | 0.3 | |||||||||||||||||
|
|
|
|
|
|
|
|
|
|
|
|
|
|||||||||||||
| Income (loss) before provision for (benefit from) income taxes and equity income |
(5.9 | ) | (77.1 | ) | 109.6 | 4.8 | — | 31.4 | ||||||||||||||||
| Provision for (benefit from) income taxes |
(2.3 | ) | (20.9 | ) | 43.9 | 1.5 | — | 22.2 | ||||||||||||||||
|
|
|
|
|
|
|
|
|
|
|
|
|
|||||||||||||
| Income (loss) before equity income |
(3.6 | ) | (56.2 | ) | 65.7 | 3.3 | — | 9.2 | ||||||||||||||||
| Equity income, net of tax |
14.0 | 70.2 | 4.5 | — | (87.2 | ) | 1.5 | |||||||||||||||||
|
|
|
|
|
|
|
|
|
|
|
|
|
|||||||||||||
| Net income |
10.4 | 14.0 | 70.2 | 3.3 | (87.2 | ) | 10.7 | |||||||||||||||||
| Less: Net income attributable to noncontrolling interest |
— | — | — | 0.3 | — | 0.3 | ||||||||||||||||||
|
|
|
|
|
|
|
|
|
|
|
|
|
|||||||||||||
| Net income attributable to Global Brass and Copper Holdings, Inc. |
$ | 10.4 | $ | 14.0 | $ | 70.2 | $ | 3.0 | $ | (87.2 | ) | $ | 10.4 | |||||||||||
|
|
|
|
|
|
|
|
|
|
|
|
|
|||||||||||||
124
Table of Contents
Global Brass and Copper Holdings, Inc.
Notes to Consolidated Financial Statements
| Condensed Consolidating Statement of Operations | ||||||||||||||||||||||||
| (in millions) | Year Ended December 31, 2012 | |||||||||||||||||||||||
| Parent | Issuer | Guarantor Subsidiaries |
Non- Guarantor Subsidiaries |
Eliminations | Consolidated | |||||||||||||||||||
| Net sales |
$ | — | $ | — | $ | 1,584.3 | $ | 93.7 | $ | (27.5 | ) | $ | 1,650.5 | |||||||||||
| Cost of sales |
— | 0.1 | 1,409.6 | 85.1 | (27.5 | ) | 1,467.3 | |||||||||||||||||
|
|
|
|
|
|
|
|
|
|
|
|
|
|||||||||||||
| Gross profit (loss) |
— | (0.1 | ) | 174.7 | 8.6 | — | 183.2 | |||||||||||||||||
| Selling, general and administrative expenses |
1.4 | 30.8 | 57.9 | 2.6 | — | 92.7 | ||||||||||||||||||
|
|
|
|
|
|
|
|
|
|
|
|
|
|||||||||||||
| Operating income (loss) |
(1.4 | ) | (30.9 | ) | 116.8 | 6.0 | — | 90.5 | ||||||||||||||||
| Interest expense |
— | 39.7 | — | — | — | 39.7 | ||||||||||||||||||
| Loss on extinguishment of debt |
— | 19.6 | — | — | — | 19.6 | ||||||||||||||||||
| Other (income) expense, net |
— | 0.7 | (0.1 | ) | (0.5 | ) | — | 0.1 | ||||||||||||||||
|
|
|
|
|
|
|
|
|
|
|
|
|
|||||||||||||
| Income (loss) before provision for (benefit from) income taxes and equity income |
(1.4 | ) | (90.9 | ) | 116.9 | 6.5 | — | 31.1 | ||||||||||||||||
| Provision for (benefit from) income taxes |
(0.5 | ) | (30.1 | ) | 47.8 | 2.0 | — | 19.2 | ||||||||||||||||
|
|
|
|
|
|
|
|
|
|
|
|
|
|||||||||||||
| Income (loss) before equity income |
(0.9 | ) | (60.8 | ) | 69.1 | 4.5 | — | 11.9 | ||||||||||||||||
| Equity income, net of tax |
13.4 | 74.2 | 5.1 | — | (91.7 | ) | 1.0 | |||||||||||||||||
|
|
|
|
|
|
|
|
|
|
|
|
|
|||||||||||||
| Net income |
12.5 | 13.4 | 74.2 | 4.5 | (91.7 | ) | 12.9 | |||||||||||||||||
| Less: Net income attributable to noncontrolling interest |
— | — | — | 0.4 | — | 0.4 | ||||||||||||||||||
|
|
|
|
|
|
|
|
|
|
|
|
|
|||||||||||||
| Net income attributable to Global Brass and Copper Holdings, Inc. |
$ | 12.5 | $ | 13.4 | $ | 74.2 | $ | 4.1 | $ | (91.7 | ) | $ | 12.5 | |||||||||||
|
|
|
|
|
|
|
|
|
|
|
|
|
|||||||||||||
125
Table of Contents
Global Brass and Copper Holdings, Inc.
Notes to Consolidated Financial Statements
| Condensed Consolidating Statement of Comprehensive Income | ||||||||||||||||||||||||
| (in millions) | Year Ended December 31, 2014 | |||||||||||||||||||||||
| Parent | Issuer | Guarantor Subsidiaries |
Non- Guarantor Subsidiaries |
Eliminations | Consolidated | |||||||||||||||||||
| Net income |
$ | 31.7 | $ | 32.3 | $ | 70.3 | $ | 3.3 | $ | (105.5 | ) | $ | 32.1 | |||||||||||
| Foreign currency translation adjustment, net of tax |
(1.1 | ) | (1.1 | ) | (1.7 | ) | (1.2 | ) | 4.0 | (1.1 | ) | |||||||||||||
|
|
|
|
|
|
|
|
|
|
|
|
|
|||||||||||||
| Comprehensive income |
30.6 | 31.2 | 68.6 | 2.1 | (101.5 | ) | 31.0 | |||||||||||||||||
| Less: Comprehensive income attributable to noncontrolling interest |
— | — | — | 0.4 | — | 0.4 | ||||||||||||||||||
|
|
|
|
|
|
|
|
|
|
|
|
|
|||||||||||||
| Comprehensive income attributable to Global Brass and Copper Holdings, Inc. |
$ | 30.6 | $ | 31.2 | $ | 68.6 | $ | 1.7 | $ | (101.5 | ) | $ | 30.6 | |||||||||||
|
|
|
|
|
|
|
|
|
|
|
|
|
|||||||||||||
| Condensed Consolidating Statement of Comprehensive Income | ||||||||||||||||||||||||
| Year Ended December 31, 2013 | ||||||||||||||||||||||||
| Parent | Issuer | Guarantor Subsidiaries |
Non- Guarantor Subsidiaries |
Eliminations | Consolidated | |||||||||||||||||||
| Net income |
$ | 10.4 | $ | 14.0 | $ | 70.2 | $ | 3.3 | $ | (87.2 | ) | $ | 10.7 | |||||||||||
| Foreign currency translation adjustment, net of tax |
(1.0 | ) | (1.0 | ) | (1.6 | ) | 0.3 | 2.4 | (0.9 | ) | ||||||||||||||
|
|
|
|
|
|
|
|
|
|
|
|
|
|||||||||||||
| Comprehensive income |
9.4 | 13.0 | 68.6 | 3.6 | (84.8 | ) | 9.8 | |||||||||||||||||
| Less: Comprehensive income attributable to noncontrolling interest |
— | — | — | 0.4 | — | 0.4 | ||||||||||||||||||
|
|
|
|
|
|
|
|
|
|
|
|
|
|||||||||||||
| Comprehensive income attributable to Global Brass and Copper Holdings, Inc. |
$ | 9.4 | $ | 13.0 | $ | 68.6 | $ | 3.2 | $ | (84.8 | ) | $ | 9.4 | |||||||||||
|
|
|
|
|
|
|
|
|
|
|
|
|
|||||||||||||
| Condensed Consolidating Statement of Comprehensive Income | ||||||||||||||||||||||||
| Year Ended December 31, 2012 | ||||||||||||||||||||||||
| Parent | Issuer | Guarantor Subsidiaries |
Non- Guarantor Subsidiaries |
Eliminations | Consolidated | |||||||||||||||||||
| Net income |
$ | 12.5 | $ | 13.4 | $ | 74.2 | $ | 4.5 | $ | (91.7 | ) | $ | 12.9 | |||||||||||
| Foreign currency translation adjustment, net of tax |
(0.4 | ) | (0.4 | ) | (0.6 | ) | 1.1 | (0.1 | ) | (0.4 | ) | |||||||||||||
|
|
|
|
|
|
|
|
|
|
|
|
|
|||||||||||||
| Comprehensive income |
12.1 | 13.0 | 73.6 | 5.6 | (91.8 | ) | 12.5 | |||||||||||||||||
| Less: Comprehensive income attributable to noncontrolling interest |
— | — | — | 0.4 | — | 0.4 | ||||||||||||||||||
|
|
|
|
|
|
|
|
|
|
|
|
|
|||||||||||||
| Comprehensive income attributable to Global Brass and Copper Holdings, Inc. |
$ | 12.1 | $ | 13.0 | $ | 73.6 | $ | 5.2 | $ | (91.8 | ) | $ | 12.1 | |||||||||||
|
|
|
|
|
|
|
|
|
|
|
|
|
|||||||||||||
126
Table of Contents
Global Brass and Copper Holdings, Inc.
Notes to Consolidated Financial Statements
| (in millions) | Condensed Consolidating Statement of Cash Flows Year Ended December 31, 2014 |
|||||||||||||||||||||||
| Parent | Issuer | Guarantor Subsidiaries |
Non- Guarantor Subsidiaries |
Eliminations | Consolidated | |||||||||||||||||||
| Cash flows from operating activities |
||||||||||||||||||||||||
| Net cash provided by (used in) operating activities |
$ | 3.3 | $ | 43.1 | $ | 22.1 | $ | 0.6 | $ | (4.6 | ) | $ | 64.5 | |||||||||||
| Cash flows from investing activities |
||||||||||||||||||||||||
| Capital expenditures |
— | (0.1 | ) | (23.1 | ) | (0.2 | ) | — | (23.4 | ) | ||||||||||||||
| Proceeds from sale of property, plant and equipment |
— | — | 1.1 | — | — | 1.1 | ||||||||||||||||||
|
|
|
|
|
|
|
|
|
|
|
|
|
|||||||||||||
| Net cash used in investing activities |
— | (0.1 | ) | (22.0 | ) | (0.2 | ) | — | (22.3 | ) | ||||||||||||||
| Cash flows from financing activities |
||||||||||||||||||||||||
| Borrowings on ABL Facility |
— | 248.4 | — | — | — | 248.4 | ||||||||||||||||||
| Payments on ABL Facility |
— | (253.9 | ) | — | — | — | (253.9 | ) | ||||||||||||||||
| Principal payments under capital lease obligation |
— | — | (0.2 | ) | — | — | (0.2 | ) | ||||||||||||||||
| Dividends paid |
(3.2 | ) | (3.2 | ) | — | — | 3.2 | (3.2 | ) | |||||||||||||||
| Proceeds from exercise of stock options |
0.1 | — | — | — | — | 0.1 | ||||||||||||||||||
| Excess tax benefit from share-based compensation |
0.2 | — | — | — | — | 0.2 | ||||||||||||||||||
| Share repurchases |
(0.4 | ) | — | — | — | — | (0.4 | ) | ||||||||||||||||
|
|
|
|
|
|
|
|
|
|
|
|
|
|||||||||||||
| Net cash provided by (used in) financing activities |
(3.3 | ) | (8.7 | ) | (0.2 | ) | — | 3.2 | (9.0 | ) | ||||||||||||||
| Effect of foreign currency exchange rates |
— | — | — | 0.6 | — | 0.6 | ||||||||||||||||||
|
|
|
|
|
|
|
|
|
|
|
|
|
|||||||||||||
| Net increase (decrease) in cash |
— | 34.3 | (0.1 | ) | 1.0 | (1.4 | ) | 33.8 | ||||||||||||||||
| Cash at beginning of period |
— | 3.3 | 3.9 | 3.6 | — | 10.8 | ||||||||||||||||||
|
|
|
|
|
|
|
|
|
|
|
|
|
|||||||||||||
| Cash at end of period |
$ | — | $ | 37.6 | $ | 3.8 | $ | 4.6 | $ | (1.4 | ) | $ | 44.6 | |||||||||||
|
|
|
|
|
|
|
|
|
|
|
|
|
|||||||||||||
127
Table of Contents
Global Brass and Copper Holdings, Inc.
Notes to Consolidated Financial Statements
| (in millions) | Condensed Consolidating Statement of Cash Flows Year Ended December 31, 2013 |
|||||||||||||||||||||||
| Parent | Issuer | Guarantor Subsidiaries |
Non- Guarantor Subsidiaries |
Eliminations | Consolidated | |||||||||||||||||||
| Cash flows from operating activities |
||||||||||||||||||||||||
| Net cash provided by (used in) operating activities |
$ | 0.8 | $ | (0.2 | ) | $ | 29.7 | $ | 0.4 | $ | (2.7 | ) | $ | 28.0 | ||||||||||
| Cash flows from investing activities |
||||||||||||||||||||||||
| Capital expenditures |
— | (0.1 | ) | (26.0 | ) | (0.1 | ) | — | (26.2 | ) | ||||||||||||||
| Payable to / receivable from subsidiaries |
(4.9 | ) | 4.9 | — | — | — | — | |||||||||||||||||
| Proceeds from sale of property, plant and equipment |
— | — | 0.2 | — | — | 0.2 | ||||||||||||||||||
|
|
|
|
|
|
|
|
|
|
|
|
|
|||||||||||||
| Net cash used in investing activities |
(4.9 | ) | 4.8 | (25.8 | ) | (0.1 | ) | — | (26.0 | ) | ||||||||||||||
| Cash flows from financing activities |
||||||||||||||||||||||||
| Borrowings on ABL Facility |
— | 420.8 | — | — | — | 420.8 | ||||||||||||||||||
| Payments on ABL Facility |
— | (429.8 | ) | — | — | — | (429.8 | ) | ||||||||||||||||
| Dividends paid |
(0.8 | ) | (0.8 | ) | — | (2.0 | ) | 2.8 | (0.8 | ) | ||||||||||||||
| Net payments (amounts due) from stockholder |
4.9 | — | — | — | — | 4.9 | ||||||||||||||||||
|
|
|
|
|
|
|
|
|
|
|
|
|
|||||||||||||
| Net cash provided by (used in) financing activities |
4.1 | (9.8 | ) | — | (2.0 | ) | 2.8 | (4.9 | ) | |||||||||||||||
| Effect of foreign currency exchange rates |
— | — | — | (0.2 | ) | — | (0.2 | ) | ||||||||||||||||
|
|
|
|
|
|
|
|
|
|
|
|
|
|||||||||||||
| Net increase (decrease) in cash |
— | (5.2 | ) | 3.9 | (1.9 | ) | 0.1 | (3.1 | ) | |||||||||||||||
| Cash at beginning of period |
— | 8.5 | — | 5.5 | (0.1 | ) | 13.9 | |||||||||||||||||
|
|
|
|
|
|
|
|
|
|
|
|
|
|||||||||||||
| Cash at end of period |
$ | — | $ | 3.3 | $ | 3.9 | $ | 3.6 | $ | — | $ | 10.8 | ||||||||||||
|
|
|
|
|
|
|
|
|
|
|
|
|
|||||||||||||
128
Table of Contents
Global Brass and Copper Holdings, Inc.
Notes to Consolidated Financial Statements
| Condensed Consolidating Statement of Cash Flows | ||||||||||||||||||||||||
| (in millions) | Year Ended December 31, 2012 | |||||||||||||||||||||||
| Parent | Issuer | Guarantor Subsidiaries |
Non- Guarantor Subsidiaries |
Eliminations | Consolidated | |||||||||||||||||||
| Cash flows from operating activities |
||||||||||||||||||||||||
| Net cash provided by (used in) operating activities |
$ | 73.6 | $ | 58.0 | $ | 18.0 | $ | 1.3 | $ | (70.8 | ) | $ | 80.1 | |||||||||||
| Cash flows from investing activities |
||||||||||||||||||||||||
| Capital expenditures |
— | (0.5 | ) | (18.0 | ) | (0.1 | ) | — | (18.6 | ) | ||||||||||||||
| Capital distributions from subsidiary |
86.4 | — | — | — | (86.4 | ) | — | |||||||||||||||||
| Payable to subsidiaries |
2.5 | — | — | — | (2.5 | ) | — | |||||||||||||||||
| Proceeds from sale of property, plant and equipment |
— | — | — | — | — | — | ||||||||||||||||||
|
|
|
|
|
|
|
|
|
|
|
|
|
|||||||||||||
| Net cash used in investing activities |
88.9 | (0.5 | ) | (18.0 | ) | (0.1 | ) | (88.9 | ) | (18.6 | ) | |||||||||||||
| Cash flows from financing activities |
||||||||||||||||||||||||
| Deferred financing fees |
— | (12.9 | ) | — | — | — | (12.9 | ) | ||||||||||||||||
| Proceeds from senior secured notes |
— | 375.0 | — | — | — | 375.0 | ||||||||||||||||||
| Payments on term loan |
— | (310.9 | ) | — | — | — | (310.9 | ) | ||||||||||||||||
| Borrowings on ABL Facility |
— | 204.3 | — | — | — | 204.3 | ||||||||||||||||||
| Payments on ABL Facility |
— | (189.8 | ) | — | — | — | (189.8 | ) | ||||||||||||||||
| Distribution to stockholder |
(160.0 | ) | (160.0 | ) | — | — | 160.0 | (160.0 | ) | |||||||||||||||
| Net payments (amounts due) from stockholder |
(2.5 | ) | — | — | — | — | (2.5 | ) | ||||||||||||||||
|
|
|
|
|
|
|
|
|
|
|
|
|
|||||||||||||
| Net cash provided by (used in) financing activities |
(162.5 | ) | (94.3 | ) | — | — | 160.0 | (96.8 | ) | |||||||||||||||
| Effect of foreign currency exchange rates |
— | — | — | (0.3 | ) | — | (0.3 | ) | ||||||||||||||||
|
|
|
|
|
|
|
|
|
|
|
|
|
|||||||||||||
| Net increase (decrease) in cash |
— | (36.8 | ) | — | 0.9 | 0.3 | (35.6 | ) | ||||||||||||||||
| Cash at beginning of period |
— | 45.3 | — | 4.6 | (0.4 | ) | 49.5 | |||||||||||||||||
|
|
|
|
|
|
|
|
|
|
|
|
|
|||||||||||||
| Cash at end of period |
$ | — | $ | 8.5 | $ | — | $ | 5.5 | $ | (0.1 | ) | $ | 13.9 | |||||||||||
|
|
|
|
|
|
|
|
|
|
|
|
|
|||||||||||||
129
Table of Contents
Global Brass and Copper Holdings, Inc.
Notes to Consolidated Financial Statements
| 22. | Quarterly Financial Information (Unaudited) |
| (in millions, except per share data) | 2014 | |||||||||||||||
| First Quarter |
Second Quarter |
Third Quarter |
Fourth Quarter |
|||||||||||||
| Net sales |
$ | 443.8 | $ | 440.5 | $ | 436.8 | $ | 390.3 | ||||||||
| Gross profit |
43.6 | 44.2 | 44.6 | 32.2 | (A) | |||||||||||
| Income before provision for income taxes and equity income |
14.8 | 14.4 | 15.7 | 2.7 | ||||||||||||
| Net income |
9.8 | 9.1 | 10.3 | 2.9 | ||||||||||||
| Net income attributable to Global Brass and Copper Holdings, Inc. |
9.7 | 9.0 | 10.2 | 2.8 | ||||||||||||
| Net income attributable to Global Brass and Copper Holdings, Inc. per common share: |
||||||||||||||||
| Basic |
0.46 | 0.42 | 0.48 | 0.13 | ||||||||||||
| Diluted |
0.46 | 0.42 | 0.48 | 0.13 | ||||||||||||
| 2013 | ||||||||||||||||
| First Quarter |
Second Quarter |
Third Quarter |
Fourth Quarter |
|||||||||||||
| Net sales |
$ | 445.0 | $ | 461.5 | $ | 439.2 | $ | 412.8 | ||||||||
| Gross profit |
46.9 | 51.7 | 45.3 | 38.4 | (C) | |||||||||||
| Income (loss) before provision for (benefit from) income taxes and equity income |
17.1 | (11.1 | ) (B) | 15.0 | 10.4 | |||||||||||
| Net income (loss) |
11.5 | (17.1 | ) | 10.0 | 6.3 | |||||||||||
| Net income (loss) attributable to Global Brass and Copper Holdings, Inc. |
11.4 | (17.1 | ) | 9.9 | 6.2 | |||||||||||
| Net income (loss) attributable to Global Brass and Copper Holdings, Inc. per common share: |
||||||||||||||||
| Basic |
0.54 | (0.81 | ) | 0.47 | 0.29 | |||||||||||
| Diluted |
0.54 | (0.81 | ) | 0.47 | 0.29 | |||||||||||
| (A) | Includes $0.6 million loss from liquidation of LIFO inventory layers. |
| (B) | Includes $29.3 million profits interest compensation expense. |
| (C) | Includes $2.0 million gain from liquidation of LIFO inventory layers. |
Basic and diluted EPS are computed independently for each of the periods presented. Accordingly, the sum of the quarterly EPS amounts may not equal the total for the year.
As discussed in note 2, the Company has revised its historical consolidated statements of cash flows to correct errors related to the treatment of purchases of property, plant and equipment for which cash had not yet been paid. The Company will revise its unaudited consolidated statements of cash flows to increase “net cash provided by (used in) operating activities” by $3.3 million, $1.8 million, and $3.0 million for the nine months ended September 30, 2014, the six months ended June 30, 2014 and the three months ended March 31, 2014, respectively, with a corresponding increase to “net cash used in investing activities” the next time they are filed. The Company will revise its unaudited consolidated statements of cash flows to increase “net cash provided by (used in) operating activities” by $3.7 million, $3.6 million, and $3.5 million for the nine months ended September 30, 2013, the six months ended June 30, 2013 and the three months ended March 31, 2013, respectively, with a corresponding increase to “net cash used in investing activities” the next time they are filed.
130
Table of Contents
Schedule I—Condensed Financial Information of Registrant
Global Brass and Copper Holdings, Inc. (Parent Company Only)
Condensed Balance Sheets
| As of December 31, | ||||||||
| (In millions, except share and par value data) | 2014 | 2013 | ||||||
| Assets |
||||||||
| Current assets: |
||||||||
| Cash |
$ | — | $ | — | ||||
|
|
|
|
|
|||||
| Total current assets |
— | — | ||||||
| Investment in subsidiary |
29.8 | 0.2 | ||||||
|
|
|
|
|
|||||
| Total assets |
$ | 29.8 | $ | 0.2 | ||||
|
|
|
|
|
|||||
| Liabilities and stockholders’ equity / (deficit) |
||||||||
| Current liabilities: |
||||||||
| Accounts payable |
$ | — | $ | — | ||||
|
|
|
|
|
|||||
| Total current liabilities |
— | — | ||||||
| Payable to subsidiary |
8.2 | 7.6 | ||||||
| Obligations and advances in excess of investment in subsidiary |
— | — | ||||||
|
|
|
|
|
|||||
| Total liabilities |
8.2 | 7.6 | ||||||
|
|
|
|
|
|||||
| Stockholders’ equity / (deficit): |
||||||||
| Common stock—$0.01 par value; 80,000,000 shares authorized; 21,369,407 and 21,251,486 shares issued, respectively |
0.2 | 0.2 | ||||||
| Additional paid-in capital |
32.5 | 30.5 | ||||||
| Accumulated deficit |
(10.1 | ) | (38.6 | ) | ||||
| Treasury stock, at cost; 29,200 and 0 shares, respectively |
(0.4 | ) | — | |||||
| Accumulated other comprehensive (loss) income |
(0.6 | ) | 0.5 | |||||
|
|
|
|
|
|||||
| Total stockholders’ equity / (deficit) |
21.6 | (7.4 | ) | |||||
|
|
|
|
|
|||||
| Total liabilities and stockholders’ equity / (deficit) |
$ | 29.8 | $ | 0.2 | ||||
|
|
|
|
|
|||||
See accompanying notes to condensed financial information of registrant.
131
Table of Contents
Schedule I—Condensed Financial Information of Registrant
Global Brass and Copper Holdings, Inc. (Parent Company Only)
Condensed Statements of Operations
| Year Ended December 31, | ||||||||||||
| (In millions) | 2014 | 2013 | 2012 | |||||||||
| Net sales |
$ | — | $ | — | $ | — | ||||||
| Cost of sales |
— | — | — | |||||||||
|
|
|
|
|
|
|
|||||||
| Gross profit |
— | — | — | |||||||||
| Selling, general and administrative expenses |
1.1 | 5.9 | 1.4 | |||||||||
|
|
|
|
|
|
|
|||||||
| Loss before income taxes and equity income |
(1.1 | ) | (5.9 | ) | (1.4 | ) | ||||||
| Benefit from income taxes |
(0.5 | ) | (2.3 | ) | (0.5 | ) | ||||||
|
|
|
|
|
|
|
|||||||
| Loss before equity income |
(0.6 | ) | (3.6 | ) | (0.9 | ) | ||||||
| Equity income, net of tax |
32.3 | 14.0 | 13.4 | |||||||||
|
|
|
|
|
|
|
|||||||
| Net income |
$ | 31.7 | $ | 10.4 | $ | 12.5 | ||||||
|
|
|
|
|
|
|
|||||||
See accompanying notes to condensed financial information of registrant.
132
Table of Contents
Schedule I—Condensed Financial Information of Registrant
Global Brass and Copper Holdings, Inc. (Parent Company Only)
Condensed Statements of Comprehensive Income
| Year Ended December 31, | ||||||||||||
| (In millions) | 2014 | 2013 | 2012 | |||||||||
| Net income |
$ | 31.7 | $ | 10.4 | $ | 12.5 | ||||||
| Other comprehensive loss: |
||||||||||||
| Foreign currency translation adjustment, net of tax |
(1.1 | ) | (1.0 | ) | (0.4 | ) | ||||||
|
|
|
|
|
|
|
|||||||
| Comprehensive income |
$ | 30.6 | $ | 9.4 | $ | 12.1 | ||||||
|
|
|
|
|
|
|
|||||||
See accompanying notes to condensed financial information of registrant.
133
Table of Contents
Schedule I—Condensed Financial Information of Registrant
Global Brass and Copper Holdings, Inc. (Parent Company Only)
Condensed Statements of Cash Flows
| Year Ended December 31, | ||||||||||||
| (In millions) | 2014 | 2013 | 2012 | |||||||||
| Net cash provided by operating activities |
$ | 3.3 | $ | 0.8 | $ | 73.6 | ||||||
| Cash flows from investing activities |
||||||||||||
| Capital distributions from subsidiary |
— | — | 86.4 | |||||||||
| Payable to subsidiary |
— | (4.9 | ) | 2.5 | ||||||||
|
|
|
|
|
|
|
|||||||
| Net cash (used in) provided by investing activities |
— | (4.9 | ) | 88.9 | ||||||||
|
|
|
|
|
|
|
|||||||
| Cash flows from financing activities |
||||||||||||
| Distributions to stockholder |
— | — | (160.0 | ) | ||||||||
| Dividends paid |
(3.2 | ) | (0.8 | ) | — | |||||||
| Proceeds from exercise of stock options |
0.1 | — | — | |||||||||
| Excess tax benefit from share-based compensation |
0.2 | — | — | |||||||||
| Share repurchases |
(0.4 | ) | — | — | ||||||||
| Net payment (amount due) from stockholder |
— | 4.9 | (2.5 | ) | ||||||||
|
|
|
|
|
|
|
|||||||
| Net cash provided by (used in) financing activities |
(3.3 | ) | 4.1 | (162.5 | ) | |||||||
|
|
|
|
|
|
|
|||||||
| Net increase (decrease) in cash |
— | — | — | |||||||||
| Cash at beginning of year |
— | — | — | |||||||||
|
|
|
|
|
|
|
|||||||
| Cash at end of year |
$ | — | $ | — | $ | — | ||||||
|
|
|
|
|
|
|
|||||||
See accompanying notes to condensed financial information of registrant.
134
Table of Contents
Schedule I—Condensed Financial Information of Registrant
Global Brass and Copper Holdings, Inc. (Parent Company Only)
Notes to Condensed Financial Information of Registrant
December 31, 2014
| 1. | Basis of Presentation |
Global Brass and Copper, Inc. (“GBC”) is a direct subsidiary of Global Brass and Copper Holdings, Inc. (the “Company”). Under the terms of the agreements governing the 9.50% Senior Secured Notes (“Senior Secured Notes”) issued by GBC and the asset-based revolving loan facility entered into by GBC and certain of its subsidiaries (the “ABL Facility”), GBC and substantially all of its existing and future 100%-owned U.S. subsidiaries are significantly restricted from making dividend payments, loans or advances to the Company. These restrictions have resulted in the restricted net assets (as defined in Rule 4-08(e)(3) of Regulation S-X) of the Company’s subsidiaries exceeding 25% of the consolidated net assets of the Company and its subsidiaries. These condensed financial statements should be read in conjunction with the consolidated financial statements and related notes thereto included in this filing.
| 2. | Guarantees |
The Senior Secured Notes and the ABL Facility are guaranteed by the Company and substantially all of GBC’s existing and future 100%-owned U.S. subsidiaries. The Senior Secured Notes, the ABL Facility and the related guarantees are secured by the fixed assets, accounts receivable and inventory of GBC and GBC’s existing and future 100%-owned U.S. subsidiaries.
| 3. | Distributions from Subsidiary |
Cash distributions received by the Company from GBC were $3.2 million, $0.8 million and $160.0 million for the year ended December 31, 2014, 2013 and 2012, respectively. The $3.2 million and $0.8 million received for the years ended December 31, 2014 and 2013, respectively, both represented a return on capital. Of the $160.0 million received during the year ended December 31, 2012, $73.6 million represented a return on capital and $86.4 million represented a return of capital.
135
Table of Contents
Item 9. Changes in and Disagreements With Accountants on Accounting and Financial Disclosure.
None.
Item 9A. Controls and Procedures
Evaluation of Disclosure Controls and Procedures.
Management of a reporting company, with the participation of the principal executive officer and principal financial officer, must periodically evaluate the Company’s “disclosure controls and procedures” as defined in Rules 13a-15(e) and 15d-15(e) under the Securities Exchange Act of 1934, as amended (“Exchange Act”). Disclosure controls and procedures are defined as controls and other procedures of a reporting company that are designed to ensure that information required to be disclosed by the reporting company in its reports filed or submitted to the SEC under the Exchange Act (such as this Form 10-K) is i) recorded, processed, summarized, and reported in the time periods specified in the SEC’s rules and forms, and ii) accumulated and communicated to management, including its principal executive officer and principal financial officer, as appropriate, to allow timely decisions regarding required disclosures.
The Company’s management, with the participation of the Chief Executive Officer and the Chief Financial Officer, carried out an evaluation of the effectiveness of the design and operation of the Company’s disclosure controls and procedures as of December 31, 2014. Management recognizes that any controls and procedures, no matter how well designed and operated, can provide only reasonable assurance of achieving their objectives and management necessarily applies its judgment in evaluating the cost benefit relationship of possible controls and procedures. Based on this evaluation, our Chief Executive Officer and Chief Financial Officer concluded that, as of December 31, 2014, the design and operation of our disclosure controls and procedures were effective to provide reasonable assurance that the desired control objectives were achieved.
Management’s Annual Report on Internal Control Over Financial Reporting
Our management is responsible for establishing and maintaining adequate internal control over financial reporting, as such term is defined in Exchange Act Rules 13a-15(f) and 15d-15(f). Our internal control over financial reporting is designed to provide reasonable assurance regarding the reliability of financial reporting and the preparation of financial statements for external purposes in accordance with generally accepted accounting principles.
Management assessed the design and effectiveness of the Company’s internal control over financial reporting as of December 31, 2014. In making this assessment, management used the criteria set forth by the Committee of Sponsoring Organizations of the Treadway Commission (“COSO”) in Internal Control—Integrated Framework (2013 framework). Based on this evaluation, management concluded that our internal control over financial reporting was effective as of December 31, 2014 based on criteria in Internal Control—Integrated Framework issued by the COSO.
The effectiveness of our internal control over financial reporting as of December 31, 2014 has been audited by PricewaterhouseCoopers LLP, an independent registered public accounting firm, as stated in their report which appears under Item 8 of this Annual Report on Form 10-K.
Remediation Efforts
We had previously reported that our internal control over financial reporting was not effective as of June 30, 2014 and September 30, 2014 due to the existence of a material weakness related to deficiencies in the execution, supervision and review related to the financial statement close process of
136
Table of Contents
our Olin Brass reportable segment. A material weakness is a deficiency, or a combination of deficiencies, in internal control over financial reporting, such that there is a reasonable possibility that a material misstatement of the Company’s annual or interim financial statements will not be prevented or detected on a timely basis.
With the oversight of senior management and our audit committee, during the third quarter of 2014, management took significant steps to remediate the underlying causes of the material weakness. Steps taken include specific training and communication of our established financial statement close processes and procedures to Olin Brass reportable segment management and financial reporting personnel. Additionally, we implemented formal monitoring and supervision of the execution of monthly reportable segment closing processes and procedures by finance personnel in our corporate office to ensure established monthly closing processes at our Olin Brass reportable segment are properly executed on a timely basis and documentation of the execution and completion of the closing procedures is maintained. Further, we hired additional finance personnel in our Olin Brass operating segment to ensure adequate staffing is in place to properly complete monthly closing processes. Management believes that the actions described above have been fully implemented and tested and that the material weakness in our internal control over financial reporting has now been remediated.
For additional information regarding the material weakness identified by management, see our Form 10-Qs for the quarters ended June 30, 2014 and September 30, 2014 filed with the SEC.
Changes in Internal Control Over Financial Reporting
There have been no changes in our internal control over financial reporting (as such term is defined in Rules 13a–15(f) and 15d–15(f) under the Exchange Act) during the quarter ended December 31, 2014 that have materially affected, or are reasonably likely to materially affect, our internal control over financial reporting.
None.
137
Table of Contents
Item 10. Directors, Executive Officers and Corporate Governance.
Management
Information regarding our management and directors, included under the heading “Directors, Executive Officers and Corporate Governance”, is incorporated by reference herein from our 2015 proxy statement to be filed with the SEC not later than 120 days after the end of our fiscal year ended December 31, 2014.
Audit Committee
Information with respect to the Audit Committee and Audit Committee financial experts, included under the heading “Audit Committee” in the Proxy Statement, is incorporated by reference herein from our 2015 proxy statement to be filed with the SEC not later than 120 days after the end of our fiscal year ended December 31, 2014.
Section 16(a) Beneficial Ownership Reporting Compliance
Information regarding Section 16(a) compliance, included under the heading “Section 16(a) Beneficial Ownership Reporting Compliance” in the Proxy Statement, is incorporated by reference herein from our 2015 proxy statement to be filed with the SEC not later than 120 days after the end of our fiscal year ended December 31, 2014.
Codes of Conduct
The Board has adopted a Code of Business Conduct and Ethics, which applies to all employees, including our executive officers (which includes our Principal Executive Officer, our Principal Financial Officer and our Principal Accounting Officer). Our Code of Business Conduct and Ethics can be found on our website at http://www.gbcmetals.com. We will post any amendment to or waiver from the provisions of the Code of Business Conduct and Ethics that applies to the executive officers above on the same website and will provide it to shareholders free of charge upon written request by contacting Global Brass and Copper Holdings, Inc. at 475 N. Martingale Road, Suite 1050, Schaumburg, IL 60173, Attention: Investor Relations.
Item 11. Executive Compensation.
Information with respect to compensation of our executive officers and directors, included under the headings “Compensation Discussion and Analysis,” “Executive Compensation,” “Compensation Committee Interlocks and Insider Participation” and “Compensation Committee Report” in the Proxy Statement, is incorporated by reference herein from our 2015 proxy statement to be filed with the SEC not later than 120 days after the end of our fiscal year ended December 31, 2014.
Item 12. Security Ownership of Certain Beneficial Owners and Management and Related Stockholder Matters.
Information with respect to security ownership of certain beneficial owners and management, included under the heading “Security Ownership of Certain Beneficial Owners, Directors and Management” in the Proxy Statement, is incorporated by reference herein from our 2015 proxy statement to be filed with the SEC not later than 120 days after the end of our fiscal year ended December 31, 2014. Information with respect to securities authorized for issuance under equity compensation plans, included under the heading “Equity Compensation Plan Information Table” in the Proxy Statement, is incorporated by reference herein from our 2015 proxy statement to be filed with the SEC not later than 120 days after the end of our fiscal year ended December 31, 2014.
138
Table of Contents
Item 13. Certain Relationships and Related Transactions, and Director Independence.
Information regarding certain relationships and related transactions, and director independence, included under the heading, “Certain Relationships and Related Party Transactions” in the Proxy Statement, is incorporated by reference herein from our 2015 proxy statement to be filed with the SEC not later than 120 days after the end of our fiscal year ended December 31, 2014.
Item 14. Principal Accounting Fees and Services.
Information with respect to principal accounting fees and services, included under the heading “Fees of Independent Accountants” in the Proxy Statement, is incorporated by reference herein from our 2015 proxy statement to be filed with the SEC not later than 120 days after the end of our fiscal year ended December 31, 2014.
Item 15. Exhibits, Financial Statement Schedules.
| (a) | Financial Statement Schedules |
The following documents are filed as part of this Report:
| 1. | Financial Statements: the report of independent registered public accounting firm, financial statements, notes, and financial statements schedule are contained in a separate section of this Annual Report: |
Index to Consolidated Financial Statements:
| (b) | Other than as stated in the Index to Consolidated Financial Statements in Item 15(a)(1) above with respect to Schedule I, financial statement schedules are omitted because they are not applicable or the required information is presented in the financial statements or related notes. |
| (c) | Exhibits |
| Exhibit |
Description | |
| 2.1* |
Purchase Agreement, between Global Brass and Copper Acquisition Co. and Olin Corporation, dated as of October 15, 2007. | |
| 3.1**** |
Amended and Restated Certificate of Incorporation of Global Brass and Copper Holdings, Inc. | |
| 3.2********* |
Amended and Restated Bylaws of Global Brass and Copper Holdings, Inc. | |
| 4.1**** |
Form of Certificate of Common Stock of Global Brass and Copper Holdings, Inc. | |
| 4.2*** |
Indenture, by and among Global Brass and Copper, Inc., Wells Fargo Bank, National Association, and the Guarantors named therein, dated June 1, 2012. | |
139
Table of Contents
| Exhibit |
Description | |
| 10.1**** |
Global Brass and Copper Holdings, Inc. 2013 Omnibus Equity Incentive Plan. | |
| 10.2** |
Severance Agreement, by and between John J. Wasz and Global Brass and Copper, Inc., dated August 31, 2011. | |
| 10.3****** |
Employment Agreement between Global Brass and Copper, Inc. and John J. Wasz, dated May 8, 2014 | |
| 10.4******* |
Severance Agreement, by and between Robert T. Micchelli and Global Brass and Copper, Inc., dated March 17, 2014. | |
| 10.5* |
Severance Agreement, by and between Devin K. Denner and Global Brass and Copper, Inc., dated July 29, 2011. | |
| 10.6** |
Amendment No. 1 to Severance Agreement, by and between Devin K. Denner and Global Brass and Copper, Inc., dated February 9, 2012. | |
| 10.7 |
Severance Agreement, by and between Scott B. Hamilton and Global Brass and Copper, Inc., dated October 10, 2011. | |
| 10.8 |
Severance Agreement, by and between Kevin W. Bense and Global Brass and Copper, Inc., dated September 20, 2013. | |
| 10.9 |
Severance Agreement, by and between William G. Toler and Global Brass and Copper, Inc., dated September 9, 2013. | |
| 10.10*** |
Amended and Restated Loan and Security Agreement, by and among Global Brass and Copper, Inc., Chase Brass and Copper Company, LLC, GBC Metals, LLC, Chase Brass, LLC, A.J. Oster, LLC, Global Brass and Copper Holdings, Inc., other guarantors, and Wells Fargo Bank, National Association and other lenders, dated August 18, 2010. | |
| 10.11*** |
Amendment No. 1 to Amended and Restated Loan and Security Agreement and Waiver, by and among Global Brass and Copper, Inc., Chase Brass and Copper Company, LLC, GBC Metals, LLC, Chase Brass, LLC, A.J. Oster, LLC, Global Brass and Copper Holdings, Inc., other guarantors, and Wells Fargo Bank, National Association and other lenders, dated May 13, 2011. | |
| 10.12*** |
Amendment No. 2 to Amended and Restated Loan and Security Agreement, by and among Global Brass and Copper, Inc., Chase Brass and Copper Company, LLC, GBC Metals, LLC, Chase Brass, LLC, A.J. Oster, LLC, Global Brass and Copper Holdings, Inc., other guarantors, and Wells Fargo Bank, National Association and other lenders, dated October 26, 2011. | |
| 10.13*** |
Amendment No. 3 to Amended and Restated Loan and Security Agreement, by and among Global Brass and Copper, Inc., Chase Brass and Copper Company, LLC, GBC Metals, LLC, Chase Brass, LLC, A.J. Oster, LLC, Global Brass and Copper Holdings, Inc., other guarantors, and Wells Fargo Bank, National Association and other lenders, dated June 1, 2012. | |
| 10.14*** |
Senior Lien Intercreditor Agreement, among Wells Fargo Bank, National Association, Global Brass and Copper, Inc., Global Brass and Copper Holdings, Inc., and the Subsidiaries of Global Brass and Copper Holdings, Inc. named therein dated as of June 1, 2012. | |
| 10.15*** |
Indenture, by and among Global Brass and Copper, Inc., Wells Fargo Bank, National Association, and the Guarantors named therein, dated June 1, 2012. | |
| 10.16*** |
Exchange and Registration Rights Agreement, by and among Global Brass and Copper, Inc., Goldman, Sachs & Co. and Morgan Stanley & Co. LLC, dated June 1, 2012. | |
| 10.17*** |
Pledge and Security Agreement, between each guarantor party thereto and Wells Fargo Bank, National Association, dated as of June 1, 2012. | |
140
Table of Contents
| Exhibit |
Description | |
| 10.18* |
Indenture of Lease, between The Lares Group II and A.J. Oster Company, dated March 1, 1995, as amended. | |
| 10.19* |
Single Tenant Lease, between La Palmea Flex, L.P. and A.J. Oster West LLC, dated February 1, 2009. | |
| 10.20**** |
Form of Indemnity Agreement. | |
| 10.21***** |
Investor Rights Agreement, dated as of May 29, 2013, by and between Global Brass and Copper Holdings, Inc. and Halkos Holdings, LLC. | |
| ^10.22******** |
Form of Performance Share Award Agreement under the Global Brass and Copper Holdings, Inc. 2013 Omnibus Equity Incentive Plan | |
| ^10.23******** |
Form of Nonqualified Option Award Agreement under the Global Brass and Copper Holdings, Inc. 2013 Omnibus Equity Incentive Plan | |
| ^10.24******** |
Form of Employee Restricted Stock Award Agreement under the Global Brass and Copper Holdings, Inc. 2013 Omnibus Equity Incentive Plan | |
| ^10.25******** |
Form of Director Restricted Stock Award Agreement under the Global Brass and Copper Holdings, Inc. 2013 Omnibus Equity Incentive Plan | |
| 12.1 |
Computation of Ratio of Earnings to Fixed Charges. | |
| 21.1 |
List of Subsidiaries of Global Brass and Copper Holdings, Inc. | |
| 23.1 |
Consent of PricewaterhouseCoopers LLP. | |
| 31.1 |
Certification of Chief Executive Officer under Section 302 of the Sarbanes-Oxley Act of 2002. | |
| 31.2 |
Certification of Chief Financial Officer under Section 302 of the Sarbanes-Oxley Act of 2002. | |
| 32.1† |
Certification of Chief Executive Officer and Chief Financial Officer under Section 906 of the Sarbanes-Oxley Act of 2002. | |
| 101.INS |
XBRL Instance Document. | |
| 101.SCH |
XBRL Taxonomy Extension Schema. | |
| 101.CAL |
XBRL Taxonomy Extension Calculation Linkbase. | |
| 101.DEF |
XBRL Taxonomy Extension Definition Linkbase. | |
| 101.LAB |
XBRL Taxonomy Extension Label Linkbase. | |
| 101.PRE |
XBRL Taxonomy Extension Presentation Linkbase. | |
| * | Filed with Amendment No. 1 to Form S-1 (No. 333-177594) of Global Brass and Copper Holdings, Inc. on January 6, 2012 and incorporated by reference herein. |
| ** | Filed with Amendment No. 2 to Form S-1 (No. 333-177594) of Global Brass and Copper Holdings, Inc. on February 10, 2012 and incorporated by reference herein. |
| *** | Filed with Amendment No. 3 to Form S-1 (No. 333-177594) of Global Brass and Copper Holdings, Inc. on September 18, 2013 and incorporated by reference herein. |
| **** | Filed with Amendment No. 6 to Form S-1 (No. 333-177594) of Global Brass and Copper Holdings, Inc. on May 8, 2013 and incorporated by reference herein. |
| ***** | Filed on Form 8-K of Global Brass and Copper Holdings, Inc. on May 29, 2013 and incorporated by reference herein. |
| ****** | Filed on Form 8-K of Global Brass and Copper Holdings, Inc. on May 14, 2014 and incorporated by reference herein. |
141
Table of Contents
| ******* | Filed on Form 8-K of Global Brass and Copper Holdings, Inc. on March 19, 2014 and incorporated by reference herein. |
| ******** | Filed on Form 10-K of Global Brass and Copper Holdings, Inc. on March 19, 2014 and incorporated by reference herein. |
| ********* | Filed on Form 8-K of Global Brass and Copper Holdings, Inc. on March 10, 2015 and incorporated by reference herein. |
| ^ | Compensatory plan or arrangement |
| † | This certification is deemed not filed for purposes of section 18 of the Securities Exchange Act of 1934, as amended (Exchange Act), or otherwise subject to the liability of that section, nor shall it be deemed incorporated by reference into any filing under the Securities Act of 1933, as amended (Securities Act) or the Exchange Act. |
142
Table of Contents
Pursuant to the requirements of Section 13 or 15(d) of the Securities Exchange Act of 1934, the Registrant has duly caused this report to be signed on its behalf by the undersigned, thereunto duly authorized.
| GLOBAL BRASS AND COPPER HOLDINGS, INC | ||
| By: | /s/ Robert T. Micchelli | |
| Robert T. Micchelli | ||
| Chief Financial Officer | ||
Date: March 16, 2015
Pursuant to the requirements of the Securities Exchange Act of 1934, this Report has been signed below by the following persons on behalf of Global Brass and Copper Holdings, Inc. and in the capacities indicated on March 16, 2015.
| Name |
Position | |||
| /s/ John J. Wasz John J. Wasz |
Chief Executive Officer and President (principal executive officer) and Director | |||
| /s/ Robert T. Micchelli Robert T. Micchelli |
Chief Financial Officer (principal financial officer and principal accounting officer) | |||
| /s/ John H. Walker John H. Walker |
Chairman of the Board | |||
| /s/ Vicki L. Avril Vicki L. Avril |
Director | |||
| /s/ Donald L. Marsh Donald L. Marsh |
Director | |||
| /s/ Bradford T. Ray Bradford T. Ray |
Director | |||
| /s/ Martin E. Welch, III Martin E. Welch, III |
Director | |||
| /s/ Ronald C. Whitaker Ronald C. Whitaker |
Director | |||
143