Attached files
| file | filename |
|---|---|
| EXCEL - IDEA: XBRL DOCUMENT - FedNat Holding Co | Financial_Report.xls |
| EX-32.1 - EXHIBIT 32.1 - FedNat Holding Co | ex32_1.htm |
| EX-21.1 - EXHIBIT 21.1 - FedNat Holding Co | ex21_1.htm |
| EX-32.2 - EXHIBIT 32.2 - FedNat Holding Co | ex32_2.htm |
| EX-31.1 - EXHIBIT 31.1 - FedNat Holding Co | ex31_1.htm |
| EX-23.1 - EXHIBIT 23.1 - FedNat Holding Co | ex23_1.htm |
| EX-31.2 - EXHIBIT 31.2 - FedNat Holding Co | ex31_2.htm |
UNITED STATES SECURITIES AND EXCHANGE COMMISSION
WASHINGTON, D.C. 20549
FORM 10-K
☒ Annual Report under Section 13 or 15(d) of the Securities Act of 1934
For the fiscal year ended December 31, 2014
or
☐ Transition Report under Section 13 or 15(d) of the Securities Exchange Act of 1934
For the transition period of _____________to_______________
Commission file number: 0-2500111
Federated National Holding Company
(Exact name of registrant as specified in its Charter)
|
Florida
|
65-0248866
|
|
|
(State or other jurisdiction of incorporation or organization)
|
(I.R.S. Employer Identification No)
|
|
14050 N.W. 14th Street, Suite 180, Sunrise, Florida 33323
|
|
(Address of principal executive offices) (Zip Code)
|
Registrant’s telephone number, including area code 800-293-2532
Securities registered pursuant to Section 12(b) of the Exchange Act:
|
Title of Each Class
|
Name of Each Exchange on Which Registered
|
|
Common Stock, par value $0.01 per share
|
NASDAQ Global Market
|
Securities registered pursuant to Section 12(g) of the Exchange Act:
None
Indicate by check mark if the Registrant is a well-known seasoned issuer, as defined in Rule 405 of the Securities Act. Yes ☐ No ☒
Indicate by check mark if the Registrant is not required to file reports pursuant to Section 13 or Section 15(d) of the Act. Yes ☐ No ☒
Indicate by check mark whether the Registrant (1) has filed all reports required to be filed by Section 13 or 15(d) of the Securities Exchange Act of 1934 during the preceding 12 months (or for such shorter period that the Registrant was required to file such reports) and (2) has been subject to such filing requirements for the past 90 days. Yes☒ No ☐
Indicate by check mark whether the registrant has electronically submitted and posted on its corporate Web site, if any, every Interactive Data File required to be submitted and posted pursuant to Rule 405 of Regulation S-T (§232.405 of this chapter) during the preceding 12 months (or for such shorter period that the Registrant was required to submit and post such files). Yes ☒ No ☐
Indicate by check mark if disclosure of delinquent filers pursuant to Item 405 of Regulation S-K is not contained herein, and will not be contained, to the best of registrant's knowledge, in definitive proxy or information statements incorporated by reference in Part III of this Form 10-K or any amendment to this Form 10-K. ☐
Indicate by check mark whether the registrant is a large accelerated filer, an accelerated filer, a non-accelerated filer, or a smaller reporting company. See the definition of “large accelerated filer,” “accelerated filer,” and “smaller reporting company” in Rule 12b-2 of the Exchange Act.
|
Large accelerated filer ☐
|
Accelerated filer ☒
|
Non-accelerated filer ☐
|
Smaller reporting company ☐
|
Indicate by check mark whether the Registrant is a shell company (as defined in Rule 12b-2 of the Act). Yes☐ No ☒
The aggregate market value of the Registrant’s common stock held by non-affiliates was $265,407,621 on June 30, 2014, computed on the basis of the closing sale price of the Registrant’s common stock on that date.
As of March 10, 2015, the total number of common shares outstanding of Registrant's common stock was 14,155,256.
DOCUMENTS INCORPORATED BY REFERENCE
None.
Federated National Holding Company
|
PART I
|
|
3
|
|
ITEM 1
|
3
|
|
|
ITEM 1A
|
23
|
|
|
ITEM 1B
|
35
|
|
|
ITEM 2
|
35
|
|
|
ITEM 3
|
35
|
|
|
ITEM 4
|
35
|
|
|
PART II
|
|
36
|
|
ITEM 5
|
36
|
|
|
ITEM 6
|
39
|
|
|
ITEM 7
|
41
|
|
|
ITEM 7A
|
70
|
|
|
ITEM 8
|
71
|
|
|
ITEM 9
|
114
|
|
|
ITEM 9A
|
114
|
|
|
ITEM 9B
|
115
|
|
|
PART III
|
|
115
|
|
ITEM 10
|
115
|
|
|
ITEM 11
|
119
|
|
|
ITEM 12
|
126
|
|
|
ITEM 13
|
127
|
|
|
ITEM 14
|
127
|
|
|
PART IV
|
|
129
|
|
ITEM 15
|
129
|
|
| SIGNATURES |
133
|
Federated National Holding Company
CAUTIONARY NOTE ABOUT FORWARD-LOOKING STATEMENTS
This Annual Report on Form 10-K contains forward-looking statements within the meaning of Section 27A of the Securities Act of 1933, as amended, or the Securities Act, and Section 21E of the Securities Exchange Act of 1934, as amended, or the Exchange Act. These statements are therefore entitled to the protection of the safe harbor provisions of these laws. These statements may be identified by the use of forward-looking terminology such as “anticipate,” “believe,” “budget,” “contemplate,” “continue,” “could,” “envision,” “estimate,” “expect,” “forecast,” “guidance,” “indicate,” “intend,” “may,” “might,” “outlook,” “plan,” “possibly,” “potential,” “predict,” “probably,” “pro-forma,” “project,” “seek,” “should,” “target,” “will,” “would,” “will be,” “will continue” or the negative thereof or other variations thereon or comparable terminology. We have based these forward-looking statements on our current expectations, assumptions, estimates and projections. While we believe these expectations, assumptions, estimates and projections are reasonable, such forward-looking statements are only predictions and involve a number of risks and uncertainties, many of which are beyond our control. These and other important factors may cause our actual results, performance or achievements to differ materially from any future results, performance or achievements expressed or implied by these forward-looking statements. Management cautions that the forward-looking statements contained in this Annual Report on Form 10-K are not guarantees of future performance, and we cannot assume that such statements will be realized or the forward-looking events and circumstances will occur. Factors that might cause such a difference include, without limitation, the risks and uncertainties discussed under “Risk Factors” in this Annual Form 10-K, and discussed from time to time in our reports filed with the SEC.
Given these risks and uncertainties, you are cautioned not to place undue reliance on such forward-looking statements. The forward-looking statements included or incorporated by reference into this Annual Form 10-K are made only as of the date hereof. We do not undertake and specifically decline any obligation to update any such statements or to publicly announce the results of any revisions to any such statements to reflect future events or developments.
GENERAL
Federated National Holding Company (“FNHC”, “Company”, “we”, “us”), formerly known as 21st Century Holding Company, is an insurance holding company that controls substantially all steps in the insurance underwriting, distribution and claims processes through our subsidiaries and our contractual relationships with our independent agents and general agents. We changed our name on September 11, 2012, pursuant to approval received at our annual shareholders’ meeting, from 21st Century Holding Company so that our parent company and other subsidiary companies’ names are consistent with our primary insurance subsidiary and the name under which we have been writing insurance for more than 23 years.
We are authorized to underwrite, and/or place through our wholly owned subsidiaries, homeowners’ multi-peril (“homeowners”), commercial general liability, federal flood, personal auto and various other lines of insurance in Florida and various other states. We market and distribute our own and third-party insurers’ products and our other services through a network of independent agents.
Our insurance subsidiary is Federated National Insurance Company (“FNIC”). FNIC is licensed as an admitted carrier in Florida. An admitted carrier is an insurance company that has received a license from the state department of insurance giving the company the authority to write specific lines of insurance in that state. These companies are also bound by rate and form regulations, and are strictly regulated to protect policyholders from a variety of illegal and unethical practices, including fraud. Admitted carriers are also required to financially contribute to the state guarantee fund, which is used to pay for losses if an insurance carrier becomes insolvent or unable to pay the losses due their policyholders. Through contractual relationships with a network of approximately 3,600 independent agents, of which approximately 2,300 actively sell and service our products, FNIC is authorized to underwrite homeowners’, commercial general liability, fire, allied lines and personal and commercial automobile insurance in Florida. FNIC is licensed as an admitted carrier in Alabama, Louisiana, Georgia and Texas and underwrites commercial general liability insurance in those states. FNIC also underwrites homeowners’ insurance in Louisiana and Alabama, commencing in October 2014. Additionally, we underwrite personal automobile insurance in Georgia and Texas.
FNIC is licensed as a non-admitted carrier in Missouri, Nevada and South Carolina and can underwrite commercial general liability insurance in all of these states. Currently, we do not have any operations in these states. A non-admitted carrier, sometimes referred to as an “excess and surplus lines” carrier, is permitted to do business in a state and, although it is strictly regulated to protect policyholders from a variety of illegal and unethical practices, including fraud, non-admitted carriers are subject to considerably less regulation with respect to policy rates and forms. Non-admitted carriers are not required to financially contribute to and benefit from the state guarantee fund, which is used to pay for losses if an insurance carrier becomes insolvent or unable to pay the losses due their policyholders.
Federated National Holding Company
We internally process claims made by our insureds through our wholly owned claims adjusting company, Federated National Adjusting, Inc. (“FNA”). Our agents have no authority to settle claims or otherwise exercise control over the claims process. Furthermore, we believe that the retention of independent adjusters, in addition to the employment of salaried claims personnel, results in reduced ultimate loss payments, lower Loss and loss adjustment expenses (“LAE”) and improved customer service for our claimants and policyholders. We also employ an in-house litigation management team to cost effectively manage claims-related litigation and to monitor our claims handling practices for efficiency and regulatory compliance.
During 2014, the Florida Office of Insurance Regulation (“Florida OIR”) approved an application to allow the claims administration operations of FNA to be assumed by FedNat Underwriters, Inc. (“FNU”), formerly known as Federated National Underwriters Inc., a wholly owned subsidiary of the Company. Under the amended managing general agency agreement between FNU and FNIC, FNU will provide the same claims administration services under the same fee structure. The combination of these services in FNU had no effect on consolidated net income.
FNU acts as FNIC’s exclusive managing general agent in Florida and is also licensed as a managing general agent in the States of Alabama, Georgia, Louisiana, Mississippi, Nevada, South Carolina and Texas. FNU has contracted with other unaffiliated insurance companies to sell personal umbrella through FNU’s existing network of agents.
FNU earns commissions and fees for providing policy administration, marketing, accounting and analytical services, and for participating in the negotiation of reinsurance contracts. FNU earns a per policy fee which ranges from $25 to $55 and a commission fee from its affiliate, FNIC, which totaled 4% during 2014. The Florida OIR periodically reviews our managing general agent’s fee structure to ensure that it is neither excessive nor inadequate to operate.
The homeowner policy provides FNU the right to cancel any policy within a period of 90 days from the policy's inception with 25 days’ notice, or after 90 days from policy inception with 95 days’ notice, even if the risk falls within our underwriting criteria.
Although we are authorized to underwrite the various lines described above, our business is primarily underwriting homeowners’ policies. During 2014, 91.4%, 3.3%, 2.0% and 3.3% of the premiums we underwrote were for homeowners’, commercial general liability, federal flood, and personal automobile insurance, respectively. During 2014, $39.6 million or 11.0% of the $344.9 million of homeowners’ premiums we underwrote were produced under an agency agreement with Ivantage Select Agency, Inc. (“ISA”), an affiliate of Allstate Insurance Company, that grants Allstate agents the authority to offer certain FNU products. The $39.6 million of homeowners’ premiums produced under this agreement with ISA represents 31.0% of the total increase in the sale of homeowners’ policies during 2014, compared with 2013. This network of agents began writing for FNIC in March 2013. During 2013, 89.6%, 4.3%, 2.6% and 3.5% of the premiums we underwrote were for homeowners’, commercial general liability, federal flood, and personal automobile insurance, respectively.
During the years ended December 31, 2014, 2013 or 2012, we did not experience any weather-related catastrophic events such as the hurricanes that occurred in Florida during 2005 and 2004. We are not able to predict how hurricanes or other insurable events will affect our future results of operations and liquidity. Losses and LAE are affected by a number of factors, many of which are partially or entirely beyond our control, including the following.
| · | the nature and severity of the loss; |
| · | weather-related patterns; |
| · | the availability, cost and terms of reinsurance; |
| · | underlying settlement costs, including medical and legal costs; |
| · | legal and political factors such as legislative initiatives and public opinion; |
| · | macroeconomic issues. |
Our business, results of operations and financial condition are subject to fluctuations due to a variety of factors. Abnormally high severity or frequency of claims in any period could have a material adverse effect on us. When our estimated liabilities for unpaid losses and LAE are less than the actuarially determined amounts, we increase the expense in the current period. Conversely, when our estimated liabilities for unpaid losses and LAE are greater than the actuarially determined amounts, we decrease the expense in the current period.
We previously entered into a Coexistence Agreement effective August 30, 2013 (the “Coexistence Agreement”) with Federated Mutual Insurance Company (“Federated Mutual”) pursuant to which, among other things, we may continue to use “Federated” until at least August 30, 2020, after which time we have agreed to either cease using “Federated” in commerce or otherwise adopt and use trade names that are not confusingly similar to Federated Mutual’s trademarks. We continue to develop our brand under the “FedNat” name, which is the name by which agents generally know us.
Federated National Holding Company
Our goal in our reinsurance strategy is to equalize the liquidity requirements imposed by most severe insurable events and by all other insurable events we manage in the normal course of business. Please see “Reinsurance Agreements” under “Item 1. Business” for a more detailed description of our reinsurance agreements and strategy.
Our executive offices are located at 14050 N.W. 14th Street, Suite 180, Sunrise, Florida 33323 and our telephone number is (800) 293-2532.
Our internet web site is www.FedNat.com for policy holders, agents and investors. Our annual reports on Form 10-K, quarterly reports on Form 10-Q, current reports on Form 8-K and amendments to such reports are available, free of charge, through our website as soon as reasonably practicable after we electronically file or furnish such material to the Securities and Exchange Commission (“SEC”). Further, a copy of this annual report on Form 10-K is located at the SEC’s Public Reference Room at 100 F Street, NE, Washington, D.C. 20549. Information on the operation of the Public Reference Room can be obtained by calling the SEC at 1-800-SEC-0330. The SEC maintains an internet site that contains reports, proxy and information statements and other information regarding our filings at www.sec.gov.
RECENT DEVELOPMENTS
We sold 2,358,975 shares of our common stock in an August 6, 2014 capital raise offering, which represented approximately 17.0% of our outstanding shares of common stock on that date after giving effect to this offering.
BUSINESS STRATEGY
We expect that in 2015 we will capitalize on our operational efficiencies and business practices through:
| · | improved property analytical qualities such as a broader geographical dispersion of risks throughout the state of Florida and avoiding risks that do not yield an underwriting profit; |
| · | continued territorial expansion of our homeowners’, commercial general liability and private passenger automobile insurance products into additional states; |
| · | employing our business practices developed and used in Florida in our expansion to other selected states; |
| · | maintaining a commitment to provide high quality customer service to our agents and insureds; |
| · | expansion of our marketing efforts by retaining key personnel and implementing direct marketing technologies; |
| · | offering attractive incentives to our agents to place a high volume of quality business with our companies; |
| · | offering our employees continuing education classes appropriate to the respective discipline employed within this organization; |
| · | assumption of existing risks from other carriers; and |
| · | additional strategies that may include possible mergers, acquisitions and joint ventures or dispositions of assets, and development of procedures to improve claims history and mitigate losses from claims. |
We expect that in 2015 these strategies have poised us to accelerate the 2014 results trajectory in 2015 and beyond. There can be no assurances, however, that any of the foregoing strategies will be developed or successfully implemented or, if implemented, that they will positively affect our results of operations.
INSURANCE OPERATIONS AND RELATED SERVICES
Overview of Premium Growth
Gross premiums written increased $133.8 million, or 55.0%, to $377.2 million for 2014, compared with $243.4 million for 2013. Florida homeowners’ represents 94% and Texas private passenger automobile represents the remaining 6% of the increased premium volume. We believe that our growth in 2014 reflects management’s efforts over several years. Our success today reflects our goal to be an agent-friendly carrier that provides exceptional service. We have invested in our agent relationships and our staff, have created easy-to-use systems for the agent, and increased our relevance to the agents’ operations by providing insurance products that meet their market needs.
Federated National Holding Company
Our homeowner business contributed $126.6 million or 95.0% of the increased gross written premiums during the year ended December 31, 2014. This increase was the result of:
| · | policyholders continuing to renew their FNIC homeowners’ policy, |
| · | a “flight to quality” in the market by agents who seek quality carriers to place their business, and |
| · | supporting a marketing team dedicated to promoting the quality and quantity of products and services that we offer. |
During 2014, approximately 88% of our policyholders renewed their Florida homeowner policies. We believe that high retention rate reflects the confidence that the policyholder and his agent have in our financial stability and strength and in our commitment to adjusting claims quickly and fairly.
Overview of Insurance Lines of Business
The following tables set forth the amount and percentages of our consolidated gross premiums written, premiums ceded to reinsurers and net premiums written by line of business for the periods indicated.
|
Years Ended December 31,
|
||||||||||||||||||||||||
|
2014
|
2013
|
2012
|
||||||||||||||||||||||
|
Premium
|
Percent
|
Premium
|
Percent
|
Premium
|
Percent
|
|||||||||||||||||||
|
(Dollars in Thousands)
|
||||||||||||||||||||||||
|
Gross written premiums:
|
||||||||||||||||||||||||
|
Automobile
|
$
|
12,377
|
3.3
|
%
|
$
|
8,449
|
3.5
|
%
|
$
|
2,996
|
2.5
|
%
|
||||||||||||
|
Federal Flood
|
7,408
|
2.0
|
%
|
6,213
|
2.6
|
%
|
5,293
|
4.4
|
%
|
|||||||||||||||
|
Homeowners'
|
344,939
|
91.4
|
%
|
218,350
|
89.6
|
%
|
101,832
|
85.3
|
%
|
|||||||||||||||
|
Commercial General Liability
|
12,432
|
3.3
|
%
|
10,362
|
4.3
|
%
|
9,338
|
7.8
|
%
|
|||||||||||||||
|
Total gross written premiums
|
$
|
377,156
|
100.0
|
%
|
$
|
243,374
|
100.0
|
%
|
$
|
119,459
|
100.0
|
%
|
||||||||||||
|
Ceded premiums:
|
||||||||||||||||||||||||
|
Automobile
|
$
|
9,300
|
4.6
|
%
|
$
|
6,337
|
7.7
|
%
|
$
|
2,021
|
4.0
|
%
|
||||||||||||
|
Federal Flood
|
7,408
|
3.7
|
%
|
6,213
|
7.5
|
%
|
5,293
|
10.4
|
%
|
|||||||||||||||
|
Homeowners'
|
184,766
|
91.4
|
%
|
69,721
|
84.3
|
%
|
43,331
|
84.7
|
%
|
|||||||||||||||
|
Commercial General Liability
|
524
|
0.3
|
%
|
438
|
0.5
|
%
|
440
|
0.9
|
%
|
|||||||||||||||
|
Total ceded premiums
|
$
|
201,998
|
100.0
|
%
|
$
|
82,709
|
100.0
|
%
|
$
|
51,085
|
100.0
|
%
|
||||||||||||
|
Net written premiums
|
||||||||||||||||||||||||
|
Automobile
|
$
|
3,077
|
1.8
|
%
|
$
|
2,112
|
1.3
|
%
|
$
|
975
|
1.4
|
%
|
||||||||||||
|
Federal Flood
|
-
|
0.0
|
%
|
-
|
0.0
|
%
|
-
|
0.0
|
%
|
|||||||||||||||
|
Homeowners'
|
160,173
|
91.4
|
%
|
148,629
|
92.5
|
%
|
58,501
|
85.6
|
%
|
|||||||||||||||
|
Commercial General Liability
|
11,908
|
6.8
|
%
|
9,924
|
6.2
|
%
|
8,898
|
13.0
|
%
|
|||||||||||||||
|
Total net written premiums
|
$
|
175,158
|
100.0
|
%
|
$
|
160,665
|
100.0
|
%
|
$
|
68,374
|
100.0
|
%
|
||||||||||||
Federated National Holding Company
Homeowners’ Property and Casualty Insurance
FNIC underwrites homeowners’ insurance in Florida, Alabama and Louisiana. Homeowners’ insurance generally protects an owner of real and personal property against covered causes of loss to that property. The number of Alabama and Louisiana homeowner policies in-force totaled approximately 150 and 4,685 at December 31, 2014, respectively. The table that follows reflects the number of Florida homeowner policies in-force by county and reflects our concentrations of risk from catastrophic events.
| In-Force Policy Count | ||||||||||||||||||||||||
| Years Ended December 31, | ||||||||||||||||||||||||
|
2014
|
2013
|
2012
|
||||||||||||||||||||||
|
County
|
Amount
|
Percentage
|
Amount
|
Percentage
|
Amount
|
Percentage
|
||||||||||||||||||
|
Palm Beach
|
20,990
|
11.4
|
%
|
13,874
|
11.9
|
%
|
7,270
|
11.7
|
%
|
|||||||||||||||
|
Brevard
|
13,993
|
7.7
|
%
|
8,947
|
7.7
|
%
|
4,508
|
7.4
|
%
|
|||||||||||||||
|
Collier
|
12,723
|
7.0
|
%
|
7,420
|
6.4
|
%
|
3,422
|
5.6
|
%
|
|||||||||||||||
|
Lee
|
9,958
|
5.5
|
%
|
6,870
|
5.9
|
%
|
5,175
|
8.5
|
%
|
|||||||||||||||
|
Hillsborough
|
8,743
|
4.8
|
%
|
6,350
|
5.5
|
%
|
2,682
|
4.4
|
%
|
|||||||||||||||
|
Pinellas
|
12,303
|
6.7
|
%
|
6,139
|
5.3
|
%
|
4,034
|
6.6
|
%
|
|||||||||||||||
|
Broward
|
11,854
|
6.5
|
%
|
5,498
|
4.7
|
%
|
3,700
|
6.1
|
%
|
|||||||||||||||
|
Saint Lucie
|
6,542
|
3.6
|
%
|
4,957
|
4.3
|
%
|
3,151
|
5.2
|
%
|
|||||||||||||||
|
Indian River
|
6,291
|
3.4
|
%
|
4,704
|
4.0
|
%
|
2,436
|
4.0
|
%
|
|||||||||||||||
|
Okaloosa
|
5,432
|
3.0
|
%
|
4,668
|
4.0
|
%
|
1,966
|
3.2
|
%
|
|||||||||||||||
|
Martin
|
6,102
|
3.3
|
%
|
4,444
|
3.8
|
%
|
2,052
|
3.4
|
%
|
|||||||||||||||
|
Orange
|
7,573
|
4.1
|
%
|
4,083
|
3.5
|
%
|
1,654
|
2.7
|
%
|
|||||||||||||||
|
Sarasota
|
7,889
|
4.3
|
%
|
3,936
|
3.4
|
%
|
2,759
|
4.5
|
%
|
|||||||||||||||
|
Charlotte
|
4,900
|
2.7
|
%
|
3,129
|
2.7
|
%
|
2,059
|
3.4
|
%
|
|||||||||||||||
|
Escambia
|
3,877
|
2.1
|
%
|
3,038
|
2.6
|
%
|
1,227
|
2.0
|
%
|
|||||||||||||||
|
Walton
|
3,403
|
1.9
|
%
|
3,021
|
2.6
|
%
|
1,210
|
2.0
|
%
|
|||||||||||||||
|
Santa Rosa
|
3,581
|
2.0
|
%
|
2,939
|
2.5
|
%
|
1,305
|
2.1
|
%
|
|||||||||||||||
|
Bay
|
3,763
|
2.1
|
%
|
2,785
|
2.4
|
%
|
792
|
1.3
|
%
|
|||||||||||||||
|
Duval
|
3,396
|
1.9
|
%
|
2,249
|
1.9
|
%
|
911
|
1.5
|
%
|
|||||||||||||||
|
Volusia
|
3,637
|
2.0
|
%
|
1,990
|
1.7
|
%
|
881
|
1.4
|
%
|
|||||||||||||||
|
Miami-Dade
|
2,420
|
1.3
|
%
|
1,883
|
1.6
|
%
|
1,616
|
2.6
|
%
|
|||||||||||||||
|
Manatee
|
4,435
|
2.4
|
%
|
1,859
|
1.6
|
%
|
1,560
|
2.6
|
%
|
|||||||||||||||
|
Seminole
|
2,786
|
1.5
|
%
|
1,665
|
1.4
|
%
|
788
|
1.3
|
%
|
|||||||||||||||
|
Saint Johns
|
2,687
|
1.5
|
%
|
1,639
|
1.4
|
%
|
547
|
0.9
|
%
|
|||||||||||||||
|
Flagler
|
1,744
|
1.0
|
%
|
1,267
|
1.1
|
%
|
543
|
0.9
|
%
|
|||||||||||||||
|
All others
|
11,535
|
6.3
|
%
|
7,047
|
6.1
|
%
|
2,854
|
4.7
|
%
|
|||||||||||||||
|
Total
|
182,557
|
100.0
|
%
|
116,401
|
100.0
|
%
|
61,102
|
100.0
|
%
|
|||||||||||||||
Our homeowner insurance products provide maximum dwelling coverage in the amount of approximately $3.8 million, with the aggregate maximum policy limit being approximately $6.2 million. We currently offer dwelling coverage “A” up to $4.0 million with an aggregate total insured value of $6.5 million. We continually subject these limits to review; during 2014 coverage “A” was increased by $1.0 million and total insured value increased by $1.5 million. The approximate average premium on the policies currently in-force is $1,840, as compared with $1,857 for 2013. The typical deductible is either $2,500 or $1,000 for non-hurricane-related claims and generally 2% of the coverage amount for the structure for hurricane-related claims.
Premium rates charged to our homeowner insurance policyholders are continually evaluated to assure that they meet the expectation that they are actuarially sound and produce a reasonable level of profit (neither excessive nor inadequate). Premium rates are regulated and approved by the Florida OIR. In 2014 our voluntary program rate study resulted in a rate decrease of 3% on our voluntary property book of homeowners’ business. In 2013 our voluntary program rate indications did not indicate the need for adjustment. In 2012 we were approved for a 4.8% and 0.9% rate increase on our voluntary property book of homeowners’ business.
Federated National Holding Company
Similarly, for the policies we assumed from Citizens Property Insurance Corporation (“Citizens”) in 2009, we received approval for a 14.8% increase in 2013 and a 14.1% rate increase in 2012. There was no rate change in 2014. Our voluntary program was 99.0%, 97.7%, and 90.0% of the total homeowner program, for the years ending December 31, 2014, 2013 and 2012, respectively.
For a further discussion regarding Homeowners’ Property and Casualty Insurance, see “Recent Developments”, above.
Commercial General Liability
We underwrite commercial general liability insurance for approximately 380 classes of artisan (excluding home-builders and developers) and mercantile trades (such as owners, landlords and tenants). The limits of liability range from $100,000 per occurrence with a $200,000 policy aggregate to $1.0 million per occurrence with a $2.0 million policy aggregate. We continually subject these limits to review, though there were no changes during 2014. We market the commercial general liability insurance products through independent agents and a limited number of general agencies unaffiliated with the Company. The average annual premium on policies currently in-force during 2014 is approximately $796, as compared with $773 in 2013.
The following table sets forth the amounts and percentages of our gross premiums written in connection with our commercial general liability program by state.
| Years Ended December 31, | ||||||||||||||||||||||||
|
2014
|
2013
|
2012
|
||||||||||||||||||||||
|
Amount
|
Percentage
|
Amount
|
Percentage
|
Amount
|
Percentage
|
|||||||||||||||||||
| (Dollars in Thousands) | ||||||||||||||||||||||||
|
State
|
||||||||||||||||||||||||
|
Florida
|
$
|
11,401
|
91.71
|
%
|
$
|
9,572
|
92.37
|
%
|
$
|
8,639
|
92.52
|
%
|
||||||||||||
|
Louisiana
|
98
|
0.79
|
%
|
150
|
1.45
|
%
|
217
|
2.32
|
%
|
|||||||||||||||
|
Texas
|
756
|
6.08
|
%
|
547
|
5.28
|
%
|
426
|
4.56
|
%
|
|||||||||||||||
|
Other
|
177
|
1.42
|
%
|
93
|
0.90
|
%
|
56
|
0.60
|
%
|
|||||||||||||||
|
Total
|
$
|
12,432
|
100.00
|
%
|
$
|
10,362
|
100.00
|
%
|
$
|
9,338
|
100.00
|
%
|
||||||||||||
Personal Automobile
Personal automobile insurance markets can be divided into two categories, standard automobile and nonstandard automobile. Standard personal automobile insurance is principally provided to insureds who present an average risk profile in terms of driving record, vehicle type and other factors. Nonstandard personal automobile insurance is principally provided to insureds that are unable to obtain standard insurance coverage because of their driving record, age, vehicle type or other factors, including market conditions. The average nonstandard personal automobile insurance policy currently in-force is approximately $1,056 for a six-month policy in Florida. The average nonstandard personal automobile insurance policy currently in-force in Texas is approximately $61 for a one-month policy, $197 for a three-month policy, $372 for a six-month policy and $1,116 for a twelve-month policy. During the third quarter of 2014 we began to issue nonstandard personal automobile insurance policies in Georgia. The average nonstandard personal automobile insurance policy currently in-force in Georgia is approximately $466 for a six-month policy.
The maximum exposures for the nonstandard policy in Florida are $10,000 per individual, $20,000 per accident for bodily injury, $10,000 per accident for property damage, and predominantly $50,000 for comprehensive and collision. The maximum exposures for the nonstandard policy in Texas are $30,000 per individual, $60,000 per accident for bodily injury, $30,000 per accident for property damage, and predominantly $50,000 for comprehensive and collision. For our nonstandard personal automobile insurance in Georgia, the maximum exposures are $25,000 per individual, $50,000 per accident for bodily injury, $25,000 per accident for property damage, and predominantly $50,000 for comprehensive and collision.
Flood
FNIC writes flood insurance through the National Flood Insurance Program (“NFIP”) on a direct and ceded basis. We write the policy for the NFIP, which assumes 100% of the flood risk while we retain a commission for our service. The average flood policy premium is approximately $504 with limits up to $250,000. Commissions in connection with this program totaled $0.5 million, $0.4 million and $0.3 million in 2014, 2013 and 2012, respectively.
Federated National Holding Company
Managing General Agent Services
FNU, a wholly owned subsidiary of the Company, acts as FNIC’s exclusive managing general agent in Florida and is also licensed as a managing general agent in the States of Alabama, Georgia, Louisiana, Mississippi, Nevada, South Carolina and Texas. FNU has also contracted with other unaffiliated insurance companies to sell personal umbrella policies through FNU’s existing network of agents.
FNU earns commissions and fees for providing policy administration, marketing, accounting and analytical services, and for participating in the negotiation of reinsurance contracts. FNU earns a per policy fee which ranges from $25 to $55 and a commission fee from its affiliate, FNIC, which totaled 4% during 2014. The Florida OIR periodically reviews our managing general agent’s fee structure to ensure that it is neither excessive nor inadequate to operate.
Claims Adjusting
We internally process claims made by our insureds through our wholly owned claims adjusting company, FNA. Our agents have no authority to settle claims or otherwise exercise control over the claims process. Furthermore, we believe that the retention of independent adjusters, in addition to the employment of salaried claims personnel, results in reduced ultimate loss payments, lower LAE and improved customer service for our claimants and policyholders. We also employ an in-house litigation management team to cost effectively manage claims-related litigation and to monitor our claims handling practices for efficiency and regulatory compliance.
During 2014, the Florida OIR approved an application to allow the claims administration operations of FNA to be assumed by FNU. Under the amended managing general agency agreement between FNU and FNIC, FNU will provide the same claims administration services under the same fee structure. The combination of these services in FNU had no effect on consolidated net income.
Direct Billing
The Company anticipates continued use of the direct bill feature associated with our homeowners’ and commercial general liability programs. Direct billing is when the insurance company accepts from the insured, as a receivable, a promise to pay the premium, as opposed to requiring payment of the full amount of the policy. The advantage of direct billing a policyholder by the insurance company is that we are not reliant on a credit facility, but remain able to charge and collect interest from the policyholder. Underwriting criteria are designed with down payment requirements and monthly payments that create policyholder equity in the insurance policy. The equity in the policy is collateral for the extension of credit to the insured.
Through our monitoring systems, we track delinquent payments and, in accordance with the terms of the extension of credit, cancel if payment is not made. If any excess premium remains after cancellation of the policy and deduction of applicable penalties, this excess is refunded to the policyholder. The direct bill program enables us to closely manage our risk while providing credit to our insureds.
Independent Insurance Agency
Insure-Link, Inc. (“Insure-Link”) is our independent insurance agency. The insurance agency markets direct to the public to provide a variety of insurance products and services to individual clients, as well as business clients, by offering a full line of insurance products including, but not limited to, homeowners’, flood, personal and commercial automobile, commercial general liability and workers’ compensation insurance through their agency appointments with over thirty different carriers.
MARKETING AND DISTRIBUTION
We are focusing our marketing efforts on continuing to expand our distribution network while maintaining our commitment to long-term relationships. We market our products and services throughout Florida and in other states by establishing relationships with additional independent agents and general agents. There can be no assurance, however, that we will be able to obtain the required regulatory approvals to offer additional insurance products or expand into other states.
Our independent agents and general agents have the authority to sell and bind insurance coverage in accordance with procedures established by FNU. FNU reviews all coverage bound by the agents promptly and generally accepts all coverage that falls within stated underwriting criteria. For all policies issued, FNU also has the right, within a period that varies by state between 60 days and 120 days from a policy's inception, to cancel any policy, upon an advanced notice provided in accordance with statutory specific guidelines, even if the risk falls within our underwriting criteria.
Federated National Holding Company
We believe that our integrated computer systems, which allow for rapid automated premium quotation and policy issuance by our agents, is a key element in providing quality service to both our agents and insureds for various lines of our business.
We believe that the management of our distribution system now centers on our ability to capture and maintain relevant data by producing agents. We believe that information management of agent production, coupled with loss experience, will enable us to maximize profitability.
REINSURANCE AGREEMENTS
Financing risk generally involves a combination of risk retention and risk transfer techniques. “Retention”, similar to a deductible, involves financing losses by funds internally generated. “Transfer” involves the existence of a contractual arrangement designed to shift financial responsibility to another party in exchange for premium. Secondary to the primary risk-transfer agreements, we use reinsurance agreements to transfer a portion of the risks insured under our policies to other companies through the purchase of reinsurance. We utilize reinsurance to reduce exposure to catastrophic and non-catastrophic risks and to help manage the cost of capital. Reinsurance techniques are designed to lessen earnings volatility, improve shareholder return, and to support the required statutory surplus requirements. We also use reinsurance to realize an arbitrage of premium rates, benefit from the availability of our reinsurers’ expertise, and benefit from the management of a profitable portfolio of insureds by way of enhanced analytical capacities. Our primary property line that is subject to catastrophic reinsurance is Homeowners’ Multiple Peril. FNIC cedes these risks to domestic and foreign reinsurance participants from Bermuda and Europe as well as to the Florida Hurricane Catastrophe Fund (“FHCF”).
Quota share reinsurance is a pro rata agreement among the primary insurer and one or more reinsurers where each party shares a fixed and predetermined percentage of the program’s premiums and losses. Excess of loss risk transfer agreements involve the transfer of premium in exchange for reimbursement for claims, if they occur, as a result of specific events such as severe catastrophic weather. For quota share and excess of loss reinsurance, coverage is generally afforded based on meeting predetermined risk characteristics. In contrast, facultative reinsurance is negotiated between the primary insurer and the reinsurer(s) on a case-by-case basis with no obligation on either part to cede or assume share the risk.
Generally, there are three separate kinds of reinsurance structures – quota share, excess of loss, and facultative, each considered either proportional or non-proportional. Our reinsurance structures are maintained to protect our insurance subsidiary against the severity of losses on individual claims or unusually serious occurrences in which the frequency and or the severity of claims produce an aggregate extraordinary loss from catastrophic events. In addition to reinsurance agreements, we also from time to time enter into retro-cessionary reinsurance agreements; each designed to shift financial responsibility based on predefined conditions.
Although reinsurance does not discharge us from our primary obligation to pay for losses insured under the policies we issue, reinsurance does make the assuming reinsurer liable to the insurance subsidiary for the reinsured portion of the risk. A credit risk exposure exists with respect to ceded losses to the extent that any reinsurer is unable or unwilling to meet the obligations assumed under the reinsurance contracts. The collectability of reinsurance is subject to the solvency of the reinsurers, interpretation of contract language and other factors. A reinsurer's insolvency or inability to make payments under the terms of a reinsurance contract could have a material adverse effect on our results of operations and financial condition. Our reinsurance structure has significant risks, including the fact that the FHCF may not be able to raise sufficient money to pay its claims or impair its ability to pay its claims in a timely manner. This could result in significant financial, legal and operational challenges to all property and casualty companies associated with FHCF, including our company.
The availability and costs associated with the acquisition of reinsurance will vary year to year. These fluctuations, which can be significant, are not subject to our control and may limit our ability to purchase adequate coverage. For example, FHCF continues to restrict its reinsurance capacity and is expected to continue constricting capacity for future seasons. This gradual restriction is requiring us to replace that capacity with private market reinsurance. Our reinsurance program is subject to approval by the Florida OIR and review by Demotech, Inc. (“Demotech”). The recovery of increased reinsurance costs through rate action is not immediate and cannot be presumed and is subject to Florida OIR approval.
Federated National Holding Company
For the 2014–2015 hurricane season, the excess of loss and FHCF treaties insured the property lines for approximately $1.49 billion of aggregate catastrophic losses and LAE with a maximum single event coverage totaling approximately $1.01 billion, with the Company retaining the first $11.20 million in Florida and $3.0 million in Louisiana for losses and LAE from each event. Florida risks represent 98.5%, or $1.46 billion of the $1.49 billion of total aggregate catastrophic losses and LAE. The reinsurance program includes coverage purchased from the private market, which affords optional reinstatement premium protection that provides coverage beyond the first event, along with any remaining coverage from the FHCF. The FHCF only affords coverage for losses sustained in Florida. Coverage afforded by the FHCF totals approximately $546.3 million, or 37.4% of Florida’s $1.46 billion of aggregate catastrophic losses and LAE. The FHCF affords coverage for the entire season, subject to maximum payouts, without regard to any particular insurable event.
The estimated cost to the Company for the excess of loss reinsurance products for the 2014–2015 hurricane season, inclusive of approximately $40.20 million payable to the FHCF and the prepaid automatic premium reinstatement protection, is approximately $117.0 million.
Included in this year’s program is a 30% quota share reinsurance treaty for the Company’s in-force new and renewal homeowners’ insurance program in the State of Florida. This two-year quota share reinsurance treaty provides 30% of $200 million of aggregate catastrophe coverage per year with maximum single event coverage of 30% of $100 million per year. The approximate cost of this quota share is projected to be $6.7 million per year, net of ceding commissions, and it is included in the $117.0 million amount referenced above. The quota share treaty contains commutation provisions for the Company to share profits based on loss experience during the term of the treaty.
The 30% quota share reinsurance treaty described above contains profit sharing provisions that will adjust over its two-year term depending on the Company’s loss experience from catastrophic and non-catastrophic events during the term. The frequency and severity of catastrophic events, coupled with non-catastrophic loss experience, will determine the ultimate profit share, if any. In accordance with Generally Accepted Accounting Principles (“GAAP”), the Company will initially recognize an asset and liability and the resultant net income or loss. For example, deferred quota-share profit sharing totaled $10.5 million as of December 31, 2014. The deferred quota-share profit sharing was originally recorded at $14.0 million at the program’s July 1, 2014 inception and will continue to amortize over the life of the program. Subsequently, the Company will adjust the value of the asset and liability based on information available at the time of valuation. Upward and downward adjustments to the asset’s value will affect the Company’s results of operations by increasing or decreasing net income in the period of the adjustment.
Federated National Holding Company
The 2014-2015 private reinsurance companies and their respective A.M. Best Company (“A.M. Best”) and Standard and Poor’s (“S&P”) ratings are listed in the table as follows.
|
Reinsurer
|
A.M. Best Rating
|
|
S&P Rating
|
|||||
|
|
|
|||||||
|
UNITED STATES
|
|
|||||||
|
American Agricultural Insurance Company
|
A-
|
NR
|
||||||
|
American Standard Insurance Company of Wisconsin
|
A
|
NR
|
||||||
|
AIG (National Union Fire Insurance Company of Pittsburgh, PA)
|
A
|
A+
|
||||||
|
Everest Reinsurance Company
|
A+
|
A+
|
||||||
|
Odyssey Reinsurance Company
|
A
|
A-
|
||||||
|
QBE Reinsurance Corporation
|
A
|
A+
|
||||||
|
RLI Insurance Company
|
A+
|
A+
|
||||||
|
Transatlantic Reinsurance Company
|
A
|
A+
|
||||||
|
|
|
|||||||
|
BERMUDA
|
|
|||||||
|
ACE Tempest Reinsurance Limited
|
A++
|
AA-
|
||||||
|
Allied World Assurance Company, Limited
|
A
|
A
|
||||||
|
Arch Reinsurance Limited
|
A+
|
A+
|
||||||
|
Argo Reinsurance Limited
|
A
|
NR
|
||||||
|
Ariel Reinsurance Bermuda Ltd for and on Behalf of Ariel Syndicate 1910 (ARE)
|
A-
|
A+
|
||||||
|
Aspen Bermuda Limited
|
A
|
A
|
||||||
|
AXIS Specialty Limited
|
A+
|
A+
|
||||||
|
BGS Services (Bermuda) Limited/Lloyds Syndicate 2987
|
A
|
A+
|
||||||
|
DaVinci Reinsurance Ltd
|
A
|
AA-
|
||||||
|
Endurance Specialty Insurance Limited
|
A
|
A
|
||||||
|
Hamilton Re, Limited
|
A-
|
NR
|
||||||
|
Hiscox Insurance Company (Bermuda) Limited
|
A
|
NR
|
||||||
|
Partner Reinsurance Company Limited
|
A+
|
A+
|
||||||
|
Platinum Underwriters Bermuda Limited
|
A
|
A-
|
||||||
|
Renaissance Reinsurance, Limited
|
A+
|
AA-
|
||||||
|
Securis Re III Limited Bermuda
|
NR
|
*
|
**
|
NR
|
||||
|
Securis Re IV Limited Bermuda
|
NR
|
*
|
**
|
NR
|
||||
|
Tokio Millennium Re AG, Bermuda Branch
|
A++
|
AA-
|
||||||
|
XL RE Limited
|
A
|
A+
|
||||||
|
|
|
|||||||
|
UNITED KINGDOM
|
|
|||||||
|
A.F. Beazley Syndicate No. 623 (AFB)
|
A
|
A+
|
||||||
|
A.F. Beazley Syndicate No. 2623 (AFB)
|
A
|
A+
|
||||||
|
Amlin Syndicate No. 2001 (AML)
|
A
|
A+
|
||||||
|
Antares Syndicate No. 1274 (AUL)
|
A
|
A+
|
||||||
|
Ariel Syndicate No. 1910 (ARE)
|
A
|
A+
|
||||||
|
ARK Syndicate No. 4020 (ARK)
|
A
|
A+
|
||||||
|
Ascot Syndicate No. 1414 (ASC)
|
A
|
A+
|
||||||
|
Barbican Syndication No. 1955 (BAR)
|
A
|
A+
|
||||||
|
Canopius Syndicate No. 958 (CNP)
|
A
|
A+
|
||||||
|
Canopius Syndicate No. 4444 (CNP)
|
A
|
A+
|
||||||
|
Cathederal Syndicate No. 2010 (MMX)
|
A
|
A+
|
||||||
|
Chaucer Syndicate No. 1084 (CSL)
|
A
|
A+
|
||||||
|
Dale Underwriting Syndicate No. 1729 (DUW)
|
A
|
A+
|
||||||
|
Faraday Syndicate No. 435 (FDY)
|
A
|
A+
|
||||||
|
Hiscox Syndicate No. 0033 (HIS)
|
A
|
A+
|
||||||
|
Kiln Syndicate No. 510 (KLN)
|
A
|
A+
|
||||||
|
Liberty Syndicates Services Limited, Paris for and on behalf of Lloyd's Syndicate No. 4472 (LIB)
|
A
|
A+
|
||||||
|
MAP Underwriting Syndicate No. 2791 (MAP)
|
A
|
A+
|
||||||
|
MAP Underwriting Syndicate No. 2791 (Parallel) (MAP)
|
A
|
A+
|
||||||
|
Novae Syndicate No. 2007 (NVA)
|
A
|
A+
|
||||||
|
S.J.O, Catlin & Others No. 2003 (SJC)
|
A
|
A+
|
||||||
|
|
|
|||||||
|
EUROPE
|
|
|||||||
|
Amlin AG, Switzerland, Bermuda Branch
|
A
|
A
|
||||||
|
Hannover Rueck SE (obo Pillar Capital Management)
|
NR
|
*
|
**
|
NR
|
||||
|
Lansforsakringar Sak Forsakringsaktiebolag (publ)
|
NR
|
A
|
||||||
|
SCOR Global P&C SE, Paris, Zurich Branch
|
A
|
A
|
||||||
|
|
|
|||||||
|
ASIA
|
|
|||||||
|
China Reinsurance (Group) Corporation
|
A
|
NR
|
||||||
|
Qatar Reinsurance Company LLC
|
A
|
A
|
||||||
|
|
|
|||||||
|
* Reinstatement Premium Protection Program Participants
|
||||||||
|
|
|
|||||||
|
** Participant will fund a trust agreement for their exposure with cash and U.S. Government obligations of American institutions at fair market value.
|
||||||||
Federated National Holding Company
For the 2013–2014 hurricane season, the excess of loss and FHCF treaties insured the property lines for approximately $562.7 million of aggregate catastrophic losses and LAE with a maximum single event coverage totaling approximately $420.4 million, with the Company retaining the first $7.0 million of losses and LAE for each event. The reinsurance program includes coverage purchased from the private market, which affords optional reinstatement premium protection that provides coverage beyond the first event, along with any remaining coverage from the FHCF. Coverage afforded by the FHCF totals approximately $278.1 million, or 49.4% of the $562.7 million of aggregate catastrophic losses and LAE. The FHCF affords coverage for the entire season, subject to maximum payouts, without regard to any particular insurable event.
The estimated cost to the Company for the excess of loss reinsurance products for the 2013-2014 hurricane season, inclusive of approximately $21.7 million payable to the FHCF and the prepaid automatic premium reinstatement protection, is approximately $67.9 million.
The 2013-2014 private reinsurance companies and their respective A.M. Best and S&P ratings are listed in the table as follows.
|
Reinsurer
|
A.M. Best Rating
|
|
S&P Rating
|
|||||
|
|
||||||||
|
UNITED STATES
|
|
|||||||
|
American Agricultural Insurance Company
|
A-
|
NR
|
||||||
|
Everest Reinsurance Company
|
A+
|
A+
|
||||||
|
Houston Casualty Company, UK Branch
|
A
|
A+
|
||||||
|
Odyssey Reinsurance Company
|
A
|
A-
|
||||||
|
|
||||||||
|
BERMUDA
|
|
|||||||
|
ACE Tempest Reinsurance Limited
|
A+
|
AA-
|
||||||
|
Allied World Assurance Company Limited, Bermuda
|
A
|
A
|
||||||
|
Arch Reinsurance Limited
|
A+
|
A+
|
||||||
|
Argo Reinsurance Limited
|
A
|
NR
|
||||||
|
Ariel Reinsurance Bermuda Ltd for and on Behalf of Ariel Syndicate 1910 (ARE)
|
A-
|
NR
|
||||||
|
DaVinci Reinsurance Ltd
|
A
|
A+
|
||||||
|
Endurance Specialty Insurance Limited
|
A
|
A
|
||||||
|
JC Re Ltd. (aka Pillar Capital and fka Juniperus & Actua Re Ltd.)
|
NR
|
*
|
**
|
NR
|
||||
|
Partner Reinsurance Company Limited
|
A+
|
A+
|
||||||
|
Platinum Underwriters Bermuda Limited
|
A
|
A-
|
||||||
|
Renaissance Reinsurance Ltd
|
A+
|
AA-
|
||||||
|
S.A.C. Re, Ltd.
|
A-
|
NR
|
||||||
|
XL Re Limited
|
A
|
A
|
||||||
|
|
||||||||
|
UNITED KINGDOM
|
|
|||||||
|
A.F. Beazley Syndicate No. 623 (AFB)
|
A
|
A+
|
||||||
|
A.F. Beazley Syndicate No. 2623 (AFB)
|
A
|
A+
|
||||||
|
Amlin Syndicate No. 2001 (AML)
|
A
|
A+
|
||||||
|
Ariel Syndicate No. 1910 (ARE)
|
A
|
A+
|
||||||
|
ARK Syndicate No. 3902 (NOA)
|
A
|
A+
|
||||||
|
Ascot Syndicate No. 1414 (ASC)
|
A
|
A+
|
||||||
|
Barbican Syndication No. 1955 (BAR)
|
A
|
A+
|
||||||
|
Canopius Syndicate No. 958 (CNP)
|
A
|
A+
|
||||||
|
Canopius Syndicate No. 4444 (CNP)
|
A
|
A+
|
||||||
|
Cathederal Syndicate No. 2010 (MMX)
|
A
|
A+
|
||||||
|
Kiln Syndicate No. 510 (KLN)
|
A
|
A+
|
||||||
|
Liberty Syndicates Services Limited, Paris for and on behalf of Lloyd's Syndicate No. 4472 (LIB)
|
NR
|
A+
|
||||||
|
MAP Underwriting Syndicate No. 2791 (MAP)
|
A
|
A+
|
||||||
|
MAP Underwriting Syndicate No. 2791 (Parallel) (MAP)
|
A
|
A+
|
||||||
|
Novae Syndicate No. 2007 (NVA)
|
A
|
A+
|
||||||
|
Pembroke Syndicate No. 4000 (PEM)
|
A
|
A+
|
||||||
|
Tokio Marine Kiln Syndicate No. 1880 (TMK)
|
A
|
A+
|
||||||
|
|
||||||||
|
EUROPE
|
|
|||||||
|
Amlin Bermuda (Branch of Amlin AG)
|
A
|
A
|
||||||
|
SCOR Global P&C SE
|
A
|
A
|
||||||
|
|
||||||||
|
* Reinstatement Premium Protection Program Participants
|
||||||||
|
|
|
|||||||
|
** Participant will fund a trust agreement for their exposure with cash and U.S. Government obligations of American institutions at fair market value.
|
||||||||
|
|
|
|
|
|
|
|
||
Federated National Holding Company
Annually, the cost and amounts of reinsurance are based on management's analysis of FNIC's exposure to catastrophic risk as of June 30 and estimated to September 30. Our data is then subjected to actual exposure level analysis as of September 30. This analysis of our exposure level in relation to the total exposures to the FHCF and excess of loss treaties may produce changes in limits and reinsurance premiums as a result of the reconciliation of estimated to actual exposure level. The September 30, 2014 change to total insured value was an increase of $5.4 billion or 8.2% and the change to reinsurance premiums was an increase of $0.4 million. The September 30, 2013 change to total insured value was an increase of $8.7 billion or 25.3% and the change to reinsurance premiums was an increase of $8.3 million or 13.3%.These adjustments are amortized over the remaining underlying policy term.
To date, we have made no claims asserted against our reinsurers in connection with the 2014–2015 and 2013–2014 excess of loss and FHCF treaties.
The quota share retrocessionaire reinsurance agreements require FNIC to securitize credit, regulatory and business risk. Fully funded trust agreements totaled $4.9 million as of December 31, 2014 and 2013.
We are selective in choosing reinsurers and consider numerous factors, the most important of which are the financial stability of the reinsurer, its history of responding to claims and its overall reputation. In an effort to minimize our exposure to the insolvency of a reinsurer, we evaluate the acceptability and review the financial condition of the reinsurer at least annually.
FNIC entered into Commutation, Settlement and Release Agreements (“CSR”) effective December 31, 2014. The underlying reinsurance treaties covering Florida private passenger automobiles were for a term from November 1, 2001 to December 31, 2003. As of December 31, 2014, there were no unearned premiums, direct loss or loss adjustment expense reserves and the ceded reinsurance recoverable totaled approximately $12,000 was received in January 2015. The agreement to commute had no effect on current year operations. Under the terms of the CSR, each party agreed to fully and finally release and commute all rights, obligations and liabilities, both known and unknown, for both parties pertaining to these agreements.
LIABILITY FOR UNPAID LOSSES AND LAE
We are directly liable for losses and LAE payments under the terms of the insurance policies that we write. In many cases, there may be a time lag between the occurrence and reporting of an insured loss and our payment of that loss. As required by insurance regulations and accounting rules, we reflect the liability for the ultimate payment of all incurred losses and LAE by establishing a liability for those unpaid losses and LAE for both reported and unreported claims, which represent estimates of future amounts needed to pay claims and related expenses.
When a claim, other than personal automobile, involving a probable loss is reported, we establish a liability for the estimated amount of our ultimate losses and LAE payments. The estimate of the amount of the ultimate loss is based upon such factors as the type of loss, jurisdiction of the occurrence, knowledge of the circumstances surrounding the claim, severity of injury or damage, potential for ultimate exposure, estimate of liability on the part of the insured, past experience with similar claims and the applicable policy provisions.
All newly reported claims received with respect to personal automobile policies are set up with an initial average liability. The average liability for these claims is determined by dividing the number of reported claims into the total amount paid during the same period. If a claim is open more than 45 days, that open case liability is evaluated and the liability is adjusted upward or downward according to the facts and circumstances of that particular claim.
In addition, management provides for a liability on an aggregate basis to provide for incurred but not yet reported (“IBNR”). We utilize independent actuaries to help establish liability for unpaid losses and LAE. We do not discount the liability for unpaid losses and LAE for financial statement purposes.
The estimates of the liability for unpaid losses and LAE are subject to the effect of trends in claims severity and frequency and are continually reviewed. As part of this process, we review historical data and consider various factors, including known and anticipated legal developments, inflation and economic conditions. As experience develops and other data become available, these estimates are revised, as required, resulting in increases or decreases to the existing liability for unpaid losses and LAE. Adjustments are reflected in results of operations in the period in which they are made and the liabilities may deviate substantially from prior estimates.
Federated National Holding Company
Among our classes of insurance, the automobile and homeowners’ liability claims historically tend to have longer time lapses between the occurrence of the event, the reporting of the claim and the final settlement, than do automobile physical damage and homeowners’ property claims. These liability claims often involve parties filing suit and therefore may result in litigation. By comparison, property damage claims tend to be reported in a relatively shorter period of time and settled in a shorter time frame with less occurrence of litigation.
There can be no assurance that our liability for unpaid losses and LAE will be adequate to cover actual losses. If our liability for unpaid losses and LAE proves to be inadequate, we will be required to increase the liability with a corresponding reduction in our net income in the period in which the deficiency is identified. Future loss experience substantially in excess of established liability for unpaid losses and LAE could have a material adverse effect on our business, results of operations and financial condition.
The following table sets forth a reconciliation of beginning and ending liability for unpaid losses and LAE as shown in our consolidated financial statements for the periods indicated.
|
Period Ending
|
||||||||||||
|
December 31, 2014
|
December 31, 2013
|
December 31, 2012
|
||||||||||
|
(Dollars in Thousands)
|
||||||||||||
|
Balance at January 1
|
$
|
61,016
|
$
|
49,908
|
$
|
59,983
|
||||||
|
Less reinsurance recoverables
|
(2,742
|
)
|
(3,503
|
)
|
(2,088
|
)
|
||||||
|
Net balance at January 1
|
$
|
58,274
|
$
|
46,405
|
$
|
57,895
|
||||||
|
Incurred related to
|
||||||||||||
|
Current year
|
$
|
79,932
|
$
|
56,209
|
$
|
31,636
|
||||||
|
Prior years
|
1,104
|
201
|
(1,427
|
)
|
||||||||
|
Total incurred
|
$
|
81,036
|
$
|
56,410
|
$
|
30,209
|
||||||
|
Paid related to
|
||||||||||||
|
Current year
|
$
|
42,391
|
$
|
22,695
|
$
|
15,892
|
||||||
|
Prior years
|
31,123
|
21,846
|
25,807
|
|||||||||
|
Total paid
|
$
|
73,514
|
$
|
44,541
|
$
|
41,699
|
||||||
|
Net balance at period end
|
$
|
65,796
|
$
|
58,274
|
$
|
46,405
|
||||||
|
Plus reinsurance recoverables
|
12,534
|
2,742
|
3,503
|
|||||||||
|
Balance as of period end
|
$
|
78,330
|
$
|
61,016
|
$
|
49,908
|
||||||
As shown above, and as a result of review of liability for losses and LAE, which includes a re-evaluation of the adequacy of reserve levels for prior year’s claims, we increased the liability for losses and LAE for claims occurring in prior years by $1.1 million and $0.2 million for the years ended December 31, 2014 and 2013 and decreased the liability for losses and LAE for claims occurring in prior years by $1.4 million for the year ended December 31, 2012.
The liability for losses and LAE increased by $18.4 million and $1.4 million for our homeowners’ and commercial general liability lines, and decreased by $2.5 million for our automobile line, respectively, during 2014. These changes are due to management's continued efforts to manage the claims life cycle more efficiently. Additionally, our underwriting processes are designed to quickly gather the true primary and secondary risk characteristics and provide a profitable quote to the policyholder. This approach helps to reduce the overall frequency and severity of the loss portfolio.
Based upon discussions with our independent actuarial consultants and their statements of opinion on losses and LAE, we believe that the liability for unpaid losses and LAE is currently adequate to cover all claims and related expenses which may arise from incidents reported and IBNR as of December 31, 2014. There can be no assurance concerning future adjustments of reserves, positive or negative, for claims incurred through December 31, 2014.
Federated National Holding Company
The following table presents total unpaid losses and LAE, net, and total reinsurance recoverable due from our catastrophic reinsurers as shown in our consolidated financial statements.
|
As of December 31,
|
||||||||
|
2014
|
2013
|
|||||||
|
(Dollars in Thousands)
|
||||||||
|
Catastrophe Excess of Loss (various participants) and FHCF
|
||||||||
|
Reinsurance recoverable on paid losses and LAE
|
$
|
5
|
$
|
29
|
||||
|
Unpaid losses and LAE
|
3
|
25
|
||||||
|
$
|
8
|
$
|
54
|
|||||
|
Amounts due from (to) reinsurers consisted of amounts related to:
|
||||||||
|
Unpaid losses and LAE
|
$
|
3
|
$
|
25
|
||||
|
Reinsurance recoverable on paid LAE
|
5
|
29
|
||||||
|
$
|
8
|
$
|
54
|
|||||
Federated National Holding Company
The following table presents the liability for unpaid losses and LAE for the years ended December 31, 2005 through 2014 and does not distinguish between catastrophic and non-catastrophic events. The top line of the table shows the estimated liability for unpaid losses and LAE at the balance sheet date for each of the periods indicated. These figures represent the estimated amount of unpaid losses and LAE for claims arising in all prior years that were unpaid at the balance sheet date, including losses that had been IBNR. The portion of the table labeled "Cumulative paid as of" shows the cumulative payments for losses and LAE made in succeeding years for losses incurred prior to the balance sheet date. The lower portion of the table shows the re-estimated amount of the previously recorded liability based on experience as of the end of each succeeding year.
|
Years Ended December 31,
|
||||||||||||||||||||||||||||||||||||||||
|
(Dollars in Thousands)
|
||||||||||||||||||||||||||||||||||||||||
|
2014
|
2013
|
2012
|
2011
|
2010
|
2009
|
2008
|
2007
|
2006
|
2005
|
|||||||||||||||||||||||||||||||
|
Unpaid losses and LAE, net
|
$
|
78,330
|
$
|
61,016
|
$
|
49,908
|
$
|
59,983
|
$
|
66,529
|
70,611
|
$
|
64,775
|
$
|
59,685
|
$
|
39,615
|
$
|
154,038
|
|||||||||||||||||||||
|
Cumulative paid as of:
|
||||||||||||||||||||||||||||||||||||||||
|
One year later
|
26,928
|
24,329
|
16,527
|
20,774
|
29,202
|
26,431
|
30,570
|
36,058
|
170,825
|
|||||||||||||||||||||||||||||||
|
Two years later
|
35,576
|
31,676
|
26,667
|
40,493
|
45,264
|
48,409
|
58,002
|
196,080
|
||||||||||||||||||||||||||||||||
|
Three years later
|
39,119
|
38,703
|
42,577
|
52,761
|
64,014
|
72,752
|
215,297
|
|||||||||||||||||||||||||||||||||
|
Four years later
|
44,305
|
50,096
|
53,689
|
68,865
|
86,110
|
228,805
|
||||||||||||||||||||||||||||||||||
|
Five years later
|
53,283
|
60,075
|
68,880
|
89,006
|
240,171
|
|||||||||||||||||||||||||||||||||||
|
Six years later
|
62,344
|
73,235
|
87,555
|
242,383
|
||||||||||||||||||||||||||||||||||||
|
Seven years later
|
74,627
|
90,910
|
244,405
|
|||||||||||||||||||||||||||||||||||||
|
Eight years later
|
91,885
|
246,286
|
||||||||||||||||||||||||||||||||||||||
|
Nine years later
|
247,124
|
|||||||||||||||||||||||||||||||||||||||
|
Re-estimated net liability as of:
|
||||||||||||||||||||||||||||||||||||||||
|
End of year
|
78,330
|
61,016
|
49,908
|
59,983
|
66,529
|
70,611
|
64,775
|
59,685
|
39,615
|
154,038
|
||||||||||||||||||||||||||||||
|
One year later
|
62,120
|
46,245
|
58,389
|
62,756
|
73,122
|
75,646
|
69,383
|
71,907
|
193,068
|
|||||||||||||||||||||||||||||||
|
Two years later
|
50,241
|
58,711
|
51,266
|
70,709
|
80,606
|
82,890
|
80,383
|
223,005
|
||||||||||||||||||||||||||||||||
|
Three years later
|
58,027
|
51,936
|
59,276
|
78,132
|
88,159
|
97,174
|
231,761
|
|||||||||||||||||||||||||||||||||
|
Four years later
|
55,147
|
58,223
|
68,119
|
85,532
|
102,571
|
248,116
|
||||||||||||||||||||||||||||||||||
|
Five years later
|
59,401
|
69,226
|
77,294
|
99,710
|
252,365
|
|||||||||||||||||||||||||||||||||||
|
Six years later
|
61,051
|
78,541
|
93,878
|
249,744
|
||||||||||||||||||||||||||||||||||||
|
Seven years later
|
67,879
|
96,514
|
248,211
|
|||||||||||||||||||||||||||||||||||||
|
Eight years later
|
78,223
|
251,217
|
||||||||||||||||||||||||||||||||||||||
|
Nine years later
|
218,556
|
|||||||||||||||||||||||||||||||||||||||
|
Cumulative (deficiency) redundancy
|
(1,104
|
)
|
(333
|
)
|
1,956
|
11,382
|
11,210
|
3,724
|
(8,194
|
)
|
(38,608
|
)
|
(64,518
|
)
|
||||||||||||||||||||||||||
|
Cumulative (deficiency) redundancy as a % of reserves originally established
|
-1.8
|
%
|
-0.7
|
%
|
3.3
|
%
|
17.1
|
%
|
15.9
|
%
|
5.7
|
%
|
-13.7
|
%
|
-97.5
|
%
|
-41.9
|
%
|
||||||||||||||||||||||
The cumulative redundancy or deficiency represents the aggregate change in the estimates over all prior years. A deficiency indicates that the latest estimate of the liability for losses and LAE is higher than the liability that was originally estimated and a redundancy indicates that such estimate is lower. It should be emphasized that the table presents a run-off of balance sheet liability for the periods indicated rather than accident or policy loss development for those periods. Therefore, each amount in the table includes the cumulative effects of changes in liability for all prior periods. Conditions and trends that have affected liabilities in the past may not necessarily occur in the future.
Federated National Holding Company
As noted above, we have since experienced $1.1 million and $0.3 million cumulative deficiencies in connection with the re-estimation of all losses that occurred in 2013 and 2012, respectively.
The table below sets forth the differences between loss and LAE reserves as disclosed for GAAP basis compared with Statutory Accounting Principles (“SAP”) basis of presentation for the years ended 2014, 2013 and 2012.
| Years Ended December 31, | ||||||||||||
|
2014
|
2013
|
2012
|
||||||||||
|
(Dollars in Thousands)
|
||||||||||||
|
GAAP basis Loss and LAE reserves
|
$
|
78,330
|
$
|
61,016
|
$
|
49,908
|
||||||
|
Less unpaid Losses and LAE ceded
|
10,395
|
2,312
|
3,189
|
|||||||||
|
Balance Sheet Liability
|
67,935
|
58,704
|
46,719
|
|||||||||
|
Add Insurance Apportionment Plan
|
7
|
2
|
6
|
|||||||||
|
Intercompany Indemnification
|
279
|
(4,705
|
)
|
(2,039
|
)
|
|||||||
|
FNIC SAP basis Loss and LAE reserves
|
$
|
68,221
|
$
|
54,001
|
$
|
44,686
|
||||||
The table below sets forth the differences between loss and LAE incurred as disclosed for GAAP basis compared with SAP basis presentation for the years ended 2014, 2013 and 2012.
| Years Ended December 31, | ||||||||||||
|
2014
|
2013
|
2012
|
||||||||||
|
(Dollars in Thousands)
|
||||||||||||
|
GAAP basis Loss and LAE incurred
|
$
|
81,036
|
$
|
56,410
|
$
|
30,209
|
||||||
|
Intercompany adjusting and other expenses
|
9,297
|
3,489
|
3,744
|
|||||||||
|
Insurance apportionment plan
|
40
|
13
|
(4
|
)
|
||||||||
|
SAP basis Loss and LAE incurred
|
$
|
90,373
|
$
|
59,912
|
$
|
33,949
|
||||||
Underwriting results of insurance companies are frequently measured by their Combined Ratios. However, investment income, federal income taxes and other non-underwriting income or expense are not reflected in the Combined Ratio. The profitability of property and casualty insurance companies depends on income from underwriting, investment and service operations. Underwriting results are considered profitable when the Combined Ratio is under 100% and unprofitable when the Combined Ratio is over 100%.
The following table sets forth Loss Ratios, Expense Ratios and Combined Ratios for the periods indicated for the insurance business for 2014, 2013 and 2012, and are inclusive of Unallocated Loss Adjustment Expenses (“ULAE”).
|
Years Ended December 31,
|
||||||||||||
|
2014
|
2013
|
2012
|
||||||||||
|
Loss Ratio
|
47.4
|
%
|
54.0
|
%
|
50.9
|
%
|
||||||
|
Expense Ratio
|
36.5
|
%
|
44.2
|
%
|
53.4
|
%
|
||||||
|
Combined Ratio
|
83.9
|
%
|
98.2
|
%
|
104.3
|
%
|
||||||
Our loss ratio is computed as losses and LAE divided by net premiums earned. A lower loss ratio generally results in higher operating income. Our loss ratio for 2014 was 47.4% compared with 54.0% for the same period in 2013. The decrease to our loss ratio is due to the $24.6 million increase in losses and LAE measured against the $66.5 million increase in net premium earned during 2014 as compared with the same period in 2013.
Our expense ratio is computed as the sum of operating and underwriting expenses plus salaries and wages plus amortization of Deferred Policy Acquisition Costs (“DPAC”) divided by net premiums earned. A lower expense ratio generally results in higher operating income. Our expense ratio for 2014 was 36.5% compared with 44.2% for the same period in 2013. The decrease to our expense ratio is due to the $16.2 million increase in the sum of operating and underwriting expenses plus salaries and wages plus amortization of DPAC measured against the $66.5 million increase in net premium earned during 2014 as compared with the same period in 2013.
Federated National Holding Company
COMPETITION
We operate in highly competitive markets and face competition from national, regional and residual market insurance companies in the homeowners’, commercial general liability, and automobile markets. Our competitors include companies that market their products through agents, as well as companies that sell insurance directly to their customers. Large national writers may have certain competitive advantages over agency writers, including increased name recognition, increased loyalty of their customer base and reduced policy acquisition costs. We compete based on underwriting criteria, our distribution network and superior service to our agents and insureds. Although our pricing is inevitably influenced to some degree by that of our competitors, we believe that it is generally not in our best interest to compete solely on price.
In Florida, more than 100 companies compete with us in the homeowners’ insurance market. Several of our larger competitors are Citizens, Universal Property and Casualty Insurance Company and St. Johns Insurance Company. In Florida, more than one dozen companies compete with us in the commercial general liability insurance market.
Significant competition also emerged because of fundamental changes made to the property and casualty insurance business in Florida in recent years which resulted in a multi-pronged approach to address the cost of residential property insurance in Florida. First, the law increased the capacity of reinsurance that stabilized the reinsurance market to the benefit of the insurance companies writing properties lines in Florida. Secondly, the law provided for rate relief to all policyholders. The law also authorized the state-owned insurance company, Citizens, which is free of many of the restraints on private carriers such as surplus, ratios, income taxes and reinsurance expense, to reduce its premium rates and begin competing against private insurers in the residential property insurance market and expands the authority of Citizens to write commercial insurance.
As a result of legislation in 2013, Citizens has reduced its insurance policy count and established the Property Insurance Clearinghouse (“Clearinghouse”). The Clearinghouse launched in January 2014, for new business ineligible for Citizens if a participating insurance company is willing to afford similar coverage at a price that is no more than 15% above the price of a policy with Citizens. Similarly, existing Citizens policies are not be eligible for renewal with Citizens if a participating insurance company is willing to afford similar coverage at no additional cost over the price for a Citizens policy. This allows potentially new and renewal policies of Citizens to be comparatively shopped by participating private market insurers before becoming, or remaining, policies of Citizens. Effective March 30, 2014, FNIC joined as a participating insurance company in the Clearinghouse.
REGULATION
General
We are subject to the laws and regulations in Alabama, Florida, Georgia, Louisiana, Mississippi, Missouri, Nevada, South Carolina and Texas and regulations of any other states in which we seek to conduct business in the future. The regulations cover all aspects of our business and are generally designed to protect the interests of insurance policyholders, as opposed to the interests of shareholders. Such regulations relate to authorized lines of business, capital and surplus requirements, allowable rates and forms, investment parameters, underwriting limitations, transactions with affiliates, dividend limitations, changes in control, market conduct, maximum amount allowable for premium financing service charges and a variety of other financial and non-financial components of our business. Our failure to comply with certain provisions of applicable insurance laws and regulations could have a material adverse effect on our business, results of operations or financial condition. In addition, any changes in such laws and regulations, including the adoption of consumer initiatives regarding rates charged for coverage, could materially and adversely affect our operations or our ability to expand.
Most states’ laws restrict an insurer’s underwriting discretion, such as the ability to terminate policies, terminate agents or reject insurance coverage applications, and many state regulators have the power to reduce, or to disallow, increases in premium rates. In addition, state laws generally require that rate schedules and other information be filed with the state's insurance regulatory authority, either directly or through a rating organization with which the insurer is affiliated. The regulatory authority may disapprove a rate filing if it finds that the rates are inadequate, excessive or unfairly discriminatory. Rates, which are not necessarily uniform for all insurers, vary by class of business, hazard covered, and size of risk. Certain states, including Florida, as discussed above, have adopted laws or are considering proposed legislation which, among other things, limit the ability of insurance companies to effect rate increases or to cancel, reduce or non-renew insurance coverage with respect to existing policies, particularly personal automobile insurance.
Most states require licensure or regulatory approval prior to the marketing of new insurance products. Typically, licensure review is comprehensive and includes a review of a company’s business plan, solvency, reinsurance, character of its officers and directors, rates, forms and other financial and non-financial aspects of a company. The regulatory authorities may prohibit entry into a new market by not granting a license or by withholding approval.
Federated National Holding Company
All insurance companies must file quarterly and annual statements with certain regulatory agencies and are subject to regular and special examinations by those agencies. We may be the subject of additional special examinations or analysis. These examinations or analysis may result in one or more corrective orders being issued by the Florida OIR. The most recent balance sheet audit of FNIC by the Florida OIR occurred as of December 31, 2010. There were no material findings by the independent auditors in connection with this examination. FNIC also experienced a regularly scheduled statutory examination by the Florida OIR which occurred during 2010 for the five years ended December 31, 2010. There were no material findings in connection with this examination.
In some instances, various states routinely require deposits of assets for the protection of policyholders either in those states or for all policyholders. As an example, the Florida OIR requires FNIC to have securities with a fair market value of $2.0 million held in escrow. As of December 31, 2014, FNIC held investment securities with a fair value of approximately $2.3 million, as a deposit with the State of Florida. Additionally, as of December 31, 2014 FNIC had cash deposits totaling $415,000 with the State of Alabama, $238,000 with the State of Louisiana and $25,000 with the State of Georgia.
As of December 31, 2013, FNIC held investment securities with a fair value of approximately $2.0 million, as a deposit with the State of Florida. Additionally, as of December 31, 2013 FNIC had cash deposits totaling $370,000 with the State of Alabama, $118,900 with the State of Louisiana and $25,000 with the State of Georgia.
Consent Order
As of September 30, 2014, we had satisfied all applicable conditions of the Consent Order we entered into in January 2011 (the “Consent Order”) with the Florida OIR. We entered into the Consent Order in connection with the merger of our one of our wholly owned insurance subsidiaries, American Vehicle Insurance Company (“American Vehicle”), into FNIC, with FNIC continuing the operations of both entities. As of the date of this Report, the only operational restriction that remains in effect is a requirement to obtain OIR approval prior to writing commercial multi-peril business or any new commercial property business, including condo associations, under any other line of business for which FNIC is authorized. FNIC currently has no commercial multi-peril policy premium in-force and the current commercial habitation book of business is fully earned. The Consent Order required us to, among other things, limit the number of policies that we write in the Tri-County area and imposed certain other operational requirements on us, all of which we have complied with.
Restrictions in Payments of Dividends by Domestic Insurance Companies
Under Florida law, a domestic insurer may not pay any dividend or distribute cash or other property to its shareholders except out of that part of its available and accumulated capital surplus funds which is derived from realized net operating profits on its business and net realized capital gains. A Florida domestic insurer may not make dividend payments or distributions to shareholders without prior approval of the Florida OIR if the dividend or distribution would exceed the larger of (i) the lesser of (a) 10.0% of its capital surplus or (b) net income, not including realized capital gains, plus a two-year carryforward, (ii) 10.0% of capital surplus with dividends payable constrained to unassigned funds minus 25.0% of unrealized capital gains or (iii) the lesser of (a) 10.0% of capital surplus or (b) net investment income plus a three-year carryforward with dividends payable constrained to unassigned funds minus 25.0% of unrealized capital gains.
Alternatively, a Florida domestic insurer may pay a dividend or distribution without the prior written approval of the Florida OIR (i) if the dividend is equal to or less than the greater of (a) 10.0% of the insurer’s capital surplus as regards policyholders derived from realized net operating profits on its business and net realized capital gains or (b) the insurer’s entire net operating profits and realized net capital gains derived during the immediately preceding calendar year, (ii) the insurer will have policy holder capital surplus equal to or exceeding 115.0% of the minimum required statutory capital surplus after the dividend or distribution, (iii) the insurer files a notice of the dividend or distribution with the Florida OIR at least ten business days prior to the dividend payment or distribution and (iv) the notice includes a certification by an officer of the insurer attesting that, after the payment of the dividend or distribution, the insurer will have at least 115.0% of required statutory capital surplus as to policyholders. Except as provided above, a Florida domiciled insurer may only pay a dividend or make a distribution (i) subject to prior approval by the Florida OIR or (ii) 30 days after the Florida OIR has received notice of such dividend or distribution and has not disapproved it within such time.
No dividends were paid by FNIC or American Vehicle in 2014, 2013 and 2012, and none are anticipated in 2015. Although we believe that amounts required to meet our financial and operating obligations will be available from sources other than dividends from our insurance subsidiaries, there can be no assurance in this regard. Further, there can be no assurance that, if requested, the Florida OIR will allow any dividends to be paid by FNIC to us, the parent company, in the future. The maximum dividends permitted by state law are not necessarily indicative of an insurer’s actual ability to pay dividends or other distributions to a parent company, which also may be constrained by business and regulatory considerations, such as the impact of dividends on capital surplus, which could affect an insurer’s competitive position, the amount of premiums that can be written and the ability to pay future dividends. Further, state insurance laws and regulations require that the statutory capital surplus of an insurance company following any dividend or distribution by it be reasonable in relation to its outstanding liabilities and adequate for its financial needs.
Federated National Holding Company
While the non-insurance company subsidiaries (FNU, FNA and any other affiliate) are not subject directly to the dividend and other distribution limitations, insurance holding company regulations govern the amount that any affiliate within the holding company system may charge any of the insurance companies for service (e.g., management fees and commissions).
National Association of Insurance Commissioners (“NAIC”) Risk-Based Capital Requirements
In order to enhance the regulation of insurer solvency, NAIC established risk-based capital requirements for insurance companies that are designed to assess capital adequacy and to raise the level of protection that statutory surplus provides for policy holders. These requirements measure three major areas of risk facing property and casualty insurers: (i) underwriting risks, which encompass the risk of adverse loss developments and inadequate pricing; (ii) declines in asset values arising from credit risk; and (iii) other business risks from investments. Insurers having less statutory surplus than required will be subject to varying degrees of regulatory action, depending on the level of capital inadequacy. The Florida OIR, which follows these requirements, could require FNIC to cease operations in the event they fail to maintain the required statutory capital.
Based upon the 2014 and 2013 statutory financial statements for FNIC, statutory surplus exceeded the regulatory action levels established by the NAIC’s risk-based capital requirements.
Based on risk-based capital requirements, the extent of regulatory intervention and action increases as the ratio of an insurer’s statutory surplus to its Authorized Control Level (“ACL”), as calculated under the NAIC’s requirements, decreases. The first action level, the Company Action Level, requires an insurer to submit a plan of corrective actions to the insurance regulators if statutory surplus falls below 200.0% of the ACL amount. The second action level, the Regulatory Action Level, requires an insurer to submit a plan containing corrective actions and permits the insurance regulators to perform an examination or other analysis and issue a corrective order if statutory surplus falls below 150.0% of the ACL amount. The third action level, ACL, allows the regulators to rehabilitate or liquidate an insurer in addition to the aforementioned actions if statutory surplus falls below the ACL amount. The fourth action level is the Mandatory Control Level, which requires the regulators to rehabilitate or liquidate the insurer if statutory surplus falls below 70.0% of the ACL amount. FNIC’s ratio of statutory surplus to its ACL was 534.0%, 312.1% and 474.4% at December 31, 2014, 2013 and 2012, respectively.
Insurance Regulatory Information Systems (“IRIS”) Ratios
The NAIC has also developed IRIS ratios to assist state insurance departments in identifying companies which may be developing performance or solvency problems, as signaled by significant changes in the companies’ operations. Such changes may not necessarily result from any problems with an insurance company, but may merely indicate changes in certain ratios outside the ranges defined as normal by the NAIC. When an insurance company has four or more ratios falling outside “usual ranges”, state regulators may investigate to determine the reasons for the variance and whether corrective action is warranted.
As of December 31, 2014, FNIC was outside NAIC’s usual range for four of thirteen IRIS ratios. These exceptions related to change in policyholder surplus growth, investment yield and estimated current reserve deficiency to policyholders’ surplus. The policyholder surplus growth exceeded the normal range due to the Company’s surplus infusion into FNIC totaling approximately $18.5 million. The increase in earned premiums during 2014 lead to the exceptional value for the Estimated Current Reserve to Deficiency to Surplus result.
As of December 31, 2013, FNIC was outside NAIC’s usual range for three of thirteen IRIS ratios. These exceptions related to change in net writings, investment yield and estimated current reserve deficiency to policyholders’ surplus.
As of December 31, 2012, FNIC was outside NAIC’s usual range for three of thirteen IRIS ratios. These exceptions related to investment yield, net change in adjusted policyholders’ surplus and estimated current reserve deficiency to policyholders’ surplus.
There was no action taken by the Florida OIR in connection with the December 31, 2013 or 2012 IRIS ratio results. We do not currently believe that the Florida OIR will take any significant action with respect to FNIC regarding the 2014 IRIS ratios, although there can be no assurance that will be the case.
Federated National Holding Company
Insurance Holding Company Regulation
We, the parent company, are subject to laws governing insurance holding companies in Florida where FNHC is domiciled. These laws, among other things, (i) require us to file periodic information with the Florida OIR, including information concerning our capital structure, ownership, financial condition and general business operations, (ii) regulate certain transactions between us and our affiliates, including the amount of dividends and other distributions, the terms of surplus notes and amounts that our affiliates can charge the holding company for services such as management fees or commissions, (iii) restrict the ability of any one person to acquire certain levels of our voting securities without prior regulatory approval. Any purchaser of 5% or more of the outstanding shares of our Common Stock will be presumed to have acquired control of FNHC unless the Florida OIR, upon application, determines otherwise.
Underwriting and Marketing Restrictions
During the past several years, various regulatory and legislative bodies have adopted or proposed new laws or regulations to address the cyclical nature of the insurance industry, catastrophic events and insurance capacity and pricing. These regulations include (i) the creation of "market assistance plans" under which insurers are induced to provide certain coverages, (ii) restrictions on the ability of insurers to rescind or otherwise cancel certain policies in mid-term, (iii) advance notice requirements or limitations imposed for certain policy non-renewals and (iv) limitations upon or decreases in rates permitted to be charged.
Industry Ratings Services
Third-party rating agencies assess and rate the ability of insurers to pay their claims. These financial strength ratings are used by the insurance industry to assess the financial strength and quality of insurers. These ratings are based on criteria established by the rating agencies and reflect evaluations of each insurer's profitability, debt and cash levels, customer base, adequacy and soundness of reinsurance, quality and estimated market value of assets, adequacy of reserves and management. Ratings are based upon factors of concern to agents, reinsurers and policyholders and are not directed toward the protection of investors, such as purchasers of our common stock.
As of December 31, 2014, FNIC is rated by Demotech as "A" ("Exceptional"), which is the third of seven ratings, and defined as “Regardless of the severity of a general economic downturn or deterioration in the insurance cycle, insurers earning a Financial Stability Rating (“FSR”) of “A” possess “Exceptional” financial stability related to maintaining surplus as regards to policyholders”. Demotech’s ratings are based upon factors of concern to agents, reinsurers and policyholders and are not primarily directed toward the protection of investors. Our Demotech rating could be jeopardized by factors including adverse development and various surplus related ratio exceptions. On November 22, 2014, Demotech reaffirmed FNIC’s FSR of “A” (“Exceptional”).
The withdrawal of our ratings could limit or prevent us from writing or renewing desirable insurance policies, from competing with insurers who have higher ratings, from obtaining adequate reinsurance, or from borrowing on a line of credit. The withdrawal of our ratings could have a material adverse effect on the Company’s results of operations and financial position because the Company’s insurance products might no longer be acceptable to the secondary marketplace and mortgage lenders. Furthermore, a withdrawal of our ratings could prevent independent agents from selling and servicing our insurance products.
EMPLOYEES
As of December 31, 2014, we had 219 employees, including two executive officers. We are not a party to any collective bargaining agreement and we have not experienced work stoppages or strikes as a result of labor disputes. We consider relations with our employees to be satisfactory.
Federated National Holding Company
We are subject to certain risks in our business operations which are described below. Careful consideration of these risks should be made before making an investment decision. The risks and uncertainties described below are not the only ones facing FNHC. Additional risks and uncertainties not presently known or currently deemed immaterial may also impair our business operations.
Risks Related to Our Business
Our financial condition could be adversely affected by the occurrence of natural and man-made disasters.
We write insurance policies that cover homeowners, business owners and automobile owners for losses that result from, among other things, catastrophes and sinkholes. Catastrophic losses can be caused by natural events such as hurricanes, tropical storms, tornadoes, wind, hail, fires, explosions and other events, and their incidence and severity are inherently unpredictable. They can also be caused by terrorist attacks, war, riots, political instability and other man-made events. The extent of losses from a catastrophe is a function of two factors: the total amount of the insurance company's exposure in the area affected by the event and the severity of the event. Although our homeowners' policyholders are disbursed throughout Florida, substantially all of them are located in Florida, which is especially subject to adverse weather conditions such as hurricanes and tropical storms, and a substantial portion are located in southeastern Florida.
The occurrence of claims from catastrophic events could result in substantial volatility in our results of operations or financial condition for any fiscal quarter or year. Increases in the values and concentrations of insured property may also increase the severity of these occurrences in the future. Although we attempt to manage our exposure to such events through the use of underwriting controls and the purchase of third-party reinsurance, catastrophic events are inherently unpredictable and the actual nature of such events when they occur could be more frequent or severe than contemplated in our pricing and risk management expectations. As a result, the occurrence of one or more catastrophic events could have a material adverse effect on our results of operations or financial condition.
Although Florida has not experienced a hurricane during the last nine hurricane seasons, some weather analysts believe that we have entered a period of greater hurricane activity. We are exploring alternatives to reduce our exposure to these types of storms, which may increase operating expenses and may not be successful in protecting long-term profitability. If our loss experience is more adverse than is contemplated by our loss reserves, the related increase in our loss reserves may have a material adverse effect on our results of operations in the period in which the increase occurs.
Although we follow the industry practice of reinsuring a portion of our risks, our costs of obtaining reinsurance fluctuates and we may not be able to successfully alleviate risk through reinsurance arrangements.
We have a reinsurance structure that is a combination of private reinsurance and the FHCF. Our reinsurance structure is composed of several reinsurance companies with varying levels of participation providing coverage for loss and LAE at pre-established minimum and maximum amounts. Losses incurred in connection with a catastrophic event below the minimum and above the maximum are the responsibility of FNIC.
The availability and costs associated with the acquisition of reinsurance will vary year to year. We are not able to control these fluctuations which may be significant and may limit our ability to purchase adequate coverage. The recovery of increased reinsurance costs through rate action is not immediate and cannot be presumed, as it is subject to approval of the Florida OIR.
We face a risk of non-collectability of reinsurance, which could materially and adversely affect our business, results of operations and financial condition.
As is common practice within the insurance industry, we transfer a portion of the risks insured under our policies to other companies through the purchase of reinsurance. This reinsurance is maintained to protect our insurance subsidiary against the severity of losses on individual claims, unusually serious occurrences in which a number of claims produce an aggregate extraordinary loss and other catastrophic events. Although reinsurance does not discharge our insurance subsidiary from its primary obligation to pay for losses insured under the policies it issues, reinsurance does make the assuming reinsurer liable to the insurance subsidiary for the reinsured portion of the risk. A credit exposure exists with respect to ceded losses to the extent that any reinsurer is unable or unwilling to meet the obligations assumed under the reinsurance contracts. The collectability of reinsurance is subject to the solvency of the reinsurers, interpretation of contract language and other factors. A reinsurer's insolvency or inability to make payments under the terms of a reinsurance contract could have a material adverse effect on our business, results of operations and financial condition.
Federated National Holding Company
Our reinsurance structure has significant risks, including the fact that the FHCF may not be able to raise sufficient money to pay their claims or impair their ability to pay their claims in a timely manner. This could result in significant financial, legal and operational challenges to our company. Therefore, in the event of a catastrophic loss, we may become dependent upon the FHCF's ability to pay, which may, in turn, be dependent upon the MCP's ability to issue bonds in amounts that would be required to meet its reinsurance obligations in the event of such a catastrophic loss.
Our January 2011 Consent Order with the Florida OIR, as amended in February 2013, limits our business in certain respects and may prevent us from growing our business.
In January 2011, we entered into a Consent Order with the Florida OIR, in connection with our request for approval of the merger of FNIC, into American Vehicle, one of our other subsidiaries at the time. The Consent Order was amended in February 2013 to lessen or eliminate certain of the original requirements, due to FNIC's statutory underwriting profit during 2012. Among other things, the Consent Order as amended requires us to limit the concentration of our homeowners' policies in Miami-Dade, Broward and Palm Beach counties. This reduction in concentration could materially adversely affect us by limiting our ability to write policies in the most populous region of the State of Florida, which could materially adversely affect our results of operations if we are not able to replace those policies with policies elsewhere in Florida or the other states in which we do business.
If we are unable to continue our growth because our capital must be used to pay greater than anticipated claims, our financial results may suffer.
Our future growth will depend on our ability to expand the types of insurance products we offer and the geographic markets in which we do business, both balanced by the business risks we choose to assume and cede. We believe that our Company is sufficiently capitalized to operate our business as it now exists and as we currently plan to expand it. Our existing sources of funds include possible sales of our investment securities and our earnings from operations and investments. Unexpected catastrophic events in our market areas, such as the hurricanes experienced in Florida, have resulted and may result in greater claims losses than anticipated, which could require us to limit or halt our growth while we redeploy our capital to pay these unanticipated claims.
We may require additional capital in the future which may not be available or only available on unfavorable terms.
Our future capital requirements depend on many factors, including our ability to write new business successfully and to establish premium rates and reserves at levels sufficient to cover losses. Based on our current operating plan, we believe current capital, together with our anticipated retained earnings, will support our operations without the need to raise additional capital. To the extent that our capital may be insufficient to meet future operating requirements and/or cover losses, we may need to raise additional funds through financings or curtail our growth. Many factors will affect the amount and timing of our capital needs, including our growth and profitability, our claims experience, and the availability of reinsurance, as well as possible acquisition opportunities, market disruptions and other unforeseeable developments.
If we were required to raise additional capital, equity or debt financing may not be available at all or may be available only on terms that are not favorable to us. In the case of equity financings, dilution to our stockholders’ ownership could result, and in any case such securities may have rights, preferences and privileges that are senior to those of existing shareholders. If we raise additional funds by incurring debt financing, the terms of the debt may involve significant cash payment obligations as well as covenants and specific financial ratios that may restrict our ability to operate our business or pay dividends. If we cannot obtain adequate capital on favorable terms or at all, our business, financial condition or results of operations could be materially adversely affected.
Our business is heavily regulated, and changes in regulation may reduce our profitability and limit our growth.
We are subject to extensive regulation in the states in which we conduct business. This regulation is generally designed to protect the interests of policyholders, as opposed to shareholders and other investors, and relates to authorization for lines of business, capital and surplus requirements, investment limitations, underwriting limitations, transactions with affiliates, dividend limitations, changes in control, premium rates and a variety of other financial and non-financial components of an insurance company's business. These regulatory requirements may adversely affect or inhibit our ability to achieve some or all of our business objectives. State regulatory authorities also conduct periodic examinations into insurers' business practices. These reviews may reveal deficiencies in our insurance operations or differences between our interpretations of regulatory requirements and those of the regulators.
Federated National Holding Company
The National Association of Insurance Commissioners, or NAIC, and state insurance regulators are constantly reexamining existing laws and regulations, generally focusing on modifications to holding company regulations, interpretations of existing laws and the development of new laws.
From time to time, some states in which we conduct business have considered or enacted laws that may alter or increase state authority to regulate insurance companies and insurance holding companies. In other situations, states in which we conduct business have considered or enacted laws that impact the competitive environment and marketplace for property and casualty insurance. In addition, in recent years the state insurance regulatory framework has come under increased federal scrutiny. Changes in federal legislation and administrative policies in several areas, including changes in financial services regulation and federal taxation, can significantly impact the insurance industry and us.
We cannot predict with certainty the effect any enacted, proposed or future state or federal legislation or NAIC initiatives may have on the conduct of our business. Furthermore, there can be no assurance that the regulatory requirements applicable to our business will not become more stringent in the future or result in materially higher costs than current requirements. Changes in the regulation of our business may reduce our profitability, limit our growth or otherwise adversely affect our operations.
We may experience financial exposure from climate change.
A body of scientific evidence seems to indicate that climate change may be occurring. Climate change, to the extent that it may affect weather patterns, may cause an increase in the frequency and/or the severity of catastrophic events or severe weather conditions. Our financial exposure from climate change is most notably associated with losses in connection with the occurrence of hurricanes striking Florida. We mitigate the risk of financial exposure from climate change by restrictive underwriting criteria, sensitivity to geographic concentrations, and reinsurance.
Restrictive underwriting criteria can include, but are not limited to, higher premiums and deductibles and more specifically excluded policy risks such as fences and screened-in enclosures. New technological advances in computer generated geographical mapping afford us an enhanced perspective as to geographic concentrations of policyholders and proximity to flood prone areas. Our amount of maximum reinsurance coverage is determined by subjecting our homeowner exposures to statistical forecasting models that are designed to quantify a catastrophic event in terms of the frequency of a storm occurring once in every "n" years. Our reinsurance coverage contemplates the effects of a catastrophic event that occurs only once every 100 years. Our amount of losses retained (our deductible) in connection with a catastrophic event is determined by market capacity, pricing conditions and surplus preservation. There can be no assurance that our reinsurance coverage and other measures taken will be sufficient to mitigate losses resulting from one or more catastrophic events.
Our loss reserves are estimates and may be inadequate to cover our actual liability for losses, causing our results of operations to be adversely affected.
We maintain reserves to cover our estimated ultimate liabilities for loss and LAE. These reserves are estimates based on historical data and statistical projections of what we believe the settlement and administration of claims will cost based on facts and circumstances then known to us. Actual loss and LAE reserves, however, may vary significantly from our estimates.
Factors that affect unpaid losses and LAE include the estimates made on a claim-by-claim basis known as "case reserves" coupled with bulk estimates known as IBNR Periodic estimates by management of the ultimate costs required to settle all claim files are based on our analysis of historical data and estimations of the impact of numerous factors such as (i) per claim information; (ii) company and industry historical loss experience; (iii) legislative enactments, judicial decisions, legal developments in the awarding of damages, and changes in political attitudes; and (iv) trends in general economic conditions, including the effects of inflation. Management revises its estimates based on the results of its analysis. This process assumes that past experience, adjusted for the effects of current developments and anticipated trends, is an appropriate basis for estimating the ultimate settlement of all claims. There is no precise method for subsequently evaluating the impact of any specific factor on the adequacy of the reserves, because the eventual redundancy or deficiency is affected by multiple factors.
Because of the uncertainties that surround estimated loss reserves, we cannot be certain that our reserves will be adequate to cover our actual losses. If our reserves for unpaid losses and LAE are less than actual losses and LAE, we will be required to increase our reserves with a corresponding reduction in our net income in the period in which the deficiency is identified. Future loss experience, substantially in excess of our reserves for unpaid losses and LAE, could substantially harm our results of operations and financial condition.
Federated National Holding Company
Our revenues and operating performance will fluctuate due to statutorily approved assessments that support property and casualty insurance pools and associations.
We operate in a regulatory environment where certain entities and organizations have the authority to require us to participate in assessments. Currently these entities and organizations include, but are not limited to, the Florida Joint Underwriters Association, the Florida Insurance Guaranty Association, Citizens and the FHCF.
The insurance companies currently pass the assessments on to holders or insurance policies, in the form of a policy surcharge, and reflect the collection of these assessments as fully earned credits to operations in the period collected. The collection of these fees may adversely affect our overall marketing strategy due to the competitive landscape in Florida.
In addition, the impact of future assessments on our balance sheet, results of operations or cash flow are undeterminable at this time.
Our investment portfolio may suffer reduced returns or losses, which would significantly reduce our earnings.
Like other insurance companies, we depend on income from our investment portfolio for a substantial portion of our earnings. During the time that normally elapses between the receipt of insurance premiums and any payment of insurance claims, we invest the premiums received, together with our other available capital, primarily in debt securities and to a lesser extent in equity securities, in order to generate investment income.
Our investment portfolio contains interest rate sensitive instruments, such as bonds, which may be adversely affected by changes in interest rates. A significant increase in interest rates or decrease in credit worthiness could have a material adverse effect on our financial condition or results of operations. Generally, bond prices decrease as interest rates rise. Changes in interest rates could also have an adverse effect on our investment income and results of operations. For example, if interest rates decline, investment of new premiums received and funds reinvested will earn less than expected.
Our determination of the amount of other-than-temporary impairment to record varies by investment type and is based upon our periodic evaluation and assessment of known and inherent risks associated with the respective investment type. We revise our evaluations and assessments as conditions change and new information becomes available, and we reflect changes in other-than- temporary impairments in our consolidated statements of income. We base our assessment of whether other-than-temporary impairments have occurred on our case-by-case evaluation of the underlying reasons for the decline in fair value. We can neither provide assurance that we have accurately assessed whether the impairment of one or more of our investments is temporary or other-than-temporary, nor that we have accurately recorded amounts for other-than-temporary impairments in our financial statements. Furthermore, historical trends may not be indicative of future impairments and additional impairments may need to be recorded in the future.
In addition, volatile and illiquid markets increase the likelihood that investment securities may not behave in historically predictable manners, resulting in fair value estimates that may be overstated compared with actual amounts that could be realized upon disposition or maturity of the security. The effects of market volatility and declining economic conditions may have unforeseen consequences on the credit quality, liquidity and financial stability of the issuers of securities we hold, or reinsurers with which we do business. Such deteriorations in financial condition can occur rapidly, leaving us unable to react to such a scenario in a prudent manner consistent with our historical practices in dealing with more orderly markets. This in turn could adversely and negatively affect our results of operations, liquidity or financial condition.
We may experience a loss due to the concentration of credit risk.
Financial instruments that potentially subject the Company to significant concentration of credit risk consist of cash and cash equivalents held in a mutual fund money market account. The Company had approximately $17.3 million and $12.2 million invested in the Wilmington Prime Money Market Fund – Class Select (Ticker: VSMXX, CUSIP: 97181C308), for which the NAIC classification is Class 1, as of December 31, 2014 and 2013, respectively. Although this fund is on the Class 1 list, the highest rating available, there can be no assurance that it will remain financially sound. If the MTB Fund were to experience financial difficulty such that it could not repay the money we have invested in the fund, our financial condition and results of operations could be materially and adversely affected.
Federated National Holding Company
The failure of any of the loss limitation methods we employ could have a material adverse effect on our financial condition or our results of operations.
Various provisions of our policies, such as limitations or exclusions from coverage which have been negotiated to limit our risks, may not be enforceable in the manner we intend. At the present time we employ a variety of exclusions to our policies that limit exposure to known risks, including, but not limited to, exclusions relating to certain named liabilities, types of vehicles and specific artisan activities.
In addition, the policies we issue contain conditions requiring the prompt reporting of claims to us and our right to decline coverage in the event of a violation of that condition. While we believe our insurance product exclusions and limitations reduce the loss exposure to us and help eliminate known exposures to certain risks, it is possible that a court or regulatory authority could nullify or void an exclusion or that legislation could be enacted modifying or barring the use of such endorsements and limitations in a way that would adversely affect our loss experience, which could have a material adverse effect on our financial condition or results of operations.
The effects of emerging claim and coverage issues on our business are uncertain.
As industry practices and legal, judicial, social and other conditions change, unexpected and unintended issues related to claims and coverage may emerge. These issues may adversely affect our business by either extending coverage beyond our underwriting intent or by increasing the number or size of claims. In some instances, these changes may not become apparent until sometime after we have issued insurance contracts that are affected by the changes. As a result, the full extent of liability under our insurance contracts may not be known for many years after a contract is issued.
An example of such emerging change was the influence public adjusters have had on property claim patterns. Public adjusters represented the vast majority of new and reopened claims filed during 2011 and 2010 where the cause of loss was asserted as hurricane related. Although the legitimacy of the claim may not prevail we are still required to research, review and sometimes mediate these claims. Several legislative actions in of the State of Florida, such as limiting the time a claim can be filed subsequent to the cause of loss, have either passed or remain in legislative sub-committees. Each of these actions is designed to enhance the legitimacy of the public adjusters’ influence on the claim process.
Our failure to pay claims accurately could adversely affect our business, financial results and capital requirements.
We must accurately evaluate and pay claims that are made under our policies. Many factors affect our ability to pay claims accurately, including the training and experience of our claims representatives, the culture of our claims organization and the effectiveness of our management, our ability to develop or select and implement appropriate procedures and systems to support our claims functions and other factors. Our failure to pay claims accurately could lead to material litigation, undermine our reputation in the marketplace, impair our image and negatively affect our financial results.
In addition, if we do not train new claims adjusting employees effectively or if we lose a significant number of experienced claims adjusting employees, our claims department's ability to handle an increasing workload as we grow could be adversely affected. In addition to potentially requiring that growth be slowed in the affected markets, we could suffer decreased quality of claims work, which in turn could lower our operating margins.
Our insurance company is subject to minimum capital and surplus requirements, and our failure to meet these requirements could subject us to regulatory action.
Our insurance company is subject to risk-based capital standards and other minimum capital and surplus requirements imposed under applicable state laws, including the laws of the State of Florida. The risk-based capital standards, based upon the Risk Based Capital Model Act adopted by the NAIC, require our insurance company to report their results of risk-based capital calculations to state departments of insurance and the NAIC. These risk-based capital standards provide for different levels of regulatory attention depending upon the ratio of an insurance company's total adjusted capital, as calculated in accordance with NAIC guidelines, to its authorized control level risk-based capital.
If we fail to meet the applicable risk-based capital or minimum statutory capital requirements imposed by the laws of Florida or other states where we do business, we could be subject to further examination or corrective action imposed by state regulators, including limitations on out writing of additional business, state supervision or liquidation, and may be required to raise additional capital. Similarly, an increase in existing risk-based capital requirements or minimum statutory capital requirements may require us to increase our statutory capital levels. As of December 31, 2014, FNIC was in compliance with the NAIC risk-based capital requirements (see “Business-Regulation” for further discussion).
Federated National Holding Company
Our revenues and operating performance may fluctuate with business cycles in the property and casualty insurance industry.
Historically, the financial performance of the property and casualty insurance industry has tended to fluctuate in cyclical patterns characterized by periods of significant competition in pricing and underwriting terms and conditions, which is known as a "soft" insurance market, followed by periods of lessened competition and increasing premium rates, which is known as a "hard" insurance market. Although an individual insurance company's financial performance is dependent on its own specific business characteristics, the profitability of most property and casualty insurance companies tends to follow this cyclical market pattern, with profitability generally increasing in hard markets and decreasing in soft markets. At present, we are experiencing a softening market in the property and casualty market in Florida because of increased competition. We cannot predict, however, how long these market conditions will persist. Although we do not compete entirely on price or targeted market share, negative market conditions may impair our ability to write insurance at rates that we consider appropriate relative to the risk assumed. If we cannot write insurance at appropriate rates, our revenues and operating performance may be adversely affected.
We may not obtain the necessary regulatory approvals to expand the types of insurance products we offer or the states in which we operate.
The insurance industry is highly regulated. Prior to selling a new insurance product in a state, we must obtain approval from the applicable state insurance regulators. The insurance regulators in states to which we might apply may request additional information, add conditions to the license that we find unacceptable, or deny our application. This would delay or prevent us from operating in that state. If we want to operate in any additional states, we must file similar applications for licenses, which we may not be successful in obtaining.
Adverse ratings by insurance rating agencies may adversely impact our ability to write new policies, renew desirable policies or obtain adequate insurance, which could limit or halt our growth and harm our business.
Third-party rating agencies assess and rate the ability of insurers to pay their claims. These financial strength ratings are used by the insurance industry to assess the financial strength and quality of insurers. These ratings are based on criteria established by the rating agencies and reflect evaluations of each insurer's profitability, debt and cash levels, customer base, adequacy and soundness of reinsurance, quality and estimated market value of assets, adequacy of reserves, and management. Ratings are based upon factors of concern to agents, reinsurers and policyholders and are not directed toward the protection of investors, such as purchasers of our common stock.
The withdrawal of our ratings could limit or prevent us from writing or renewing desirable insurance policies, from competing with insurers who have higher ratings, from obtaining adequate reinsurance, or from borrowing on a line of credit.
The withdrawal or downgrade of our ratings could have a material adverse effect on our results of operations and financial position because our insurance products might no longer be acceptable to the secondary marketplace and mortgage lenders. Furthermore, a withdrawal or downgrade of our ratings could prevent independent agents from selling and servicing our insurance products or could increase the commissions we must pay to these agents.
We rely on independent and general agents to write our insurance policies, and if we are not able to attract and retain independent and general agents, our revenues would be negatively affected.
We currently market and distribute our products and services through contractual relationships with a network of approximately 3,600 independent agents, of which approximately 2,300 actively sell and service our products, and a selected number of general agents. Our independent agents are our primary source for our property and liability insurance policies. Many of our competitors also rely on independent agents. As a result, we must compete with other insurers for independent agents' business. Our competitors may offer a greater variety of insurance products, lower premiums for insurance coverage, or higher commissions to their agents. If our products, pricing and commissions do not remain competitive, we may find it more difficult to attract business from independent agents to sell our products. A material reduction in the amount of our products that independent agents sell or a material reduction in the number of independent agents with whom we maintain a relationship could negatively affect our results of operations and financial condition.
In February 2013, we entered into an Insurance Agency Master Agreement with Ivantage Select Agency, Inc., or ISA, an affiliate of Allstate Insurance Company, or Allstate, pursuant to which we are authorized by ISA to appoint Allstate agents to offer our homeowners' and commercial general liability insurance products to consumers in Florida. Since that time, our homeowners' premiums and the percentage of homeowners' premiums attributable to Allstate agents has increased rapidly. During 2014, 33.4% of the homeowners' premiums we underwrote were from Allstate's network of Florida agents, and this concentration may continue to increase. An interruption or change in our relationship with ISA could have a material adverse effect on the amount of premiums we are able to write, as well as our results of operations.
Federated National Holding Company
Our business could be materially and adversely affected by a security breach or other attack involving our computer systems or the systems of one or more of our business partners or vendors.
Our business requires that we build and maintain computer systems to run our operations and to store the significant volume of data that we acquire, including the personal confidential information of our customers, agents and employees and our intellectual property, trade secrets, and other sensitive business and financial information. These systems are subject to attacks by sophisticated third parties with substantial computing resources and capabilities. Such attacks may include, among other things, attempts to gain unauthorized access to this confidential or proprietary data or attempts to disrupt or shut down the system. Additionally, an employee, consultant, vendor representative or other person with legitimate access to our systems may take actions, or be the subject of a security breach or cyber attack, which could result in improper or unauthorized access to our systems, and in the loss or theft of our intellectual property or the personal information of our customers, agents or employees.
We undertake substantial efforts to protect our systems and sensitive or confidential information. These efforts include internal processes and technological defenses that are preventative or detective, and other controls designed to provide multiple layers of security protection. While we expend significant resources on these defensive measures, there can be no assurance that we will be successful in preventing attacks or detecting and stopping them once they have begun.
We also conduct significant business functions and computer operations using the systems of third-party business partners and vendors, who provide software, hosting, communication, and other computer services to us. These third-party systems may experience cyber attacks and other security breaches, which could result in the loss, theft or unauthorized publication of our information or the confidential information of our customers, agents or employees.
Our business could be significantly damaged by a security breach, data loss or corruption, or cyber attack. In addition to the potentially high costs of investigating and stopping such an event and implementing necessary fixes, we could incur substantial liability if confidential customer, agent or employee information is stolen. This could cause a significant disruption of our ability to conduct our insurance operations, adversely affect our competitive position if trade secrets or other proprietary information is stolen, and have severe ramifications on our reputation and brand, resulting in a materially adverse effect on our ability to generate new and renewal business. To mitigate these costs, we carry a cyber-liability insurance policy. Our insurance may not be sufficient to protect against all financial and other loss. Additionally, this policy will not afford us coverage for security breaches, data loss, or cyber attacks experienced by our third-party business partners who have access to our customer, agent, or employee data.
We rely on our information technology and telecommunications systems, and the failure of these systems could disrupt our operations.
Our business is highly dependent upon the successful and uninterrupted functioning of our current information technology and telecommunications systems. We rely on these systems to process new and renewal business, provide customer service, make claims payments and facilitate collections and cancellations, as well as to perform actuarial and other analytical functions necessary for pricing and product development. As a result, the failure of these systems could interrupt our operations and adversely affect our financial results. We utilize a third-party to provide certain information security related services designed to prevent an information security event or detect one timely. Although we have implemented security measures to protect our systems from computer viruses and intrusions by third parties, there can be no assurances that these measures will be effective.
Nonstandard automobile insurance historically has a higher frequency of claims than standard automobile insurance, thereby increasing our potential for loss exposure beyond what we would be likely to experience if we offered only standard automobile insurance.
Nonstandard automobile insurance is provided to insureds that are unable to obtain preferred or standard insurance coverage because of their payment histories, driving records, age, vehicle types, or prior claims histories. This type of automobile insurance historically has a higher frequency of claims than does preferred or standard automobile insurance policies, although the average dollar amount of the claim is usually smaller under nonstandard insurance policies. As a result, we are exposed to the possibility of increased loss exposure and higher claims experience than would be the case if we offered only standard automobile insurance.
Federated National Holding Company
Florida's personal injury protection insurance statute contains provisions that favor claimants, causing us to experience a higher frequency of claims than might otherwise be the case if we operated only outside of Florida.
Florida's personal injury protection insurance statute limits an insurer's ability to deny benefits for medical treatment that is unrelated to the accident, that is unnecessary, or that is fraudulent. In addition, the statute allows claimants to obtain awards for attorney's fees. Although this statute has been amended several times in recent years, primarily to address concerns over fraud, the Florida legislature has been only marginally successful in implementing effective mechanisms that allow insurers to combat fraud and other abuses. We believe that this statute contributes to a higher frequency of claims under nonstandard automobile insurance policies in Florida, as compared with claims under standard automobile insurance policies in Florida and nonstandard and standard automobile insurance policies in other states. Although we believe that we have successfully offset these higher costs with premium increases, because of competition, we may not be able to do so with as much success in the future, which could have a material adverse effect on our results of operations and financial condition.
Our success depends on our ability to accurately price the risks we underwrite.
The results of operations and the financial condition of our insurance company depend on our ability to underwrite and set premium rates accurately for a wide variety of risks. Rate adequacy is necessary to generate sufficient premiums to pay losses, LAE and underwriting expenses and to earn a profit. In order to price our products accurately, we must collect and properly analyze a substantial amount of data; develop, test and apply appropriate rating formulas; closely monitor and timely recognize changes in trends; and project both severity and frequency of losses with reasonable accuracy. Our ability to undertake these efforts successfully and price our products accurately is subject to a number of risks and uncertainties, some of which are outside our control, including:
| · | the availability of sufficient reliable data and our ability to properly analyze available data; |
| · | the uncertainties that inherently characterize estimates and assumptions; |
| · | our selection and application of appropriate rating and pricing techniques; |
| · | changes in legal standards, claim settlement practices, medical care expenses and restoration costs; |
| · | regulatory restrictions; and |
| · | legislatively imposed consumer initiatives. |
Consequently, we could under-price risks, which would negatively affect our profit margins, or we could overprice risks, which could reduce our sales volume and competitiveness. In either event, the profitability of our insurance company could be materially and adversely affected.
Current operating resources are necessary to develop future new insurance products.
We currently intend to expand our product offerings by underwriting additional insurance products and programs, and marketing them through our distribution network. Expansion of our product offerings will result in increases in expenses due to additional costs incurred in actuarial rate justifications, software and personnel. Offering additional insurance products may also require regulatory approval, further increasing our costs. There can be no assurance that we will be successful bringing new insurance products to our marketplace in a manner that is profitable.
Increased competition, competitive pressures, industry developments and market conditions could affect the growth of our business and adversely impact our financial results.
We operate in highly competitive markets and face competition from national, regional and residual market insurance companies in the homeowners', commercial general liability, and automobile markets, many of whom are larger, have greater financial and other resources, have higher financial strength ratings and offer more diversified insurance coverage. Our competitors include companies that market their products through agents, as well as companies that sell insurance directly to their customers. Large national writers may have certain competitive advantages over agency writers, including increased name recognition, increased loyalty of their customer base and reduced policy acquisition costs. We may be forced to reduce our premiums significantly to compete, which could make us less profitable and have a material adverse effect on our business, results of operations and financial condition. If we do not meet the prices offered by our competitors, we may lose business in the short term, which could also result in a material adverse effect on our business, results of operations and financial condition.
Federated National Holding Company
Our ability to compete successfully in states outside of Florida and to expand our business footprint may also be negatively affected by our lack of an A. M. Best rating of our financial strength. Although our insurance subsidiary has a Demotech rating of "A" (Exceptional), which is generally accepted in Florida and certain other states, a rating by A. M. Best is more widely accepted outside of Florida and may cause customers and agents to prefer a policy written by an A. M. Best-rated company over a policy written by us. In addition, some mortgage companies outside of Florida may require homeowners to obtain property insurance from an insurance company with a minimum A. M. Best rating.
We may not obtain the necessary regulatory approvals to organize the new property and casualty insurer in Florida that is the subject of our previously announced joint venture.
On July 21, 2014, we announced that we have entered into a joint venture to form a new property and casualty insurer in Florida to be named Monarch National Insurance Company (“Monarch”). As of the date of this report, the approval of the Florida OIR is pending. We may not be able to obtain the necessary approvals and any approvals received may be subject to conditions that will make organization of a new insurer impractical. Therefore, there can be no assurances that we will be able to achieve the purpose of the joint venture.
Once Monarch is organized, we will be required to consolidate Monarch's financial results with ours. As a result, our financial results may be impacted by our percentage share of any losses that Monarch would be likely to experience in its first years of operations.
We will own approximately 42.4% of the indirect parent of Monarch (“Monarch Parent”), which, together with our expected management of Monarch's operations, will require us to consolidate Monarch Parent’s financial results with ours under generally accepted accounting principles. Monarch Parent may experience operating losses as Monarch scales up its operations. As a result, our financial results may be negatively impacted to the extent that our percentage share of any losses exceeds the income earned as a result of the managing general agent services, we expect to provide Monarch.
We anticipate that Monarch will initially focus on the Florida homeowners' insurance market, which will increase our exposure to the factors that impact the Florida insurance market generally, such as the occurrence of hurricanes, trends in claims experience, and the impact of changes in Florida insurance law and regulations.
Monarch is intended to be organized as a Florida property and casualty insurer and, once organized, will initially focus primarily on the Florida homeowners' insurance market. As a result, the presence of Monarch in the Florida market will increase our exposure to the factors that impact insurers in the Florida market generally, such as the occurrence of catastrophic events such as hurricanes, the trends experienced in administering and resolving claims resulting from the increased use of private adjusters, and the impact of changes in Florida's insurance laws and regulations. To the extent that these factors may adversely affect our operations, the presence of Monarch in the Florida market will have the effect of magnifying the effect of those factors.
It is intended that Monarch will write insurance policies that will have a higher risk profile than those written by FNIC, allowing Monarch to reach a broader market and charge higher premiums. While Monarch's underwriting standards will avoid the highest risk policies, the occurrence of a catastrophic event could result in greater losses per policy for Monarch and have a material adverse effect on the Company’s results of operations, financial position and cash flows.
Our participation in the Florida Property Insurance Clearinghouse may not result in an increase in our premium revenue.
Pursuant to legislation passed by the Florida legislature in 2013 intended to reduce the insurance policy count of Citizens, a Florida not-for-profit, tax-exempt government corporation, the Property Insurance Clearinghouse (the “Clearinghouse”) launched in January 2014. This allows all potentially new and renewal policies of Citizens to be comparatively shopped by participating private market insurers before becoming, or remaining, policies of Citizens. We intend to be a participating insurance company in the Clearinghouse.
Applications to Citizens for new homeowners' policies and existing policies with Citizens up for renewal are submitted to insurance companies participating in the Clearinghouse. If that process identifies a carrier willing to write a new policy at a premium that is no more than 15% higher than Citizens' premium of comparable coverage or, in the case of a renewal, with a premium equal to or less than the policy's renewal premium with Citizens, then that homeowner is ineligible for coverage with Citizens. The homeowner may then choose to have an agent bind coverage with the homeowner's choice of the private market insurers that have made the homeowner a qualifying offer of coverage.
Federated National Holding Company
There can be no assurance that our policy count or gross premiums will increase as a result of our participation in the Clearinghouse, because our premiums may not be below the threshold required by Citizens, other carriers participating in the Clearinghouse may be willing to offer similar policies for lower premiums, or we may decide to not provide a quote on these policies if they do not meet our underwriting guidelines.
Our senior management team is critical to the strategic direction of our company. If there were an unplanned loss of service by any of our officers our business could be harmed.
We depend, and will continue to depend, on the services of our executive management team which includes Michael H. Braun, Chief Executive Officer and President and Peter J. Prygelski III, our Chief Financial Officer and Treasurer. Our success also will depend in part upon our ability to attract and retain qualified executive officers, experienced underwriting talent and other skilled employees who are knowledgeable about our business. If we were to lose the services of one or more members of our executive management team, our business could be adversely affected. Although we have employment agreements with our executive officers, any unplanned loss of service could substantially harm our business.
We are subject to extensive regulation and potential further restrictive regulation may increase our operating costs and limit our growth.
As an insurance company, we are subject to extensive laws and regulations. These laws and regulations are complex and subject to change. Moreover, they are administered and enforced by a number of different governmental authorities, including state insurance regulators, state securities administrators, the SEC, the U.S. Department of Justice, and state attorneys general, each of which exercises a degree of interpretive latitude. Consequently, we are subject to the risk that compliance with any particular regulator’s or enforcement authority’s interpretation of a legal issue may not result in compliance with another’s interpretation of the same issue, particularly when compliance is judged in hindsight. In addition, there is risk that any particular regulator’s or enforcement authority’s interpretation of a legal issue may change over time to our detriment, or that changes in the overall legal environment may, even absent any particular regulator’s or enforcement authority’s interpretation of a legal issue changing, cause us to change our views regarding the actions we need to take from a legal risk management perspective, thus necessitating changes to our practices that may, in some cases, limit our ability to grow and improve the profitability of our business. Furthermore, in some cases, these laws and regulations are designed to protect or benefit the interests of a specific constituency rather than a range of constituencies. For example, state insurance laws and regulations are generally intended to protect or benefit purchasers or users of insurance products, not holders of securities issued by us. In many respects, these laws and regulations limit our ability to grow and improve the profitability of our business.
In recent years, the state insurance regulatory framework has come under public scrutiny and members of Congress have discussed proposals to provide for federal chartering of insurance companies. We can make no assurances regarding the potential impact of state or federal measures that may change the nature or scope of insurance regulation.
New homeowners’ insurance operations outside of the State of Florida may not be profitable.
We plan to continue the expansion of admitted homeowners’ property and casualty programs into other states as opportunities avail themselves. Risks associated with execution of our planned operations include the inability to market an adequately priced policy, inadequate commission structures, and overpriced or unavailable catastrophic reinsurance for wind events. Additionally, each state has its own authoritative body designed to regulate the insurance products and operations of new and existing insurance companies under their respective authority. For example, during 2013 FNIC obtained regulatory approval to initiate a new homeowners’ property and casualty program in the State of Louisiana.
There can be no guarantees that our operations will be profitable in a given state nor can there be any guarantees that the state authorities will allow us to do business in that state.
We face risks in connection with potential material weakness resulting from our Sarbanes-Oxley Section 404 management report and any related remedial measures that we undertake.
In conjunction with our ongoing reporting obligations as a public company and the requirements of Section 404 of the Sarbanes-Oxley Act, management reported on the effectiveness of our internal control over financial reporting as of December 31, 2014. In order to identify any material weaknesses in our internal control over financial reporting, we engaged in a process to document, evaluate and test our internal controls and procedures, including corrections to existing controls and implement additional controls and procedures that we may deem necessary. As a result of this evaluation and testing process, no material financial reporting deficiencies were noted.
Federated National Holding Company
Although we did not have any material weaknesses in our internal controls for our fiscal year ended December 31, 2014, we cannot be certain that there will be none in the future. In future periods, if the process required by Section 404 of the Sarbanes-Oxley Act reveals significant deficiencies or material weaknesses, the correction of any such significant deficiencies or material weaknesses could require additional remedial measures that could be costly and time-consuming. In addition, the discovery of material weaknesses could also require the restatement of prior period operating results. If a material weakness exists as of a future period year-end (including a material weakness identified prior to year-end for which there is an insufficient period of time to evaluate and confirm the effectiveness of the corrections or related new procedures), our management will be unable to report favorably as of such future period year-end as to the effectiveness of our control over financial reporting and we could lose investor confidence in the accuracy and completeness of our financial reports, which could have an adverse effect on our stock price and potentially subject us to litigation.
Risks Related to an Investment in Our Shares
Our stock price in recent years has been volatile and is likely to continue to be volatile. As a result, the market price of our common stock may drop below the price you pay, and you may not be able to resell your shares at a profit.
The market price of our common stock has experienced, and may continue to experience, significant volatility from time to time. Such volatility may be affected by various factors and events, such as:
|
·
|
our quarterly operating results, including a shortfall in operating revenue or net income from that expected by securities analysts and investors; |
|
·
|
recognition of large unanticipated accounting charges, such as related to a loss reserve enhancement;
|
|
·
|
changes in securities analysts’ estimates of our financial performance or the financial performance of our competitors or companies in our industry generally; |
|
·
|
the announcement of a material event or anticipated event involving us or our industry or the markets in which we operate; |
|
·
|
the issuance of a significant number of shares; and
|
|
·
|
the other risk factors described in this prospectus supplement, the accompanying prospectus and the documents incorporated by reference herein. |
In recent years, the U.S. stock market has experienced extreme price and volume fluctuations, which have sometimes affected the market price of the securities issued by a particular company in a manner unrelated to the operational performance of the company. This type of market effect could impact our common stock price as well. The volatility of our common stock means that the price of our common stock may have declined substantially at such time as you may look to sell your shares of our common stock. If our share price decreases, the value of your investment could decline.
If we report a material weakness in our internal controls and procedures, we may lose investor confidence and remedial measures may be costly.
In accordance with applicable law, we are required to document, evaluate and test our internal controls and procedures, including corrections to existing controls and implement additional controls and procedures that we may deem necessary, and to identify and report any material weakness in our internal control over financial reporting. As a result of this evaluation and testing process, no material weakness was identified or reported as of December 31, 2014. In fixture periods, if the process required by law reveals significant deficiencies or material weaknesses, the correction of any such significant deficiencies or material weaknesses could require additional remedial measures that could be costly and time consuming. In addition, the discovery of material weaknesses could also require the restatement of prior period operating results. If a material weakness exists and is reported as of a future period year-end (including a material weakness identified prior to year-end for which there is an insufficient period of time to evaluate and confirm the effectiveness of the corrections or related new procedures), we could lose investor confidence in the accuracy and completeness of our financial reports, which could have an adverse effect on our stock price and potentially subject us to litigation.
No system of internal control over financial reporting will prevent all errors and all fraud. A control system, no matter how well designed and operated, can provide only reasonable, not absolute, assurance that the control systems objectives will be met. Further, the design of a control system must reflect the fact that there are resource constraints, and the benefits of controls must be considered relative to their costs. Controls can be circumvented by the individual acts of some persons, by collusion of two or more people, or by management override of the controls. Over time, controls may become inadequate because changes in conditions or deterioration in the degree of compliance with policies or procedures may occur. Because of the inherent limitations in a cost-effective control system, misstatements due to error or fraud may occur and not be detected. As a result, we cannot assure you that significant deficiencies or material weaknesses in our internal control over financial reporting will be identified in the future.
Federated National Holding Company
Our controls and procedures may fail or be circumvented which could have a material adverse effect on our business, results of operations and financial condition.
We regularly review and update our internal controls, disclosure controls and procedures, and corporate governance policies and procedures. Any system of controls, however well designed and operated, is based in part on certain assumptions and can provide only reasonable, not absolute, assurances that the objectives of the system are met. Any failure or circumvention of our controls and procedures or failure to comply with regulations related to controls and procedures could have a material adverse effect on our business, results of operations and financial condition.
We have authorized but unissued preferred stock, which could affect rights of holders of common stock.
Our articles of incorporation authorize the issuance of preferred stock with designations, rights and preferences determined from time to time by our board of directors. Accordingly, our board of directors is empowered, without shareholder approval, to issue preferred stock with dividends, liquidation, conversion, voting or other rights that could adversely affect the voting power or other rights of the holders of common stock. In addition, the preferred stock could be issued as a method of discouraging a takeover attempt. Although we do not intend to issue any preferred stock at this time, we may do so in the future.
Provisions in our articles of incorporation and our bylaws, as amended, and the Florida Business Corporation Act could make it more difficult to acquire us and may reduce the market price of our common stock.
Our articles of incorporation and our bylaws presently contain certain provisions which may make it more difficult and time-consuming for shareholders or third parties to influence our management, policies or affairs, and may discourage, delay or prevent a transaction involving a change-in-control of the Company and offering a premium over the current market price of our common stock. These provisions include those which:
|
·
|
prohibit cumulative voting in the election of our directors,
|
|
·
|
establish a classified board of directors with staggered three-year terms,
|
|
·
|
provide that the written request of shareholders holding not less than one-third of all votes entitled to be cast on an issue is required for shareholders to call special meetings of our shareholders, |
|
·
|
establish advance notice and disclosure procedures for shareholders to bring matters, including nominations for election to our board, before a meeting of our shareholders, and |
|
·
|
eliminate the ability of shareholders to take action by written consent in lieu of a shareholder meeting.
|
As a result, we may be less likely to receive unsolicited offers to acquire us that some of our shareholders might consider beneficial.
The Florida Business Corporation Act, as amended, contains provisions, which our directors have elected not to opt out of, that are designed to enhance the ability of our board to respond to and potentially defer attempts to acquire control of the Company. These provisions may discourage altogether takeover attempts that have not been approved by our board. These provisions may also adversely affect the price that a potential purchaser would be willing to pay for our common stock and, therefore, deprive you of the opportunity to obtain a takeover premium for your shares. These provisions could make the removal of our incumbent directors and management more difficult. These provisions may enable a minority of our directors and the holders of a minority of our outstanding voting stock or the holders of an existing control block to prevent, delay, discourage or make more difficult a merger, tender offer or proxy contest, even though the transaction may be favorable to the interests of a majority of our non-affiliate shareholders. These provisions could also potentially adversely affect the market price of our common stock.
Federated National Holding Company
As a holding company, we depend on the earnings of our subsidiaries and their ability to pay management fees and dividends to the holding company as the primary source of our income.
We are an insurance holding company whose primary assets are the stock of our subsidiaries. Our operations, and our ability to pay dividends or service future potential debt, are limited by the earnings of our subsidiaries and their payment of their earnings to us in the form of management fees, commissions, dividends, loans, advances or the reimbursement of expenses. These payments can be made only when our subsidiaries have adequate earnings. In addition, dividend payments made to us by our insurance subsidiary are restricted by Florida law governing the insurance industry. Generally, Florida law limits the dividends payable by insurance companies under complicated formulas based on the subsidiary's available capital and earnings.
Payment of dividends in the future will depend on our earnings and financial position and such other factors, as our Board of Directors deems relevant. Moreover, our ability to continue to pay dividends may be restricted by regulatory limits on the amount of dividends that FNIC is permitted to pay to the parent company.
Future sales of our common stock may depress our stock price.
Sales of a substantial number of shares of our common stock in the public market or otherwise, by us or by a major shareholder, could depress the market price of our common stock and impair our ability to raise capital through the sale of additional equity securities.
In addition, we may issue additional shares of our common stock from time to time in the future in amounts that may be significant. The sale of substantial amounts of our common stock, or the perception that these sales may occur, could adversely impact our stock price.
As of December 31, 2014, there were 151,585 shares issuable upon the exercise of outstanding and exercisable stock options, 67,700 shares issuable upon the exercise of outstanding stock options that are unvested and 750,500 additional shares available for grant under our equity-based compensation plans. The market price of the common shares may be depressed by the potential exercise of these options or grant of these shares. The holders of these options are likely to exercise them when we would otherwise be able to obtain additional capital on more favorable terms than those provided by the options.
None
Our executive offices are now located at 14050 N.W. 14th Street, Suite 180, Sunrise, Florida 33323 in an 18,500 square foot office facility and our telephone number is (800) 293-2532. During March 2014, we extended our lease term to expire in August 2019 and expanded the leased premises to include an additional 13,642 square feet. All of our operations are consolidated within this facility. We believe that the facilities are well maintained, in substantial compliance with environmental laws and regulations, and adequately covered by insurance. We also believe that these leased facilities are not unique and could be replaced, if necessary, at the end of the lease term.
See Item 8 of Part II, “Financial Statements and Supplementary Data – Footnote 9 – Commitments and Contingencies”.
Not applicable.
Federated National Holding Company
|
MARKET FOR REGISTRANT’S COMMON EQUITY, RELATED STOCKHOLDER MATTERS AND ISSUER PURCHASES OF EQUITY SECURITIES
|
Our common stock is listed for trading on The NASDAQ Global Market under the symbol “FNHC”. The following table sets out the high and low closing sale prices as reported on The NASDAQ Global Market. These reported prices reflect inter-dealer prices without adjustments for retail markups, markdowns or commissions.
|
Quarter Ended
|
High
|
Low
|
||||||
|
March 31, 2014
|
$
|
18.40
|
$
|
12.17
|
||||
|
June 30, 2014
|
$
|
26.60
|
$
|
18.02
|
||||
|
September 30, 2014
|
$
|
28.22
|
$
|
19.70
|
||||
|
December 31, 2014
|
$
|
37.04
|
$
|
23.60
|
||||
|
March 31, 2013
|
$
|
7.90
|
$
|
5.35
|
||||
|
June 30, 2013
|
$
|
10.41
|
$
|
7.05
|
||||
|
September 30, 2013
|
$
|
10.89
|
$
|
8.43
|
||||
|
December 31, 2013
|
$
|
14.90
|
$
|
9.80
|
||||
As of March 2, 2015, there were 55 holders of record of our common stock. We believe that the number of beneficial owners of our common stock is in excess of 6,250.
DIVIDENDS
The Board of Directors of FNHC declared regular quarterly dividends as follows:
| · | $0.04 per common share payable on March 2, 2015 to shareholders of record as of February 2, 2015; |
| · | $0.03 per common share payable on June 2, September 2 and December 1, 2014 to shareholders of record as of May 5, August 4 and November 3, 2014; |
| · | $0.03 per common share payable on September 3 and December 2, 2013 and March 3, 2014 to shareholders of record as of August 5 and November 4, 2013 and February 3, 2014; |
| · | $0.02 per common share payable on December 28, 2012 and March 4, 2013 to shareholders of record as of December 3, 2012 and February 4, 2013. |
Payment of dividends in the future will depend on our earnings and financial position and such other factors, as our Board of Directors deems relevant. Moreover, our ability to continue to pay dividends may be restricted by regulatory limits on the amount of dividends that FNIC is permitted to pay to the parent company.
Federated National Holding Company
SECURITIES AUTHORIZED FOR ISSUANCE UNDER EQUITY COMPENSATION PLANS
The following table summarizes our equity compensation plans as of December 31, 2014. All equity compensation plans were approved by our shareholders. We have not granted any options, warrants or rights to our shareholders outside of these equity compensation plans.
|
Equity Compensation Plan Information
|
||||||||||||
|
Plan category
|
Number of securities to
be issued upon exercise of
outstanding options,
warrants and rights
|
Weighted-average
exercise price of
outstanding options,
warrants and rights
|
Number of securities
remaining available for
future issuance under
equity compensation plans
(excluding securities
reflected in column (a))
|
|||||||||
|
(a)
|
(b)
|
(c)
|
||||||||||
|
Equity compensation plans approved by stock holders*
|
667,086
|
12.55
|
750,500
|
|||||||||
* Includes the 1998 and 2002 Stock Option Plans and the 2012 Stock Incentive Plan.
For additional information concerning our capitalization please see Footnote 14 to our Consolidated Financial Statements included under Item 8 of this Annual Report on Form 10-K.
ISSUER REPURCHASES
During 2014 and 2013, the Company did not repurchase any common stock under previously announced stock repurchase plans.
SALES OF UNREGISTERED SECURITIES
None.
Federated National Holding Company
STOCK PERFORMANCE GRAPH
The following graph shows the cumulative total shareholder return on our common stock over the last five fiscal years as compared with the total returns of the NASDAQ Composite Index and the SNL Property & Casualty Insurance Index. In accordance with SEC rules, this graph includes indices that we believe are comparable and appropriate.
|
|
Federated National Holding Company
|
|
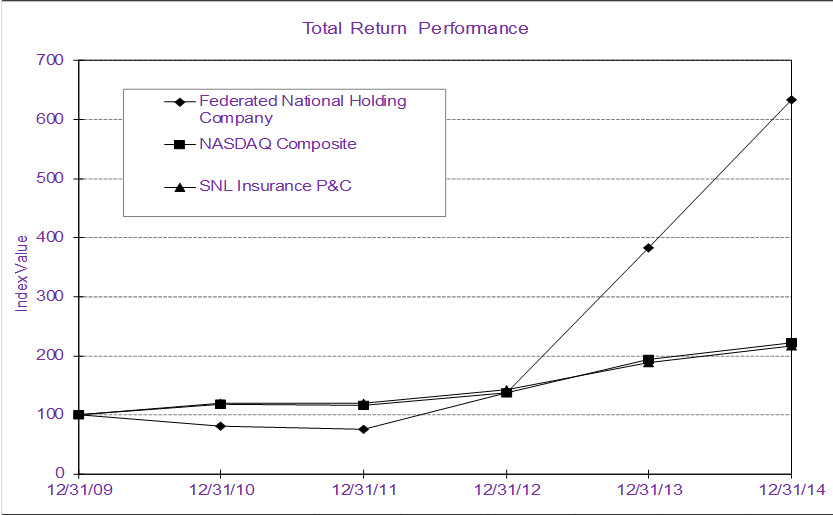
|
Period Ending
|
||||||||||||||||||||||||
|
Index
|
12/31/09
|
12/31/10
|
12/31/11
|
12/31/12
|
12/31/13
|
12/31/14
|
||||||||||||||||||
|
Federated National Holding Company
|
100.00
|
81.60
|
75.95
|
137.77
|
382.67
|
634.22
|
||||||||||||||||||
|
NASDAQ Composite
|
100.00
|
118.15
|
117.22
|
138.02
|
193.47
|
222.16
|
||||||||||||||||||
|
SNL Insurance P&C
|
100.00
|
119.24
|
120.55
|
142.31
|
188.53
|
216.52
|
||||||||||||||||||
Source : SNL Financial LC, Charlottesville, VA
© 2015
www.snl.com
Returns are based on the change in year-end to year-end price. The graph assumes $100 was invested on December 31, 2009 in our common stock, the NASDAQ Composite Index and the SNL Property & Casualty Insurance Index and that all dividends were reinvested. Past performance is not necessarily an indicator of future results.
Our filings with the SEC may incorporate information by reference, including this Form 10-K. Unless we specifically state otherwise, the information under this heading "Stock Performance Graph" shall not be deemed to be "soliciting materials" and shall not be deemed to be "filed" with the SEC or incorporated by reference into any of our filings under the Securities Act of 1933, as amended, or the Securities Exchange Act of 1934.
Federated National Holding Company
The following selected consolidated financial data should be read in conjunction with the consolidated financial statements and notes thereto and “Management’s Discussion and Analysis of Financial Condition and Results of Operations” appearing elsewhere in this Annual Report on Form 10-K.
|
As of the Years Ended December 31,
|
||||||||||||||||||||
| (Amounts in Thousands except Book Value Per Share) | ||||||||||||||||||||
|
2014
|
2013
|
2012
|
2011
|
2010
|
||||||||||||||||
|
Balance Sheet Data
|
||||||||||||||||||||
|
Assets:
|
||||||||||||||||||||
|
Cash and investments
|
$
|
370,920
|
$
|
262,156
|
$
|
151,238
|
$
|
144,672
|
$
|
138,691
|
||||||||||
|
Total assets
|
503,631
|
316,741
|
185,888
|
179,980
|
184,049
|
|||||||||||||||
|
Liabilities:
|
||||||||||||||||||||
|
Unpaid losses and LAE
|
78,330
|
61,016
|
49,908
|
59,983
|
66,529
|
|||||||||||||||
|
Unearned premiums
|
192,424
|
128,343
|
59,006
|
47,933
|
47,136
|
|||||||||||||||
|
Total liabilities
|
311,052
|
208,247
|
119,983
|
121,836
|
126,118
|
|||||||||||||||
|
Total shareholders' equity
|
192,579
|
108,494
|
65,905
|
58,144
|
57,931
|
|||||||||||||||
|
Book value per share
|
$
|
14.13
|
$
|
9.95
|
$
|
8.26
|
$
|
7.32
|
$
|
7.29
|
||||||||||
|
Statutory surplus
|
125,330
|
76,889
|
52,012
|
39,307
|
40,603
|
|||||||||||||||
Federated National Holding Company
| Years Ended December 31, | ||||||||||||||||||||
| (Amounts in Thousands except EPS and Dividends) | ||||||||||||||||||||
|
2014
|
2013
|
2012
|
2011
|
2010
|
||||||||||||||||
|
Operations Data:
|
||||||||||||||||||||
|
Revenue:
|
||||||||||||||||||||
|
Gross premiums written
|
$
|
377,156
|
$
|
243,373
|
$
|
119,459
|
$
|
98,269
|
$
|
96,410
|
||||||||||
|
Gross premiums ceded
|
(201,998
|
)
|
(82,708
|
)
|
(51,085
|
)
|
(46,293
|
)
|
(52,963
|
)
|
||||||||||
|
Net premiums written
|
175,158
|
160,665
|
68,374
|
51,976
|
43,447
|
|||||||||||||||
|
Increase (decrease) in prepaid reinsurance premiums
|
59,828
|
13,052
|
2,059
|
(2,656
|
)
|
(2,108
|
)
|
|||||||||||||
|
(Increase) decrease in unearned premiums
|
(64,081
|
)
|
(69,336
|
)
|
(11,074
|
)
|
(797
|
)
|
3,721
|
|||||||||||
|
Net change in prepaid reinsurance premiums and unearned premiums
|
(4,253
|
)
|
(56,284
|
)
|
(9,015
|
)
|
(3,453
|
)
|
1,613
|
|||||||||||
|
Net premiums earned
|
170,905
|
104,381
|
59,359
|
48,523
|
45,060
|
|||||||||||||||
|
Commission income
|
4,517
|
2,646
|
1,377
|
994
|
1,388
|
|||||||||||||||
|
Finance revenue
|
1,466
|
866
|
496
|
518
|
395
|
|||||||||||||||
|
Direct written policy fees
|
8,689
|
6,196
|
2,007
|
1,583
|
1,609
|
|||||||||||||||
|
Net investment income
|
5,385
|
3,332
|
3,819
|
4,079
|
3,726
|
|||||||||||||||
|
Net realized investment gains
|
4,426
|
2,881
|
1,072
|
2,725
|
6,777
|
|||||||||||||||
|
Regulatory assessments recovered
|
-
|
-
|
-
|
-
|
857
|
|||||||||||||||
|
Other income
|
2,512
|
1,435
|
517
|
1,741
|
792
|
|||||||||||||||
|
Quota-share profit sharing, net
|
2,792
|
-
|
-
|
-
|
-
|
|||||||||||||||
|
Total revenue
|
200,692
|
121,737
|
68,647
|
60,163
|
60,604
|
|||||||||||||||
|
Expenses:
|
||||||||||||||||||||
|
Losses and LAE
|
81,036
|
56,410
|
30,209
|
30,896
|
40,088
|
|||||||||||||||
|
Operating and underwriting expenses
|
19,906
|
14,474
|
9,996
|
9,916
|
10,835
|
|||||||||||||||
|
Salaries and wages
|
14,968
|
10,188
|
8,439
|
8,004
|
8,611
|
|||||||||||||||
|
Amortization of deferred policy acquisition costs
|
27,475
|
21,447
|
13,255
|
12,347
|
13,025
|
|||||||||||||||
|
Total expenses
|
143,385
|
102,519
|
61,899
|
61,163
|
72,559
|
|||||||||||||||
|
Income (loss) before provision for income tax expense (benefit)
|
57,307
|
19,218
|
6,748
|
(1,000
|
)
|
(11,955
|
)
|
|||||||||||||
|
Provision for income tax expense (benefit)
|
20,108
|
6,491
|
2,435
|
(570
|
)
|
(3,959
|
)
|
|||||||||||||
|
Net income (loss)
|
$
|
37,199
|
$
|
12,727
|
$
|
4,313
|
$
|
(430
|
)
|
$
|
(7,996
|
)
|
||||||||
|
Earnings per share data
|
||||||||||||||||||||
|
Net income (loss) per share - basic
|
$
|
3.08
|
$
|
1.50
|
$
|
0.53
|
$
|
(0.05
|
)
|
$
|
(1.01
|
)
|
||||||||
|
Net income (loss) per share - diluted
|
$
|
2.99
|
$
|
1.45
|
$
|
0.53
|
$
|
(0.05
|
)
|
$
|
(1.01
|
)
|
||||||||
|
Dividends paid per share
|
$
|
0.13
|
$
|
0.11
|
$
|
0.02
|
$
|
-
|
$
|
0.06
|
||||||||||
Federated National Holding Company
Management’s Discussion and Analysis of Financial Condition and Results of Operations
OVERVIEW
Federated National Holding Company (“FNHC”, “Company”, “we”, “us”), formerly known as 21st Century Holding Company, is an insurance holding company that controls substantially all steps in the insurance underwriting, distribution and claims processes through our subsidiaries and our contractual relationships with our independent agents and general agents. We changed our name on September 11, 2012, pursuant to approval received at our annual shareholders’ meeting, from 21st Century Holding Company so that our parent company and other subsidiary companies’ names are consistent with our primary insurance subsidiary and the name under which we have been writing insurance for more than 23 years.
We are authorized to underwrite, and/or place through our wholly owned subsidiaries, homeowners’ multi-peril (“homeowners”), commercial general liability, federal flood, personal auto and various other lines of insurance in Florida and various other states. We market and distribute our own and third-party insurers’ products and our other services through a network of independent agents.
Our insurance subsidiary is Federated National Insurance Company (“FNIC”). FNIC is licensed as an admitted carrier in Florida. An admitted carrier is an insurance company that has received a license from the state department of insurance giving the company the authority to write specific lines of insurance in that state. These companies are also bound by rate and form regulations, and are strictly regulated to protect policyholders from a variety of illegal and unethical practices, including fraud. Admitted carriers are also required to financially contribute to the state guarantee fund, which is used to pay for losses if an insurance carrier becomes insolvent or unable to pay the losses due their policyholders. Through contractual relationships with a network of approximately 3,600 independent agents, of which approximately 2,300 actively sell and service our products, FNIC is authorized to underwrite homeowners’, commercial general liability, fire, allied lines and personal and commercial automobile insurance in Florida. FNIC is licensed as an admitted carrier in Alabama, Louisiana, Georgia and Texas and underwrites commercial general liability insurance in those states. FNIC also underwrites homeowners’ insurance in Louisiana and Alabama, commencing in October 2014. Additionally, we underwrite personal automobile insurance in Georgia and Texas.
FNIC is licensed as a non-admitted carrier in Missouri, Nevada and South Carolina and can underwrite commercial general liability insurance in all of these states. Currently, we do not have any operations in these states. A non-admitted carrier, sometimes referred to as an “excess and surplus lines” carrier, is permitted to do business in a state and, although it is strictly regulated to protect policyholders from a variety of illegal and unethical practices, including fraud, non-admitted carriers are subject to considerably less regulation with respect to policy rates and forms. Non-admitted carriers are not required to financially contribute to and benefit from the state guarantee fund, which is used to pay for losses if an insurance carrier becomes insolvent or unable to pay the losses due their policyholders.
We internally process claims made by our insureds through our wholly owned claims adjusting company, Federated National Adjusting, Inc. (“FNA”). Our agents have no authority to settle claims or otherwise exercise control over the claims process. Furthermore, we believe that the retention of independent adjusters, in addition to the employment of salaried claims personnel, results in reduced ultimate loss payments, lower Losses and loss adjustment expenses (“LAE”) and improved customer service for our claimants and policyholders. We also employ an in-house litigation management team to cost effectively manage claims-related litigation and to monitor our claims handling practices for efficiency and regulatory compliance.
During 2014, the Florida Office of Insurance Regulation (“Florida OIR”) approved an application to allow the claims administration operations of FNA to be assumed by FedNat Underwriters, Inc. (“FNU”), formerly known as Federated National Underwriters Inc., a wholly owned subsidiary of the Company. Under the amended managing general agency agreement between FNU and FNIC, FNU will provide the same claims administration services under the same fee structure. The combination of these services in FNU had no effect on consolidated net income.
FNU acts as FNIC’s exclusive managing general agent in Florida and is also licensed as a managing general agent in the States of Alabama, Georgia, Louisiana, Mississippi, Nevada, South Carolina and Texas. FNU has contracted with other unaffiliated insurance companies to sell personal umbrella through FNU’s existing network of agents.
FNU earns commissions and fees for providing policy administration, marketing, accounting and analytical services, and for participating in the negotiation of reinsurance contracts. FNU earns a per policy fee which ranges from $25 to $55 and a commission fee from its affiliate, FNIC, which totaled 4% during 2014. The Florida OIR periodically reviews our managing general agent’s fee structure to ensure that it is neither excessive nor inadequate to operate.
Federated National Holding Company
Management’s Discussion and Analysis of Financial Condition and Results of Operations
The homeowner policy provides FNU the right to cancel any policy within a period of 90 days from the policy's inception with 25 days’ notice, or after 90 days from policy inception with 95 days’ notice, even if the risk falls within our underwriting criteria.
Although we are authorized to underwrite the various lines described above, our business is primarily underwriting homeowners’ policies. During 2014, 91.4%, 3.3%, 2.0% and 3.3% of the premiums we underwrote were for homeowners’, commercial general liability, federal flood, and personal automobile insurance, respectively. During 2014, $39.6 million or 11.0% of the $344.9 million of homeowners’ premiums we underwrote were produced under an agency agreement with Ivantage Select Agency, Inc. (“ISA”), an affiliate of Allstate Insurance Company, that grants Allstate agents the authority to offer certain FNU products. The $39.6 million of homeowners’ premiums produced under this agreement with ISA represents 31.0% of the total increase in the sale of homeowners’ policies during 2014, compared with 2013. This network of agents began writing for FNIC in March 2013. During 2013, 89.6%, 4.3%, 2.6% and 3.5% of the premiums we underwrote were for homeowners’, commercial general liability, federal flood, and personal automobile insurance, respectively.
During the years ended December 31, 2014, 2013 or 2012, we did not experience any weather-related catastrophic events such as the hurricanes that occurred in Florida during 2005 and 2004. We are not able to predict how hurricanes or other insurable events will affect our future results of operations and liquidity. Losses and LAE are affected by a number of factors, many of which are partially or entirely beyond our control, including the following.
| · | the nature and severity of the loss; |
| · | weather-related patterns; |
| · | the availability, cost and terms of reinsurance; |
| · | underlying settlement costs, including medical and legal costs; |
| · | legal and political factors such as legislative initiatives and public opinion; |
| · | macroeconomic issues. |
Our business, results of operations and financial condition are subject to fluctuations due to a variety of factors. Abnormally high severity or frequency of claims in any period could have a material adverse effect on us. When our estimated liabilities for unpaid losses and LAE are less than the actuarially determined amounts, we increase the expense in the current period. Conversely, when our estimated liabilities for unpaid losses and LAE are greater than the actuarially determined amounts, we decrease the expense in the current period.
Our goal in our reinsurance strategy is to equalize the liquidity requirements imposed by most severe insurable events and by all other insurable events we manage in the normal course of business. Please see “Reinsurance Agreements” under “Item 1. Business” for a more detailed description of our reinsurance agreements and strategy.
Overview of Premium Growth
Gross premiums written increased $133.8 million, or 55.0%, to $377.2 million for 2014, compared with $243.4 million for 2013. Florida homeowners’ represents 94% and Texas private passenger automobile represents the remaining 6% of the increased premium volume. We believe that our growth in 2014 reflects management’s efforts over several years. Our success today reflects our goal to be an agent-friendly carrier that provides exceptional service. We have invested in our agent relationships and our staff, created easy-to-use systems for the agent, and increased our relevance to the agents’ operations by providing insurance products that meet their market needs.
Our homeowner business contributed $126.6 million or 95.0% of the increased gross written premiums during the year ended December 31, 2014. This increase was the result of:
| · | policyholders continuing to renew their FNIC homeowners’ policy, |
| · | a “flight to quality” in the market by agents who seek quality carriers to place their business, and |
| · | supporting a marketing team dedicated to promoting the quality and quantity of products and services that we offer. |
Federated National Holding Company
Management’s Discussion and Analysis of Financial Condition and Results of Operations
During 2014, approximately 88% of our policyholders renewed their Florida homeowner policies. We believe that high retention rate reflects the confidence that the policyholder and his agent have in our financial stability and strength and in our commitment to adjusting claims quickly and fairly.
CRITICAL ACCOUNTING POLICIES
The preparation of financial statements in conformity with Generally Accepted Accounting Principles (“GAAP”) requires management to make estimates and assumptions about future events that affect the amounts reported in the financial statements and accompanying notes. Future events and their effects cannot be determined with absolute certainty. Therefore, the determination of estimates requires the exercise of judgment. Actual results inevitably will differ from those estimates, and such differences may be material to the financial statements.
The most significant accounting estimates inherent in the preparation of our financial statements include estimates associated with management’s evaluation of the determination of (i) liability for unpaid losses and LAE, (ii) the amount and recoverability of amortization of Deferred Policy Acquisition Costs (“DPAC”), and (iii) estimates for our reserves with respect to finance contracts, premiums receivable and deferred income taxes. Various assumptions and other factors underlie the determination of these significant estimates, which are described in greater detail in Footnote 2 in this Form 10-K.
Except as described below, we believe that in 2014 there were no significant changes in those critical accounting policies and estimates. Senior management has reviewed the development and selection of our critical accounting policies and estimates and their disclosure in this Form 10-K with the Audit Committee of our Board of Directors.
The process of determining significant estimates is fact-specific and takes into account factors such as historical experience, current and expected economic conditions, and in the case of unpaid losses and LAE, an actuarial valuation. Management regularly reevaluates these significant factors and makes adjustments where facts and circumstances dictate. In selecting the best estimate, we utilize various actuarial methodologies. Each of these methodologies is designed to forecast the number of claims we will be called upon to pay and the amounts we will pay on average to settle those claims. In arriving at our best estimate, our actuaries consider the likely predictive value of the various loss development methodologies employed in light of underwriting practices, premium rate changes and claim settlement practices that may have occurred, and weight the credibility of each methodology. Our actuarial methodologies take into account various factors, including, but not limited to, paid losses, liability estimates for reported losses, paid allocated LAE, salvage and other recoveries received, reported claim counts, open claim counts and counts for claims closed with and without payment for loss.
Accounting for loss contingencies pursuant to Financial Accounting Standards Board (“FASB”) issued guidance involves the existence of a condition, situation or set of circumstances involving uncertainty as to possible loss that will ultimately be resolved when one or more future event(s) occur or fail to occur. Additionally, accounting for a loss contingency requires management to assess each event as probable, reasonably possible or remote. Probable is defined as the future event or events are likely to occur. Reasonably possible is defined as the chance of the future event or events occurring is more than remote but less than probable, while remote is defined as the chance of the future event or events occurring is slight. An estimated loss in connection with a loss contingency shall be recorded by a charge to current operations if both of the following conditions are met: First, the amount can be reasonably estimated, and second, the information available prior to issuance of the financial statements indicates that it is probable that a liability has been incurred at the date of the financial statements. It is implicit in this condition that it is probable that one or more future events will occur confirming the fact of the loss or incurrence of a liability.
FASB issued guidance addresses accounting and reporting for (a) investments in equity securities that have readily determinable fair values and (b) all investments in debt securities. We account for our investment securities consistent with FASB issued guidance that requires our securities to be classified into one of three categories: (i) held-to-maturity, (ii) trading securities or (iii) available-for-sale.
Investments classified as held-to-maturity include debt securities wherein the Company’s intent and ability are to hold the investment until maturity and are carried at amortized cost without consideration to unrealized gains or losses. Investments classified as trading securities include debt and equity securities bought and held primarily for sale in the near term and are carried at fair value with unrealized holding gains and losses included in current period operations. Investments classified as available-for-sale include debt and equity securities that are not classified as held-to-maturity or as trading security investments and are carried at fair value with unrealized holding gains and losses excluded from earnings and reported as a separate component of shareholders’ equity, namely “Other Comprehensive Income.”
Federated National Holding Company
Management’s Discussion and Analysis of Financial Condition and Results of Operations
Overview of Management’s Loss Reserving Process
The Company’s loss reserves can generally be categorized into two distinct groups. One group is short-tail classes of business consisting principally of property risks in connection with homes and automobiles. The other group is long-tail casualty classes of business which include primarily commercial general liability and to a much lesser extent, homeowner and automobile liability. For operations writing short-tail coverages our loss reserves were generally geared toward determining an expected loss ratio for current business rather than maintaining a reserve for the outstanding exposure. Estimations of ultimate net loss reserves for long-tail casualty classes of business is a more complex process and depends on a number of factors including class and volume of business involved. Experience in the more recent accident years of long-tail casualty classes of business shows limited statistical credibility in reported net losses because a relatively low proportion of net losses would be reported claims and expenses and even smaller percentage would be net losses paid. Therefore, incurred but not yet reported (“IBNR”) would constitute a relatively high proportion of net losses.
Additionally, the different methodologies are utilized the same, regardless of the line of business. However, the final selection of ultimate loss and LAE is certain to vary by both line of business and by accident period maturity. There is no prescribed combination of line of business, accident year maturity, and methodologies; consistency in results of the different methodologies and reasonableness of the result are the primary factors that drive the final selection of ultimate loss and LAE.
Methods Used to Estimate Loss and LAE Reserves
The methods we use for our short-tail business do not differ from the methods we use for our long-tail business. The Incurred and Paid Development Methods intrinsically recognize the unique development characteristics contained within the historical experience of each material short-tail and long-tail line of business. The Incurred and Paid Cape Cod Methods reflect similar historical development unique to each material short-tail and long-tail line of business.
We apply the following general methods in projecting loss and LAE reserves:
| · | Paid and Incurred Loss Development Method |
| · | Paid and Incurred Bornhuetter-Ferguson Incurred Method |
| · | Frequency / Severity Method |
Description of Ultimate Loss Estimation Methods
The estimated Ultimate Loss and Defense and Cost Containment Expense (“DCCE”) is based on an analysis by line of business, coverage and by accident quarter performed using data as of December 31, 2014. The analysis relies primarily on four actuarial methods: Incurred Loss and DCCE Development Method, Paid Loss and DCCE Development Method, Bornhuetter-Ferguson Incurred Method, and Bornhuetter-Ferguson Paid Method. Each method relies on company experience, and, where relevant, the analysis includes comparisons to industry experience. The following is a description of each of these methods:
Incurred Loss and DCCE Development Method – This reserving method is based on the assumption that the historical incurred loss and DCCE development pattern as reflected by the Company is appropriate for estimating the future loss & DCCE development. Incurred paid plus case amounts separated by accident quarter of occurrence and at quarterly evaluations are used in this analysis. Case reserves do not have to be adequately stated for this method to be effective; they only need to have a fairly consistent level of adequacy at all stages of maturity. Historical “age-to-age” loss development factors were calculated to measure the relative development of an accident quarter from one maturity point to the next. Loss and DCCE development factors (“LDF”) are selected based on a review of the historical relationships between incurred loss & DCCE at successive valuations and based on industry patterns. The LDFs are multiplied together to derive cumulative LDF’s that, when multiplied by actual incurred loss and DCCE, produce estimates of ultimate loss and DCCE.
Paid Loss & DCCE Development Method – This method is similar to the Incurred Loss & DCCE Development Method only paid loss & DCCE and paid patterns are substituted for the incurred loss & DCCE and incurred patterns.
Bornhuetter-Ferguson Incurred Method – This reserving method combines estimated initial expected unreported loss & DCCE with the actual loss & DCCE to yield the ultimate loss & DCCE estimate. Expected unreported loss & DCCE are equal to expected total loss & DCCE times the expected unreported percentage of loss & DCCE for each policy year. The incurred loss & DCCE emergence pattern used to determine the unreported percentages in our projections is based on the selected LDF’s from the Incurred Loss & DCCE Development Method described above. The estimate of initial expected total loss & DCCE is based on the historical loss ratio for more mature accident years. While this approach reduces the independence of the Bornhuetter-Ferguson Method from the loss & DCCE development methods for older policy years, it is used primarily for estimating ultimate loss & DCCE for more recent, less mature, policy years.
Federated National Holding Company
Management’s Discussion and Analysis of Financial Condition and Results of Operations
Bornhuetter-Ferguson Paid Method – This method is similar to the Bornhuetter-Ferguson Incurred Method only paid loss & DCCE and paid patterns are substituted for the incurred loss & DCCE and incurred patterns.
We select an estimate of ultimate loss & DCCE for each accident quarter after considering the results of each projection method for the quarter and the relative maturity of the quarter (the time elapsed between the start of the quarter and December 31, 2014). Reserves for unpaid losses & DCCE for each quarter are the differences between these ultimate estimates and the amount already paid. The reserves for each quarter and each coverage are summed, and the result is the overall estimate of unpaid losses & DCCE liability for the company.
We also produce an estimate of unpaid Adjusting and Other Expense (“A&O”), as a reserve is required under Statutory Accounting Principles (“SAP”) even if this expense has been pre-paid or with an unconsolidated affiliate. Although we do not prepay for A&O, the majority of the A&O incurred is with an affiliated company and eliminated under the accounting principles for consolidation. The unpaid A&O is added to unpaid losses & DCCE, resulting in total unpaid losses and LAE.
The validity of the results from using a loss development approach can be affected by many conditions, such as internal claim department processing changes, a shift between single and multiple claim payments, legal changes, or variations in a company’s mix of business from year to year. Also, since the percentage of losses paid for immature years is often low, development factors can be volatile. A small variation in the number of claims paid can have a leveraging effect that could lead to significant changes in estimated ultimate values. Accordingly, our reserves are estimates because there are uncertainties inherent in the determination of ultimate losses. Court decisions, regulatory changes and economic conditions can affect the ultimate cost of claims that occurred in the past as well as create uncertainties regarding future loss cost trends. We compute our estimated ultimate liability using the most appropriate principles and procedures applicable to the lines of business written. However, because the establishment of loss reserves is an inherently uncertain process, we cannot be certain that ultimate losses will not exceed the established loss reserves and have a material adverse effect on our results of operations and financial condition.
Frequency / Severity Method – This method separately estimates the two components of ultimate losses (the frequency, or number of claims and the severity, or cost per claim) and then combines the resulting estimates in a multiplicative fashion to estimate ultimate losses. The approach is valuable because sometimes there is more inherent stability in the frequency and severity data when viewed separately than in the total losses.
We developed reported claim counts to ultimate levels using the development approach. The mechanics of this approach are the same as we described previously for paid and incurred losses. The validity of the results of this method depends on the stability of claim reporting and settlement rates. Then we developed accident year incurred severities (incurred losses divided by reported claim counts) to ultimate levels using the development approach.
We trended these severities to accident year 2014 levels. Trend rates were selected based on a review of historical severities. Selected severity was chosen based on judgment considering the developed severities and the trended severities, considering industry benchmarks for each segment. The loss & ALAE, claim count and severity triangles are evaluated as of 12 months, 24 months, 36 months etc. We selected loss development factors based on the loss development history, to the extent credible, and supplemented with industry data where appropriate.
A key assumption underlying the estimation of the reserve for loss and LAE is that past experience serves as the most reliable estimator of future events. This assumption may materially affect the estimates when the insurance market, the regulatory environment, the legal environment, the economic environment, the book of business, the claims handling department, or other factors (known or unknown) have varied over time during the experience period and / or will vary (expectedly or unexpectedly) in the future. Changes in estimates, or differences between estimates and amounts ultimately paid, are reflected in the operating results of the period during which such adjustments are made. Therefore, the ultimate liability for unpaid losses and LAE will likely differ from the amount recorded at December 31, 2014.
Federated National Holding Company
Management’s Discussion and Analysis of Financial Condition and Results of Operations
The following describes the extent of our procedures for determining the reserve for loss and LAE on both an annual and interim reporting basis:
Annually - Our policy is to select a single point estimate that best reflects our in-house actuarial determination for unpaid losses and LAE. Our independent actuarial firm, examining the exact same data set, will independently select a point estimate which determines a high point and low point range. Both processes rely on objective and subjective determinations. If our point estimate falls within the range determined from the point estimate of our actuary, then the Company’s policy has been that no adjustments by management would be required. In consideration thereof, the company does not have a policy for adjusting the liability for unpaid losses and LAE to an amount that is different than an amount set forth within the range determined by our independent actuary, although the reserve level ultimately determined by us may not be the mid-point of our independent actuary’s range. Further, there can be no assurances that our actual losses will be within our actuary’s range. Our independent actuary’s report expressly states that the report is based on assumptions developed from its own analysis and based on information provided by management and that notwithstanding its analysis, there is a significant risk of material adverse deviation from its range.
Interim – During 2014 our interim approach was very similar to the annual process noted above.
A number of other actuarial assumptions are generally made in the review of reserves for each class of business.
For each class of business, expected ultimate loss ratios for each accident year are estimated based on loss reserve development patterns. The expected loss ratio generally reflects the projected loss ratio from prior accident years, adjusted for the loss trend and the effect of rate changes and other quantifiable factors on the loss ratio.
In practice there are factors that change over time; however, many (such as inflation) are intrinsically reflected in the historical development patterns, and others typically do not materially affect the estimate of the reserve for unpaid losses and LAE. Therefore, no specific adjustments have been incorporated for such contingencies projecting future development of losses and LAE. There are no key assumptions as of December 31, 2014 premised on future emergence inconsistent with historical loss reserve development patterns.
The table below distinguishes total loss reserves between IBNR, as discussed above, and case estimates for specific claims as established by routine claims management.
|
Reserves for unpaid loss and LAE net of reinsurance recoverable as of December 31, 2014
|
Case Loss Reserves
|
Case LAE Reserves
|
Total Case Reserves
|
IBNR Reserves (Including LAE)
|
Reinsurance Recoverable on Unpaid Loss and Loss Expenses
|
Net Reserves
|
||||||||||||||||||
|
(Dollars in Thousands)
|
||||||||||||||||||||||||
|
Homeowners'
|
$
|
12,095
|
$
|
2,127
|
$
|
14,222
|
$
|
41,425
|
$
|
9,815
|
$
|
45,832
|
||||||||||||
|
Commercial General Liability
|
4,438
|
1,208
|
5,646
|
12,669
|
-
|
18,315
|
||||||||||||||||||
|
Automobile
|
3,404
|
258
|
3,662
|
706
|
2,719
|
1,649
|
||||||||||||||||||
|
Total
|
$
|
19,937
|
$
|
3,593
|
$
|
23,530
|
$
|
54,800
|
$
|
12,534
|
$
|
65,796
|
||||||||||||
|
Reserves for unpaid loss and LAE net of reinsurance recoverable as of December 31, 2013
|
Case Loss Reserves
|
Case LAE Reserves
|
Total Case Reserves
|
IBNR Reserves (Including LAE)
|
Reinsurance Recoverable on Unpaid Loss and Loss Expenses
|
Net Reserves
|
||||||||||||||||||
|
(Dollars in Thousands)
|
||||||||||||||||||||||||
|
Homeowners'
|
$
|
10,106
|
$
|
1,292
|
$
|
11,398
|
$
|
23,749
|
$
|
25
|
$
|
35,122
|
||||||||||||
|
Commercial General Liability
|
2,404
|
1,099
|
3,503
|
13,366
|
-
|
16,869
|
||||||||||||||||||
|
Automobile
|
5,037
|
3,211
|
8,248
|
752
|
2,717
|
6,283
|
||||||||||||||||||
|
Total
|
$
|
17,547
|
$
|
5,602
|
$
|
23,149
|
$
|
37,867
|
$
|
2,742
|
$
|
58,274
|
||||||||||||
Federated National Holding Company
Management’s Discussion and Analysis of Financial Condition and Results of Operations
Our reported results, financial position and liquidity would be affected by likely changes in key assumptions that determine our net loss reserves. The table below illustrates the change to equity that would occur as a result of a change in loss and LAE reserves, net of reinsurance.
|
Years Ended December 31,
|
||||||||||||||||
|
2014
|
2013
|
|||||||||||||||
|
Change in loss and
LAE reserves, net of
reinsurance
|
Adjusted loss and
LAE reserves, net of
reinsurance
|
Percentage
change in
equity (1)
|
Adjusted loss and
LAE reserves, net of
reinsurance
|
Percentage
change in
equity (1)
|
||||||||||||
|
(Dollars in Thousands)
|
||||||||||||||||
|
-10.0%
|
59,217
|
2.2
|
%
|
52,447
|
3.6
|
%
|
||||||||||
|
-7.5%
|
60,861
|
1.7
|
%
|
53,903
|
2.7
|
%
|
||||||||||
|
-5.0%
|
62,506
|
1.1
|
%
|
55,360
|
1.8
|
%
|
||||||||||
|
-2.5%
|
64,151
|
0.6
|
%
|
56,817
|
0.9
|
%
|
||||||||||
|
Base
|
65,796
|
-
|
58,274
|
-
|
||||||||||||
|
2.5%
|
67,441
|
-0.6
|
%
|
59,731
|
-0.9
|
%
|
||||||||||
|
5.0%
|
69,086
|
-1.1
|
%
|
61,188
|
-1.8
|
%
|
||||||||||
|
7.5%
|
70,731
|
-1.7
|
%
|
62,645
|
-2.7
|
%
|
||||||||||
|
10.0%
|
72,376
|
-2.2
|
%
|
64,101
|
-3.6
|
%
|
||||||||||
|
(1)
|
Net of tax
|
For the year ended December 31, 2014, our actuarial firm determined range of statutory loss and LAE reserves on a net basis range from a low of $61.7 million to a high of $72.2 million, with a best estimate of $66.2 million. The Company’s net loss and LAE reserves are carried on a statutory basis at $68.2 million, and on a GAAP consolidated basis at $61.0 million which when netted with our $2.7 million reinsurance recoverable totals $58.3 million. The Company’s statutory point estimate for its reserves as of December 31, 2014 is 3.0% above our actuary’s best estimate, which reflects management’s current analysis of the status and expected timing of our anticipated claims, our analysis of expected weather patterns in the regions in which we sell policies, our re-focus of our business growth efforts to areas outside of South Florida, and other factors.
We are required to review the contractual terms of all our reinsurance purchases to ensure compliance with FASB issued guidance. The guidance establishes the conditions required for a contract with a reinsurer to be accounted for as reinsurance and prescribes accounting and reporting standards for those contracts. Contracts that do not result in the reasonable possibility that the reinsurer may realize a significant loss from the insurance risk assumed generally do not meet the conditions for reinsurance accounting and must be accounted for as deposits. The guidance also requires us to disclose the nature, purpose and effect of reinsurance transactions, including the premium amounts associated with reinsurance assumed and ceded. It also requires disclosure of concentrations of credit risk associated with reinsurance receivables and prepaid reinsurance premiums.
Please see Footnote 2 of the Notes to Consolidated Financial Statements for additional discussions regarding critical accounting policies.
RECENT ACCOUNTING PRONOUNCEMENTS
See Note 2(n), “Summary of Significant Accounting Policies – Recent Accounting Pronouncements” in the Notes to the Condensed Consolidated Financial Statements for a discussion of recent accounting pronouncements and their effect, if any, on the Company.
Federated National Holding Company
Management’s Discussion and Analysis of Financial Condition and Results of Operations
ANALYSIS OF FINANCIAL CONDITION
As of December 31, 2014 Compared with December 31, 2013
Total Investments
Total investments increased $110.1 million, or 49.9%, to $330.8 million as of December 31, 2014, compared with $220.7 million as of December 31, 2013. This increase reflected the $133.8 million increase in gross premiums written compared with 2013 and the $43.4 million in net proceeds from the Company’s August 2014 offering. The excess cash was invested primarily in the bond portfolio.
FASB issued guidance addresses accounting and reporting for (a) investments in equity securities that have readily determinable fair values and (b) all investments in debt securities. We account for our investment securities consistent with FASB issued guidance that requires our securities to be classified into one of three categories: (i) held-to-maturity, (ii) trading securities or (iii) available-for-sale.
Investments classified as held-to-maturity include debt securities wherein the Company’s intent and ability are to hold the investment until maturity and are carried at amortized cost without consideration to unrealized gains or losses. Investments classified as trading securities include debt and equity securities bought and held primarily for sale in the near term and are carried at fair value with unrealized holding gains and losses included in current period operations. Investments classified as available-for-sale include debt and equity securities that are not classified as held-to-maturity or as trading security investments and are carried at fair value with unrealized holding gains and losses excluded from earnings and reported as a separate component of shareholders’ equity, namely “Other Comprehensive Income.”
The debt and equity securities that are available-for-sale and carried at fair value represent 98% of total investments as of December 31, 2014, compared with 97% as of December 31, 2013.
We did not hold any trading investment securities during 2014.
As of December 31, 2014 and 2013, our investments consisted primarily of corporate bonds held in various industries, municipal bonds and United States government bonds. As of December 31, 2014, 77% of our debt portfolio was in diverse industries and 23% is in United States government bonds. As of December 31, 2014, approximately 88% of our equity holdings were in equities related to diverse industries and 12% were in mutual funds. As of December 31, 2013, 83% of our debt portfolio was in diverse industries and 17% is in United States government bonds. As of December 31, 2013, approximately 91% of our equity holdings were in equities related to diverse industries and 9% were in mutual funds.
Below is a summary of net unrealized gains at December 31, 2014 and December 31, 2013 by category.
|
Unrealized Gains (Losses)
|
||||||||
|
December 31, 2014
|
December 31, 2013
|
|||||||
|
(Dollars in Thousands)
|
||||||||
|
Debt securities:
|
||||||||
|
United States government obligations and authorities
|
$
|
945
|
$
|
(213
|
)
|
|||
|
Obligations of states and political subdivisions
|
886
|
180
|
||||||
|
Corporate
|
1,249
|
467
|
||||||
|
International
|
(1
|
)
|
(33
|
)
|
||||
|
3,079
|
401
|
|||||||
|
Equity securities:
|
||||||||
|
Common stocks
|
9,339
|
9,161
|
||||||
|
Total debt and equity securities
|
$
|
12,418
|
$
|
9,562
|
||||
The net unrealized gain of $12.4 million is inclusive of $1.0 million of unrealized losses. The $1.0 million of unrealized losses is inclusive of $0.5 million unrealized losses from equity securities and $0.5 million unrealized losses from debt securities.
Federated National Holding Company
Management’s Discussion and Analysis of Financial Condition and Results of Operations
The $0.5 million of unrealized losses from equity securities is from common stocks and mutual funds held in diverse industries as of December 31, 2014. The Company evaluated the near-term prospects in relation to the severity and duration of the impairment. Based on this evaluation and the Company’s ability and intent to hold these investments for a reasonable period of time sufficient for a forecasted recovery of fair value, the Company does not consider these investments to be other-than-temporarily impaired at December 31, 2014.
The $0.5 million of unrealized losses from debt securities is primarily related to Corporate obligations. The Company does not expect to settle at prices less than the amortized cost basis. The Company does not consider these investments to be other-than-temporarily impaired at December 31, 2014 because we neither currently intend to sell these investments nor consider it likely that we will be required to sell these investments before recovery of the amortized cost basis.
The FASB issued guidance also addresses the determination as to when an investment is considered impaired, whether that impairment is other-than temporary, and the measurement of an impairment loss. The Company’s policy for the valuation of temporarily impaired securities is to determine impairment based on the analysis of the following factors.
| · | rating downgrade or other credit event (eg., failure to pay interest when due); |
| · | length of time and the extent to which the fair value has been less than amortized cost; |
| · | financial condition and near term prospects of the issuer, including any specific events which may influence the operations of the issuer such as changes in technology or discontinuance of a business segment; |
| · | prospects for the issuer’s industry segment; |
| · | intent and ability of the Company to retain the investment for a period of time sufficient to allow for anticipated recovery in market value; |
| · | historical volatility of the fair value of the security. |
Pursuant to FASB issued guidance, the Company records the unrealized losses, net of estimated income taxes that are associated with that part of our portfolio classified as available-for-sale through the shareholders' equity account titled “Other Comprehensive Income”. Management periodically reviews the individual investments that comprise our portfolio in order to determine whether a decline in fair value below our cost either is other-than temporarily or permanently impaired. Factors used in such consideration include, but are not limited to, the extent and length of time over which the market value has been less than cost, the financial condition and near-term prospects of the issuer and our ability and intent to keep the investment for a period sufficient to allow for an anticipated recovery in market value.
In reaching a conclusion that a security is either other-than-temporarily or permanently impaired we consider such factors as the timeliness and completeness of expected dividends, principal and interest payments, ratings from nationally recognized statistical rating organizations such as Standard and Poor’s (“S&P”) and Moody’s Investors Service, Inc. (“Moody’s”), as well as information released via the general media channels.
During 2014 and 2013, in connection with the process, we have not charged any investment losses to operations. During 2012, in connection with the process, we have charged to operations $44,000 of investment losses.
As of December 31, 2014 and December 31, 2013, respectively, all of our securities are in good standing and not impaired as defined by FASB issued guidance.
Federated National Holding Company
Management’s Discussion and Analysis of Financial Condition and Results of Operations
The following table summarizes, by type, our investments as of December 31, 2014 and 2013.
|
December 31, 2014
|
December 31, 2013
|
|||||||||||||||
|
Carrying
Amount |
Percent
of Total |
Carrying
Amount |
Percent
of Total |
|||||||||||||
|
(Dollars in Thousands)
|
||||||||||||||||
|
Debt securities, at market:
|
||||||||||||||||
|
United States government obligations and authorities
|
$
|
62,323
|
18.84
|
%
|
$
|
27,209
|
12.33
|
%
|
||||||||
|
Obligations of states and political subdivisions
|
91,614
|
27.70
|
%
|
52,064
|
23.59
|
%
|
||||||||||
|
Corporate
|
119,024
|
35.99
|
%
|
91,941
|
41.66
|
%
|
||||||||||
|
International
|
11,138
|
3.37
|
%
|
3,698
|
1.68
|
%
|
||||||||||
|
284,099
|
85.90
|
%
|
174,912
|
79.26
|
%
|
|||||||||||
|
Debt securities, at amortized cost:
|
||||||||||||||||
|
United States government obligations and authorities
|
4,490
|
1.36
|
%
|
4,630
|
2.10
|
%
|
||||||||||
|
Corporate
|
2,681
|
0.81
|
%
|
2,475
|
1.12
|
%
|
||||||||||
|
International
|
246
|
0.07
|
%
|
109
|
0.05
|
%
|
||||||||||
|
7,417
|
2.24
|
%
|
7,214
|
3.27
|
%
|
|||||||||||
|
Total debt securities
|
291,516
|
88.14
|
%
|
182,126
|
82.53
|
%
|
||||||||||
|
Equity securities, at market:
|
39,247
|
11.86
|
%
|
38,584
|
17.47
|
%
|
||||||||||
|
Total investments
|
$
|
330,763
|
100.00
|
%
|
$
|
220,710
|
100.00
|
%
|
||||||||
Debt securities are carried on the balance sheet at market. At December 31, 2014 and 2013, debt securities had the following quality ratings by S&P and for securities not assigned a rating by S&P, Moody’s or Fitch ratings were used.
|
December 31, 2014
|
December 31, 2013
|
|||||||||||||||
|
Carrying
Amount |
Percent
of Total |
Carrying
Amount |
Percent
of Total |
|||||||||||||
|
(Dollars in Thousands)
|
||||||||||||||||
|
AAA
|
$
|
40,119
|
13.76
|
%
|
$
|
24,904
|
13.67
|
%
|
||||||||
|
AA
|
125,385
|
43.01
|
%
|
67,374
|
36.99
|
%
|
||||||||||
|
A
|
67,818
|
23.26
|
%
|
46,338
|
25.44
|
%
|
||||||||||
|
BBB
|
58,172
|
19.96
|
%
|
42,979
|
23.60
|
%
|
||||||||||
|
Not rated
|
22
|
0.01
|
%
|
531
|
0.30
|
%
|
||||||||||
|
$
|
291,516
|
100.00
|
%
|
$
|
182,126
|
100.00
|
%
|
|||||||||
The following table summarizes, by maturity, the debt securities as of December 31, 2014 and 2013.
|
December 31, 2014
|
December 31, 2013
|
|||||||||||||||
|
Carrying
Amount |
Percent
of Total |
Carrying
Amount |
Percent
of Total |
|||||||||||||
|
(Dollars in Thousands)
|
||||||||||||||||
|
Matures In:
|
||||||||||||||||
|
One year or less
|
$
|
16,796
|
5.76
|
%
|
$
|
5,180
|
2.84
|
%
|
||||||||
|
One year to five years
|
174,260
|
59.78
|
%
|
113,561
|
62.35
|
%
|
||||||||||
|
Five years to 10 years
|
100,427
|
34.45
|
%
|
62,511
|
34.32
|
%
|
||||||||||
|
More than 10 years
|
33
|
0.01
|
%
|
874
|
0.49
|
%
|
||||||||||
|
Total debt securities
|
$
|
291,516
|
100.00
|
%
|
$
|
182,126
|
100.00
|
%
|
||||||||
As December 31, 2014, the duration of the bond portfolio was approximately 3.7 years.
As of December 31, 2014 and December 31, 2013, we have classified $7.4 million and $7.2 million, respectively, of our bond portfolio as held-to-maturity. We classify bonds as held-to-maturity to support securitization of credit requirements.
Federated National Holding Company
Management’s Discussion and Analysis of Financial Condition and Results of Operations
During 2014, we did not re-classify any of our bond portfolio between available-for-sale and held-to-maturity. During 2013 we reclassified $150,000 of our bond portfolio to available-for-sale from held-to-maturity.
Two reinsurers require FNIC to maintain securities with a fair market value of $4.9 million. As of December 31, 2014 and 2013, FNIC maintained fully funded trust agreements that totaled $4.9 million in favor of the reinsurers. In addition, as of December 31, 2014 and 2013, $1.0 million is held in a fully funded trust account in favor of another reinsurer under a prior program.
Cash and Short-Term Investments
Cash and short-term investments, which include cash, certificates of deposits, and money market accounts, decreased $1.2 million, or 3.1%, to $40.2 million as of December 31, 2014, compared with $41.4 million as of December 31, 2013.
Prepaid Reinsurance Premiums
Prepaid reinsurance premiums increased $46.9 million, or 618.5%, to $54.5 million as of December 31, 2014, compared with $7.6 million as of December 31, 2013 as the result of the increase in ceded unearned premiums on the Property 30% Quota Share reinsurance agreement effective July 1, 2014, in addition to the amortization of our payment patterns. We believe concentrations of credit risk associated with our prepaid reinsurance premiums are not significant.
Premiums Receivable, Net of Allowance for Credit Losses
Premiums receivable, net of allowance for credit losses, increased $4.8 million, or 21.5%, to $27.2 million as of December 31, 2014, compared with $22.4 million as of December 31, 2013.
Our homeowners’ insurance premiums receivable increased $3.0 million, or 15.0%, to $22.4 million as of December 31, 2014, compared with $19.4 million as of December 31, 2013, resulting from the increase to gross premiums written during 2014 compared with 2013.
Our commercial general liability insurance premiums receivable decreased $0.1 million, or 29.8%, to $0.2 million as of December 31, 2014, compared with $0.3 million as of December 31, 2013.
Premiums receivable in connection with our automobile line of business increased $2.0 million, or 72.0%, to $4.8 million as of December 31, 2014, compared with $2.8 million as of December 31, 2013.
Our allowance for credit losses remained unchanged at $0.1 million as of December 31, 2014, compared with $0.1 million as of December 31, 2013.
|
Years Ended December 31,
|
||||||||
|
2014
|
2013
|
|||||||
|
(Dollars in Thousands)
|
||||||||
|
Allowance for credit losses at beginning of year
|
$
|
143
|
$
|
69
|
||||
|
Additions charged to bad debt expense
|
45
|
250
|
||||||
|
Write-downs charged against the allowance
|
(40
|
)
|
(176
|
)
|
||||
|
Allowance for credit losses at end of year
|
$
|
148
|
$
|
143
|
||||
Reinsurance Recoverable, Net
Reinsurance recoverable, net, increased $9.8 million, or 358.5%, to $12.5 million as of December 31, 2014, compared with $2.7 million as of December 31, 2013. The change is due to the payment patterns by our reinsurers, as influenced by the diminishing catastrophe related claims and to the Property 30% Quota Share agreement effective July 1, 2014. All amounts are current and deemed collectable. We believe concentrations of credit risk associated with our reinsurance recoverables, net, are not significant.
Federated National Holding Company
Management’s Discussion and Analysis of Financial Condition and Results of Operations
DPAC
DPAC decreased $3.1 million, or 18.5%, to $13.6 million as of December 31, 2014, compared with $16.7 million as of December 31, 2013. The change reflects in part the deferral of the actual policy acquisition costs, including commissions, payroll and premium taxes, less commissions earned on reinsurance ceded and policy fees earned associated with our increased unearned premium, which during the twelve months ended December 31, 2014 total approximately $9.3 million. The $9.3 million increase was offset by a $12.4 million reduction associated with our Property 30% Quota Share agreement effective July 1, 2014. An analysis of deferred acquisition costs follows.
|
Years Ended December 31,
|
||||||||
|
2014
|
2013
|
|||||||
|
(Dollars in Thousands)
|
||||||||
|
Balance, beginning of year
|
$
|
16,708
|
$
|
8,479
|
||||
|
Acquisition costs deferred
|
24,377
|
29,676
|
||||||
|
Amortization expense during year
|
(27,475
|
)
|
(21,447
|
)
|
||||
|
Balance, end of year
|
$
|
13,610
|
$
|
16,708
|
||||
Deferred Income Taxes, Net
Deferred income taxes, net, converted to a $1.3 million liability as of December 31, 2014, compared with a $1.0 million asset as of December 31, 2013.
Deferred income taxes, net, is comprised of approximately $9.7 million and $11.0 million of deferred tax assets, net of approximately $11.0 million and $10.0 million of deferred tax liabilities as of December 31, 2014 and December 31, 2013.
The change to deferred income taxes, net is primarily due to the decrease in the reserve for claims settlements and increase in unrealized gain on investment securities as illustrated in the following table.
|
Years Ended December 31,
|
||||||||
|
2014
|
2013
|
|||||||
|
Deferred tax assets:
|
||||||||
|
Unpaid losses and loss adjustment expenses
|
$
|
1,239
|
$
|
1,157
|
||||
|
Unearned premiums
|
7,812
|
6,864
|
||||||
|
Discount on advance premiums
|
-
|
243
|
||||||
|
Allowance for credit losses
|
63
|
59
|
||||||
|
Allowance for impairments
|
20
|
21
|
||||||
|
Depreciation & amortization
|
13
|
149
|
||||||
|
Reserve for claims settlements
|
12
|
1,844
|
||||||
|
NOL Carryforward
|
-
|
73
|
||||||
|
Deferred revenue
|
36
|
-
|
||||||
|
Flow-through income or loss
|
-
|
4
|
||||||
|
Stock option expense per ASC 718
|
545
|
550
|
||||||
|
Total deferred tax assets
|
9,740
|
10,964
|
||||||
|
Deferred tax liabilities:
|
||||||||
|
Deferred acquisition costs, net
|
(6,199
|
)
|
(6,287
|
)
|
||||
|
Flow-through income or loss
|
(9
|
)
|
-
|
|||||
|
Dividends Collected vs. Earned
|
(12
|
)
|
(6
|
)
|
||||
|
Regulatory assessments
|
(69
|
)
|
(67
|
)
|
||||
|
Unrealized Gain on investment securities
|
(4,792
|
)
|
(3,598
|
)
|
||||
|
Total deferred tax liabilities
|
(11,081
|
)
|
(9,958
|
)
|
||||
|
Net deferred tax (liability) asset
|
$
|
(1,341
|
)
|
$
|
1,006
|
|||
Federated National Holding Company
Management’s Discussion and Analysis of Financial Condition and Results of Operations
Income taxes receivable totaled $1.8 million as of December 31, 2014, compared with income taxes payable of $2.4 million as of December 31, 2013. The change is due to estimated tax payments made in excess of the related accrued liability.
Property, Plant and Equipment, net
Property, plant and equipment, net increased $0.8 million, or 88.3%, to $1.7 million as of December 31, 2014, compared with $0.9 million as of December 31, 2013. The change is due primarily to investments in information technology.
Other Assets
Other assets increased $4.0 million, or 126.4%, to $7.2 million as of December 31, 2014, compared with $3.2 million as of December 31, 2013. Major components of other assets are shown in the following table; the accrued interest income receivable is primarily investment related.
|
December 31, 2014
|
December 31, 2013
|
|||||||
|
(Dollars in Thousands)
|
||||||||
|
Accrued interest income receivable
|
$
|
2,601
|
$
|
1,684
|
||||
|
Commission receivable
|
2,077
|
-
|
||||||
|
Deposits
|
281
|
327
|
||||||
|
Prepaid expenses
|
1,496
|
812
|
||||||
|
Other
|
746
|
371
|
||||||
|
Total
|
$
|
7,231
|
$
|
3,194
|
||||
Contingent Quota-Share Profit Sharing
Contingent quota-share profit sharing totaled $14.0 million as of December 31, 2014, compared with nothing as of December 31, 2013. The $14.0 million is our current estimated profit-sharing benefit associated with our Property 30% Quota Share agreement effective July 1, 2014. The provisions of this program allow for profit-sharing up to approximately $32.0 million at the end of the two-year contract term. The ultimate benefit is based upon the occurrence of future catastrophic events and predefined non-catastrophic loss ratios.
Unpaid Losses and LAE
Unpaid losses and LAE increased $17.3 million, or 28.4%, to $78.3 million as of December 31, 2014, compared with $61.0 million as of December 31, 2013, in conjunction with the increase to net premiums earned during 2014 compared with 2013. The $17.3 million increase was net of a $2.1 million reduction associated with our Property 30% Quota Share agreement effective July 1, 2014. The composition of unpaid losses and LAE by product line is as follows.
| December 31, 2014 | December 31, 2013 | |||||||||||||||||||||||
|
Case
|
Bulk
|
Total
|
Case
|
Bulk
|
Total
|
|||||||||||||||||||
|
(Dollars in Thousands)
|
(Dollars in Thousands)
|
|||||||||||||||||||||||
|
Homeowners'
|
$
|
14,223
|
$
|
35,192
|
$
|
49,415
|
$
|
11,399
|
$
|
19,623
|
$
|
31,022
|
||||||||||||
|
Commercial General Liability
|
5,646
|
12,505
|
18,151
|
3,503
|
13,231
|
16,734
|
||||||||||||||||||
|
Automobile
|
3,672
|
7,092
|
10,764
|
8,259
|
5,001
|
13,260
|
||||||||||||||||||
|
Total
|
$
|
23,541
|
$
|
54,789
|
$
|
78,330
|
$
|
23,161
|
$
|
37,855
|
$
|
61,016
|
||||||||||||
Please see “Liability for Unpaid Losses and LAE” under “Item 1. Business” for a discussion of the factors that affect unpaid losses and LAE.
Federated National Holding Company
Management’s Discussion and Analysis of Financial Condition and Results of Operations
Unearned Premium
Unearned premiums increased $64.1 million, or 49.9%, to $192.4 million as of December 31, 2014, compared with $128.3 million as of December 31, 2013. The change was due to a $61.3 million increase in unearned homeowners’ insurance premiums, a $0.8 million increase in unearned flood insurance premiums, a $1.2 million increase in unearned commercial general liability premiums and a $0.8 million increase in unearned automobile insurance premiums. Generally, as is in this case, an increase in unearned premium directly relates to an increase in written premium on a rolling twelve-month basis. The $64.1 million total increase and the $61.3 million homeowners’ increase were net of a $38.5 million reduction associated with our Property 30% Quota Share agreement effective July 1, 2014.
Premium Deposits and Customer Credit Balances
Premium deposits and customer credit balances increased $3.6 million, or 92.6%, to $7.4 million as of December 31, 2014, compared with $3.8 million as of December 31, 2013. Premium deposits are monies received on policies not yet in-force, the change of which is due to the increase in gross written premiums during this same period.
Income Taxes Payable
Income taxes payable converted to income taxes receivable of $1.8 million as of December 31, 2014, compared with income taxes payable of $2.4 million as of December 31, 2013. The change is due to estimated tax payments made in excess of the related accrued liability.
Deferred Income Taxes, Net
Deferred income taxes, net, converted to a $1.3 million liability as of December 31, 2014, compared with a $1.0 million asset as of December 31, 2013.
Deferred income taxes, net, is comprised of approximately $9.7 million and $11.0 million of deferred tax assets, net of approximately $11.0 million and $10.0 million of deferred tax liabilities as of December 31, 2014 and December 31, 2013.
The change to deferred income taxes, net is primarily due to the decrease in the reserve for claims settlements and increase in unrealized gain on investment securities as illustrated in the following table.
|
Years Ended December 31,
|
||||||||
|
2014
|
2013
|
|||||||
|
Deferred tax assets:
|
||||||||
|
Unpaid losses and loss adjustment expenses
|
$
|
1,239
|
$
|
1,157
|
||||
|
Unearned premiums
|
7,812
|
6,864
|
||||||
|
Discount on advance premiums
|
-
|
243
|
||||||
|
Allowance for credit losses
|
63
|
59
|
||||||
|
Allowance for impairments
|
20
|
21
|
||||||
|
Depreciation & amortization
|
13
|
149
|
||||||
|
Reserve for claims settlements
|
12
|
1,844
|
||||||
|
NOL Carryforward
|
-
|
73
|
||||||
|
Deferred revenue
|
36
|
-
|
||||||
|
Flow-through income or loss
|
-
|
4
|
||||||
|
Stock option expense per ASC 718
|
545
|
550
|
||||||
|
Total deferred tax assets
|
9,740
|
10,964
|
||||||
|
Deferred tax liabilities:
|
||||||||
|
Deferred acquisition costs, net
|
(6,199
|
)
|
(6,287
|
)
|
||||
|
Flow-through income or loss
|
(9
|
)
|
-
|
|||||
|
Dividends Collected vs. Earned
|
(12
|
)
|
(6
|
)
|
||||
|
Regulatory assessments
|
(69
|
)
|
(67
|
)
|
||||
|
Unrealized Gain on investment securities
|
(4,792
|
)
|
(3,598
|
)
|
||||
|
Total deferred tax liabilities
|
(11,081
|
)
|
(9,958
|
)
|
||||
|
Net deferred tax (liability) asset
|
$
|
(1,341
|
)
|
$
|
1,006
|
|||
Federated National Holding Company
Management’s Discussion and Analysis of Financial Condition and Results of Operations
Claims Payments Outstanding
Claims payments outstanding increased $4.0 million, or 63.7%, to $10.2 million as of December 31, 2014, compared with $6.2 million as of December 31, 2013. The claims payments outstanding relate primarily to losses and LAE disbursements paid but not presented for payment by the policyholder or vendor. The change relates to the timing of presentation of claims checks to the issuing bank. Generally, the increase in claims payments outstanding directly relates to the increase in claims payments which directly relates to the increase in written premium.
Accounts Payable and Accrued Expenses
Accounts payable and accrued expenses increased $4.5 million, or 69.5%, to $11.0 million as of December 31, 2014, compared with $6.5 million as of December 31, 2013. The $4.5 million change includes increases of $1.8 million for premium taxes, $0.9 million for commissions, $0.9 million for vendor accruals, $0.4 million for the remittance of recouped assessments, $0.3 million for the Homeowners Louisiana assessment and $0.2 million for dividends.
Deferred Quota-Share Profit Sharing
Deferred quota-share profit sharing totaled $10.5 million as of December 31, 2014, compared with nothing as of December 31, 2013, and relates to the quota-share program. The deferred quota-share profit sharing was originally recorded at $14.0 million at the program’s July 1, 2014 inception and will continue to amortize over the life of the program.
RESULTS OF OPERATIONS
Year Ended December 31, 2014 Compared with Year Ended December 31, 2013
Effective January 26, 2011, FNIC merged with and into American Vehicle, and the resulting entity changed its name to “Federated National Insurance Company”.
Gross Premiums Written
Gross premiums written increased $133.8 million, or 55.0%, to $377.2 million for 2014, compared with $243.4 million for 2013. The following table denotes gross premiums written by major product line. The increase in gross premiums written during 2014 is primarily due to the increase in the sale of homeowners’ policies. During 2014, our improved underwriting, risk management and product distribution enabled us to write more policies than in prior years.
|
Years Ended December 31,
|
||||||||||||||||
|
2014
|
2013
|
|||||||||||||||
|
(Dollars in Thousands)
|
||||||||||||||||
|
Amount
|
Percentage
|
Amount
|
Percentage
|
|||||||||||||
|
Homeowners'
|
$
|
344,939
|
91.46
|
%
|
$
|
218,349
|
89.72
|
%
|
||||||||
|
Commercial General Liability
|
12,432
|
3.30
|
%
|
10,362
|
4.26
|
%
|
||||||||||
|
Federal Flood
|
7,408
|
1.96
|
%
|
6,213
|
2.55
|
%
|
||||||||||
|
Automobile
|
12,377
|
3.28
|
%
|
8,449
|
3.47
|
%
|
||||||||||
|
Gross written premiums
|
$
|
377,156
|
100.00
|
%
|
$
|
243,373
|
100.00
|
%
|
||||||||
The increase in the sale of homeowners’ policies by $126.6 million, or 58.0%, to $344.9 million in 2014, compared with $218.3 million in 2013, is gross of reinsurance costs and net of Florida’s mandated homeowners’ wind mitigation discounts. We offer premium discounts for wind mitigation efforts by policyholders, as required by Florida law. As of December 31, 2014, 76.4% of our in-force homeowners’ policyholders were receiving wind mitigation credits totaling approximately $336.7 million (a 50.1% reduction of in-force premium), while 80.3% of our in-force homeowners’ policyholders were receiving wind mitigation credits totaling approximately $216.8 million, (a 50.1% reduction of in-force premium), as of December 31, 2013.
During 2014, $39.6 million or 11.0% of the $344.9 million of homeowners’ premiums we underwrote were produced under an agency agreement with Ivantage Select Agency, Inc. (“ISA”), an affiliate of Allstate Insurance Company, that grants Allstate agents the authority to offer certain FNU products. The $39.6 million of homeowners’ premiums produced under this agreement with ISA represents 31.0% of the total increase in the sale of homeowners’ policies during 2014, compared with 2013. This network of agents began writing for FNIC in March 2013.
Federated National Holding Company
Management’s Discussion and Analysis of Financial Condition and Results of Operations
During 2014 and 2013, the change to the cumulative wind mitigation credits afforded our policyholders totaled $119.9 million and $155.7 million, respectively.
These premium discounts have had a significant effect on both written and earned premium. Wind mitigation credits are 50.1% of the pre-credit premium, or $336.7 million, as of December 31, 2014, as compared with 50.1% of the pre-credit premium, or $216.8 million, as of December 31, 2013.
Our in-force homeowners’ policies increased by approximately 66,200, or approximately 56.8%, to approximately 182,600 as of December 31, 2014, as compared with approximately 116,400 as of December 31, 2013.
Premium rates charged to our homeowner insurance policyholders are continually evaluated to assure that they meet the expectation that they are actuarially sound and produce a reasonable level of profit (neither excessive nor inadequate). Premium rates are regulated and approved by the Florida OIR. In 2014 our voluntary program rate study resulted in a rate decrease of 3% on our voluntary property book of homeowners’ business. In 2013 our voluntary program rate indications did not indicate the need for adjustment. In 2012 we were approved for a 4.8% and 0.9% rate increase on our voluntary property book of homeowners’ business.
Similarly, for the policies we assumed from Citizens Property Insurance Corporation (“Citizens”) in 2009, we received approval for a 14.8% increase in 2013 and a 14.1% rate increase in 2012. There was no rate change in 2014. Our voluntary program was 99.0%, 97.7%, and 90.0% of the total homeowner program, for the years ending December 31, 2014, 2013 and 2012, respectively.
Our earnings can also be impacted by our ratings, such as the rating of FNIC by Demotech, Inc. (“Demotech”). FNIC’s rating as of December 31, 2014 was "A" ("Exceptional"). For more information regarding our rating and the impact of a change or withdrawal of our rating, please see “Business-Regulation-Industry Rating Services.”
The Company’s sale of commercial general liability policies increased by $2.0 million to $12.4 million for 2014, compared with $10.4 million for 2013. The primary factor for this increase has been renewal retention combined with new business growth.
The following table sets forth the amounts and percentages of our gross premiums written in connection with our commercial general liability program by state.
| Years Ended December 31, | ||||||||||||||||
|
2014
|
2013
|
|||||||||||||||
|
Amount
|
Percentage
|
Amount
|
Percentage
|
|||||||||||||
|
(Dollars in Thousands)
|
||||||||||||||||
|
State
|
||||||||||||||||
|
Florida
|
$
|
11,401
|
91.71
|
%
|
$
|
9,572
|
92.37
|
%
|
||||||||
|
Louisiana
|
98
|
0.79
|
%
|
150
|
1.45
|
%
|
||||||||||
|
Texas
|
756
|
6.08
|
%
|
547
|
5.28
|
%
|
||||||||||
|
Other
|
177
|
1.42
|
%
|
93
|
0.90
|
%
|
||||||||||
|
Total
|
$
|
12,432
|
100.00
|
%
|
$
|
10,362
|
100.00
|
%
|
||||||||
We are required to report write-your-own flood premiums on a direct and 100% ceded basis.
The Company’s sale of auto insurance policies increased by $4.0 million to $12.4 million for 2014, compared with $8.4 million for 2013. The primary factor for this increase was due to the new Texas private passenger automobile business for which 2013 was the first full year of operations.
Gross Premiums Ceded
Gross premiums ceded increased to $202.0 million for 2014, compared with $82.7 million for 2013. Gross premiums ceded relating to our homeowners’, commercial general liability, write-your-own flood and automobile programs totaled $184.8 million, $0.5 million, $7.4 million and $9.3 million for 2014. Gross premiums ceded relating to our homeowners’ includes $73.0 million associated with our Property 30% Quota Share agreement effective July 1, 2014 and was also impacted by an additional 165.0% of reinsurance coverage purchased for the 2014-2015 season as compared with the 2013-2014 season.
Federated National Holding Company
Management’s Discussion and Analysis of Financial Condition and Results of Operations
Gross premiums ceded relating to our homeowners’, commercial general liability, write-your-own flood and automobile programs totaled $69.7 million, $0.5 million, $6.2 million and $6.3 million for 2013.
Increase in Prepaid Reinsurance Premiums
The increase in prepaid reinsurance premiums was $59.8 million in 2014, compared with $13.1 million in 2013. The increased benefit to written premium is associated with the timing of our reinsurance payments measured against the term of the underlying reinsurance policies.
Increase in Unearned Premiums
The increase in unearned premiums was $64.1 million for 2014, compared with $69.3 million in 2013. The $64.1 million charge to written premium was due to a $61.3 million increase in unearned homeowners’ insurance premiums, a $0.8 million increase in unearned flood premiums, a $1.2 million increase in unearned commercial general liability premiums and a $0.8 million increase in unearned automobile insurance premiums during 2014. These changes are a result of differences in written premium volume during this period as compared with the same period last year. See “Gross Premiums Written” above. The $64.1 million total increase and the $61.3 million homeowners’ increase were net of a $38.5 million reduction associated with our Property 30% Quota Share agreement effective July 1, 2014.
Net Premiums Earned
Net premiums earned increased $66.5 million, or 63.7%, to $170.9 million for 2014, compared with $104.4 million for 2013. The following table denotes net premiums earned by product line.
|
Years Ended December 31,
|
||||||||||||||||
|
2014
|
2013
|
|||||||||||||||
|
Amount
|
Percentage
|
Amount
|
Percentage
|
|||||||||||||
|
(Dollars in Thousands)
|
||||||||||||||||
|
Homeowners'
|
$
|
157,225
|
92.00
|
%
|
$
|
92,793
|
88.89
|
%
|
||||||||
|
Commercial General Liability
|
10,769
|
6.30
|
%
|
9,432
|
9.04
|
%
|
||||||||||
|
Automobile
|
2,911
|
1.70
|
%
|
2,156
|
2.07
|
%
|
||||||||||
|
Net premiums earned
|
$
|
170,905
|
100.00
|
%
|
$
|
104,381
|
100.00
|
%
|
||||||||
The $64.4 million increase in homeowners’ net premiums earned is due to a $126.6 million increase in gross written premium as discussed, a $115.0 million increase in gross premiums ceded and a $52.9 million decrease in the net change to prepaid reinsurance premiums and unearned premium.
The $66.5 million total increase and the $64.4 million homeowners’ increase were net of a $34.6 million reduction associated with our Property 30% Quota Share agreement effective July 1, 2014.
The $1.3 million increase in commercial general liability net premiums earned is a result of a $2.1 million increase in gross written premium, a less than $0.1 million increase in gross premiums ceded and a $0.7 million increase in the net change to unearned premium.
The $0.8 million increase in automobile net premiums earned is a result of a $3.9 million increase in gross written premium as discussed, a $3.0 million increase in gross premiums ceded and a $0.2 million increase in the net change to prepaid reinsurance premiums and unearned premium.
Commission Income
Commission income increased $1.9 million, or 70.7%, to $4.5 million for 2014, compared with $2.6 million for 2013. The primary sources of our commission income are our managing general agent services, write-your-own flood premiums and our independent insurance agency, Insure-Link, Inc. (“Insure-Link”).
Federated National Holding Company
Management’s Discussion and Analysis of Financial Condition and Results of Operations
Finance Revenue
Finance revenue increased $0.6 million, or 69.2%, to $1.5 million 2014, compared with $0.9 million for 2013. The primary source of finance revenue is service fees and interest income from our direct billing program, in which we allow our insureds to pay premiums over a stated number of months.
Direct Written Policy Fees
Direct written policy fees increased $2.5 million, or 40.2%, to $8.7 million for 2014, compared with $6.2 million for 2013. The change is attributed to the increase in gross premiums written during this same period.
Net Investment Income
Net investment income increased $2.1 million, or 61.6%, to $5.4 million for 2014, compared with $3.3 million for 2013.
Our investment yield, net of and including investment expenses, excluding equities and including cash, was 2.7% and 3.0%, respectively, for 2014. Our investment yield, net of and including investment expenses, excluding equities and including cash, was 2.1% and 2.3%, respectively, for 2013.
Our investment yield, net of and including investment expenses measured against debt securities, excluding equities and cash, was 2.8% and 3.2%, respectively, for 2014. Our investment yield, net of and including investment expenses measured against debt securities, excluding equities and cash, was 2.4% and 2.7%, respectively, for 2013. The 2013 investment yields have been recalculated in conformity with the 2014 computations, which are on a taxable equivalent basis and more adequately distinguish between taxable and non-taxable income. Our lower investment yield in 2013 primarily resulted from selling higher yielding and longer duration bonds and purchasing shorter duration and lower yielding bonds to protect our bond portfolio against principal erosion, and our average cash holdings were much higher in 2013.
See also “Analysis of Financial Condition As of December 31, 2014 Compared with December 31, 2013 – Investments” for a further discussion on our investment portfolio.
Net Realized Investment Gains
Net realized investment gains were $4.4 million for 2014, compared with $2.9 million for 2013. Specifically, net realized gains for equity securities were $3.8 million for 2014, compared with of $2.9 million for 2013. For debt securities, net realized gains were $0.7 million for 2014, compared with $0.7 million for 2013. Our managers are authorized to sell securities at their discretion. During 2014, our equity managers took advantage of prevailing market opportunities and sold equities to lock in gains.
FASB has issued guidance regarding when an investment is considered impaired, whether that impairment is other-than temporary, and the measurement of an impairment loss. Management periodically reviews the individual investments that comprise our portfolio in order to determine whether a decline in fair value below our cost either is other-than temporarily or permanently impaired. During 2014 and 2013, pursuant to guidelines prescribed in FASB issued guidance, we have not charged to operations any investment losses. During 2012, in connection with the process, we have charged to operations $44,000 of investment losses. In reaching a conclusion that a security is either other-than-temporarily or permanently impaired we consider such factors as the timeliness and completeness of expected dividends, principal and interest payments, ratings from nationally recognized statistical rating organizations such as S&P and Moody’s, as well as information released via the general media channels.
Federated National Holding Company
Management’s Discussion and Analysis of Financial Condition and Results of Operations
The table below depicts the net realized investment gains by investment category during 2014 and 2013.
|
Years Ended December 31,
|
||||||||
|
2014
|
2013
|
|||||||
|
(Dollars in Thousands)
|
||||||||
|
Realized gains:
|
||||||||
|
Debt securities
|
$
|
725
|
$
|
1,690
|
||||
|
Equity securities
|
4,489
|
2,858
|
||||||
|
Total realized gains
|
5,214
|
4,548
|
||||||
|
Realized losses:
|
||||||||
|
Debt securities
|
(147
|
)
|
(1,001
|
)
|
||||
|
Equity securities
|
(641
|
)
|
(666
|
)
|
||||
|
Total realized losses
|
(788
|
)
|
(1,667
|
)
|
||||
|
Net realized gains on investments
|
$
|
4,426
|
$
|
2,881
|
||||
Other Income
Other income increased $1.1 million, or 75.1%, to $2.5 million for 2014, compared with $1.4 million for 2013. The increase is primarily due to the commission sharing agreement with our reinsurance intermediary.
Quota-Share Profit Sharing, Net
Quota-share profit sharing, net totaled $2.8 million for 2014, compared with nothing for 2013. The deferred quota-share profit sharing was originally estimated and recorded at $14.0 million at the program’s July 1, 2014 inception, based upon the likely occurrence of future catastrophic events and predefined non-catastrophic loss ratios. This estimate, subject to future adjustments, will continue to be amortized over the remaining life of the quota-share program.
The $2.8 million, net total includes a $3.5 million benefit associated with our Property 30% Quota Share agreement effective July 1, 2014 and a $0.7 charge associated with our profit sharing agreement with SageSure.
Favorable adjustments to the deferred quota-share profit sharing total will increase the amount we recognize over the remaining life of the program. Unfavorable adjustments to the deferred quota-share profit sharing total will decrease the amount we recognize over the remaining life of the program and could result in a current period charge to operations for some or all of the previously recognized profit sharing.
Losses and LAE
Losses and LAE, our most significant expense, represent actual payments made and changes in estimated future payments to be made to or on behalf of our policyholders, including expenses required to settle claims and losses. We revise our estimates based on the results of analysis of estimated future payments to be made. This process assumes that experience, adjusted for the effects of current developments and anticipated trends, is an appropriate basis for predicting future events.
Losses and LAE increased by $24.6 million, or 43.7%, to $81.0 million for 2014, compared with $56.4 million for 2013. The overall change includes a $17.3 million increase in our homeowners’ program, a $7.1 million increase in our commercial general liability program and a $0.2 million increase in connection with our automobile program.
The $24.6 million total increase and the $17.3 million homeowners’ increase were net of a $7.7 million reduction associated with our Property 30% Quota Share agreement effective July 1, 2014.
The increase to losses and LAE for 2014, compared with 2013, also reflects the additional reserves we added in response to the substantial increase in the number of policies we wrote during 2014. The increase to losses and LAE was more than offset by the increase to net premiums earned during this same period.
Federated National Holding Company
Management’s Discussion and Analysis of Financial Condition and Results of Operations
The composition of unpaid losses and LAE by product line is as follows.
| December 31, 2014 | December 31, 2013 | |||||||||||||||||||||||
|
Case
|
Bulk
|
Total
|
Case
|
Bulk
|
Total
|
|||||||||||||||||||
|
(Dollars in Thousands)
|
(Dollars in Thousands)
|
|||||||||||||||||||||||
|
Homeowners'
|
$
|
14,223
|
$
|
35,192
|
$
|
49,415
|
$
|
11,399
|
$
|
19,623
|
$
|
31,022
|
||||||||||||
|
Commercial General Liability
|
5,646
|
12,505
|
18,151
|
3,503
|
13,231
|
16,734
|
||||||||||||||||||
|
Automobile
|
3,672
|
7,092
|
10,764
|
8,259
|
5,001
|
13,260
|
||||||||||||||||||
|
Total
|
$
|
23,541
|
$
|
54,789
|
$
|
78,330
|
$
|
23,161
|
$
|
37,855
|
$
|
61,016
|
||||||||||||
Please see “Liability for Unpaid Losses and LAE” under “Item 1 Business” for a further discussion of the factors that affect unpaid losses and LAE.
Management revises its estimates based on the results of its analysis. This process assumes that experience, adjusted for the effects of current developments and anticipated trends, is an appropriate basis for estimating the ultimate settlement of all claims. There is no precise method for subsequently evaluating the impact of any specific factor on the adequacy of the reserves, because the eventual redundancy or deficiency is affected by multiple factors. Because of our process, reserves were increased by approximately $17.3 million during 2014. This overall change includes a $18.4 million increase in reserves for our homeowners’ program, a $2.5 million decrease in reserves for our automobile program and a $1.4 million increase in reserves for our commercial general liability program.
Our loss ratio is computed as losses and LAE divided by net premiums earned. A lower loss ratio generally results in higher operating income. Our loss ratio for 2014 was 47.4% compared with 54.0% for the same period in 2013. The decrease to our loss ratio is due to the $24.6 million increase in losses and LAE measured against the $66.5 million increase in net premium earned during 2014 as compared with the same period in 2013.
The table below reflects the loss ratios by product line.
|
Years Ended December 31,
|
||||||||
|
2014
|
2013
|
|||||||
|
Homeowners'
|
44.24
|
%
|
56.27
|
%
|
||||
|
Commercial General Liability
|
70.75
|
%
|
5.50
|
%
|
||||
|
Automobile
|
132.52
|
%
|
170.79
|
%
|
||||
|
All lines
|
47.42
|
%
|
54.04
|
%
|
||||
Operating and Underwriting Expenses
Operating and underwriting expenses increased $5.4 million, or 37.5%, to $19.9 million for 2014, compared with $14.5 million for 2013. The change is primarily due to a $1.6 million increase in premium tax, a $0.5 million increase in surveys and underwriting reports, a $0.4 million increase in actuarial fees, a $0.4 million increase in credit card fees and a $2.5 million increase in other general expenses.
Salaries and Wages
Salaries and wages increased $4.8 million, or 46.9%, to $15.0 million for 2014, compared with $10.2 million for 2013 and is primarily due to the increased number of employees which totaled 219 as of December 31, 2014, compared with 153 as of December 31, 2013. The charge to operations for stock-based compensation, in accordance with FASB guidance, was approximately $1.3 million during 2014, compared with approximately $0.4 million for 2013, for which the increased charge is primarily attributed to the higher fair market value per share at grant during 2014 compared with 2013.
Amortization of DPAC
Amortization of DPAC increased $6.1 million, or 28.1%, to $27.5 million for 2014, compared with $21.4 million for 2013, which corresponds to the increase in net premiums earned during this same period. Amortization of DPAC consists of the actual policy acquisition costs, including commissions, payroll and premium taxes, less commissions earned on reinsurance ceded and policy fees earned.
Federated National Holding Company
Management’s Discussion and Analysis of Financial Condition and Results of Operations
The change to amortization of DPAC typically corresponds to the change in net premiums earned during the same period, and consists of the actual policy acquisition costs, including commissions, payroll and premium taxes, less commissions earned on reinsurance ceded and policy fees earned, which for 2014 totaled approximately $18.4 million. The $18.4 million was offset by a $12.3 million benefit associated with our Property 30% Quota Share agreement effective July 1, 2014.
Provision for Income Tax Expense
The provision for income tax expense was $20.1 million for 2014, compared with $6.5 million for 2013. The effective rate for income taxes was 35.1% for 2014, compared with 33.8% for 2013.
Net Income
Net income increased $24.5 million, or 192.3%, to $37.2 million for 2014, compared with $12.7 million for 2013.
RESULTS OF OPERATIONS
Year Ended December 31, 2013 Compared with Year Ended December 31, 2012
Effective January 26, 2011, FNIC merged with and into American Vehicle, and the resulting entity changed its name to “Federated National Insurance Company”.
Gross Premiums Written
Gross premiums written increased $123.9 million, or 103.7%, to $243.4 million for 2013, compared with $119.5 million for 2012. The following table denotes gross premiums written by major product line. The increase in gross premiums written during 2013 is primarily due to the increase in the sale of homeowners’ policies. During 2013, our improved underwriting, risk management and product distribution enabled us to write more policies than in prior years.
|
Years Ended December 31,
|
||||||||||||||||
|
2013
|
2012
|
|||||||||||||||
|
(Dollars in Thousands)
|
||||||||||||||||
|
Amount
|
Percentage
|
Amount
|
Percentage
|
|||||||||||||
|
Homeowners'
|
$
|
218,349
|
89.72
|
%
|
$
|
101,832
|
85.24
|
%
|
||||||||
|
Commercial General Liability
|
10,362
|
4.26
|
%
|
9,338
|
7.82
|
%
|
||||||||||
|
Federal Flood
|
6,213
|
2.55
|
%
|
5,293
|
4.43
|
%
|
||||||||||
|
Automobile
|
8,449
|
3.47
|
%
|
2,996
|
2.51
|
%
|
||||||||||
|
Gross written premiums
|
$
|
243,373
|
100.00
|
%
|
$
|
119,459
|
100.00
|
%
|
||||||||
The increase in the sale of homeowners’ policies by $116.5 million, or 114.4%, to $218.3 million in 2013, compared with $101.8 million in 2012, is gross of reinsurance costs and net of Florida’s mandated homeowners’ wind mitigation discounts. We offer premium discounts for wind mitigation efforts by policyholders, as required by Florida law. As of December 31, 2013, 80.3% of our in-force homeowners’ policyholders were receiving wind mitigation credits totaling approximately $216.8 million (a 50.1% reduction of in-force premium), while 72.7% of our in-force homeowners’ policyholders were receiving wind mitigation credits totaling approximately $61.1 million, (a 37.4 % reduction of in-force premium), as of December 31, 2012.
During 2013, $29.7 million or 13.6% of the $218.3 million of homeowners’ premiums we underwrote were produced under an agency agreement with Ivantage Select Agency, Inc. (“ISA”), an affiliate of Allstate Insurance Company, that grants Allstate agents the authority to offer certain FNU products. The $29.7 million of homeowners’ premiums produced under this agreement with ISA represents 25.5% of the total increase in the sale of homeowners’ policies during 2013, compared with 2012. This network of agents began writing for FNIC in March 2013.
During 2013 and 2012, the change to the cumulative wind mitigation credits afforded our policyholders totaled $155.7 million and $29.6 million, respectively.
Federated National Holding Company
Management’s Discussion and Analysis of Financial Condition and Results of Operations
These premium discounts have had a significant effect on both written and earned premium. Wind mitigation credits are 50.1% of the pre-credit premium, or $216.8 million, as of December 31, 2013, as compared with 37.4% of the pre-credit premium, or $61.1 million, as of December 31, 2012.
Our in-force homeowners’ policies increased by approximately 55,300, or approximately 91%, to approximately 116,400 as of December 31, 2013, as compared with approximately 61,100 as of December 31, 2012.
Premium rates charged to our homeowner insurance policyholders are continually evaluated to assure that they meet the expectation that they are actuarially sound and produce a reasonable level of profit (neither excessive nor inadequate). Premium rates are regulated and approved by the Florida OIR. In 2013 our voluntary program rate indications did not indicate the need for adjustment. In 2012 we were approved for a 4.8% and 0.9% rate increase on our voluntary property book of homeowners’ business. In 2011 our voluntary rate increase of 20% was approved.
Similarly, for the policies we assumed from Citizens in 2009, we received approval for a 14.8% increase in 2013 and a 14.1% rate increase in 2012. In 2011 we received approval for a 13.9% increase. Our voluntary program was 97.7%, 90.0%, and 79.2% of the total homeowner program, for the years ending December 31, 2013, 2012, and 2011, respectively.
Our earnings can also be impacted by our ratings, such as the rating of FNIC by Demotech. FNIC’s rating as of December 31, 2013 was "A" ("Exceptional"). For more information regarding our rating and the impact of a change or withdrawal of our rating, please see “Business-Regulation-Industry Rating Services.”
The Company’s sale of commercial general liability policies increased by $1.1 million to $10.4 million for 2013, compared with $9.3 million for 2012. The primary factor for this increase has been renewal retention combined with new business growth.
The following table sets forth the amounts and percentages of our gross premiums written in connection with our commercial general liability program by state.
| Years Ended December 31, | ||||||||||||||||
|
2013
|
2012
|
|||||||||||||||
|
Amount
|
Percentage
|
Amount
|
Percentage
|
|||||||||||||
|
(Dollars in Thousands)
|
||||||||||||||||
|
State
|
||||||||||||||||
|
Florida
|
$
|
9,572
|
92.37
|
%
|
$
|
8,639
|
92.52
|
%
|
||||||||
|
Louisiana
|
150
|
1.45
|
%
|
217
|
2.32
|
%
|
||||||||||
|
Texas
|
547
|
5.28
|
%
|
426
|
4.56
|
%
|
||||||||||
|
Other
|
93
|
0.90
|
%
|
56
|
0.60
|
%
|
||||||||||
|
Total
|
$
|
10,362
|
100.00
|
%
|
$
|
9,338
|
100.00
|
%
|
||||||||
We are required to report write-your-own flood premiums on a direct and 100% ceded basis.
The Company’s sale of auto insurance policies increased by $5.4 million to $8.4 million for 2013, compared with $3.0 million for 2012. The primary factor for this increase has been renewal retention combined with new Texas business growth for which 2013 was the first full year of operations.
Gross Premiums Ceded
Gross premiums ceded increased to $82.7 million for 2013, compared with $51.1 million for 2012. Gross premiums ceded relating to our homeowners’, commercial general liability, write-your-own flood and automobile programs totaled $69.7 million, $0.5 million, $6.2 million and $6.3 million for 2013. Gross premiums ceded relating to our homeowners’, commercial general liability, write-your-own flood and automobile programs totaled $43.3 million, $0.5 million, $5.3 million and $2.0 million for 2012.
The increased homeowners’ gross premiums ceded is due to an additional 75.7% of reinsurance coverage purchased for the 2013-2014 season as compared with the 2012 - 2013 season.
Federated National Holding Company
Management’s Discussion and Analysis of Financial Condition and Results of Operations
Increase in Prepaid Reinsurance Premiums
The increase in prepaid reinsurance premiums was $13.1 million in 2013, compared with $2.1 million in 2012. The benefit to written premium is associated with the timing of our reinsurance payments measured against the term of the underlying reinsurance policies.
Increase in Unearned Premiums
The increase in unearned premiums was $69.3 million for 2013, compared with $11.1 million in 2012. The 2013 charge to written premium was due to a $68.0 million increase in unearned homeowners’ insurance premiums, a $0.4 million increase in unearned flood premiums, a $0.5 million increase in unearned commercial general liability premiums and a $0.4 million increase in unearned automobile insurance premiums during 2013. These changes are a result of differences in written premium volume during this period as compared with the same period last year. See “Gross Premiums Written” above.
Net Premiums Earned
Net premiums earned increased $45.0 million, or 75.8%, to $104.4 million for 2013, compared with $59.4 million for 2012. The following table denotes net premiums earned by product line.
|
Years Ended December 31,
|
||||||||||||||||
|
2013
|
2012
|
|||||||||||||||
|
Amount
|
Percentage
|
Amount
|
Percentage
|
|||||||||||||
|
(Dollars in Thousands)
|
||||||||||||||||
|
Homeowners'
|
$
|
92,793
|
88.89
|
%
|
$
|
49,209
|
82.90
|
%
|
||||||||
|
Commercial General Liability
|
9,432
|
9.04
|
%
|
9,196
|
15.49
|
%
|
||||||||||
|
Automobile
|
2,156
|
2.07
|
%
|
954
|
1.61
|
%
|
||||||||||
|
Net premiums earned
|
$
|
104,381
|
100.00
|
%
|
$
|
59,359
|
100.00
|
%
|
||||||||
The $43.6 million increase in homeowners’ net premiums earned is due to a $116.5 million increase in gross written premium as discussed, a $26.4 million increase in gross premiums ceded and a $46.5 million increase in the net change to prepaid reinsurance premiums and unearned premium.
The $0.2 million increase in commercial general liability net premiums earned is a result of a $1.0 million increase in gross written premium, a less than $0.1 million decrease in gross premiums ceded and a $0.8 million increase in the net change to unearned premium.
The $1.2 million increase in automobile net premiums earned is a result of a $5.5 million increase in gross written premium as discussed, a $4.3 million increase in gross premiums ceded and a less than $0.1 million decrease in the net change to prepaid reinsurance premiums and unearned premium.
Commission Income
Commission income increased $1.2 million, or 92.2%, to $2.6 million for 2013, compared with $1.4 million for 2012. The primary sources of our commission income are our managing general agent services, write-your-own flood premiums and our independent insurance agency, Insure-Link.
Direct Written Policy Fees
Direct written policy fees increased $4.2 million, or 208.8%, to $6.2 million for 2013, compared with $2.0 million for 2012. The change is attributed to the increase in gross premiums written during this same period.
Federated National Holding Company
Management’s Discussion and Analysis of Financial Condition and Results of Operations
Net Investment Income
Net investment income decreased $0.5 million, or 12.7%, to $3.3 million for 2013, compared with $3.8 million for 2012.
Our investment yield, net and of and including investment expenses, excluding equities and including cash, was 2.1% and 2.3%, respectively, for 2013. Our investment yield, net of and including investment expenses, excluding equities and including cash, was 2.5% and 2.8%, respectively, for 2012.
Our investment yield, net of and including investment expenses measured against debt securities, excluding equities and cash, was 2.4% and 2.7%, respectively, for 2013. Our investment yield, net of and including investment expenses measured against debt securities, excluding equities and cash, was 2.6% and 2.9%, respectively, for 2012.
The 2013 investment yields have been recalculated in conformity with the 2014 computations which are on a taxable equivalent basis and more adequately distinguish between taxable and non-taxable income. The 2012 investment yields have not been recalculated in conformity with the 2014 computations because the distinction between taxable and non-taxable income was immaterial.
The primary reason for our lower investment yield in 2013 pertained to selling higher yielding and longer duration bonds and purchasing shorter duration and lower yielding bonds to protect our bond portfolio against principal erosion.
See also “Analysis of Financial Condition As of December 31, 2013 Compared with December 31, 2012 – Investments” for a further discussion on our investment portfolio.
Net Realized Investment Gains
Net realized investment gains were $2.9 million for 2013, compared with $1.1 million for 2012. Specifically, net realized gains for equity securities were $2.2 million for 2013, compared with net realized losses of $0.3 million for 2012. For debt securities, net realized gains were $0.7 million for 2013, compared with $1.4 million for 2012. Our managers are authorized to sell securities at their discretion. During 2013, our equity managers took advantage of prevailing market opportunities and sold equities to lock in gains.
FASB has issued guidance regarding when an investment is considered impaired, whether that impairment is other-than temporary, and the measurement of an impairment loss. Management periodically reviews the individual investments that comprise our portfolio in order to determine whether a decline in fair value below our cost either is other-than temporarily or permanently impaired. During 2013, pursuant to guidelines prescribed in FASB issued guidance, we have not charged to operations any investment losses. During 2012, pursuant to guidelines prescribed in FASB issued guidance, we charged to operations, realized investment losses of $44,000. In reaching a conclusion that a security is either other-than-temporarily or permanently impaired we consider such factors as the timeliness and completeness of expected dividends, principal and interest payments, ratings from nationally recognized statistical rating organizations such as S&P and Moody’s, as well as information released via the general media channels.
The table below depicts the net realized investment gains by investment category during 2013 and 2012.
|
Years Ended December 31,
|
||||||||
|
2013
|
2012
|
|||||||
|
(Dollars in Thousands)
|
||||||||
|
Realized gains:
|
||||||||
|
Debt securities
|
$
|
1,690
|
$
|
1,783
|
||||
|
Equity securities
|
2,858
|
1,403
|
||||||
|
Total realized gains
|
4,548
|
3,186
|
||||||
|
Realized losses:
|
||||||||
|
Debt securities
|
(1,001
|
)
|
(391
|
)
|
||||
|
Equity securities
|
(666
|
)
|
(1,723
|
)
|
||||
|
Total realized losses
|
(1,667
|
)
|
(2,114
|
)
|
||||
|
Net realized gains on investments
|
$
|
2,881
|
$
|
1,072
|
||||
Federated National Holding Company
Management’s Discussion and Analysis of Financial Condition and Results of Operations
Other Income
Other income increased $0.9 million, or 177.3%, to $1.4 million for 2013, compared with $0.5 million for 2012. The increase is primarily due to the recoupment of assessments previously expensed in connection with the Florida Insurance Guaranty Association (“FIGA”).
Losses and LAE
Losses and LAE, our most significant expense, represent actual payments made and changes in estimated future payments to be made to or on behalf of our policyholders, including expenses required to settle claims and losses. We revise our estimates based on the results of analysis of estimated future payments to be made. This process assumes that experience, adjusted for the effects of current developments and anticipated trends, is an appropriate basis for predicting future events.
Losses and LAE increased by $26.2 million, or 86.7%, to $56.4 million for 2013, compared with $30.2 million for 2012. The overall change includes a $26.7 million increase in our homeowners’ program, a $2.5 million decrease in our commercial general liability program and a $2.0 million increase in connection with our automobile program.
The increase to losses and LAE for 2013, compared with 2012, reflects the additional reserves we added in response to the substantial increase in the number of policies we wrote during 2013. The increase to losses and LAE was more than offset by the increase to net premiums earned during this same period.
The composition of unpaid losses and LAE by product line is as follows.
| December 31, 2013 | December 31, 2012 | |||||||||||||||||||||||
|
Case
|
Bulk
|
Total
|
Case
|
Bulk
|
Total
|
|||||||||||||||||||
|
(Dollars in Thousands)
|
(Dollars in Thousands)
|
|||||||||||||||||||||||
|
Homeowners'
|
$
|
11,399
|
$
|
19,623
|
$
|
31,022
|
$
|
8,276
|
$
|
6,637
|
$
|
14,913
|
||||||||||||
|
Commercial General Liability
|
3,503
|
13,231
|
16,734
|
2,956
|
22,310
|
25,266
|
||||||||||||||||||
|
Automobile
|
8,259
|
5,001
|
13,260
|
3,643
|
6,086
|
9,729
|
||||||||||||||||||
|
Total
|
$
|
23,161
|
$
|
37,855
|
$
|
61,016
|
$
|
14,875
|
$
|
35,033
|
$
|
49,908
|
||||||||||||
Please see “Liability for Unpaid Losses and LAE” under “Item 1 Business” for a further discussion of the factors that affect unpaid losses and LAE.
Management revises its estimates based on the results of its analysis. This process assumes that experience, adjusted for the effects of current developments and anticipated trends, is an appropriate basis for estimating the ultimate settlement of all claims. There is no precise method for subsequently evaluating the impact of any specific factor on the adequacy of the reserves, because the eventual redundancy or deficiency is affected by multiple factors. Because of our process, reserves were increased by approximately $11.1 million during 2013. This overall change includes a $16.1 million increase in reserves for our homeowners’ program, a $3.5 million increase in reserves for our automobile program and an $8.5 million decrease in reserves for our commercial general liability program.
Our loss ratio is computed as losses and LAE divided by net premiums earned. A lower loss ratio generally results in higher operating income. Our loss ratio for 2013 was 54.0% compared with 50.9% for the same period in 2012. The increase to our loss ratio is due to the $26.2 million increase in losses and LAE measured against the $45.0 million increase in net premium earned during 2013 as compared with the same period in 2012.
The table below reflects the loss ratios by product line.
|
Years Ended December 31,
|
||||||||
|
2013
|
2012
|
|||||||
|
Homeowners'
|
56.27
|
%
|
51.86
|
%
|
||||
|
Commercial General Liability
|
5.50
|
%
|
32.86
|
%
|
||||
|
Automobile
|
170.79
|
%
|
175.08
|
%
|
||||
|
All lines
|
54.04
|
%
|
50.89
|
%
|
||||
Federated National Holding Company
Management’s Discussion and Analysis of Financial Condition and Results of Operations
Operating and Underwriting Expenses
Operating and underwriting expenses increased $4.5 million, or 44.8%, to $14.5 million for 2013, compared with $10.0 million for 2012. The change is primarily due to a $2.5 million increase in premium tax expense, a $0.5 million increase in postage, a $0.9 million increase in surveys and underwriting reports and a $0.6 million increase in other general expenses.
Salaries and Wages
Salaries and wages increased $1.8 million, or 20.7%, to $10.2 million for 2013, compared with $8.4 million for 2012 and is primarily due to an increased number of employees. The charge to operations for stock-based compensation, in accordance with FASB guidance, was approximately $0.4 million during 2013, compared with approximately $0.3 million for 2012.
Amortization of DPAC
Amortization of DPAC increased $8.1 million, or 61.8%, to $21.4 million for 2013, compared with $13.3 million for 2012, which corresponds to the increase in net premiums earned during this same period.
Amortization of DPAC, consists of the actual policy acquisition costs, including commissions, payroll and premium taxes, less commissions earned on reinsurance ceded and policy fees earned.
Provision for Income Tax Expense
The provision for income tax expense was $6.5 million for 2013, compared with $2.4 million for 2012. The effective rate for income taxes was 33.8% for 2013, compared with 36.1% for 2012.
Net Income
Net income increased $8.4 million, or 195.1%, to $12.7 million for 2013, compared with $4.3 million for 2012.
CONTRACTUAL OBLIGATIONS
A summary of long-term contractual obligations as of December 31, 2014 follows. The amounts represent estimates of gross undiscounted amounts payable over time.
|
(Dollars in Thousands)
|
||||||||||||||||||||||||
|
Contractual Obligations
|
Total
|
2015
|
2016
|
2017
|
2018
|
Thereafter
|
||||||||||||||||||
|
Unpaid Losses and LAE
|
$
|
78,330
|
$
|
46,497
|
$
|
18,729
|
$
|
8,616
|
$
|
3,008
|
$
|
1,480
|
||||||||||||
|
Operating leases
|
3,378
|
698
|
712
|
726
|
740
|
502
|
||||||||||||||||||
|
Total
|
$
|
81,708
|
$
|
47,195
|
$
|
19,441
|
$
|
9,342
|
$
|
3,748
|
$
|
1,982
|
||||||||||||
LIQUIDITY AND CAPITAL RESOURCES
In 2014, our primary sources of capital included proceeds from the sale of investment securities, increased unearned premiums, issuance of common stock, increased unpaid losses and LAE, increased accounts payable and accrued expenses, amortization of investment premium discount, net and increased claims payments outstanding. Additional sources of capital included increased premium deposits and customer credit balances, decreased policy acquisition costs, net of amortization, non-cash compensation, exercised stock options, decreased deferred income tax expense, net of other comprehensive income and a tax benefit related to non-cash compensation. Because we are a holding company, we are largely dependent upon fees and commissions from our subsidiaries for cash flow.
In 2014, 2013 and 2012, net cash provided by operating activities was $63.1 million, $79.7 million and $1.5 million, respectively.
In 2014, operations generated $140.9 million of gross cash flow, due to a $64.1 million increase in unearned premiums, a $17.3 million increase in unpaid losses and LAE, a $4.5 million increase in accounts payable and accrued expenses, $4.2 million of amortization of investment premium discount, net and a $4.0 million increase in claims payments outstanding. Additional sources of cash included a $3.5 million increase in premium deposits and customer credit balances, a $3.1 million decrease in policy acquisition costs, net of amortization, $1.7 million non-cash compensation, a $1.2 million decrease in deferred income tax expense, net of other comprehensive income and $0.1 million depreciation and amortization, all in conjunction with $37.2 million of net income.
Federated National Holding Company
Management’s Discussion and Analysis of Financial Condition and Results of Operations
In 2014, operations used $77.7 million of gross cash flow primarily due to a $46.9 million increase in prepaid reinsurance premiums, a $9.8 million increase in reinsurance recoverable, net, a $4.9 million increase in premiums receivable, $4.4 million in net realized investment gains and a $4.0 million increase in other assets. Additional uses of cash included a $3.5 increase in contingent quota-share profit sharing, a $2.4 million decrease in income taxes payable and a $1.8 million increase in income taxes recoverable.
In 2014, net cash used by investing activities was $107.9 million. In 2013 and 2012, net cash used and provided by investing activities was $87.1 million and $4.3 million, respectively. Our available-for-sale investment portfolio is highly liquid as it consists entirely of readily marketable securities. In 2014, investing activities generated $87.2 million and used $195.1 million.
In 2014, net cash provided by financing activities was $43.5 million. In 2013 and 2012, net cash provided by financing activities was $27.7 million and less than $0.1 million, respectively. In 2014, the sources of cash in connection with financing activities included $43.1 million from issuance of common stock, $1.6 million from exercised stock options and a $0.5 million tax benefit related to non-cash compensation. In 2014, the use of cash in connection with financing activities was $1.7 million of dividends paid.
We offer direct billing in connection with our homeowners’ and commercial general liability programs. Direct billing is an agreement in which the insurance company accepts from the insured, as a receivable, a promise to pay the premium, as opposed to requiring the full amount of the policy at policy inception, either directly from the insured or from a premium finance company. The advantage of direct billing a policyholder by the insurance company is that we are not reliant on a credit facility, but remain able to charge and collect interest from the policyholder.
As discussed above, we have experienced significant growth, as evidenced by the 55.0% increase in gross premiums written during 2014 as compared with 2013 and the 56.8% increase in the number of our in-force homeowners’ policies during 2014.
We believe that our current capital resources will be sufficient to meet currently anticipated working capital requirements. There can be no assurances, however, that such will be the case. We continue to evaluate our liquidity and the possibility that we may require additional working capital.
GAAP differs in some respects from reporting practices prescribed or permitted by the Florida OIR. FNIC’s statutory capital and surplus was $125.3 million and $76.9 million as of December 31, 2014 and 2013, respectively. FNIC’s statutory net income was $29.2 million, $3.6 million and $6.6 million for 2014, 2013 and 2012, respectively. FNIC’s statutory non-admitted assets were $0.1 million and nearly nothing as of December 31, 2014 and 2013, respectively.
As of December 31, 2014, 2013, and 2012, we did not have any relationships with unconsolidated entities or financial partnerships, such as entities often referred to as “structured finance” or “special purpose” entities, which were established for the purpose of facilitating off-balance-sheet arrangements or other contractually narrow or limited purposes. As such, management believes that we currently are not exposed to any financing, liquidity, market or credit risks that could arise if we had engaged in transactions of that type requiring disclosure herein.
IMPACT OF INFLATION AND CHANGING PRICES
The consolidated financial statements and related data presented in this Annual Report have been prepared in accordance with GAAP, which requires the measurement of financial position and operating results in terms of historical dollars without considering changes in the relative purchasing power of money over time due to inflation. Our primary assets and liabilities are monetary in nature. As a result, interest rates have a more significant impact on performance than the effects of general levels of inflation. Interest rates do not necessarily move in the same direction or with the same magnitude as the inflationary effect on the cost of paying losses and LAE.
Insurance premiums are established before we know the amount of losses and LAE and the extent to which inflation may affect such expenses. Consequently, we attempt to anticipate the future impact of inflation when establishing rate levels. While we attempt to charge adequate premiums, we may be limited in raising premium levels for competitive and regulatory reasons. Inflation may also affect the market value of our investment portfolio and the investment rate of return. Any future economic changes that result in prolonged and increasing levels of inflation could cause increases in the dollar amount of incurred losses and LAE and thereby materially adversely affect future liability requirements.
Federated National Holding Company
Management’s Discussion and Analysis of Financial Condition and Results of Operations
SELECTED QUARTERLY FINANCIAL DATA (Unaudited)
| Year Ended December 31, 2014 | ||||||||||||||||
| (Dollars in Thousands except EPS) | ||||||||||||||||
|
First
Quarter |
Second
Quarter |
Third
Quarter |
Fourth
Quarter |
|||||||||||||
|
Revenue:
|
||||||||||||||||
|
Net premiums earned
|
$
|
44,004
|
$
|
51,433
|
$
|
34,518
|
$
|
40,950
|
||||||||
|
Other revenue
|
5,711
|
7,570
|
8,632
|
7,874
|
||||||||||||
|
Total revenue
|
49,715
|
59,003
|
43,150
|
48,824
|
||||||||||||
|
Expenses:
|
||||||||||||||||
|
Losses and LAE
|
20,828
|
24,522
|
15,126
|
20,560
|
||||||||||||
|
Other expenses
|
15,159
|
16,487
|
16,569
|
14,134
|
||||||||||||
|
Total expenses
|
35,987
|
41,009
|
31,695
|
34,694
|
||||||||||||
|
Income before provision for income tax expense
|
13,728
|
17,994
|
11,455
|
14,130
|
||||||||||||
|
Provision for income tax expense
|
5,305
|
6,440
|
4,228
|
4,135
|
||||||||||||
|
Net income
|
$
|
8,423
|
$
|
11,554
|
$
|
7,227
|
$
|
9,995
|
||||||||
|
Basic net income per share
|
$
|
0.77
|
$
|
1.04
|
$
|
0.57
|
$
|
0.73
|
||||||||
|
Fully diluted net income per share
|
$
|
0.74
|
$
|
1.01
|
$
|
0.56
|
$
|
0.72
|
||||||||
|
Weighted average number of common shares outstanding
|
10,949
|
11,096
|
12,625
|
13,624
|
||||||||||||
|
Weighted average number of common shares outstanding (assuming dilution)
|
11,317
|
11,481
|
12,956
|
13,930
|
||||||||||||
Federated National Holding Company
Management’s Discussion and Analysis of Financial Condition and Results of Operations
| Year Ended December 31, 2013 | ||||||||||||||||
| (Dollars in Thousands except EPS) | ||||||||||||||||
|
First
Quarter |
Second
Quarter |
Third
Quarter |
Fourth
Quarter |
|||||||||||||
|
Revenue:
|
||||||||||||||||
|
Net premiums earned
|
$
|
18,261
|
$
|
23,742
|
$
|
27,315
|
$
|
35,063
|
||||||||
|
Other revenue
|
3,607
|
4,436
|
4,605
|
4,708
|
||||||||||||
|
Total revenue
|
21,868
|
28,178
|
31,920
|
39,771
|
||||||||||||
|
Expenses:
|
||||||||||||||||
|
Losses and LAE
|
9,323
|
12,821
|
14,439
|
19,827
|
||||||||||||
|
Other expenses
|
8,813
|
11,302
|
12,695
|
13,299
|
||||||||||||
|
Total expenses
|
18,136
|
24,123
|
27,134
|
33,126
|
||||||||||||
|
Income before provision for income tax expense
|
3,732
|
4,055
|
4,786
|
6,645
|
||||||||||||
|
Provision for income tax expense
|
1,397
|
1,511
|
1,504
|
2,079
|
||||||||||||
|
Net income
|
$
|
2,335
|
$
|
2,544
|
$
|
3,282
|
$
|
4,566
|
||||||||
|
Basic net income per share
|
$
|
0.29
|
$
|
0.32
|
$
|
0.41
|
$
|
0.48
|
||||||||
|
Fully diluted net income per share
|
$
|
0.29
|
$
|
0.31
|
$
|
0.39
|
$
|
0.46
|
||||||||
|
Weighted average number of common shares outstanding
|
7,983
|
8,020
|
8,067
|
9,391
|
||||||||||||
|
Weighted average number of common shares outstanding (assuming dilution)
|
8,127
|
8,274
|
8,346
|
9,731
|
||||||||||||
OFF BALANCE SHEET TRANSACTIONS
For the years ended December 31, 2014 and 2013, we had no off balance sheet transactions.
Federated National Holding Company
Our investment objective is to maximize total rate of return after federal income taxes while maintaining liquidity and minimizing risk. Our current investment policy limits investment in non-investment-grade debt securities (including high-yield bonds), and limits total investments in preferred stock, common stock and mortgage notes receivable. We also comply with applicable laws and regulations that further restrict the type, quality and concentration of our investments. In general, these laws and regulations permit investments, within specified limits and subject to certain qualifications, in federal, state and municipal obligations, corporate bonds, preferred and common equity securities and real estate mortgages.
Our investment policy is established by the Board of Directors Investment Committee and is reviewed on a regular basis. Pursuant to this investment policy, as of December 31, 2014, approximately 88% of investments were in debt securities and cash and cash equivalents, which are considered to be either held until maturity or available-for-sale, based upon our estimates of required liquidity. Approximately 97% of the debt securities are considered available-for-sale and are marked to market. We may in the future consider additional debt securities to be held-to-maturity and carried at amortized cost. We do not use any swaps, options, futures or forward contracts to hedge or enhance our investment portfolio.
The following table provides information about the financial instruments as of December 31, 2014 that are sensitive to changes in interest rates. The table presents principal cash flows and the related weighted average interest rate by expected maturity date based upon par values.
|
2015
|
2016
|
2017
|
2018
|
2019
|
Thereafter
|
Total
|
Carrying
Amount |
|||||||||||||||||||||||||
|
Principal amount by expected maturity:
|
||||||||||||||||||||||||||||||||
|
United States government obligations and authorities
|
$
|
1,246
|
$
|
2,714
|
$
|
5,482
|
$
|
5,880
|
$
|
7,200
|
$
|
26,878
|
$
|
49,400
|
$
|
50,489
|
||||||||||||||||
|
Obligations of states and political subdivisions
|
5,640
|
9,540
|
18,700
|
10,635
|
12,305
|
24,685
|
81,505
|
91,614
|
||||||||||||||||||||||||
|
Corporate securities
|
6,594
|
17,009
|
19,327
|
16,362
|
14,528
|
31,197
|
105,017
|
111,667
|
||||||||||||||||||||||||
|
International securities
|
1,241
|
2,087
|
2,125
|
2,342
|
1,565
|
1,752
|
11,112
|
11,384
|
||||||||||||||||||||||||
|
Collateralized mortgage obligations
|
1,795
|
3,679
|
3,819
|
1,885
|
5,494
|
8,173
|
24,845
|
26,362
|
||||||||||||||||||||||||
|
Equity securities, at market
|
-
|
-
|
-
|
-
|
-
|
-
|
-
|
39,247
|
||||||||||||||||||||||||
|
All investments
|
$
|
16,516
|
$
|
35,029
|
$
|
49,453
|
$
|
37,104
|
$
|
41,092
|
$
|
92,685
|
$
|
271,879
|
$
|
330,763
|
||||||||||||||||
|
Weighted average interest rate by expected maturity:
|
||||||||||||||||||||||||||||||||
|
United States government obligations and authorities
|
0.27
|
%
|
1.61
|
%
|
0.70
|
%
|
1.19
|
%
|
1.69
|
%
|
2.36
|
%
|
1.84
|
%
|
||||||||||||||||||
|
Obligations of states and political subdivisions
|
4.49
|
%
|
4.73
|
%
|
4.64
|
%
|
5.01
|
%
|
5.04
|
%
|
4.86
|
%
|
4.82
|
%
|
||||||||||||||||||
|
Corporate securities
|
4.38
|
%
|
4.02
|
%
|
3.50
|
%
|
4.70
|
%
|
4.96
|
%
|
4.31
|
%
|
4.27
|
%
|
||||||||||||||||||
|
International securities
|
0.85
|
%
|
2.15
|
%
|
2.42
|
%
|
2.89
|
%
|
2.51
|
%
|
3.91
|
%
|
2.54
|
%
|
||||||||||||||||||
|
Collateralized mortgage obligations
|
5.24
|
%
|
5.56
|
%
|
3.93
|
%
|
3.46
|
%
|
4.23
|
%
|
3.93
|
%
|
4.30
|
%
|
||||||||||||||||||
|
Equity securities, at market
|
0.00
|
%
|
0.00
|
%
|
0.00
|
%
|
0.00
|
%
|
0.00
|
%
|
0.00
|
%
|
0.00
|
%
|
||||||||||||||||||
|
All investments
|
3.94
|
%
|
4.08
|
%
|
3.61
|
%
|
4.06
|
%
|
4.22
|
%
|
3.85
|
%
|
3.92
|
%
|
||||||||||||||||||
Federated National Holding Company
INDEX TO CONSOLIDATED FINANCIAL STATEMENTS
|
PAGE
|
|
|
Report of Independent Registered Public Accounting Firm
|
72
|
|
Consolidated Balance Sheets as of December 31, 2014 and 2013
|
73
|
|
Consolidated Statements of Operations For the years ended December 31, 2014, 2013 and 2012
|
74
|
|
Consolidated Statements of Comprehensive Income For the years ended December 31, 2014, 2013 and 2012
|
75
|
|
Consolidated Statements of Changes in Shareholders' Equity and Comprehensive Income For the years ended December 31, 2014, 2013 and 2012
|
76
|
|
Consolidated Statements of Cash Flows For the years ended December 31, 2014, 2013 and 2012
|
77
|
|
Notes to Consolidated Financial Statements
|
79
|
Federated National Holding Company and Subsidiaries
REPORT OF INDEPENDENT REGISTERED PUBLIC ACCOUNTING FIRM
To the Board of Directors and
Stockholders of Federated National Holding Company
Stockholders of Federated National Holding Company
We have audited the accompanying consolidated balance sheets of Federated National Holding Company as of December 31, 2014 and 2013, and the related consolidated statements of income, comprehensive income, stockholders’ equity, and cash flows for each of the years in the three year period ended December 31, 2014. We also have audited Federated National Holdings Company’s internal control over financial reporting as of December 31, 2014, based on criteria established in Internal Control—Integrated Framework (2013) issued by the Committee of Sponsoring Organizations of the Treadway Commission (COSO). Federated National Holdings Company’s management is responsible for these consolidated financial statements, for maintaining effective internal control over financial reporting, and for its assessment of the effectiveness of internal control over financial reporting, included in the accompanying Item 9A Controls and Procedures. Our responsibility is to express an opinion on these consolidated financial statements and an opinion on the company’s internal control over financial reporting based on our audits.
We conducted our audits in accordance with the standards of the Public Company Accounting Oversight Board (United States). Those standards require that we plan and perform the audits to obtain reasonable assurance about whether the consolidated financial statements are free of material misstatement and whether effective internal control over financial reporting was maintained in all material respects. Our audits of the consolidated financial statements included examining, on a test basis, evidence supporting the amounts and disclosures in the consolidated financial statements, assessing the accounting principles used and significant estimates made by management, and evaluating the overall consolidated financial statement presentation. Our audit of internal control over financial reporting included obtaining an understanding of internal control over financial reporting, assessing the risk that a material weakness exists, and testing and evaluating the design and operating effectiveness of internal control based on the assessed risk. Our audits also included performing such other procedures as we considered necessary in the circumstances. We believe that our audits provide a reasonable basis for our opinions.
A company’s internal control over financial reporting is a process designed to provide reasonable assurance regarding the reliability of financial reporting and the preparation of consolidated financial statements for external purposes in accordance with generally accepted accounting principles. A company’s internal control over financial reporting includes those policies and procedures that (1) pertain to the maintenance of records that, in reasonable detail, accurately and fairly reflect the transactions and dispositions of the assets of the company; (2) provide reasonable assurance that transactions are recorded as necessary to permit preparation of financial statements in accordance with generally accepted accounting principles, and that receipts and expenditures of the company are being made only in accordance with authorizations of management and directors of the company; and (3) provide reasonable assurance regarding prevention or timely detection of unauthorized acquisition, use, or disposition of the company’s assets that could have a material effect on the financial statements.
Because of its inherent limitations, internal control over financial reporting may not prevent or detect misstatements. Also, projections of any evaluation of effectiveness to future periods are subject to the risk that controls may become inadequate because of changes in conditions, or that the degree of compliance with the policies or procedures may deteriorate.
In our opinion, the consolidated financial statements referred to above present fairly, in all material respects, the consolidated financial position of Federated National Holding Company as of December 31, 2014 and 2013, and the consolidated results of its operations and its cash flows for each of the years in the three year period ended December 31, 2014, in conformity with accounting principles generally accepted in the United States of America. Also in our opinion, Federated National Holdings Company maintained, in all material respects, effective internal control over financial reporting as of December 31, 2014, based on criteria established in Internal Control—Integrated Framework (2013) issued by the Committee of Sponsoring Organizations of the Treadway Commission (COSO).
Goldstein Schechter Koch
Fort Lauderdale, FL
March 16, 2015
Federated National Holding Company and Subsidiaries
CONSOLIDATED BALANCE SHEETS
DECEMBER 31, 2014 AND 2013
| Period Ending | ||||||||
|
December 31, 2014
|
December 31, 2013
|
|||||||
|
ASSETS
|
(Dollars in Thousands)
|
|||||||
|
Investments
|
||||||||
|
Debt maturities, available for sale, at fair value
|
$
|
284,099
|
$
|
174,912
|
||||
|
Debt maturities, held to maturity, at amortized cost
|
7,417
|
7,214
|
||||||
|
Equity securities, available for sale, at fair value
|
39,247
|
38,584
|
||||||
|
Total investments
|
330,763
|
220,710
|
||||||
|
Cash and short term investments
|
40,157
|
41,446
|
||||||
|
Prepaid reinsurance premiums
|
54,502
|
7,592
|
||||||
|
Premiums receivable, net of allowance for credit losses of $148 and $143, respectively
|
27,275
|
22,414
|
||||||
|
Reinsurance recoverable, net
|
12,534
|
2,742
|
||||||
|
Deferred policy acquisition costs
|
13,610
|
16,708
|
||||||
|
Deferred income taxes, net
|
-
|
1,006
|
||||||
|
Income taxes receivable
|
1,810
|
-
|
||||||
|
Property, plant and equipment, net
|
1,749
|
929
|
||||||
|
Other assets
|
7,231
|
3,194
|
||||||
|
Contingent quota-share profit sharing
|
14,000
|
-
|
||||||
|
Total assets
|
$
|
503,631
|
$
|
316,741
|
||||
|
LIABILITIES AND SHAREHOLDERS' EQUITY
|
||||||||
|
Unpaid losses and LAE
|
$
|
78,330
|
$
|
61,016
|
||||
|
Unearned premiums
|
192,424
|
128,343
|
||||||
|
Premiums deposits and customer credit balances
|
7,381
|
3,833
|
||||||
|
Claims payments outstanding
|
10,152
|
6,203
|
||||||
|
Income taxes payable
|
-
|
2,379
|
||||||
|
Deferred income taxes, net
|
1,341
|
-
|
||||||
|
Accounts payable and accrued expenses
|
10,924
|
6,473
|
||||||
|
Deferred quota-share profit sharing
|
10,500
|
-
|
||||||
|
Total liabilities
|
311,052
|
208,247
|
||||||
|
Shareholders' equity:
|
||||||||
|
Common stock, $0.01 par value. Authorized 25,000,000 shares; issued and outstanding 13,632,414 and 10,901,716, respectively
|
136
|
109
|
||||||
|
Preferred stock, $0.01 par value. Authorized 1,000,000 shares; none issued or outstanding
|
-
|
-
|
||||||
|
Additional paid-in capital
|
127,302
|
80,525
|
||||||
|
Accumulated other comprehensive income
|
||||||||
|
Unrealized net gains on investments, available for sale
|
7,718
|
5,964
|
||||||
|
Total accumulated other comprehensive income
|
7,718
|
5,964
|
||||||
|
Retained earnings
|
57,423
|
21,896
|
||||||
|
Total shareholders' equity
|
192,579
|
108,494
|
||||||
|
Total liabilities and shareholders' equity
|
$
|
503,631
|
$
|
316,741
|
||||
See accompanying notes to consolidated financial statements.
Federated National Holding Company and Subsidiaries
CONSOLIDATED STATEMENTS OF OPERATIONS
YEARS ENDED DECEMBER 31, 2014, 2013 AND 2012
|
Twelve Months Ended December 31,
|
||||||||||||
|
2014
|
2013
|
2012
|
||||||||||
|
(Dollars in Thousands except EPS and Share and Dividend Data)
|
||||||||||||
|
Revenue:
|
||||||||||||
|
Gross premiums written
|
$
|
377,156
|
$
|
243,373
|
$
|
119,459
|
||||||
|
Gross premiums ceded
|
(201,998
|
)
|
(82,708
|
)
|
(51,085
|
)
|
||||||
|
Net premiums written
|
175,158
|
160,665
|
68,374
|
|||||||||
|
Increase in prepaid reinsurance premiums
|
59,828
|
13,052
|
2,059
|
|||||||||
|
Increase in unearned premiums
|
(64,081
|
)
|
(69,336
|
)
|
(11,074
|
)
|
||||||
|
Net change in prepaid reinsurance premiums and unearned premiums
|
(4,253
|
)
|
(56,284
|
)
|
(9,015
|
)
|
||||||
|
Net premiums earned
|
170,905
|
104,381
|
59,359
|
|||||||||
|
Commission income
|
4,517
|
2,646
|
1,377
|
|||||||||
|
Finance revenue
|
1,466
|
866
|
496
|
|||||||||
|
Direct written policy fees
|
8,689
|
6,196
|
2,007
|
|||||||||
|
Net investment income
|
5,385
|
3,332
|
3,819
|
|||||||||
|
Net realized investment gains
|
4,426
|
2,881
|
1,072
|
|||||||||
|
Other income
|
2,512
|
1,435
|
517
|
|||||||||
|
Quota-share profit sharing, net
|
2,792
|
-
|
-
|
|||||||||
|
Total revenue
|
200,692
|
121,737
|
68,647
|
|||||||||
|
Expenses:
|
||||||||||||
|
Losses and LAE
|
81,036
|
56,410
|
30,209
|
|||||||||
|
Operating and underwriting expenses
|
19,906
|
14,474
|
9,996
|
|||||||||
|
Salaries and wages
|
14,968
|
10,188
|
8,439
|
|||||||||
|
Amortization of deferred policy acquisition costs
|
27,475
|
21,447
|
13,255
|
|||||||||
|
Total expenses
|
143,385
|
102,519
|
61,899
|
|||||||||
|
Income before provision for income tax expense
|
57,307
|
19,218
|
6,748
|
|||||||||
|
Provision for income tax expense
|
20,108
|
6,491
|
2,435
|
|||||||||
|
Net income
|
$
|
37,199
|
$
|
12,727
|
$
|
4,313
|
||||||
|
Net income per share - basic
|
$
|
3.08
|
$
|
1.50
|
$
|
0.53
|
||||||
|
Net income per share - diluted
|
$
|
2.99
|
$
|
1.45
|
$
|
0.53
|
||||||
|
Weighted average number of common shares outstanding - basic
|
12,082,269
|
8,505,967
|
7,951,906
|
|||||||||
|
Weighted average number of common shares outstanding - diluted
|
12,438,418
|
8,772,060
|
8,016,110
|
|||||||||
|
Dividends paid per share
|
$
|
0.13
|
$
|
0.11
|
$
|
0.02
|
||||||
See accompanying notes to consolidated financial statements.
Federated National Holding Company and Subsidiaries
CONSOLIDATED STATEMENTS OF COMPREHENSIVE INCOME
YEARS ENDED DECEMBER 31, 2014, 2013 AND 2012
|
Years Ended December 31,
|
||||||||||||
|
2014
|
2013
|
2012
|
||||||||||
|
(Dollars in Thousands)
|
||||||||||||
|
Net income
|
$
|
37,199
|
$
|
12,727
|
$
|
4,313
|
||||||
|
Change in net unrealized gains on investments available for sale
|
2,856
|
3,041
|
5,114
|
|||||||||
|
Comprehensive income before tax
|
40,055
|
15,768
|
9,427
|
|||||||||
|
Income tax expense related to items of other comprehensive income
|
(1,102
|
)
|
(1,144
|
)
|
(1,924
|
)
|
||||||
|
Comprehensive income
|
$
|
38,953
|
$
|
14,624
|
$
|
7,503
|
||||||
See accompanying notes to consolidated financial statements.
Federated National Holding Company and Subsidiaries
CONSOLIDATED STATEMENTS OF CHANGES IN SHAREHOLDERS' EQUITY AND
COMPREHENSIVE INCOME
YEARS ENDED DECEMBER 31, 2014, 2013 AND 2012
|
Comprehensive
Income |
Common
Stock |
Additional
Paid-in |
Accumulated
Other |
Retained
Earnings |
Total
Shareholders' |
|||||||||||||||||||
| (Dollars in Thousands) | ||||||||||||||||||||||||
|
Balance as of December 31, 2011
|
79
|
50,940
|
877
|
6,248
|
58,144
|
|||||||||||||||||||
|
Net income
|
$
|
4,313
|
4,313
|
4,313
|
||||||||||||||||||||
|
Cash dividends
|
(159
|
)
|
(159
|
)
|
||||||||||||||||||||
|
Treasury stock acquired
|
-
|
|||||||||||||||||||||||
|
Stock options exercised
|
1
|
128
|
129
|
|||||||||||||||||||||
|
Shares based compensation
|
288
|
288
|
||||||||||||||||||||||
|
Net unrealized change in investments, net of tax effect of ($1,924)
|
3,190
|
3,190
|
3,190
|
|||||||||||||||||||||
|
Comprehensive income
|
$
|
7,503
|
||||||||||||||||||||||
|
Balance as of December 31, 2012
|
80
|
51,356
|
4,067
|
10,402
|
65,905
|
|||||||||||||||||||
|
Net income
|
$
|
12,727
|
12,727
|
12,727
|
||||||||||||||||||||
|
Cash dividends
|
(1,233
|
)
|
(1,233
|
)
|
||||||||||||||||||||
|
Stock issued for capital raised
|
28
|
27,851
|
27,879
|
|||||||||||||||||||||
|
Treasury stock acquired
|
-
|
|||||||||||||||||||||||
|
Stock options exercised
|
1
|
857
|
858
|
|||||||||||||||||||||
|
Shares based compensation
|
461
|
461
|
||||||||||||||||||||||
|
Net unrealized change in investments, net of tax effect of ($1,144)
|
1,897
|
1,897
|
1,897
|
|||||||||||||||||||||
|
Comprehensive income
|
$
|
14,624
|
||||||||||||||||||||||
|
Balance as of December 31, 2013
|
109
|
80,525
|
5,964
|
21,896
|
108,494
|
|||||||||||||||||||
|
Net income
|
$
|
37,199
|
37,199
|
37,199
|
||||||||||||||||||||
|
Cash dividends
|
(1,672
|
)
|
(1,672
|
)
|
||||||||||||||||||||
|
Stock issued for capital raised
|
23
|
43,086
|
43,109
|
|||||||||||||||||||||
|
Treasury stock acquired
|
-
|
|||||||||||||||||||||||
|
Stock options exercised
|
4
|
1,551
|
1,555
|
|||||||||||||||||||||
|
Shares based compensation
|
2,140
|
2,140
|
||||||||||||||||||||||
|
Net unrealized change in investments, net of tax effect of ($1,102)
|
1,754
|
1,754
|
1,754
|
|||||||||||||||||||||
|
Comprehensive income
|
$
|
38,953
|
||||||||||||||||||||||
|
Balance as of December 31, 2014
|
$
|
136
|
$
|
127,302
|
$
|
7,718
|
$
|
57,423
|
$
|
192,579
|
||||||||||||||
See accompanying notes to consolidated financial statements.
Federated National Holding Company and Subsidiaries
CONSOLIDATED STATEMENTS OF CASH FLOWSYEARS ENDED DECEMBER 31, 2014, 2013 AND 2012
|
For the Years Ended December 31,
|
||||||||||||
|
2014
|
2013
|
2012
|
||||||||||
|
(Dollars in Thousands)
|
||||||||||||
|
Cash flow from operating activities:
|
||||||||||||
|
Net income
|
$
|
37,199
|
$
|
12,727
|
$
|
4,313
|
||||||
|
Adjustments to reconcile net income to net cash provided by operating activities:
|
||||||||||||
|
Amortization of investment premium or discount, net
|
4,165
|
1,761
|
1,356
|
|||||||||
|
Depreciation and amortization of property plant and equipment, net
|
149
|
263
|
195
|
|||||||||
|
Net realized investment gains
|
(4,426
|
)
|
(2,881
|
)
|
(1,072
|
)
|
||||||
|
Non-cash impairment recognition
|
-
|
-
|
(44
|
)
|
||||||||
|
Recovery for credit losses, net
|
-
|
-
|
(12
|
)
|
||||||||
|
(Recovery) provision for uncollectible premiums receivable
|
(5
|
)
|
(74
|
)
|
5
|
|||||||
|
Non-cash compensation
|
1,660
|
293
|
188
|
|||||||||
|
Changes in operating assets and liabilities:
|
||||||||||||
|
Premiums receivable
|
(4,855
|
)
|
(14,317
|
)
|
(2,412
|
)
|
||||||
|
Prepaid reinsurance premiums
|
(46,911
|
)
|
(546
|
)
|
1,293
|
|||||||
|
Reinsurance recoverable, net
|
(9,793
|
)
|
761
|
(1,415
|
)
|
|||||||
|
Income taxes recoverable
|
(1,810
|
)
|
39
|
(39
|
)
|
|||||||
|
Deferred income tax expense, net of other comprehensive income
|
1,245
|
2,188
|
2,350
|
|||||||||
|
Policy acquisition costs, net of amortization
|
3,098
|
(8,229
|
)
|
(761
|
)
|
|||||||
|
Other assets
|
(4,037
|
)
|
(536
|
)
|
(552
|
)
|
||||||
|
Contingent quota-share profit sharing
|
(3,500
|
)
|
-
|
-
|
||||||||
|
Unpaid losses and LAE
|
17,315
|
11,108
|
(10,075
|
)
|
||||||||
|
Unearned premiums
|
64,081
|
69,336
|
11,074
|
|||||||||
|
Premium deposits and customer credit balances
|
3,548
|
1,376
|
(347
|
)
|
||||||||
|
Income taxes payable
|
(2,379
|
)
|
2,379
|
(77
|
)
|
|||||||
|
Claims payments outstanding
|
3,949
|
216
|
(1,942
|
)
|
||||||||
|
Accounts payable and accrued expenses
|
4,451
|
3,849
|
(486
|
)
|
||||||||
|
Net cash provided by operating activities
|
63,144
|
79,713
|
1,540
|
|||||||||
|
Cash flow (used) provided by investing activities:
|
||||||||||||
|
Proceeds from sale of investment securities
|
87,151
|
106,173
|
90,449
|
|||||||||
|
Purchases of investment securities available for sale
|
(194,087
|
)
|
(192,627
|
)
|
(86,203
|
)
|
||||||
|
Purchases of property and equipment
|
(969
|
)
|
(629
|
)
|
83
|
|||||||
|
Net cash (used) provided by investing activities
|
(107,905
|
)
|
(87,083
|
)
|
4,329
|
|||||||
|
Cash flow provided by financing activities:
|
||||||||||||
|
Exercised stock options
|
$
|
1,555
|
$
|
858
|
$
|
128
|
||||||
|
Dividends paid
|
(1,672
|
)
|
(1,232
|
)
|
(159
|
)
|
||||||
|
Issuance of common stock
|
43,110
|
27,879
|
-
|
|||||||||
|
Tax benefit related to non-cash compensation
|
479
|
168
|
100
|
|||||||||
|
Net cash provided by financing activities
|
43,472
|
27,673
|
69
|
|||||||||
|
Net (decrease) increase in cash and short term investments
|
(1,289
|
)
|
20,303
|
5,938
|
||||||||
|
Cash and short term investments at beginning of period
|
41,446
|
21,143
|
15,205
|
|||||||||
|
Cash and short term investments at end of period
|
$
|
40,157
|
$
|
41,446
|
$
|
21,143
|
||||||
See accompanying notes to consolidated financial statements.
Federated National Holding Company and Subsidiaries
CONSOLIDATED STATEMENTS OF CASH FLOWS
YEARS ENDED DECEMBER 31, 2014, 2013 AND 2012
|
For the Years Ended December 31,
|
||||||||||||
|
(continued)
|
2014
|
2013
|
2012
|
|||||||||
|
(Dollars in Thousands)
|
||||||||||||
|
Supplemental disclosure of cash flow information:
|
||||||||||||
|
Cash paid during the period for:
|
||||||||||||
|
Income taxes
|
$
|
19,185
|
$
|
1,870
|
$
|
165
|
||||||
|
Non-cash investing and finance activities:
|
||||||||||||
|
Accrued dividends payable
|
$
|
564
|
$
|
330
|
$
|
159
|
||||||
See accompanying notes to consolidated financial statements.
Federated National Holding Company and Subsidiaries
Notes to Consolidated Financial Statements
December 31, 2014
(1) ORGANIZATION AND BUSINESS
The accompanying consolidated financial statements include the accounts of the Company and its subsidiaries. All significant intercompany balances and transactions have been eliminated in consolidation.
Federated National Holding Company (“FNHC”, “Company”, “we”, “us”), formerly known as 21st Century Holding Company is an insurance holding company that controls substantially all steps in the insurance underwriting, distribution and claims processes through our subsidiaries and our contractual relationships with our independent agents and general agents. We changed our name on September 11, 2012, pursuant to approval received at our annual shareholders’ meeting, from 21st Century Holding Company so that our parent company and other subsidiary companies’ names are consistent with our primary insurance subsidiary and the name under which we have been writing insurance for more than 23 years.
We are authorized to underwrite, and/or place through our wholly owned subsidiaries, homeowners’ multi-peril (“homeowners”), commercial general liability, federal flood, personal auto and various other lines of insurance in Florida and various other states. We market and distribute our own and third-party insurers’ products and our other services through a network of independent agents.
Our insurance subsidiary is Federated National Insurance Company (“FNIC”). FNIC is licensed as an admitted carrier in Florida. An admitted carrier is an insurance company that has received a license from the state department of insurance giving the company the authority to write specific lines of insurance in that state. These companies are also bound by rate and form regulations, and are strictly regulated to protect policyholders from a variety of illegal and unethical practices, including fraud. Admitted carriers are also required to financially contribute to the state guarantee fund, which is used to pay for losses if an insurance carrier becomes insolvent or unable to pay the losses due their policyholders. Through contractual relationships with a network of approximately 3,600 independent agents, of which approximately 2,300 actively sell and service our products, FNIC is authorized to underwrite homeowners’, commercial general liability, fire, allied lines and personal and commercial automobile insurance in Florida. FNIC is licensed as an admitted carrier in Alabama, Louisiana, Georgia and Texas and underwrites commercial general liability insurance in those states. FNIC also underwrites homeowners’ insurance in Louisiana and Alabama, commencing in October 2014. Additionally, we underwrite personal automobile insurance in Georgia and Texas.
FNIC is licensed as a non-admitted carrier in Missouri, Nevada and South Carolina and can underwrite commercial general liability insurance in all of these states. Currently, we do not have any operations in these states. A non-admitted carrier, sometimes referred to as a “excess and surplus lines” carrier, is permitted to do business in a state and, although it is strictly regulated to protect policyholders from a variety of illegal and unethical practices, including fraud, non-admitted carriers are subject to considerably less regulation with respect to policy rates and forms. Non-admitted carriers are not required to financially contribute to and benefit from the state guarantee fund, which is used to pay for losses if an insurance carrier becomes insolvent or unable to pay the losses due their policyholders.
We internally process claims made by our insureds through our wholly owned claims adjusting company, Federated National Adjusting, Inc. (“FNA”). Our agents have no authority to settle claims or otherwise exercise control over the claims process. Furthermore, we believe that the retention of independent adjusters, in addition to the employment of salaried claims personnel, results in reduced ultimate loss payments, lower Loss and loss adjustment expenses (“LAE”) and improved customer service for our claimants and policyholders. We also employ an in-house litigation management team to cost effectively manage claims-related litigation and to monitor our claims handling practices for efficiency and regulatory compliance.
During 2014, the Florida Office of Insurance Regulation (“Florida OIR”) approved an application to allow the claims administration operations of FNA to be assumed by FedNat Underwriters, Inc. (“FNU”), formerly known as Federated National Underwriters Inc., a wholly owned subsidiary of the Company. Under the amended managing general agency agreement between FNU and FNIC, FNU will provide the same claims administration services under the same fee structure. The combination of these services in FNU had no effect on consolidated net income.
FNU acts as FNIC’s exclusive managing general agent in Florida and is also licensed as a managing general agent in the States of Alabama, Georgia, Louisiana, Mississippi, Nevada, South Carolina and Texas. FNU has contracted with other unaffiliated insurance companies to sell personal umbrella through FNU’s existing network of agents.
FNU earns commissions and fees for providing policy administration, marketing, accounting and analytical services, and for participating in the negotiation of reinsurance contracts. FNU earns a per policy fee which ranges from $25 to $55 and a commission fee from its affiliate, FNIC, which totaled 4% during 2014. The Florida OIR periodically reviews our managing general agent’s fee structure to ensure that it is neither excessive nor inadequate to operate.
Federated National Holding Company and Subsidiaries
Notes to Consolidated Financial Statements
December 31, 2014
The homeowner policy provides FNU the right to cancel any policy within a period of 90 days from the policy's inception with 25 days’ notice, or after 90 days from policy inception with 95 days’ notice, even if the risk falls within our underwriting criteria.
Although we are authorized to underwrite the various lines described above, our business is primarily underwriting homeowners’ policies. During 2014, 91.4%, 3.3%, 2.0% and 3.3% of the premiums we underwrote were for homeowners’, commercial general liability, federal flood, and personal automobile insurance, respectively. During 2014, $39.6 million or 11.0% of the $344.9 million of homeowners’ premiums we underwrote were produced under an agency agreement with Ivantage Select Agency, Inc. (“ISA”), an affiliate of Allstate Insurance Company, that grants Allstate agents the authority to offer certain FNU products. The $39.6 million of homeowners’ premiums produced under this agreement with ISA represents 31.0% of the total increase in the sale of homeowners’ policies during 2014, compared with 2013. This network of agents began writing for FNIC in March 2013. During 2013, 89.6%, 4.3%, 2.6% and 3.5% of the premiums we underwrote were for homeowners’, commercial general liability, federal flood, and personal automobile insurance, respectively.
During the years ended December 31, 2014, 2013 or 2012, we did not experience any weather-related catastrophic events such as the hurricanes that occurred in Florida during 2005 and 2004. We are not able to predict how hurricanes or other insurable events will affect our future results of operations and liquidity. LAE is affected by a number of factors, many of which are partially or entirely beyond our control, including the following.
| · | the nature and severity of the loss; |
| · | weather-related patterns; |
| · | the availability, cost and terms of reinsurance; |
| · | underlying settlement costs, including medical and legal costs; |
| · | legal and political factors such as legislative initiatives and public opinion; |
| · | macroeconomic issues. |
Our business, results of operations and financial condition are subject to fluctuations due to a variety of factors. Abnormally high severity or frequency of claims in any period could have a material adverse effect on us. When our estimated liabilities for unpaid losses and LAE are less than the actuarially determined amounts, we increase the expense in the current period. Conversely, when our estimated liabilities for unpaid losses and LAE are greater than the actuarially determined amounts, we decrease the expense in the current period.
We previously entered into a Coexistence Agreement effective August 30, 2013 (the “Coexistence Agreement”) with Federated Mutual Insurance Company (“Federated Mutual”) pursuant to which, among other things, we may continue to use “Federated” until at least August 30, 2020, after which time we have agreed to either cease using “Federated” in commerce or otherwise adopt and use trade names that are not confusingly similar to Federated Mutual’s trademarks. We continue to develop our brand under the “FedNat” name, which is the name by which agents generally know us.
We are focusing our marketing efforts on continuing to expand our distribution network while maintaining our commitment to long-term relationships. We market our products and services throughout Florida and in other states by establishing relationships with additional independent agents and general agents. There can be no assurance, however, that we will be able to obtain the required regulatory approvals to offer additional insurance products or expand into other states.
(2) SUMMARY OF SIGNIFICANT ACCOUNTING POLICIES AND PRACTICES
(a) CASH AND SHORT TERM INVESTMENTS
We consider all short-term highly liquid investments with original maturities of less than three months to be short term investments.
(b) INVESTMENTS
Our investment securities have been classified as either available-for-sale or held-to-maturity in response to our liquidity needs, changes in market interest rates and asset-liability management strategies, among other reasons. Investments available-for-sale are stated at fair value on the balance sheet. Investments designated as held-to-maturity are stated at amortized cost on the balance sheet. Unrealized gains and losses are excluded from earnings and are reported as a component of other comprehensive income within shareholders' equity, net of related deferred income taxes.
Federated National Holding Company and Subsidiaries
Notes to Consolidated Financial Statements
December 31, 2014
A decline in the fair value of an available-for-sale security below cost that is deemed other-than-temporary results in a charge to income, resulting in the establishment of a new cost basis for the security. Premiums and discounts are amortized or accreted, respectively, over the life of the related debt security as an adjustment to yield using a method that approximates the effective interest method. Dividends and interest income are recognized when earned. Realized gains and losses are included in earnings and are derived using the specific-identification method for determining the cost of securities sold.
(c) PREMIUM REVENUE
Premium revenue on all lines is earned on a pro-rata basis over the life of the policies. Unearned premiums represent the portion of the premium related to the unexpired policy term.
(d) DEFERRED ACQUISITION COSTS
Deferred acquisition costs primarily represent commissions paid to outside agents at the time of policy issuance (to the extent they are recoverable from future premium income) net of ceded premium commission earned from reinsurers, salaries and premium taxes net of policy fees, and are amortized over the life of the related policy in relation to the amount of premiums earned. The method followed in computing deferred acquisition costs limits the amount of such deferred costs to their estimated realizable value, which gives effect to the premium to be earned, related investment income, unpaid losses and LAE and certain other costs expected to be incurred as the premium is earned. There is no indication that these costs will not be fully recoverable in the near term.
(e) PREMIUM DEPOSITS
Premium deposits represent premiums received primarily in connection with homeowner policies that are not yet effective. We take approximately 30 working days to issue the policy from the date the cash and policy application are received.
(f) UNPAID LOSSES AND LAE
Unpaid losses and LAE are determined by establishing liabilities in amounts estimated to cover incurred losses and LAE. Such liabilities are determined based upon our assessment of claims pending and the development of prior years' loss liability. These amounts include liabilities based upon individual case estimates for reported losses and LAE and estimates of such amounts that are incurred but not yet reported (“IBNR”). Changes in the estimated liability are charged or credited to operations as the losses and LAE are settled.
The estimates of the liability for unpaid losses and LAE are subject to the effect of trends in claims severity and frequency and are continually reviewed. As part of this process, we review historical data and consider various factors, including known and anticipated legal developments, inflation and economic conditions. As experience develops and other data become available, these estimates are revised, as required, resulting in increases or decreases to the existing liability for unpaid losses and LAE. Adjustments are reflected in results of operations in the period in which they are made and the liabilities may deviate substantially from prior estimates.
There can be no assurance that our liability for unpaid losses and LAE will be adequate to cover actual losses. If our liability for unpaid losses and LAE proves to be inadequate, we will be required to increase the liability with a corresponding reduction in our net income in the period in which the deficiency is identified. Future loss experience substantially in excess of established liability for unpaid losses and LAE could have a material adverse effect on our business, results of operations and financial condition.
Accounting for loss contingencies pursuant to Financial Accounting Standards Board (“FASB”) issued guidance involves the existence of a condition, situation or set of circumstances involving uncertainty as to possible loss that will ultimately be resolved when one or more future event(s) occur or fail to occur. Additionally, accounting for a loss contingency requires management to assess each event as probable, reasonably possible or remote. Probable is defined as the future event or events are likely to occur. Reasonably possible is defined as the chance of the future event or events occurring is more than remote but less than probable, while remote is defined as the chance of the future event or events occurring is slight. An estimated loss in connection with a loss contingency shall be recorded by a charge to current operations if both of the following conditions are met: First, the amount can be reasonably estimated, and second, the information available prior to issuance of the financial statements indicates that it is probable that a liability has been incurred at the date of the financial statements. It is implicit in this condition that it is probable that one or more future events will occur confirming the fact of the loss or incurrence of a liability.
Federated National Holding Company and Subsidiaries
Notes to Consolidated Financial Statements
December 31, 2014
We do not discount unpaid losses and LAE for financial statement purposes.
(g) FINANCE REVENUE
Interest and service income, resulting from the financing of insurance premiums, is recognized using a method that approximates the effective interest method. Late charges are recognized as income when chargeable.
(h) PREMIUMS RECEIVABLE, NET OF ALLOWANCE FOR CREDIT LOSSES
Provisions for credit losses are provided in amounts sufficient to maintain the allowance for credit losses at a level considered adequate to cover anticipated losses. Generally, accounts that are over 90 days old are written off to the allowance for credit losses. We have been increasing our reliance on direct billing of our policyholders for their insurance premiums. Direct billing is when the insurance company accepts from the insured, as a receivable, a promise to pay the premium, as opposed to requiring payment of the full amount of the policy, either directly from the insured or from a premium finance company. We manage the credit risk associated with our direct billing program through our integrated computer system which allows us to monitor the equity in the unearned premium to the underlying policy. Underwriting criteria are designed with down payment requirements and monthly payments that create policyholder equity, also called unearned premium, in the insurance policy. The equity in the policy is collateral for the extension of credit to the insured.
(i) MANAGING GENERAL AGENT (“MGA”) FEES
If all the costs substantially associated with the MGA contracts, which do not involve affiliated insurers, are incurred during the underwriting process, then the MGA fees and the related acquisition costs are recognized at the time the policy is underwritten, net of estimated cancellations. If the MGA contract requires significant involvement subsequent to the completion of the underwriting process, then the MGA fees and related acquisition costs are deferred and recognized over the life of the policy. Included in MGA Fees are policy fees charged by the insurance companies and passed through to FNU. Policy fees are discussed below.
(j) POLICY FEES
Policy fees range from $25 to $55 and represent a non-refundable application fee for insurance coverage, which are intended to reimburse us for the costs incurred to underwrite the policy. The fees and related costs are recognized when the policy is underwritten. These fees are netted against underwriting costs and are included as a component of deferred acquisition costs.
(k) REINSURANCE
We recognize the income and expense on reinsurance contracts principally on a pro-rata basis over the term of the reinsurance contracts or until the reinsurers maximum liability is exhausted, whichever comes first. We are reinsured under separate reinsurance agreements for the different lines of business underwritten. Reinsurance contracts do not relieve us from our obligations to policyholders. We continually monitor our reinsurers to minimize our exposure to significant losses from reinsurer insolvencies. We only cede risks to reinsurers whom we believe to be financially sound. At December 31, 2014, all reinsurance recoverables are considered current and deemed collectable.
(l) INCOME TAXES
Income taxes are accounted for under the asset and liability method. Deferred tax assets and liabilities are recognized for the estimated future tax consequences attributable to differences between the financial statement carrying amounts of existing assets and liabilities and their respective tax bases, and operating loss, capital loss and tax-credit carryforwards. Deferred tax assets and liabilities are measured using enacted tax rates expected to apply to taxable income in the years in which those temporary differences are expected to be recovered or settled. The effect on deferred tax assets and liabilities of a change in tax rates is recognized in income or expense in the period that includes the enactment date.
(m) CONCENTRATION OF CREDIT RISK
FNU earns commissions and fees for providing policy administration, marketing, accounting and analytical services, and for participating in the negotiation of reinsurance contracts. FNU earns a per policy fee which ranges from $25 to $55 and a commission fee from its affiliate, FNIC, which totaled 4% during 2014. The Florida OIR periodically reviews our managing general agent’s fee structure to ensure that it is neither excessive nor inadequate to operate.
Federated National Holding Company and Subsidiaries
Notes to Consolidated Financial Statements
December 31, 2014
Financial instruments, which potentially expose us to concentrations of credit risk, consist primarily of investments, premiums receivable, amounts due from reinsurers on paid and unpaid losses and finance contracts. We have not experienced significant losses related to premiums receivable from individual policyholders or groups of policyholders in a particular industry or geographic area. We believe no credit risk beyond the amounts provided for collection losses is inherent in our premiums receivable or finance contracts. In order to reduce credit risk for amounts due from reinsurers, we seek to do business with financially sound reinsurance companies and regularly review the financial strength of all reinsurers used. Additionally, our credit risk in connection with our reinsurers is frequently mitigated by the establishment of irrevocable clean letters of credit in favor of FNIC.
(n) RECENT ACCOUNTING PRONOUNCEMENTS
In June 2014, the FASB issued Accounting Standard Update (“ASU”) No. 2014-12: Compensation – Stock Compensation (Topic 718): Accounting for Share-Based Payments When the Terms of an Award Provide That a Performance Target Could Be Achieved after the Requisite Service Period, a consensus of the FASB Emerging Issues Task Force. The amendments in this ASU apply to all reporting entities that grant their employees share-based payments in which the terms of the award provide that a performance target that affects vesting could be achieved after the requisite service period. That is the case when an employee is eligible to retire or otherwise terminate employment before the end of the period in which a performance target (for example, an initial public offering or a profitability target) could be achieved and still be eligible to vest in the award if and when the performance target is achieved. The amendments in the ASU require that a performance target that affects vesting and that could be achieved after the requisite service period be treated as a performance condition. Current U.S. Generally Accepted Accounting Principles (“GAAP”) does not contain explicit guidance on whether to treat a performance target that could be achieved after the requisite service period as a performance condition that affects vesting or as a non-vesting condition that affects the grant-date fair value of an award. The amendments in this ASU provide explicit guidance for those awards. The amendments in this ASU are effective for annual periods and interim periods within those annual periods beginning after December 15, 2015, and, earlier adoption is permitted. The adoption of the amendments in this ASU will not have a material impact on our financial position, results of operations or cash flows.
In July 2013, the FASB issued Accounting Standard Update (“ASU”) No. 2013-11: Income Taxes (Topic 740): Presentation of an Unrecognized Tax Benefit When a Net Operating Loss Carryforward, a Similar Tax Loss, or a Tax Credit Carryforward Exists. Topic 740, Income Taxes, does not include explicit guidance on the financial statement presentation of an unrecognized tax benefit when a net operating loss carryforward, a similar tax loss, or a tax credit carryforward exists, and there is diversity in practice in the presentation of unrecognized tax benefit in those instances. The objective of the amendments in this ASU is to eliminate that diversity in practice. The ASU applies to all entities that have unrecognized tax benefits when a net operating loss carry forward, a similar tax loss, or a tax credit carryforward exists at the operating date. The ASU is effective for fiscal years, and interim periods within those years, beginning after December 15, 2013 and early adoption is permitted. The amendments in this ASU should be applied prospectively to all unrecognized tax benefits that exist at the effective date and retrospective application is permitted. The adoption of the amendments in this ASU did not have a material impact on our financial condition, results of operations or cash flows.
In February 2013, the FASB issued ASU No. 2013-02: Comprehensive Income (Topic 220): Reporting of Amounts Reclassified Out of Accumulated Other Comprehensive Income. The objective of this ASU is to improve the reporting of reclassifications out of accumulated other comprehensive income. The amendments require an entity to report the effect of significant reclassifications out of accumulated other comprehensive income on the respective line items in net income if the amount being reclassified is required under U.S. GAAP to be reclassified in its entirety in net income. For other amounts that are not required to be reclassified to net income in the same reporting period, an entity is required to cross-reference other disclosures required under U.S. GAAP that provide additional detail about those amounts. The amendments in the ASU do not change the current requirements for reporting net income or other comprehensive income in financial statements. The ASU is effective prospectively for reporting periods beginning after December 15, 2012. The adoption of these amendments did not have a material impact on our financial condition, results of operations or cash flows.
In January 2013, the FASB issued ASU No. 2013-01: Balance Sheet (Topic 210): Clarifying the Scope of Disclosures about Offsetting Assets and Liabilities. The objective of this ASU is to clarify the scope of offsetting disclosures and to address implementation issues with ASU No. 2011-11, Balance Sheet (Topic 210): Disclosures about Offsetting Assets and Liabilities. The amendments clarify that the scope of ASU 2011-11 applies to derivatives accounted for in accordance with Topic 815, Derivatives and Hedging, including bifurcated embedded derivatives, repurchase agreements and reverse repurchase agreements, and securities borrowing and securities lending transactions. An entity is required to apply the amendments for fiscal years beginning on or after January 1, 2013, and interim periods within those annual periods. An entity should provide the required disclosures retrospectively for all comparative periods. The adoption of these amendments did not have a material impact on our financial condition, results of operations or cash flows.
Federated National Holding Company and Subsidiaries
Notes to Consolidated Financial Statements
December 31, 2014
In July 2012, the FASB issued ASU No. 2012-02: Intangibles – Goodwill and Other (Topic 350): Testing Indefinite-Lived Intangible Assets for Impairment. The objective of the amendments in this ASU is to reduce the cost and complexity of performing an impairment test for indefinite-lived intangible assets by simplifying how an entity tests those assets for impairment and to improve consistency in impairment testing guidance among long-lived asset categories. The amendments permit an entity first to assess qualitative factors to determine whether it is more likely than not that an indefinite-lived intangible asset is impaired as a basis for determining whether it is necessary to perform the quantitative impairment test in accordance with Subtopic 350-30. The more-likely-than-not threshold is defined as having a likelihood of more than 50 percent. Upon adoption, these amendments are effective for annual and interim impairment tests performed for fiscal years beginning after September 15, 2012; early adoption is permitted. The adoption of these amendments did not have a material impact on our financial condition, results of operations or cash flows.
In June 2011, the FASB issued ASU No. 2011-05: Comprehensive Income (Topic 220): Presentation of Comprehensive Income. The guidance in this ASU is intended to increase the prominence of items reported in other comprehensive income in the financial statements by presenting the total of comprehensive income, the components of net income and the components of other comprehensive income either in a single continuous statement of comprehensive income or in two separate but consecutive statements. This ASU eliminates the option to present the components of other comprehensive income as part of the statement of changes in stockholders' equity. The guidance in this ASU does not change the items that must be reported in other comprehensive income or when an item of other comprehensive income must be reclassified to net income. Upon adoption, this update is to be applied retrospectively and is effective during interim and annual periods beginning after December 15, 2011. Early adoption is permitted. The adoption of this ASU did not have a material impact on our financial condition, results of operations or cash flows.
In December 2011, the FASB issued ASU No. 2011-12: Comprehensive Income (Topic 220): Deferral of the Effective Date for Amendments to the Presentation of Reclassifications of Items Out of Accumulated Other Comprehensive Income in Accounting Standards Update No. 2011-05. The guidance defers certain provisions contained in ASU No. 2011-05 requiring the requirement to present components of reclassifications of other comprehensive income on the face of the income statement or in the notes to the financial statements. However, this deferral does not impact the other requirements contained in the new standard on comprehensive income as described above. This ASU is effective during interim and annual periods beginning after December 15, 2011. The adoption of this ASU did not have a material impact on our financial condition, results of operations or cash flows.
In September 2011, the FASB issued ASU No. 2011-08: Intangibles – Goodwill and Other (Topic 350): Testing Goodwill for Impairment, which amends ASC Topic 350, Intangibles-Goodwill and Other. The guidance in this ASU permits an entity to first assess qualitative factors to determine whether it is more likely than not that the fair value of a reporting unit is less than its carrying amount as a basis for determining whether it is necessary to perform the two-step goodwill impairment test described in ASC Topic 350. Under the amendments in this ASU, an entity is not required to calculate the fair value of a reporting unit unless the entity determines that it is more likely than not that its fair value is less than its carrying amount. The amendments are effective for annual and interim goodwill impairment tests performed for fiscal years beginning after December 15, 2011. Early adoption is permitted, including for annual and interim goodwill impairment tests performed as of a date before September 15, 2011, if an entity’s financial statements for the most recent annual or interim period have not yet been issued or, for nonpublic entities, have not yet been made available for issuance. The adoption of this ASU did not have a material impact on our financial condition, results of operations or cash flows.
In December 2011, the FASB issued ASU No. 2011-11: Balance Sheet (Topic 210): Disclosures about Offsetting Assets and Liabilities, which requires new disclosure requirements mandating that entities disclose both gross and net information about instruments and transactions eligible for offset in the statement of financial position as well as instruments and transactions subject to an agreement similar to a master netting arrangement. In addition, the standard requires disclosure of collateral received and posted in connection with master netting agreements or similar arrangements. This ASU is effective for annual reporting periods beginning on or after January 1, 2013, and interim periods within those annual periods. The adoption of this ASU did not have a material impact on our financial condition, results of operations or cash flows.
Other recent accounting pronouncements issued by FASB, the American Institute of Certified Public Accountants (“AICPA”), and the Securities and Exchange Commission (“SEC”) did not or are not believed by management to have a material impact on the Company’s present or future financial statements.
Federated National Holding Company and Subsidiaries
Notes to Consolidated Financial Statements
December 31, 2014
(o) USE OF ESTIMATES
The preparation of financial statements in conformity with GAAP requires management to make estimates and assumptions about future events that affect the amounts reported in the financial statements and accompanying notes. Future events and their effects cannot be determined with absolute certainty. Therefore, the determination of estimates requires the exercise of judgment. Actual results inevitably will differ from those estimates, and such differences may be material to the financial statements.
Similar to other property and casualty insurers, our liability for unpaid losses and LAE, although supported by actuarial projections and other data, is ultimately based on management's reasoned expectations of future events. Although considerable variability is inherent in these estimates, we believe that this liability is adequate. Estimates are reviewed regularly and adjusted as necessary. Such adjustments are reflected in current operations. In addition, the realization of our deferred income tax assets is dependent on generating sufficient future taxable income. It is reasonably possible that the expectations associated with these accounts could change in the near term and that the effect of such changes could be material to the Consolidated Financial Statements.
(p) OPERATIONAL RISKS
We are subject to certain risks in our business operations which are described below. Careful consideration of these risks should be made before making an investment decision. The risks and uncertainties described below are not the only ones facing FNHC. Additional risks and uncertainties not presently known or currently deemed immaterial may also impair our business operations.
Risks Related to Our Business
| · | Our financial condition could be adversely affected by the occurrence of natural and man-made disasters. |
| · | Although we follow the industry practice of reinsuring a portion of our risks, our costs of obtaining reinsurance fluctuates and we may not be able to successfully alleviate risk through reinsurance arrangements. |
| · | We face a risk of non-collectability of reinsurance, which could materially and adversely affect our business, results of operations and/or financial condition. |
| · | Our January 2011 Consent Order with the Florida OIR, as amended in February 2013, limits our business in certain respects and may prevent us from growing our business. |
| · | If we are unable to continue our growth because our capital must be used to pay greater than anticipated claims, our financial results may suffer. |
| · | We may require additional capital in the future which may not be available or only available on unfavorable terms. |
| · | Our business is heavily regulated, and changes in regulation may reduce our profitability and limit our growth. |
| · | We may experience financial exposure from climate change. |
| · | Our loss reserves are estimates and may be inadequate to cover our actual liability for losses, causing our results of operations to be adversely affected. |
| · | Our revenues and operating performance may fluctuate due to statutorily approved assessments that support property and casualty insurance pools and associations. |
| · | Our investment portfolio may suffer reduced returns or losses, which would significantly reduce our earnings. |
| · | We may experience a loss due to the concentration of credit risk. |
| · | The failure of any of the loss limitation methods we employ could have a material adverse effect on our financial condition or our results of operations. |
| · | The effects of emerging claim and coverage issues on our business are uncertain. |
Federated National Holding Company and Subsidiaries
Notes to Consolidated Financial Statements
December 31, 2014
| · | Our failure to pay claims accurately could adversely affect our business, financial results and capital requirements. |
| · | Our insurance company is subject to minimum capital and surplus requirements, and our failure to meet these requirements could subject us to regulatory action. |
| · | Our revenues and operating performance may fluctuate with business cycles in the property and casualty insurance industry. |
| · | We may not obtain the necessary regulatory approvals to expand the types of insurance products we offer or the states in which we operate. |
| · | Adverse ratings by insurance rating agencies may adversely impact our ability to write new policies, renew desirable policies or obtain adequate insurance, which could limit or halt our growth and harm our business. |
| · | We rely on independent and general agents to write our insurance policies, and if we are not able to attract and retain independent and general agents, our revenues would be negatively affected. |
| · | Our business could be materially and adversely affected by a security breach or other attack involving our computer systems or the systems of one or more of our business partners or vendors. |
| · | We rely on our information technology and telecommunications systems, and the failure of these systems could disrupt our operations. |
| · | Nonstandard automobile insurance historically has a higher frequency of claims than standard automobile insurance, thereby increasing our potential for loss exposure beyond what we would be likely to experience if we offered only standard automobile insurance. |
| · | Florida's personal injury protection insurance statute contains provisions that favor claimants, causing us to experience a higher frequency of claims than might otherwise be the case if we operated only outside of Florida. |
| · | Our success depends on our ability to accurately price the risks we underwrite. |
| · | Current operating resources are necessary to develop future new insurance products. |
| · | Increased competition, competitive pressures, industry developments and market conditions could affect the growth of our business and adversely impact our financial results. |
| · | We may not obtain the necessary regulatory approvals to organize the new property and casualty insurer in Florida that is the subject of our previously announced joint venture. |
| · | Once Monarch is organized, we will be required to consolidate Monarch's financial results with ours. As a result, our financial results may be impacted by our percentage share of any losses that Monarch would be likely to experience in its first years of operations. |
| · | We anticipate that Monarch will initially focus on the Florida homeowners' insurance market, which will increase our exposure to the factors that impact the Florida insurance market generally, such as the occurrence of hurricanes, trends in claims experience, and the impact of changes in Florida insurance law and regulations. |
| · | Our participation in the Florida Property Insurance Clearinghouse may not result in an increase in our premium revenue. |
| · | Our senior management team is critical to the strategic direction of our company. If there were an unplanned loss of service by any of our officers our business could be harmed. |
| · | We are subject to extensive regulation and potential further restrictive regulation may increase our operating costs and limit our growth. |
| · | New homeowners’ insurance operations outside of the State of Florida may not be profitable. |
Federated National Holding Company and Subsidiaries
Notes to Consolidated Financial Statements
December 31, 2014
| · | We face risks in connection with potential material weakness resulting from our Sarbanes-Oxley Section 404 management report and any related remedial measures that we undertake. |
Risks Related to an Investment in Our Shares
| · | Our stock price in recent years has been volatile and is likely to continue to be volatile. As a result, the market price of our common stock may drop below the price you pay, and you may not be able to resell your shares at a profit. |
| · | If we report a material weakness in our internal controls and procedures, we may lose investor confidence and remedial measures may be costly. |
| · | Our controls and procedures may fail or be circumvented which could have a material adverse effect on our business, results of operations and financial condition. |
| · | We have authorized but unissued preferred stock, which could affect rights of holders of common stock. |
| · | Provisions in our articles of incorporation and our bylaws, as amended, and the Florida Business Corporation Act could make it more difficult to acquire us and may reduce the market price of our common stock. |
| · | As a holding company, we depend on the earnings of our subsidiaries and their ability to pay management fees and dividends to the holding company as the primary source of our income. |
| · | Future sales of our common stock may depress our stock price. |
(q) FAIR VALUE
The fair value of our investments is estimated based on prices published by financial services or quotations received from securities dealers and is reflective of the interest rate environment that existed as of the close of business on December 31, 2014 and 2013. Changes in interest rates subsequent to December 31, 2014 may affect the fair value of our investments. Refer to Footnote 21 of the Notes to Consolidated Financial Statements for details.
The carrying amounts for the following financial instrument categories approximate their fair values at December 31, 2014 and 2013 because of their short-term nature: cash and short term investments, premiums receivable, finance contracts, due from reinsurers, revolving credit outstanding, bank overdraft, accounts payable and accrued expenses.
(r) STOCK OPTION PLANS
During the year ended December 31, 2014, the Company had three stock-based employee compensation plans, which are described later in Footnote 14, Stock Compensation Plans. Prior to January 1, 2006, we accounted for the plans under the recognition and measurement provisions of stock-based compensation using the intrinsic value method prescribed by the Accounting Principles Board (“APB”) and related Interpretation, as permitted by FASB issued guidance. Under these provisions, no stock-based employee compensation cost was recognized in the Statement of Operations as all options granted under those plans had an exercise price equal to or less than the market value of the underlying common stock on the date of grant.
Effective January 1, 2006, the Company adopted the fair value recognition provisions of FASB issued guidance using the modified-prospective-transition method. Under that transition method, compensation costs recognized during 2014, 2013 and 2012 include:
| · | Compensation cost for all share-based payments granted prior to, but not yet vested as of January 1, 2006, based on the grant date fair value estimated in accordance with the original provisions of FASB issued guidance, and |
| · | Compensation cost for all share-based payments granted subsequent to January 1, 2006, based on the grant-date fair-value estimated in accordance with the provisions of FASB issued guidance. Results for prior periods have not been restated, as they are not required to be by the pronouncement. |
Federated National Holding Company and Subsidiaries
Notes to Consolidated Financial Statements
December 31, 2014
(s) PROPERTY, PLANT AND EQUIPMENT
Property, plant and equipment is stated at cost less accumulated depreciation. Depreciation on property, plant and equipment is calculated on a straight-line basis over the following estimated useful lives: building and improvements - 30 years, furniture and fixtures - 7 years and computer equipment – 5 years. We capitalize betterments and any other expenditure in excess of $1,000 if the asset is expected to have a useful life greater than one year. The carrying value of property, plant and equipment is periodically reviewed based on the expected future undiscounted operating cash flows of the related item. Based upon our most recent analysis, we believe that no impairment of property, plant and equipment exists at December 31, 2014.
(t) RECLASSIFICATIONS
The 2013 and 2012 financial statement amounts have not been reclassified to conform to the 2014 presentations.
(u) GOODWILL AND INTANGIBLE ASSETS
At December 31, 2014, the Company purchased an intangible asset totaling $0.5 million. In accordance with FASB issued guidance, the accounting for the recognized intangible asset will be based on its useful life to the Company. The useful life of the intangible asset is the period over which it is expected to contribute directly or indirectly to the future cash flows of the Company. The intangible asset has a definite finite life of twelve months, and will be amortized accordingly during 2015.
(3) INVESTMENTS
Total investments increased $110.1 million, or 49.9%, to $330.8 million as of December 31, 2014, compared with $220.7 million as of December 31, 2013. This increase reflected the $133.8 million increase in gross premiums written compared with 2013 and the $43.4 million in net proceeds from the Company’s August 2014 offering. The excess cash was invested primarily in the bond portfolio.
FASB issued guidance addresses accounting and reporting for (a) investments in equity securities that have readily determinable fair values and (b) all investments in debt securities. We account for our investment securities consistent with FASB issued guidance that requires our securities to be classified into one of three categories: (i) held-to-maturity, (ii) trading securities or (iii) available-for-sale.
Investments classified as held-to-maturity include debt securities wherein the Company’s intent and ability are to hold the investment until maturity and are carried at amortized cost without consideration to unrealized gains or losses. Investments classified as trading securities include debt and equity securities bought and held primarily for sale in the near term and are carried at fair value with unrealized holding gains and losses included in current period operations. Investments classified as available-for-sale include debt and equity securities that are not classified as held-to-maturity or as trading security investments and are carried at fair value with unrealized holding gains and losses excluded from earnings and reported as a separate component of shareholders’ equity, namely “Other Comprehensive Income.”
The debt and equity securities that are available-for-sale and carried at fair value represent 98% of total investments as of December 31, 2014, compared with 97% as of December 31, 2013.
We did not hold any trading investment securities during 2014.
As of December 31, 2014 and 2013, our investments consisted primarily of corporate bonds held in various industries, municipal bonds and United States government bonds. As of December 31, 2014, 77% of our debt portfolio was in diverse industries and 23% is in United States government bonds. As of December 31, 2014, approximately 88% of our equity holdings were in equities related to diverse industries and 12% were in mutual funds. As of December 31, 2013, 83% of our debt portfolio was in diverse industries and 17% is in United States government bonds. As of December 31, 2013, approximately 91% of our equity holdings were in equities related to diverse industries and 9% were in mutual funds.
The FASB issued guidance also addresses the determination as to when an investment is considered impaired, whether that impairment is other-than temporary, and the measurement of an impairment loss. The Company’s policy for the valuation of temporarily impaired securities is to determine impairment based on the analysis of the following factors.
| · | rating downgrade or other credit event (eg., failure to pay interest when due); |
| · | length of time and the extent to which the fair value has been less than amortized cost; |
Federated National Holding Company and Subsidiaries
Notes to Consolidated Financial Statements
December 31, 2014
| · | financial condition and near term prospects of the issuer, including any specific events which may influence the operations of the issuer such as changes in technology or discontinuance of a business segment; |
| · | prospects for the issuer’s industry segment; |
| · | intent and ability of the Company to retain the investment for a period of time sufficient to allow for anticipated recovery in market value; |
| · | historical volatility of the fair value of the security. |
Pursuant to FASB issued guidance, the Company records the unrealized losses, net of estimated income taxes that are associated with that part of our portfolio classified as available-for-sale through the shareholders' equity account titled “Other Comprehensive Income”. Management periodically reviews the individual investments that comprise our portfolio in order to determine whether a decline in fair value below our cost either is other-than temporarily or permanently impaired. Factors used in such consideration include, but are not limited to, the extent and length of time over which the market value has been less than cost, the financial condition and near-term prospects of the issuer and our ability and intent to keep the investment for a period sufficient to allow for an anticipated recovery in market value.
In reaching a conclusion that a security is either other-than-temporarily or permanently impaired we consider such factors as the timeliness and completeness of expected dividends, principal and interest payments, ratings from nationally recognized statistical rating organizations such as Standard and Poor’s (“S&P”) and Moody’s Investors Service, Inc. (“Moody’s”), as well as information released via the general media channels. During 2014 and 2013, in connection with the process, we have not charged any investment losses to operations. During 2012, in connection with the process, we have charged to operations $44,000 of investment losses.
As of December 31, 2014 and December 31, 2013, respectively, all of our securities are in good standing and not impaired as defined by FASB issued guidance.
As of December 31, 2014 and December 31, 2013, we have classified $7.4 million and $7.2 million, respectively, of our bond portfolio as held-to-maturity. We classify bonds as held-to-maturity to support securitization of credit requirements.
During 2014, we did not re-classify any of our bond portfolio between available-for-sale and held-to-maturity. During 2013 we reclassified $150,000 of our bond portfolio to available-for-sale from held-to-maturity.
Two reinsurers require FNIC to maintain securities with a fair market value of $4.9 million. As of December 31, 2014 and 2013, FNIC maintained fully funded trust agreements that totaled $4.9 million in favor of the reinsurers. In addition, as of December 31, 2014 and 2013, $1.0 million is held in a fully funded trust account in favor of another reinsurer under a prior program.
Federated National Holding Company and Subsidiaries
Notes to Consolidated Financial Statements
December 31, 2014
(a) DEBT AND EQUITY SECURITIES
The following table summarizes, by type, our investments as of December 31, 2014 and 2013.
|
December 31, 2014
|
December 31, 2013
|
|||||||||||||||
|
Carrying
Amount
|
Percent of Total
|
Carrying
Amount
|
Percent of Total
|
|||||||||||||
|
(Dollars in Thousands)
|
||||||||||||||||
|
Debt securities, at market:
|
||||||||||||||||
|
United States government obligations and authorities
|
$
|
62,323
|
18.84
|
%
|
$
|
27,209
|
12.33
|
%
|
||||||||
|
Obligations of states and political subdivisions
|
91,614
|
27.70
|
%
|
52,064
|
23.59
|
%
|
||||||||||
|
Corporate
|
119,024
|
35.99
|
%
|
91,941
|
41.66
|
%
|
||||||||||
|
International
|
11,138
|
3.37
|
%
|
3,698
|
1.68
|
%
|
||||||||||
|
284,099
|
85.90
|
%
|
174,912
|
79.26
|
%
|
|||||||||||
|
Debt securities, at amortized cost:
|
||||||||||||||||
|
United States government obligations and authorities
|
4,490
|
1.36
|
%
|
4,630
|
2.10
|
%
|
||||||||||
|
Corporate
|
2,681
|
0.81
|
%
|
2,475
|
1.12
|
%
|
||||||||||
|
International
|
246
|
0.07
|
%
|
109
|
0.05
|
%
|
||||||||||
|
7,417
|
2.24
|
%
|
7,214
|
3.27
|
%
|
|||||||||||
|
Total debt securities
|
291,516
|
88.14
|
%
|
182,126
|
82.53
|
%
|
||||||||||
|
Equity securities, at market:
|
39,247
|
11.86
|
%
|
38,584
|
17.47
|
%
|
||||||||||
|
Total investments
|
$
|
330,763
|
100.00
|
%
|
$
|
220,710
|
100.00
|
%
|
||||||||
The following table shows the realized gains (losses) for debt and equity securities for the years ended December 31, 2014 and 2013.
|
Years Ended December 31,
|
||||||||||||||||
|
2014
|
2013
|
|||||||||||||||
|
Gains
(Losses)
|
Fair Value
at Sale
|
Gains
(Losses)
|
Fair Value
at Sale
|
|||||||||||||
|
(Dollars in Thousands)
|
||||||||||||||||
|
Debt securities
|
$
|
725
|
$
|
54,154
|
$
|
1,690
|
$
|
41,256
|
||||||||
|
Equity securities
|
4,489
|
14,104
|
2,858
|
12,052
|
||||||||||||
|
Total realized gains
|
5,214
|
68,258
|
4,548
|
53,308
|
||||||||||||
|
Debt securities
|
(147
|
)
|
$
|
11,013
|
(1,001
|
)
|
43,239
|
|||||||||
|
Equity securities
|
(641
|
)
|
2,236
|
(666
|
)
|
3,564
|
||||||||||
|
Total realized losses
|
(788
|
)
|
13,249
|
(1,667
|
)
|
46,803
|
||||||||||
|
Net realized gains on investments
|
$
|
4,426
|
$
|
81,507
|
$
|
2,881
|
$
|
100,111
|
||||||||
Federated National Holding Company and Subsidiaries
Notes to Consolidated Financial Statements
December 31, 2014
A summary of the amortized cost, estimated fair value, gross unrealized gains and losses of debt and equity securities at December 31, 2014 and 2013 is as follows.
|
Amortized
Cost
|
Gross
Unrealized
Gains
|
Gross
Unrealized
Losses
|
Estimated
Fair Value
|
|||||||||||||
|
(Dollars in Thousands)
|
||||||||||||||||
|
December 31, 2014
|
||||||||||||||||
|
Debt Securities - Available-For-Sale:
|
||||||||||||||||
|
United States government obligations and authorities
|
$
|
61,376
|
$
|
1,022
|
$
|
75
|
$
|
62,323
|
||||||||
|
Obligations of states and political subdivisions
|
90,728
|
956
|
70
|
91,614
|
||||||||||||
|
Corporate
|
117,778
|
1,578
|
332
|
119,024
|
||||||||||||
|
International
|
11,139
|
53
|
54
|
11,138
|
||||||||||||
|
$
|
281,021
|
$
|
3,609
|
$
|
531
|
$
|
284,099
|
|||||||||
|
Debt Securities - Held-To-Maturity:
|
||||||||||||||||
|
United States government obligations and authorities
|
$
|
4,490
|
$
|
41
|
$
|
225
|
$
|
4,306
|
||||||||
|
Corporate
|
2,681
|
31
|
5
|
2,707
|
||||||||||||
|
International
|
246
|
1
|
1
|
246
|
||||||||||||
|
$
|
7,417
|
$
|
73
|
$
|
231
|
$
|
7,259
|
|||||||||
|
Equity securities - common stocks
|
$
|
29,908
|
$
|
9,836
|
$
|
497
|
$
|
39,247
|
||||||||
|
December 31, 2013
|
||||||||||||||||
|
Debt Securities - Available-For-Sale:
|
||||||||||||||||
|
United States government obligations and authorities
|
$
|
27,422
|
$
|
186
|
$
|
399
|
$
|
27,209
|
||||||||
|
Obligations of states and political subdivisions
|
51,883
|
303
|
122
|
52,064
|
||||||||||||
|
Corporate
|
91,475
|
1,233
|
767
|
91,941
|
||||||||||||
|
International
|
3,731
|
5
|
38
|
3,698
|
||||||||||||
|
$
|
174,511
|
$
|
1,727
|
$
|
1,326
|
$
|
174,912
|
|||||||||
|
Debt Securities - Held-To-Maturity:
|
||||||||||||||||
|
United States government obligations and authorities
|
$
|
4,630
|
$
|
32
|
$
|
326
|
$
|
4,336
|
||||||||
|
Corporate
|
2,475
|
22
|
17
|
2,480
|
||||||||||||
|
International
|
109
|
-
|
1
|
108
|
||||||||||||
|
$
|
7,214
|
$
|
54
|
$
|
344
|
$
|
6,924
|
|||||||||
|
Equity securities - common stocks
|
$
|
29,423
|
$
|
9,436
|
$
|
275
|
$
|
38,584
|
||||||||
Federated National Holding Company and Subsidiaries
Notes to Consolidated Financial Statements
December 31, 2014
The table below reflects our unrealized investment losses by investment class, aged for length of time in an unrealized loss position.
|
Unrealized Losses
|
Less than 12 months
|
12 months or longer
|
||||||||||
|
(Dollars in Thousands)
|
||||||||||||
|
Debt securities:
|
||||||||||||
|
United States government obligations and authorities
|
$
|
75
|
$
|
22
|
$
|
53
|
||||||
|
Obligations of states and political subdivisions
|
70
|
66
|
4
|
|||||||||
|
Corporate
|
332
|
260
|
72
|
|||||||||
|
International
|
54
|
54
|
-
|
|||||||||
|
531
|
402
|
129
|
||||||||||
|
Equity securities:
|
||||||||||||
|
Common stocks
|
497
|
461
|
36
|
|||||||||
|
Total debt and equity securities
|
$
|
1,028
|
$
|
863
|
$
|
165
|
||||||
Below is a summary of debt securities at December 31, 2014 and 2013 by contractual or expected maturity periods. Expected maturities may differ from contractual maturities because borrowers may have the right to call or prepay obligations with or without call or prepayment penalties.
|
December 31, 2014
|
December 31, 2013
|
|||||||||||||||
|
Amortized
Cost
|
Estimated
Fair Value
|
Amortized
Cost
|
Estimated
Fair Value
|
|||||||||||||
|
(Dollars in Thousands)
|
||||||||||||||||
|
Due in one year or less
|
$
|
16,777
|
$
|
16,797
|
$
|
5,161
|
$
|
5,181
|
||||||||
|
Due after one through five years
|
173,236
|
174,273
|
113,027
|
113,561
|
||||||||||||
|
Due after five through ten years
|
98,404
|
100,259
|
62,656
|
62,220
|
||||||||||||
|
Due after ten years
|
26
|
33
|
881
|
874
|
||||||||||||
|
Total
|
$
|
288,443
|
$
|
291,362
|
$
|
181,725
|
$
|
181,836
|
||||||||
United States Treasury notes with a book value of $61,465 and $2,208,588, maturing in 2016 and 2022, respectively, were on deposit with the Florida OIR as of December 31, 2014, as required by law for FNIC, and are included with other investments held until maturity.
United States Treasury notes with a book value of $62,490 and $2,193,814, maturing in 2016 and 2022, respectively, were on deposit with the Florida OIR as of December 31, 2013, as required by law for FNIC, and are included with other investments held until maturity.
The table below sets forth investment results for the periods indicated.
|
Years Ended December 31,
|
||||||||||||
|
2014
|
2013
|
2012
|
||||||||||
|
(Dollars in Thousands)
|
||||||||||||
|
Interest on debt securities
|
$
|
4,775
|
$
|
2,850
|
$
|
3,380
|
||||||
|
Dividends on equity securities
|
553
|
478
|
436
|
|||||||||
|
Interest on cash and cash equivalents
|
57
|
4
|
3
|
|||||||||
|
Total investment income
|
$
|
5,385
|
$
|
3,332
|
$
|
3,819
|
||||||
|
Net realized gains
|
$
|
4,426
|
$
|
2,881
|
$
|
1,072
|
||||||
Federated National Holding Company and Subsidiaries
Notes to Consolidated Financial Statements
December 31, 2014
Proceeds from sales, pay downs and maturities of debt securities and proceeds from sales of equity securities in 2014, 2013 and 2012 were approximately $87.2 million, $106.2 million and $90.4 million, respectively.
A summary of net realized investment gains follows.
|
Twelve Months Ended December 31,
|
||||||||||||
|
2014
|
2013
|
2012
|
||||||||||
|
(Dollars in Thousands)
|
||||||||||||
|
Net realized gains
|
||||||||||||
|
Debt securities
|
$
|
578
|
$
|
689
|
$
|
1,392
|
||||||
|
Equity securities
|
3,848
|
2,192
|
(320
|
)
|
||||||||
|
Total
|
$
|
4,426
|
$
|
2,881
|
$
|
1,072
|
||||||
A summary of net unrealized investment gains follows.
|
December 31, 2014
|
December 31, 2013
|
|||||||
|
(Dollars in Thousands)
|
||||||||
|
Net unrealized gains
|
||||||||
|
Debt securities
|
$
|
3,078
|
$
|
401
|
||||
|
Equity securities
|
9,339
|
9,161
|
||||||
|
Total
|
$
|
12,417
|
$
|
9,562
|
||||
(4) PROPERTY, PLANT AND EQUIPMENT
Property, plant and equipment consist of the following.
|
Years Ended December 31,
|
||||||||
|
2014
|
2013
|
|||||||
|
(Dollars in Thousands)
|
||||||||
|
Computer equipment
|
$
|
4,770
|
$
|
3,721
|
||||
|
Furniture & fixtures
|
1,154
|
900
|
||||||
|
Property, plant and equipment, gross
|
5,924
|
4,621
|
||||||
|
Accumulated depreciation
|
(4,175
|
)
|
(3,692
|
)
|
||||
|
Property, plant and equipment, net
|
$
|
1,749
|
$
|
929
|
||||
Depreciation of property, plant, and equipment was $482,750, $263,334 and $195,078 during 2014, 2013 and 2012, respectively.
Federated National Holding Company and Subsidiaries
Notes to Consolidated Financial Statements
December 31, 2014
(5) REINSURANCE
We reinsure (cede) a portion of written premiums on an excess of loss or a quota-share basis to nonaffiliated insurance companies in order to limit our loss exposure. To the extent that reinsuring companies are unable to meet their obligations assumed under these reinsurance agreements, we remain primarily liable to our policyholders.
The impact of the reinsurance treaties on the financial statements is as follows.
|
Years Ended December 31,
|
||||||||||||
|
2014
|
2013
|
2012
|
||||||||||
|
(Dollars in Thousands)
|
||||||||||||
|
Premium written
|
||||||||||||
|
Direct and Assumed
|
$
|
377,156
|
$
|
243,374
|
$
|
119,459
|
||||||
|
Ceded
|
(201,998
|
)
|
(82,709
|
)
|
(51,085
|
)
|
||||||
|
$
|
175,158
|
$
|
160,665
|
$
|
68,374
|
|||||||
|
Premiums earned
|
||||||||||||
|
Direct and Assumed
|
$
|
313,075
|
$
|
174,037
|
$
|
109,312
|
||||||
|
Ceded
|
(142,170
|
)
|
(69,656
|
)
|
(49,953
|
)
|
||||||
|
$
|
170,905
|
$
|
104,381
|
$
|
59,359
|
|||||||
|
Losses and LAE incurred
|
||||||||||||
|
Direct and Assumed
|
$
|
103,710
|
$
|
59,820
|
$
|
33,329
|
||||||
|
Ceded
|
(22,674
|
)
|
(3,410
|
)
|
(3,120
|
)
|
||||||
|
$
|
81,036
|
$
|
56,410
|
$
|
30,209
|
|||||||
|
As of December 31,
|
||||||||
|
2014
|
2013
|
|||||||
|
(Dollars in Thousands)
|
||||||||
|
Unpaid losses and LAE, net
|
||||||||
|
Direct and Assumed
|
$
|
78,330
|
$
|
61,015
|
||||
|
Ceded
|
(12,534
|
)
|
(2,742
|
)
|
||||
|
$
|
65,796
|
$
|
58,273
|
|||||
|
Unearned premiums
|
||||||||
|
Direct and Assumed
|
$
|
192,424
|
$
|
128,343
|
||||
|
Ceded
|
(96,963
|
)
|
(37,135
|
)
|
||||
|
$
|
95,461
|
$
|
91,208
|
|||||
The Company holds collateral under related reinsurance agreements in the form of fully funded trust agreements totaling $4.9 million that can be drawn on for amounts that remain unpaid for more than 120 days.
Federated National Holding Company and Subsidiaries
Notes to Consolidated Financial Statements
December 31, 2014
(6) UNPAID LOSSES AND LAE
The liability for unpaid losses and LAE is determined on an individual-case basis for all incidents reported. The liability also includes amounts for unallocated expenses, anticipated future claim development and IBNR.
Activity in the liability for unpaid losses and LAE is summarized as follows.
|
Period Ending
|
||||||||||||
|
December 31, 2014
|
December 31, 2013
|
December 31, 2012
|
||||||||||
|
(Dollars in Thousands)
|
||||||||||||
|
Balance at January 1
|
$
|
61,016
|
$
|
49,908
|
$
|
59,983
|
||||||
|
Less reinsurance recoverables
|
(2,742
|
)
|
(3,503
|
)
|
(2,088
|
)
|
||||||
|
Net balance at January 1
|
$
|
58,274
|
$
|
46,405
|
$
|
57,895
|
||||||
| Incurred related to | ||||||||||||
|
Current year
|
$
|
79,932
|
$
|
56,209
|
$
|
31,636
|
||||||
|
Prior years
|
1,104
|
201
|
(1,427
|
)
|
||||||||
|
Total incurred
|
$
|
81,036
|
$
|
56,410
|
$
|
30,209
|
||||||
| Paid related to | ||||||||||||
|
Current year
|
$
|
42,391
|
$
|
22,695
|
$
|
15,892
|
||||||
|
Prior years
|
31,123
|
21,846
|
25,807
|
|||||||||
|
Total paid
|
$
|
73,514
|
$
|
44,541
|
$
|
41,699
|
||||||
|
Net balance at period end
|
$
|
65,796
|
$
|
58,274
|
$
|
46,405
|
||||||
|
Plus reinsurance recoverables
|
12,534
|
2,742
|
3,503
|
|||||||||
|
Balance as of period end
|
$
|
78,330
|
$
|
61,016
|
$
|
49,908
|
||||||
Based upon consultations with our independent actuarial consultants and their statement of opinion on losses and LAE, we believe that the liability for unpaid losses and LAE is adequate to cover all claims and related expenses which may arise from incidents reported.
As shown above, and as a result of review of liability for losses and LAE, which includes a re-evaluation of the adequacy of reserve levels for prior year’s claims, we increased the liability for losses and LAE for claims occurring in prior years by $1.1 million and $0.2 million for the years ended December 31, 2014 and 2013 and decreased the liability for losses and LAE for claims occurring in prior years by $1.4 million for the year ended December 31, 2012.
We continue to revise our estimates of the ultimate financial impact of claims made resulting from past storms. The revisions to our estimates are based on our analysis of subsequent information that we receive regarding various factors, including: (i) per claim information; (ii) Company and industry historical loss experience; (iii) legislative enactments, judicial decisions, legal developments in the awarding of damages, and (iv) trends in general economic conditions, including the effects of inflation.
For the year ended December 31, 2014, our actuarial firm determined range of statutory loss and LAE reserves on a net basis range from a low of $61.7 million to a high of $72.3 million, with a best estimate of $66.2 million. The Company’s net loss and LAE reserves are carried on a statutory basis at $68.2 million, and on a GAAP consolidated basis at $78.3 million which when netted with our $12.5 million reinsurance recoverable totals $65.8 million. The Company’s statutory point estimate for its reserves as of December 31, 2014 is 3.0% above our actuary’s best estimate, which reflects management’s current analysis of the status and expected timing of our anticipated claims, our analysis of expected weather patterns in the regions in which we sell policies, our re-focus of our business growth efforts to areas outside of South Florida, and other factors.
Federated National Holding Company and Subsidiaries
Notes to Consolidated Financial Statements
December 31, 2014
The following is an overview of management’s loss reserving process
The Company’s loss reserves can generally be categorized into two distinct groups. One group is short-tail classes of business consisting principally of property risks in connection with homes and automobiles. The other group is long-tail casualty classes of business which include primarily commercial general liability and to a much lesser extent, homeowner and automobile liability. For operations writing short-tail coverages our loss reserves were generally geared toward determining an expected loss ratio for current business rather than maintaining a reserve for the outstanding exposure. Estimations of ultimate net loss reserves for long-tail casualty classes of business is a more complex process and depends on a number of factors including class and volume of business involved. Experience in the more recent accident years of long-tail casualty classes of business shows limited statistical credibility in reported net losses because a relatively low proportion of net losses would be reported claims and expenses and even smaller percentage would be net losses paid. Therefore, IBNR would constitute a relatively high proportion of net losses.
Additionally, the different methodologies are utilized the same, regardless of the line of business. However, the final selection of ultimate loss and LAE is certain to vary by both line of business and by accident period maturity. There is no prescribed combination of line of business, accident year maturity, and methodologies; consistency in results of the different methodologies and reasonableness of the result are the primary factors that drive the final selection of ultimate loss and LAE.
Methods Used to Estimate Loss and LAE Reserves
The methods we use for our short-tail business do not differ from the methods we use for our long-tail business. The Incurred and Paid Development Methods intrinsically recognize the unique development characteristics contained within the historical experience of each material short-tail and long-tail line of business. The Incurred and Paid Cape Cod Methods reflect similar historical development unique to each material short-tail and long-tail line of business.
We apply the following general methods in projecting loss and LAE reserves:
| · | Paid and Incurred Loss Development Method |
| · | Paid and Incurred Bornhuetter-Ferguson Incurred Method |
| · | Frequency / Severity Method |
Description of Ultimate Loss Estimation Methods
The estimated Ultimate Loss and Defense and Cost Containment Expense (“DCCE”) is based on an analysis by line of business, coverage and by accident quarter performed using data as of December 31, 2014. The analysis relies primarily on four actuarial methods: Incurred Loss and DCCE Development Method, Paid Loss and DCCE Development Method, Bornhuetter-Ferguson Incurred Method, and Bornhuetter-Ferguson Paid Method. Each method relies on company experience, and, where relevant, the analysis includes comparisons to industry experience. The following is a description of each of these methods:
Incurred Loss and DCCE Development Method – This reserving method is based on the assumption that the historical incurred loss and DCCE development pattern as reflected by the Company is appropriate for estimating the future loss & DCCE development. Incurred paid plus case amounts separated by accident quarter of occurrence and at quarterly evaluations are used in this analysis. Case reserves do not have to be adequately stated for this method to be effective; they only need to have a fairly consistent level of adequacy at all stages of maturity. Historical “age-to-age” loss development factors were calculated to measure the relative development of an accident quarter from one maturity point to the next. Loss and DCCE development factors (“LDF”) are selected based on a review of the historical relationships between incurred loss & DCCE at successive valuations and based on industry patterns. The LDFs are multiplied together to derive cumulative LDF’s that, when multiplied by actual incurred loss and DCCE, produce estimates of ultimate loss and DCCE.
Paid Loss & DCCE Development Method – This method is similar to the Incurred Loss & DCCE Development Method only paid loss & DCCE and paid patterns are substituted for the incurred loss & DCCE and incurred patterns.
Bornhuetter-Ferguson Incurred Method – This reserving method combines estimated initial expected unreported loss & DCCE with the actual loss & DCCE to yield the ultimate loss & DCCE estimate. Expected unreported loss & DCCE are equal to expected total loss & DCCE times the expected unreported percentage of loss & DCCE for each policy year. The incurred loss & DCCE emergence pattern used to determine the unreported percentages in our projections is based on the selected LDF’s from the Incurred Loss & DCCE Development Method described above. The estimate of initial expected total loss & DCCE is based on the historical loss ratio for more mature accident years. While this approach reduces the independence of the Bornhuetter-Ferguson Method from the loss & DCCE development methods for older policy years, it is used primarily for estimating ultimate loss & DCCE for more recent, less mature, policy years.
Federated National Holding Company and Subsidiaries
Notes to Consolidated Financial Statements
December 31, 2014
Bornhuetter-Ferguson Paid Method – This method is similar to the Bornhuetter-Ferguson Incurred Method only paid loss & DCCE and paid patterns are substituted for the incurred loss & DCCE and incurred patterns.
We select an estimate of ultimate loss & DCCE for each accident quarter after considering the results of each projection method for the quarter and the relative maturity of the quarter (the time elapsed between the start of the quarter and December 31, 2014). Reserves for unpaid losses & DCCE for each quarter are the differences between these ultimate estimates and the amount already paid. The reserves for each quarter and each coverage are summed, and the result is the overall estimate of unpaid losses & DCCE liability for the company.
We also produce an estimate of unpaid Adjusting and Other Expense (“A&O”), as a reserve is required under Statutory Accounting Principles (“SAP”) even if this expense has been pre-paid or with an unconsolidated affiliate. Although we do not prepay for A&O, the majority of the A&O incurred is with an affiliated company and eliminated under the accounting principles for consolidation. The unpaid A&O is added to unpaid losses & DCCE, resulting in total unpaid losses and LAE.
The validity of the results from using a loss development approach can be affected by many conditions, such as internal claim department processing changes, a shift between single and multiple claim payments, legal changes, or variations in a company’s mix of business from year to year. Also, since the percentage of losses paid for immature years is often low, development factors can be volatile. A small variation in the number of claims paid can have a leveraging effect that could lead to significant changes in estimated ultimate values. Accordingly, our reserves are estimates because there are uncertainties inherent in the determination of ultimate losses. Court decisions, regulatory changes and economic conditions can affect the ultimate cost of claims that occurred in the past as well as create uncertainties regarding future loss cost trends. We compute our estimated ultimate liability using the most appropriate principles and procedures applicable to the lines of business written. However, because the establishment of loss reserves is an inherently uncertain process, we cannot be certain that ultimate losses will not exceed the established loss reserves and have a material adverse effect on our results of operations and financial condition.
Frequency / Severity Method – This method separately estimates the two components of ultimate losses (the frequency, or number of claims and the severity, or cost per claim) and then combines the resulting estimates in a multiplicative fashion to estimate ultimate losses. The approach is valuable because sometimes there is more inherent stability in the frequency and severity data when viewed separately than in the total losses.
We developed reported claim counts to ultimate levels using the development approach. The mechanics of this approach are the same as we described previously for paid and incurred losses. The validity of the results of this method depends on the stability of claim reporting and settlement rates. Then we developed accident year incurred severities (incurred losses divided by reported claim counts) to ultimate levels using the development approach.
We trended these severities to accident year 2014 levels. Trend rates were selected based on a review of historical severities. Selected severity was chosen based on judgment considering the developed severities and the trended severities, considering industry benchmarks for each segment. The loss & ALAE, claim count and severity triangles are evaluated as of 12 months, 24 months, 36 months etc. We selected loss development factors based on the loss development history, to the extent credible, and supplemented with industry data where appropriate.
A key assumption underlying the estimation of the reserve for loss and LAE is that past experience serves as the most reliable estimator of future events. This assumption may materially affect the estimates when the insurance market, the regulatory environment, the legal environment, the economic environment, the book of business, the claims handling department, or other factors (known or unknown) have varied over time during the experience period and / or will vary (expectedly or unexpectedly) in the future. Changes in estimates, or differences between estimates and amounts ultimately paid, are reflected in the operating results of the period during which such adjustments are made. Therefore, the ultimate liability for unpaid losses and LAE will likely differ from the amount recorded at December 31, 2014.
The following describes the extent of our procedures for determining the reserve for loss and LAE on both an annual and interim reporting basis:
Federated National Holding Company and Subsidiaries
Notes to Consolidated Financial Statements
December 31, 2014
Annually - Our policy is to select a single point estimate that best reflects our in-house actuarial determination for unpaid losses and LAE. Our independent actuarial firm, examining the exact same data set, will independently select a point estimate which determines a high point and low point range. Both processes rely on objective and subjective determinations. If our point estimate falls within the range determined from the point estimate of our actuary’s opinion, then the Company’s policy has been that no adjustments by management would be required. In consideration thereof, the company does not have a policy for adjusting the liability for unpaid losses and LAE to an amount that is different than an amount set forth within the range determined by our independent actuary, although the reserve level ultimately determined by us may not be the mid-point of our independent actuary’s range. Further, there can be no assurances that our actual losses will be within our actuary’s range. Our independent actuary’s report expressly states that the report is based on assumptions developed from its own analysis and based on information provided by management and that notwithstanding its analysis, there is a significant risk of material adverse deviation from its range.
Interim – During 2014 our interim approach was very similar to the annual process noted above.
A number of other actuarial assumptions are generally made in the review of reserves for each line of business.
For each line of business, expected ultimate loss ratios for each accident year are estimated based on loss reserve development patterns. The expected loss ratio generally reflects the projected loss ratio from prior accident years, adjusted for the loss trend and the effect of rate changes and other quantifiable factors on the loss ratio.
In practice there are factors that change over time; however, many (such as inflation) are intrinsically reflected in the historical development patterns, and others typically do not materially affect the estimate of the reserve for unpaid losses and LAE. Therefore, no specific adjustments have been incorporated for such contingencies projecting future development of losses and LAE. There are no key assumptions as of December 31, 2014 premised on future emergence inconsistent with historical loss reserve development patterns.
(7) INCOME TAXES
A summary of the provision for income tax expense is as follows.
|
Years Ended December 31,
|
||||||||||||
|
2014
|
2013
|
2012
|
||||||||||
|
(Dollars in Thousands)
|
||||||||||||
|
Federal
|
||||||||||||
|
Current
|
$
|
16,659
|
$
|
4,289
|
$
|
63
|
||||||
|
Deferred
|
1,059
|
1,393
|
2,052
|
|||||||||
|
Provision for Federal income tax expense
|
17,718
|
5,682
|
2,115
|
|||||||||
|
State
|
||||||||||||
|
Current
|
2,204
|
-
|
-
|
|||||||||
|
Deferred
|
186
|
809
|
320
|
|||||||||
|
Provision for state income tax expense
|
2,390
|
809
|
320
|
|||||||||
|
Provision for income tax expense
|
$
|
20,108
|
$
|
6,491
|
$
|
2,435
|
||||||
The actual income tax expense differs from the "expected" income tax expense (computed by applying the combined applicable effective federal and state tax rates to income before provision for income tax expense as follows).
|
Years Ended December 31,
|
||||||||||||
|
2014
|
2013
|
2012
|
||||||||||
|
(Dollars in Thousands)
|
||||||||||||
|
Computed expected tax expense provision, at federal rate
|
$
|
19,887
|
$
|
6,535
|
$
|
2,294
|
||||||
|
State tax, net of federal deduction expense
|
1,696
|
698
|
245
|
|||||||||
|
Tax-exempt interest
|
(312
|
)
|
(31
|
)
|
(26
|
)
|
||||||
|
Dividend received deduction
|
(136
|
)
|
(97
|
)
|
(88
|
)
|
||||||
|
Stock option expense
|
-
|
(34
|
)
|
72
|
||||||||
|
AMT Tax credit
|
-
|
-
|
(113
|
)
|
||||||||
|
True-up / Rate Change
|
(1,027
|
)
|
(306
|
)
|
-
|
|||||||
|
Other
|
-
|
(274
|
)
|
51
|
||||||||
|
Provision for income tax expense
|
$
|
20,108
|
$
|
6,491
|
$
|
2,435
|
||||||
Federated National Holding Company and Subsidiaries
Notes to Consolidated Financial Statements
December 31, 2014
Deferred income taxes reflect the net tax effects of temporary differences between the carrying amounts of assets and liabilities for financial reporting purposes and the amounts used for income tax purposes. Significant components of our net deferred tax asset are as follows.
|
Years Ended December 31,
|
||||||||
|
2014
|
2013
|
|||||||
|
Deferred tax assets:
|
||||||||
|
Unpaid losses and loss adjustment expenses
|
$
|
1,239
|
$
|
1,157
|
||||
|
Unearned premiums
|
7,812
|
6,864
|
||||||
|
Discount on advance premiums
|
-
|
243
|
||||||
|
Allowance for credit losses
|
63
|
59
|
||||||
|
Allowance for impairments
|
20
|
21
|
||||||
|
Depreciation & amortization
|
13
|
149
|
||||||
|
Reserve for claims settlements
|
12
|
1,844
|
||||||
|
NOL Carryforward
|
-
|
73
|
||||||
|
Deferred revenue
|
36
|
-
|
||||||
|
Flow-through income or loss
|
-
|
4
|
||||||
|
Stock option expense per ASC 718
|
545
|
550
|
||||||
|
Total deferred tax assets
|
9,740
|
10,964
|
||||||
|
Deferred tax liabilities:
|
||||||||
|
Deferred acquisition costs, net
|
(6,199
|
)
|
(6,287
|
)
|
||||
|
Flow-through income or loss
|
(9
|
)
|
-
|
|||||
|
Dividends Collected vs. Earned
|
(12
|
)
|
(6
|
)
|
||||
|
Regulatory assessments
|
(69
|
)
|
(67
|
)
|
||||
|
Unrealized Gain on investment securities
|
(4,792
|
)
|
(3,598
|
)
|
||||
|
Total deferred tax liabilities
|
(11,081
|
)
|
(9,958
|
)
|
||||
|
Net deferred tax (liability) asset
|
$
|
(1,341
|
)
|
$
|
1,006
|
|||
The Company has adopted ASC 740-10-05, Accounting for Uncertainty in Income Taxes, which clarifies the accounting for uncertainty in income taxes recognized in an enterprise’s financial statements. ASC 740 provides a threshold for the financial statement recognition and measurement of a tax position taken or expected to be taken in a tax return. The Company’s policy is to classify interest and penalties related to unrecognized tax positions in income before income taxes. As of December 31, 2014, 2013 and 2012, we have determined that no uncertain tax liabilities are required.
In September 2013, the Internal Revenue Service (“IRS”) released final tangible property regulations under Sections 162(a) and 263(a) of the Internal Revenue Code regarding the deduction and capitalization of expenditures related to tangible property as well as dispositions of tangible property. These regulations are effective for our tax year beginning January 1, 2014. The adoption of these regulations is not expected to have a material impact on our consolidated financial position, results of operations, or cash flows.
The Company has recorded a net deferred tax liability and asset of $1.3 million and $1.0 million as of December 31, 2014 and 2013, respectively. Realization of deferred tax assets is dependent on generating sufficient taxable income in future periods. Management considers the scheduled reversal of deferred tax liabilities, projected future taxable income and tax planning strategies in assessing the ability to realize deferred tax assets. Based upon the level of historical taxable income and projections for future taxable income over the periods in which the deferred tax assets are deductible, management believes it is more likely than not that the Company will realize the benefits of these deductible differences and as such no valuation allowance has been recorded against deferred tax assets. Should a change in circumstances lead to a change in judgment about the realizability of deferred tax assets in future years, the Company would record a valuation allowances as deemed appropriate in the period that the change in circumstances occurs, along with a corresponding increase or charge to net income. The resolution of tax reserves and changes in valuation allowances could be material to the Company’s results of operations for any period, but is not expected to be material to the Company’s financial position.
The Company files a federal income tax return and various state and local tax returns. The Company’s consolidated federal and state income tax returns for 2012 - 2013 are open for review by the IRS and various state taxing authorities. The Company’s 2011 federal tax return was under review by the IRS and in 2014 the audit was closed with a no change report.
Federated National Holding Company and Subsidiaries
Notes to Consolidated Financial Statements
December 31, 2014
During 2014, the Company recorded tax benefits of $0.9 million from the exercise of non-qualifying stock options, restricted stock and disqualifying dispositions of incentive stock options as a reduction of the Company's income tax liability and an increase in equity. Additionally, in 2014 the Company recorded deferred tax liabilities of $1.0 million related to unrealized gains on investments as a decrease to equity.
(8) REGULATORY REQUIREMENTS AND RESTRICTIONS
Consent Order
As of September 30, 2014, we had satisfied all applicable conditions of the Consent Order we entered into in January 2011 (the “Consent Order”) with the Florida OIR. We entered into the Consent Order in connection with the merger of our one of our wholly owned insurance subsidiaries, American Vehicle into FNIC, with FNIC continuing the operations of both entities. As of the date of this Report, the only operational restriction that remains in effect is a requirement to obtain OIR approval prior to writing commercial multi-peril business or any new commercial property business, including condo associations, under any other line of business for which FNIC is authorized. FNIC currently has no commercial multi-peril policy premium in-force and the current commercial habitation book of business is fully earned. The Consent Order required us to, among other things, limit the number of policies that we write in the Tri-County area and imposed certain other operational requirements on us, all of which we have complied with.
Other Regulatory Requirements and Restrictions
To retain our certificate of authority, the Florida Insurance Code (the "Code") requires FNIC to maintain capital and surplus equal to the greater of 10% of its’ liabilities or a statutory minimum capital and surplus as defined in the Code. FNIC is required to have a minimum capital surplus of $5.0 million.
At December 31, 2014, 2013 and 2012, FNIC’s statutory capital surplus was $125.3 million, $76.9 million and $52.1 million, respectively.
An insurance company is also required to adhere to prescribed premium-to-capital surplus ratios. As of December 31, 2014, 2013 and 2012, FNIC was in compliance with the prescribed premium-to-surplus ratio.
We had bonds with a carrying value of approximately $2.3 million pledged to the Florida OIR, as of December 31, 2014 and 2013, respectively, in accordance with regulatory requirements.
Under Florida law, a domestic insurer may not pay any dividend or distribute cash or other property to its shareholders except out of that part of its available and accumulated capital surplus funds which is derived from realized net operating profits on its business and net realized capital gains. A Florida domestic insurer may not make dividend payments or distributions to shareholders without prior approval of the Florida OIR if the dividend or distribution would exceed the larger of (i) the lesser of (a) 10.0% of its capital surplus or (b) net income, not including realized capital gains, plus a two-year carryforward, (ii) 10.0% of capital surplus with dividends payable constrained to unassigned funds minus 25.0% of unrealized capital gains or (iii) the lesser of (a) 10.0% of capital surplus or (b) net investment income plus a three-year carryforward with dividends payable constrained to unassigned funds minus 25.0% of unrealized capital gains.
Alternatively, a Florida domestic insurer may pay a dividend or distribution without the prior written approval of the Florida OIR (i) if the dividend is equal to or less than the greater of (a) 10.0% of the insurer’s capital surplus as regards policyholders derived from realized net operating profits on its business and net realized capital gains or (b) the insurer’s entire net operating profits and realized net capital gains derived during the immediately preceding calendar year, (ii) the insurer will have policy holder capital surplus equal to or exceeding 115.0% of the minimum required statutory capital surplus after the dividend or distribution, (iii) the insurer files a notice of the dividend or distribution with the Florida OIR at least ten business days prior to the dividend payment or distribution and (iv) the notice includes a certification by an officer of the insurer attesting that, after the payment of the dividend or distribution, the insurer will have at least 115.0% of required statutory capital surplus as to policyholders. Except as provided above, a Florida domiciled insurer may only pay a dividend or make a distribution (i) subject to prior approval by the Florida OIR or (ii) 30 days after the Florida OIR has received notice of such dividend or distribution and has not disapproved it within such time.
No dividends were paid by FNIC or American Vehicle in 2014, 2013 and 2012, and none are anticipated in 2015. Although we believe that amounts required to meet our financial and operating obligations will be available from sources other than dividends from our insurance subsidiaries, there can be no assurance in this regard. Further, there can be no assurance that, if requested, the Florida OIR will allow any dividends to be paid by FNIC to us, the parent company, in the future. The maximum dividends permitted by state law are not necessarily indicative of an insurer’s actual ability to pay dividends or other distributions to a parent company, which also may be constrained by business and regulatory considerations, such as the impact of dividends on capital surplus, which could affect an insurer’s competitive position, the amount of premiums that can be written and the ability to pay future dividends. Further, state insurance laws and regulations require that the statutory capital surplus of an insurance company following any dividend or distribution by it be reasonable in relation to its outstanding liabilities and adequate for its financial needs.
Federated National Holding Company and Subsidiaries
Notes to Consolidated Financial Statements
December 31, 2014
Insurance holding company regulations govern the amount that non-insurance company subsidiaries (FNU, FNA and any other affiliate) may charge any of the insurance companies for service (e.g., management fees and commissions).
In order to enhance the regulation of insurer solvency, the National Association of Insurance Commissioners (“NAIC”) established risk-based capital requirements for insurance companies that are designed to assess capital adequacy and to raise the level of protection that statutory surplus provides for policy holders. These requirements measure three major areas of risk facing property and casualty insurers: (i) underwriting risks, which encompass the risk of adverse loss developments and inadequate pricing; (ii) declines in asset values arising from credit risk; and (iii) other business risks from investments. Insurers having less statutory surplus than required will be subject to varying degrees of regulatory action, depending on the level of capital inadequacy. The Florida OIR, which follows these requirements, could require FNIC to cease operations in the event they fail to maintain the required statutory capital.
Based upon the 2014 and 2013 statutory financial statements for FNIC, statutory surplus exceeded the regulatory action levels established by the NAIC’s risk-based capital requirements.
Based on risk-based capital requirements, the extent of regulatory intervention and action increases as the ratio of an insurer’s statutory surplus to its Authorized Control Level (“ACL”), as calculated under the NAIC’s requirements, decreases. The first action level, the Company Action Level, requires an insurer to submit a plan of corrective actions to the insurance regulators if statutory surplus falls below 200.0% of the ACL amount. The second action level, the Regulatory Action Level, requires an insurer to submit a plan containing corrective actions and permits the insurance regulators to perform an examination or other analysis and issue a corrective order if statutory surplus falls below 150.0% of the ACL amount. The third action level, ACL, allows the regulators to rehabilitate or liquidate an insurer in addition to the aforementioned actions if statutory surplus falls below the ACL amount. The fourth action level is the Mandatory Control Level, which requires the regulators to rehabilitate or liquidate the insurer if statutory surplus falls below 70.0% of the ACL amount. FNIC’s ratio of statutory surplus to its ACL was 534.0%, 312.1% and 474.4% at December 31, 2014, 2013 and 2012, respectively.
Most recently the Florida OIR subjected FNIC to a balance sheet audit as of December 31, 2010. There were no material findings by the independent auditors in connection with this examination. FNIC also experienced a regularly scheduled statutory examination by the Florida OIR which occurred during 2010 for the five years ended December 31, 2010. There were no material findings in connection with this examination. The previous regulatory examination conducted by the Florida OIR on FNIC covered the three-year period ended on December 31, 2004.
The NAIC has also developed IRIS ratios to assist state insurance departments in identifying companies which may be developing performance or solvency problems, as signaled by significant changes in the companies’ operations. Such changes may not necessarily result from any problems with an insurance company, but may merely indicate changes in certain ratios outside the ranges defined as normal by the NAIC. When an insurance company has four or more ratios falling outside “usual ranges”, state regulators may investigate to determine the reasons for the variance and whether corrective action is warranted.
As of December 31, 2014, FNIC was outside NAIC’s usual range for four of thirteen IRIS ratios. These exceptions related to change in policyholder surplus growth, investment yield and estimated current reserve deficiency to policyholders’ surplus. The policyholder surplus growth exceeded the normal range due to the parent company’s surplus infusion totaling approximately $18.5 million. The increase in earned premiums during 2014 lead to the exceptional value for the Estimated Current Reserve to Deficiency to Surplus result.
As of December 31, 2013, FNIC was outside NAIC’s usual range for three of thirteen IRIS ratios. These exceptions related to change in net writings, investment yield and estimated current reserve deficiency to policyholders’ surplus.
As of December 31, 2012, NAIC’s usual range for three of thirteen IRIS ratios. These exceptions related to investment yield, net change in adjusted policyholders’ surplus and estimated current reserve deficiency to policyholders’ surplus.
There was no action taken by the Florida OIR in connection with the December 31, 2013 or 2012 IRIS ratio results. We do not currently believe that the Florida OIR will take any significant action with respect to FNIC regarding the 2014 IRIS ratios, although there can be no assurance that will be the case.
Federated National Holding Company and Subsidiaries
Notes to Consolidated Financial Statements
December 31, 2014
The table below reflects the range and test results for FNIC for the years ended December 31, 2014 and 2013, respectively.
|
IRIS Ratios
|
Unusual Values Equal to Or
|
2014
|
2013
|
|||||||||||||
|
Over
|
Under
|
FNIC
|
FNIC
|
|||||||||||||
|
Gross Premiums to Policyholders' Surplus
|
900
|
-
|
308
|
325
|
||||||||||||
|
Net Premium to Policyholders' Surplus
|
300
|
-
|
147
|
217
|
||||||||||||
|
Change in Net Writings
|
33
|
(33
|
)
|
10
|
137
|
*
|
||||||||||
|
Surplus Aid to Policyholders' Surplus
|
15
|
-
|
11
|
0
|
||||||||||||
|
Two-year Overall Operating Ratio
|
100
|
-
|
79
|
84
|
||||||||||||
|
Investment Yield
|
6.5
|
3.0
|
1.5
|
*
|
1.4
|
*
|
||||||||||
|
Gross Change in Policyholders' Surplus
|
50
|
(10
|
)
|
63
|
*
|
48
|
||||||||||
|
Net Change in Adjusted Policyholders' Surplus
|
25
|
(10
|
)
|
39
|
*
|
17
|
||||||||||
|
Liabilities to Liquid Assets
|
105
|
-
|
70
|
79
|
||||||||||||
|
Gross Agents' Balance to Policyholders' Surplus
|
40
|
-
|
5
|
13
|
||||||||||||
|
One-Year Reserve Development to Policyholders' Surplus
|
20
|
-
|
3
|
(4
|
)
|
|||||||||||
|
Two-Year Reserve Development to Policyholders' Surplus
|
20
|
-
|
7
|
(7
|
)
|
|||||||||||
|
Estimated Current Reserve Deficiency to Policyholders' Surplus
|
25
|
-
|
38
|
*
|
56
|
*
|
||||||||||
* indicates an unusual value
GAAP differs in some respects from reporting practices prescribed or permitted by the Florida OIR. FNIC’s statutory capital and surplus was $125.3 million and $76.9 million as of December 31, 2014 and 2013, respectively. FNIC’s statutory net income was $29.2 million, $3.6 million and $6.6 million for 2014, 2013 and 2012, respectively. FNIC’s statutory non-admitted assets were $0.1 million and nearly nothing as of December 31, 2014 and 2013, respectively.
(9) COMMITMENTS AND CONTINGENCIES
Management has a responsibility to continually measure and monitor its commitments and its contingencies. The nature of the Company’s commitments and contingencies can be grouped into three major categories: insured claim activity, assessment related activities and operational matters.
(A) Insured Claim Activity
We are involved in claims and legal actions arising in the ordinary course of business. The amount of liability for these claims and lawsuits is uncertain. Revisions to our estimates are based on our analysis of subsequent information that we receive regarding various factors, including: (i) per claim information; (ii) company and industry historical loss experience; (iii) legislative enactments, judicial decisions, legal developments in the awarding of damages; and (iv) trends in general economic conditions, including the effects of inflation. Management revises its estimates based on the results of its analysis. This process assumes that experience, adjusted for the effects of current developments and anticipated trends, is an appropriate basis for estimating the ultimate settlement of all claims. There is no precise method for subsequently evaluating the impact of any specific factor on the adequacy of the reserves, because the eventual redundancy or deficiency is affected by multiple factors. In the opinion of management, the ultimate disposition of these matters may have a material adverse effect on our consolidated financial position, results of operations, or liquidity.
The Company’s subsidiaries are, from time to time, named as defendants in various lawsuits incidental to their insurance operations. Legal actions relating to claims made in the ordinary course of seeking indemnification for a loss covered by the insurance policy are considered by the Company in establishing loss and LAE reserves.
The Company also faces, in the ordinary course of business, lawsuits that seek damages beyond policy limits. The Company continually evaluates potential liabilities and reserves for litigation of these types using the criteria established by FASB issued guidance. Under this guidance, reserves for a loss are recorded if the likelihood of occurrence is probable and the amount can be reasonably estimated. If a loss, while not probable, is judged to be reasonably possible, management will make an estimate of a possible range of loss or state that an estimate cannot be made. Management considers each legal action using this guidance and records reserves for losses as warranted.
Federated National Holding Company and Subsidiaries
Notes to Consolidated Financial Statements
December 31, 2014
(B) Assessment Related Activity
We operate in a regulatory environment where certain entities and organizations have the authority to require us to participate in assessments. Currently these entities and organizations include, but are not limited to, Florida Insurance Guaranty Association (“FIGA”), Citizens Property Insurance Corporation (“Citizens”), Florida Hurricane Catastrophe Fund (“FHCF”) and Florida Joint Underwriters Insurance Association (“JUA”). As a direct premium writer in the state of Florida, we are required to participate in certain insurer solvency associations under Florida Statutes Section 631.57(3) (a), administered by FIGA.
During December 2012, the Company was assessed $0.8 million by FIGA relating to the failures of Florida domestic property and casualty insurance companies. Future assessments are likely, although the impact of these assessments on our balance sheet, results of operations or cash flow are undeterminable at this time.
FNIC is also required to participate in an insurance apportionment plan under Florida Statutes Section 627.351, which is referred to as a JUA Plan. The JUA Plan provides for the equitable apportionment of any profits realized, or losses and expenses incurred, among participating automobile insurers. In the event of an underwriting deficit incurred by the JUA Plan which is not recovered through the policyholders in the JUA Plan, such deficit shall be recovered from the companies participating in the JUA Plan in the proportion that the net direct written premiums of each such member during the preceding calendar year bear to the aggregate net direct premiums written in this state by all members of the JUA Plan. FNIC was not assessed by the JUA Plan during 2014, 2013 or 2012. Future assessments by this association are undeterminable at this time.
(C) Operational Matters
The Company has recorded a net deferred tax liability and asset of $1.3 million and $1.0 million as of December 31, 2014 and 2013, respectively. Realization of deferred tax assets is dependent on generating sufficient taxable income in future periods. Management considers the scheduled reversal of deferred tax liabilities, projected future taxable income and tax planning strategies in assessing the ability to realize deferred tax assets. Based upon the level of historical taxable income and projections for future taxable income over the periods in which the deferred tax assets are deductible, management believes it is more likely than not that the Company will realize the benefits of these deductible differences and as such no valuation allowance has been recorded against deferred tax assets. Should a change in circumstances lead to a change in judgment about the realizability of deferred tax assets in future years, the Company would record a valuation allowances as deemed appropriate in the period that the change in circumstances occurs, along with a corresponding increase or charge to net income. The resolution of tax reserves and changes in valuation allowances could be material to the Company’s results of operations for any period, but is not expected to be material to the Company’s financial position.
The Company files a federal income tax return and various state and local tax returns. The Company’s consolidated federal and state income tax returns for 2012 - 2013 are open for review by the IRS and various state taxing authorities. The Company’s 2011 federal tax return was under review by the IRS and in 2014 the audit was closed with a no change report.
The Company is not currently involved in any material legal actions arising from the ordinary course of business that are not related to insured claims activity.
Included in this year’s reinsurance program is a 30% quota share reinsurance treaty for the Company’s in-force new and renewal homeowners’ insurance program in the State of Florida. This two-year quota share reinsurance treaty provides 30% of $200 million of aggregate catastrophe coverage per year with maximum single event coverage of 30% of $100 million per year. The approximate cost of this quota share is projected to be $6.7 million per year, net of ceding commissions, and it is included in the $117.0 million amount referenced above. The quota share treaty contains commutation provisions for the Company to share profits based on loss experience during the term of the treaty.
The 30% quota share reinsurance treaty described above contains profit sharing provisions that will adjust over its two-year term depending on the Company’s loss experience from catastrophic and non-catastrophic events during the term. The frequency and severity of catastrophic events, coupled with non-catastrophic loss experience, will determine the ultimate profit share, if any. In accordance with GAAP, the Company will initially recognize an asset and liability and the resultant net income or loss. For example, deferred quota-share profit sharing totaled $10.5 million as of December 31, 2014. The deferred quota-share profit sharing was originally recorded at $14.0 million at the program’s July 1, 2014 inception and will continue to amortize over the life of the program. Subsequently, the Company will adjust the value of the asset and liability based on information available at the time of valuation. Upward and downward adjustments to the asset’s value will affect the Company’s results of operations by increasing or decreasing net income in the period of the adjustment.
Federated National Holding Company and Subsidiaries
Notes to Consolidated Financial Statements
December 31, 2014
(10) LEASES
Relative to the Company’s commitments stemming from operational matters, on or about March 1, 2006 we sold our interest in the building that housed our operations in Lauderdale Lakes through December 16, 2011, to an unrelated party. As part of this transaction, we agreed to lease the same facilities for a five-year term. We amended the lease agreement and the note receivable on September 1, 2010. As part of the amendment, we discounted the note receivable and have discontinued the interest on the note. In consideration, we paid a reduced lease payment for the remainder of the lease. Our lease for this office space expired in December 2011.
Our executive offices are located at 14050 N.W. 14th Street, Suite 180, Sunrise, Florida 33323 in an 18,500 square foot office facility. Our original lease for this office space was scheduled to expire in May 2017. During March 2014, we extended our lease term to expire in August 2019 and expanded the leased premises to include an additional 13,642 square feet. All of our operations are consolidated within these facilities. We believe that the facilities are well maintained, in substantial compliance with environmental laws and regulations, and adequately covered by insurance. We also believe that these leased facilities are not unique and could be replaced, if necessary, at the end of the lease term.
The expected future lease payouts in connection with this lease are as follows.
|
Fiscal Year
|
Payments
|
|||
|
(Dollars in Thousands)
|
||||
|
2015
|
698
|
|||
|
2016
|
712
|
|||
|
2017
|
726
|
|||
|
2018
|
740
|
|||
|
Thereafter
|
502
|
|||
|
Total
|
$
|
3,378
|
||
Rent expense was $0.5 million, $0.4 million and $0.2 million in 2014, 2013 and 2012, respectively.
(11) RELATED PARTY TRANSACTIONS
One of our directors is a partner at a law firm that handles some of the Company’s claims litigation. Fees paid to this law firm amounted to approximately $6,538, $36,400 and $27,175 in 2014, 2013 and 2012, respectively, and is included in LAE.
Federated National Holding Company and Subsidiaries
Notes to Consolidated Financial Statements
December 31, 2014
(12) NET INCOME PER SHARE
Net income per share is computed by dividing net income by the weighted average number of shares of common stock and common stock equivalents outstanding during the periods presented. In accordance with GAAP, net loss per share would be antidilutive; therefore the basic and diluted loss per share is the same.
A summary of the numerator and denominator of the basic and fully diluted 2014, 2013 and 2012 net income (loss) per share is presented below.
|
Income
(Numerator) |
Shares Outstanding
(Denominator) |
Per-share
Amount |
||||||||||
|
(Dollars in Thousands)
|
||||||||||||
|
For the year ended December 31, 2014
|
||||||||||||
|
Basic net income per share
|
$
|
37,199
|
12,082
|
$
|
3.08
|
|||||||
|
Fully diluted income per share
|
$
|
37,199
|
12,438
|
$
|
2.99
|
|||||||
|
For the year ended December 31, 2013
|
||||||||||||
|
Basic net income per share
|
$
|
12,727
|
8,506
|
$
|
1.50
|
|||||||
|
Fully diluted income per share
|
$
|
12,727
|
8,772
|
$
|
1.45
|
|||||||
|
For the year ended December 31, 2012
|
||||||||||||
|
Basic net income per share
|
$
|
4,313
|
7,952
|
$
|
0.53
|
|||||||
|
Fully diluted income per share
|
$
|
4,313
|
8,016
|
$
|
0.53
|
|||||||
(13) SEGMENT INFORMATION
FASB issued guidance requires that the amount reported for each segment item be based on what is used by the chief operating decision maker in formulating a determination as to how many resources to assign to a segment and how to appraise the performance of that segment. The term chief operating decision maker may apply to the chief executive officer or chief operating officer or to a group of executives. Note: The term of chief operating decision maker may apply to a function and not necessarily to a specific person. This is a management approach rather than an industry approach in identifying segments. The segments are based on the Company’s organizational structure, revenue sources, nature of activities, existence of responsible managers, and information presented to the Board of Directors.
If any one of the following exists, a segment must be reported on.
| · | Revenue, including unaffiliated and inter-segment sales or transfers, is 10% or more of total revenue of all operating segments. |
| · | Operating profit or loss is 10% or more of the greater, in absolute amount, of the combined operating profit (or loss) of all industry segments with operating profits (or losses). |
| · | Identifiable assets are 10% or more of total assets of all operating segments. |
Operating segments that are not reportable should be combined and disclosed in the ‘‘all other’’ category. Disclosure should be made of the sources of revenue for these segments. Accordingly, we have no segment information to report.
Federated National Holding Company and Subsidiaries
Notes to Consolidated Financial Statements
December 31, 2014
(14) STOCK COMPENSATION PLANS
We implemented a stock option plan in 1998 (the “1998 Plan”), which expired in September 2008. Under this plan, we were authorized to grant options to purchase up to 900,000 common shares, and as of December 31, 2014 and December 31, 2013, we had outstanding exercisable options to purchase none and 3,000 shares, respectively.
We implemented a stock option plan in 2002 (the “2002 Plan”), which expired in April 2012. Under this plan, we were authorized to grant options to purchase up to 1,800,000 common shares, and as of December 31, 2014 and December 31, 2013, we had outstanding exercisable options to purchase 219,285 and 523,521 shares, respectively.
In April 2012, our Board of Directors adopted, and in September 2012 our shareholders approved, the Company’s 2012 Stock Incentive Plan (the “2012 Plan”). The 2012 Plan permits the issuance of up to 1,000,000 shares of our common stock, subject to adjustment as provided for in the 2012 Plan, in connection with the grant of a variety of equity incentive awards, such as incentive stock options, non-qualified stock options, stock appreciation rights, dividend equivalent rights, restricted stock, restricted stock units, and performance shares. Officers, directors and executive, managerial, administrative and professional employees of the Company and its subsidiaries are eligible to participate in the 2012 Plan. Awards may be granted singly, in combination, or in tandem. The 2012 Plan was amended and restated in March 2013 to clarify the plan administrator’s authority to permit the vesting of unvested restricted shares in the event of the death of the grantee. The 2012 Plan will expire on April 5, 2022.
On March 4, 2013, a total of 100,000 restricted shares from the 2012 Plan were granted pursuant to the vesting requirements and other terms and conditions set forth in restricted stock agreements. Of the total, 25,000 shares were granted to the Company's Chief Executive Officer and President and 15,000 shares were granted to the Company's Chief Financial Officer. An aggregate of 20,000 shares were granted to the Company's directors and the remaining 40,000 shares were granted to other employees of the Company.
On August 5, 2013, a total of 150,000 restricted shares from the 2012 Plan were granted pursuant to the vesting requirements and other terms and conditions set forth in restricted stock agreements. Of the total, 100,000 shares were granted to the Company's Chief Executive Officer and President and 50,000 shares were granted to the Company's Chief Financial Officer.
On March 4, 2014, a total of 88,648 restricted shares from the 2012 Plan were granted pursuant to the vesting requirements and other terms and conditions set forth in restricted stock agreements. Of the total, 43,997 shares were granted to the Company's Chief Executive Officer and President and 16,341 shares were granted to the Company's Chief Financial Officer. An aggregate of 15,710 shares were granted to the Company's directors and the remaining 12,600 shares were granted to other employees of the Company.
On September 9, 2014, a total of 130,000 restricted shares from the 2012 Plan were granted pursuant to the vesting requirements and other terms and conditions set forth in restricted stock agreements. Of the total, 45,000 shares were granted to the Company's Chief Executive Officer and President and 15,000 shares were granted to the Company's Chief Financial Officer. An aggregate of 50,000 shares were granted to the Company's directors and the remaining 20,000 shares were granted to other employees of the Company.
On December 9, 2014, a total of 50,000 restricted shares from the 2012 Plan were granted to the Company’s Chief Executive Officer and President pursuant to the vesting requirements and other terms and conditions set forth in the restricted stock agreement.
Federated National Holding Company and Subsidiaries
Notes to Consolidated Financial Statements
December 31, 2014
Activity in our stock option and incentive plans for the period from January 1, 2011 to December 31, 2014 is summarized below.
|
1998 Plan
|
2002 Plan
|
2012 Plan
|
||||||||||||||||||||||
|
Number of
Shares
|
Weighted
Average
Option
Exercise Price
|
Number of
Shares
|
Weighted
Average
Option
Exercise Price
|
Number of
Shares
|
Fair Market
Value at Grant
|
|||||||||||||||||||
|
Outstanding at January 1, 2012
|
89,750
|
$
|
12.83
|
624,700
|
$
|
6.15
|
-
|
$
|
-
|
|||||||||||||||
|
Granted
|
-
|
$
|
-
|
181,500
|
$
|
4.40
|
-
|
$
|
-
|
|||||||||||||||
|
Exercised
|
-
|
$
|
-
|
(33,104
|
)
|
$
|
3.86
|
-
|
$
|
-
|
||||||||||||||
|
Cancelled
|
(11,250
|
)
|
$
|
13.54
|
(70,499
|
)
|
$
|
12.45
|
-
|
$
|
-
|
|||||||||||||
|
Outstanding at January 1, 2013
|
78,500
|
$
|
12.73
|
702,597
|
$
|
5.17
|
-
|
$
|
-
|
|||||||||||||||
|
Granted
|
-
|
$
|
-
|
-
|
$
|
-
|
250,000
|
$
|
8.23
|
|||||||||||||||
|
Exercised
|
(500
|
)
|
$
|
8.67
|
(165,577
|
)
|
$
|
7.15
|
-
|
$
|
-
|
|||||||||||||
|
Cancelled
|
(75,000
|
)
|
$
|
12.92
|
(13,499
|
)
|
$
|
5.41
|
(500
|
)
|
$
|
5.54
|
||||||||||||
|
Outstanding at January 1, 2014
|
3,000
|
$
|
8.67
|
523,521
|
$
|
4.54
|
249,500
|
$
|
8.24
|
|||||||||||||||
|
Granted
|
-
|
$
|
-
|
-
|
$
|
-
|
268,648
|
$
|
25.25
|
|||||||||||||||
|
Exercised
|
(3,000
|
)
|
$
|
8.67
|
(299,735
|
)
|
$
|
5.10
|
(68,988
|
)
|
$
|
18.67
|
||||||||||||
|
Cancelled
|
-
|
$
|
-
|
(4,501
|
)
|
$
|
3.49
|
(1,359
|
)
|
$
|
7.73
|
|||||||||||||
|
Outstanding at December 31, 2014
|
-
|
$
|
-
|
219,285
|
$
|
3.79
|
447,801
|
$
|
16.84
|
|||||||||||||||
Options outstanding as of December 31, 2014 are exercisable as follows.
|
2002 Plan
|
||||||||
|
Options Exercisable at:
|
Number of
Shares
|
Weighted
Average
Option
Exercise Price
|
||||||
|
December 31, 2014
|
151,585
|
$
|
3.79
|
|||||
|
December 31, 2015
|
67,700
|
$
|
3.79
|
|||||
|
December 31, 2016
|
-
|
$
|
3.79
|
|||||
|
December 31, 2017
|
-
|
$
|
3.79
|
|||||
|
December 31, 2018
|
-
|
$
|
3.79
|
|||||
|
Thereafter
|
-
|
$
|
3.79
|
|||||
|
Total options exercisable
|
219,285
|
|||||||
Upon the exercise of options, the Company issues authorized shares.
Prior to January 1, 2006, we accounted for the plans under the recognition and measurement provisions of stock-based compensation using the intrinsic value method prescribed by the APB and related Interpretation, as permitted by FASB issued guidance. Under these provisions, no stock-based employee compensation cost was recognized in the Statement of Operations as all options granted under those plans had an exercise price equal to or less than the market value of the underlying common stock on the date of grant.
Effective January 1, 2006, the Company adopted the fair value recognition provisions of FASB issued guidance using the modified-prospective-transition method. Under that transition method, compensation costs recognized during 2014 and 2013 include the following.
| · | Compensation cost for all share-based payments granted prior to, but not yet vested as of January 1, 2006, based on the grant date fair value estimated in accordance with the original provisions of FASB issued guidance, and |
| · | Compensation cost for all share-based payments granted subsequent to January 1, 2006, based on the grant-date fair-value estimated in accordance with the provisions of FASB issued guidance. Results for prior periods have not been restated, as they are not required to be by the pronouncement. |
Federated National Holding Company and Subsidiaries
Notes to Consolidated Financial Statements
December 31, 2014
As a result of adopting FASB issued guidance on January 1, 2006, the Company’s income from continuing operations before provision for income tax expense and net income for 2014 are lower by approximately $1,272,500 and $800,000, respectively, than if it had continued to account for share-based compensation under APB guidance.
As a result of adopting FASB issued guidance on January 1, 2006, the Company’s income from continuing operations before provision for income tax expense and net income for 2013 are lower by approximately $447,000 and $278,600, respectively, than if it had continued to account for share-based compensation under APB guidance.
Basic and diluted earnings per share for 2014 would have been $3.15 and $3.05, respectively, if the Company had not adopted FASB issued guidance, compared with reported basic and diluted earnings per share of $3.08 and $2.99, respectively.
Basic and diluted earnings per share for 2013 would have been $1.53 and $1.48, respectively, if the Company had not adopted FASB issued guidance, compared with reported basic and diluted earnings per share of $1.50 and $1.45, respectively.
Because the change in income taxes receivable (payable) includes the effect of excess tax benefits, those excess tax benefits also must be shown as a separate operating cash outflow so that operating cash flows exclude the effect of excess tax benefits. FASB issued guidance requires the cash flows resulting from the tax benefits resulting from tax deductions in excess of the compensation cost recognized for those options (excess tax benefits) to be classified as financing cash flows.
FASB issued guidance requires that when valuing an employee stock option under the Black-Scholes option pricing model, the fair value be based on the option’s expected term and expected volatility rather than the contractual term. The estimate of the fair value on the grant date should reflect the assumptions marketplace participants now use on the date of the measurement (i.e. grant date). During 2011, management changed the expected term in the Black –Scholes option pricing model from four years to two years for new options granted. Management believes that share price volatility over the last two years is more indicative of future share price volatility. The change has had an immaterial impact on the financial statements.
The weighted average fair value of options granted during 2012 estimated on the date of grant using the Black-Scholes option-pricing model was $1.45; no options were granted during 2013 or 2014.
The fair value of options granted is estimated on the date of grant using the following assumptions.
|
December 31, 2014
|
December 31, 2013
|
December 31, 2012
|
|||||||
|
Dividend yield
|
N/A
|
N/A
|
N/A
|
|
|||||
|
Expected volatility
|
N/A
|
N/A
|
39.79%
|
|
|||||
|
Risk-free interest rate
|
N/A
|
N/A
|
0.28%
|
|
|||||
|
Expected life (in years)
|
N/A
|
N/A
|
4.45
|
Summary information about the Company’s stock options outstanding at December 31, 2014 follows.
|
Range of
Exercise Price
|
Outstanding at
December 31, 2014
|
Weighted Average
Contractual
Periods in Years
|
Weighted
Average
Exercise Price
|
Exercisable at
December 31, 2014
|
||||||||||||||||
|
2002 Plan
|
$
|
2.45 - $4.40
|
219,285
|
6.60
|
$
|
3.79
|
151,585
|
|||||||||||||
(15) EMPLOYEE BENEFIT PLAN
We have established a profit sharing plan under Section 401(k) of the Internal Revenue Code. This plan allows eligible employees to contribute up to 100 percent of their compensation, not to exceed statutory limits. The Company match totaled $0.4 million, $0.2 million and $0.1 million during the years 2014, 2013 and 2012, respectively.
Through December 31, 2010, the Company matched 50% of the first 6% of a participant’s elective contributions. Effective January 1, 2011, the Board of Directors approved an amendment to our 401(k) plan to be a qualified automatic contribution arrangement with an employer match of 100% of the first 1% of elective contributions and an employer match of 50% of the next 2% to 6% of elective contributions, which is vested 100% after 2 years of service. Effective January 1, 2014, the Board of Directors approved the Company will match 100% of the first 6% of a participant’s elective contributions.
Federated National Holding Company and Subsidiaries
Notes to Consolidated Financial Statements
December 31, 2014
(16) ACQUISITIONS
We made no acquisitions during 2014 or 2013.
(17) COMPREHENSIVE INCOME
For the years ended December 31, 2014, 2013 and 2012, comprehensive income consisted of the following.
|
Years Ended December 31,
|
||||||||||||
|
2014
|
2013
|
2012
|
||||||||||
|
(Dollars in Thousands)
|
||||||||||||
|
Net income
|
$
|
37,199
|
$
|
12,727
|
$
|
4,313
|
||||||
|
Change in net unrealized gains on investments available for sale
|
2,856
|
3,041
|
5,114
|
|||||||||
|
Comprehensive income before tax
|
40,055
|
15,768
|
9,427
|
|||||||||
|
Income tax expense related to items of other comprehensive income
|
(1,102
|
)
|
(1,144
|
)
|
(1,924
|
)
|
||||||
|
Comprehensive income
|
$
|
38,953
|
$
|
14,624
|
$
|
7,503
|
||||||
(18) AUTHORIZATION OF PREFERRED STOCK
Our Amended and Restated Articles of Incorporation authorize the issuance of one million shares of preferred stock with designations, rights and preferences determined from time to time by our board of directors. Accordingly, our Board of Directors is empowered, without shareholder approval, to issue preferred stock with dividends, liquidation, conversion, voting or other rights that could adversely affect the voting power or other rights of the holders of common stock. We have not issued preferred shares as of December 31, 2014.
Federated National Holding Company and Subsidiaries
Notes to Consolidated Financial Statements
December 31, 2014
(19) FEDERATED NATIONAL HOLDING COMPANY (UNAUDITED)
FNHC (the parent company only) has no long term obligations, guarantees or material contingencies as of December 31, 2014. The following summarizes the major categories of the parent company’s financial statements.
|
Condensed Balance Sheets (Unaudited)
|
Period Ending December 31,
|
|||||||
|
ASSETS
|
2014
|
2013
|
||||||
|
(Dollars in Thousands)
|
||||||||
|
Cash and short term investments
|
$
|
12,053
|
$
|
2,143
|
||||
|
Investments and advances to subsidiaries
|
138,171
|
105,797
|
||||||
|
Deferred income taxes receivable
|
332
|
1,006
|
||||||
|
Income taxes receivable
|
8,966
|
8,157
|
||||||
|
Property, plant and equipment, net
|
511
|
184
|
||||||
|
Other assets
|
1,044
|
4,446
|
||||||
|
Total assets
|
$
|
161,077
|
$
|
121,733
|
||||
|
LIABILITIES AND SHAREHOLDERS' EQUITY
|
||||||||
|
Income taxes payable
|
-
|
1,690
|
||||||
|
Dividends payable
|
564
|
330
|
||||||
|
Capital contribution payable
|
18,501
|
16,000
|
||||||
|
Other liabilities
|
428
|
238
|
||||||
|
Total liabilities
|
19,493
|
18,258
|
||||||
|
Shareholders' equity:
|
||||||||
|
Common stock
|
137
|
110
|
||||||
|
Additional paid-in capital
|
115,123
|
74,086
|
||||||
|
Accumulated other comprehensive loss
|
508
|
(1,727
|
)
|
|||||
|
Retained earnings
|
25,816
|
31,006
|
||||||
|
Total shareholders' equity
|
141,584
|
103,475
|
||||||
|
Total liabilities and shareholders' equity
|
$
|
161,077
|
$
|
121,733
|
||||
|
Condensed Statements of Operations (Unaudited)
|
Years Ended December 31,
|
|||||||||||
|
2014
|
2013
|
2012
|
||||||||||
|
(Dollars in Thousands)
|
||||||||||||
|
Revenue:
|
||||||||||||
|
Management fees from subsidiaries
|
$
|
2,387
|
$
|
1,864
|
$
|
1,228
|
||||||
|
Equity in income of subsidiaries
|
61,653
|
21,623
|
8,787
|
|||||||||
|
Net investment income
|
415
|
136
|
34
|
|||||||||
|
Other income
|
2
|
11
|
476
|
|||||||||
|
Total revenue
|
64,457
|
23,634
|
10,525
|
|||||||||
|
Expenses:
|
||||||||||||
|
Salaries and wages
|
3,342
|
2,022
|
1,853
|
|||||||||
|
Legal fees
|
178
|
113
|
198
|
|||||||||
|
Other expenses
|
3,630
|
2,281
|
1,726
|
|||||||||
|
Total expenses
|
7,150
|
4,416
|
3,777
|
|||||||||
|
Income before provision for income tax expense
|
57,307
|
19,218
|
6,748
|
|||||||||
|
Provision for income tax expense
|
20,108
|
6,491
|
2,435
|
|||||||||
|
Net income
|
$
|
37,199
|
$
|
12,727
|
$
|
4,313
|
||||||
Federated National Holding Company and Subsidiaries
Notes to Consolidated Financial Statements
December 31, 2014
|
Condensed Statements of Cash Flow (Unaudited)
|
||||||||||||
|
Years Ended December 31,
|
||||||||||||
|
2014
|
2013
|
2012
|
||||||||||
|
(Dollars in Thousands)
|
||||||||||||
|
Cash flow from operating activities:
|
||||||||||||
|
Net income
|
$
|
37,199
|
$
|
12,727
|
$
|
4,313
|
||||||
|
Adjustments to reconcile net income to net cash (used) provided by operating activities:
|
||||||||||||
|
Equity in income of subsidiaries
|
(61,653
|
)
|
(21,623
|
)
|
(8,787
|
)
|
||||||
|
Depreciation and amortization of property plant and equipment, net
|
92
|
33
|
23
|
|||||||||
|
Deferred income tax expense
|
(674
|
)
|
(3,332
|
)
|
(4,274
|
)
|
||||||
|
Income tax (recoverable) payable
|
(1,690
|
)
|
1,690
|
(78
|
)
|
|||||||
|
Change in dividends payable
|
234
|
330
|
-
|
|||||||||
|
Non-cash compensation
|
1,660
|
293
|
188
|
|||||||||
|
Changes in operating assets and liabilities:
|
||||||||||||
|
Property, plant and equipment
|
419
|
119
|
(138
|
)
|
||||||||
|
Deferred gain on sale of assets
|
-
|
-
|
(30
|
)
|
||||||||
|
Other assets
|
(3,402
|
)
|
377
|
45
|
||||||||
|
Capital contribution payable
|
2,501
|
16,000
|
-
|
|||||||||
|
Other liabilities
|
190
|
112
|
(18
|
)
|
||||||||
|
Net cash (used) provided by operating activities
|
(25,124
|
)
|
6,726
|
(8,756
|
)
|
|||||||
|
Cash flow used in investing activities:
|
||||||||||||
|
Purchases of investment securities available for sale
|
(32,374
|
)
|
(44,792
|
)
|
(451
|
)
|
||||||
|
Cash flow used in investing activities:
|
(32,374
|
)
|
(44,792
|
)
|
(451
|
)
|
||||||
|
Net cash provided in financing activities:
|
||||||||||||
|
Dividends paid
|
(1,672
|
)
|
(1,232
|
)
|
(159
|
)
|
||||||
|
Stock options exercised
|
1,555
|
858
|
128
|
|||||||||
|
Tax benefit related to non-cash compensation
|
479
|
168
|
100
|
|||||||||
|
Issuance of common stock
|
43,110
|
27,879
|
-
|
|||||||||
|
Advances from subsidiaries
|
23,936
|
11,042
|
8,349
|
|||||||||
|
Net cash provided in financing activities:
|
67,408
|
38,715
|
8,418
|
|||||||||
|
Net increase (decrease) in cash and short term investments
|
9,910
|
649
|
(789
|
)
|
||||||||
|
Cash and short term investments at beginning of year
|
2,143
|
1,494
|
2,283
|
|||||||||
|
Cash and short term investments at end of year
|
$
|
12,053
|
$
|
2,143
|
$
|
1,494
|
||||||
Federated National Holding Company and Subsidiaries
Notes to Consolidated Financial Statements
December 31, 2014
(20) SCHEDULE
VI – SUPPLEMENTAL INFORMATION CONCERNING PROPERTY-CASUALTY INSURANCE OPERATIONS (UNAUDITED)
|
Loss and LAE
- Current Year
|
Loss and LAE
- Prior year
|
Amortization of
deferred policy
acquisition
costs
|
Paid losses and
LAE
expenses
|
Net premiums
written
|
||||||||||||||||
|
(Dollars in Thousands)
|
||||||||||||||||||||
|
2014
|
$
|
79,932
|
$
|
1,104
|
$
|
27,475
|
$
|
42,391
|
$
|
175,158
|
||||||||||
|
2013
|
$
|
56,209
|
$
|
201
|
$
|
21,447
|
$
|
22,695
|
$
|
160,665
|
||||||||||
|
2012
|
$
|
31,636
|
$
|
(1,427
|
)
|
$
|
13,255
|
$
|
15,892
|
$
|
68,374
|
|||||||||
|
Affiliation with registrant
|
Deferred policy
acquisition
costs
|
Reserves for
losses and LAE
|
Discount, if any,
deducted from
previous column
|
Unearned
premiums
|
Net premiums
earned
|
|||||||||||||||
|
(Dollars in Thousands)
|
||||||||||||||||||||
|
Consolidated Property and Casualty Subsidiaries
|
||||||||||||||||||||
|
2014
|
$
|
13,610
|
$
|
78,330
|
$
|
-
|
$
|
192,424
|
$
|
170,905
|
||||||||||
|
2013
|
$
|
16,708
|
$
|
61,016
|
$
|
-
|
$
|
128,343
|
$
|
104,381
|
||||||||||
|
2012
|
$
|
8,479
|
$
|
49,908
|
$
|
-
|
$
|
59,006
|
$
|
59,359
|
||||||||||
(21) FAIR VALUE DISCLOSURE
In April 2009, the FASB issued accounting guidance that if an entity determines that either the volume and/or level of activity for an investment security has significantly decreased (from normal conditions for that investment security) or price quotations or observable inputs are not associated with orderly transactions, increased analysis and management judgment will be required to estimate fair value. This guidance was effective for interim and annual periods ending after June 15, 2009, with early adoption permitted. This guidance was applied prospectively. The adoption of this guidance did not have an impact on our financial condition, results of operations or cash flows.
In October 2008, the FASB issued accounting guidance to clarify the application of GAAP in determining fair value of financial instruments in a market that is not active. The guidance was effective upon issuance, including prior periods for which financial statements had not been issued. Our adoption of this guidance did not have a material effect on our financial position, results of operations or cash flows.
In September 2006, FASB issued accounting guidance that defines fair value as the exchange price that would be received for an asset or paid to transfer a liability (an exit price) in the principal or most advantageous market for an asset or liability in an orderly transaction between market participants on the measurement date. This guidance also establishes a fair value hierarchy that requires an entity to maximize the use of observable inputs and minimize the use of unobservable inputs when measuring fair value. The guidance also categorizes assets and liabilities at fair value into one of three different levels depending on the observation of the inputs employed in the measurement, as follows.
Federated National Holding Company and Subsidiaries
Notes to Consolidated Financial Statements
December 31, 2014
Level 1 — inputs to the valuation methodology are quoted prices (unadjusted) for identical assets or liabilities in active markets. A quoted price for an identical asset or liability in an active market provides the most reliable fair value measurement because it is directly observable to the market.
Level 2 — inputs to the valuation methodology include quoted prices for similar assets and liabilities in active markets, and inputs are observable for an asset or liability, either directly or indirectly, for substantially the full term of the financial instrument.
Level 3 — inputs to the valuation methodology are unobservable and significant to the fair value measurement.
Securities available-for-sale: The fair value of securities available-for-sale is determined by obtaining quoted prices on nationally recognized security exchanges.
Assets measured at fair value on a recurring basis as of December 31, 2014, presented in accordance with this guidance, are as follows.
|
As of December 31, 2014
|
||||||||||||||||
|
Level 1
|
Level 2
|
Level 3
|
Total
|
|||||||||||||
|
(Dollars in Thousands)
|
||||||||||||||||
|
Debt securities:
|
||||||||||||||||
|
United States government obligations and authorities
|
$
|
46,002
|
$
|
16,321
|
$
|
-
|
$
|
62,323
|
||||||||
|
Obligations of states and political subdivisions
|
-
|
91,614
|
-
|
91,614
|
||||||||||||
|
Corporate
|
-
|
119,024
|
-
|
119,024
|
||||||||||||
|
International
|
-
|
11,138
|
-
|
11,138
|
||||||||||||
|
46,002
|
238,097
|
-
|
284,099
|
|||||||||||||
|
Equity securities:
|
||||||||||||||||
|
Common stocks
|
39,247
|
-
|
-
|
39,247
|
||||||||||||
|
39,247
|
-
|
-
|
39,247
|
|||||||||||||
|
Total debt and equity securities
|
$
|
85,249
|
$
|
238,097
|
$
|
-
|
$
|
323,346
|
||||||||
(22) SUBSEQUENT EVENTS
On March 10, 2015, a total of 66,140 restricted shares from the 2012 Plan were granted pursuant to the vesting requirements and other terms and conditions set forth in Restricted Stock Agreements. Of the total, 32,997 shares were granted to the Company's Chief Executive Officer and President and 9,551 shares were granted to the Company's Chief Financial Officer. An aggregate of 6,252 shares were granted to the Company's directors and the remaining 17,340 shares were granted to other employees of the Company.
On March 4, 2015, FNHC announced that Bruce F. Simberg, Chairman and a member of the Company’s Board of Directors, has resigned for personal reasons. Michael H. Braun, the Company’s Chief Executive Officer, President, and a member of the Board, will serve as interim Chairman of the Board.
On February 17, 2015, Federated National entered into a Reimbursement Contract with the SBA for the 2015-2016 hurricane season. This Reimbursement Contract is part of the Company’s reinsurance program and will reimburse Federated National for covered property losses under its homeowners’ insurance policies resulting from hurricanes that cause damage in the State of Florida through May 31, 2016.
Under this Contract, the FHCF will provide about $591.4 million of aggregate seasonal coverage for covered losses in excess of approximately $222.6 million subject to a 10% Company participation. Federated National’s premium for the FHCF reinsurance coverage will be approximately $40.2 million payable in three installments between August 2015 and December 2015. The actual attachment point, total coverage and cost may vary significantly as we continue to write new business and will not be finalized until December 31, 2015.
Federated National Holding Company and Subsidiaries
Effective February 12, 2015, Federated National Underwriters, Inc. changed its name to FedNat Underwriters, Inc.
On January 22, 2015, the Florida OIR approved FNIC to transact business in (050) Commercial Multi-Peril, with admitted (010) Commercial Property Fire, effective 2015.
None
Evaluation of Disclosure Controls and Procedures
We maintain disclosure controls and procedures that are designed to ensure that information required to be disclosed in the reports that we file or submit under the Exchange Act is recorded, processed, summarized, and reported within the time periods specified in the SEC’s rules and forms, and that such information is accumulated and communicated to our management, including our Chief Executive Officer and Chief Financial Officer, as appropriate, to allow timely decisions regarding required disclosure.
As of the end of the period covered by this report, we carried out an evaluation, under the supervision and with the participation of our principal executive officer and principal financial officer, of the effectiveness of the design and operation of our disclosure controls and procedures. Based on that evaluation, our Chief Executive Officer and Chief Financial Officer concluded that our disclosure controls and procedures were effective as of December 31, 2014.
Management’s Report on Internal Control over Financial Reporting
Because of its inherent limitations, internal controls over financial reporting may not prevent or detect misstatements. Also, projections of any evaluation of effectiveness to future periods are subject to the risk that controls may become inadequate because of changes in condition, or that the degree of compliance with the policies or procedures may deteriorate.
Our management is responsible for establishing and maintaining adequate internal control over financial reporting, as such term is defined in Exchange Act Rule 13a-15(f). Under the supervision and with the participation of our management, including our Chief Executive Officer and Chief Financial Officer, we conducted an evaluation of the effectiveness of our internal control over financial reporting based on the framework in Internal Control — Integrated Framework (2013) issued by the COSO.
Based on the results of this evaluation, our management has concluded that our internal control over financial reporting was effective as of December 31, 2014 to provide reasonable assurance regarding the reliability of financial reporting and the preparation of financial statements for external reporting purposes in accordance with GAAP. We reviewed the results of management’s assessment with the Company’s Audit Committee.
Changes in Internal Control over Financial Reporting
There were no changes in our internal control over financial reporting that occurred during the year ended December 31, 2014 that has materially affected, or is reasonably likely to materially affect, our internal control over financial reporting.
Limitations on Effectiveness
Our management and our audit committee do not expect that our disclosure controls and procedures or internal control over financial reporting will prevent all errors or all instances of fraud. A control system, no matter how well designed and operated, can provide only reasonable, not absolute, assurance that the control system’s objectives will be met. Further, the design of the control system must reflect the fact that there are resource constraints, and the benefits of controls must be considered relative to their costs. Because of the inherent limitations in all control systems, no evaluation of controls can provide absolute assurance that all control gaps and instances of fraud have been detected. These inherent limitations include the realities that judgments and decision-making can be faulty, and that breakdowns can occur because of simple errors or mistakes. Controls can also be circumvented by the individual acts of some persons, by collusion of two or more people, or by management override of the controls. The design of any system of controls is based in part upon certain assumptions about the likelihood of future events, and any design may not succeed in achieving its stated goals under all potential future conditions.
Federated National Holding Company and Subsidiaries
None
The following table sets forth certain information with respect to our executive officers and directors as of March 16, 2015:
|
Name
|
Age
|
Position with the Company
|
|
Michael H. Braun (5)
|
47
|
Chief Executive Officer, President, Interim Chairman, Director
|
|
Peter J. Prygelski, III (2)
|
46
|
Chief Financial Officer, Treasurer, Director
|
|
Richard W. Wilcox, Jr. (1)(3)(4)(5)
|
73
|
Director
|
|
Carl Dorf (1)(2)(4)
|
74
|
Director
|
|
Jenifer G. Kimbrough (1)(3)(4)(5)
|
43
|
Director
|
| (1) | Audit Committee Member |
| (2) | Investment Committee Member |
| (3) | Compensation Committee Member |
| (4) | Nominating Committee Member |
| (5) | Directors Compensation Committee Member |
Our Articles of Incorporation provide that our Board of Directors shall consist of three classes of directors, as nearly equal in number as possible, designated Class I, Class II and Class III, and provides that the exact number of directors comprising our Board of Directors will be determined from time to time by resolution adopted by the Board. At each annual meeting of shareholders, successors to the class of directors whose term expires at that annual meeting are elected for a three-year term. The current term of the Class I directors (currently Mr. Braun, Mr. Prygelski and Ms. Kimbrough) terminates on the date of our 2016 annual meeting. The current term of the Class II directors (currently Mr. Wilcox) terminates on the date of our 2015 annual meeting and the current term of the Class III director (currently Mr. Dorf) terminates as of the date of our 2017 annual meeting. As a result of the death of a director in 2014 and the resignation of a director in March 2015, the Board will review the director classes prior to the upcoming annual meeting of shareholders.
The following is a brief description of the business experience of each director and executive officer of the Company.
Bruce F. Simberg, who had been a member of the Board since 1998, resigned on March 4, 2015. The Company recognizes and expresses appreciation for his industry expertise and his service to the Board and the Company.
Michael H. Braun was appointed Chief Executive Officer of the Company in July 2008, President in June 2009, and elected to the Board of Directors in December 2005. Previously, Mr. Braun was Chief Operating Officer, where he was responsible for the Company’s day-to-day operations and strategic product portfolio. Mr. Braun has also served as President of Federated National Insurance Company (“FNIC”), a subsidiary of the Company, since September 2003, a position that he continues to hold. Previously, he held key management positions within FNIC, responsible for operations, marketing and underwriting. Prior to joining the Company, Mr. Braun was Managing Partner for an independent chain of insurance agencies, which was acquired by the Company in 1998.
Peter J. Prygelski, III was named Chief Financial Officer in June 2007 after serving as an independent director from January 2004 through June 2007. Mr. Prygelski was re-nominated to the Board in June 2008 and has served as an inside director since that time. Mr. Prygelski has spent his entire career in the financial services industry. He spent 12 years at American Express in various capacities including; Director of Internal Audit and Assistant General Auditor of American Express Centurion Bank. In this capacity, Mr. Prygelski was responsible for the monitoring of internal controls for a bank with $45 billion in assets, and assessing and mitigating operational, reputational, regulatory and strategic risk. After leaving American Express, he spent the next three years at Ernst & Young and Deloitte and Touche. At both firms, Mr. Prygelski served as a senior manager responsible for growing the financial services practice in the Southeast. He managed teams that provided Fortune 500 companies with consulting services in the following areas; Finance Transformation, Finance Operations Effectiveness, Financial Reporting, Cost Optimization, Governance, Risk and Compliance Services, and Board of Directors Performance.
Federated National Holding Company and Subsidiaries
Richard W. Wilcox, Jr. has served as a director of the Company since January 2003. Mr. Wilcox has been in the insurance industry for more than 40 years. In 1963, Mr. Wilcox started an insurance agency that eventually developed into a business generating $10 million in annual revenue. In 1991, Mr. Wilcox sold his agency to Hilb, Rogal and Hamilton Company (“HRH”) of Fort Lauderdale, for which he retained the position of President through 1998. In 1998, HRH of Fort Lauderdale merged with Poe and Brown of Fort Lauderdale, and Mr. Wilcox served as the Vice President of Poe and Brown until 1999, when he retired. Mr. Wilcox holds CIC designation as a member of the Society of Certified Insurance Counselors. Mr. Wilcox also holds an Advanced Professional Director Certification from the American College of Corporate Directors, a national public company director education and credentialing organization.
Carl Dorf, has served as a director of the Company since August 2001. Mr. Dorf has over 40 years of diversified investment experience as a security analyst, portfolio manager, mutual fund manager and hedge fund manager. He earned the Chartered Financial Analyst (CFA) designation and in the past served as director of the Los Angeles Society of Security Analysts. Since April 2001, Mr. Dorf has been the principal of Dorf Asset Management, LLC, and is responsible for all investment decisions made by that company. From January 1991 to February 2001, Mr. Dorf served as the Fund Manager of ING Pilgrim Bank and Thrift Fund. Prior to his experience at Pilgrim, Mr. Dorf was a principal in Dorf & Associates, an investment management company.
Jenifer G. Kimbrough has served as a director of the Company since April 2009. Ms. Kimbrough has served as the Vice President of Compliance and Audit for Surgical Care Affiliates since March 2010, prior to which Ms. Kimbrough served as the Vice President of Assurance and Process Improvement. Prior to 2007, Ms. Kimbrough was the Senior Vice President of Investor Relations at Regions Financial Corporation. From 1993 to 2003, Ms. Kimbrough served as an Audit Senior Manager at Ernst & Young LLP. Ms. Kimbrough received her certification as a certified public accountant from the Alabama State Board of Public Accountancy in 1994. Ms. Kimbrough is an active member of several societies, including: American Woman’s Society of CPAs, Institute of Internal Auditors, Alabama State Society of CPAs and American Institute of CPAs. Additionally, she recently served on the AICPA Women’s Initiative Executive Committee and as National President of the AWSCPA.
Section 16(a) Beneficial Ownership Reporting Compliance
Section 16(a) of the Exchange Act requires that our executive officers, directors, and persons who own more than 10% of a registered class of our equity securities to file reports of beneficial ownership and certain changes in beneficial ownership with the SEC and to furnish us with copies of those reports. To our knowledge, based solely on a review of the copies of such reports furnished to us or written representations that no other reports were required, we believe that during the year ended December 31, 2014, our officers, directors and greater than 10% shareholders timely filed all reports required by Section 16(a), except Bruce Simberg, a director of the Company until March 4, 2015, reported one transaction for the exercise of 3,333 stock options late on a Form 4.
Corporate Governance/Code of Conduct
We have adopted a Code of Conduct for all employees, officers and directors of the Company. A copy of our Code of Conduct policy is available on our web site at www.FedNat.com.
Leadership Structure and Risk Oversight
The Chairman of the Board typically presides at all meetings of the Board. The Chairman is elected to serve by the directors. Currently, Michael Braun, our Chief Executive Officer and President, serves as out Interim Chairman, although in the past the offices of Chairman of the Board and Chief Executive Officer have been separated. The Chief Executive Officer and Chief Financial Officer currently serve as the only members of management on the Board. Based on the current size, organizational structure and nature of operations of the Company, the Board believes that having a qualified individual serve as Interim Chairman of the Board and Chief Executive Officer is in the best interests of the Company.
The Company believes that its Board as a whole should encompass a range of talent, skill, diversity, and expertise enabling it to provide sound guidance with respect to the Company's operations and interests. The Company's policy is to have at least a majority of Directors qualify as independent as defined by the listing and maintenance rules of The Nasdaq Stock Market (the “Nasdaq Rules”). The Nominating Committee identifies candidates for election to the Board of Directors; reviews their skills, characteristics and experience; and recommends nominees for director to the Board for approval. The Nominating Committee's Charter provides that the Board of Directors as a whole should be diverse and consist of individuals with various and relevant career experience, relevant technical skills, industry knowledge and experience, financial expertise and local or community ties. Minimum individual requirements include strength of character, mature judgment, familiarity with the Company's business and industry, independence of thought and an ability to work collegially. The Board believes that the qualifications of the directors, as set forth in their biographies set forth above provide them with the qualifications and skills to serve as a director of our Company.
Federated National Holding Company and Subsidiaries
To facilitate the Board’s oversight functions and to take advantage of the knowledge and experience of its members, the Board has created several standing committees. These committees, the Audit, Investment, Nominating, Compensation and Directors Compensation Committees, allow regular risk oversight and monitoring, and deeper analysis of issues before the Board. The Audit and Compensation committee structures also require committees to be comprised exclusively of independent directors. The membership of the standing committees is reviewed from time to time, and specific committee assignments are proposed and appointed by the Board. In addition, among their other respective duties, the Board and Audit Committee each conduct an annual assessment to evaluate their effectiveness.
The Board’s role in connection with risk oversight is to oversee and monitor the management of risk practiced by the Company’s management in the performance of their duties. The Board does this in a number of ways, principally through the oversight responsibility of committees of the Board, but also as part of the strategic planning process. For example, our Audit Committee oversees management of risks related to accounting, auditing and financial reporting and maintaining effective internal controls over financial reporting. Our Nominating Committee oversees risk associated with corporate governance and the Company’s code of conduct, including compliance with listing standards for independent directors and conflicts of interest. Our Compensation Committee oversees the risk related to our executive compensation plans and arrangements. Our Investment Committee oversees the risks related to managing our investment portfolio. Our Directors Compensation Committee oversees the risk related to our non-employee director compensation plans and arrangements. The full Board receives reports on a regular basis regarding each committee’s oversight from the chairperson of each committee when reporting on their committee’s actions at regular Board meetings, as well as overseeing the development and implementation of strategic initiatives.
Meetings and Committees of the Board of Directors
During 2014, the Board of Directors held nine regular meetings, one special meeting and took actions by written consent on four occasions. During 2014, no director attended fewer than 75% of the Board and committee meetings held during this period. The Board of Directors encourages, but does not require, its directors to attend the Company’s annual meeting. Last year, all six of our directors attended our annual meeting.
The Board has determined that the following directors continue to be independent pursuant to the Nasdaq Rules applicable to the Company: Carl Dorf, Richard W. Wilcox, Jr., and Jenifer G. Kimbrough. Prior to his resignation, the Board had determined that Bruce F. Simberg was also independent pursuant to the Nasdaq Rules applicable to the Company.
The standing committees of the Board of Directors in 2014 were the Audit Committee, the Compensation Committee, the Nominating Committee, the Investment Committee and the Directors Compensation Committee. The Strategic Initiatives Committee was disbanded in July 2014. Charters for the Audit, Compensation and Nominating Committees are available upon the Company’s website at www.FedNat.com. The charter of the Audit, Compensation and Nominating Committees is also available in print to any shareholder who requests it from our Corporate Secretary.
Audit Committee. As of December 31, 2014, the Audit Committee was composed of Jenifer G. Kimbrough, who served as the Chair, Richard W. Wilcox, Jr. and Carl Dorf. Each member was determined to be “independent” as defined under the Nasdaq Rules applicable to the Company and SEC rules for Audit Committee membership. Ms. Kimbrough was designated as a “financial expert” as that term is defined in the applicable rules and regulations of the Exchange Act. The Board determined that Ms. Kimbrough was a "financial expert" as defined in the applicable rules and regulations of the Exchange Act based on her understanding of GAAP and financial statements; her ability to assess the general application of GAAP in connection with the accounting for estimates, accruals and reserves; her experience preparing, auditing, analyzing or evaluating financial statements that present a breadth and level of complexity of accounting issues that are generally comparable to the breadth and complexity of issues that can reasonably be expected to be raised by the Company’s financial statements, or experience actively supervising one or more persons engaged in such activities; her understanding of internal controls and procedures for financial reporting; and her understanding of audit committee functions. The Audit Committee held five regular meetings in fiscal 2014.
Federated National Holding Company and Subsidiaries
Pursuant to its written charter, the duties and responsibilities of the Audit Committee include, but are not limited to, (a) the appointment of the independent certified public accountants and any termination of such engagement, (b) reviewing the plan and scope of independent audits, (c) reviewing significant accounting and reporting policies and operating controls, (d) having general responsibility for all related auditing and financial statement matters, and (e) reporting its recommendations and findings to the full Board of Directors. The Audit Committee pre-approves all auditing services and permitted non-audit services (including the fees and terms thereof) to be performed by the independent accountants, subject to the de minimus exceptions for non-audit services described in Section 10A(i)(1)(B) of the Exchange Act that are approved by the Audit Committee prior to the completion of the audit.
To ensure prompt handling of unexpected matters, the Audit Committee delegates to the Chair the authority to amend or modify the list of approved permissible non-audit services and fees. The Chair will report action taken to the Audit Committee at the next committee meeting. The Chief Financial Officer is responsible for tracking all independent auditor fees against the budget for such services and reports at least annually to the Audit Committee.
Compensation Committee. As of December 31, 2014, the Company’s Compensation Committee was composed of Bruce F. Simberg (who resigned from the Board on March 4, 2015), Jenifer G. Kimbrough and Richard W. Wilcox, Jr. Each member is independent as defined by the Nasdaq Rules. The Compensation Committee performs the duties and responsibilities pursuant to its charter, which includes reviewing and approving the compensation of the Company's executive officers. During fiscal 2014, the Compensation Committee held four regular meetings, three special meetings and acted on one occasion by written consent.
Nominating Committee. As of December 31, 2014, the Company’s Nominating Committee was composed of Bruce F. Simberg (who resigned from the Board on March 4, 2015), Jenifer G. Kimbrough, Carl Dorf, and Richard W. Wilcox, Jr. Each member is independent as defined by the Nasdaq Rules.
The Nominating Committee will consider candidates for director who are recommended by its members, by other Board members and by management of the Company. The Company is in the process of identifying the experience and skill set best suited to benefit the Company and its shareholders. The Nominating Committee will consider nominees recommended by our shareholders if the shareholder submits the nomination in compliance with the advance notice, information and other requirements described in our bylaws and applicable securities laws. The Nominating Committee evaluates director candidates recommended by shareholders in the same way that it evaluates candidates recommended by its members, other members of the Board, or other persons.
It is the Board’s policy to identify qualified potential candidates without regard to any candidate’s race, color, disability, gender, national origin, religion or creed. In recommending proposed nominees to the full Board, the Nominating Committee is charged with building and maintaining a Board that has an ideal mix of talent and experience to achieve the Company’s business objectives. In particular, the Nominating Committee considers all aspects of a candidate’s qualifications in the context of the needs of the Company at that point in time with a view to creating a Board with a diversity of experience and perspectives. Among the qualifications, qualities and skills of a candidate considered important by the Nominating Committee is a person with strength of character, mature judgment, familiarity with the Company’s business and industry, independence of thought and an ability to work collegially.
Shareholders who wish to recommend nominees to the Nominating Committee should submit their recommendation in writing to the Secretary of the Company at its executive offices pursuant to the requirements contained in Article III, Section 13 of the Company’s Bylaws. This section provides that the notice shall include: (a) as to each person who the shareholder proposed to nominate for election, (i) name, age, business address and residence address of the person, (ii) the principal occupation or employment of the person, (iii) the class and number of shares of capital stock of the Company which are beneficially owned by the person, (iv) the consent of each nominee to serve as a director of the Company if so elected and (v) any other information relating to the person that is required to be disclosed in solicitation for proxies for the election of directors pursuant to Rule 14A under the Exchange Act; and (b) as to the shareholder giving the notice, the name and record address of the shareholder, and (ii) the class and number of shares of capital stock of the Company which are beneficially owned by the shareholder. The Company may require any proposed nominee to furnish such other information as may reasonably be required by the Company to determine the eligibility of such proposed nominee to serve as a director of the Company. To be timely, a shareholder’s notice shall be delivered to or mailed and received at the Company’s principal executive offices not less than 60 days nor more than 90 days prior to the meeting. If we give less than 70 days’ notice or prior public disclosure of the date of the meeting date, however, notice by the shareholder to be timely must be so received not later than the close of business on the tenth day following either the date we publicly announce the date of our annual meeting or the date of mailing of the notice of the meeting, whichever first occurs.
Federated National Holding Company and Subsidiaries
Investment Committee. As of December 31, 2014, the Company’s Investment Committee was composed of Peter J. Prygelski, III, Bruce F. Simberg (who resigned from the Board on March 4, 2015), and Carl Dorf. The Investment Committee manages our investment portfolio pursuant to its adopted Investment Policy Statement. Mr. Dorf serves as the Chairman. During fiscal 2014, the Investment Committee held four regular meetings and two special meetings.
Directors Compensation Committee. As of December 31, 2014, the Company’s Directors Compensation Committee was composed of Michael H. Braun, Bruce F. Simberg (who resigned from the Board on March 4, 2015), and Jenifer G. Kimbrough. The Directors Compensation Committee performs the duties and responsibilities pursuant to its charter, which includes reviewing and recommending the compensation of the Company's independent directors for approval by the full Board of Directors. Mr. Wilcox currently serves as the Chairman. During fiscal 2014, the Directors Compensation Committee held three regular meetings.
Summary Compensation Table
The following table sets forth information regarding compensation earned by, awarded to or paid to our Chief Executive Officer and President, and Chief Financial Officer, for the years ended December 31, 2014 and 2013. We refer to these officers as our Named Executive Officers. We currently do not have any other individual employee of the Company designated as an executive officer.
|
SUMMARY COMPENSATION
|
|||||||||||||||||||||||||||||||||
|
Name and
Principal
Position
|
Year
|
Salary
|
Bonus
|
Stock
Awards
|
Option
Awards
(1)
|
Non-Equity
Incentive Plan Compensation
|
Nonqualified
Deferred Compensation Earnings
|
All Other Compensation
(2)
|
Total
|
||||||||||||||||||||||||
|
Michael H. Braun
Chief Executive Officer, President
|
2014
|
$
|
469,231
|
$
|
8
|
(3)
|
$
|
3,160,092
|
--
|
--
|
--
|
$
|
34,883
|
$
|
3,664,214
|
||||||||||||||||||
|
2013
|
$
|
347,322
|
$
|
72,300
|
$
|
1,141,500
|
--
|
--
|
--
|
$
|
26,665
|
$
|
1,587,787
|
||||||||||||||||||||
|
Peter J. Prygelski, III
Chief Financial Officer, Treasurer
|
2014
|
$
|
297,638
|
$
|
90,015
|
(4)
|
$
|
643,685
|
--
|
--
|
--
|
$
|
39,572
|
$
|
1,070,910
|
||||||||||||||||||
|
2013
|
$
|
249,182
|
$
|
75,000
|
$
|
584,600
|
--
|
--
|
--
|
$
|
30,737
|
$
|
939,519
|
||||||||||||||||||||
| (1) | This amount reflects the aggregate grant date fair value computed in accordance with FASB ASC Topic 718. Assumptions used in the calculation of this amount are included in Footnote 14 to the Company’s audited financial statements for fiscal years ended December 31, 2014 and December 31, 2013, respectively. |
| (2) | See table "All Other Compensation" for an itemized disclosure of this element of compensation. |
| (3) | Mr. Braun elected to receive 100% of his bonus paid in 2014 as restricted stock. The nominal amount shown in the bonus column was payment due to the fractional amount remaining after calculation of his bonus as restricted stock, based on the fair market value of $15.91 per share on the grant date. |
| (4) | Mr. Prygelski elected to receive a portion of his bonus paid in 2014 as cash and the remaining portion as restricted stock, the amount of which was based on the fair market value of $15.91 per share on the grant date. |
|
ALL OTHER COMPENSATION
|
|||||||||||||||||||||
|
Name
|
Year
|
Auto
|
Club Member
Fees
|
Insurance
Benefits (1)
|
Contribution to
401(k) Plan (2)
|
All Other
Compensation
Total
|
|||||||||||||||
|
Michael H. Braun
|
2014
|
$
|
7,998
|
--
|
$
|
9,385
|
$
|
17,500
|
$
|
34,883
|
|||||||||||
|
2013
|
$
|
8,519
|
--
|
$
|
9,221
|
$
|
8,925
|
$
|
26,665
|
||||||||||||
|
Peter J. Prygelski, III
|
2014
|
$
|
6,000
|
$
|
9,228
|
$
|
6,844
|
$
|
17,500
|
$
|
39,572
|
||||||||||
|
2013
|
$
|
6,000
|
$
|
9,225
|
$
|
6,716
|
$
|
8,796
|
$
|
30,737
|
|||||||||||
| (1) | Represents premiums for life, medical and dental insurance. |
| (2) | Represents matching contributions made by the Company on behalf of the Named Executive Officers to the Company’s 401(k) plan. |
Federated National Holding Company and Subsidiaries
Michael H. Braun. We entered into a second amended and restated employment agreement with Michael H. Braun, the Company’s Chief Executive Officer and President, effective as of January 18, 2012, which amends and restates Mr. Braun’s prior employment agreement. Under his agreement, Mr. Braun was entitled to receive an annual salary of $280,000 and a $500 monthly automobile allowance. Mr. Braun’s annual salary, which may be increased at any time during the term of the agreement, was increased to $475,000 effective January 1, 2014. The agreement is for a term of two years, which term shall automatically be extended so that at all times the balance of the term shall not be less than two years unless sooner terminated as provided in the second amended and restated employment agreement. Mr. Braun is also entitled to receive such bonuses and increases as may be awarded by the Board of Directors. It also contains customary confidentiality and non-solicitation provisions. Additionally, we entered into an amended and restated non-competition, non-disclosure and non-solicitation agreement with Mr. Braun effective August 5, 2013. The amended non-compete agreement prohibits Mr. Braun from directly or indirectly competing with us for a period of two years after the termination of his employment for any reason. If Mr. Braun’s employment with the Company is terminated, he is entitled to certain payments described below.
Peter J. Prygelski, III. We entered into a second amended and restated employment agreement with Peter J. Prygelski, III, the Company’s Chief Financial Officer and Treasurer, effective as of January 18, 2012, which amended and restated Mr. Prygelski’s prior employment agreement. Under his agreement, Mr. Prygelski was entitled to receive an annual salary of $223,000 and a $500 monthly automobile allowance. Mr. Prygelski’s annual salary, which may be increased at any time during the term of the agreement, was increased to $300,000 effective January 1, 2014. The agreement is for a term of two years, which term shall automatically be extended so that at all times the balance of the term shall not be less than two years unless sooner terminated as provided in the second amended and restated employment agreement. Mr. Prygelski is also entitled to receive such bonuses and increases as may be awarded by the Board of Directors. It also contains customary confidentiality and non-solicitation provisions. Additionally, we entered into an amended and restated non-competition, non-disclosure and non-solicitation agreement with Mr. Prygelski effective August 5, 2013. The amended non-compete agreement prohibits Mr. Prygelski from directly or indirectly competing with us for a period of two years after the termination of his employment for any reason. If Mr. Prygelski’s employment with the Company is terminated, he is entitled to certain payments described below.
Mr. Braun and Mr. Prygelski are each entitled to receive certain payments upon the termination of employment under certain circumstances as set forth in their respective agreements. If the executive’s employment is terminated by us without Cause (as defined in the respective agreements), we must make a lump sum payment to the executive equal to two years' base salary (the “Termination Severance”). In addition, all unvested stock options and any other equity awards held by him will become vested.
If Mr. Braun’s or Mr. Prygelski’s employment with us is terminated for Cause or as a result of his death or disability, he will be entitled to his base salary prorated through the date of the termination and any benefits due him as may be provided under the applicable plan, program or arrangement.
The agreements also provide for payments to the executives if employed by us on the date on which a Change of Control occurs. Under the agreements, a “Change of Control” will be deemed to have occurred if: (i) any person, including a “group” as defined in Section 13(d)(3) of the Exchange Act, becomes the owner or beneficial owner of our securities having 50% (which was increased from 30% in the agreements in effect during 2011) or more of the combined voting power of our then-outstanding securities that may be voted for the election of our directors (other than as a result of an issuance of securities initiated by us, or open market purchases approved by our Board, as long as the majority of the Board approving the purchases is the majority at the time the purchases are made), or (ii) the persons who were our directors before such transactions shall cease to constitute a majority of our Board, or any successor to us, as the direct or indirect result of or in connection with, any cash tender or exchange offer, merger or other business combination, sale of assets or contested election, or any combination of the foregoing transactions. If, following a Change in Control, Mr. Braun’s or Mr. Prygelski’s employment is terminated by us (or any successor or subsidiary) without Cause or by the executive for Good Reason (as defined in the respective agreements), we will make a lump sum payment to the executive in an amount equal to two times the sum of his base salary in effect immediately prior to the Change of Control plus his actual bonus for the fiscal year immediately preceding the Change of Control (the "Change of Control Severance"). Additionally, all unvested stock options and any other equity awards held by him will become vested and the Company will continue to provide Messrs. Braun and Prygelski (and their families) with medical insurance for a period of two years after the date of such termination of employment at no cost and on the same terms and conditions as in effect on the date on which such termination of employment occurs.
Federated National Holding Company and Subsidiaries
If either Mr. Braun or Mr. Prygelski is terminated by us without Cause prior to a Change of Control, and a Change of Control occurs within six months following such termination, then in addition to the Termination Severance described above, the executive will be entitled to an additional lump sum payment in an amount equal to (i) the Change of Control Severance, less (ii) the Termination Severance.
As a condition to Mr. Braun’s and Mr. Prygelski’s entitlement to receive the base salary amounts and equity award acceleration referenced above, each is bound by the terms of an agreement that sets forth certain restrictive covenants. Pursuant to the non-competition provisions of these agreements, each are prohibited from working in the insurance industry in any territories where the Company has been doing business for a period of one year from the date on which he terminates employment with the Company for any reason (other than without cause). For a period of one year after his employment is terminated, he is also prohibited from soliciting, for himself or for any third person, any employees or former employees of the Company, unless the employees have not been employed by the Company for a period in excess of six months, and from disclosing any confidential information that he learned about the Company during his employment.
Grants of Plan Based Awards
The following table provides information regarding restricted stock granted to Named Executive Officers during 2014 under the Company’s 2012 Stock Incentive Plan:
|
GRANTS OF PLAN-BASED AWARDS
|
|||||||||||||
|
Name
|
Grant Date
|
All Other Equity Awards / Number
of Securities Underlying Options
|
Exercise or Base
Price of Equity
Awards
|
Grant Date Fair Value of
Equity Awards (1)
|
|||||||||
|
Michael H. Braun
|
3/4/2014
|
43,997
|
$
|
15.91
|
$
|
699,992
|
|||||||
|
9/9/2014
|
45,000
|
$
|
25.58
|
$
|
1,151,100
|
||||||||
|
12/9/2014
|
50,000
|
$
|
26.18
|
$
|
1,309,000
|
||||||||
|
Peter J. Prygelski, III
|
3/4/2014
|
16,341
|
$
|
15.91
|
$
|
259,985
|
|||||||
|
9/9/2014
|
15,000
|
$
|
25.58
|
$
|
383,700
|
||||||||
| (1) | This amount reflects the aggregate grant date fair value computed in accordance with FASB ASC Topic 718. Assumptions used in the calculation of this amount are included in Footnote 14 to the Company’s audited financial statements for fiscal year ended December 31, 2014, included in Part II, Item 8, of this Report. |
Stock Incentive Plans
Our Amended and Restated 2012 Stock Incentive Plan (the “2012 Plan”) is administered by the Compensation Committee (the “Committee”). The objectives of the 2012 Plan include attracting, motivating and retaining key personnel and promoting our success by linking the interests of our employees, directors and consultants with our success.
Awards may be made under the 2012 Plan in the form of (a) incentive stock options, (b) non-qualified stock options, (c) stock appreciation rights, (d) dividend equivalent rights, (e) restricted stock, (f) unrestricted stock, (g) restricted stock units, and (h) performance shares. No incentive stock option may be granted to a person who is not an employee of the Company or one of its subsidiaries on the date of grant. In addition, both incentive stock options and non-statutory stock options were granted under our 1998 and 2002 stock option plans, both of which have expired, although as of December 31, 2014 certain options remain outstanding under the 2002 plan.
Options Available for Issuance. As of December 31, 2014, all 900,000 shares of common stock authorized for issuance upon exercise of options granted under the 1998 plan and 1,800,000 total shares authorized for issuance under the 2002 plan have been issued or are issuable upon exercise of outstanding options. There were, as of December 31, 2014, 483,211 shares remaining available to be awarded under the 2012 Plan. The shares to be delivered upon exercise of options or awards will be made available, at the discretion of the Committee, from authorized but unissued shares or outstanding options or awards that expire or are cancelled. If shares covered by an option or award cease to be issuable for any reason, such number of shares will no longer count against the shares authorized under the plan and may again be granted under the 2012 Plan.
Term of Options. The term of each outstanding option granted to our officers and employees is currently 10 years.
Federated National Holding Company and Subsidiaries
Vesting Schedule. Options or awards granted under our stock plans, unless waived or modified in a particular option agreement or by action of the Committees, typically vest according to one of the following schedules:
|
Vesting Schedule
|
||||
|
From the Grant Date
|
Portion of Grant Vested
|
|||
|
Less than 1 year
|
0
|
%
|
||
|
1 year
|
33 1/3
|
%
|
||
|
2 years
|
33 1/3
|
%
|
||
|
3 years
|
33 1/3
|
%
|
||
|
or
|
||||
|
Less than 1 year
|
0
|
%
|
||
|
1 year
|
20
|
%
|
||
|
2 years
|
20
|
%
|
||
|
3 years
|
20
|
%
|
||
|
4 years
|
20
|
%
|
||
|
5 years
|
20
|
%
|
||
Options or awards granted under the stock plans require that the recipient of a grant be continuously employed or otherwise provide services to us or our subsidiaries. Failure to be continuously employed or in another service relationship generally results in the forfeiture of options or awards not vested at the time the employment or other service relationship ends. Termination of a recipient’s employment or other service relationship for cause generally results in the forfeiture of all of the recipient’s unexercised options or awards.
Adjustments in Our Capital Structure. The number and kind of shares available for grants under our stock plans and any outstanding options or awards under the plans, as well as the exercise price of outstanding options or awards, will be subject to adjustment by the Committee in the event of any merger, consolidation, reorganization, stock split, stock dividend or other event causing a capital adjustment affecting the number of outstanding shares of common stock. In the event of a business combination or in the event of a sale of all or substantially all of our assets, the Committee may cash out some or all of the unexercised, vested options or awards under the plan, or allow some or all of the options or awards to remain outstanding, subject to certain conditions. Unless otherwise provided in individual option agreements, the vesting of outstanding options or awards will not accelerate in connection with a business combination or in the event of a sale of all or substantially all of our assets.
Administration. The Committee has full discretionary authority to determine all matters relating to options and awards granted under the stock plans, including the persons eligible to receive options or awards, the number of shares subject to each option or award, the exercise price of each option or award, any vesting schedule, any acceleration of the vesting schedule and any extension of the exercise period. The Committee has granted limited authority to executive management members to grant awards to eligible individuals.
Amendment and Termination. Our Board of Directors has authority to suspend, amend or terminate the 2012 Plan, except as would adversely affect participants rights to outstanding awards without their consent. The 2012 Plan was amended and restated in March 2013 to clarify the plan administrator’s authority to permit the vesting of unvested restricted shares in the event of the death of the grantee. As the plan administrator, our Committee has the authority to interpret the plans and options or awards granted under the stock plans and to make all other determinations necessary or advisable for plan administration.
Federated National Holding Company and Subsidiaries
Outstanding Equity Awards at Fiscal Year-End
The following table summarizes the equity awards held by our Chief Executive Officer and President, and our Chief Financial Officer, as of December 31, 2014.
|
Stock Option Awards
|
Equity Awards
|
||||||||||||||||||||||||||||||
|
Name
|
Number of
Securities
Underlying
Exercisable
Options (#)
|
Number of
Securities
Underlying
Unexercisable
Options (#)
|
Option
Exercise
Price ($)
|
Option
Expiration
Date
|
Shares That
Have Not
Vested (#)
|
Market Value of
Shares That Have Not
Vested ($)(1)
|
Equity
Exercise
Price
($)
|
Equity
Expiration
Date
|
|||||||||||||||||||||||
|
Michael H. Braun
|
12,000
|
3,000
|
4.36
|
03/03/2020 (2)
|
|||||||||||||||||||||||||||
|
10,000
|
--
|
2.45
|
08/22/2021 (3)
|
||||||||||||||||||||||||||||
|
10,000
|
5,000
|
4.40
|
04/06/2022 (4)
|
||||||||||||||||||||||||||||
|
16,666
|
$
|
402,651
|
--
|
--
|
(5)
|
||||||||||||||||||||||||||
|
80,000
|
$
|
1,932,800
|
--
|
--
|
(6)
|
||||||||||||||||||||||||||
|
43,997
|
$
|
1,062,968
|
--
|
--
|
(7)
|
||||||||||||||||||||||||||
|
45,000
|
$
|
1,087,200
|
--
|
--
|
(8)
|
||||||||||||||||||||||||||
|
50,000
|
$
|
1,208,000
|
--
|
--
|
(9)
|
||||||||||||||||||||||||||
|
Peter J. Prygelski, III
|
9,000
|
6,000
|
4.36
|
03/03/2020 (2)
|
|||||||||||||||||||||||||||
|
6,667
|
3,333
|
2.45
|
08/22/2021 (3)
|
||||||||||||||||||||||||||||
|
5,000
|
10,000
|
4.40
|
04/06/2022 (4)
|
||||||||||||||||||||||||||||
|
15,000
|
$
|
241,600
|
--
|
--
|
(5)
|
||||||||||||||||||||||||||
|
50,000
|
$
|
966,400
|
--
|
--
|
(6)
|
||||||||||||||||||||||||||
|
16,341
|
$
|
394,799
|
--
|
--
|
(7)
|
||||||||||||||||||||||||||
|
15,000
|
$
|
362,400
|
--
|
--
|
(8)
|
||||||||||||||||||||||||||
| (1) | Based on the market value of $24.16 on December 31, 2014. |
| (2) | Options vested as to 80% of the underlying shares on December 31, 2014, the remaining 20% vest on 3/3/2015. |
| (3) | Options vested as to 100% of the underlying shares on December 31, 2014. |
| (4) | Options vested as to 66 2/3% of the underlying shares on December 31, 2014, the remaining 33 1/3% vest on 4/6/2015. |
| (5) | Restricted stock vested as to 0% on December 31, 2014, the remaining 100% vest as follows: 50% on 3/4/2015 and 50% on 3/4/2016. |
| (6) | Restricted stock vested as to 0% on December 31, 2014, the remaining 100% vest as follows: 25% on 8/5/2015, 25% on 8/5/2016, 25% on 8/5/2017 and 25% on 8/5 2018. |
| (7) | Restricted stock vested as to 0% on December 31, 2014, the remaining 100% vest as follows: 33 1/3% on 3/4/2015, 33 1/3% on 3/4/2016, and 33 1/3% on 3/4/2017. |
| (8) | Restricted stock vested as to 0% on December 31, 2014, the remaining 100% vest as follows: 20% on 9/9/2015, 20% on 9/9/2016, 20% on 9/9/2017, 20% on 9/9/2018 and 20% on 9/9/2019. |
| (9) | Restricted stock vested as to 0% on December 31, 2014, the remaining 100% vest as follows: 20% on 12/9/2015, 20% on 12/9/2016, 20% on 12/9/2017, 20% on 12/9/2018 and 20% on 12/9/2019. |
Federated National Holding Company and Subsidiaries
Option Exercises and Stock Vested
The following table sets forth certain information with respect to stock options exercised and equity awards vested during calendar year 2014 by the Named Executive Officers.
|
Stock Option Awards
|
Equity Awards
|
|||||||||||||||
|
Name
|
Shares acquired on
Exercise (#)
|
Value Realized on
Exercise ($)
|
Shares Acquired on
Vesting (#)
|
Value Realized on
Vesting ($)
|
||||||||||||
|
Michael H. Braun
|
40,000
|
$
|
625,200
|
--
|
--
|
|||||||||||
|
500
|
$
|
10,190
|
--
|
--
|
||||||||||||
|
40,000
|
$
|
809,600
|
--
|
--
|
||||||||||||
|
--
|
--
|
8,334
|
$
|
132,594
|
||||||||||||
|
--
|
--
|
20,000
|
$
|
418,400
|
||||||||||||
|
Peter J. Prygelski, III
|
10,000
|
$
|
152,200
|
--
|
--
|
|||||||||||
|
500
|
$
|
9,475
|
--
|
--
|
||||||||||||
|
--
|
--
|
5,000
|
$
|
79,550
|
||||||||||||
|
--
|
--
|
10,000
|
$
|
209,200
|
||||||||||||
Pension Benefits and Other Nonqualified Deferred Compensation
None of our Named Executive Officers participate in or have account balances in qualified or non-qualified defined benefit or contribution plans or other deferred compensation plans maintained by us. The Compensation Committee, which is composed solely of outside directors as defined for purposes of Section 162(m) of the Internal Revenue Code, may elect to provide our officers and other employees with qualified or non-qualified defined benefit or contribution or other deferred compensation benefits if the Compensation Committee determines that doing so is in our best interests.
Director Compensation
During 2014, we had five non-employee directors that qualified for compensation. Members of our Board of Directors who are also executive officers do not receive additional compensation for service on the Board. Non-employee directors receive an initial stock option or equity grant upon appointment to the Board of Directors and subsequent option or equity grants as may be granted at the discretion of the Board. In addition, non-employee directors receive annual cash compensation and reimbursement of actual out-of-pocket expenses. During 2014, the non-employee directors received an annual retainer of $60,000, payable in quarterly installments of $15,000 in January, April, and July and October.
In September 2014, the Directors Compensation Committee recommended, and the Board approved, an increase of the annual retainer to $75,000 effective October 1, 2014. In addition, the Directors Compensation Committee recommended, and the Board approved, increases of the additional annual fees paid to each committee chairperson and the Chairman of the Board effective October 1, 2014. The additional annual fee payable to Chairman of the Board was increased to $40,000; the additional annual fee payable to the chairperson of the Audit Committee was increased to $20,000; and the additional annual fees payable to the chairpersons of the other Board committees were increased to $17,500 for the Investment Committee and $15,000 for the Compensation Committee. There are currently no additional fees paid to the chairperson of the Directors Compensation Committee.
The Compensation Committee engaged the independent executive compensation consulting firm of Pearl Meyer & Partners (“Pearl Meyer”) in 2012 to review the structure and competitiveness of the Company’s executive officer and director compensation. The Directors Compensation Committee reviewed the 2012 report prepared by Pearl Meyer for guidance with respect to the Board fees paid to other non-employee directors at companies similar in size and structure to the Company, and determined to increase Board fees gradually over time so as to achieve a Board fee level commensurate with other companies. Pearl Meyer provided no services to the Company in 2014. The Directors Compensation Committee may use the services of compensation consultants in the future to assist it in providing a fair and competitive compensation plan for its directors.
Federated National Holding Company and Subsidiaries
Historically, the Company granted stock-based incentives to our non-employee directors as part of their compensation. Cash compensation paid to, and the dollar value of equity awards granted to, our non-employee directors in 2014 are shown in the table below.
|
NON-EMPLOYEE DIRECTORS' COMPENSATION SUMMARY
|
||||||||||||||||||||||||||||
|
Name
|
Fees
Earned or
Paid in
Cash
|
Equity
(Restricted
Stock)
Awards (1)
|
Stock
Option
Awards
(1)
|
Non-Equity
Incentive Plan
Compensation
|
Non-Qualified
Deferred
Compensation
Earnings
|
All Other
Compensation
|
Total
|
|||||||||||||||||||||
|
Carl Dorf
|
$
|
78,625
|
$
|
305,789
|
--
|
--
|
--
|
--
|
$
|
384,414
|
||||||||||||||||||
|
Bruce F. Simberg (2)
|
$
|
100,000
|
$
|
561,589
|
--
|
--
|
--
|
--
|
$
|
661,589
|
||||||||||||||||||
|
Richard W. Wilcox, Jr.
|
$
|
63,750
|
$
|
305,789
|
--
|
--
|
--
|
$
|
700
|
(3)
|
$
|
370,239
|
||||||||||||||||
|
Jenifer G. Kimbrough
|
$
|
80,750
|
$
|
305,789
|
--
|
--
|
--
|
--
|
$
|
386,539
|
||||||||||||||||||
|
Charles B. Hart, Jr. (4)
|
$
|
54,750
|
$
|
49,989
|
--
|
--
|
--
|
$
|
350
|
(3)
|
$
|
105,089
|
||||||||||||||||
|
(1)
|
The following table provides certain additional information concerning the currently outstanding stock options and/or equity awards held by our non-employee directors as of the end of 2014:
|
|
Name
|
Total Stock
Option/Equity Awards
Outstanding at 2014
Fiscal Year End
(Shares)
|
Stock Option / Equity
Awards Granted
During Fiscal Year
2014 (Shares)
|
Grant Date Fair Value of
Equity Awards Granted
During Fiscal Year 2014 ($)
|
|||||||||
|
3,142
|
$
|
49,989
|
(b)
|
|||||||||
|
Carl Dorf
|
40,808
|
(a)
|
10,000
|
$
|
255,800
|
(c)
|
||||||
|
3,142
|
$
|
49,989
|
(b)
|
|||||||||
|
Bruce F. Simberg
|
30,808
|
(d)
|
20,000
|
$
|
511,600
|
(c)
|
||||||
|
3,142
|
$
|
49,989
|
(b)
|
|||||||||
|
Richard W. Wilcox, Jr.
|
20,808
|
(e)
|
10,000
|
$
|
255,800
|
(c)
|
||||||
|
3,142
|
$
|
49,989
|
(b)
|
|||||||||
|
Jenifer G. Kimbrough
|
36,142
|
(f)
|
10,000
|
$
|
255,800
|
(c)
|
||||||
|
Charles B. Hart, Jr.
|
0
|
3,142
|
$
|
49,989
|
(b)
|
|||||||
| (a) | Includes 10,000 options granted on 8/22/2011 with an exercise price of $2.45, vest 33 1/3% per year, and expire on 8/22/2021; 15,000 options granted on 4/6/2012 with an exercise price of $4.40, vest 33 1/3% per year, and expire on 4/6/2022; 2,666 shares of restricted stock which originally vested 33 1/3 per year; 3,142 shares of restricted stock which vest 33 1/3% per year; and 10,000 shares of restricted stock which vest 20% per year. |
| (b) | Based on the market value of $15.91 on March 4, 2014. |
| (c) | Based on the market value of $25.58 on September 9, 2014. |
| (d) | Includes 5,000 options granted on 4/6/2012 with an exercise price of $4.40, vest 33 1/3% per year, and expire on 4/6/2022; 2,666 shares of restricted stock which originally vest 33 1/3 per year; 3,142 shares of restricted stock which vest 33 1/3% per year; and 20,000 shares of restricted stock which vest 20% per year. Mr. Simberg resigned as a director of the Company on March 4, 2015. The Board approved the vesting of 2,381 shares that would have vested on that date. |
| (e) | Includes 5,000 options granted on 4/6/2012 with an exercise price of $4.40, vest 33 1/3% per year, and expire on 4/6/2022; 2,666 shares of restricted stock which originally vested 33 1/3 per year; 3,142 shares of restricted stock which vest 33 1/3% per year; and 10,000 shares of restricted stock which vest 20% per year. |
| (f) | Includes 2,000 options granted on 4/1/2009 with an exercise price of $3.30, vest 20% per year and expire on 4/1/2015; 3,334 options granted on 8/22/2011 with an exercise price of $2.45, vest 33 1/3% per year, and expire on 8/22/2021; 15,000 options granted on 4/6/2012 with an exercise price of $4.40, vest 33 1/3% per year, and expire on 4/6/2022; 2,666 shares of restricted stock which originally vested 33 1/3 per year; 3,142 shares of restricted stock which vest 33 1/3% per year; and 10,000 shares of restricted stock which vest 20% per year. |
|
(2)
|
Mr. Simberg resigned as a director of the Company on March 4, 2015.
|
|
(3)
|
Includes fair value for events attended by director in 2014.
|
|
(4)
|
Mr. Hart’s service as a director ceased upon his death on July 2, 2014.
|
Federated National Holding Company and Subsidiaries
| ITEM 12 | SECURITY OWNERSHIP OF CERTAIN BENEFICIAL OWNERS AND MANAGEMENT AND RELATED STOCKHOLDER MATTERS |
The following table sets forth, as of March 16, 2015, information with respect to the beneficial ownership of our common stock by (i) each person who is known by us to beneficially own 5% or more of our outstanding common stock, (ii) each of our executive officers named in the Summary Compensation Table in the section “Executive Compensation,” (iii) each of our directors, and (iv) all directors and executive officers as a group.
As used herein, the term “beneficial ownership” with respect to a security is defined by Rule 13d-3 under the Exchange Act as consisting of sole or shared voting power (including the power to vote or direct the vote) and/or sole or shared investment power (including the power to dispose or direct the disposition of) with respect to the security through any contract, arrangement, understanding, relationship or otherwise, including a right to acquire such power(s) during the next 60 days. Unless otherwise noted, beneficial ownership consists of sole ownership, voting and investment rights and the address for each person is c/o Federated National Holding Company, 14050 NW 14 Street, Suite 180, Sunrise, Florida 33323.
|
Name and Address of Beneficial Owner
|
Number of Shares
Beneficially
Owned
|
Percent of
Class
Outstanding (1)
|
||||||
|
Michael H. Braun (2)
|
377,175
|
2.66
|
%
|
|||||
|
Richard W. Wilcox, Jr. (4)
|
182,476
|
1.29
|
%
|
|||||
|
Carl Dorf (3)
|
173,341
|
1.22
|
%
|
|||||
|
Peter J. Prygelski, III (5)
|
148,557
|
1.05
|
%
|
|||||
|
Jenifer G. Kimbrough (6)
|
35,336
|
*
|
||||||
|
All directors and executive officers as a group (five persons) (7)
|
539,710
|
3.78
|
%
|
|||||
|
5% or greater holders:
|
||||||||
|
Dimensional Fund Advisors LP (8)
|
725,649
|
5.13
|
%
|
|||||
|
Palisades West, Building One
|
||||||||
|
6300 Bee Cave Road
|
||||||||
|
Austin, TX 78746
|
||||||||
|
BlackRock, Inc. (9)
|
903,938
|
6.39
|
%
|
|||||
|
55 East 52nd Street
|
||||||||
|
New York, NY 10022
|
||||||||
* Less than 1%.
| (1) | Based on 14,155,256 shares outstanding as of March 10, 2015. |
| (2) | Includes 8,333 shares of restricted stock, which began vesting over three years beginning on March 4, 2014, 80,000 shares of restricted stock, which began vesting over five years beginning on August 5, 2014, 29,331 shares of restricted stock, which began vesting over three years beginning on March 4, 2015, 45,000 shares of restricted stock, 20% of which vest each year beginning on September 9, 2015, 50,000 shares of restricted stock, 20% of which vest each year beginning on December 9, 2015, 32,997 shares of restricted stock, 33 1/3% of which vest each year beginning on March 10, 2016 and 40,000 shares of common stock issuable upon the exercise of vested stock options held by Mr. Braun. |
| (3) | Includes 63,491 shares of common stock held by Dorf Trust, 59,624 shares of common stock held by Carl Dorf Rollover IRA, 1,333 shares of restricted stock, which began vesting over three years beginning on March 4, 2014, 2,094 shares of restricted stock, which began vesting over three years beginning on March 4, 2015, 10,000 shares of restricted stock, 20% of which vest each year beginning on September 9, 2015, 2,084 shares of restricted stock, 33 1/3% of which vest each year beginning on March 10, 2016 and 25,000 shares of common stock issuable upon the exercise of vested stock options held by Mr. Dorf. |
| (4) | Includes 3,000 shares of common stock held in Mr. Wilcox’s IRA, 40,000 shares of common stock held by Mr. Wilcox’s spouse, 1,333 shares of restricted stock, which began vesting over three years beginning on March 4, 2014, 2,094 shares of restricted stock, which began vesting over three years beginning on March 4, 2015, 10,000 shares of restricted stock, 20% of which vest each year beginning on September 9, 2015, 2,084 shares of restricted stock, 33 1/3% of which vest each year beginning on March 10, 2016 and 5,000 shares of common stock issuable upon the exercise of vested stock options held by Mr. Wilcox. |
Federated National Holding Company and Subsidiaries
| (5) | Includes 4,000 shares of common stock held in Mr. Prygelski’s IRA, 5,000 shares of restricted stock, which began vesting over three years beginning on March 4, 2014, 40,000 shares of restricted stock, which began vesting over five years beginning on August 5, 2014, 10,894 shares of restricted stock, which began vesting over three years beginning on March 4, 2015, 15,000 shares of restricted stock, 20% of which will vest each year beginning on September 9, 2015, 9,551 shares of restricted stock, 33 1/3% of which vest each year beginning on March 10, 2016 and 40,000 shares of common stock issuable upon the exercise of vested stock options held by Mr. Prygelski. |
| (6) | Includes 1,333 shares of restricted stock, which began vesting over three years beginning on March 4, 2014, 2,094 shares of restricted stock, which began vesting over three years beginning on March 4, 2015, 10,000 shares of restricted stock, 20% of which vest each year beginning on September 9, 2015, 2,084 shares of restricted stock, 33 1/3% of which vest each year beginning on March 10, 2016 and 15,000 shares of common stock issuable upon the exercise of vested stock options held by Ms. Kimbrough. |
| (7) | Includes 17,332 shares of restricted stock, which began vesting over three years beginning on March 4, 2014, 120,000 shares of restricted stock, which began vesting over five years beginning on August 5, 2014, 46,507 shares of restricted stock, which began vesting over three years beginning on March 4, 2015, 90,000 shares of restricted stock, 20% of which vest each year beginning on September 9, 2015, 50,000 shares of restricted stock, 20% of which vest each year beginning on December 9, 2015, 48,800 shares of restricted stock, of which 33 1/3% vest each year beginning on March 10, 2016 and 125,000 shares of common stock issuable upon the exercise of vested stock options. |
| (8) | This information is based on an Amendment No. 5 to Schedule 13G filed with the SEC on February 5, 2015. |
| (9) | This information is based on the Schedule 13G filed with the SEC on February 2, 2015. |
Family Relationships
There are no family relationships between or among our current executive officers and directors.
Related Transactions
The following is a summary of transactions during 2013 and 2014 between the Company and its executive officers, directors, nominees for director, principal shareholders and other related parties involving amounts in excess of $120,000 or that the Company has chosen to voluntarily disclose.
Bruce F. Simberg, a director of the Company until March 4, 2015, is a partner of the Fort Lauderdale, Florida law firm of Conroy, Simberg, which renders legal services to the Company. The Company paid legal fees to Conroy, Simberg for services rendered in the amount of approximately $36,400 and $6,538 in 2013 and 2014, respectively. We believe that the fees charged for services provided by Conroy, Simberg are on terms at least as favorable as those that we could secure from a non-affiliated law firm.
During 2013 and 2014, Michael H. Braun, the Company’s Chief Executive Officer and President, received the compensation described in "Executive Compensation" on pages 119 through 125 of this report. Mr. Braun’s brother received salary compensation of $136,000 and $137,412 for his services as the Vice President of Accounting and Finance in 2013 and 2014, respectively. We believe that the compensation provided to this individual is comparable to that paid by other companies in our industry and market for similar positions.
We have adopted a written policy that any transactions between the Company and executive officers, directors, principal shareholders or their affiliates take place on an arm’s-length basis and require the approval of a majority of our independent directors, as defined in the Nasdaq Rules.
The Audit Committee selected De Meo Young McGrath (“De Meo”) as the independent registered public accounting firm to perform the audit of the Company’s consolidated financial statements and management’s assessment of the effectiveness of internal control over financial reporting for the 2014 fiscal year. Effective January 1, 2014, De Meo merged with Goldstein Schechter Koch, P.A. (“GSK”). GSK is the surviving firm and continues to practice under that name. As a result of the merger, De Meo effectively resigned as the Company’s independent registered public accounting firm and GSK, as the successor to De Meo following the merger, became the Company’s independent registered public accounting firm. The engagement of GSK was approved by the Audit Committee of the Company’s Board of Directors on January 15, 2014. As a result, the reports previously issued by De Meo with respect to the Company will be reissued by, and any consent to the use of such reports will be issued by, GSK.
Federated National Holding Company and Subsidiaries
Our Audit Committee requires that management obtain the prior approval of the Audit Committee for all audit and permissible non-audited services to be provided by GSK. The Audit Committee considers and approves at each meeting, as needed, anticipated audit and permissible non-audit services to be provided by GSK during the year and estimated fees. The Audit Committee Chairman may approve permissible non-audit services with subsequent notification to the full Audit Committee. All services rendered to us by De Meo in 2014 were pre-approved in accordance with these procedures.
The Company’s independent auditors for the 2014 fiscal year, GSK, as successor to De Meo, has advised the Company that neither it, nor any of its members, has any direct financial interest in the Company as a promoter, underwriter, voting trustee, director, officer or employee. All professional services rendered by De Meo during the fiscal year ended December 31, 2014 were furnished at customary rates and were performed by full-time, permanent employees.
The following table shows fees that we paid (or accrued) for professional services rendered by De Meo for fiscal 2014 and 2013.
|
Fiscal 2014
|
Fiscal 2013
|
|||||||
|
Audit Fees (1)
|
$
|
568,519
|
$
|
368,213
|
||||
|
Audit-Related Fees (2)
|
$
|
31,040
|
$
|
14,823
|
||||
|
Total
|
$
|
599,559
|
$
|
383,036
|
||||
| (1) | Audit fees consisted of audit work performed in the preparation of financial statements, as well as work generally only the independent auditor can reasonably be expected to provide, such as statutory audits. |
| (2) | Audit-related fees consisted primarily of audits of employee benefit plans and special procedures related to regulatory filings in 2014 and 2013. |
Federated National Holding Company and Subsidiaries
|
(a)
|
The following documents are filed as part of this report.
|
| (1) | Financial Statements |
The following consolidated financial statements of the Company and the reports of independent auditors thereon are filed with this report:
Independent Auditors’ Report (Goldstein Schechter Koch, P.A.)
Consolidated Balance Sheets as of December 31, 2014 and 2013
Consolidated Statements of Operations for the years ended December 31, 2014, 2013 and 2012.
Consolidated Statements of Comprehensive Income for the years ended December 31, 2014, 2013 and 2012.
Consolidated Statements of Shareholders’ Equity and Comprehensive Income for the years ended December 31, 2014, 2013 and 2012.
Consolidated Statements of Cash Flows for the years ended December 31, 2014, 2013 and 2012.
Notes to Consolidated Financial Statements for the years ended December 31, 2014, 2013 and 2012.
| (2) | Financial Statement Schedules. |
Schedule VI, Supplemental information concerning property-casualty insurance operations, is included herein under Item 8, Financial Statements and Supplementary Data.
| (3) | Exhibits. |
Federated National Holding Company and Subsidiaries
|
Exhibit
|
Description
|
|
3.1
|
Amended and Restated Articles of Incorporation (incorporated by reference to Exhibit 3.1 in the Company’s Registration Statement on Form SB-2 filed with the SEC on September 17, 1998 [File No. 333-63623]).
|
|
3.2
|
Amended and Restated Articles of Incorporation, as amended (incorporated by reference to Exhibit 3.1 in the Company’s Current Report on Form 8-K filed with the SEC on September 12, 2012 and Exhibit 3.1 in the Company’s Quarterly Report on Form 10-Q for the quarter ended September 30, 2012 filed with the SEC on November 14, 2012).
|
|
3.3
|
Amended and Restated Bylaws of the Company (incorporated by reference to Exhibit 10.1 in the Company’s Current Report on Form 8-K filed with the SEC on November 28, 2007).
|
|
4.1
|
Specimen of Common Stock Certificate (incorporated by reference to Exhibit 4.1 in Amendment No. 1 to the Company’s Registration Statement on Form SB-2 filed with the SEC on October 7, 1998 [File No. 333-63623]).
|
|
10.1
|
Amended and Restated 2012 Stock Incentive Plan (incorporated by reference to Exhibit 10.3 in the Company’s Annual Report on Form 10-K for the year ended December 31,2012 filed with the SEC on April 1, 2013).+
|
|
10.2
|
Form of Restricted Stock Agreement between the Company and individuals awarded restricted stock from the 2012 Stock Incentive Plan, as amended (incorporated by reference to Exhibit 10.1 in the Company’s Current Report on Form 8-K filed with the SEC on March 8, 2012).+
|
|
10.3
|
Federated National Holding Company 2002 Stock Option Plan, as amended, and Stock Plan Acknowledgment (incorporated by reference to Annex A in the Company’s Definitive Proxy Statement for its 2009 Annual Meeting of Stockholders filed with the SEC on April 2, 2009).+
|
|
10.4
|
Federated National Holding Company 1998 Stock Option Plan, as amended, and Stock Plan Acknowledgment (incorporated by reference to Annex A in the Company’s Definitive Proxy Statement filed with the SEC on May 12, 2000).+
|
|
10.5
|
Form of Indemnification Agreement between the Company and its directors and executive officers (incorporated by reference from Exhibit 10.15 in the Company’s Annual Report on Form 10-K for its year ended December 31, 1007 filed with the SEC on March 17, 2008).
|
|
10.6
|
Consent Order for Case Number 114165-10-CO between Federated National Insurance Company, American Vehicle Insurance Company, 21st Century Holding Company and the Florida Office of Insurance Regulation filed January 25, 2011 to approve of the merger of Federated National Insurance Company with and into American Vehicle Insurance Company (incorporated by reference to Exhibit 10.1 in the Company’s Current Report on Form 8-K filed with the SEC on January 27, 2011).
|
|
10.7
|
Amended Consent Order dated February 5, 2013 between the Florida Office of Insurance Regulation and Federated National Insurance Company (incorporated by reference to Exhibit 10.1 in the Company’s Current Report on Form 8-K filed with the SEC on February 8, 2013).
|
|
10.8
|
Reimbursement Contract between Federated National Insurance Company and The State Board of Administration of Florida (SBA) which administers the Florida Hurricane Catastrophe Fund (FHCF) effective June 1, 2014 (incorporated by reference to Exhibit 10.1 in the Company’s Current Report on Form 8-K filed with the SEC on February 28, 2014).
|
|
10.9
|
Excess Catastrophe Reinsurance Contract, effective July 1, 2014, between Federated National Insurance Company and subscribing reinsurers (incorporated by reference from Exhibit 10.1 in the Company’s Quarterly Report on Form 10-Q for its quarter ended September 30, 2014 filed with the SEC on November 10, 2014).
|
|
10.10
|
Reinstatement Premium Protection Reinsurance Contract, effective July 1, 2014, between Federated National Insurance Company and subscribing reinsurers (incorporated by reference from Exhibit 10.2 in the Company’s Quarterly Report on Form 10-Q for its quarter ended September 30, 2014 filed with the SEC on November 10, 2014).
|
Federated National Holding Company and Subsidiaries
|
10.11
|
Homeowners Quota Share Reinsurance Contract, effective July 1, 2014 between Federated National Insurance Company and subscribing reinsurers (incorporated by reference from Exhibit 10.3 in the Company’s Quarterly Report on Form 10-Q for its quarter ended September 30, 2014 filed with the SEC on November 10, 2014).
|
|
10.12
|
Property Catastrophe Excess of Loss (Louisiana Only) Reinsurance Contract, effective July 1, 2014 between Federated National Insurance Company and subscribing reinsurers (incorporated by reference from Exhibit 10.4 in the Company’s Quarterly Report on Form 10-Q for its quarter ended September 30, 2014 filed with the SEC on November 10, 2014).
|
|
10.13
|
Reinstatement Premium Protection Reinsurance Contract (Louisiana Only), effective July 1, 2014 between Federated National Insurance Company and subscribing reinsurers (incorporated by reference from Exhibit 10.5 in the Company’s Quarterly Report on Form 10-Q for its quarter ended September 30, 2014 filed with the SEC on November 10, 2014).
|
|
10.14
|
Second Amended and Restated Employment Agreement dated January 18, 2012 between the Company and Michael H. Braun (incorporated by reference to Exhibit 10.1 in the Company’s Current Report on Form 8-K filed with the SEC on January 20, 2012).+
|
|
10.15
|
Second Amended and Restated Employment Agreement dated January 18, 2012 between the Company and Peter J. Prygelski, III (incorporated by reference to Exhibit 10.2 in the Company’s Current Report on Form 8-K filed with the SEC on January 20, 2012).+
|
|
10.16
|
Form of Amended and Restated Non-Competition, Non-Disclosure and Non-Solicitation Agreement between the Company and certain employees of the Company (incorporated by reference to Exhibit 10.1 in the Company’s Current Report on Form 8-K filed with the SEC on August 7, 2013).+
|
|
10.17
|
Insurance Agency Master Agreement dated February 4, 2013 between Ivantage Select Agency, Inc. and Federated National Underwriters, Inc. (incorporated by reference from Exhibit 10.5 in the Company’s Quarterly Report on Form 10-Q for its quarter ended September 30, 2013 filed with the SEC on November 6, 2013).
|
|
10.18
|
First Amendment to Insurance Agency Master Agreement dated February 12, 2013 between Ivantage Select Agency, Inc. and Federated National Underwriters, Inc. (incorporated by reference from Exhibit 10.6 in the Company’s Quarterly Report on Form 10-Q for its quarter ended September 30, 2013 filed with the SEC on November 6, 2013).
|
|
10.19
|
Reimbursement Contract between Federated National Insurance Company and The State Board of Administration of Florida (SBA) which administers the Florida Hurricane Catastrophe Fund (FHCF) effective June 1, 2015 (incorporated by reference to Exhibit 10.1 in the Company’s Current Report on Form 8-K filed with the SEC on February 23, 2015).
|
|
10.20
|
Subscription Agreement, effective as of July 18, 2014, among C.A. Bancorp Inc., Federated National Holding Company, and Transatlantic Reinsurance Company (incorporated by reference from Exhibit 10.6 in the Company’s Quarterly Report on Form 10-Q for its quarter ended September 30, 2014 filed with the SEC on November 10, 2014).
|
|
21.1
|
Subsidiaries of the Company *
|
|
23.1
|
Consent of Goldstein, Schechter, Koch, P.A. Independent Certified Public Accountants *
|
|
31.1
|
Certification of Chief Executive Officer pursuant to Section 302 of the Sarbanes-Oxley Act *
|
|
31.2
|
Certification of Chief Financial Officer pursuant to Section 302 of the Sarbanes-Oxley Act *
|
|
32.1
|
Certification of Chief Executive Officer pursuant to Section 906 of the Sarbanes-Oxley Act *
|
|
32.2
|
Certification of Chief Financial Officer pursuant to Section 906 of the Sarbanes-Oxley Act *
|
|
101.INS-XBRL Instance Document. **
|
|
101.SCH-XBRL Taxonomy Extension Schema Document. **
|
Federated National Holding Company and Subsidiaries
|
101.CAL-XBRL Taxonomy Extension Calculation Linkbase Document. **
|
|
101.LAB-XBRL Taxonomy Extension Label Linkbase Document. **
|
|
101.PRE-XBRL Taxonomy Extension Presentation Linkbase Document. **
|
+ Management Compensation Plan or Arrangement
* Filed herewith
** In accordance with Rule 406T of Regulation S-T, these interactive data files are deemed not filed for purposes of Section 18 of the Exchange Act, or otherwise subject to the liability of that section, and shall not be part of any registration statement or other document filed under the Securities Act of Exchange Act, except as shall be expressly set forth by specific reference in such filing.
Federated National Holding Company and Subsidiaries
Pursuant to the requirements of Section 13 or 15 (d) of the Securities Exchange Act of 1934, the registrant has duly caused this Form 10-K report to be signed on its behalf by the undersigned, thereto duly authorized.
|
FEDERATED NATIONAL HOLDING COMPANY
|
|||
|
By:
|
/s/ Michael H. Braun
|
||
|
Michael H. Braun, Chairman and Chief Executive Officer
|
|||
|
(Principal Executive Officer)
|
|||
|
/s/ Peter J. Prygelski, III
|
|||
|
Peter J. Prygelski, III, Chief Financial Officer
|
|||
|
(Principal Financial and Accounting Officer)
|
|||
Dated: March 16, 2015
Pursuant to the requirements of the Securities Exchange Act of 1934, this Report has been signed by the following persons on behalf of the registrant and in the capacities and on the date indicated.
|
Signature
|
Title
|
Date
|
|
|
/s/ Michael H. Braun
|
Chairman and Chief Executive Officer
|
March 16, 2015
|
|
|
Michael H. Braun
|
(Principal Executive Officer)
|
||
|
/s/ Peter J. Prygelski, III
|
Chief Financial Officer
|
March 16, 2015
|
|
|
Peter J. Prygelski, III
|
(Principal Financial and Accounting Officer)
|
||
|
/s/ Richard W. Wilcox, Jr.
|
Director
|
March 16, 2015
|
|
|
Richard W. Wilcox, Jr.
|
|||
|
/s/ Carl Dorf
|
Director
|
March 16, 2015
|
|
|
Carl Dorf
|
|||
|
/s/ Jenifer G. Kimbrough
|
Director
|
March 16, 2015
|
|
|
Jenifer G. Kimbrough
|
EXHIBIT INDEX
|
Subsidiaries
|
|
|
Consent of Goldstein Schechter Koch, P.A., Independent Certified Public Accountants
|
|
|
Certification of the Chief Executive Officer pursuant to Section 302 of the Sarbanes-Oxley Act
|
|
|
Certification of the Chief Financial Officer pursuant to Section 302 of the Sarbanes-Oxley Act
|
|
|
Certification of the Chief Executive Officer pursuant to Section 906 of the Sarbanes-Oxley Act
|
|
|
Certification of the Chief Financial Officer pursuant to Section 906 of the Sarbanes-Oxley Act
|
- 134 -