Attached files
| file | filename |
|---|---|
| EX-31.1 - EX-31.1 - Cherry Hill Mortgage Investment Corp | d851725dex311.htm |
| EX-32.2 - EX-32.2 - Cherry Hill Mortgage Investment Corp | d851725dex322.htm |
| EX-12.1 - EX-12.1 - Cherry Hill Mortgage Investment Corp | d851725dex121.htm |
| EX-21.1 - EX-21.1 - Cherry Hill Mortgage Investment Corp | d851725dex211.htm |
| EX-23.1 - EX-23.1 - Cherry Hill Mortgage Investment Corp | d851725dex231.htm |
| EX-31.2 - EX-31.2 - Cherry Hill Mortgage Investment Corp | d851725dex312.htm |
| EX-32.1 - EX-32.1 - Cherry Hill Mortgage Investment Corp | d851725dex321.htm |
| EXCEL - IDEA: XBRL DOCUMENT - Cherry Hill Mortgage Investment Corp | Financial_Report.xls |
| XML - IDEA: XBRL DOCUMENT - Cherry Hill Mortgage Investment Corp | R9999.htm |
Table of Contents
UNITED STATES
SECURITIES AND EXCHANGE COMMISSION
WASHINGTON, D.C. 20549
FORM 10-K
| x | ANNUAL REPORT PURSUANT TO SECTION 13 OR 15(d) OF THE SECURITIES EXCHANGE ACT OF 1934 |
For the fiscal year ended December 31, 2014
OR
| ¨ | TRANSITION REPORT PURSUANT TO SECTION 13 OR 15(d) OF THE SECURITIES EXCHANGE ACT OF 1934 |
For the transition period from to
Commission File Number: 001-35246
CHERRY HILL MORTGAGE INVESTMENT CORPORATION
(Exact name of registrant as specified in its charter)
| Maryland | 46-1315605 | |
| (State or other jurisdiction of incorporation or organization) |
(I.R.S. Employer Identification No.) |
| 301 Harper Drive, Suite 110 Moorestown, New Jersey |
08057 | |
| (Address of principal executive offices) | (Zip Code) |
(877) 870 – 7005
(Registrant’s telephone number, including area code)
Securities registered pursuant to Section 12(b) of the Act:
| Title of Each Class |
Name of Each Exchange on Which Registered | |
| Common Stock, $0.01 par value | New York Stock Exchange |
Securities registered pursuant to Section 12(g) of the Act:
None
Indicate by check mark if the registrant is a well-known seasoned issuer, as defined in Rule 405 of the Securities Act. Yes ¨ No x
Indicate by check mark if the registrant is not required to file reports pursuant to Section 13 or Section 15(d) of the Exchange Act. Yes ¨ No x
Indicate by check mark whether the registrant (1) has filed all reports required to be filed by Section 13 or 15(d) of the Securities Exchange Act of 1934 during the preceding 12 months (or for such shorter period that the registrant was required to file such reports), and (2) has been subject to such filing requirements for the past 90 days. Yes x No ¨
Indicate by check mark whether the registrant has submitted electronically and posted on its corporate Web site, if any, every Interactive Data File required to be submitted and posted pursuant to Rule 405 of Regulation S-T (§ 232.405 of this chapter) during the preceding 12 months (or for such shorter period that the registrant was required to submit and post such files). Yes x No ¨
Indicate by check mark if disclosure of delinquent filers pursuant to Item 405 of Regulation S-K (§ 229.405 of this chapter) is not contained herein, and will not be contained, to the best of registrant’s knowledge, in definitive proxy or information statements incorporated by reference in Part III of this Form 10-K or any amendment to this Form 10-K. ¨
Indicate by check mark whether the registrant is a large accelerated filer, an accelerated filer, a non-accelerated filer or a smaller reporting company. See the definitions of “large accelerated filer,” “accelerated filer” and “smaller reporting company” in Rule 12b-2 of the Exchange Act.
| Large accelerated filer | ¨ | Accelerated filer | x | |||
| Non-accelerated filer | ¨ (Do not check if a smaller reporting company) | Smaller reporting company | ¨ | |||
Indicate by check mark whether the registrant is a shell company (as defined in Rule 12b-2 of the Exchange Act). Yes ¨ No x
The aggregate market value of the registrant’s Common Stock, $0.01 par value per share, at June 30, 2014, held by those persons deemed by the registrant to be non-affiliates (based upon the closing sale price of the Common Stock on the New York Stock Exchange on June 30, 2014) was approximately $129.2 million. Shares of the registrant’s Common Stock held by each executive officer and director and by each entity or person that, to the registrant’s knowledge, owned 10% or more of the registrant’s outstanding common stock as of June 30, 2014 have been excluded from this number in that these persons may be deemed affiliates of the registrant. This determination of affiliate status is not necessarily a conclusive determination for other purposes.
On March 13, 2015, the registrant had a total of 7,509,543 shares of common stock, $0.01 par value, outstanding.
DOCUMENTS INCORPORATED BY REFERENCE
Portions of the registrant’s Definitive Proxy Statement on Schedule 14A relating to its 2015 Annual Meeting of Stockholders, to be filed with the Securities and Exchange Commission by no later than April 30, 2015, are incorporated by reference into Part III, Items 10-14 of this Annual Report on Form 10-K as indicated herein.
Table of Contents
| Page | ||||||||
| 1 | ||||||||
| Item 1. |
1 | |||||||
| Item 1A. |
6 | |||||||
| Item 1B. |
28 | |||||||
| Item 2. |
28 | |||||||
| Item 3. |
28 | |||||||
| Item 4. |
28 | |||||||
| 29 | ||||||||
| Item 5. |
29 | |||||||
| Item 6. |
32 | |||||||
| Item 7. |
Management’s Discussion and Analysis of Financial Condition and Results of Operations |
33 | ||||||
| Item 7A. |
50 | |||||||
| Item 8. |
54 | |||||||
| Item 9. |
Changes in and Disagreements with Accountants on Accounting and Financial Disclosure |
91 | ||||||
| Item 9A. |
91 | |||||||
| Item 9B. |
92 | |||||||
| 92 | ||||||||
| Item 10. |
92 | |||||||
| Item 11. |
92 | |||||||
| Item 12. |
Security Ownership of Certain Beneficial Owners and Management and Related Stockholder Matters |
92 | ||||||
| Item 13. |
Certain Relationships and Related Transactions and Director Independence |
92 | ||||||
| Item 14. |
92 | |||||||
| 93 | ||||||||
| Item 15. |
93 | |||||||
Table of Contents
In this Annual Report on Form 10-K, unless specifically stated otherwise or the context otherwise indicates, references to “we,” “us,” “our,” the “Company” or “CHMI” refer to Cherry Hill Mortgage Investment Corporation, a Maryland corporation, together with its consolidated subsidiaries; references to the “Manager” or to “CHMM” refer to Cherry Hill Mortgage Management, LLC, a Delaware limited liability company; and references to the “Operating Partnership” refer to Cherry Hill Operating Partnership, L.P., a Delaware limited partnership.
GLOSSARY
This glossary defines some of the terms that we use elsewhere in this Annual Report and is not a complete list of all of the defined terms used herein.
“Agency” means a U.S. Government agency, such as Ginnie Mae, or a GSE.
“Agency RMBS” means RMBS issued by an Agency or for which an Agency guarantees payments of principal and interest on the securities.
“ARM” means an adjustable-rate residential mortgage loan.
“CFTC” means the U.S. Commodity Futures Trading Commission.
“CMO” means a collateralized mortgage obligation. CMOs are structured instruments representing interests in specified mortgage loan collateral. CMO securitizations consist of multiple classes, or tranches, of securities, with each tranche having specified characteristics, based on the rules described in the securitization documents governing the division of the monthly principal and interest distributions, including prepayments, from the underlying mortgage collateral among the various tranches.
“credit enhancement” means techniques to improve the credit ratings of securities, including overcollateralization, creating retained spread, creating subordinated tranches and insurance.
“Excess MSR” means an interest in an MSR, representing a portion of the interest payment collected from a pool of mortgage loans, net of a basic servicing fee paid to the mortgage servicer.
“Fannie Mae” means the Federal National Mortgage Association.
“FHA” means the Federal Housing Administration.
“FHFA” means the U.S. Federal Housing Finance Agency.
“FHA mortgage loan” means a mortgage loan that is insured by FHA.
“Freddie Mac” means the Federal Home Loan Mortgage Corporation.
“FRM” means a fixed-rate residential mortgage loan.
“Ginnie Mae” means the Government National Mortgage Association, a wholly-owned corporate instrumentality of the United States of America within HUD.
“GSE” means a government-sponsored enterprise. When we refer to GSEs, we mean Fannie Mae or Freddie Mac.
“HUD” means the U.S. Department of Housing and Urban Development.
“hybrid ARM” means a residential mortgage loan that has an interest rate that is fixed for a specified period of time (typically three, five, seven or ten years) and thereafter adjusts to an increment over a specified interest rate index.
i
Table of Contents
“inverse IO” means an inverse interest-only security, which is a type of stripped security. These debt securities receive no principal payments and have a coupon rate which has an inverse relationship to its reference index.
“IO” means an interest-only security, which is a type of stripped security. IO strips receive a specified portion of the interest on the underlying assets.
“MBS” means mortgage-backed securities.
“MSR” means a mortgage servicing right. An MSR provides a mortgage servicer with the right to service a mortgage loan or a pool of mortgages in exchange for a portion of the interest payments made on the mortgage or the underlying mortgages. An MSR is made up of two components: a basic servicing fee and an Excess MSR. The basic servicing fee is the amount of compensation for the performance of servicing duties.
“mortgage loan” means a loan secured by real estate with a right to receive the payment of principal and interest on the loan (including the servicing fee).
“non-Agency RMBS” means RMBS that are not issued or guaranteed by an Agency, including investment grade (AAA through BBB rated) and non-investment grade (BB rated through unrated) classes.
“non-conforming loan” means a residential mortgage loan that does not conform to the Agency underwriting guidelines and does not meet the funding criteria of Fannie Mae and Freddie Mac.
“non-QM loan” means a mortgage loan that does not satisfy the requirements for a qualified mortgage.
“prime mortgage loan” means a mortgage loan that generally conforms to GSE underwriting guidelines or is non-QM loan with a FICO score generally above 700.
“REIT” means a real estate investment trust.
“qualified mortgage” means a mortgage that complies with the ability to repay rule and related requirements in Regulation Z.
“residential mortgage pass-through certificate” is a MBS that represents an interest in a “pool” of mortgage loans secured by residential real property where payments of both interest and principal (including principal prepayments) on the underlying residential mortgage loans are made monthly to holders of the security, in effect “passing through” monthly payments made by the individual borrowers on the mortgage loans that underlie the security, net of fees paid to the issuer/guarantor and servicer.
“RMBS” means a residential MBS.
“Servicing Related Assets” means Excess MSRs and MSRs.
“SIFMA” means the Securities Industry and Financial Markets Association.
“stripped security” is an RMBS structured with two or more classes that receives different distributions of principal or interest on a pool of RMBS. Stripped securities include IOs and inverse IOs, each of which we may invest in subject to qualifying as a REIT.
“TBA” means a forward-settling Agency RMBS where the pool is “to-be-announced.” In a TBA, a buyer will agree to purchase, for future delivery, Agency RMBS with certain principal and interest terms and certain types of underlying collateral, but the particular Agency RMBS to be delivered is not identified until shortly before the TBA settlement date.
“TRS” means a taxable REIT subsidiary.
“UPB” means unpaid principal balance.
ii
Table of Contents
“U.S. Treasury” means the U.S. Department of Treasury.
“VA” means the Department of Veterans Affairs.
“VA mortgage loan” means a mortgage loan that is partially guaranteed by the VA in accordance with its regulations.
FORWARD-LOOKING INFORMATION
The Company makes forward-looking statements in this Annual Report on Form 10-K within the meaning of Section 27A of the Securities Act of 1933, as amended (the “Securities Act”), and Section 21E of the Securities Exchange Act of 1934, as amended (the “Exchange Act”). For these statements, the Company claims the protections of the safe harbor for forward-looking statements contained in such Sections. Forward-looking statements are subject to substantial risks and uncertainties, many of which are difficult to predict and are generally beyond the Company’s control. These forward-looking statements include information about possible or assumed future results of the Company’s business, financial condition, liquidity, results of operations, plans and objectives. When the Company uses the words “believe,” “expect,” “anticipate,” “estimate,” “plan,” “continue,” “intend,” “should,” “could,’’ “would,” “may,” “potential” or the negative of these terms or other comparable terminology, the Company intends to identify forward-looking statements. Statements regarding the following subjects, among others, may be forward-looking:
| • | the Company’s investment objectives and business strategy; |
| • | the Company’s ability to obtain future financing arrangements; |
| • | the Company’s expected leverage; |
| • | the Company’s expected investments; |
| • | the Company’s ability to execute its prime mortgage loan strategy and its ability to finance this asset class; |
| • | the Company’s ability to acquire MSRs and create its own Excess MSRs from the MSRs it may eventually acquire; |
| • | the Company’s ability to complete acquisition of Aurora Financial Group Inc. (“Aurora”) and obtain the anticipated benefits of owning a licensed servicer; |
| • | estimates or statements relating to, and the Company’s ability to make, future distributions; |
| • | the Company’s ability to compete in the marketplace; |
| • | market, industry and economic trends; |
| • | recent market developments and actions taken and to be taken by the U.S. Government, the U.S. Treasury and the Board of Governors of the Federal Reserve System, Fannie Mae, Freddie Mac, Ginnie Mae and the U.S. Securities and Exchange Commission (“SEC”); |
| • | mortgage loan modification programs and future legislative actions; |
| • | the Company’s ability to maintain its qualification as a real estate investment trust (“REIT”) under the Internal Revenue Code of 1986, as amended (the “Code”); |
| • | the Company’s ability to maintain its exemption from qualification under the Investment Company Act of 1940, as amended (the “Investment Company Act”); |
| • | projected capital and operating expenditures; |
| • | availability of investment opportunities in mortgage-related, real estate-related and other securities; |
| • | availability of qualified personnel; |
| • | prepayment rates; and |
| • | projected default rates. |
iii
Table of Contents
The Company’s beliefs, assumptions and expectations can change as a result of many possible events or factors, not all of which are known to it or are within its control. If any such change occurs, the Company’s business, financial condition, liquidity and results of operations may vary materially from those expressed in, or implied by, the Company’s forward-looking statements. These risks, along with, among others, the following factors, could cause actual results to vary from the Company’s forward-looking statements:
| • | the factors referenced in this Annual Report on Form 10-K, including those set forth under “Item 1. Business” and “Item 1A. Risk Factors”; |
| • | the Company’s ability to obtain required consents in connection with the Aurora acquisition; |
| • | general volatility of the capital markets; |
| • | changes in the Company’s investment objectives and business strategy; |
| • | availability, terms and deployment of capital; |
| • | availability of suitable investment opportunities; |
| • | the Company’s dependence on its external manager, CHMM, and the Company’s ability to find a suitable replacement if the Company or the Manager were to terminate the management agreement the Company has entered into with the Manager; |
| • | changes in the Company’s assets, interest rates or the general economy; |
| • | increased rates of default and/or decreased recovery rates on the Company’s investments; |
| • | changes in interest rates, interest rate spreads, the yield curve, prepayment rates or recapture rates; |
| • | limitations on the Company’s business due to compliance with the REIT requirements; and |
| • | the degree and nature of the Company’s competition, including competition for its targeted assets. |
Although the Company believes that the expectations reflected in the forward-looking statements are reasonable, it cannot guarantee future results, levels of activity, performance or achievements. These forward-looking statements apply only as of the date of this Annual Report on Form 10-K. The Company is not obligated, and does not intend, to update or revise any forward-looking statements, whether as a result of new information, future events or otherwise. See “Item 1A. Risk Factors” of this Annual Report on Form 10-K.
iv
Table of Contents
| Item 1. | Business |
Cherry Hill Mortgage Investment Corporation is a public residential real estate finance company focused on acquiring, investing in and managing residential mortgage assets in the United States. We were incorporated in Maryland on October 31, 2012, and we commenced operations on October 9, 2013 following the completion of our initial public offering (“IPO”) and a concurrent private placement. Our common stock is listed and traded on the New York Stock Exchange under the symbol “CHMI.” We are externally managed by Cherry Hill Mortgage Management, LLC, an SEC-registered investment adviser and an affiliate of Freedom Mortgage Corporation, or Freedom Mortgage (“Freedom Mortgage”).
We operate so as to qualify to be taxed as a REIT under the Code. To qualify as a REIT, we must distribute annually to our stockholders an amount at least equal to 90% of our REIT taxable income, determined without regard to the deduction for dividends paid and excluding any net capital gain. We currently expect to distribute substantially all of our REIT taxable income to our stockholders. We will be subject to income tax on our taxable income that is not distributed and to an excise tax to the extent that certain percentages of our taxable income are not distributed by specified dates. Income as computed for purposes of the foregoing tax rules will not necessarily correspond to our income as determined for financial reporting purposes.
Our principal objective is to generate attractive current yields and risk-adjusted total returns for our stockholders over the long term, primarily through dividend distributions and secondarily through capital appreciation. We intend to attain this objective by selectively constructing and actively managing a targeted portfolio of Excess MSRs, RMBS, prime mortgage loans and other cashflowing residential mortgage assets.
We operate our business through the following segments: (i) investments in Servicing Related Assets; and (ii) RMBS. For information regarding the segments in which we operate, see “Item 8. Consolidated Financial Statements and Supplementary Data— Note 3—Segment Reporting.”
Our Targeted Asset Classes
Our targeted asset classes currently include:
| • | Excess MSRs; |
| • | RMBS, including Agency RMBS, residential mortgage pass-through certificates, CMOs (IOs and inverse IOs) and TBAs; and |
| • | prime mortgage loans. |
Our Strategy
Our strategy, which we expect could change as market conditions warrant, involves:
| • | allocating a majority of our equity capital to the acquisition of Excess MSRs through flow or bulk purchases: |
| • | upon receipt of necessary approvals, the creation of Excess MSRs from MSRs generated from prime mortgage loans we may acquire or acquired by our taxable REIT subsidiary, CHMI Solutions, Inc. (“Solutions”); |
| • | acquiring RMBS on a leveraged basis; |
| • | over time, as the market for prime mortgage loans grows, purchasing these assets from, or potentially in partnership with, Freedom Mortgage; and |
| • | opportunistically mitigating our prepayment, interest rate and, to a lesser extent, credit risk by using a variety of hedging instruments and where applicable and available, recapture agreements. |
1
Table of Contents
Excess MSR Strategy. We currently expect that the primary method by which we will invest in Excess MSRs will be through the creation of Excess MSRs from MSRs acquired by Solutions. If and when regulatory approvals are obtained, we plan to acquire MSRs from Freedom Mortgage and other servicers on a flow or bulk basis on terms to be negotiated in the future. We also may generate MSRs through the purchase of prime mortgage loans from Freedom Mortgage and independent third-party correspondents.
Our ability to acquire MSRs will be subject to the applicable REIT qualification tests. We likely will have to hold any MSRs through Solutions, which will be subject to corporate income tax. However, we plan to create Excess MSRs from those MSRs. The newly created Excess MSRs will be transferred to our subsidiary, Cherry Hill QRS II, LLC and will represent a portion of the interest payments collected from the related pool of mortgage loans, net of a basic servicing fee retained by Solutions. The portion of the interest payments represented by the Excess MSR will not be subject to an entity level tax as long as we comply with the REIT qualification tests. The tax liability of Solutions (if it holds MSRs) would negatively impact our returns from those assets. In addition, unlike our investments in Excess MSRs, any investments in MSRs will expose us to default risk and the potential for credit losses.
RMBS Strategy. Our RMBS strategy focuses primarily on the acquisition and ownership of Agency RMBS that are whole-pool, residential mortgage pass-through certificates. However, we may from time to time invest in CMOs, including IOs and inverse IOs. If we decide to invest in CMOs, we anticipate doing so primarily to take advantage of particularly attractive prepayment-related or structural opportunities in the RMBS markets. In addition to investing in specific pools of Agency RMBS, we utilize forward-settling purchases and sales of Agency RMBS where the underlying pools of mortgage loans are “to-be-announced” (TBAs). Pursuant to these TBA transactions, we agree to purchase or sell, for future delivery, Agency RMBS with certain principal and interest terms and certain types of underlying collateral, but the particular Agency RMBS to be delivered is not identified until shortly before the TBA settlement date. Our ability to engage in TBA transactions is limited by the gross income and asset tests applicable to REITs.
Our RMBS strategy includes selective investments in non-Agency RMBS, including GSE risk-sharing securities. GSE risk-sharing securities are general obligations of Fannie Mae and Freddie Mac that provide credit protection with respect to defaults on reference pools primarily consisting of non-agency RMBS. We currently expect to expand our participation in that market. However, the extent of our investments in GSE risk-sharing securities will be limited by the gross income and asset tests applicable to REITs. We also intend to invest opportunistically in legacy non-Agency RMBS issued during or after 2010. If and when market conditions permit us to execute our prime mortgage loan acquisition and financing strategy, we expect that we will retain certain bonds collateralized by the prime mortgage loans we securitize. We also may selectively invest across the entire capital structure of non-Agency RMBS that are newly issued by third parties. Non-Agency RMBS, if we decide to purchase them, are subject to risk of default, among other risks, and could result in greater losses.
Prime Mortgage Loan Strategy. We believe that the market for non-conforming loans including, in particular, prime non-conforming mortgage loans, will grow. As a result, we expect our portfolio to include this asset class over time. Based on current market conditions, we do not expect this asset class to be a part of our portfolio until the second half of 2015, if at all. The prime mortgage loans we intend to acquire may be ARMs, hybrid ARMs or FRMs with original terms to maturity of not more than 30 years and will be either fully amortizing or interest-only for up to ten years, and fully amortizing thereafter. We expect that these loans may include both qualified mortgages and, if and when market conditions permit, non-QM loans.
We currently do not intend to offer mortgage loans to consumers. We intend to acquire prime mortgage loans that are underwritten to our specifications. We may acquire prime mortgage loans underwritten to our specifications from Freedom Mortgage or other originators. To the extent Freedom Mortgage originates prime mortgage loans that satisfy our investment parameters and guidelines, we expect to negotiate an arrangement with Freedom Mortgage so we have the right to purchase such loans. Any such arrangement will be subject to the review and approval of our independent directors. We may acquire prime mortgage loans for our portfolio with the intention of either holding them in our residential mortgage loan portfolio or securitizing them.
Our strategy is adaptable to changing market environments, subject to compliance with the income and other tests that we must satisfy to qualify as a REIT and maintain our exclusion from regulation as an investment company under the Investment Company Act. As a result, our acquisition and management decisions will depend on prevailing market conditions, and our targeted asset classes and strategy may vary over time in response to market conditions.
2
Table of Contents
Our Manager
We are externally managed by our Manager. We have entered into a management agreement with our Manager, pursuant to which our Manager is responsible for our investment strategies and decisions and our day-to-day operations, subject to the supervision and oversight of our board of directors. Mr. Middleman, our non-executive Chairman of the Board, is the sole member of our Manager. Freedom Mortgage and its employees support our Manager in providing services to us pursuant to the terms of a services agreement that has been entered into by our Manager and Freedom Mortgage. We rely on our Manager and Freedom Mortgage to provide or obtain on our behalf the personnel and services necessary for us to conduct our business. Our executive officers and the officers and employees of our Manager are also officers and employees of Freedom Mortgage, and we will compete with Freedom Mortgage for access to these individuals. The executive offices of our Manager are located at 907 Pleasant Valley Ave., Mount Laurel, New Jersey 08054, and the telephone number of our Manager’s executive offices is (877) 870-7005.
Our Manager has established an Investment Committee to monitor our investment policies, portfolio holdings, financing and hedging strategies and compliance with our investment guidelines. The members of our Manager’s Investment Committee are Mr. Middleman, our Chairman; Mr. Lown, our President and Chief Investment Officer; Mr. Levine, our Chief Financial Officer, Treasurer and Secretary; and the Manager’s two portfolio managers and head of risk/operations.
Our Manager is registered as an investment adviser under the Investment Advisers Act of 1940, as amended, or the Advisers Act, and is subject to the regulatory oversight of the Investment Management Division of the SEC.
Our Investment Guidelines; Transactions with Freedom Mortgage
The investment guidelines for our assets and borrowings are as follows:
| • | No investment will be made if it causes us to fail to qualify as a REIT under the Code. |
| • | No investment will be made if it causes us to be regulated as an investment company under the Investment Company Act. |
| • | We will not enter into principal transactions or split price executions with Freedom Mortgage or any of its affiliates unless such transaction is otherwise in accordance with our investment guidelines and the management agreement between us and our Manager and the terms of such transaction are at least as favorable to us as to Freedom Mortgage or its affiliate. |
| • | Any proposed material investment that is outside our targeted asset classes must be approved by at least a majority of our independent directors. |
Our Manager makes the determinations as to the percentage of assets that are invested in each of our targeted asset classes, consistent with our investment guidelines. Our Manager’s acquisition decisions depend on prevailing market conditions and may change over time in response to opportunities available in different interest rate, economic and credit environments. In addition, our investment guidelines may be changed from time to time by our board of directors without the approval of our stockholders. Changes to our investment guidelines may include, without limitation, modification or expansion of the types of assets which we may acquire. To the extent that our board of directors approves material changes to our investment guidelines, we will inform stockholders of such changes through disclosure in our periodic reports and other filings required under the Exchange Act.
Our Manager’s Investment Committee reviews our compliance with our guidelines periodically, and our board of directors receives a report each quarter in conjunction with its review of our quarterly results. The Nominating and Corporate Governance Committee, which is comprised of all of our independent directors, reviews the material terms of any transaction between us and Freedom Mortgage, including the pricing terms, to determine if the terms of those transactions are fair and reasonable. This committee will also be responsible for reviewing and approving any agreements pursuant to which we will acquire prime mortgage loans or MSRs from Freedom Mortgage. We also retain two independent valuation services to assist our management and our independent directors in making pricing determinations on Excess MSRs and other assets we purchase from Freedom Mortgage.
3
Table of Contents
Our Financing Strategies and Use of Leverage
We finance our RMBS with what we believe to be a prudent amount of leverage, which will vary from time to time based upon the particular characteristics of our portfolio, availability of financing and market conditions. Our borrowings consist of repurchase transactions under master repurchase agreements. These agreements represent uncommitted financing provided by the counterparties. Our repurchase transactions are collateralized by our RMBS. In a repurchase transaction, we sell an asset to a counterparty at a discounted value, or the loan amount, and simultaneously agree to repurchase the same asset from such counterparty at a price equal to the loan amount plus an interest factor. Despite being legally structured as sales and subsequent repurchases, repurchase transactions are generally accounted for as debt secured by the underlying assets. During the term of a repurchase transaction, we generally receive the income and other payments distributed with respect to the underlying assets and pay interest to the counterparty. While the proceeds of our repurchase financings often will be used to purchase additional RMBS subject to the same master repurchase agreement, our financing arrangements are not expected to restrict our ability to use proceeds from these arrangements to support our other liquidity needs. Our master repurchase agreements are documented under the standard form master repurchase agreement published by SIFMA.
We have entered into repurchase agreements with 13 counterparties as of December 31, 2014. From time to time we expect to negotiate and enter into additional master repurchase agreements with other counterparties that could produce opportunities to acquire certain RMBS that may not be available from our existing counterparties.
We are actively pursuing limited financing for our Excess MSRs. We also intend to obtain financing for any MSRs that we may acquire. Execution of our prime mortgage loan strategy is dependent on obtaining financing on attractive terms. We may utilize other types of borrowings in the future, including term facilities or other more complex financing structures. Additionally, we may take advantage of available borrowings, if any, under new programs established by the U.S. Government to finance our assets. We also may raise capital by issuing unsecured debt, preferred or common stock or trust preferred securities.
Interest Rate Hedging
We opportunistically manage our interest rate risk by using various hedging strategies. Subject to maintaining our qualification as a REIT and maintaining our exclusion from regulation as an investment company under the Investment Company Act, we use certain derivative financial instruments and other hedging instruments to mitigate interest rate risk we expect to arise from our repurchase agreement financings associated with our RMBS. The interest rate hedging instruments that we currently use include: interest rate swaps, TBAs and swaptions. Our overall hedging strategy takes into account the natural hedging effect of our Excess MSRs, which tend to increase in value as interest rates rise. See “Item 8. Consolidated Financial Statements and Supplementary Data—Note 2—Basis of Presentation and Significant Accounting Policies—Derivatives and Hedging Activities.”
Policies with Respect to Certain Other Activities
If our board of directors determines that additional funding is required, we may raise such funds through additional offerings of equity or debt securities, the retention of cash flow and other funds from debt financing, or a combination of these methods. In the event that our board of directors determines to raise additional equity capital, it has the authority, without stockholder approval, to issue additional shares of common stock or preferred stock in any manner and on such terms and for such consideration as it deems appropriate, at any time. We may, in the future, offer equity or debt securities in exchange for assets. We have not in the past and will not in the future underwrite the securities of other companies. Our board of directors may change any of these policies without prior notice to you or a vote of our stockholders.
Competition
We compete with other mortgage REITs, specialty finance companies, savings and loan associations, banks, mortgage bankers, insurance companies, mutual funds, institutional investors, investment banking firms, financial institutions, governmental bodies and other entities for investment opportunities in general. See Item 1A, “Risk Factors—We operate in a highly competitive market.”
4
Table of Contents
In the face of this competition, through our Manager, we have access to Freedom Mortgage’s professionals and their industry expertise, which may provide us with a competitive advantage and help us assess risks and determine appropriate pricing for certain potential assets. In addition, we believe that these relationships enable us to compete more effectively for attractive asset acquisition opportunities. However, we may not be able to achieve our business goals or expectations due to the competitive risks that we face.
Employees
We do not have any employees other than one loan officer who is employed by Solutions. All of our executive officers are employees of Freedom Mortgage.
Our Tax Status
We have elected to be taxed as a REIT under the Code. Provided that we maintain our qualification as a REIT, we generally will not be subject to U.S. federal income tax on our REIT taxable income that is currently distributed to our stockholders. REITs are subject to a number of organizational and operational requirements, including a requirement that they currently distribute at least 90% of their annual REIT taxable income excluding net capital gains. We cannot assure you that we will be able to comply with such requirements in the future. Failure to qualify as a REIT in any taxable year would cause us to be subject to U.S. federal income tax on our taxable income at regular corporate rates (and any applicable state and local taxes). Even if we qualify for taxation as a REIT, we may be subject to certain federal, state, local and non-U.S. taxes on our income. For example, the income generated by Solutions will be subject to U.S. federal, state and local income tax.
See “Item 1A. Risk Factors—U.S. Federal Income Tax Risks” for additional tax status information.
Our Exclusion from Regulation as an Investment Company
We are organized as a holding company and conduct business primarily through our subsidiaries. We believe we have conducted and intend to conduct our operations so that neither we nor any of our subsidiaries are required to register as an investment company under the Investment Company Act.
Section 3(a)(1)(A) of the Investment Company Act defines an investment company as any issuer that is or holds itself out as being engaged primarily in the business of investing, reinvesting or trading in securities. Section 3(a)(1)(C) of the Investment Company Act defines an investment company as any issuer that is engaged or proposes to engage in the business of investing, reinvesting, owning, holding or trading in securities and owns or proposes to acquire investment securities having a value exceeding 40% of the value of the issuer’s total assets (exclusive of U.S. Government securities and cash items) on an unconsolidated basis, which we refer to as the 40% test. Excluded from the term “investment securities,” among other things, are U.S. Government securities and securities issued by majority-owned subsidiaries that are not themselves investment companies and are not relying on the exclusion from the definition of investment company set forth in Section 3(c)(1) or Section 3(c)(7) of the Investment Company Act.
We believe neither we nor our operating partnership is considered an investment company under Section 3(a)(1)(A) of the Investment Company Act because neither we nor our operating partnership engage primarily or hold ourselves out as being engaged primarily in the business of investing, reinvesting or trading in securities. Rather, through our operating partnership’s wholly-owned or majority-owned subsidiaries, we and our operating partnership are primarily engaged in the non-investment company businesses of these subsidiaries, namely the business of purchasing or otherwise acquiring mortgages and other interests in real estate.
We rely upon certain exemptions from registration as an investment company under the Investment Company Act including, in the case of our subsidiary, Cherry Hill QRS I, LLC, Section 3(c)(5)(C) of the Investment Company Act. Section 3(c)(5)(C), as interpreted by the staff of the SEC, requires an entity to invest at least 55% of its assets in “mortgages and other liens on and interests in real estate,” which we refer to as “qualifying real estate interests,” and at least 80% of its
5
Table of Contents
assets in qualifying real estate interests plus “real estate-related assets.” In satisfying the 55% requirement, the entity may treat securities issued with respect to an underlying pool of mortgage loans in which it holds all of the certificates issued by the pool as qualifying real estate interests. We treat the Agency whole-pool pass-through securities in which we have invested as qualifying real estate interests for purposes of the 55% requirement. The Excess MSRs we have acquired are, and the Agency CMOs we may acquire will, not be treated as qualifying real estate interests for purposes of the 55% requirement, but as real estate-related assets that qualify for the 80% test. In addition, Cherry Hill QRS I, LLC will treat its investment in Cherry Hill QRS II, LLC as a real estate-related asset because substantially all of the assets held by Cherry Hill QRS II, LLC will be real estate-related assets.
We monitor our compliance with the 40% Test and the holdings of our subsidiaries to ensure that each of our subsidiaries is in compliance with an applicable exemption or exclusion from registration as an investment company under the Investment Company Act. In the event that we, or our operating partnership, were to acquire assets that could make either entity fall within the definition of investment company under Section 3(a)(1)(A) or Section 3(a)(1)(C) of the Investment Company Act, we believe that we would still qualify for an exclusion from registration pursuant to Section 3(c)(5)(C).
Qualification for exclusion from registration under the Investment Company Act limits our ability to make certain investments. In addition, complying with the tests for exclusion from registration could restrict the time at which we can acquire and sell assets. To the extent that the SEC or its staff provides more specific guidance regarding any of the matters bearing upon such exclusions, we may be required to adjust our strategy accordingly. Any additional guidance from the SEC or its staff could provide additional flexibility to us, or it could further inhibit our ability to pursue the strategies we have chosen.
Website Access to Reports
We maintain a website at www.chmireit.com. We are providing the address to our website solely for the information of investors. The information on our website is not a part of, nor is it incorporated by reference, into this report. Through our website, we make available, free of charge, our annual proxy statement, annual reports on Form 10-K, quarterly reports on Form 10-Q, current reports on Form 8-K and amendments to those reports filed or furnished pursuant to Section 13(a) or 15(d) of the Securities Exchange Act of 1934, as amended, or the Exchange Act, as soon as reasonably practicable after we electronically file such material with, or furnish them to, the SEC. The SEC maintains a website that contains these reports at www.sec.gov.
Corporate Information
Our principal executive offices are located at 301 Harper Drive, Suite 110, Moorestown, New Jersey, 08057. Our telephone number is (877) 870-7005 and our website is www.chmireit.com. The offices of our Manager are located at 907 Pleasant Valley Ave., Mount Laurel, New Jersey, 08054. Information available on or accessible through our website and Freedom Mortgage’s website is not incorporated into this Annual Report on form 10-K.
| Item 1A. | Risk Factors |
The Company’s business and operations are subject to a number of risks and uncertainties, the occurrence of which could adversely affect its business, financial condition, results of operations and ability to make distributions to stockholders and could cause the value of the Company’s capital stock to decline. Please refer to the section entitled “Forward-Looking Statements.”
Risks Related To Our Business
We may not be able to continue to operate our business successfully or generate sufficient revenue to make or sustain distributions to our stockholders.
We commenced operations on October 9, 2013. We cannot assure you that we will be able to continue to operate our business successfully or implement our strategies. There can be no assurance that we will be able to continue to generate sufficient returns to pay our operating expenses and make satisfactory distributions to our stockholders. The results of our operations depend on several factors, including the availability of opportunities for the acquisition of target assets, the level and volatility of interest rates, the availability of adequate short and long-term financing, conditions in the financial markets and general economic conditions.
6
Table of Contents
Difficult conditions in the mortgage and residential real estate markets as well as general market concerns may adversely affect the value of the assets in which we invest, and these conditions may persist for the foreseeable future.
Our business is materially affected by conditions in the residential mortgage market, the residential real estate market, the financial markets and the economy in general. In particular, the residential mortgage market in the United States has experienced a variety of difficulties and changed economic conditions, including defaults, credit losses and liquidity concerns. Over the past several years, certain commercial banks, investment banks and insurance companies have announced extensive losses from exposure to the residential mortgage market. These factors have impacted investor perception of the risk associated with RMBS, other real estate-related securities and various other asset classes in which we may invest. As a result, values of our target assets have experienced volatility. Deterioration of the mortgage market and investor perception of the risks associated with RMBS and other residential mortgage assets that we acquire could materially adversely affect our business, financial condition and results of operations and our ability to make distributions to our stockholders.
We are dependent on mortgage servicers to service the mortgage loans relating to our Servicing Related Assets.
Our investments in Excess MSRs are dependent on the mortgage servicer to perform its servicing obligations. As a result, we could be materially and adversely affected if the servicer is terminated by the applicable Agency. The duties and obligations of mortgage servicers are defined through contractual agreements, which generally provide for the possibility for termination of the servicer in the absolute discretion of the applicable Agency. In the event of such termination with respect to a particular servicer, the related Excess MSRs could potentially lose all value on a going forward basis. Moreover, the termination of a servicer could take effect across all mortgages being serviced by that servicer. Therefore, to the extent we make multiple investments relating to mortgages serviced by the same servicer, such as our initial portfolio of Excess MSRs which are entirely serviced by Freedom Mortgage, all such investments could lose all their value in the event of the termination of the servicer. In addition, many servicers also rely on subservicing arrangements with third parties, and the failure of subservicers to adequately perform their services may negatively impact the servicer and, as a result, the performance of our Excess MSRs. We may not have recourse to the servicer if the subservicer fails to perform.
We could also be materially and adversely affected if the servicer is unable to adequately service the underlying mortgage loans due to:
| • | its failure to comply with applicable laws and regulation; |
| • | its failure to perform its loss mitigation obligations; |
| • | a downgrade in its servicer rating; |
| • | its failure to perform adequately in its external audits; |
| • | a failure in or poor performance of its operational systems or infrastructure; |
| • | regulatory scrutiny regarding foreclosure processes lengthening foreclosure timelines; |
| • | the transfer of servicing to another party; or |
| • | any other reason. |
MSRs are subject to numerous federal, state and local laws and regulations and may be subject to various judicial and administrative decisions imposing various requirements and restrictions on the servicer’s business. If Freedom Mortgage or any servicer from whom we acquire Excess MSRs actually or allegedly failed to comply with applicable laws, rules or regulations, the servicer could be exposed to fines, penalties or other costs, or the servicer could be terminated as the servicer and the MSRs to which our Excess MSRs relate would be eliminated and lose all value, which could have a material adverse effect on the associated Excess MSR, our business, financial condition, results of operations or cash flows. If these laws, regulations and decisions change, we could be exposed to similar fines, penalties or costs.
In addition, a bankruptcy by any mortgage servicer that services the mortgage loans underlying any Excess MSRs that we have acquired or may acquire in the future could result in:
| • | the validity and priority of our ownership of the Excess MSRs being challenged in a bankruptcy proceeding; |
7
Table of Contents
| • | payments made by such servicer to us, or obligations incurred by it, being voided by a court under federal or state preference laws or federal or state fraudulent conveyance laws; |
| • | a re-characterization of any sale of the Excess MSRs or other assets to us as a pledge of such assets in a bankruptcy proceeding; or |
| • | any agreement pursuant to which we acquired the Excess MSRs being rejected in a bankruptcy proceeding. |
Any of the foregoing events could have a material and adverse effect on us.
We plan on using subservicers, which may include Freedom Mortgage, to accomplish the actual servicing of the mortgage loans underlying any MSRs we acquire and any Excess MSRs that we create. The considerations discussed in this risk factor are equally applicable to any MSRs we may acquire.
Governmental investigations or examinations, or private lawsuits, including purported class action lawsuits, involving Freedom Mortgage could have a material adverse effect on Freedom Mortgage and its ability to perform its obligations under our strategic alliance agreements.
Freedom Mortgage is routinely involved in legal proceedings concerning matters that arise in the ordinary course of its business. An adverse result in governmental investigations or examinations, or private lawsuits, including purported class action lawsuits, could have a material adverse effect on Freedom Mortgage’s financial results. These legal proceedings can range from private actions involving a single plaintiff to class action lawsuits with potentially thousands of class members. Participants in the mortgage industry, including Freedom Mortgage, are also routinely subject to government investigations and inquiries. An adverse result in governmental investigations or examinations, or private lawsuits, including purported class action lawsuits, could have a material adverse effect on Freedom Mortgage’s financial results. Litigation and other proceedings may require that Freedom Mortgage pay settlement costs, legal fees, damages, penalties or other charges, which could adversely affect its financial results. In particular, ongoing and other legal proceedings brought under state consumer protection statutes may result in a separate fine for each violation of the statute, which, particularly in the case of class action lawsuits, could result in damages substantially in excess of the amounts earned from the underlying activities and that could have a material adverse effect on Freedom Mortgage’s liquidity and financial position.
Freedom Mortgage has advised us that it does not believe that it is currently subject to any legal proceedings or government investigations that would reasonably be expected to have a material adverse effect on Freedom Mortgage or on us, but it is possible that one or more such legal proceedings or investigations could evolve into a material legal proceeding in the future. For example, Freedom Mortgage has informed us that, in February 2013, it received a subpoena from the Office of the Inspector General for the U.S. Department of Housing and Urban Development, or the HUD OIG, in which the HUD OIG requested that Freedom Mortgage provide the HUD OIG with documents and records concerning Freedom Mortgage’s quality control and training policies and procedures relating to its FHA mortgage loan origination activities. The HUD OIG acts under the oversight of the U.S. Department of Justice. It is our understanding that several other FHA approved mortgage originators have received similar requests. Freedom Mortgage has informed us that, in March 2013, it provided the requested information that was readily available and attempted to further clarify the scope of the remaining information that was initially requested. In September 2013, the HUD OIG requested documents not previously requested from Freedom Mortgage, and we have been advised by Freedom Mortgage that it provided those documents to the HUD OIG. Certain members of Freedom Mortgage’s staff have been deposed. Freedom Mortgage has informed us that it anticipates that a significant initial monetary demand is reasonably likely, and that the final demand, if any, will be the product of negotiations the results of which cannot be predicted. Freedom Mortgage has informed us that as of the date of filing of this annual report, the HUD OIG has not communicated to Freedom Mortgage any allegations of wrongdoing or any monetary demands. However, we cannot assure you that the HUD OIG will not do so in the future, and any such allegations or findings could result in Freedom Mortgage being required to pay settlement costs, legal fees, damages, penalties or other charges, which could adversely affect its financial results and its business operations, which in turn could impact its ability to perform under the strategic alliance agreements with us or may otherwise negatively impact us.
8
Table of Contents
Our ability to invest in, and dispose of, our investments in Servicing Related Assets may be subject to the receipt of third-party consents.
The Agencies may require that we submit ourselves to costly or burdensome conditions as a prerequisite to their consent to our investments in Servicing Related Assets. These conditions may diminish or eliminate the investment potential of certain of those assets by making such investments too expensive for us or by severely limiting the potential returns available. The potential costs, issues or restrictions associated with receiving such Agency’s consent for any such dispositions by us cannot be determined with any certainty. To the extent we are unable to dispose of Servicing Related Assets in our portfolio when we determine it would be beneficial to do so, our results of operations may be adversely impacted.
Acknowledgement agreements with Ginnie Mae, Fannie Mae or Freddie Mac could expose us to potential liability in the event of a payment default.
In order to acquire Excess MSRs related to FHA and VA mortgage loans that have been pooled into securities guaranteed by Ginnie Mae, we must enter into an acknowledgment agreement with Ginnie Mae and the Ginnie Mae-approved issuer/servicer for the mortgage loans if we want to have Ginnie Mae acknowledge our interest in the relevant mortgage loans. Under that agreement, if the issuer/servicer fails to make a required payment to the holders of the Ginnie Mae-guaranteed RMBS, we would be obligated to make that payment even though the payment may relate to loans for which we do not own any Excess MSRs.
Our failure to make that payment could result in liability to Ginnie Mae for any losses or claims that it suffers as a result. In addition, under an acknowledgment agreement with Fannie Mae or Freddie Mac, we could be exposed to potential liability in the event of a payment default by an approved seller/servicer. However, the amount of the potential liability to Fannie Mae or Freddie Mac would be limited to the mortgage loans in the servicing portfolio identified in the acknowledgment agreement.
Given the size of Freedom Mortgage’s portfolio of FHA and VA loans that have been pooled into Ginnie Mae-guaranteed RMBS, it is unlikely that we would be able to satisfy that obligation under the acknowledgment agreement should Freedom Mortgage fail to make a required payment. In that case we would be subject to claims for losses by Ginnie Mae which would have a material and adverse effect on our financial condition and operations, and our ability to enter into acknowledgement agreements in the future and to acquire Excess MSRs related to FHA and VA mortgage loans would be adversely affected. The only remedy related to the servicing permitted under the acknowledgment agreement is to request Ginnie Mae to transfer the servicing to another Ginnie Mae-approved issuer/servicer which would terminate our interest in the related Excess MSRs. The termination of our Excess MSRs could have a material adverse effect on our financial condition, results of operations and ability to make distributions to our stockholders.
We have entered into an acknowledgement agreement with Ginnie Mae and Freedom Mortgage in connection with the acquisition of our initial portfolio of Excess MSRs.
The value of our Servicing Related Assets may vary substantially with changes in interest rates.
The values of MSRs are sensitive, and values of Excess MSRs are highly sensitive, to changes in interest rates. The value of Servicing Related Assets typically increases when interest rates rise and decreases when interest rates decline due to the effect those changes in interest rates have on prepayment estimates. Subject to qualifying and maintaining our qualification as a REIT, we may pursue various hedging strategies to seek to reduce our exposure to adverse changes in interest rates. Our hedging activity will vary in scope based on the level and volatility of interest rates, the type of assets held and other changing market conditions. Interest rate hedging may fail to protect or could adversely affect us. To the extent we do not utilize derivatives to hedge against changes in the fair value of our Servicing Related Assets, our balance sheet, results of operations and cash flows would be susceptible to significant volatility due to changes in the fair value of, or cash flows from, those assets as interest rates change.
If delinquencies increase, the value of our Servicing Related Assets may decline significantly.
Delinquency rates have a significant impact on the value of our Servicing Related Assets. An increase in delinquencies will generally result in lower revenue because, typically, servicers will only collect servicing fees from GSEs
9
Table of Contents
or mortgage owners for performing loans. Our expectation of delinquencies is a significant assumption underlying the cash flow projections on the related pools of mortgage loans. If delinquencies are significantly greater than expected, the estimated fair value of the Servicing Related Assets could be diminished. As a result, we could suffer a loss.
Prepayment rates can change, adversely affecting the performance of our assets.
The frequency at which prepayments (including voluntary prepayments by borrowers, loan buyouts and liquidations due to defaults and foreclosures) occur on mortgage loans is affected by a variety of factors, including the prevailing level of interest rates as well as economic, demographic, tax, social, legal, and other factors. Generally, borrowers tend to prepay their mortgages when prevailing mortgage rates fall below the interest rates on their mortgage loans. If borrowers prepay their mortgage loans at rates that are faster or slower than expected, it may adversely affect our profitability.
We will record our Servicing Related Assets on our balance sheet at fair value, and changes in their fair value will be reflected in our consolidated results of operations. The determination of the fair value of Servicing Related Assets requires our management to make numerous estimates and assumptions that could materially differ from actual results. Such estimates and assumptions include, among other things, prepayment rates, as well as estimates of the future cash flows from the Servicing Related Assets, interest rates, delinquencies and foreclosure rates of the underlying mortgage loans. The ultimate realization of the value of the Servicing Related Assets, which are measured at fair value on a recurring basis, may be materially different than the fair values of such assets as may be reflected in our consolidated financial statements as of any particular date. The use of different estimates or assumptions in connection with the valuation of these assets could produce materially different fair values for such assets. Our failure to make accurate assumptions regarding prepayment rates or the other factors examined in determining fair value could cause the fair value of our Servicing Related Assets to materially vary, which could have a material adverse effect on our financial position, results of operations and cash flows. If the fair value of our Servicing Related Assets decreases, we would be required to record a non-cash charge, which would have a negative impact on our financial results. Furthermore, a significant increase in prepayment speeds could materially reduce the ultimate cash flows we receive from the Servicing Related Assets, and we could ultimately receive substantially less than what we paid for such assets.
Voluntary prepayment rates generally increase when interest rates fall and decrease when interest rates rise, but changes in prepayment rates are difficult to predict. Prepayments can also occur when borrowers sell the property and use the sale proceeds to prepay the mortgage as part of a physical relocation or when borrowers default on their mortgages and the mortgages are prepaid from the proceeds of a foreclosure sale of the property. Fannie Mae and Freddie Mac will generally, among other conditions, purchase mortgages that are 120 days or more delinquent from mortgage-backed securities trusts when the cost of guaranteed payments to security holders, including advances of interest at the security coupon rate, exceeds the cost of holding the nonperforming loans in their portfolios. Ginnie Mae provides the issuer the option to buy 90 days or more delinquent loans out of the mortgage-backed securities that it services, which may also contribute to an increase in prepayment rates. Consequently, prepayment rates also may be affected by conditions in the housing and financial markets, which may result in increased delinquencies on mortgage loans. Additionally, changes in the government-sponsored entities’ decisions as to when to repurchase delinquent loans can materially impact prepayment rates.
With respect to our Excess MSRs, voluntary and involuntary prepayments eliminate the Excess MSR on the mortgage loans being prepaid. In recent years, Freedom Mortgage has experienced relatively high levels of recapture on voluntary prepayments. There can be no assurance that Freedom Mortgage will continue to successfully enjoy the levels of recapture it has historically had, particularly as interest rate environments change. In addition, although we expect Freedom Mortgage to replace the Excess MSRs on loans in the pools that are refinanced by Freedom Mortgage, there can be no assurance that Freedom Mortgage will enter into recapture agreements with us in the future or that it will be successful in replacing any Excess MSRs, which would negatively impact our cash flows. When we purchase Excess MSRs, we base the price we pay and the rate of amortization of those assets on, among other things, our projection of the cash flows from the pool of mortgage loans underlying the related MSRs. Our expectation of prepayment speeds and recapture rates is a significant assumption factored into our cash flow projections, and if prepayment speeds are significantly greater than expected or recapture rates significantly lower than expected, the carrying value of our Excess MSRs would change.
10
Table of Contents
Interest rate mismatches between our assets and any borrowings used to fund purchases of our assets may reduce our income during periods of changing interest rates.
Some of our assets will be fixed-rate securities or have a fixed rate component (such as RMBS backed by hybrid ARMs). This means that the interest we earn on these assets will not vary over time based upon changes in a short-term interest rate index. Although the interest we earn on our RMBS backed by ARMs generally will adjust for changing interest rates, such interest rate adjustments may not occur as quickly as the interest rate adjustments to any related borrowings, and such interest rate adjustments will generally be subject to interest rate caps, which potentially could cause such RMBS to acquire many of the characteristics of fixed-rate securities if interest rates were to rise above the cap levels. We generally fund our fixed-rate target assets with short-term borrowings. Therefore, there will be an interest rate mismatch between our assets and liabilities. Although we hedge to minimize interest rate exposure, the use of interest rate hedges also introduces the risk of other interest rate mismatches and exposures. During periods of changing interest rates, these mismatches could cause our business, financial condition and results of operations and ability to make distributions to our stockholders to be materially adversely affected.
Ordinarily, short-term interest rates are lower than long-term interest rates. If short-term interest rates rise disproportionately relative to long-term interest rates (a flattening of the yield curve), our borrowing costs may increase more rapidly than the interest income earned on our assets. Because we expect that our investments in RMBS, on average, will bear interest based on longer-term rates than our borrowings, a flattening of the yield curve would tend to decrease our net income and the market value of our assets. Additionally, to the extent cash flows from RMBS are reinvested in new RMBS, the spread between the yields of the new RMBS and available borrowing rates may decline, which could reduce our net interest margin or result in losses. Any one of the foregoing risks could materially adversely affect our business, financial condition and results of operations and our ability to pay distributions to our stockholders. It is also possible that short-term interest rates may exceed long-term interest rates, in which event our borrowing costs may exceed our interest income and we could incur operating losses.
We cannot predict the impact future actions by regulators or U.S. government bodies, including the U.S. Federal Reserve, will have on our business, and any such actions may negatively impact us.
Regulators and U.S. government bodies have a major impact on our business. The U.S. Federal Reserve is a major participant in, and its actions significantly impact, the residential mortgage market. For example, quantitative easing, a program implemented by the U.S. Federal Reserve to keep long-term interest rates low and stimulate the U.S. economy, has had the effect of reducing the difference between short-term and long-term interest rates. As a result of the reduction in long-term interest rates, prepayment speeds increased. Its purchases of Agency RMBS have resulted in a narrowing of the spread earned by Agency RMBS investors. While the U.S. Federal Reserve has discontinued quantitative easing, the effects on the Agency RMBS market have not completely dissipated as it continues to re-invest paydowns of their holdings in Agency RMBS. We cannot predict or control the impact future actions by regulators or U.S. government bodies such as the U.S. Federal Reserve will have on our business. Accordingly, future actions by regulators or U.S. government bodies, including the U.S. Federal Reserve, could have a material and adverse effect on our business, financial condition and results of operations and our ability to pay distributions to our stockholders.
Interest rate caps on the ARMs and hybrid ARMs that may back our RMBS may reduce our net interest margin during periods of rising interest rates.
ARMs and hybrid ARMs are typically subject to periodic and lifetime interest rate caps. Periodic interest rate caps limit the amount an interest rate can increase during any given period. Lifetime interest rate caps limit the amount an interest rate can increase through the maturity of the loan. We generally fund our RMBS with borrowings that typically are not subject to similar restrictions. Accordingly, in a period of rapidly increasing interest rates, our financing costs could increase without limitation while caps could limit the interest we earn on the ARMs and hybrid ARMs that will back our RMBS. This problem is magnified for ARMs and hybrid ARMs that are not fully indexed because such periodic interest rate caps prevent the coupon on the security from fully reaching the specified rate in one reset. Further, some ARMs and hybrid ARMs may be subject to periodic payment caps that result in a portion of the interest being deferred and added to the principal outstanding. As a result, we may receive less cash income on RMBS backed by ARMs and hybrid ARMs than necessary to pay interest on our related borrowings. Interest rate caps on RMBS backed by ARMs and hybrid ARMs could reduce our net interest margin if interest rates were to increase beyond the level of the caps, which could materially adversely affect our business, financial condition and results of operations and our ability to pay distributions to our stockholders.
11
Table of Contents
Our Manager relies on analytical models and other data to analyze potential asset acquisition and disposition opportunities and to manage our portfolio. These models could cause us to purchase assets that do not meet our expectations or to make asset management decisions that are not in line with our strategy.
Our Manager relies on analytical models and information and data supplied by third parties. These models and data may be used to value assets or potential asset acquisitions and dispositions and also in connection with our asset management activities. If these models and data prove to be incorrect, misleading or incomplete, any decisions made in reliance thereon could expose us to potential risks. In addition, models are only as accurate as the assumptions that go into building the models. Our Manager’s use of models and data may induce it to purchase certain assets at prices that are too high, sell certain other assets at prices that are too low or miss favorable opportunities altogether. Similarly, any hedging activities that are based on faulty models and data may prove to be unsuccessful.
Some models, such as prepayment models or mortgage default models, may be predictive in nature. The use of predictive models has inherent risks. For example, such models may incorrectly forecast future behavior, leading to potential losses. In addition, the predictive models used by our Manager may differ substantially from those models used by other market participants, with the result that valuations based on these predictive models may be substantially higher or lower for certain assets than actual market prices. Furthermore, because predictive models are usually constructed based on historical data supplied by third parties, the success of relying on such models may depend heavily on the accuracy and reliability of the supplied historical data, and, in the case of predicting performance in scenarios with little or no historical precedent (such as extreme broad-based declines in home prices, or deep economic recessions or depressions), such models must employ greater degrees of extrapolation, and are therefore more speculative and of more limited reliability.
All valuation models rely on correct market data inputs. If incorrect market data is entered into even a well-founded valuation model, the resulting valuations will be incorrect. However, even if market data is input correctly, “model prices” will often differ substantially from market prices, especially for securities with complex characteristics or whose values are particularly sensitive to various factors. If our market data inputs are incorrect or our model prices differ substantially from market prices, our business, financial condition and results of operations and our ability to make distributions to our stockholders could be materially adversely affected.
Valuations of some of our assets will be inherently uncertain, may be based on estimates, may fluctuate over short periods of time and may differ from the values that would have been used if a ready market for these assets existed.
While in many cases our determination of the fair value of our assets is based on valuations provided by third-party dealers and pricing services, we value assets based upon our judgment, and such valuations may differ from those provided by third-party dealers and pricing services. Valuations of certain assets are often difficult to obtain or unreliable. In general, dealers and pricing services heavily disclaim their valuations. Additionally, dealers generally claim to furnish valuations only as an accommodation and without special compensation, and so they disclaim any and all liability for any direct, incidental or consequential damages arising out of any inaccuracy or incompleteness in valuations, including any act of negligence or breach of any warranty. Depending on the complexity and illiquidity of an asset, valuations of the same asset can vary substantially from one dealer or pricing service to another. The valuation process has been particularly difficult recently because market events have made valuations of certain assets unpredictable, and the disparity of valuations provided by third-party dealers has widened. Our business, financial condition and results of operations and our ability to make distributions to our stockholders could be materially adversely affected if our fair value determinations of these assets are materially higher than actual market values.
An increase in interest rates may cause a decrease in the volume of certain of our target assets, which could adversely affect our ability to acquire target assets that satisfy our investment objectives and to make distributions to our stockholders.
Rising interest rates generally reduce the demand for mortgage loans due to the higher cost of borrowing. A reduction in the volume of mortgage loans originated may affect the volume of target assets available to us, which could adversely affect our ability to acquire assets that satisfy our investment objectives. Rising interest rates may also cause our target assets that were issued prior to an interest rate increase to provide yields that are below prevailing market interest rates. If rising interest rates cause us to be unable to acquire a sufficient volume of our target assets with a yield that is above our borrowing cost, our ability to satisfy our investment objectives and to make distributions to our stockholders could be materially adversely affected.
12
Table of Contents
The lack of liquidity of our assets may adversely affect our business, including our ability to sell our assets.
Excess MSRs are highly illiquid and subject to numerous restrictions on transfers. The duties and obligations of mortgage servicers are defined through contractual agreements. These contracts generally require that holders of Excess MSRs obtain consent from the servicer, and may require third party consent, prior to any change of ownership of such Excess MSRs. Such approval may be withheld for any reason or no reason in the discretion of the third party. Additionally, investments in Excess MSRs are a relatively recent type of transaction, and there have been extremely few investment products that pursue a similar investment strategy. Accordingly, the risks associated with the transaction and structure are not fully known to buyers or sellers. As a result of the foregoing, there is a significant risk that we will be unable to locate a buyer if we wish to sell an Excess MSR. Therefore, we cannot provide any assurance that we will obtain any return or any benefit of any kind from any disposition of Excess MSRs.
In addition, mortgage-related assets generally experience periods of illiquidity, including the period of delinquencies and defaults with respect to residential and commercial mortgage loans during the financial crisis. In addition, validating third-party pricing for illiquid assets may be more subjective than with respect to more liquid assets. Any illiquidity of our assets makes it difficult for us to sell such assets if the need or desire arises. In addition, if we are required to liquidate all or a portion of our portfolio quickly, we may realize significantly less than the value at which we previously recorded our assets. We may also face other restrictions on our ability to liquidate any assets for which we or our Manager has or could be attributed with material non-public information. If we are unable to sell our assets at favorable prices or at all, it could materially adversely affect our business, financial condition and results of operations and our ability to make distributions to our stockholders. Assets that are illiquid are more difficult to finance, and to the extent that we use leverage to finance assets that become illiquid we may lose that leverage or have it reduced. Assets tend to become less liquid during times of financial stress, which is often the time that liquidity is most needed. As a result, our ability to sell assets or vary our portfolio in response to changes in economic and other conditions may be limited by liquidity constraints, which could adversely affect our results of operations and financial condition.
We use leverage in executing our business strategy, which may adversely affect the return on our assets and may reduce cash available for distribution to our stockholders, as well as increase losses when economic conditions are unfavorable.
We use leverage to finance our investments in certain of our target assets and to enhance our financial returns. Our primary source of leverage is short-term borrowings under master repurchase agreements collateralized by our RMBS assets. Other sources of leverage in the future may include credit facilities, including term loans and revolving credit facilities.
Through the use of leverage, we acquire positions with market exposure significantly greater than the amount of capital committed to the transaction. Although we are not required to maintain any particular minimum or maximum target debt-to-equity leverage ratio with respect to our RMBS assets, the amount of leverage we may employ for this asset class will depend upon the availability of particular types of financing and our Manager’s assessment of the credit, liquidity, price volatility, financing counterparty risk and other factors. Our Manager has discretion, without the need for further approval by our board of directors, to change the amount of leverage we utilize for our RMBS. We do not have a targeted debt-to-equity ratio for our RMBS. We use leverage for the primary purpose of financing our RMBS portfolio and not for the purpose of speculating on changes in interest rates. We may, however, be limited or restricted in the amount of leverage we may employ by the terms and provisions of any financing or other agreements that we may enter into in the future, and we are subject to margin calls as a result of our financing activity.
Our ability to achieve our investment and leverage objectives depends on our ability to borrow money in sufficient amounts and on favorable terms. In particular, our ability to execute on our prime mortgage loan strategy and our ability to generate a servicing portfolio is dependent on obtaining sufficient financing on attractive terms. In addition, we must be able to renew or replace our maturing borrowings on a continuous basis. In recent years, investors and financial institutions that lend in the securities repurchase market have tightened lending standards in response to the difficulties and changed economic conditions that have materially adversely affected the RMBS market. These market disruptions have been most pronounced in the non-Agency RMBS market, and the impact has also extended to Agency RMBS, which has made the value of these assets unstable and relatively illiquid compared to prior periods. This could potentially increase our financing costs and reduce our liquidity. In addition, because we rely on short-term financing, we are exposed to changes in the availability of financing which may make it more difficult for us to secure continued financing.
13
Table of Contents
Leverage magnifies both the gains and the losses of our positions. Leverage increases our returns as long as we earn a greater return on investments purchased with borrowed funds than our cost of borrowing such funds. However, if we use leverage to acquire an asset and the value of the asset decreases, the leverage may increase our loss. Even if the asset increases in value, if the asset fails to earn a return that equals or exceeds our cost of borrowing, the leverage will decrease our returns.
We are required to post large amounts of cash as collateral or margin to secure our leveraged positions. In the event of a sudden, precipitous drop in value of our financed assets, we might not be able to liquidate assets quickly enough to repay our borrowings, further magnifying losses. Even a small decrease in the value of a leveraged asset may require us to post additional margin or cash collateral. Our debt service payments and posting of margin or cash collateral will reduce cash flow available for distribution to stockholders. We may not be able to meet our debt service obligations. To the extent that we cannot meet our debt service obligations, we risk the loss of some or all of our assets to sale to satisfy our debt obligations.
To the extent we might be compelled to liquidate qualifying real estate assets to repay debts, our compliance with the REIT rules regarding our assets and our sources of income could be negatively affected, which could jeopardize our qualification as a REIT. Failing to qualify as a REIT would cause us to be subject to U.S. federal income tax (and any applicable state and local taxes) on all of our income and decrease profitability and cash available for distributions to stockholders.
Adverse market developments generally will cause our lenders to require us to pledge additional assets as collateral. If our assets were insufficient to meet these collateral requirements, we might be compelled to liquidate particular assets at inopportune times and at unfavorable prices.
Adverse market developments, including a sharp or prolonged rise in interest rates, a change in prepayment rates or increasing market concern about the value or liquidity of one or more types of our target assets, might reduce the market value of our portfolio, which generally will cause our lenders to initiate margin calls. A margin call means that the lender requires us to pledge additional collateral to re-establish the ratio of the value of the collateral to the amount of the borrowing. If we are unable to satisfy margin calls, our lenders may foreclose on our collateral. The liquidation of collateral may jeopardize our ability to qualify as a REIT. Our failure to qualify as a REIT would cause us to be subject to U.S. federal income tax (and any applicable state and local taxes) on all of our income and decrease profitability and cash available for distribution to our stockholders.
Our use of repurchase transactions gives our lenders greater rights in the event that we file for bankruptcy, which may make it difficult for us to recover our collateral in the event of a bankruptcy filing.
Our borrowings under master repurchase agreements are intended to qualify for special treatment under the bankruptcy code, giving our lenders the ability to void the automatic stay provisions of the bankruptcy code and take possession of and liquidate collateral pledged in our repurchase transactions without delay if we file for bankruptcy. Furthermore, the special treatment of repurchase agreements under the bankruptcy code may make it difficult for us to recover our pledged assets in the event that any of our lenders files for bankruptcy. Thus, the use of repurchase transactions exposes our pledged assets to risk in the event of a bankruptcy filing by either our lenders or us.
If our lenders default on their obligations to resell the RMBS back to us at the end of the repurchase transaction term, the value of the RMBS has declined by the end of the repurchase transaction term or we default on our obligations under the repurchase transaction, we will lose money on these transactions, which, in turn, may materially adversely affect our business, financial condition and results of operations and our ability to pay distributions to our stockholders.
When we engage in a repurchase transaction, we initially sell securities to the financial institution in exchange for cash and our counterparty is obligated to resell the securities to us at the end of the term of the transaction, which is typically from 30 to 180 days, but which may be up to 364 days or more. The cash we receive when we initially sell the securities is less than the value of those securities. This difference is referred to as the haircut. If these haircuts are increased we will be required to post additional cash collateral for our Agency RMBS. If our counterparty defaults on its obligation to resell the securities to us, we would incur a loss on the transaction equal to the amount of the haircut (assuming there was no change in the value of the securities).
14
Table of Contents
If we default on one of our obligations under a repurchase transaction, the counterparty can terminate the transaction and cease entering into any other repurchase transactions with us. In that case, we would likely need to establish a replacement repurchase facility with another financial institution in order to continue to leverage our portfolio and carry out our investment strategy. There is no assurance we would be able to establish a suitable replacement facility on acceptable terms or at all.
Hedging against interest rate changes and other risks may materially adversely affect our business, financial condition and results of operations and our ability to make distributions to our stockholders.
Subject to maintaining our qualification as a REIT and exemption from registration under the Investment Company Act, we pursue various hedging strategies to seek to reduce our exposure to adverse changes in interest rates. Our hedging activity varies in scope based on the level and volatility of interest rates, the types of liabilities and assets held and other changing market conditions. Interest rate hedging may fail to protect or could adversely affect us because, among other things:
| • | interest rate hedging can be expensive, particularly during periods of rising and volatile interest rates; |
| • | available interest rate hedges may not correspond directly with the interest rate risk for which protection is sought; |
| • | the duration of the hedge may not match the duration of the related assets or liabilities being hedged; |
| • | to the extent hedging transactions do not satisfy certain provisions of the Code, and are not made through a TRS, the amount of income that a REIT may earn from hedging transactions to offset interest rate losses is limited by U.S. federal tax provisions governing REITs; |
| • | the value of derivatives used for hedging may be adjusted from time to time in accordance with accounting rules to reflect changes in fair value. Downward adjustments or “mark-to-market losses,” would reduce our stockholders’ equity; |
| • | the credit quality of the hedging counterparty owing money on the hedge may be downgraded to such an extent that it impairs our ability to sell or assign our side of the hedging transaction; and |
| • | the hedging counterparty owing money in the hedging transaction may default on its obligation to pay. |
Our hedging transactions, which are intended to limit losses, may actually adversely affect our earnings, which could reduce our cash available for distribution to our stockholders.
Changes in regulations relating to swaps activities may cause us to limit our swaps activity or subject us and our Manager to additional disclosure, recordkeeping, and other regulatory requirements.
The enforceability of agreements underlying hedging transactions may depend on compliance with applicable statutory and commodity and other regulatory requirements and, depending on the identity of the counterparty, applicable international requirements. Recently, new regulations have been promulgated by U.S. and foreign regulators attempting to strengthen oversight of derivative contracts. Any actions taken by regulators could constrain our strategy and could increase our costs, either of which could materially and adversely affect our business, financial condition and results of operations and our ability to make distributions to our stockholders. In particular, the Dodd-Frank Act requires most derivatives to be executed on a regulated market and cleared through a central counterparty, which has resulted in increased margin requirements and costs. On December 7, 2012, the CFTC issued a no-action letter that provides mortgage REITs relief from such registration, or the MREIT No-Action Letter, if they meet certain conditions and submit a claim for such no-action relief. We believe we meet the conditions set forth in the MREIT No-Action Letter and we have filed our claim with the CFTC to perfect the use of the no-action relief from registration. However, if in the future we do not meet the conditions set forth in the MREIT No-Action Letter or the relief provided by the MREIT No-Action Letter becomes unavailable for any other reason, we may need to seek to obtain another exemption from registration or our Manager may be required to register as a “commodity pool operator” with the CFTC. If our Manager is required to register with the CFTC as a commodity pool operator, our Manager would become subject to additional disclosure, recordkeeping and reporting requirements, which may increase the expenses we reimburse to our Manager pursuant to the management agreement.
15
Table of Contents
We may change our investment strategy, investment guidelines and asset allocation without notice or stockholder consent, which may result in riskier investments. In addition, our charter provides that our board of directors may authorize us to revoke or otherwise terminate our REIT election, without the approval of our stockholders.
Our board of directors has the authority to change our investment strategy or asset allocation at any time without notice to or consent from our stockholders. To the extent that our investment strategy changes in the future, we may make investments that are different from, and possibly riskier than, the investments described in this Annual Report and the other documents we file with the SEC from time to time. A change in our investment or leverage strategy may increase our exposure to interest rate and real estate market fluctuations or require us to sell a portion of our existing investments, which could result in gains or losses and therefore increase our earnings volatility. Decisions to employ additional leverage in executing our investment strategies could increase the risk inherent in our asset acquisition strategy. Furthermore, a change in our asset allocation could result in our allocating assets in a different manner than as described in this Annual Report.
In addition, our charter provides that our board of directors may authorize us to revoke or otherwise terminate our REIT election, without the approval of our stockholders, if it determines that it is no longer in our best interests to qualify as a REIT. These changes could adversely affect our financial condition, results of operations, the market value of our common stock, and our ability to make distributions to our stockholders.
We operate in a highly competitive market.
Our profitability depends, in large part, on our ability to acquire targeted assets at favorable prices. We compete with a number of entities when acquiring our targeted assets, including other mortgage REITs, financial companies, public and private funds, commercial and investment banks and residential and commercial finance companies. We may also compete with the U.S. Federal Reserve and the U.S. Treasury to the extent they purchase assets in our targeted asset classes. Many of our competitors are substantially larger and have considerably greater access to capital and other resources than we do. Furthermore, new companies with significant amounts of capital have recently been formed or have raised additional capital, and may continue to be formed and raise additional capital in the future, and these companies may have objectives that overlap with ours, which may create competition for assets we wish to acquire. Some competitors may have a lower cost of funds and access to funding sources that are not available to us, such as funding from the U.S. Government or a Federal Home Loan Bank. In addition, some of our competitors may have higher risk tolerances or different risk assessments, which could allow them to consider a wider variety of assets to acquire and establish more relationships than us. We also may have different operating constraints from those of our competitors including, among others, (i) tax-driven constraints such as those arising from our qualification as a REIT, (ii) restraints imposed on us by our attempt to comply with certain exclusions from the definition of an “investment company” or other exemptions under the Investment Company Act and (iii) restraints and additional costs arising from our status as a public company. Furthermore, competition for assets in our targeted asset classes may lead to the price of such assets increasing, which may further limit our ability to generate desired returns. We cannot assure you that the competitive pressures we face will not have a material adverse effect on our business, financial condition and results of operations.
Our ability to make distributions to our stockholders depends on our operating results, our financial condition and other factors, and we may not be able to make regular cash distributions at a fixed rate or at all under certain circumstances.
We intend to continue to make distributions to our stockholders in amounts such that we distribute all or substantially all of our REIT taxable income in each year (subject to certain adjustments). This distribution policy will enable us to avoid being subject to U.S. federal income tax on our taxable income that we distribute to our stockholders. However, our ability to make distributions will depend on our earnings, applicable law, our financial condition and such other factors as our board of directors may deem relevant from time to time. We will declare and make distributions to our stockholders only to the extent approved by our board of directors.
16
Table of Contents
Residential whole mortgage loans are subject to increased risks.
We may acquire and manage pools of residential whole mortgage loans. Residential whole mortgage loans are subject to increased risks of loss. Unlike RMBS, whole mortgage loans generally are not guaranteed by the U.S. Government or any GSE, though in some cases they may benefit from private mortgage insurance. Additionally, by directly acquiring whole mortgage loans, we do not receive the structural credit enhancements that benefit senior tranches of RMBS. A whole mortgage loan is directly exposed to losses resulting from default. Therefore, the value of the underlying property, the creditworthiness and financial position of the borrower and the priority and enforceability of the lien will significantly impact the value of such mortgage. In the event of a foreclosure, we may assume direct ownership of the underlying real estate. The liquidation proceeds upon sale of such real estate may not be sufficient to recover our cost basis in the loan, and any costs or delays involved in the foreclosure or liquidation process may increase losses.
Whole mortgage loans are also subject to “special hazard” risk (property damage caused by hazards, such as earthquakes or environmental hazards, not covered by standard property insurance policies), and to bankruptcy risk (reduction in a borrower’s mortgage debt by a bankruptcy court). In addition, claims may be assessed against us on account of our position as a mortgage holder or property owner, including assignee liability, responsibility for tax payments, environmental hazards and other liabilities. In some cases, these liabilities may be “recourse liabilities” or may otherwise lead to losses in excess of the purchase price of the related mortgage or property.
The completion of the acquisition of Aurora and its MSR portfolio is subject to third-party consents and approvals, which may not be obtained on the terms or timeline currently contemplated, or at all.
On February 10, 2015, we announced that Solutions entered into a securities purchase agreement to acquire Aurora and its MSR portfolio. This transaction is expected to close by the end of the second quarter of 2015. Although the Company and Aurora have started to seek approval for the change in control from the regulatory authorities and Agencies, no assurance can be given that the required regulatory and Agency approvals will be obtained or that the transaction will close within the anticipated timeframe, or at all. If the acquisition is not completed on the terms or timeline currently contemplated, it will significantly delay our ability to execute our strategy relating to MSRs and prime mortgage loans, which could negatively impact our business. Even if the acquisition of Aurora is completed, other factors such as the availability of attractive financing may make this acquisition less beneficial than anticipated.
Risks Related to our Relationship with our Manager and Freedom Mortgage
Our Manager has limited experience operating a REIT and we cannot assure you that our Manager’s past experience will be sufficient to successfully manage our business as a REIT.
Our Manager has limited experience operating a REIT. The REIT provisions of the Code are complex, and any failure to comply with those provisions in a timely manner could prevent us from qualifying as a REIT or force us to pay unexpected taxes and penalties. In such event, our net income would be reduced and we could incur a loss.
Our Manager has limited experience operating a public company or complying with regulatory requirements, including the Sarbanes-Oxley Act, which may hinder its ability to achieve our objectives.
Prior to our commencement of operations in October 2013, our Manager had no experience operating a public company or complying with regulatory requirements, including the Sarbanes-Oxley Act. Our Manager’s inexperience may hinder our Manager’s ability to achieve our objectives and we cannot assure you that we will be able to successfully execute our business strategies as a public company, or comply with regulatory requirements applicable to public companies.
We are dependent on our Manager and certain key personnel of Freedom Mortgage that are or will be provided to us through our Manager and may not find a suitable replacement if our Manager terminates the management agreement or such key personnel are no longer available to us.
We do not have any employees of our own other than one loan officer employed by Solutions. Our officers are employees of Freedom Mortgage. We have no separate facilities and are completely reliant on our Manager, which has significant discretion as to the implementation of our operating policies and execution of our business strategies and risk
17
Table of Contents
management practices. We also depend on our Manager’s access to the professionals and principals of Freedom Mortgage as well as information and deal flow generated by Freedom Mortgage. The employees of Freedom Mortgage identify, evaluate, negotiate, structure, close and monitor our portfolio. The departure of Messrs. Middleman, Lown or Levine or other senior officers of our Manager, or of a significant number of investment professionals or principals of Freedom Mortgage, could have a material adverse effect on our ability to achieve our objectives.
We can offer no assurance that our Manager will remain our manager or that we will continue to have access to our Manager’s senior management. We are subject to the risk that our Manager will terminate the management agreement or that we may deem it necessary to terminate the management agreement or prevent certain individuals from performing services for us and that no suitable replacement will be found to manage us.
If our management agreement is terminated and no suitable replacement is found to manage us or we are unable to find a suitable replacement on a timely basis, we may not be able to continue to execute our business plan. In addition, our Manager maintains a contractual as opposed to fiduciary relationship with us. No assurances can be given that our Manager will act in our best interests with respect to the allocation of personnel, services and resources to our business. The failure of any of the key personnel of our Manager to service our business with the requisite time and dedication could materially and adversely affect our ability to execute our business plan.
The management fee payable to our Manager is payable regardless of the performance of our portfolio, which may reduce our Manager’s incentive to devote the time and effort to seeking profitable opportunities for our portfolio.
We pay our Manager a management fee, which may be substantial, based on our stockholders’ equity (as defined in the management agreement) regardless of the performance of our portfolio. The management fee takes into account the net issuance proceeds of both common and preferred stock offerings, as well as issuances of equity securities by our operating partnership. Our Manager’s entitlement to non-performance-based compensation might reduce its incentive to devote the time and effort of its professionals and Freedom Mortgage’s professionals to seeking profitable opportunities for our portfolio, which could result in a lower performance of our portfolio and materially adversely affect our business, financial condition and results of operations.
Our Manager’s investment guidelines are very broad, and our board of directors will not approve each decision made by our Manager to acquire, dispose of, or otherwise manage an asset.
Our Manager is authorized to follow very broad guidelines in pursuing our strategy. Our board of directors will periodically review our guidelines and our portfolio and asset-management decisions. However, it generally will not review all of our proposed acquisitions, dispositions and other management decisions. In addition, in conducting periodic reviews, our board of directors will rely primarily on information provided to it by our Manager. Furthermore, our Manager may arrange for us to use complex strategies or to enter into complex transactions that may be difficult or impossible to unwind by the time they are reviewed by our board of directors. Our Manager has great latitude within the broad guidelines in determining the types of assets it may decide are proper for us to acquire and other decisions with respect to the management of those assets subject to our maintaining our qualification as a REIT. Poor decisions could have a material adverse effect on our business, financial condition and results of operations and our ability to make distributions to our stockholders.
Our success heavily relies on our strategic alliance with Freedom Mortgage.
Our success is dependent on our relationship with Freedom Mortgage. We intend to capitalize on this relationship to source opportunities to acquire MSRs and, if applicable, prime mortgage loans. There is no guarantee that we will be successful in negotiating future purchase agreements with Freedom Mortgage for MSRs or prime mortgage loans that it originates on acceptable terms or at all
Freedom Mortgage is a separate and distinct investment vehicle with its own business interests and will be under no obligation to maintain its current business strategy. In addition, to the extent we seek to leverage Freedom Mortgage’s relationships with third parties to generate future investment opportunities in assets such as MSRs and prime mortgage loans, Freedom Mortgage will be under no obligation to co-invest with us or assist us in generating such opportunities.
18
Table of Contents
There will be conflicts of interest in our relationships with our Manager and Freedom Mortgage, which could result in decisions that are not in the best interests of our stockholders.
Our Manager is an affiliate of Freedom Mortgage. Both our Manager and Freedom Mortgage are wholly owned and controlled by Mr. Middleman.
We are dependent on our Manager for our day-to-day management and operations. Various potential and actual conflicts of interest may arise from the activities of Freedom Mortgage and its affiliates by virtue of the fact that our Manager is controlled by Freedom Mortgage. Our executive officers and the officers and employees of our Manager are also officers or employees of Freedom Mortgage and, with the exception of those officers that are dedicated to us, we compete with Freedom Mortgage for access to those individuals. The ability of our Manager’s officers and personnel, with the exception of those officers that are dedicated to us, to engage in other business activities, including the management of Freedom Mortgage, may reduce the time our Manager and certain of its officers and personnel spend managing us.
Our management agreement with our Manager, our strategic alliance agreements between us and Freedom Mortgage and the Excess MSR acquisition and recapture agreements, have been negotiated between related parties and their respective terms, may not be as favorable to us as if they were negotiated on an arm’s-length basis with unaffiliated third parties. Furthermore, we may choose not to enforce, or to enforce less vigorously, our rights under such agreements because of our desire to maintain our ongoing relationships with Freedom Mortgage and our Manager. In the future, Freedom Mortgage may sponsor other vehicles that invest in Excess MSR or prime loans or other investments, and there may be situations where we compete with affiliates of Freedom Mortgage for opportunities to acquire Excess MSR or prime mortgage loans or other assets. Freedom Mortgage is a separate and distinct company with its own business interests and will be under no obligation to maintain its current business strategy. To the extent we seek to leverage Freedom Mortgage’s relationships with third parties to generate future investment opportunities, Freedom Mortgage will be under no obligation to co-invest with us in the future or assist us in generating such opportunities. Freedom Mortgage will be under no obligation, under the terms of the strategic alliance agreement or otherwise, to offer prime loans or other assets other than Excess MSRs and Freedom Mortgage may offer those assets to third parties without offering such assets to us.
In addition, there may be conflicts of interest inherent in our relationship with our Manager and its affiliates to the extent Freedom Mortgage or our Manager invests in or creates new vehicles to invest in Excess MSRs or other assets in which we may invest or whose investment objectives overlap with our investment objectives. Certain investments appropriate for us may also be appropriate for one or more of these other investment vehicles. Members of our board of directors and employees of our Manager who are our officers may serve as officers and/or directors of these other entities. In addition, in the future our Manager or its affiliates may have investments in and/or earn fees from such other investment vehicles that are higher than their economic interests in us and which may therefore create an incentive to allocate investments to such other investment vehicles.
Our management agreement with our Manager generally does not limit or restrict our Manager or its affiliates from engaging in any business or managing other pooled investment vehicles that invest in investments that meet our investment objectives, except that under our management agreement neither our Manager nor any entity controlled by or under common control with our Manager is permitted to raise or sponsor any new pooled investment vehicle whose investment policies, guidelines or plans target as its primary investment category investments in Excess MSRs.
The ability of our Manager and its officers and employees to engage in other business activities, including their employment at Freedom Mortgage, subject to the terms of our management agreement with our Manager, may reduce the amount of time our Manager, its officers or other employees spend managing us. In addition, we may engage (subject to our investment guidelines) in material transactions with Freedom Mortgage or our Manager, including, but not limited to, certain financing arrangements, co-investments in Excess MSRs and purchases of prime mortgage loans and other assets, that present an actual, potential or perceived conflict of interest. It is possible that actual, potential or perceived conflicts could give rise to investor dissatisfaction, litigation or regulatory enforcement actions. Appropriately dealing with conflicts of interest is complex and difficult, and our reputation could be damaged if we fail, or appear to fail, to deal appropriately with
19
Table of Contents
one or more potential, actual or perceived conflicts of interest. Regulatory scrutiny of, or litigation in connection with, conflicts of interest could have a material adverse effect on our reputation, which could materially adversely affect our business in a number of ways, including causing an inability to raise additional funds, a reluctance of counterparties to do business with us, a decrease in the prices of our common and preferred securities and a resulting increased risk of litigation and regulatory enforcement actions.
The management agreement with our Manager was not negotiated on an arm’s-length basis and may not be as favorable to us as if it had been negotiated with an unaffiliated third party and may be costly and difficult to terminate.
The management agreement that we have entered into with our Manager was negotiated between related parties, and its terms, including fees payable, may not be as favorable to us as if it had been negotiated with an unaffiliated third party. Various potential and actual conflicts of interest may arise from the activities of Freedom Mortgage and its affiliates by virtue of the fact that our Manager is controlled by Freedom Mortgage.
Termination of our management agreement without cause is subject to several conditions which may make such a termination difficult and a significant termination fee could be payable by us. That fee will increase the effective cost to us of terminating the management agreement, thereby adversely affecting our ability to terminate our Manager without cause.
Pursuant to the management agreement, our Manager will not assume any responsibility other than to render the services called for thereunder and will not be responsible for any action of our board of directors in following or declining to follow the Manager’s advice or recommendations. Our Manager will maintain a contractual as opposed to a fiduciary relationship with us. Under the terms of the management agreement, our Manager, Freedom Mortgage, and their affiliates and each of their officers, directors, trustees, members, stockholders, partners, managers, Investment Committee members, employees, agents, successors and assigns, will not be liable to us for acts or omissions performed in accordance with and pursuant to the management agreement, except because of acts constituting bad faith, willful misconduct, gross negligence, fraud or reckless disregard of their duties under the management agreement. In addition, we will indemnify our Manager, Freedom Mortgage, and their affiliates and each of their officers, directors, trustees, members, stockholders, partners, managers, Investment Committee members, employees, agents, successors and assigns, with respect to all expenses, losses, damages, liabilities, demands, charges and claims arising from acts of our Manager not constituting bad faith, willful misconduct, gross negligence, fraud or reckless disregard of duties, performed in good faith in accordance with and pursuant to the management agreement.
If our Manager ceases to be our Manager pursuant to the management agreement, our lenders and our derivative counterparties may cease doing business with us.
If our Manager ceases to be our Manager, it would constitute an event of default or early termination event under many of our financing and hedging agreements, upon which our counterparties would have the right to terminate their agreements with us. If our Manager ceases to be our Manager for any reason, including upon the non-renewal of our management agreement, and we are unable to obtain financing or enter into or maintain derivative transactions, our business, financial condition and results of operations and our ability to make distributions to our stockholders may be materially adversely affected.
Risks Related to Our Organizational Structure
Maintenance of our exclusion from regulation as an investment company under the Investment Company Act imposes significant limitations on our operations.
We intend to continue to conduct our operations so that neither we nor any of our subsidiaries is required to register as an investment company under the Investment Company Act. We conduct our business primarily through our operating partnership and its wholly-owned subsidiaries. The securities issued by our subsidiaries that are excluded from the definition of “investment company” under Section 3(c)(7) of the Investment Company Act, together with other investment securities we may own, cannot exceed 40% of the value of all our assets (excluding U.S. Government securities and cash) on an unconsolidated basis. This requirement limits the types of businesses in which we may engage and the assets we may hold. Certain of our subsidiaries rely on the exclusion provided by Section 3(c)(5)(C) under the Investment Company Act. Section 3(c)(5)(C) of the Investment Company Act is designed for entities “primarily engaged in the business of purchasing or otherwise acquiring
20
Table of Contents
mortgages and other liens on and interests in real estate.” This exclusion generally requires that at least 55% of the entity’s assets on an unconsolidated basis consist of qualifying real estate assets and at least 80% of the entity’s assets consist of qualifying real estate assets or real estate-related assets. These requirements limit the assets those subsidiaries can own and the timing of sales and purchases of those assets.
To classify the assets held by our subsidiaries as qualifying real estate assets or real estate-related assets, we rely on no-action letters and other guidance published by the SEC staff regarding those kinds of assets, as well as upon our analyses (in consultation with outside counsel) of guidance published with respect to other types of assets. There can be no assurance that the laws and regulations governing the Investment Company Act status of companies similar to ours, or the guidance from the SEC or its staff regarding the treatment of assets as qualifying real estate assets or real estate-related assets, will not change in a manner that adversely affects our operations. In fact, in August 2011, the SEC published a concept release in which it asked for comments on this exclusion from regulation. To the extent that the SEC staff provides more specific guidance regarding any of the matters bearing upon our exemption from the need to register under the Investment Company Act, we may be required to adjust our strategy accordingly. Any additional guidance from the SEC staff could further inhibit our ability to pursue the strategies that we have chosen. Furthermore, although we intend to monitor the assets of our subsidiaries regularly, there can be no assurance that our subsidiaries will be able to maintain their exclusion from registration. Any of the foregoing could require us to adjust our strategy, which could limit our ability to make certain investments or require us to sell assets in a manner, at a price or at a time that we otherwise would not have chosen. This could negatively affect the value of our common stock, the sustainability of our business model and our ability to make distributions.
The ownership limits in our charter may discourage a takeover or business combination that may have benefited our stockholders.
To assist us in qualifying as a REIT, among other purposes, our charter generally limits the beneficial or constructive ownership of our stock by any person, other than Mr. Middleman, to no more than 9.0% in value or the number of shares, whichever is more restrictive, of the outstanding shares of any class or series of our stock. This and other restrictions on ownership and transfer of our shares of stock contained in our charter may discourage a change of control of us and may deter individuals or entities from making tender offers for our common stock on terms that might be financially attractive to you or which may cause a change in our management. In addition to deterring potential transactions that may be favorable to our stockholders, these provisions may also decrease your ability to sell our common stock.
Our stockholders’ ability to control our operations is severely limited.
Our board of directors approves our major strategies, including our strategies regarding investments, financing, growth, debt capitalization, REIT qualification and distributions. Our board of directors may amend or revise these and other strategies without a vote of our stockholders.
Certain provisions of Maryland law could inhibit a change in our control.
Certain provisions of the Maryland General Corporation Law, or the MGCL, may have the effect of inhibiting a third party from making a proposal to acquire us or impeding a change of control under circumstances that otherwise could provide our stockholders with the opportunity to realize a premium over the then-prevailing market price of our common stock, including:
| • | “business combination” provisions that, subject to limitations, prohibit certain business combinations between us and an “interested stockholder” (defined generally as any person who beneficially owns 10% or more of the voting power of our outstanding voting stock or an affiliate or associate of ours who, at any time within the two-year period immediately prior to the date in question, was the beneficial owner of 10% or more of the voting power of our then-outstanding stock) or an affiliate of an interested stockholder for five years after the most recent date on which the stockholder became an interested stockholder, and thereafter require two supermajority stockholder votes to approve any such combination; and |
| • | “control share” provisions that provide that a holder of “control shares” of the Company (defined as voting shares of stock which, when aggregated with all other shares of stock owned by the acquiror or in respect of which the acquiror is able to exercise or direct the exercise of voting power (except solely by virtue of a |
21
Table of Contents
| revocable proxy), entitle the acquiror to exercise one of three increasing ranges of voting power in electing directors) acquired in a “control share acquisition” (defined as the direct or indirect acquisition of ownership or control of issued and outstanding “control shares,” subject to certain exceptions) generally has no voting rights with respect to the control shares except to the extent approved by our stockholders by the affirmative vote of two-thirds of all the votes entitled to be cast on the matter, excluding all interested shares. |
We have elected to opt-out of these provisions of the MGCL, in the case of the business combination provisions, by resolution of our board of directors exempting any business combination between us and any other person (provided that such business combination is first approved by our board of directors, including a majority of our directors who are not affiliates or associates of such person), and, in the case of the control share provisions, pursuant to a provision in our bylaws. However, our board of directors may by resolution elect to repeal the foregoing opt-out from the business combination provisions of the MGCL, and we may, by amendment to our bylaws, opt in to the control share provisions of the MGCL in the future.
Our authorized but unissued common and preferred stock may prevent a change in our control.
Our charter authorizes us to issue additional authorized but unissued common stock and preferred stock without stockholder approval. In addition, our board of directors may, without stockholder approval, (i) amend our charter to increase or decrease the aggregate number of our shares of stock or the number of shares of any class or series of stock that we have authority to issue, (ii) classify or reclassify any unissued common stock or preferred stock and set the preferences, rights and other terms of the classified or reclassified shares. As a result, among other things, our board may establish a class or series of common stock or preferred stock that could delay or prevent a transaction or a change in our control that might involve a premium price for our common stock or otherwise be in the best interests of our stockholders.
Our rights and the rights of our stockholders to take action against our directors and officers are limited, which could limit your recourse in the event of actions not in your best interest.
Our charter limits the liability of our present and former directors and officers to us and our stockholders for money damages to the maximum extent permitted under Maryland law. Under current Maryland law, our present and former directors and officers will not have any liability to us or our stockholders for money damages other than liability resulting from:
| • | actual receipt of an improper benefit or profit in money, property or services; or |
| • | active and deliberate dishonesty by the director or officer that was established by a final judgment and is material to the cause of action. |
In addition, our charter authorizes us to indemnify our present and former directors and officers for actions taken by them in those and other capacities to the maximum extent permitted by Maryland law and our bylaws require us to indemnify our present and former directors and officers, to the maximum extent permitted by Maryland law, in the defense of any proceeding to which he or she is made, or threatened to be made, a party by reason of his or her service to us as a director or officer in these and other capacities. In addition, we may be obligated to pay or reimburse the expenses incurred by our present and former directors and officers without requiring a preliminary determination of their ultimate entitlement to indemnification. As a result, we and our stockholders may have more limited rights against our present and former directors and officers than might otherwise exist absent the current provisions in our charter and bylaws or that might exist with other companies, which could limit your recourse in the event of actions not in your best interests.
Our charter contains provisions that make removal of our directors difficult, which could make it difficult for our stockholders to effect changes to our management.
Our charter provides that, subject to the rights of holders of one or more classes or series of preferred stock to elect or remove one or more directors, a director may be removed only for “cause” (as defined in our charter), and then only by the affirmative vote of at least two-thirds of the votes entitled to be cast generally in the election of directors. Vacancies may be filled only by a majority of the remaining directors in office, even if less than a quorum, for the full term of the directorship in which the vacancy occurred (other than vacancies among any directors elected by the holder or holders of any class or series of preferred stock, if such right exists). These requirements make it more difficult to change our management by removing and replacing directors and may prevent a change in our control that is in the best interests of our stockholders.
22
Table of Contents
Risks Related to Our Common Stock
The market price and trading volume of our common stock may be volatile.
The market price of our common stock may be highly volatile and subject to wide fluctuations. In addition, the trading volume in our common stock may fluctuate and cause significant price variations to occur. The stock market has experienced price and volume fluctuations that have affected the market price of many companies in industries similar or related to ours and that have been unrelated to these companies’ operating performances. If the market price of our common stock declines significantly, you may be unable to resell your shares at a gain. Further, fluctuations in the trading price of our common stock may adversely affect the liquidity of the trading market for our common stock and, in the event that we seek to raise capital through future equity financings, our ability to raise such equity capital.
We cannot assure you that the market price of our common stock will not fluctuate or decline significantly in the future. Some of the factors that could negatively affect our share price or result in fluctuations in the price or trading volume of our common stock include:
| • | actual or anticipated variations in our quarterly operating results; |
| • | increases in market interest rates that lead purchasers of our common stock to demand a higher yield or to seek alternative investments; |
| • | changes in market valuations of similar companies; |
| • | adverse market reaction to any increased indebtedness we incur in the future; |
| • | additions or departures of key personnel; |
| • | actions by stockholders; |
| • | speculation in the press or investment community; |
| • | general market, economic and political conditions and the impact of these conditions on the global credit markets; |
| • | the operating performance of other similar companies; |
| • | changes in accounting principles; and |
| • | passage of legislation or other regulatory developments that adversely affect us or our industry. |
For as long as we are an emerging growth company, we will not be required to comply with certain reporting requirements, including those relating to accounting standards and disclosure about our executive compensation, that apply to other public companies.
We are an “emerging growth company,” as defined in Section 2(a) of the Securities Act of 1933, as amended, or the Securities Act, as modified by the JOBS Act. As such, we are eligible to take advantage of certain exemptions from various reporting requirements that are applicable to other public companies that are not “emerging growth companies,” including, but not limited to, not being required to comply with the auditor attestation requirements of Section 404(b) of the Sarbanes-Oxley Act, reduced disclosure obligations regarding executive compensation in our periodic reports and proxy statements and exemptions from the requirements of holding a non-binding advisory vote on executive compensation and of stockholder approval of any golden parachute payments not previously approved. We have not made a decision whether to take advantage of any or all of these exemptions. If we do take advantage of any of these exemptions, we do not know if some investors will find our common stock less attractive as a result. The result may be a less active trading market for our common stock and our stock price may be more volatile.
We could remain an “emerging growth company” for up to five years or until the earliest of (a) the last day of the first fiscal year in which our annual gross revenues exceed $1 billion, (b) the date that we become a “large accelerated filer”
23
Table of Contents
as defined in Rule 12b-2 under the Securities Exchange Act of 1934, as amended, or, Exchange Act, which would occur if the market value of our common stock that is held by non-affiliates exceeds $700 million as of the last business day of our most recently completed second fiscal quarter, or (c) the date on which we have issued more than $1 billion in non-convertible debt securities during the preceding three-year period.
In addition, pursuant to Section 107 of the JOBS Act, as an “emerging growth company,” we are permitted to take advantage of the extended transition period provided in Section 7(a)(2)(B) of the Securities Act for complying with new or revised accounting standards, which would allow us to delay the adoption of certain accounting standards until those standards would otherwise apply to private companies. We have elected to take advantage of the benefits of this extended transition period. This election is irrevocable. As a result of our election to utilize the extended transition period, our financial statements may not be comparable to those of other public companies that comply with such new or revised accounting standards. Please refer to “Item 7. Management’s Discussion and Analysis of Financial Condition and Results of Operations—Critical Accounting Policies and Estimates—Emerging Growth Company Status” for further discussion of our election to utilize the extended transition period for complying with new or revised accounting standards.
Future sales of our common stock or other securities convertible into our common stock could cause the market value of our common stock to decline and could result in dilution of your shares.
Sales of substantial amounts of shares of our common stock could cause the market price of our common stock to decrease significantly. We cannot predict the effect, if any, of future sales of our common stock, or the availability of shares of our common stock for future sales, on the value of our common stock. Sales of substantial amounts of shares of our common stock, or the perception that such sales could occur, may adversely affect prevailing market values for our common stock.
Future offerings of debt securities, which would rank senior to our common stock upon our bankruptcy liquidation, and future offerings of equity securities, which would dilute the common stock holdings of our existing stockholders and may be senior to our common stock for the purposes of dividend and liquidating distributions, may adversely affect the market price of our common stock.
In the future, we may attempt to increase our capital resources by making offerings of debt securities or additional offerings of equity securities. Upon bankruptcy or liquidation, holders of our debt securities and shares of our preferred stock and lenders with respect to other borrowings will receive a distribution of our available assets prior to the holders of shares of our common stock. Our preferred stock, if issued, could have a preference on liquidating distributions or a preference on dividend payments or both that could limit our ability to pay a dividend or other distribution to the holders of our common stock. Because our decision to issue securities in any future offering will depend on market conditions and other factors beyond our control, we cannot predict or estimate the amount, timing or nature of our future offerings. Thus, holders of our common stock bear the risk of our future offerings reducing the market price of our common stock and diluting their shareholdings in our company.
U.S. Federal Income Tax Risks
Our failure to qualify as a REIT would subject us to U.S. federal, state and local income taxes, which could adversely affect the value of our common stock and would substantially reduce the cash available for distribution to our stockholders.
We operate in a manner that is intended to cause us to qualify as a REIT for federal income tax purposes. However, the federal income tax laws governing REITs are complex, and interpretations of the federal income tax laws governing qualification as a REIT are limited. Moreover, our qualification and taxation as a REIT depend upon our ability to meet on a continuing basis, through actual annual operating results, certain qualification tests set forth in the federal income tax laws. Although we intend to operate so that we will qualify as a REIT, given the complex nature of the rules governing REITs, the ongoing importance of factual determinations, including the potential tax treatment of the investments we make, and the possibility of future changes in our circumstances, no assurance can be given that our actual results of operations for any particular taxable year will satisfy such requirements.
24
Table of Contents
If we fail to qualify as a REIT in any calendar year, and do not qualify for certain statutory relief provisions, we would be required to pay U.S. federal income tax (and any applicable state and local taxes), including any applicable alternative minimum tax, on our taxable income at regular corporate rates, and dividends paid to our stockholders would not be deductible by us in computing our taxable income (although such dividends received by certain stockholders taxed at individual rates generally would be subject to a preferential rate of taxation). Further, if we fail to qualify as a REIT, we might need to borrow money or sell assets in order to pay any resulting tax. Our payment of income tax would decrease the amount of our income available for distribution to our stockholders. Furthermore, if we fail to qualify or maintain our qualification as a REIT, we no longer would be required under U.S. federal tax laws to distribute substantially all of our REIT taxable income to our stockholders. Unless our failure to qualify as a REIT was subject to relief under federal tax laws, we could not re-elect to qualify as a REIT until the fifth calendar year following the year in which we failed to qualify.
Complying with REIT requirements may cause us to forego or liquidate otherwise attractive investments.
To qualify as a REIT, we must continually satisfy various tests regarding the sources of our income, the nature and diversification of our assets, the amounts we distribute to our stockholders and the ownership of our common stock. In order to meet these tests, we may be required to forego investments we might otherwise make. We may be required to make distributions to stockholders at disadvantageous times or when we do not have funds readily available for distribution, and may be unable to pursue investments that would be otherwise advantageous to us in order to satisfy the source of income or asset diversification requirements for qualifying as a REIT. Thus, compliance with the REIT requirements may hinder our investment performance.
Failure to make required distributions would subject us to tax, which would reduce the cash available for distribution to our stockholders.
To qualify as a REIT, we must distribute to our stockholders each calendar year at least 90% of our REIT taxable income (including certain items of non-cash income), determined without regard to the deduction for dividends paid and excluding net capital gain. To the extent that we satisfy the 90% distribution requirement, but distribute less than 100% of our taxable income, we will be subject to federal corporate income tax on our undistributed income. In addition, we will incur a 4% nondeductible excise tax on the amount, if any, by which our distributions in any calendar year are less than the sum of:
| • | 85% of our REIT ordinary income for that year; |
| • | 95% of our REIT capital gain net income for that year; and |
| • | any undistributed taxable income from prior years. |
We intend to distribute our taxable income to our stockholders in a manner intended to satisfy the 90% distribution requirement and to avoid both corporate income tax and the 4% nondeductible excise tax. However, there is no requirement that TRSs distribute their after tax net income to their parent REIT or its stockholders.
Our taxable income may substantially exceed our net income as determined based on GAAP, because, for example, realized capital losses will be deducted in determining our GAAP net income, but may not be deductible in computing our taxable income. In addition, we may invest in assets that generate taxable income in excess of economic income or in advance of the corresponding cash flow from the assets. As a result of the foregoing, we may generate less cash flow than taxable income in a particular year. To the extent that we generate such non-cash taxable income in a taxable year, we may incur corporate income tax and the 4% nondeductible excise tax on that income if we do not distribute such income to stockholders in that year. In that event, we may be required to use cash reserves, incur debt, sell assets, make taxable distributions of our shares or debt securities or liquidate non-cash assets at rates or at times that we regard as unfavorable to satisfy the distribution requirement and to avoid corporate income tax and the 4% nondeductible excise tax in that year.
Despite qualification as a REIT, we may face other tax liabilities that reduce our cash flows.
Despite qualification as a REIT, we may be subject to certain federal, state and local taxes on our income and assets, including taxes on any undistributed income, tax on income from some activities conducted as a result of a foreclosure, and state or local income, property and transfer taxes. In addition, Solutions and any other TRSs we form will be subject to regular corporate federal, state and local taxes. Any of these taxes would decrease cash available for distributions to stockholders.
25
Table of Contents
We may lose our REIT qualification or be subject to a penalty tax if the U.S. Internal Revenue Service, or IRS, successfully challenges our characterization of our investments in Excess MSRs.
We invest in Excess MSRs. The IRS has issued two private letter rulings to other REITs holding that Excess MSRs are qualifying assets for purposes of the 75% asset test and produce qualifying income for purposes of the 75% gross income test. Any income that is qualifying income for the 75% gross income test is also qualifying income for the 95% gross income test. A private letter ruling may be relied upon only by the taxpayer to whom it is issued, and the IRS may revoke a private letter ruling. Based on these private letter rulings and other IRS guidance regarding excess mortgage servicing fees, we generally intend to treat our investments in Excess MSRs as qualifying assets for purposes of the 75% asset test and as producing qualifying income for purposes of the 95% and 75% gross income tests. However, we have not sought, and we do not intend to seek, our own private letter ruling. Thus, it is possible that the IRS could successfully take the position that our Excess MSRs are not qualifying assets or do not produce qualifying income, presumably by recharacterizing Excess MSRs as an interest in servicing compensation, in which case we may fail one or more of the income and asset requirements for REIT qualification. If we failed one of those tests, we would either be required to pay a penalty tax, which could be material, to maintain REIT status or we would fail to qualify as a REIT.
The failure of RMBS subject to a repurchase agreement to qualify as real estate assets would adversely affect our ability to qualify as a REIT.
We have entered into repurchase agreements under which we nominally sell certain of our RMBS to a counterparty and simultaneously agree to repurchase the sold assets. We believe that, for U.S. federal income tax purposes, these transactions will be treated as secured debt and we will be treated as the owner of the RMBS that are the subject of any such repurchase agreement notwithstanding that such agreements may transfer record ownership of such assets to the counterparty during the term of the agreement. It is possible, however, that the IRS could successfully assert that we do not own the RMBS during the term of the repurchase agreement, in which case we could fail to qualify as a REIT.
Our ability to engage in TBA transactions could be limited by the requirements necessary to qualify as a REIT, and we could fail to qualify as a REIT as a result of these investments.
We purchase and sell TBAs for purposes of managing interest rate risk associated with our liabilities under repurchase agreements. We treat such TBA purchases and sales as hedging transactions that hedge indebtedness incurred to acquire or carry real estate assets, or “qualifying liability hedges” for REIT purposes. From time to time, we also opportunistically engage in TBA transactions because we find them attractive on their own. The law is unclear regarding whether income and gains from TBAs that are not qualifying liability hedges are qualifying income for the 75% gross income test and whether TBAs are qualifying assets for the 75% asset test.
To the extent that we engage in TBA transactions that are not qualifying liability hedges for REIT purposes, unless we receive a favorable private letter ruling from the IRS or we are advised by counsel that income and gains from such TBAs should be treated as qualifying income for purposes of the 75% gross income test, we will limit our income and gains from dispositions of such TBAs and any non-qualifying income to no more than 25% of our gross income for each calendar year. Further, unless we receive a favorable private letter ruling from the IRS or we are advised by counsel that TBAs should be treated as qualifying assets for purposes of the 75% asset test, we will limit our investment in such TBAs and any non-qualifying assets to no more than 25% of our total assets at the end of any calendar quarter and will limit the TBAs held by us that are issued by any one issuer to no more than 5% of our total assets at the end of any calendar quarter. Accordingly, our ability to purchase and sell Agency RMBS through TBAs and to hold or dispose of TBAs, through dollar roll transactions or otherwise, could be limited.
Even if we are advised by counsel that such TBAs should be treated as qualifying assets or that income and gains from such TBAs should be treated as qualifying income, it is possible that the IRS could successfully take the position that such assets are not qualifying assets and such income is not qualifying income. In that event, we could be subject to a penalty tax or we could fail to qualify as a REIT if (i) the value of our TBAs, together with our other non-qualifying assets for the 75% asset test, exceeded 25% of our total assets at the end of any calendar quarter, (ii) the value of our TBAs issued by any one issuer exceeded 5% of our total assets at the end of any calendar quarter, or (iii) our income and gains from our TBAs that are not qualifying liability hedges, together with our non-qualifying income for the 75% gross income test, exceeded 25% of our gross income for any taxable year.
26
Table of Contents
Complying with REIT requirements may limit our ability to hedge effectively.
The REIT provisions of the Code substantially limit our ability to hedge. Our aggregate gross income from non-qualifying hedges, fees, and certain other non-qualifying sources cannot exceed 5% of our annual gross income. As a result, we might have to limit our use of advantageous hedging techniques or implement those hedges through a TRS. Any hedging income earned by a TRS would be subject to federal, state and local income tax at regular corporate rates. This could increase the cost of our hedging activities or expose us to greater risks associated with interest rate changes or other changes than we would otherwise want to bear.
Our ownership of and relationship with Solutions and any future TRSs that we form will be limited and a failure to comply with the limits would jeopardize our REIT status and may result in the application of a 100% excise tax.
A REIT may own up to 100% of the stock of one or more TRSs. A TRS may earn income that would not be qualifying income if earned directly by the parent REIT. Both the subsidiary and the REIT must jointly elect to treat the subsidiary as a TRS. A corporation (other than a REIT) of which a TRS directly or indirectly owns more than 35% of the voting power or value of the stock will automatically be treated as a TRS. Overall, no more than 25% of the value of a REIT’s total assets may consist of stock or securities of one or more TRSs. A domestic TRS will pay federal, state and local income tax at regular corporate rates on any income that it earns. In addition, the TRS rules limit the deductibility of interest paid or accrued by a TRS to its parent REIT to assure that the TRS is subject to an appropriate level of corporate taxation. The rules also impose a 100% excise tax on certain transactions between a TRS and its parent REIT that are not conducted on an arm’s-length basis. Solutions and any future domestic TRS that we may form will pay federal, state and local income tax on its taxable income, and its after-tax net income will be available for distribution to us but is not required to be distributed to us unless necessary to maintain our REIT qualification.
Our ownership limitation may restrict change of control or business combination opportunities in which our stockholders might receive a premium for their common stock.
In order for us to qualify as a REIT for each taxable year after 2013, no more than 50% in value of our outstanding shares of stock may be owned, directly or indirectly, by five or fewer individuals during the last half of any calendar year. “Individuals” for this purpose include natural persons, private foundations, some employee benefit plans and trusts, and some charitable trusts. In order to help us qualify as a REIT, among other purposes, our charter generally prohibits any person, other than Mr. Middleman, from beneficially or constructively owning more than 9.0% in value or in number of shares, whichever is more restrictive, of the outstanding shares of any class or series of our stock.
The ownership limitation and other restrictions could have the effect of discouraging a takeover or other transaction in which holders of shares of our common stock might receive a premium for their common stock over the then-prevailing market price or which holders might believe to be otherwise in their best interests.
Dividends payable by REITs do not qualify for the reduced tax rates available for some dividends.
The maximum tax rate applicable to “qualified dividend income” payable to U.S. stockholders that are taxed at individual rates is 20%. Dividends payable by REITs, however, are generally not eligible for the reduced rates on qualified dividend income. The more favorable rates applicable to regular corporate qualified dividends could cause investors who are taxed at individual rates to perceive investments in REITs to be relatively less attractive than investments in the stocks of non-REIT corporations that pay dividends treated as qualified dividend income, which could adversely affect the value of the shares of REITs, including our common stock.
We may be subject to adverse legislative or regulatory tax changes that could reduce the market price of our common stock.
At any time, the U.S. federal income tax laws or regulations governing REITs or the administrative interpretations of those laws or regulations may be amended. We cannot predict when or if any new U.S. federal income tax law, regulation
27
Table of Contents
or administrative interpretation, or any amendment to any existing U.S. federal income tax law, regulation or administrative interpretation, will be adopted, promulgated or become effective and any such law, regulation or interpretation may take effect retroactively. We and our stockholders could be adversely affected by any such change in, or any new, U.S. federal income tax law, regulation or administrative interpretation.
Our recognition of “phantom” income may reduce a stockholder’s after-tax return on an investment in our common stock.
We may recognize taxable income in excess of our economic income, known as phantom income, in the first years that we hold certain investments, and experience an offsetting excess of economic income over our taxable income in later years. As a result, stockholders at times may be required to pay U.S. federal income tax on distributions that economically represent a return of capital rather than a dividend. These distributions would be offset in later years by distributions representing economic income that would be treated as returns of capital for U.S. federal income tax purposes. Taking into account the time value of money, this acceleration of U.S. federal income tax liabilities may reduce a stockholder’s after-tax return on his or her investment to an amount less than the after-tax return on an investment with an identical before-tax rate of return that did not generate phantom income.
Liquidation of our assets may jeopardize our REIT qualification.
To qualify and maintain our qualification as a REIT, we must comply with requirements regarding our assets and our sources of income. If we are compelled to liquidate our assets to repay obligations to our lenders or for other reasons, we may be unable to comply with these requirements, thereby jeopardizing our qualification as a REIT, or we may be subject to a 100% tax on any resultant gain if we sell assets that are treated as inventory or property held primarily for sale to customers in the ordinary course of business.
Our qualification as a REIT and exemption from U.S. federal income tax with respect to certain assets may be dependent on the accuracy of legal opinions or advice rendered or given or statements by the issuers of assets that we acquire, and the inaccuracy of any such opinions, advice or statements may adversely affect our REIT qualification and result in significant corporate-level tax.
When purchasing securities, we may rely on opinions or advice of counsel for the issuer of such securities, or statements made in related offering documents, for purposes of determining whether such securities represent debt or equity securities for U.S. federal income tax purposes, the value of such securities, and also to what extent those securities constitute qualified real estate assets for purposes of the REIT asset tests and produce income that qualifies under the 75% gross income test. The inaccuracy of any such opinions, advice or statements may adversely affect our ability to qualify as a REIT and result in significant corporate-level tax.
| Item 1B. | Unresolved Staff Comments |
None.
| Item 2. | Properties |
Pursuant to the management agreement that we have entered into with our Manager, our Manager provides us with our office space located at 301 Harper Drive, Suite 110, Moorestown, New Jersey 08057, telephone (877) 870-7005.
| Item 3. | Legal Proceedings |
From time to time, the Company may be involved in various claims and legal actions in the ordinary course of business. As of December 31, 2014, the Company was not involved in any legal proceedings.
| Item 4. | Mine Safety Disclosures |
Not applicable.
28
Table of Contents
| Item 5. | Market for Registrant’s Common Equity, Related Stockholder Matters and Issuer Purchases of Equity Securities |
Market Information
Our common stock has been listed and traded on the New York Stock Exchange (“NYSE”) under the symbol “CHMI” since October 4, 2013. Prior to October 4, 2013, our common stock was not listed on any exchange or over-the-counter market. On March 9, 2015, the closing sale price for our common stock on the NYSE was $18.03 per share. The following table presents the quarterly high and low closing sale prices per share of our common stock on the NYSE from October 4, 2013 to December 31, 2014:
| Common Stock | ||||||||
| High | Low | |||||||
| 2014 |
||||||||
| Fourth Quarter |
$ | 19.06 | $ | 17.58 | ||||
| Third Quarter |
$ | 20.28 | $ | 18.70 | ||||
| Second Quarter |
$ | 20.40 | $ | 18.51 | ||||
| First Quarter |
$ | 19.13 | $ | 17.90 | ||||
| 2013 |
||||||||
| Fourth Quarter |
$ | 18.50 | $ | 17.40 | ||||
Holders
As of March 9, 2015, we had five holders of record of our common stock. The five holders of record include Cede & Co., which holds shares as nominee for The Depository Trust Company, which itself holds shares on behalf of the beneficial owners of our common stock. Such information was obtained from our registrar and transfer agent.
Dividends
The Company has elected to be taxed as a REIT under the Code. To qualify as a REIT, the Company must distribute at least 90% of its annual REIT taxable income to stockholders within the time frame set forth in the Code, and the Company must also meet certain other requirements. Although we may borrow funds to make distributions, cash for such distributions is expected to be largely generated from our results of operations. Dividends are declared and paid at the discretion of our board of directors and depend on our taxable net income, cash available for distribution, financial condition, ability to maintain our qualification as a REIT, and such other factors that our board of directors may deem relevant. From time to time, a portion of our dividends on our capital stock may be characterized as capital gains or return of capital. For 2014 and 2013, $2.03 and $0.45, respectively, of our common stock dividends were characterized as ordinary income to stockholders. (See “Item 1A, Risk Factors,” and “Item 7, Management’s Discussion and Analysis of Financial Conditions and Results of Operations,” of this Annual Report on Form 10-K, for information regarding the sources of funds used for dividends and for a discussion of factors which may adversely affect our ability to pay dividends.)
We declared the following cash dividends on our common stock for the quarterly periods indicated below:
| Declaration Date |
Record Date | Payment Date |
Amount per Share |
|||||||||||||
| 2014 |
||||||||||||||||
| Fourth Quarter |
12/16/2014 | 12/30/2014 | 1/27/2015 | $ | 0.51 | |||||||||||
| Third Quarter |
9/11/2014 | 9/30/2014 | 10/28/2014 | $ | 0.51 | |||||||||||
| Second Quarter |
6/11/2014 | 6/30/2014 | 7/29/2014 | $ | 0.51 | |||||||||||
| First Quarter |
3/18/2014 | 4/2/2014 | 4/29/2014 | $ | 0.50 | |||||||||||
| 2013 |
||||||||||||||||
| Fourth Quarter |
12/17/2013 | 12/27/2013 | 1/28/2014 | $ | 0.45 | |||||||||||
29
Table of Contents
Stockholder Return Performance
The following graph is a comparison of the cumulative total stockholder return on our common stock, the S&P 500 Index, the Russell 2000 Index (the “Russell 2000”) and the SNL Finance REIT Index, a peer group index from October 4, 2013 (commencement of trading on the New York Stock Exchange) to December 31, 2014. The graph assumes that $100 was invested on October 4, 2013 in our common stock, the S&P 500, Russell 2000 and the SNL Finance REIT Index and that all dividends were reinvested without the payment of any commissions. There can be no assurance that the performance of our common stock will continue in line with the same or similar trends depicted in the graph below:
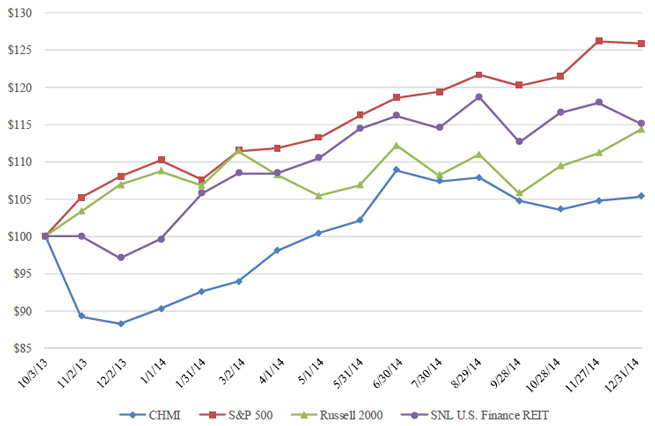
| Period Ended | ||||||||||||||||||||||||
| 10/4/2013 | 12/31/2013 | 3/31/2014 | 6/30/2014 | 9/30/2014 | 12/31/2014 | |||||||||||||||||||
| Cherry Hill Mortgage Investment Corporation |
$ | 100.00 | $ | 91.22 | $ | 98.65 | $ | 108.19 | $ | 103.64 | $ | 105.32 | ||||||||||||
| Russel 2000 |
$ | 100.00 | $ | 109.00 | $ | 110.22 | $ | 112.48 | $ | 104.20 | $ | 114.34 | ||||||||||||
| SNL Finance REIT (A) |
$ | 100.00 | $ | 100.47 | $ | 109.35 | $ | 116.23 | $ | 111.26 | $ | 115.06 | ||||||||||||
| S&P 500 |
$ | 100.00 | $ | 110.67 | $ | 112.67 | $ | 118.57 | $ | 119.91 | $ | 125.82 | ||||||||||||
Source: SNL Financial.
| (A) | In addition to the Company, as of December 31, 2014, the SNL Finance REIT Index comprised the following companies: AG Mortgage Investment Trust, American Capital Agency Corp., American Capital Mortgage Inv, American Church Mortgage Co., Annaly Capital Mgmt Inc., Anworth Mortgage Asset Corp., Apollo Commercial Real Estate, Apollo Residential Mortgage, Arbor Realty Trust Inc., Ares Commercial Real Estate, ARMOUR Residential REIT Inc., Bimini Capital Mgmt Inc., Blackstone Mortgage Trust, Capstead Mortgage Corp., Chimera Investment Corp., Colony Financial Inc., CV Holdings Inc., CYS Investments, Dynex Capital Inc., Ellington Residential Mortgage, Five Oaks Investment Corp, Hannon Armstrong Sustainable, Hatteras Financial Corp., Invesco Mortgage Capital Inc., iStar Financial Inc., JAVELIN Mortgage, JER Investors Trust Inc., Ladder Capital Corp, MFA Financial Inc., New Resdl Invt Corp, New York Mortgage Trust Inc., Newcastle Investment Corp., NorthStar Realty Finance Corp., Orchid Island Capital Inc., Origen Financial Inc., Owens Realty Mortgage Inc., PennyMac Mortgage Investment, RAIT Financial Trust, Redwood Trust Inc., Resource Capital Corp., Starwood Property Trust Inc., Two Harbors Investment Corp., United Development Funding IV, Western Asset Mrtg Cap Corp and ZAIS Financial Corp. |
30
Table of Contents
Securities Authorized For Issuance Under Equity Compensation Plans
During 2013, the board of directors approved and the Company adopted the Cherry Hill Mortgage Investment Corporation 2013 Equity Incentive Plan (“2013 Plan”). The 2013 Plan provides for the grant of options to purchase shares of the Company’s common stock, stock awards, stock appreciation rights, performance units, incentive awards and other equity-based awards, including long term incentive plan units (“LTIP-OP Units”) of the Company’s operating partnership, Cherry Hill Operating Partnership, LP (the “Operating Partnership”). Each LTIP-OP Unit awarded is deemed equivalent to an award of one share of our common stock under the 2013 Plan and reduces the 2013 Plan’s share authorization for other awards on a one-for-one basis.
The following tables present information as of December 31, 2014 and 2013 with respect to the Company’s equity compensation plans:
Equity Incentive Plan Information
As of December 31, 2014
| Number of Securities Issued or to be Issued Upon Exercise of Outstanding Options, Warrants and Rights |
Number of Securities Remaining Available For Future Issuance Under Equity Compensation Plans |
|||||||
| Equity compensation Plans Approved By Securityholders |
1,421,607 | |||||||
| LTIP-OP Units |
68,850 | |||||||
| Shares of Common Stock |
9,543 | |||||||
| Equity Compensation Plans Not Approved By Securityholders |
||||||||
As of December 31, 2013
| Number of Securities Issued or to be Issued Upon Exercise of Outstanding Options, Warrants and Rights |
Number of Securities Remaining Available For Future Issuance Under Equity Compensation Plans |
|||||||
| Equity compensation Plans Approved By Securityholders |
1,462,500 | |||||||
| LTIP-OP Units |
37,500 | |||||||
| Equity Compensation Plans Not Approved By Securityholders |
— | |||||||
31
Table of Contents
| Item 6. | Selected Financial Data |
All currency figures are presented in thousands, except per share amounts or as otherwise noted.
The selected financial data set forth has been derived from our audited consolidated financial statements.
This information should be read in conjunction with “Item 1. Business,” “Item 7. Management’s Discussion and Analysis of Financial Condition and Results of Operations” and the audited consolidated financial statements and notes thereto included under “Item 8. Consolidated Financial Statements and Supplementary Data” in this Annual Report on Form 10-K.
32
Table of Contents
| Operating Data: | Year Ended December 31, 2014 |
Year Ended December 31, 2013 |
Two Month Period October 31, 2012 (date of inception) to December 31, 2012 |
|||||||||
| (dollars in thousands, except per share data) | ||||||||||||
| Income |
||||||||||||
| Interest income |
$ | 24,961 | $ | 5,475 | $ | — | ||||||
| Interest expense |
4,307 | 867 | — | |||||||||
|
|
|
|
|
|
|
|||||||
| Net interest income |
20,654 | 4,608 | — | |||||||||
| Other Income (Loss) |
||||||||||||
| Realized gain (loss) on RMBS, net |
(60 | ) | (527 | ) | — | |||||||
| Realized gain (loss) on derivatives, net |
(2,643 | ) | 59 | — | ||||||||
| Unrealized gain (loss) on derivatives, net |
(6,564 | ) | 2,747 | — | ||||||||
| Unrealized gain (loss) on investments in excess mortgage servicing rights |
(3,564 | ) | 15,647 | — | ||||||||
|
|
|
|
|
|
|
|||||||
| Total Income |
7,823 | 22,534 | — | |||||||||
| Expenses |
||||||||||||
| General and administrative expense |
3,028 | 716 | 25 | |||||||||
| Management fee to affiliate |
2,560 | 616 | — | |||||||||
|
|
|
|
|
|
|
|||||||
| Total Expenses |
5,588 | 1,332 | 25 | |||||||||
|
|
|
|
|
|
|
|||||||
| Income (Loss) Before Income Taxes |
2,235 | 21,202 | (25 | ) | ||||||||
| (Benefit from) provision for corporate business taxes |
(140 | ) | — | — | ||||||||
|
|
|
|
|
|
|
|||||||
| Net Income (Loss) |
2,375 | 21,202 | (25 | ) | ||||||||
| Net income allocated to LTIP - OP Units |
(22 | ) | (107 | ) | — | |||||||
|
|
|
|
|
|
|
|||||||
| Net Income Applicable to Common Stockholders |
$ | 2,353 | $ | 21,095 | $ | (25 | ) | |||||
| Net Income (Loss) Per Share of Common Stock |
||||||||||||
| Basic |
$ | 0.31 | $ | 12.50 | $ | (25.00 | ) | |||||
| Diluted |
$ | 0.31 | $ | 12.50 | $ | (25.00 | ) | |||||
| Weighted Average Number of Shares of Common Stock Outstanding |
||||||||||||
| Basic |
7,505,546 | 1,688,275 | 1,000 | |||||||||
| Diluted |
7,508,827 | 1,688,275 | 1,000 | |||||||||
| Dividends per share of Common Stock |
$ | 2.03 | $ | 0.45 | $ | 0.00 | ||||||
| Balance Sheet Data: | December 31, 2014 | December 31, 2013 | December 31, 2012 | |||||||||
| (dollars in thousands) | ||||||||||||
| RMBS, available-for-sale |
$ | 416,003 | $ | 286,979 | $ | — | ||||||
| Investments in excess mortgage servicing rights at fair value |
91,322 | 110,306 | — | |||||||||
| Total Assets |
531,926 | 427,398 | 1 | |||||||||
| Repurchase agreements |
362,126 | 261,302 | — | |||||||||
| Derivative liabilities |
4,088 | 592 | — | |||||||||
| Dividends payable |
3,830 | 3,375 | — | |||||||||
| Total Liabilities |
371,608 | 266,276 | 25 | |||||||||
| Total Stockholders’ Equity |
160,318 | 161,122 | (24 | ) | ||||||||
| Item 7. | Management’s Discussion and Analysis of Financial Condition and Results of Operations |
The following discussion should be read in conjunction with our audited historical consolidated financial statements and the accompanying notes included in “Item 8. Consolidated Financial Statements and Supplementary Data” of this Annual Report on Form 10-K.
33
Table of Contents
General
Cherry Hill Mortgage Investment Corporation is a residential real estate finance company that acquires, invests in and manages residential mortgage assets in the United States. Our principal objective is to generate attractive current yields and risk-adjusted total returns for our stockholders over the long term, primarily through dividend distributions and secondarily through capital appreciation. We intend to attain this objective by selectively constructing and actively managing a portfolio of Excess MSRs and RMBS, and subject to market conditions, prime mortgage loans and other cashflowing residential mortgage assets such as MSRs.
We are subject to the risks involved with real estate and real estate-related debt instruments. These include, among others, the risks normally associated with changes in the general economic climate, changes in the mortgage market, changes in tax laws, interest rate levels, and the availability of financing.
We are managed by Cherry Hill Mortgage Management, LLC, a Delaware limited liability company, which is wholly owned by Stanley Middleman.
We have elected to be treated as a REIT for U.S. federal income tax purposes.
Our asset acquisition strategy focuses on acquiring a diversified portfolio of residential mortgage assets that balances the risk and reward opportunities our Manager observes in the marketplace. Since the completion of our, IPO and through March 9, 2015, we have allocated a majority of our equity capital, on an unleveraged basis, to Excess MSRs. In addition to our Excess MSRs, we also have invested in RMBS on a leveraged basis as part of our initial portfolio and our longer term strategy. We invested primarily in RMBS backed by whole pools of 30-year, 20-year and 15-year FRMs that offer, what we believe to be, favorable prepayment and duration characteristics. As the market for prime loans grows, we expect our portfolio to include this asset class as well. In addition, we may also invest opportunistically from time to time in other residential mortgage assets.
We finance our RMBS with what we believe to be a prudent amount of leverage, which will vary from time to time based upon the particular characteristics of our portfolio, availability of financing and market conditions. Our borrowings for RMBS currently consist of short-term borrowings under master repurchase agreements collateralized by our RMBS. We do not have a targeted debt-to-equity ratio for our RMBS. As of December 31, 2014 and 2013, our debt-to-equity ratio for our RMBS was approximately 6.2:1, and 6.3:1, respectively. We are actively pursuing limited financing for our Excess MSRs. We also intend to obtain financing for any MSRs that we may acquire. Execution of our prime mortgage loan strategy is dependent on obtaining financing on attractive terms.
Subject to maintaining our qualification as a REIT, we utilize derivative financial instruments (or hedging instruments) to hedge our exposure to potential interest rate mismatches between the interest we earn on our assets and our borrowing costs caused by fluctuations in short-term interest rates. In utilizing leverage and interest rate hedges, our objectives include, where desirable, locking in, on a long-term basis, a spread between the yield on our assets and the cost of our financing in an effort to improve returns to our stockholders.
We also operate our business in a manner that permits us to maintain our exclusion from regulation as an investment company under the Investment Company Act.
Factors Impacting our Operating Results
The results of our operations are affected by a number of factors and primarily depend on, among other things, the level of our net interest income, the market value of our assets and the supply of, and demand for, Excess MSRs, RMBS and other residential mortgage assets in the marketplace. Our net interest income includes the actual interest payments we receive on our Excess MSRs, RMBS and other residential mortgage assets, if any, and is also impacted by the amortization of purchase premiums and accretion of purchase discounts. Changes in various factors such as prepayment speeds, estimated future cash flows and credit quality could impact the amount of premium to be amortized or discount to be accreted into interest income for a given period. Interest rates and prepayment rates vary according to the type of investment, conditions in the financial markets, competition and other factors, none of which can be predicted with any certainty.
34
Table of Contents
Changes in the Market Value of Our Assets
We hold our Excess MSRs as long-term investments. Our Excess MSRs are carried at their fair value with changes in their fair value recorded in other income or loss in our consolidated statements of operations.
Our RMBS are carried at their fair value, as available-for-sale in accordance with ASC 320, Accounting for Certain Investments in Debt or Equity Securities, with changes in fair value recorded through accumulated other comprehensive income or loss, a component of stockholders’ equity. As a result, we do not expect that changes in the market value of our RMBS assets will normally impact our operating results. However, at least on a quarterly basis, we assess both our ability and intent to continue to hold our RMBS as long-term investments. As part of this process, we monitor our RMBS assets for other-than-temporary impairment. A change in our ability and/or intent to continue to hold any of our RMBS assets could result in our recognizing an impairment charge or realizing losses while holding these assets.
Impact of Changes in Market Interest Rates on Servicing Related Assets
Our Excess MSRs are, and any MSRs that we acquire will be, subject to interest rate risk. Generally, in a declining interest rate environment, prepayment speeds increase which in turn would cause the value of the Servicing Related Assets to decrease. Conversely, in an increasing interest rate environment, prepayment speeds decrease which in turn would cause the value of the Servicing Related Assets to increase. To the extent we do not utilize derivatives to hedge against changes in the fair value of the Servicing Related Assets, our balance sheet, results of operations and cash flows are susceptible to significant volatility due to changes in the fair value of, or cash flows from, the Servicing Related Assets as interest rates change. The effects of such a decrease in values on our financial position, results of operations and liquidity are discussed below under “—Exposure of Servicing Related Assets to Prepayment Speed.”
Impact of Changes in Market Interest Rates on Assets Other than Servicing Related Assets
With respect to our business operations, increases in interest rates, in general, may over time cause:
| • | the interest expense associated with our borrowings to increase; |
| • | the value of our assets to fluctuate in value; |
| • | the coupons on any adjustable-rate and hybrid RMBS we may own to reset, although on a delayed basis, to higher interest rates; |
| • | prepayments on our RMBS to slow, thereby slowing the amortization of our purchase premiums and the accretion of our purchase discounts; and |
| • | an increase in the value of any interest rate swap agreements we may enter into as part of our hedging strategy. |
Conversely, decreases in interest rates, in general, may over time cause:
| • | prepayments on our RMBS to increase, thereby accelerating the amortization of our purchase premiums and the accretion of our purchase discounts; |
| • | the interest expense associated with our borrowings to decrease; |
| • | the value of our assets to fluctuate in value; |
| • | to the extent we enter into interest rate swap agreements as part of our hedging strategy, the value of these agreements to decrease; and |
| • | coupons on any adjustable-rate and hybrid RMBS assets we may own to reset, although on a delayed basis, to lower interest rates. |
35
Table of Contents
Exposure of Servicing Related Assets to Prepayment Speed
Prepayment speeds significantly affect the value of the Servicing Related Assets. Prepayment speed is the measurement of how quickly borrowers pay down the UPB of their loans or how quickly loans are otherwise liquidated or charged off. The price we pay to acquire Servicing Related Assets will be based on, among other things, our projection of the cash flows from the related pool of mortgage loans. Our expectation of prepayment speeds is a significant assumption underlying those cash flow projections. If prepayment speeds are significantly greater than expected, the carrying value of the Servicing Related Assets could exceed their estimated fair value. If the fair value of the Servicing Related Assets decreases, we would be required to record a non-cash charge, which would have a negative impact on our financial results. Furthermore, a significant increase in prepayment speeds could materially reduce the ultimate cash flows we receive from the Servicing Related Assets and we could ultimately receive substantially less than what we paid for such assets.
We seek to reduce our exposure to prepayments through the structuring of our investments in Excess MSRs. For example, we have entered into recapture agreements whereby we will receive a new Excess MSR with respect to a loan that was originated by the servicer and used to repay a loan underlying an Excess MSR that we previously acquired from that same servicer. In lieu of receiving an Excess MSR with respect to the loan used to repay a prior loan, the servicer may supply a similar Excess MSR. We will seek to enter into such recapture agreements in order to protect our returns in the event of elevated voluntary prepayment rates. To the extent our counterparties, including Freedom Mortgage, are unable to achieve anticipated recapture rates, we may not benefit from the terms of the recapture agreements we have entered into, and the value of our Excess MSRs could decline. For a summary of the recapture terms related to our existing investments in Excess MSRs, see “—Portfolio—Excess MSRs.”
Impact of Interest Rates on Recapture Activity
The value, and absolute amount, of recapture activity tends to vary inversely with the direction of interest rates. When interest rates are falling, recapture rates tend to be higher due to increased opportunities for borrowers to refinance. As interest rates increase, however, there is likely to be less recapture activity. Since we expect interest rates to rise relative to what they had been in the past, which is likely to reduce the level of voluntary prepayments, we expect recapture rates to be significantly lower than what they had been in the past. However, since voluntary prepayment rates are likely to decline at the same time, we expect overall prepayment rates to remain roughly constant.
Exposure of Assets, Other than Servicing Related Assets, to Prepayment Speed
The value of our assets may be affected by prepayment rates on mortgage loans. If we acquire mortgage loans and mortgage related securities, including RMBS, we anticipate that the mortgage loans or the underlying mortgages will prepay at a projected rate generating an expected yield. If we purchase assets at a premium to par value, when borrowers prepay their mortgage loans faster than expected, the corresponding prepayments on our RMBS or other mortgage-related securities may reduce the expected yield on such securities because we will have to amortize the related premium on an accelerated basis. Conversely, if we purchase assets at a discount to par value, when borrowers prepay their mortgage loans slower than expected, the decrease in corresponding prepayments on our RMBS or other mortgage-related securities may reduce the expected yield on such securities because we will not be able to accrete the related discount as quickly as originally anticipated. Prepayment rates may be affected by a number of factors including, but not limited to, the availability of mortgage credit, the relative economic vitality of the area in which the related properties are located, the servicing of the mortgage loans, possible changes in tax laws, other opportunities for investment, homeowner mobility and other economic, social, geographic, demographic and legal factors, none of which can be predicted with any certainty. Based on our experience, we expect that over time any adjustable-rate and hybrid RMBS and mortgage loans that we own will experience higher prepayment rates than do fixed-rate RMBS and mortgage loans, as we believe that homeowners with adjustable-rate and hybrid mortgage loans exhibit more rapid housing turnover levels or refinancing activity compared to fixed-rate borrowers. In addition, we anticipate that prepayments on adjustable-rate mortgage loans accelerate significantly as the coupon reset date approaches.
Spreads on RMBS
The spread between the yield on our assets and our funding costs affects the performance of our business. Wider spreads imply greater income on new asset purchases but may have a negative impact on our stated book value. Wider
36
Table of Contents
spreads may also negatively impact asset prices. In an environment where spreads are widening, counterparties may require additional collateral to secure borrowings which may require us to reduce leverage by selling assets. Conversely, tighter spreads imply lower income on new asset purchases but may have a positive impact on stated book value of our existing assets. In this case we may be able to reduce the amount of collateral required to secure borrowings.
Extension Risk
Our Manager computes the projected weighted-average life of our assets based on assumptions regarding prepayment rates. In general, when we acquire RMBS backed by FRMs or hybrid ARMs, we may, but are not required to, enter into an interest rate swap agreement or other hedging instrument that effectively fixes all or a portion of our borrowing costs for a period close to the anticipated average life of the fixed-rate portion of the related assets. This strategy is designed to protect us from rising interest rates because the borrowing costs are fixed for the duration of the fixed-rate portion of the related assets.
If prepayment rates decrease in a rising interest rate environment, however, the life of the fixed-rate portion of the related assets could extend beyond the term of the swap agreement or other hedging instrument. This longer than expected life of the fixed-rate portion of the related asset could have a negative impact on our results of operations, as borrowing costs would no longer be fixed after the end of the swap agreement. This situation may also cause the market value of our RMBS backed by FRMs or hybrid ARMs to decline, with little or no offsetting gain from the related hedging transactions. In extreme situations, we may be forced to sell assets to maintain adequate liquidity, which could cause us to incur losses.
Credit Risk
We may become subject to varying degrees of credit risk in connection with our assets. Although we expect relatively low credit risk with respect to our Excess MSR and Agency RMBS portfolio, we will be subject to varying degrees of credit risk in connection with our potential investment in other target assets, including MSRs, prime mortgage loans and non-Agency RMBS. Through our Manager, we seek to mitigate this risk by seeking to acquire high quality assets at appropriate prices given anticipated and unanticipated losses and employing a comprehensive review and asset selection process and careful ongoing monitoring of acquired assets. Nevertheless, unanticipated credit losses could occur which could adversely impact our operating results.
Critical Accounting Policies and Use of Estimates
Our financial statements are prepared in accordance with U.S. GAAP, which requires the use of estimates that involve the exercise of judgment and the use of assumptions as to future uncertainties. In accordance with SEC guidance, the following discussion addresses the accounting policies that we apply with respect to our operations. Our most critical accounting policies involve decisions and assessments that could affect our reported amounts of assets and liabilities, the disclosure of contingent assets and liabilities, as well as our reported amounts of revenues and expenses. We believe that all of the decisions and assessments upon which our financial statements are based were reasonable at the time made and based upon information available to us at that time. Our critical accounting policies and accounting estimates will be expanded over time as we diversify our portfolio and invest in asset classes other than Excess MSRs and RMBS. The material accounting policies and estimates that we expect to be most critical to an investor’s understanding of our financial results and condition and require complex management judgment are discussed below.
Classification of Investment Securities and Impairment of Financial Instruments
ASC 320-10, Debt and Equity Securities, requires that at the time of purchase, we designate a security as either trading, available-for-sale, or held-to-maturity depending on our ability and intent to hold such security to maturity. Securities available-for-sale will be reported at fair value, while securities held-to-maturity will be reported at amortized cost. Although we may hold most of our securities until maturity, we may, from time to time, sell any of our securities as part of our overall management of our asset portfolio. Accordingly, we elect to classify substantially all of our securities as available-for-sale. All assets classified as available-for-sale will be reported at fair value, with unrealized gains and losses excluded from earnings and reported as a separate component of stockholders’ equity. See “—Valuation of Financial Instruments.”
37
Table of Contents
When the estimated fair value of a security is less than amortized cost, we consider whether there is an other-than-temporary impairment, or OTTI, in the value of the security. An impairment is deemed an OTTI if (i) we intend to sell the security, (ii) it is more likely than not that we will be required to sell the security before recovering our cost basis, or (iii) we do not expect to recover the entire amortized cost basis of the security even if we do not intend to sell the security or believe it is more likely than not that we will be required to sell the security before recovering our cost basis. If the impairment is deemed to be an OTTI, the resulting accounting treatment depends on the factors causing the OTTI. If the OTTI has resulted from (i) our intention to sell the security, or (ii) our judgment that it is more likely than not that we will be required to sell the security before recovering our cost basis, an impairment loss is recognized in current earnings equal to the difference between our amortized cost basis and fair value. Whereas, if the OTTI has resulted from our conclusion that we will not recover our cost basis even if we do not intend to sell the security, the credit loss portion of the impairment is recorded in current earnings and the portion of the loss related to other factors, such as changes in interest rates, continues to be recognized in accumulated other comprehensive income. Determining whether there is an OTTI may require management to exercise significant judgment and make significant assumptions, including, but not limited to, estimated cash flows, estimated prepayments, loss assumptions, and assumptions regarding changes in interest rates. As a result, actual impairment losses could differ from reported amounts. Such judgments and assumptions are based upon a number of factors, including (i) credit of the issuer or the borrower, (ii) credit rating of the security, (iii) key terms of the security, (iv) performance of the loan or underlying loans, including debt service coverage and loan-to-value ratios, (v) the value of the collateral for the loan or underlying loans, (vi) the effect of local, industry, and broader economic factors, and (vii) the historical and anticipated trends in defaults and loss severities for similar securities.
Valuation of Financial Instruments
ASC 820, Fair Value Measurements and Disclosure, (“ASC 820”) defines fair value as the price that would be received to sell an asset or paid to transfer a liability in an orderly transaction between market participants at the measurement date. ASC 820 clarifies that fair value should be based on the assumptions market participants would use when pricing an asset or liability and establishes a fair value hierarchy that prioritizes the information used to develop those assumptions. The fair value hierarchy gives the highest priority to quoted prices available in active markets (i.e., observable inputs) and the lowest priority to data lacking transparency (i.e., unobservable inputs). Additionally, ASC 820 requires an entity to consider all aspects of nonperformance risk, including the entity’s own credit standing, when measuring fair value of a liability.
ASC 820 establishes a three level hierarchy to be used when measuring and disclosing fair value. An instrument’s categorization within the fair value hierarchy is based on the lowest level of significant input to its valuation. Following is a description of the three levels
| Level 1 | Inputs are quoted prices in active markets for identical assets or liabilities as of the measurement date under current market conditions. Additionally, the entity must have the ability to access the active market and the quoted prices cannot be adjusted by the entity. | |
| Level 2 | Inputs include quoted prices in active markets for similar assets or liabilities; quoted prices in inactive markets for identical or similar assets or liabilities; or inputs that are observable or can be corroborated by observable market data by correlation or other means for substantially the full-term of the assets or liabilities. | |
| Level 3 | Unobservable inputs are supported by little or no market activity. The unobservable inputs represent the assumptions that market participants would use to price the assets and liabilities, including risk. Generally, Level 3 assets and liabilities are valued using pricing models, discounted cash flow methodologies, or similar techniques that require significant judgment or estimation. | |
The level in the fair value hierarchy within which a fair value measurement in its entirety falls is based on the lowest level input that is significant to the fair value measurement in its entirety. We have used Level 2 for our RMBS and for our derivative assets and liabilities and Level 3 for our Excess MSRs.
When available, we use quoted market prices to determine the fair value of an asset or liability. If quoted market prices are not available, we will consult independent pricing services or third party broker quotes, provided that there is no ongoing material event that affects the issuer of the securities being valued or the market. If there is such an ongoing event, or if quoted market prices are not available, we will determine the fair value of the securities using valuation techniques that use, when possible, current market-based or independently-sourced market parameters, such as interest rates.
38
Table of Contents
Investments in Excess MSRs
Upon acquisition, we elected to record our investments in Excess MSRs at fair value. We made this election in order to provide the users of the financial statements with better information regarding the effects of prepayment risk and other market factors on the Excess MSRs. Under this election, we will record a valuation adjustment on our Excess MSRs investments on a quarterly basis to recognize the changes in fair value in net income as described in “—Revenue Recognition on Investments in Excess MSRs” below.
The fair values of Excess MSRs are determined by projecting net servicing cash flows, which are then discounted to estimate the fair value. The fair values of Excess MSRs are impacted by a variety of factors, including prepayment assumptions, discount rates, delinquency rates, contractually specified servicing fees, and underlying portfolio characteristics. The underlying assumptions and estimated values are corroborated by values received from independent third parties. Changes in fair value of our Excess MSRs will be reported in other income or loss in our consolidated statements of income. For additional information on our fair value methodology, see “Item 8. Consolidated Financial Statements and Supplementary Data—Note 9. Fair Value.”
Revenue Recognition on Investments in Excess MSRs
Investments in Excess MSRs are aggregated into pools as applicable and each pool of Excess MSRs is accounted for in the aggregate. Income for Excess MSRs is accreted into income on an effective yield or “interest” method, based upon the expected excess servicing amount through the expected life of the underlying mortgages. Changes to expected cash flows result in a cumulative retrospective adjustment, which will be recorded in the period in which the change in expected cash flows occurs. Under the retrospective method, the income recognized for a reporting period is measured as the difference between the amortized cost basis at the end of the period and the amortized cost basis at the beginning of the period, plus any cash received during the period. The amortized cost basis is calculated as the present value of estimated future cash flows using an effective yield, which is the yield that equates all past actual and current estimated future cash flows to the initial investment. In addition, our policy is to recognize income only on Excess MSRs in existing eligible underlying mortgages. The difference between the fair value of Excess MSRs and their amortized cost basis are recorded as “Unrealized gain (loss) on investments in excess mortgage servicing rights.” Fair value is generally determined by discounting the expected future cash flows using discount rates that incorporate the market risks and liquidity premium specific to the Excess MSRs, and therefore may differ from their effective yields.
Revenue Recognition on Securities
Interest income from coupon payments is accrued based on the outstanding principal amount of the RMBS and their contractual terms. Premiums and discounts associated with the purchase of the RMBS are amortized into interest income over the projected lives of the securities using the interest method. Our policy for estimating prepayment speeds for calculating the effective yield is to evaluate historical performance, consensus prepayment speeds, and current market conditions. Adjustments are made for actual prepayment activity.
Repurchase Transactions
We finance the acquisition of our RMBS for our portfolio through repurchase transactions under master repurchase agreements. Repurchase transactions are treated as collateralized financing transactions and are carried at their contractual amounts as specified in the respective transactions. Accrued interest payable is included in “Accrued expense and other liabilities” on the consolidated balance sheet.
Repurchase transactions are treated as collateralized financing transactions. Securities financed through repurchase transactions remain on our consolidated balance sheet as an asset and cash received from the purchaser is recorded on our consolidated balance sheet as a liability. Interest paid in accordance with repurchase transactions is recorded in interest expense.
39
Table of Contents
Income Taxes
Our financial results are generally not expected to reflect provisions for current or deferred income taxes. We believe that we operate in a manner that allows us to qualify for taxation as a REIT. As a result of our REIT qualification, we do not generally expect to pay federal corporate level taxes, although Solutions and any other domestic TRSs we form in the future will be required to pay federal corporate level taxes on their income. Many of the REIT requirements, however, are highly technical and complex. If we were to fail to meet the REIT requirements, we would be subject to federal, state and local income taxes.
Emerging Growth Company Status
On April 5, 2012, the JOBS Act was signed into law. The JOBS Act contains provisions that, among other things, reduce certain reporting requirements for qualifying public companies. Because we qualify as an “emerging growth company,” we may, under Section 7(a)(2)(B) of the Securities Act, delay adoption of new or revised accounting standards applicable to public companies until such standards would otherwise apply to private companies. We have elected to take advantage of this extended transition period until the first to occur of the date that we (i) are no longer an “emerging growth company” or (ii) affirmatively and irrevocably opt out of this extended transition period. As a result, our financial statements may not be comparable to those of other public companies that comply with such new or revised accounting standards. Until the date that we are no longer an “emerging growth company” or affirmatively and irrevocably opt out of the extended transition period, upon issuance of a new or revised accounting standard that applies to our financial statements and that has a different effective date for public and private companies, we will disclose the date on which adoption is required for non-emerging growth companies and the date on which we will adopt the recently issued accounting standard.
Results of Operations
We completed our IPO and a concurrent private placement on October 9, 2013, at which time we commenced operations.
Prior to October 9, 2013, we were a development stage company and had not commenced operations other than the organization of the Company, nor had we acquired any Excess MSRs, RMBS or other assets. We were not fully invested in our target assets and were not levered in a manner consistent with our business plan during the period from October 31, 2012 (date of inception) through October 9, 2013 and, as such, the results of our operations for periods prior to October 9, 2013 are not comparable with the results of our operations for the year ended December 31, 2014.
40
Table of Contents
The following tables summarize the changes in our results of operations for the periods indicated below (dollars in thousands):
| Two Month Period October 31, 2012 (date of inception) to December 31, 2012 |
||||||||||||
| Year Ended | ||||||||||||
| December 31, 2014 | December 31, 2013 | |||||||||||
| Income |
||||||||||||
| Interest income |
$ | 24,961 | $ | 5,475 | $ | — | ||||||
| Interest expense |
4,307 | 867 | — | |||||||||
|
|
|
|
|
|
|
|||||||
| Net Interest Income |
20,654 | 4,608 | — | |||||||||
| Other Income (Loss) |
||||||||||||
| Realize gain (loss) on RMBS, net |
(60 | ) | (527 | ) | — | |||||||
| Realized gain (loss) on derivatives, net |
(2,643 | ) | 59 | — | ||||||||
| Unrealized gain (loss) on derivatives, net |
(6,564 | ) | 2,747 | — | ||||||||
| Unrealized gain (loss) on Excess MSRs |
(3,564 | ) | 15,647 | — | ||||||||
|
|
|
|
|
|
|
|||||||
| Total Income |
7,823 | 22,534 | — | |||||||||
| Expenses |
||||||||||||
| General and administrative expense |
3,028 | 716 | 25 | |||||||||
| Management fee to affiliate |
2,560 | 616 | — | |||||||||
|
|
|
|
|
|
|
|||||||
| Total Expenses |
5,588 | 1,332 | 25 | |||||||||
|
|
|
|
|
|
|
|||||||
| Income (Loss) Before Income Taxes |
2,235 | 21,202 | (25 | ) | ||||||||
|
|
|
|
|
|
|
|||||||
| (Benefit from) provision for corporate business taxes |
(140 | ) | — | — | ||||||||
|
|
|
|
|
|
|
|||||||
| Net Income (Loss) |
2,375 | 21,202 | (25 | ) | ||||||||
| Net income allocated to LTIP - OP Units |
(22 | ) | (107 | ) | — | |||||||
|
|
|
|
|
|
|
|||||||
| Net income (loss) Applicable to Common Stockholders |
$ | 2,353 | $ | 21,095 | $ | (25 | ) | |||||
Summary financial data on our segments is given below, together with a reconciliation to the same data for the Company as a whole (dollars in thousands):
| Year Ended December 31, 2014 | ||||||||||||||||
| Servicing Related Assets |
RMBS | All Other | Total | |||||||||||||
| Interest income |
$ | 14,318 | $ | 10,643 | $ | — | $ | 24,961 | ||||||||
| Interest expense |
— | 4,307 | — | 4,307 | ||||||||||||
|
|
|
|
|
|
|
|
|
|||||||||
| Net interest income |
14,318 | 6,336 | — | 20,654 | ||||||||||||
| Other income |
(3,564 | ) | (9,267 | ) | — | (12,831 | ) | |||||||||
| Other operating expenses |
— | — | 5,588 | 5,588 | ||||||||||||
| (Benefit from) provision for corporate business taxes |
(140 | ) | — | — | (140 | ) | ||||||||||
|
|
|
|
|
|
|
|
|
|||||||||
| Net income (loss) |
$ | 10,894 | $ | (2,931 | ) | $ | (5,588 | ) | $ | 2,375 | ||||||
| Year Ended December 31, 2013 | ||||||||||||||||
| Servicing Related Assets |
RMBS | All Other | Total | |||||||||||||
| Interest income |
$ | 3,552 | $ | 1,923 | $ | — | $ | 5,475 | ||||||||
| Interest expense |
— | 867 | — | 867 | ||||||||||||
|
|
|
|
|
|
|
|
|
|||||||||
| Net interest income |
3,552 | 1,056 | — | 4,608 | ||||||||||||
| Other income |
15,647 | 2,279 | — | 17,926 | ||||||||||||
| Other operating expenses |
— | — | 1,332 | 1,332 | ||||||||||||
| (Benefit from) provision for corporate business taxes |
— | — | — | — | ||||||||||||
|
|
|
|
|
|
|
|
|
|||||||||
| Net income (loss) |
$ | 19,199 | $ | 3,335 | $ | (1,332 | ) | $ | 21,202 | |||||||
| Two Month Period October 31, 2012 (date of inception) to December 31, 2012 |
||||||||||||||||
| Servicing Related Assets |
RMBS | All Other | Total | |||||||||||||
| Interest income |
$ | — | $ | — | $ | — | $ | — | ||||||||
| Interest expense |
— | — | — | — | ||||||||||||
|
|
|
|
|
|
|
|
|
|||||||||
| Net interest income |
— | — | — | — | ||||||||||||
| Other income |
— | — | — | — | ||||||||||||
| Other operating expenses |
— | — | 25 | 25 | ||||||||||||
| (Benefit from) provision for corporate business taxes |
— | — | — | — | ||||||||||||
|
|
|
|
|
|
|
|
|
|||||||||
| Net income (loss) |
$ | — | $ | — | $ | (25 | ) | $ | (25 | ) | ||||||
41
Table of Contents
Interest Income
Interest income for the year ended December 31, 2014 increased by approximately $19.5 million consisting of $10.8 million from Excess MSRs and $8.7 million from RMBS as a result of a full year’s operations in 2014 compared to 81 days of operations in 2013. Interest income for the year ended December 31, 2013 increased by approximately $5.5 million consisting of $3.6 million from Excess MSRs and $1.9 million from Agency RMBS as a result of the deployment of proceeds from the IPO and concurrent private placement into new investments in Excess MSRs and Agency RMBS.
Interest Expense
Interest expense for the year ended December 31, 2014 increased by $3.4 million as a result of a full year’s operations in 2014 compared to 81 days of operations in 2013. Interest expense for the year ended December 31, 2013 increased by $0.9 million due to repurchase agreement financings and swaps related thereto entered into upon deployment of the proceeds from the IPO and concurrent private placement to investments in Agency RMBS. As of December 31, 2014, our investment in Servicing Related Assets consisted entirely of our investment in Excess MSRs and was unlevered and incurred no interest expense.
Change in Fair Value of Investments in Excess MSRs
The fair value of investments in Excess MSRs for the year ended December 31, 2014 decreased $3.6 million due to a net decrease in the fair value of the Excess MSRs during the year.
Change in Fair Value of Derivatives
The fair value of derivatives for the year ended December 31, 2014 decreased by $6.6 million due to subsequent net decreases in value.
General and Administrative Expense
General and administrative expense for the year ended December 31, 2014 increased by $2.3 million due to additional expenses for Solutions of approximately $400 thousand, the expenses associated with the appointment of a general counsel of approximately $100 thousand in June 2014 and administrative expense also increased as a result of a full year’s operations in 2014 compared to 81 days of operations in 2013.
Management Fees to Affiliate
Management fees for the year ended December 31, 2014 increased by $1.9 million due to a full year of operation as opposed to only 81 days in 2013.
Net Income Allocated to LTIP - OP Units
Net income allocated to LTIP - OP Units for the year ended December 31, 2014, which are owned by directors and officers of the Company and by certain employees of Freedom Mortgage who provide services to us through the Manager, represents 0.9% of net income as opposed to 0.5% at December 31, 2013.
42
Table of Contents
Accumulated Other Comprehensive Income (Loss)
For the periods indicated below, our accumulated other comprehensive income (loss) changed due to the following factors (dollars in thousands):
| Year Ended December 31, 2014 |
||||
| Accumulated other comprehensive gain (loss), December 31, 2013 |
$ | (5,033 | ) | |
| Net unrealized gain (loss) on RMBS |
11,674 | |||
|
|
|
|||
| Accumulated other comprehensive gain (loss), December 31, 2014 |
$ | 6,641 | ||
| Year Ended December 31, 2013 |
||||
| Accumulated other comprehensive gain (loss), December 31, 2012 |
$ | — | ||
| Net unrealized gain (loss) on RMBS |
(5,033 | ) | ||
|
|
|
|||
| Accumulated other comprehensive gain (loss), December 31, 2013 |
$ | (5,033 | ) | |
| Two Month Period October 31, 2012 (date of inception) to December 31, 2012 |
||||
| Accumulated other comprehensive gain (loss), October 31, 2012 |
$ | — | ||
| Net unrealized gain (loss) on RMBS |
— | |||
|
|
|
|||
| Accumulated other comprehensive gain (loss), December 31, 2012 |
$ | — | ||
Our GAAP equity changes as our RMBS are marked to market each quarter, among other factors. The primary causes of mark to market changes are changes in interest rates and credit spreads. During the year ended December 31, 2014, an 86 basis point drop in interest rates caused a net unrealized gain of $11.7 million, recorded in accumulated other comprehensive income, on our RMBS.
Our Portfolio
Excess MSRs
As of December 31, 2014 and 2013, we had approximately $91.3 million, and $110.3 million, respectively estimated carrying value of Excess MSRs. Our investments represents between a 50% and 85% interest in the Excess MSRs on these pools of mortgage loans with an aggregate UPB at December 31, 2014 and 2013, of approximately $17.5 billion, and $20.0 billion, respectively. Freedom Mortgage is the servicer of the loans underlying all of our investments in Excess MSRs to date, and it earns a basic fee and all ancillary income associated with the portfolios in exchange for providing all servicing functions. In addition, Freedom Mortgage retains either a 15% or a 50% interest in the Excess MSRs. We do not have any servicing duties, liabilities or obligations associated with the servicing of the portfolios underlying any of our investments. Each of our investments in Excess MSRs to date is subject to a recapture agreement with Freedom Mortgage. Under the recapture agreements, we are generally entitled to our percentage interest in the Excess MSRs on any initial or subsequent refinancing by Freedom Mortgage of a loan in the original portfolio. In other words, we are generally entitled to our percentage interest in the Excess MSRs on both (i) a loan resulting from a refinancing by Freedom Mortgage of a loan in the original portfolio, and (ii) a loan resulting from a refinancing by Freedom Mortgage of a previously recaptured loan.
Upon completion of our initial public offering and the concurrent private placement, we entered into two separate Excess MSR acquisition and recapture agreements with Freedom Mortgage related to our investments in Excess MSRs. We also entered into a flow and bulk purchase agreement related to future purchases of Excess MSRs from Freedom Mortgage. On February 28, 2014, pursuant to the flow and bulk Excess MSR purchase agreement, the Company purchased from Freedom Mortgage Excess MSRs on mortgage loans originated by Freedom Mortgage during the first quarter of 2014 with an UPB of approximately $76.8 million. The Company acquired an approximate 85% interest in the Excess MSRs for approximately $567,000. The terms of the purchase include recapture provisions that are the same as those in the Excess MSR acquisition agreements the Company entered into with Freedom Mortgage in October 2013.
On March 31, 2014, pursuant to the flow and bulk Excess MSR purchase agreement, the Company purchased from Freedom Mortgage Excess MSRs on mortgage loans originated by a third party originator with an aggregate UPB of approximately $159.8 million. Freedom Mortgage purchased the MSRs on these mortgage loans from a third party on January 31, 2014. The Company acquired an approximate 71% interest in the Excess MSRs for approximately $946,000. The terms of the purchase include recapture provisions that are the same as those in the Excess MSR acquisition agreements the Company entered into with Freedom Mortgage in October 2013.
On June 30, 2014, pursuant to the flow and bulk Excess MSR purchase agreement, the Company purchased from Freedom Mortgage Excess MSRs on mortgage loans originated by Freedom Mortgage during the second quarter of 2014 with an aggregate UPB of approximately $98.1 million. The Company acquired an approximate 85% interest in the Excess MSRs for approximately $661,000. The terms of the purchase include recapture provisions that are the same as those in the Excess MSR acquisition agreements the Company entered into with Freedom Mortgage in October 2013.
The mortgage loans underlying the Excess MSRs purchased in 2014 are collectively referred to as “Pool 2014,” and the recapture provisions, which are identical, are collectively referred to as the “Pool 2014—Recapture Agreement.”
43
Table of Contents
The following tables summarize the collateral characteristics of the loans underlying our Excess MSR investments as of December 31, 2014 and 2013 (dollars in thousands):
Collateral Characteristics
At December 31, 2014
| Collateral Characteristics | ||||||||||||||||||||||||||||||||
| Current Carrying Amount |
Original Principal Balance |
Current Principal Balance |
Number of Loans |
WA Coupon |
WA Maturity (months) |
Weighted Average Loan Age (months) |
ARMs % (A) |
|||||||||||||||||||||||||
| Pool 1 |
||||||||||||||||||||||||||||||||
| Original Pool |
$ | 53,586 | $ | 10,026,722 | $ | 8,605,932 | 44,787 | 3.50 | % | 323 | 24 | 1.0 | % | |||||||||||||||||||
| Recaptured Loans |
601 | 109,815 | 495 | 4.11 | % | 340 | 5 | — | ||||||||||||||||||||||||
| Recapture Agreement |
611 | — | — | — | — | |||||||||||||||||||||||||||
|
|
|
|
|
|
|
|
|
|
|
|
|
|
|
|
|
|||||||||||||||||
| Pool 1 Total/WA |
54,798 | 10,026,722 | 8,715,747 | 45,282 | 3.51 | % | 324 | 24 | 1.0 | % | ||||||||||||||||||||||
| Pool 2 |
— | — | ||||||||||||||||||||||||||||||
| Original Pool |
24,988 | 10,704,024 | 6,902,453 | 44,089 | 2.50 | % | 331 | 28 | 100.0 | % | ||||||||||||||||||||||
| Recaptured Loans |
8,688 | — | 1,573,522 | 9,500 | 3.99 | % | 349 | 5 | — | |||||||||||||||||||||||
| Recapture Agreement |
1,262 | — | — | — | — | |||||||||||||||||||||||||||
|
|
|
|
|
|
|
|
|
|
|
|
|
|
|
|
|
|||||||||||||||||
| Pool 2 Total/WA |
34,938 | 10,704,024 | 8,475,975 | 53,589 | 2.77 | % | 334 | 23 | 81.4 | % | ||||||||||||||||||||||
| Pool 2014 |
— | — | ||||||||||||||||||||||||||||||
| Original Pool |
1,405 | 334,672 | 276,652 | 1,610 | 3.68 | % | 340 | 17 | — | % | ||||||||||||||||||||||
| Recaptured Loans |
181 | — | 31,910 | 149 | 3.93 | % | 346 | 3 | — | |||||||||||||||||||||||
| Recapture Agreement |
— | — | — | — | — | |||||||||||||||||||||||||||
|
|
|
|
|
|
|
|
|
|
|
|
|
|
|
|
|
|||||||||||||||||
| Pool 2014 Total/WA |
1,586 | 334,672 | 308,562 | 1,759 | 3.71 | % | 341 | 16 | — | % | ||||||||||||||||||||||
|
|
|
|
|
|
|
|
|
|
|
|
|
|
|
|
|
|||||||||||||||||
| Total/Weighted Average |
$ | 91,322 | $ | 21,065,418 | $ | 17,500,284 | 100,630 | 3.16 | % | 329 | 23 | 39.9 | % | |||||||||||||||||||
At December 31, 2013
| Collateral Characteristics | ||||||||||||||||||||||||||||||||
| Current Carrying Amount |
Original Principal Balance |
Current Principal Balance |
Number of Loans |
WA Coupon |
WA Maturity (months) |
Weighted Average Loan Age (months) |
ARMs % (A) |
|||||||||||||||||||||||||
| Pool 1 |
||||||||||||||||||||||||||||||||
| Original Pool |
$ | 65,128 | $ | 10,026,722 | $ | 9,823,250 | 49,340 | 3.51 | % | 335 | 12 | 1.0 | % | |||||||||||||||||||
| Recaptured Loans |
— | — | — | — | — | — | — | — | ||||||||||||||||||||||||
| Recapture Agreement |
982 | — | — | — | — | — | — | — | ||||||||||||||||||||||||
|
|
|
|
|
|
|
|
|
|
|
|
|
|
|
|
|
|||||||||||||||||
| Pool 1 Total/WA |
66,110 | 10,026,722 | 9,823,250 | 49,340 | 3.51 | % | 335 | 12 | 1.0 | % | ||||||||||||||||||||||
| Pool 2 |
||||||||||||||||||||||||||||||||
| Original Pool |
40,599 | 10,704,024 | 10,149,440 | 61,751 | 2.63 | % | 340 | 18 | 100.0 | % | ||||||||||||||||||||||
| Recaptured Loans |
451 | — | 77,239 | 512 | 4.34 | % | 358 | — | — | |||||||||||||||||||||||
| Recapture Agreement |
3,146 | — | — | — | — | — | — | — | ||||||||||||||||||||||||
|
|
|
|
|
|
|
|
|
|
|
|
|
|
|
|
|
|||||||||||||||||
| Pool 2 Total/WA |
44,196 | 10,704,024 | 10,226,679 | 62,263 | 2.64 | % | 341 | 18 | 99.2 | % | ||||||||||||||||||||||
|
|
|
|
|
|
|
|
|
|
|
|
|
|
|
|
|
|||||||||||||||||
| Total/Weighted Average |
$ | 110,306 | $ | 20,730,746 | $ | 20,049,929 | 111,603 | 3.07 | % | 338 | 15 | 51.1 | % | |||||||||||||||||||
| (A) | ARMs % represents the percentage of the total principal balance of the pool that corresponds to ARMs and hybrid ARMs. |
44
Table of Contents
RMBS
The following tables summarize the characteristics of our RMBS portfolio and certain characteristics of the collateral underlying our RMBS as of December 31, 2014 and 2013 (dollars in thousands):
RMBS Characteristics
At December 31, 2014
| Original | Gross Unrealized | Weighted Average | ||||||||||||||||||||||||||||||||||||
| Asset Type |
Face Value |
Book Value |
Gains | Losses | Carrying Value (A) |
Number of Securities |
Rating | Coupon | Yield | Maturity (Years) (C) |
||||||||||||||||||||||||||||
| RMBS |
||||||||||||||||||||||||||||||||||||||
| Fannie Mae |
$ | 267,516 | $ | 263,924 | $ | 4,674 | $ | (10 | ) | $ | 268,588 | 33 | (B) | 3.89 | % | 3.51 | % | 24 | ||||||||||||||||||||
| Freddie Mac |
144,064 | 138,333 | 2,143 | — | 140,476 | 17 | (B) | 3.75 | % | 2.99 | % | 23 | ||||||||||||||||||||||||||
| CMOs |
25,964 | 7,105 | — | (166 | ) | 6,939 | 4 | Unrated | 4.18 | % | 12.65 | % | 14 | |||||||||||||||||||||||||
|
|
|
|
|
|
|
|
|
|
|
|
|
|
|
|
|
|
|
|||||||||||||||||||||
| Total/Weighted Average |
$ | 437,544 | $ | 409,362 | $ | 6,817 | $ | (176 | ) | $ | 416,003 | 54 | — | 3.85 | % | 3.49 | % | 23 | ||||||||||||||||||||
At December 31, 2013
| Original | Gross Unrealized | Weighted Average | ||||||||||||||||||||||||||||||||||||
| Asset Type |
Face Value |
Book Value |
Gains | Losses | Carrying Value (A) |
Number of Securities |
Rating | Coupon | Yield | Maturity (Years) (C) |
||||||||||||||||||||||||||||
| RMBS |
||||||||||||||||||||||||||||||||||||||
| Fannie Mae |
$ | 173,015 | $ | 179,556 | $ | — | $ | (2,800 | ) | $ | 176,756 | 18 | (B) | 3.86 | % | 3.61 | % | 25 | ||||||||||||||||||||
| Freddie Mac |
109,431 | 112,456 | — | (2,233 | ) | 110,223 | 11 | (B) | 3.62 | % | 3.22 | % | 24 | |||||||||||||||||||||||||
|
|
|
|
|
|
|
|
|
|
|
|
|
|
|
|
|
|
|
|||||||||||||||||||||
| Total/Weighted Average |
$ | 282,446 | $ | 292,012 | $ | — | $ | (5,033 | ) | $ | 286,979 | 29 | — | 3.77 | % | 3.46 | % | 24 | ||||||||||||||||||||
| (A) | See “Item 8. Consolidated Financial Statements and Supplementary Data—Note 9. Fair Value” regarding the estimation of fair value, which is equal to carrying value for all securities. |
| (B) | CHMI used an implied AAA rating for the FNMA/FHLMC securities. |
| (C) | The weighted average maturity is based on the timing of expected principal reduction on the assets. |
The following table summarizes the net interest spread of our RMBS portfolio as of December 31, 2014 and 2013:
| At December 31, 2014 | At December 31, 2013 | |||||||
| Weighted Average Asset Yield |
3.05 | % | 2.98 | % | ||||
| Weighted Average Interest Expense |
1.39 | % | 1.55 | % | ||||
|
|
|
|
|
|||||
| Net Interest Spread |
1.67 | % | 1.43 | % | ||||
Liquidity and Capital Resources
Liquidity is a measurement of our ability to meet potential cash requirements, including ongoing commitments to repay borrowings, fund and maintain investments and other general business needs. Additionally, to maintain our status as a REIT under the Code, we must distribute annually at least 90% of our REIT taxable income. In future years, a portion of this requirement may be able to be met through stock dividends, rather than cash, subject to limitations based on the value of our stock.
Our primary sources of funds for liquidity consist of cash provided by operating activities (primarily income from our investments in Excess MSRs and RMBS), sales or repayments of RMBS and borrowings under repurchase agreements. In the future sources of funds for liquidity may include potential debt financing sources, warehouse agreements, securitizations and the issuance of equity securities, when feasible. Our primary uses of funds are the payment of interest, management fees, outstanding commitments, investments in new or replacement assets and other operating expenses and the repayment of borrowings, as well as dividends.
We have funded the acquisition of our Excess MSRs on an unlevered basis, but we are actively pursuing a small facility for this asset class. As of December 31, 2014, we had repurchase agreements with 15 counterparties and approximately $362.1 million of outstanding repurchase agreement borrowings from 13 of those 15 counterparties, which were used to finance RMBS. As of December 31, 2013, we had approximately $261.3 million of outstanding repurchase agreement borrowings from seven of the 11 counterparties with which we had repurchase agreements. Under these agreements, which are uncommitted facilities, we sold a security to a counterparty and concurrently agreed to repurchase the same security at a later date for a higher specified price. The sale price represents financing proceeds and the difference between the sale and repurchase prices represents interest on the financing. The price at which the security is sold generally represents the market value of the security less a discount or “haircut”. The weighted average haircut on our repurchase debt at December 31, 2014, was approximately 5.4%. During the term of the repurchase agreement, which can be as short as 30 days, the counterparty holds the security and posted margin as collateral. The counterparty monitors and calculates what it estimates to be the value of the collateral during the term of the agreement. If this value declines by more than a de minimis threshold, the counterparty could require us to post additional collateral (or
45
Table of Contents
“margin”) in order to maintain the initial haircut on the collateral. This margin is typically required to be posted in the form of cash and cash equivalents. Furthermore, we may, from time to time, be a party to derivative agreements or financing arrangements that may be subject to margin calls based on the value of such instruments. We seek to maintain adequate cash reserves and other sources of available liquidity to meet any margin calls resulting from decreases in value related to a reasonably possible (in the opinion of management) change in interest rates.
Our ability to obtain borrowings and to raise future equity capital is dependent on our ability to access borrowings and the capital markets on attractive terms. Our Manager’s senior management team has extensive long-term relationships with investment banks, brokerage firms and commercial banks, which we believe will enhance our ability to source and finance asset acquisitions on attractive terms and access borrowings and the capital markets at attractive levels.
As of the date of this filing, we have sufficient liquid assets, which include unrestricted cash and RMBS, to satisfy all of our short-term recourse liabilities. With respect to the next twelve months, we expect that our cash on hand combined with our cash flow provided by operations will be sufficient to satisfy our anticipated liquidity needs with respect to our current investment portfolio, including related financings, potential margin calls and operating expenses. While it is inherently more difficult to forecast beyond the next twelve months, we currently expect to meet our long-term liquidity requirements through our cash on hand and, if needed, additional borrowings, proceeds received from repurchase agreements and similar financings, proceeds from equity offerings and the liquidation or refinancing of our assets.
Our cash flow used by operations differs from our net income due primarily to: (i) accretion of discount or premium on our RMBS, (ii) unrealized gains or losses on our Excess MSRs, and (iii) other-than-temporary impairment on our securities, if any.
In addition to the information referenced above, the following factors could affect our liquidity, access to capital resources and our capital obligations. As such, if their outcomes do not fall within our expectations, changes in these factors could negatively affect our liquidity.
| • | Access to Financing from Counterparties — Decisions by investors, counterparties and lenders to enter into transactions with us will depend upon a number of factors, such as our historical and projected financial performance, compliance with the terms of our current credit arrangements, industry and market trends, the availability of capital and our investors’, counterparties’ and lenders’ policies and rates applicable thereto, and the relative attractiveness of alternative investment or lending opportunities. Recent conditions and events have limited the array of capital resources available. Our business strategy is dependent upon our ability to finance our RMBS at rates that provide a positive net spread. |
| • | Impact of Expected Repayment or Forecasted Sale on Cash Flows — The timing of and proceeds from the repayment or sale of certain investments may be different than expected or may not occur as expected. Proceeds from sales of illiquid assets such as Excess MSRs are unpredictable and may vary materially from their estimated fair value and their carrying value. Further, the availability of investments that provide similar returns to those repaid or sold investments is unpredictable and returns on new investments may vary materially from those on existing investments. |
46
Table of Contents
Repurchase Agreements
The following tables provide additional information regarding our repurchase agreements. These short-term borrowings are used to finance certain of our investments in RMBS. The RMBS repurchase agreements are guaranteed by CHMI. The weighted average difference between the fair value of the assets and the face amount of available financing for the RMBS repurchase agreements, or the haircut, was 5.4% and 5.5% as of December 31, 2014 and 2013, respectively.
Repurchase Agreement Characteristics
At December 31, 2014
| Repurchase Agreements | Weighted Average Rate | |||||||
| Less than one month |
$ | 78,988 | 0.38 | % | ||||
| One to three months |
208,533 | 0.38 | % | |||||
| Greater than three months |
74,605 | 0.38 | % | |||||
|
|
|
|
|
|||||
| Total/Weighted Average |
$ | 362,126 | 0.38 | % | ||||
At December 31, 2013
| Repurchase Agreements | Weighted Average Rate | |||||||
| Less than one month |
$ | 134,001 | 0.39 | % | ||||
| One to three months |
127,301 | 0.40 | % | |||||
| Greater than three months |
— | — | ||||||
|
|
|
|
|
|||||
| Total/Weighted Average |
$ | 261,302 | 0.39 | % | ||||
The amount of collateral at December 31, 2014 and 2013, including cash, was $383.5 million and $275.6 million, respectively.
The weighted average term to maturities at December 31, 2014 and 2013 were 63 days and 29 days, respectively.
Cash Flows
Operating and Investing Activities
Our operating activities provided cash of approximately $25.0 million and our investing activities used cash of approximately $105.8 million for the year ended December 31, 2014. The cash provided by operating activities and the cash used in investing activities is a result of the execution of our ongoing investment strategy.
Financing Activities
On October 9, 2013, we completed our IPO, pursuant to which we sold 6,500,000 shares of our common stock to the public at a price of $20.00 per share, for gross proceeds of $130.0 million. Concurrently with the closing of the IPO, we completed a private placement in which we sold 1,000,000 shares of our common stock to our non-executive Chairman of the Board, Stanley Middleman, at a price of $20.00 per share. We received additional gross proceeds of $20 million from the concurrent private placement. In connection with the IPO, the underwriting discounts and commissions and a structuring fee paid to certain underwriters were paid by our Manager. We did not pay any underwriting discounts or commissions or any structuring fees in connection with our IPO or the concurrent private placement. Net proceeds, after the payment of offering costs payable by us of approximately $1.9 million, were approximately $148.1 million.
On January 27, 2014 we issued 9,543 shares of our common stock, to our independent directors. Of that amount, 1,590 unrestricted shares were part of the compensation for joining the board of directors in 2013. The remaining shares, which were subject to forfeiture prior to January 2015, were part of the independent directors’ compensation for 2014.
For information regarding our use of repurchase agreements to finance the acquisition of our RMBS, see “Liquidity and Capital Resources” above.
Dividends
We conduct our operations in a manner intended to satisfy the requirements to qualify as a REIT for U.S. federal income tax purposes. U.S. federal income tax law generally requires that a REIT distribute annually at least 90% of its REIT taxable income, without regard to the deduction for dividends paid and excluding net capital gains, and that it pay tax at regular corporate rates to the extent that it annually distributes less than 100% of its taxable income. We intend to continue to make regular quarterly distributions of all or substantially all of our taxable income to holders of our common stock out of assets legally available for this purpose, if and to the extent authorized by our board of directors. Before we pay any dividend, whether for U.S. federal income tax purposes or otherwise, we must first meet both our operating requirements and debt
47
Table of Contents
service on our repurchase agreements and other debt payable. If our cash available for distribution is less than our taxable income, we could be required to sell assets or borrow funds to make cash distributions, or we may make a portion of the required distribution in the form of a taxable stock distribution or distribution of debt securities. We will make distributions only upon the authorization of our board of directors. The amount, timing and frequency of distributions will be authorized by our board of directors based upon a variety of factors, including:
| • | actual results of operations; |
| • | our level of retained cash flows; |
| • | our ability to make additional investments in our target assets; |
| • | restrictions under Maryland law; |
| • | any debt service requirements; |
| • | our taxable income; |
| • | the annual distribution requirements under the REIT provisions of the Code; and |
| • | other factors that our board of directors may deem relevant |
Our ability to make distributions to our stockholders will depend upon the performance of our investment portfolio, and, in turn, upon our Manager’s management of our business. Distributions will be made quarterly in cash to the extent that cash is available for distribution. We may not be able to generate sufficient cash available for distribution to pay distributions to our stockholders. In addition, our board of directors may change our distribution policy in the future. See “Risk Factors.”
We make distributions based on a number of factors, including an estimate of taxable earnings per common share. Dividends distributed and taxable and GAAP earnings will typically differ due to items such as fair value adjustments, differences in premium amortization and discount accretion, and non-deductible general and administrative expenses. Our dividend per share may be substantially different than our taxable earnings and GAAP earnings per share. Our GAAP earnings per share for the year were $0.31.
Our long term view of the attractiveness of the investment opportunities in our target asset classes has not changed. However, the current levels of asset pricing has reduced the available returns. As a result, we currently believe it is unlikely that we will be able to maintain dividends in 2015 at the level in effect since inception. We intend to expand the scope of our investments in our target assets with the goal of creating a more diversified and stable revenue profile. While we believe a more stable source of income should provide value to our stockholders over time, the strategy will likely result in a decline in the level of dividends relative to those for 2014. Our diversification strategy involves execution risks and requires capital. There is no assurance as to when we will be able to raise that capital, if at all.
See “Item 5. Market for Registrant’s Common Equity, Related Stockholder Matters and Issuer Purchases of Equity Securities—Dividends” for more information.
Off-balance Sheet Arrangements
As of December 31, 2014, we did not have any off-balance sheet arrangements. We did not have any relationships with unconsolidated entities or financial partnerships, such as entities often referred to as structured investment vehicles, or special purpose or variable interest entities, established to facilitate off-balance sheet arrangements or other contractually narrow or limited purposes. Further, we have not guaranteed any obligations of unconsolidated entities or entered into any commitment or intend to provide additional funding to any such entities.
Contractual Obligations
Our contractual obligations as of December 31, 2014, included repurchase agreements on certain RMBS, our agreements with Freedom Mortgage with respect to certain Excess MSR transactions and our management agreement with our Manager. Pursuant to our management agreement, our Manager is entitled to receive a management fee and the reimbursement of certain expenses.
The following tables summarize our contractual obligations as of December 31, 2014 and 2013 (dollars in thousands):
Contractual Obligations Characteristics
At December 31, 2014
| Less than 1 year |
1 to 3 years |
3 to 5 years |
More than 5 years |
Total | ||||||||||||||||
| Borrowings under repurchase agreements |
$ | 362,126 | $ | — | $ | — | $ | — | $ | 362,126 | ||||||||||
| Interest on repurchase agreement borrowings (A) |
$ | 332 | $ | — | $ | — | $ | — | $ | 332 | ||||||||||
At December 31, 2013
| Less than 1 year |
1 to 3 years |
3 to 5 years |
More than 5 years |
Total | ||||||||||||||||
| Borrowings under repurchase agreements |
$ | 261,302 | $ | — | $ | — | $ | — | $ | 261,302 | ||||||||||
| Interest on repurchase agreement borrowings (A) |
$ | 175 | $ | — | $ | — | $ | — | $ | 175 | ||||||||||
| (A) | Interest expense is calculated based on the interest rate in effect at year end and includes all interest expense incurred and expected to be incurred in the future through the contractual maturity of the associated repurchase agreement. |
The table above does not include amounts due under the management agreement with our Manager as such obligations, discussed below, do not have fixed and determinable payments.
48
Table of Contents
Management Agreement
The management agreement with our Manager provides that our Manager is entitled to receive a management fee, the reimbursement of certain expenses and, in certain circumstances, a termination fee. The management fee is an amount equal to 1.5% per annum of our stockholders’ equity as defined in the management agreement, calculated and payable quarterly in arrears. We will also be required to pay a termination fee equal to three times the average annual management fee earned by our Manager during the two four-quarter periods ending as of the end of the fiscal quarter preceding the date of termination. Such termination fee will be payable upon termination of the management agreement by us without cause or by our Manager if we materially breach the management agreement.
We pay all of our direct operating expenses, except those specifically required to be borne by our Manager under the management agreement. Our Manager is responsible for all costs incident to the performance of its duties under the management agreement. Our Manager uses the proceeds from its management fee in part to pay compensation to its officers who, notwithstanding that certain of them also are our officers, will receive no cash compensation directly from us. Our Manager provides us with a chief financial officer, a controller and, beginning in June 2014, a general counsel. Our Manager is entitled to be reimbursed for a pro rata portion of the costs of the wages, salary and other benefits with respect these officers, based on the percentages of their working time and efforts spent on matters related to our company. The amount of the wages, salary and benefits reimbursed with respect to these officers our Manager provides to us is subject to the approval of the compensation committee of our board of directors.
The initial term of the management agreement will expire on October 9, 2016 and will be automatically renewed for a one-year term on such date and on each anniversary of such date thereafter unless terminated or not renewed as described below. Either we or our Manager may elect not to renew the management agreement upon expiration of its initial term or any renewal term by providing written notice of non-renewal at least 180 days, but not more than 270 days, before expiration. In the event we elect not to renew the term, we will be required to pay our Manager a termination fee equal to three times the average annual management fee earned by our Manager during the two four-quarter periods ending as of the end of the fiscal quarter preceding the date of termination. We may terminate the management agreement at any time for cause effective upon 30 days prior written notice of termination from us to our Manager, in which case no termination fee would be due. Our board of directors will review our Manager’s performance annually and, as a result of such review, upon the affirmative vote of at least two-thirds of the members of our board of directors or of the holders of a majority of our outstanding common stock, we may terminate the management agreement based upon unsatisfactory performance by our Manager that is materially detrimental to us or a determination by our independent directors that the management fees payable to our Manager are not fair, subject to the right of our Manager to prevent such a termination by agreeing to a reduction of the management fees payable to our Manager. Upon any termination of the management agreement based on unsatisfactory performance or unfair management fees, we are required to pay our Manager the termination fee described above. Our Manager may terminate the management agreement, without payment of the termination fee, in the event we become regulated as an investment company under the Investment Company Act. Our Manager may also terminate the management agreement upon 60 days’ written notice if we default in the performance of any material term of the management agreement and the default continues for a period of 30 days after written notice to us, whereupon we would be required to pay our Manager the termination fee described above.
Acquisitions of Excess MSRs in 2014
Upon completion of our initial public offering and the concurrent private placement, we entered into two separate Excess MSR acquisition and recapture agreements with Freedom Mortgage related to our investments in Excess MSRs. We also entered into a flow and bulk purchase agreement related to future purchases of Excess MSRs from Freedom Mortgage.
In October 2013, the Company also entered into a flow and bulk Excess MSR purchase agreement with Freedom Mortgage. This agreement provides that Freedom Mortgage will offer to sell to the Company a participation interest (between 65% and 85%) in the Excess MSRs on the eligible mortgage loans originated by Freedom Mortgage on a flow basis. In addition, Freedom will offer to sell to the Company a participation interest (between 40% and 85%) in the Excess MSRs on mortgage loans for which Freedom Mortgage acquires the MSRs from third parties. The pricing of the transactions must be approved by a majority of our independent directors based on, among other things, a valuation from a third party valuation service. The Company is not obligated to accept any such offer.
During 2014, we made three small investments in Excess MSRs with an aggregate notional UPB as of the respective times of investment of approximately $334.7 million. These Excess MSRs were purchased from Freedom Mortgage pursuant to a Flow and Bulk purchase agreement dated as of October 9, 2013, for a total purchase price of approximately $2.2 million. Our interests are either 85% or 71% and have the benefit of recapture provisions that are identical to those applicable to our initial purchases of Excess MSRs. These purchases are referred to collectively as “Pool 2014.”
Inflation
Virtually all of our assets and liabilities are financial in nature. As a result, interest rates and other factors affect our performance more so than inflation, although inflation rates can often have a meaningful influence over the direction of interest rates. Furthermore, our financial statements are prepared in accordance with U.S. GAAP and our distributions are determined by our board of directors primarily based on our REIT taxable income, and, in each case, our activities and balance sheet are measured with reference to historical cost and/or fair market value without considering inflation.
49
Table of Contents
| Item 7A. | Quantitative and Qualitative Disclosures about Market Risk |
We seek to manage our risks related to the credit quality of our assets, interest rates, liquidity, prepayment speeds and market value while, at the same time, seeking to provide an opportunity to stockholders to realize attractive risk-adjusted returns through ownership of our capital stock. While we do not seek to avoid risk completely, we believe the risk can be quantified from historical experience and seek to actively manage that risk, to earn sufficient compensation to justify taking those risks and to maintain capital levels consistent with the risks we undertake.
Interest Rate Risk
Interest rates are highly sensitive to many factors, including fiscal and monetary policies and domestic and international economic and political considerations, as well as other factors beyond our control. We are subject to interest rate risk in connection with our assets and our related financing obligations. In general, we expect to finance the acquisition of certain of our assets through financings in the form of repurchase agreements, warehouse facilities, securitizations, re-securitizations, bank credit facilities (including term loans and revolving facilities) and public and private equity and debt issuances in addition to transaction or asset specific funding arrangements. In addition, the values of our Servicing Related Assets are highly sensitive to changes in interest rates, historically increasing when rates rise and decreasing when rates decline. Subject to maintaining our qualification as a REIT, we attempt to mitigate interest rate risk through utilization of hedging instruments, primarily interest rate swap agreements. We may also use financial futures, options, interest rate cap agreements, and forward sales. These instruments are intended to serve as a hedge against future interest rate changes on our borrowings.
Interest Rate Effect on Net Interest Income
Our operating results depend in large part on differences between the income earned on our assets and our cost of borrowing and hedging activities. The cost of our borrowings are generally based on prevailing market interest rates. During a period of rising interest rates, our borrowing costs generally will increase (1) while the yields earned on our leveraged fixed-rate mortgage assets will remain static and (2) at a faster pace than the yields earned on our leveraged adjustable-rate and hybrid adjustable-rate RMBS, which could result in a decline in our net interest spread and net interest margin. The severity of any such decline would depend on our asset/liability composition at the time as well as the magnitude and duration of the interest rate increase. Further, an increase in short-term interest rates could also have a negative impact on the market value of our assets, other than our Servicing Related Assets. A decrease in interest rates could have a negative impact on the market value of our Servicing Related Assets. If any of these events happen, we could experience a decrease in net income or incur a net loss during these periods, which could adversely affect our liquidity and results of operations.
Hedging techniques are partly based on assumed levels of prepayments of our target assets, specifically our RMBS. If prepayments are slower or faster than assumed, the life of the investment will be longer or shorter, which would reduce the effectiveness of any hedging strategies we may use and may cause losses on such transactions. Hedging strategies involving the use of derivatives are highly complex and may produce volatile returns.
Interest Rate Cap Risk
Any adjustable-rate RMBS that we acquire will generally be subject to interest rate caps, which potentially could cause such RMBS to acquire many of the characteristics of fixed-rate securities if interest rates were to rise above the cap levels. This issue will be magnified to the extent we acquire adjustable-rate and hybrid adjustable-rate RMBS that are not based on mortgages which are fully indexed. In addition, adjustable-rate and hybrid adjustable-rate RMBS may be subject to periodic payment caps that result in some portion of the interest being deferred and added to the principal outstanding. This could result in our receipt of less cash income on such assets than we would need to pay the interest cost on our related borrowings. To mitigate interest rate mismatches, we may utilize the hedging strategies discussed above under “—Interest Rate Risk.” Actual economic conditions or implementation of decisions by our Manager may produce results that differ significantly from the estimates and assumptions used in our models and the projected results shown in this prospectus.
50
Table of Contents
Prepayment Risk; Extension Risk
The value of our assets may be affected by prepayment rates on mortgage loans. We anticipate that the mortgage loans, including the mortgages underlying our Excess MSRs and RMBS, will prepay at a projected rate generating an expected yield. If we purchase assets at a premium to par value, when borrowers prepay their mortgage loans faster than expected, the corresponding prepayments may reduce the expected yield on such assets because we will have to amortize the related premium on an accelerated basis. Conversely, if we purchase assets at a discount to par value, when borrowers prepay their mortgage loans slower than expected, the decrease in corresponding prepayments may reduce the expected yield on such assets because we will not be able to accrete the related discount as quickly as originally anticipated. A slower than anticipated rate of prepayment also will cause the life of the related RMBS to extend beyond that which was projected. As a result we would have a lower yielding asset for a longer period of time. In addition, if we have hedged our interest rate risk, extension may cause the security to be outstanding longer than the related hedge thereby reducing the protection intended to be provided by the hedge. With respect to our Servicing Related Assets, if prepayment speeds are significantly greater than expected, the carrying value of our Servicing Related Assets may change. If the fair value of our Servicing Related Assets decreases, we would be required to record a non-cash charge. Significant increases in prepayment speeds could also materially reduce the ultimate cash flows we receive from Servicing Related Assets, and we could ultimately receive substantially less than what we paid for such assets.
The following tables summarize the estimated change in fair value of our interests in the Excess MSRs owned as of December 31, 2014 and 2013, given several parallel shifts in the discount rate and voluntary prepayment rate (dollars in thousands):
Fair Value
At December 31, 2014
| (20)% | (10)% | -% | 10% | 20% | ||||||||||||||||
| Discount Rate Shift in % |
||||||||||||||||||||
| Estimated FV |
$ | 100,390 | $ | 95,645 | $ | 91,322 | $ | 87,366 | $ | 87,735 | ||||||||||
| Change in FV |
$ | 9,068 | $ | 4,324 | $ | — | $ | (3,956 | ) | $ | (7,587 | ) | ||||||||
| % Change in FV |
10 | % | 5 | % | — | % | (4 | )% | (8 | )% | ||||||||||
| Voluntary Prepayment Rate Shift in % |
||||||||||||||||||||
| Estimated FV |
$ | 98,737 | $ | 94,898 | $ | 91,322 | $ | 87,981 | $ | 84,855 | ||||||||||
| Change in FV |
$ | 7,416 | $ | 3,577 | $ | — | $ | (3,340 | ) | $ | (6,467 | ) | ||||||||
| % Change in FV |
8 | % | 4 | % | — | % | (4 | )% | (7 | )% | ||||||||||
| Recapture Rate Shift in % |
||||||||||||||||||||
| Estimated FV |
$ | 90,947 | $ | 91,134 | $ | 91,322 | $ | 91,509 | $ | 91,696 | ||||||||||
| Change in FV |
$ | (375 | ) | $ | (187 | ) | $ | — | $ | 187 | $ | 375 | ||||||||
| % Change in FV |
(0 | )% | (0 | )% | — | % | 0 | % | 0 | % | ||||||||||
At December 31, 2013
| (20)% | (10)% | -% | 10% | 20% | ||||||||||||||||
| Discount Rate Shift in % |
||||||||||||||||||||
| Estimated FV |
$ | 123,178 | $ | 116,396 | $ | 110,306 | $ | 104,812 | $ | 99,831 | ||||||||||
| Change in FV |
$ | 12,872 | $ | 6,090 | $ | — | $ | (5,495 | ) | $ | (10,475 | ) | ||||||||
| % Change in FV |
12 | % | 6 | % | — | % | (5 | )% | (9 | )% | ||||||||||
| Voluntary Prepayment Rate Shift in % |
||||||||||||||||||||
| Estimated FV |
$ | 117,814 | $ | 113,940 | $ | 110,306 | $ | 106,889 | $ | 103,668 | ||||||||||
| Change in FV |
$ | 7,508 | $ | 3,634 | $ | — | $ | (3,417 | ) | $ | (6,639 | ) | ||||||||
| % Change in FV |
7 | % | 3 | % | — | % | (3 | )% | (6 | )% | ||||||||||
| Recapture Rate Shift in % |
||||||||||||||||||||
| Estimated FV |
$ | 109,442 | $ | 109,874 | $ | 110,306 | $ | 110,739 | $ | 111,171 | ||||||||||
| Change in FV |
$ | (865 | ) | $ | (432 | ) | $ | — | $ | 432 | $ | 865 | ||||||||
| % Change in FV |
(1 | )% | — | % | — | % | — | % | 1 | % | ||||||||||
51
Table of Contents
The sensitivity analysis is hypothetical and is presented solely to assist an analysis of the possible effects on the fair value under various scenarios. It is not a prediction of the amount or likelihood of a change in any particular scenario. In particular, the results are calculated by stressing a particular economic assumption independent of changes in any other assumption. In practice, changes in one factor may result in changes in another, which might counteract or amplify the sensitivities. In addition, changes in the fair value based on a 10% variation in an assumption generally may not be extrapolated because the relationship of the change in the assumption to the change in fair value may not be linear.
The following tables summarize the estimated change in fair value of our RMBS owned as of December 31, 2014 and 2013, given several parallel increases in interest rates (dollars in thousands):
Fair Value Changes
At December 31, 2014
| Fair Value at December 31, 2014 | ||||||||||||||||||||||||
| December 31, 2014 | +25 Bps | +50 Bps | +75 Bps | +100 Bps | +150 Bps | |||||||||||||||||||
| RMBS Portfolio |
||||||||||||||||||||||||
| RMBS, available-for-sale |
$ | 416,003 | ||||||||||||||||||||||
| RMBS Total Return (%) |
(0.98 | )% | (2.06 | )% | (3.20 | )% | (4.38 | )% | (6.79 | )% | ||||||||||||||
|
|
|
|
|
|
|
|
|
|
|
|||||||||||||||
| RMBS Dollar Return |
$ | (4,081 | ) | $ | (8,588 | ) | $ | (13,329 | ) | $ | (18,203 | ) | $ | (28,255 | ) | |||||||||
At December 31, 2013
| Fair Value at December 31, 2013 | ||||||||||||||||||||||||
| December 31, 2013 | +25 Bps | +50 Bps | +75 Bps | +100 Bps | +150 Bps | |||||||||||||||||||
| RMBS Portfolio |
||||||||||||||||||||||||
| RMBS, available-for-sale |
$ | 286,979 | ||||||||||||||||||||||
| RMBS Total Return (%) |
(1.53 | )% | (3.06 | )% | (4.58 | )% | (6.09 | )% | (9.20 | )% | ||||||||||||||
|
|
|
|
|
|
|
|
|
|
|
|||||||||||||||
| RMBS Dollar Return |
$ | (4,385 | ) | $ | (8,776 | ) | $ | (13,141 | ) | $ | (17,477 | ) | $ | (26,396 | ) | |||||||||
The sensitivity analysis is hypothetical and is presented solely to assist an analysis of the possible effects on the fair value under various scenarios. It is not a prediction of the amount or likelihood of a change in any particular scenario. In particular, the results are calculated by stressing a particular economic assumption independent of changes in any other assumption. In practice, changes in one factor may result in changes in another, which might counteract or amplify the sensitivities. In addition, changes in the fair value based on variations in an assumption generally may not be extrapolated because the relationship of the change in the assumption to the change in fair value may not be linear.
Counterparty Risk
When we engage in repurchase transactions, we generally sell securities to lenders (i.e., repurchase agreement counterparties) and receive cash from the lenders. The lenders are obligated to resell the same securities back to us at the end of the term of the transaction. Because the cash we receive from the lender when we initially sell the securities to the lender is less than the value of those securities (this difference is the haircut), if the lender defaults on its obligation to resell the same securities back to us we would incur a loss on the transaction equal to the amount of the haircut (assuming there was no change in the value of the securities).
Our interest rate swaps are required to be cleared on an exchange which greatly mitigates, but does not entirely eliminate, counterparty risk.
Our investments in Excess MSRs are dependent on the mortgage servicer, Freedom Mortgage, to perform its servicing obligations. If the mortgage servicer fails to perform its obligations and is terminated, our investments in the related Excess MSRs could lose all their value. In addition, many servicers also rely on subservicing arrangements with third parties, and the failure
52
Table of Contents
of subservicers to adequately perform their services may negatively impact the servicer and, as a result, the performance an of our Excess MSRs. See “Item 1A. Risk Factors—Risks Related to Our Business—We will be dependent on mortgage servicers to service the mortgage loans underlying the Excess MSRs that we acquire.” In addition, should a servicer of the Excess MSRs that we acquire fail to make required payments, under our acknowledgment agreements with Ginnie Mae, Fannie Mae or Freddie Mac we could be exposed to potential liabilities. See “Risk Factors—Risks Related to Our Business—Acknowledgment agreements with Ginnie Mae, Fannie Mae or Freddie Mac could expose us to potential liability in the event of a payment default.” Moreover, our business model heavily relies upon our strategic alliance with Freedom Mortgage and our acquiring Excess MSRs through our relationship with Freedom Mortgage. To the extent Freedom Mortgage loses its ability to serve as a servicer for one or more of the GSEs, we could face significant adverse consequences. Similarly, if Freedom Mortgage is unable to successfully execute its business strategy or no longer maintains its financial viability, our business strategy would be materially adversely affected and our results of operations would suffer.
Funding Risk
To the extent available on desirable terms, we expect to continue to finance our RMBS with repurchase agreement financing. Over time, as market conditions change, in addition to these financings, we may use other forms of leverage. We may also seek to finance other mortgage-related assets, such as prime mortgage loans. Weakness in the financial markets, the residential mortgage markets and the economy generally could adversely affect one or more of our potential lenders and could cause one or more of our potential lenders to be unwilling or unable to provide us with financing or to increase the costs of that financing.
Liquidity Risk
A portion of the assets that comprise our asset portfolio are not publicly traded. A portion of these assets may be subject to legal and other restrictions on resale or will otherwise be less liquid than publicly-traded securities. The illiquidity of these assets may make it difficult for us to sell such assets if the need or desire arises, including in response to changes in economic and other conditions.
Credit Risk
We may become subject to varying degrees of credit risk in connection with our assets. Although we expect relatively low credit risk with respect to our Excess MSR portfolio and our Agency RMBS portfolio, to the extent we invest in non-Agency RMBS, prime mortgage loans and MSRs, we do expect to encounter credit risk related to these asset classes.
53
Table of Contents
| Item 8. | Consolidated Financial Statements and Supplementary Data. |
Consolidated Financial Statements
Index to Consolidated Financial Statements
| Page | ||||
| 55 | ||||
| Consolidated Balance Sheets as of December 31, 2014 and 2013 |
56 | |||
| 57 | ||||
| 58 | ||||
| 59 | ||||
| 60 | ||||
| 61 | ||||
54
Table of Contents
REPORT OF INDEPENDENT REGISTERED PUBLIC ACCOUNTING FIRM
The Board of Directors and Shareholders of Cherry Hill Mortgage Investment Corporation
We have audited the accompanying consolidated balance sheets of Cherry Hill Mortgage Investment Corporation and subsidiaries (the Company) as of December 31, 2014 and 2013, and the related consolidated statements of income, comprehensive income, stockholders’ equity and cash flows for the years ended December 31, 2014, December 31, 2013 and for the two month period from October 31, 2012 (date of inception) to December 31, 2012. These financial statements are the responsibility of the Company’s management. Our responsibility is to express an opinion on these financial statements based on our audits.
We conducted our audits in accordance with the standards of the Public Company Accounting Oversight Board (United States). Those standards require that we plan and perform the audit to obtain reasonable assurance about whether the financial statements are free of material misstatement. We were not engaged to perform an audit of the Company’s internal control over financial reporting. Our audits included consideration of internal control over financial reporting as a basis for designing audit procedures that are appropriate in the circumstances, but not for the purpose of expressing an opinion on the effectiveness of the Company’s internal control over financial reporting. Accordingly, we express no such opinion. An audit also includes examining, on a test basis, evidence supporting the amounts and disclosures in the financial statements, assessing the accounting principles used and significant estimates made by management, and evaluating the overall financial statement presentation. We believe that our audits provide a reasonable basis for our opinion.
In our opinion, the financial statements referred to above present fairly, in all material respects, the consolidated financial position of Cherry Hill Mortgage Investment Corporation and subsidiaries at December 31, 2014 and 2013, and the consolidated results of their operations and their cash flows for the years ended December 31, 2014, December 31, 2013 and for the two month period from October 31, 2012 (date of inception) to December 31, 2012, in conformity with U.S. generally accepted accounting principles.
Ernst & Young LLP
New York, New York
March 13, 2015
55
Table of Contents
Cherry Hill Mortgage Investment Corporation and Subsidiaries
Consolidated Balance Sheets
(in thousands — except share data)
| December 31, 2014 | December 31, 2013 | |||||||
| Assets |
||||||||
| RMBS, available-for-sale |
$ | 416,003 | $ | 286,979 | ||||
| Investments in Excess MSRs at fair value |
91,322 | 110,306 | ||||||
| Cash and cash equivalents |
12,447 | 10,375 | ||||||
| Restricted cash |
6,947 | 3,744 | ||||||
| Derivative assets |
342 | 4,613 | ||||||
| Receivables from unsettled trades |
309 | 7,239 | ||||||
| Receivables and other assets |
4,556 | 4,142 | ||||||
|
|
|
|
|
|||||
| Total Assets |
$ | 531,926 | $ | 427,398 | ||||
| Liabilities and Stockholders’ Equity |
||||||||
| Liabilities |
||||||||
| Repurchase agreements |
$ | 362,126 | $ | 261,302 | ||||
| Derivative liabilities |
4,088 | 592 | ||||||
| Dividends payable |
3,830 | 3,375 | ||||||
| Due to affiliates |
769 | 616 | ||||||
| Accrued expenses and other liabilities |
795 | 391 | ||||||
|
|
|
|
|
|||||
| Total Liabilities |
$ | 371,608 | $ | 266,276 | ||||
| Stockholders’ Equity |
||||||||
| Preferred stock, $0.01 par value, 100,000,000 shares authorized, none issued and outstanding as of December 31, 2014 and December 31, 2013 |
$ | — | $ | — | ||||
| Common stock, $0.01 par value, 500,000,000 shares authorized, 7,509,543 shares issued and outstanding at December 31, 2014 and 7,500,000 shares issued and outstanding at December 31, 2013 |
75 | 75 | ||||||
| Additional paid-in capital |
148,258 | 148,078 | ||||||
| Retained earnings |
4,799 | 17,695 | ||||||
| Accumulated other comprehensive income (loss) |
6,641 | (5,033 | ) | |||||
|
|
|
|
|
|||||
| Total CHMI Stockholders’ Equity |
$ | 159,773 | $ | 160,815 | ||||
| Non-controlling interests in operating partnership |
545 | 307 | ||||||
|
|
|
|
|
|||||
| Total Stockholders’ Equity |
$ | 160,318 | $ | 161,122 | ||||
|
|
|
|
|
|||||
| Total Liabilities and Stockholders’ Equity |
$ | 531,926 | $ | 427,398 | ||||
See notes to consolidated financial statements.
56
Table of Contents
Cherry Hill Mortgage Investment Corporation and Subsidiaries
Consolidated Statements of Income
(in thousands — except per share data)
| Year Ended December 31, |
Two Month Period October 31, 2012 (date of inception) to December 31, 2012 |
|||||||||||
| 2014 | 2013 | |||||||||||
| Income |
||||||||||||
| Interest income |
$ | 24,961 | $ | 5,475 | $ | — | ||||||
| Interest expense |
4,307 | 867 | — | |||||||||
|
|
|
|
|
|
|
|||||||
| Net interest income |
20,654 | 4,608 | — | |||||||||
| Other income (loss) |
— | |||||||||||
| Realized gain (loss) on RMBS, net |
(60 | ) | (527 | ) | — | |||||||
| Realized gain (loss) on derivatives, net |
(2,643 | ) | 59 | — | ||||||||
| Unrealized gain (loss) on derivatives, net |
(6,564 | ) | 2,747 | — | ||||||||
| Unrealized gain (loss) on investments in Excess MSRs |
(3,564 | ) | 15,647 | — | ||||||||
|
|
|
|
|
|
|
|||||||
| Total Income |
7,823 | 22,534 | — | |||||||||
| Expenses |
— | |||||||||||
| General and administrative expense |
3,028 | 716 | 25 | |||||||||
| Management fee to affiliate |
2,560 | 616 | — | |||||||||
|
|
|
|
|
|
|
|||||||
| Total Expenses |
5,588 | 1,332 | 25 | |||||||||
|
|
|
|
|
|
|
|||||||
| Income (Loss) Before Income Taxes |
2,235 | 21,202 | (25 | ) | ||||||||
| (Benefit from) provision for corporate business taxes |
(140 | ) | — | — | ||||||||
|
|
|
|
|
|
|
|||||||
| Net Income (Loss) |
2,375 | 21,202 | (25 | ) | ||||||||
| Net (income) loss allocated to LTIP - OP Units |
(22 | ) | (107 | ) | — | |||||||
|
|
|
|
|
|
|
|||||||
| Net Income (Loss) Applicable to Common Stockholders |
$ | 2,353 | $ | 21,095 | $ | (25 | ) | |||||
| Net income (Loss) Per Share of Common Stock |
— | |||||||||||
| Basic |
$ | 0.31 | $ | 12.50 | $ | (25.00 | ) | |||||
| Diluted |
$ | 0.31 | $ | 12.50 | $ | (25.00 | ) | |||||
| Weighted Average Number of Shares of Common Stock Outstanding |
— | |||||||||||
| Basic |
7,505,546 | 1,688,275 | 1,000 | |||||||||
| Diluted |
7,508,827 | 1,688,275 | 1,000 | |||||||||
See notes to consolidated financial statements.
57
Table of Contents
Cherry Hill Mortgage Investment Corporation and Subsidiaries
Consolidated Statements of Comprehensive Income
(in thousands)
| Year Ended December 31, |
Two Month Period October 31, 2012 (date of inception) to December 31, 2012 |
|||||||||||
| 2014 | 2013 | |||||||||||
| Net income (loss) |
$ | 2,375 | $ | 21,202 | $ | (25 | ) | |||||
| Other comprehensive income (loss): |
||||||||||||
| Net unrealized gain (loss) on RMBS |
11,674 | (5,033 | ) | — | ||||||||
|
|
|
|
|
|
|
|||||||
| Other comprehensive income (loss) |
11,674 | (5,033 | ) | — | ||||||||
|
|
|
|
|
|
|
|||||||
| Comprehensive income (loss) |
$ | 14,049 | $ | 16,169 | $ | (25 | ) | |||||
See notes to consolidated financial statements
58
Table of Contents
Cherry Hill Mortgage Investment Corporation and Subsidiaries
Consolidated Statements of Changes in Stockholders’ Equity
(in thousands — except share data)
| Common Stock Shares |
Common Stock Amount |
Additional Paid-in Capital |
Accumulated Other Comprehensive Income (Loss) |
Retained Earnings (Deficit) |
Non- Controlling Interest in Operating Partnership |
Total Stockholders’ Equity (Deficit) |
||||||||||||||||||||||
| Beginning balance, October 31, 2012 (date of inception) |
— | $ | — | $ | — | $ | — | $ | — | $ | — | $ | — | |||||||||||||||
| Common shares issued to founder on December 4, 2012 |
1,000 | — | (A) | 1 | — | — | — | 1 | ||||||||||||||||||||
| Net Loss for the two month period October 31, 2012 (date of inception) to December 31, 2012 |
— | — | — | — | (25 | ) | — | (25 | ) | |||||||||||||||||||
|
|
|
|
|
|
|
|
|
|
|
|
|
|
|
|||||||||||||||
| Balance, December 31, 2012 |
1,000 | $ | — | (A) | $ | 1 | $ | — | $ | (25 | ) | $ | — | $ | (24 | ) | ||||||||||||
| Repurchase of common stock |
(1,000 | ) | — | (1 | ) | — | — | — | (1 | ) | ||||||||||||||||||
| Issuance of common stock, net of offering costs |
7,500,000 | 75 | 148,078 | — | — | — | 148,153 | |||||||||||||||||||||
| Net Income |
— | — | — | — | 21,095 | 107 | 21,202 | |||||||||||||||||||||
| Other Comprehensive Loss |
— | — | — | (5,033 | ) | — | — | (5,033 | ) | |||||||||||||||||||
| LTIP-OP Unit awards |
— | — | — | — | — | 200 | 200 | |||||||||||||||||||||
| Common dividends declared, $0.45 per share |
— | — | — | — | (3,375 | ) | — | (3,375 | ) | |||||||||||||||||||
|
|
|
|
|
|
|
|
|
|
|
|
|
|
|
|||||||||||||||
| Balance, December 31, 2013 |
7,500,000 | $ | 75 | $ | 148,078 | $ | (5,033 | ) | $ | 17,695 | $ | 307 | $ | 161,122 | ||||||||||||||
| Issuance of common stock |
9,543 | — | (B) | 180 | — | — | — | 180 | ||||||||||||||||||||
| Net Income |
— | — | — | — | 2,353 | 22 | 2,375 | |||||||||||||||||||||
| Other Comprehensive Income |
— | — | — | 11,674 | — | — | 11,674 | |||||||||||||||||||||
| LTIP-OP Unit awards |
— | — | — | — | — | 320 | 320 | |||||||||||||||||||||
| Distribution paid on LTIP-OP Units |
— | — | — | — | — | (104 | ) | (104 | ) | |||||||||||||||||||
| Common dividends declared, $2.03 per share |
— | — | — | — | (15,249 | ) | — | (15,249 | ) | |||||||||||||||||||
|
|
|
|
|
|
|
|
|
|
|
|
|
|
|
|||||||||||||||
| Balance, December 31, 2014 |
7,509,543 | $ | 75 | $ | 148,258 | $ | 6,641 | $ | 4,799 | $ | 545 | $ | 160,318 | |||||||||||||||
| (A) | de minimis ($10 rounds to $0) |
| (B) | de minimis ($115 rounds to $0) |
See notes to consolidated financial statements.
59
Table of Contents
Cherry Hill Mortgage Investment Corporation and Subsidiaries
Consolidated Statements of Cash Flows
(in thousands)
| Year Ended December 31, |
Two Month Period October 31, 2012 (date of inception) to December 31, 2012 |
|||||||||||
| 2014 | 2013 | |||||||||||
| Cash Flows From Operating Activities |
||||||||||||
| Net income (loss) |
$ | 2,375 | $ | 21,202 | $ | (25 | ) | |||||
| Adjustments to reconcile net income (loss) to net cash provided by (used in) operating activities: |
||||||||||||
| Change in fair value of investments in Excess MSRs |
3,564 | (15,647 | ) | — | ||||||||
| Accretion of premium and other amortization |
2,058 | 217 | — | |||||||||
| Realized (gain) loss on RMBS, net |
60 | 527 | — | |||||||||
| Unrealized (gain) loss on derivatives, net |
6,564 | (2,747 | ) | — | ||||||||
| Realized (gain) loss on derivatives, net |
2,643 | (59 | ) | — | ||||||||
| LTIP-OP Unit awards |
320 | 200 | — | |||||||||
| Changes in: |
— | |||||||||||
| Receivables from unsettled trades |
6,930 | (7,239 | ) | — | ||||||||
| Other assets |
(414 | ) | (4,106 | ) | — | |||||||
| Due to affiliate |
153 | 616 | — | |||||||||
| Accrued expenses and other liabilities |
718 | 956 | 25 | |||||||||
|
|
|
|
|
|
|
|||||||
| Net cash provided by (used in) operating activities |
$ | 24,971 | $ | (6,080 | ) | $ | — | |||||
| Cash Flows From Investing Activities |
||||||||||||
| Purchase of RMBS |
(202,679 | ) | (416,695 | ) | — | |||||||
| Acquisition of Excess MSRs |
(2,181 | ) | (98,968 | ) | — | |||||||
| Proceeds from sale of RMBS |
57,511 | 121,785 | — | |||||||||
| Purchase of derivatives |
(1,585 | ) | (1,842 | ) | — | |||||||
| Sale of derivatives |
157 | — | — | |||||||||
| Principal paydown of Excess MSRs |
17,601 | 4,309 | — | |||||||||
| Principal paydown of RMBS |
25,369 | 2,155 | — | |||||||||
|
|
|
|
|
|
|
|||||||
| Net cash provided by (used in) investing activities |
$ | (105,807 | ) | $ | (389,256 | ) | $ | — | ||||
| Cash Flows From Financing Activities |
||||||||||||
| Repayments of repurchase agreements |
(1,410,035 | ) | (379,838 | ) | — | |||||||
| Margin deposits under repurchase agreements |
(3,203 | ) | (3,744 | ) | — | |||||||
| Borrowings under repurchase agreements |
1,510,859 | 641,140 | — | |||||||||
| Issuance of common stock, net of offering costs |
180 | 148,152 | 1 | |||||||||
| LTIP-OP Units distributions paid |
(104 | ) | — | — | ||||||||
| Dividends paid |
(14,789 | ) | — | — | ||||||||
|
|
|
|
|
|
|
|||||||
| Net cash provided by (used in) financing activities |
$ | 82,908 | $ | 405,710 | $ | 1 | ||||||
|
|
|
|
|
|
|
|||||||
| Net Increase (Decrease) in Cash and Cash Equivalents |
$ | 2,072 | $ | 10,374 | $ | 1 | ||||||
| Cash and Cash Equivalents, Beginning of Period |
10,375 | 1 | — | |||||||||
|
|
|
|
|
|
|
|||||||
| Cash and Cash Equivalents, End of Period |
$ | 12,447 | $ | 10,375 | $ | 1 | ||||||
| Supplemental Disclosure of Cash Flow Information |
||||||||||||
| Cash paid during the period for interest expense |
$ | 3,867 | $ | 178 | $ | — | ||||||
| Dividends declared but not paid |
$ | 3,830 | $ | 3,375 | $ | — | ||||||
See notes to consolidated financial statements.
60
Table of Contents
Cherry Hill Management Investment Corporation and Subsidiaries
Notes to Consolidated Financial Statements
Note 1 — Organization and Operations
Cherry Hill Mortgage Investment Corporation (together with its consolidated subsidiaries, the “Company” or “CHMI”) was organized in the state of Maryland on October 31, 2012 to invest in residential mortgage assets in the United States. Under the Company’s charter, at December 31, 2012, CHMI was authorized to issue 1,000 shares of common stock. On June 6, 2013, the Company amended and restated its charter and increased its authorized capitalization. Accordingly, at December 31, 2013, the Company was authorized to issue up to 500,000,000 shares of common stock and 100,000,000 shares of preferred stock, each with a par value of $0.01 per share. CHMI commenced operations on or about October 9, 2013.
The accompanying consolidated financial statements include the accounts of the Company’s subsidiaries, Cherry Hill Operating Partnership LP, Cherry Hill QRS I, LLC, Cherry Hill QRS II, LLC, CHMI Insurance Company, LLC and CHMI Solutions, Inc. (“Solutions”), (formerly CHMI Solutions, LLC).
On October 9, 2013, the Company completed an initial public offering (the “IPO”) of 6,500,000 shares of common stock and a concurrent private placement of 1,000,000 shares of common stock. The IPO and concurrent private placement resulted in the sale of 7,500,000 shares of common stock, at a price per share of $20.00. The net proceeds to the Company from the IPO and the concurrent private placement were approximately $148.1 million, after deducting offering-related expenses payable by the Company. The Company did not conduct any activity prior to the IPO and the concurrent private placement. Substantially all of the net proceeds from the IPO were used to invest in excess mortgage servicing rights on residential mortgage loans (“Excess MSRs”) and Agency residential mortgage-backed securities (“RMBS” or “securities”).
Prior to the IPO, the Company was a development stage company that had not commenced operations other than the organization of the Company. The Company completed the IPO and concurrent private placement on October 9, 2013, at which time the Company commenced operations.
Prior to the IPO, the sole stockholder of the Company was Stanley Middleman. On December 4, 2012, Mr. Middleman made a $1,000 initial capital contribution to CHMI in exchange for 1,000 shares of common stock, and, on October 9, 2013, CHMI repurchased these shares from Mr. Middleman for $1,000.
The Company is party to a management agreement (the “Management Agreement”) with Cherry Hill Mortgage Management, LLC (the “Manager”), a Delaware limited liability company which is controlled by Mr. Middleman. For a further discussion of the Management Agreement, see Note 7.
The Company was taxed for U.S. federal income tax purposes as a Subchapter C corporation for the two month period from October 31, 2012 (date of inception) to December 31, 2012. On February 13, 2013, the Company elected to be taxed for U.S. federal income tax purposes as a Subchapter S corporation effective January 1, 2013, and, as such, all federal tax liabilities were the responsibility of the sole stockholder. In anticipation of the IPO, the Company elected to revoke its Subchapter S election on October 2, 2013 and has elected to be taxed as a real estate investment trust (“REIT”), as defined under the Internal Revenue Service Code of 1986, as amended, (the “Code”) for U.S. federal income tax purposes commencing with the year ended December 31, 2013. As long as the Company continues to comply with a number of requirements under federal tax law and maintains its qualification as a REIT, the Company generally will not be subject to U.S. federal income taxes to the extent that the Company distributes its taxable income to its stockholders on an annual basis and does not engage in prohibited transactions. However, certain activities that the Company may perform may cause it to earn income that will not be qualifying income for REIT purposes.
61
Table of Contents
Note 2 — Basis of Presentation and Significant Accounting Policies
Basis of Accounting
The accompanying consolidated financial statements are prepared in accordance with U.S. generally accepted accounting principles (“GAAP”). The consolidated financial statements include the accounts of CHMI and its consolidated subsidiaries. All significant intercompany transactions and balances have been eliminated. CHMI consolidates those entities in which it has an investment of 50% or more and has control over significant operating, financial and investing decisions of the entity.
Emerging Growth Company Status
On April 5, 2012, the Jumpstart Our Business Startups Act (the “JOBS Act”) was signed into law. The JOBS Act contains provisions that, among other things, reduce certain reporting requirements for qualifying public companies. Because the Company qualifies as an “emerging growth company,” it may, under Section 7(a)(2)(B) of the Securities Act of 1933, delay adoption of new or revised accounting standards applicable to public companies until such standards would otherwise apply to private companies. The Company has elected to take advantage of this extended transition period until the first to occur of the date that it (i) is no longer an “emerging growth company” or (ii) affirmatively and irrevocably opts out of this extended transition period. As a result, the financial statements may not be comparable to those of other public companies that comply with such new or revised accounting standards. Until the date that the Company is no longer an “emerging growth company” or affirmatively and irrevocably opts out of the extended transition period, upon issuance of a new or revised accounting standard that applies to the financial statements and that has a different effective date for public and private companies, the Company will disclose the date on which adoption is required for non-emerging growth companies and the date on which it will adopt the recently issued accounting standard.
Use of Estimates
The preparation of financial statements in conformity with GAAP requires management to make a number of significant estimates and assumptions. These include estimates of fair value of RMBS, Excess MSRs, derivatives and credit losses including the period of time during which the Company anticipates an increase in the fair values of securities sufficient to recover unrealized losses on those securities, and other estimates that affect the reported amounts of certain assets and liabilities and disclosure of contingent assets and liabilities as of the date of the consolidated financial statements and the reported amounts of certain revenues and expenses during the reporting period. It is likely that changes in these estimates (e.g., valuation changes due to supply and demand, credit performance, prepayments, interest rates, or other reasons) will occur in the near term. The Company’s estimates are inherently subjective in nature; actual results could differ from its estimates and differences may be material.
Risks and Uncertainties
In the normal course of business, CHMI encounters primarily two significant types of economic risk: credit and market. Credit risk is the risk of default on CHMI’s investments in RMBS, Excess MSRs and derivatives that results from a borrower’s or derivative counterparty’s inability or unwillingness to make contractually required payments. Market risk reflects changes in the value of investments in RMBS, Excess MSRs and derivatives due to changes in interest rates, spreads or other market factors.
Additionally, CHMI is subject to the risks involved with real estate and real estate-related debt instruments. These include, among others, the risks normally associated with changes in the general economic climate, changes in the mortgage market, changes in tax laws, interest rate levels, and the availability of financing.
Additionally, CHMI is subject to significant tax risks. If CHMI were to fail to qualify as a REIT in any taxable year, CHMI would be subject to U.S. federal income tax (including any applicable alternative minimum tax), which could be material. Unless entitled to relief under certain statutory provisions, CHMI would also be disqualified from treatment as a REIT for the four taxable years following the year during which qualification is lost.
62
Table of Contents
Investments in RMBS
Classification – CHMI classifies its investments in RMBS as securities available for sale. Although CHMI generally intends to hold most of its securities until maturity, it may, from time to time, sell any of its securities as part of its overall management of its portfolio. Securities available for sale are carried at fair value with the net unrealized gains or losses reported as a separate component of accumulated other comprehensive income, to the extent impairment losses, if any, are considered temporary. Unrealized losses on securities are charged to earnings if they reflect a decline in value that is other-than-temporary, as described below.
Fair value is determined under the guidance of ASC 820, Fair Value Measurements and Disclosures (“ASC 820”). The Company determines fair value of its RMBS investments based upon prices obtained from third-party pricing providers. The third-party pricing providers use pricing models that generally incorporate such factors as coupons, primary and secondary mortgage rates, rate reset period, issuer, prepayment speeds, credit enhancements and expected life of the security. In determining the fair value of RMBS, management judgment is used to arrive at fair value that considers prices obtained from third-party pricing providers and other applicable market data. The Company’s application of ASC 820 guidance is discussed in further detail at Note 9.
Investment securities transactions are recorded on the trade date. Purchases of newly-issued securities are recorded when all significant uncertainties regarding the characteristics of the securities are removed, generally shortly before settlement date. At disposition, the net realized gain or loss is determined on the basis of the cost of the specific investment and is included in earnings. All RMBS purchased or sold in the year ended December 31, 2014 were settled.
Revenue Recognition – Interest income from coupon payments is accrued based on the outstanding principal amount of the RMBS and their contractual terms. Premiums and discounts associated with the purchase of the RMBS are accreted into interest income over the projected lives of the securities using the interest method. The Company’s policy for estimating prepayment speeds for calculating the effective yield is to evaluate historical performance, consensus prepayment speeds, and current market conditions. Adjustments are made for actual prepayment activity. Approximately $1.3 million in interest income is receivable at December 31, 2014, and is classified as “Receivables and other assets” on the consolidated balance sheet.
Impairment – CHMI evaluates its RMBS, on a quarterly basis, to assess whether a decline in the fair value below the amortized cost basis is an other-than-temporary impairment (“OTTI”). The presence of OTTI is based upon a fair value decline below a security’s amortized cost basis and a corresponding adverse change in expected cash flows due to credit related factors as well as non-credit factors, such as changes in interest rates and market spreads. Impairment is considered other-than-temporary if an entity (i) intends to sell the security, (ii) will more likely than not be required to sell the security before it recovers in value, or (iii) does not expect to recover the security’s amortized cost basis, even if the entity does not intend to sell the security. Under these scenarios, the impairment is other-than-temporary and the full amount of impairment should be recognized currently in earnings and the cost basis of the security is adjusted. However, if an entity does not intend to sell the impaired security and it is more likely than not that it will not be required to sell before recovery, the OTTI should be separated into (i) the estimated amount relating to credit loss, or credit component, and (ii) the amount relating to all other factors, or non-credit component. Only the estimated credit loss amount is recognized currently in earnings, with the remainder of the loss recognized in other comprehensive income. The difference between the new amortized cost basis and the cash flows expected to be collected is accreted into interest income in accordance with the effective interest method.
Investments in Excess MSRs
Classification – Upon acquisition, CHMI elected the fair value option to record its investments in Excess MSRs in order to provide users of the financial statements with better information regarding the effects of prepayment risk and other market factors on the Excess MSRs. Under this election, CHMI records a valuation adjustment on its investments in Excess MSRs on a quarterly basis to recognize the changes in fair value in net income as described below. In determining the valuation of Excess MSRs, management used an internally developed models that are primarily based on observable market-based inputs but also include unobservable market data inputs (see Note 9).
Revenue Recognition – Excess MSRs are aggregated into pools as applicable; each pool of Excess MSRs is accounted for in the aggregate. Interest income for Excess MSRs is accreted into interest income on an effective yield or “interest” method, based upon the expected excess mortgage servicing amount over the expected life of the underlying mortgages. Changes to
63
Table of Contents
expected cash flows result in a cumulative retrospective adjustment, which will be recorded in the period in which the change in expected cash flows occurs. Under the retrospective method, the interest income recognized for a reporting period would be measured as the difference between the amortized cost basis at the end of the period and the amortized cost basis at the beginning of the period, plus any cash received during the period. The amortized cost basis is calculated as the present value of estimated future cash flows using an effective yield, which is the yield that equates all past actual and current estimated future cash flows to the initial investment. The difference between the fair value of Excess MSRs and their amortized cost basis is recorded on the income statement as “Unrealized gain (loss) on investments in excess mortgage servicing rights.” Fair value is generally determined by discounting the expected future cash flows using discount rates that incorporate the market risks and liquidity premium specific to the Excess MSRs and, therefore, may differ from their effective yields. Approximately $2.7 million in Excess MSR cash flow is receivable at December 31, 2014, and is classified as “Receivables and other assets” on the consolidated balance sheet.
Derivatives and Hedging Activities
Derivative transactions include swaps, swaptions, treasury futures and TBAs. Swaps and swaptions are entered into by CHMI solely for interest rate risk management purposes. TBAs are used for duration risk and basis risk management purposes. The decision of whether or not a given transaction/position (or portion thereof) is economically hedged is made on a case-by-case basis, based on the risks involved and other factors as determined by senior management, including restrictions imposed by the Code on REITs among others. In determining whether to economically hedge a risk, CHMI may consider whether other assets, liabilities, firm commitments and anticipated transactions already offset or reduce the risk. All transactions undertaken as economic hedges are entered into with a view towards minimizing the potential for economic losses that could be incurred by CHMI. Generally, derivatives entered into are not intended to qualify as hedges under GAAP, unless specifically stated otherwise.
CHMI’s derivative financial instruments contain credit risk to the extent that its bank counterparties may be unable to meet the terms of the agreements. CHMI reduces such risk by limiting its counterparties to major financial institutions. In addition, the potential risk of loss with any one party resulting from this type of credit risk is monitored. Finally, CHMI’s interest rate swaps are required to be cleared on an exchange, which further mitigates but does not eliminate, credit risk. Management does not expect any material losses as a result of default by other parties.
Classification – All derivatives are recognized as either assets or liabilities on the consolidated balance sheet and measured at fair value. Due to the nature of these instruments, they may be in a receivable/asset position or a payable/liability position at the end of an accounting period. Derivative amounts payable to, and receivable from, the same party under contracts may be offset as long as the following conditions are met: (i) each of the two parties owes the other determinable amounts; (ii) the reporting party has the right to offset the amount owed with the amount owed by the other party; (iii) the reporting party intends to offset; and (iv) the right to offset is enforceable by law. CHMI reports the fair value of derivative instruments gross of cash paid or received pursuant to credit support agreements, and fair value is reflected on a net counterparty basis when CHMI believes a legal right of offset exists under an enforceable master netting agreement. For further discussion on offsetting assets and liabilities, see Note 8.
Revenue Recognition – With respect to derivatives that have not been designated as hedges, any net payments under, or fluctuations in the fair value of, such derivatives have been recognized currently in “Realized and unrealized gains (losses) on derivatives, net” in the consolidated statements of income. These derivatives may, to some extent, be economically effective as hedges.
Cash and Cash Equivalents and Restricted Cash
CHMI considers all highly liquid short-term investments with maturities of 90 days or less when purchased to be cash equivalents. Substantially all amounts on deposit with major financial institutions exceed insured limits. Restricted cash represents the Company’s cash held by counterparties as collateral against CHMI’s derivatives and/or repurchase agreements.
Due to Affiliate
This represents amounts due to the Manager pursuant to the Management Agreement. For further information on the Management Agreement, see Note 7.
64
Table of Contents
Income Taxes
As long as the Company qualifies as a REIT, the Company generally will not be subject to U.S. federal income taxes on its taxable income to the extent it annually distributes at least 90% of its net taxable income to stockholders and does not engage in prohibited transactions. The Company intends to comply with all requirements to continue to qualify as a REIT. The majority of states also recognize the Company’s REIT status. For the taxable years ended December 31, 2014 and 2013, the Company qualified to be taxed as a REIT for US federal income tax purposes.
The Company assesses its tax positions for all open tax years and determines if it has any material unrecognized liabilities in accordance with ASC 740, Income Taxes. The Company records these liabilities to the extent it deems them more-likely-than-not to be incurred. The Company classifies interest and penalties on material uncertain tax positions, if any, as interest expense and operating expense, respectively, in its consolidated statements of income. The Company has not incurred any interest or penalties.
Effective January 1, 2014, Solutions has elected to be taxed as a corporation for Federal income tax purposes; prior to this date, Solutions was a disregarded entity for Federal income tax purposes. Solutions has jointly elected with the Company, the ultimate beneficial owner of Solutions, to be treated as a taxable REIT subsidiary.
The Company accounts for income taxes in accordance with ASC 740, Income Taxes. ASC 740 requires the recording of deferred income taxes that reflect the net tax effect of temporary differences between the carrying amounts of the Company’s assets and liabilities for financial reporting purposes and the amounts used for income tax purposes, including operating loss carry forwards. Deferred tax assets and liabilities are measured using enacted tax rates expected to apply to taxable income in the years in which those temporary differences are expected to be recovered or settled. The effect of a change in tax rates on deferred tax assets and liabilities is recognized in earnings in the period that includes the enactment date. The Company records interest and penalties related to income taxes within the provision for income taxes in the statement of income.
65
Table of Contents
Realized Gain (Loss) on RMBS and Derivatives, Net
The following table presents gains and losses on sales of RMBS and derivatives for the periods indicated (dollars in thousands):
| Year Ended December 31, |
Two Month Period October 31, 2012 (date of inception) to December 31, 2013 |
|||||||||||
| 2014 | 2013 | |||||||||||
| Realized gain (loss) on RMBS, net |
||||||||||||
| Gain on RMBS |
$ | 303 | $ | 116 | $ | — | ||||||
| Loss on RMBS |
(363 | ) | (643 | ) | — | |||||||
|
|
|
|
|
|
|
|||||||
| Net realized gain (loss) on RMBS |
(60 | ) | (527 | ) | — | |||||||
| Realized gain (loss) on derivatives, net |
(2,643 | ) | 59 | — | ||||||||
| Unrealized gain (loss) on derivatives, net |
(6,564 | ) | 2,747 | — | ||||||||
|
|
|
|
|
|
|
|||||||
| Total |
$ | (9,267 | ) | $ | 2,279 | $ | — | |||||
Repurchase Agreements and Interest Expense
CHMI finances its investments in RMBS with short-term borrowings under master repurchase agreements. The repurchase agreements are generally short-term debt, which expire within one year. Borrowings under repurchase agreements generally bear interest rates of a specified margin over one-month LIBOR and are generally uncommitted. The repurchase agreements are treated as collateralized financing transactions and are carried at their contractual amounts, as specified in the respective agreements. Interest is recorded at the contractual amount on an accrual basis.
Dividends Payable
Because the Company is organized as a REIT under the Code, it is required by law to distribute annually at least 90% of its REIT taxable income, which it does in the form of quarterly dividend payments. The Company accrues the dividend payable on the accounting date, which causes an offsetting reduction in retained earnings.
Comprehensive Income
Comprehensive income is defined as the change in equity of a business enterprise during a period from transactions and other events and circumstances, excluding those resulting from investments by and distributions to owners. For CHMI’s purposes, comprehensive income represents net income, as presented in the consolidated statements of income, adjusted for unrealized gains or losses on RMBS, which are designated as available for sale.
Offering Costs
Offering costs of approximately $1.9 million incurred in connection with the Company’s IPO and concurrent private placement were reflected as a reduction of additional paid-in-capital. Costs incurred which were not directly associated with the completion of the IPO and concurrent private placement were expensed as incurred. Offering costs incurred in connection with the IPO and concurrent private placement included, among others, the fees and disbursements of the Company’s counsel, the costs of printing the prospectus for the IPO, the fees paid to apply to list the Company’s common stock and all filing fees paid in connection with the IPO. However, the manager agreed to pay the underwriting discounts and commissions and a structuring fee of 0.375% of the gross proceeds of the IPO and concurrent private placement without reimbursement from the Company.
Offering costs of approximately $154,000 incurred in connection with the preparation and filing of the Company’s shelf registration statement on Form S-3 and the resale shelf registration statement on Form S-3 covering the shares of the Company’s common stock acquired on the concurrent private placement in 2013, each of which was declared effective on December 3, 2014 were expensed in December 2014. Offering costs included, among others, the fees and disbursements of the Company’s external counsel, and the costs of printing.
66
Table of Contents
Recent Accounting Pronouncements
Offsetting Assets and Liabilities – In December 2011, the Financial Accounting Standards Board (“FASB”) issued Accounting Standards Update (“ASU”) 2011-11, Disclosures about Offsetting Assets and Liabilities, which amends ASC 210, Balance Sheet. The amendments in ASU 2011-11 enhance disclosures required by U.S. GAAP by requiring improved information about financial instruments and derivative instruments that are either (1) offset in accordance with ASC 210, Balance Sheet or ASC 815, Other Presentation Matters or (2) subject to an enforceable master netting arrangement or similar agreement. ASU 2011-11 is effective for the first interim or annual period beginning on or after January 1, 2013. In January 2013, the FASB issued ASU 2013-01, Balance Sheet: Clarifying the Scope of Disclosures about Offsetting Assets and Liabilities, which limits the scope of ASU 2011-11 to certain derivatives, repurchase agreements and securities lending arrangements. ASU 2013-01 is also effective for the first interim or annual period beginning on or after January 1, 2013. Adopting both ASU 2011-11 and ASU 2013-01 did not have any impact on the Company’s consolidated financial condition, results of operations or earnings per share, but did impact financial statement disclosures – refer to Note 8.
Comprehensive Income – In February 2013, the FASB issued ASU 2013-02, Reporting of Amounts Reclassified Out of Accumulated Other Comprehensive Income, which amends ASC 320, Comprehensive Income. ASU 2013-02 provides disclosure guidance on amounts reclassified out of Accumulated Other Comprehensive Income by component. The new guidance does not change the requirement to present items of net income and OCI and totals for net income, OCI and comprehensive income in a single continuous statement or two consecutive statements. ASU 2013-02 is effective for the first interim or annual period beginning on or after December 15, 2012. Adopting ASU 2013-02 did not have any impact on the Company’s consolidated financial condition, results of operations or earnings per share.
Liabilities – In March 2013, the FASB issued ASU 2013-04, Obligations Resulting from Joint and Several Liability Arrangements for Which the Total Amount of the Obligation Is Fixed at the Reporting Date, which amends ASC 405, Liabilities. ASU 2013-04 requires additional disclosures about joint and several liability arrangements and requires the Company to measure obligations resulting from joint and several liability arrangements as the sum of the amount the Company agreed to pay on the basis of its arrangement among its co-obligors and any additional amount the Company expects to pay on behalf of its co-obligors. ASU 2013-04 is effective for the fiscal years and interim periods beginning after December 15, 2013. Adopting ASU 2013-04 did not have any impact on the Company’s consolidated financial condition, results of operations or earnings per share.
Presentation of an Unrecognized Tax Benefit – In July 2013, the FASB issued ASU 2013-11, Presentation of an Unrecognized Tax Benefit When a Net Operating Loss Carryforward, a Similar Tax Loss, or a Tax Credit Carryforward Exists, which amends ASC 740, Income Taxes. ASU 2013-11 requires an entity to present an unrecognized tax benefit as a reduction of a deferred tax asset for a net operating loss (“NOL”) carryforward or similar tax loss or tax credit carryforward, rather than as a liability when (1) the uncertain tax position would not reduce the NOL or other carryforward under the tax law of the applicable jurisdiction, and (2) the entity intends to use the deferred tax asset for that purpose. ASU 2013-11 does not require any new recurring disclosures. It is effective prospectively for fiscal years, and interim periods within those years, beginning on or after December 15, 2013, with early adoption permitted. Adopting ASU 2013-11 did not have any impact on the Company’s consolidated financial condition, results of operations or earnings per share.
Revenue Recognition – In May 2014, the FASB issued ASU 2014-09, Revenue from Contracts with Customers, which supersedes the revenue recognition requirements in ASC 606, Revenue Recognition, and most industry-specific guidance throughout the Industry Topics of the Codification. The core principle of ASU 2014-09 is that an entity should recognize revenue to depict the transfer of promised goods or services to customers in an amount that reflects the consideration to which the entity expects to be entitled in exchange for those goods or services. ASU 2014-09 is effective for fiscal years and
67
Table of Contents
interim periods beginning after December 15, 2016 and early adoption is not permitted. Management is evaluating the impact of ASU 2014-09; however, it is not expected to have a significant impact on the Company’s financial condition, results of operations or earnings per share.
Transfers and Servicing – In June 2014, the FASB issued ASU 2014-11, Repurchase-to-Maturity Transactions, Repurchase Financings, and Disclosures, which amends ASC 860, Transfers and Servicing. ASU 2014-11, which affects all entities that enter into repurchase-to-maturity transactions or repurchase financings, requires two accounting changes. First, ASU 2014-11 changes the accounting for repurchase-to-maturity transactions to secured borrowing accounting. Second, for repurchase financing arrangements, ASU 2014-11 requires separate accounting for a transfer of a financial asset executed contemporaneously with a repurchase agreement with the same counterparty, which will result in secured borrowing accounting for the repurchase agreement. ASU 2014-11 also requires disclosures for certain transactions comprising (1) a transfer of a financial asset accounted for as a sale and (2) an agreement with the same transferee entered into in contemplation of the initial transfer that results in the transferor retaining substantially all of the exposure to the economic return on the transferred financial asset throughout the term of the transaction. For those transactions outstanding at the reporting date, the transferor is required to disclose additional information by type of transaction. ASU 2014-11 also requires certain disclosures for repurchase agreements, securities lending transactions, and repurchase-to-maturity transactions that are accounted for as secured borrowings. The accounting changes in ASU 2014-11 are effective for public business entities for the first interim or annual period beginning after December 15, 2014. For public business entities, the disclosure for certain transactions accounted for as a sale is required to be presented for interim and annual periods beginning after December 15, 2014, and the disclosure for repurchase agreements, securities lending transactions, and repurchase-to-maturity transactions accounted for as secured borrowings is required to be presented for annual periods beginning after December 15, 2014, and for interim periods beginning after March 15, 2015, with early adoption prohibited. Currently, management does not anticipate that the adoption of ASU 2014-11 will have a material impact on the consolidated financial condition, results of operations or earnings per share.
Stock Compensation – In June 2014, the FASB issued ASU 2014-12, Accounting for Share-Based Payments When the Terms of an Award Provide that a Performance Target Could be Achieved After the Requisite Service Period, which amends ASC 718, Compensation – Stock Compensation. ASU 2014-12 requires that a performance target that affects vesting and that could be achieved after the requisite service period be treated as a performance condition. A reporting entity should apply existing guidance in ASC 718 as it relates to awards with performance conditions that affect vesting to account for such awards. As such, the performance target should not be reflected in estimating the grant-date fair value of the award. Compensation cost should be recognized in the period in which it becomes probable that the performance target will be achieved and should represent the compensation cost attributable to the period(s) for which the requisite service has already been rendered. If the performance target becomes probable of being achieved before the end of the requisite service period, the remaining unrecognized compensation cost should be recognized prospectively over the remaining requisite service period. The total amount of compensation cost recognized during and after the requisite service period should reflect the number of awards that are expected to vest and should be adjusted to reflect those awards that ultimately vest. The requisite service period ends when the employee can cease rendering service and still be eligible to vest in the award if the performance target is achieved. As indicated in the definition of vest, the stated vesting period (which includes the period in which the performance target could be achieved) may differ from the requisite service period. ASU 2014-12 is effective for annual periods and interim periods within those annual periods beginning after December 15, 2015, with early adoption permitted. Currently, management does not anticipate that the adoption of ASU 2014-12 will have a material impact on the consolidated financial condition, results of operations or earnings per share.
Going Concern – In August 2014, the FASB issued ASU 2014-15, Disclosures of Uncertainties about an Entity’s Ability to Continue as a Going Concern, which amends ASC Subtopic 205-40, Presentation of Financial Statements – Going Concern. ASU 2014-15 provides guidance in GAAP about management’s responsibility to evaluate whether there are conditions or events that raise substantial doubt about an entity’s ability to continue as a going concern within one year after the date that the financial statements are issued and to provide related footnote disclosures of the relevant facts and circumstances. ASU 2014-15 is effective for the annual period ending after December 15, 2016, and for annual periods and interim periods thereafter, with early adoption permitted. Currently, management does not anticipate that the adoption of ASU 2014-15 will have a material impact on the consolidated financial condition, results of operations or earnings per share.
68
Table of Contents
Note 3 — Segment Reporting
The Company conducts its business through the following segments: (i) investments in RMBS; and (ii) investments in Servicing Related Assets. “All Other” consists primarily of general and administrative expenses including fees to the directors, and management fees pursuant to the Management Agreement (see Note 7). For segment reporting purposes, CHMI does not allocate interest income on short-term investments or general and administrative expenses.
69
Table of Contents
Summary financial data on CHMI’s segments is given below, together with a reconciliation to the same data for CHMI as a whole (dollars in thousands):
| Servicing Related Assets |
RMBS | All Other | Total | |||||||||||||
| Income Statement |
||||||||||||||||
| Year Ended December 31, 2014 |
||||||||||||||||
| Interest income |
$ | 14,318 | $ | 10,643 | $ | — | $ | 24,961 | ||||||||
| Interest expense |
— | 4,307 | — | 4,307 | ||||||||||||
|
|
|
|
|
|
|
|
|
|||||||||
| Net interest income |
14,318 | 6,336 | — | 20,654 | ||||||||||||
| Other income |
(3,564 | ) | (9,267 | ) | — | (12,831 | ) | |||||||||
| Other operating expenses |
— | — | 5,588 | 5,588 | ||||||||||||
| (Benefit from) provision for corporate business taxes |
(140 | ) | — | — | (140 | ) | ||||||||||
|
|
|
|
|
|
|
|
|
|||||||||
| Net income (loss) |
$ | 10,894 | $ | (2,931 | ) | $ | (5,588 | ) | $ | 2,375 | ||||||
| Year Ended December 31, 2013 |
||||||||||||||||
| Interest income |
$ | 3,552 | $ | 1,923 | $ | — | (A) | $ | 5,475 | |||||||
| Interest expense |
— | 867 | — | 867 | ||||||||||||
|
|
|
|
|
|
|
|
|
|||||||||
| Net interest income |
3,552 | 1,056 | — | 4,608 | ||||||||||||
| Other income |
15,647 | 2,279 | — | 17,926 | ||||||||||||
| Other operating expenses |
— | — | 1,332 | 1,332 | ||||||||||||
| Corporate business taxes |
— | — | — | — | ||||||||||||
|
|
|
|
|
|
|
|
|
|||||||||
| Net income (loss) |
$ | 19,199 | $ | 3,335 | $ | (1,332 | ) | $ | 21,202 | |||||||
| Two Month Period October 31, 2012 (date of inception) to December 31, 2012 |
||||||||||||||||
| Other operating expenses |
$ | — | $ | — | $ | 25 | $ | 25 | ||||||||
| Corporate business taxes |
— | — | — | — | ||||||||||||
|
|
|
|
|
|
|
|
|
|||||||||
| Net income (loss) |
$ | — | $ | — | $ | (25 | ) | $ | (25 | ) | ||||||
| Balance Sheet |
||||||||||||||||
| December 31, 2014 |
||||||||||||||||
| Investments |
$ | 91,322 | $ | 416,003 | $ | — | $ | 507,325 | ||||||||
| Other assets |
2,713 | 8,920 | 12,968 | 24,601 | ||||||||||||
|
|
|
|
|
|
|
|
|
|||||||||
| Total assets |
94,035 | 424,923 | 12,968 | 531,926 | ||||||||||||
| Debt |
— | 362,126 | — | 362,126 | ||||||||||||
| Other liabilities |
— | 4,319 | 5,163 | 9,482 | ||||||||||||
|
|
|
|
|
|
|
|
|
|||||||||
| Total liabilities |
— | 366,445 | 5,163 | 371,608 | ||||||||||||
| GAAP book value |
$ | 94,035 | $ | 58,478 | $ | 7,805 | $ | 160,318 | ||||||||
| December 31, 2013 |
||||||||||||||||
| Investments |
$ | 110,306 | $ | 286,979 | $ | — | $ | 397,285 | ||||||||
| Other assets |
2,828 | 16,494 | 10,791 | 30,113 | ||||||||||||
|
|
|
|
|
|
|
|
|
|||||||||
| Total assets |
113,134 | 303,473 | 10,791 | 427,398 | ||||||||||||
| Debt |
— | 261,302 | — | 261,302 | ||||||||||||
| Other liabilities |
— | 690 | 4,284 | 4,974 | ||||||||||||
|
|
|
|
|
|
|
|
|
|||||||||
| Total liabilities |
— | 261,992 | 4,284 | 266,276 | ||||||||||||
| GAAP book value |
$ | 113,134 | $ | 41,481 | $ | 6,507 | $ | 161,122 | ||||||||
| (A) | de minimis ($192 rounds to $0) |
Note 4 — Investments in RMBS
The following is a summary of CHMI’s RMBS at December 31, 2014 and 2013, all of which are classified as available for sale and are, therefore, reported at fair value with changes in fair value recorded in other comprehensive income, except for securities that are other-than-temporarily impaired, for which there was none for the current year-ended (dollars in thousands):
70
Table of Contents
Available for Sale Securities
At December 31, 2014
| Asset Type |
Original | Gross Unrealized | Number | Weighted Average | ||||||||||||||||||||||||||||||||||||
| Face Value |
Book Value |
Gains | Losses | Carrying Value(A) |
of Securities |
Rating | Coupon | Yield | Maturity (Years)(C) |
|||||||||||||||||||||||||||||||
| RMBS |
||||||||||||||||||||||||||||||||||||||||
| Fannie Mae |
$ | 267,516 | $ | 263,924 | $ | 4,674 | $ | (10 | ) | $ | 268,588 | 33 | (B) | 3.89 | % | 3.51 | % | 24 | ||||||||||||||||||||||
| Freddie Mac |
144,064 | 138,333 | 2,143 | — | 140,476 | 17 | (B) | 3.75 | % | 2.99 | % | 23 | ||||||||||||||||||||||||||||
| CMOs |
25,964 | 7,105 | — | (166 | ) | 6,939 | 4 | Unrated | 4.18 | % | 12.65 | % | 14 | |||||||||||||||||||||||||||
|
|
|
|
|
|
|
|
|
|
|
|
|
|
|
|
|
|
|
|||||||||||||||||||||||
| Total/Weighted Average |
$ | 437,544 | $ | 409,362 | $ | 6,817 | $ | (176 | ) | $ | 416,003 | 54 | 3.85 | % | 3.49 | % | 23 | |||||||||||||||||||||||
At December 31, 2013
| Asset Type |
Original | Gross Unrealized | Number | Weighted Average | ||||||||||||||||||||||||||||||||||||
| Face Value |
Book Value |
Gains | Losses | Carrying Value(A) |
of Securities |
Rating | Coupon | Yield | Maturity (Years)(C) |
|||||||||||||||||||||||||||||||
| RMBS |
||||||||||||||||||||||||||||||||||||||||
| Fannie Mae |
$ | 173,015 | $ | 179,556 | $ | — | $ | (2,800 | ) | $ | 176,756 | 18 | (B) | 3.86 | % | 3.61 | % | 25 | ||||||||||||||||||||||
| Freddie Mac |
109,431 | 112,456 | — | (2,233 | ) | 110,223 | 11 | (B) | 3.62 | % | 3.22 | % | 24 | |||||||||||||||||||||||||||
|
|
|
|
|
|
|
|
|
|
|
|
|
|
|
|
|
|
|
|||||||||||||||||||||||
| Total/Weighted Average |
$ | 282,446 | $ | 292,012 | $ | — | $ | (5,033 | ) | $ | 286,979 | 29 | 3.77 | % | 3.46 | % | 24 | |||||||||||||||||||||||
| (A) | See Note 9 regarding the estimation of fair value, which is equal to carrying value for all securities. |
| (B) | CHMI used an implied AAA rating for the FNMA/FHLMC securities. |
| (C) | The weighted average maturity is based on the timing of expected principal reduction on the assets. No individual security matures within 10 years. |
At December 31, 2014 and 2013, the Company pledged investments with a carrying value of approximately $380.7 million and $261.3 million, respectively as collateral for repurchase agreements. At December 31, 2014, the Company did not have any securities purchased from and financed with the same counterparty that did not meet the conditions of ASC 860, Transfers and Servicing, to be considered linked transactions and, therefore, classified as derivatives.
Unrealized losses that are considered other-than-temporary are recognized currently in earnings. During the year ended December 31, 2014 and 2013, CHMI recorded no other-than-temporary impairment charges (“OTTI”). Based on management’s analysis of these securities, the performance of the underlying loans and changes in market factors, management determined that unrealized losses as of the balance sheet date on CHMI’s securities were primarily the result of changes in market factors, rather than issuer-specific credit impairment. CHMI performed analyses in relation to such securities, using management’s best estimate of their cash flows, which support its belief that the carrying values of such securities were fully recoverable over their expected holding period. Such market factors include changes in market interest rates and credit spreads, or certain macroeconomic events, which did not directly impact the Company’s ability to collect amounts contractually due. Management continually evaluates the credit status of each of CHMI’s securities and the collateral supporting those securities. This evaluation includes a review of the credit of the issuer of the security (if applicable), the credit rating of the security, the key terms of the security (including credit support), debt service coverage and loan to value ratios, the performance of the pool of underlying loans and the estimated value of the collateral supporting such loans, including the effect of local, industry and broader economic trends and factors. In connection with the above, the Company weighs the fact that all of its investments in RMBS are guaranteed by government agencies.
These factors include underlying loan default expectations and loss severities, which are analyzed in connection with a particular security’s credit support, as well as prepayment rates. The result of this evaluation is considered when determining management’s estimate of cash flows and in relation to the amount of the unrealized loss and the period elapsed since it was incurred. Significant judgment is required in this analysis. The following tables summarize CHMI’s securities in an unrealized loss position as of December 31, 2014 (dollars in thousands):
71
Table of Contents
Securities in an Unrealized Loss Position
At December 31, 2014
| Asset Type |
Original Face Value |
Book Value |
Gross Unrealized Losses |
Carrying Value(A) |
Number of Securities |
Weighted Average | ||||||||||||||||||||||||||||||
| Rating | Coupon | Yield | Maturity (Years)(C) * |
|||||||||||||||||||||||||||||||||
| Less than Twelve Months |
$ | 35,404 | $ | 16,946 | $ | (176 | ) | $ | 16,770 | 5 | (B) | 3.78 | % | 7.21 | % | 23 | ||||||||||||||||||||
| Twelve or More Months |
— | — | — | — | — | — | % | — | % | — | ||||||||||||||||||||||||||
|
|
|
|
|
|
|
|
|
|
|
|
|
|
|
|
|
|||||||||||||||||||||
| Total/Weighted Average |
$ | 35,404 | $ | 16,946 | $ | (176 | ) | $ | 16,770 | 5 | 3.78 | % | 7.21 | % | 23 | |||||||||||||||||||||
At December 31, 2013
| Asset Type |
Original Face Value |
Book Value |
Gross Unrealized Losses |
Carrying Value(A) |
Number of Securities |
Weighted Average | ||||||||||||||||||||||||||||||
| Rating | Coupon | Yield | Maturity (Years)(C)* |
|||||||||||||||||||||||||||||||||
| Less than Twelve Months |
$ | 282,446 | $ | 292,012 | $ | (5,033 | ) | $ | 286,979 | 29 | (B) | 3.77 | % | 3.46 | % | 24 | ||||||||||||||||||||
| Twelve or More Months |
— | — | — | — | — | — | % | — | % | — | ||||||||||||||||||||||||||
|
|
|
|
|
|
|
|
|
|
|
|
|
|
|
|
|
|||||||||||||||||||||
| Total/Weighted Average |
$ | 282,446 | $ | 292,012 | $ | (5,033 | ) | $ | 286,979 | 29 | 3.77 | % | 3.46 | % | 24 | |||||||||||||||||||||
| (A) | See Note 9 regarding the estimation of fair value, which is equal to carrying value for all securities. |
| (B) | CHMI used an implied AAA rating for the FNMA/FHLMC securities. |
| (C) | The weighted average maturity is based on the timing of expected principal reduction on the assets. |
| * | The Company does not intend to sell the investments and it is not more likely than not that the Company will be required to sell the investments before recovery of their amortized cost bases which may be maturity. |
Note 5 — Investments in Excess MSRs
In October 2013, CHMI entered into an agreement (“MSR Agreement 1”) with Freedom Mortgage Corporation (“Freedom Mortgage”), a leading residential mortgage servicer wholly-owned by the sole shareholder of the Manager, to invest in Excess MSRs with Freedom Mortgage. Freedom Mortgage originated the mortgage servicing rights on a pool of government sponsored enterprise residential fixed rate Ginnie Mae-eligible FHA and VA mortgage loans with an outstanding principal balance of approximately $10.0 billion (“MSR Pool 1”). Freedom Mortgage is entitled to receive an initial weighted average total mortgage servicing amount of approximately 28 basis points (“bps”) on the performing unpaid principal balance, as well as any ancillary income from MSR Pool 1. Pursuant to MSR Agreement 1, Freedom Mortgage performs all servicing functions and advancing functions related to MSR Pool 1 for a basic fee (the contractual amount the service is entitled to for performing the servicing duties) of 8 bps. Therefore, the remainder, or “excess mortgage servicing amount” is initially equal to a weighted average of 20 bps.
CHMI acquired the right to receive 85% of the excess mortgage servicing amount on MSR Pool 1 and, subject to certain limitations and pursuant to a loan replacement agreement (the “MSR Pool 1—Recapture Agreement”), 85% of the Excess MSRs on certain future mortgage loans originated by Freedom Mortgage that represent refinancings of loans in MSR Pool l (which loans then become part of MSR Pool 1) for approximately $60.6 million. Freedom Mortgage has co-invested, pari passu with CHMI, in 15% of the Excess MSRs. Freedom Mortgage, as servicer, also retains the ancillary income and the servicing obligations and liabilities. If Freedom Mortgage is terminated as the servicer, CHMI’s right to receive its portion of the excess mortgage servicing amount is also terminated. To the extent that Freedom Mortgage is terminated as the servicer and receives a termination payment, CHMI is entitled to a pro rata share, or 85%, of such termination payment.
The value, and absolute amount, of recapture activity tends to vary inversely with the direction of interest rates. When interest rates are falling, recapture rates tend to be higher due to increased opportunities for borrowers to refinance. As interest rates increase, however, there is likely to be less recapture activity.
In October 2013, CHMI entered into an agreement (“MSR Agreement 2”) with Freedom Mortgage to invest with Freedom Mortgage. Freedom Mortgage acquired the mortgage servicing rights from a third-party seller on a pool of government sponsored enterprise residential Ginnie Mae-eligible VA hybrid adjustable rate mortgages with an outstanding principal balance of approximately $10.7 billion (“MSR Pool 2”). Freedom Mortgage is entitled to receive an initial weighted average total mortgage servicing amount of 44 bps on the performing unpaid principal balance, as well as any ancillary income from MSR Pool 2. Pursuant to MSR Agreement 2, Freedom Mortgage performs all servicing functions and advancing functions related to MSR Pool 2 for a basic fee (the contractual amount the service is entitled to for performing the servicing duties) of 10 bps. Therefore, the remainder, or “excess mortgage servicing amount” is initially equal to a weighted average of 34 bps.
72
Table of Contents
CHMI acquired the right to receive 50% of the excess mortgage servicing amount on MSR Pool 2 and, subject to certain limitations and pursuant to a loan replacement agreement (the “MSR Pool 2—Recapture Agreement”), 50% of the Excess MSRs on certain future mortgage loans originated by Freedom Mortgage that represent refinancings of loans in MSR Pool 2 (which loans then become part of MSR Pool 2) for approximately $38.4 million. Freedom Mortgage has co-invested, pari passu with CHMI, in 50% of the Excess MSRs. Freedom Mortgage, as servicer, also retains the ancillary income and the servicing obligations and liabilities. If Freedom Mortgage is terminated as the servicer, CHMI’s right to receive its portion of the excess mortgage servicing amount is also terminated. To the extent that Freedom Mortgage is terminated as the servicer and receives a termination payment, CHMI is entitled to a pro rata share, or 50%, of such termination payment.
Upon completion of our initial public offering and the concurrent private placement, we also entered into a flow and bulk Excess MSR purchase agreement related to future purchases of Excess MSRs from Freedom Mortgage. On February 28, 2014, pursuant to the flow and bulk Excess MSR purchase agreement, the Company purchased from Freedom Mortgage Excess MSRs on mortgage loans originated by Freedom Mortgage during the first quarter of 2014 with an UPB of approximately $76.8 million. The Company acquired an approximate 85% interest in the Excess MSRs for approximately $567,000. The terms of the purchase include recapture provisions that are the same as those in the Excess MSR acquisition agreements the Company entered into with Freedom Mortgage in October 2013.
On March 31, 2014, pursuant to the flow and bulk Excess MSR purchase agreement, the Company purchased from Freedom Mortgage Excess MSRs on mortgage loans originated by a third party originator with an aggregate UPB of approximately $159.8 million. Freedom Mortgage purchased the MSRs on these mortgage loans from a third party on January 31, 2014. The Company acquired an approximate 71% interest in the Excess MSRs for approximately $946,000. The terms of the purchase include recapture provisions that are the same as those in the Excess MSR acquisition agreements the Company entered into with Freedom Mortgage in October 2013.
On June 30, 2014, pursuant to the flow and bulk Excess MSR purchase agreement, the Company purchased from Freedom Mortgage Excess MSRs on mortgage loans originated by Freedom Mortgage during the second quarter of 2014 with an aggregate UPB of approximately $98.1 million. The Company acquired an approximate 85% interest in the Excess MSRs for approximately $661,000. The terms of the purchase include recapture provisions that are the same as those in the Excess MSR acquisition agreements the Company entered into with Freedom Mortgage in October 2013.
The mortgage loans underlying the Excess MSRs purchased in 2014 are collectively referred to as “Pool 2014,” and the recapture provisions, which are identical, are collectively referred to as the “Pool 2014—Recapture Agreement.”
The following is a summary of the Company’s Excess MSRs (dollars in thousands):
| December 31, 2014 | ||||||||||||||||||||||||
| Unpaid Principal Balance |
Amortized Cost Basis(A) |
Carrying Value(B) |
Weighted Average Coupon |
Weighted Average Maturity (Years)(C) |
Changes in Fair Value Recorded in Other Income (Loss)(D) |
|||||||||||||||||||
| Pool 1 |
$ | 8,715,747 | $ | 47,741 | $ | 54,187 | 3.51 | % | 27.0 | $ | (2,889 | ) | ||||||||||||
| Pool 1 - Recapture Agreement |
— | 2,900 | 611 | (371 | ) | |||||||||||||||||||
| Pool 2 |
8,475,975 | 24,025 | 33,676 | 2.77 | % | 27.8 | 2,011 | |||||||||||||||||
| Pool 2 - Recapture Agreement |
— | 2,554 | 1,262 | (1,882 | ) | |||||||||||||||||||
| Pool 2014 |
308,562 | 2,019 | 1,586 | 3.71 | % | 28.4 | (433 | ) | ||||||||||||||||
| Pool 2014 - Recapture Agreement |
— | — | — | — | ||||||||||||||||||||
|
|
|
|
|
|
|
|
|
|
|
|
|
|||||||||||||
| Total |
$ | 17,500,284 | $ | 79,239 | $ | 91,322 | 3.16 | % | 27.4 | $ | (3,564 | ) | ||||||||||||
73
Table of Contents
| December 31, 2013 | ||||||||||||||||||||||||
| Unpaid Principal Balance |
Amortized Cost Basis(A) |
Carrying Value(B) |
Weighted Average Coupon |
Weighted Average Maturity (Years)(C) |
Changes in Fair Value Recorded in Other Income (Loss)(D) |
|||||||||||||||||||
| Pool 1 |
$ | 9,823,250 | $ | 55,793 | $ | 65,128 | 3.51 | % | 27.9 | $ | 9,335 | |||||||||||||
| Pool 1 - Recapture Agreement |
2,900 | 982 | (1,918 | ) | ||||||||||||||||||||
| Pool 2 |
10,226,679 | 33,410 | 41,050 | 2.64 | % | 28.3 | 7,640 | |||||||||||||||||
| Pool 2 - Recapture Agreement |
2,554 | 3,146 | 590 | |||||||||||||||||||||
|
|
|
|
|
|
|
|
|
|
|
|
|
|||||||||||||
| Total |
$ | 20,049,929 | $ | 94,657 | $ | 110,306 | 3.07 | % | 28.1 | $ | 15,647 | |||||||||||||
| (A) | The amortized cost basis of the recapture agreements is determined based on the relative fair values of the recapture agreements and related Excess MSRs at the time they were acquired. |
| (B) | Carrying value represents the fair value of the pools or recapture agreements, as applicable (see Note 9). |
| (C) | The weighted average maturity represents the weighted average expected timing of the receipt of cash flows of each investment. |
| (D) | The portion of the change in fair value of the recapture agreement relating to loans recaptured as of December 31, 2013 is reflected in the respective pool. |
The tables below summarize the geographic distribution for the states representing 5% or greater of the underlying residential mortgage loans of the Excess MSRs:
| State |
Percentage of Total Outstanding Unpaid Principal Balance December 31, 2014 |
|||
| California |
13.3 | % | ||
| Texas |
10.1 | % | ||
| Florida |
6.9 | % | ||
| Virginia |
6.5 | % | ||
| North Carolina |
5.7 | % | ||
| Georgia |
5.3 | % | ||
| Washington |
5.1 | % | ||
| All other |
47.1 | % | ||
|
|
|
|||
| Total |
100.0 | % | ||
| State |
Percentage of Total Outstanding Unpaid Principal Balance December 31, 2013 |
|||
| California |
14.4 | % | ||
| Texas |
10.0 | % | ||
| Florida |
6.9 | % | ||
| Virginia |
6.6 | % | ||
| North Carolina |
5.6 | % | ||
| Georgia |
5.3 | % | ||
| Washington |
5.2 | % | ||
| Colorado |
5.0 | % | ||
| All other |
41.0 | % | ||
|
|
|
|||
| Total |
100.0 | % | ||
Geographic concentrations of investments expose CHMI to the risk of economic downturns within the relevant states. Any such downturn in a state where CHMI holds significant investments could affect the underlying borrower’s ability to make the mortgage payment and, therefore, could have a meaningful, negative impact on CHMI’s Excess MSRs.
Note 6 — Equity and Earnings per Share
Equity Incentive Plan
During 2013, the board of directors approved and the Company adopted the Cherry Hill Mortgage Investment Corporation 2013 Equity Incentive Plan (“2013 Plan”). The 2013 Plan provides for the grant of options to purchase shares of the
74
Table of Contents
Company’s common stock, stock awards, stock appreciation rights, performance units, incentive awards and other equity-based awards, including long term incentive plan units (“LTIP-OP Units”) of the Company’s operating partnership, Cherry Hill Operating Partnership, LP (the “Operating Partnership”).
The following tables present certain information about the Company’s 2013 Plan as of December 31, 2014 and 2013:
Equity Incentive Plan Information
As of December 31, 2014
| Number of Securities Issued or to be Issued Upon Exercise of Outstanding Options, Warrants and Rights |
Number of Securities Remaining Available For Future Issuance Under Equity Compensation Plans |
|||||||
| Equity compensation Plans Approved By Securityholders |
1,421,607 | |||||||
| LTIP-OP Units |
68,850 | |||||||
| Shares of Common Stock |
9,543 | |||||||
| Equity Compensation Plans Not Approved By Securityholders |
||||||||
As of December 31, 2013
| Number of Securities Issued or to be Issued Upon Exercise of Outstanding Options, Warrants and Rights |
Number of Securities Remaining Available For Future Issuance Under Equity Compensation Plans |
|||||||
| Equity compensation Plans Approved By Securityholders |
1,462,500 | |||||||
| LTIP-OP Units |
37,500 | |||||||
| Equity Compensation Plans Not Approved By Securityholders |
— | |||||||
LTIP-OP Units (sometimes referred to as profits interest units) are a special class of partnership interest in the Operating Partnership. LTIP-OP Units may be issued to eligible participants for the performance of services to or for the benefit of the Operating Partnership. Initially, LTIP-OP Units do not have full parity with the Operating Partnership’s common units of limited partnership interest (“OP Units”) with respect to liquidating distributions; however, LTIP-OP Units receive, whether vested or not, the same per-unit distributions as OP Units and are allocated their pro-rata share of the Company’s net income or loss. Under the terms of the LTIP-OP Units, the Operating Partnership will revalue its assets upon the occurrence of certain specified events, and any increase in the Operating Partnership’s valuation from the time of grant of the LTIP-OP
75
Table of Contents
Units until such event will be allocated first to the holders of LTIP-OP Units to equalize the capital accounts of such holders with the capital accounts of the holders of OP Units. Upon equalization of the capital accounts of the holders of LTIP-OP Units with the other holders of OP Units, the LTIP-OP Units will achieve full parity with OP Units for all purposes, including with respect to liquidating distributions. If such parity is reached, vested LTIP-OP Units may be converted into an equal number of OP Units at any time and, thereafter, enjoy all the rights of OP Units, including redemption/exchange rights. Each LTIP-OP Unit awarded is deemed equivalent to an award of one share under the 2013 Plan and reduces the 2013 Plan’s share authorization for other awards on a one-for-one basis. As of December 31, 2014, 1,421,607 shares remain for future issuance under the 2013 Plan.
During 2013 the board of directors approved a grant of 37,500 LTIP-OP Units upon the completion of the Company’s IPO on October 9, 2013 (the “grant date”). Of the total 37,500 LTIP-OP Units granted, 7,500 were granted to the Company’s independent directors, which vested immediately, and 30,000 LTIP-OP Units were granted to the Company’s executive officers and certain employees of Freedom Mortgage, which vest ratably over the first three year anniversaries of the grant date. The fair value of each LTIP-OP Unit was determined based on the offering price of the Company’s common stock on the grant date (IPO date) of $20.00. The aggregate grant date fair value of the total 37,500 LTIP-OP Units was $750,000.
On June 10, 2014, the Company granted 31,350 LTIP-OP Units to ten individuals who regularly perform services for the Company through the Manager. The LTIP-OP Units vest ratably over the first three anniversaries of the grant date. The fair value of each LTIP-OP Unit was determined based on the closing price of the Company’s common stock on the grant date of $19.33. The aggregate grant date fair value of the total 31,350 LTIP-OP Units was approximately $606,000.
As of December 31, 2014, 17,500 LTIP-OP Units have vested. The Company recognized approximately $320,000 and $200,000 in share-based compensation expense in the years ended December 31, 2014 and 2013, respectively. There was approximately $838,000 of total unrecognized share-based compensation expense as of December 31, 2014, related to the 51,350 non-vested LTIP-OP Units. This unrecognized share-based compensation expense is expected to be recognized ratably over the remaining vesting period of up to three years. The aggregate expense related to the LTIP-OP Unit grants is presented as “General and administrative expense” in the Company’s consolidated income statement.
On January 27, 2014, the Company granted each of the independent directors pursuant to the 2013 Equity Incentive Plan 530 shares of common stock (for a total of 1,590 shares), which were fully vested on the date of grant, and 2,651 restricted shares of common stock (for a total of 7,953 shares) which were subject to forfeiture in certain circumstances within one year from the grant date. They are no longer subject to forfeiture and are vested.
Non-Controlling Interests in Operating Partnership
Non-controlling interests in the Operating Partnership in the accompanying consolidated financial statements relate to LTIP-OP Units in the Operating Partnership held by parties other than the Company.
Certain individuals own LTIP-OP Units in the Operating Partnership. An LTIP-OP Unit and a share of common stock of the Company have substantially the same economic characteristics in as much as they effectively share equally in the net income or loss of the Operating Partnership. Holders of LTIP Units that have reached parity with OP Units have the right to redeem their LTIP-OP Units, subject to certain restrictions. The redemption is required to be satisfied in shares of common stock, cash, or a combination thereof, at the Company’s option, calculated as follows: one share of the Company’s common stock, or cash equal to the fair value of a share of the Company’s common stock at the time of redemption, for each LTIP-OP Unit. When an LTIP-OP Units holder redeems an OP Unit (as described above), non-controlling interest in the Operating Partnership is reduced and the Company’s equity is increased.
As of December 31, 2014, the non-controlling interest holders in the Operating Partnership owned 68,850 LTIP-OP Units, or 0.9% of the Operating Partnership. Pursuant to ASC 810, Consolidation, changes in a parent’s ownership interest (and transactions with non-controlling interest unit holders in the Operating Partnership) while the parent retains its controlling interest in its subsidiary should be accounted for as equity transactions. The carrying amount of the non-controlling interest will be adjusted to reflect the change in its ownership interest in the subsidiary, with the offset to equity attributable to the Company.
76
Table of Contents
Earnings per Share
The Company is required to present both basic and diluted earnings per share (“EPS”). Basic EPS is calculated by dividing net income (loss) applicable to common stockholders by the weighted average number of shares of common stock outstanding during each period. Diluted EPS is calculated by dividing net income (loss) applicable to common stockholders by the weighted average number of shares of common stock outstanding plus the additional dilutive effect of common stock equivalents during each period. In accordance with ASC 260, Earnings Per Share, if there is a loss from continuing operations, the common stock equivalents are deemed anti-dilutive and earnings (loss) per share is calculated excluding the potential common shares. During 2014, the Company had no dilutive common stock equivalents.
77
Table of Contents
The following table presents basic net earnings per share of common stock for the years ended December 31, 2014 and 2013, and for the two month period from October 31, 2012 (date of inception) to December 31, 2012 (dollars in thousands, except per share data):
| Year Ended December 31, |
Two Month Period Ended December 31, |
|||||||||||
| 2014 | 2013 | 2012 | ||||||||||
| Numerator: |
||||||||||||
| Net income attributable to common stockholders and participating securities for basic earnings per share |
$ | 2,375 | $ | 21,202 | $ | (25 | ) | |||||
| Net income allocable to common stockholders |
$ | 2,353 | $ | 21,095 | $ | (25 | ) | |||||
| Denominator: |
||||||||||||
| Weighted average common shares outstanding |
7,505,546 | 1,688,275 | 1,000 | |||||||||
| Weighted average diluted shares outstanding |
7,508,827 | 1,688,275 | 1,000 | |||||||||
| Basic and Dilutive: |
||||||||||||
|
|
|
|
|
|
|
|||||||
| Basic earnings per share |
$ | 0.31 | $ | 12.50 | $ | (25.00 | ) | |||||
| Diluted earnings per share |
$ | 0.31 | $ | 12.50 | $ | (25.00 | ) | |||||
There were no participating securities or equity instruments outstanding that were anti-dilutive for purposes of calculating earnings per share for the periods presented.
Common Stock Offerings
In October 2013, the Company issued 7,500,000 shares of its common stock in its initial public offering and a concurrent private placement at a price of $20.00 per share for net proceeds of approximately $148.1 million.
Offering costs of approximately $154,000 incurred in connection with the preparation and filing of the Company’s shelf registration statement on Form S-3 and the resale shelf registration statement on Form S-3 covering the shares of the Company’s common stock acquired on the concurrent private placement in 2013, each of which was declared effective on December 3, 2014 were expensed in December 2014. Offering costs included, among others, the fees and disbursements of the Company’s external counsel, and the costs of printing.
Purchases of Equity Securities by the Issuer and Affiliated Purchasers
For the years ended December 31, 2014 and 2013, we repurchased shares of our common stock as follows:
| Period | Total Number of Shares Purchased |
Average Price Paid Per Share |
Total Number of Shares Purchased as Part of Publicity Announced Plans of Programs |
Maximum Approximate Dollar Value of Shares that May Yet Be Purchased Under the Plan or Program |
||||||||||||
| 2013 |
1,000 | (A) | $ | 1.00 | — | — | ||||||||||
| 2014 |
— | — | — | — | ||||||||||||
|
|
|
|
|
|
|
|
|
|||||||||
| Total |
1,000 | $ | 1.00 | — | — | |||||||||||
| (A) | In connection with our initial capitalization, our non-executive Chairman of the Board, Stanley Middleman, purchased 1,000 shares of our common stock for total cash consideration of $1,000. On October 9, 2013, we repurchased these shares from Mr. Middleman for $1,000. |
78
Table of Contents
Note 7 — Transactions with Affiliates and Affiliated Entities
Manager
CHMI has entered into a management agreement with the Manager, pursuant to which the Manager provides for the day-to-day management of the Company’s operations (the “Management Agreement”). The Management Agreement requires the Manager to manage CHMI’s business affairs in conformity with the policies and the investment guidelines that are approved and monitored by the Company’s board of directors. The Management Agreement will remain in full force until October 9, 2016 and provides for automatically renewing one-year terms thereafter subject to certain termination rights. The Manager’s performance is reviewed annually and may be terminated by the Company for cause without payment of a termination fee, or may be terminated without cause with payment of a termination fee, as defined in the Management Agreement, equal to three times the average annual management fee amount earned by the Manager during the two four-quarter periods ending as of the end of the most recently completed fiscal quarter prior to the effective date of the termination, upon either the affirmative vote of at least two-thirds of the members of the board of directors or the affirmative vote of the holders of at least a majority of the outstanding common stock. Pursuant to the Management Agreement, the Manager, under the supervision of CHMI’s board of directors, formulates investment strategies, arranges for the acquisition of assets, arranges for financing, monitors the performance of CHMI’s assets and provides certain advisory, administrative and managerial services in connection with the operations of CHMI. For performing these services, CHMI pays the Manager a quarterly management fee equal to the product of one quarter of the 1.5% Management Fee Annual Rate and the Stockholders’ Equity, adjusted as set forth in the Management Agreement, calculated and payable quarterly in arrears.
The Manager is a party to a services agreement (the “Services Agreement”) with Freedom Mortgage, pursuant to which Freedom Mortgage provides to the Manager the personnel, services and resources as needed by the Manager to enable the Manager to carry out its obligations and responsibilities under the Management Agreement. CHMI is a named third-party beneficiary to the Services Agreement and, as a result, has, as a non-exclusive remedy, a direct right of action against Freedom Mortgage in the event of any breach by the Manager of any of its duties, obligations or agreements under the Management Agreement that arise out of or result from any breach by Freedom Mortgage of its obligations under the Services Agreement. The Services Agreement will terminate upon the termination of the Management Agreement. Pursuant to the Services Agreement, the Manager will make certain payments to Freedom Mortgage in connection with the services provided. All of CHMI’s executive officers and the officers of the Manager are also officers or employees of Freedom Mortgage. As a result, the Management Agreement between CHMI and the Manager was negotiated between related parties, and the terms, including fees payable, may not be as favorable to CHMI as if it had been negotiated with an unaffiliated third party. Both the Manager and Freedom Mortgage are controlled by Mr. Stanley Middleman.
From October 31, 2012 (date of inception) to December 31, 2012, and for the nine months ended September 30, 2013, CHMI shared office space with Freedom Mortgage. In accordance with the Management Agreement between CHMI and the Manager, for the period indicated above, the Manager did not allocate rent, overhead, reimbursable executives’ salaries, or other miscellaneous office expenses to CHMI, as it had not commenced operations as of September 30, 2013 and had not generated revenue during the period. The Manager commenced allocating expenses to the Company in October 2013, the first month during which the Company commenced operations.
The Management Agreement provides that CHMI will reimburse the Manager for various expenses incurred by the Manager or its officers, and agents on CHMI’s behalf, including costs of legal, accounting, tax, administrative and other similar services rendered for CHMI by providers retained by the Manager “Due to affiliates” consisted of the following for the periods indicated (dollars in thousands):
|
Year Ended |
Two Month Period October 31, 2012 (date of inception) to December 31, 2012 |
|||||||||||
| 2014 | 2013 | |||||||||||
| Management fees |
$ | 2,150 | $ | 549 | $ | — | ||||||
| Expense reimbursement |
410 | 67 | — | |||||||||
|
|
|
|
|
|
|
|||||||
| Total |
$ | 2,560 | $ | 616 | $ | — | ||||||
79
Table of Contents
Other Affiliated Entities
See Note 5 for a discussion of the co-investments in Excess MSRs with Freedom Mortgage.
Note 8 — Derivative Instruments
Interest Rate Swap Agreements, Swaptions and TBAs
In order to help mitigate exposure to higher short-term interest rates in connection with its repurchase agreements, the Company enters into interest rate swap agreements. These agreements establish an economic fixed rate on related borrowings because the variable-rate payments received on the interest rate swap agreements largely offset interest accruing on the related borrowings, leaving the fixed-rate payments to be paid on the interest rate swap agreements as the Company’s effective borrowing rate, subject to certain adjustments including changes in spreads between variable rates on the interest rate swap agreements and actual borrowing rates. A swaption is an option granting its owner the right but not the obligation to enter into an underlying swap. The Company’s interest rate swap agreements and swaptions have not been designated as hedging instruments.
In order to help mitigate duration risk and basis risk management, the Company utilizes forward-settling purchases and sales of RMBS where the underlying pools of mortgage loans are “to-be-announced” (TBAs). Pursuant to these TBA transactions, the Company agrees to purchase or sell, for future delivery, RMBS with certain principal and interest terms and certain types of underlying collateral, but the particular RMBS to be delivered is not identified until shortly before the TBA settlement date.
The following table summarizes the outstanding notional amounts of derivative instruments as of December 31, 2014 and 2013 (dollars in thousands):
| Non-hedge derivatives | December 31, 2014 | December 31, 2013 | ||||||
| Notional amount of interest rate swaps |
$ | 224,100 | $ | 171,700 | ||||
| Notional amount of swaptions |
105,000 | 125,000 | ||||||
| Notional amount of TBAs, net |
— | 4,800 | ||||||
| Notional amount of Treasury Futures |
8,000 | — | ||||||
|
|
|
|
|
|||||
| Total notional amount |
$ | 337,100 | $ | 301,500 | ||||
The following table presents information about the Company’s interest rate swap agreements as of December 31, 2014 and 2013 (dollars in thousands):
| Weighted Average Maturity |
Notional Amount |
Weighted Average Pay Rate |
Weighted Average Receive Rate |
Weighted Average Years to Maturity |
||||||||||||||||
| December 31, 2014 |
2020 | $ | 224,100 | 1.84 | % | 0.23 | % | 5.4 | ||||||||||||
| December 31, 2013 |
2020 | $ | 171,700 | 1.95 | % | 0.24 | % | 6.7 | ||||||||||||
Offsetting Assets and Liabilities
The Company has netting arrangements in place with all derivative counterparties pursuant to standard documentation developed by the International Swap and Derivatives Association, or ISDA. Under GAAP, if the Company has a valid right of offset, it may offset the related asset and liability and report the net amount. The Company presents interest rate swaps, swaptions and treasury futures assets and liabilities on a gross basis in its consolidated balance sheets. The Company presents TBA assets and liabilities on a net basis in its consolidated balance sheets. The Company presents repurchase agreements subject to master netting arrangements on a gross basis. Additionally, the Company does not offset financial assets and liabilities with the associated cash collateral on the consolidated balance sheets.
80
Table of Contents
The following tables present information about the Company’s assets and liabilities that are subject to master netting arrangements or similar agreements and can potentially be offset on the Company’s consolidated balance sheets as of December 31, 2014 and 2013 (dollars in thousands):
| December 31, 2014 |
||||||||||||||||||||||||
| Gross Amounts of Recognized Assets or Liabilities |
Gross Amounts Offset in the Consolidated Balance Sheet |
Net Amounts of Assets Presented in the Consolidated Balance Sheet |
Gross Amounts Not Offset in the Consolidated Balance Sheet |
Net Amount | ||||||||||||||||||||
| Financial Instruments |
Cash Collateral Received (Pledged) |
|||||||||||||||||||||||
| Assets |
||||||||||||||||||||||||
| Interest rate swaps |
$ | 46 | $ | — | $ | 46 | $ | (46 | ) | $ | — | $ | — | |||||||||||
| Swaptions |
291 | — | 291 | (291 | ) | — | — | |||||||||||||||||
| TBAs |
— | — | — | — | — | — | ||||||||||||||||||
| Treasury futures |
5 | — | 5 | (5 | ) | (89 | ) | |||||||||||||||||
|
|
|
|
|
|
|
|
|
|
|
|
|
|||||||||||||
| Total Assets |
$ | 342 | $ | — | $ | 342 | $ | (342 | ) | $ | (89 | ) | $ | — | ||||||||||
| Liabilities |
||||||||||||||||||||||||
| Repurchase agreements |
$ | 362,126 | $ | — | $ | 362,126 | $ | (359,270 | ) | $ | (2,856 | ) | $ | — | ||||||||||
| Interest rate swaps |
4,045 | — | 4,045 | (43 | ) | (4,002 | ) | — | ||||||||||||||||
| Swaptions |
— | — | — | — | — | — | ||||||||||||||||||
| TBAs |
43 | — | 43 | (43 | ) | — | — | |||||||||||||||||
| Treasury futures |
— | |||||||||||||||||||||||
|
|
|
|
|
|
|
|
|
|
|
|
|
|||||||||||||
| Total Liabilities |
$ | 366,214 | $ | — | $ | 366,214 | $ | (359,356 | ) | $ | (6,858 | ) | $ | — | ||||||||||
| December 31, 2013 |
||||||||||||||||||||||||
| Gross Amounts of Recognized Assets |
Gross Amounts Offset in the Consolidated Balance Sheet |
Net Amounts of Assets Presented in the Consolidated Balance Sheet |
Gross Amounts Not Offset in the Consolidated Balance Sheet |
|||||||||||||||||||||
| Financial Instruments |
Cash Collateral Received (Pledged) |
Net Amount | ||||||||||||||||||||||
| Assets |
||||||||||||||||||||||||
| Interest rate swaps |
$ | 2,531 | $ | — | $ | 2,531 | $ | (2,531 | ) | $ | — | $ | — | |||||||||||
| Swaptions |
2,082 | — | 2,082 | (2,082 | ) | — | — | |||||||||||||||||
| TBAs |
— | — | — | — | — | — | ||||||||||||||||||
|
|
|
|
|
|
|
|
|
|
|
|
|
|||||||||||||
| Total Assets |
$ | 4,613 | $ | — | $ | 4,613 | $ | (4,613 | ) | $ | — | $ | — | |||||||||||
| Liabilities |
||||||||||||||||||||||||
| Repurchase agreements |
$ | 261,302 | $ | — | $ | 261,302 | $ | (257,558 | ) | $ | (3,744 | ) | $ | — | ||||||||||
| Interest rate swaps |
592 | — | 592 | (592 | ) | — | — | |||||||||||||||||
| Swaptions |
— | — | — | — | — | — | ||||||||||||||||||
| TBAs |
— | — | — | — | — | — | ||||||||||||||||||
|
|
|
|
|
|
|
|
|
|
|
|
|
|||||||||||||
| Total Liabilities |
$ | 261,894 | $ | — | $ | 261,894 | $ | (258,150 | ) | $ | (3,744 | ) | $ | — | ||||||||||
The following table presents information about derivatives realized gain (loss), which is included on the consolidated statement of income as of December 31, 2014 and 2013 (dollars in thousands):
| Year Ended December 31, |
Two Month Period October 31, 2012 (date of inception) to December 31, 2012 |
|||||||||||||
| Non-Hedge Derivatives |
Income Statement Location |
2014 | 2013 | |||||||||||
| Interest rate swaps |
Realized gain/(loss) on derivative assets | $ | (686 | ) | $ | 53 | $ | — | ||||||
| Swaptions |
Realized gain/(loss) on derivative assets | (1,910 | ) | — | — | |||||||||
| TBAs |
Realized gain/(loss) on derivative assets | 60 | 17 | — | ||||||||||
| Treasury futures |
Realized gain/(loss) on derivative assets | (107 | ) | (11 | ) | — | ||||||||
|
|
|
|
|
|
|
|||||||||
| Total |
$ | (2,643 | ) | $ | 59 | $ | — | |||||||
81
Table of Contents
Note 9 – Fair Value
Fair Value Measurements
ASC 820, Fair Value Measurements and Disclosure, (“ASC 820”) defines fair value as the price that would be received to sell an asset or paid to transfer a liability in an orderly transaction between market participants at the measurement date. ASC 820 clarifies that fair value should be based on the assumptions market participants would use when pricing an asset or liability and establishes a fair value hierarchy that prioritizes the information used to develop those assumptions. The fair value hierarchy gives the highest priority to quoted prices available in active markets (i.e., observable inputs) and the lowest priority to data lacking transparency (i.e., unobservable inputs). Additionally, ASC 820 requires an entity to consider all aspects of nonperformance risk, including the entity’s own credit standing, when measuring fair value of a liability.
ASC 820 establishes a three level hierarchy to be used when measuring and disclosing fair value. An instrument’s categorization within the fair value hierarchy is based on the lowest level of significant input to its valuation. Following is a description of the three levels
| Level 1 | Inputs are quoted prices in active markets for identical assets or liabilities as of the measurement date under current market conditions. Additionally, the entity must have the ability to access the active market and the quoted prices cannot be adjusted by the entity. | |
| Level 2 | Inputs include quoted prices in active markets for similar assets or liabilities; quoted prices in inactive markets for identical or similar assets or liabilities; or inputs that are observable or can be corroborated by observable market data by correlation or other means for substantially the full-term of the assets or liabilities. | |
| Level 3 | Unobservable inputs are supported by little or no market activity. The unobservable inputs represent the assumptions that market participants would use to price the assets and liabilities, including risk. Generally, Level 3 assets and liabilities are valued using pricing models, discounted cash flow methodologies, or similar techniques that require significant judgment or estimation. | |
Following are descriptions of the valuation methodologies used to measure material assets and liabilities at fair value and details of the valuation models, key inputs to those models and significant assumptions utilized.
RMBS
The Company holds a portfolio of RMBS that are classified as available for sale and are carried at fair value in the consolidated balance sheet. The Company determines the fair value of its RMBS based upon prices obtained from third-party pricing providers. The third-party pricing providers use pricing models that generally incorporate such factors as coupons, primary and secondary mortgage rates, rate reset period, issuer, prepayment speeds, credit enhancements and expected life of the security. As a result, the Company classified 100% of its RMBS as Level 2 fair value assets at December 31, 2014.
Excess MSRs
The Company holds a portfolio of Excess MSRs that are reported at fair value on the consolidated balance sheet. Although Excess MSR transactions are observable in the marketplace, the valuation includes unobservable market data inputs (prepayment speeds, delinquency levels and discount rates). As a result, the Company classified 100% of its Excess MSRs as Level 3 fair value assets at December 31, 2014.
Derivative Instruments
The Company may enter into a variety of derivative financial instruments as part of its economic hedging strategies. The Company executes interest rate swaps, swaptions TBAs and treasury futures. The Company utilizes third-party pricing providers to value its financial derivative instruments. The Company classified 100% of the derivative instruments as Level 2 fair value assets and liabilities at December 31, 2014.
82
Table of Contents
The Company also enters into certain other derivative financial instruments, such as interest rate futures and TBAs. These instruments are similar in form to the Company’s RMBS available for sale securities and the Company utilizes a pricing service to value TBAs.
The Company has netting arrangements in place with certain derivative counterparties pursuant to standard documentation developed by the ISDA. Additionally, both the Company and the counterparties are required to post cash collateral based upon the net underlying market value of the Company’s open positions with the counterparties. Posting of cash collateral typically occurs daily, subject to certain dollar thresholds. Due to the existence of netting arrangements, as well as frequent cash collateral posting at low posting thresholds, credit exposure to the Company and/or counterparties is considered materially mitigated. The Company’s interest rate swaps are required to be cleared on an exchange, which further mitigates but does not eliminate, credit risk. Based on the Company’s assessment, there is no requirement for any additional adjustment to derivative valuations specifically for credit.
83
Table of Contents
Recurring Fair Value Measurements
The following tables present the Company’s assets and liabilities measured at fair value on a recurring basis (dollars in thousands).
Recurring Fair Value Measurements
At December 31, 2014
| Level 1 | Level 2 | Level 3 | Carrying Value | |||||||||||||
| Assets |
||||||||||||||||
| RMBS |
||||||||||||||||
| Fannie Mae |
$ | — | $ | 268,588 | $ | — | $ | 268,588 | ||||||||
| Freddie Mac |
— | 140,476 | — | 140,476 | ||||||||||||
| CMOs |
— | 6,939 | — | 6,939 | ||||||||||||
|
|
|
|
|
|
|
|
|
|||||||||
| RMBS total |
— | 416,003 | — | 416,003 | ||||||||||||
| Derivative assets |
||||||||||||||||
| Interest rate swaps |
— | 46 | — | 46 | ||||||||||||
| Interest rate swaptions |
— | 291 | — | 291 | ||||||||||||
| TBAs |
— | — | — | — | ||||||||||||
| Treasury Futures |
— | 5 | — | 5 | ||||||||||||
|
|
|
|
|
|
|
|
|
|||||||||
| Derivative assets total |
— | 342 | — | 342 | ||||||||||||
| Excess MSRs |
— | — | 91,322 | 91,322 | ||||||||||||
|
|
|
|
|
|
|
|
|
|||||||||
| Total Assets |
$ | — | $ | 416,345 | $ | 91,322 | $ | 507,667 | ||||||||
| Liabilities |
||||||||||||||||
| Derivative liabilities |
||||||||||||||||
| Interest rate swaps |
— | 4,045 | — | 4,045 | ||||||||||||
| TBAs |
— | 43 | — | 43 | ||||||||||||
| Treasury Futures |
— | — | — | — | ||||||||||||
|
|
|
|
|
|
|
|
|
|||||||||
| Derivative liabilities total |
— | 4,088 | — | 4,088 | ||||||||||||
|
|
|
|
|
|
|
|
|
|||||||||
| Total Liabilities |
$ | — | $ | 4,088 | $ | — | $ | 4,088 | ||||||||
At December 31, 2013
| Level 1 | Level 2 | Level 3 | Carrying Value | |||||||||||||
| Assets |
||||||||||||||||
| RMBS |
||||||||||||||||
| Fannie Mae |
$ | — | $ | 176,756 | $ | — | $ | 176,756 | ||||||||
| Freddie Mac |
— | 110,223 | — | 110,223 | ||||||||||||
| CMOs |
— | — | — | — | ||||||||||||
|
|
|
|
|
|
|
|
|
|||||||||
| RMBS total |
— | 286,979 | — | 286,979 | ||||||||||||
| Derivative assets |
||||||||||||||||
| Interest rate swaps |
— | 2,531 | — | 2,531 | ||||||||||||
| Interest rate swaptions |
— | 2,082 | — | 2,082 | ||||||||||||
| TBAs |
— | — | — | — | ||||||||||||
|
|
|
|
|
|
|
|
|
|||||||||
| Derivative assets total |
— | 4,613 | — | 4,613 | ||||||||||||
| Excess MSRs |
— | — | 110,306 | 110,306 | ||||||||||||
|
|
|
|
|
|
|
|
|
|||||||||
| Total Assets |
$ | — | $ | 291,592 | $ | 110,306 | $ | 401,898 | ||||||||
| Liabilities |
||||||||||||||||
| Derivative liabilities |
||||||||||||||||
| Interest rate swaps |
— | 592 | — | 592 | ||||||||||||
| TBAs |
— | — | — | — | ||||||||||||
|
|
|
|
|
|
|
|
|
|||||||||
| Derivative liabilities total |
— | 592 | — | 592 | ||||||||||||
|
|
|
|
|
|
|
|
|
|||||||||
| Total Liabilities |
$ | — | $ | 592 | $ | — | $ | 592 | ||||||||
The Company may be required to measure certain assets or liabilities at fair value from time to time. These periodic fair value measures typically result from application of certain impairment measures under GAAP. These items would constitute nonrecurring fair value measures under ASC 820. As of December 31, 2014, the Company did not have any assets or liabilities measured at fair value on a nonrecurring basis in the periods presented.
Level 3 Assets and Liabilities
The valuation of Level 3 instruments requires significant judgment by the third-party pricing providers and/or management. The third-party pricing providers and/or management rely on inputs such as market price quotations from market makers (either market or indicative levels), original transaction price, recent transactions in the same or similar instruments, and changes in financial ratios or cash flows to determine fair value. Level 3 instruments may also be discounted to reflect
84
Table of Contents
illiquidity and/or non-transferability, with the amount of such discount estimated by the third-party pricing provider in the absence of market information. Assumptions used by the third-party pricing provider due to lack of observable inputs may significantly impact the resulting fair value and therefore the Company’s financial statements. The Company’s management reviews all valuations that are based on pricing information received from a third-party pricing provider. As part of this review, prices are compared against other pricing or input data points in the marketplace, along with internal valuation expertise, to ensure the pricing is reasonable.
In connection with the above, CHMI estimates the fair value of its Excess MSRs based on internal pricing models rather than quotations, and compares these internal models against models generated by third-party valuation specialists. The determination of estimated cash flows used in pricing models is inherently subjective and imprecise. Changes in market conditions, as well as changes in the assumptions or methodology used to determine fair value, could result in a significant change to estimated fair values. It should be noted that minor changes in assumptions or estimation methodologies can have a material effect on these derived or estimated fair values, and that the fair values reflected below are indicative of the interest rate and credit spread environments as of December 31, 2014 and do not take into consideration the effects of subsequent changes in market or other factors.
The tables below present the reconciliation for the Company’s Level 3 assets (Excess MSRs) measured at fair value on a recurring basis (dollars in thousands).
Recurring Fair Value Measurements
At December 31, 2014
| Level 3 (A) | ||||||||||||||||
| Pool 1 | Pool 2 | Pool 2014 | Total | |||||||||||||
| Balance at December 31, 2013 |
$ | 66,110 | $ | 44,196 | $ | — | $ | 110,306 | ||||||||
| Unrealized gain included in Net Income |
(3,260 | ) | 129 | (433 | ) | (3,564 | ) | |||||||||
| Purchases and principal paydowns |
||||||||||||||||
| Purchases |
— | — | 2,181 | 2,181 | ||||||||||||
| Proceeds from principal paydowns |
(8,052 | ) | (9,387 | ) | (162 | ) | (17,601 | ) | ||||||||
|
|
|
|
|
|
|
|
|
|||||||||
| Balance at December 31, 2014 |
$ | 54,798 | $ | 34,938 | $ | 1,586 | $ | 91,322 | ||||||||
At December 31, 2013
| Level 3 (A) | ||||||||||||
| Pool 1 | Pool 2 | Total | ||||||||||
| Balance at December 31, 2012 |
$ | — | $ | — | $ | — | ||||||
| Gain Included in Net Income |
7,417 | 8,230 | 15,647 | |||||||||
| Purchases and principal paydowns |
||||||||||||
| Purchases |
60,561 | 38,407 | 98,968 | |||||||||
| Proceeds from principal paydowns |
(1,868 | ) | (2,441 | ) | (4,309 | ) | ||||||
|
|
|
|
|
|
|
|||||||
| Balance at December 31, 2013 |
$ | 66,110 | $ | 44,196 | $ | 110,306 | ||||||
| (A) | Includes the recapture agreement for each respective pool. |
The tables below present information about the significant unobservable inputs used in the fair value measurement of the Company’s Excess MSRs classified as Level 3 fair value assets at December 31, 2014 (dollars in thousands):
Excess MSR Information
At December 31, 2014
| Fair Value | Valuation Technique |
Unobservable Input (A) |
Range | Weighted Average |
||||||||||
| Pool 1 |
$ | 54,798 | Discounted cash flow | Constant prepayment speed | 6.2% - 12.8% | 10.4 | % | |||||||
| Uncollected Payments | 2.8% - 7.0% | 6.3 | % | |||||||||||
| Discount rate | — | 12.2 | % | |||||||||||
| Pool 2 |
$ | 34,938 | Discounted cash flow | Constant prepayment speed | 11.9% - 21.9% | 16.7 | % | |||||||
| Uncollected Payments | 9.6% - 15.2% | 13.7 | % | |||||||||||
| Discount rate | — | 17.3 | % | |||||||||||
| Pool 2014 |
$ | 1,586 | Discounted cash flow | Constant prepayment speed | 8.7% - 15.4% | 12.3 | % | |||||||
| Uncollected Payments | 2.7% - 6.0% | 5.4 | % | |||||||||||
| Discount rate | — | 11.8 | % | |||||||||||
|
|
|
|||||||||||||
| TOTAL |
$ | 91,322 | Discounted cash flow | |||||||||||
85
Table of Contents
At December 31, 2013
| Fair Value | Valuation Technique |
Unobservable Input (A) |
Range | Weighted Average |
||||||||||
| Pool 1 |
$ | 66,110 | Discounted cash flow | Constant prepayment speed | 4.8% - 9.6% | 7.4 | % | |||||||
| Uncollected Payments | 2.0% - 7.0% | 6.2 | % | |||||||||||
| Discount rate | — | 14.3 | % | |||||||||||
| Pool 2 |
$ | 44,196 | Discounted cash flow | Constant prepayment speed | 9.7% - 23.6% | 18.0 | % | |||||||
| Uncollected Payments | 2.0% - 12.0% | 9.2 | % | |||||||||||
| Discount rate | — | 18.4 | % | |||||||||||
|
|
|
|||||||||||||
| TOTAL |
$ | 110,306 | Discounted cash flow | |||||||||||
| (A) | Significant increases (decreases) in any of the inputs in isolation may result in significantly lower (higher) fair value measurement. A change in the assumption used for discount rates may be accompanied by a directionally similar change in the assumption used for the probability of delinquency and a directionally opposite change in the assumption used for prepayment rates. |
Fair Value of Financial Instruments
In accordance with ASC 820, the Company is required to disclose the fair value of financial instruments, both assets and liabilities recognized and not recognized in the consolidated balance sheet, for which fair value can be estimated. The following describes the Company’s methods for estimating the fair value for financial instruments.
| • | RMBS available for sale securities, Excess MSRs, derivative assets and derivative liabilities are recurring fair value measurements; carrying value equals fair value. See discussion of valuation methods and assumptions within the “Fair Value Measurements” section of this footnote. |
| • | Cash and cash equivalents and restricted cash have a carrying value which approximates fair value because of the short maturities of these instruments. |
| • | The carrying value of repurchase agreements that mature in less than one year generally approximates fair value due to the short maturities. The Company does not hold any repurchase agreements that are considered long-term. |
Note 10 — Commitments and Contingencies
The following represents commitments and contingencies of the Company as of December 31, 2014:
Management Agreement
CHMI pays the Manager a quarterly management fee, calculated and payable quarterly in arrears, equal to the product of one quarter of the 1.5% Management Fee Annual Rate and the Stockholders’ Equity, adjusted as set forth in the Management Agreement as of the end of such fiscal quarter. The Company relies on resources of Freedom Mortgage to provide the Manager with the necessary resources to conduct Company operations. For further discussion regarding the Management Fee, refer to Note 7.
Legal and Regulatory
From time to time the Company may be subject to potential liability under laws and government regulations and various claims and legal actions arising in the ordinary course of business. Liabilities are established for legal claims when payments associated with the claims become probable and the costs can be reasonably estimable. The actual costs of resolving legal claims may be substantially higher or lower than the amounts established for those claims. Based on information currently available, management is not aware of any legal or regulatory claims that would have a material effect on the Company’s consolidated financial statements, and, therefore, no accrual is required as of December 31, 2014.
86
Table of Contents
Commitments to Purchase RMBS
In 2014, the Company entered into forward TBA purchase commitments with counterparties, which are forward RMBS trades, whereby the Company committed to purchasing a pool of securities at a particular interest rate. As of the date of the trade, the underlying mortgage-backed securities underlying the pool that will be delivered to fulfill a TBA trade is not yet designated. The securities are typically “to be announced” 48 hours prior to the established trade settlement date. At December 31, 2014, the Company is not obligated to purchase any securities and is obligated to sell approximately $43,000 of Fannie Mae securities.
Acknowledgement Agreement
In order to acquire Excess MSRs related to FHA and VA mortgage loans that have been pooled into securities guaranteed by Ginnie Mae, we must enter into an acknowledgment agreement with Ginnie Mae and the Ginnie Mae-approved issuer/servicer for the mortgage loans if we want to have Ginnie Mae acknowledge our interest in the relevant mortgage loans. Under that agreement, if the issuer/servicer fails to make a required payment to the holders of the Ginnie Mae-guaranteed RMBS, we would be obligated to make that payment even though the payment may relate to loans for which we do not own any Excess MSRs.
Our failure to make that payment could result in liability to Ginnie Mae for any losses or claims that it suffers as a result. In addition, under an acknowledgment agreement with Fannie Mae or Freddie Mac, we could be exposed to potential liability in the event of a payment default by an approved seller/servicer. However, the amount of the potential liability to Fannie Mae or Freddie Mac would be limited to the mortgage loans in the servicing portfolio identified in the acknowledgment agreement.
Management has determined, as of December 31, 2014, the risk of material loss to be remote and thus no liability has been accrued.
Note 11 – Repurchase Agreements
At December 31, 2014, the Company had outstanding approximately $362.1 million of repurchase agreements with a weighted average borrowing rate of 0.38%, after giving effect to the Company’s interest rate swaps, and weight average remaining maturities of 63 days. RMBS and cash have been pledged as collateral under these repurchase agreements (see Note 4).
The amount of collateral at December 31, 2014 and 2013, including cash, was $383.5 million and $275.6 million, respectively.
At December 31, 2014 and 2013, the repurchase agreements had the following remaining maturities and weighted average rates (dollars in thousands):
Repurchase Agreements
At December 31, 2014
| Repurchase Agreements | Weighted Average Rate | |||||||
| Less than one month |
$ | 78,988 | 0.38 | % | ||||
| One to three months |
208,533 | 0.38 | % | |||||
| Greater than three months |
74,605 | 0.38 | % | |||||
|
|
|
|
|
|||||
| Total/Weighted Average |
$ | 362,126 | 0.38 | % | ||||
At December 31, 2013
| Repurchase Agreements | Weighted Average Rate | |||||||
| Less than one month |
$ | 134,001 | 0.39 | % | ||||
| One to three months |
127,301 | 0.40 | % | |||||
| Greater than three months |
— | — | ||||||
|
|
|
|
|
|||||
| Total/Weighted Average |
$ | 261,302 | 0.39 | % | ||||
87
Table of Contents
Note 12 – Summarized Quarterly Results (Unaudited)
The following tables present information about the Company’s quarterly operating results (dollars in thousands):
| 2014 | ||||||||||||||||
| December 31, | September 30, | June 30, | March 31, | |||||||||||||
| Income |
||||||||||||||||
| Interest income |
$ | 6,569 | $ | 6,244 | $ | 6,137 | $ | 6,011 | ||||||||
| Interest expense |
1,190 | 1,164 | 1,006 | 947 | ||||||||||||
|
|
|
|
|
|
|
|
|
|||||||||
| Net interest income |
5,379 | 5,080 | 5,131 | 5,064 | ||||||||||||
| Other income (loss) |
||||||||||||||||
| Realized gain (loss) on RMBS, net |
166 | 48 | 75 | (349 | ) | |||||||||||
| Realized gain (loss) on derivatives, net |
(1,359 | ) | (1,025 | ) | (187 | ) | (72 | ) | ||||||||
| Unrealized gain (loss) on derivatives, net |
(2,441 | ) | 2,025 | (2,705 | ) | (3,443 | ) | |||||||||
| Change in fair value of investments in excess mortgage servicing rights |
(536 | ) | (2,050 | ) | (1,648 | ) | 670 | |||||||||
|
|
|
|
|
|
|
|
|
|||||||||
| Total Income |
1,209 | 4,078 | 666 | 1,870 | ||||||||||||
| Expenses |
||||||||||||||||
| General and administrative expense |
1,191 | 743 | 641 | 453 | ||||||||||||
| Management fee to affiliate |
682 | 520 | 679 | 679 | ||||||||||||
|
|
|
|
|
|
|
|
|
|||||||||
| Total Expenses |
1,873 | 1,263 | 1,320 | 1,132 | ||||||||||||
|
|
|
|
|
|
|
|
|
|||||||||
| Income (Loss) Before Income Taxes |
(664 | ) | 2,815 | (654 | ) | 738 | ||||||||||
| (Benefit from) provision for corporate business taxes |
(146 | ) | 1 | 2 | 3 | |||||||||||
|
|
|
|
|
|
|
|
|
|||||||||
| Net Income (Loss) |
(518 | ) | 2,814 | (656 | ) | 735 | ||||||||||
| Net income allocated to LTIP-OP Units |
5 | (26 | ) | 3 | (4 | ) | ||||||||||
|
|
|
|
|
|
|
|
|
|||||||||
| Income Applicable to Common Stockholders |
$ | (513 | ) | $ | 2,788 | $ | (653 | ) | $ | 731 | ||||||
| Income (Loss) Per Share of Common Stock |
||||||||||||||||
| Basic |
$ | (0.07 | ) | $ | 0.37 | $ | (0.09 | ) | $ | 0.10 | ||||||
| Diluted |
$ | (0.07 | ) | $ | 0.37 | $ | (0.09 | ) | $ | 0.10 | ||||||
| Weighted Average Number of Shares of Common Stock Outstanding |
||||||||||||||||
| Basic |
7,508,549 | 7,506,560 | 7,504,572 | 7,502,505 | ||||||||||||
| Diluted |
7,509,543 | 7,509,543 | 7,509,543 | 7,506,680 | ||||||||||||
88
Table of Contents
| 2013 | ||||||||||||||||
| December 31, | September 30, | June 30, | March 31, | |||||||||||||
| Income |
||||||||||||||||
| Interest income |
$ | 5,475 | $ | — | $ | — | $ | — | ||||||||
| Interest expense |
867 | — | — | — | ||||||||||||
|
|
|
|
|
|
|
|
|
|||||||||
| Net interest income |
4,608 | — | — | — | ||||||||||||
| Other income (loss) |
||||||||||||||||
| Realized gain (loss) on RMBS, net |
(527 | ) | — | — | — | |||||||||||
| Realized gain on derivatives, net |
59 | — | — | — | ||||||||||||
| Unrealized gain (loss) on derivatives, net |
2,747 | — | — | — | ||||||||||||
| Change in fair value of investments in excess mortgage servicing rights |
15,647 | — | — | — | ||||||||||||
|
|
|
|
|
|
|
|
|
|||||||||
| Total Income |
22,534 | — | — | — | ||||||||||||
| Expenses |
||||||||||||||||
| General and administrative expense |
609 | 36 | 36 | 35 | ||||||||||||
| Management fee to affiliate |
616 | — | — | — | ||||||||||||
|
|
|
|
|
|
|
|
|
|||||||||
| Total Expenses |
1,225 | 36 | 36 | 35 | ||||||||||||
|
|
|
|
|
|
|
|
|
|||||||||
| Income (Loss) Before Income Taxes |
21,309 | (36 | ) | (36 | ) | (35 | ) | |||||||||
| (Benefit from) provision for corporate business taxes |
— | — | — | — | ||||||||||||
|
|
|
|
|
|
|
|
|
|||||||||
| Net Income (Loss) |
21,309 | (36 | ) | (36 | ) | (35 | ) | |||||||||
| Net income allocated to LTIP-OP Units |
(107 | ) | — | — | — | |||||||||||
|
|
|
|
|
|
|
|
|
|||||||||
| Income Applicable to Common Stockholders |
$ | 21,202 | $ | (36 | ) | $ | (36 | ) | $ | (35 | ) | |||||
| Income (Loss) Per Share of Common Stock |
||||||||||||||||
| Basic |
$ | 3.14 | $ | (36.00 | ) | $ | (36.00 | ) | $ | (35.00 | ) | |||||
| Diluted |
$ | 3.14 | $ | (36.00 | ) | $ | (36.00 | ) | $ | (35.00 | ) | |||||
| Weighted Average Number of Shares of Common Stock Outstanding |
||||||||||||||||
| Basic |
6,750,100 | 1,000 | 1,000 | 1,000 | ||||||||||||
| Diluted |
6,750,100 | 1,000 | 1,000 | 1,000 | ||||||||||||
Note 13 – Income Taxes
For the period October 31, 2012 (date of inception) to December 31, 2012, the Company was taxable as a corporation and, as such, was subject to federal, state and local taxation. The Company incurred certain expenses during the period but had not commenced operations. The Company recorded a deferred tax asset of $10,000 related to these start-up expenses. Given that the Company was in its first year of operations and did not expected to realize the benefits of the deferred tax asset, management concluded that a full valuation allowance was required.
On January 1, 2013, the Company elected to be taxed as a Subchapter S corporation and, as such, all federal tax liabilities are the responsibility of the Company’s sole stockholder, Mr. Stanley Middleman. The Company had no state and local income tax liability for the period that it was taxed as a Subchapter S corporation. On October 2, 2013, the Company elected to revoke its Subchapter S election and elected to be taxed as a REIT under the Code for US federal income tax purposes for its year ended December 31, 2013.
As long as the Company qualifies as a REIT, the Company generally will not be subject to U.S. federal income taxes on its taxable income to the extent it annually distributes at least 90% of its net taxable income to stockholders and does not engage in prohibited transactions. The Company intends to comply with all requirements to continue to qualify as a REIT. The majority of states also recognize the Company’s REIT status. For the taxable years ended December 31, 2014 and 2013, the Company qualified to be taxed as a REIT for US federal income tax purposes.
89
Table of Contents
The Company assesses its tax positions for all open tax years and determines if it has any material unrecognized liabilities in accordance with ASC 740, Income Taxes. The Company records these liabilities to the extent it deems them more-likely-than-not to be incurred. The Company classifies interest and penalties on material uncertain tax positions, if any, as interest expense and operating expense, respectively, in its consolidated statements of income. The Company has not incurred any interest or penalties.
Effective January 1, 2014, Solutions has elected to be taxed as a corporation for Federal income tax purposes; prior to this date, Solutions was a disregarded entity for Federal income tax purposes. Solutions has jointly elected with the Company, the ultimate beneficial owner of Solutions, to be treated as a taxable REIT subsidiary. Solutions files a separate tax return and is fully taxed as a standalone U.S. C-Corporation.
The Company accounts for income taxes in accordance with ASC 740, Income Taxes. ASC 740 requires the recording of deferred income taxes that reflect the net tax effect of temporary differences between the carrying amounts of the Company’s assets and liabilities for financial reporting purposes and the amounts used for income tax purposes, including operating loss carry forwards. Deferred tax assets and liabilities are measured using enacted tax rates expected to apply to taxable income in the years in which those temporary differences are expected to be recovered or settled. The effect of a change in tax rates on deferred tax assets and liabilities is recognized in earnings in the period that includes the enactment date. The Company records interest and penalties related to income taxes within the provision for income taxes in the statement of income.
The components of the Company’s income tax expense are as follows for the periods indicated below:
|
Year Ended December 31, |
Two Month Period October 31, 2012 (date of inception) to December 31, 2012 |
|||||||||||
| 2014 | 2013 | |||||||||||
| Current federal income tax expense (benefit) |
$ | — | $ | — | $ | — | ||||||
| Current state income tax expense (benefit) |
6 | — | — | |||||||||
| Deferred federal income tax expense (benefit) |
(124 | ) | — | — | ||||||||
| Deferred state income tax expense (benefit) |
(22 | ) | — | — | ||||||||
|
|
|
|
|
|
|
|||||||
| Total Income Tax Expense (Benefit) |
$ | (140 | ) | $ | — | $ | — | |||||
The following is a reconciliation of the statutory federal rate to the effective rate, for the years ended December 31, 2014 and 2013 and the two month period October 31, 2012 (date of inception) to December 31, 2012:
|
Year Ended December 31, |
Two Month Period October 31, 2012 (date of inception) to December 31, 2012 |
|||||||||||||||||||||||
| 2014 | 2013 | |||||||||||||||||||||||
| $ | % | $ | % | $ | % | |||||||||||||||||||
| Computed income tax expense at federal rate |
$ | 824 | 35.0 | % | $ | 7,383 | 35.0 | % | $ | — | — | % | ||||||||||||
| State taxes, net of federal benefit, if applicable |
92 | 3.9 | % | — | — | % | — | — | % | |||||||||||||||
| Permanent differences in taxable income from GAAP net income |
4,874 | 207.2 | % | (6,071 | ) | (28.8 | %) | — | — | % | ||||||||||||||
| REIT income not subject to tax |
(5,930 | ) | (252.0 | %) | (1,312 | ) | (6.2 | %) | |
— |
|
— | % | |||||||||||
|
|
|
|
|
|
|
|
|
|
|
|
|
|||||||||||||
| (Benefit from) provision for income taxes/Effective Tax Rate(A) |
$ | (140 | ) | (5.9 | %) | $ | — | — | % | $ | — | — | % | |||||||||||
| (A) | The (benefit from) provision for income taxes is recorded at the taxable subsidiary level. |
The Company’s consolidated balance sheets, at December 31, 2014 and 2013, contain the following current and deferred tax liabilities and assets, which are recorded at the taxable REIT subsidiary level:
| Year Ended December 31, | ||||||||
| 2014 | 2013 | |||||||
| Income taxes (payable) receivable |
||||||||
| Federal income taxes (payable) receivable |
$ | — | $ | — | ||||
| State and local income taxes (payable) receivable |
— | — | ||||||
|
|
|
|
|
|||||
| Income taxes (payable) receivable, net |
— | — | ||||||
| Deferred tax assets (liabilities) |
||||||||
| Deferred tax asset |
146 | — | ||||||
| Deferred tax liability |
— | — | ||||||
|
|
|
|
|
|||||
| Total net deferred tax assets (liabilities) |
146 | — | ||||||
|
|
|
|
|
|||||
| Total tax assets and liabilities, net |
$ | 146 | $ | — | ||||
The deferred tax asset described above primarily consisted of net operating loss carryforwards and acquisition related costs capitalized for tax purposes. Solutions’ federal and state net operating loss carryforwards are approximately $154,000 and are available to offset future taxable income and expire in 2034. Management has determined that it is more likely than not that all of Solutions’ deferred tax assets will be realized in the future. Accordingly, no valuation allowance has been established at December 31, 2014. The deferred tax asset is included in Receivables and other assets in the consolidated balance sheets.
Based on the Company’s evaluation, it has been concluded that there are no significant uncertain tax positions requiring recognition in the Company’s financial statements. Additionally, there were no amounts accrued for penalties or interest as of or during the periods presented in these consolidated financial statements.
Note 14 – Subsequent Events
On February 10, 2015, Solutions signed a definitive agreement to purchase the stock of Aurora Financial Group, Inc. (Aurora), a licensed mortgage origination and servicing company. Aurora is an approved issuer of Government National Mortgage Association (Ginnie Mae) and an approved seller/servicer for Federal National Mortgage Association (Fannie Mae) and Federal Home Loan Mortgage Corporation (Freddie Mac). Aurora, at December 31, 2014 owns servicing rights on approximately $700 million of Fannie Mae and Freddie Mac RMBS.
90
Table of Contents
The closing is contingent on several conditions, including obtaining regulatory and agency approvals. If the acquisition of Aurora does not close for any reason by June 30, 2015, Aurora is obligated to sell its servicing portfolio to Freedom Mortgage Corporation at the price set forth in Solutions’ agreement with Aurora. In turn, Freedom Mortgage Corporation is obligated to repay Solutions for the $360,121 down payment it made to Seller.
The Company has evaluated subsequent events for recognition and disclosure through March 13, 2015 the date the financial statements were available to be issued. Based on this evaluation, the Company has determined that no additional events are required to be recognized or disclosed in the financial statements
| Item 9. | Changes in and Disagreements with Accountants on Accounting and Financial Disclosure |
None.
| Item 9A. | Controls and Procedures |
Disclosure Controls and Procedures. The Company’s President and its Chief Financial Officer, have evaluated the effectiveness of the Company’s disclosure controls and procedures (as such term is defined in Rules 13a-15(e) and 15d –15(e) under the Securities Exchange Act of 1934, as amended (the “Exchange Act”)) as of the end of the period covered by this report. The Company’s disclosure controls and procedures are designed to provide reasonable assurance that information is recorded, processed, summarized and reported accurately and on a timely basis. Based on such evaluation, the Company’s President and the Company’s Chief Financial Officer have concluded that, as of the end of such period, the Company’s disclosure controls and procedures are effective.
Management’s Report on Internal Control Over Financial Reporting. Our management is responsible for establishing and maintaining adequate internal control over financial reporting. Internal control over financial reporting is defined in Rule 13a-15(f) and 15d-15(f) under the Securities Exchange Act of 1934, as amended, as a process designed by, or under the supervision of, the Company’s principal executive and principal financial officers and effected by the Company’s board of directors, management and other personnel to provide reasonable assurance regarding the reliability of financial reporting and the preparation of financial statements for external purposes in accordance with accounting principles generally accepted in the United States and includes those policies and procedures that:
| • | pertain to the maintenance of records that in reasonable detail accurately and fairly reflect the transactions and dispositions of the assets of the Company; |
| • | provide reasonable assurance that transactions are recorded as necessary to permit preparation of financial statements in accordance with accounting principles generally accepted in the United States, and that receipts and expenditures of the Company are being made only in accordance with authorizations of management and directors of the Company; and |
| • | provide reasonable assurance regarding prevention or timely detection of unauthorized acquisition, use or disposition of the Company’s assets that could have a material effect on the financial statements |
Under the supervision and with the participation of our management, including our principal executive officer and principal financial officer, we conducted an evaluation of the effectiveness of our internal control over financial reporting based on the framework in Internal Control - Integrated Framework, issued by the Committee of Sponsoring Organizations of the Treadway Commission (2013 Framework). Based on our evaluation under the framework in Internal Control Integrated Framework, our management concluded that our internal control over financial reporting was effective as of December 31, 2014.
Because of its inherent limitations, internal control over financial reporting may not prevent or detect all misstatements. Projections of any evaluation of effectiveness to future periods are subject to the risks that controls may become inadequate because of changes in conditions, or that the degree of compliance with the policies or procedures may deteriorate.
Changes in Internal Control Over Financial Reporting. There have been no changes in the Company’s internal control over financial reporting (as such term is defined in Rules 13a-15(f) and 15d-15(f) under the Exchange Act) during the most recently completed fiscal quarter that have materially affected, or are reasonably likely to materially affect, the Company’s internal control over financial reporting.
91
Table of Contents
| Item 9B. | Other Information |
None
| Item 10. | Directors, Executive Officers and Corporate Governance |
The information required by this item is incorporated herein by reference to the Company’s Definitive Proxy Statement on Schedule 14A relating to its annual meeting of stockholders (the “Proxy Statement”), to be filed with the SEC within 120 days after December 31, 2014.
| Item 11. | Executive Compensation |
The information required by this item is incorporated herein by reference to the Proxy Statement to be filed with the SEC within 120 days after December 31, 2014.
| Item 12. | Security Ownership of Certain Beneficial Owners and Management and Related Stockholder Matters |
The information required by this item is incorporated herein by reference to the Proxy Statement to be filed with the SEC within 120 days after December 31, 2014.
| Item 13. | Certain Relationships and Related Transactions and Director Independence |
The information required by this item is incorporated herein by reference to the Proxy Statement to be filed with the SEC within 120 days after December 31, 2014.
| Item 14. | Principal Accountant Fees and Services |
The information required by this item is incorporated herein by reference to the Proxy Statement to be filed with the SEC within 120 days after December 31, 2014.
92
Table of Contents
| Item 15. | Exhibits |
Documents filed as part of the report
The following documents are filed as part of this Annual Report on Form 10-K:
| (1) | Financial Statements. |
The consolidated financial statements of the Company, together with the independent registered public accounting firm’s report thereon, are set forth in this Annual Report on Form 10-K and are incorporated herein by reference. See “Item 8. Consolidated Financial Statements and Supplementary Data,” filed herewith, for a list of financial statements.
| (2) | Financial Statement Schedule. |
All financial statement schedules have been omitted because the required information is not applicable or deemed not material, or the required information is presented in the consolidated financial statements and/or in the notes to consolidated financial statements filed in response to Item 8 of this Annual Report on Form 10-K.
| (3) | Exhibits Files. |
| Exhibit |
Description | |
| 3.1 | Articles of Amendment and Restatement of Cherry Hill Mortgage Investment Corporation (incorporated by reference to Exhibit 3.1 to Amendment No. 2 to the Company’s Registration Statement on Form S-11 (Registration No. 333-188214) on June 10, 2013). | |
| 3.2 | Amended and Restated Bylaws of Cherry Hill Mortgage Investment Corporation (incorporated by reference to Exhibit 3.2 to Amendment No. 2 to the Company’s Registration Statement on Form S-11 (Registration No. 333- 188214) on June 10, 2013). | |
| 4.1 | Specimen Common Stock Certificate. (incorporated by reference to Exhibit 4.1 to Amendment No. 1 to the Company’s Registration Statement on Form S-11 (Registration No. 333- 188214) on May 28, 2013). | |
| 4.2 | Registration Rights Agreement between Stanley Middleman and Cherry Hill Mortgage Investment Corporation (incorporated by reference to Exhibit 99.2 to the Schedule 13D filed by Stanley Middleman on October 11, 2013 (incorporated by reference to actual agreement). | |
| 10.1 | Strategic Alliance Agreement, dated October 9, 2013, by and between Cherry Hill Mortgage Investment Corporation and Freedom Mortgage Corporation (incorporated by reference from Exhibit 10.1 of the Company’s Form 8-K filed with the SEC on October 15, 2013). | |
| 10.2 | Flow and Bulk Excess MSR Acquisition Agreement, dated October 9, 2013, by and between Cherry Hill Mortgage Investment Corporation and Freedom Mortgage Corporation (incorporated by reference from Exhibit 10.2 of the Company’s Form 8-K filed with the SEC on October 15, 2013). | |
| 10.3 | Pool 1 Excess MSR Acquisition and Recapture Agreement, dated October 9, 2013, by and between Cherry Hill Mortgage Investment Corporation and Freedom Mortgage Corporation (incorporated by reference from Exhibit 10.3 of the Company’s Form 8-K filed with the SEC on October 15, 2013). | |
| 10.4 | Pool 2 Excess MSR Acquisition and Recapture Agreement, dated October 9, 2013, by and between Cherry Hill Mortgage Investment Corporation and Freedom Mortgage Corporation (incorporated by reference from Exhibit 10.4 of the Company’s Form 8-K filed with the SEC on October 15, 2013). | |
| 10.5 | Amended and Restated Management Agreement, dated September 24, 2013, among Cherry Hill Mortgage Investment Corporation, Cherry Hill Operating Partnership, LP, Cherry Hill QRS I, LLC, Cherry Hill QRS II, LLC, Cherry Hill Solutions, Inc. (former Cherry Hill TRS, LLC) and Cherry Hill Mortgage Management, LLC (incorporated by reference to Exhibit 10.5 to Amendment No. 4 to the Company’s Registration Statement on Form S-11 (Registration No. 333- 188214) on September 26, 2013). | |
93
Table of Contents
| Exhibit |
Description | |
| 10.6 | Services Agreement, dated May 1, 2013, between Cherry Hill Mortgage Management, LLC and Freedom Mortgage Corporation (incorporated by reference to Exhibit 10.5 to Amendment No. 1 to the Company’s Registration Statement on Form S-11 (Registration No. 333- 188214) on May 28, 2013). | |
| 10.7 | Form of Indemnification Agreement (incorporated by reference to Exhibit 10.6 to Amendment No. 1 to the Company’s Registration Statement on Form S-11 (Registration No. 333- 188214) on May 28, 2013). | |
| 10.8 | 2013 Equity Incentive Plan (incorporated by reference to Exhibit 10.7 to Amendment No. 2 to the Company’s Registration Statement on Form S-11 (Registration No. 333- 188214) on June 10, 2013). | |
| 10.9 | Agreement of Limited Partnership of Cherry Hill Operating Partnership, LP. (incorporated by reference to Exhibit 10.8 to Amendment No. 1 to the Company’s Registration Statement on Form S-11 (Registration No. 333- 188214) on May 28, 2013). | |
| 10.10 | Form of LTIP Unit Vesting Agreement (incorporated by reference to Exhibit 10.9 to Amendment No. 2 to the Company’s Registration Statement on Form S-11 (Registration No. 333- 188214) on June 10, 2013). | |
| 10.11 | Stock Purchase Agreement between Stanley Middleman and Cherry Hill Mortgage Investment Corporation (incorporated by reference to Exhibit 99.1 to the Schedule 13D filed by Stanley Middleman on October 11, 2013. | |
| 10.12 | Form of LTIP Unit Vesting Agreement for Independent Directors (incorporated by reference to Exhibit 10.11 to Amendment No. 2 to the Company’s Registration Statement on Form S-11 (Registration No. 333- 188214) on June 10, 2013). | |
| 10.13 | Form of Unrestricted Non-Employee Director Stock Award Agreement (Without Forfeiture Restrictions) (incorporated by reference to Exhibit 10.1 to the Company’s Current Report on Form 8-K filed on January 27, 2014). | |
| 10.14 | Form of Unrestricted Non-Employee Director Stock Award Agreement (With Forfeiture Restrictions) (incorporated by reference to the Company’s Current Report on Form 8-K filed on January 27, 2014). | |
| 12.1* | Statement of Computation of Ratio of Earnings to Combined Fixed Charges and Preferred Stock Dividends. | |
| 21.1 * | Subsidiaries of Cherry Hill Mortgage Investment Corporation. | |
| 23.1* | Consent of Ernst & Young LLP. | |
| 31.1* | Certification of Principal Executive Officer pursuant to Rule 13a-14(a)/15d-14(a) of the Securities Exchange Act of 1934. | |
| 31.2* | Certification of Principal Financial Officer pursuant to Rule 13a-14(a)/15d-14(a) of the Securities Exchange Act of 1934. | |
| 32.1* | Certification of Principal Executive Officer pursuant to 18 U.S.C. Section 1350, as adopted pursuant to Section 906 of the Sarbanes-Oxley Act of 2002. | |
| 32.2* | Certification of Chief Financial Officer pursuant to 18 U.S.C. Section 1350, as adopted pursuant to Section 906 of the Sarbanes-Oxley Act of 2002. | |
| 101.INS* | XBRL Instance Document | |
| 101.SCH* | XBRL Taxonomy Extension Schema | |
| 101.CAL* | XBRL Taxonomy Extension Calculation Linkbase | |
| 101.DEF* | XBRL Taxonomy Definition Linkbase | |
| 101.LAB* | XBRL Taxonomy Extension Label Linkbase | |
| 101.PRE* | XBRL Taxonomy Extension Presentation Linkbase | |
| * | Filed herewith. |
94
Table of Contents
SIGNATURES
Pursuant to the requirements of Section 13 or 15(d) of the Securities Exchange Act of 1934, the registrant has duly caused this report to be signed on its behalf by the undersigned, thereunto duly authorized.
| Cherry Hill Mortgage Investment Corporation | ||||||||
| Date: March 13, 2015 | By: | /s/ Jeffrey Lown II | ||||||
| Name: | Jeffrey Lown II | |||||||
| Title: | President, Chief Investment Officer and Director (Principal Executive Officer) | |||||||
Pursuant to the requirements of the Securities Exchange Act of 1934, this report has been signed below by the following persons on behalf of the registrant and in the capacities and on the dates indicated.
| Date: March 13, 2015 | By: | /s/ Jeffrey Lown II | ||||||
| Name: | Jeffrey Lown II | |||||||
| Title: | President, Chief Investment Officer and Director (Principal Executive Officer) | |||||||
| Date: March 13, 2015 | By: | /s/ Martin Levine | ||||||
| Martin Levine | ||||||||
| Chief Financial Officer, Secretary and Treasurer Officer | ||||||||
| (Principal Financial Officer) | ||||||||
| Date: March 13, 2015 | By: | /s/ Stanley Middleman | ||||||
| Stanley Middleman | ||||||||
| Chairman | ||||||||
| Date: March 13, 2015 | By: | /s/ Joseph Murin | ||||||
| Joseph Murin | ||||||||
| Director | ||||||||
| Date: March 13, 2015 | By: | /s/ Jonathan Kislak | ||||||
| Jonathan Kislak | ||||||||
| Director | ||||||||
| Date: March 13, 2015 | By: | /s/ Robert Salcetti | ||||||
| Robert Salcetti | ||||||||
| Director | ||||||||