Attached files
| file | filename |
|---|---|
| EXCEL - IDEA: XBRL DOCUMENT - PLUS THERAPEUTICS, INC. | Financial_Report.xls |
| EX-31.1 - EXHIBIT 31.1 - PLUS THERAPEUTICS, INC. | ex31_1.htm |
| EX-32.1 - EXHIBIT 32.1 - PLUS THERAPEUTICS, INC. | ex32_1.htm |
| EX-3.1 - EXHIBIT 3.1 - PLUS THERAPEUTICS, INC. | ex3_1.htm |
| EX-23.1 - EXHIBIT 23.1 - PLUS THERAPEUTICS, INC. | ex23_1.htm |
| EX-31.2 - EXHIBIT 31.2 - PLUS THERAPEUTICS, INC. | ex31_2.htm |
UNITED STATES SECURITIES AND EXCHANGE COMMISSION
Washington, D.C. 20549
FORM 10-K
(Mark One)
| ☒ | ANNUAL REPORT PURSUANT TO SECTION 13 OR 15(d) OF THE SECURITIES EXCHANGE ACT OF 1934 |
For the fiscal year ended December 31, 2014
OR
| ☐ | TRANSITION REPORT PURSUANT TO SECTION 13 OR 15(d) OF THE SECURITIES EXCHANGE ACT OF 1934 |
For the transition period from to
Commission file number 001-34375
CYTORI THERAPEUTICS, INC.
(Exact name of Registrant as Specified in Its Charter)
|
DELAWARE
|
33-0827593
|
|
|
(State or Other Jurisdiction of Incorporation or Organization)
|
(I.R.S. Employer Identification No.)
|
|
|
3020 CALLAN ROAD, SAN DIEGO, CALIFORNIA
|
92121
|
|
|
(Address of principal executive offices)
|
(Zip Code)
|
Registrant’s telephone number, including area code: (858) 458-0900
Securities registered pursuant to Section 12(b) of the Act:
|
Title of each class
|
Name of each exchange on which registered
|
|
Common stock, par value $0.001
|
NASDAQ Stock Market LLC
|
Securities registered pursuant to Section 12(g) of the Act:
Preferred Stock Purchase Rights
Indicate by check mark if the registrant is a well-known seasoned issuer as defined in Rule 405 of the Securities Act. Yes ☐ No ☒
Indicate by check mark if the registrant is not required to file reports pursuant to Section 13 or Section 15(d) of the Exchange Act.
Yes ☐ No ☒
Indicate by check mark whether the registrant: (1) has filed all reports required to be filed by Section 13 or 15(d) of the Securities Exchange Act of 1934 during the preceding 12 months (or for such shorter period that the registrant was required to file such reports), and (2) has been subject to such filing requirements for the past 90 days.
Yes ☒ No ☐
Indicate by check mark whether the registrant has submitted electronically and posted on its corporate Web site, if any, every Interactive Data File required to be submitted and posted pursuant to Rule 405 of Regulation S-T (§232.405 of this chapter) during the preceding 12 months (or for such shorter period that the registrant was required to submit and post such files).
Yes ☒ No ☐
Indicate by check mark if disclosure of delinquent filers pursuant to Item 405 of Regulation S-K (§229.405 of this chapter) is not contained herein, and will not be contained, to the best of the registrant’s knowledge, in definitive proxy or information statements incorporated by reference in Part III of this Form 10-K or any amendment to this Form 10-K. ☒
Indicate by check mark whether the registrant is a large accelerated filer, an accelerated filer, a non-accelerated filer, or a smaller reporting company. See definitions of “large accelerated filer,” “accelerated filer” and “smaller reporting company” in Rule 12b-2 of the Exchange Act (Check one).
|
Large Accelerated Filer ☐
|
Accelerated Filer ☒
|
Non-Accelerated Filer ☐
|
Smaller reporting company ☐
|
|
(Do not check if a smaller reporting company)
|
|||
Indicate by check mark whether the registrant is a shell company (as defined in Rule 12b-2 of the Exchange Act). Yes ☐ No ☒
The aggregate market value of the common stock of the registrant held by non-affiliates of the registrant on June 30, 2014, the last business day of the registrant’s most recently completed second fiscal quarter, was $167,748,022 based on the closing sales price of the registrant’s common stock on June 30, 2014 as reported on the Nasdaq Global Market, of $2.39 per share.
As of February 28, 2015, there were 108,181,358 shares of the registrant’s common stock outstanding.
|
Page
|
||
|
PART I
|
||
|
Item 1.
|
3
|
|
|
Item 1A.
|
10
|
|
|
Item 1B.
|
24
|
|
|
Item 2.
|
24
|
|
|
Item 3.
|
24
|
|
|
Item 4.
|
24
|
|
|
PART II
|
||
|
Item 5.
|
25
|
|
|
Item 6.
|
27
|
|
|
Item 7.
|
29
|
|
|
Item 7A.
|
42
|
|
|
Item 8.
|
43
|
|
|
Item 9.
|
73
|
|
|
Item 9A.
|
73
|
|
|
Item 9B.
|
75
|
|
|
PART III
|
||
|
Item 10.
|
75
|
|
|
Item 11.
|
80
|
|
|
Item 12.
|
98
|
|
|
Item 13.
|
99
|
|
|
Item 14.
|
100
|
|
|
PART IV
|
||
|
Item 15.
|
101
|
PART I
References to “Cytori,” “we,” “us” and “our” refer to Cytori Therapeutics, Inc. and its consolidated subsidiaries. References to “Notes” refer to the Notes to Consolidated Financial Statements included herein (refer to Item 8).
CAUTIONARY STATEMENT REGARDING FORWARD-LOOKING STATEMENTS
This report contains certain statements that may be deemed “forward-looking statements” within the meaning of U.S. securities laws. All statements, other than statements of historical fact, that address activities, events or developments that we intend, expect, project, believe or anticipate and similar expressions or future conditional verbs such as will, should, would, could or may occur in the future are forward-looking statements. Such statements are based upon certain assumptions and assessments made by our management in light of their experience and their perception of historical trends, current conditions, expected future developments and other factors they believe to be appropriate.
These statements include, without limitation, statements about our anticipated expenditures, including those related to clinical research studies and general and administrative expenses; the potential size of the market for our products, future development and/or expansion of our products and therapies in our markets, our ability to generate product revenues or effectively manage our gross profit margins; our ability to obtain regulatory clearance; expectations as to our future performance; the “Liquidity and Capital Resources” section of this report, including our potential need for additional financing and the availability thereof; and the potential enhancement of our cash position through development, marketing, and licensing arrangements. Our actual results will likely differ, perhaps materially, from those anticipated in these forward-looking statements as a result of various factors, including: our need and ability to raise additional cash, our joint ventures, risks associated with laws or regulatory requirements applicable to us, market conditions, product performance, potential litigation, and competition within the regenerative medicine field, to name a few. The forward-looking statements included in this report are subject to a number of additional material risks and uncertainties, including but not limited to the risks described under the “Risk Factors” in Item 1A of Part I above, which we encourage you to read carefully.
We encourage you to read the risks described under “Risk Factors” carefully. We caution you not to place undue reliance on the forward-looking statements contained in this report. These statements, like all statements in this report, speak only as of the date of this report (unless an earlier date is indicated) and we undertake no obligation to update or revise the statements except as required by law. Such forward-looking statements are not guarantees of future performance and actual results will likely differ, perhaps materially, from those suggested by such forward-looking statements.
This Annual report on Form 10-K refers to trademarks such as Cytori Cell Therapy, Celution, Intravase, Puregraft and StemSource. Solely for convenience, our trademarks and tradenames referred to in this Form 10-K may appear without the ® or ™ symbols, but such references are not intended to indicate in any way that we will not assert, to the fullest extent under applicable law, our rights to these trademarks and tradenames.
General
Cytori Therapeutics (NASDAQ: CYTX) develops cellular therapeutics uniquely formulated and optimized for specific diseases and medical conditions. Our lead therapeutics are currently targeted for impaired hand function in scleroderma, osteoarthritis of the knee, anddeep thermal burns combined with radiation exposure.
Our cellular therapeutics are collectively known by the trademarked name, Cytori Cell TherapyTM, and consist of a heterogeneous population of specialized cells including stem cells that are involved in response to injury, repair and healing. These cells are extracted from an adult patient’s own adipose (fat) tissue using our fully automated, enzymatic, sterile Celution® System devices and consumable sets at the place where the patient is receiving their care (i.e. there is no off-site processing or manufacturing). Cytori Cell Therapy can either be administered to the patient the same day or banked for future use. An independent published study has demonstrated that our proprietary process results in higher nucleated cell viability, less residual enzyme activity, less processing time, and improved economics in terms of cell progenitor output compared to other semi-automated and automated processes available.
Our goal is to bring Cytori Cell Therapy to market first for treatment of impaired hand function in scleroderma and osteoarthritis of the knee, through Cytori-sponsored clinical development efforts. We received Investigational Device Exemption (IDE) approval from the U.S. Food and Drug Administration (FDA) in late 2014 and in early 2015 initiated both osteoarthritis and scleroderma studies. In addition, we are developing a treatment for thermal burns combined with radiation injury under a contract from the Biomedical Advanced Research Development Authority (BARDA), a division of the U.S. Department of Health and Human Services. We are also exploring other development opportunities in a variety of other conditions.
In addition to our targeted therapeutic development, we have continued to commercialize the Celution® System under select medical device approvals, clearances and registrations to research customers developing new therapeutic applications for Cytori Cell Therapy in Europe, Japan, and other regions. The sale of systems, consumables and ancillary products in advance of specific regulatory claims and reimbursement contributes a margin that partially offset our operating expenses and play a role in fostering familiarity within the medical community with our technology. These sales have also facilitated the discovery of new applications for Cytori Cell Therapy by customers conducting investigator-initiated and funded research.
Scleroderma
In January 2015, the FDA granted unrestricted IDE approval for a pivotal clinical trial, named the “STAR” trial, to evaluate Cytori Cell Therapy as a potential treatment for impaired hand function in scleroderma, a rare autoimmune disease affecting approximately 50,000 patients in the U.S. The STAR trial is a 48 week, randomized, double blind, placebo-controlled pivotal clinical trial of 80 patients in the U.S. The trial evaluates the safety and efficacy of a single administration of Cytori Cell Therapy (ECCS-50) in scleroderma patients affecting the hands and fingers. The STAR trial plans to use the Cochin hand score, a validated measure of hand function, as the primary endpoint measured at six months after a single administration of ECCS-50 or placebo. Patients in the placebo group will be eligible for crossover to the active arm of the trial after all patients have completed 48 weeks of follow up. In February 2015, the FDA approved our request to increase the number of investigational sites from 12 to up to 20. The increased number of sites is anticipated to broaden the geographic coverage of the trial and facilitate trial enrollment. The trial is expected to initiate in mid-2015.
The STAR trial is predicated on a completed pilot phase I/II trial performed in France termed SCLERADEC-I. The results were published in the Annals of the Rheumatic Diseases in May 2014 and demonstrate approximately a 50 percent improvement at six months across four important and validated endpoints used to assess the clinical status in patients with scleroderma with impaired hand function. Patients perceived their health status to be improved as shown by a 45·2% and 42·4% decrease of the Scleroderma Health Assessment Questionnaire (SHAQ) at month 2 (p=0·001) and at month 6 (p=0·001) respectively. A 47·4% and 56·0% decrease of the Cochin Hand Function Scale (CHFS) at month 2 and month 6 in comparison to baseline was observed (p<0·001 for both). Grip strength increased at month 6 with a mean improvement of +4.8±6.4 kg for the dominant hand (p=0.033) and +4.0±3.5 kg for the non-dominant hand (p=0.002). Similarly, an increase in pinch strength at month 6 was noted with a mean improvement of +1.0±1.1 kg for the dominant hand (p=0.009) and +0.8±1.2 kg for the non-dominant hand (p=0.050). Among subjects having at least one digital ulcer (DU) at inclusion, total number of DU decreased, from 15 DUs at baseline, 10 at month 2 and 7 at month 6. The average reduction of the Raynaud’s Condition Score from baseline was 53.7% at month 2 (p<0.001) and 67.5% at month 6 (p<0.001). Hand pain showed a significant decrease of 37.8% at month 2 (p=0.001) and 41.7% at month 6 (p<0.001).
In 2014, in conjunction with by Dr’s Guy Magalon and Brigette Granel, Cytori has submitted a study for review for a follow pivotal/phase III randomized, double-blind, placebo controlled trial in France called SCLERDEC II. Patients will be followed for 6 months post-procedure.
Scleroderma is a chronic autoimmune disorder associated with fibrosis of the skin, destructive changes in blood vessels and multiple organ systems as the result of a generalized overproduction of collagen. Scleroderma affects women four times more frequently than men and is typically detected between the ages of 30 and 50. More than 90 percent of scleroderma patients have hand involvement that is typically progressive and can result in chronic pain, blood flow changes and severe dysfunction. The limited available treatments for scleroderma may provide some benefit but do little to modify disease progression or substantially improve symptoms. Treatment options are directed at protecting the hands from injury and detrimental environmental conditions as well as the use of vasodilators. When the disease is advanced, immunosuppressive and other medications may be used but are often accompanied by intolerable side effects.
The STAR trial is predicated on a completed pilot trial performed in France. The results were published in the Annals of the Rheumatic Diseases in May 2014 and demonstrated approximately a 50 percent improvement at six months across four important and validated endpoints used to assess the clinical status in patients with scleroderma with impaired hand function.
Osteoarthritis
In the later part of 2014, Cytori received approval by the FDA to begin a U.S. IDE pilot (phase IIa/b) trial of Cytori Cell Therapy in patients with osteoarthritis of the knee. The trial, called ACT-OA, is a 90 patient, randomized, double-blind, placebo control study involving two dose escalations of Cytori Cell Therapy (ECCO-50), a low dose and a high dose, conducted over 48 weeks. The randomization is 1:1:1 between the control, low dose and high dose groups. The primary end point will be pain on walking as measured by the Knee Injury and Osteoarthritis Outcome Score (KOOS score) at twelve weeks. Additional endpoints include the full KOOS questionnaire, magnetic resonance imaging (MRI) and adverse events. The trial enrolled the first patient in February 2015.
Osteoarthritis is a disease of the entire joint involving the cartilage, joint lining, ligaments, and underlying bone. The breakdown of tissue leads to pain, joint stiffness and reduced function. It is the most common form of arthritis and affects an estimated 13.9% of US adults over the age of 25, and 33.6% of adults over the age of 65. Current treatments include physical therapy, non-steroidal anti-inflammatory medications, viscosupplement injections, and total knee replacement. A substantial medical need exists as present medications have limited efficacy and joint replacement is a relatively definitive treatment for those with the most advanced disease.
Cutaneous and Soft Tissue Thermal and Radiation Injuries
Cytori Cell Therapy (DCCT-10) is also being developed for the treatment of thermal burns combined with radiation injury. In the third quarter of 2012, we were awarded a contract to develop a new countermeasure for thermal burns valued at up to $106 million with BARDA.
The initial base period included $4.7 million over two years for preclinical research and additional development support for Cytori’s Celution® System. The additional contract options, if fully executed, could cover our clinical development through FDA approval under a device-based pre-market approval application (PMA) regulatory pathway. We submitted reports to BARDA in late 2013 detailing the completion of the objectives in the initial contract. An In-Process Review Meeting in the first half of 2014 confirmed completion of the proof of concept phase.
In August and December, 2014, BARDA awarded contract options with us worth approximately $14 million. The options allow for continuation of research, regulatory, clinical, and other activities required for approval and completion of a pilot clinical trial using Cytori Cell Therapy (DCCT-10) for the treatment of thermal burns combined with radiation injury. The award for conducting the pilot trial, approximately $8 million, would follow FDA approval of the trial protocol and associated documentation. Once the pilot trial is analyzed, the final phase would include research, regulatory, and clinical activities necessary to achieve regulatory clearances for treatment of combined injury involving thermal burn and radiation exposure. A pivotal clinical trial of Cytori Cell Therapy (DCCT-10) for thermal burn injury would be the primary basis for FDA approval. The total award is intended to support all clinical, preclinical, regulatory, and technology development activities needed to complete the FDA approval process for use in thermal burn injury under a device-based PMA regulatory pathway.
Other Clinical Indications
In 2014, we truncated enrollment at 31 patients in the U.S. ATHENA trials for chronic heart failure as a result of a variety of enrollment delays.. The company intends to review 6 and 12 month data in 2015 and with the analysis, determine if further development work in the cardiovascular area is warranted. In addition to the Company-sponsored clinical work on the ATHENA trial, Cytori Cell Therapy (OICH-D3) is available on a limited commercial basis for vascular conditions in several countries outside of North America.
Another therapeutic target under evaluation is stress urinary incontinence in men following removal of the prostate gland (radical prostatectomy), which is based on positive data reported in a peer reviewed journal. A study is currently being planned in Japan and anticipated to begin this year. This study will receive substantial support from Japan’s Ministry of Health, Labour and Welfare (MHLW).
Sales & Marketing
Cytori Cell TherapyTM
A majority of Cytori’s product revenue in 2014 was derived from Japan. New cell therapy regulations in Japan, may reduce regulatory uncertainties and provide greater clarity for the Company moving forward. Besides revenue, these sales provide strategic value for us through the investigator relationships that are built, clinical data that is compiled and the global visibility generated. In Europe, Celution® System has CE mark approval for select indications. Our European customers include hospitals and clinics as well as researchers performing investigator-initiated and funded studies.
Cytori Cell and Tissue Banking
We currently market Cytori Cell and Tissue Banking to hospitals, clinics, tissue banks, and stem cell banking companies worldwide through a combination of distributors and direct sales. The solution encompasses three configurations that are available on a regionally specific basis: cell banking, cell and adipose tissue banking, or adipose tissue banking alone. We remain responsible for manufacturing and sourcing all necessary equipment, including but not limited to cryopreservation chambers, cooling and thawing devices, cell banking protocols and the proprietary software and database application.
Refer to Note 2 of the Notes to Consolidated Financial Statements for a discussion of geographical concentration of sales.
Customers
In Japan, Europe, Middle East, Asia-Pacific, and Latin America we offer Cytori Cell Therapy and Cytori Cell and Tissue Banking through direct sales reps, distributors, and partners, including Lorem Vascular Pty. Ltd. (Lorem Vascular), hospitals, clinics, and researchers performing investigator-initiated and funded studies.
Manufacturing and Raw Materials
Our products are currently manufactured at the Company’s headquarters in San Diego, CA and in Wales, United Kingdom. Our manufacturing capabilities are expected to enable us to meet anticipated demand in 2015. We are, and the manufacturer of any future therapeutic products would be, subject to periodic inspection by regulatory authorities and distribution partners. The manufacturer of devices and products for human use is subject to regulation and inspection from time to time by the FDA for compliance with the FDA’s Quality System Regulation, or QSR, requirements, as well as equivalent requirements and inspections by state and non-U.S. regulatory authorities, such as our Notified Body in Europe.
Most of the raw materials required to manufacture the Celution® System family of products are commonly available from multiple sources, and we have identified and executed supply agreements with our preferred vendors. Some specialty components are custom made for us, and we are dependent on the ability of these suppliers to deliver functioning parts or materials in a timely manner to meet the ongoing demand for our products. There can be no assurance that we will be able to obtain adequate quantities of the necessary raw materials supplies within a reasonable time or at commercially reasonable prices. Interruptions in supplies due to price, timing, or availability or other issues with our suppliers could have a negative impact on our ability to manufacture products.
Competition
The field of regenerative medicine is expanding rapidly, in large part through the development of cell-based therapies and/or devices designed to isolate cells from human tissues. As the field grows, we face, and will continue to face, increased competition from pharmaceutical, biopharmaceutical, medical device and biotechnology companies, as well as academic and research institutions and governmental agencies in the United States and abroad. Most regenerative medicine efforts involve sourcing adult stem and regenerative cells from tissues such as bone marrow, placental tissue, umbilical cord and peripheral blood, and skeletal muscle. However, a growing number of companies are using adipose tissue as a cell source. We exclusively use adipose tissue as a source of adult stem and regenerative cells.
With the growing number of companies working in the cell therapy field, we are forced to compete across several areas, including equity and capital, clinical trial sites, enrollment of patients in clinical trials, corporate partnerships, skilled and experienced personnel and commercial market share. Some of our competitors and potential competitors have substantially greater financial, technological, research and development, marketing, and personnel resources than we do. We cannot with any accuracy forecast when or if these companies are likely to bring cell therapies to market for indications such as scleroderma, osteoarthritis, and thermal burns which we are also pursuing.
Companies researching and developing cell-based therapies for our lead indications include, but are not limited to, Aastrom Biosciences, Arteriocyte, Cellular Biomedicine Group, GID Group, Medistem, Mesoblast, Osiris, Regeneus, Stempeutics, Tissue Genesis and Vericel. These companies are in various stages of clinical development for their respective cell therapies. In addition, we are aware of several surgeons who are performing autologous fat transfers using manual methods, some of whom enrich the fat with autologous adipose-derived cells. In 2014 the FDA released several guidances which are anticipated to limit the availability of non-FDA approved cell therapies including those derived from adipose tissue. FDA has issued specific guidance on the use of cells from adipose tissue. Specifically, FDA has indicated that the process of separating the stromal vascular fraction from adipose tissue is considered a regulated process and such cells are considered drugs that would need FDA oversight prior to use on humans. It is these same stromal vascular cells that are produced by the Celution device. Since Cytori has previously initiated a regulatory pathway with FDA that is consistent with this new public announcement (PMA pathway for Celution System), the regulatory impact to Cytori is minimal and confirmatory in nature. However, the regulatory impact for Cytori competitors is unknown as the full impact of these new FDA guidelines are not known.
We expect to compete based on, among other things, the clinical safety, clinical efficacy, regulatory approvals, and cost effectiveness of our solutions. We also believe the newly announced FDA policies on the selection of stromal vascular fraction cells from adipose cells are favorable for Cytori Celution System given the fact that Cytori had previously initiated a regulatory pathway that is consistent with these new FDA announcements.
Research and Development
Research and development expenses were $15,105,000, $17,065,000 and $13,628,000 for the years ended December 31, 2014, 2013 and 2012, respectively. These expenses have supported the basic research, product development and clinical activities necessary to bring our products to market.
Our research and development efforts in 2014 focused predominantly on the following areas:
| · | Supported enrollment in the ATHENA and ATHENA II trials; |
| · | Supported ongoing preclinical and other research activities towards BARDA contract milestones; |
| · | Continued patient follow-up and data analysis from the European ADVANCE trial assessing the effect of Cytori Cell Therapy compared to a placebo control in patients with chronic myocardial ischemia; |
| · | Supported FDA submission and approval of the STAR (scleroderma) and ACT-OA (osteoarthritis) trials; |
| · | Prepared and submitted multiple regulatory filings in the United States, Europe, Japan, and other regions related to various cell and tissue processing systems under development; |
| · | Developed new configurations and expanded functionality of our Celution® platform to address the current Japan approval as a medical device (Japan Class I) and other markets; |
| · | Conducted adipose derived regenerative cells (ADRC) viability and transport studies in support of clinical trial requirements; |
| · | Conducted, presented, and published research efforts related to ADRC characterization and potency to further establish scientific leadership in the field; and |
| · | Continued to optimize and develop the Celution® System family of products and next-generation devices, single-use consumables and related instrumentation. |
Intellectual Property
Our success depends in large part on our ability to protect our proprietary technology, including the Celution® System product platform, and to operate without infringing on the proprietary rights of third parties. We rely on a combination of patent, trade secret, copyright and trademark laws, as well as confidentiality agreements, licensing agreements and other agreements, to establish and protect our proprietary rights. Our success also depends, in part, on our ability to avoid infringing patents issued to others. If we were judicially determined to be infringing on any third party patent, we could be required to pay damages, alter our products or processes, obtain licenses or cease certain activities.
To protect our proprietary medical technologies, including the Celution® System platform and other scientific discoveries, Cytori has over 75 issued patents worldwide. We have 22 issued U.S. patents and 54 issued international patents. Of the 22 issued U.S. patents, 3 were issued in 2014. Of the 54 issued international patents, 6 were issued 2014. In addition, we have over 45 patent applications pending worldwide related to our technology. We are seeking additional patents on methods and systems for processing adipose-derived stem and regenerative cells, on the use of adipose-derived stem and regenerative cells for a variety of therapeutic indications, including their mechanisms of actions, on compositions of matter that include adipose-derived stem and regenerative cells, and on other scientific discoveries. We are also the exclusive, worldwide licensee of the Regents of the University of California’s rights to a portfolio related to isolated adipose derived stem cells, which includes one US patent and twelve foreign patents.
We cannot assure that any of our pending patent applications will be issued, that we will develop additional proprietary products that are patentable, that any patents issued to us will provide us with competitive advantages or will not be challenged by any third parties or that the patents of others will not prevent the commercialization of products incorporating our technology. Furthermore, we cannot assure that others will not independently develop similar products, duplicate any of our products or design around our patents. U.S. patent applications are not immediately made public, so we might be surprised by the grant to someone else of a patent on a technology we are actively using.
There is a risk that any patent applications that we file and any patents that we hold or later obtain could be challenged by third parties and declared invalid or infringing of third party claims. For many of our pending applications, patent interference proceedings may be instituted with the U.S. Patent and Trademark Office (USPTO) when more than one person files a patent application covering the same technology, or if someone wishes to challenge the validity of an issued patent. At the completion of the interference proceeding, the USPTO will determine which competing applicant is entitled to the patent, or whether an issued patent is valid. Patent interference proceedings are complex, highly contested legal proceedings, and the USPTO’s decision is subject to appeal. This means that if an interference proceeding arises with respect to any of our patent applications, we may experience significant expenses and delay in obtaining a patent, and if the outcome of the proceeding is unfavorable to us, the patent could be issued to a competitor rather than to us. Third parties can file post-grant proceedings in the USPTO. Seeking to have issued patent invalidated, within nine months of issuance. This means that patents undergoing post-grant proceedings may be lost, or some or all claims may require amendment or cancellation, if the outcome of the proceedings is unfavorable to us. Post-grant proceedings are complex and could result in a reduction or loss of patent rights.
Patent law outside the United States is uncertain and in many countries is currently undergoing review and revisions. The laws of some countries may not protect our proprietary rights to the same extent as the laws of the United States. Third parties may attempt to oppose the issuance of patents to us in foreign countries by initiating opposition proceedings. Opposition proceedings against any of our patent filings in a foreign country could have an adverse effect on our corresponding patents that are issued or pending in the U.S. It may be necessary or useful for us to participate in proceedings to determine the validity of our patents or our competitors’ patents that have been issued in countries other than the United States. This could result in substantial costs, divert our efforts and attention from other aspects of our business, and could have a material adverse effect on our results of operations and financial condition. We currently have pending patent applications or issued patents in Europe, Brazil, Mexico, India, Russia, Australia, Japan, Canada, China, Korea, and Singapore, among others.
In addition to patent protection, we rely on unpatented trade secrets and proprietary technological expertise. We cannot assure you that others will not independently develop or otherwise acquire substantially equivalent techniques, somehow gain access to our trade secrets and proprietary technological expertise or disclose such trade secrets, or that we can ultimately protect our rights to such unpatented trade secrets and proprietary technological expertise. We rely, in part, on confidentiality agreements with our marketing partners, employees, advisors, vendors and consultants to protect our trade secrets and proprietary technological expertise. We cannot assure you that these agreements will not be breached, that we will have adequate remedies for any breach or that our unpatented trade secrets and proprietary technological expertise will not otherwise become known or be independently discovered by competitors.
Government Regulation
As medical devices that yield cells with therapeutic potential, our products must receive regulatory clearances or approvals from the European Union, the FDA and, from other applicable governments prior to their sale. Our current and future Celution® Systems are or will be subject to stringent government regulation in the United States by the FDA under the Federal Food, Drug and Cosmetic Act. The FDA regulates the design/development process, clinical testing, manufacture, safety, labeling, sale, distribution, and promotion of medical devices and drugs. Included among these regulations are pre-market clearance and pre-market approval requirements, design control requirements, and the Quality System Regulations/Good Manufacturing Practices. Other statutory and regulatory requirements govern, among other things, registration and inspection, medical device listing, prohibitions against misbranding and adulteration, labeling and post-market reporting.
The Celution® System family of products must also comply with the government regulations of each individual country in which the products are to be distributed and sold. These regulations vary in complexity and can be as stringent, and on occasion even more stringent, than FDA regulations in the United States. International government regulations vary from country to country and region to region. For example, regulations in some parts of the world only require product registration while other regions/countries require a complex product approval process. Due to the fact that there are new and emerging cell therapy and cell banking regulations that have recently been drafted and/or implemented in various countries around the world, the application and subsequent implementation of these new and emerging regulations have little to no precedence. Therefore, the level of complexity and stringency is not always precisely understood today for each country, creating greater uncertainty for the international regulatory process. Furthermore, government regulations can change with little to no notice and may result in up-regulation of our product(s), thereby, creating a greater regulatory burden for our cell processing and cell banking technology products.
Worldwide, the regulatory process can be lengthy, expensive, and uncertain with no guarantee of approval. Before any new medical device may be introduced to the U.S. market, the manufacturer generally must obtain FDA clearance or approval through either the 510(k) pre-market notification process or the lengthier pre-market approval application (PMA) process, which requires clinical trials to generate clinical data supportive of safety and efficacy. Approval of a PMA could take four or more years from the time the process is initiated. Our core Celution® System processing device products under development are generally subject to the lengthier PMA process for many specific applications. Failure to comply with applicable requirements can result in application integrity proceedings, fines, recalls or seizures of products, injunctions, civil penalties, total or partial suspensions of production, withdrawals of existing product approvals or clearances, refusals to approve or clear new applications or notifications, and criminal prosecution.
Specifically, regulation of the Celution® System in Europe and the U.S. for use in cardiovascular disease requires that we conduct clinical trials to collect safety and efficacy data to support marketing approvals. We have completed a pilot study in Europe for acute myocardial infarction. We completed a pilot study for chronic myocardial ischemia in Europe and based on the data are seeking a limited approval in Europe. In the U.S., we are currently following 31 patients in the ATHENA trials for refractory heart failure under the device regulations via the PMA pathway.
Summary of Celution®System Family Regulatory Status
|
Region
|
Clinical Applications
|
Regulatory Status
|
|
Japan
|
Cell Banking
|
Approved
|
|
Celution® Centrifuge, Celbrush, Puregraft Bag and select components.
|
Class I Notification
|
|
|
Europe
|
Celution® 800 and Celution One: Cell Processing for re-implantation or re-infusion into same patient (General Processing)
|
CE Mark
|
|
Celution® 800 and Celution One: Breast reconstruction, healing of Crohn’s wounds and other cosmetic procedures
|
CE Mark
|
|
|
Celution® 800: Cryptoglandular fistula, tissue ischemia and other soft tissue procedures
|
CE Mark
|
|
|
Intravase® for use with Celution® 800
|
CE Mark
|
|
|
Cell Concentration
|
CE Mark
|
|
|
Celution® One cosmetic and reconstructive surgery claims
|
CE Mark
|
|
|
U.S.
|
Osteoarthritis
|
ACT-OA trial being initiated
|
|
U.S.
|
Scleroderma
|
STAR (full IDE approval granted in January 2015)
|
|
U.S.
|
Refractory Heart Failure
|
ATHENA and ATHENA II IDE trial underway
|
|
Australia
|
Celution 800 Cell Processing for re-implantation or re-infusion into same patient (general/plastic reconstruction), Puregraft, Instrument Sets
|
ARTG Certificate
|
|
Croatia
|
Celution 800 Cell Processing for re-implantation or re-infusion into same patient (general/plastic reconstruction), Puregraft
|
Approval Certificated from the Croatia Agency for Medicinal Products and Medical Devices
|
|
New Zealand
|
Celution 800, Puregraft, Instrument Sets
|
WAND Registered
|
|
Russia
|
Celution 800 Cell Processing for re-implantation or re-infusion into same patient (general/plastic reconstruction), Puregraft
|
Roszdravnadzor Certificate (Federal Service for Control of Healthcare and Social Development)
|
|
Serbia
|
Celution 800 Cell Processing for re-implantation or re-infusion into same patient (general/plastic reconstruction), Puregraft
|
ALIMS (Medicines and Medical Devices Agency of Serbia)
|
|
Singapore
|
Celution 800 Cell Processing for re-implantation or re-infusion into same patient (general/plastic reconstruction), Puregraft
|
HSA approved, SMDR Registered
|
Medical devices are also subject to post-market reporting requirements for deaths or serious injuries when the device may have caused or contributed to the death or serious injury, and for certain device malfunctions that would be likely to cause or contribute to a death or serious injury if the malfunction were to recur. If safety or effectiveness problems occur after the product reaches the market, the FDA may take steps to prevent or limit further marketing of the product. Additionally, the FDA actively enforces regulations prohibiting marketing and promotion of devices for indications or uses that have not been cleared or approved by the FDA. In addition, modifications or enhancements of products that could affect the safety or effectiveness or effect a major change in the intended use of a device that was either cleared through the 510(k) process or approved through the PMA process may require further FDA review through new 510(k) or PMA submissions.
We must comply with extensive regulations from foreign jurisdictions regarding safety, manufacturing processes and quality. These regulations, including the requirements for marketing and authorization may differ from the FDA regulatory scheme in the United States.
Employees
As of December 31, 2014, we had 78 full-time employees. These employees are comprised of 12 employees in manufacturing, 30 employees in research and development, 13 employees in sales and marketing and 23 employees in management, finance and administration. From time to time, we also employ independent contractors to support our operations. Our employees are not represented by any collective bargaining agreements and we have never experienced an organized work stoppage.
Corporate Information and Web Site Access to SEC Filings
We were initially formed as a California general partnership in July 1996, and incorporated in the State of Delaware in May 1997. We were formerly known as MacroPore Biosurgery, Inc., and before that as MacroPore, Inc. Our corporate offices are located at 3020 Callan Road, San Diego, CA 92121. Our telephone number is (858) 458-0900. We maintain an Internet website at www.cytori.com. Through this site, we make available free of charge our annual reports on Form 10-K, quarterly reports on Form 10-Q, current reports on Form 8-K, and amendments to those reports filed or furnished pursuant to Section 13(a) of the Securities Exchange Act of 1934 as soon as reasonably practicable after we electronically file such material with, or furnish it to, the U.S. Securities and Exchange Commission (SEC). In addition, we publish on our website all reports filed under Section 16(a) of the Securities Exchange Act by our directors, officers and 10% stockholders. These materials are accessible via the Investor Relations—Reports and Filings section of our website within the “SEC Filings” link. Some of the information is stored directly on our website, while other information can be accessed by selecting the provided link to the section on the SEC website, which contains filings for our company and its insiders.
The public can also obtain any documents that we file with the SEC at http://www.sec.gov. The public may read and copy any materials that we file with the SEC at the SEC’s Public Reference Room at 100 F Street, N.E., Room 1580, Washington, D.C. 20549. The public may obtain information on the operation of the Public Reference Room by calling the SEC at 1-800-SEC-0330.
In analyzing our company, you should consider carefully the following risk factors together with all of the other information included in this Annual Report on Form 10-K, including our unaudited Consolidated Financial Statements and the related notes and “Management’s Discussion and Analysis of Financial Conditions and Results of Operations”. If any of the risks described below occur, our business, operating results, and financial condition could be adversely affected and the value of our common stock could decline.
Risks Related to Our Business
We will need to raise more cash in the future
We have almost always had negative cash flows from operations. Our business will continue to result in a substantial requirement for research and development expenses for several years, during which we may not be able to bring in sufficient cash and/or revenues to offset these expenses. We have had, and we will continue to have, an ongoing need to raise additional cash from outside sources to continue funding our operations to profitability. We do not currently believe that our cash balance and the revenues from our operations will be sufficient to fund the development and marketing efforts required to reach profitability without raising additional capital from accessible sources of financing in the very near future.
To date, these operating losses have been funded primarily from outside sources of invested capital and gross profits. We have had, and we will likely continue to have, an ongoing need to raise additional cash from outside sources to fund our future operations. However, our ability to raise capital was adversely affected once FDA put a hold on our Athena trials in mid-2014, which had an adverse impact to stock price performance and our corresponding ability to restructure our debt. If we are unsuccessful in our efforts to raise outside capital in the near term, we will be required to significantly reduce our research, development, and administrative operations, including reduction of our employee base, in order to offset the lack of available funding. We expect to continue to utilize our cash and cash equivalents to fund operations at least through June of 2015, subject to minimum cash and cash liquidity requirements of the Loan and Security Agreement with the Lenders, which requires that we maintain at least three months of cash on hand to avoid an event of default under the Loan and Security Agreement.
We have been placing, and will continue to place, significant effort into restructuring our current Loan Agreement with Oxford Finance LLC and Silicon Valley Bank, and raising additional capital that will provide adequate capital resources to allow us to continue to fund our future operations. Based on our cash and cash equivalents on hand of approximately $15 million at December 31, 2014, and our minimum liquidity requirements of the Loan Agreement that require us to make principal and interest payments of $1,003,000 per month beginning in April 2015 and our obligation to maintain at least three months of cash on hand, we must raise additional capital and/or obtain a waiver or restructure our Loan Agreement on or before May 2015 to avoid an event of default under our Loan Agreement. If we are unable to avoid an event of default under the Loan Agreement the lender would have the right to cause the outstanding loan amount of approximately $27 million to become immediately due and payable. Our financing plans include pursuing additional cash through strategic corporate partnerships, licensing, sales of equity, and refinancing of our Loan Agreement or modify the terms of the existing Loan Agreement. While we have an established history of raising capital through these platforms, and we are currently involved in negotiations with multiple parties, there is no guarantee that adequate funds will be available when needed from additional debt or equity financing, development and commercialization partnerships or from other sources, or on terms acceptable to us. There is also no guarantee that that we will be able to refinance our existing debt, or that our lender would agree to a modification of the Loan Agreement on terms that are acceptable to us. If our efforts to obtain sufficient additional funds are not successful, in addition to the lender’s ability to cause the loan amount to be immediately due and payable, we would at a minimum be required to delay, scale back, or eliminate some or all of our research or product development, manufacturing operations, administrative operations, including our employee base, and clinical or regulatory activities, which could negatively affect our ability to achieve certain corporate goals. In addition, the indebtedness under our Loan Agreement is secured by a security interest in substantially all of our existing and after-acquired assets, including our intellectual property assets, and therefore, if we are unable to repay such indebtedness, the lenders could foreclose on these assets, which would, at a minimum, have a severe material adverse effect on our ability to operate our business.
In addition to the funding sources previously mentioned, we continue to seek additional capital through product revenues, strategic transactions, IP licensing, and State and Federal development programs, including additional funding opportunities though our current BARDA contract.
Our level of indebtedness, and covenant restrictions under such indebtedness, could adversely affect our operations and liquidity
On June 28, 2013 we entered into our Loan Agreement with Oxford Finance LLC and Silicon Valley Bank (together, the “Lenders”), pursuant to which the Lenders funded an aggregate principal amount of $27.0 million (“Term Loan”), subject to the terms and conditions set forth in the Loan Agreement. The Term Loan accrues interest at a fixed rate of 9.75% per annum. Pursuant to the Loan Agreement, we were required to make interest only payments through July 1, 2014. On September 19, 2014, we entered into a letter agreement with the Lenders (the “Letter Agreement”) pursuant to which we received a waiver of compliance with the Loan Agreement through October 31, 2014. On June 5, 2014 we entered into a First Amendment to the Loan Agreement which modified the definition of Permitted Investments to allow the Company to establish and invest up to $500,000 per year in its wholly owned Subsidiary in the United Kingdom (Cytori Ltd.). On September 29, 2014 we entered into a Second Amendment to the Loan Agreement with the Lenders wherein we were provided a conditional waiver of principal payments subject to meeting certain capital raise requirements, which we achieved in October 2014. Pursuant to the Second Amendment to the Loan Agreement we obtained a deferral of principal payments from November 1, 2014 through April 1, 2015 and thereafter we are required to make payments of principal and accrued interest in equal monthly installments (of approximately$1,003,000) sufficient to amortize the Term Loans through the maturity date.
Our indebtedness could adversely affect our operations and liquidity, by, among other things:
| · | causing us to use a larger portion of our cash flow to fund interest and principal payments, reducing the availability of cash to fund working capital and capital expenditures and other business activities; |
| · | making it more difficult for us to take advantage of significant business opportunities, such as acquisition opportunities, and to react to changes in market or industry conditions; and |
| · | limiting our ability to borrow additional monies in the future to fund working capital, capital expenditures and other general corporate purposes. |
The Loan Agreement requires us to maintain at least three months of cash on hand and includes certain reporting and other covenants, that, among other things, restrict our ability to: (i) dispose of assets, (ii) change the business we conduct, (iii) make acquisitions, (iv) engage in mergers or consolidations, (v) incur additional indebtedness, (vi) create liens on assets, (vii) maintain any collateral account, (viii) pay dividends, (ix) make investments, loans or advances, (x) engage in certain transactions with affiliates, and (xi) prepay certain other indebtedness or amend other financing arrangements. If we fail to comply with any of these covenants or restrictions, such failure may result in an event of default, which if not cured or waived, could result in the lenders accelerating the maturity of our indebtedness. If the maturity of our indebtedness is accelerated, we may not have sufficient cash resources to satisfy our debt obligations and such acceleration would adversely affect our business and financial condition.
In addition, the indebtedness under our Loan Agreement is secured by a security interest in substantially all of our existing and after-acquired assets, including our intellectual property assets, and therefore, if we are unable to repay such indebtedness, the Lenders could foreclose on these assets, which would, at a minimum, have a severe material effect on our ability to operate our business.
We could be delisted from NASDAQ, which could seriously harm the liquidity of our stock and our ability to raise capital
On October 30, 2014 we received a letter from the Listing Qualifications staff of The NASDAQ Stock Market LLC (“Nasdaq”) indicating that, based upon the closing bid price of the our common stock for the last 30 consecutive business days, we no longer meet the requirement to maintain a minimum bid price of $1 per share, as set forth in Nasdaq Listing Rule 5450(a)(1). Subsequently we regained compliance with this listing rule and the matter was closed by Nasdaq. If we were not able to regain compliance within the 180 day time period prescribed by Nasdaq, or if we were to fall out of compliance with this rule once again , and if it appears to the Nasdaq Staff that we would not be able to cure the deficiency in a timely manner, or if we are then otherwise not eligible, Nasdaq would provide us notice that our common stock is subject to delisting.
On November 20, 2014 we received a second letter from Nasdaq indicating that, based upon the Market Value of Listed Securities (MVLS) for our common stock for the last 30 consecutive business days, we no longer meet the requirement to maintain a minimum MVLS of $50,000,000, as set forth in Nasdaq Listing Rule 5450(b)(2)(a). Subsequently we regained compliance with this listing rule and the matter was closed by Nasdaq. If we were not able to regain compliance, or if we were to fall out of compliance with this rule once again, and we were not able to regain compliance within 180 calendar days, then we may be subject to delisting, or be forced to transfer to a less desirable trading market within Nasdaq.
There can be no assurance that we will be able to maintain compliance with the minimum bid price requirement or the MVLS requirement, or maintain compliance with the other listing requirements, or that we will be eligible for listing on any comparable trading market. The effects of losing the Nasdaq listing could materially harm our ability to raise additional capital.
Continued turmoil in the economy could harm our business
Negative trends in the general economy, including trends resulting from an actual or perceived recession, tightening credit markets, increased cost of commodities, including oil, actual or threatened military action by the United States and threats of terrorist attacks in the United States and abroad, could cause a reduction of investment in and available funding for companies in certain industries, including ours and our customers. Our ability to raise capital has been and may in the future be adversely affected by downturns in current credit conditions, financial markets and the global economy.
We have never been profitable on an operational basis and expect significant operating losses for at least the next one to two years
We have incurred net operating losses in each year since we started business. As our focus on Cytori Cell Therapy, the Celution® System platform and development of therapeutic applications for Cytori Cell Therapy has increased, losses have resulted primarily from expenses associated with research and development activities and general and administrative expenses. While we have implemented and continue implement cost reduction measures where possible, we nonetheless expect to continue operating in a loss position on a consolidated basis and that recurring operating expenses will be at high levels for at least the next one to two years, in order to perform clinical trials, additional pre-clinical research, product development, and marketing. As a result of our historic losses, we have been, and are likely to continue to be, reliant on raising outside capital to fund our operations.
Our business strategy is high-risk
We are focusing our resources and efforts primarily on development of the Celution® System family of products and the therapeutic applications of its cellular output, which requires extensive cash needs for research, development, and commercialization activities. This is a high-risk strategy because there is no assurance that our future products will ever become commercially viable (commercial risk), that we will prevent other companies from depriving us of market share and profit margins by selling products based on our inventions and developments (legal risk), that we will successfully manage a company in a new area of business (regenerative medicine) and on a different scale than we have operated in the past (operational risk), that we will be able to achieve the desired therapeutic results using stem and regenerative cells (scientific risk), or that our cash resources will be adequate to develop our products until we become profitable, if ever (financial risk). We are using our cash in one of the riskiest industries in the economy (strategic risk). This may make our stock an unsuitable investment for many investors.
The development and manufacture of current and future generation Celution® System devices is important to us
We must continue to develop and manufacture both the current and future generation Celution® System devices. If we are not successful in further development of the current and future generation Celution® System devices, we may not be able to compete successfully in the marketplace (technology risk), and if we experience disruptions and/or delays in our production of these devices as required by the marketplace, our operations and commercialization efforts (clinical, regulatory and/or commercial sales) would be harmed (manufacturing risk).
Although we have significant experience in manufacturing the current Celution® System platform and its consumables at a commercial level, there can be no guarantee that we will be able to successfully develop and manufacture future generation Celution® Systems in a manner that is cost-effective or commercially viable, or that development and manufacturing capabilities might not take much longer than currently anticipated to be ready for the market.
Although we have been manufacturing the Celution® 800 System and the StemSource® 900-based Cell Bank since 2008, we cannot assure that we will be able to manufacture sufficient numbers of such products to meet future demand, or that we will be able to overcome unforeseen manufacturing difficulties for this sophisticated equipment.
Our Operating results and stock price can be volatile
Our prospects must be evaluated in light of the risks and difficulties frequently encountered by emerging companies and particularly by such companies in rapidly evolving and technologically advanced biotech and medical device fields. From time to time, we have tried to update our investors’ expectations as to our operating results by periodically announcing financial guidance. However, we have in the past been forced to revise or withdraw such guidance due to lack of visibility and predictability of product demand. Our stock price has a history of significant volatility, which may harm our ability to raise additional capital and may cause an investment in our company to be unsuitable for some investors.
We may not be able to correctly estimate or control our future operating expenses, which could lead to cash shortfalls
Our budgeted expense levels are based in part on our expectations concerning future revenues from sales as well our assessment of the future investments needed to expand our commercial organization and support research and development activities. We may be unable to reduce our expenditures in a timely manner to compensate for any unexpected events or a shortfall in revenue. Accordingly, a shortfall in demand for our products or other unexpected events could have an immediate and material impact on our business and financial condition.
We are vulnerable to competition and technological change, and also to physicians’ inertia
We compete with many domestic and foreign companies in developing our technology and products, including biotechnology, medical device, and pharmaceutical companies. Many current and potential competitors have substantially greater financial, technological, research and development, marketing, and personnel resources. There is no assurance that our competitors will not succeed in developing alternative products that are more effective, easier to use, or more economical than those which we have developed or are in the process of developing, or that would render our products obsolete and non-competitive. In general, we may not be able to prevent others from developing and marketing competitive products similar to ours or which perform similar functions.
Competitors may have greater experience in developing therapies or devices, conducting clinical trials, obtaining regulatory clearances or approvals, manufacturing and commercialization. It is possible that competitors may obtain patent protection, approval, or clearance from the FDA or achieve commercialization earlier than we can, any of which could have a substantial negative effect on our business.
We compete against cell-based therapies derived from alternate sources, such as bone marrow, umbilical cord blood and potentially embryos. Doctors historically are slow to adopt new technologies like ours, regardless of the perceived merits, when older technologies continue to be supported by established providers. Overcoming such inertia often requires very significant marketing expenditures or definitive product performance and/or pricing superiority.
We expect physicians’ inertia and skepticism to also be a significant barrier as we attempt to gain market penetration with our future products. We believe we will continue to need to finance lengthy time-consuming clinical studies to provide evidence of the medical benefit of our products and resulting therapies in order to overcome this inertia and skepticism particularly in reconstructive surgery, cell preservation, osteoarthritis, scleroderma, cardiovascular indications and others.
Many potential applications of our technology are pre-commercialization, which subjects us to development and marketing risks
We are in a relatively early stage of the path to commercialization with many of our products. We believe that our long-term viability and growth will depend in large part on our ability to develop commercial quality cell processing devices and useful procedure-specific consumables, and to establish the safety and efficacy of our therapies through clinical trials and studies. With our Cytori Cell Therapy, we are pursuing new approaches for therapies for osteoarthritis, scleroderma, cardiovascular disease, burns, soft tissue defects, reconstructive surgery, preservation of stem and regenerative cells for potential future use, and other conditions. There is no assurance that our development programs will be successfully completed or that required regulatory clearances or approvals will be obtained on a timely basis, if at all.
There is no proven path for commercializing Cytori Cell Therapy in a way to earn a durable profit commensurate with the medical benefit. Although we began to commercialize our reconstructive surgery products in Europe and certain Asian markets, and our cell banking products in Japan, Europe, and certain Asian markets in 2008, additional market opportunities for many of our products and/or services may not materialize for a number of years.
Successful development and market acceptance of our products is subject to developmental risks, including failure of inventive imagination, ineffectiveness, lack of safety, unreliability, failure to receive necessary regulatory clearances or approvals, high commercial cost, preclusion or obsolescence resulting from third parties’ proprietary rights or superior or equivalent products, competition from copycat products, and general economic conditions affecting purchasing patterns. There is no assurance that we or our partners will successfully develop and commercialize Cytori Cell Therapy, or that our competitors will not develop competing technologies that are less expensive or superior. Failure to successfully develop and market Cytori Cell Therapy would have a substantial negative effect on our results of operations and financial condition.
If any party to a key collaboration partnership fails to perform material obligations under our agreements, or any other collaboration agreement, or if such agreements are terminated for any reason, our business could significantly suffer
We have entered into collaboration agreements under which we may receive future payments in the form of milestone payments, maintenance fees and royalties. We are dependent on our collaborators to commercialize Cytori Cell Therapy in certain countries in order for us to realize any financial benefits from these collaborations. Our collaborators may not devote the attention and resources to such efforts to be successful. In addition, in the event that a party fails to perform under a key collaboration agreement, or if a key collaboration agreement is terminated, the reduction in anticipated revenues could delay or suspend our commercialization efforts in certain countries. Specifically, the termination of a key collaboration agreement by one of our collaborators could materially impact our ability to enter into additional collaboration agreements with new collaborators on favorable terms.
If we or our distributors or collaborators fail to comply with regulatory requirements applicable to the development, manufacturing, and marketing of our products, regulatory agencies may take action against us or them, which could significantly harm our business
Our products and product candidates, along with the clinical development process, the manufacturing processes, post-approval clinical data, labeling, advertising and promotional activities for these products, are subject to continual requirements and review by the FDA, state and foreign regulatory bodies. Regulatory authorities subject a marketed product, its manufacturer and the manufacturing facilities to continual review and periodic inspections. We, our distributors and collaborators and our and their respective contractors, suppliers and vendors, will be subject to ongoing regulatory requirements, including complying with regulations and laws regarding advertising, promotion and sales of products, required submissions of safety and other post-market information and reports, registration requirements, cGMP regulations (including requirements relating to quality control and quality assurance, as well as the corresponding maintenance of records and documentation), and the requirements regarding the distribution of samples to physicians and recordkeeping requirements. Regulatory agencies may change existing requirements or adopt new requirements or policies. We, our distributors and collaborators and our and their respective contractors, suppliers and vendors, may be slow to adapt or may not be able to adapt to these changes or new requirements.
Failure to comply with regulatory requirements may result in any of the following:
| • | restrictions on our products or manufacturing processes; |
| • | warning letters; |
| • | withdrawal of the products from the market; |
| • | voluntary or mandatory recall; |
| • | fines; |
| • | suspension or withdrawal of regulatory approvals; |
| • | suspension or termination of any of our ongoing clinical trials; |
| • | refusal to permit the import or export of our products; |
| • | refusal to approve pending applications or supplements to approved applications that we submit; |
| • | product seizure; |
| • | injunctions; or |
| • | imposition of civil or criminal penalties. |
We must rely on the performance of Lorem Vascular for the commercialization of our products in China, Hong Kong, Singapore, Malaysia and Australia
Lorem Vascular is the exclusive licensee for our products in China, Hong Kong, Singapore, Malaysia and Australia, and while we will be strongly supportive to their efforts, they are responsible for obtaining regulatory approvals, market development and sales in these countries. Lorem Vascular is also a relatively new company and as such will be required to develop the expertise, personnel and relationships in each of these countries required to successfully market and sell our products. We cannot guarantee that Lorem Vascular will make the investments required to be successful in these countries. We cannot guarantee that the necessary regulatory approvals can be obtained, and we cannot guarantee that our products will be successful in these markets even if advantageous market regulatory approvals are obtained. Further, to the extent Lorem fails to comply with any regulations applicable to its marketing and commercialization of our products, we cannot assure you that regulators might not try to hold us responsible for such activities if they believe we somehow facilitated or were otherwise responsible for Lorem’s actions.
To the extent any of our customers fail to use our products in compliance with applicable regulations, regulators could try to hold us responsible if they believe we facilitated or were otherwise somehow responsible for our customer's non-compliance
We sell our products in many markets. Many of these markets have different, and in some cases less burdensome, regulatory schemes applicable to our products. To the extent any of our customers, whether inside or outside the U.S., use or further market our products for unapproved uses in their home market or in other markets or in a way that does not otherwise comply with applicable laws, there is a risk that regulators could try to hold us responsible for any such non-compliance. For example, we sell products to customers outside the U.S. To the extent any of our customers use or further market our products in their home market in a way that does not comply with applicable local regulations, regulators could try to hold us responsible if they believe we facilitated or were otherwise responsible for the customers actions. While we take measures in an effort to protect us against these types of risks, we cannot ensure you that such measures would prevent us from becoming subject to any such claims.
Market acceptance of new technology such as ours can be difficult to obtain
New and emerging cell therapy and cell banking technologies, such as those provided by the Cytori Cell Therapy family of products, may have difficulty or encounter significant delays in obtaining market acceptance in some or all countries around the world due to the novelty of our cell therapy and cell banking technologies. Therefore, the market adoption of our Cytori Cell Therapy and cell banking technologies may be slow and lengthy with no assurances that significant market adoption will be successful. The lack of market adoption or reduced or minimal market adoption of our cell therapy and cell banking technologies may have a significant impact on our ability to successfully sell our product(s) into a country or region.
Future clinical trial results may differ significantly from our expectations
While we have proceeded incrementally with our previous clinical trials in an effort to gauge the risks of proceeding with larger and more expensive trials, such as in previous cardiac trials in Europe, and our ATHENA I and ATHENA II feasibility trial in heart failure due to ischemic heart disease, we cannot guarantee that we will not experience negative results in larger and much more expensive clinical trials than we have conducted to date. Poor results, unanticipated events or other complications in our clinical trials could result in substantial delays in commercialization, substantial negative effects on the perception of our products, and substantial additional costs. These risks are increased by our reliance on third parties in the performance of many of the clinical trial functions, including the clinical investigators, hospitals, CROs, and other third party service providers.
Our product candidates may not receive regulatory approvals or their development may be delayed for a variety of reasons, including unsuccessful clinical trials, regulatory requirements or safety concerns
Clinical testing of our products is a long, expensive and uncertain process, and the failure or delay of a clinical trial can occur at any stage. Even if initial results of preclinical and nonclinical studies or clinical trial results are promising, we may obtain different results in subsequent trials or studies that fail to show the desired levels of safety and efficacy, or we may not obtain applicable regulatory approval for a variety of other reasons. Clinical trials for any of our products could be unsuccessful, which would delay or prohibit regulatory approval and commercialization of the product. In the United States and other jurisdictions, regulatory approval can be delayed, limited or not granted for many reasons, including, among others:
| • | clinical results may not meet prescribed endpoints for the studies or otherwise provide sufficient data to support the efficacy of our products; |
| • | clinical and nonclinical test results may reveal side effects, adverse events or unexpected safety issues associated with the use of our products; |
| • | regulatory review may not find a product safe or effective enough to merit either continued testing or final approval; |
| • | regulatory review may not find that the data from preclinical testing and clinical trials justifies approval; |
| • | regulatory authorities may require that we change our studies or conduct additional studies which may significantly delay or make continued pursuit of approval commercially unattractive; |
| • | a regulatory agency may reject our trial data or disagree with our interpretations of either clinical trial data or applicable regulations; |
| • | the cost of clinical trials required for product approval may be greater than what we originally anticipate, and we may decide to not pursue regulatory approval for such a product; |
| • | a regulatory agency may identify problems or other deficiencies in our existing manufacturing processes or facilities, or the existing processes or facilities of our collaborators, our contract manufacturers or our raw material suppliers; |
| • | a regulatory agency may change its formal or informal approval requirements and policies, act contrary to previous guidance, adopt new regulations or raise new issues or concerns late in the approval process; |
| • | a product candidate may be approved only for indications that are narrow or under conditions that place the product at a competitive disadvantage, which may limit the sales and marketing activities for such products or otherwise adversely impact the commercial potential of a product; or |
| • | a regulatory agency may ask the company to put a clinical study on hold pending additional safety data; there is no guarantee that the company will be able to satisfy the regulator agencies requests in a timely manner, which can lead to significant uncertainty in the completion of a clinical study. |
If a product is not approved in a timely fashion on commercially viable terms, or if development of any product is terminated due to difficulties or delays encountered in the regulatory approval process, it could have a material adverse impact on our business, and we will become more dependent on the development of other proprietary products and/or our ability to successfully acquire other products and technologies. There can be no assurances that any product will receive regulatory approval in a timely manner, or at all.
Certain products will be marketed, and perhaps manufactured, in foreign countries. The process of obtaining regulatory approvals in foreign countries is subject to delay and failure for the reasons set forth above, as well as for reasons that vary from jurisdiction to jurisdiction. The approval process varies among countries and jurisdictions and can involve additional testing. The time required to obtain approval may differ from that required to obtain FDA approval. Foreign regulatory agencies may not provide approvals on a timely basis, if at all. Approval by the FDA does not ensure approval by regulatory authorities in other countries or jurisdictions, and approval by one foreign regulatory authority does not ensure approval by regulatory authorities in other foreign countries or jurisdictions or by the FDA.
We may not be able to protect our proprietary rights
Our success depends in part on whether we can maintain our existing patents, obtain additional patents, maintain trade secret protection, and operate without infringing on the proprietary rights of third parties.
There can be no assurance that any of our pending patent applications will be approved or that we will develop additional proprietary products that are patentable. There is also no assurance that any patents issued to us will not become the subject of a re-examination, will provide us with competitive advantages, will not be challenged by any third parties, or that the patents of others will not prevent the commercialization of products incorporating our technology. Furthermore, there can be no guarantee that others will not independently develop similar products, duplicate any of our products, or design around our patents.
Our commercial success will also depend, in part, on our ability to avoid infringing on patents issued by others. If we were judicially determined to be infringing on any third-party patent, we could be required to pay damages, alter our products or processes, obtain licenses, or cease certain activities. If we are required in the future to obtain any licenses from third parties for some of our products, there can be no guarantee that we would be able to do so on commercially favorable terms, if at all. U.S. patent applications are not immediately made public, so we might be surprised by the grant to someone else of a patent on a technology we are actively using.
Litigation, which would result in substantial costs to us and diversion of effort on our part, may be necessary to enforce or confirm the ownership of any patents issued or licensed to us, or to determine the scope and validity of third-party proprietary rights. If our competitors claim technology also claimed by us and prepare and file patent applications in the United States, we may have to participate in interference proceedings declared by the U.S. Patent and Trademark Office or a foreign patent office to determine priority of invention, which could result in substantial costs to and diversion of effort, even if the eventual outcome is favorable to us. Any such litigation or interference proceeding, regardless of outcome, could be expensive and time-consuming.
Successful challenges to our patents through oppositions, reexamination proceedings or interference proceedings could result in a loss of patent rights in the relevant jurisdiction. If we are unsuccessful in actions we bring against the patents of other parties and it is determined that we infringe the patents of third-parties, we may be subject to litigation, or otherwise prevented from commercializing potential products in the relevant jurisdiction, or may be required to obtain licenses to those patents or develop or obtain alternative technologies, any of which could harm our business. Furthermore, if such challenges to our patent rights are not resolved in our favor, we could be delayed or prevented from entering into new collaborations or from commercializing certain products, which could adversely affect our business and results of operations.
On September 16, 2011, President Obama signed into law major patent law reform known as the Leahy-Smith America Invents Act (AIA). Among other things the AIA implements a first inventor to file standard for patent approval, changes the legal standards for patentability under section 102 of the statute, and creates a post grant review system. As a result of the added uncertainty of interpretation of the AIA and the uncertainty of patent law in general, we cannot predict with certainty how much protection, if any, will be given to our patents if we attempt to enforce them and they are challenged in court. Changes to the patent law under the AIA also may provoke third parties to assert claims against us or result in our intellectual property being narrowed in scope or declared to be invalid or unenforceable.
Competitors or third parties may infringe on or upon our patents. We may be required to file patent infringement claims, which can be expensive and time-consuming. In addition, in an infringement proceeding, a court may decide that a patent of ours is not valid or is unenforceable, or that the third party’s technology does not in fact infringe upon our patents. An adverse determination of any litigation or defense proceedings could put one or more of our patents at risk of being invalidated or interpreted narrowly and could put our related pending patent applications at risk of not issuing. Litigation may fail and, even if successful, may result in substantial costs and be a distraction to our management. We may not be able to prevent misappropriation of our proprietary rights, particularly in countries outside the U.S. where patent rights may be more difficult to enforce. Furthermore, because of the substantial amount of discovery required in connection with intellectual property litigation, there is a risk that some of our confidential or sensitive information could be compromised by disclosure in the event of litigation. In addition, during the course of litigation there could be public announcements of the results of hearings, motions or other interim proceedings or developments. If securities analysts or investors perceive these results to be negative, it could have a substantial adverse effect on the price of our common stock.
In addition to patents, which alone may not be able to protect the fundamentals of our business, we also rely on unpatented trade secrets and proprietary technological expertise. Some of our intended future cell-related therapeutic products may fit into this category. We rely, in part, on confidentiality agreements with our partners, employees, advisors, vendors, and consultants to protect our trade secrets and proprietary technological expertise. There can be no guarantee that these agreements will not be breached, or that we will have adequate remedies for any breach, or that our unpatented trade secrets and proprietary technological expertise will not otherwise become known or be independently discovered by competitors.
Failure to obtain or maintain patent protection, or protect trade secrets, for any reason (or third-party claims against our patents, trade secrets, or proprietary rights, or our involvement in disputes over our patents, trade secrets, or proprietary rights, including involvement in litigation), could have a substantial negative effect on our results of operations and financial condition.
We may not be able to protect our intellectual property in countries outside the United States
Intellectual property law outside the United States is uncertain and in many countries is currently undergoing review and revisions. The laws of some countries do not protect our patent and other intellectual property rights to the same extent as United States laws. This is particularly relevant to us as most of our current commercial product sales and clinical trials are outside of the United States. Third parties may attempt to oppose the issuance of patents to us in foreign countries by initiating opposition proceedings. Opposition proceedings against any of our patent filings in a foreign country could have an adverse effect on our corresponding patents that are issued or pending in the United States. It may be necessary or useful for us to participate in proceedings to determine the validity of our patents or our competitors’ patents that have been issued in countries other than the U.S. This could result in substantial costs, divert our efforts and attention from other aspects of our business, and could have a material adverse effect on our results of operations and financial condition. We currently have pending patent applications in Europe, Australia, Japan, Canada, China, Korea, and Brazil, among other countries.
We and our medical devices are subject to FDA regulation
As medical devices, the Celution® System family of products, and components of the Stemsource® cell banks, must receive regulatory clearances or approvals from the FDA and, in many instances, from non-U.S. and state governments prior to their sale. The Celution® System family of products is subject to stringent government regulation in the United States by the FDA under the Federal Food, Drug and Cosmetic Act. The FDA regulates the design/development process, clinical testing, manufacture, safety, labeling, sale, distribution, and promotion of medical devices and drugs. Included among these regulations are pre-market clearance and pre-market approval requirements, design control requirements, and the Quality System Regulations/Good Manufacturing Practices. Other statutory and regulatory requirements govern, among other things, establishment registration and inspection, medical device listing, prohibitions against misbranding and adulteration, labeling and post-market reporting.
The regulatory process can be lengthy, expensive, and uncertain. Before any new medical device may be introduced to the U.S. market, the manufacturer generally must obtain FDA clearance or approval through either the 510(k) pre-market notification process or the lengthier pre-market approval application, or PMA, process. It generally takes from three to 12 months from submission to obtain 510(k) pre-market clearance, although it may take longer. Approval of a PMA could take four or more years from the time the process is initiated. The 510(k) and PMA processes can be expensive, uncertain, and lengthy, and there is no guarantee of ultimate clearance or approval. Our Celution® products under development today and in the foreseeable future will be subject to the lengthier PMA process. Securing FDA clearances and approvals may require the submission of extensive clinical data and supporting information to the FDA, and there can be no guarantee of ultimate clearance or approval. Failure to comply with applicable requirements can result in application integrity proceedings, fines, recalls or seizures of products, injunctions, civil penalties, total or partial suspensions of production, withdrawals of existing product approvals or clearances, refusals to approve or clear new applications or notifications, and criminal prosecution.
Medical devices are also subject to post-market reporting requirements for deaths or serious injuries when the device may have caused or contributed to the death or serious injury, and for certain device malfunctions that would be likely to cause or contribute to a death or serious injury if the malfunction were to recur. If safety or effectiveness problems occur after the product reaches the market, the FDA may take steps to prevent or limit further marketing of the product. Additionally, the FDA actively enforces regulations prohibiting marketing and promotion of devices for indications or uses that have not been cleared or approved by the FDA. While we believe that our current activities are in compliance with FDA regulations relating to marketing and promotion, if regulators were to determine that our commercialization efforts, or those of our distributors, collaborators or customers, involve improper marketing and promotion of our products in violation of FDA regulations, our business could be substantially negatively affected.
There can be no guarantee that we will be able to obtain the necessary 510(k) clearances or PMA approvals to market and manufacture our other products in the United States for their intended use on a timely basis, if at all. Delays in receipt of or failure to receive such clearances or approvals, the loss of previously received clearances or approvals, or failure to comply with existing or future regulatory requirements could have a substantial negative effect on our results of operations and financial condition.
To sell in international markets, we will be subject to regulation in foreign countries
In cooperation with our distribution and collaborative partners, we intend to market our current and future products both domestically and in many foreign markets. A number of risks are inherent in international transactions. In order for us to market our products in Europe, Canada, Japan and certain other non-U.S. jurisdictions, we need to obtain and maintain required regulatory approvals or clearances and must comply with extensive regulations regarding safety, manufacturing processes and quality. These regulations, including the requirements for approvals or clearances to market, may differ from the FDA regulatory scheme. International sales also may be limited or disrupted by political instability, price controls, trade restrictions and changes in tariffs. Additionally, fluctuations in currency exchange rates may adversely affect demand for our products by increasing the price of our products in the currency of the countries in which the products are sold.
There can be no assurance that we will obtain regulatory approvals or clearances in all of the countries where we intend to market our products, or that we will not incur significant costs in obtaining or maintaining foreign regulatory approvals or clearances, or that we will be able to successfully commercialize current or future products in various foreign markets. Delays in receipt of approvals or clearances to market our products in foreign countries, failure to receive such approvals or clearances or the future loss of previously received approvals or clearances could have a substantial negative effect on our results of operations and financial condition.
Changing, new and/or emerging government regulations may adversely affect us
Government regulations can change without notice. Given the fact that Cytori operates in various international markets, our access to such markets could change with little to no warning due to a change in government regulations that suddenly up-regulate our product(s) and create greater regulatory burden for our cell therapy and cell banking technology products.
Due to the fact that there are new and emerging cell therapy and cell banking regulations that have recently been drafted and/or implemented in various countries around the world, the application and subsequent implementation of these new and emerging regulations have little to no precedence. Therefore, the level of complexity and stringency is not known and may vary from country to country, creating greater uncertainty for the international regulatory process.
Anticipated or unanticipated changes in the way or manner in which the FDA or other regulators regulate products or classes/groups of products can delay, further burden, or alleviate regulatory pathways that were once available to other products. There are no guarantees that such changes in FDA’s or other regulators’ approach to the regulatory process will not deleteriously affect some or all of our products or product applications.
We may have difficulty obtaining health insurance reimbursement for our products
New and emerging cell therapy and cell banking technologies, such as those provided by the Cytori Cell Therapy family of products, may have difficulty or encounter significant delays in obtaining health care reimbursement in some or all countries around the world due to the novelty of our cell therapy and cell banking technology and subsequent lack of existing reimbursement schemes/pathways. Therefore, the creation of new reimbursement pathways may be complex and lengthy with no assurances that such reimbursements will be successful. The lack of health insurance reimbursement or reduced or minimal reimbursement pricing may have a significant impact on our ability to successfully sell our cell therapy and cell banking technology product(s) into a county or region, which would negatively impact our operating results.
Our concentration of sales in Japan may have negative effects on our business in the event of any crisis in that region
We have operations in a number of regions around the world, including the United States, Japan, and Europe. Our global operations may be subject to risks that may limit our ability to operate our business. We sell our products globally, which exposes us to a number of risks that can arise from international trade transactions, local business practices and cultural considerations, including:
| · | political unrest, terrorism and economic or financial instability; |
| · | unexpected changes and uncertainty in regulatory requirements; |
| · | nationalization programs that may be implemented by foreign governments; |
| · | import-export regulations; |
| · | difficulties in enforcing agreements and collecting receivables; |
| · | difficulties in ensuring compliance with the laws and regulations of multiple jurisdictions; |
| · | changes in labor practices, including wage inflation, labor unrest and unionization policies; |
| · | longer payment cycles by international customers; |
| · | currency exchange fluctuations; |
| · | disruptions of service from utilities or telecommunications providers, including electricity shortages; |
| · | difficulties in staffing foreign branches and subsidiaries and in managing an expatriate workforce, and differing employment practices and labor issues; and |
| · | potentially adverse tax consequences. |
We also face risks associated with currency exchange and convertibility, inflation and repatriation of earnings as a result of our foreign operations. We are also vulnerable to appreciation or depreciation of foreign currencies against the U.S. dollar. Although we have significant operations in Asia, a substantial portion of transactions are denominated in U.S. dollars. As appreciation against the U.S. dollar increases, it will result in an increase in the cost of our business expenses abroad. Conversely, downward fluctuations in the value of foreign currencies relative to the U.S. dollar may make our products less price competitive than local solutions. From time to time, we may engage in currency hedging activities, but such activities may not be able to limit the risks of currency fluctuations.
Our revenue, results of operations, and cash flows may suffer upon the loss of a significant customer or a significant reduction in the amount of product ordered by any such customer
Our largest customer accounted for 17% of our revenue during the year ended December 31, 2014. Loss of this significant customer or a significant reduction in the amount of product ordered by this customer could adversely affect our revenue, results of operations, and cash flows.
We must maintain quality assurance certification and manufacturing approvals
The manufacture of our products is, and the manufacture of any future cell-related therapeutic products would be, subject to periodic inspection by regulatory authorities and distribution partners. The manufacture of devices and products for human use is subject to regulation and inspection from time to time by the FDA for compliance with the FDA’s Quality System Regulation, or QSR, requirements, as well as equivalent requirements and inspections by state and non-U.S. regulatory authorities. There can be no guarantee that the FDA or other authorities will not, during the course of an inspection of existing or new facilities, identify what they consider to be deficiencies in our compliance with QSRs or other requirements and request, or seek remedial action.
Failure to comply with such regulations or a potential delay in attaining compliance may adversely affect our manufacturing activities and could result in, among other things, injunctions, civil penalties, FDA refusal to grant pre-market approvals or clearances of future or pending product submissions, fines, recalls or seizures of products, total or partial suspensions of production, and criminal prosecution. There can be no assurance after such occurrences that we will be able to obtain additional necessary regulatory approvals or clearances on a timely basis, if at all. Delays in receipt of or failure to receive such approvals or clearances, or the loss of previously received approvals or clearances could have a substantial negative effect on our results of operations and financial condition.
The termination or suspension of the BARDA contract could delay and/or adversely affect our business and our ability to further develop our Celution® System
We were awarded the contract with BARDA in September 2012 with the aim to develop a new countermeasure for a combined injury involving thermal burn and radiation exposure which would be useful following a mass-casualty event. The cost-plus-fixed-fee contract was valued at up to $106 million, with a guaranteed base period of approximately $4.7 million which included preclinical research and the acceleration of our ongoing development of the Celution® cell processing System (the Celution® System).
On August 13, 2014, we and BARDA amended the contract exercising Option 1 to perform research, regulatory, clinical and other tasks required for initiation of a pilot clinical trial of the Celution System in thermal burn injury, amended the Statement of Work and reorganized the contract options. The total cost plus fixed fee for the performance of Option 1 was up to approximately $12.1 million. In December 2014, we executed an amendment to the August 2014 contract option to fund continued investigation and development of Cytori Cell Therapy for use in thermal burn injuries , which increased the option extension to $14.1 million. The revised Option 2 consists of execution of the pilot clinical study, regulatory, and other tasks for a cost plus fixed fee of up to $8.3 million. The revised Option 3 consists of clinical, regulatory, and other tasks for completion of a pivotal clinical trial leading to FDA approval for use of the Celution System in thermal burn injury, for a cost plus fixed fee of up to $45.5 million. The revised Option 4 consists of R&D, clinical, regulatory and other tasks required to develop and obtain FDA clearance for other characteristics suitable for use in thermal burn injury following a mass casualty event, for a cost plus fixed fee of up to $23.4 million.
BARDA may suspend or terminate this contract should we fail to achieve key objectives or milestones, or fail to comply with the operating procedures and processes approved by BARDA and its audit agency, the Defense Contract Audit Agency. There can be no assurance that we will be able to comply with BARDA’s operating procedures and processes, achieve the necessary clinical milestones, or whether we will be able to successfully develop our Celution® System under the contract. If the BARDA contract were terminated or suspended, our business could be adversely affected.
The BARDA contract has certain contracting requirements that allow the U.S. Government to unilaterally control its contracts. If the U.S. Government suspends, cancels, or otherwise terminates our contract with them, we could experience significant revenue shortfalls, and our financial condition and business may be adversely affected
Contracts with U.S. Government agencies typically contain termination provisions unfavorable to the other party, and are subject to audit and modification by the U.S. Government at its sole discretion, which will subject us to additional risks. These risks include the ability of the U.S. Government to unilaterally:
| · | audit or object to our contract-related costs and fees, and require us to reimburse all such costs and fees; |
| · | suspend or prevent us for a set period of time from receiving new contracts or extending our existing contracts based on violations or suspected violations of laws or regulations; |
| · | cancel, terminate or suspend our contracts based on violations or suspected violations of laws or regulations; |
| · | terminate our contracts if in the Government’s best interest, including if funds become unavailable to the applicable governmental agency; |
| · | reduce the scope and value of our contracts; and |
| · | change certain terms and conditions in our contracts. |
BARDA is able to terminate its contracts with us, either for its best interests or if we default by failing to perform in accordance with or to achieve the milestones set forth in the contract schedules and terms. Termination-for-convenience provisions generally enable us to recover only our costs incurred or committed and settlement expenses on the work completed prior to termination. Changes to, or an unexpected termination of this contract could result in significant revenue shortfalls. If revenue shortfalls occur and are not offset by corresponding reductions in expenses, our business could be adversely affected. We cannot anticipate if, when or to what extent BARDA might revise, alter or terminate its contract with us in the future.
Under our contract with BARDA, our operations, and those of our contractors, are subject to audit by the U.S. Government, a negative outcome to which could adversely affect our financial conditions and business operations
U.S. Government agencies, such as the Department of Health and Human Services, or DHHS, and the Defense Contract Audit Agency, or the DCAA, routinely audit and investigate government contractors and recipients of federal grants. These agencies evaluate a contractor’s performance under its contracts, cost structure and compliance with applicable laws, regulations and standards.
The DHHS and the DCAA also review the adequacy of, and a contractor’s compliance with, its internal control systems and policies, including the contractor’s purchasing, property, estimating, compensation and management information systems. Any costs found to be improperly allocated to a contract will not be reimbursed, while such costs already reimbursed must generally be repaid. If an audit identifies improper or illegal activities, we may be subject to civil and criminal penalties and administrative sanctions, including, but not limited to:
| · | termination of contracts; |
| · | forfeiture of profits; |
| · | suspension of payments; |
| · | fines; and |
| · | suspension or prohibition from conducting business with the U.S. Government. |
Material weakness in our internal control over financial reporting have occurred in the past and could occur in the future
We identified a material weakness in our internal control over financial reporting for the year ended December 31, 2013, which may have adversely affected investor confidence in us and, as a result, the value of our common stock. While no such material weakness was identified for the year ended December 31, 2014, we cannot assure you that additional material weaknesses will not be identified in the future.
We are required, pursuant to Section 404 of the Sarbanes-Oxley Act, to furnish a report by management on, among other things, the effectiveness of our internal control over financial reporting. This assessment includes disclosure of any material weaknesses identified by our management in our internal control over financial reporting, as well as a statement that our independent registered public accounting firm has issued an attestation report on the effectiveness of our internal control over financial reporting.
If we are unable to effectively remediate any material weaknesses in a timely manner, or if we identify one or more additional material weaknesses in the future, investors could lose confidence in the accuracy and completeness of our financial reports, which could have a material adverse effect on the price of our common stock.
We depend on a few key officers
Our performance is substantially dependent on the performance of our executive officers and other key scientific and sales staff, including Marc H. Hedrick, MD, our President and Chief Executive Officer. We rely upon them for strategic business decisions and guidance. We believe that our future success in developing marketable products and achieving a competitive position will depend in large part upon whether we can attract and retain additional qualified management and scientific personnel. Competition for such personnel is intense, and there can be no assurance that we will be able to continue to attract and retain such personnel. The loss of the services of one or more of our executive officers or key scientific staff, or the inability to attract and retain additional personnel and develop expertise as needed could have a substantial negative effect on our results of operations and financial condition.
We may not have enough product liability insurance
The testing, manufacturing, marketing, and sale of our regenerative cell products involve an inherent risk that product liability claims will be asserted against us, our distribution partners, or licensees. There can be no guarantee that our clinical trial and commercial product liability insurance is adequate or will continue to be available in sufficient amounts or at an acceptable cost, if at all. A product liability claim, product recall, or other claim, as well as any claims for uninsured liabilities or in excess of insured liabilities, could have a substantial negative effect on our results of operations and financial condition. Also, well-publicized claims could cause our stock to fall sharply, even before the merits of the claims are decided by a court.
Risks Related to Ownership of our Common Stock
The market price of our common stock may be volatile and fluctuate significantly, which could result in substantial losses for stockholders and subject us to litigation.
The market price of our common stock may be subject to significant fluctuations. Among the factors that may cause the market price of our common stock to fluctuate are the risks described in this “Risk Factors” section and other factors, including:
| ● | fluctuations in our operating results or the operating results of our competitors; |
| ● | changes in estimates of our financial results or recommendations by securities analysts; |
| ● | variance in our financial performance from the expectations of securities analysts; |
| ● | changes in the estimates of the future size and growth rate of our markets; |
| ● | changes in accounting principles or changes in interpretations of existing principles, which could affect our financial results; |
| ● | conditions and trends in the markets we serve; |
| ● | changes in general economic, industry and market conditions; |
| ● | success of competitive products and services; |
| ● | changes in market valuations or earnings of our competitors; |
| ● | announcements of significant new products, contracts, acquisitions or strategic alliances by us or our competitors; |
| ● | the timing and outcome of regulatory reviews and approvals of our products; |
| ● | the commencement or outcome of litigation involving our company, our general industry or both; |
| ● | changes in our capital structure, such as future issuances of securities or the incurrence of additional debt; |
| ● | actual or expected sales of our common stock by the holders of our common stock; and |
| ● | the trading volume of our common stock. |
In addition, the stock market in general, the NASDAQ Global Market and the market for cell therapy development companies in particular may experience a loss of investor confidence. A loss of investor confidence may result in extreme price and volume fluctuations in our common stock that are unrelated or disproportionate to the operating performance of our business, our financial condition or results of operations. These broad market and industry factors may materially harm the market price of our common stock and expose us to securities class-action litigation. Class-action litigation, even if unsuccessful, could be costly to defend and divert management’s attention and resources, which could further materially harm our financial condition and results of operations.
Future sales of our common stock may depress our share price
As of December 31, 2014, we had 99,348,377 shares of our common stock outstanding. Sales of a number of shares of common stock in the public market, or the expectation of such sales, could cause the market price of our common stock to decline. We may also sell additional common stock or securities convertible into or exercisable or exchangeable for common stock in subsequent public or private offerings or other transactions, which may adversely affect the market price of our common stock.
We have granted demand registration rights for the resale of certain shares of our common stock to each of Astellas Pharma Inc. and Green Hospital Supply, Inc. pursuant to common stock purchase agreements previously entered into with each of these stockholders. An aggregate of 4,428,571 shares of our common stock are subject to these demand registration rights. If we receive a written request from any of these stockholders to file a registration statement under the Securities Act covering its shares of unregistered common stock, we are required to use reasonable efforts to prepare and file with the SEC within 30 business days of such request a registration statement covering the resale of the shares for an offering to be made on a continuous basis pursuant to Rule 415 under the Securities Act.
Our charter documents contain anti-takeover provisions
Certain provisions of our amended and restated certificate of incorporation and amended and restated bylaws could discourage, delay or prevent a merger, acquisition or other change of control that stockholders may consider favorable. These provisions could also prevent or frustrate attempts by our stockholders to replace or remove members of our Board of Directors. Stockholders who wish to participate in these transactions may not have the opportunity to do so. These provisions:
| ● | authorize our Board of Directors to issue without stockholder approval up to 5,000,000 shares of preferred stock, the rights of which will be determined at the discretion of the Board of Directors; |
| ● | require that stockholder actions must be effected at a duly called stockholder meeting and cannot be taken by written consent; |
| ● | establish advance notice requirements for stockholder nominations to our Board of Directors or for stockholder proposals that can be acted on at stockholder meetings; and |
| ● | limit who may call stockholder meetings. |
We are governed by the provisions of Section 203 of the Delaware General Corporation Law, which may, unless certain criteria are met, prohibit large stockholders, in particular those owning 15% or more of the voting rights on our common stock, from merging or combining with us for a prescribed period of time.
We pay no dividends in connection with our common stock
We have never paid cash dividends in the past, and currently do not intend to pay any cash dividends in connection with our common stock in the foreseeable future. Furthermore, our Loan Agreement with the Lenders currently prohibits our issuance of cash dividends. This could make an investment in our company inappropriate for some investors, and may serve to narrow our potential sources of additional capital.
If securities and/or industry analysts fail to continue publishing research about our business, if they change their recommendations adversely or if our results of operations do not meet their expectations, our stock price and trading volume could decline
The trading market for our common stock will be influenced by the research and reports that industry or securities analysts publish about us or our business. If one or more of these analysts cease coverage of our company or fail to publish reports on us regularly, we could lose visibility in the financial markets, which in turn could cause our stock price or trading volume to decline. In addition, it is likely that in some future period our operating results will be below the expectations of securities analysts or investors. If one or more of the analysts who cover us downgrade our stock, or if our results of operations do not meet their expectations, our stock price could decline.
Not applicable.
We lease 77,585 square feet at 3020 and 3030 Callan Road, San Diego, California that we use for our corporate headquarters and manufacturing facilities. The related lease agreement, as amended, bears monthly rent at a rate of $1.80 per square foot, with annual increase of $0.05 per square foot. The lease term is 88 months, commencing on July 1, 2010 and expiring on October 31, 2017. We received a 50% rent abatement for an additional 17,467 square feet through March of 2014 along with a tenant improvement allowance. Additionally, we entered into several lease agreements for international office locations. For these properties, we pay an aggregate of approximately $185,000 in rent per month.
From time to time, we have been involved in routine litigation incidental to the conduct of our business. As of December 31, 2014, we were not a party to any material legal proceeding.
Not applicable.
PART II
| Item 5. | Market for Registrant’s Common Equity, Related Stockholder Matters and Issuer Purchases of Equity Securities |
Market Prices
From August 2000 (our initial public offering in Germany) through September 2007 our common stock was quoted on the Frankfurt Stock Exchange under the symbol “XMPA” (formerly XMP). In September 2007 our stock closed trading on the Frankfurt Stock Exchange. Effective December 19, 2005, our common stock began trading on the NASDAQ Capital Market under the symbol “CYTX,” and has since transferred to the NASDAQ Global Market effective February 14, 2006. Warrants, issued as part of a financing agreement in March 2009, began trading on the NASDAQ Global Market under the symbol “CYTXW” effective June 22, 2009. The following tables show the high and low sales prices for our common stock and warrants for the periods indicated, as reported by the NASDAQ Stock Market. These prices do not include retail markups, markdowns or commissions.
Common Stock
|
High
|
Low
|
|||||||
|
2013
|
||||||||
|
Quarter ended March 31, 2013
|
$
|
3.16
|
$
|
2.31
|
||||
|
Quarter ended June 30, 2013
|
$
|
2.89
|
$
|
2.20
|
||||
|
Quarter ended September 30, 2013
|
$
|
2.87
|
$
|
2.09
|
||||
|
Quarter ended December 31, 2013
|
$
|
3.93
|
$
|
2.00
|
||||
|
2014
|
||||||||
|
Quarter ended March 31, 2014
|
$
|
3.47
|
$
|
2.44
|
||||
|
Quarter ended June 30, 2014
|
$
|
2.88
|
$
|
2.14
|
||||
|
Quarter ended September 30, 2014
|
$
|
2.52
|
$
|
0.66
|
||||
|
Quarter ended December 31, 2014
|
$
|
0.70
|
$
|
0.36
|
||||
All of our outstanding shares have been deposited with the Depository Trust & Clearing Corporation (DTCC) since December 9, 2005.
As of February 28, 2015, we had approximately 20 record holders of our common stock. Because many of our shares are held by brokers and other institutions on behalf of stockholders, we are unable to estimate the total number of individual stockholders represented by these record holders.
Dividends
We have never declared or paid any dividends on our common stock and do not anticipate paying any in the foreseeable future. Furthermore, our Loan Agreement with the Lenders currently prohibits our issuance of cash dividends on common stock.
Equity Compensation Plan Information
|
Plan Category
|
Number of securities to be issued
upon exercise of outstanding
options, warrants and rights
|
Weighted-average exercise price
of outstanding options, warrants
and rights
|
Number of securities remaining
available for future
issuance under equity compensation
plans (excluding securities reflected
in column(a))
|
|||||||||
|
(a)
|
(b)
|
(c)
|
||||||||||
|
Equity compensation plans approved by security holders (1)
|
415,905
|
$
|
4.98
|
—
|
||||||||
|
Equity compensation plans not approved by security holders (2)
|
8,614,566
|
$
|
3.88
|
—
|
||||||||
|
Equity compensation plans not approved by security holders (3)
|
278,000
|
$
|
1.31
|
3,697,000
|
||||||||
|
Total
|
9,308,471
|
$
|
3.85
|
3,697,000
|
||||||||
| (1) | The 1997 Stock Option and Stock Purchase Plan expired in October 2007. |
| (2) | The 2004 Stock Option and Stock Purchase Plan expired in August 2014. |
| (3) | See Notes to the Consolidated Financial Statements included elsewhere herein for a description of our 2014 Equity Incentive Plan. |
Comparative Stock Performance Graph
The following graph shows how an initial investment of $100 in our common stock would have compared to an equal investment in the NASDAQ Composite Index and the NASDAQ Biotechnology Index during the period from December 31, 2009 through December 31, 2014. The performance shown is not necessarily indicative of future price performance.
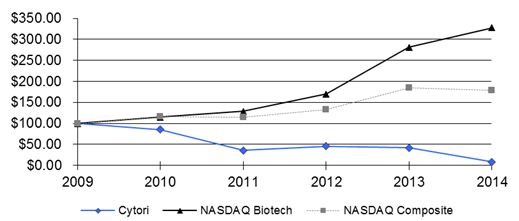
The selected data presented below under the captions “Statements of Operations Data,” “Statements of Cash Flows Data” and “Balance Sheet Data” for, and as of the end of, each of the years in the five-year period ended December 31, 2014, are derived from, and should be read in conjunction with, our audited consolidated financial statements. The consolidated balance sheets as of December 31, 2014 and 2013, and the related consolidated statements of operations and comprehensive loss, stockholders’ (deficit) equity, and cash flows for each of the years in the three-year period ended December 31, 2014, which have been audited by KPMG LLP, an independent registered public accounting firm, and their report thereon, are included elsewhere in this annual report. The consolidated balance sheets as of December 31, 2012, 2011 and 2010, and the related consolidated statements of operations and comprehensive loss, stockholders’ equity, and cash flows for the years ended December 31, 2011 and 2010, which were also audited by KPMG LLP, are included with our annual reports previously filed.
The information contained in this table should also be read in conjunction with “Management’s Discussion and Analysis of Financial Condition and Results of Operations” and the financial statements and related notes thereto included elsewhere in this report (in thousands except share and per share data):
|
2014
|
2013
|
2012
|
2011
|
2010
|
||||||||||||||||
|
Statements of Operations Data:
|
||||||||||||||||||||
|
Product revenues:
|
||||||||||||||||||||
|
Sales to related party
|
$
|
—
|
$
|
1,845
|
$
|
—
|
$
|
—
|
$
|
590
|
||||||||||
|
Sales to third parties
|
4,953
|
5,277
|
8,709
|
7,983
|
7,664
|
|||||||||||||||
|
4,953
|
7,122
|
8,709
|
7,983
|
8,254
|
||||||||||||||||
|
Cost of product revenues
|
2,940
|
3,421
|
4,000
|
3,837
|
3,908
|
|||||||||||||||
|
Gross profit
|
2,013
|
3,701
|
4,709
|
4,146
|
4,346
|
|||||||||||||||
|
Development revenues:
|
||||||||||||||||||||
|
Development, related party
|
—
|
638
|
2,882
|
1,992
|
2,122
|
|||||||||||||||
|
Development
|
—
|
1,179
|
2,529
|
—
|
—
|
|||||||||||||||
|
Government contracts and other
|
2,645
|
3,257
|
381
|
21
|
251
|
|||||||||||||||
|
2,645
|
5,074
|
5,792
|
2,013
|
2,373
|
||||||||||||||||
|
Operating expenses:
|
||||||||||||||||||||
|
Research and development
|
15,105
|
17,065
|
13,628
|
10,904
|
9,687
|
|||||||||||||||
|
Sales and marketing
|
6,406
|
9,026
|
9,488
|
13,560
|
11,040
|
|||||||||||||||
|
General and administrative
|
15,953
|
16,031
|
15,672
|
14,727
|
12,570
|
|||||||||||||||
|
Change in fair value of warrants
|
(369
|
)
|
(418
|
)
|
(209
|
)
|
(4,360
|
)
|
(1,285
|
)
|
||||||||||
|
Change in fair value of option liabilities
|
—
|
(2,250
|
)
|
340
|
740
|
30
|
||||||||||||||
|
Total operating expenses
|
37,095
|
39,454
|
38,919
|
35,571
|
32,042
|
|||||||||||||||
|
Total operating loss
|
(32,437
|
)
|
(30,679
|
)
|
(28,418
|
)
|
(29,412
|
)
|
(25,323
|
)
|
||||||||||
|
Other income (expense):
|
||||||||||||||||||||
|
Gain/loss on asset disposal
|
42
|
(257
|
)
|
—
|
—
|
—
|
||||||||||||||
|
Loss on debt extinguishment
|
—
|
(708
|
)
|
—
|
—
|
—
|
||||||||||||||
|
Interest income
|
6
|
4
|
4
|
9
|
9
|
|||||||||||||||
|
Interest expense
|
(4,371
|
)
|
(3,396
|
)
|
(3,386
|
)
|
(2,784
|
)
|
(2,052
|
)
|
||||||||||
|
Other income (expense), net
|
(608
|
)
|
(438
|
)
|
(314
|
)
|
(55
|
)
|
23
|
|||||||||||
|
Gain on Puregraft divestiture
|
—
|
4,453
|
—
|
—
|
—
|
|||||||||||||||
|
Gain on previously held equity interest in JV
|
—
|
4,892
|
—
|
—
|
—
|
|||||||||||||||
|
Equity loss in investments
|
—
|
(48
|
)
|
(165
|
)
|
(209
|
)
|
(151
|
)
|
|||||||||||
|
Net loss
|
$
|
(37,368
|
)
|
$
|
(26,177
|
)
|
$
|
(32,279
|
)
|
$
|
(32,451
|
)
|
$
|
(27,494
|
)
|
|||||
|
Beneficial conversion feature for convertible preferred stock
|
(1,169
|
)
|
—
|
—
|
—
|
—
|
||||||||||||||
|
Net loss allocable to common stockholders
|
$
|
(38,537
|
)
|
$
|
(26,177
|
)
|
$
|
(32,279
|
)
|
$
|
(32,451
|
)
|
$
|
(27,494
|
)
|
|||||
|
Basic and diluted net loss per share allocable to common stockholders
|
$
|
(0.48
|
)
|
$
|
(0.39
|
)
|
$
|
(0.55
|
)
|
$
|
(0.61
|
)
|
$
|
(0.60
|
)
|
|||||
|
Basic and diluted weighted average shares used in calculating net loss per share allocable to common stockholders
|
80,830,698
|
67,781,364
|
58,679,687
|
53,504,030
|
45,947,966
|
|||||||||||||||
|
Statements of Cash Flows Data:
|
||||||||||||||||||||
|
Net cash used in operating activities
|
$
|
(30,330
|
)
|
$
|
(34,563
|
)
|
$
|
(32,193
|
)
|
$
|
(35,323
|
)
|
$
|
(23,574
|
)
|
|||||
|
Net cash provided by(used in) investing activities
|
(1,343
|
)
|
3,686
|
(1,204
|
)
|
(560
|
)
|
(1,290
|
)
|
|||||||||||
|
Net cash provided by financing activities
|
30,874
|
20,772
|
22,192
|
20,137
|
64,678
|
|||||||||||||||
|
Effect of exchange rate changes on cash and cash equivalents
|
(85
|
)
|
(106
|
)
|
—
|
—
|
—
|
|||||||||||||
|
Net (decrease) increase in cash
|
(884
|
)
|
(10,211
|
)
|
(11,205
|
)
|
(15,746
|
)
|
39,814
|
|||||||||||
|
Cash and cash equivalents at beginning of year
|
15,506
|
25,717
|
36,922
|
52,668
|
12,854
|
|||||||||||||||
|
Cash and cash equivalents at end of year
|
$
|
14,622
|
$
|
15,506
|
$
|
25,717
|
$
|
36,922
|
$
|
52,668
|
||||||||||
|
Balance Sheet Data:
|
||||||||||||||||||||
|
Cash, cash equivalents and short-term investments
|
$
|
14,622
|
$
|
15,506
|
$
|
25,717
|
$
|
36,922
|
$
|
52,668
|
||||||||||
|
Working capital
|
5,769
|
9,671
|
16,366
|
35,516
|
45,730
|
|||||||||||||||
|
Total assets
|
38,719
|
42,060
|
43,250
|
51,534
|
66,347
|
|||||||||||||||
|
Deferred revenues, related party
|
—
|
—
|
638
|
3,520
|
5,512
|
|||||||||||||||
|
Deferred revenues
|
112
|
212
|
2,635
|
5,244
|
4,929
|
|||||||||||||||
|
Warrant liabilities, long-term
|
9,793
|
—
|
—
|
627
|
4,987
|
|||||||||||||||
|
Option liabilities
|
—
|
—
|
2,250
|
1,910
|
1,170
|
|||||||||||||||
|
Long-term deferred rent
|
558
|
710
|
756
|
504
|
398
|
|||||||||||||||
|
Long-term obligations, less current portion
|
18,041
|
23,100
|
12,903
|
21,962
|
13,255
|
|||||||||||||||
|
Total stockholders’ (deficit) equity
|
$
|
(5,702
|
)
|
$
|
3,132
|
$
|
6,455
|
$
|
9,946
|
$
|
22,873
|
|||||||||
Overview
We are a biotechnology company dedicated to the development of novel treatments and devices for a range of disorders using cells as a key part of the therapy. We are presently focused on developing our primary product, Cytori Cell Therapy, for patients with scleroderma hand dysfunction, orthopedic disorders, cardiovascular disease, urinary incontinence and thermal burns combined with radiation injury. We are actively investigating broadening the use of our technology platform into other areas as well, through internal research and that of our partners.
Cytori Cell Therapy consist of a heterogeneous population of specialized cells including stem cells that are involved in response to injury, repair and healing. These cells are extracted from an adult patient’s own adipose (fat) tissue using our fully automated, enzymatic, sterile Celution® System devices and consumable sets at the place where the patient is receiving their care (i.e. there is no off-site processing or manufacturing). Cytori Cell Therapy can either be administered to the patient the same day or banked for future use. An independent published study has demonstrated that Cytori’s proprietary process results in higher nucleated cell viability, less residual enzyme activity, less processing time, and improved economics in terms of cell progenitor output compared to other semi-automated and automated processes available.
In addition to our targeted therapeutic development, we have continued to upgrade and sell our Celution® System under select medical device clearances to customers developing new therapeutic applications for Cytori Cell Therapy in Europe, Japan, and other regions. The sales enhance the body of clinical feasibility data using our technology that could lead to new indications and intellectual property, contribute to near term marginal profit that partially offset our operating expenses and provide the basis for further partnerships and commercial experience that should facilitate future product revenue growth.
Development Pipeline
The primary therapeutic areas currently in the development pipeline are scleroderma, orthopedics, cardiovascular disease, specifically heart failure due to ischemic heart disease, and the treatment of thermal burns.
In January 2015, the FDA granted unrestricted IDE approval for a pivotal clinical trial, named the ‘STAR’ trial, to evaluate Cytori Cell Therapy as a potential treatment for impaired hand function in scleroderma, a rare autoimmune disease affecting approximately 50,000 patients in the United States. The STAR trial is a 48 week, randomized, double blind, placebo-controlled pivotal clinical trial of 80 patients in the United States. The trial evaluates the safety and efficacy of a single administration of Cytori Cell Therapy in scleroderma patients affecting the hands and fingers. Based on our internal analysis of the clinical and commercial chances of success, we have decided that scleroderma will be our most advanced clinical indication as it is a phase III pivotal study.
In the later part of 2014, we received approval by the FDA to begin a U.S. IDE pilot (phase IIa/b) trial of Cytori Cell Therapy in patients with osteoarthritis of the knee. The trial, called ACT-OA, is a 90 patient, randomized, double-blind, placebo control study involving two dose escalations of Cytori Cell Therapy, a low dose and a high dose conducted over 48 weeks. The randomization is 1:1:1 between the control, low dose and high dose groups. The first patient was enrolled in February 2015.
Cardiovascular disease remains a target therapeutic application of Cytori Cell Therapy. The ATHENA and ATHENA II trial programs sought to evaluate the safety and feasibility of Cytori Cell Therapy in patients with heart failure due to ischemic heart disease. In 2014, we truncated enrollment at 31 patients in the U.S. ATHENA trials as a result of delays associated with reviews of safety data. While the trials received FDA approval to proceed, we elected to stop enrollment in order to examine 6 and 12 month data in 2015 and with the analysis, strategically examine further investments in the cardiac program.
Another therapeutic target under evaluation is stress urinary incontinence in men following radical prostatectomy, which is based on positive data reported in a peer reviewed journal.
Cytori Cell Therapy is also being developed for the treatment of thermal burns combined with radiation injury. In the third quarter of 2012, we were awarded a contract to develop a new countermeasure for thermal burns valued at up to $106 million with the U.S. Department of Health and Human Service’s Biomedical Advanced Research and Development Authority (BARDA). The initial base period included $4.7 million over two years and covered preclinical research and continued development of Cytori’s Celution® System to improve cell processing. The additional contract options, if fully executed, could cover our clinical development through FDA approval under a device-based PMA regulatory pathway.
The cost-plus-fixed-fee contract is valued at up to $106 million, with a guaranteed two-year base period of approximately $4.7 million. We submitted reports to BARDA in late 2013 detailing the completion of the objectives in the initial contract. An In-Process Review Meeting in the first half of 2014 confirmed completion of the proof of concept phase.
In August and December, 2014, BARDA awarded to us contract options of $14 million. The options allow for continuation of research, regulatory, clinical, and other activities required for approval and completion of a pilot clinical trial using Cytori Cell Therapy (DCCT-10) for the treatment of thermal burns combined with radiation injury. The award for conducting the pilot trial, approximately $8 million, would follow FDA approval of the trial protocol and associated documentation. Once the pilot trial is analyzed, the final phase would include research, regulatory, and clinical activities necessary to achieve regulatory clearances to optimize a treatment for combined injury involving thermal burn and radiation exposure. A pivotal clinical trial of the use of the Cytori Cell Therapy (DCCT-10) for thermal burn injury will be the primary basis of an FDA approval. The total award is intended to support all clinical, preclinical, regulatory, and technology development activities needed to complete the FDA approval process for use in thermal burn injury under a device-based PMA regulatory pathway.
Results of Operations
Product revenues
Product revenues consisted of revenues primarily from our Celution® and StemSource® Cell Banks.
The following table summarizes the components for the years ended December 31, 2014, 2013 and 2012:
|
Years ended
|
||||||||||||
|
2014
|
2013
|
2012
|
||||||||||
|
Related party
|
$
|
—
|
$
|
1,845,000
|
$
|
—
|
||||||
|
Third party
|
4,953,000
|
5,277,000
|
8,709,000
|
|||||||||
|
Total product revenues
|
$
|
4,953,000
|
$
|
7,122,000
|
$
|
8,709,000
|
||||||
A majority of our product revenue in 2014 was derived from Japan. With two new regenerative medicine laws in Japan going into effect in November 2014 that removed regulatory uncertainties and provided a clear path for us to offer Cytori Cell Therapy in Japan, we expect continued demand from researchers at academic hospitals seeking to perform investigator-initiated and funded studies.
We experienced a decrease in product revenue during the year ended December 31, 2014 as compared to the same period in 2013, primarily due to decreased activities with our licensee and distributor Lorem Vascular, who purchased the initial stocking order of approximately $1.8M in late 2013 that did not recur in 2014, decreased revenue in Europe of $0.7 million, offset by increased revenues in Japan of approximately $1.0 million. Revenue deferred in the years ended December 31, 2014, and 2013 was $1.4 million, and $3.6 million, respectively. There was no comparable revenue deferral in the year ended December 31, 2012.
The future: We expect to continue to generate product revenues from a mix of Celution® and StemSource® System and consumables sales. We will sell the products to a diverse group of customers in Europe, Asia and North America, who may apply the products towards reconstructive surgery, soft tissue repair, research, aesthetics, and cell and tissue banking as approved in each country. Additionally, as a result of Class I Device Clearance for Celution® and a number of our other products in Japan, we anticipate selling these products to researchers at academic hospitals seeking to perform investigator-initiated and funded studies using Cytori’s Cell Therapy. As a result of the sale of our Puregraft® product line discussed in note 5 of the consolidated condensed financial statements, we do not expect significant revenues from that product line in the foreseeable future.
Cost of product revenues
Cost of product revenues relate primarily to Celution® System products and StemSource® Cell Banks and includes material, manufacturing labor, and overhead costs. The following table summarizes the components of our cost of revenues for the years ended December 31, 2014, 2013 and 2012:
|
Years ended
|
||||||||||||
|
2014
|
2013
|
2012
|
||||||||||
|
Cost of product revenues
|
$
|
2,856,000
|
$
|
3,338,000
|
$
|
3,923,000
|
||||||
|
Share-based compensation
|
84,000
|
83,000
|
77,000
|
|||||||||
|
Total cost of product revenues
|
$
|
2,940,000
|
$
|
3,421,000
|
$
|
4,000,000
|
||||||
|
Total cost of product revenues as % of product revenues
|
59
|
%
|
48
|
%
|
46
|
%
|
||||||
Cost of product revenues as a percentage of product revenues was 59%, 48% and 46% for the years ended December 31, 2014, 2013 and 2012, respectively. Fluctuation in this percentage is to be expected due to the product mix, distributor and direct sales mix, geographic mix and allocation of overhead. In 2014, we also experienced the impact of the weakness of the Japanese Yen, which resulted in a decrease to our gross profit margin.
The future: We expect to continue to see variation in our gross profit margin as the product mix comprising revenues fluctuates.
Development revenues
The following table summarizes the components of our development revenues for the years ended December 31, 2014, 2013 and 2012:
|
Years ended
|
||||||||||||
|
2014
|
2013
|
2012
|
||||||||||
|
Government contract (BARDA) and other
|
2,645,000
|
$
|
3,257,000
|
381,000
|
||||||||
|
Development (Olympus)
|
$
|
—
|
638,000
|
$
|
2,882,000
|
|||||||
|
Development (Astellas)
|
—
|
—
|
2,529,000
|
|||||||||
|
Development (Senko)
|
—
|
1,179,000
|
—
|
|||||||||
|
Total development revenues
|
$
|
2,645,000
|
$
|
5,074,000
|
$
|
5,792,000
|
||||||
During the year ended December 31, 2014, we incurred $2,461,000 in qualified expenditures, and recognized a total of $2,645,000 in revenues, which included allowable fees as well as cost reimbursements. During the year ended December 31, 2013, we incurred $3,053,000 in qualified expenditures, and recognized a total of $3,257,000 in revenues, which included allowable fees as well as cost reimbursements. During the year ended December 31, 2012, we incurred $331,000 in qualified expenditures, and recognized a total of $355,000 in revenues, which included allowable fees as well as cost reimbursements. The decrease in revenues for the year ended December 31, 2014 as compared to the same period in 2013 is primarily due to the closing of the initial base period and timing of execution of the first contract option in August of 2014, as well as our outsourced animal studies which were largely completed in the second half of 2013 and the first half of 2014. The increase in revenues for the year ended December 31, 2013 as compared to the same period in 2012 is primarily due to the initial base period beginning in the fourth quarter of 2012.
We recognize deferred revenues, related party, as development revenue when certain performance obligations are met (i.e., using a proportional performance approach). No development revenue was recognized for the year ended December 31, 2014. During the year ended December 31, 2013, we recognized $638,000 of revenue associated with our arrangements with Olympus as a result of the United States Court of Appeals upholding the FDA’s previous determination that our cell processing devices were not substantially equivalent to the cited predicate devices. The recognition of revenue associated with this event reflects the completion of our efforts expended to use commercially reasonable efforts to obtain device regulatory approvals in the United States as it pertains to the 510(k) pathway. During the year ended December 31, 2012, we recognized $2,882,000 of revenue associated with our arrangements with Olympus Corporation as a result of two remaining milestones for the APOLLO (European pilot safety and feasibility study in patients with acute myocardial infarction) and PRECISE (European pilot safety and feasibility study in patients with chronic myocardial ischemia) clinical trials that were reached upon the completion of all patient follow up procedures and recognition of a regulatory milestone triggered upon us obtaining Class I Device Clearance for Celution® and a number of our other products in Japan.
In February 2013, we entered into a mutual termination and release agreement with Senko, whereby the Distribution Agreement and all Senko rights, licenses and privileges granted under the Distribution Agreement terminated and reverted to the Company. As a result of this Termination Agreement, we were obligated to pay Senko $1,200,000 in six quarterly installment payments of $200,000 each through May 2014. At the time of the Termination Agreement, we had a balance of $2,379,000 in deferred revenues on our balance sheet relating to the payments received from Senko in the past pursuant to the Distribution Agreement. At the time of the Termination Agreement, we accrued $1,200,000 of the termination fee, and recognized the remaining $1,179,000 in development revenues which reflects the Company’s efforts towards commercialization under the agreement.
The future: In August 2014, BARDA exercised Option 1 of the contract, as amended in December 2014, for us to perform research, regulatory, clinical and other tasks required for initiation of a pilot clinical trial of the Cytori Cell Therapy (DCCT-10) in thermal burn injury, amendments to the Statement of Work, and reorganization of the contract options for a total fixed fee of up to $14 million. We expect approximately half of the work associated with Option 1, as amended, to be completed by the end of 2015.
Research and development expenses
Research and development expenses relate to the development of a technology platform that involves using adipose tissue as a source of autologous regenerative cells for therapeutic applications as well as the continued development efforts related to our Celution® System.
Research and development expenses include costs associated with the design, development, testing and enhancement of our products, regulatory fees, laboratory supplies, pre-clinical and clinical studies. The following table summarizes the components of our research and development expenses for the years ended December 31, 2014, 2013 and 2012:
|
Years ended
|
||||||||||||
|
2014
|
2013
|
2012
|
||||||||||
|
Research and development
|
$
|
14,527,000
|
$
|
16,444,000
|
$
|
12,784,000
|
||||||
|
Development milestone (Joint Venture)
|
—
|
16,000
|
219,000
|
|||||||||
|
Stock-based compensation
|
578,000
|
605,000
|
625,000
|
|||||||||
|
Total research and development expenses
|
$
|
15,105,000
|
$
|
17,065,000
|
$
|
13,628,000
|
||||||
Research and development expenses for the year ended December 31, 2014 as compared to the same period in 2013 decreased due to a decrease of $554,000 of supplies and preclinical activity expenses related to the completion of the base period of the BARDA contract, $518,000 in product samples due to decreased enrollment in the ATHENA trials, and $897,000 in depreciation costs related to accelerated depreciation of equipment in 2013 due to the termination of our Joint Venture with Olympus.
Research and development expenses for the year ended December 31, 2013 as compared to the same period in 2012 increased primarily due to the increase in salary and related benefits expense (excluding share-based compensation) of $590,000, an increase in professional services expenses of $1,025,000 and increase in research supplies expense of $987,000 due to increase in our clinical and research activities including our efforts related to BARDA.
The future: We expect research and development expenditures to increase from current levels as we plan to start two clinical trials in 2015; STAR, a trial for treatment of impaired hand function in scleroderma, and ACT-OA, a trial for the potential treatment for osteoarthritis of the knee. In addition, we expect increased expenditures due to our development work under our amended Option 1 of the BARDA contract.
Sales and marketing expenses
Sales and marketing expenses include costs of sales and marketing personnel, tradeshows, physician training, and promotional activities and materials. The following table summarizes the components of our sales and marketing expenses for the years ended December 31, 2014, 2013 and 2012:
|
Years ended
|
||||||||||||
|
2014
|
2013
|
2012
|
||||||||||
|
Sales and marketing
|
$
|
5,946,000
|
$
|
8,329,000
|
$
|
8,764,000
|
||||||
|
Stock-based compensation
|
460,000
|
697,000
|
724,000
|
|||||||||
|
Total sales and marketing
|
$
|
6,406,000
|
$
|
9,026,000
|
$
|
9,488,000
|
||||||
The decrease in sales and marketing expense during the year ended December 31, 2014 as compared to the same period in 2013 was mainly attributed to the decrease in salary and related benefits expense (excluding share-based compensation) of $1,082,000 related to a decrease in headcount of 10 full-time equivalent employees, $577,000 of professional services expenses, $285,000 in travel, and $231,000 in advertising and promotion. These decreases are mostly attributable to the expense reduction initiatives implemented throughout 2014 in our Sales and Marketing organization.
The decrease in sales and marketing expense during the year ended December 31, 2013 as compared to the same period in 2012 was mainly attributed to the decrease in salary and related benefits expense (excluding share-based compensation) of $662,000 due to a decrease in headcount, and a decrease in travel of $168,000, by an increase in professional services of $337,000.
The future: As we obtain the full benefit of cost curtailment activities implemented through 2014, we expect sales and marketing expenditures to decrease modestly in 2015.
General and administrative expenses
General and administrative expenses include costs for administrative personnel, legal and other professional expenses, and general corporate expenses. The following table summarizes the general and administrative expenses for the years ended December 31, 2014, 2013 and 2012:
|
Years ended
|
||||||||||||
|
2014
|
2013
|
2012
|
||||||||||
|
General and administrative
|
$
|
13,974,000
|
$
|
13,808,000
|
$
|
13,194,000
|
||||||
|
Stock-based compensation
|
1,979,000
|
2,223,000
|
2,478,000
|
|||||||||
|
Total general and administrative expenses
|
$
|
15,953,000
|
$
|
16,031,000
|
$
|
15,672,000
|
||||||
For the year ended December 31, 2014 as compared to the same period in 2013, the general and administrative expenses (excluding share-based compensation) remained relatively consistent. However, within general and administrative expenses we had a decrease in salary and related benefits expense (excluding share-based compensation) of $730,000 related to a decrease of headcount of 13 full-time equivalent employees, partially offset by an increase in professional services (which includes legal and consulting services) of $702,000.
For the year ended December 31, 2013 as compared to the same period in 2012, the general and administrative expenses (excluding share-based compensation) increased due to non-cash accounts receivable charges of $1,141,000, an increase in professional services of $301,000 and were offset by reduced labor costs.
The future: Based on cost curtailment initiatives implemented throughout 2014, we expect general and administrative expenditures to decrease modestly in 2015.
Stock-based compensation expenses
Stock-based compensation expenses include charges related to options and restricted stock awards issued to employees, directors and non-employees along with charges related to the employee stock purchases under the Employee Stock Purchase Plan (ESPP). We measure stock-based compensation expense based on the grant-date fair value of any awards granted to our employees. Such expense is recognized over the period of time that employees provide service to us and earn all rights to the awards.
The following table summarizes the components of our stock-based compensation for the years ended December 31, 2014, 2013 and 2012:
|
Years ended
|
||||||||||||
|
2014
|
2013
|
2012
|
||||||||||
|
Cost of product revenues
|
$
|
84,000
|
$
|
83,000
|
$
|
77,000
|
||||||
|
Research and development related
|
578,000
|
605,000
|
625,000
|
|||||||||
|
Sales and marketing related
|
460,000
|
697,000
|
724,000
|
|||||||||
|
General and administrative related
|
1,979,000
|
2,223,000
|
2,478,000
|
|||||||||
|
Total stock-based compensation
|
$
|
3,101,000
|
$
|
3,608,000
|
$
|
3,904,000
|
||||||
Most of the share-based compensation expenses for the years ended December 31, 2014, 2013 and 2012 related to the vesting of stock option and restricted stock awards to employees.
The decrease in share-based compensation for the year ended December 31, 2014 as compared to the same period in 2013 is primarily due to the decrease in headcount of 37 full-time equivalent employees, the stock price decrease experienced in 2014 and share-based compensation expense reversals due to option cancellations. See Note 16 to the Consolidated Financial Statements included elsewhere herein for disclosure and discussion of share-based compensation.
The decrease in share-based compensation for the year ended December 31, 2013 as compared to the same period in 2012 is primarily due to restricted stock awards granted to our executive team during 2012. See Note 16 to the Consolidated Financial Statements included elsewhere herein for disclosure and discussion of share-based compensation.
The future. We expect to continue to grant options and stock awards to our employees, directors, and, as appropriate, to non-employee service providers. In addition, previously-granted options will continue to vest in accordance with their original terms. As of December 31, 2014, the total compensation cost related to non-vested stock options and stock awards not yet recognized for all our plans is approximately $3,944,000, which is expected to be recognized as a result of vesting under service conditions over a weighted average period of 1.77 years.
Change in fair value of warrant liability
The following is a table summarizing the change in fair value of warrant liability for the years ended December 31, 2014, 2013 and 2012:
|
Years ended December 31,
|
||||||||||||
|
2014
|
2013
|
2012
|
||||||||||
|
Change in fair value of warrant liability
|
$
|
(369,000
|
)
|
$
|
(418,000
|
)
|
$
|
(209,000
|
)
|
|||
The change in fair value of our warrant liability for the year ended December 31, 2014, is due to warrants issued in connection with this issuance of Series A 3.6% Convertible Preferred Stock in October 2014, as well as warrants re-priced related to our Loan Agreement. For the years ended December 31, 2013 and 2012, the balance relates to warrants issued in 2008 in connection with a private placement that expired in August 2013.
The future: Future changes in the fair value of the warrant liability will be recognized in earnings until such time as the warrants’ exercise price becomes fixed, or warrants are exercised or expire.
Change in fair value of option liability
The following is a table summarizing the change in fair value of option liability for the years ended December 31, 2014, 2013 and 2012:
|
Years ended
|
||||||||||||
|
2014
|
2013
|
2012
|
||||||||||
|
Change in fair value of option liability
|
$
|
—
|
$
|
(2,250,000
|
)
|
$
|
340,000
|
|||||
Changes in fair value of our put option liability are due to changes in assumptions used in estimating the value of the Put, such as bankruptcy threshold for Cytori, fair value of the Olympus Joint Venture, volatility and others.
The Put was cancelled as a result of the Joint Venture termination agreement executed in 2013.
Financing items
The following table summarizes interest income, interest expense, and other income and expenses for the years ended December 31, 2014, 2013 and 2012:
|
Years ended
|
||||||||||||
|
2014
|
2013
|
2012
|
||||||||||
|
Loss on asset disposal
|
$
|
42,000
|
$
|
(257,000
|
)
|
$
|
—
|
|||||
|
Loss on debt extinguishment
|
—
|
(708,000
|
)
|
$
|
—
|
|||||||
|
Interest income
|
6,000
|
4,000
|
4,000
|
|||||||||
|
Interest expense
|
(4,371,000
|
)
|
(3,396,000
|
)
|
(3,386,000
|
)
|
||||||
|
Other income (expense), net
|
(608,000
|
)
|
(438,000
|
)
|
(314,000
|
)
|
||||||
|
Gain on Puregraft divestiture
|
—
|
4,453,000
|
—
|
|||||||||
|
Gain on previously held equity interest in joint venture
|
—
|
4,892,000
|
—
|
|||||||||
|
Total
|
$
|
(4,931,000
|
)
|
$
|
4,550,000
|
$
|
(3,696,000
|
)
|
||||
| · | Interest expense increased for the year ended December 31, 2014 as compared to 2013, due to cash interest and non-cash amortization of debt and warrant costs related to our $27.0 million Term Loan executed in June 2013, and increased accretion expense related to our Joint Venture liability. |
| · | We recorded a beneficial conversion feature of $1,169,000 in December of 2014, related to the issuance of our Series A 3.6% Convertible Preferred Stock. The fair value of the common stock into which the Series A 3.6% Preferred Stock was convertible on the respective dates of issuance of the preferred stock exceeded the proceeds allocated to the Series A 3.6% Convertible Preferred Stock, resulting in a beneficial conversion feature. |
| · | Interest expense increased for the year ended December 31, 2013 as compared to 2012 due to cash interest and non-cash amortization of debt issuance costs and debt discount for our $27.0 million term loan executed in June 2013. |
| · | The changes in other income (expense) in 2014, 2013 and 2012 resulted primarily from changes in foreign currency exchange rates. |
| · | In connection with the June 2013 Loan Agreement, a loss on debt extinguishment was recorded that relates to the payoff of the prior loan obligation. See Note 11 to the Consolidated Financial Statements for further information. |
| · | Refer to Note 5 of the Notes to Consolidated Financial Statements for discussion of gain on Puregraft divestiture. |
| · | Refer to Note 4 of the Notes to Consolidated Financial Statements for discussion of gain on previously held equity interest in joint venture. |
The future: Subject to our future financing activities, we expect interest expense in 2015 to remain relatively stable as we continue to pay interest on the $27.0 million Term Loan that was amended in 2013 and in 2014 and record accretion expense related to our acquisition of the Joint Venture.
Liquidity and Capital Resources
Short-term and long-term liquidity
The following is a summary of our key liquidity measures at December 31, 2014 and 2013:
|
As of December 31,
|
||||||||
|
2014
|
2013
|
|||||||
|
Cash and cash equivalents
|
$
|
14,622,000
|
$
|
15,506,000
|
||||
|
Current assets
|
$
|
21,686,000
|
$
|
24,577,000
|
||||
|
Current liabilities
|
15,917,000
|
14,906,000
|
||||||
|
Working capital
|
$
|
5,769,000
|
$
|
9,671,000
|
||||
We incurred net losses of $37,368,000, $26,177,000 and $32,279,000 for the years ended December 31, 2014, 2013 and 2012, respectively. We have an accumulated deficit of $338,273,000 as of December 31, 2014. Additionally, we have used net cash of $30,330,000, $34,563,000 and $32,193,000 to fund our operating activities for years ended December 31, 2014, 2013 and 2012, respectively. At December 31, 2014, the current portion of long-term debt obligations is $7.4 million and the Joint Venture purchase obligation is $3.0 million. The combination of these facts and the balance of cash and cash equivalents at December 31, 2014 raises substantial doubt as to the Company’s ability to continue as a going concern.
To date, these operating losses have been funded primarily from outside sources of invested capital and gross profits. We have had, and we will likely continue to have, an ongoing need to raise additional cash from outside sources to fund our future operations. However, our ability to raise capital was adversely affected once FDA put a hold on our Athena trials in mid-2014, which had an adverse impact to stock price performance and our corresponding ability to restructure our debt. If we are unsuccessful in our efforts to raise outside capital in the near term, we will be required to significantly reduce our research, development, and administrative operations, including reduction of our employee base, in order to offset the lack of available funding.
We are pursuing financing opportunities in both the private and public debt and equity markets as well as through strategic corporate partnerships. We have an established history of raising capital through these platforms, and we are currently involved in negotiations with multiple parties. Our efforts in 2014 to raise capital took longer than we initially anticipated. We expect to continue to utilize our cash and cash equivalents to fund operations at least through June of 2015, subject to minimum cash and cash liquidity requirements of the Loan and Security Agreement with the Lenders, which requires that we maintain at least three months of cash on hand to avoid an event of default under the Loan and Security Agreement. We continue to seek additional cash through product revenues, strategic collaborations, and future sales of equity or debt securities. Although there can be no assurance given, we hope to successfully complete one or more additional financing transactions and corporate partnerships in the near-term. Without this additional capital, current working capital and cash generated from sales and containment of operating costs will not provide adequate funding for research, sales and marketing efforts, clinical and preclinical trials, and product development activities at their current levels. If sufficient capital is not raised, we will at a minimum need to significantly reduce or curtail our research and development and other operations, and this could negatively affect our ability to achieve corporate growth goals.
Specifically, we have prepared an operating plan that calls for us to reduce operations to focus almost entirely on one US clinical program and the supply of current products to existing or new distribution channels. In addition, as part of this plan, there would be minimal expenditures for ongoing scientific research, product development or clinical research. This impacts research and development headcount, external subcontractor expenditures, capital outlay and general and administrative expenditures related to the supervision of such activities. In parallel, we would significantly reduce administrative staff and salaries consistent with the overall reduction in scope of operations. In aggregate, such reductions could result in eliminations of roles for the majority of the Company’s current staff and the deferral or elimination of all ongoing development projects until such time that cash resources were available from operations or outside sources to re-establish development and growth plans. Management is currently reviewing contractual obligations related to the pre-clinical and clinical commitments along with minimum purchase requirements to include deferral of such commitments as part of this plan. While management is actively pursuing it’s near term financial and strategic alternatives it is also, in parallel, continuing to evaluate the timing of implementation of the alternative operating plan and the initiation of the identified reductions.
From January 1, 2012 to December 31, 2014, we have financed our operations primarily by:
| · | In December 2012, we entered into an underwriting agreement with Lazard Capital Markets, LLC (underwriter), relating to the issuance and sale of 7,020,000 shares of our common stock. This price to the public in this offering was $2.85 per share and the underwriter purchased the shares from us at a price of $2.69 per share. The transaction was completed on December 19, 2012 raising approximately $20,007,000 in gross proceeds before deducting underwriting discounts and commissions and other offering expenses payable by us. |
| · | In January 2013, Lazard Capital Markets, LLC (underwriter) exercised its overallotment option and as a result we sold an additional 1,053,000 shares raising approximately $3,000,000 in gross proceeds before deducting underwriting discounts and commissions and other offering expenses payable by us. |
| · | On June 28, 2013 we entered into the Loan Agreement with Oxford Finance LLC and Silicon Valley Bank (together, the “Lenders”), pursuant to which the Lenders funded an aggregate principal amount of $27.0 million (Term Loan), subject to the terms and conditions set forth in the loan agreement. The Term Loan accrues interest at a fixed rate of 9.75% per annum. In connection with the Term Loan, on June 28, 2013, we issued to the Lenders warrants to purchase up to an aggregate of 596,553 shares of our common stock at an exercise price of $2.26 per share. These warrants are immediately exercisable and will expire on June 28, 2020. In connection with the Loan Agreement, we prepaid all outstanding amounts under the prior loan agreement, at which time our obligations under the prior loan agreement immediately terminated. The net proceeds of the Term Loans, after payment of lender fees and expenses and prepaying all the outstanding amounts relating to the prior loan agreement, were approximately $7.8 million. |
| · | On July 30, 2013, we entered into a Sale and Exclusive License/Supply Agreement with Bimini Technologies LLC (“Bimini”), pursuant to which we sold to Bimini substantially all of the assets (other than certain retained rights and licenses) of our Puregraft® product line, a series of standalone fat transplantation products that were developed to improve the predictability of outcomes for autologous fat grafting and aesthetic body contouring. The aggregate value of the consideration paid by Bimini at the execution of the agreement was $5.0 million. |
| · | On October 29, 2013, we entered into a partnership with Lorem Vascular, to commercialize Cytori Cell Therapy (OICH-D3) for the cardiovascular, renal and diabetes markets, in China, Hong Kong, Malaysia, Singapore and Australia (License/Supply Agreement), and a Common Stock Purchase Agreement. On January 30, 2014 we entered into the Amended and Restated License/Supply Agreement with Lorem Vascular (the “Restated Agreement”) expanding the licensed field to all uses excepting alopecia (hair loss). Under the Restated Agreement, Lorem Vascular committed to pay up to $500 million in license fees in the form of revenue milestones. In addition, Lorem is required to pay us 30% of their gross profits in China, Hong Kong and Malaysia for the term of the Restated Agreement. Cytori Cell Therapy is derived from our Celution® System, which enables access to a patient’s own adipose-derived regenerative cells (ADRCs) at the point-of-care. In addition, Lorem Vascular agreed to purchase our Celution® System and consumables under the Restated Agreement. Pursuant to the related Common Stock Purchase Agreement, we received $24.0 million in exchange for 8.0 million shares of our common stock issued to Lorem Vascular at $3.00 per share. The equity purchased was closed in two equal installments, in November 2013 and January 2014. |
| · | In May 2014, we and 47 holders of warrants to purchase a total of 3,156,238 shares of our common stock issued in a private offering in May 2009, agreed to extend the expiration date of the warrants from May 14, 2014 to May 14, 2015 and increase the exercise price of the warrants from $2.62 per share to $3.50 per share pursuant to an Amendment to Warrant to Purchase Common Stock. One holder of warrants did not agree to the Amendment, and their warrants, covering 38,500 shares of Common Stock, expired unexercised on May 14, 2014 in accordance with the original terms. |
| · | In May 2014, we entered into subscription agreements with certain institutional investors pursuant to which we sold a total of 4,048,584 units, with each unit consisting of one share of common stock and one warrant to purchase one share of common stock at a purchase price of $2.47 per unit, in a registered direct offering. Each warrant had an exercise price of $3.00 per share, was exercisable immediately after issuance and expires five years from the date of issuance. The transaction was completed on June 4, 2014 raising approximately $10,000,000 in gross proceeds before deducting any offering expenses or fees payable by us. Under the terms of our Placement Agent Agreement, we granted WBB Securities, LLC warrants to purchase 202,429 shares of common stock. The placement agent warrants have the same terms as the warrants issued to the purchasers in the offering, except that such warrants have an exercise price of $3.09. |
| · | In September 2014, we and 13 holders of warrants dated June 4, 2014 to purchase a total of 4,032,389 shares of our common stock agreed to amend the warrants in order to reduce the exercise price from $3.00 per share to $1.00 per share and change the expiration date from June 4, 2019 to September 10, 2014. We received proceeds of approximately $4,066,000 from the exercise of the warrants. In addition, pursuant to the terms of the amendment, upon each holder’s exercise of all warrants for cash prior to the amended expiration date, we issued additional warrants for the same number of common shares to the holders. The additional warrants have an exercise price of $2.00 per share, and are exercisable on the date that is six months and one day from the date of issuance and expire five years from the date of issuance. For those investors participating in the October 2014 issuance of Series A 3.6% Convertible Preferred Stock, we agreed to reduce the exercise price of 3,384,601 warrants from $2.00 per share to $0.5771 per share, conditioned upon shareholder approval which was obtained in January 2015. |
| · | In September 2014, we entered into a 2nd Amendment to the Loan Agreement with the Lenders pursuant to the amended Loan Agreement, under which we were provided a conditional waiver of principal payments subject to meeting certain capital raise requirements, which we achieved in October. The waiver of principal payments continues from November 1, 2014 through April 1, 2015 and thereafter we are required to make payments of principal and accrued interest in equal monthly installments of $1.0 million, sufficient to amortize the Term Loans through the maturity date. |
| · | In October, 2014, we entered into a Securities Purchase Agreement with certain institutional investors pursuant to which we sold a total of 13,500 units for a purchase price of $1,000 per unit, with each unit consisting of one share of our Series A 3.6% Convertible Preferred Stock, which is convertible into shares of our common stock with a conversion price of $0.52, and warrants to purchase up to a number of shares of common stock equal to 100% of the conversion shares under the shares of preferred stock, in a registered direct offering. Each warrant has an exercise price of $0.5771 per share, is exercisable six months after the date of issuance and expires five years from the date on which it is initially exercisable. The preferred stock and the warrants were immediately separable and were issued separately. As of December 31, 2014, 8,189 units had been converted into 15,747,000 shares of common stock. |
The following summarizes our contractual obligations and other commitments at December 31, 2014, and the effect such obligations could have on our liquidity and cash flow in future periods:
|
Payments due by period
|
||||||||||||||||||||
|
Contractual Obligations
|
Total
|
Less than 1
year
|
1 – 3 years
|
3 – 5 years
|
More than
5 years
|
|||||||||||||||
|
Long-term obligations
|
$
|
26,863,000
|
$
|
7,462,000
|
$
|
19,401,000
|
$
|
—
|
$
|
—
|
||||||||||
|
Interest commitment on long-term obligations
|
3,670,000
|
2,205,000
|
1,465,000
|
—
|
—
|
|||||||||||||||
|
Operating lease obligations
|
6,296,000
|
2,183,000
|
4,086,000
|
27,000
|
—
|
|||||||||||||||
|
Joint Venture purchase obligation*
|
3,297,000
|
3,297,000
|
—
|
—
|
—
|
|||||||||||||||
|
Clinical research study obligations
|
1,216,000
|
1,216,000
|
—
|
—
|
—
|
|||||||||||||||
|
Total
|
$
|
41,342,000
|
$
|
16,363,000
|
$
|
24,952,000
|
$
|
27,000
|
$
|
—
|
||||||||||
* We have various payment options which could result in the acceleration or deferral of the Joint Venture purchase obligation. See Note 4 to the Consolidated Condensed Financial Statements for discussion of our acquisition of Olympus’ interest in the Joint Venture.
Net cash used in or provided by operating, investing and financing activities for the years ended December 31, 2014, 2013 and 2012 is summarized as follows:
|
Years Ended
|
||||||||||||
|
2014
|
2013
|
2012
|
||||||||||
|
Net cash used in operating activities
|
$
|
(30,330,000
|
)
|
$
|
(34,563,000
|
)
|
$
|
(32,193,000
|
)
|
|||
|
Net cash provided by (used in) investing activities
|
(1,343,000
|
)
|
3,686,000
|
(1,204,000
|
)
|
|||||||
|
Net cash provided by financing activities
|
30,874,000
|
20,772,000
|
22,192,000
|
|||||||||
Operating activities
Operating activities, inclusive of research and development, sales and marketing, and general and administrative efforts, offset in part by product sales, generated a $37,368,000 net loss for the year ended December 31, 2014. The operating cash impact of this loss was $30,330,000, after adjusting for non-cash share-based compensation, other adjustments for material non-cash activities, such as depreciation, amortization, change in fair value of warrants, and changes in working capital due to timing of product shipments (accounts receivable) and payment of liabilities. Overall, our operational cash use decreased as compared to same period in 2013, due primarily to an increase in cash collections from accounts receivable, offset by increased in payments of accounts payable and accrued liabilities.
Operating activities, inclusive of research and development, sales and marketing, and general and administrative efforts, offset in part by product sales, generated a $26,177,000 net loss for the year ended December 31, 2013. The operating cash impact of this loss was $34,563,000, after adjusting for non-cash share-based compensation, other adjustments for material non-cash activities, such as depreciation, amortization, change in fair value of option liabilities and warrants, gain on sale of assets and acquisition of Joint Venture, and changes in working capital due to timing of product shipments (accounts receivable) and payment of liabilities.
Operating activities, inclusive of research and development, sales and marketing, and general and administrative efforts, offset in part by product sales, generated a $32,279,000 net loss for the year ended December 31, 2012. The operating cash impact of this loss was $32,193,000, after adjusting for the recognition of development revenue of $381,000, and other non-cash development revenues of $5,411,000, the consideration of non-cash share-based compensation, other adjustments for material non-cash activities, such as depreciation, amortization, change in fair value of option liabilities and warrants, and changes in working capital due to timing of product shipments (accounts receivable) and payment of liabilities.
Investing activities
Net cash used in investing activities for the year ended December 31, 2014 resulted in cash outflows for payment of a license termination fee of $400,000, expenditures for intellectual property of $255,000 and for purchases of property and equipment of $764,000 offset by proceeds from the sale of assets of $76,000.
Net cash provided by investing activities for the year ended December 31, 2013 resulted from cash outflows for payment of a license termination fee of $800,000 and for purchases of property and equipment and cash inflows of $5,000,000 from the sale of the Puregraft product line.
Net cash used in investing activities for the year ended December 31, 2012 resulted primarily from purchases of property and equipment, primarily for use in clinical trials and research.
Financing Activities
The net cash provided by financing activities for the year ended December 31, 2014 related primarily to a sale of common stock, preferred stock, and exercise of warrants. In October 2014, we sold a total of 13,500 units for a purchase price of $1,000 per unit, with each unit consisting of one share of our Series A 3.6% Convertible Preferred Stock, which is convertible into shares of our common stock, for approximately $12,370,000, net of issuance costs. In September 2014, 4,032,389 warrants were exercised and we received proceeds of approximately $4,066,000. In May 2014, we sold 4,048,584 units, consisting of one share of common stock and one warrant to purchase one share of common stock, for approximately $10,000,000 in gross proceeds in connection with a registered direct offering to certain institutional investors. We received $9,000,000 in January 2014 pursuant to our Common Stock Purchase Agreement with Lorem Vascular that was executed in October of 2013, partially offset by principal payments of $1,962,000 primarily relating to our $27.0 million loan and $2,262,000 payment towards our Joint Venture purchase obligation.
The net cash provided by financing activities for the year ended December 31, 2013 related primarily to a sale to Lorem Vascular of 4,000,000 shares for $12,000,000 in gross proceeds, as well as an additional $3,000,000 in gross proceeds (received in 2013) which related to the second closing of an additional 4,000,000 shares in January 2014. The balance of $9,000,000 in gross proceeds for the second closing was received in 2014. In addition, there was a sale of 1,053,000 shares for approximately $3,000,000 in gross proceeds in connection with the underwriter exercising the option to purchase additional shares relating to our December 2012 public offering offset by principal payments of $22,304,000 primarily relating to our $25.0 million loan. Additionally, in June 2013, we entered into a Loan Agreement with the Lenders pursuant to which the Lenders funded an aggregate principal amount of $27,000,000 offset by $1,744,000 debt issuance costs and loan fees. Net cash provided by this transaction was approximately $7.8 million after repayment of the prior outstanding loan balance, debt issuance costs and loan fees. Also, during the year ended December 31, 2013, we paid $221,000 payment towards our Joint Venture purchase obligation.
The net cash provided by financing activities for the year ended December 31, 2012 related primarily to a sale of 1,750,000 shares for approximately $4,881,000 in net proceeds in connection with our common stock purchase agreement with Seaside entered into on July 11, 2011, the sale of 7,020,000 shares of common stock and for approximately $18,590,000 in net proceeds in the December 2012 public offering and proceeds from exercise of warrants and employee stock options and employee stock purchase plan of $1,413,000.
Critical Accounting Policies and Significant Estimates
The preparation of financial statements in conformity with accounting principles generally accepted in the United States requires us to make estimates and assumptions that affect the reported amounts of our assets, liabilities, revenues and expenses, and that affect our recognition and disclosure of contingent assets and liabilities.
While our estimates are based on assumptions we consider reasonable at the time they were made, our actual results may differ from our estimates, perhaps significantly. If results differ materially from our estimates, we will make adjustments to our financial statements prospectively as we become aware of the necessity for an adjustment.
We believe it is important for you to understand our most critical accounting policies. These are our policies that require us to make our most significant judgments and, as a result, could have the greatest impact on our future financial results.
Revenue Recognition
In accordance with the Securities and Exchange Commission’s guidance, we recognize revenue from product sales when the following fundamental criteria are met: (i) persuasive evidence of an arrangement exists, (ii) delivery has occurred, (iii) the price to the customer is fixed or determinable and (iv) collection of the resulting accounts receivable is reasonably assured. For customers that have not developed a sufficient payment history with us or for whom a letter of credit is not in place at the time of the transaction, we defer revenues until collectability is reasonably assured.
For all sales, we use a binding purchase order or a signed agreement as evidence of an arrangement. If the other revenue recognition criteria are met, revenue for these product sales is recognized upon delivery to the customer, as all risks and rewards of ownership have been substantively transferred to the customer at that point. For sales to customers who arrange for and manage the shipping process, we recognize revenue upon shipment from our facilities. Shipping and handling costs that are billed to our customers are classified as revenue. The customer’s obligation to pay and the payment terms are set at the time of delivery and are not dependent on the subsequent use or resale of our products. For sales where all revenue recognition criteria are not met, revenue is deferred and related inventory remains on our books.
For sales that include multiple deliverables, such as sales of our StemSource® Cell Bank (cell bank), we account for products or services (deliverables) separately rather than as a combined unit. Stem cell banks typically consist of a complex array of equipment, proprietary knowledge, license rights, and services, including one or more StemSource® devices, a cryogenic freezer, measuring and monitoring equipment, and a database patient tracking system. In addition, we typically provide consulting, installation, and training services. Web hosting, technical support and maintenance services are generally provided for a period of up to one year subsequent to the date of sale. FASB authoritative guidance requires an evaluation of these deliverables to determine the appropriate “units of accounting” for purposes of revenue recognition. Each cell bank is customized to provide the best solution for the customer. Depending on customers’ needs, all or combination of the following units of accounting will apply to cell bank transactions:
| · | initial consulting services; |
| · | license rights and standard operating procedures; |
| · | equipment and supplies; |
| · | installation services; |
| · | training services; |
| · | database hosting services; |
| · | technical support services; and |
| · | maintenance services. |
FASB authoritative guidance establishes a selling price hierarchy for determining the selling price of a deliverable, which is based on: (a) vendor-specific objective evidence (“VSOE”); (b) third-party evidence (“TPE”); or (c) management estimates. This guidance requires arrangement consideration to be allocated at the inception of the arrangement to all deliverables using the relative selling price method. For our cell bank sales, we establish relative selling prices for all deliverables based on vendor-specific quotes for comparable services when available. In the absence of VSOE, we use competitors’ products or services considered largely interchangeable with our own or management’s best estimate. Revenue allocated to each unit of accounting is calculated and recognized based on the relative selling price of each deliverable. Future services such as web hosting and ongoing maintenance are deferred and recognized into income as the services are provided, generally over one year following the installation of the equipment.
Accounts Receivable
Accounts receivable are recorded at the invoiced amount and do not bear interest. Amounts collected on accounts receivable are included in net cash provided by operating activities in the consolidated statements of cash flows. The Company maintains an allowance for doubtful accounts for estimated losses inherent in its accounts receivable portfolio. In establishing the required allowance, management considers historical losses adjusted to take into account current market conditions and our customers’ financial condition, the amount of receivables in dispute, and the current receivables aging and current payment patterns. Account balances are charged off against the allowance after all means of collection have been exhausted and the potential for recovery is considered remote.
Impairment
We assess certain of our long-lived assets, such as property and equipment and intangible assets other than goodwill, for potential impairment when there is a change in circumstances that indicates carrying values of assets may not be recoverable. Such long-lived assets are deemed to be impaired when the undiscounted cash flows expected to be generated by the asset (or asset group) are less than the asset’s carrying amount. Any required impairment loss would be measured as the amount by which the asset’s carrying value exceeds its fair value, and would be recorded as a reduction in the carrying value of the related asset and a charge to operating expense. We recognized no impairment losses during any of the periods presented in these financial statements.
Goodwill and Intangibles
Goodwill is reviewed for impairment annually or more frequently when events or changes in circumstances indicate that fair value of the reporting unit has been reduced to less than its carrying value. We perform our impairment test annually during the fourth quarter. In September 2011, the FASB issued revised guidance to simplify how entities test goodwill for impairment. Under the revised guidance, entities have the option to first assess qualitative factors to determine whether it is more likely than not that the fair value of a reporting unit is less than its carrying amount as a basis for determining whether it is necessary to perform the two-step goodwill impairment test described in Accounting Standards Codification Topic 350. If, after assessing qualitative factors, an entity determines it is not more likely than not that the fair value of a reporting unit is less than its carrying amount, then performing the two-step impairment test is unnecessary. If deemed necessary, a two-step test is used to identify the potential impairment and to measure the amount of goodwill impairment, if any. The first step is to compare the fair value of the reporting unit with its carrying amount, including goodwill. If the fair value of the reporting unit exceeds its carrying amount, goodwill is considered not impaired; otherwise, there is an indication that goodwill may be impaired and the amount of the loss, if any, is measured by performing step two. Under step two, the impairment loss, if any, is measured by comparing the implied fair value of the reporting unit goodwill with the carrying amount of goodwill.
Stock-based compensation
The estimated fair value of stock-based awards exchanged for employee and non-employee director services are expenses over the requisite service period. For purposes of calculating stock-based compensation, we estimate the fair value of stock options and shares issued under the Employee Stock Purchase Plan using a Black-Scholes option-pricing model. The determination of the fair value of stock-based payment awards utilizing the Black-Scholes model is affected by our stock price and a number of assumptions, including expected volatility, expected life, risk-free interest rate and expected dividends. The expected volatility is based on the historical volatility of our common stock over the most recent period commensurate with the estimated expected term of the stock options. The expected life of the stock options is based on historical and other economic data trended into the future. The risk-free interest rate assumption is based on observed interest rates appropriate for the expected terms of our stock options. The dividend yield assumption is based on our history and expectation of no dividend payouts. The fair value of restricted stock agreements granted is based on the market price of our common stock on the day of the grant.
Warrant Liability
Warrants issued in connection with our preferred stock offering as well as our Letter Agreement with the Lenders do not trade in an active securities market, and as such, we estimate the fair value of these warrants using Black Scholes or Monte Carlo option pricing models. Following the authoritative accounting guidance, warrants with variable exercise price features are accounted for as liabilities, with changes in the fair value included in operating expenses. The Company estimated the fair value of the warrants immediately before and after modification using an option pricing model to reclassify its fair value from additional paid-in capital to warrant liability.
Recent Accounting Pronouncements
See Note 2 to the Consolidated Financial Statements included elsewhere herein for disclosure and discussion of new accounting standards.
We are exposed to market risk related to fluctuations in interest rates and in foreign currency exchange rates.
Interest Rate Exposure
We are not subject to market risk due to fluctuations in interest rates on our long-term obligations as they bear a fixed rate of interest. Our exposure relates primarily to short-term investments, including funds classified as cash equivalents. As of December 31, 2014, all excess funds were invested in money market funds and other highly liquid investments, therefore our interest rate exposure is not considered to be material.
Foreign Currency Exchange Rate Exposure
Our exposure to market risk due to fluctuations in foreign currency exchange rates relates primarily to our activities in Europe and Japan. Transaction gains or losses resulting from cash balances and revenues have not been significant in the past and we are not currently engaged in any hedging activity in the Euro, the Yen or other currencies. Based on our cash balances and revenues derived from markets other than the United States for the year ended December 31, 2014, a hypothetical 10% adverse change in the Euro or Yen against the U.S. dollar would not result in a material foreign currency exchange loss. Consequently, we do not expect that reductions in the value of such sales denominated in foreign currencies resulting from even a sudden or significant fluctuation in foreign exchange rates would have a direct material impact on our financial position, results of operations or cash flows.
Notwithstanding the foregoing, the indirect effect of fluctuations in interest rates and foreign currency exchange rates could have a material adverse effect on our business, financial condition and results of operations. For example, foreign currency exchange rate fluctuations may affect international demand for our products. In addition, interest rate fluctuations may affect our customers’ buying patterns. Furthermore, interest rate and currency exchange rate fluctuations may broadly influence the United States and foreign economies resulting in a material adverse effect on our business, financial condition and results of operations.
|
Page
|
|
|
Reports of KPMG LLP, Independent Registered Public Accounting Firm
|
44
|
|
Consolidated Balance Sheets as of December 31, 2014 and 2013
|
46
|
|
Consolidated Statements of Operations and Comprehensive Loss for the years ended December 31, 2014, 2013 and 2012
|
47
|
|
Consolidated Statements of Stockholders’ (Deficit) Equity for the years ended December 31, 2014, 2013 and 2012
|
48
|
|
Consolidated Statements of Cash Flows for the years ended December 31, 2014, 2013 and 2012
|
49
|
|
Notes to Consolidated Financial Statements
|
51
|
| PART I. | FINANCIAL INFORMATION |
| Item 1. | Financial Statements |
Report of Independent Registered Public Accounting Firm
The Board of Directors and Stockholders
Cytori Therapeutics, Inc.:
We have audited the accompanying consolidated balance sheets of Cytori Therapeutics, Inc. and subsidiaries (the Company) as of December 31, 2014 and 2013, and the related consolidated statements of operations and comprehensive loss, stockholders’ (deficit) equity, and cash flows for each of the years in the three‑year period ended December 31, 2014. In connection with our audits of the consolidated financial statements, we have also audited the accompanying schedule of valuation and qualifying accounts. These consolidated financial statements and financial statement schedule are the responsibility of the Company’s management. Our responsibility is to express an opinion on these consolidated financial statements based on our audits.
We conducted our audits in accordance with the standards of the Public Company Accounting Oversight Board (United States). Those standards require that we plan and perform the audit to obtain reasonable assurance about whether the financial statements are free of material misstatement. An audit includes examining, on a test basis, evidence supporting the amounts and disclosures in the financial statements. An audit also includes assessing the accounting principles used and significant estimates made by management, as well as evaluating the overall financial statement presentation. We believe that our audits provide a reasonable basis for our opinion.
In our opinion, the consolidated financial statements referred to above present fairly, in all material respects, the financial position of Cytori Therapeutics, Inc. and subsidiaries as of December 31, 2014 and 2013, and the results of their operations and their cash flows for each of the years in the three‑year period ended December 31, 2014, in conformity with U.S. generally accepted accounting principles. Also, in our opinion, the related financial statement schedule, when considered in relation to the basic consolidated financial statements taken as a whole, presents fairly, in all material respects, the information set forth therein.
The accompanying consolidated financial statements and financial statement schedule have been prepared assuming that the Company will continue as a going concern. As discussed in note 1 to the consolidated financial statements, the Company’s recurring losses from operations, liquidity position, and debt service requirements raises substantial doubt about its ability to continue as a going concern. Management’s plans in regard to these matters are also described in note 1. The consolidated financial statements and financial statement schedule do not include any adjustments that might result from the outcome of this uncertainty.
We also have audited, in accordance with the standards of the Public Company Accounting Oversight Board (United States), Cytori Therapeutics, Inc.’s internal control over financial reporting as of December 31, 2014, based on criteria established in Internal Control – Integrated Framework (1992) issued by the Committee of Sponsoring Organizations of the Treadway Commission (COSO), and our report dated March 16, 2015 expressed an unqualified opinion on the effectiveness of the Company’s internal control over financial reporting.
|
|
/s/ KPMG LLP
|
|
|
|
|
San Diego, California
|
|
|
March 16, 2015
|
|
Report of Independent Registered Public Accounting Firm
The Board of Directors and Stockholders
Cytori Therapeutics, Inc:
We have audited Cytori Therapeutics, Inc. and subsidiaries (the Company) internal control over financial reporting as of December 31, 2014, based on criteria established in Internal Control – Integrated Framework (1992) issued by the Committee of Sponsoring Organizations of the Treadway Commission (COSO) . The Company’s management is responsible for maintaining effective internal control over financial reporting and for its assessment of the effectiveness of internal control over financial reporting, included in the accompanying Management’s Report on Internal Control over Financial Reporting (Item 9A(b)). Our responsibility is to express an opinion on the Company’s internal control over financial reporting based on our audit.
We conducted our audit in accordance with the standards of the Public Company Accounting Oversight Board (United States). Those standards require that we plan and perform the audit to obtain reasonable assurance about whether effective internal control over financial reporting was maintained in all material respects. Our audit included obtaining an understanding of internal control over financial reporting, assessing the risk that a material weakness exists, and testing and evaluating the design and operating effectiveness of internal control based on the assessed risk. Our audit also included performing such other procedures as we considered necessary in the circumstances. We believe that our audit provides a reasonable basis for our opinion.
A company’s internal control over financial reporting is a process designed to provide reasonable assurance regarding the reliability of financial reporting and the preparation of financial statements for external purposes in accordance with generally accepted accounting principles. A company’s internal control over financial reporting includes those policies and procedures that (1) pertain to the maintenance of records that, in reasonable detail, accurately and fairly reflect the transactions and dispositions of the assets of the company; (2) provide reasonable assurance that transactions are recorded as necessary to permit preparation of financial statements in accordance with generally accepted accounting principles, and that receipts and expenditures of the company are being made only in accordance with authorizations of management and directors of the company; and (3) provide reasonable assurance regarding prevention or timely detection of unauthorized acquisition, use, or disposition of the company’s assets that could have a material effect on the financial statements.
Because of its inherent limitations, internal control over financial reporting may not prevent or detect misstatements. Also, projections of any evaluation of effectiveness to future periods are subject to the risk that controls may become inadequate because of changes in conditions, or that the degree of compliance with the policies or procedures may deteriorate.
In our opinion, the Company maintained, in all material respects, effective internal control over financial reporting as of December 31, 2014, based on criteria established in Internal Control – Integrated Framework (1992) issued by the Committee of Sponsoring Organizations of the Treadway Commission (COSO).
We also have audited, in accordance with the standards of the Public Company Accounting Oversight Board (United States), the consolidated balance sheets of the Company as of December 31, 2014 and 2013, and the related consolidated statements of operations and comprehensive loss, stockholders’ (deficit) equity, and cash flows for each of the years in the three-year period ended December 31, 2014, and our report dated March 16, 2015 expressed an unqualified opinion on those consolidated financial statements.
|
|
/s/ KPMG LLP
|
|
|
|
|
San Diego, California
|
|
|
March 16, 2015
|
|
|
|
|
CYTORI THERAPEUTICS, INC.
CONSOLIDATED BALANCE SHEETS
|
As of December 31,
|
||||||||
|
2014
|
2013
|
|||||||
|
Assets
|
||||||||
|
Current assets:
|
||||||||
|
Cash and cash equivalents
|
$
|
14,622,000
|
$
|
15,506,000
|
||||
|
Accounts receivable, net of reserves of $1,523,000 and of $1,445,000 in 2014 and 2013, respectively
|
1,243,000
|
4,152,000
|
||||||
|
Inventories, net
|
4,829,000
|
3,694,000
|
||||||
|
Other current assets
|
992,000
|
1,225,000
|
||||||
|
Total current assets
|
21,686,000
|
24,577,000
|
||||||
|
Property and equipment, net
|
1,583,000
|
1,054,000
|
||||||
|
Restricted cash and cash equivalents
|
350,000
|
350,000
|
||||||
|
Other assets
|
1,763,000
|
2,812,000
|
||||||
|
Intangibles, net
|
9,415,000
|
9,345,000
|
||||||
|
Goodwill
|
3,922,000
|
3,922,000
|
||||||
|
Total assets
|
$
|
38,719,000
|
$
|
42,060,000
|
||||
|
Liabilities and Stockholders’ (Deficit) Equity
|
||||||||
|
Current liabilities:
|
||||||||
|
Accounts payable and accrued expenses
|
$
|
5,546,000
|
$
|
6,077,000
|
||||
|
Current portion of long-term obligations, net of discount
|
7,363,000
|
3,191,000
|
||||||
|
Termination fee obligation
|
—
|
400,000
|
||||||
|
Puregraft divestiture obligation
|
—
|
547,000
|
||||||
|
Joint Venture purchase obligation
|
3,008,000
|
4,691,000
|
||||||
|
Total current liabilities
|
15,917,000
|
14,906,000
|
||||||
|
Warrant liability
|
9,793,000
|
—
|
||||||
|
Deferred revenues
|
112,000
|
212,000
|
||||||
|
Long-term deferred rent
|
558,000
|
710,000
|
||||||
|
Long-term obligations, net of discount, less current portion
|
18,041,000
|
23,100,000
|
||||||
|
Total liabilities
|
44,421,000
|
38,928,000
|
||||||
|
Commitments and contingencies
|
||||||||
|
Stockholders’ equity:
|
||||||||
|
Series A 3.6% convertible preferred stock, $0.001 par value; 5,000,000 shares authorized; 13,500 shares issued and 5,311 outstanding in 2014, and no shares issued and outstanding in 2013
|
—
|
—
|
||||||
|
Common stock, $0.001 par value; 145,000,000 shares authorized; 99,348,377 and 71,305,375 shares issued and outstanding in 2014 and 2013, respectively
|
99,000
|
71,000
|
||||||
|
Additional paid-in capital
|
331,772,000
|
303,710,000
|
||||||
|
Accumulated other comprehensive income
|
700,000
|
256,000
|
||||||
|
Accumulated deficit
|
(338,273,000
|
)
|
(300,905,000
|
)
|
||||
|
Total stockholders’ (deficit) equity
|
(5,702,000
|
)
|
3,132,000
|
|||||
|
Total liabilities and stockholders’ (deficit) equity
|
$
|
38,719,000
|
$
|
42,060,000
|
||||
THE ACCOMPANYING NOTES ARE AN INTEGRAL PART OF THESE CONSOLIDATED FINANCIAL STATEMENTS
CYTORI THERAPEUTICS, INC.
CONSOLIDATED STATEMENTS OF OPERATIONS AND COMPREHENSIVE LOSS
|
For the Years Ended December 31,
|
||||||||||||
|
2014
|
2013
|
2012
|
||||||||||
|
Product revenues:
|
||||||||||||
|
Related party
|
$
|
—
|
$
|
1,845,000
|
$
|
—
|
||||||
|
Third party
|
4,953,000
|
5,277,000
|
8,709,000
|
|||||||||
|
4,953,000
|
7,122,000
|
8,709,000
|
||||||||||
|
Cost of product revenues
|
2,940,000
|
3,421,000
|
4,000,000
|
|||||||||
|
Gross profit
|
2,013,000
|
3,701,000
|
4,709,000
|
|||||||||
|
Development revenues:
|
||||||||||||
|
Development, related party
|
—
|
638,000
|
2,882,000
|
|||||||||
|
Development
|
—
|
1,179,000
|
2,529,000
|
|||||||||
|
Government contracts and other
|
2,645,000
|
3,257,000
|
381,000
|
|||||||||
|
2,645,000
|
5,074,000
|
5,792,000
|
||||||||||
|
Operating expenses:
|
||||||||||||
|
Research and development
|
15,105,000
|
17,065,000
|
13,628,000
|
|||||||||
|
Sales and marketing
|
6,406,000
|
9,026,000
|
9,488,000
|
|||||||||
|
General and administrative
|
15,953,000
|
16,031,000
|
15,672,000
|
|||||||||
|
Change in fair value of warrants
|
(369,000
|
)
|
(418,000
|
)
|
(209,000
|
)
|
||||||
|
Change in fair value of option liability
|
—
|
(2,250,000
|
)
|
340,000
|
||||||||
|
Total operating expenses
|
37,095,000
|
39,454,000
|
38,919,000
|
|||||||||
|
Operating loss
|
(32,437,000
|
)
|
(30,679,000
|
)
|
(28,418,000
|
)
|
||||||
|
Other income (expense):
|
||||||||||||
|
Gain (loss) on asset disposal
|
42,000
|
(257,000
|
)
|
—
|
||||||||
|
Loss on debt extinguishment
|
—
|
(708,000
|
)
|
—
|
||||||||
|
Interest income
|
6,000
|
4,000
|
4,000
|
|||||||||
|
Interest expense
|
(4,371,000
|
)
|
(3,396,000
|
)
|
(3,386,000
|
)
|
||||||
|
Other income (expense), net
|
(608,000
|
)
|
(438,000
|
)
|
(314,000
|
)
|
||||||
|
Gain on Puregraft divestiture
|
—
|
4,453,000
|
—
|
|||||||||
|
Gain on previously held equity interest in joint venture
|
—
|
4,892,000
|
—
|
|||||||||
|
Equity loss from investment in joint venture
|
—
|
(48,000
|
)
|
(165,000
|
)
|
|||||||
|
Total other income (expense)
|
(4,931,000
|
)
|
4,502,000
|
(3,861,000
|
)
|
|||||||
|
Net loss
|
(37,368,000
|
)
|
(26,177,000
|
)
|
(32,279,000
|
)
|
||||||
|
Beneficial conversion feature for
|
||||||||||||
|
convertible preferred stock
|
(1,169,000
|
)
|
—
|
—
|
||||||||
|
Net loss allocable to common stock holders
|
(38,537,000
|
)
|
(26,177,000
|
)
|
(32,279,000
|
)
|
||||||
|
Basic and diluted net loss per share allocable to common stockholders
|
$
|
(0.48
|
)
|
$
|
(0.39
|
)
|
$
|
(0.55
|
)
|
|||
|
Basic and diluted weighted average shares used in calculating net loss per share allocable to common stockholders
|
80,830,698
|
67,781,364
|
58,679,687
|
|||||||||
| Comprehensive loss: | ||||||||||||
| Net loss |
$
|
(37,368,000
|
)
|
$
|
(26,177,000
|
)
|
$
|
(32,279,000
|
)
|
|||
|
Other comprehensive income – foreign currency translation adjustments
|
444,000
|
256,000
|
—
|
|||||||||
|
Comprehensive loss
|
$
|
(36,924,000
|
)
|
$
|
(25,921,000
|
)
|
$
|
(32,279,000
|
)
|
|||
THE ACCOMPANYING NOTES ARE AN INTEGRAL PART OF THESE CONSOLIDATED FINANCIAL STATEMENTS
CYTORI THERAPEUTICS, INC.
CONSOLIDATED STATEMENTS OF STOCKHOLDERS’ (DEFICIT) EQUITY
FOR THE YEARS ENDED DECEMBER 31, 2014, 2013 AND 2012
|
Convertible Preferred Stock
|
Common Stock
|
Additional
Paid-in
|
Accumulated
|
Accumulated Other Comprehensive Income
|
||||||||||||||||||||||||||||
|
Shares
|
Amount
|
Shares
|
Amount
|
Capital
|
Deficit
|
(Loss)
|
Total
|
|||||||||||||||||||||||||
|
Balance at December 31, 2011
|
—
|
$
|
—
|
56,594,683
|
$
|
57,000
|
$
|
252,338,000
|
$
|
(242,449,000
|
)
|
$
|
—
|
$
|
9,946,000
|
|||||||||||||||||
|
Stock-based compensation expense
|
—
|
—
|
—
|
—
|
3,904,000
|
—
|
—
|
3,904,000
|
||||||||||||||||||||||||
|
Issuance of common stock under stock option plan and employee stock purchase plan
|
—
|
—
|
450,512
|
—
|
1,157,000
|
—
|
—
|
1,157,000
|
||||||||||||||||||||||||
|
Issuance of common stock under stock warrant agreement
|
—
|
—
|
98,855
|
—
|
256,000
|
—
|
—
|
256,000
|
||||||||||||||||||||||||
|
Sale of common stock, net
|
—
|
—
|
8,770,000
|
9,000
|
23,462,000
|
—
|
—
|
23,471,000
|
||||||||||||||||||||||||
|
Net loss for the year ended December 31, 2012
|
—
|
—
|
—
|
—
|
—
|
(32,279,000
|
)
|
—
|
(32,279,000
|
)
|
||||||||||||||||||||||
|
Balance at December 31, 2012
|
—
|
—
|
65,914,050
|
$
|
66,000
|
$
|
281,117,000
|
$
|
(274,728,000
|
)
|
$
|
—
|
$
|
6,455,000
|
||||||||||||||||||
|
Stock-based compensation expense
|
—
|
—
|
—
|
—
|
3,608,000
|
—
|
—
|
3,608,000
|
||||||||||||||||||||||||
|
Issuance of common stock under stock option plan and employee stock purchase plan
|
—
|
—
|
338,325
|
—
|
225,000
|
—
|
—
|
225,000
|
||||||||||||||||||||||||
|
Sale of common stock, net
|
—
|
—
|
5,053,000
|
5,000
|
17,811,000
|
—
|
—
|
17,816,000
|
||||||||||||||||||||||||
|
Allocation of fair value for debt-related warrants
|
—
|
—
|
—
|
—
|
949,000
|
—
|
—
|
949,000
|
||||||||||||||||||||||||
|
Accumulated other comprehensive income (loss)
|
—
|
—
|
—
|
—
|
—
|
—
|
256,000
|
256,000
|
||||||||||||||||||||||||
|
Net loss for the year ended December 31, 2013
|
—
|
—
|
—
|
—
|
—
|
(26,177,000
|
)
|
—
|
(26,177,000
|
)
|
||||||||||||||||||||||
|
Balance at December 31, 2013
|
—
|
—
|
71,305,375
|
$
|
71,000
|
$
|
303,710,000
|
$
|
(300,905,000
|
)
|
$
|
256,000
|
$
|
3,132,000
|
||||||||||||||||||
|
Stock-based compensation expense
|
—
|
—
|
—
|
—
|
3,101,000
|
—
|
—
|
3,101,000
|
||||||||||||||||||||||||
|
Issuance of common stock under stock option plan and employee stock purchase plan
|
—
|
—
|
204,288
|
—
|
92,000
|
—
|
—
|
92,000
|
||||||||||||||||||||||||
|
Sale of common stock, net
|
—
|
—
|
8,048,584
|
8,000
|
18,582,000
|
—
|
—
|
18,590,000
|
||||||||||||||||||||||||
|
Issuance of Series A 3.6% Convertible Preferred Stock, net
|
13,500
|
—
|
—
|
—
|
2,235,000
|
—
|
—
|
2,235,000
|
||||||||||||||||||||||||
|
Conversion of Series A 3.6% Convertible Preferred Stock into common stock
|
(8,189
|
)
|
—
|
15,747,397
|
$
|
16,000
|
—
|
—
|
—
|
16,000
|
||||||||||||||||||||||
|
Issuance of common stock under stock warrant agreement
|
—
|
—
|
4,042,733
|
$
|
4,000
|
4,052,000
|
—
|
—
|
4,056,000
|
|||||||||||||||||||||||
|
Accumulated other comprehensive income (loss)
|
—
|
—
|
—
|
—
|
—
|
—
|
$
|
444,000
|
444,000
|
|||||||||||||||||||||||
|
Net loss for the year ended December 31, 2014
|
—
|
—
|
—
|
—
|
—
|
(37,368,000
|
)
|
—
|
(37,368,000
|
)
|
||||||||||||||||||||||
|
Balance at December 31, 2014
|
5,311
|
—
|
99,348,377
|
$
|
99,000
|
$
|
331,772,000
|
$
|
(338,273,000
|
)
|
$
|
700,000
|
$
|
(5,702,000
|
)
|
|||||||||||||||||
ACCOMPANYING NOTES ARE AN INTEGRAL PART OF THESE CONSOLIDATED FINANCIAL STATEMENTS
CYTORI THERAPEUTICS, INC.
CONSOLIDATED STATEMENTS OF CASH FLOWS
|
For the Years Ended December 31,
|
||||||||||||
|
2014
|
2013
|
2012
|
||||||||||
|
Cash flows from operating activities:
|
||||||||||||
|
Net loss
|
$
|
(37,368,000
|
)
|
$
|
(26,177,000
|
)
|
$
|
(32,279,000
|
)
|
|||
|
Adjustments to reconcile net loss to net cash used in operating activities:
|
||||||||||||
|
Depreciation and amortization
|
779,000
|
1,630,000
|
933,000
|
|||||||||
|
Amortization of deferred financing costs and debt discount
|
1,220,000
|
893,000
|
930,000
|
|||||||||
|
Joint venture acquisition obligation accretion
|
579,000
|
204,000
|
—
|
|||||||||
|
Provision for doubtful accounts
|
1,084,000
|
1,141,000
|
144,000
|
|||||||||
|
Provision for expired enzymes
|
313,000
|
—
|
—
|
|||||||||
|
Change in fair value of warrants
|
(369,000
|
)
|
(418,000
|
)
|
(209,000
|
)
|
||||||
|
Change in fair value of option liability
|
—
|
(2,250,000
|
)
|
340,000
|
||||||||
|
Stock-based compensation
|
3,101,000
|
3,608,000
|
3,904,000
|
|||||||||
|
Equity loss from investment in joint venture
|
—
|
48,000
|
165,000
|
|||||||||
|
Loss on asset disposal
|
(33,000
|
)
|
257,000
|
—
|
||||||||
|
Gain on previously held equity interest in Joint Venture
|
—
|
(4,892,000
|
)
|
—
|
||||||||
|
Gain on sale of assets
|
—
|
(4,453,000
|
)
|
—
|
||||||||
|
Loss on debt extinguishment
|
—
|
708,000
|
—
|
|||||||||
|
Increases (decreases) in cash caused by changes in operating assets and liabilities:
|
||||||||||||
|
Accounts receivable
|
2,057,000
|
(1,209,000
|
)
|
(1,810,000
|
)
|
|||||||
|
Inventories
|
(815,000
|
)
|
(459,000
|
)
|
143,000
|
|||||||
|
Other current assets
|
510,000
|
(24,000
|
)
|
(324,000
|
)
|
|||||||
|
Other assets
|
11,000
|
(854,000
|
)
|
(74,000
|
)
|
|||||||
|
Accounts payable and accrued expenses
|
(1,147,000
|
)
|
(409,000
|
)
|
1,183,000
|
|||||||
|
Deferred revenues, related party
|
—
|
(638,000
|
)
|
(2,882,000
|
)
|
|||||||
|
Deferred revenues
|
(100,000
|
)
|
(1,223,000
|
)
|
(2,609,000
|
)
|
||||||
|
Long-term deferred rent
|
(152,000
|
)
|
(46,000
|
)
|
252,000
|
|||||||
|
Net cash used in operating activities
|
(30,330,000
|
)
|
(34,563,000
|
)
|
(32,193,000
|
)
|
||||||
|
Cash flows from investing activities:
|
||||||||||||
|
Purchases of property and equipment
|
(764,000
|
)
|
(519,000
|
)
|
(1,204,000
|
)
|
||||||
|
Expenditures for intellectual property
|
(255,000
|
)
|
—
|
—
|
||||||||
|
Proceeds from sale of assets
|
76,000
|
5,000,000
|
—
|
|||||||||
|
License agreement termination fee
|
(400,000
|
)
|
(800,000
|
)
|
—
|
|||||||
|
Cash acquired in purchase of joint venture
|
—
|
5,000
|
—
|
|||||||||
|
Net cash (used in) provided by investing activities
|
(1,343,000
|
)
|
3,686,000
|
(1,204,000
|
)
|
|||||||
|
Cash flows from financing activities:
|
||||||||||||
|
Principal payments on long-term debt obligations
|
(1,962,000
|
)
|
(22,304,000
|
)
|
(2,692,000
|
)
|
||||||
|
Proceeds from long-term obligations
|
—
|
27,000,000
|
—
|
|||||||||
|
Debt issuance costs and loan fees
|
—
|
(1,744,000
|
)
|
—
|
||||||||
|
Joint venture purchase payments
|
(2,262,000
|
)
|
(221,000
|
)
|
—
|
|||||||
|
Proceeds from exercise of employee stock options and warrants and stock purchase plan
|
4,151,000
|
225,000
|
1,413,000
|
|||||||||
|
Proceeds from issuance of common stock
|
19,001,000
|
18,000,000
|
24,953,000
|
|||||||||
|
Proceeds from issuance of preferred stock
|
13,500,000
|
—
|
—
|
|||||||||
|
Costs from sale of common stock
|
(425,000
|
)
|
(184,000
|
)
|
(1,482,000
|
)
|
||||||
|
Costs from sale of preferred stock
|
(1,129,000
|
)
|
—
|
—
|
||||||||
|
Net cash provided by financing activities
|
30,874,000
|
20,772,000
|
22,192,000
|
|||||||||
|
Effect of exchange rate changes on cash and cash equivalents
|
(85,000
|
)
|
(106,000
|
)
|
—
|
|||||||
|
Net decrease in cash and cash equivalents
|
(884,000
|
)
|
(10,211,000
|
)
|
(11,205,000
|
)
|
||||||
|
Cash and cash equivalents at beginning of year
|
15,506,000
|
25,717,000
|
36,922,000
|
|||||||||
|
Cash and cash equivalents at end of year
|
$
|
14,622,000
|
$
|
15,506,000
|
$
|
25,717,000
|
||||||
|
For the Years Ended December 31,
|
||||||||||||
|
2014
|
2013
|
2012
|
||||||||||
|
Supplemental disclosure of cash flows information:
|
||||||||||||
|
Cash paid during period for:
|
||||||||||||
|
Interest
|
$
|
2,588,000
|
$
|
2,252,000
|
$
|
2,497,000
|
||||||
|
Final payment fee on long-term debt
|
—
|
1,078,000
|
—
|
|||||||||
|
Supplemental schedule of non-cash investing and financing activities:
|
||||||||||||
|
Conversion of preferred stock into common stock
|
$
|
16,000
|
$
|
—
|
$
|
—
|
||||||
|
Declared dividend related to preferred stock
|
72,000
|
—
|
—
|
|||||||||
|
Fair value of warrants allocated to additional paid-in capital
|
—
|
949,000 |
—
|
|||||||||
|
Fair value of intangible assets acquired
|
—
|
9,394,000
|
—
|
|||||||||
|
Fair value of tangible assets acquired
|
—
|
260,000
|
—
|
|||||||||
|
Joint venture purchase obligation
|
—
|
4,709,000
|
—
|
|||||||||
|
Fair value of previously held equity interest at acquisition date
|
—
|
4,928,000
|
—
|
|||||||||
THE ACCOMPANYING NOTES ARE AN INTEGRAL PART OF THESE CONSOLIDATED FINANCIAL STATEMENTS
CYTORI THERAPEUTICS, INC.
NOTES TO CONSOLIDATED FINANCIAL STATEMENTS
DECEMBER 31, 2014
| 1. | Organization and Operations |
The Company
Cytori Therapeutics (NASDAQ: CYTX) develops cell therapies uniquely formulated and optimized for specific diseases and medical conditions with a primary focus on impaired hand function in scleroderma, osteoarthritis of the knee, full thickness thermal burns combined with radiation exposure, and chronic heart failure.
Principles of Consolidation
The accompanying consolidated financial statements include our accounts and those of our subsidiaries. All significant intercompany transactions and balances have been eliminated.
We have five subsidiaries located in Japan, United Kingdom, Switzerland, India and Spain that have been established primarily to support our sales and marketing activities in these regions.
Certain Risks and Uncertainties
Our prospects are subject to the risks and uncertainties frequently encountered by companies in the early stages of development and commercialization, especially those companies in rapidly evolving and technologically advanced industries such as the biotech/medical device field. Our future viability largely depends on our ability to complete development of new products and receive regulatory approvals for those products. No assurance can be given that our new products will be successfully developed, regulatory approvals will be granted, or acceptance of these products will be achieved. The development of medical devices for specific therapeutic applications is subject to a number of risks, including research, regulatory and marketing risks. There can be no assurance that our development stage products will overcome these hurdles and become commercially viable and/or gain commercial acceptance.
Capital Availability
We incurred net losses of $37,368,000, $26,177,000 and $32,279,000 for the years ended December 31, 2014, 2013 and 2012, respectively. We have an accumulated deficit of $338,273,000 as of December 31, 2014. Additionally, we have used net cash of $30,330,000, $34,563,000 and $32,193,000 to fund our operating activities for years ended December 31, 2014, 2013 and 2012, respectively. At December 31, 2014, the current portion of long-term debt obligations is $7.4 million and the Joint Venture purchase obligation is $3.0 million. The combination of these facts and the balance of cash and cash equivalents at December 31, 2014 raises substantial doubt as to the Company’s ability to continue as a going concern.
To date, these operating losses have been funded primarily from outside sources of invested capital and gross profits. We have had, and we will likely continue to have, an ongoing need to raise additional cash from outside sources to fund our future operations. However, our ability to raise capital was adversely affected once FDA put a hold on our Athena trials in mid-2014, which had an adverse impact to stock price performance and our corresponding ability to restructure our debt. If we are unsuccessful in our efforts to raise outside capital in the near term, we will be required to significantly reduce our research, development, and administrative operations, including reduction of our employee base, in order to offset the lack of available funding.
We are pursuing financing opportunities in both the private and public debt and equity markets as well as through strategic corporate partnerships. We have an established history of raising capital through these platforms, and we are currently involved in negotiations with multiple parties. Our efforts in 2014 to raise capital took longer than we initially anticipated. We expect to continue to utilize our cash and cash equivalents to fund operations at least through June of 2015, subject to minimum cash and cash liquidity requirements of the Loan and Security Agreement with the Lenders, which requires that we maintain at least three months of cash on hand to avoid an event of default under the Loan and Security Agreement. We continue to seek additional cash through product revenues, strategic collaborations, and future sales of equity or debt securities. Although there can be no assurance given, we hope to successfully complete one or more additional financing transactions and corporate partnerships in the near-term. Without this additional capital, current working capital and cash generated from sales and containment of operating costs will not provide adequate funding for research, sales and marketing efforts, clinical and preclinical trials, and product development activities at their current levels. If sufficient capital is not raised, we will at a minimum need to significantly reduce or curtail our research and development and other operations, and this could negatively affect our ability to achieve corporate growth goals.
Specifically, we have prepared an operating plan that calls for us to reduce operations to focus almost entirely on one US clinical program and the supply of current products to existing or new distribution channels. In addition, as part of this plan, there would be minimal expenditures for ongoing scientific research, product development or clinical research. This impacts research and development headcount, external subcontractor expenditures, capital outlay and general and administrative expenditures related to the supervision of such activities. In parallel, we would significantly reduce administrative staff and salaries consistent with the overall reduction in scope of operations. In aggregate, such reductions could result in eliminations of roles for the majority of the Company’s current staff and the deferral or elimination of all ongoing development projects until such time that cash resources were available from operations or outside sources to re-establish development and growth plans. Management is currently reviewing contractual obligations related to the pre-clinical and clinical commitments along with minimum purchase requirements to include deferral of such commitments as part of this plan. While management is actively pursuing it’s near term financial and strategic alternatives it is also, in parallel, continuing to evaluate the timing of implementation of the alternative operating plan and the initiation of the identified reductions.
| 2. | Summary of Significant Accounting Policies |
Use of Estimates
The preparation of Consolidated Financial Statements in conformity with U.S. generally accepted accounting principles requires management to make estimates and assumptions affecting the reported amounts of assets and liabilities and disclosure of contingent assets and liabilities at the date of the financial statements, and the reported amounts of revenue and expenses during the reporting period. Our most significant estimates and critical accounting policies involve recognizing revenue, valuing the acquisition of the Olympus Joint Venture, valuing warrants, determining the assumptions used in measuring share-based compensation expense and valuing allowances for doubtful accounts, and inventories.
Actual results could differ from these estimates. Management’s estimates and assumptions are reviewed regularly, and the effects of revisions are reflected in the Consolidated Financial Statements in the periods they are determined to be necessary.
Cash and Cash Equivalents
We consider all highly liquid investments with maturities of three months or less at the time of purchase to be cash equivalents. Investments with original maturities of three months or less that were included with and classified as cash and cash equivalents totaled $8,144,000 and $4,644,000 as of December 31, 2014 and 2013, respectively. We maintain our cash at insured financial institutions. The combined account balances at each institution periodically exceed FDIC insurance coverage, and as a result, there is a concentration of credit risk related to amounts in excess of FDIC limits.
Restricted Cash and Cash Equivalents
Restricted cash consists of cash and cash equivalents held in a letter of credit account pursuant to a lease agreement entered into on April 2, 2010 (amended November 4, 2011) for leasing of property at 3020 and 3030 Callan Road, San Diego, California. The lease agreement required us to execute a letter of credit for $350,000 naming the landlord as a beneficiary. The letter of credit was issued in July 2010 and automatically renews every 6 months unless we make changes during the grace period which is the week after the maturity date. The next maturity date is June 29, 2015. It is required by the landlord that we maintain $350,000 as restricted cash for the duration of the lease, which expires October 31, 2017.
Accounts Receivable
Accounts receivable are recorded at the invoiced amount and do not bear interest. Amounts collected on accounts receivable are included in net cash provided by operating activities in the consolidated statements of cash flows. The Company maintains an allowance for doubtful accounts for estimated losses inherent in its accounts receivable portfolio. In establishing the required allowance, management considers historical losses adjusted to take into account current market conditions and our customers’ financial condition, the amount of receivables in dispute, and the current receivables aging and current payment patterns. Account balances are charged off against the allowance after all means of collection have been exhausted and the potential for recovery is considered remote.
Inventories
Inventories include the cost of material, labor, and overhead, and are stated at the lower of cost, determined on the first-in, first-out (FIFO) method, or market. We periodically evaluate our on-hand stock and make appropriate provisions for any stock deemed excess or obsolete. Manufacturing costs resulting from lower than “normal” production levels are expensed as incurred.
Property and Equipment
Property and equipment are stated at cost, net of accumulated depreciation. Depreciation expense, which includes the amortization of capitalized leasehold improvements, is provided for on a straight-line basis over the estimated useful lives of the assets, or the life of the lease, whichever is shorter, and range from three to five years. When assets are sold or otherwise disposed of, the cost and related accumulated depreciation are removed from the accounts and the resulting gain or loss, if any, is included in operations. Maintenance and repairs are charged to operations as incurred.
Impairment
We assess certain of our long-lived assets, such as property and equipment and intangible assets other than goodwill, for potential impairment when there is a change in circumstances that indicates carrying values of assets may not be recoverable. Such long-lived assets are deemed to be impaired when the undiscounted cash flows expected to be generated by the asset (or asset group) are less than the asset’s carrying amount. Any required impairment loss would be measured as the amount by which the asset’s carrying value exceeds its fair value, and would be recorded as a reduction in the carrying value of the related asset and a charge to operating expense. We recognized no impairment losses during any of the periods presented in these financial statements.
Goodwill and Intangibles
Goodwill is reviewed for impairment annually or more frequently when events or changes in circumstances indicate that fair value of the reporting unit has been reduced to less than its carrying value. We perform our impairment test annually during the fourth quarter. First the Company assesses qualitative factors to determine whether it is more likely than not that the fair value of a reporting unit is less than its carrying amount as a basis for determining whether it is necessary to perform the two-step goodwill impairment test. If, after assessing qualitative factors, the Company determines it is not more likely than not that the fair value of a reporting unit is less than its carrying amount, then performing the two-step impairment test is unnecessary. If deemed necessary, a two-step test is used to identify the potential impairment and to measure the amount of goodwill impairment, if any. The first step is to compare the fair value of the reporting unit with its carrying amount, including goodwill. If the fair value of the reporting unit exceeds its carrying amount, goodwill is considered not impaired; otherwise, there is an indication that goodwill may be impaired and the amount of the loss, if any, is measured by performing step two. Under step two, the impairment loss, if any, is measured by comparing the implied fair value of the reporting unit goodwill with the carrying amount of goodwill. We completed this assessment as of November 30, 2014, and concluded that no impairment existed.
Separable intangible assets that have finite useful lives continue to be amortized over their respective useful lives.
As part of the May 2013 acquisition of the Joint Venture (see Note 4), we acquired intangible assets which consisted primarily of contractual license rights that had previously enabled the Joint Venture to conduct development and manufacturing activities pertaining to certain aspects of Cytori’s Celution ® technology. The useful life of the identifiable intangible assets was estimated based on the assumed future economic benefit expected to be received from the assets. The technology was valued at $9,394,000 and is being amortized over a useful life of seven years, based on the quarterly revenue forecasted for those years. We have amortized $166,000 and $49,000 as of December 31, 2014 and 2013, respectively. The estimated aggregate amortization expense will be $896,000 for 2015, $1,267,000 for 2016, $1,774,000 for 2017, $2,306,000 for 2018 and $2,883,000 thereafter.
The changes in the carrying amounts of other indefinite and finite-life intangible assets and goodwill for the years ended December 31, 2014 and 2013 are as follows:
|
December 31, 2014
|
||||
|
Other intangibles, net:
|
||||
|
Beginning balance
|
$
|
9,345,000
|
||
|
Increase
|
255,000
|
|||
|
Amortization
|
(185,000
|
)
|
||
|
Ending balance
|
9,415,000
|
|||
|
Goodwill, net:
|
||||
|
Beginning balance
|
3,922,000
|
|||
|
Increase (decrease)
|
—
|
|||
|
Ending balance
|
3,922,000
|
|||
|
Total goodwill and other intangibles, net
|
$
|
13,337,000
|
||
|
December 31, 2013
|
||||
|
Other intangibles, net:
|
||||
|
Beginning balance
|
$
|
—
|
||
|
Acquisition of JV Intangible
|
9,394,000
|
|||
|
Amortization
|
(49,000
|
)
|
||
|
Ending balance
|
9,345,000
|
|||
|
Goodwill, net:
|
||||
|
Beginning balance
|
3,922,000
|
|||
|
Increase (decrease)
|
—
|
|||
|
Ending balance
|
3,922,000
|
|||
|
Total goodwill and other intangibles, net
|
$
|
13,267,000
|
||
Warrant Liability
Warrants with exercise price reset features (down-round protection) are accounted for as liabilities, with changes in the fair value included in net loss for the respective periods. In connection with the Securities Purchase Agreement, in October 2014, the Company issued common stock purchase warrants to certain institutional investors. Each warrant has an exercise price of $0.5771 per share, is exercisable six months after the date of issuance and expires five years from the date on which it is initially exercisable. The initial fair value of the liability associated with these warrants was $10.0 million, and the fair value decreased to $9.8 million as of December 31, 2014. All future changes in the fair value of the warrants will be recognized in our consolidated statements of operations until they are either exercised or expire in 2020. The warrants are not traded in an active securities market, and as such the estimated the fair value at December 31 was determined by using an option pricing model (Monte Carlo) with the following assumptions:
|
As of
December 31, 2014
|
||||
|
Expected term
|
5.3 years
|
|||
|
Common stock market price
|
$
|
0.49
|
||
|
Risk-free interest rate
|
1.65
|
%
|
||
|
Expected volatility
|
90.00
|
%
|
||
|
Resulting fair value (per warrant)
|
$
|
0.38
|
||
Expected volatility is based on both historical and implied volatility. Historical volatility was computed using daily pricing observations for recent periods that correspond to the expected term of the warrants while implied volatility was computed using publicly traded options of Cytori as well as Cytori’s peer companies. We believe this method produces an estimate that is representative of our expectations of future volatility over the expected term of these warrants. We currently have no reason to believe future volatility over the expected remaining life of these warrants is likely to differ materially from historical volatility. The expected life is based on the remaining contractual term of the warrants. The risk-free interest rate is the U.S. Treasury bond rate as of the valuation date. The fair value of these warrants also incorporates our assumptions about future equity issuances and their impact to the down-round protection feature.
Fluctuations in the fair value of the warrants are impacted by unobservable inputs, most significantly the assumption with regards to future equity issuances and its impact to the down-round protection feature. Significant increases (decreases) in this input in isolation would result in a significantly higher (lower) fair value measurement.
Revenue Recognition
Product Sales
We recognize revenue from product sales when the following fundamental criteria are met: (i) persuasive evidence of an arrangement exists, (ii) delivery has occurred, (iii) the price to the customer is fixed or determinable and (iv) collection of the resulting accounts receivable is reasonably assured. For customers that have not developed a sufficient payment history with us or for whom a letter of credit is not in place at the time of the transaction, we defer revenues until collectability is reasonably assured.
For all sales, we use a binding purchase order or a signed agreement as evidence of an arrangement. If the other revenue recognition criteria are met, revenue for these product sales is recognized upon delivery to the customer, as all risks and rewards of ownership have been substantively transferred to the customer at that point. For sales to customers who arrange for and manage the shipping process, we recognize revenue upon shipment from our facilities. Shipping and handling costs that are billed to our customers are classified as revenue. The customer’s obligation to pay and the payment terms are set at the time of delivery and are not dependent on the subsequent use or resale of our products. For sales where all revenue recognition criteria are not met, revenue is deferred and related inventory remains on our books.
For sales that include multiple deliverables, such as sales of our StemSource® Cell Bank (cell bank), we account for products or services (deliverables) separately rather than as a combined unit. Stem cell banks typically consist of a complex array of equipment, proprietary knowledge, license rights, and services, including one or more StemSource® devices, a cryogenic freezer, measuring and monitoring equipment, and a database patient tracking system. In addition, we typically provide consulting, installation, and training services. Web hosting, technical support and maintenance services are generally provided for a period of up to one year subsequent to the date of sale. FASB authoritative guidance requires an evaluation of these deliverables to determine the appropriate “units of accounting” for purposes of revenue recognition. Each cell bank is customized to provide the best solution for the customer. Depending on customers’ needs, all or combination of the following units of accounting will apply to cell bank transactions:
| · | initial consulting services; |
| · | license rights and standard operating procedures; |
| · | equipment and supplies; |
| · | installation services; |
| · | training services; |
| · | database hosting services; |
| · | technical support services; and |
| · | maintenance services. |
FASB authoritative guidance establishes a selling price hierarchy for determining the selling price of a deliverable, which is based on: (a) vendor-specific objective evidence (“VSOE”); (b) third-party evidence (“TPE”); or (c) management estimates. This guidance requires arrangement consideration to be allocated at the inception of the arrangement to all deliverables using the relative selling price method. For our cell bank sales, we establish relative selling prices for all deliverables based on vendor-specific quotes for comparable services when available. In the absence of VSOE, we use competitors’ products or services considered largely interchangeable with our own or management’s best estimate. Revenue allocated to each unit of accounting is calculated and recognized based on the relative selling price of each deliverable. Future services such as web hosting and ongoing maintenance are deferred and recognized into income as the services are provided, generally over one year following the installation of the equipment.
Concentration of Significant Customers & Geographical Sales
For the year ended December 31, 2014, our sales were concentrated with respect to three distributors and one direct customer, which comprised 52% of our product revenue recognized. Three distributors accounted for 92% of total outstanding accounts receivable (excluding BARDA) as of December 31, 2014.
For the year ended December 31, 2013, our sales were concentrated with respect to one distributor, which comprised 26% of our product revenue recognized. Two distributors and one direct customer accounted for 55% of total outstanding accounts receivable as of December 31, 2013.
For the year ended December 31, 2012, our sales were concentrated with respect to one direct customer, which comprised 12% of our product revenue recognized. Two direct customers and one distributor accounted for 39% of total outstanding accounts receivable as of December 31, 2012.
Product revenues, classified by geographic location, are as follows:
|
Years ended
|
||||||||||||||||||||||||
|
2014
|
2013
|
2012
|
||||||||||||||||||||||
|
Product Revenues
|
% of Total
|
Product Revenues
|
% of Total
|
Product Revenues
|
% of Total
|
|||||||||||||||||||
|
North America
|
$
|
894,000
|
18
|
%
|
$
|
1,079,000
|
15
|
%
|
$
|
1,143,000
|
13
|
%
|
||||||||||||
|
Japan
|
3,068,000
|
62
|
%
|
2,109,000
|
30
|
%
|
4,352,000
|
50
|
%
|
|||||||||||||||
|
Europe
|
506,000
|
10
|
%
|
1,240,000
|
17
|
%
|
2,004,000
|
23
|
%
|
|||||||||||||||
|
Other countries
|
485,000
|
10
|
%
|
2,694,000
|
38
|
%
|
1,210,000
|
14
|
%
|
|||||||||||||||
|
Total product revenues
|
$
|
4,953,000
|
100
|
%
|
$
|
7,122,000
|
100
|
%
|
$
|
8,709,000
|
100
|
%
|
||||||||||||
Research and Development
We earn revenue for performing tasks under research and development agreements with both commercial enterprises, such as Olympus and Senko, and governmental agencies like the U.S. Department of Health and Human Service’s Biomedical Advanced Research and Development Authority (BARDA). Revenue earned under development agreements with commercial enterprises is classified as development revenues. Revenues derived from reimbursement of direct out-of-pocket expenses for research costs associated with government contracts are recorded as government contract and other within development revenues. Government contract revenue is recorded at the gross amount of the reimbursement. The costs associated with these reimbursements are reflected as a component of research and development expense in our consolidated statements of operations.
In the third quarter of 2012, we were awarded a contract to develop a new countermeasure for thermal burns valued at up to $106 million with BARDA. The initial base period included $4.7 million tranche over two years and covered preclinical research and continued development of Cytori’s Celution® system to improve cell processing. The additional contract options, if fully executed, cover clinical development through FDA approval under a device-based PMA regulatory pathway. In August 2014, BARDA exercised Option 1 of the contract for Cytori to perform research, regulatory, clinical and other tasks required for initiation of a pilot clinical trial of the Celution System in thermal burn injury for a total cost-plus fixed fee of up to $12.1 million. In December 2014, we executed an amendment to the August 2014 contract option to fund continued investigation and development of Cytori Cell Therapy (DCCT-10) for use in thermal burn injuries, which increased the option extension to $14.1 million. Upon IDE approval by the FDA, we anticipate BARDA will increase funding to cover costs associated with execution of the clinical trial, currently estimated at approximately $8.3 million, and bringing the combined value of the first option to up to $22.4 million. This is a cost reimbursement contract, and related government contract revenue was recorded at the gross amount of reimbursement starting in the fourth quarter of 2012.
We received funds from Olympus and Olympus-Cytori, Inc. during 2005 and 2006. We recorded upfront fees totaling $28,311,000 as deferred revenues, related party. In exchange for these proceeds, we agreed to (a) provide Olympus-Cytori, Inc. an exclusive and perpetual license to our Celution® System device technology and certain related intellectual property, and (b) provide future development contributions related to commercializing the Celution® System platform. The license and development services were not separable and as a result the recognition of this deferred amount as revenue required achievement of service related milestones, under a proportional performance methodology. Revenue was recognized as the above mentioned R&D milestones were completed. Of the amounts received and deferred, we recognized the last remaining development revenue of $638,000 during the three months ended March 31, 2013 as a result of the United States Court of Appeals upholding the FDA’s previous determination that our cell processing devices were not substantially equivalent to the cited predicate devices. The recognition of revenue associated with this event reflects the completion of our efforts expended to use commercially reasonable efforts to obtain device regulatory approvals in the United States as it pertains to the 510(k) pathway. During the year ended December 31, 2012, we recognized $2,882,000 of revenue associated with our arrangement with Olympus as a result of two milestones for the APOLLO and PRECISE clinical trials. As of December 31, 2014 and 2013, there are no deferred amounts under this contract.
Refer to Note 8 for discussion about our arrangement with Senko.
Research and Development
Research and development expenditures, which are charged to operations in the period incurred, include costs associated with the design, development, testing and enhancement of our products, regulatory fees, the purchase of laboratory supplies, and pre-clinical and clinical studies as well as salaries and benefits for our research and development employees.
Also included in research and development expenditures are costs incurred to support the government reimbursement contract.
$2,461,000, $3,053,000, and $331,000 qualified expenses were incurred for the years ended December 31, 2014, 2013 and 2012, related to our government contract with BARDA.
Deferred Financing Costs and Other Debt-Related Costs
Deferred financing costs are capitalized and amortized to interest expense over the term of the associated debt instrument using the effective interest method. If the maturity of the debt is accelerated because of default or early debt repayment, then the amortization would be accelerated.
Income Taxes
Income taxes are accounted for under the asset and liability method. Deferred tax assets and liabilities are recognized for the future tax consequences attributable to differences between the financial statement carrying amounts of existing assets and liabilities and their respective tax bases and operating loss and tax credit carry forwards. Deferred tax assets and liabilities are measured using enacted tax rates expected to apply to taxable income (loss) in the years in which those temporary differences are expected to be recovered or settled. Due to our history of losses, a full valuation allowance has been recognized against our deferred tax assets.
Stock Based Compensation
We recognize the fair value of all share-based payment awards in our statements of operations over the requisite vesting period of each award. We estimate the fair value of these options using the Black-Scholes option pricing model using assumptions for expected volatility, expected term, and risk-free interest rate. Expected volatility is based primarily on historical volatility and is computed using daily pricing observations for recent periods that correspond to the expected term of the options. The expected life is based on the expected term of the options. The risk-free interest rate is the interest rate for treasury instruments with maturities that approximate the expected term.
Segment Information
For the years ended December 31, 2014, 2013 and 2012, all of our financial results relate to cell therapy, therefore we report our results as a single segment.
Loss Per Share
Basic per share data is computed by dividing net income or loss allocable to common stockholders by the weighted average number of common shares outstanding during the period. Diluted per share data is computed by dividing net income or loss allocable to common stockholders by the weighted average number of common shares outstanding during the period increased to include, if dilutive, the number of additional common shares that would have been outstanding as calculated using the treasury stock method. Potential common shares were related entirely to outstanding but unexercised options, warrants, employee stock purchase plans, and restricted stock awards for all periods presented.
We have excluded all potentially dilutive securities, including unvested performance-based restricted stock, from the calculation of diluted loss per share allocable to common stockholders for the years ended December 31, 2014, 2013 and 2012, as their inclusion would be antidilutive. Potentially dilutive common shares excluded from the calculations of diluted loss per share were 43.7 million, 17.2 million and 17.4 million for the years ended December 31, 2014, 2013 and 2012, respectively.
Recent Accounting Pronouncements
The following new accounting standards have been issued, but not adopted by the Company as of December 31, 2014:
In May 2014, the Financial Accounting Standards Board (FASB) and International Accounting Standards Board (IASB) jointly issued Accounting Standards Update (ASU) 2014-09, Revenue from Contracts with Customers. ASU 2014-09 requires an entity to recognize revenue to depict the transfer of promised goods or services to customers in an amount that reflects the consideration to which the entity expects to be entitled in exchange for those goods and services. The effective date of ASU 2014-09 is for annual reporting periods beginning after December 15, 2016. The Company is currently evaluating the impact of adopting ASU 2014-09.
In August 2014, the Financial Accounting Standards Board (FASB) issued Accounting Standards Update (ASU) 2014-15, Presentation of Financial Statements—Going Concern (Subtopic 205-40). ASU 2014-15 requires management to assess an entity’s ability to continue as a going concern by incorporating and expanding upon certain principles that are currently in U.S. auditing standards. Specifically, the amendments (1) provide a definition of the term substantial doubt, (2) require an evaluation every reporting period including interim periods, (3) provide principles for considering the mitigating effect of management’s plans, (4) require certain disclosures when substantial doubt is alleviated as a result of consideration of management’s plans, (5) require an express statement and other disclosures when substantial doubt is not alleviated, and (6) require an assessment for a period of one year after the date that the financial statements are issued (or available to be issued). The effective date of ASU 2014-15 is for annual reporting periods beginning after December 15, 2016. The Company is currently evaluating the impact of adopting ASU 2014-15.
| 3. | Agreement with Lorem Vascular |
On October 29, 2013, we entered into an agreement with Lorem Vascular to commercialize Cytori Cell Therapy (OICH-D3) for the cardiovascular, renal and diabetes markets, in China, Hong Kong, Malaysia, Singapore and Australia (License/Supply Agreement), and a Common Stock Purchase Agreement. On January 30, 2014 we entered into the Amended and Restated License/Supply Agreement with Lorem Vascular (the “Restated Agreement”) which restated the License/Supply Agreement in its entirety and expanded the licensed field to all uses excepting alopecia (hair loss). Under the Restated Agreement, Lorem Vascular committed to pay up to $500 million in license fees in the form of revenue milestones. In addition, Lorem Vascular is required to pay us 30% of their gross profits in China, Hong Kong and Malaysia for the term of the agreement. In addition, Lorem Vascular has agreed to purchase the Cytori Celution® System and consumables under the Restated Agreement. Pursuant to the related Common Stock Purchase Agreement, Cytori sold Lorem Vascular 8.0 million shares of Cytori common stock at $3.00 per share for a total of $24.0 million. The equity purchased was closed in two equal installments, in November 2013 and January 2014.
Lorem Vascular initially purchased approximately $1.8 million in Celution® devices and consumables in December 2013. In addition to this purchase, upon achieving regulatory clearance from the Chinese Food and Drug Administration (“CFDA”), Lorem Vascular has also agreed to purchase an opening order of 23 Celution Systems and 1,100 Celution Consumable Sets (which Lorem Vascular anticipates to be fulfilled within 2015), plus an additional 150 devices and 7,500 consumables during the three-year period following CFDA approval.
4. Transactions with Olympus Corporation
Acquisition of Olympus’ Interest in the Joint Venture
In 2005, we entered into a joint venture and other related agreements (the “Joint Venture Agreements”) with Olympus. The Joint Venture was owned equally by Olympus and us. We had previously accounted for our interests in the Joint Venture using the equity method of accounting, since we could not exert significant influence over the Joint Venture’s operations.
On May 8, 2013, Cytori and Olympus agreed to terminate the Joint Venture pursuant to a Termination Agreement, and Cytori acquired the remaining 50% equity interest in the Joint Venture from Olympus. The termination of the relationship and purchase of Olympus’ equity shares of the Joint Venture allowed Cytori to regain full control of the manufacturing rights for the Celution ® system. The purpose of the acquisition is to gain more flexibility on the manufacturing process and associated costs, enable higher margins, and speed the transition to the critical next-generation systems. In connection with the Termination Agreement, the assets acquired, liabilities assumed, and the Company’s previously held equity interest were recorded at fair value. For valuation purposes, Cytori determined the acquisition date (the date on which Cytori effectively gained full control of the equity interest previously held by Olympus) to be May 27, 2013. The remeasurement of the previously held equity interest at the acquisition date resulted in a net gain of $4,892,000 that was recorded in the accompanying Consolidated Statements of Operations.
As consideration for the Termination Agreement, Cytori can choose from alternative payment options as defined in the Termination Agreement. The payment options call for a minimum of $4,500,000 up to a maximum of $16,000,000 to be paid by Cytori to Olympus in installments over periods ranging from one year to six years depending on the option selected by the Company. Installment payments will be calculated quarterly based on 5% of Cytori’s gross sales receipts for all products sold. If Cytori receives an aggregate $35,000,000 in cash through strategic or financing arrangements during the first year of the Termination Agreement, Cytori would be required to pay $4,500,000 (minus installment payments previously made) upon request of Olympus as full and complete consideration under the Agreement.
The fair value of the Joint Venture, including the identified intangible assets acquired, consideration transferred, and Cytori’s previously held equity interest, was estimated from a market participant perspective, using valuation techniques based on the income approach for measuring fair value. Specifically, an excess earnings methodology was employed using primarily Level 3 fair value inputs. The intangible assets acquired consisted primarily of contractual license rights that had previously enabled the Joint Venture to conduct development and manufacturing activities pertaining to certain aspects of Cytori’s Celution ® technology. The useful life of the identifiable intangible assets was estimated based on the assumed future economic benefit expected to be received from the assets. Inputs used in the valuation included various market participant assumptions in order to project potential future cash flows, discounted at a rate commensurate with the risk involved.
|
Useful Life
(in years)
|
Estimated
Fair Value
|
|||||||
|
Intangible assets:
|
||||||||
|
Developed technology
|
7
|
$
|
9,394,000
|
|||||
The following table summarizes the fair value of the assets acquired and liabilities assumed at the date of acquisition (in thousands):
|
Estimated
Fair Value
|
||||
|
Current assets
|
$
|
236
|
||
|
Property and equipment
|
260
|
|||
|
Intangible assets
|
9,394
|
|||
|
Total assets acquired
|
9,890
|
|||
|
Accrued and other current liabilities
|
(33
|
)
|
||
|
Total fair value of the Joint Venture
|
$
|
9,857
|
||
Acquisition-related transaction costs are not included as components of consideration transferred but have been accounted for as expenses in the period in which the costs are incurred.
Revenues and earnings from the Joint Venture were limited to royalties from sales of certain Cytori products, therefore, subsequent to the date of acquisition there was no revenue or earnings from the Joint Venture included in our consolidated results. Had the acquisition occurred on January 1, 2013, consolidated revenue would not have been affected, but our consolidated net loss would have been reduced by $48,000, the amount of our year-to-date equity loss from investment in Joint Venture.
The Company calculated the fair value of the purchase consideration on the acquisition date to be $4,928,000. This was determined using a weighted probability assessment of the payment options available to Cytori. Present value risk-adjusted discount rates applied to the purchase consideration ranged from 9.75% to 12.75%. The fair value calculation of the purchase consideration resulted in a discount of $1,072,000, which was being amortized to interest expense over a weighted average expected term of 1.8 years. On a quarterly basis, the Company reassesses the probabilities of the various payment options and expected term. Changes in the expected term and the remaining discount amount as a result of the reassessment will be recognized prospectively as an adjustment to interest expense. Upon final settlement of the purchase obligation, any difference between the amount paid and the carrying amount of the purchase obligation will be recorded as a gain or loss on extinguishment of the liability.
As of May 8, 2014, the Company’s obligation to Olympus had not been settled, and accordingly, the obligation increased by $1.5 million under an alternative payment option. This option calls for $6.0 million in total payments to be made by May 8, 2015. Since we have made payments totaling $2.7 million through December 31, 2014 our remaining payment obligation under this option is now approximately $3.3 million.
As a result of our quarterly reassessment, we have recorded additional interest expense of $579,000 for the year ended December 31, 2014, and have a remaining unrecognized future discount amount of approximately $289,000 as of December 31, 2014.
Put/Calls and Guarantees
Prior to the termination of the Joint Venture the Shareholders’ Agreement between Cytori and Olympus provided that in certain specified circumstances of our insolvency or if we experienced a change in control, Olympus would have the rights to (i) repurchase our interests in the Joint Venture at the fair value of such interests or (ii) sell its own interests in the Joint Venture to Cytori (the “Put”) at the higher of (a) $22,000,000 or (b) the Put’s fair value.
For the year ended December 31, 2013, the Put, as a previously existing contractual relationship between Olympus and Cytori, was cancelled as a result of the Joint Venture termination in May 2013 and therefore its related fair value decreased to zero as a result of the termination. At December 31, 2012, the fair value of the Put was $2,250,000. Fluctuations in the Put value were recorded in the Consolidated Statements of Operations as change in fair value of option liabilities.
|
5.
|
Sale and Exclusive License/Supply Agreement with Bimini Technologies LLC
|
On July 30, 2013, we entered into a Sale and Exclusive License/Supply Agreement with Bimini Technologies LLC (“Bimini”), pursuant to which we sold to Bimini substantially all of the assets (other than certain retained rights and licenses) of our Puregraft® product line, a series of standalone fat transplantation products that were developed to improve the predictability of outcomes for autologous fat grafting and aesthetic body contouring. The aggregate value of the consideration paid by Bimini at the execution of the agreement was $5.0 million.
In connection with the sale, Bimini granted to the Company an exclusive, perpetual, royalty bearing license to market and sell the Puregraft products for use in combination with adipose derived regenerative cells, and non-exclusive rights for use in connection with the Company’s licensed cell and tissue banks (in addition to certain Company retained ownership rights in the technology). The Company supplied Puregraft products to Bimini on an interim basis until the Company transferred the manufacturing of the Puregraft products to Bimini in December 2014. After the transfer, Bimini will supply the Puregraft products to the Company.
Pursuant to the agreement, the Company has also granted to Bimini the global, exclusive, perpetual, irrevocable royalty bearing license to purchase from Cytori, use and sell the Celution® System products for alopecia (hair loss). Cytori will supply Celution devices and consumable sets to Bimini, and Bimini will be responsible for all costs associated with commercial development in the alopecia market.
The agreement included certain obligations to be performed by the Company on behalf of Bimini, which included transferring the manufacturing of Puregraft products to an agreed upon third party (transfer was completed by December 31, 2014). The Company recorded a gain on the Puregraft divestiture of $4.5 million in the accompanying Consolidated Statements of Operations in 2013. Bimini is obligated to make certain additional milestone payments to the Company (in an aggregate amount of up to $10.0 million), contingent upon the achievement of certain milestones relating to Bimini’s gross profits from sales of the Puregraft products.
|
6.
|
Fair Value Measurements
|
Fair value measurements are market-based measurements, not entity-specific measurements. Therefore, fair value measurements are determined based on the assumptions that market participants would use in pricing the asset or liability. We follow a three-level hierarchy to prioritize the inputs used in the valuation techniques to derive fair values. The basis for fair value measurements for each level within the hierarchy is described below:
|
·
|
Level 1: Quoted prices in active markets for identical assets or liabilities.
|
|
·
|
Level 2: Quoted prices for similar assets or liabilities in active markets; quoted prices for identical or similar instruments in markets that are not active; and model-derived valuations in which all significant inputs are observable in active markets.
|
|
·
|
Level 3: Valuations derived from valuation techniques in which one or more significant inputs are unobservable in active markets.
|
The following table provides a summary of the recognized assets and liabilities that we measure at fair value on a recurring basis:
|
Balance as of
|
Basis of Fair Value Measurements
|
|||||||||||||||
|
December 31, 2014
|
Level 1
|
Level 2
|
Level 3
|
|||||||||||||
|
Assets:
|
||||||||||||||||
|
Cash equivalents
|
$
|
8,144,000
|
$
|
8,144,000
|
$
|
—
|
$
|
—
|
||||||||
|
Liabilities:
|
||||||||||||||||
|
Warrant liability
|
$
|
9,793,000
|
$
|
—
|
$
|
—
|
$
|
9,793,000
|
||||||||
|
Balance as of
|
Basis of Fair Value Measurements
|
|||||||||||||||
|
December 31, 2013
|
Level 1
|
Level 2
|
Level 3
|
|||||||||||||
|
Assets:
|
||||||||||||||||
|
Cash equivalents
|
$
|
4,644,000
|
$
|
4,644,000
|
$
|
—
|
$
|
—
|
||||||||
We use quoted market prices to determine the fair value of our cash equivalents, which consist of money market funds and therefore these are classified in Level 1 of the fair value hierarchy.
Warrants with exercise price reset features (down-round protection) are accounted for as liabilities, with changes in the fair value included in net loss for the respective periods. Because some of the inputs to our valuation model are either not observable or are not derived principally from or corroborated by observable market data by correlation or other means, the warrant liability is classified as Level 3 in the fair value hierarchy.
The following table summarizes the change in our Level 3 warrant liability value:
|
Warrant liability
|
December 31, 2014
|
December 31, 2013
|
||||||
|
Beginning balance
|
$
|
—
|
$
|
418,000
|
||||
|
Additions to warrant liability
|
10,162,000
|
—
|
||||||
|
Change in fair value
|
(369,000
|
)
|
(418,000
|
)
|
||||
|
Ending balance
|
$
|
9,793,000
|
$
|
—
|
||||
We valued our Put liability using an option pricing theory based simulation analysis (i.e., a Monte Carlo simulation). The Put was cancelled as a result of the Joint Venture Termination Agreement executed in 2013. The following table summarizes the change in our Level 3 Put option liability value:
|
Put option liability
|
Year ended
December 31, 2013 |
|||
|
Beginning balance
|
$
|
(2,250,000
|
)
|
|
|
Decrease (increase) in fair value recognized in operating expenses
|
2,250,000
|
|||
|
Ending balance
|
$
|
—
|
||
|
7.
|
Fair Value
|
Financial Instruments
We disclose fair value information about all financial instruments, whether or not recognized in the balance sheet, for which it is practicable to estimate fair value. The disclosures of estimated fair value of financial instruments at December 31, 2014 and 2013 were determined using available market information and appropriate valuation methods. Considerable judgment is necessary to interpret market data and develop estimated fair value. The use of different market assumptions or estimation methods may have a material effect on the estimated fair value amounts.
The carrying amounts for cash and cash equivalents, accounts receivable, inventories, other current assets, accounts payable, accrued expenses and other liabilities approximate fair value due to the short-term nature of these instruments.
We utilize quoted market prices to estimate the fair value of our fixed rate debt, when available. If quoted market prices are not available, we calculate the fair value of our fixed rate debt based on a currently available market rate assuming the loans are outstanding through maturity and considering the collateral. In determining the current market rate for fixed rate debt, a market spread is added to the quoted yields on federal government treasury securities with similar terms to the debt.
At December 31, 2014 and 2013, the aggregate fair value and the carrying value of the Company’s fixed rate long-term debt were as follows:
|
December 31, 2014
|
December 31, 2013
|
|||||||||||||||
|
Fair Value
|
Carrying Value
|
Fair Value
|
Carrying Value
|
|||||||||||||
|
Fixed rate long-term debt
|
$
|
25,206,000
|
$
|
25,373,000
|
$
|
26,207,000
|
$
|
26,241,000
|
||||||||
The fair value of debt is classified as Level 3 in the fair value hierarchy as some of the inputs to our valuation model are either not observable quoted prices or are not derived principally from or corroborated by observable market data by correlation or other means.
Carrying value is net of debt discount of $1,459,000 and $2,379,000 as of December 31, 2014 and 2013, respectively.
Nonfinancial Assets and Liabilities
We apply fair value techniques on a non-recurring basis associated with: (1) valuing potential impairment losses related to goodwill which are accounted for pursuant to the authoritative guidance for intangibles—goodwill and other; and (2) valuing potential impairment losses related to long-lived assets which are accounted for pursuant to the authoritative guidance for property, plant and equipment.
As part of the May 2013 acquisition of the Joint Venture, we acquired intangible assets which consisted primarily of contractual license rights that had previously enabled the Joint Venture to conduct development and manufacturing activities pertaining to certain aspects of Cytori’s Celution ® technology. The useful life of the identifiable intangible assets was estimated based on the assumed future economic benefit expected to be received from the assets. The technology was valued at $9,394,000 and is being amortized over a useful life of seven years, based on the quarterly revenue forecasted for those years.
|
8.
|
Thin Film Japan Distribution Agreement
|
In 2004, the Company entered into a Distribution Agreement with Senko. Under this agreement, we granted to Senko an exclusive license to sell and distribute certain Thin Film products in Japan and are responsible for the completion of the initial regulatory application to the Ministry of Health, Labor and Welfare (MHLW) and commercialization of the Thin Film product line in Japan.
In February 2013, we entered into a mutual termination and release agreement with Senko, whereby the Distribution Agreement and all Senko rights, licenses and privileges granted under the Distribution Agreement terminated and reverted to the Company. As a result of this Termination Agreement, we were obligated to pay Senko $1,200,000 in six quarterly installment payments of $200,000 each through May 2014. At the time of the Termination Agreement, we had a balance of $2,379,000 in deferred revenues on our balance sheet relating to the payments received from Senko in the past pursuant to the Distribution Agreement. At the time of the Termination Agreement we accrued $1,200,000 of the termination fee, and recognized the remaining $1,179,000 in development revenues which reflects the Company’s efforts towards commercialization under the agreement. As of December 31, 2014, we have no remaining termination fee obligation.
|
9.
|
Composition of Certain Financial Statement Captions
|
Inventories, net
As of December 31, 2014 and 2013, inventories, net, were comprised of the following:
|
December 31,
|
||||||||
|
2014
|
2013
|
|||||||
|
Raw materials
|
$
|
1,715,000
|
$
|
1,315,000
|
||||
|
Work in process
|
1,301,000
|
232,000
|
||||||
|
Finished goods
|
1,813,000
|
2,147,000
|
||||||
|
$
|
4,829,000
|
$
|
3,694,000
|
|||||
Other Current Assets
As of December 31, 2014 and 2013, other current assets were comprised of the following:
|
December 31,
|
||||||||
|
2014
|
2013
|
|||||||
|
Prepaid insurance
|
$
|
200,000
|
$
|
264,000
|
||||
|
Prepaid other
|
675,000
|
850,000
|
||||||
|
Other receivables
|
117,000
|
111,000
|
||||||
|
$
|
992,000
|
$
|
1,225,000
|
|||||
Property and Equipment, net
As of December 31, 2014 and 2013, property and equipment, net, were comprised of the following:
|
December 31,
|
||||||||
|
2014
|
2013
|
|||||||
|
Manufacturing and development equipment
|
$
|
5,674,000
|
$
|
5,059,000
|
||||
|
Office and computer equipment
|
2,006,000
|
2,274,000
|
||||||
|
Leasehold improvements
|
3,271,000
|
3,271,000
|
||||||
|
10,951,000
|
10,604,000
|
|||||||
|
Less accumulated depreciation and amortization
|
(9,368,000
|
)
|
(9,550,000
|
)
|
||||
|
$
|
1,583,000
|
$
|
1,054,000
|
|||||
Depreciation expense totaled $594,000, $1,581,000 and $741,000 for the years ended December 31, 2014, 2013, and 2012, respectively.
Other Assets
As of December 31, 2014 and 2013, other assets were comprised of the following:
|
December 31,
|
||||||||
|
2014
|
2013
|
|||||||
|
Deposits
|
$
|
540,000
|
$
|
479,000
|
||||
|
Prepaid supplies, long-term
|
1,223,000
|
2,333,000
|
||||||
|
$
|
1,763,000
|
$
|
2,812,000
|
|||||
Accounts Payable and Accrued Expenses
As of December 31, 2014 and 2013, accounts payable and accrued expenses were comprised of the following:
|
December 31,
|
||||||||
|
2014
|
2013
|
|||||||
|
Accrued legal fees
|
$
|
544,000
|
$
|
564,000
|
||||
|
Accrued R&D studies
|
273,000
|
376,000
|
||||||
|
Accounts payable
|
949,000
|
965,000
|
||||||
|
Accrued vacation
|
577,000
|
918,000
|
||||||
|
Accrued bonus
|
758,000
|
759,000
|
||||||
|
Accrued expenses
|
2,006,000
|
2,167,000
|
||||||
|
Deferred rent
|
191,000
|
138,000
|
||||||
|
Accrued accounting fees
|
130,000
|
140,000
|
||||||
|
Accrued payroll
|
118,000
|
50,000
|
||||||
|
$
|
5,546,000
|
$
|
6,077,000
|
|||||
|
10.
|
Commitments and Contingencies
|
We have contractual obligations to make payments on leases of office and manufacturing space as follows:
|
Years Ending December 31,
|
Operating Leases
|
|||
|
2015
|
$
|
2,183,000
|
||
|
2016
|
2,241,000
|
|||
|
2017
|
1,790,000
|
|||
|
2018
|
55,000
|
|||
|
2019
|
27,000
|
|||
|
Total
|
$
|
6,296,000
|
||
Rent expense, which includes common area maintenance, for the years ended December 31, 2014, 2013 and 2012 was $3,332,000, $3,458,000 and $2,980,000, respectively.
We have entered into agreements with various research organizations for clinical development studies, which have provisions for cancellation. Under the terms of these agreements, the vendors provide a variety of services including conducting research, enrolling patients, recruiting patients, monitoring studies and data analysis. Payments under these agreements typically include fees for services and reimbursement of expenses. The timing of payments due under these agreements was estimated based on current schedules of clinical studies in progress. As of December 31, 2014, we have clinical research study obligations of $1,216,000 all of which are expected to be complete within a year. Should the timing of the clinical trials change, the timing of the payment of these obligations would also change.
We are subject to various claims and contingencies related to legal proceedings. Due to their nature, such legal proceedings involve inherent uncertainties including, but not limited to, court rulings, negotiations between affected parties and governmental actions. Management assesses the probability of loss for such contingencies and accrues a liability and/or discloses the relevant circumstances, as appropriate. Management believes that any liability to us that may arise as a result of currently pending legal proceedings will not have a material adverse effect on our financial condition, liquidity, or results of operations as a whole.
Refer to Note 11 for a discussion of our commitments and contingencies related to our long-term obligations.
| 11. | Long-term Obligations |
On June 28, 2013 we entered into a Loan and Security Agreement (Loan Agreement) with Oxford Finance LLC and Silicon Valley Bank (together, the Lenders), pursuant to which the Lenders funded an aggregate principal amount of $27.0 million (Term Loan), subject to the terms and conditions set forth in the loan agreement. The Term Loan accrues interest at a fixed rate of 9.75% per annum. Pursuant to the Loan Agreement, we are required to make interest only payments through July 1, 2014 and thereafter we are required to make payments of principal and accrued interest in equal monthly installments sufficient to amortize the Term Loan through July 1, 2017, the maturity date. At maturity of the Term Loan, or the earlier repayment in full following a voluntary prepayment or upon acceleration, the Company is required to make a final payment fee in an aggregate amount equal to $1,795,000. In connection with the Term Loan, on June 28, 2013, we issued to the Lenders warrants to purchase up to an aggregate of 596,553 shares of our common stock at an exercise price of $2.26 per share. These warrants are immediately exercisable and will expire on June 28, 2020.
In connection with the funding of the Loan Agreement, we prepaid all outstanding amounts under the prior loan agreement, at which time the Company’s obligations under the prior loan agreement immediately terminated. The Company paid to the prior agent and the prior lenders approximately $18,866,000, consisting of the then outstanding principal balance due of approximately $17,325,000, accrued but unpaid interest of approximately $119,000, a final payment fee (net of fees waived or refunded by the Lenders under the new loan agreement) of approximately $1,078,000, a prepayment fee (net of fees waived or refunded by the Lenders under the new loan agreement) of approximately $312,000 and other customary lender fees and expenses.
The net proceeds of the Term Loan, after payment of lender fees and expenses and prepaying all the outstanding amounts relating to the prior loan agreement, were approximately $7.8 million.
For the continuing Lenders, we accounted for this amendment as a debt modification. Accordingly, related fees of $1,942,000 were recorded as debt discount from the prior loan, and along with the unamortized debt discount will be amortized as an adjustment of interest expense using the effective interest method. For one existing lender that did not participate in the Term Loan, the payoff of their loan was accounted for as debt extinguishment. Accordingly, a loss on debt extinguishment of $708,000 was recorded, which includes that lender’s portion of unamortized fees and discounts along with prepayment and final payment fees.
We allocated the aggregate proceeds of the Term Loan between the warrants and the debt obligations based on their relative fair values. The fair value of the warrants issued to the Lenders was calculated utilizing the Black-Scholes option pricing model. We are amortizing the resulting additional discount of $949,000 to interest expense over the term of the loan using the effective interest method. The overall effective interest rate for the Term Loan is 13.86%. The Term Loan is collateralized by the tangible assets of the company, including a security interest in substantially all of its existing and after-acquired assets.
On September 19, 2014, we entered into a Letter Agreement with the Lenders pursuant to which the Lenders waived financial covenant compliance pursuant to the Loan Agreement through October 31, 2014. The Loan Agreement requires the Company to maintain certain minimum cash balances at all times during the term of the Loan Agreement. In exchange for the above waiver, the Company agreed to re-price all 596,553 outstanding warrants issued by the Company to Oxford Finance LLC and Silicon Valley Bank pursuant to the Loan Agreement, with an exercise price per share equal to the lower of (i) the closing price per share of the Company’s common stock on September 30, 2014, or (ii) the average closing price per share of the Company’s common stock for October 1, 2 and 3, 2014.
On September 29, 2014 we entered into a 2nd Amendment to the Loan Agreement with the Lenders Pursuant to the amended Loan Agreement, and we were provided a conditional waiver of principal payments subject to meeting certain capital raise requirements, which we achieved in October. The waiver of principal payments continues through April 1, 2015 and we are then required to make payments of principal and accrued interest in equal monthly installments sufficient to amortize the Term Loan through the maturity date.
Additional details relating to the outstanding Term Loan as of December 31, 2014, are presented in the following table:
|
Origination Date
|
Original Loan
Amount
|
Interest
Rate
|
Current
Monthly
Payment*
|
Original Term
|
Remaining
Principal
(Face Value)
|
||||||||||||
|
June 2013
|
$
|
27,000,000
|
9.75
|
%
|
$
|
203,434
|
48 Months
|
$
|
25,038,125
|
||||||||
* Current monthly payment is inclusive of interest only
As of December 31, 2014, the future contractual principal and final fee payments on all of our debt and lease obligations are as follows:
|
Years Ending December 31,
|
||||
|
2015
|
$
|
7,462,000
|
||
|
2016
|
10,805,000
|
|||
|
2017
|
8,596,000
|
|||
|
Total
|
$
|
26,863,000
|
||
|
Reconciliation of Face Value to Book Value as of December 31, 2014
|
||||
|
Total debt and lease obligations, including final payment fee (Face Value)
|
$
|
26,863,000
|
||
|
Less: Debt discount
|
(1,459,000
|
)
|
||
|
Total:
|
25,404,000
|
|||
|
Less: Current portion
|
(7,363,000
|
)
|
||
|
Long-term obligation
|
$
|
18,041,000
|
||
Our interest expense for the years ended December 31, 2014, 2013 and 2012 was $4,371,000, $3,396,000 and $3,386,000, respectively. Interest expense is calculated using the effective interest method, therefore it is inclusive of non-cash amortization in the amount of $1,220,000, $893,000 and $930,000, respectively, related to the amortization of the debt discount and capitalized loan fees.
| 12. | Income Taxes |
Due to our net losses for the years ended December 31, 2014, 2013 and 2012, and since we have recorded a full valuation allowance against deferred tax assets, there was no provision or benefit for income taxes recorded. There were no components of current or deferred federal or state income tax provisions for the years ended December 31, 2014, 2013 and 2012.
A reconciliation of the total income tax provision tax rate to the statutory federal income tax rate of 34% for the years ended December 31, 2014, 2013 and 2012 is as follows:
|
2014
|
2013
|
2012
|
||||||||||
|
Income tax expense (benefit) at federal statutory rate
|
(34.00)
|
%
|
(34.00)
|
%
|
(34.00)
|
%
|
||||||
|
Income tax expense (benefit) at state statutory rate
|
(3.52)
|
%
|
(3.54)
|
%
|
(2.79)
|
%
|
||||||
|
Gain on previously held equity interest in joint venture
|
0.00
|
%
|
(7.02)
|
%
|
0.00
|
%
|
||||||
| Mark to market permanent adjustment |
(0.37)
|
%
|
(2.15)
|
%
|
(0.24)
|
%
|
||||||
|
Change in valuation allowance
|
27.12
|
%
|
80.13
|
%
|
35.86
|
%
|
||||||
|
Change in state rate
|
0.02
|
%
|
(1.01)
|
%
|
(8.36)
|
%
|
||||||
|
Permanent interest adjustments
|
4.17
|
%
|
0.00
|
%
|
0.00
|
%
|
||||||
|
Debt refinance permanent adjustment
|
3.92
|
%
|
0.00
|
%
|
0.00
|
%
|
||||||
|
Acquired NOL’s/Intangibles from joint venture
|
0.00
|
%
|
(33.40)
|
%
|
0.00
|
%
|
||||||
|
Foreign rate differential
|
0.00
|
%
|
2.48
|
%
|
(0.04)
|
%
|
||||||
|
Other, net
|
2.66
|
%
|
(1.49)
|
%
|
9.57
|
%
|
||||||
|
0.00
|
%
|
0.00
|
%
|
0.00
|
%
|
|||||||
The tax effects of temporary differences that give rise to significant portions of our deferred tax assets and deferred tax liabilities as of December 31, 2014 and 2013 are as follows:
|
2014
|
2013
|
|||||||
|
Deferred tax assets:
|
||||||||
|
Allowances and reserves
|
$
|
825,000
|
$
|
639,000
|
||||
|
Accrued expenses
|
502,000
|
718,000
|
||||||
|
Deferred revenue and gain-on-sale
|
32,000
|
79,000
|
||||||
|
Stock based compensation
|
7,786,000
|
6,962,000
|
||||||
|
Net operating loss carryforwards
|
117,258,000
|
107,846,000
|
||||||
|
Income tax credit carryforwards
|
6,993,000
|
6,710,000
|
||||||
|
Property and equipment, principally due to differences in depreciation
|
926,000
|
804,000
|
||||||
|
Other,net
|
77,000
|
296,000
|
||||||
|
134,399,000
|
124,054,000
|
|||||||
|
Valuation allowance
|
(132,583,000
|
)
|
(122,450,000
|
)
|
||||
|
Total deferred tax assets, net of allowance
|
1,816,000
|
1,604,000
|
||||||
|
Deferred tax liabilities:
|
||||||||
|
Intangibles
|
(1,816,000
|
)
|
(1,604,000
|
)
|
||||
|
Total deferred tax liability
|
(1,816,000
|
)
|
(1,604,000
|
)
|
||||
|
Net deferred tax assets (liability)
|
$
|
—
|
$
|
—
|
||||
We have established a valuation allowance against our net deferred tax assets due to the uncertainty surrounding the realization of such assets. We periodically evaluate the recoverability of the deferred tax assets. At such time as it is determined that it is more likely than not that deferred assets are realizable, the valuation allowance will be reduced. We have recorded a full valuation allowance of $132,583,000 as of December 31, 2014 as we do not believe it is more likely than not our net deferred tax assets will be realized. We increased our valuation allowance by approximately $10,133,000 during the year ended December 31, 2014. The valuation allowance includes approximately $579,000 related to stock option deductions, the benefit of which, if realized, will eventually be credited to equity and not to income.
At December 31, 2014, we had federal, and California tax loss carry forwards of approximately $314,349,000, and $187,182,000, respectively, prior to reduction for windfall tax benefits. The federal and state net operating loss carry forwards begin to expire in 2019 and 2015 respectively, if unused. At December 31, 2014, we had federal and state tax credit carry forwards of approximately $4,279,000 and $4,113,000, respectively, after reduction for uncertain tax positions. The Company has not performed a formal reseach and development credit study with respect to these credits. The federal credits will begin to expire in 2018, if unused, and the state credits carry forward indefinitely.
Pursuant to the Internal Revenue Code (“IRC”) of 1986, as amended, specifically IRC §382 and IRC §383, our ability to use net operating loss and R&D tax credit carry forwards (“tax attribute carry forwards”) to offset future taxable income is limited if we experience a cumulative change in ownership of more than 50% within a three-year testing period. We have not completed an ownership change analysis pursuant to IRC Section 382 for taxable years ended after December 31, 2007. If ownership changes within the meaning of IRC Section 382 are identified as having occurred subsequent to 2007, the amount of remaining tax attribute carry forwards available to offset future taxable income and income tax expense in future years may be significantly restricted or eliminated. Further, our deferred tax assets associated with such tax attributes could be significantly reduced upon realization of an ownership change within the meaning of IRC §382.
We recognize tax benefits associated with the exercise of stock options directly to stockholders’ equity only when realized. Accordingly, deferred tax assets are not recognized for net operating loss carry forwards resulting from windfall tax benefits. At December 31, 2014, deferred tax assets do not include $1,262,000 of excess tax benefits from stock-based compensation.
We changed our accounting method of accounting for uncertain tax positions on January 1, 2007. We had no unrecognized tax benefits as of the date of adoption.
Following is a tabular reconciliation of the unrecognized tax benefits activity during the years ended December 31, 2014, 2013 and 2012:
|
2014
|
2013
|
2012
|
||||||||||
|
Unrecognized Tax Benefits – Beginning
|
$
|
1,723,000
|
$
|
1,394,000
|
$
|
1,304,000
|
||||||
|
Gross increases – tax positions in prior period
|
—
|
69,000
|
—
|
|||||||||
|
Gross decreases – tax positions in prior period
|
—
|
—
|
—
|
|||||||||
|
Gross increase – current-period tax positions
|
129,000
|
260,000
|
90,000
|
|||||||||
|
Settlements
|
—
|
—
|
—
|
|||||||||
|
Lapse of statute of limitations
|
—
|
—
|
—
|
|||||||||
|
Unrecognized Tax Benefits – Ending
|
$
|
1,852,000
|
$
|
1,723,000
|
$
|
1,394,000
|
||||||
The unrecognized tax benefit amounts are reflected in the determination of the Company’s deferred tax assets. If recognized, none of these amounts would affect the Company’s effective tax rate, since it would be offset by an equal reduction in the deferred tax asset valuation allowance. The Company does not foresee material changes to its liability for uncertain tax benefits within the next twelve months.
The Company did not recognize interest related to unrecognized tax benefits in interest expense and penalties in operating expenses as of December 31, 2014.
The Company’s material tax jurisdictions are United States and California. To our knowledge, the Company is currently not under examination by the Internal Revenue Service or any other taxing authority.
The Company’s tax years for 1999 and forward can be subject to examination by the United States and California tax authorities due to the carry forward of net operating losses and research development credits.
| 13. | Employee Benefit Plan |
We implemented a 401(k) retirement savings and profit sharing plan (the “Plan”) effective January 1, 1999. We may make discretionary annual contributions to the Plan, which is allocated to the profit sharing accounts based on the number of years of employee service and compensation. At the sole discretion of the Board of Directors, we may also match the participants’ contributions to the Plan. We made no discretionary or matching contributions to the Plan in 2014, 2013 and 2012.
| 14. | Stockholders’ Equity |
Preferred Stock
We have authorized 5,000,000 shares of $0.001 par value preferred stock. Our Board of Directors is authorized to designate the terms and conditions of any preferred stock we issue without further action by the common stockholders. There were 13,500 and -0- shares of Series A 3.6% Convertible Preferred Stock issued and 5,311 and -0- shares outstanding as of December 31, 2014 and 2013, respectively.
In October 2014, we entered into a Securities Purchase Agreement with certain institutional investors pursuant to which the Company sold a total of 13,500 units for a purchase price of $1,000 per unit, with each unit consisting of one share of the Company’s Series A 3.6% Convertible Preferred Stock, which are convertible into shares of the Company’s common stock with a conversion price of $0.52, and warrants to purchase up to a number of shares of common stock equal to 100% of the conversion shares under the shares of preferred stock, in a registered direct offering. Each warrant has an exercise price of $0.5771 per share, is exercisable six months after the date of issuance and expires five years from the date on which it is initially exercisable. The preferred stock and the warrants were immediately separable and were issued separately. As of December 31, 2014, 8,189 units had been converted into 15,747,000 shares of common stock.
We recorded a dividend of $1.2 million for the year ended December 31, 2014, related to a beneficial conversion feature included in the issuance of our Series A 3.6% Convertible Preferred Stock. The fair value of the common stock into which the Series A 3.6% preferred stock was convertible on the date of issuance exceeded the proceeds allocated to the preferred stock, resulting in the beneficial conversion feature that we recognized as a dividend to the preferred shareholders and, accordingly, an adjustment to net loss to arrive at net loss allocable to common shareholders. Certain shares of Series A 3.6% Convertible Preferred Stock were not convertible until shareholder approval, which occurred in January 2015. As a result, an additional dividend for the beneficial conversion feature of $0.6 million will be recorded during the quarter ended March 31, 2015.
Common Stock
In December 2012, we entered into an underwriting agreement with Lazard Capital Markets, LLC (underwriter), relating to the issuance and sale of 7,020,000 shares of our common stock. The price to the public in this offering was $2.85 per share and the underwriter purchased the shares from us at a price of $2.69 per share. The transaction was completed on December 19, 2012 raising approximately $20,007,000 in gross proceeds before deducting underwriting discounts and commissions and other offering expenses payable by us. Under the terms of the underwriting agreement, we granted the underwriter an option, exercisable for 30 days, to purchase up to an additional 1,053,000 shares.
In January 2013, the underwriter exercised this option and as a result we sold an additional 1,053,000 shares raising approximately $3,000,000 in gross proceeds before deducting underwriting discounts and commissions and other offering expenses payable by us.
In October 2013, we entered into a Common Stock Purchase Agreement with Lorem Vascular for the purchase of 8,000,000 shares at $3.00 per share. The transaction occurred in two separate closings of 4,000,000 shares each. The first closing occurred in November 2013, and the second closing occurred in January 2014. As of December 31, 2013, we received $15,000,000 of the gross proceeds, $12,000,000 for the first closing and $3,000,000 towards the second closing. The balance of $9,000,000 in gross proceeds required to complete the second closing was received in January 2014. In connection with the Common Stock Purchase Agreement, the right to a one time appointment of one member of our Board of directors was granted to Mr. K.T. Lim, Chairman of Lorem Vascular. Mr. Lim exercised his right to appoint a member to serve on our Board of Directors in June 2014, and Mr. Lim’s appointee, Mr. Ruud Jona, subsequently resigned his appointment to the Board of Directors in July 2014.
In May 2014, we and 47 holders of warrants to purchase a total of 3,156,238 shares of the Company’s common stock, issued in a private offering in May 2009, agreed to extend the expiration date of the warrants from May 14, 2014 to May 14, 2015 and increase the exercise price of the warrants from $2.62 per share to $3.50 per share pursuant to an Amendment to Warrant to Purchase Common Stock. One holder of warrants did not agree to the Amendment, and their warrants, covering 38,500 shares of Common Stock, expired unexercised on May 14, 2014 in accordance with the original terms.
In May 2014, we entered into subscription agreements with certain institutional investors pursuant to which we sold a total of 4,048,584 units, with each unit consisting of one share of common stock and one warrant to purchase one share of common stock at a purchase price of $2.47 per unit, in a registered direct offering. Each warrant had an exercise price of $3.00 per share, was exercisable immediately after issuance and expires five years from the date of issuance. The transaction was completed on June 4, 2014 raising approximately $10,000,000 in gross proceeds before deducting any offering expenses or fees payable by us. Under the terms of our Placement Agent Agreement, we granted WBB Securities, LLC warrants to purchase 202,429 shares of common stock. The placement agent warrants have the same terms as the warrants issued to the purchasers in the offering, except that such warrants have an exercise price of $3.09.
In September 2014, the Company and 13 holders of warrants dated June 4, 2014 to purchase a total of 4,032,389 shares of the Company’s common stock agreed to amend the warrants in order to reduce the exercise price from $3.00 per share to $1.00 per share and change the expiration date from June 4, 2019 to September 10, 2014. The Company received proceeds of approximately $4,033,000 from the exercise of the warrants. In addition, pursuant to the terms of the amendment, upon each holder’s exercise of all shares for cash prior to the amended expiration date, the Company issued additional warrants for the same number of common shares to the holders. The additional warrants have an exercise price of $2.00 per share, and are exercisable on the date that is six months and one day from the date of issuance and expire five years from the date of issuance. For those investors participating in the October 2014 issuance of Series A 3.6% Convertible Preferred Stock, we agreed to reduce the exercise price of 3,384,601 warrants from $2.00 per share to $0.5771 per share, conditioned upon shareholder approval which was obtained in January 2015.
| 15. | Stockholders Rights Plan |
On May 28, 2003, the Board of Directors declared a dividend distribution of one preferred share purchase right (a “Right”) for each outstanding share of our common stock. The dividend is payable to the stockholders of record on June 10, 2003, and with respect to shares of common stock issued thereafter until the Distribution Date (as defined below) and, in certain circumstances, with respect to shares of common stock issued after the Distribution Date. Except as set forth below, each Right, when it becomes exercisable, entitles the registered holder to purchase from us one one-thousandth (1/1000th) of a share of our Series RP Preferred Stock, $0.001 par value per share (the “Preferred Stock”), at a price of $25.00 per one one-thousandth (1/1000th) of a share of Preferred Stock, subject to adjustment. Each share of the Preferred Stock would entitle the holder to our common stock with a value of twice that paid for the Preferred Stock. The description and terms of the Rights are set forth in a Rights Agreement (the “Rights Agreement”) between us and Computershare Trust Company, Inc., as Rights Agent, dated as of May 29, 2003, and as amended on May 12, 2005 and August 28, 2007.
The Rights attach to all certificates representing shares of our common stock outstanding, and are evidenced by a legend on each share certificate, incorporating the Rights Agreement by reference. The Rights trade with and only with the associated shares of our common stock and have no impact on the way in which holders can trade our shares. Unless the Rights Agreement was to be triggered, it would have no effect on the Company’s consolidated balance sheet or income statement and should have no tax effect on the Company or its stockholders. The Rights Agreement is triggered upon the earlier to occur of (i) a person or group of affiliated or associated persons having acquired, without the prior approval of the Board, beneficial ownership of 15% or more (20% or more for certain shareholders) of the outstanding shares of our common stock or (ii) 10 days, or such later date as the Board may determine, following the commencement of or announcement of an intention to make, a tender offer or exchange offer the consummation of which would result in a person or group of affiliated or associated persons becoming an Acquiring Person (as defined in the Rights Agreement) except in certain circumstances (the “Distribution Date”).
The Rights were not exercisable until the Distribution Date and expired on May 29, 2013.
| 16. | Stock-based Compensation |
During 1997, we adopted the 1997 Stock Option and Stock Purchase Plan (the “1997 Plan”), which provides for the direct award or sale of shares and for the grant of incentive stock options (“ISOs”) and non-statutory options to employees, directors or consultants. The 1997 Plan, as amended, provides for the issuance of up to 7,000,000 shares of our common stock. The exercise price of ISOs cannot be less than the fair market value of the underlying shares on the date of grant. ISOs can be granted only to employees. The 1997 Plan expired in October 2007.
During 2004, we adopted the 2004 Equity Incentive Plan (the “2004 Plan”), which provides our employees, directors and consultants the opportunity to purchase our common stock through non-qualified stock options, stock appreciation rights, restricted stock units, or restricted stock and cash awards. The 2004 Plan initially provides for issuance of 3,000,000 shares of our common stock, which number may be cumulatively increased (subject to Board discretion) on an annual basis beginning January 1, 2005, which annual increase shall not exceed 2% of our then outstanding stock. The 2004 Plan expired in August 2014.
In August 2014, we adopted the 2014 Equity Incentive Plan (the “2014 Plan”), which provides our employees, directors and consultants the opportunity to purchase our common stock in the form of options (incentive or non-qualified), stock appreciation rights, restricted stock purchase rights, restricted stock bonuses, restricted stock units, performance shares, performance units, cash-based awards other stock-based awards, and deferred compensation awards. The 2014 Plan initially provides for issuance of 3,975,000 shares of our common stock. As of December 31, 2014, there are 3,697,000 shares of common stock remaining and available for future issuances under the 2014 Plan, which is exclusive of securities to be issued upon an exercise of outstanding options, warrants, and rights.
Stock Options
Generally, options issued under the 2014 Plan, 2004 Plan or the 1997 Plan are subject to four-year vesting, and have a contractual term of 10 years. Most options contain one of the following two vesting provisions:
| · | 12/48 of a granted award will vest after one year of service, while an additional 1/48 of the award will vest at the end of each month thereafter for 36 months, or |
| · | 1/48 of the award will vest at the end of each month over a four-year period. |
A summary of activity for the year ended December 31, 2014 is as follows:
|
Options
|
Weighted
Average
Exercise Price
|
|||||||
|
Balance as of January 1, 2014
|
8,322,289
|
$
|
4.55
|
|||||
|
Granted
|
3,058,190
|
$
|
1.99
|
|||||
|
Exercised
|
(2,667
|
)
|
$
|
2.62
|
||||
|
Expired
|
(396,328
|
)
|
$
|
4.14
|
||||
|
Cancelled/forfeited
|
(1,866,136
|
)
|
$
|
3.45
|
||||
|
Balance as of December 31, 2014
|
9,115,348
|
$
|
3.93
|
|||||
|
Options
|
Weighted
Average
Exercise Price
|
Weighted Average Remaining Contractual Term (years)
|
Aggregate
Intrinsic Value
|
|||||||||||||
|
Balance as of December 31, 2014
|
9,115,348
|
$
|
3.93
|
6.31
|
$
|
584.4
|
||||||||||
|
Vested and expected to vest at December 31, 2014
|
9,064,341
|
$
|
3.94
|
6.30
|
$
|
560.47
|
||||||||||
|
Exercisable at December 31, 2014
|
6,230,987
|
$
|
4.70
|
5.06
|
$
|
—
|
||||||||||
The total intrinsic value of stock options exercised was $200, $3,500 and $311,000 for the years ended December 31, 2014, 2013 and 2012, respectively.
The fair value of each option awarded during the year ended December 31, 2014, 2013 and 2012 was estimated on the date of grant using the Black-Scholes-Merton option valuation model based on the following weighted-average assumptions:
|
Years ended December 31,
|
||||||||||||
|
2014
|
2013
|
2012
|
||||||||||
|
Expected term
|
6.0 years
|
6.0 years
|
5.2 years
|
|||||||||
|
Risk-free interest rate
|
1.86
|
%
|
1.12
|
%
|
0.83
|
%
|
||||||
|
Volatility
|
77.52
|
%
|
75.27
|
%
|
75.63
|
%
|
||||||
|
Dividends
|
—
|
—
|
—
|
|||||||||
|
Resulting weighted average grant date fair value
|
$
|
1.35
|
$
|
1.72
|
$
|
1.96
|
||||||
We calculated the expected term of our stock options based on our historical data. The expected term is calculated for and applied to all employee awards as a single group as we do not expect (nor does historical data suggest) substantially different exercise or post-vesting termination behavior amongst our employee population.
We estimate volatility based on the historical volatility of our daily stock price over the period preceding grant date commensurate with the expected term of the option.
The weighted average risk-free interest rate represents the interest rate for treasury constant maturity instruments published by the Federal Reserve Board. If the term of available treasury constant maturity instruments is not equal to the expected term of an employee option, we use the weighted average of the two Federal Reserve securities closest to the expected term of the employee option.
The dividend yield has been assumed to be zero as we (a) have never declared or paid any dividends and (b) do not currently anticipate paying any cash dividends on our outstanding shares of common stock in the foreseeable future.
Restricted Stock Awards
Generally, restricted stock awards issued under the 2014 Plan and 2004 Plan are subject to a vesting period that coincides with the fulfillment of service requirements for each award and have a contractual term of 10 years. These awards are amortized to compensation expense over the estimated vesting period based upon the fair value of our common stock on the award date.
A summary of activity for the year ended December 31, 2014 is as follows:
|
Restricted
Stock Awards
|
Weighted
Average Grant
Date Fair Value
|
|||||||
|
Balance as of January 1, 2014
|
106,341
|
$
|
3.62
|
|||||
|
Granted
|
115,808
|
$
|
2.50
|
|||||
|
Exercised/Released
|
(12,200
|
)
|
$
|
2.80
|
||||
|
Cancelled/forfeited
|
(16,826
|
)
|
$
|
2.51
|
||||
|
Balance as of December 31, 2014
|
193,123
|
$
|
3.10
|
|||||
|
Restricted
Stock Awards
|
Weighted
Average Grant
Date Fair Value
|
Weighted
Average
Remaining
Contractual
Term (years)
|
||||||||||
|
Balance as of December 31, 2014
|
193,123
|
$
|
3.10
|
8.32
|
||||||||
|
Vested and expected to vest at December 31, 2014
|
193,123
|
$
|
3.10
|
7.21
|
||||||||
|
Exercisable at December 31, 2014
|
83,641
|
$
|
3.91
|
8.32
|
||||||||
The following summarizes the total compensation cost recognized for the stock options and restricted stock awards in the accompanying financial statements:
|
Years ended December 31,
|
||||||||||||
|
2014
|
2013
|
2012
|
||||||||||
|
Total compensation cost for share-based payment arrangements recognized in the statement of operations (net of tax of $0)
|
$
|
3,101,000
|
$
|
3,608,000
|
$
|
3,904,000
|
||||||
As of December 31, 2014, the total compensation cost related to non-vested stock options and stock awards not yet recognized for all our plans is approximately $3,944,000, which is expected to be recognized as a result of vesting under service conditions over a weighted average period of 1.77 years.
Cash received from stock option and warrant exercises and employee stock purchase for the years ended December 31, 2014, 2013 and 2012 was approximately $4,151,000, $225,000 and $1,413,000, respectively. No income tax benefits have been recorded related to the stock option exercises as the benefits have not been realized in our income tax returns.
To settle stock options and restricted stock awards, we will issue new shares of our common stock. At December 31, 2014, we have an aggregate of 775,977 shares authorized and available to satisfy option exercises under our plans.
|
17.
|
Related Party Transactions
|
As of December 31, 2014 and 2013, Lorem Vascular was a beneficial owner of more than five percent of our outstanding shares of common stock. During the year ended December 31, 2013, Lorem Vascular purchased Celution® Systems and consumable sets from us for a total of $1,845,000 pursuant to the License/Supply Agreement.
|
18.
|
Quarterly Information (unaudited)
|
The following unaudited quarterly financial information includes, in management’s opinion, all the normal and recurring adjustments necessary to fairly state the results of operations and related information for the periods presented:
|
For the three months ended
|
||||||||||||||||
|
March 31,
2014
|
June 30,
2014
|
September 30,
2014
|
December 31,
2014
|
|||||||||||||
|
Product revenues
|
$
|
1,031,000
|
$
|
935,000
|
$
|
518,000
|
$
|
2,469,000
|
||||||||
|
Gross profit
|
610,000
|
169,000
|
181,000
|
1,053,000
|
||||||||||||
|
Development revenues
|
403,000
|
356,000
|
585,000
|
1,301,000
|
||||||||||||
|
Operating expenses
|
(10,560,000
|
)
|
(11,210,000
|
)
|
(8,656,000
|
)
|
(6,669,000
|
)
|
||||||||
|
Other income (expense)
|
(853,000
|
)
|
(1,143,000
|
)
|
(1,495,000
|
)
|
(1,440,000
|
)
|
||||||||
|
Net loss
|
$
|
(10,400,000
|
)
|
$
|
(11,828,000
|
)
|
$
|
(9,385,000
|
)
|
$
|
(5,755,000
|
)
|
||||
|
Beneficial conversion feature for convertible preferred stock
|
—
|
—
|
—
|
(1,169,000
|
)
|
|||||||||||
|
Net loss allocable to common stock holders…
|
(10,400,000
|
)
|
(11,828,000
|
)
|
(9,385,000
|
)
|
(6,924,000
|
)
|
||||||||
|
Basic and diluted net loss per share
|
$
|
(0.14
|
)
|
$
|
(0.15
|
)
|
$
|
(0.12
|
)
|
$
|
(0.08
|
)
|
||||
|
For the three months ended
|
||||||||||||||||
|
March 31,
2013
|
June 30,
2013
|
September 30,
2013
|
December 31,
2013
|
|||||||||||||
|
Product revenues
|
$
|
1,392,000
|
$
|
1,408,000
|
$
|
1,616,000
|
$
|
2,706,000
|
||||||||
|
Gross profit
|
636,000
|
800,000
|
685,000
|
1,580,000
|
||||||||||||
|
Development revenues
|
2,366,000
|
859,000
|
1,095,000
|
754,000
|
||||||||||||
|
Operating expenses
|
(9,739,000
|
)
|
(8,022,000
|
)
|
(10,241,000
|
)
|
(11,452,000
|
)
|
||||||||
|
Other income (expense)
|
(930,000
|
)
|
3,152,000
|
3,203,000
|
(923,000
|
)
|
||||||||||
|
Net loss
|
$
|
(7,667,000
|
)
|
$
|
(3,211,000
|
)
|
$
|
(5,258,000
|
)
|
$
|
(10,041,000
|
)
|
||||
|
Basic and diluted net loss per share
|
$
|
(0.11
|
)
|
$
|
(0.05
|
)
|
$
|
(0.08
|
)
|
$
|
(0.14
|
)
|
||||
Not applicable.
| (a) | Evaluation of Disclosure Controls and Procedures |
We maintain disclosure controls and procedures that are designed to ensure that information required to be disclosed in our reports filed or furnished pursuant to the Exchange Act is recorded, processed, summarized and reported within the time periods specified in the Securities and Exchange Commission’s rules and forms, and that such information is accumulated and communicated to our management, including our Chief Executive Officer and Chief Financial Officer, as appropriate, to allow for timely decisions regarding required disclosure. In designing and evaluating the disclosure controls and procedures, management recognizes that any controls and procedures, no matter how well designed and operated, can provide only reasonable assurance of achieving the desired control objectives, and management necessarily is required to apply its judgment in evaluating the cost-benefit relationship of possible controls and procedures.
As required by Rule 13a-15(b) under the Exchange Act, we carried out an evaluation, under the supervision and with the participation of our management, including our Chief Executive Officer and Chief Financial Officer, of the effectiveness of our disclosure controls and procedures, as such term is defined under Rule 13a-15(e) promulgated under the Securities Exchange Act of 1934, as amended, as of the end of the period covered by this Annual Report on Form 10-K. Based on the foregoing, our Chief Executive Officer and Chief Financial Officer concluded that our disclosure controls and procedures as of the end of the period covered by this Annual Report were effective as of the end of the period covered by this Annual Report.
| (b) | Management’s Report on Internal Control Over Financial Reporting |
Our management is responsible for establishing and maintaining adequate internal control over financial reporting. Internal control over financial reporting is defined in Rule 13a-15(f) or 15d-15(f) under the Securities Exchange Act of 1934 as a process designed by, or under the supervision of, our principal executive and principal financial officers and effected by our Board of Directors, management and other personnel, to provide reasonable assurance regarding the reliability of financial reporting and the preparation of financial statements for external purposes in accordance with generally accepted accounting principles and includes those policies and procedures that:
| · | Pertain to the maintenance of records that in reasonable detail accurately and fairly reflect the transactions and dispositions of our assets; |
| · | Provide reasonable assurance that transactions are recorded as necessary to permit preparation of financial statements in accordance with generally accepted accounting principles, and that receipts and expenditures are being made only in accordance with authorizations of management and our Board of Directors; and |
| · | Provide reasonable assurance regarding prevention or timely detection of unauthorized acquisition, use or disposition of our assets that could have a material effect on the financial statements. |
Because of its inherent limitations, internal control over financial reporting may not prevent or detect misstatements. Also, projections of any evaluation of effectiveness to future periods are subject to the risk that controls may become inadequate because of changes in conditions, or that the degree of compliance with the policies or procedures may deteriorate.
Under the supervision and with the participation of our management, including our Chief Executive Officer and Chief Financial Officer, we have conducted an evaluation of the effectiveness of our internal control over financial reporting as of the end of the fiscal year covered by this annual report on Form 10-K based on the criteria set forth in Internal Control - Integrated Framework (1992) issued by the Committee of Sponsoring Organizations of the Treadway Commission (COSO). Based on our evaluation, management concluded that our internal control over financial reporting was effective as of December 31, 2014 based on the COSO criteria. Our independent registered public accounting firm, KPMG LLP, has issued an attestation report on our internal control over financial reporting which is included herein.
| (c) | Changes in Internal Control over Financial Reporting |
There have been no changes in our internal control over financial reporting during the quarter ended December 31, 2014 that have materially affected, or are reasonably likely to materially affect, our internal control over financial reporting other than the material weakness described above.
| (d) | Remediation of Material Weakness |
We identified a material weakness in our internal control over financial reporting for the year ended December 31, 2013, related to the recognition and measurement of revenue in accordance with U.S. generally accepted accounting principles (GAAP). Specifically, our controls did not operate effectively to aggregate and communicate information necessary to (i) verify that the collection of accounts receivable was reasonably assured and (ii) evaluate whether contractual provisions were satisfied in order to recognize revenue.
In order to remediate the material weakness in our internal control over financial reporting, we implemented a remediation plan to improve our systems of disclosure controls and procedures and internal control over financial reporting. This remediation plan included:
| 1. | reevaluation of our processes for the recognition of revenue, |
| 2. | hiring a qualified individual in Japan with appropriate experience to assist with our review of revenue arrangements and to help facilitate better communication with our Japan subsidiary, and |
| 3. | enhancing our assessment of collectability over our customers to ensure that adequate evidence of collectability is obtained prior to the recognition of revenue. For customers that have not developed an adequate payment history with us and a letter of credit is not in place at the time of the transaction, and assuming all other revenue recognition criteria have been met, we defer revenues until cash is received. Our remediation efforts, including design, implementation and testing continued throughout fiscal year 2014. |
Management believes that these steps have remediated the material weakness by improving our systems of disclosure controls and procedures and internal control over financial reporting.
None.
PART III
The names of the seven directors are set forth below (the ages shown are as of March 16, 2015). All directors are elected annually and serve a one-year term until the next Annual Meeting, or until their respective successors are duly elected.
Directors and Business Experience
|
Name
|
Age
|
Position
|
|
David M. Rickey
|
59
|
Chairman of the Board of Directors
|
|
Marc H. Hedrick, MD
|
52
|
President & CEO and Director
|
|
Richard J. Hawkins
|
66
|
Director
|
|
Paul W. Hawran
|
62
|
Director
|
|
Gary Lyons
|
63
|
Director
|
|
Tommy G. Thompson
|
73
|
Director
|
|
Gail K. Naughton, Ph.D.
|
59
|
Director
|
David M. Rickey has served as a Director of the Company since November 1999, and has served as the Chairman of the Board since June 2013. Mr. Rickey was President and Chief Executive Officer of Applied Micro Circuits Corporation (AMCC), which provides high-performance, high-bandwidth silicon solutions for optical networks, from February 1996 to March 2005. Mr. Rickey served on the Board of Directors of AMCC from February 1996 to March 2005, and as its Chairman of the Board from August 2000 to March 2005. Mr. Rickey also served as a Director of AMI Semiconductor, Inc. from 2000 to 2006 and was a Director of Netlist, Inc. from 2005 to 2008, as well as several private technology companies. He holds a B.S. from Marietta College, a B.S. from Columbia University and an M.S. from Stanford University. Mr. Rickey’s qualifications to sit on our Board of Directors include his extensive executive experience, and his service on other public company boards and committees.
Marc H. Hedrick, M.D. was appointed as Chief Executive Officer of the Company in April 2014. He was appointed as President of the Company in May 2004, and joined us as Chief Scientific Officer, Medical Director and Director in October 2002. In December 2000, Dr. Hedrick co-founded and served as President and Chief Executive Officer and Director of StemSource, Inc., a company specializing in stem cell research and development, which was acquired by the Company in 2002. He is a plastic surgeon and is a former Associate Professor of Surgery and Pediatrics at the University of California, Los Angeles (UCLA). From 1998 until 2005, he directed the Laboratory of Regenerative Bioengineering and Repair for the Department of Surgery at UCLA. Dr. Hedrick earned his M.D. degree from University of Texas Southwestern Medical School, Dallas and an M.B.A. from UCLA Anderson School of Management. Dr. Hedrick’s qualifications to sit on our Board of Directors include his experience as a general, vascular and plastic surgeon; his academic appointments and achievements in the life sciences; his executive and managerial experience in stem cell research and scientific product development, and his foundational knowledge, experience and contributions to the specific technology and operations of our company. In addition, Dr. Hedrick has extensive global experience and familiarity with the cell therapy and regenerative medical industry. On April 2, 2014 the Board of Director’s appointed Dr. Hedrick as Chief Executive Officer.
Richard J. Hawkins has served as a Director of the Company since December 2007. In 1982, Mr. Hawkins founded Pharmaco, a clinical research organization (CRO) that merged with the predecessor of PPD-Pharmaco in 1991 and is one of the largest CROs in the world today. In 1992, Mr. Hawkins co-founded Sensus Drug Development, which developed and received regulatory approval for SOMAVERT®, a growth hormone antagonist approved for the treatment of acromegaly, which is now marketed by Pfizer in both the United States and Europe, and he served as Chairman until 2000. In 1994, Mr. Hawkins co-founded Corning Biopro, a contract protein manufacturing firm where he served on the Board until 2000. In September 2003 Mr. Hawkins founded LabNow, Inc., a privately held company that develops lab-on-a-chip sensor technology, where he served as the Chairman and CEO until October 2009. Mr. Hawkins has served on the Board of SciClone Pharmaceuticals, Inc. since October 2004. In February 2011, Mr. Hawkins became CEO, and is currently CEO, of Lumos Pharma, Inc., a start-up pharma company. He served on the Presidential Advisory Committee for the Center for Nano and Molecular Science and Technology at the University of Texas in Austin, and was inducted into the Hall of Honor for the College of Natural Sciences at the University of Texas. Mr. Hawkins graduated cum laude with a B.S. in Biology from Ohio University. Mr. Hawkins’s qualifications to sit on our Board of Directors include his executive experience working with life sciences companies, his extensive experience in pharmaceutical research and development, his knowledge, understanding and experience in the regulatory development and approval process and his service on other public company boards and committees.
Paul W. Hawran has served as a Director of the Company since February 2005. Mr. Hawran has held various executive, strategic, financial and operational positions in the health care industry for over 30 years. Mr. Hawran was a Founder and President and CEO of Ascendant MDx, a molecular diagnostic testing company focused on women’s health care, through June 2013. Prior to Ascendant MDx, Mr. Hawran was the Chief Financial Officer of Sequenom, Inc., a publicly traded genetics company, from April 2007 to September 2009, served on their Board of Directors from August 2006 to February 2007 and was the Chairman of the Audit Committee of the Board of Directors. Mr. Hawran also served as a Founder, Executive Vice President and Chief Financial Officer of Neurocrine Biosciences, Inc. from May 1993 through September 2006, and as a Senior Advisor to Neurocrine from September 2006 through April 2007. Neurocrine Biosciences, Inc. is a publicly traded company engaged in pharmaceutical drug development. Mr. Hawran was employed by SmithKline Beecham (now Glaxo SmithKline) from July 1984 to May 1993, most recently as Vice President and Treasurer. Prior to joining SmithKline in 1984, he held various financial positions at Warner Communications (now Time Warner) involving corporate finance and financial planning and forecasting. Mr. Hawran earned a B.S. in Finance from St. John's University and an M.S. in Taxation from Seton Hall University. He is a Certified Public Accountant (currently inactive) and is a member of the American Institute of Certified Public Accountants. Mr. Hawran’s qualifications to sit on our Board of Directors include his executive experience in life sciences industries, his extensive experience in strategic and corporate finance and planning, his status as an audit committee financial expert within the meaning of Item 407(d)(5) of SEC Regulation S-K and his service on other public company boards and committees.
Gary A. Lyons has served as a Director of the Company since October 2013. Mr. Lyons has served on the Board of Directors of Neurocrine Biosciences since 1993 and as the President and Chief Executive Officer of Neurocrine from 1993 through January 2008. Prior to joining Neurocrine Biosciences, Mr. Lyons held a number of senior management positions at Genentech, Inc., including Vice President of Business Development and Vice President of Sales. Mr. Lyons currently serves on the Boards of Directors for Rigel Pharmaceuticals, Inc., Vical Incorporated, and KaloBios Pharmaceuticals, Inc. Mr. Lyons was previously a director of PDL BioPharma, Inc., Poniard Pharmaceuticals, Inc., Neurogesx and Facet Biotech Corporation. Mr. Lyons holds a B.S. in marine biology from the University of New Hampshire and an M.B.A. from Northwestern University’s J.L. Kellogg Graduate School of Management. Mr. Lyons qualifications to sit on our Board include his executive experience working with life sciences companies, his extensive experience in pharmaceutical business development, his knowledge, understanding and experience in the regulatory development and approval process and his service on other public company boards and committees.
Tommy G. Thompson has served as a Director of the Company since April 2011. Mr. Thompson was a partner at the law firm of Akin Gump Strauss Hauer & Feld from March 2005 to January 2012. He served as U.S Department of Health and Human Services Secretary from January 2001 to January 2005, and was Governor of Wisconsin from January 1987 to January 2001. Mr. Thompson was the Chairman of the Board of Logistics Health, Inc., having been President from February 2005 to January 2011. Mr. Thompson has served as a Director of C.R. Bard since August 2005; a Director of CareView Communications, Inc. since July 2005; a Director of Centene Corporation since April 2005 and a Director of United Therapeutics Corporation since February 2011. He also served as Chairman of the Board of AGA Medical Corporation from July 2005 to November 2011. He is a recipient of the prestigious Horatio Alger Award and has served as chairman of the National Governors’ Association, the Education Commission of the States, and the Midwestern Governors’ Conference. Mr. Thompson received both his B.S. and his J.D. from the University of Wisconsin-Madison and also served in the Wisconsin National Guard and the Army Reserve. Mr. Thompson’s qualifications to sit on our Board of Directors include his significant experience in the healthcare industry both as a public official and in the private sector; his advocacy of innovative solutions to health care challenges, and his service on other public company boards and committees.
Gail K. Naughton, Ph.D. has served as a Director of the Company since July 2014. Dr. Naughton was the co-founder and co-inventor of the technology at Advanced Tissue Sciences where she held key management positions for more than 15 years, including President, Chief Operating Officer and Director. She also served as the Dean of the College of Business Administration at San Diego State University for nine years. Currently Dr. Naughton serves as the Chief Executive Officer and the Chairman of the Board of Histogen, a regenerative medicine company she founded in 2007. Dr. Naughton has also served on the Board of Directors for CR Bard, Inc. since 2005. Dr. Naughton holds a B.S. in biology from St. Francis College as well as a Master’s in histology and a Ph.D. in cell biology from New York University Medical Center. She also holds an EMBA from the Anderson School at the University of California, Los Angeles. Dr. Naughton’s qualifications to sit on our Board of Directors include her executive experience working with life sciences companies, her extensive experience in pharmaceutical research and development, her knowledge, understanding and experience in the field of regenerative medicine and her service on other public company boards and committees.
Executive Officers and Business Experience
|
Name
|
Age
|
Position
|
|
Marc H. Hedrick, MD
|
52
|
President & CEO and Director
|
|
Tiago Girão
|
35
|
Vice President, Finance & Chief Financial Officer
|
|
Steven Kesten
|
56
|
Executive Vice President & Chief Medical Officer
|
|
Seijiro N. Shirahama
|
61
|
President—Asia Pacific
|
Tiago Girão was appointed Vice President of Finance and Chief Financial Officer (CFO) in September 2014. Mr. Girão joined Cytori Therapeutics from NuVasive, Inc. where he recently served as International Controller from February 2014 to August 2014. Prior to his International Controller role, he served as Director, Financial Reporting, where he managed a team responsible for all corporate technical accounting and SEC related matters from March 2012 to February 2014. Prior to joining NuVasive, Mr. Girão served as Senior Manager, Assurance at KPMG, Cytori’s independent audit firm from October 2004 to March 2012. Prior to joining KPMG, Mr. Girão was a senior accountant for Ernst & Young in Brazil from October 2000 to August 2004. Mr. Girão is a certified public accountant with 14 years experience in the accounting, finance and reporting for U.S. and public companies and substantial experience in global finance and operations.
Steven Kesten joined Cytori as Executive Vice President and Chief Medical Officer in February 2013. Previously, he served as Vice President and Chief Medical Officer at Uptake Medical from November 2010 – February 2013 and at Boehringer Ingelheim from 2000 – 2010, mostly recently as the vice president, medicine for marketed products for respiratory disease. Prior to that, he served as the medical director of the Rush Advanced Lung Disease and Lung Transplant Program at Rush Presbyterian St. Luke’s Medical Center from 1996 – 1999; in 1995 as the medical director of the Toronto Lung Transplant Program at the University of Toronto; and as a staff pulmonologist at Toronto General Hospital and Toronto Western Hospital from 1989 to 1996. He also served as a faculty member of the University of Toronto and an associate professor of medicine at Rush Medical College. Dr. Kesten received his medical degree and specialty training in internal medicine and pulmonary medicine at the University of Toronto.
Seijiro N. Shirahama was appointed President – Asia Pacific in November 2007. Mr. Shirahama had served as Senior Vice President – Asia Pacific since November 2006, and as Vice President – Asia Pacific, from September 2002 to November 2006. Prior to that, from May 1999 to August 2002, he was President of Touchmetrics K.K., a diagnostic ultrasound firm. He held executive positions with Bristol-Myers Squibb K.K. from April 1997 to October 1998, and from March 1995 until March 1997, was the General Manager for Baxter Biotech Group in Tokyo, Japan. Mr. Shirahama holds a B.A. from Kanagawa University in Yokohama, Japan and an M.A. from the University of San Francisco.There are no family relationships among our officers and directors, nor are there any arrangements or understandings between any of our directors or officers or any other person pursuant to which any officer or director was, or is, to be selected as an officer or director.
CORPORATE GOVERNANCE
The Board of Directors held twelve meetings during 2014 and took action via unanimous written consent five times. The Audit Committee met five times; the Compensation Committee met seven times and took action via unanimous written consent two times; the Governance and Nominating Committee met two times and took action via unanimous written consent once; and the Executive Committee met two times and took action via unanimous written consent two times.
Except for Mr. Lloyd Dean who resigned on November 1, 2014, each member of the Board of Directors attended 75% or more of the aggregate of (i) the total number of Board meetings held during the period of such member’s service and (ii) the total number of meetings of committees of the Board of Directors on which such member served, during the period of such member’s service.
All board members are encouraged to attend our annual stockholders’ meetings in person. Eight of our board members attended last year’s annual stockholders’ meeting.
Board of Directors Leadership Structure
Our bylaws and governance principles provide the Board of Directors with the flexibility to combine or separate the positions of Chairman and Chief Executive Officer. Historically, these positions have been separate. Our Board believes that the separation of these positions strengthens the independence of our Board and allows us to have a Chairman focused on the leadership of the Board while allowing our Chief Executive Officer to focus more of his time and energy on managing our operations. The Board currently believes this structure works well to meet the leadership needs of the Board and of the Company. Dr. Hedrick, our President and Chief Executive Officer, has comprehensive industry expertise and is able to devote substantial time to the Company, and Mr. Rickey, our Chairman, is able to devote focus on longer term and strategic matters, and to provide related leadership to the Board. As a result, we do not currently intend to combine these positions; however a change in this leadership structure could be made if the Board of Directors determined it was in the best long-term interests of stockholder based upon a departure of either our Chief Executive Officer or Chairman. For example, if the two roles were to be combined, we believe that the independence of the majority of our directors, and the three fully independent Board committees, would provide effective oversight of our management and the Company.
The Board’s Role in Risk Oversight
The Board’s role in risk oversight includes assessing and monitoring risks and risk management. The Board reviews and oversees strategic, financial and operating plans and holds management responsible for identifying and moderating risk in accordance with those plans. The Board fulfills its risk oversight function by reviewing and assessing reports from members of management on a regular basis regarding material risks faced by the Company and applicable mitigation strategy and activity, not less than quarterly. The reports cover the critical areas of operations, sales and marketing, development, regulatory and quality affairs, intellectual property, clinical development, legal and financial affairs. The Board and its Committees (described below) consider these reports; discuss matters with management and identify and evaluate any potential strategic or operational risks, and appropriate activity to address those risks.
Board Committees
The Board of Directors has standing Audit, Compensation, Executive, and Governance and Nominating Committees. All members of the Compensation Committee, Audit Committee, and Governance and Nominating Committee are independent directors.
Compensation Committee
The Compensation Committee consists of Mr.Thompson (Chairman), Mr. Hawran and Dr. Naughton. Each of these members is independent as defined by NASDAQ, a “Non-Employee Director” as defined by rule 16b-3(b)(3)(i) of the Securities Exchange Act of 1934, as amended, and an “outside director” as defined by Section 162(m) of the Internal Revenue Code of 1986, as amended. The Committee Chairman is responsible for setting the Committee’s calendar and meeting agenda.
The Compensation Committee is responsible for developing and implementing compensation programs for our executive officers and other employees, subject only to the discretion of the full Board. More specifically, our Compensation Committee establishes base salary rates for each of the Company’s officers, and administers our 2004 Equity Incentive Plan, our 2014 Equity Incentive Plan, our Executive Management Incentive Compensation Plan, and our 2011 Employee Stock Purchase Plan. This Committee establishes the compensation and benefits for our Chief Executive Officer and other executive officers, and annually reviews the relationship between our performance and our compensation policies as well as assessing any risks associated with our compensation policies. In addition, this Committee reviews and advises the Board concerning regional and industry-wide compensation practices and trends in order to assess the adequacy of our executive compensation programs. The charter of the Compensation Committee has been established and approved by the Board of Directors, and a copy of the charter has been posted on our website at www.cytori.com under Investor Relations – Corporate Governance.
The Compensation Committee has delegated to our CEO the authority to award stock option grants to non-executive employees from a pool of stock options set aside by the Committee from time to time. Any grant made from such pool to a non-executive employee may not exceed 16,000 shares and all of the grants shall have an exercise price equal to 100% of our Common Stock’s fair market value on the grant date. We have a written policy that addresses the dates on which it is appropriate to grant such options. In addition, our CEO:
| · | Makes recommendations to the Compensation Committee regarding the base salary, bonus and stock option award levels for our other executive officers; and |
| · | Provides an annual recommendation to the Compensation Committee regarding overall Company performance objectives for the year and the individual performance objectives of each of our executive officers with respect to our Executive Management Incentive Compensation Plan, and reports to the Compensation Committee on the satisfaction of each such objective. |
Our CEO attends some of the meetings of the Compensation Committee upon invitation, but does not participate in the executive sessions of the Compensation Committee.
Audit Committee
During 2014, Mr. Hawran (Chairman), Mr. Thompson and Mr. Hawkins were the members of our Audit Committee. The Audit Committee is comprised solely of independent directors, as defined by NASDAQ. The Board of Directors has determined that Mr. Hawran is an “audit committee financial expert” within the meaning of Item 407(d)(5) of SEC Regulation S-K. The charter of the Audit Committee has been established and approved by the Board of Directors, and a copy of the charter has been posted on our website at www.cytori.com under Investor Relations – Corporate Governance.
The Audit Committee selects our auditors, reviews the scope of the annual audit, approves the audit fees and non-audit fees to be paid to our auditors, and reviews our financial accounting controls with the staff and the auditors. The Audit Committee is also charged with review and oversight of management’s enterprise risk management assessment.
Governance and Nominating Committee
Mr. Hawkins (Chairman), Mr. Dean, and Mr. Lyons comprised the members of our Governance and Nominating Committee in 2014. Mr. Dean resigned from the Committee as well as from the Board of Directors effective November 1, 2014. Dr. Naughton joined the Governance and Nominating Committee in January 2015. Currently, the Governance and Nominating Committee consists of Mr. Hawkins, Mr. Lyons, and Dr. Naughton.
The Governance and Nominating Committee is comprised solely of independent directors, as defined by NASDAQ. The Governance and Nominating Committee interviews, evaluates, nominates and recommends individuals for membership on the Board, evaluates the effectiveness of the Board and its serving members, and recommends the structure, responsibility and composition of the committees of the Board. The Committee is also responsible for recommending guidelines and policies for corporate governance for adoption by the Board. The charter of the Governance and Nominating Committee has been established and approved by the Board of Directors, and a copy of the charter has been posted on our website at www.cytori.com under Investor Relations – Corporate Governance.
Executive Committee
In 2014, the Executive Committee consisted of Dr. Hedrick, Mr. Rickey, Mr. Hawkins, and Mr. Hawran, and Mr. Thompson.
The Executive Committee is responsible to evaluate and approve the material terms of any financing transactions or business transactions as well as to authorize and approve the issuance of stock and/or other equity securities. The Executive Committee also would be able to act on behalf of the full Board in urgent or exigent circumstances wherein it would be very difficult or impossible to assemble the full Board between regularly scheduled meetings. The Sub-Committee of the Executive Committee, consists of Chairman of the Board and the CEO, has the authority to approve corporate expenditures presented by Management in excess of $250,000 up to a maximum of $1,000,000 for a single corporate transaction.
COMPENSATION COMMITTEE INTERLOCKS AND INSIDER PARTICIPATION
As of December 31, 2014, the Compensation Committee consisted of Mr. Thompson (Chairman), Dr. Naughton, and Mr. Hawran, each of whom is an independent director and none of whom is a current or former employee of the Company. None of our executive officers served as a director or member of the Compensation Committee or any Board committee performing equivalent functions for another entity that has one or more executive officers serving on our Board of Directors.
CODE OF BUSINESS CONDUCT AND ETHICS
We have adopted a Code of Business Conduct and Ethics that applies to all of our directors, officers and employees, including our principal executive officer, principal financial officer and controller. This Code of Business Conduct and Ethics has been posted on our website at www.cytori.com. We intend to post amendments to this code, or any waivers of its requirements, on our website at www.cytori.com under Investor Relations – Corporate Governance, as permitted under SEC rules and regulations.
SECTION 16(a) BENEFICIAL OWNERSHIP REPORTING COMPLIANCE
Section 16(a) of the Securities Exchange Act of 1934 requires our directors, executive officers, and persons or entities who own more than ten percent of our common stock, to file with the SEC reports of beneficial ownership and changes in beneficial ownership of our common stock. Those directors, officers, and stockholders are required by regulations to furnish us with copies of all forms they file under Section 16(a). Based solely upon a review of the copies of such reports furnished to us and written representations from such directors, officers, and stockholders, we believe that all such reports required to be filed during 2014 were filed on a timely basis.
Compensation Discussion and Analysis
This Compensation Discussion and Analysis is designed to provide stockholders with an understanding of our compensation philosophy and objectives as well as the analysis that we performed in setting executive compensation. It discusses the Compensation Committee’s determination of how and why, in addition to what, compensation actions were taken during the last fiscal year for each person serving as our chief executive officer and our chief financial officer during 2014, and the three other most highly compensated executive officers who were serving as such at the end of 2014.
Our named executive officers for fiscal year 2014 were Christopher J. Calhoun, our former Chief Executive Officer (retired July 2014); Marc H. Hedrick, our President and Chief Executive Officer; Mark E. Saad, our former Chief Financial Officer (resigned August 2014); Tiago Girão, our current Financial Officer (joined the Company in September 2014); Steven Kesten, our Executive Vice President and Chief Medical Officer; and Clyde W. Shores, our former Executive Vice President Marketing & Sales (resigned November 2014), and Seijiro Shirahama, our President of AsiaPacific.
These individuals are collectively referred to in this discussion as the “named executive officers” because they are named in the compensation tables included in this Form 10-K. Investors are encouraged to read this discussion in conjunction with the compensation tables and related notes, which include more detailed information about the compensation of the named executive officers for 2014 as well as prior years.
Compensation Philosophy for the Named Executive Officers
The Company’s compensation programs for our officers are established by the Compensation Committee of the Board of Directors (the Committee). The Committee believes that our compensation policy should align the financial interests of our executives with those of our stockholders. A key to creating this alignment is placing a substantial amount of executive compensation at risk based upon both the short-term and long-term performance of the Company, while discouraging any short-sighted risk-taking behavior. The Committee also seeks to maintain compensation programs that will retain the executives we have, and attract the executives we may need.
Executive Compensation
In the process of determining compensation for our named executive officers (NEOs), the Committee considers the current financial position of the Company, the strategic goals of the Company and the performance of our executives. The Committee also benchmarks the various components (described below) of our compensation program for executives to compensation paid by other public companies in our defined peer group, compensation data from Radford Global Life Sciences Survey, historical review of all executive officer compensation, and recommendations from our CEO (other than for his own salary). From time to time the Committee engages the services of outside compensation consultants. The Committee has the sole authority to select, compensate and terminate its external advisors.
The Committee utilizes the following components of compensation (described further below) to strike an appropriate balance between promoting sustainable and excellent performance and discouraging any inappropriate short-sighted risk-taking behavior:
| · | Base Salary; |
| · | Annual short-term performance–based cash incentives (The Executive Management Incentive Compensation Plan); |
| · | Long-term equity compensation in the form of Stock Options; |
| · | Short-term equity compensation in the potential forms as allowed by our respective 2004 Equity Incentive Plan and 2014 Equity Incentive Plan, including time, and performance vested restricted stock awards or units; |
| · | Personal benefits and perquisites; and |
| · | Change in control and severance agreements. |
Base Salary
In determining base salary for our executives the Committee considers the factors mentioned above, but base salaries are also designed to account for internal equity, length and depth of experience and the complexity and importance of roles and responsibilities.
In October, 2013, the Committee approved the engagement of Barney & Barney LLC as compensation consultants. Their engagement was specifically to review the Company’s peer group and to provide recommendations to strengthen the peer group used for market assessment of compensation. A prospective list of potential peer companies was generated and along with the current peer list; all were assessed for appropriateness of inclusion based on: industry sector; stage of commercialization; location; company revenue; market capitalization; and number of employees. Based on a result of this analysis, the Committee resolved to adopt the peer group as shown in the table below.
|
Company
|
Market Capitalization as of October 14, 2013
|
|
Arena Pharmaceuticals
|
$953.8 Million
|
|
Athersys
|
$109.5 Million
|
|
AVEO Pharmaceuticals
|
$110.6 Million
|
|
BioCryst Pharmaceuticals
|
$386.6 Million
|
|
Cell Therapeutics
|
$218.9 Million
|
|
Cytokinetics
|
$206.6 Million
|
|
Dyax
|
$718.4 Million
|
|
Dynavax Technologies
|
$214.2 Million
|
|
Geron
|
$396.2 Million
|
|
Hansen Medical
|
$138.2 Million
|
|
Immunomedics
|
$448.7 Million
|
|
Ligand Pharmaceuticals
|
$971.3 Million
|
|
NeoStem
|
$188.1 Million
|
|
Neurocrine Biosciences
|
$688.7 Million
|
|
Novavax
|
$627.4 Million
|
|
Osiris Therapeutics
|
$594.2 Million
|
|
Pain Therapeutics
|
$126.3 Million
|
|
Peregrine Pharmaceuticals
|
$222.2 Million
|
|
Rigel Pharmaceutics
|
$296.4 Million
|
|
Sangamo BioSciences
|
$605.5 Million
|
|
Solta Medical
|
$170.7 Million
|
|
StemCells
|
$59.1 Million
|
|
Ziopharm Oncology
|
$375.9 Million
|
Also in October 2013, the Committee benchmarked each executive’s base salary and target bonus to the comparable positions in the 2013 Radford Global Life Sciences Survey, generally targeting the 50th – 60th percentile and the base salary and bonus of the top five officers was also benchmarked against compensation in our peer companies. The Committee additionally reviewed each executive’s year to date performance progress in relation to the 2013 Executive Management Incentive Compensation Plan (see further discussion below), the salary history for each of the executives, and Mr.Christopher Calhoun’s (our former CEO) recommendations for compensation for each of the officers of the Company below the level of the top three executives (CEO, President, CFO). Based on the Committee’s review of the various factors mentioned above, the Committee chose not to adjust the base salaries of the executives, and their base salaries remained as follows: Mr. Calhoun at $467,900; Dr. Hedrick at $406,628 (whose salary was increased to $450,000 in April 2014 upon his appointment to CEO); Mr. Saad at $389,917; Mr. Shores at $334,750; and Dr. Kesten at $400,000. In September 2014, Mr. Girão joined the Company as Vice President of Finance and Chief Financial Officer. Mr. Girão’s salary was set at $240,000.
In October 2014, the Committee approved the engagement of Barney & Barney LLC to review the Company’s peer group and to provide recommendations to strengthen the peer group used for market assessment of compensation. A prospective list of potential peer companies was generated and along with the current peer list; all were assessed for appropriateness of inclusion based on: industry sector; developmental stage; location; and company revenue, market capitalization, and number of employees. Based on a result of this analysis, the Committee resolved to adopt the peer group as shown in the table below.
|
Company
|
Market Capitalization as of September 18, 2014
|
|
Aastrom Biosciences
|
$21.5 Million
|
|
Arqule
|
$72.8 Million
|
|
Athersys
|
$112.1 Million
|
|
AVEO Pharmaceuticals
|
$61.7 Million
|
|
CTI Biopharma
|
$400.3 Million
|
|
Cytokinetics
|
$141.7 Million
|
|
Dynavax Technologies
|
$357.5 Million
|
|
Fibrocell Science
|
$111.5 Million
|
|
Geron
|
$362.4 Million
|
|
Hansen Medical
|
$138 Million
|
|
Immunomedics
|
$302.6 Million
|
|
NeoStem
|
$183.3 Million
|
|
Neuralstem
|
$283.1 Million
|
|
Osiris Therapeutics
|
$451.2Million
|
|
Pain Therapeutics
|
$173.9 Million
|
|
Peregrine Pharmaceuticals
|
$251.3 Million
|
|
Rigel Pharmaceuticals
|
$196.7 Million
|
|
Senomyx
|
$378.2 Million
|
|
StemCells
|
$97.5 Million
|
|
Stereotaxis
|
$49.8 Million
|
|
Verastem
|
$248.6 Million
|
|
Vical
|
$102.8 Million
|
|
Ziopharm Oncology
|
$300.2 Million
|
|
Zogenix
|
$170.7 Million
|
After review of the benchmark data, discussion of each executive’s performance, with input from Mr. Calhoun (except for his own performance), the Committee decided to make no adjustments to base salaries or target bonus percentages.
|
2014 Base Salary
|
Target Bonus %
|
|||||||
|
Dr. Hedrick
|
$406,628 (increased to $450,000 upon appointment
to CEO in April 2014)
|
40% (Increased to 45%
upon appointment to CEO)
|
||||||
|
Mr. Girão
|
$
|
240,000
|
30
|
%
|
||||
|
Dr. Kesten
|
$
|
400,000
|
25
|
%
|
||||
|
Mr. Shirahama (1)
|
$
|
366,978
|
25
|
%
|
||||
|
Mr. Shores(2)
|
$
|
329,469
|
30
|
%
|
||||
|
Mr. Calhoun(3)
|
$
|
467,900
|
50
|
%
|
||||
|
Mr. Saad(4)
|
$
|
389,917
|
35
|
%
|
||||
|
(1)
|
Mr. Shirahama’s salary is in Japanese Yen. His base salary was calculated using the average exchange rate over the year.
|
| (2) | Mr. Shores resigned from the Company effective November 2014. |
| (3) | Mr. Calhoun retired as Chief Executive Officer effective April 2, 2014 and agreed to serve as Managing Director for a transition period beginning April 2, 2014 through July 1, 2014 to facilitate the orderly transfer of responsibilities |
|
(4)
|
Mr. Saad resigned from the Company effective August 2014.
|
Executive Management Incentive Compensation Plan
Our Compensation Committee adopted the Cytori Therapeutics Executive Management Incentive Compensation Plan (the EMIC) to increase the performance-based component of our executives’ compensation by linking their bonus payments to achievement of shorter term performance goals. Target bonuses are reviewed annually and established as a percentage of the executive’s base salary, generally based upon seniority of the officer and targeted at or near the median of the peer group and survey data described above. Each year the Committee establishes corporate and individual objectives and respective target percentages, taking into account recommendations from the CEO as it relates to executive positions other than the CEO’s compensation. Objectives for Dr. Hedrick were set by the Committee in 2014 to align with the overall corporate objectives. After fiscal year-end the CEO provided the Committee with a written evaluation showing actual performance as compared to the objectives, and the Committee uses that information, along with the overall corporate performance, to determine what percentage of each executive’s bonus target will be paid out as a bonus for that year. Overall, we attempt to set the corporate and individual functional goals to be highly challenging yet attainable. Our corporate financial objectives are intended to be more difficult to achieve than our actual expected results, such that their attainment would require exceptional performance and dedication from our management team.
For 2014, the general corporate objectives were determined by the Committee to account for 100% of the objectives for Dr. Hedrick, and weight of 50% of the overall target bonus amounts for each of our other named executive officers. The general Company objectives were as follows:
| o | Financial Objectives |
| o | Manage operating loss to specified objectives |
| o | Achieve 2014 year end cash objectives |
| o | Clinical Development Objectives |
| o | Complete ATHENA I and ATHENA II trial and enrollment objectives |
| o | Identify new pipeline opportunities with development plans and budget for project initiation ready by year-end |
| o | Complete clinical partnership trial objectives |
| o | Government Contracting and Development Objectives |
| o | Transfer specified manufacturing to EU facility |
| o | Obtain BARDA funding to specified targets |
| o | Business Development Objectives |
| o | Bring licensing opportunity to term-sheet |
| o | Obtain certificate of foreign governments and CFDA class 1 approval |
| o | Research Sales and Marketing |
| o | Achieve specified product revenue targets |
| o | Develop operating plans for regional profitability in 2015. |
The individual following named executive officers’ objectives expanded upon their particular function in the overall corporate objectives and were to be weighted as 50% of their respective target bonus amounts.
Mr. Saad’s individual objectives included:
| · | Corporate cash burn reduction objectives |
| · | Capitalization objectives |
| · | Cash deal objectives |
| · | Investor relations objectives |
| · | Vendor cost reduction targets |
| · | Finance and accounting process improvement objectives |
| · | Compliance and reporting objectives |
| · | Bringing at least one substantive partnership to late stage discussion |
Dr. Kesten’s individual objectives included:
| · | Enrollment and/or Initiation goals for ATHENA I & ATHENA II, Development of new pipeline indications |
| · | Business development objectives |
Mr. Shores’ individual objectives included:
| · | Revenue goal to specified targets |
| · | Achieve overall gross margin and consumable utilization objectives |
| • |
Development of new pipeline indications
|
Mr. Shirahama’s individual objectives included:
| · | Achieve research sales and operational profitability objectives |
| · | Achieve business development deal objectives |
| · | Regulatory and clinical objectives |
Mr. Girão joined the company in September 2014 and thus did not participate in the formal 2014 EMIC plan.
The 2014 target bonus as a percentage of annual base salary for each named executive officer was: 45% for Dr. Hedrick; 25% for Dr. Kesten; and 25% for Mr. Shirahama. The Committee, in its January 2015 meeting, evaluated our progress in 2014 as compared to overall the corporate objectives in the 2014 EMIC Plan described above. The Committee evaluated the overall results and then evaluated the progress of each executive officer towards their own functional objectives and the results are tabulated in the table below:
|
Officer and Position
|
Target Bonus as a % of Salary
|
% of Target Bonus Awarded
|
Bonus Awarded as a % of Salary
|
Amount of 2014 Bonus Paid in 2015(6)
|
||||||||||||
|
Marc H. Hedrick,
President & CEO
|
45
|
%
|
90
|
%
|
40.5
|
%
|
$
|
182,250
|
||||||||
|
Tiago M. Girão, (1)
Chief Financial Officer
|
30
|
%
|
33
|
%
|
9.9
|
%
|
$
|
25,000
|
||||||||
|
Steven Kesten
Executive Vice President & Chief Medical Officer
|
25
|
%
|
63.8
|
%
|
15.9
|
%
|
$
|
63,750
|
||||||||
|
Seijiro Shirahama(2)
President- Asia Pacific
|
25
|
%
|
55
|
%
|
13.8
|
%
|
$
|
50,460
|
||||||||
|
Clyde Shores, (3)
Former Executive Vice President Marketing & Sales
|
N/
|
A
|
N/
|
A
|
N/
|
A
|
N/
|
A
|
||||||||
|
Christopher J. Calhoun, (4)
Former Chief Executive Officer
|
N/
|
A
|
N/
|
A
|
N/
|
A
|
N/
|
A
|
||||||||
|
Mark Saad, (5)
Former Chief Financial Officer
|
N/
|
A
|
N/
|
A
|
N/
|
A
|
N/
|
A
|
||||||||
| (1) | Mr. Girão did not formally participate in the 2014 EMIC program, but the Committee, in its discretion awarded Mr. Girão a $25,000 bonus. |
| (2) | Mr. Shirahama’s bonus was determined by the Committee as 13.8% of his base salary in US Dollars using the 2014 average annual foreign exchange rate. |
| (3) | Mr. Shores resigned from the Company effective November 2014, therefore his EMIC bonus determination is not applicable. |
| (4) | Mr. Calhoun retired as Chief Executive Officer effective April 2, 2014 , therefore his EMIC determination bonus is not applicable. |
| (5) | Mr. Saad resigned from the Company effective August 2014, therefore his EMIC bonus determination is not applicable. |
| (6) | The 2014 bonus has not been paid as of February 28, 2015. The bonus will be paid in quarterly installments starting April 1, 2015. |
Long-Term Equity Compensation
We designed our long-term equity grant program to further align the interests of our executives with those of our stockholders and to reward the executives’ longer-term performance. Historically, the Committee has granted individual option grant awards, although from time-to-time, to further increase the emphasis on compensation tied to performance, the Committee may grant other equity awards as allowed by either the 2004 Equity Incentive Plan or the 2014 Equity Incentive Plan. The Committee grants stock options, restricted stock, or restricted stock units based on its judgment as to whether the complete compensation packages to our executives, including prior equity awards, are sufficient to retain and incentivize the executives and whether the grants balance long-term vs. short-term compensation. The Committee also considers our overall performance as well as the individual performance of each NEO, and the potential dilutive effect of restricted stock awards, and the dilutive and overhang effect of the option grant awards, and recommendations from the CEO (other than with respect to his own option grants or restricted stock awards).
Our customary practice is to grant long-term equity compensation to the executives at the regularly-scheduled Compensation Committee meeting in the first quarter of the year, or as executive new hires are made or promotions granted. The Compensation Committee meeting dates are not related to dates for release of Company information. Stock options are granted with an exercise price equal to the fair market value of our Common Stock on the date of grant and restricted stock is awarded at the fair market value on the date of award. In April 2014, the Committee granted the following stock options to the NEOs:
|
Officer
|
Stock options at
fair market value($2.38)
|
|||
|
Dr. Hedrick
|
285,000
|
|||
|
Dr. Kesten
|
140,000
|
|||
|
Mr. Shirahama
|
100,000
|
|||
|
Mr. Shores(1)
|
120,000
|
|||
|
Mr. Saad(2)
|
170,000
|
|||
| (1) | Mr. Shores resigned from the Company effective November 2014, therefore his EMIC bonus determination is not applicable. |
| (2) | Mr. Saad resigned as CFO in August 2014. |
Stock options are granted with an exercise price equal to the fair market value of our Common Stock on the date of grant and restricted stock is awarded at the fair market value on the date of award. In August 2014, the Committee granted the following stock options as part of a one-time special grant to the NEOs:
|
Officer
|
Stock options at
fair market value($1.40)
|
|||
|
Dr. Hedrick
|
100,000
|
|||
|
Dr. Kesten
|
90,000
|
|||
|
Mr. Shirahama
|
50,000
|
|||
|
Mr. Shores(1)
|
50,000
|
|||
| (1) | Mr. Shores resigned from the Company effective November 2014, therefore his EMIC bonus determination is not applicable. |
When Mr. Girão joined the Company in September 2014, he was granted 150,000 options at fair market value ($1.36) on September 2, 2014, which would vest 1/48th each month thereafter, subject to a one year cliff from his date of hire.
These grants represented an increase over 2013 grants, reflecting our increased focus on option-based compensation at above fair market value. You can find more information regarding these grants by referring to our Grants of Plan-Based Awards table on page 91.
Short-Term Equity Compensation
No short term equity was granted to Executives in fiscal year 2013 or 2014.
Personal Benefits and Perquisites
All of our executives are eligible to participate in our employee benefit plans, including medical, dental, vision, life insurance, short-term and long-term disability insurance, flexible spending accounts, 401(k), and Employee Stock Purchase Program (ESPP). These plans are available to all full-time employees. In keeping with our philosophy to provide total compensation that is competitive within our industry we offer limited personal benefits and perquisites to executive officers that include supplemental long-term disability insurance. We also provided a supplemental life insurance policy for Dr. Hedrick. You can find more information on the amounts paid for these perquisites in our 2014 Summary Compensation Table.
Company Acquisition / Post-Termination Compensation
The Company has entered into individual change of control agreements (the CIC Agreements) with Dr. Hedrick, Mr. Girão, Dr. Kesten, and Mr. Shirahama. The CIC Agreements provide for certain severance benefits to be paid to each of these executives in the event of his involuntary termination without cause, or due to the executive’s resignation for good reason (including the Company’s material breach of its obligations, material reduction in duties, responsibilities, compensation or benefits, or relocation by more than 30 miles without prior consent), provided such termination or resignation occurs in connection with an acquisition of the Company. Upon such termination or resignation in the event of an acquisition, Dr. Hedrick would receive a lump sum payment of 18 times his monthly base salary, and 18 times his monthly COBRA payments, and Mr. Girão, Dr. Kesten, and Mr. Shirahama would each receive a lump sum payment of 12 times their monthly base salary, and 12 times their monthly COBRA payments. Notwithstanding the foregoing, these executives’ employment may be terminated for cause (including extended disability, repudiation of the CIC Agreement, conviction of a plea of no contest to certain crimes or misdemeanors, negligence that materially harms the company, failure to perform material duties without cure, drug or alcohol use that materially interferes with performance, and chronic unpermitted absence) without triggering an obligation for the Company to pay severance benefits under the CIC Agreements.
In addition, under the CIC Agreements, any unvested stock options granted to each of the above named executive officers would vest in full upon (1) the date of the executive’s termination under the circumstances described above following entry into an acquisition agreement (subject to the actual consummation of the acquisition) or (2) consummation of an acquisition.
In all events, each executive’s entitlement to the benefits described above is expressly conditioned upon his execution and delivery to the Company of a CIC Agreement and General Release of claims, in the form to be attached to the CIC Agreement.
The executives may voluntarily terminate their employment with the Company at any time. If they voluntarily terminate their employment, they will receive payment for any earned and unpaid base salary as of the date of such termination; accrued but unused vacation time; and benefits they are entitled to receive under benefit plans of the Company, less standard withholdings for tax and social security purposes, through the termination date.
2014 Summary Compensation Table
The following table sets forth information concerning compensation earned for services rendered to us by the NEOs:
|
(a)
|
(b)
|
(c)
|
(d)
|
(e)
|
(f)
|
(g)
|
(h)
|
|||||||||||||||||||||
|
Name and Principal Position
|
Year
|
Salary
|
Stock Awards(1)
|
Option Awards(2)
|
Non-
Equity Incentive Plan
Comp. (3)
|
All Other Comp-ensation
|
Total
|
|||||||||||||||||||||
| Marc H. Hedrick, President and Chief |
2014
|
$
|
437,350
|
—
|
$
|
554,307
|
$
|
182,250
|
—
|
(4) |
$
|
1,173,907
|
||||||||||||||||
| Executive Officer (PEO) |
2013
|
$
|
406,627
|
—
|
$
|
465,869
|
$
|
89,133
|
—
|
(4)
|
$
|
961,629
|
||||||||||||||||
|
2012
|
$
|
406,627
|
$
|
212,764
|
(12)
|
$
|
241,998
|
$
|
76,446
|
—
|
(4)
|
$
|
937,835
|
(8)
|
||||||||||||||
| Tiago M. Girão, |
2014
|
$
|
79,080
|
—
|
$
|
137,561
|
$
|
50,000
|
(5)
|
—
|
$
|
266,641
|
||||||||||||||||
| VP of Finance and Chief Financial |
2013
|
—
|
—
|
—
|
—
|
—
|
—
|
|||||||||||||||||||||
| Officer (PFO)(15) |
2012
|
—
|
—
|
—
|
—
|
—
|
—
|
|||||||||||||||||||||
| Steven Kesten, M.D., Executive Vice |
2014
|
$
|
400,000
|
—
|
$
|
310,888
|
$
|
63,750
|
—
|
(4)
|
$
|
774,638
|
||||||||||||||||
| President and Chief Medical Officer |
2013
|
$
|
333,333
|
—
|
$
|
271,174
|
$
|
113,880
|
$
|
68,401
|
(6)
|
$
|
786,788
|
|||||||||||||||
|
2012
|
—
|
—
|
—
|
—
|
—
|
—
|
||||||||||||||||||||||
| Seijiro Shirahama, |
2014
|
$
|
366,978
|
(7)
|
—
|
$
|
208,574
|
$
|
50,460
|
—
|
(4)
|
$
|
626,012
|
(8)
|
||||||||||||||
| President- Asia Pacific |
2013
|
$
|
371,808
|
(7)
|
—
|
$
|
211,758
|
$
|
24,528
|
—
|
(4)
|
$
|
608,094
|
|||||||||||||||
|
2012
|
$
|
454,432
|
(7)
|
$
|
178,278
|
(12)
|
$
|
84,173
|
$
|
82,843
|
—
|
(4)
|
$
|
779,726
|
||||||||||||||
| Clyde W. Shores, |
2014
|
$
|
302,013
|
|
—
|
$
|
240,847
|
(11)
|
—
|
$
|
25,344
|
(10) |
$
|
568,204
|
||||||||||||||
| Former Executive Vice President |
2013
|
$
|
329,469
|
|
—
|
$
|
254,110
|
$
|
25,237
|
$
|
35,000
|
(10) |
$
|
643,816
|
||||||||||||||
| Marketing & Sales(9) |
2012
|
$
|
329,469
|
|
$
|
178,278
|
(12)
|
$
|
84,173
|
$
|
65,276
|
$
|
44,400
|
(10) |
$
|
701,596
|
||||||||||||
| Christopher J. Calhoun, Former |
2014
|
$
|
427,406
|
—
|
|
—
|
—
|
$
|
129,576
|
(14)
|
$
|
556,982
|
||||||||||||||||
| Chief Executive Officer (13) |
2013
|
$
|
467,900
|
—
|
$
|
635,276
|
$
|
82,467
|
—
|
(4)
|
$
|
1,185,643
|
||||||||||||||||
|
2012
|
$
|
467,900
|
$
|
293,260
|
(12)
|
$
|
483,996
|
$
|
109,956
|
—
|
(4)
|
$
|
1,355,112
|
(8)
|
||||||||||||||
| Mark E. Saad, |
2014
|
$
|
304,433
|
—
|
$
|
274,314
|
(16)
|
$
|
—
|
—
|
(4)
|
$
|
578,747
|
|||||||||||||||
| Former Chief Financial Officer(15) |
2013
|
$
|
389,917
|
—
|
$
|
381,165
|
$
|
35,660
|
—
|
(4)
|
$
|
806,742
|
||||||||||||||||
|
2012
|
$
|
389,917
|
$
|
184,040
|
(12)
|
$
|
84,173
|
$
|
64,141
|
—
|
(4)
|
$
|
722,271
|
(8)
|
||||||||||||||
| (1) | This column represents the dollar amount of the aggregate grant date fair value of stock awards, computed in accordance with FASB ASC Topic 718. For information relating to the assumptions made by us in valuing the stock awards made to our named executive officers in 2015, refer to Note 16 to our audited consolidated financial statements. |
| (2) | This column represents the dollar amount of the aggregate grant date fair value of awards, computed in accordance with FASB ASC Topic 718. For information relating to the assumptions made by us in valuing the option awards made to our named executive officers in 2015, refer to Note 16 to our audited consolidated financial statements. |
| (3) | The amounts in column (f) reflect the cash awards under our EMIC Plan, which is discussed in further detail in the CD&A under the heading “2015 NEO Compensation – Executive Management Incentive Compensation Plan.” |
| (4) | Dollar value of the Named Executive Officer’s perquisites and other personal benefits was less than $10,000 for the year reported. |
| (5) | Includes sign-on bonus ($25,000). |
| (6) | All Other Compensation for Dr. Kesten who was hired 2/26/2013 includes a relocation allowance ($68,401). |
| (7) | We pay Mr. Shirahama in Japanese Yen. During 2012, 2013, and 2014 his salary was recorded at the average exchange rate over the year. |
| (8) | Includes the value of RSA grants that did not vest in the timeframe required by the grants and therefore terminated in their entirety. |
| (9) | Mr. Shores resigned from the Company effective November 2014. |
| (10) | All Other Compensation for Mr. Shores include relocation allowance ($44,400) for 2012, additional relocation allowance ($35,000) for 2013 and severance ($24,344) for 2014. |
| (11) | Options awards were cancelled due to resignation. |
| (12) | On January 26, 2012, the Compensation Committee granted Restricted Stock Awards as well as Performance based RSAs with performance vesting requirement. In 2013, the Compensation Committee determined that one of the performance milestones was achieved and authorized to continue vesting the shares allocated to this milestone. The Compensation Committee used its discretion to continue vesting a portion of the awards allocated to the milestones that were not achieved by December 31, 2012. |
| (13) | Mr. Calhoun retired as Chief Executive Officer effective April 2, 2014 and agreed to serve as Managing Director for a transition period beginning April 2, 2014 through July 1, 2014 to facilitate the orderly transfer of responsibilities. From July 2, 2014 to September 29, 2014 Mr. Calhoun continued as a non-Board member Management Director with select Business Development responsibilities. |
| (14) | All Other Compensation for Mr. Calhoun severance of $129,576 for 2014. |
| (15) | Mr. Saad resigned as CFO in August 2014, and Mr. Girão joined the Company as Vice President Finance & Chief Financial Officer in September 2014. |
| (16) | Mr. Saad entered into a consulting services agreement on August 13, 2014. This agreement forfeited 170,000 vested options and 185,000 unvested options. The remaining unvested options continued to vest for the duration of the contract services; the remaining vested options continue to remain eligible for exercise. The fair value was decreased from $1.61 to $0.00 due to option modification revaluation at date of termination. |
2014 Grants of Plan-Based Awards
The following table sets forth information regarding grants of stock and option awards made to our Named Executive Officers during fiscal 2014:
|
(a)
|
(b)
|
(c-e) |
(f)
|
(g)
|
(h)
|
(i)
|
(j)
|
||||||||||||||||||||||||||
|
Estimated Future Payouts Under Non-Equity Incentive Plan Awards(1)
|
All Other Stock Awards: Number of Shares of Stock or Units
|
All Other Option Awards: Number of Securities Underlying Options
|
Exercise or Base Price of Option Awards
|
Market Price on Date of Grant
|
Full Grant Date Fair Value of Stock and Option Awards
|
||||||||||||||||||||||||||||
|
Named Officers
|
Grant
|
Thre-shold
|
Target
|
Maxi-mum
|
|||||||||||||||||||||||||||||
| Date |
($)
|
($)
|
($)
|
(#)
|
(#)
|
($/Sh)
|
($/Sh)
|
($)(2)
|
|||||||||||||||||||||||||
|
Marc H. Hedrick,
President and Chief Executive Officer
|
04/11/2014
08/21/2014
|
–
–
|
$
|
202,500
–
|
–
–
|
–
–
|
285,000
100,000
|
$
$
|
2.38
1.40
|
$
$
|
2.38
1.40
|
$
$
|
459,885
94,422
|
||||||||||||||||||||
|
Tiago M. Girão,
VP of Finance Chief Financial Officer
|
09/02/2014
|
–
|
$
|
78,000
|
–
|
–
|
150,000
|
$
|
1.36
|
$
|
1.36
|
$
|
137,561
|
||||||||||||||||||||
|
Steven Kesten, M.D., Executive Vice President and Chief Medical Officer
|
04/11/2014
08/21/2014
|
–
–
|
$
|
100,000
–
|
–
–
|
–
–
|
140,000
90,000
|
$
$
|
2.38
1.40
|
$
$
|
2.38
1.40
|
$
$
|
225,908
84,979
|
||||||||||||||||||||
|
Seijiro Shirahama,
President- Asia Pacific
|
04/11/2014
08/21/2014
|
–
–
|
$
|
91,745
–
|
(3)
|
–
–
|
–
–
|
100,000
50,000
|
$
$
|
2.38
1.40
|
$
$
|
2.38
1.40
|
$
$
|
161,363
47,210
|
|||||||||||||||||||
|
Clyde W. Shores,
Former Executive Vice President Marketing & Sales(4)
|
04/11/2014
08/21/2014
|
–
–
|
–
–
|
–
–
|
–
–
|
120,000
50,000
|
$
$
|
2.38
1.40
|
$
|
2.38
1.40
|
$
$
|
193,636
47,211
|
|||||||||||||||||||||
|
Christopher J. Calhoun, Former
Chief Executive Officer(5)
|
–
|
–
|
–
|
–
|
–
|
–
|
–
|
–
|
–
|
||||||||||||||||||||||||
|
Mark E. Saad,
Former Chief Financial Officer(6)
|
04/11/2014
|
–
|
–
|
–
|
–
|
170,000
|
$
|
2.38
|
$
|
2.38
|
$
|
274,317
|
|||||||||||||||||||||
| (1) | Amounts reported represent the target cash bonus amounts that could have been earned under the EMIC, as described under the heading Compensation Discussion & Analysis - Executive Compensation” above. |
| (2) | Computed in accordance with FASB ASC Topic 718. Refer to Note 16 to our audited consolidated financial statements regarding assumptions underlying valuation of equity awards. |
| (3) | Mr. Shirahama’s Estimated Future Payouts Under Non-Equity Incentive Plan Awards is based in US Dollars using the 2014 average annual foreign exchange rate. |
| (4) | Mr. Shores resigned from the Company effective November 2014. |
| (5) | Mr. Calhoun retired as Chief Executive Officer effective April 2, 2014 and agreed to serve as Managing Director for a transition period beginning April 2, 2014 through July 1, 2014 to facilitate the orderly transfer of responsibilities. |
| (6) | Mr. Saad resigned from the Company effective August 2014. |
Narrative Disclosure to Summary Compensation Table and Grants of Plan-Based Awards Table
The stock options granted to the NEOs in April 2014 have an exercise price of $2.38 and $1.40 for the options granted in August 2014. Exercise prices for the options granted in April 2014 and August 2014 are determined by the closing sale price of the Company’s common stock on NASDAQ on the date of grant. The April 2014 option awards have a contractual term of ten years and vest in equal monthly installments over a period of four years, subject to the NEO’s continued service to the Company. The August 2014 option awards have a contractual term of ten years and vest over two years, with 50% cliff-vesting on August 21, 2015 and 50% vesting on August 21, 2016, subject to remaining an employee of the Company.
Outstanding Equity Awards at December 31, 2014
The following table sets forth information regarding outstanding equity awards held by our Named Executive Officers as of December 31, 2014.
|
Option Awards
|
Stock Awards
|
|||||||||||||||||||||
|
Name
|
Option Grant
Date(1)
|
Number
of
Securities
Underlying Unexercised
Options
(#)
Exercisable
|
Number of
Securities
Underlying Unexercised
Options
(#) Un-
Exercisable(2)
|
Option Exercise
Price
($)
|
Option Ex-
piration
Date
|
Number
of Shares
or Units
of Stock
That
Have
Not
Vested
(#)
|
Market
Value of
Shares or
Units of
Stock
That
Have Not
Vested
($)
|
|||||||||||||||
|
Marc H. Hedrick,
President and Chief Executive Officer
|
2/2/2005
1/24/2006
2/26/2007
1/31/2008
1/29/2009
2/5/2010
1/27/2011
1/26/2012
1/31/2013
1/31/2013
4/11/2014
8/21/2014
|
70,000
70,000
50,000
60,000
75,000
110,000
53,853
83,854
87,847
43,924
47,500
—
|
—
—
—
—
—
—
1,147
31,146
95,486
47,843
237,500
100,000(6)
|
|
$3.12
$7.04
$5.44
$5.14
$4.80
$6.71
$5.57
$3.44
$2.74
$5.00
$2.38
$1.40
|
2/2/2015
1/24/2016
2/26/2017
1/31/2018
1/29/2019
2/5/2020
1/27/2021
1/26/2022
1/31/2023
1/31/2023
4/11/2024
8/21/2024
|
—
—
—
—
—
—
—
—
—
—
—
—
|
—
—
—
—
—
—
—
—
—
—
—
—
|
||||||||||||||
|
Tiago M. Girão,
VP of Finance Chief Financial Officer
|
9/2/2014
|
—
|
150,000
|
|
$1.36
|
9/2/2024
|
—
|
—
|
||||||||||||||
|
Steven Kesten, M.D., Executive Vice President and Chief Medical Officer
|
1/31/2013
4/11/2014
8/21/2014
|
72,354
23,333
—
|
78,646
116,667
90,000(6)
|
|
$2.74
$2.38
$1.40
|
1/31/2023
4/11/2024
8/21/2024
|
—
—
—
|
—
—
—
|
||||||||||||||
|
Seijiro Shirahama,
President- Asia Pacific
|
2/2/2005
12/08/2005
1/24/2006
2/26/2007
11/15/2007
1/31/2008
1/29/2009
2/5/2010
1/27/2011
1/26/2012
1/31/2013
1/31/2013
4/11/2014
8/21/2014
|
35,000
50,000
35,000
30,000
25,000
55,000
65,000
95,000
46,510
29,167
39,930
19,965
16,667
—
|
—
—
—
—
—
—
—
—
990
10,833
43,403
21,702
83,333
50,000(6)
|
|
$3.12
$6.86
$7.04
$5.44
$5.35
$5.14
$4.80
$6.71
$5.57
$3.44
$2.74
$5.00
$2.38
$1.40
|
2/2/2015
12/08/2015
1/24/2016
2/26/2017
11/15/2017
1/31/2018
1/29/2019
2/5/2020
1/27/2021
1/26/2022
1/31/2023
1/31/2023
4/11/2024
8/21/2024
|
—
—
—
—
—
—
—
—
—
—
—
—
—
—
|
—
—
—
—
—
—
—
—
—
—
—
—
—
—
|
||||||||||||||
|
Clyde W. Shores,
Former Executive Vice President Marketing & Sales(3)
|
5/19/2011
1/26/2012
1/31/2013
1/31/2013
4/11/2014
|
72,187
28,333
43,750
21,875
17,500
|
—
—
—
—
—
|
|
$5.37
$3.44
$2.74
$5.00
$2.38
|
5/19/2021
1/26/2022
1/31/2023
1/31/2023
4/11/2024
|
—
—
—
—
—
|
—
—
—
—
—
|
||||||||||||||
|
Christopher J. Calhoun,
Former Chief Executive Officer(4)
|
2/2/2005
1/24/2006
2/26/2007
1/31/2008
1/29/2009
2/5/2010
1/27/2011
1/26/2012
1/31/2013
1/31/2013
|
100,000
100,000
70,000
85,000
100,000
150,000
67,186
148,542
250,000
49,479
|
—
—
—
—
—
—
—
—
—
—
|
|
$3.12
$7.04
$5.44
$5.14
$4.80
$6.71
$5.57
$3.44
$2.74
$5.00
|
2/2/2015
1/24/2016
2/26/2017
1/31/2018
1/29/2019
2/5/2020
1/27/2021
1/26/2022
1/31/2023
1/31/2023
|
—
—
—
—
—
—
—
—
—
—
|
—
—
—
—
—
—
—
—
—
—
|
||||||||||||||
|
Mark E. Saad,
Chief Former Financial Officer(5)
|
1/24/2006
2/26/2007
1/31/2008
1/29/2009
1/27/2011
1/26/2012
1/31/2013
1/31/2013
4/11/2014
|
70,000
50,000
55,000
70,000
48,958
29,167
71,875
35,937
28,333
|
—
—
—
—
1,042
10,833
78,125
39,063
141,667
|
|
$7.04
$5.44
$5.14
$4.80
$5.57
$3.44
$2.74
$5.00
$2.38
|
1/24/2016
2/26/2017
1/31/2018
1/29/2019
1/27/2021
1/26/2022
1/31/2023
1/31/2023
4/11/2024
|
—
—
—
—
—
—
—
—
—
|
—
—
—
—
—
—
—
—
—
|
||||||||||||||
| (1) | For a better understanding of this table, we have included an additional column showing the grant date of the stock options. |
| (2) | Generally, awards issued under the 1997 or 2004 plans are subject to four-year vesting, and have a contractual term of 10 years. Awards presented in this table contain one of the following two vesting provisions: |
| · | 25% of a granted award vests after one year of service, while an additional 1/48 of the award vests at the end of each month thereafter for 36 months, or |
| · | 1/48 of the award vests at the end of each month over a four-year period. |
| (3) | Mr. Shores resigned from the Company effective November 2014. |
| (4) | Mr. Calhoun retired as Chief Executive Officer effective April 2, 2014 and agreed to serve as Managing Director for a transition period beginning April 2, 2014 through July 1, 2014 to facilitate the orderly transfer of responsibilities. |
| (5) | Mr. Saad resigned from the Company effective August 2014, per his separation agreement his options will continue to vest 12 months after resignation date. |
| (6) | The August 2014 grant schedule is, 50% of granted award vests after one year of service and the additional 50% on the second anniversary of the grant. |
2014 Option Exercises and Stock Vested
The following table sets forth information regarding options exercised and shares of common stock acquired upon vesting by our Named Executive Officers during the fiscal ended December 31, 2014:
|
(a)
|
(b)
|
(c)
|
(d)
|
(e)
|
||||||||||||
|
Option Awards
|
Stock Awards
|
|||||||||||||||
|
Name
|
Number of Shares Acquired on Exercise
(#)
|
Value Realized on Exercise
($)
|
Number of Shares Acquired on Vesting
(#)(1)
|
Value Realized on Vesting
($)
|
||||||||||||
|
Marc H. Hedrick,
President & Chief Executive Officer
|
—
|
—
|
21,373
|
$
|
62,623
|
|||||||||||
|
Tiago M. Girão,
VP of Finance Chief Financial Officer
|
—
|
—
|
—
|
—
|
||||||||||||
|
Steven Kesten, M.D., Executive Vice President and Chief Medical Officer
|
—
|
—
|
—
|
—
|
||||||||||||
|
Seijiro Shirahama,
President- Asia Pacific
|
—
|
—
|
—
|
—
|
||||||||||||
|
Clyde W. Shores,
Former Executive Vice President Marketing & Sales(3)
|
—
|
—
|
18,458
|
$
|
54,082
|
|||||||||||
|
Christopher J. Calhoun,
Former Chief Executive Officer (4)
|
—
|
—
|
29,145
|
$
|
85,395
|
|||||||||||
|
Mark E. Saad,
Former Chief Financial Officer(5)
|
—
|
—
|
19,430
|
$
|
56,930
|
|||||||||||
| (1) | Represents time based restricted stock awards that vested on January 10, 2014. |
| (2) | The fair market value on January 10, 2014 was $2.93. Computed in accordance with FASB ASC Topic 718. Refer to Note 16 to our audited consolidated financial statements regarding assumptions underlying valuation of equity awards. |
| (3) | Mr. Shores resigned from the Company effective November 2014. |
| (4) | Mr. Calhoun retired as Chief Executive Officer effective April 2, 2014 and agreed to serve as Managing Director for a transition period beginning April 2, 2014 through July 1, 2014 to facilitate the orderly transfer of responsibilities |
| (5) | Mr. Saad resigned from the Company effective August 2014, per his separation agreement his options will continue to vest 12 months after resignation date. |
Pension Benefits
We did not have a pension plan nor did we provide pension benefits to our NEOs (or any other employees) during fiscal 2014.
Nonqualified Deferred Compensation
We did not permit compensation deferral by our NEOs (or any other employees) during fiscal year 2014.
Potential Payments Upon Termination or Change In Control
On January 31, 2008, we entered into an individual change of control agreement (the Agreement) with Dr. Hedrick (filed as Exhibit 10.53to our Annual Report on Form 10-K, as filed with the SEC on March 14, 2008). A new Agreement for Dr. Hedrick was executed on March 11, 2015 to account for his appointment to CEO in 2014, which supersedes and replaces his previous signed agreement on January 31, 2008. On February 12, 2010, February 26, 2013, April 16, 2012, March 11, 2015 respectively we entered into individual change of control agreements with Mr. Shirahama, Dr. Kesten, Mr. Shores and Mr. Girão. The terms of the Agreements are described in detail in the section above titled, Compensation Discussion & Analysis - Company Acquisition / Post-Termination Compensation.
The following table describes the potential payments upon termination and/or a change in control of the Company for Mr. Christopher J. Calhoun our former Chief Executive Officer:
|
Change in
Control(2)
|
Termination (*)
|
|||||||
|
PAYMENTS DUE UPON ACQUISITION / TERMINATION(1):
|
||||||||
|
Cash Severance
|
||||||||
|
Base Salary(4)
|
$
|
—
|
$
|
129,576
|
||||
|
Benefits
|
||||||||
|
COBRA Premiums
|
—
|
$
|
5,673
|
|||||
|
Long-Term Incentives
|
||||||||
|
Value of Accelerated Stock Options(5)
|
$
|
—
|
$
|
271,250
|
||||
|
TOTAL VALUE
|
$
|
—
|
$
|
406,499
|
||||
(*) The below amounts represent the severance payments paid to Mr. Calhoun pursuant to his Separation Agreement with the Company executed October 22, 2014.
The following table describes the potential payments upon termination and/or a change in control of the Company for Dr. Hedrick, our President & Chief Executive Officer:
|
Change in
Control (2)
|
Termination
Following
Change in
Control (3)
|
|||||||
|
PAYMENTS DUE UPON ACQUISITION / TERMINATION(1):
|
||||||||
|
Cash Severance
|
||||||||
|
Base Salary(4)
|
$
|
—
|
$
|
675,000
|
||||
|
Benefits
|
||||||||
|
COBRA Premiums
|
—
|
$
|
33,701
|
|||||
|
Long-Term Incentives
|
||||||||
|
Value of Accelerated Stock Options(5)
|
$
|
—
|
$
|
—
|
||||
|
TOTAL VALUE
|
$
|
—
|
$
|
708,701
|
||||
The following table describes the potential payments upon termination and/or a change in control of the Company for Mr. Saad, our former CFO:
|
Change in Control (2)
|
Termination (*)
|
|||||||
|
PAYMENTS DUE UPON ACQUISITION / TERMINATION(1):
|
||||||||
|
Cash Severance
|
||||||||
|
Base Salary(4)
|
$
|
—
|
$
|
50,000
|
||||
|
Benefits
|
||||||||
|
COBRA Premiums
|
—
|
$
|
—
|
|||||
|
Long-Term Incentives
|
||||||||
|
Value of Accelerated Stock Options(5)
|
$
|
—
|
$
|
—
|
||||
|
TOTAL VALUE
|
$
|
—
|
$
|
50,000
|
||||
(*) The below amounts represent the payments paid to Mr. Saad pursuant to his Consulting Agreement with the Company executed August 13, 2014.
The following table describes the potential payments upon termination and/or a change in control of the Company for Dr. Kesten, our Executive Vice President & Chief Medical Officer.
|
Change in
Control (2)
|
Termination
Following
Change in
Control (3)
|
|||||||
|
PAYMENTS DUE UPON ACQUISITION / TERMINATION(1):
|
||||||||
|
Cash Severance
|
||||||||
|
Base Salary(4)
|
$
|
—
|
$
|
400,000
|
||||
|
Benefits
|
||||||||
|
COBRA Premiums
|
—
|
$
|
15,902
|
|||||
|
Long-Term Incentives
|
||||||||
|
Value of Accelerated Stock Options(5)
|
$
|
—
|
$
|
—
|
||||
|
TOTAL VALUE
|
$
|
—
|
$
|
415,902
|
||||
The following table describes the potential payments upon termination and/or a change in control of the Company for Mr. Shores, our former Executive Vice President – Marketing and Sales.
|
Change in Control (2)
|
Termination (*)
|
|||||||
|
PAYMENTS DUE UPON ACQUISITION / TERMINATION(1):
|
||||||||
|
Cash Severance
|
||||||||
|
Base Salary(4)
|
$
|
—
|
$
|
25,344
|
||||
|
Benefits
|
||||||||
|
COBRA Premiums
|
—
|
$
|
—
|
|||||
|
Long-Term Incentives
|
||||||||
|
Value of Accelerated Stock Options(5)
|
$
|
—
|
$
|
—
|
||||
|
TOTAL VALUE
|
$
|
—
|
$
|
25,344
|
||||
(*) The below amounts represent the severance payments paid to Mr. Shores pursuant to his Separation Agreement with the Company effective November 28, 2014.
The following table describes the potential payments upon termination and/or a change in control of the Company for Mr. Shirahama, our President of Asia-Japan.
|
Change in
Control (2)
|
Termination
Following
Change in
Control (3)
|
|||||||
|
PAYMENTS DUE UPON ACQUISITION / TERMINATION(1):
|
||||||||
|
Cash Severance
|
||||||||
|
Base Salary(4)
|
$
|
—
|
$
|
366,978
|
(6)
|
|||
|
Benefits
|
||||||||
|
COBRA Premiums
|
—
|
N/
|
A
|
|||||
|
Long-Term Incentives
|
||||||||
|
Value of Accelerated Stock Options(5)
|
$
|
—
|
$
|
—
|
||||
|
TOTAL VALUE
|
$
|
—
|
$
|
366,978
|
||||
The following table describes the potential payments upon termination and/or a change in control of the Company for Mr. Girão, our current Chief Financial Officer.
|
Change in
Control (2)
|
Termination
Following
Change in
Control (3)
|
|||||||
|
PAYMENTS DUE UPON ACQUISITION / TERMINATION(1):
|
||||||||
|
Cash Severance
|
||||||||
|
Base Salary(4)
|
$
|
—
|
$
|
240,000
|
||||
|
Benefits
|
||||||||
|
COBRA Premiums
|
—
|
$
|
22,917
|
|||||
|
Long-Term Incentives
|
||||||||
|
Value of Accelerated Stock Options(5)
|
$
|
—
|
$
|
—
|
||||
|
TOTAL VALUE
|
$
|
—
|
$
|
262,917
|
||||
| (1) | Assumes a triggering event occurred on December 31, 2014. |
| (2) | Based on the occurrence of a change in control of the Company, provided that the executive is at that time still in the service of the Company. |
| (3) | Based on the occurrence of either actual or constructive termination without good cause in the context of a change in control of the Company as described in detail in the section above titled, Company Acquisition/Post-Termination Compensation. |
| (4) | Based on the executive’s annual base salary on December 31, 2014, which was $450,000 for Dr. Hedrick; $400,000 for Dr. Kesten, and $366,978 for Mr. Shirahama. The base salary for Mr. Girão is based upon his salary as of joining the company in September of 2014. |
| (5) | Based on the difference between the aggregate exercise price of all accelerated in-the-money stock options and the aggregate market value of the underlying shares, calculated based on the per-share closing market price of our common stock on December 31, 2014, $0.49. |
| (6) | Mr. Shirahama’s salary is in Japanese Yen. His base salary was calculated using the average exchange rate over the current year. |
Director Compensation
Generally, our Board believes that the level of director compensation should be based on time spent carrying out Board and committee responsibilities and be competitive with comparable companies. In addition, the Board believes that a significant portion of director compensation should align director interests with the long-term interests of shareholders. The Board makes changes in its director compensation practices only upon the recommendation of the Compensation Committee, and following discussion and approval by the Board.
The following table summarizes director compensation during fiscal year 2014.
|
(a)
|
(b)
|
(c)
|
(d)
|
(e)
|
||||||||||||
|
Director Name(1)
|
Fees Earned or Paid in Cash(2)
($)
|
Stock Awards
($)
|
Option Awards(11)(12)
($)
|
Total
($)
|
||||||||||||
|
David M. Rickey,
Chairman
|
$
|
68,875
|
$
|
39,864
|
(3)
|
$
|
28,012
|
$
|
$136,751
|
|||||||
|
Lloyd H. Dean(13)
|
$
|
33,625
|
$
|
35,363
|
(4)
|
$
|
28,012
|
$
|
$97,000
|
|||||||
|
Richard J. Hawkins
|
$
|
50,976
|
$
|
39,676
|
(5)
|
$
|
28,012
|
$
|
$118,664
|
|||||||
|
Paul W. Hawran
|
$
|
63,875
|
$
|
41,300
|
(6)
|
$
|
28,012
|
$
|
$133,187
|
|||||||
|
E. Carmack Holmes, MD(13)
|
$
|
36,750
|
$
|
34,052
|
(7)
|
$
|
28,012
|
$
|
$98,814
|
|||||||
|
Gary A. Lyons
|
$
|
35,875
|
$
|
8,250
|
(8)
|
—
|
$
|
$44,125
|
||||||||
|
Gail K. Naughton, Ph.D.
|
$
|
25,375
|
$
|
50,400
|
(9)
|
$
|
34,039
|
(9)
|
$
|
$109,814
|
||||||
|
Tommy G. Thompson
|
$
|
51,438
|
$
|
40,426
|
(10)
|
$
|
28,012
|
$
|
$119,876
|
|||||||
|
Ruud JP Jona(15)
|
$
|
3,083
|
||||||||||||||
| (1) | Mr. Calhoun and Dr. Hedrick are not included in this table as they are employees of the Company and receive no extra compensation for their services as a Director. The compensation received by Mr. Calhoun and Dr. Hedrick as employees of the Company is shown in the 2014 Summary Compensation Table and the three equity-related tables above. |
| (2) | In fiscal year 2014, each non-employee director’s compensation included a $6,250 quarterly retainer, a fee of $2,000 per quarterly meeting attended, and a fee of $1,000 per special Board meeting attended in person. Attendance of telephonic meetings was compensated at $1,000 per meeting. Compensation Committee, Governance and Nominating Committee and Audit Committee members received $1,000 per meeting attended. Executive Committee members were exempt from receiving committee fees. The Chairman of the Board received an additional annual stipend of $25,000, the Chairman of the Audit Committee received an additional annual stipend of $15,000, and the Chairmen of the Compensation Committee and the Governance and Nominating Committee each received an additional annual stipend of $10,000 and $10,000, respectively. |
| (3) | David M. Rickey was granted 10,550 shares of restricted stock at a fair value of $2.57, effective on January 1, 2014 with shares cliff vesting on December 31, 2014. In addition he was granted 5,269 shares of restricted stock at a fair value of $2.42, effective on May 19, 2014 with shares cliff vesting on January 2, 2015 in exchange for forfeiting an amount estimated to be approximately 25% of his cash compensation for the second through fourth quarters of 2014. |
| (4) | Lloyd H. Dean was granted 10,550 shares of restricted stock at a fair value of $2.57, effective on January 1, 2014 with shares cliff vesting on December 31, 2014. |
| (5) | Richard J. Hawkins was granted 10,550 shares of restricted stock at a fair value of $2.57, effective on January 1, 2014 with shares cliff vesting on December 31, 2014. In addition he was granted 5,862 shares of restricted stock at a fair value of $2.42, effective on May 19, 2014 with shares cliff vesting on January 2, 2015 in exchange for forfeiting an amount estimated to be approximately 25% of his cash compensation for the second through fourth quarters of 2014.. |
| (6) | Paul W. Hawran was granted 10,550 shares of restricted stock at a fair value of $2.57, effective on January 1, 2014 with shares cliff vesting on December 31, 2014. In addition he was granted 5,191 shares of restricted stock at a fair value of $2.42, effective on May 19, 2014 with shares cliff vesting on January 2, 2015 in exchange for forfeiting an amount estimated to be approximately 25% of his cash compensation for the second through fourth quarters of 2014.. |
| (7) | E. Carmack Holmes was granted 10,550 shares of restricted stock at a fair value of $2.57, effective on January 1, 2014 with shares cliff vesting on December 31, 2014. |
| (8) | Gary A. Lyons was granted 3,409 shares of restricted stock at a fair value of $2.42, effective on May 19, 2014 with shares cliff vesting on January 2, 2015 in exchange for forfeiting an amount estimated to be approximately 25% of his cash compensation for the second through fourth quarters of 2014.. |
| (9) | Gail K. Naughton received an initial stock award and stock option grant upon joining the Board. She was granted 21,000 shares of restricted stock at a fair value of $2.42, effective on July 1, 2014 with 50% of the shares cliff vesting on July 1, 2015 and 50% of the shares cliff vesting on July 1, 2016. She was also awarded 21,000 options to purchase stock at a fair value of $1.62. |
| (10) | Tommy G. Thompson was granted 10,550 shares of restricted stock at a fair value of $2.57, effective on January 1, 2014 with shares cliff vesting on December 31, 2014. In addition he was granted 5,501 shares of restricted stock at a fair value of $2.42, effective on May 19, 2014 with shares cliff vesting on January 2, 2015 in exchange for forfeiting an amount estimated to be approximately 25% of his cash compensation for the second through fourth quarters of 2014. |
| (11) | Column (d) represents the grant date fair value of the option awards, computed in accordance with FASB ASC Topic 718. For additional information on the valuation assumptions with respect to the 2014 grants, refer to Note 16 to our audited consolidated financial statements regarding assumptions underlying valuation of equity awards. |
| (12) | Directors were awarded 16,030 options to purchase stock at a fair value of $1.747 effective January 1, 2014. |
| (13) | Mr. Dean resigned from our Board of Directors effective November 1, 2014. |
| (14) | Dr. Holmes retired from the Company’s Board of Directors effective December 31, 2014. |
| (15) | Mr. Jona joined the Board of Directors on June 7, 2014 and resigned from the Board July 15, 2014. |
Narrative Disclosure to the Director Compensation Table
The stock options granted to the non-employee directors in January 2014 have an exercise price of $2.57. The exercise prices of these grants were equal to the closing sale price of the Company’s common stock on NASDAQ on the date of grant. The option awards have a contractual term of 10 years and vest in equal monthly installments over a period of two years, subject to the director’s continued service to the Company. To align Board compensation with that of our peer group companies, each of our non-employee directors was also granted 10,550 shares of restricted stock, effective on January 1, 2014 with shares cliff vesting on January 2, 2015.
REPORT OF THE COMPENSATION COMMITTEE
The Compensation Committee has reviewed and discussed the Compensation Discussion and Analysis required by Item 402(b) of Regulation S-K with management. Based on this review and discussion, the Compensation Committee recommended to the Board of Directors that the Compensation Discussion and Analysis be included in the Company’s Annual Report on Form 10-K.
THE COMPENSATION COMMITTEE
Tommy G. Thompson (Chairman)
Paul W. Hawran
Gail K. Naughton, Ph.D.
| Item 12. | Security Ownership of Certain Beneficial Owners and Management and Related Stockholder Matters |
SECURITY OWNERSHIP OF CERTAIN BENEFICIAL OWNERS AND MANAGEMENT
The following table sets forth information regarding ownership of our Common Stock as of February 28, 2015 (or earlier date for information based on filings with the SEC) by (a) each person known to us to own more than 5% of the outstanding shares of our Common Stock, (b) each director and nominee for director, (c) our President & Chief Executive Officer, VP of Finance & Chief Financial Officer and each other executive officer named in the compensation tables appearing in Item 12 of this Form 10-K and (d) all directors and executive officers as a group. The information in this table is based solely on statements in filings with the SEC or other reliable information. A total of 108,181,358 shares of our common stock were issued and outstanding as of February 28, 2015.
|
Name and Address of Beneficial Owner (1)
|
Number of Shares of Common Stock Owned (2)
|
Number of Shares of Common Stock Subject to Options/Warrants Exercisable Within 60 Days (3)
|
Total Number
of Shares of
Common Stock
Beneficially
Owned (4)
|
Percent Ownership
|
||||||||||||
|
|
||||||||||||||||
|
Sabby Healthcare Master Fund, Ltd.
c/o Ogier Fiduciary Services (Cayman) Limited
89 Nexus Way, Camana Bay
Grand Cayman KY1-9007
Cayman Islands
|
9,235,675
|
-
|
9,235,675
|
8.5
|
%
|
|||||||||||
|
Kian Thiam Lim (6)
|
8,000,000
|
-
|
8,000,000
|
7.4
|
%
|
|||||||||||
|
Level 12, 2 Queen Street Melbourne, Victoria 3000,Australia
|
||||||||||||||||
|
BlackRock, Inc.(5)
|
5,121,692
|
-
|
5,121,692
|
4.7
|
%
|
|||||||||||
|
55 East 52nd Street
New York, NY 10022
|
||||||||||||||||
|
Marc H. Hedrick, MD
|
515,711
|
778,646
|
1,294,357
|
1.2
|
%
|
|||||||||||
|
Christopher J. Calhoun
|
154,975
|
1,020,207
|
1,175,182
|
1.1
|
%
|
|||||||||||
|
Tiago M. Girão
|
60,000
|
5,000
|
65,000
|
*
|
||||||||||||
|
Steven Kesten, M.D.
|
-
|
123,459
|
123,459
|
*
|
||||||||||||
|
Seijiro Shirahama
|
48,659
|
531,042
|
579,701
|
*
|
||||||||||||
|
Clyde W. Shores
|
38,458
|
-
|
38,458
|
*
|
||||||||||||
|
Mark E. Saad
|
138,430
|
491,875
|
630,305
|
*
|
||||||||||||
|
David M. Rickey
|
592,444
|
153,411
|
745,855
|
*
|
||||||||||||
|
Paul W. Hawran
|
104,122
|
165,286
|
269,408
|
*
|
||||||||||||
|
Richard J. Hawkins
|
41,926
|
140,286
|
182,212
|
*
|
||||||||||||
|
Tommy Thompson
|
61,201
|
56,286
|
117,487
|
*
|
||||||||||||
|
Gary A. Lyons
|
24,409
|
19,917
|
44,326
|
*
|
||||||||||||
|
Gail Naughton
|
21,000
|
4,167
|
25,167
|
*
|
||||||||||||
|
All executive officers and directors as a group (13)
|
1,965,201
|
3,648,697
|
5,613,898
|
5.0
|
%
|
|||||||||||
|
*
|
Represents beneficial ownership of less than one percent (1%) of the outstanding shares as of February 28, 2015.
|
| (1) | Unless otherwise indicated, the address of each of the named individuals is c/o Cytori Therapeutics, Inc., 3020 Callan Road, San Diego, CA 92121. |
| (2) | Unless otherwise indicated, represents shares of outstanding common stock owned by the named parties as of February 28, 2015. |
| (3) | Shares of common stock subject to stock options or warrants currently exercisable or exercisable within 60 days of February 28, 2015 are deemed to be outstanding for computing the percentage ownership of the person holding such options and the percentage ownership of any group of which the holder is a member, but are not deemed outstanding for computing the percentage of any other person. |
| (4) | The amounts and percentages of common stock beneficially owned are reported on the basis of regulations of the Securities and Exchange Commission governing the determination of beneficial ownership of securities. Under the rules of the Commission, a person is deemed to be a “beneficial owner” of a security if that person has or shares “voting power,” which includes the power to vote or to direct the voting of such security, or “investment power,” which includes the power to dispose of or to direct the disposition of such security. A person is also deemed to be a beneficial owner of any securities for which that person has a right to acquire beneficial ownership within 60 days. |
| (5) | Information reported is based on a Schedule 13G/A as filed with the Securities and Exchange Commission on February 2, 2015. According to the Schedule 13G/A, BlackRock, Inc. has (i) sole power to vote or to direct the vote of 5,045,742 shares; and (ii) sole power to dispose or to direct the disposition of 5,121,692 shares. |
| (6) | Information reported is based on a Schedule 13D as filed with the Securities and Exchange Commission on February 28, 2014. According to the Schedule 13D, Kian Thiam Lim. has (i) sole power to vote or to direct the vote of 8,000,000 shares; and (ii) sole power to dispose or to direct the disposition of 8,000,000 shares. |
| (7) | Information reported is based on a Schedule 13G/A as filed with the Securities and Exchange Commission on January 16, 2015. According to the Schedule 13G/A, Sabby Heathcare Master Fund, Ltd. has (i) sole power to vote or to direct the vote of 9,235,675 shares; and (ii) sole power to dispose or to direct the disposition of 9,235,675 shares. |
CERTAIN RELATIONSHIPS AND RELATED TRANSACTIONS
Related Party Transactions
During the fiscal year 2014 there were no related party transactions.
Procedures for Approval of Related Person Transactions
The Governance and Nominating Committee of the Board of Directors is responsible for reviewing and approving most material transactions with related persons. However, in certain cases, transactions have been approved by the full Board of Directors, the Audit Committee, or some other committee consisting of all independent directors, as the case may be. In general, transactions with holders of our securities covered by Item 404(a) of Regulation S-K will be reviewed and approved by our full Board of Directors, so long as none of our directors or executive officers or their family members have a material interest in such transaction. Related parties include any of our directors or executive officers, certain of our stockholders and their immediate family members. This obligation is set forth in writing in our Governance and Nominating Committee Charter. A copy of the Governance and Nominating Committee Charter is available at www.cytori.com under Investor Relations – Corporate Governance.
To identify related person transactions, each year we submit and require our directors and officers to complete Director and Officer Questionnaires identifying any transactions with us in which the officer or director or their family members have an interest. We review related person transactions due to the potential for a conflict of interest. A conflict of interest occurs when an individual's private interest interferes, or appears to interfere, in any way with the interests of the Company. Our Code of Business Conduct and Ethics requires all directors, officers and employees who may have a potential or apparent conflict of interest to immediately notify our Compliance Officer or the Chairman of the Audit Committee.
We expect our directors, officers and employees to act and make decisions that are in the Company’s best interests and encourage them to avoid situations which present an actual or perceived conflict between our interests and their own personal interests. Exceptions are only permitted in the reasonable discretion of the Board of Directors or the Corporate Governance and Nominating Committee, consistent with the best interests of the Company. In addition, we are strictly prohibited from extending personal loans to, or guaranteeing the personal obligations of, any director or officer.
Board Independence
The Board of Directors has determined that Messrs. Hawkins, Hawran, Rickey, Thompson, Lyons, and Dr. Naughton are “independent” under the rules of the NASDAQ Stock Market. Under applicable SEC and the NASDAQ rules, the existence of certain “related person” transactions above certain thresholds between a director and the Company are required to be disclosed and preclude a finding by the Board that the director is independent. The Board of Directors is not able to considerDr. Hedrick, our President & CEO, independent, as a result of his employment with us during the past three years.
Principal Accountant Fees and Services
The Audit Committee has appointed KPMG LLP as the Company’s independent registered public accounting firm for the fiscal year ending December 31, 2014. The Audit Committee reviews and must pre-approve all audit and non-audit services performed by KPMG LLP as well as the fees charged by KPMG LLP for such services. No fees were approved under the Regulation S-X Rule 2.01(c)(7)(i)(C) exception to the pre-approval requirement. In its review of non-audit service fees, the Audit Committee considers, among other things, the possible impact of the performance of such services on the accounting firm’s independence.
The following table shows the aggregate fees paid or accrued by the Company for the audit and other services provided by KPMG LLP for fiscal years ended December 31, 2014 and 2013.
|
2014
|
2013
|
|||||||
|
Audit fees (1)
|
$
|
470,000
|
$
|
664,596
|
||||
|
Audit related fees (2)
|
58,000
|
6,000
|
||||||
|
Tax Fees (3)
|
56,000
|
87,640
|
||||||
|
All other fees (4)
|
—
|
—
|
||||||
|
Total
|
$
|
584,000
|
$
|
758,236
|
||||
| (1) | Audit fees consist of fees for professional services performed by KPMG LLP for the integrated audit of our annual financial statements (and internal control over financial reporting) included in our Form 10-K filing and review of financial statements included in our quarterly Form 10-Q filings, reviews of registration statements and issuances of consents, and services that are normally provided in connection with statutory and regulatory filings or engagements. |
| (2) | Audit related fees consist of fees for assurance and related services, such as comfort letters, performed by KPMG LLP that are reasonably related to the performance of the audit or review of our financial statements. |
| (3) | Tax fees consist of fees for professional services performed by KPMG LLP with respect to tax compliance, tax advice, tax consulting and tax planning. |
| (4) | All other fees consist of fees for other permissible work performed by KPMG LLP that does not meet with the above category descriptions. No such fees were incurred in 2014 or 2013. |
PART IV
|
(a) (1)
|
Financial Statements
|
Page
|
|
|
Reports of KPMG LLP, Independent Registered Public Accounting Firm
|
44
|
||
|
Consolidated Balance Sheets as of December 31, 2014 and 2013
|
46
|
||
|
Consolidated Statements of Operations and Comprehensive Loss for the years ended December 31, 2014, 2013 and 2012
|
47
|
||
|
Consolidated Statements of Stockholders’ (Deficit) Equity for the years ended December 31, 2014, 2013 and 2012
|
48
|
||
|
Consolidated Statements of Cash Flows for the years ended December 31, 2014, 2013 and 2012
|
49
|
||
|
Notes to Consolidated Financial Statements
|
51
|
||
|
(a) (2)
|
Financial Statement Schedules
|
|
SCHEDULE II — VALUATION AND QUALIFYING ACCOUNTS
For the years ended December 31, 2014, 2013 and 2012
(in thousands of dollars)
|
Balance at
beginning of
year
|
Additions (A)
|
Deductions (B)
|
Other (C)
|
Balance at
end of year
|
||||||||||||||||
|
Allowance for doubtful accounts
|
||||||||||||||||||||
|
Year ended December 31, 2014
|
$
|
1,445
|
$
|
1,084
|
$
|
(995
|
)
|
$
|
(11
|
)
|
$
|
1,523
|
||||||||
|
Year ended December 31, 2013
|
$
|
278
|
$
|
1,141
|
$
|
( 16
|
)
|
$
|
42
|
$
|
1,445
|
|||||||||
|
Year ended December 31, 2012
|
$
|
474
|
$
|
144
|
$
|
(313
|
)
|
$
|
(27
|
)
|
$
|
278
|
||||||||
| (A) | Includes charges to costs and expenses. |
| (B) | Includes deductions for uncollectible accounts receivable. |
| (C) | Miscellaneous activity. |
| (a)(3) | Exhibits |
List of Exhibits required by Item 601 of Regulation S-K. See Item 15(b) below.
| (b) | Exhibits |
The exhibits listed in the accompanying “Exhibit Index” are filed, furnished or incorporated by reference as part of this Annual Report, as indicated.
SIGNATURES
Pursuant to the requirements of Section 13 or 15(d) of the Securities Exchange Act of 1934, the registrant has duly caused this registration statement to be signed on its behalf by the undersigned, thereunto duly authorized.
|
CYTORI THERAPEUTICS, INC.
|
||
|
By:
|
/s/ Marc H. Hedrick, MD
|
|
|
Marc. H. Hedrick, MD
|
||
|
President & Chief Executive Officer
|
||
|
March 16, 2015
|
||
Pursuant to the requirements of the Securities Exchange Act of 1934, this annual report has been signed below by the following persons on behalf of the registrant and in the capacities and on the dates indicated.
|
SIGNATURE
|
TITLE
|
DATE
|
||
|
/s/ David M. Rickey
|
Chairman of the Board of Directors
|
March 16, 2015
|
||
|
David M. Rickey
|
||||
|
/s/ Marc H. Hedrick, MD
|
President & Chief Executive Officer (Principal Executive Officer)
|
March 16, 2015
|
||
|
Marc H. Hedrick, MD
|
||||
|
/s/ Tiago M. Girão
|
VP of Finance and Chief Financial Officer (Principal Financial Officer)
|
March 16, 2015
|
||
|
Tiago M. Girão
|
||||
|
/s/ John W. Townsend
|
Chief Accounting Officer (Principal Accounting Officer)
|
March 16, 2015
|
||
|
John W. Townsend
|
||||
|
/s/ Paul W. Hawran
|
Director
|
March 16, 2015
|
||
|
Paul W. Hawran
|
||||
|
/s/ Gail K. Naughton, PhD
|
Director
|
March 16, 2015
|
||
|
Gail K. Naughton, PhD
|
||||
|
/s/ Richard J. Hawkins
|
Director
|
March 16, 2015
|
||
|
Richard J. Hawkins
|
||||
|
/s/ Tommy G. Thompson
|
Director
|
March 16, 2015
|
||
|
Tommy G. Thompson
|
|
/s/ Gary A. Lyons
|
Director
|
March 16, 2015
|
||
|
Gary A. Lyons
|
EXHIBIT INDEX
|
CYTORI THERAPEUTICS, INC.
|
|||||
|
EXHIBIT INDEX
|
|||||
|
Exhibit Number
|
Exhibit Title
|
Filed with this Form 10-K
|
Incorporated by Reference
|
||
|
Form
|
File No.
|
Date Filed
|
|||
|
Composite Certificate of Incorporation.
|
X | ||||
|
3.2
|
Amended and Restated Bylaws of Cytori Therapeutics, Inc.
|
10-Q
|
000-32501
Exhibit 3.2
|
08/14/2003
|
|
|
4.2
|
Form of Warrant.
|
8-K
|
000-32501
Exhibit 4.2
|
03/10/2009
|
|
|
4.3
|
Form of Warrant to be dated February 28, 2007.
|
8-K
|
000-32501
Exhibit 10.4
|
02/26/2007
|
|
|
4.4
|
Form of Warrant to Purchase Common Stock issued on August 11, 2008 pursuant to the Securities Purchase Agreement, dated August 7, 2008, by and among the Company and the Purchasers identified on the signature pages thereto.
|
8-K
|
000-32501
Exhibit 10.34
|
08/08/2008
|
|
|
4.5
|
Registration Rights Agreement, dated August 7, 2008, by and among the Company and the Purchasers identified on the signature pages thereto.
|
8-K
|
000-32501
Exhibit 10.35
|
08/08/2008
|
|
|
4.6
|
Warrant to Purchase Common Stock issued by the Company on October 14, 2008 in favor of GE Capital Equity Investments, Inc., pursuant to the Loan and Security Agreement dated October 14, 2008.
|
10-K
|
000-32501
Exhibit 10.61
|
03/06/2009
|
|
|
4.7
|
Warrant to Purchase Common Stock issued by the Company on October 14, 2008 in favor of Silicon Valley Bank, pursuant to the Loan and Security Agreement dated October 14, 2008.
|
10-K
|
000-32501
Exhibit 10.62
|
03/06/2009
|
|
|
4.8
|
Form of Warrant to Purchase Common Stock to be issued on or about May 11, 2009.
|
8-K
|
000-32501
Exhibit 10.64
|
05/08/2009
|
|
|
4.9
|
Registration Rights Agreement, dated May 7, 2009, by and among Cytori Therapeutics, Inc. and the Purchasers identified on the signature pages thereto.
|
8-K
|
000-32501
Exhibit 10.65
|
05/08/2009
|
|
|
4.10
|
Warrant to Purchase Common Stock issued by the Company on June 11, 2010 in favor of GE Capital Equity Investments, Inc., pursuant to the Amended and Restated Loan and Security Agreement dated June 11, 2010.
|
8-K
|
001-34375
Exhibit 10.73
|
06/17/2010
|
|
|
4.11
|
Warrant to Purchase Common Stock issued by the Company on June 11, 2010 in favor of Silicon Valley Bank, pursuant to the Amended and Restated Loan and Security Agreement dated June 11, 2010.
|
8-K
|
001-34375
Exhibit 10.74
|
06/17/2010
|
|
|
4.12
|
Warrant to Purchase Common Stock issued by the Company on June 11, 2010 in favor of Oxford Financial Corporation, pursuant to the Amended and Restated Loan and Security Agreement dated June 11, 2010.
|
8-K
|
001-34375
Exhibit 10.75
|
06/17/2010
|
|
|
4.13
|
Warrant to Purchase Common Stock issued by the Company on September 9, 2011 in favor of GE Capital Equity Investments, Inc., pursuant to the Amended and Restated Loan and Security Agreement dated September 9, 2011.
|
8-K
|
001-34375
Exhibit 10.84
|
09/15/2011
|
|
|
4.14
|
Warrant to Purchase Common Stock issued by the Company on September 9, 2011 in favor of Silicon Valley Bank, pursuant to the Amended and Restated Loan and Security Agreement dated September 9, 2011.
|
8-K
|
001-34375
Exhibit 10.85
|
09/15/2011
|
|
|
4.15
|
Warrant to Purchase Common Stock issued by the Company on September 9, 2011 in favor of Oxford Financial Corporation, pursuant to the Amended and Restated Loan and Security Agreement dated September 9, 2011.
|
8-K
|
001-34375
Exhibit 10.86
|
09/15/2011
|
|
|
4.16
|
Warrant to Purchase Common Stock issued by the Company on September 9, 2011 in favor of Oxford Financial Corporation, pursuant to the Amended and Restated Loan and Security Agreement dated September 9, 2011.
|
8-K
|
001-34375
Exhibit 10.87
|
09/15/2011
|
|
|
|
|||||
|
4.17
|
Warrant to Purchase Common Stock issued by the Company on June 28, 2013 in favor of Oxford Finance LLC pursuant to the Loan and Security Agreement dated June 28, 2013.
|
10-Q
|
001-34375
Exhibit 4.17
|
08/09/2013
|
|
|
4.18
|
Warrant to Purchase Common Stock issued by the Company on June 28, 2013 in favor of Oxford Finance LLC pursuant to the Loan and Security Agreement dated June 28, 2013.
|
10-Q
|
001-34375
Exhibit 4.18
|
08/09/2013
|
|
|
4.19
|
Warrant to Purchase Common Stock issued by the Company on June 28, 2013 in favor of Oxford Finance LLC pursuant to the Loan and Security Agreement dated June 28, 2013.
|
10-Q
|
001-34375
Exhibit 4.19
|
08/09/2013
|
|
|
4.20
|
Warrant to Purchase Common Stock issued by the Company on June 28, 2013 in favor of Oxford Finance LLC pursuant to the Loan and Security Agreement dated June 28, 2013.
|
10-Q
|
001-34375
Exhibit 4.20
|
08/09/2013
|
|
|
4.21
|
Warrant to Purchase Common Stock issued by the Company on June 28, 2013 in favor of Silicon Valley Bank pursuant to the Loan and Security Agreement dated June 28, 2013.
|
10-Q
|
001-34375
Exhibit 4.21
|
08/09/2013
|
|
|
4.22
|
Stock Purchase Agreement, effective October 29, 2013, by and between the Company and Lorem Vascular, Pty. Ltd.
|
S-3
|
333-192409
|
11-19-2013
|
|
|
10.1#
|
Amended and Restated 1997 Stock Option and Stock Purchase Plan.
|
10
|
000-32501
Exhibit 10.1
|
03/30/2001
|
|
|
10.1.1#
|
Board of Directors resolution adopted November 9, 2006 regarding determination of fair market value for stock option grant purposes (incorporated by reference to Exhibit 10.10.1 filed as Exhibit 10.10.1 to our Form 10-K Annual Report, as filed on March 30, 2007 and incorporated by reference herein)
|
10-K
|
000-32501
Exhibit 10.10.1
|
03/30/2007
|
|
|
10.10#
|
2004 Equity Incentive Plan of Cytori Therapeutics, Inc
|
8-K
|
000-32501
Exhibit 10.1
|
08/27/2004
|
|
|
10.10.1#
|
Board of Directors resolution adopted November 9, 2006 regarding determination of fair market value for stock option grant purposes.
|
10-K
|
000-32501
Exhibit 10.10.1
|
03/30/2007
|
|
|
10.12#
|
Notice and Agreement for Stock Options Grant Pursuant to Cytori Therapeutics, Inc. 1997 Stock Option and Stock Purchase Plan; (Nonstatutory).
|
10-Q
|
000-32501
Exhibit 10.19
|
11/15/2004
|
|
|
10.13#
|
Notice and Agreement for Stock Options Grant Pursuant to Cytori Therapeutics, Inc. 1997 Stock Option and Stock Purchase Plan; (Nonstatutory) with Cliff.
|
10-Q
|
000-32501
Exhibit 10.20
|
11/15/2004
|
|
|
10.14#
|
Notice and Agreement for Stock Options Grant Pursuant to Cytori Therapeutics, Inc. 1997 Stock Option and Stock Purchase Plan; (Incentive).
|
10-Q
|
000-32501
Exhibit 10.21
|
11/15/2004
|
|
|
10.15#
|
Notice and Agreement for Stock Options Grant Pursuant to Cytori Therapeutics, Inc. 1997 Stock Option and Stock Purchase Plan; (Incentive) with Cliff.
|
10-Q
|
000-32501
Exhibit 10.22
|
11/15/2004
|
|
|
10.16#
|
Form of Options Exercise and Stock Purchase Agreement Relating to the 2004 Equity Incentive Plan.
|
10-Q
|
000-32501
Exhibit 10.23
|
11/15/2004
|
|
|
10.17#
|
Form of Notice of Stock Options Grant Relating to the 2004 Equity Incentive Plan.
|
10-Q
|
000-32501
Exhibit 10.24
|
11/15/2004
|
|
|
10.22
|
Common Stock Purchase Agreement dated April 28, 2005, between Olympus Corporation and the Company.
|
10-Q
|
000-32501
Exhibit 10.21
|
08/15/2005
|
|
|
10.23
|
Sublease Agreement dated May 24, 2005, between Biogen Idec, Inc. and the Company.
|
10-Q
|
000-32501
Exhibit 10.21
|
08/15/2005
|
|
|
10.27+
|
Joint Venture Agreement dated November 4, 2005, between Olympus Corporation and the Company.
|
10-K
|
000-32501
Exhibit 10.27
|
03/30/2006
|
|
|
10.28+
|
License/ Commercial Agreement dated November 4, 2005, between Olympus-Cytori, Inc. and the Company
|
10-K
|
000-32501
Exhibit 10.28
|
03/30/2006
|
|
|
10.28.1
|
Amendment One to License/ Commercial Agreement dated November 14, 2007, between Olympus-Cytori, Inc. and the Company.
|
10-K
|
000-32501
Exhibit 10.28.1
|
03/14/2008
|
|
|
10.29+
|
License/ Joint Development Agreement dated November 4, 2005, between Olympus Corporation, Olympus-Cytori, Inc. and the Company.
|
10-K
|
000-32501
Exhibit 10.29
|
03/30/2006
|
|
10.29.1
|
Amendment No. 1 to License/ Joint Development Agreement dated May 20, 2008, between Olympus Corporation, Olympus-Cytori, Inc. and the Company.
|
10-Q
|
000-32501
Exhibit 10.29.1
|
08/11/2008
|
|
|
10.30+
|
Shareholders Agreement dated November 4, 2005, between Olympus Corporation and the Company.
|
10-K
|
000-32501
Exhibit 10.30
|
03/30/2006
|
|
|
10.32
|
Common Stock Purchase Agreement, dated August 9, 2006, by and between Cytori Therapeutics, Inc. and Olympus Corporation.
|
8-K
|
000-32501
Exhibit 10.32
|
08/15/2006
|
|
|
10.33
|
Form of Common Stock Subscription Agreement, dated August 9, 2006 (Agreements on this form were signed by Cytori and each of respective investors in the Institutional Offering).
|
8-K
|
000-32501
Exhibit 10.33
|
08/15/2006
|
|
|
10.43
|
Financial services advisory engagement letter agreement, dated February 16, 2007, between Cytori Therapeutics, Inc. and WBB Securities, LLC.
|
8-K
|
000-32501
Exhibit 10.2
|
02/26/2007
|
|
|
10.46
|
Common Stock Purchase Agreement, dated March 28, 2007, by and between Cytori Therapeutics, Inc. and Green Hospital Supply, Inc.
|
10-Q
|
000-32501
Exhibit 10.46
|
05/11/2007
|
|
|
10.47
|
Consulting Agreement, dated May 3, 2007, by and between Cytori Therapeutics, Inc. and Marshall G. Cox.
|
10-Q
|
000-32501
Exhibit 10.47
|
08/14/2007
|
|
|
10.48+
|
Master Cell Banking and Cryopreservation Agreement, effective August 13, 2007, by and between Green Hospital Supply, Inc. and Cytori Therapeutics, Inc.
|
10-Q
|
000-32501
Exhibit 10.48
|
11/13/2007
|
|
|
10.48.1
|
Amendment No. 1 to Master Cell Banking and Cryopreservation Agreement, effective June 4, 2008, by and between Green Hospital Supply, Inc. and the Company.
|
8-K
|
000-32501
Exhibit 10.48.1
|
06/10/2008
|
|
|
10.49+
|
License & Royalty Agreement, effective August 23, 2007, by and between Olympus-Cytori, Inc. and Cytori Therapeutics, Inc.
|
10-Q
|
000-32501
Exhibit 10.49
|
11/13/2007
|
|
|
10.51
|
Common Stock Purchase Agreement, dated February 8, 2008, by and between Green Hospital Supply, Inc. and Cytori Therapeutics, Inc.
|
8-K
|
000-32501
Exhibit 10.51
|
02/19/2008
|
|
|
10.51.1
|
Amendment No. 1 to Common Stock Purchase Agreement, dated February 29, 2008, by and between Green Hospital Supply, Inc. and Cytori Therapeutics, Inc.
|
8-K
|
000-32501
Exhibit 10.51.1
|
02/29/2008
|
|
|
10.52#
|
Agreement for Acceleration and/or Severance, dated January 31, 2008, by and between Christopher J. Calhoun and Cytori Therapeutics, Inc.
|
10-K
|
000-32501
Exhibit 10.52
|
03/14/2008
|
|
|
10.53#
|
Agreement for Acceleration and/or Severance, dated January 31, 2008, by and between Marc H. Hedrick and Cytori Therapeutics, Inc.
|
10-K
|
000-32501
Exhibit 10.53
|
03/14/2008
|
|
|
10.54#
|
Agreement for Acceleration and/or Severance, dated January 31, 2008, by and between Mark E. Saad and Cytori Therapeutics, Inc.
|
10-K
|
000-32501
Exhibit 10.54
|
03/14/2008
|
|
|
10.55
|
Common Stock Purchase Agreement, dated August 7, 2008, by and between the Company and Olympus Corporation.
|
8-K
|
000-32501
Exhibit 10.32
|
08/08/2008
|
|
|
10.55.1
|
Amendment No. 1 to Common Stock Purchase Agreement, dated August 8, 2008, by and between the Company and Olympus Corporation.
|
8-K
|
000-32501
Exhibit 10.32.1
|
08/14/2008
|
|
|
10.56
|
Securities Purchase Agreement, dated August 7, 2008, by and among the Company and the Purchasers identified on the signature pages thereto.
|
8-K
|
000-32501
Exhibit 10.33
|
08/08/2008
|
|
|
10.59
|
Loan and Security Agreement, dated October 14, 2008, by and among the Company, General Electric Capital Corporation, and the other lenders signatory thereto.
|
10-K
|
000-32501
Exhibit 10.59
|
03/06/2009
|
|
|
10.60
|
Promissory Note issued by the Company in favor of General Electric Capital Corporation or any subsequent holder thereof, pursuant to the Loan and Security Agreement dated October 14, 2008.
|
10-K
|
000-32501
Exhibit 10.60
|
03/06/2009
|
|
|
10.63
|
Form of Subscription Agreement by and between Cytori Therapeutics, Inc. and the Purchaser (as defined therein), dated as of March 9, 2009.
|
8-K
|
000-32501
Exhibit 10.63
|
03/10/2009
|
|
|
10.64
|
Placement Agency Agreement, dated March 9, 2009, between Cytori Therapeutics, Inc. and Piper Jaffray & Co.
|
8-K
|
000-32501
Exhibit 10.64
|
03/10/2009
|
|
10.65
|
Securities Purchase Agreement, dated May 7, 2009, by and among Cytori Therapeutics, Inc. and the Purchasers identified on the signature pages thereto.
|
8-K
|
000-32501
Exhibit 10.63
|
05/08/2009
|
|
|
10.68
|
Form of Common Stock Purchase Agreement by and between Cytori Therapeutics, Inc. and Seaside 88, LP, dated as of June 19, 2009.
|
8-K
|
001-34375
Exhibit 10.68
|
06/22/2009
|
|
|
10.69
|
Lease Agreement entered into on April 2, 2010, between HCP Callan Rd, LLC. and Cytori Therapeutics, Inc..
|
10-Q
|
001-34375
Exhibit 10.69
|
05/06/2010
|
|
|
10.70
|
Amended and Restated Loan and Security Agreement, dated June 11, 2010, by and among the Company, General Electric Capital Corporation, and the other lenders signatory thereto.
|
8-K
|
001-34375
Exhibit 10.70
|
06/17/2010
|
|
|
10.71
|
Promissory Note issued by the Company in favor of General Electric Capital Corporation or any subsequent holder thereof, pursuant to the Loan and Security Agreement dated June 11, 2010.
|
8-K
|
001-34375
Exhibit 10.71
|
06/17/2010
|
|
|
10.72
|
Promissory Note issued by the Company in favor of Oxford Financial Corporation or any subsequent holder thereof, pursuant to the Loan and Security Agreement dated June 11, 2010.
|
8-K
|
001-34375
Exhibit 10.72
|
06/17/2010
|
|
|
10.76
|
Common Stock Purchase Agreement, dated December 6, 2010, by and among Cytori Therapeutics, Inc. and Astellas Pharma Inc.
|
8-K
|
001-34375
Exhibit 10.76
|
12/09/2010
|
|
|
10.77
|
Form of Notice and Restricted Stock Award Agreement for grants of performance-based restricted stock awards under the 2004 Equity Incentive Plan.
|
8-K
|
001-34375
Exhibit 10.1
|
03/04/2011
|
|
|
10.78
|
Form of Common Stock Purchase Agreement by and between Cytori Therapeutics, Inc. and Seaside 88, LP, dated July 11, 2011
|
8-K
|
001-34375
Exhibit 10.78
|
07/12/2011
|
|
|
10.79
|
First Amendment to Amended and Restated Loan and Security Agreement, dated June 23, 2011, by and among the Company, Oxford Finance LLC, the other lenders party hereto and General Electric Capital Corporation.
|
10-Q
|
001-34375
Exhibit 10.79
|
08/09/2011
|
|
|
10.80
|
Second Amendment to the Amended and Restated Loan and Security Agreement, dated September 9, 2011, by and among the Company, General Electric Capital Corporation, and the other lenders signatory thereto.
|
8-K
|
001-34375
Exhibit 10.80
|
09/15/2011
|
|
|
10.81
|
Promissory Note issued by the Company in favor of General Electric Capital Corporation or any subsequent holder thereof, pursuant to the Loan and Security Agreement dated September 9, 2011.
|
8-K
|
001-34375
Exhibit 10.81
|
09/15/2011
|
|
|
10.82
|
Promissory Note issued by the Company in favor of Silicon Valley Bank or any subsequent holder thereof, pursuant to the Loan and Security Agreement dated September 9, 2011.
|
8-K
|
001-34375
Exhibit 10.82
|
09/15/2011
|
|
|
10.83
|
Promissory Note issued by the Company in favor of Oxford Financial Corporation or any subsequent holder thereof, pursuant to the Loan and Security Agreement dated September 9, 2011.
|
8-K
|
001-34375
Exhibit 10.83
|
09/15/2011
|
|
|
10.88
|
First Amendment to Lease Agreement entered into on November 4, 2011, between HCP Callan Rd, LLC. and the Company.
|
10-Q
|
001-34375
Exhibit 10.88
|
11/08/2011
|
|
|
10.89#
|
2011 Employee Stock Purchase Plan
|
DEF 14A
|
001-34375
Appendix A
|
05/02/2011
|
|
|
10.90+
|
Contract HHSO100201200008C dated September 27, 2012, by and between the Company and the U.S. Department of Health and Human Services Biomedical Advanced Research and Development Authority (portions of the exhibit have been omitted pursuant to a request for confidential treatment).
|
8-K
|
001-34375
Exhibit 10.90
|
10/03/2012
|
|
|
10.91
|
Joint Venture Termination Agreement dated May 8, 2013 by and between the Company and Olympus Corporation.
|
10-Q
|
001-34375
Exhibit 10.91
|
05/10/2013
|
|
|
10.92
|
Loan and Security Agreement, dated June 28, 2013, by and among the Company, Oxford Finance LLC and Silicon Valley Bank.
|
10-Q
|
001-34375
Exhibit 10.92
|
08/09/2013
|
|
|
10.93+
|
Puregraft Sale-License-Supply Agreement, dated July 30, 2013, by and among the Company and Bimini Technologies LLC.
|
10-Q/A
|
001-34375
Exhibit 10.93
|
11/12/2013
|
|
10.94+
|
Amended and Restated License and Supply Agreement dated January 30, 2014, by and between the Company and Lorem Vascular Pty. Ltd.
|
8-K
|
001-34375
|
02/04/2014
|
|
|
14.1
|
Code of Ethics.
|
10-K
|
000-32501
Exhibit 14.1
|
03/30/2004
|
|
|
Consent of KPMG LLP, Independent Registered Public Accounting Firm
|
X
|
||||
|
Certification of Principal Executive Officer Pursuant to Securities Exchange Act Rule 13a-14(a), as adopted pursuant to Section 302 of the Sarbanes-Oxley Act of 2002
|
X
|
||||
|
Certification of Principal Financial Officer Pursuant to Securities Exchange Act Rule 13a-14(a), as adopted pursuant to Section 302 of the Sarbanes-Oxley Act of 2002
|
X
|
||||
|
Certifications Pursuant to 18 U.S.C. Section 1350/ Securities Exchange Act Rule 13a-14(b), as adopted pursuant to Section 906 of the Sarbanes - Oxley Act of 2002
|
X
|
||||
|
101.INS
|
XBRL Instance Document
|
X
|
|||
|
101.SCH
|
XBRL Schema Document
|
X
|
|||
|
101.CAL
|
XBRL Calculation Linkbase Document
|
X
|
|||
|
101.DEF
|
XBRL Definition Linkbase Document
|
X
|
|||
|
101.LAB
|
XBRL Label Linkbase Document
|
X
|
|||
|
*
|
XBRL Presentation Linkbase Document
|
X
|
+ Confidential treatment has been granted with respect to certain portions of this exhibit.
# Indicates management contract or compensatory plan or arrangement.
108