Attached files
| file | filename |
|---|---|
| EX-31.1 - EX-31.1 - BioAmber Inc. | bioa-ex311_201412318.htm |
| EX-31.2 - EX-31.2 - BioAmber Inc. | bioa-ex312_201412317.htm |
| EX-32.1 - EX-32.1 - BioAmber Inc. | bioa-ex321_2014123110.htm |
| EX-21.1 - EX-21.1 - BioAmber Inc. | bioa-ex211_2014123112.htm |
| EX-10.67 - EX-10.67 - BioAmber Inc. | bioa-ex1067_20141231602.htm |
| EXCEL - IDEA: XBRL DOCUMENT - BioAmber Inc. | Financial_Report.xls |
| EX-23.1 - EX-23.1 - BioAmber Inc. | bioa-ex231_201412319.htm |
UNITED STATES
SECURITIES AND EXCHANGE COMMISSION
Washington, D.C. 20549
FORM 10-K
(Mark One)
|
x |
ANNUAL REPORT PURSUANT TO SECTION 13 OR 15(d) OF THE |
For the fiscal year ended December 31, 2014
OR
|
o |
TRANSITION REPORT PURSUANT TO SECTION 13 OR 15(d) OF THE |
For the transition period from to
Commission file number: 001-35905
BioAmber Inc.
(Exact name of registrant as specified in its charter)
|
Delaware |
20-1579162 |
|
(State or other jurisdiction of incorporation) |
(I.R.S. Employer Identification No.) |
|
1250 Rene Levesque West, Suite 4110 Montreal, Quebec, Canada H3B 4W8 |
H3B 4W8 |
|
(Address of principal executive offices) |
(Zip Code) |
(514) 844-8000
(Registrant’s telephone number, including area code)
Securities Registered pursuant to Section 12(b) of the Act:
|
Title of Each Class |
Name of Exchange on Which Registered |
|
Common Stock, par value $0.01 per share |
New York Stock Exchange |
Securities Registered pursuant to Section 12(g) of the Act:
None
Indicate by check mark if the registrant is a well-known seasoned issuer, as defined in Rule 405 of the Securities Act. Yes o No x
Indicate by check mark if the registrant is not required to file reports pursuant to Section 13 or Section 15(d) of the Act. Yes o No x
Indicate by check mark whether the registrant: (1) has filed all reports required to be filed by Section 13 or 15(d) of the Securities Exchange Act of 1934 during the preceding 12 months (or for such shorter period that the Registrant was required to file such reports), and (2) has been subject to such filing requirements for the past 90 days. Yes x No o
Indicate by check mark whether the registrant has submitted electronically and posted on its corporate Web site, if any, every Interactive Data File required to be submitted and posted pursuant to Rule 405 of Regulation S-T during the preceding 12 months (or for such shorter period that the registrant was required to submit and post such files). Yes x No o
Indicate by check mark if disclosure of delinquent filers pursuant to Item 405 of Regulation S-K is not contained herein, and will not be contained, to the best of registrant’s knowledge, in definitive proxy or information statements incorporated by reference in Part III of this Form 10-K or any amendment to this Form 10-K. o
Indicate by check mark whether the registrant is a large accelerated filer, an accelerated filer, a non-accelerated filer, or a smaller reporting company. See the definitions of “large accelerated filer,” “accelerated filer” and “smaller reporting company” in Rule 12b-2 of the Exchange Act. (Check one):
|
Large accelerated filer |
¨ |
Accelerated filer |
x |
|
|
|
|
|
|
Non-accelerated filer |
¨ (Do not check if a smaller reporting company) |
Smaller reporting company |
¨ |
Indicate by check mark whether the registrant is a shell company (as defined in Rule 12b-2 of the Exchange Act). Yes o No x
The aggregate market value of common stock held by non-affiliates of the registrant based on the closing price of the registrant’s common stock as reported on the New York Stock Exchange on June 30, 2014, was $155 million. As of March 13, 2015, there were 21,838,671 shares of the registrant’s common stock, par value $0.01 per share, outstanding.
DOCUMENTS INCORPORATED BY REFERENCE
Portions of the registrant’s definitive Proxy Statement relating to its 2015 Annual Meeting of Stockholders are incorporated by reference into Part III of this Annual Report on Form 10-K where indicated. Such Proxy Statement will be filed with the U.S. Securities and Exchange Commission within 120 days after the end of the fiscal year to which this report relates.
TABLE OF CONTENTS
SPECIAL NOTE REGARDING FORWARD-LOOKING STATEMENTS
This Annual Report on Form 10-K contains “forward-looking statements” that involve risks and uncertainties, as well as assumptions that, if they never materialize or prove incorrect, could cause our results to differ materially from those expressed or implied by such forward-looking statements. The statements contained in this Annual Report on Form 10-K that are not purely historical are forward-looking statements within the meaning of Section 27A of the Securities Act of 1933, as amended, or Securities Act, and Section 21E of the Securities Exchange Act of 1934, as amended, or Exchange Act. Such forward-looking statements include any expectation of earnings, revenue or other financial items; any statements of the plans, strategies and objectives of management for future operations; factors that may affect our operating results; statements related to adding employees; statements related to future capital expenditures; statements related to future economic conditions or performance; statements as to industry trends and other matters that do not relate strictly to historical facts or statements of assumptions underlying any of the foregoing. Forward-looking statements are often identified by the use of words such as, but not limited to, “anticipate,” “believe,” “can,” “continue,” “could,” “estimate,” “expect,” “intend,” “may,” “will,” “plan,” “project,” “seek,” “should,” “target,” “will,” “would,” and similar expressions or variations intended to identify forward-looking statements. These statements are based on the beliefs and assumptions of our management based on information currently available to management. Such forward-looking statements are subject to risks, uncertainties and other important factors that could cause actual results and the timing of certain events to differ materially from future results expressed or implied by such forward-looking statements. Factors that could cause or contribute to such differences include, but are not limited to, those identified below, and those discussed in the section titled “Risk Factors” included in Item 1A of Part I of this Annual Report on Form 10-K, and the risks discussed in our other Securities and Exchange Commission, or SEC, filings. Furthermore, such forward-looking statements speak only as of the date of this report. Except as required by law, we undertake no obligation to update any forward-looking statements to reflect events or circumstances after the date of such statements. Forward-looking statements in this Annual Report on Form 10-K may include statements about:
|
• |
the expected funding sources of our planned Sarnia, Ontario plant and our other planned manufacturing facilities and the expected timing of the completion of construction and the start of commercial operations at each of these facilities; |
|
• |
our joint venture with Mitsui & Co. Ltd., or Mitsui; |
|
• |
our take-or-pay agreements with Vinmar International Ltd., or Vinmar, related to bio-based 1, 4 BDO and bio-succinic acid, and with PTTMCC Biochem for bio-succinic acid; |
|
• |
the expected applications of our products and the sizes of addressable markets; |
|
• |
our ability to gain market acceptance for bio-succinic acid, its derivatives and other building block chemicals; |
|
• |
the benefits of our transition from our E. coli bacterium to our yeast; |
|
• |
our ability to commence commercial sales and execute on our commercial expansion plan, including the timing and volume of our future production and sales; |
|
• |
the expected cost-competitiveness and relative performance attributes of our bio-succinic acid and the products derived from it; |
|
• |
our ability to cost-effectively produce and commercialize bio-succinic acid, its derivatives and other building block chemicals; |
|
• |
customer qualification, approval and acceptance of our products; |
|
• |
our ability to maintain and advance strategic partnerships and collaborations and the expected benefits and accessible markets related to those partnerships and collaborations; |
|
• |
our ability to economically obtain feedstock and other inputs; |
|
• |
the achievement of advances in our technology platform; |
|
• |
our ability to obtain and maintain intellectual property protection for our products and processes and not infringe on others’ rights; |
|
• |
government regulatory and industry certification approvals for our facilities and products; and |
|
• |
government policymaking and incentives relating to bio-chemicals. |
Overview
We are an industrial biotechnology company producing sustainable chemicals. Our proprietary technology platform combines industrial biotechnology and chemical catalysis to convert renewable feedstocks into sustainable chemicals that are cost-competitive replacements for petroleum-derived chemicals, which are used in a wide variety of everyday products including plastics, resins, food additives and personal care products. We currently sell our first product, bio-succinic acid, to customers in a variety of chemical markets. We intend to produce bio-succinic acid that is cost-competitive with succinic acid produced from petroleum at our facility under construction in Sarnia, Ontario. We produced our bio-succinic acid in a large-scale demonstration facility using a 350,000 liter fermenter in Pomacle, France, which we believe to be among the largest bio-based chemical fermenters in the world. We have produced approximately 3.5 million pounds, or 1,580 metric tons, of bio-succinic acid at this facility as of December 31, 2014.
Succinic acid can be used to manufacture a wide variety of products used every day, including plastics, food additives and personal care products, and can also be used as a building block for a number of derivative chemicals. Today, petroleum-derived succinic acid is not used in many potential applications because of its relatively high production costs and selling price. We believe that our low-cost production capability and our development of next-generation bio-succinic derived products including 1,4 BDO, which is used to produce polyesters, plastics, spandex and other products, will provide us with access to a more than $10 billion market opportunity. Combining these opportunities with other building block chemicals we are developing, such as adipic acid which is used in the production of nylons, we believe that our total addressable market is in excess of $30 billion.
We believe we can produce bio-succinic acid that is cost-competitive with succinic acid produced from oil priced as low as $35 per barrel, based on management’s estimates of production costs at our planned facility in Sarnia, Ontario and an assumed corn price of $6.50 per bushel. While we can provide no assurance that we will be able to secure corn at $6.50 per bushel given the fluctuations in corn prices, we believe this assumption is reasonable given the historic price of corn and management’s expectations as to their ability to manage the cost of glucose from corn and other inputs for our planned facility in Sarnia, Ontario. Over the past five years, the price of corn ranged from a low of $2.68 per bushel to a high of $8.44 per bushel. As of March 13, 2015, the spot price was $3.59 per bushel and the six month forward price was $3.88 per bushel. We estimate that a $1.00 increase or decrease in the per bushel price of corn would result in just a $0.054 per pound change in our variable cost of our bio-succinic acid. We expect the productivity of our yeast organism and on-going process improvements to further reduce our production costs. Our ability to compete on cost is not dependent on government subsidies or tariffs.
We are working to rapidly expand our accessible markets and product portfolio. We have entered into strategic relationships with several leading companies, such as our multi-year agreements with PTTMCC Biochem and Vinmar International Ltd., or Vinmar, for bio-succinic acid and Vinmar, for bio-based 1,4 Butanediol. We have also entered into agreements with LANXESS Inc., or LANXESS, Faurecia S.A., or Faurecia, NatureWorks LLC, or NatureWorks, and others for the development of derivatives of bio-succinic acid.
We have also entered into technology partnerships to lower our production costs, expand our product portfolio and enhance our biochemical production platform. For example, we entered into a technology partnership with Cargill through which we exclusively license a proprietary yeast organism for use in our fermentation process to produce our products. We refer to the yeast organism that we have licensed from Cargill as “our yeast.” We have also established other technology licenses and collaborations, including with DuPont, Evonik and Celexion.
Our business strategy is to leverage the value of our technology by building and operating production facilities around the world. However, depending on our access to capital and third-party demand for our technology, we may also enter into technology licenses on an opportunistic basis.
In order to support our growth strategy, we have begun to rapidly expand our manufacturing capacity. We have entered into a joint venture agreement with Mitsui & Co. Ltd. for our facility under construction in Sarnia, Ontario, which has an initial projected capacity of 30,000 metric tons of bio-succinic acid and could subsequently be expanded to produce another 20,000 metric tons of bio-succinic acid. The initial phase of the facility is expected to be mechanically complete in the second quarter 2015, and we began commissioning and start-up in March 2015. We expect this facility to be in commercial operation in the third quarter of 2015 and to be fully funded through equity contributions by both us, with a portion of the net proceeds of our recent equity offerings, and Mitsui, as well as a combination of government grants, interest-free and interest-bearing loans. We terminated production of our products at the large-scale demonstration facility in Pomacle, France at the end of 2014. Our joint venture with Mitsui also contemplates the potential construction and operation of an additional facility, which we expect to occur over the next three to five years.
1
On January 22, 2014, we entered into a 15 year take-or-pay contract for bio-based 1,4-Butanediol (BDO) with Vinmar, a privately held marketing, distribution, and project developed company headquartered in Houston, Texas. Under the terms of the master off-take agreement, Vinmar has committed to purchase 100% of the bio-based 1,4 BDO produced in a 100,000 metric ton per year capacity plant that we plan to build in North America and commission in 2018. Vinmar also plans to invest in the facility alongside us. While this agreement is binding, our inability to finance and construct the BDO plant would relieve Vinmar of its obligation to purchase BDO under the terms of the take-or-pay agreement. We signed a second take-or-pay agreement on July 3, 2014 with Vinmar to supply 10,000 tons of bio-succinic acid per year for 15 years from the Sarnia plant. The take-or-pay agreement also includes an expansion to the BDO facility previously announced of an additional 70,000 tons per year of bio-succinic acid, with Vinmar off-taking 70% of the bio-succinic acid produced for 15 years. Vinmar also commits to off-take 75% of the production from a new, third bio-succinic acid plant with 200,000 MT capacity that BioAmber plans to commission in 2020.
We are committed to managing our economic, social, environmental and ethical performance through continued sustainable business practices. We have completed a life cycle analysis for our planned facility in Sarnia that indicates that no carbon dioxide equivalent (or greenhouse gases) will be emitted per kilogram of our bio-succinic acid produced, making our process carbon neutral. This is significantly less carbon intensive than the current petrochemical process for making succinic acid, in which 7.1 kilograms of carbon dioxide equivalent are emitted per kilogram of succinic acid produced. This represents a 100% reduction in greenhouse gases for our bio-succinic acid process, relative to the current petrochemical process for making succinic acid. The life cycle analysis also indicates that our planned facility in Sarnia will consume 64% less energy than the current petrochemical process.
We were incorporated in the State of Delaware in October 2008 as DNP Green Technology, Inc. and were established as the result of a spin-off of certain assets from Diversified Natural Products, Inc. In September 2010, we acquired the 50% interest in our joint venture Bioamber S.A.S. that we did not already own, after which, Bioamber S.A.S. became wholly owned by us. Concurrent with this acquisition, the Company changed its name from DNP Green Technology, Inc. to BioAmber Inc. and changed its fiscal year end from June 30 to December 31. Bioamber S.A.S. had been wholly owned by the Company until its liquidation in December 2014.
Our Industry
The global chemical industry is a $4.1 trillion market, based on total global chemical shipments in 2012, according to the American Chemistry Council. Chemicals are utilized in a broad range of end-use markets, including heavy industry, mining, construction, consumer goods, textiles and healthcare. While there is significant ongoing process innovation and technological development in the broader chemicals industry, producers are still heavily reliant on petroleum-derived feedstocks. The following table lists five of the key chemical classes from two carbon, or C2, to six carbon, or C6, that are primarily being produced from fossil fuels today along with examples of derivative compounds and end-use applications.
|
|
C2 Ethylene |
C3 Propylene |
C4 n-Butane Butadiene |
C5 and greater Benzene/Toluene/Xylene |
|
Derivatives |
•Ethylene glycol •Polyethylene •PVC •Vinyl |
•Acrylic •Polypropylene |
•Maleic anhydride •Succinic Acid •1,4 BDO and THF |
•Adipic acid •Caprolactam •Caprolactone •Cyclohexane •Hexamethylenediamine (HMDA) •Hexanediol |
|
|
|
|
|
|
|
Applications |
•Anti-freeze •Building materials •Foam packaging •Plastic bags •Plastic films |
•Automotive components •Coatings •Packaging •Plastic parts •Textiles and fibers |
•Adhesives •Elastomers •Footwear •Synthetic rubber •Tires |
•Carpet fiber •Clothing •Nylon •Thread, ropes and netting |
Reliance on Petrochemicals
While the global chemical industry provides many value-added products to industrial and consumer end-markets, it is facing an increasing number of challenges as a result of its significant reliance on petroleum as its primary feedstock for the following reasons:
|
• |
A Finite, Non-Renewable Resource as its Primary Input. Chemical companies are heavily dependent on oil, a finite, non-renewable resource that is in growing demand, particularly from developing economies such as India and China. , Recent supply growth has been limited. Given the demand pressures on such a critical input, the purchasers of chemical have shown growing interest in finding cost-effective, renewable alternatives. |
2
|
• |
Hydrocarbon Feedstock Price Volatility. Crude oil prices have experienced significant price volatility over time. For example, during the last five years, the market price per barrel of West Texas Intermediate crude oil ranged from a low of $44.45 to a high of $112.93 and was $47.05 on March 12, 2015. As a result, we believe chemical companies are looking for more stable solutions. |
|
• |
Potential for Margins Pressure at Existing Petrochemical Facilities. Given the price volatility around crude oil, chemical companies are increasingly concerned about rapid raw material price increases driven by supply shortages in basic petrochemical inputs that could negatively impact their profit margins. Due to the nature of contracts with their customers, chemical companies often cannot pass-through rising raw materials costs to their customers quickly. |
|
• |
Reduced Supply of C4 Chemicals. In the past five years, there has been a 25% reduction in the supply of C4 chemicals due to the emergence of relatively inexpensive natural gas in certain geographies including shale gas in North America. In these geographies there has been a shift away from naphtha cracking to natural gas liquid cracking as a means of producing ethylene. As such, there is significantly less crude C4 fraction produced, which is a principal source of supply for C4 chemicals. Consequently, the shift to natural gas cracking has led to a drop in the supply of crude C4, a primary feedstock for C4 chemicals. This has led to increased volatility in the prices of C4 derived chemicals, including butadiene, maleic anhydride and 1,4 BDO. |
|
• |
Increasing Governmental Regulation. Increasing government regulation and climate change initiatives are driving up the cost of using high carbon emitting processes, such as chemical production via petrochemicals. The third phase of the European Union’s Emission Trading System when implemented is expected to more broadly cover petrochemical production activities, potentially increasing costs at European petrochemical plants. In addition to regulation of carbon emitting processes, the use of petrochemicals in certain products, such as plasticizers containing phthalates, are subject to increasing regulatory pressure. |
|
• |
Customer Demand for Renewable and Sustainable Products. Consumers are increasingly choosing renewable alternatives to products when available. As consumers become more aware of the environmental footprint of petroleum-derived products, they may shy away from less sustainable products in favor of readily available, non-petrochemical based alternatives, especially if these products are priced competitively. We believe that there is demand among certain players in the chemical industry for sustainable alternatives in order to differentiate themselves from their competitors. |
Biochemical Alternatives
We believe there is significant and growing demand for a low-cost and sustainable alternative to using petroleum for chemical production. Multiple biochemical processes have been developed to address this demand, primarily using microorganisms that can convert sugars derived from renewable feedstocks into various chemical building blocks including:
|
• |
Bio-succinic acid: A biologically produced, chemically identical replacement for petroleum-derived succinic acid that can be utilized to produce derivative products such as bio-based 1,4 BDO, and can substitute petrochemicals such as maleic anhydride, phthalic acid and adipic acid in a number of applications. Target end-uses for bio-succinic acid include plasticizers, polyurethanes, personal care products, resins and coatings, de-icing solutions, lubricants and food additives. |
|
• |
Bio-adipic acid: A biologically produced, chemically identical replacement for adipic acid. Target end-uses for bio-adipic acid include nylon fibers, resins, plasticizers, solvents and adhesives. |
Bio-succinic acid and bio-adipic acid are often referred to as “building block” chemicals because they can be converted into intermediate chemicals that are then used in the production of a wide array of consumer end-products. Bio-succinic acid is produced from renewable sugars in a carbon dioxide-sequestering process, which results in higher theoretical yields than other bio-based chemicals, as shown in the table below.
|
Chemical |
Theoretical Yield |
Kg Sugar Needed to Produce a Kg of Product |
|
Bio-succinic acid |
112% |
0.9 |
|
Lactic acid |
100% |
1.0 |
|
Bio-based 1,4 BDO via succinic acid |
85% |
1.2 |
|
1,3 Propanediol |
63% |
1.6 |
|
Adipic acid |
58% |
1.7 |
|
1,4 BDO via direct fermentation |
54% |
1.9 |
|
Ethanol |
51% |
2.0 |
|
Iso-Butanol |
41% |
2.4 |
|
Farnesene |
29% |
3.5 |
3
Bio-adipic acid is also produced from renewable sugars in a process that does not consume carbon dioxide, but is free of nitrous oxide emissions, which are a significant drawback of the petrochemical process. We produce bio-based succinic acid and we intend to produce bio-based 1,4 BDO via succinic acid and are also developing a bio-based route to adipic acid.
Despite their inherent benefits, there has not been a critical mass of bio-based chemical manufacturing facilities operating at sufficient scale to prove out the cost and quality necessary to compete with their petrochemical equivalents. We believe that if manufacturers of bio-based chemicals can produce at reduced costs compared to their petrochemical equivalents, the market for the bio-based chemicals could be significantly larger than it is today. The high cost of producing succinic acid from petroleum feedstock has limited its use. We believe there is a significant opportunity for bio-based chemical manufacturers who can reliably deliver product at scale, with the required specifications of potential customers and at a competitive cost.
Our Strengths
Our business benefits from a number of competitive strengths, including:
Proprietary Technology Platform that Addresses a Large Market Opportunity
Our proprietary technology platform integrates industrial biotechnology, and chemical catalysis to produce bio-based chemicals as cost-competitive, chemically identical replacements for petroleum-derived equivalents. We own or have exclusive rights to specific microorganisms, chemical catalysis technology and a scalable and flexible purification process that, when combined and optimized, convert renewable feedstocks into platform chemicals. We believe the strength of our platform, our intellectual property portfolio and our licensing agreements with Cargill, Celexion and DuPont will allow us to extend our chemical production beyond our current product, bio-succinic acid, to large markets including bio-based 1,4 BDO and bio-based adipic acid. We believe our bio-based chemicals can serve as “drop-in” replacements for existing petroleum-based chemicals in these markets. Together, these chemicals address what we believe to be an approximately $30 billion market opportunity.
Selling Commercial Product Today
We believe we were the first company selling bio-succinic acid in commercial quantities. Our customers utilize our product as a cost-competitive, sustainable alternative to the petroleum-based specialty chemicals they currently use in polymers, food additives and flavorings, bath salts, polyurethanes, pharmaceutical and other applications. Our ability to supply large scale quantities of bio-succinic acid allows our customers to develop new applications and initiate commercialization of their products.
Cost-Competitive Economics at Large Scale
Our experience operating the large-scale demonstration facility in Pomacle, France for five years helped us refine our process and make bio-succinic acid cost-competitively without subsidies. We expect to produce bio-succinic acid that is cost-competitive with succinic acid produced from oil priced as low as $35 per barrel, based on management’s estimate of input prices in Sarnia, Ontario and an assumed corn price of $6.50 per bushel. Through extensive research and development efforts relating to our bio-succinic acid production process, including pilot plant phase, process efficiency enhancements and scaling up our process to our current scale, we have been able to thoroughly address the operational complexities in our process. We believe that our experience operating at the large demonstration scale in France provided us with the know-how to efficiently design, build and operate our Sarnia facility currently under construction.
Limited Exposure to the Availability and Price of Sugar
Our process requires less sugar than other renewable products. We require approximately 50% less sugar to produce a pound of bio-succinic acid than is needed to produce a pound of ethanol (0.15 gallons), and even less sugar than is needed to produce a pound of several other bio-based chemicals. This makes our process less vulnerable to price increases in sugar, relative to other bio-based processes. This efficient use of sugar translates into reduced consumption. To produce $1 billion worth of bio-succinic acid and $1 billion worth of bio-based 1,4 BDO at current prices, we would require approximately 1.2 million metric tons of sugar. Even if the entire $2 billion worth of bio-succinic acid and bio-based 1,4 BDO were produced in North America, it would require only 6.0% of the sugar produced in existing corn wet mills. Given this modest demand and our ability to source sugar from a variety of sources, rapid growth in our production capacity would not likely have a material impact on the sugar markets from which we plan to source.
Established, Diverse Customer Base
Our leadership in bio-succinic acid technology, our product quality and the economics of our process are validated by the contracts we have signed with customers in a variety of end-markets. We have entered into two take-or-pay agreements for the Sarnia plant for the sale of 162,000 metric tons of bio-succinic acid over the next 15 years. We have also entered into supply agreements for
4
the sale of approximately 47,000 metric tons of bio-succinic acid and its derivatives until the end of 2017. These supply agreements typically obligate our customers, subject to certain conditions, to purchase 75% to 100% of their succinic acid needs from us, contingent on our ability to meet their price and other requirements. There are no penalties in the event these customers do not purchase or we do not supply them with bio-succinic acid in the projected purchase volumes indicated in the agreements.
Global Manufacturing Expansion Plan
We have signed a joint venture agreement with Mitsui to build and operate a commercial scale plant in Sarnia, Ontario, that is expected to produce bio-succinic acid. We commenced construction of this facility in 2013 and expect the facility to be mechanically complete in the second quarter of 2015. This facility has been designed to have an initial capacity of 30,000 metric tons of bio-succinic acid and could subsequently be expanded to produce another 20,000 metric tons of bio-succinic acid. Pursuant to the July 3, 2014 take-or-pay agreement with Vinmar, which expands the scope of our next plant to include 70,000 tons per year of succinic acid capacity in addition to the 100,000 tons per year of BDO capacity, we are re-evaluating the timing and eventual size of the Sarnia expansion. Since we expect our next plant to be in construction in 2016 and completed by early 2018, we may decide to focus our human and financial resources on the second plant and not simultaneously expand the Sarnia plant. We anticipate making a final decision in the second half of 2015.
Experienced Management Team with Strong Track Record
Our management team consists of experienced professionals, possessing on average over 25 years of relevant experience in scaling up, manufacturing and commercializing chemicals and bio-based products, gained at both large companies and entrepreneurial start-ups. Members of our senior management team have worked at companies including Abengoa, Cargill, DuPont, Dow Corning Corporation, Royal DSM N.V., Suncor, Sanofi and Tate & Lyle.
Our Strategy
Our goal is to be the leading provider of renewable chemicals by replacing petroleum-based chemicals with our bio-based alternatives, which we believe could revolutionize the global chemical industry.
Rapidly Expand Our Global Manufacturing Capacity
We operated a large-scale demonstration facility in Pomacle, France until December 31, 2014, and are building our first commercial facility in cooperation with Mitsui in Sarnia, Ontario. We expect this facility to be mechanically complete in the second quarter of 2015, and we began commissioning and start-up activities in March 2015. We plan to construct additional large-scale bio-based succinic acid facilities in multiple geographic regions employing a standardized design that facilitates expedient and capital-efficient growth. We expect to benefit from incremental cost reductions and further technological and engineering improvements at each additional facility. To further streamline production and reduce costs, we plan to integrate production and locate these facilities in proximity to required infrastructure and feedstock. We intend to retain operational control and a majority interest in these facilities and collaborate with third parties to obtain capital, construct the facilities, secure feedstock, sell future output and assist with manufacturing and market access.
Target the Large and Established 1,4 BDO Market
We intend to leverage our ability to produce high quality bio-succinic at low cost, as well as high value-added derivatives of bio-succinic, such as bio-based 1,4 BDO, which is used in the production of polyesters, plastics, spandex and other products. We have licensed technology from DuPont, which we believe will enable us to produce bio-based 1,4 BDO at a lower cost than alternative processes with equivalent purity. In January 2014 we announced our intention to build a 100,000 ton per year capacity bio-based 1,4-BDO plant in North America, which we plan to commission by early 2018. We have entered into a 15 year take-or-pay contract with Vinmar International Ltd. in which they will guarantee 100% off-take of bio-based 1,4 BDO from the 100,000 ton per year facility. We expect to benefit from Vinmar’s global logistics expertise and its experience selling large volumes of BDO and executing large chemical facility projects. We expect that Vinmar will invest alongside us in the planned North American facility, and Mitsui may also participate as a minority equity partner in the plant.
5
Develop Next-Generation Succinic-Derived Products
We intend to leverage our proprietary technology platform and expertise in the production of bio-succinic acid to target high value-added products such as bioplastics and plasticizers that can be made with succinic acid and replacements for silicone in personal care.
Continue to Reduce the Cost of Our Products
Our goal is to be the low-cost producer of the bio-based chemicals we manufacture. Our bio-succinic acid production process has high yields and benefits from our proprietary, low-cost purification. We believe that at our manufacturing facility under construction in Sarnia, Ontario, we will produce bio-succinic acid at a significantly reduced cost compared to the cost of other bio-based succinic acid processes and petroleum-derived succinic acid, according to our estimates of what the costs of the inputs will be at our facility in Sarnia. We have reduced our production costs by increasing the scale of our manufacturing process to realize economies of scale and by transitioning from an E. coli bacterium to a yeast licensed from Cargill.
Expand Product Platform to Additional Building Block Chemicals
We are working to expand our product portfolio to C6 building block chemicals including adipic acid, hexamethylene diamine (HMDA) and caprolactam. These products are used in the production of carpeting, rugs, textile laminations, garment linings, adhesives for shoe soles and resins used in the paper products industry. We expect to use our flexible technology platform to expand our product base, starting with bio-adipic acid, by leveraging our extensive experience developing, producing and marketing bio-succinic acid. We believe our technology platform, including an exclusive license to a biochemical pathway discovered by Celexion, an exclusive license to use Cargill’s proprietary yeast and our innovative purification process will provide us with a competitive advantage.
Our Products
Our bio-based specialty chemicals can be used in multiple end-markets and applications and can serve as key building blocks for a wide variety of products used every day. The table below sets forth, for both C4 and C6 chemicals, the development stage of each of the products we currently sell or are in our pipeline and typical applications for these products. The dollar amounts set forth in the table represent management’s estimates of the addressable market size for each of these products, which together represent a total addressable market in excess of $30 billion. Management’s estimates of the addressable market sizes are based on industry reports from the last five years, pricing information in the industry reports and from ICIS pricing, publicly available information, and management’s estimates of what portion of the total market size may be addressable through bio-succinic acid.
Market Opportunity
|
|
C4 Platform |
|
C6 Platform |
||||
|
|
Commercial |
Pre-Commercialization(1) |
|
In Development(2) |
|||
|
|
Bio-Succinic Acid |
1,4 BDO / THF / |
Polyesters made |
|
Adipic Acid |
Caprolactam |
HMDA |
|
Applications |
•Plasticizers •Polyurethanes •Personal care products •Resins and coatings/paints •De-icing and coolant solutions •Fine chemicals •Lubricants •Food additives |
•Elastomers •Engineering plastics •Shoe soles •Spandex •Solvents |
•Automotive interiors •Fibers and non-wovens •Food packaging •Plastic bags •Plastic cups •Organic composite boards |
|
•Carpets •Engineering plastics •Textiles and fibers |
•Carpets •Films •Textiles and fibers |
•Carpets •Engineering plastics •Polyurethanes •Textiles and fibers |
|
|
|
|
|
|
|
|
|
|
|
$4.0 billion |
$4.3 billion |
$2.0 billion |
|
$4.9 billion |
$10.7 billion |
$4.7 billion |
|
(1) |
“Pre-Commercialization” refers to products that have been produced at pilot scale and tested and for which the production process is in the process of being scaled up, with samples available for product testing and qualification. |
|
(2) |
“In Development” refers to products that have not yet been produced at the laboratory scale in adequate quantities to undergo testing. These are early stage research projects and no samples are expected to be available for at least two years. |
6
Bio-Succinic Acid
We chose to develop bio-succinic acid as our first product because it is a platform chemical that can be used in a broad range of markets, from high value niche applications such as personal care products and food additives, to large volume applications such as plasticizers, polyurethanes, resins and coatings. Bio-succinic acid is also unique in terms of the limited quantity of sugar that is needed for its production. In 2004, the DOE published a report on “Top Value-Added Chemicals from Biomass,” identifying the top opportunities for the production of chemicals from biomass. The study prioritized twelve chemicals, from a group of over 300 possible building blocks that could be most effectively manufactured from sugars. Bio-succinic acid was recognized as one of the renewable building block chemicals with the greatest technical feasibility and commercial potential.
We have identified three main market opportunities for our bio-succinic acid platform:
|
• |
First, we intend to replace petroleum-based succinic acid in applications where it is currently in use, such as food additives and fine chemicals, where the “natural” aspect of bio-based succinic acid adds value to these applications and drives greater market demand. |
|
• |
Second, we intend to expand into new applications for succinic acid, such as phthalate-free plasticizers, silicone replacements and bioplastics such as PBS, using application development and technical support to demonstrate performance advantages as well as health and environmental benefits of products made with bio-succinic acid compared to the petrochemicals currently being used for these applications. |
|
• |
Third, we intend to convert bio-succinic acid to bio-based 1,4 BDO, THF and gamma-butyrolactone, or GBL, which are large volume, existing markets accessible to our “drop-in” bio-based alternatives. These chemical intermediates are used to produce polyesters, plastics, spandex and other products. |
Historically, the high cost of producing succinic acid from petroleum feedstock limited its use to a narrow range of applications such as pharmaceuticals and food ingredients. As a result, based on 2011 estimates, the market for petroleum-based succinic acid is approximately 51,000 metric tons per year, representing a market size of approximately $350 million. However, market research firms and consultants have predicted that manufacturing bio-succinic acid will make succinic acid economically feasible for use in greater volumes across a spectrum of new applications. A study published in May 2012 by Nexant projects that the global market for succinic acid will be 424,000 metric tons in 2016, representing a compounded annual growth rate in excess of 50% between 2010 and 2016. A study published in August 2012 by Roland Berger, a consulting firm, projects that the succinic acid market will grow at a compounded annual growth rate of between 25% and 30% through 2020, when the global market size is expected to be between 500,000 and 700,000 metric tons. We have entered into two take-or-pay agreements for the Sarnia plant for the sale of 162,000 metric tons of bio-succinic acid over the next 15 years. We have also entered into supply agreements for the sale of approximately 47,000 metric tons of bio-succinic acid and its derivatives until the end of 2017. These supply agreements obligate our customers to exclusively fulfill 75% to 100% of their needs for bio-succinic acid from us, contingent on our ability to meet their price and other requirements; however, there are no penalties in the event they do not purchase or we do not supply them with bio-succinic acid in the projected purchase volumes indicated in the agreements.
We are currently focused on the following applications for bio-succinic acid, listed in descending size of the addressable markets:
|
• |
Plasticizers. Plasticizers are organic esters that are primarily used to render polyvinyl chloride, or PVC, more flexible. PVC is widely used in multiple end-markets because it is low cost, durable and versatile. Bio-succinic acid esters can serve as replacements for the major phthalate-based plasticizers, which account for over 80% of the worldwide plasticizer market. There is increasing demand for renewable, phthalate-free plasticizers, particularly in sensitive applications such as children’s toys and childcare articles. We entered into a joint development agreement with Lanxess, a global leader in phthalate-free plasticizers, to develop a portfolio of bio-succinic-based phthalate-free plasticizers that can exceed the performance of general purpose plasticizers at competitive prices. Lanxess has begun to market a range of succinic acid based plasticizers, under the Uniplex brand. These succinic acid based plasticizers have been tested by Solvin, a division of Solvay and one of the world’s leading producers of PVC, and they achieved positive results that collectively outperformed existing phthalate alternatives. While the global market for plasticizers exceeds $30 billion, we believe the addressable market for phthalate-free plasticizers is approximately $1.5 billion. |
|
• |
Polyurethanes. Succinic acid, and to a greater extent adipic acid, are currently used in polyester polyols, which are used to make polyurethanes. Polyurethanes are used in, among other things, soles for footwear, molded foams for automotive applications like car seats and arm rests, and non-foam applications such as coatings, adhesives and sealants. Bio-succinic acid can be used to replace adipic acid in this market and is currently the only renewable alternative to adipic acid for the production of polyurethanes. Suppliers of polyester polyols are actively looking for bio-based, cost-effective substitutes for adipic acid to improve the environmental profile and reduce the cost of their products. Some of the largest producers in Western Europe and North America have tested and validated our bio-succinic acid as a replacement for adipic acid in polyester polyols. Due to our first mover advantage, low cost of production and strong relationships with key customers, we believe we will be able to capture a significant portion of the market for bio-succinic acid in polyurethanes. We believe the addressable market for polyurethanes exceeds $1 billion. |
7
|
• |
Personal Care Products. Our initial focus in the personal care market has been the use of esters of bio-succinic acid as natural emollients and surfactants. Emollients are used in lotions, liquid soaps and cleansers to improve and moisturize skin, while surfactants are used in soaps, body washes and shampoos to allow easier spreading. We believe there is a significant opportunity for bio-based alternatives as consumers are increasingly demanding renewable products and ingredients in the personal care products they use including the replacement of silicone based ingredients in shampoos and other products. We believe the addressable market for succinic acid and succinate esters in the personal care industry is approximately $500 million. |
|
• |
Resins and Coatings. Bio-succinic acid can be used to replace adipic acid in polyester coating resins, powder coatings, unsaturated polyester resins, or UPR, and polyester polyols used in urethane surface coatings. Bio-succinic acid can also replace, or be used in conjunction with phthalic anhydride in UPR and alkyd resins. Bio-succinic acid offers performance equivalent to petroleum-based raw materials, as well as environmental advantages and cost-effectiveness. We believe the addressable market for resins and coatings exceeds $500 million. |
|
• |
Food Additives. Succinic acid is currently used for its multiple functions in food applications; as an acidulant, to increase the tartness or acidity of food, as a pH regulator for food ingredients, and as a flavoring agent. The unique ‘umami’ flavor of succinic acid gives a salty, soy-like taste to food and is used in the production of soy sauce, miso, sake and synthetic liquors in Asia. Outside of Asia, succinic acid is primarily used in the baking industry. Succinic acid can also be used to replace malic acid, which provides a bitter salty taste similar to succinic acid, and adipic acid that is used as a flavor in fruit drinks and as a gelling aid for gelatin desserts. Initially, we are targeting existing succinic acid applications, but we believe our bio-succinic acid will rapidly expand succinic acid’s portion of the overall flavors and food ingredients market as a natural alternative. We believe the addressable market for food additives is approximately $200 million. |
|
• |
Lubricants. Adipate esters are widely used in the lubricants market as base oils or as additives to form industrial lubricants and metal-working fluids. Bio-succinic acid is capable of replacing adipate esters and producing sustainable succinate esters that meet the demand for more environmentally friendly, non-toxic lubricants. We are working with third parties to assess our bio-succinate esters and accelerate market penetration. To date, our bio-succinate esters have performed well in product testing, showing improved flowability in cold temperatures and better prevention of oxidation, rust and corrosion. We believe the addressable market for lubricants exceeds $100 million. |
|
• |
Fine Chemicals. Succinic acid is used today in a variety of high value added applications including dyes, inks, and toners. Succinic acid is also used in pharmaceutical applications. Derivatives of succinic acid such as succinimides can provide multiple functions in pharma applications, such as a pH buffer, an antibacterial or chelating agent, a coatings/sizing agent, or as a stabilizer for other ingredients. We believe the addressable market for fine chemical applications exceeds $100 million. |
|
• |
De-icing Solutions. Chlorides are the most commonly used de-icer for roadways. Potassium salts are typical non-chloride de-icers used for roadways as well as airport runways and other surfaces. We have developed a patented bio-succinic acid-based de-icer formulation for use on airport runways. Our bio-based product is significantly less corrosive than potassium acetate and potassium formate. We are also developing bio-succinic acid based products as wetting agents for chlorides in the larger roadway market, which can reduce the corrosiveness of the chlorides applied. We believe the addressable market for de-icing solutions exceeds $100 million. |
|
• |
Other Markets. Other applications of bio-succinic acid that are currently being developed and tested by potential customers and partners include anti-freeze solutions, coolants solvents, water treatment chemicals, effervescence agents such as laundry tablets and bath salts, artificial leather products and foams made with recycled polyethylene terephthalate (PET). |
Our Product Pipeline
Derivatives of Bio-Succinic Acid
Succinic acid can be used to produce 1,4 BDO, THF and GBL. Succinic acid is also a monomer used to produce certain polyesters, including PBS. We are actively targeting these derivatives of bio-succinic acid, which offer large existing drop-in markets to broaden our addressable market and maximize the value of our technology.
1,4 Butanediol (1,4 BDO)
The major uses of 1,4 BDO are in the production of THF and polybutylene terephthalate, or PBT. THF is used to produce spandex fibers and other performance polymers, resins, solvents and printing inks for plastics. PBT is an engineering-grade thermoplastic that combines excellent mechanical and electrical properties with robust chemical resistance. The automotive and electronics industries heavily rely on PBT to produce connectors, insulators, wheel covers, gearshift knobs and reinforcing beams. We believe there is also growing demand in the automotive industry to produce PBT and blends that are partially bio-based to enable
8
automobile manufacturers to meet their sustainability goals. There is also growing demand in the apparel industry for renewable, bio-based spandex. In 2010, we licensed DuPont’s hydrogenation catalyst technology to make bio-based 1,4 BDO and bio-THF from our bio-succinic acid. We have been working with several third parties to validate the technology performance. We believe the addressable market for 1,4 BDO and THF exceeds $4.3 billion.
Gamma-Butyrolactone (GBL)
The hydrogenation catalyst technology we license from DuPont can also convert our bio-succinic acid into bio-based GBL. GBL is used to produce a number of value added specialty chemicals, including 2-pyrrolidone, N-methyl pyrrolidone and N-vinyl pyrrolidone. Pyrrolidones are generally produced from the reaction of GBL with amines. GBL and the pyrrolidones have wide use as solvents in applications from extraction solvents in petroleum processing to surface coatings. These materials are also intermediates used in the manufacture of pharmaceuticals, fine chemicals and agrochemicals. Poly-vinyl pyrrolidone, or PVP, polymers are used in pharmaceuticals, food, agrochemicals, cosmetics and personal care and detergent applications. We believe the addressable market for GBL is approximately $900 million and the pyrrolidones market is approximately $1 billion.
Succinic Acid Based Polyesters
Succinic acid can be reacted with different alcohols to produce polyesters. Polybutylene succinate, or PBS, is one such polyester. PBS is a biodegradable polymer made by reacting succinic acid with 1,4 BDO. The market for this biopolymer is currently limited by capacity and price, and the fact that it has traditionally been made with petroleum-derived succinic acid and 1,4 BDO. Applications range from single use in food service ware, including cutlery, cups and lids, agricultural mulching film and compostable bags. Our bio-succinic acid enables PBS to be lower cost and partially renewable, and upon commercialization, we expect our bio-based 1,4 BDO will enable PBS to be 100% bio-based. We believe that this will drive PBS market growth beyond current applications to include paper coating, food packaging, fibers and non-wovens, and durable applications including automotive interiors, consumer goods and household appliances. We are the exclusive supplier of bio-succinic acid to Mitsubishi Chemical, which they use to produce partially bio-based PBS.
PBS can be used in combination with other biopolymers such as PLA, PHA and poly(3-hydroxybutyrate-co-3-hydroxyvalerate), or PHBV, and with petrochemical polymers such as polypropylene, polystyrene and polycarbonate. These combinations, known as blends, combine the properties of the polymers that are being mixed and can lead to specific properties and performance that are being sought by customers. PBS composites are compounds in which PBS is filled with fibers (such as natural fibers, glass fibers or carbon fibers) or fillers (such as wood flour or starch). Blends and composites can alter properties such as stiffness, mechanical resistance and density, and lead to more cost-effective solutions. Potential applications include automotive interiors, non-wovens (such as disposal hygiene products), construction materials, consumer goods and appliances. We believe the potential addressable market for succinic acid based polyesters, including PBS, along with polyester and composites is approximately $2 billion.
C6 Building Block Chemicals
We expect to use our flexible technology platform, including our partnership with Celexion and our exclusive rights to the Cargill yeast, to expand our product base to C6 building block chemicals, starting with bio-adipic acid, by leveraging our extensive experience developing, producing and marketing bio-succinic acid. We also plan to produce bio-based caprolactam, bio-based hexamethylenediamine, bio-based hexanediol and bio-based caprolactone.
Adipic Acid
Adipic acid is primarily used in the production of Nylon 6,6 fibers, plastics and resins. Nylon fibers are used in carpeting and rugs, nylon plastics are used in molding and extrusion applications and nylon resins are used mainly for injection molding in automotive and electrical applications, as well as for hardware, appliance and machine parts. We believe the addressable market for adipic acid exceeds $4.9 billion.
Caprolactam
Caprolactam is an intermediate used in the production of Nylon 6, a major engineering plastic. Nylon 6 finds significant use in film and wire and cable insulation, as well as in automotive applications like intake manifolds, previously made with aluminum ingots, replaced by plastics such as Nylon 6 in order to reduce weight and obtain flexibility of design. We believe the addressable market for caprolactam is approximately $10.7 billion.
9
Hexamethylenediamine (HMDA)
Our C6 Platform also offers a proprietary route to bio-HMDA, which is an intermediate used to produce Nylon 6,6. Nylon 6,6 polymer is principally converted into fibers, with the remainder going into Nylon 6,6 plastics used in molding and extrusion applications, primarily in automotive applications such as exterior body components, under-the-hood components, and some mechanical components. Other Nylon 6,6 resin applications include electronics, film and extrusion coatings. A major use of Nylon fibers is in carpeting and rugs. We believe the addressable market for HMDA exceeds $4.7 billion.
Our Commercial Strategy and Partnerships
Existing Markets for Succinic Acid
For the past five years we have been sampling and qualifying our bio-succinic acid among existing purchasers of succinic acid. Our initial focus was to identify customers that valued natural, bio-based succinic acid, and to sign them to long-term supply agreements. The figure below illustrates the existing markets and applications we have targeted with this product. The use of succinic acid in these markets and applications is already well-established.

We sold bio-succinic acid to 42, 37 and 19 customers in 2014, 2013 and 2012, respectively. During the year ended December 31, 2014, 47% our sales were to International Flavor and Fragrances, Inc., or IFF, Brenntag AG, or Brenntag and Olon Italy. During the year ended December 31, 2013, 64% our sales were to IFF, and Brenntag.
10
Emerging Markets for Bio-Succinic Acid
Beyond the established markets for succinic acid, we have been working with third parties in a number of applications to expand the use of bio-succinic acid. These partnerships are currently immaterial to our financial results and many of these partnerships are in the early stages—in most cases pursuant to non-binding letters of intent—so we can provide no assurances as to the timing or amount of commercial sales that may result from these partnerships, if any. We have and intend to continue to utilize collaborations in an effort to secure development expertise, intellectual property, market access and commercialization capabilities, in an effort to establish barriers to entry for our competitors and accelerate market uptake of our bio-succinic acid. The figure below illustrates the emerging markets for bio-succinic acid that we have targeted. We believe our collaboration strategy for these markets provides us with a cost-effective approach to expanding our addressable markets while capitalizing on our first-mover advantage for bio-based alternatives.
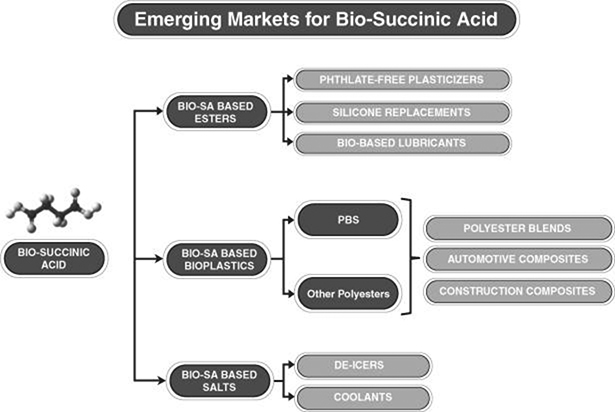
Bio-Succinic Acid Based Esters
Phthalate-Free Plasticizers. Plasticizers are softeners that are primarily used in PVC and other plastics to make these materials more flexible. Most plasticizers are phthalate-based, and phthalates have been identified as a possible health risk. We have partnered with a leader in phthalate-free plasticizers and have jointly developed bio-succinic acid-based plasticizers that are both renewable and phthalate-free. We have developed a portfolio of succinic acid based plasticizers, which our partner is now sampling to the marketplace and actively promoting. We have also been working with a leading producer of PVC, which has tested our succinic acid based plasticizers and found them to collectively outperform existing phthalate alternatives.
Silicone Replacements. Silicone replacements are used across all segments of the personal care market, including skin care, hair care (shampoos), antiperspirants and deodorants, as well as color cosmetics. In the past, attempts by third parties to develop silicon replacements have generally resulted in the need to compromise performance. We have been collaborating with a specialty ingredients company and have jointly developed bio-succinic acid based esters that are effective silicone replacements without compromising performance. We are jointly marketing these natural silicone replacements with our partner, which has begun to commercialize a range of bio-based silicone replacements to the personal care industry.
Bio-Based Lubricants. We have been collaborating with a manufacturer of lubricant formulations to develop formulations containing bio-based succinate esters to be used as a substitute for conventional petroleum-based lubricants. Pursuant to this collaboration, we are developing a range of succinic acid based esters that are renewable and testing a range of esters for lubricant applications. The lubricant manufacturer is currently seeking to complete the development and testing of these formulations and we
11
will jointly own the intellectual property rights related to the formulations and we expect to jointly commercialize successful formulations.
Bio-Succinic Acid Based Bioplastics
Bio-Based PBS/PLA Resins for Food Service Applications. We have partnered with a leading producer of polylactic acid (PLA), a biodegradable polyester. We have been jointly developing and bringing to market a new family of bio-based compounded PBS/PLA resins, which are initially designed for food service applications.
Bio-Based PBS for the Automotive Industry. We have been collaborating for several years with a leader in automotive interiors. The goal of the collaboration was to develop succinic acid based polyesters that could be combined with natural fibers and other proprietary ingredients into lightweight composites that could be used to make injected molded parts for automobile interiors. The automotive parts company intends to commercialize this technology and has established a partnership with Mitsubishi Chemical, whereby we will supply bio-succinic to Mitsubishi Chemical and the automotive parts company will source PBS from Mitsubishi Chemical for the subsequent manufacture of its proprietary composites.
Organic Composite Boards. We have been collaborating with a sustainable construction products designer and manufacturer to incorporate succinic acid polyesters into organic composite boards. These boards could replace medium density fiberboard, offering superior strength without formaldehyde. We have signed an exclusive supply agreement whereby we supply the composite board company with succinic acid based polyester, which we source from Mitsubishi Chemical.
Bio-Succinic Acid Based Salts
De-icers. We have been working with a company engaged in the development and marketing of chemical solutions, to develop an innovative bio-based airport runway de-icer, which we expect will be commercialized through our collaborator’s existing marketing channels. We have also entered into a collaborative arrangement with a company engaged in the development, production and sale of deicer formulations, to develop formulations based on our proprietary succinate salt compositions to be used as a bio-based, non-toxic and biodegradable deicers for roadway, consumer and windshield washer applications. We will supply the bio-succinic acid and jointly own with our partner the intellectual property rights related to the formulations. We intend to work together to commercialize successful formulations.
Heat Transfer Fluids. We are collaborating with a leading manufacturer and distributor of oenological products, to develop a formulation based on succinate salts to be used as a heat transfer fluid in the production of wines. Our collaborator is completing the development and testing of such formulation based on the succinate salts, and, if the development of the formulation is successful and our collaborator commercializes the formulation, we expect to enter into a supply agreement with our collaborator for a five year period governing the sales of bio-based succinic acid or the salts. We will also jointly own the intellectual property rights related to the further development made on these salts.
Other Succinic Acid Based Polyesters. In addition to our work on PBS, we have explored succinic acid in combination with other alcohols and monomers. We are evaluating the performance of these polymers in broad applications such as automotive, adhesives and packaging. These materials are complimentary to PBS and we believe the addressable market for all succinic acid based polyesters, blends and composites, is approximately $2 billion.
12
Existing Markets for Derivatives of Bio-Succinic Acid
In an effort to expand the addressable markets for our bio-succinic acid, we secured catalyst technology from DuPont in 2010 that allows us to convert our bio-succinic acid into “drop-in” 1,4 BDO, THF and GBL, which together represent existing chemical markets with annual sales in excess of $4.3 billion. We subsequently established an exclusive partnership with Evonik, a global leader in catalyst development, to optimize the DuPont catalysts and further improve their performance and economics. Since then, we have established several relationships with the goal to commercialize value-added derivatives of 1,4 BDO, THF and GBL. The figure below illustrates value-added derivatives we have targeted.
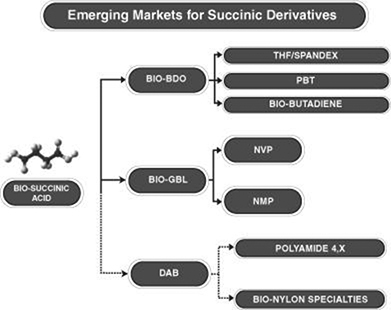
Bio-Based 1,4 BDO
Spandex. We have established a collaboration with a global leader in the manufacture and distribution of spandex fibers, and our collaborator has tested our bio-based 1,4 BDO in the production of bio-spandex. We are currently assessing opportunities for joint production of bio-based 1,4 BDO, from which our collaborator would off-take a portion of the BDO produced for its bio-spandex needs.
Polyesters including PBT. We have been collaborating with several manufacturers of PBT, a heat resistant polymer used widely in automotive and electronic applications. We expect to sell our bio-based 1,4 BDO to these companies for the subsequent manufacture of bio-based polyesters.
Butadiene. Butadiene is used in the production of synthetic rubber and we estimate that the market for butadiene is approximately $14.5 billion. However, we do not believe that in the current environment of low oil prices and relative low butadiene prices that BDO is a cost effective feedstock for making butadiene.
N-Vinyl-Pyrrolidone (NVP)
NVP is used in the production of specialty polymers. We have established a collaboration with a specialty chemicals company to develop a new technology that would allow the production of a bio-based NVP from our bio-succinic acid. Our collaborator has identified a large addressable market for NVP in oil and gas drilling, using proprietary technology. The collaboration involves a three-phased development program with the goal of constructing a large-scale plant to produce NVP products using jointly developed NVP technology.
13
Diaminobutane (DAB)
1,4 Diaminobutane, or DAB, is an intermediate used in the production of Nylon 4,6 and other high performance polyamides. These materials have a higher crystallinity and temperature performance than Nylon 6,6 and can be injection molded and extruded into fibers, tubes, and hoses. They are used in components for computers, mobile phones and personal electronics as well as in electrical applications such as connectors, circuit breaker housings, micro-switches and electric motor parts. We are in discussion with several potential partners that are producers of high performance polyamides. We believe the addressable market for DAB is approximately $500 million.
Our Technology
Our proprietary technology platform combines commercial scale industrial biotechnology and chemical catalysis to convert renewable feedstocks into chemicals that are cost-competitive replacements for petroleum-derived chemicals. We are developing three distinct technologies:
|
• |
the production of succinic acid through fermentation; |
|
• |
the conversion of succinic acid into 1,4 BDO, THF and GBL by catalyst assisted hydrogenation reaction; and |
|
• |
the production of adipic acid and other C6 chemical intermediates through fermentation and purification with or without catalytic conversion. |
Succinic Acid Production
Our process is based on the fermentation of sugar using a proprietary yeast organism to produce bio-succinic acid. Following separation and purification, bio-succinic acid, in its finished form, is a white crystal that physically resembles table salt. Two ways to produce bio-succinic acid through fermentation are using a bacterium, such as E. coli, or using yeast. Our process initially used E. coli, however, we have transitioned to yeast. We have been using a proprietary E. coli bacterium that is under exclusive license from entities funded by the DOE. From 2005 to 2010, we scaled up our proprietary E. coli technology in a series of steps, from a 1,000 liter fermenter in 2005, moving to a 10,000 liter fermenter in 2007, and an 80,000 liter fermenter in 2008. From 2010 until the end of 2014, we produced bio-succinic acid in a 350,000 liter fermenter located in a toll manufacturing facility in Pomacle, France.
One disadvantage of using bacterium like E. coli is that bacterium produce succinic acid in a salt form as opposed to an acid form. This has two negative consequences: (1) it requires energy to acidify the succinic acid (split the salt); and (2) it generally leads to additional processing steps, which in turn lead to higher capital and operating costs. Another disadvantage of bacterium relative to yeast, is the risk of contamination that can significantly reduce fermentation performance. E. coli are also limited in terms of fermenter size relative to yeast due to sensitivity to pH, agitation, process disruption and contamination.
Given the limitations of E. coli described above, in 2010 we signed a license with Cargill granting us exclusive rights to their yeast platform for the production of bio-succinic acid that could offer lower capital costs and lower operating costs. Cargill had developed a proprietary yeast host that is very robust and capable of thriving in harsh fermentation conditions, including high tolerance to organic acids such as succinic acid, good tolerance to low pH, physical robustness to heat, agitation and processing, high glycolytic rates and the ability to grow in a simple medium with inexpensive nutrients. Cargill has a patent portfolio to protect its yeast platform.
We worked with Cargill for over three years to develop our yeast and reached the final development milestone in the fall of 2013. Working with Cargill, we sequentially scaled up our yeast at the 20 liter, 600 liter, 2,000 liter and 180,000 liter scale, and we have seen the same performance (measured as succinic acid production over time) for our yeast at each successive size of fermenter. We have also validated the production process we plan to run in Sarnia, Ontario both at small-scale and at the large-scale demonstration facility in Pomacle, France. We have seen that the succinic acid we produce with our yeast offers improved quality compared to succinic acid produced using our E. coli bacterium, with fewer impurities.
The figure below summarizes the performance of a production strain of our E. coli bacterium, an earlier development strain of our yeast, and a production strain of our yeast that we have developed for use at our facility in Sarnia, Ontario. The figure also highlights the improved general performance of yeast relative to E. coli bacterium.
14
The development strain of our yeast was engineered and tested at small scale in the fall of 2012, while the production strain of our yeast was engineered and tested at small scale in early 2013. Both strains were tested in the large scale demonstration facility in Pomacle, France in the first quarter of 2013. The dotted line in the graphic below indicates the succinic acid concentration that was originally targeted for the commercialization of our yeast.

In the fall of 2013 we announced that we had achieved the final milestone of our yeast joint development program with Cargill. Our yeast had met the performance targets that we set out when we initially licensed the technology, and was ready for commercial use. The Sarnia plant under construction has been designed to operate with this yeast.
Our yeast produces succinic acid at a low pH, so that there is very little base added during the fermentation. This results in reduced energy consumption and a simplified purification process. Yeast also gives us the ability to use larger, less complex fermenters relative to E. coli, leading to significantly lower capital intensity. Our Sarnia plant has been designed to operate the yeast. We are continuing to make improvements to our yeast to further improve its performance and reduce the cost of production and the capital intensity of future plants.
1,4-BDO / THF / GBL Production
We utilize catalyst technology licensed from DuPont to transform our bio-succinic acid into bio-based 1,4 BDO, bio-THF and bio-GBL. The process involves passing bio-succinic acid and hydrogen gas into a fixed bed reactor over a heterogeneous catalyst, converting the bio-succinic acid into a mixture of bio-based 1,4 BDO, bio-THF and GBL, followed by distillation to separate, purify and recover the bio-based 1,4 BDO, bio-THF and bio-GBL. The relative concentrations of these three products can be modified by adjusting the reaction conditions.
We have partnered with Evonik, a world leader in catalyst manufacturing, to scale up the catalyst compositions under license from DuPont using bio-succinic acid as a starting material. Evonik is assisting us in the optimization of the catalyst and its manufacturing scale-up. It is important for catalyst production to be scaled-up in parallel to the scale-up of the 1,4 BDO process, to ensure that adequate catalyst is available at an acceptable cost. In the spring of 2012, we produced several tons of 1,4 BDO and THF at a toll manufacturing facility in Germany, using bio-succinic acid produced in our French demonstration plant and a catalyst produced by Evonik. The bio-based 1,4 BDO we produced was sent to over 20 potential customers. These companies found the purity to be equivalent to petroleum derived 1,4 BDO and they were able to successfully produce their products (PBT, polyurethanes) with our bio-based 1,4 BDO.
15
Adipic Acid and Other C6 Intermediates
We have licensed worldwide, exclusive rights to a metabolic pathway that transforms sugar into a family of value-added products, including adipic acid, caprolactam, HMDA, caprolactone and hexanediol. The patents covering this pathway have been issued in the United States and Europe and are pending in a number of other jurisdictions. We believe this pathway has the advantage of offering a good yield on sugar, relative to alternative routes to these products, and having several products that can be derived from a common pathway.
We are currently focused on the development of adipic acid, which allows us to leverage our experience in producing and scaling up succinic acid, including our experience with our yeast. We have secured an exclusive, worldwide license from Cargill to use their proprietary low pH yeast platform to produce adipic acid.
Technology Partnerships
We have developed our succinic acid, BDO/THF/GBL and C6 platforms through open innovation—using partnerships and licenses to access the best available technologies, facilities and know-how. We have complemented these third party contributions with in-house development efforts, integrating the whole into competitive platforms. The use of open innovation has reduced the capital and operating costs of development and accelerated our development efforts. This approach to technology development contributed to our winning the 2011 ICIS Innovation Award, which recognized our use of open innovation to develop our succinic acid platform. Our principal technology partnerships are summarized below.
ARD
In September 2010, we entered into two agreements with Agro-Industrie Recherches et Développements, or ARD, to cover a two-part consecutive plan for our exclusive use of the large-scale demonstration facility in Pomacle, France. These agreements ended at the end of 2014. Under the first agreement we developed a work plan with ARD to improve the manufacturing efficiency of the French demonstration plant, improve the purity and quality of the product, meet certain target usage factors and implement quality control procedures. We compensated ARD for labor costs, the full cost of producing successful batches of bio-succinic acid and the partial cost of lost batches. Once these objectives were met, we entered into a toll manufacturing agreement pursuant to which we retained ARD to produce succinic acid in this facility exclusively. During the course of this agreement, we compensated ARD per metric ton of product, a price that was calculated by multiplying the cost of raw materials and utilities by agreed quantities consumed per metric ton of succinic acid produced. We also paid labor fees and half of any additional capital investments and equipment leasing. We exercised options to renew the toll manufacturing agreement for three successive six-month periods ending December 31, 2014. Pursuant to the renewal terms, we secured 60% of the capacity at the large-scale demonstration facility in Pomacle, France and paid, in addition to the variable and labor costs that we had been paying to date, a portion of the annual depreciation of the plant. As planned, the toll manufacturing agreement ended in December 2014 and we ceased to have access to the demonstration plant. We have built up sufficient inventory levels so that we can manage the transition from the French toll production to manufacturing in our Sarnia facility, which we expect to be in mechanically complete in the second quarter of 2015.
Cargill
In April 2010, we entered into a commercial license agreement with Cargill Inc., or Cargill, pursuant to which Cargill granted to us an exclusive, worldwide, royalty bearing license, with a limited right to sub-license, to use certain patents that cover our yeast strain to be used in our fermentation process at our Sarnia facility under construction. We agreed to pay Cargill a royalty based on net sales of our products, but in no event less than a minimum annual royalty payment if we wish to maintain our exclusive license. If royalties based on net sales are below the minimum annual royalty payment we may elect to pay the difference. If we elect not to pay the difference in any one year, Cargill may transform the exclusive license granted to us under the agreement to a non-exclusive, worldwide, royalty-free license. This is a long-term agreement that renews automatically, unless previously terminated.
Concurrently with the commercial license agreement, we entered into a development agreement with Cargill for a term of four years. Under the development agreement, Cargill had further developed our yeast for use in producing bio-succinic acid. We made an initial payment to Cargill and agreed to pay Cargill certain fixed amounts per year for each full-time equivalent person to perform under the agreement in accordance with a work plan. In addition, we had agreed to make certain payments to Cargill upon reaching various milestones. The first milestone was a proof of concept milestone that was reached in May 2011. The second milestone related to a performance target and was met in the second quarter of 2012. The final milestone related to completion of our yeast’s development was achieved in the third quarter of 2013. The results stemming from the development work under the agreement are licensed to us pursuant to the commercial license agreement. To the extent Cargill exits the development agreement, we believe we have the rights necessary to perform the work ourselves. We also have an option under the development and license agreements to further develop our yeast so that it can consume ligno-cellulosic, non-food feedstocks.
16
In May 2012, we secured an exclusive, worldwide, royalty-bearing license from Cargill to use certain patents that cover Cargill’s yeast for the production of adipic acid. In addition to the license, we were granted the option to further develop Cargill’s yeast so that it can consume ligno-cellulosic and non-food feedstocks, as well as the option to secure rights to the yeast for the production of caprolactam, HMDA, caprolactone and hexanediol. We have begun a research and development program under which Cargill has provided assistance in metabolically engineering its yeast to produce adipic acid. This is an early stage research and development program and there is no assurance of its successful development, scale-up or commercialization.
Celexion
In September 2010, we entered into a technology license agreement with Celexion. Under the agreement, we have an exclusive, worldwide, royalty bearing license to develop, make, use or sell certain C6 derivatives, including adipic acid, hexamethylene diamine and hexanediol, under patent applications in the United States and certain foreign countries held by Celexion that describe metabolically engineered host cells for producing difunctional alkanes and methods for producing difunctional alkanes. Under the agreement, we are obligated to pay Celexion a low single digit percentage royalty based on net sales of the products, or in circumstances in which we sublicense the technology, a royalty equal to a percentage of compensation received by us as a result of the sublicense. We are also obligated to make certain payments upon achieving various milestones under the agreement. The term of the agreement runs until the later of September 2025 or expiration of the last-to-expire licensed patents. This is an early stage research and development program and there is no assurance of its successful development, scale-up or commercialization. Further under the terms of the agreement, Celexion has been carrying out experimental work on our behalf relating to enzyme activity and selectivity in connection with the licensed patents in exchange for certain annual, milestone and royalty payments.
DuPont
In June 2010, we entered into a license agreement with DuPont under which DuPont granted us worldwide sub-licenses and licenses to catalyst technology to develop and commercialize the hydrogenation of our bio-succinic acid to produce bio-based 1,4 BDO and/or bio-THF. Under the agreement, we will own all rights, title and interests to any improvements to the sub-licensed patents discovered or developed by us during the term of the agreement to the extent that such improvements are not incorporated in DuPont’s technology. In consideration of these rights, we made an initial payment to DuPont and pay a low single-digit percentage royalty to DuPont based on a percentage of net sales of products manufactured at plants built and operated by us or plants in which we own a controlling interest, although no royalties are paid on sales of certain products to DuPont. A minimum amount of royalties must be paid to DuPont each year to maintain the non-exclusive rights granted to us in the agreement. Under the agreement, DuPont has the option to secure a portion of the bio-based 1,4 BDO and/or bio-THF we produce using DuPont’s catalyst technology through an off-take agreement with our future manufacturing facilities.
Evonik
We are partnering with Evonik Industries AG, or Evonik, a world leader in catalyst manufacturing, to jointly develop improved and/or new catalysts to be used in the conversion of bio-succinic acid into 1,4 BDO, bio-THF and/or bio-GBL. We have also entered into arrangements with Evonik pursuant to which Evonik will supply us, on a long-term basis, with selected catalysts to be used in the conversion of bio-succinic acid into 1,4 BDO, bio-THF and/or bio-GBL.
National Research Council of Canada
We are partnering with the National Research Council of Canada, the Government of Canada’s premier organization for research and development, and with the INRS, a Canadian university dedicated to fundamental and applied research, to develop an organism that can consume methanol or methane for the production of bio-succinic acid. We began this relationship in November 2012 and the project is ongoing.
NatureWorks (AmberWorks LLC)
In February 2012, we entered into a series of agreements with NatureWorks LLC to create AmberWorks LLC, a 50/50 joint venture formed for the purpose of developing and bringing to market a new family of bio- based compounded modified PBS/PLA, or mPBS, resins grades, initially designed for food service applications. Under the technology license agreement, we provided AmberWorks with a non-exclusive worldwide license to use certain mPBS/PLA compounding intellectual property owned by our wholly-owned subsidiary, Sinoven. In addition, under the technology license agreement NatureWorks provided AmberWorks with a non-exclusive worldwide license to use certain patents owned by or licensed to NatureWorks. Under the exclusive distribution agreement, NatureWorks was also granted the rights to exclusively market, promote and sell the products produced by the joint venture. Each of NatureWorks and Sinoven made equal initial cash contributions in order to finance the initial operations of
17
AmberWorks. We have put our AmberWorks joint venture on hold until the Sarnia plant is commercializing succinic acid and the PTTMCC plant in Thailand is purchasing our bio-succinic acid and commercializing bio-based PBS.
UT-Battelle, LLC and UChicago Argonne, LLC
In July 2009, we entered into an exclusive commercial patent license agreement with UT-Battelle and UChicago Argonne, each of which are entities that manage and operate laboratories under contracts with the DOE. Under the agreement, we have an exclusive commercial license to patents that cover the E. coli microorganism that we use in our manufacturing process. The license is limited to use in the production of bio-succinic acid using the bacterium covered by the licensed patents, and is subject to certain government rights, as well as licenses that UT-Battelle and UChicago Argonne may grant outside our field of use and/or for non-commercial purposes. Under the agreement, we pay all fees, patent maintenance and filing costs. In addition we are obligated to pay running royalties calculated as a price per metric ton of bio-succinic acid sold, or if we sublicense the patents, a royalty equal to the greater of a price per metric ton of bio-succinic acid sold or a single-digit percentage of sublicensing revenues. We are obligated to pay a minimum annual royalty per accounting period to the extent that running royalties and sublicensing royalties do not exceed an agreed upon fixed amount. We also have limited sub-license rights. We also agree to invest in the development of technology and market for bio-succinic acid in accordance with a development and commercialization plan. Unless terminated sooner, the term of the agreement runs until the expiration of the last-to-expire licensed patents, which is 2024.
Intellectual Property
Our success depends in large part upon our ability to obtain and maintain protection for our proprietary technologies and to operate without infringing the intellectual property rights of others. We primarily protect our intellectual property in the United States, Europe and certain other jurisdictions through a combination of patents and patent applications on inventions, trademark protection on our product names and trade secret protection as we deem appropriate. We also seek to ensure a competitive position through several partnership, joint development and joint venture agreements.
We own or have rights in patents and patent applications directed to various aspects of our business. With regard to our fermentation process we have in-licensed rights to three U.S. patents and counterpart patents in Canada, Europe and other countries directed to our E. coli organism and to methods of producing succinic acid. The U.S. patents are scheduled to expire from 2015 to 2021 and patents that have been issued outside the U.S. are scheduled to expire from 2016 to 2024. Our licensing agreement with Cargill gives us access to six existing patent families covering topics such as methods and materials for the production of organic products including organic acids using genetically-modified yeast species to fermentation process optimization. Patents resulting from these six patent families are scheduled to expire from 2019 to 2026. Our collaboration with Cargill has also generated three international patent applications licensed to us or owned by us that are directed to the production of succinic acid. Patents, if granted on these patent applications, would expire in 2031 and 2033.
With regard to the purification of bio-succinic acid and other dicarboxylic acids produced by fermentation, we own three U.S. patents, nine granted patents in Europe and other countries directed to processes for producing succinic acid, adipic acid, and other di-carboxylic acids, or their ammonium salt forms from fermentation broths. U.S. patent to this purification technology is scheduled to expire in 2031 onwards. For the conversion of bio-succinic acid to bio-based 1,4 BDO, we have in-licensed five U.S. patents from DuPont that are scheduled to expire from 2017 to 2022, and we own two U.S. patents, one U.S. patent applications, and counterpart patent applications in Europe, Canada, and in other countries directed to the conversion of bio-succinic acid to 1,4 BDO. Our two U.S. patents to the conversion of bio-succinic acid to bio-based 1,4 BDO are scheduled to expire in 2031 and patents, if granted, on our pending patent applications to this technology could expire in 2031. In addition, we own one international patent application, four U.S. patent applications, and counterpart patent applications in Europe, Canada, and in other countries directed to the conversion of bio-succinic acid to other compounds such as diaminobutane, succinic dinitrile, succinamide, and pyrrolidones. Patents, if granted on these applications, could expire in 2031. We also own or have rights in patents and patent applications directed to the use of succinic acid and succinic acid salts. For example, we own a U.S. granted patent and a Canadian granted patent directed to deicing compositions. Those patents are scheduled to expire in 2029.
BioAmber re-branded in November of 2014. At that time we commissioned the creation of a new trademark, which included our stylized name and “infinity” logo. Protection for the logo and composite trademark (name & logo) in association with chemicals for industrial purposes, namely, organic acids, difunctional alkanes, organic salts, and derivatives were sought in the United States as well as internationally in the jurisdictions of China, Japan, South Korea, European Union, Switzerland, India, Mexico, Turkey, Canada, Thailand, Taiwan and Brazil.
We still maintain our trademarks for our C4 and C6 technology platform, including BIO-SA (bio-based succinic acid), BIO-AA (adipic acid), BIO-BDO (1,4-butanediol), mPBS and BIOmPBS (modified polybutylene succinate), BIOGBL and BIOTHF (gamma-butyrolactone and tetrahydrofuran).
18
We also protect our proprietary information through written agreements. Our employees, consultants, contractors, partners and other advisors are required to execute nondisclosure and assignment of invention agreements upon commencement of employment or engagement. In addition, we protect our proprietary information through written confidentiality agreements with outside parties who may be exposed to confidential information.
Our Feedstock Strategy
Our yeast can use a range of renewable feedstocks as a source of fermentable “sugars” including glucose (also called dextrose) from corn, wheat, tapioca and other starch sources, sucrose (also called sugar) from cane or beets, and ligno-cellulosic sugars containing significant quantities of xylose derived from agricultural and forestry waste. Given the small quantity of fermentable sugars that we require to produce bio-succinic acid, we have initially used commercially available 95% dextrose syrup, which we believe to be the most cost competitive source of fermentable sugars today. As ligno-cellulosic sugar technologies mature and become commercially available at competitive prices, our plan is to shift to non-food fermentable sugars.
At the demonstration plant in France, the source of fermentable sugars came from the hydrolysis of starch obtained from a wheat wet mill located adjacent to the plant. At our planned facility under construction in Sarnia, Canada, our fermentable sugars will come from corn wet mills. 95% dextrose corn syrup is an intermediate product in the production of high fructose corn syrup and is readily available on the open market. We have entered into a multi-year glucose supply agreement for our planned facility in Sarnia.
We would require less than 0.4% of the 12.4 billion bushels of corn harvested in the United States in 2012 to produce $1.0 billion worth of bio-succinic acid, based on management estimates and our projected selling price for succinic acid. We would require less than 0.3% of the 19.2 billion pounds of high fructose corn syrup produced in North America in 2012 to operate our Sarnia facility at full capacity under construction (30,000 tons per year). Given our modest demand for fermentable sugars and our multi year supply agreement with a corn wet miller, rapid growth in our production capacity will not have a material impact on the market from which we plan to source. This is in sharp contrast to first-generation ethanol, which is a major consumer of corn.
While we do not have a near-term economic incentive to move to non-food fermentable sugars, we recognize the growing need to focus the food chain on human nutrition, and to use sustainable, non-food, sources of biomass to produce chemicals and materials. As such, we plan to move to non-food fermentable sugars when they become commercially available and economically viable. We will pursue three strategies to achieve this goal: (i) incorporate Cargill’s proven technology into the succinic acid producing yeast, so that it can consume ligno-cellulosic sugars efficiently at low pH; (ii) actively screen ligno-cellulosic sugar technologies to determine which are best adapted to our technology (our yeast and purification process) and have the most competitive cost structure; and (iii) develop a next-generation organism that can consume methanol or methane as the source of carbon to produce succinic acid. This would allow us to use alternative feedstocks such as syngas.
Our Approach to Sustainability
We are committed to managing our economic, social, environmental and ethical performance through continued sustainable business practices. Bio-based chemicals as a foundational technology offer the potential to significantly reduce greenhouse gas emissions, energy use, and fossil fuel consumption by displacing chemicals derived from fossil resources. Environmental impact is measured by the life cycle analysis, or LCA, of the bio-based chemical production process. LCA results for bio-based chemicals and products have grown in importance in recent years as a distinct measure of impact relative to petrochemical production processes. Investors and corporate partners are interested in life cycle results as an evaluation of a conversion technology’s environmental performance. Customers, including large global chemical and consumer companies are interested in LCA results as they strive to meet or exceed their sustainability targets, and meet growing consumer demand for greater transparency and more sustainable products.
Manufacturing Operations
Scale-Up History
From the late 1990s to 2005, our first generation E. coli organism was developed and optimized in the lab through a combination of molecular biology and fermentation development. This work was undertaken primarily at DOE sponsored labs (UT-Battelle and UChicago Argonne), the licensors of the E. coli. In parallel to this work, we worked on purification approaches in-house and through collaborations with Michigan State University and the Lulea University of Technology in Sweden.
19
In 2005, we began working with ARD on the progressive scale up of the E. coli technology, which involved running fermentations in increasingly larger vessels and testing and adapting the fermentation conditions and the purification process as needed to obtain the desired product purity and manufacturing costs. The process we use today in the ARD owned demonstration plant in France was scaled up in a series of progressive steps, starting with a 1,000 liter fermenter in 2006, moving to a 10,000 liter fermenter in 2007, and an 80,000 liter fermenter in 2008. We have operated 180,000 and 350,000 liter fermenters at the large-scale demonstration facility in Pomacle, France since January 2010. At the 350,000 liter scale, we believe we operated one of the largest bio-based manufacturing fermenters in the world and did so for five years, gaining valuable experience and data.
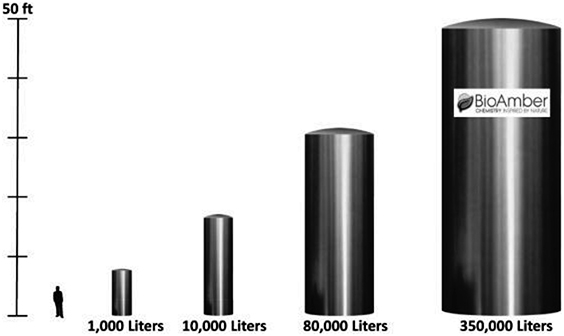
|
* |
graphic approximately to scale |
Our operating history of running large-scale batch fermentation and continuous purification has enabled us to:
|
• |
validate our process in terms of both cost-effectiveness and product quality; |
|
• |
identify and implement process improvements at large scale; |
|
• |
incorporate these process improvements into our engineering basic design package; and |
|
• |
minimize scale-up risk for our future manufacturing facilities. |
Our strategy is to build and operate additional manufacturing facilities that have economies of scale and are able to use multiple feedstocks to produce value-added products. Our proprietary technology platform allows us to maintain lower capital and operating expenses, given that:
|
• |
there are very limited byproducts, which tend to be costly to handle, store, purify and dispose; |
|
• |
our process is less energy-intensive than other bio-processing approaches; |
|
• |
our fermentation operates at low pH and is feedstock-flexible; and |
|
• |
our integrated process can make multiple products, including bio-based 1,4 BDO, THF and GBL. |
We intend to select future facility locations strategically, based on proximity to feedstock and chemical manufacturing infrastructure, as well as distribution costs and proximity to customers.
Pomacle, France
We produced bio-succinic acid at a large-scale demonstration facility in Pomacle, France, which is owned by ARD and was built at a reported cost of €21.0 million. The facility is integrated into an existing bio-refinery that supplies the bio-succinic acid plant with glucose, carbon dioxide, steam, ammonia and process water. Our toll manufacturing agreement with ARD for the use of the facility expired in December 2014.
20
We currently sell directly to our customers and commercial partners as well as indirectly through Mitsui and other distributors. Mitsui is assisting us in selling bio-succinic acid and pre-marketing bio-based 1,4 BDO. Mitsui is one of the world’s largest general trading companies, with a broad presence in the global chemicals market. Mitsui provides know-how regarding shipping and logistics, warehousing, credit checks, freight insurance, and trade finance that facilitate sales in Asia, and brings additional credibility to our customers in Asia.
Sarnia, Ontario
Our planned facility under construction in Sarnia, Ontario is being built on land we own and is located within a bio-industrial park owned by Lanxess. The site is co-located in a large petrochemical hub with existing infrastructure that facilitates access to utilities and certain raw materials and finished product shipment, including steam, electricity, hydrogen, water treatment and carbon dioxide. The facility will ferment at approximately the one million liter scale (representing an approximately three times scale up compared to the fermenter size in Pomacle, France), have initial capacity of approximately 30,000 metric tons of bio-succinic acid and is expected to be mechanically complete in the second quarter of 2015, and we initiated commissioning and start-up activities in the facility in March 2015. We anticipate that this facility will ramp up to full capacity over a three year time frame.
In November 2011, we entered into a joint venture agreement with Mitsui to finance and build our planned facility in Sarnia, Ontario through BioAmber Sarnia, a joint venture 70% owned by us and 30% owned by Mitsui. The joint venture agreement also established the parties’ intent to build and operate an additional facility in the future. In connection with the joint venture, Mitsui agreed to provide know-how regarding shipping and logistics, warehousing, credit checks, freight insurance, trade finance globally and will facilitate sales in Asia to key accounts. We have licensed our technology to the joint venture, and we provide application development and technical sales support, as well as hiring and training Sarnia plant personnel.
We expect to retain full operational control of the planned facility currently under construction in Sarnia and are not restricted from developing other applications outside of the joint venture on the premises. The construction of our planned facility is expected to cost approximately $125.0 million and we expect the funding to come from available cash, a portion of the net proceeds of our initial public offering, our follow-on offering completed in July 2014, equity contributions from Mitsui, government grants and loans. To date, we have secured a total of CAD $72 million from various agencies and government programs in the form of interest-free loans, low interest loans, project financing and grants. The Sarnia plant could be subsequently expanded to produce another 20,000 metric tons of bio-succinic acid.

(Sarnia facility under construction)
21
Government Grants and Loans and Commercial Institutions Loans Related to Sarnia Facility
BioAmber Sarnia, our joint venture entity with Mitsui that will build and operate the Sarnia plant, has received certain government grants and loans in connection with the construction of our planned facility. The grants and loans total CAD $72.0 million and are described below.
On September 16, 2011, BioAmber Sarnia entered into a contribution agreement with the Federal Economic Development Agency for Southern Ontario, or FEDDEV, pursuant to which FEDDEV has agreed to make a repayable contribution of up to CAD $12.0 million to construct our planned facility in Sarnia, Ontario. The contribution is interest free and requires repayment of principal from October 2015 to September 2020 in 60 monthly payments of CAD $0.2 million, according to the latest amended agreement from May 2014. The agreement contains a statement of work that requires BioAmber Sarnia to work towards reaching certain distinct project goals that relate to the physical construction of the facility and certain other objectives including addressing the growing global demand for bio-succinic acid and job-creation. A federal environment assessment was required as a condition of the loan. The final report was submitted to FEDDEV and approved in 2012. As of December 31, 2014, BioAmber Sarnia had received CAD $10.6 million.
On September 30, 2011, BioAmber Sarnia entered into a loan agreement with Minister of Economic Development, Employment and Infrastructure, or MEDEI, pursuant to which MEDEI has agreed to make available to BioAmber Sarnia a secured non-revolving term loan in principal amount of CAD $15.0 million in connection with the construction of our planned facility in Sarnia, Ontario. The loan is interest free for the first five years if BioAmber Sarnia is successful in creating an average of 31 jobs, calculated on an annual basis. Thereafter, the loan bears interest at an annual rate of 3.98%, or if BioAmber Sarnia is not successful in reaching the job target for the first five years, an annual rate of 5.98%. BioAmber Sarnia is also required to invest a minimum of $110 million between the Effective Date and the project Completion Date (March 31, 2015). If the expenditures are less than the required amount, a penalty is applied in the amount that the project expenditures fall short. The principal is required to be repaid in five annual equal installments from the sixth anniversary of the date of the disbursement of the loan. The loan is guaranteed by BioAmber Inc. and Mitsui & Co. (U.S.A.) and is secured by collateral including BioAmber Sarnia’s present and future accounts, inventory, equipment and other property including the land purchased from Lanxess on which the facility will be located. The loan also contains terms that require BioAmber Sarnia to work towards reaching certain project milestones that range from selecting an engineering and construction firm and beginning construction on the site through to commissioning the plant. As of December 31, 2014, BioAmber Sarnia had received CAD $7.25 million.
On November 29, 2011, BioAmber Sarnia entered into a contribution agreement with Sustainable Development Technology Canada, or SDTC, pursuant to which SDTC has agreed to grant BioAmber Sarnia up to CAD $7.5 million in connection with the construction of our planned facility in Sarnia, Ontario. The funds are payable in installments, the first CAD $1.9 million of which was paid upon execution of the agreement. The deliverable as defined under the first milestone which has already been met, included conducting site-specific engineering work and environmental assessments, and recruiting plant personnel. All subsequent installments are contingent on meeting certain deliverables as defined in three milestones, which was amended to four milestones in a modification to the Contribution Agreement dated December 18, 2014. This amendment also included an increase to the SDTC contribution from CAD $7.5 million to CAD $14.0 million.
SDTC advanced CAD $3.4 million (less a 10% holdback as provided in the contribution agreement) for purposes of the second milestone, part a), which was met as of December 31, 2014. Deliverables defined under the second milestone, part a) was re-engineering of the production process and plant design. BioAmber Sarnia received an amount of CAD $0.90 million for the second milestone, part b) defined as engineering site preparation and general contractor selection, which was fulfilled as of December 31, 2014. SDTC advanced CAD $2.4 million for the purpose of Milestone III as of December 31, 2014.
The third milestone is expected to be met by March 31, 2015 and includes the engineering, procurement of equipment and construction of the plant. The fourth and final milestone, expected to be met prior March 2016 includes commissioning, start-up and optimization of the facility.
On November 30, 2011, BioAmber Sarnia was issued a loan for CAD $0.5 million from the Sustainable Chemistry Alliance in connection with the construction of our planned facility in Sarnia, Ontario. The principal amount is repayable in 20 successive quarterly installments of CAD $25,000 each beginning upon the fourth anniversary of the funding. Interest is accrued at 5% per annum since October 1, 2013. Accrued interest will be payable upon the third anniversary of funding then quarterly thereafter. Under the debenture as amended on July 2014, BioAmber Sarnia covenants to, among other things, complete construction of the facility by March 31, 2015.
On March 10, 2014, BioAmber Sarnia entered into a repayable contribution agreement in the form of a non-interest bearing loan with the Minister of Agriculture and Agri-Food of Canada in the amount of CAD $10 million for the AgriInnovation Program. The
22
loan provides for progressive disbursements as eligible costs are incurred up to an amount of CAD $10 million, for building construction, installation of equipment and start-up and commissioning of the Sarnia facility. This loan is repayable in equal, monthly installments beginning March 31, 2016 through March 31, 2025. The loan agreement contains various legal and financial covenants ordinarily found in such government agency loan agreements. As of December 31, 2014, we have received CAD$7.3 million under this agreement.
On June 20, 2014, BioAmber Sarnia signed a loan agreement with a financial consortium, comprised of Comerica Bank, Export Development Canada and Farm Credit Canada for a senior secured loan in the principal amount of CAD $20.0 million. The loan will bear interest at a floating interest rate per annum based on the greater of (i) the Canadian prime rate and (ii) the Canadian dealer offered rate plus 1%, in either case plus an interest spread of 5%. There will be an initial interest-only period from draw down of the term loan until the first payment of principal. The loan’s principal will be repaid in 26 equal, quarterly installments beginning three months after the completion of the commissioning and start-up phase of the Sarnia plant, but at the latest on June 30, 2015. The disbursement of the loan, net of a 2.5% upfront loan fee, is subject to customary conditions, including continued progress on the construction of the Sarnia plant. Until drawdown of the CAD$20.0 million term loan, BioAmber Sarnia will pay a 1.0% per annum commitment fee on the undrawn amount. BioAmber Sarnia may prepay all or a portion of the loan outstanding from and after the date of the first principal repayment, without penalty.
BioAmber Sarnia’s obligations under the loan are secured by (i) a security interest on all of BioAmber Sarnia’s assets and (ii) a pledge of all the shares of BioAmber Sarnia. In addition, the Company will provide the lenders with a guarantee representing 70% of the secured obligations under the loan, and Mitsui & Co., Ltd. will provide a guarantee representing 30% of the secured obligations under the loan that is capped at CAD $6.0 million plus all accrued interest on the secured obligations and fees and expenses. The proceeds of the loan will be used by BioAmber Sarnia to complete the ongoing construction of the Sarnia Plant and fund its startup and commissioning. The loan agreement contains certain representations and warranties, financial covenants, affirmative covenants, negative covenants and conditions that are customarily required for similar financings, including in connection with the disbursement of the loan. There is no outstanding balance as of December 31, 2014.
Additional Planned Manufacturing Facilities
We plan to build an integrated manufacturing facility that will produce approximately 200,000 metric tons per year of bio-succinic acid and then transform the majority of the bio-succinic acid into 100,000 metric tons per year of bio-based 1,4 BDO, along with 70,000 metric tons per year of crystalline succinic acid. We have signed two 15 year take-or-pay agreements with Vinmar for 100% of the BDO output (100,000 metric tons per year) and 67% of the succinic acid output (50,000 metric tons per year) of this second planned facility. Vinmar plans to take a 10% equity stake in the plant. Mitsui could also be an equity partner in this second plant. Based on current estimates and assumptions, we expect this commercial scale manufacturing facility to have construction costs of approximately $500 million, and be mechanically complete in early 2018. As part of the succinic acid take-or-pay agreement, Vinmar has committed to purchase for 15 years, 75% of the output (150,000 metric tons per year) from a third manufacturing facility that would have an annual capacity of 200,000 metric tons of bio-succinic acid and which the Company plans to commission in 2020. As part of the BDO take-or-pay agreement, Vinmar has an option to secure 100% of the output from a fourth manufacturing facility that would produce 100,000 metric tons of BDO per year and would be commissioned in 2022 or 2023.
Research and Development
As of December 31, 2014, our research and development department activities funded an internal team of 35 scientists and engineers that were employed by us. We also work with partners, including Cargill and Evonik, to accelerate time to market and leverage existing know-how and infrastructure. Our technology development was initially focused on capabilities in fermentation engineering, analytical chemistry and molecular biology. We have more recently expanded our focus to include catalysis, purification process development and application development for bio-succinic acid.
Our net research and development expenditures were approximately $15.1 million, $16.6 million and $20.4 million for the years ended December 31, 2014, December 31, 2013 and December 31, 2012 respectively.
Competition
We expect our advanced bio-based specialty chemicals to compete with petrochemical equivalents that are proven in the market and manufactured by established companies, such as Gadiv Petrochemical Industries Ltd., Kawasaki Kasei, DSM and numerous small Chinese producers including Anqing Hexing Chemical Co. Ltd, and Anhui Sunsing Chemicals Co., Ltd. In addition, our products will compete against other companies in the bio-based specialty chemical industry, both early stage companies, such as Genomatica, Inc. (for bio-based 1,4 BDO) and Myriant Corporation (for bio-succinic acid), and established companies, such as Reverdia, a collaborative venture between DSM and Roquette Frères S.A. and Succinity, a collaborative venture between BASF and Purac (both for bio-succinic acid).
23
We believe that the primary competitive drivers include:
|
• |
price and production costs relative to both bio-based and petroleum-derived suppliers of our products; |
|
• |
capital requirements and access to capital, particularly in relation to our bio-based competitors; |
|
• |
feedstock and technology platform flexibility; |
|
• |
the ability to use yeast as opposed to a bacterium in the production of bio-succinic acid; |
|
• |
technology performance including overall yields and fermentation productivity relative to our bio-based competitors; |
|
• |
location and size of production facilities, which dictate raw material and utility prices and the economies of scale that can be achieved for capital expenditures, labor and maintenance; |
|
• |
drop-in and replacement capability for existing large markets; |
|
• |
the ability to rapidly scale-up production to large scale, produce meaningful volumes and offer customers reliable supply in qualified facilities; |
|
• |
the purity and quality of our products; and |
|
• |
the ability to refrain from being subject to price volatility and reliability of our feedstock supply. |
We believe we compete favorably with respect to all of these companies. With our yeast and our simple purification process, we are confident that we will be a cost competitive producer of high quality bio-succinic acid both relative to our bio-based competitors and existing petroleum producers. In addition to our technology advantage, we believe the size of our planned Sarnia plant currently under construction should also provide a cost advantage in terms of depreciation and fixed costs, given that our bio-succinic competitors operate plants that will all be less than half our annual capacity, and in the case of DSM-Roquette and Purac-BASF, one third the size of Sarnia. The location of our plant will also provide us with lower cost sugars and energy than in Southern Europe, where the DSM-Roquette and Purac-BASF plants are located.
Our first-to-market leadership in bio-succinic acid provided us with a lead-time advantage that we leveraged to secure customer relationships, enter into contractual agreements and establish partnerships for new succinic acid applications and derivative products. However, our competitors include large chemical companies that are better capitalized, with larger research and development departments and budgets, and well-developed distribution systems and networks for their products. These companies have relationships with our potential customers and have sales and marketing programs in place to promote their products.
With respect to our bio-based 1,4 BDO/THF/GBL, we believe we can compete with petroleum derived processes. We believe that the least expensive way to produce petroleum-derived BDO is by using an n-butane feedstock. We calculate that our technology to produce bio-based 1,4 BDO will require approximately 20% less capital expenditures than the n-butane-based process and will have comparable plant gate costs (variable costs, fixed costs and depreciation). As we scale-up our processes and our variable costs decrease, we believe our bio-based 1,4 BDO will cost approximately 10% less than the n-butane-based process in the future. Given the competitive cost structure of our bio-succinic acid, which will serve as the starting material for the production of bio-based 1,4 BDO/THF/GBL in our integrated production plants, we project that our full cost for bio-based 1,4 BDO will be situated in the bottom quartile of the cost stack for existing worldwide capacity.
We also believe that we will be cost competitive with other bio-based routes to 1,4 BDO due to the high yield on sugar that we gain from converting sugar to succinic acid. Our integrated process involves two steps: fermentation of sugar to produce succinic acid, followed by the catalytic conversion of succinic acid to 1,4 BDO, as opposed to a single step production that other companies, such as Genomatica achieve by directly fermenting sugar to 1,4 BDO. However, sugar is a significant component of variable cost in both processes, and the theoretical yield for the Genomatica one-step process requires roughly 50% more sugar than the theoretical yield of our two-step process. The term “theoretical sugar yield” with respect to these processes refers to the quantity of sugar obtained from the complete conversion of a feedstock in a chemical reaction under ideal conditions with perfect efficiency. Real-life processes inevitably incur processing losses and produce small quantities of by-products that reduce the overall yield on sugar, so that the actual yields are inferior to theoretical yields. Because there is approximately 24% weight loss during the conversion of bio-succinic acid to bio-based 1,4 BDO due to the production of water, the theoretical sugar yield for bio-based 1,4 BDO production is 85%, which is approximately 50% higher than the theoretical sugar yield for direct fermentation to 1,4 BDO.
We believe the cost competitiveness of converting succinic acid to BDO/THF/GBL is significantly reduced if the process is not integrated in a common production facility. If the succinic acid is produced and sold at arm’s length to a third party for subsequent conversion to 1,4 BDO, with a selling price that recovers the depreciation costs and an acceptable return on capital employed, the cost of the resulting 1,4 BDO is significantly higher and the production cost of the BDO is in our view not competitive. We believe that we are currently the only bio-succinic acid producer with an integrated technology for making both bio-succinic acid and bio-based 1,4
24
BDO. We recognize however, that BASF is the world leader in 1,4 BDO production and as such, could have the ability to integrate its bio-succinic acid production in its Purac joint venture, with its existing 1,4 BDO production in the future.
Regulatory Overview
We are subject to various international, federal, state and local regulatory laws, rules and regulations, including those relating to pollutant discharges into the environment, the management of hazardous materials, the protection of endangered species and the health and safety of our employees. For example, in the United States, the Occupational Safety and Health Act and analogous state laws and regulations govern the protection of the health and safety of employees. The Clean Air Act and analogous state laws and regulations impose obligations related to emissions of air pollutants, including greenhouse gases. CERCLA (Comprehensive Environmental Response, Compensation, and Liability Act) and analogous state laws and regulations govern the clean-up of hazardous substances. The Water Pollution Control Act, also known as the Clean Water Act, and analogous state laws and regulations govern discharges into waters. The TSCA and analogous state laws and regulations impose requirements on the production, importation, use and disposal of chemicals and genetically modified microorganisms.
In Canada, similar regulatory programs exist under the Canadian Environmental Protection Act (CEPA 1999). In particular, a regulatory program similar to TSCA requires that Environment Canada approve the manufacture of any chemical not already included on the Domestic Substances List (DSL). We have secured approval from Environment Canada for our use of E. coli and the manufacture of our bio-based succinic acid and the derivatives of succinic acid that we plan to commercialize. We also obtained the approval from Environment Canada with respect to the use of our yeast in 2013. If Environment Canada requires any of our future C6-based products, to undergo extensive testing, which we currently do not anticipate, securing approval to manufacture such products would potentially be subject to significant delays or costs. In the European Union, we are subject to a chemical regulatory program known as REACH (Registration, Evaluation, Authorization, and Restriction of Chemical Substances). Under REACH, we are required to register our products with the European Commission. The registration process requires the submission of information to demonstrate the safety of chemicals as used and could result in significant costs or delay the manufacture or sale of our products in the European Union.
In addition, we are or will be required to obtain, maintain or file various approvals, permits, licenses, registrations, certifications, intents to manufacture, environmental assessments and other requirements, such as air emission and water discharge permits, construction permits and boiler licenses. Such laws, regulations and permit conditions can result in substantial liabilities and the potential for permit revocations and plant shutdowns in the event we fail to comply with the applicable law, regulation or permit condition. The development of new processes, manufacture of new products using our processes, commercial sales of products produced using our processes, as well as geographic expansion, and in particular international expansion, will subject us and our industry partners to additional regulatory laws, rules and regulations. Finally, as we enter new markets such as the food, feed or cosmetic industries, we will be required to follow specific rules and regulations for these new applications.
The construction and operation of our production plants require obtaining permits and other approvals in various jurisdictions. For example, the production plant in Sarnia, Ontario, Canada required Certificates of Approval from the Ministry of Environment, an Environmental Assessment under the Canadian Environmental Assessment Act, approval of the organism under the Canadian Environmental Protection Act (CEPA 1999) and planning, construction, building, occupancy and fire permits from the City of Sarnia. Similar requirements are anticipated to apply in other countries where production plants are or may be planned. As a condition to granting the permits and other approvals, regulators could make demands that increase our partnerships’ construction and operating costs and result in the need to procure additional financing. Failure to obtain and comply with all applicable permits and other approvals could halt construction and subject us and our partners to future claims. We therefore cannot guarantee procurement or compliance with the terms of all permits and all other approvals needed to complete, and later continue to operate, our and our partners’ production plants. In addition to actual plant operations, liabilities could arise from investigation and clean-up of environmental contamination at our and our partners’ production plants. We and our partners may also be subject to third-party claims alleging property damage or personal injury due to the release of or exposure to hazardous substances.
In addition, new laws, new regulations, new interpretations of existing laws or regulations, future governmental enforcement of environmental laws or other developments could result in significant expenditures. For example, in 2009, the Environmental Protection Agency announced its “Essential Principles for Reform of Chemicals Management Legislation” and in April 2011, the Safe Chemicals Act of 2011 was introduced in Congress. This bill would amend TSCA to be more like REACH and require safety testing of all industrial chemicals and could result in the need to disclose confidential business information relating to chemical safety. We are monitoring this and other legislative and regulatory developments. Any failure by us or our industry partners to comply with applicable regulatory rules and regulations could harm our reputation as well as our business, financial condition and operating results. In addition, regulatory approvals, registrations, permits, licenses, certifications and other requirements may be denied or rescinded resulting in significant delays, additional costs and abandonment of certain planned activities or require us to engage in costly and time consuming efforts to remediate. Compliance with applicable regulatory rules and regulations can be costly and time consuming.
25
Employees
As of December 31, 2014, we had 74 full-time employees. Of these employees, 20 were engaged in research and development, 10 were engaged in sales and marketing, 18 were engaged in general and administrative activities and 26 were engaged in operations activities including engineering. 39 employees are based in Canada, 29 are based in the United States and the remaining six employees are located in Europe. We also employ other temporary staff across the organization to augment support for our employees. None of our employees are represented by a labor union. We have never experienced any employment-related stoppages and we consider our employee relations to be good.
You should carefully consider the risks described below and the other information in this Annual Report on Form 10-K. Our business, prospects, financial condition, or operating results could be harmed by any of these risks, as well as other risks not currently known to us or that we currently consider immaterial. If any of such risks and uncertainties actually occurs, our business, financial condition or operating results could differ materially from the plans, projections and other forward-looking statements included in the section titled “Management’s Discussion and Analysis of Financial Condition and Results of Operations” and elsewhere in this report and in our other public filings. The trading price of our common stock could decline due to any of these risks, and, as a result, you may lose all or part of your investment.
Risks Related to Our Business and Our Industry
We have a limited operating history, a history of losses, anticipate continuing to incur losses for a period of time, and may never achieve or sustain profitability.
We have only been in existence since October 2008 and, therefore, we have a limited operating history upon which you can base your evaluation of our business. As a result, any assessments of our current business and predictions you make about our future success or viability may not be as accurate as they could have been if we had a longer operating history. Since our inception, we have incurred substantial net losses, including net losses of $47.3 million for the year ended December 31, 2014, $33.8 million for the year ended December 31, 2013, and $39.5 million for the year ended December 31, 2012. We expect these losses to continue. We expect to continue to incur substantial costs and expenses related to the continued development and expansion of our business, including those related to the development, continuation and operation of our additional manufacturing facilities, research, testing and development of new products and the growth of our sales and marketing efforts. We will need to generate and sustain increased revenues in future periods in order to become profitable. We cannot assure you that we will ever achieve or sustain profitability on a quarterly or annual basis.
To achieve profitability, we need to execute our manufacturing expansion strategy, including the construction of our planned facility in Sarnia, Ontario.
We are currently building our first facility in cooperation with Mitsui in Sarnia, Ontario. We expect this facility to be mechanically complete in the second quarter of 2015, and we began commissioning and start-up in March 2015. We intend to build two additional facilities over the next five years. We have not yet operated a commercial-scale production facility, and our technology may not perform as expected when applied at the scale that we plan or we may encounter operational challenges for which we are unable to devise a workable solution. We can provide no assurance that our planned facility in Sarnia, Ontario will be completed on the schedule or within the budget that we intend, or at all. If the construction of our Sarnia facility takes longer than expected, or if we encounter unforeseen issues during construction, testing and operation, we will not be able to sell cost-competitive products within the timeline that we expect, or at all. We terminated our production at the French facility on December 31, 2014, as expected per the ARD agreement, and we estimate our inventory levels of bio-succinic acid as of December 31, 2014 to be adequate to meet expected customer demand during the time period when we are transitioning to our planned Sarnia facility. To the extent customer demand is greater than expected or our transition takes longer than expected, we may not be able to meet the demands of our customers and our customer relationships and commercialization growth may suffer.
Even if we successfully fund, construct and design our planned facility in Sarnia, Ontario, there is no guarantee that this facility will produce at full capacity, and even if we do meet these goals, we may encounter operational challenges for which we are unable to devise a workable solution or which may result in additional costs. In addition, our technology may not perform as expected when applied at our planned scale and any resulting adjustments to our process may result in additional costs or otherwise adversely affect our business and results of operations. To date, we have entered into agreements that contemplate, but do not obligate, us to supply approximately 47,000 metric tons of bio-succinic acid and its derivatives until the end of 2017, and we are actively seeking to enter into additional supply agreements. These supply agreements obligate our customers to exclusively fulfill their needs for bio-succinic acid from us, contingent on our ability to meet their price and other requirements, however there are no penalties in the event they do not purchase or we do not supply them with bio-succinic acid in the projected purchase volumes they have indicated in the agreements. Without increasing our production capacity by completing our Sarnia and other future facilities, we will not be able to
26
produce sufficient amounts of bio-succinic acid to deliver the full amounts contemplated by these agreements and execute on our growth strategy.
We have entered into a take-or-pay agreement with Vinmar which requires us to supply bio-succinic acid to them. In the event that we are unable to supply Vinmar reliability with succinic acid according to the terms of our agreement, due to production or quality issues other than a force majeur, we would incur financial penalties payable to Vinmar.
The funding, construction and operation of our future facilities involve significant risks.
We have limited experience constructing a manufacturing facility of the type and size required to produce commercial quantities of chemicals, and doing so is a complex and lengthy undertaking that requires sophisticated, multi-disciplinary planning and precise execution. The funding, construction and operation of manufacturing facilities are subject to a number of risks, any of which could prevent us from executing on our expansion strategy. In particular, the construction costs associated with future facilities may materially exceed budgeted amounts, which could adversely affect our results of operations and financial condition. We estimate the initial phase of the Sarnia, Ontario plant will cost approximately $125.0 million, and will be mechanically completed in the second quarter of 2015. However, we may suffer construction delays or cost overruns, which may be significant, as a result of a variety of factors, such as labor and material shortages, defects in materials and workmanship, adverse weather conditions, transportation constraints, construction change orders, site changes, labor issues and other unforeseen difficulties, any of which could delay or prevent the completion of our planned facilities. As a result, we may not be able to expand our production capacity and product portfolio as quickly as we planned. While our goal is to negotiate contracts with engineering, procurement and construction firms that minimize risk, any delays or cost overruns we encounter may result in the renegotiation of our construction contracts, which could increase our costs.
In addition, the construction of our facilities may be subject to the receipt of approvals and permits from various regulatory agencies. Such agencies may not approve the projects in a timely manner or may impose restrictions or conditions on a production facility that could potentially prevent construction from proceeding, lengthen its expected completion schedule and/or increase its anticipated cost. If construction costs, or the costs of operating and maintaining our manufacturing facilities, are higher than we anticipate, we may be unable to achieve our expected investment return, which could adversely affect our business and results of operations.
We may also encounter new design and engineering or operational challenges as we seek to expand the range of organisms and feedstocks we use. Any design and engineering or operational issues at our future facilities may result in diminished production capacity, increased costs of operations or periods in which our facilities are non-operational, all of which could harm our business, financial condition and results of operations. We intend to obtain and maintain insurance to protect against some of the risks relating to the construction of new projects. However, such insurance may not be available or adequate to cover lost revenues or increased costs if we experience construction problems, cost overruns or delays. If we are unable to address these risks in a satisfactory and timely manner, we may not be able to implement our expansion strategy as planned or at all. In addition, in the event that our products are defective or have manufacturing failures, we may have to write off and incur other charges and expenses for products that fail to meet internal or external specifications. We also may have to write off work-in-process materials and incur other charges and expenses associated with contamination and impurities should they occur.
Our failure to comply with milestone covenants contained in certain of our agreements, including certain debt instruments, government grants and government loans, could result in events of default, and if not cured, would require their accelerated or immediate repayment, in which case our assets and cash flow may be insufficient to make such repayments or fund our manufacturing expansion strategy.
The terms of our debt instruments require us to comply with various milestone covenants related to the construction and start-up of our planned facility in Sarnia, Ontario. A breach of any of these covenants could result in an event of default under one or more of these debt instruments which, if not cured or waived, could give the holders of the defaulted indebtedness the right to terminate commitments to lend and cause all amounts outstanding with respect to the indebtedness to be due and payable immediately. In addition, we are party to certain agreements with governmental entities that provide grants and loans in connection with the construction of our planned Sarnia facility. If we fail to meet any of the milestones and project goals contained in these grant and loan agreements, we may not receive additional grant installments, may be forced to repay grants received or the repayment of the loans may be accelerated. If additional government grant amounts are withheld or if we are forced to repay amounts under our government loans, our assets and cash flow may be insufficient to make such repayments or fund our manufacturing expansion strategy.
27
We have generated only limited sales of bio-succinic acid to date, are dependent on a limited number of customers and face challenges to developing our business.
To date, all our revenue has been derived from the sale of our bio-succinic acid through product and market development efforts related to our bio-succinic acid product, and we have not made sales of any other products. In order to generate sales of our bio-succinic acid and any future products, we must be able to reduce our production costs and produce sufficient quantities of our products, both of which are dependent on our ability to build commercial-scale manufacturing operations. If we are not successful in constructing and operating planned manufacturing facilities or otherwise increasing our manufacturing capacity, developing products that meet our customers’ specifications and further advancing our existing commercial arrangements with strategic partners, we will be unable to generate meaningful revenue from the sale of our products. In addition, we depend, and expect to continue to depend, on a limited number of customers for sales of our bio-succinic acid. During the year ended December 31, 2014, 47% our sales were to International Flavor and Fragrances, Inc., or IFF, Brenntag AG, or Brenntag and Olon Italy. During the year ended December 31, 2013, 64% our sales were to IFF, and Brenntag. In the future, a small number of customers may continue to represent a significant portion of our total revenue in any given period. We cannot be certain that such customers will consistently purchase our products at any particular rate over any subsequent period. A loss of, or any credit issues related to, any of these customers could adversely affect our financial performance.
We may not obtain the additional financing we need in order to grow our business, develop or enhance our products or respond to competitive pressures.
We will need to raise additional funds in the future in order to grow our business. Any required additional financing may not be available on terms acceptable to us, or at all. Our ability to secure financing and the cost of raising such capital are dependent on numerous factors, including general economic and capital markets conditions, credit availability from lenders, investor confidence and the existence of regulatory and tax incentives that are conducive to raising capital. Current turmoil and uncertainty in the financial markets has caused banks and financial institutions to decrease the amount of capital available for lending and has significantly increased the risk premium of such borrowings. In addition, such turmoil and uncertainty has significantly limited the ability of companies to raise funds through the sale of equity or debt securities. If we are unable to raise additional funds, obtain capital on acceptable terms, secure government grants or co-sponsorships for some of our projects or take advantage of federal and state incentive programs to secure favorable financing, we may have to delay, modify or abandon some or all of our expansion strategies.
The amount of any indebtedness that we may raise in the future may be substantial, and we may be required to secure such indebtedness with our assets and may have substantial interest expenses. If we default on any future secured indebtedness, our lenders may foreclose on the facilities securing such indebtedness. The incurrence of indebtedness could require us to meet financial and operating covenants, which could place limits on our operations and ability to raise additional capital, decrease our liquidity and increase the amount of cash flow required to service our debt. If we experience construction problems, cost overruns or delays that adversely affect our ability to generate revenues, we may not be able to fund principal or interest payments under any debt that we may incur.
Based on our current operating plan, we anticipate that the net proceeds of our public offerings, equity contributions from Mitsui, the loan from Tennenbaum Capital Partners LLP, or TCP, a combination of government grants, interest-bearing and interest-free loans and our existing cash and cash equivalents, will be sufficient to enable us to maintain our currently planned operations, including the funding of the construction of our planned facility in Sarnia, Ontario. We have no additional committed external sources of funds. Additional financing may not be available when we need it or may not be available on terms that are favorable to us. In addition, we may seek additional capital due to favorable market conditions or strategic considerations, even if we believe we have sufficient funds for our current or future operating plans. If adequate funds are not available to us on a timely basis, or at all, we may be required to halt construction or delay capital expenditures on our planned facility in Sarnia, Ontario, and reduce or delay operating expenses as deemed appropriate in order to conserve cash.
Any effort to sell additional debt or equity securities may not be successful or may not raise sufficient funds to finance additional facilities. The issuance of additional equity securities could result in dilution to our stockholders and the newly-issued securities may have rights senior to those of the holders of our common stock. If additional financing is not available when required or is not available on acceptable terms, we may need to delay, modify or abandon our expansion strategy and we may be unable to take advantage of business opportunities or respond to competitive pressures, which could have a material adverse effect on our offerings, revenue, results of operations and financial condition.
Our prior success in developing bio-succinic acid may not be indicative of our ability to leverage our bio-succinic acid technology to develop and commercialize derivatives of bio-succinic acid and other bio-based building block chemicals.
The success we have had in manufacturing bio-succinic acid using our four carbon, or C4, platform to date may not be indicative of our future ability to develop and commercialize derivatives of bio-succinic acid, and bio-based six carbon, or C6,
28
building block chemicals. Although we expect to be able to leverage our bio-succinic acid technology for use in higher value-added products, we have never produced derivatives of bio-succinic acid or bio-based C6 building block chemicals at commercial scale. We may find that the new chemicals that we produce using our processes are more complex than we anticipated or require processes that we are unfamiliar with or which require larger scale development facilities than expected. The development of new products has required, and will require, that we expend significant financial and management resources. We have incurred, and expect to continue to incur, significant research and development expenses. If we are unable to devote adequate resources to develop new products or cannot otherwise successfully develop new products or enhancements that meet customer requirements on a timely basis, our products could lose market share, our revenues and/or margins could decline and we could experience operating losses. Although our management team has significant experience with industrial biotechnology, purification processes and chemical catalysis, the skills and knowledge gained in these fields and in the large-scale production of bio-succinic acid does not guarantee that we will be successful in our efforts to cost-effectively produce and commercialize bio-succinic acid derivatives or bio-based C6 building block chemicals at commercial scale.
In addition, each of the chemicals that we plan to manufacture are used in multiple and diverse end-markets and applications, each of which present unique requirements, pricing pressures and competitors. As a result, we may not be able to sufficiently serve each end-market adequately. In order to effectively compete in the chemicals industry, we will need to, among other things, be able to adapt our development and production processes to meet the rapidly changing demands of the industry and our customers and ensure that the quality, performance attributes and cost of our bio-based products compare favorably to their petroleum-derived equivalents. In each end-market, there may also be barriers to entry due to third-party intellectual property rights or difficulties forming and maintaining strategic partnerships. In addition, the products currently derived from our processes and the feedstocks we use in the production of bio-succinic acid and our future products, may not be applicable to or compatible with demands in existing or future markets. We may not be able to identify new opportunities as they arise since future applications of any given product may not be readily determinable.
If we are not able to successfully develop, commercialize, produce and sell new products, we may be unable to expand our business. Consequently, we may not succeed in our strategy to expand our product platform as expected or at all. If our ability to expand our product platform is significantly delayed or if we are unable to leverage our bio-succinic acid platform as expected, our business and financial condition could be materially and adversely affected.
Demand for our bio-succinic acid, bio-based 1,4 BDO and other bio-succinic acid derivatives may take longer to develop or be reduced by technological innovations in our industry that allow our competitors to produce them at a lower cost.
The development of sufficient customer demand for bio-succinic acid, bio-based 1,4 BDO and other bio-succinic acid derivatives will be affected by the cost competitiveness of our products, and the emergence of more competitive products. The market for bio-based chemicals will require most potential customers to switch from their existing petroleum-based chemical suppliers. In addition, there has been intense growth and interest in bio-based chemicals, and these industries are subject to rapid technological change and product innovation. Our products are based on our proprietary fermentation and purification process, but a number of companies are pursuing alternative processes and technologies and our success will depend on our ability to maintain a competitive position with respect to technological advances. It is possible that those advances could make bio-succinic acid, bio-based 1,4 BDO and other bio-succinic acid derivatives less efficient or obsolete, causing the renewable chemicals we produce to be of a lesser quality than competing bio-based chemicals or causing the yield of our products to be lower than that for competing technologies. These advances could also allow our competitors to produce bio-based chemicals at a lower cost than ours. We cannot predict when new technologies may become available, the rate of acceptance of new technologies by our competitors or the costs associated with such new technologies.
Technological breakthroughs in our industry or innovations in alternative sources of bio-based chemicals could reduce demand for our products. Our technologies and products may be rendered uneconomical by technological advances, more efficient and cost-effective biocatalysts or entirely different approaches developed by one or more of our competitors. If we are unable to adopt or incorporate technological advances or adapt our products to be competitive with new technologies, our costs could be significantly higher than those of our competitors, which could make our facilities and technology less competitive or uncompetitive.
Changes we make to our business model, product development and manufacturing process, or changes to our commercial partnerships and collaborations may not yield the benefits we expect and may have adverse impacts that we did not anticipate.
We are continually working to lower our operating costs, improve our product performance, increase our speed to market and access new markets. As a result, we have made and will continue to make changes we believe will accomplish these goals. For example, we transitioned from an E. coli organism to our yeast for our planned Sarnia facility operations. In addition, we have expanded the breadth of products we are seeking to commercialize, and entered into a number of early stage partnerships and collaborations related to those products, that we believe will significantly increase our accessible market. We can give no assurances that these and other changes we make will yield the benefits we expect and will not have adverse impacts that we did not anticipate. If
29
these changes are not successful, we may incur additional costs, experience reputational and competitive harm and our business, financial condition and results of operations may be materially and adversely affected.
We are dependent on our relationships with strategic partners, licensors, collaborators and other third parties for research and development, the funding, construction and operation of our manufacturing facilities and the commercialization of our products. The failure to manage these relationships could delay or prevent us from developing and commercializing our products.
We have built our business largely by forming technology partnerships and licensing and other relationships with market leaders in the industrial biotechnology and chemicals industries. For example, through an exclusive worldwide license from Cargill, we have developed a next-generation yeast microorganism. In addition, we are developing a proprietary purification process that we believe will provide a key cost differentiator to our competitors by reducing the cost profile of our products and the capital intensity of our plants. We have also entered into license agreements with DuPont, entities funded by the DOE, Celexion and others. We expect that our ability to maintain and manage these collaborations will be significant factors in the success of our business.
Also, we expect that our ability to maintain and manage partnerships for the funding, construction and operation of our manufacturing facilities will be a significant factor in the success of our business. The large-scale demonstration facility we operate in Pomacle, France is owned by ARD and we are guaranteed 60% the facility’s capacity through a toll-manufacturing agreement with ARD.
We have entered into a joint venture agreement with Mitsui for the financing and construction of our planned facility in Sarnia, Ontario. We have commenced construction and expect this facility to be mechanically complete in the second quarter of 2015. We may work with Mitsui to build and operate an additional BDO plant in the future. We may not be able to maintain our partnership with Mitsui if it decides not to go forward based on certain rights granted to it in our agreement. Mitsui has the right to sell its shares and we have the obligation to purchase those shares at 100% of the investment value if the cost of the Sarnia facility is greater than $140 million and we cannot provide the additional funds needed to complete the facility. In the event of an occurrence of a dissolution event until December 31, 2020 the same rights apply and Mitsui has the right to sell its shares and we have the obligation to purchase those shares at 100% of the investment value. The dissolution events giving Mitsui this right are: (i) the Sarnia plant not being operational by January 31, 2016, (ii) cumulative losses accrued from 2016 through 2020 exceeding 75% of paid in capital, (iii) no after-tax profit earned in any three consecutive years from 2016 onwards, and (iv) any act of insolvency, bankruptcy, or similar event. Until December 31, 2018, Mitsui in its sole discretion may sell its shares and we must purchase those shares at a discount of 50% to the cumulative investment value.
We are working with strategic partners and collaborators through whom we either own or license the technology needed to develop new specialty chemical products. We will rely on these partners to commercialize our products and the success of these relationships will impact the market opportunity and demand for our products across our target end-markets.
Our partnering or collaboration opportunities could be harmed and our anticipated timelines could be delayed if:
|
· |
we do not achieve our objectives under our arrangements in a timely manner, or at all; |
|
· |
our existing or potential industry partners become unable, unwilling or less willing to expend their resources on research and development or commercialization efforts with us due to general market conditions, their financial condition, feedstock pricing or other circumstances, many of which are beyond our control; |
|
· |
we disagree with a strategic partner or collaborator regarding strategic direction, economics of our relationship, intellectual property or other matters; |
|
· |
we are unable to successfully manage multiple simultaneous partnering arrangements; |
|
· |
our strategic partners and collaborators breach or terminate their agreements with us or fail to perform their agreed activities or make planned equity contributions; |
|
· |
our industry partners become competitors of ours or enter into agreements with our competitors; |
|
· |
applicable laws and regulations, domestic or foreign, impede our ability to enter into strategic arrangements; |
|
· |
we develop processes or enter into additional partnering arrangements that conflict with the business objectives of our other arrangements; or |
|
· |
consolidation in our target markets limits the number of potential industry partners. |
If any of these events occur, or if we fail to maintain our agreements with our strategic partners and collaborators, we may not be able to commercialize our existing and future products, further develop our business or generate sufficient revenues to support our operations. Additionally, our business could be negatively impacted if any of our industry partners undergo a change of control or assign the rights or obligations under any of our agreements.
30
Our operations are dependent upon certain raw materials and utilities, principally sugars, hydrogen, steam and electricity, which make us vulnerable to supply availability and price fluctuations.
We are vulnerable to the supply availability and price fluctuations of certain raw materials and utilities, principally sugars, hydrogen (in the production of BDO and THF), steam and electricity. In many cases, we do not have long-term supply agreements in place, which may result in supply problems in the future. For example, we have not yet finalized supply agreements for the required feedstock or carbon dioxide for our planned facility in Sarnia, Ontario. Our operations may also be adversely impacted by the failure of our suppliers to follow specific protocols and procedures or comply with applicable regulations, equipment malfunctions and environmental factors, any of which could delay or impede their ability to meet our demand. Our reliance on third-party suppliers also subjects us to other risks that could harm our business, including that:
|
• |
we may not be able to obtain adequate supply in a timely manner or on commercially reasonable terms; |
|
• |
we may have difficulty locating and qualifying alternative suppliers for sole-source supplies; |
|
• |
we may have production delays if products we source from alternative suppliers do not meet our standards; |
|
• |
we are not, and do not expect to become, a major customer of most of our suppliers and such suppliers may give other customers’ needs higher priority than ours; and |
|
• |
our suppliers may encounter financial hardships unrelated to our demand for components, which could inhibit their ability to fulfill our orders and meet our requirements. |
In the event one or more of our suppliers are unable to meet our supply demands, we may not be able to quickly replace them or find adequate supply from a different source. Any interruption or delay in the supply of sugars, carbon dioxide, hydrogen, steam or electricity, or our inability to obtain these raw materials and utilities from alternate sources at acceptable prices in a timely manner, could impair our ability to meet the demands of our customers and expand our operations, which would have a material adverse effect on our business, financial condition and results of operations.
The price of our bio-succinic acid is based in large part on the price of sugars, which can be derived from corn, wheat or other feedstocks. Fluctuations in the commodity prices of sugars or other inputs required in our production processes may reduce our profit margins, especially if we do not have long-term contracts for the sale of our output at fixed or predictable prices. The price and availability of sugars or other inputs may be influenced by factors outside of our control, including general economic, market and regulatory factors.
We may not be able to successfully introduce new organisms and feedstocks into our processes.
We intend to introduce new organisms and feedstocks into our processes and are working to increase our conversion yields, feedstock flexibility, manufacturing efficiency and product range through our research and development efforts and strategic partnerships. In partnership with Cargill, we developed a yeast that we expect will have higher yields and less contamination risk than the E. coli bacterium we used in the French demonstration plant. We may not, however, succeed in adopting our yeast for use in Sarnia for a number of reasons, including our inability to adapt our purification process for our yeast, the failure of our yeast to produce products that meet the quality standards of our customers and a higher than expected production cost as a result of using our yeast. We plan to use our yeast in the Sarnia facility and future facilities. When we do, the transition may not be as seamless as we expect, and our yeast may require different operating conditions or otherwise differ from our expectations. We also plan to expand the range of feedstocks we use from the fermentable sugars from the hydrolysis of starch from a wheat wet mill used in the large-scale demonstration facility in France to fermentable sugars from corn wet mills in our planned facility in Sarnia, Ontario.
We may face unexpected challenges when we run our second-generation purification process and yeast fermentation process in our Sarnia facility.
We have piloted a second-generation purification process through our agreement with a strategic technology partner. We have tested this purification process at our partner’s facility in conjunction with our fermentation processes in France. However, engineering issues, additional costs or other unforeseen obstacles may arise and create delays when we implement the two processes together at a single manufacturing facility.
If we are unable to manage our growth and expand our operations successfully, our business, financial condition and results of operations may be harmed.
We have significantly expanded our business since our inception and have grown to 74 full-time employees as of December 31, 2014. We currently conduct our business in several countries, including the United States and Canada, and we expect to continue to expand geographically in the future. We expect our growth to continue and accelerate in connection with our expansion strategy. As our operations continue to expand, we will need to continue to manage multiple locations and additional relationships with various
31
third parties. We may not be able to maintain or accelerate our current growth rate, manage our expanding operations effectively or achieve planned growth on a timely or profitable basis. Managing our anticipated growth and expanding our operations will require us to do, among other things, the following:
|
• |
enhance our operational, financial and management controls and infrastructure, human resource policies, and reporting systems and procedures; |
|
• |
effectively scale our operations, including successfully constructing our planned manufacturing facilities; |
|
• |
diversify our product line to leverage our bio-succinic acid for use in multiple higher value-added products and other bio-succinic acid derivatives, and develop bio-based C6 building block chemicals; |
|
• |
successfully identify, recruit, train, maintain, motivate and integrate additional employees and continue to retain, motivate and manage our existing employees; |
|
• |
maintain partnerships with third parties for the development of our technology, funding and construction of our plants and the commercialization of our products; and |
|
• |
maintain and grow our intellectual property portfolio. |
These enhancements and improvements will require significant capital expenditures and allocation of valuable management and employee resources, which will place a strain on our operational, financial and management infrastructure. Our future financial performance and our ability to execute on our business plan will depend, in part, on our ability to effectively manage any future growth and expansion. There are no guarantees we will be able to do so in an efficient or timely manner, or at all. Our failure to effectively manage growth and expansion could have a material adverse effect on our business, financial condition and results of operations.
We have entered into certain non-binding letters of intent, memoranda of understanding and other arrangements with future customers and others, and cannot assure you that such arrangements will lead to definitive agreements, which could harm our commercial prospects.
We have entered into non-binding letters of intent, memoranda of understanding and other arrangements with future customers and others. We have also entered several non-binding memoranda of understanding with third parties related to our product development efforts. We cannot assure you that we will be able to negotiate final terms and enter into definitive agreements with any of our future customers or others in a timely manner, or at all, and there is no guarantee that the terms of any final, definitive, binding agreement will be favorable to us or reflect the terms currently contemplated under the letters of intent, memoranda of understanding and other arrangements we have. Delays in negotiating final, definitive, binding agreements could slow the development and commercialization of the products in our pipeline, which could prevent us from growing our business, result in wasted resources and cause us to consume capital significantly faster than we currently anticipate.
We have signed a binding take-or-pay contract for bio-based 1,4-Butanediol, or BDO, with Vinmar International, which, under the terms of the 15-year master off-take agreement, Vinmar has committed to purchase 100% of the BDO produced in a 100,000 ton per year capacity plant that BioAmber plans to build in North America and commission in 2017. Vinmar also plans to invest in the BDO plant alongside BioAmber. Following the financing, construction and commissioning of the 100,000 ton BDO plant, Vinmar will be obligated to purchase 100% of the BDO produced for 15 years, and BioAmber will be obligated to sell exclusively to Vinmar. As part of the agreement, Vinmar has a right of first refusal to invest in and secure 100% of the off-take from a second BDO plant that BioAmber would build in the future. While this agreement is binding, our inability to finance and construct the BDO plant would relieve Vinmar of its obligation to purchase BDO under the terms of the take-or-pay agreement.
We cannot assure you that we will be able to meet the product specification requirements of our customers or that our products will be accepted by our target customers.
We are currently selling our bio-succinic acid to customers today after having met their quality, purity, performance and cost requirements and intend to sell our product to other customers in the chemicals industry. These sales were made in connection with our product and market development efforts. We also intend to expand our market reach with the new products that we are developing as alternatives to the chemicals currently in use. Our potential customers include large specialty chemical companies that have well-developed manufacturing processes for the chemicals they use or pre-existing arrangements with suppliers for the chemical components they need. These potential customers frequently impose lengthy and complex product qualification procedures on their suppliers during which time they test and certify our products for use in their processes and, in some cases, determine whether products that contain the chemicals produced using our processes satisfy additional third-party specifications. Meeting these suitability standards could be a time-consuming and expensive process and we may invest substantial time and resources into such qualification efforts without ultimately securing approval by our customers. If we are unable to convince our potential customers that our products
32
are equivalents of or comparable to the chemicals that they currently use or that using our products is otherwise beneficial to them, we will not be successful in expanding our market and our business will be adversely affected.
In addition, agreements for the sale and purchase of our products are customarily subject to the satisfaction of certain technical, commercial and production requirements. These agreements contain conditions that we and our counterparties agree on product specifications for our chemical products and that our products conform to those specifications. If we do not satisfy these contractual requirements, demand for our products and our reputation may be adversely affected.
If the recent decline in the price of petroleum and petroleum-based succinic acid and other chemicals continues, the gross margins and or the demand for our products may decrease.
The bio-succinic acid we produce is a renewable alternative to petroleum-based succinic acid. Based on our current financial modeling with respect to our planned facility in Sarnia, Ontario, we anticipate that if the price of oil falls below $35 per barrel for a sustained period of time and corn prices are $6.50 per bushel or higher, the resulting selling price of our succinic acid would result insignificantly lower gross margins and we may be unable to compete on price with petroleum-based succinic acid products, which would adversely impact our operating results. World prices for oil have fluctuated widely in recent years. For example, during the last five years the market price per barrel of West Texas Intermediate crude oil ranged from a low of $44.45 to a high of $112.93 and was $47.05 on March 12, 2015. We expect that prices will continue to fluctuate in the future. Declining oil prices, or the perception of a future decline in oil prices, may adversely affect the prices we can obtain from our potential customers or dissuade potential customers from entering into long-term agreements with us to buy our products.
Some of our competitors have significantly more experience and resources than we do and technology developed by our competitors could become more commercially successful than our technology, which could negatively impact our results of operations and market share.
Competition in the bio-based chemicals business from other chemicals companies is well established, with many substantial entities having well-financed multi-national operations. Our products will compete against those produced by established companies, including a collaborative venture between DSM and Roquette Frères S.A., a collaborative venture between BASF and Purac, Gadiv Petrochemical Industries Ltd. and Kawasaki Kasei Chemicals Ltd. Competition in the bio-based chemicals business is expanding with the growth of the industry and the advent of many new technologies. In addition to competing with new technologies, we also compete against traditional petroleum-derived chemicals, many of which are produced by large companies that have greater financial and other resources than we do. Larger companies, due to their better capitalization, will be better-positioned to develop and commercialize new technologies, build new production facilities and to install existing or more advanced equipment, which could reduce our market share and harm our business. In addition, our products will face competition from those produced by early stage companies, including Genomatica, Inc. and Myriant Corporation. Our ability to compete successfully will depend on our ability to develop proprietary technologies that cost effectively produce renewable alternatives to petroleum-based chemicals. Some of our competitors are developing new technologies that may be more successful than our technology. These competitors may also have substantially greater production, financial, research and development, personnel and marketing resources than we do or may benefit from local government programs and incentives that are not available to us. As a result, our competitors may be able to compete more aggressively and sustain that competition over a longer period of time than we could. Our technologies and products may be rendered less competitive by technological advances or entirely different approaches developed by one or more of our competitors. As more companies develop new intellectual property in our markets, the possibility increases of a competitor acquiring patent or other rights that may limit our products or potential markets, which could lead to litigation. In addition, we may be subject to aggressive competitive tactics from our competitors, who may use their strong positions in the market and established relationships with existing suppliers and customers to take measures that negatively affect our ability to compete effectively in this industry. Our inability to maintain our competitiveness and grow our market share may, adversely affect our results of operations and financial position, and prevent us from achieving or maintaining profitability.
Failure to obtain regulatory approvals or permits could adversely affect our operations.
While our business currently has all necessary operating approvals material to our current operations, we must obtain and maintain numerous regulatory approvals and permits in order to build and operate our planned manufacturing facilities, including our planned facility in Sarnia, Ontario. Recently, Health Canada confirmed that the microbial strain to be used in Sarnia is Biosafety level 1 organism and neither Health Canada nor Environment Canada found any risk associated with the activities proposed in our notification. This means that BioAmber can import and use its production strain in Sarnia for the manufacturing of bio-based succinic acid under the operational and safety procedures mentioned in its notification.
However in any given jurisdiction, new legislations could be implemented that would require additional or new regulatory approvals. Obtaining necessary approvals and permits could be a time-consuming and expensive process, and we may not be able to obtain them on a timely basis or at all. In the event that we fail to ultimately obtain all necessary permits, we may be forced to delay operations of the facility and the receipt of related revenues or abandon the project altogether and lose the benefit of any development costs already
33
incurred, which would have an adverse effect on our results of operations. In addition, governmental regulatory requirements may substantially increase our construction costs, which could have a material adverse effect on our business, results of operations and financial condition. If there is a delay in obtaining any required regulatory approvals or if we fail to obtain and comply with any required regulatory approvals, the operation of our facilities or the sale of our bio-based chemicals could be delayed. For example, many countries require registration of chemicals before they can be distributed in the country, and a failure to register our chemicals would limit our ability to expedite sales into these markets. In addition, we may be required to make capital expenditures on an ongoing basis to comply with increasingly stringent federal, state, provincial and local environmental, health and safety laws, regulations and permits.
We face risks associated with our international business.
We are currently building and plan to operate a manufacturing facility in Sarnia, Ontario as well as additional manufacturing facilities in the future. Our international business operations are subject to a variety of risks, including:
|
• |
difficulties in staffing and managing foreign and geographically dispersed operations; |
|
• |
having to comply with various Canadian, U.S. and other laws, including export control laws. |
|
• |
changes in or uncertainties relating to foreign rule and regulations that may adversely affect our ability to sell our products, perform services or repatriate profits to the United States; |
|
• |
tariffs, export or import restrictions, restrictions on remittances abroad, imposition of duties or taxes that limit our ability to move our products out of these countries or interfere with the import of essential materials into these countries; |
|
• |
fluctuations in foreign currency exchange rates; |
|
• |
imposition of limitations on production, sale or export of bio-based chemicals in foreign countries; |
|
• |
imposition of limitations on or increase of withholding and other taxes on remittances and other payments by foreign subsidiaries or joint ventures; |
|
• |
imposition of differing labor laws and standards; |
|
• |
economic, political or social instability in foreign countries; |
|
• |
an inability, or reduced ability, to protect our intellectual property, including any effect of compulsory licensing imposed by government action; and |
|
• |
the availability of government subsidies or other incentives that benefit competitors in their local markets that are not available to us. |
We expect that we will begin expanding into other target markets, however there can be no assurance that our expansion plans will be realized, or if realized, be successful. We expect each market to have particular regulatory, feedstock sourcing and funding hurdles to overcome and future developments in these markets, including the uncertainty relating to governmental policies and regulations, could have a material adverse effect on us. If we expend significant time and resources on expansion plans that fail or are delayed, our business, reputation and financial condition may be materially and adversely affected.
Natural or man-made disasters, political, social or economic instability, or occurrence of a catastrophic or disruptive event in any of the areas where our existing or planned manufacturing facilities are located may adversely affect our business and results of operations.
We plan to build and operate manufacturing facilities strategically located throughout the world near sources of feedstock and our target markets. The operation of facilities may be harmed by natural or man-made disasters, including, without limitation, earthquakes, floods, tornadoes, fires, tsunamis, epidemics and nuclear disasters. Our facilities and the manufacturing equipment we use would be very costly to replace and could require substantial lead time to repair or replace. In addition, telecommunications failures or other systems interruptions, such as computer viruses or other cyber-attacks, at any of the locations in which we do business could significantly disrupt our operations, laboratory processes and delay shipments to our customers. Even in the absence of direct damage to our operations, large disasters, terrorist attacks, systems failures or other events could have a significant impact on our partners’ and customers’ businesses, which in turn could result in a negative impact on our results of operations. Extensive or multiple disruptions in our operations, or our partners’ or customers’ businesses, due to natural disasters or other unanticipated catastrophes could have a material adverse effect on our results of operations.
In the event any of our facilities are affected by a disaster, we may:
|
• |
be unable to meet the deadlines of our customers; |
34
|
• |
experience disruptions in our ability to manufacture and ship our products and otherwise operate our business, which could negatively impact our business; |
|
• |
need to expend significant capital and other resources to address any damage caused by the disaster; and |
|
• |
lose customers and we may be unable to regain those customers thereafter. |
Our precautions to safeguard our facilities, including insurance and health and safety protocols, may not be adequate to cover our losses in any particular case. Although we possess insurance for damage to our property and the disruption of our business from casualties, this insurance may not be sufficient to cover all of our potential losses and may not continue to be available to us on acceptable terms, or at all. Moreover, our facilities may experience unscheduled downtime or may not otherwise operate as planned or expected, which could have adverse consequences on our business and results of operations.
We may incur significant costs complying with environmental laws and regulations, and failure to comply with these laws and regulations could expose us to significant liabilities.
We use biological materials and genetically modified organisms, or GMOs, in our production processes and are subject to a variety of federal, state, and local laws and regulations governing the use, generation, manufacture and disposal of these materials. For example, the Toxic Substances Control Act, or TSCA, and analogous state laws and regulations impose requirements on the production, importation, use and disposal of chemicals and GMOs in the United States. In Canada, similar regulatory programs exist under the Canadian Environmental Protection Act. In particular, a regulatory program similar to TSCA requires that Environment Canada to approve the manufacture of any chemical not already included on the Domestic Substances List, or DSL. We have secured approval from Environment Canada for our use of E. coli and the manufacture of our bio-based succinic acid and the derivatives of succinic acid that we plan to commercialize. Environment Canada has recently reviewed our notification dossier with respect to the use of our yeast, and we obtained a favorable response for the importation and manufacture of the yeast microorganism in January 2014. If Environment Canada requires our future C6-based products, to undergo extensive testing, which we currently do not anticipate, securing approval to manufacture such products could potentially be subject to significant delays or costs. In the European Union, we are subject to a chemical regulatory program known as REACH (Registration, Evaluation, Authorization, and Restriction of Chemical Substances). Under REACH, we are required to register our products with the European Commission. The registration process requires the submission of information to demonstrate the safety of chemicals as used and could result in significant costs or delay the manufacture or sale of our products in the European Union.
We obtained requisite regulatory approvals for use of E. coli in the large-scale demonstration facility we operated in Pomacle, France as well as in our research and development operations in the United States and Canada. In addition, the Cargill yeast we have licensed has been approved for use in the United States for the production of lactic acid. Although we have implemented safety procedures for the disposal of these materials and waste products to comply with these laws and regulations, we cannot be sure that our safety measures are compliant or capable of eliminating the risk of accidental injury or contamination from the use, generation, manufacture, or disposal of hazardous materials. In the event of contamination or injury, we could be held liable for any resulting damages, and any liability could exceed our insurance coverage. There can be no assurance that violations of environmental, health and safety laws will not occur as a result of human error, accident, equipment failure or other causes.
Compliance with applicable environmental laws and regulations may be expensive, and the failure to comply with past, present or future laws could result in the imposition of fines, regulatory oversight costs, third party property damage, product liability and personal injury claims, investigation and remediation costs, the suspension of production, or a cessation of operations, and our liability may exceed our total assets. We expect to encounter similar laws and regulations in most if not all of the countries in which we may seek to establish production capabilities, and the scope and nature of these regulations will likely be different from country to country. Environmental laws could become more stringent over time, requiring us to change our operations, or imposing greater compliance costs and increasing risks and penalties associated with violations, which could impair our research, development or production efforts and harm our business. Similarly, our business may be harmed if initiatives to reduce emissions of greenhouse gases, which tend to improve the competitiveness of our products relative to petrochemicals, do not become legally enforceable requirements, or if existing legally enforceable requirements relating to greenhouse gases are amended or repealed in the future. The costs of complying with environmental, health and safety laws and regulations and any claims concerning noncompliance, or liability with respect to contamination in the future could have a material adverse effect on our financial condition or operating results.
We use hazardous materials in our business and any claims relating to improper handling, storage or disposal of these materials or noncompliance with applicable laws and regulations could adversely affect our business and results of operations.
We use chemicals and biological materials in our business and are subject to a variety of federal, regional/state and local laws and regulations governing the use, generation, manufacture, storage, handling and disposal of these materials. Although we have implemented safety procedures for handling and disposing of these materials and waste products, we cannot be sure that our safety measures are compliant with legal requirements or adequate to eliminate the risk of accidental injury or contamination. In the event of
35
contamination or injury, we could be held liable for any resulting damages, and any liability could exceed our insurance coverage. There can be no assurance that we will not violate environmental, health and safety laws as a result of human error, accident, equipment failure or other causes. Compliance with applicable environmental laws and regulations is expensive and time consuming, and the failure to comply with past, present, or future laws could result in the imposition of fines, third-party property damage, product liability and personal injury claims, investigation and remediation costs, the suspension of production, or a cessation of operations. Our liability in such an event may exceed our total assets. Liability under environmental laws can be joint and several and without regard to comparative fault. Environmental laws could become more stringent over time, imposing greater compliance costs and increasing risks and penalties associated with violations, which could impair our research, development or production efforts and harm our business. Accordingly, violations of present and future environmental laws could restrict our ability to expand facilities, or pursue certain technologies, and could require us to acquire equipment or incur potentially significant costs to comply with environmental regulations.
Loss of key personnel or our inability to attract and retain additional key personnel could harm our research and development efforts, delay launch of new products and impair our ability to meet our business objectives.
Our business involves complex operations spanning a variety of disciplines that demands a management team and employee workforce that is knowledgeable in the many areas necessary for our operations. While we have been successful in attracting experienced, skilled professionals to our company, the loss of any key member of our management team or key research and development or operational employees, or the failure to attract and retain additional such employees, could slow our development and commercialization of our products for our target markets and executing our business plans. We may not be able to attract or retain qualified employees due to the intense competition for qualified personnel among biotechnology and other technology-based businesses and the scarcity of personnel with the qualifications or experience necessary for our business. Hiring, training and successfully integrating qualified personnel into our operation is a lengthy and expensive process. The market for qualified personnel is very competitive because of the limited number of people available with the necessary technical skills and understanding of our technology and anticipated products. If we are not able to attract and retain the necessary personnel to accomplish our business objectives, we may experience staffing constraints that will adversely affect our ability to support our internal research and development programs or satisfy customer demands for our products. In particular, our product development and research and development programs are dependent on our ability to attract and retain highly skilled scientific, technical and operational personnel. Competition for such personnel from numerous companies and academic and other research institutions may limit our ability to do so on acceptable terms, or at all. Substantially all of our employees are at-will employees, which means that either the employee or we may terminate their employment at any time.
In the ordinary course of business, we may become subject to lawsuits or indemnity claims, including those related to product liability, which could materially and adversely affect our business and results of operations.
From time to time, we may, in the ordinary course of business, be named as a defendant in lawsuits, claims and other legal proceedings. These actions may seek, among other things, compensation for alleged personal injury, worker’s compensation, employment discrimination, breach of contract, infringement of the intellectual property rights of others, property damages or civil penalties and other losses of injunctive or declaratory relief. In the event that such actions or indemnities are ultimately resolved unfavorably at amounts exceeding our accrued liability, or at material amounts, the outcome could materially and adversely affect our reputation, business and results of operations.
In addition, payments of significant amounts, even if reserved, could adversely affect our liquidity position. In addition, the development, production and sale of our products involve an inherent risk of product liability claims and the associated adverse publicity. Our products may contain undetected defects or impurities that are not discovered until after the products have been used by customers and incorporated into products for end-users. This could result in claims from our customers or others, which could damage our business and reputation and entail significant costs to correct. We may also be sued for defects resulting from errors of our commercial partners or unrelated third parties, but any product liability claim brought against us, regardless of its merit, could result in material expense, divert management’s attention and harm our business and reputation. Insurance coverage is expensive, may be difficult to obtain or not available on acceptable terms and may not adequately cover potential claims or losses. If claims or losses exceed our liability insurance coverage, we may go out of business. In addition, insurance coverage may become more expensive, which would harm our results of operations.
Adverse conditions in the global economy and disruption of financial markets may prevent the successful development and commercialization of our products, as well as significantly harm our results of operations and ability to generate revenue and become profitable.
We are subject to the risks arising from adverse changes in global economic and market conditions. The worldwide economy has been experiencing significant economic turbulence, and global credit and capital markets have experienced substantial volatility and disruption. These adverse conditions and general concerns about the fundamental soundness of domestic and international
36
economies could limit our partners’ or potential partners’ ability or willingness to invest in new technologies or capital. Moreover, these economic and market conditions could negatively impact our current and prospective customers’ ability or desire to purchase and pay for our products, or negatively impact our feedstock prices and other operating costs or the prices for our products. Changes in governmental banking, monetary and fiscal policies to address liquidity and increase credit availability may not be effective. Significant government investment and allocation of resources to assist the economic recovery of various sectors which do not include the bio-based chemical industry may reduce the resources available for government grants and related funding that could assist our expansion plans or otherwise benefit us. Any one of these events, and continuation or further deterioration of these financial and macroeconomic conditions, could prevent the successful and timely development and commercialization of our products, as well as significantly harm our results of operations and ability to generate revenue and become profitable.
If we engage in any acquisitions, we will incur a variety of costs and face numerous potential risks that could adversely affect our business and operations.
If appropriate opportunities become available, we may acquire additional businesses, assets, technologies, or products to enhance our business in the future. In connection with any future acquisitions, we could:
|
• |
issue additional equity securities which would dilute our current stockholders; |
|
• |
incur substantial debt to fund the acquisitions; or |
|
• |
assume significant liabilities. |
Acquisitions involve numerous risks, including problems integrating the purchased operations, technologies or products, unanticipated costs and other liabilities, diversion of management’s attention from our core businesses, adverse effects on existing business relationships with current and/or prospective collaborators, customers and/or suppliers, risks associated with entering markets in which we have no or limited prior experience and potential loss of key employees. We do not have experience in managing the integration process and we may not be able to successfully integrate any businesses, assets, products, technologies or personnel that we might acquire in the future without a significant expenditure of operating, financial and management resources, if at all. The integration process could divert management time from focusing on operating our business, result in a decline in employee morale and cause retention issues to arise from changes in compensation, reporting relationships, future prospects or the direction of the business. Acquisitions may also require us to record goodwill and non-amortizable intangible assets that will be subject to impairment testing on a regular basis and potential periodic impairment charges, incur amortization expenses related to certain intangible assets, and incur large and immediate write offs and restructuring and other related expenses, all of which could harm our operating results and financial condition. In addition, we may acquire companies that have insufficient internal financial controls, which could impair our ability to integrate the acquired company and adversely impact our financial reporting. If we fail in our integration efforts with respect to any of our acquisitions and are unable to efficiently operate as a combined organization, our business and financial condition may be adversely affected.
Our ability to use our net operating loss carryforwards to offset future taxable income may be subject to certain limitations.
As of December 31, 2014, we had approximately $98.2 million of federal tax net operating loss carryforwards, or NOLs. In general, under Section 382 of the U.S. Internal Revenue Code of 1986, as amended, or the Code, a corporation that undergoes an “ownership change” (as defined in Section 382 of the Code) is subject to limitations on its ability to utilize its pre-change NOLs to offset future taxable income. We have not performed a detailed analysis to determine whether an ownership change has occurred after each of our previous issuances of common stock and warrants. In addition, if we undergo an ownership change, our ability to utilize NOLs could be limited by Section 382 of the Code. Future changes in our stock ownership, some of which are outside of our control, could result in an ownership change. Furthermore, we operate both in the United States and in certain jurisdictions outside the United States. Our non-U.S. operations in Canada and in Luxembourg may in the future generate taxable income that is subject to income or other taxes in the jurisdictions in which those operations are conducted. As of December 31, 2014 we had approximately $5.5 million of NOLs in Canada. Each jurisdiction in which we operate may have its own limitations on our ability to utilize NOL or tax credit carryovers generated in that jurisdiction. Also, we generally cannot utilize NOLs or tax credits generated in one jurisdiction to reduce our liability for taxes in any other jurisdiction. Accordingly, we may be subject to tax liabilities in certain jurisdictions in which we operate notwithstanding the existence of NOLs or tax credits in other jurisdictions.
Ethical, legal and social concerns about genetically engineered products and processes, and similar concerns about feedstocks grown on land that could be used for food production, could limit or prevent the use of our products, processes and technologies and limit our revenues.
Some of our processes involve the use of genetically modified organisms, or GMOs. The use of GMOs is subject to laws and regulations in many countries, some of which are new and some of which are still evolving. In the United States, the Environmental Protection Agency regulates the commercial use of GMOs as well as potential products from the GMOs. Public attitudes about the
37
safety and environmental hazards of, and ethical concerns over, genetic research and GMOs could influence public acceptance of our technology and products.
While our bacterium licensed from entities funded by DOE has been approved for commercial use in France, the United States and Canada, and has been given the lowest classification in terms of risk, our ability to commercialize this bacterium in other countries and to develop and commercialize new organisms, such as our yeast, could be limited by the following factors:
|
• |
public attitudes about the safety and environmental hazards of, and ethical concerns over, genetically engineered products and processes, which could influence public acceptance of our technologies, products and processes; |
|
• |
public attitudes regarding, and potential changes to laws governing ownership of genetic material, which could harm our intellectual property rights with respect to our genetic material and discourage others from supporting, developing or commercializing our products, processes and technologies; |
|
• |
public attitudes and ethical concerns surrounding production of feedstocks on land which could be used to grow food, which could influence public acceptance of our technologies, products and processes; |
|
• |
governmental reaction to negative publicity concerning genetically engineered organisms, which could result in greater government regulation of genetic research and derivative products; and |
|
• |
governmental reaction to negative publicity concerning feedstocks produced on land which could be used to grow food, which could result in greater government regulation of feedstock sources. |
Any of the risks discussed below could result in increased expenses, delays or other impediments to our programs or the public acceptance and commercialization of products and processes dependent on our technologies or inventions. In addition, the subjects of genetically engineered organisms and food versus fuel have received negative publicity, which has aroused public debate. This adverse publicity could lead to greater regulation and trade restrictions on imports of genetically engineered products or feedstocks grown on land suitable for food production.
Risks Related to Our Intellectual Property
Our inability to adequately protect, or any loss of our intellectual property rights, could materially adversely affect our business, financial condition and results of operations.
Our success will depend, in part, upon our ability to maintain patents and other intellectual property rights to protect our products from competition. We rely principally on a combination of patent, copyright, trademark and trade secret laws, confidentiality agreements, and physical security measures to establish and protect the intellectual property rights relevant to our business. We own or have rights in issued patents and pending patent applications in the U.S. and in certain other jurisdictions. These patents and patent applications cover various aspects of our technologies, including the microorganism (biocatalyst) we use in our fermentation processes, methods of producing our products, and the use of our products in specific applications. In addition, we generally enter into confidentiality and invention assignment agreements with our employees, consultants, contractors, collaboration partners and scientific and other business advisers. These measures, which seek to protect our intellectual property from infringement, misappropriation or other violation, may not be effective for various reasons, including the following:
|
• |
we may fail to apply for patents on important technologies or processes in a timely fashion, or at all, or abandon applications when we determine that a product or method is no longer of interest; |
|
• |
we cannot predict which of our pending patent applications, if any, will result in issued patents for various reasons, including the existence of prior art that we had not been aware of, conflicting patents by others, or defects in our applications; |
|
• |
we do not know whether the examination of any of our patent applications by the United States Patent and Trademark Office, or USPTO, or any similar foreign patent offices will require us to narrow or even cancel any of the claims in our pending patent applications, or to abandon a patent application altogether; |
|
• |
even if our patents are granted, they may be challenged by third parties through reexamination or interference proceedings in the U.S., or opposition or cancellation proceedings in Europe, or via similar proceedings in other jurisdictions, which could result in the cancellation of certain of our patent claims or the loss of the challenged patent entirely; |
|
• |
we may not be able to protect some of our technologies, and even if we receive patent or similar protection, the scope of our intellectual property rights may offer insufficient protection against lawful competition or unauthorized use; |
|
• |
our products and processes may rely on the technology of others and, therefore, may require us to obtain intellectual property licenses, if available, from third parties in order for us to manufacture or commercialize our products or practice our processes; |
38
|
• |
the patents we have been granted or may be granted may not include claims covering our products and processes, may lapse or expire, be challenged, invalidated, circumvented or be deemed unenforceable, or we may abandon them; |
|
• |
our confidentiality agreements may not effectively prevent disclosure or use of confidential information and may not provide an adequate remedy in the event of unauthorized disclosure or use; |
|
• |
the costs associated with enforcing patents, confidentiality and invention assignment agreements or other intellectual property rights may make aggressive enforcement prohibitive; |
|
• |
we may not be aware of infringement or misappropriation of our intellectual property rights, or we may elect not to seek to prevent them; |
|
• |
our efforts to safeguard our trade secrets may be insufficient to prohibit the disclosure of our confidential information; |
|
• |
even if we enforce our rights aggressively, injunctions, fines and other penalties may be insufficient to deter violations of our intellectual property rights; |
|
• |
if we seek to enforce our rights, we may be subject to claims that our intellectual property rights are invalid, anti-competitive, otherwise unenforceable, or are already licensed to the party against whom we are asserting the claim; and |
|
• |
other persons may independently develop proprietary technology, information and processes that are functionally equivalent or superior to our proprietary intellectual property and processes but do not infringe or conflict with our patented or unpatented proprietary rights, or may use their own proprietary intellectual property rights to block us from taking full advantage of the market. |
Our patent rights may not protect us against competition.
An important part of our business strategy is to obtain patent protection in the United States and in other countries for patent applications that we own or in-license from others that cover certain technologies used in, or relating to, our products and processes. Interpreting the scope and validity of patents and success in prosecuting patent applications involves complex legal and factual questions, and the issuance, scope, validity, and enforceability of a patent cannot be predicted with any certainty. Patents issued or licensed to us may be challenged, invalidated or circumvented. Moreover, third parties could practice our inventions in secret and/or in territories where we do not have patent protection. Such third parties may then try to sell or import resulting products in and into the United States or other territories. We may be unable to prove that such products were made using our inventions or infringed our intellectual property rights. Additional uncertainty may result from recent changes in the U.S. patent laws under the America Invents Act, which was signed into law on September 16, 2011 and from legal precedent handed down by the U.S. Court of Appeals for the Federal Circuit, the U.S. Supreme Court and the courts of other countries, as they determine legal issues relating to the scope, validity and construction of patent claims. Because patent applications in the U.S. and in many foreign jurisdictions typically are not published until 18 months after filing, if at all, and because the publication of discoveries in the scientific literature often lags behind the actual discoveries, there is additional uncertainty as to the priority dates of our inventions compared to inventions by others, and uncertainty as to the patentability of the claims in our pending patent applications and the validity and enforceability of claims in our issued patents. Accordingly, we cannot be certain that any of our or our licensors’ patent applications will result in issued patents, or if issued, the validity and/or enforceability of the issued patents. Also, we cannot guarantee that a competing patent application will not be granted with claims that cover our proposed organism or processes, or that our or our licensors’ patent applications or patents will not be subject to an interference proceeding with a competing patent or patent application.
Moreover, we cannot be sure that any of our or our licensors’ patent rights will be broad enough in scope to provide commercial advantage and prevent circumvention. Furthermore, patents are enforceable only for a limited term, and some of the U.S. patents that we have in-licensed exclusively relating to our biocatalyst will start to expire in 2015.
We may be involved in lawsuits to protect or enforce our patents or the patents of our licensors, or lawsuits asserted by a third party, which could be expensive, time consuming and unsuccessful.
The success of our business is highly dependent on protecting our intellectual property rights. Unauthorized parties may attempt to copy or otherwise obtain and use our products and/or technology. Policing the unauthorized use of our intellectual property rights is difficult, expensive, time-consuming and unpredictable, as is enforcing these rights against unauthorized use by others. Identifying unauthorized use of our intellectual property rights is difficult because we may be unable to monitor the processes and/or materials being employed by other parties. In addition, in an infringement proceeding, a patent of ours or our licensors may be found invalid, unenforceable, anti-competitive or not infringed. An adverse result in any litigation or defense proceedings could put one or more of our patents at risk of being invalidated or interpreted narrowly and could put our patent applications at risk of not issuing.
Third parties may challenge our or our licensors’ patents via reexamination proceedings or inter partes review in the United States, opposition or cancellation proceedings in Europe, or similar proceedings in other jurisdictions. The outcome of these proceedings can be unpredictable and may result in the claims being substantially narrowed or cancelled altogether. As a result of changes in U.S. patent law under the America Invents Act, any U.S. patent that we or our licensors obtain having an effective filing
39
date on or after March 16, 2013 could be challenged by a third party using the new post-grant review process, which could result in the claims of the challenged patents being narrowed or even cancelled. Furthermore, in the United States, patents with an effective filing date prior to March 16, 2013 are awarded to the first person to make an invention rather than to the first person to file a patent application, and therefore such patents could be subject to an interference proceeding conducted by the USPTO to determine which party was the first to create an invention. As result, interference proceedings provoked by third parties or brought by the USPTO may be necessary to determine the priority of inventions with respect to our patents or patent applications or those of our collaborators or licensors. An unfavorable outcome could require us to cease using the related technology or to attempt to license rights from the prevailing party. As a result, our business could be harmed if the prevailing party does not offer us a license on commercially reasonable terms. Litigation or interference proceedings may fail and, even if successful, may take several years to resolve, result in substantial costs, and distract our management and other employees, and otherwise interfere with the running of our business. We may be unable to prevent, alone or with our licensors, infringement or misappropriation of our proprietary rights, particularly in countries where the laws may not protect those rights as fully as in the U.S. Furthermore, because of the amount of discovery required in connection with intellectual property litigation, there is a risk that some of our confidential information could be compromised by disclosure during this type of litigation.
We may be unable to enforce our intellectual property rights throughout the world, which could negatively affect our rights, competitive position and business.
We may in the future decide to build, or partner with others in building manufacturing facilities using our technologies in countries other than the United States and Canada. We may not have sufficient patent or other intellectual property rights in those countries to prevent a competitor from using our or competing technologies. Furthermore, the laws of some foreign countries do not protect intellectual property rights to the same extent as federal, state and provincial laws in the United States and Canada. Many companies have encountered problems in protecting and enforcing intellectual property rights in certain foreign jurisdictions. The legal systems of certain countries do not favor the enforcement of patents and other intellectual property protection. This could make it difficult for us or our licensors to prevent or stop any infringement of our or our licensors’ patents or misappropriation of the subject matter of our other proprietary or intellectual property rights. Proceedings to enforce our and our licensors’ patents and other proprietary rights in foreign jurisdictions could result in substantial costs and divert our efforts and attention from other aspects of our business. Accordingly, our efforts to enforce our intellectual property rights in such countries may be inadequate to obtain a significant commercial advantage from the intellectual property that we develop or in-license.
We may be unable to operate our business without infringing the intellectual property rights of others, which could subject us to costly litigation or prevent us from offering certain products which could have a material adverse effect on our business.
Although we are currently unaware of any claims or threatened claims, our ability to manufacture and commercialize our proposed technologies, processes and products depends upon our and our licensors’ ability to develop, manufacture, market, license and/or sell such technologies, processes and products without violating the proprietary rights of third parties. Numerous U.S. and foreign patents and pending patent applications owned by third parties exist in fields that relate to our proposed technologies, processes and products and our underlying methodologies and discoveries. In addition, many companies actively police and enforce their intellectual property rights, including their patent rights, to gain a competitive advantage. Third parties may allege that our existing or proposed technologies, processes and products or our methods infringe their intellectual property rights. It is possible that the number and frequency of law suits alleging infringement of intellectual property rights may increase as the number of products and competitors in our market increases. In addition, to the extent that we gain greater visibility and market exposure as a public company, we face a greater risk of being the subject of intellectual property infringement claims. We cannot be certain that the conduct of our business does not and will not infringe intellectual property or other proprietary rights of others. If the making, using, selling, offering for sale or importing of our proposed products or practice of our proprietary technologies or processes are found to infringe third party intellectual property rights, including patent rights, we could be prohibited from manufacturing and commercializing the infringing technology, process or product unless we obtain a license under the applicable third party patent and pay royalties or are able to design around such patent.
We may be unable to obtain a license on terms acceptable to us, if at all, and we may be unable to redesign our products, biocatalysts or processes to avoid infringement. Even if we are able to redesign our products, biocatalysts or processes to avoid an infringement claim, our efforts to design around the patent could require significant effort and expense and ultimately may lead to an inferior or more costly product and/or process. Any claim of infringement by a third party, even one without merit, could cause us to incur substantial costs defending against the claim, could distract our management and employees, and generally interfere with our business. Furthermore, if any such claim is successful, a court could order us to pay substantial damages, including compensatory damages for any infringement, plus prejudgment interest and could, in addition, treble the compensatory damages and award attorney fees. These damages could be substantial and could harm our reputation, business, financial condition and operating results. A court also could enter orders that temporarily, preliminarily or permanently prohibit us, our licensees and our customers from making, using, selling, offering to sell or importing one or more of our products or practicing our proprietary technologies or processes, or could enter
40
an order requiring us to undertake certain remedial activities. Any of these events could seriously harm our business, operating results and financial condition.
We also rely in part on trade secret laws, confidentiality agreements, and security procedures, which can be difficult to protect and enforce, and which may not adequately prevent disclosures of trade secrets and other proprietary information; our failure to obtain or maintain such protections could adversely affect our competitive position.
We rely in part on trade secret laws and contractual agreements to protect some of our confidential and proprietary information, technology and processes, particularly where we do not believe patent protection is appropriate or obtainable. We have taken various measures to protect our trade secrets and other confidential or proprietary information, including requiring new employees and consultants to execute confidentiality agreements upon the commencement of employment or consulting engagement with us. However, trade secrets are difficult to maintain and protect and our security procedures may be insufficient to prevent disclosure of our trade secrets. In addition, discussions with our business partners, including our licensors, may require us to share confidential and proprietary information with them and other third parties. Our business partners’ employees, consultants, contractors or scientific and other business advisers may unintentionally or willfully breach their confidentiality and/or non-use obligations, including by disclosing our confidential or proprietary information to our competitors. Such agreements may be deemed unenforceable, fail to provide adequate remedies, or become subject to disputes that may not be resolved in our favor. Enforcement of claims that a third party has illegally obtained and is using trade secrets is expensive, time consuming and uncertain. In addition, foreign courts are sometimes less willing than U.S. courts to protect trade secrets. Our failure to obtain or maintain trade secret protection could adversely affect our competitive business position. Furthermore, trade secret laws do not prevent our competitors from independently developing equivalent knowledge, methods and know-how that could be used to compete with us and our products.
We may lose our competitive advantage if our competitors develop similar, analogous or alternative organisms that produce bio-succinic acid or other competing chemical products.
We currently use proprietary microorganisms (biocatalysts) in our production of bio-succinic acid and other cellular metabolites such as C6 compounds. If our organisms are stolen, or misappropriated, they could be used by third parties for their own commercial gain, even though they may be in breach of our intellectual property rights. Furthermore, third parties may use similar or analogous organisms in jurisdictions where we or our licensors do not have patent protection. Third parties may also independently develop similar, analogous or alternative organisms that can also produce bio-succinic acid or other metabolites without infringing our intellectual property rights. If any of these were to occur, it could be difficult for us to discover, challenge or prevent the third party from using their organisms and competing with us in the production of bio-succinic acid or other metabolites.
Our rights to key intellectual property are in-licensed from third parties, and the limitation or termination of these and related agreements would be highly detrimental to us and our business.
We are a party to certain license agreements that provide us with the right to practice key technology used in our business. For example, we have entered into license agreements with UT-Battelle, LLC, or UT-Batelle, and UChicago Argonne, LLC, or UChicago Argonne, for the E. coli bacterium to produce bio-succinic acid, Cargill for our yeast that is being developed to produce bio-succinic acid, DuPont for catalysts and methods for converting our bio-succinic acid into bio-based 1,4 BDO, and Celexion for a procedure to make C6 compounds, such as adipic acid. All of these license agreements impose various obligations on us, including royalty payments and, in certain instances, milestone payments. If we fail to comply with these or other obligations, certain agreements provide that the licensors may have the right to terminate the license or convert the exclusive license to a nonexclusive license, in which case our competitors may gain access to these important licensed technologies, and we may be unable to develop or market products, technologies or processes covered by the licensed intellectual property. Often our licensors have the right to control the filing, prosecution, maintenance and defense of the licensed intellectual property and, if a third party infringes any of the licensed intellectual property, some of our licensors may control the resulting a legal or other proceeding against that third party to stop or prevent such infringement. As a result, our licensors may take actions or make decisions relating to these matters that could harm our business or impact our rights.
Future sales of shares by existing stockholders could cause our stock price to decline.
If our existing stockholders sell, or indicate an intent to sell, substantial amounts of our common stock or warrants in the public market the trading price of our common stock or warrants could decline significantly. We cannot predict the effect, if any, that future public sales of these securities or the availability of these securities for sale will have on the market price of our securities. Holders of 8,488,213 shares of our common stock, including the shares of common stock issuable upon exercise of warrants in existence prior to our initial public offering, have the right to require us to register these shares under the Securities Act pursuant to a shareholders’ agreement. If our existing stockholders sell substantial amounts of our common stock or warrants in the public market, or if the public
41
perceives that such sales could occur, this could have an adverse impact on the market price of our securities, even if there is no relationship between such sales and the performance of our business.
Our financial results could vary significantly from quarter to quarter and are difficult to predict.
Our quarterly operating results may fluctuate significantly in the future. As a result of these fluctuations, we may fail to meet or exceed the expectations of research analysts covering the company or of investors, which could cause the market price of our securities to decline. Future quarterly fluctuations, many of which are beyond our control, may result from a number of factors, including but not limited to:
|
• |
the timing and cost associated with the completion of our planned manufacturing facilities; |
|
• |
the level and timing of expenses for product development and sales, general and administrative expenses; |
|
• |
delays or greater than anticipated expenses associated with the scale-up and the commercialization of chemicals produced using our processes; |
|
• |
our ability to successfully enter into or maintain partnering arrangements, and the terms of those relationships; |
|
• |
commercial success with our existing product and success in identifying and sourcing new product opportunities; |
|
• |
the development of new competitive technologies or products by others and competitive pricing pressures |
|
• |
fluctuations in the prices or availability of the feedstocks required to produce chemicals using our processes or those of our competitors; |
|
• |
changes in demand for our products, including any seasonal variations in demand; |
|
• |
changes in product development costs due to the achievement of certain milestones under third-party development agreements; |
|
• |
changes in the amount that we invest to develop, acquire or license new technologies and processes; |
|
• |
business interruptions, including disruptions in the production process at any facility where chemicals produced using our processes are manufactured as well as a result of changes in the technologies we employ, including our transition from our E. coli bacterium to our yeast; |
|
• |
departures of executives or other key management employees; |
|
• |
foreign exchange fluctuations; |
|
• |
changes in general economic, industry and market conditions, both domestically and in our foreign markets; and |
|
• |
changes in governmental, accounting and tax rules and regulations, environmental, health and safety requirements, and other rules and regulations. |
Based on the above factors and other uncertainties, we believe our future operating results will vary significantly from quarter-to-quarter and year-to-year. As a result, quarter-to-quarter and year-to-year comparisons of operating results are not necessarily meaningful nor do they indicate what our future performance will be.
Provisions of Delaware law and our charter documents could delay or prevent an acquisition of our company and could make it more difficult for you to change management.
Provisions of our amended and restated certificate of incorporation and amended and restated by-laws may discourage, delay or prevent a merger, acquisition or other change in control that stockholders may consider favorable, including transactions in which stockholders might otherwise receive a premium for their shares. These provisions may also prevent or delay attempts by stockholders to replace or remove our current management or members of our board of directors. These provisions include:
|
• |
a classified board of directors; |
|
• |
limitations on the removal of directors; |
|
• |
advance notice requirements for stockholder proposals and nominations; |
|
• |
the inability of stockholders to act by written consent or to call special meetings; |
|
• |
the ability of our board of directors to make, alter or repeal our amended and restated by-laws; and |
|
• |
the authority of our board of directors to issue “blank check” preferred stock, the terms of which may be established and the shares of which may be issued without stockholder approval. |
42
The affirmative vote of the holders of not less than 75% of our shares of capital stock entitled to vote, and not less than 75% of the outstanding shares of each class entitled to vote thereon as a class, is generally necessary to amend or repeal the above provisions that are contained in our amended and restated certificate of incorporation. Also, absent approval of our board of directors, our amended and restated by-laws may only be amended or repealed by the affirmative vote of the holders of at least 75% of our shares of capital stock entitled to vote.
In addition, we are subject to the provisions of Section 203 of the Delaware General Corporation Law, which limits business combination transactions with stockholders of 15% or more of our outstanding voting stock that our board of directors has not approved. These provisions and other similar provisions make it more difficult for stockholders or potential acquirers to acquire us without negotiation. These provisions may apply even if some stockholders may consider the transaction beneficial to them.
As a result, these provisions could limit the price that investors are willing to pay in the future for shares of our common stock. These provisions might also discourage a potential acquisition proposal or tender offer, even if the acquisition proposal or tender offer is at a premium over the then current market price for our common stock.
We do not intend to pay cash dividends. We have never paid dividends on our capital stock and we do not anticipate paying any dividends in the foreseeable future. Consequently, any gains from an investment in our securities will likely depend on whether the price of our common stock increases.
We have not paid dividends on any of our capital stock to date and we currently intend to retain our future earnings, if any, to fund the development and growth of our business. As a result, capital appreciation, if any, of our common stock will be your sole source of gain for the foreseeable future. Consequently, in the foreseeable future, you will likely only experience a gain from your investment in our securities if the price of our common stock increases.
We will incur significant increased costs as a result of operating as a public company and our management will be required to devote substantial time to new compliance initiatives.
As a public company and particularly after we cease to be an “emerging growth company” (and cease to take advantage of certain exceptions from reporting requirements that are available under the Jumpstart Our Business Startups Act of 2012, or the JOBS Act, as an “emerging growth company”), we incurred and will incur significant legal, accounting, administrative and other costs and expenses that we did not face as a private company. As a public company, we are subject to rules and regulations that regulate corporate governance practices of public companies, including the Securities Exchange Act of 1934, as amended, or the Exchange Act, the Sarbanes-Oxley Act of 2002, as amended, or the Sarbanes-Oxley Act, and rules promulgated by the New York Stock Exchange, or NYSE. The compliance with these public company requirements increased and will increase our costs and make some activities more time consuming and may result in a diversion of management’s time and attention from revenue-generating activities. For example, we created new board committees, adopted new internal controls and disclosure controls and procedures, and devoted significant management resources to our Securities and Exchange Commission reporting requirements. A number of those requirements will require us to carry out activities we have not performed previously. Furthermore, if we are unable to build our internal controls and accounting capabilities or subsequently identify any issues in complying with those requirements (for example, if we or our registered public accounting firm identify a material weakness or significant deficiency in our internal control over financial reporting), we could incur additional costs rectifying those issues, and the existence of those issues could adversely affect us, our reputation or investor perceptions of us. We expect that the additional reporting and other obligations imposed on us by these rules and regulations will increase our legal and financial compliance costs and the costs of our related legal, accounting and administrative activities significantly. These increased costs will require us to divert a significant amount of money that we could otherwise use to expand our business and achieve our strategic objectives.
We are an “emerging growth company” and have elected to take advantage of reduced reporting requirements applicable to emerging growth companies, which could make our securities less attractive to investors.
We are an “emerging growth company,” as defined in the JOBS Act, and we have elected to take advantage of certain exemptions from various reporting requirements that are applicable to other public companies that are not emerging growth companies, including, but not limited to, not being required to comply with the auditor attestation requirements of Section 404 of the Sarbanes-Oxley Act, or Section 404, reduced disclosure obligations regarding executive compensation in our periodic reports and proxy statements, exemptions from the requirements of holding a nonbinding advisory vote on executive compensation and shareholder approval of any golden parachute payments not previously approved, and delaying the adoption of new or revised accounting standards until they are applicable to private companies. As a result of our election to use the extended transition period provided in Section 7(a)(2)(B) of the Securities Act, our financial statements may not be comparable to companies that comply with new or revised accounting standards on the relevant dates on which adoption of such standards is required for companies that comply with public company effective dates. We cannot predict if investors will find our securities less attractive as a result of our choice to
43
rely on these exemptions. If some investors find our securities less attractive as a result, there may be a less active trading market for our securities and the market price of our securities may be more volatile.
We will remain an “emerging growth company” for up to five years after our initial public offering, or until the earliest of (i) the last day of the first fiscal year in which our annual gross revenues exceed $1 billion, (ii) the date that we become a “large accelerated filer” as defined in Rule 12b-2 under the Exchange Act, which would occur if the market value of our common stock that is held by non-affiliates exceeds $700 million as of the last business day of our most recently completed second fiscal quarter, or (iii) the date on which we have issued more than $1 billion in non-convertible debt during the preceding three year period.
If we fail to augment and maintain an effective system of internal controls, we might not be able to report our financial results accurately or prevent fraud. In that case, our stockholders could lose confidence in our financial reporting, which would harm our business and could negatively impact the price of our securities.
Our management is required to deliver a report that assesses the effectiveness of our internal control over financial reporting. Additionally, Section 404 may require our auditors to deliver an attestation report on the effectiveness of our internal controls over financial reporting in conjunction with their opinion on our audited financial statements beginning with the second annual report that we will be required to file with SEC. However, we have elected to take advantage of certain exceptions from reporting requirements that are available to “emerging growth companies” under the JOBS Act and therefore we will not be required to make our first annual assessment of our internal control over financial reporting pursuant to Section 404 until after the date we are no longer an “emerging growth company” as defined in the JOBS Act, which may be up to five years from our initial public offering.
The process of designing and implementing effective internal controls and procedures, and expanding our internal accounting capabilities, is a continuous effort that requires us to anticipate and react to changes in our business and the economic and regulatory environments and to expend significant resources to establish and maintain a system of internal controls that is adequate to satisfy our reporting obligations as a public company. The standards that must be met for management to assess the internal control over financial reporting as effective are complex, and require significant documentation, testing and possible remediation to meet the detailed standards. We cannot be certain at this time whether we will be able to successfully complete the implementation of controls and procedures or the certification and attestation requirements of Section 404. In the future we may have significant deficiencies, which could cause us to fail to meet the periodic reporting obligations that we will be subject to under Section 404 or result in material misstatements in our financial statements. If we identify and report a material weakness or any additional significant deficiencies, it could adversely affect our stock price.
If securities or industry research analysts do not publish or cease publishing research or reports about our business or if they issue unfavorable commentary or downgrade our common stock, the market price of our securities and trading volume could decline.
The trading market for our securities relies in part on the research and reports that securities and industry research analysts publish about us, our industry and our business. Securities and industry research analysts do not currently provide research coverage of us, and we cannot assure you that any research analysts, including those in the United States and Europe, will provide research coverage on us or our securities. We do not have any control over these analysts. The market price of our securities and trading volumes could decline if one or more securities or industry analysts downgrade our securities, issue unfavorable commentary about us, our industry or our business, cease to cover our company or fail to regularly publish reports about us, our industry or our business.
The warrants sold as part of our initial public offering may not have any value, and the holders of those warrants will have no rights as common stockholders until such holders exercise their warrants and acquire our common stock.
The warrants sold as part of our initial public offering will expire at 5:30 p.m. on May 9, 2017 unless we in our sole discretion extend the expiration date. In the event our common stock price does not exceed the exercise price of the warrants during the period when the warrants are exercisable, the warrants may not have any value. Until holders of warrants acquire shares of our common stock upon exercise of the warrants, holders of warrants will have no rights with respect to the shares of our common stock underlying such warrants. Upon exercise of the warrants, the holders thereof will be entitled to exercise the rights of a common stockholder only as to matters for which the record date occurs after the exercise date.
We have listed our common stock on the Professional Segment of NYSE Euronext in Paris under the symbol “BIOA,” and therefore, the risks relating to our common stock, as set out above, apply in similar respects to investors trading our common stock on NYSE Euronext Paris. In addition, investors trading our common stock on NYSE Euronext Paris should consider the following additional risks relating specifically to the admission to listing and trading of our common stock on NYSE Euronext Paris.
44
The dual listing of our common stock on NYSE and NYSE Euronext Paris may adversely affect the liquidity and trading prices for our common stock on one or both of the exchanges as a result of circumstances that may be outside of our control.
Although we believe the dual listing of our common stock is beneficial for the liquidity of our common stock as it should permit a broader base of investors to purchase shares of our common stock in secondary trading, it may also adversely affect liquidity and trading prices for our common stock on one or both of the exchanges as a result of circumstances that may be outside of our control. For example, transfers by investors of our shares from trading on one exchange to the other could result in increases or decreases in liquidity and/or trading prices on either or both of the exchanges. In addition, investors could seek to sell or buy our common stock to take advantage of any price differences between the two markets through a practice referred to as arbitrage. Any arbitrage activity could create unexpected volatility in both our common stock prices on both exchange and the volumes of shares of our common stock available for trading on either exchange.
Our common stock is dual listed and trades in U.S. dollars on NYSE and in Euros on NYSE Euronext Paris, and the trading price of our common stock on NYSE Euronext Paris and the value of dividends, if any, paid on our common stock to investors who hold our common stock on NYSE Euronext Paris and elect to receive dividends in Euros may be materially adversely affected by fluctuations in the exchange rate for converting U.S. dollars into Euros.
Our common stock trades in U.S. dollars on NYSE and in Euros on NYSE Euronext Paris. Fluctuations in the exchange rate for converting U.S. dollars into Euros may affect the value of our common stock. Specifically, as the value of the U.S. dollar relative to the Euro declines, each of the following values will also decline (and vice versa):
|
• |
the Euro equivalent of the U.S. dollar trading price of our common stock on NYSE, which may consequently cause the trading price of our common stock on NYSE Euronext Paris to also decline; and |
|
• |
the Euro equivalent of cash dividends paid in U.S. dollars on our common stock if investors holding our common stock on NYSE Euronext Paris request dividends to be paid in Euros. |
Not applicable.
We have offices in Plymouth, Minnesota, Montreal, Canada and Sarnia, Canada.
Our Plymouth research and development facility consists of approximately 27,000 square feet of office and laboratory space, including a state of the art research and development facility with capabilities in molecular biology, fermentation, analytical chemistry, pilot scale catalysis and purification. We lease this space under an agreement that expires on February 29, 2016.
Our head office is located in Montreal, where we occupy a total of approximately 5,650 square feet of administrative office space under lease agreements amended to expire in May 2015. It was originally set to expire in May 2016 but we have signed a relocation extension for a total of 6,786 square feet, starting on June 1, 2015 to May 31, 2022. We have the option to extend the term of the lease for an additional five-year period.
We lease office space in Sarnia for our operations and administration employees under an agreement that was extended until May 2015.
We have entered into a joint venture agreement with Mitsui to construct a production facility in Sarnia, Ontario. We started commissioning and start-up in March 2015 we expect the construction of the initial phase to be complete during the second quarter of 2015, with an initial capacity of approximately 30,000 metric tons of bio-succinic acid. Our joint venture entity with Mitsui has purchased 11.25 acres of land for this facility, and has signed long-term steam and services agreements with LANXESS to serve the facility.
We believe that our current office facilities and proposed plant constructions are suitable and adequate to meet our short term needs. To the extent our needs change as our business grows, we believe additional space and facilities will be available.
From time to time, we may be subject to various legal proceedings and claims that arise in the ordinary course of our business activities. Management does not believe that the outcome of these claims will have a material adverse effect on our consolidated financial position, results of operations or cash flows based on the status of proceedings at this time. We are not currently a party to any material litigation or other material legal proceedings.
45
Not applicable.
|
Market for Registrant’s Common Equity, Related Stockholder Matters and Issuer Purchases of Equity Securities |
Our securities have been traded on the New York Stock Exchange, or NYSE, since June 10, 2013, when the units issued in our initial public offering on May 9, 2013 (trading under the symbol “BIOA.U”) were split into our common stock, trading under the symbol “BIOA” and our warrants, trading under the symbol “BIOA.WS”. In connection with the initiation of the separate trading of our common and warrants, the trading of the units were suspended and delisted from NYSE. Prior our initial public offering, there was no public market for our securities. The following table shows the high and low sale prices per share of our securities as reported on the NYSE for the periods indicated:
|
|
|
Common Stock |
|
|
Warrants |
|
||||||||||
|
|
|
High |
|
|
Low |
|
|
High |
|
|
Low |
|
||||
|
Second Quarter 2013 (beginning May 9, 2013) |
|
$ |
10.05 |
|
|
$ |
6.30 |
|
|
$ |
1.00 |
|
|
$ |
0.15 |
|
|
Third Quarter 2013 |
|
$ |
7.75 |
|
|
$ |
3.96 |
|
|
$ |
0.99 |
|
|
$ |
0.50 |
|
|
Fourth Quarter 2013 |
|
$ |
8.23 |
|
|
$ |
8.23 |
|
|
$ |
1.14 |
|
|
$ |
0.51 |
|
|
|
|
|
|
|
|
|
|
|
|
|
|
|
|
|
|
|
|
First Quarter 2014 |
|
$ |
15.05 |
|
|
$ |
7.37 |
|
|
$ |
3.13 |
|
|
$ |
0.71 |
|
|
Second Quarter 2014 |
|
$ |
12.99 |
|
|
$ |
9.05 |
|
|
$ |
2.88 |
|
|
$ |
1.68 |
|
|
Third Quarter 2014 |
|
$ |
15.29 |
|
|
$ |
9.66 |
|
|
$ |
2.79 |
|
|
$ |
2.20 |
|
|
Fourth Quarter 2014 |
|
$ |
10.80 |
|
|
$ |
7.38 |
|
|
$ |
2.74 |
|
|
$ |
0.80 |
|
On March 13, 2015, the last reported sale price for our common stock on the NYSE was $8.92 per share, and the last reported sale price for our warrants was $1.68 per warrant.
Equity Compensation Plans
The information required by Item 5 of Form 10-K regarding equity compensation is incorporated herein by reference to Item 12 of Part III of this Annual Report.
Dividend Policy
We have never paid or declared any cash dividends on our common stock. We currently intend to retain any cash flow to finance the growth and development of our business, and we do not expect to pay any cash dividends on our common stock in the foreseeable future. Payment of future dividends, if any, will be at the discretion of our board of directors and will depend on our financial condition, results of operations, capital requirements, restrictions contained in current or future financing instruments and other factors our board of directors deems relevant. In addition, our credit facility contains covenants limiting our ability to pay dividends on our capital stock.
Stockholders
As of March 13, 2015, there were approximately 113 holders of record of our common stock (not including beneficial holders of stock held in street name).
Use of Proceeds from Public Offering of Common Stock
On May 9, 2013, the SEC declared effective our registration statement on Form S-1 (File No. 333-177917) in connection with our initial public offering, pursuant to which we registered an aggregate of 8,000,000 units, each unit consisting of one share of common stock and one warrant to purchase half of one share of common stock, as well as a maximum of 1,200,000 additional units to cover over-allotments, if any. Each warrant is exercisable during the period commencing on August 8, 2013 and ending at 5:30 p.m. on May 9, 2017 at an exercise price of $11.00 per whole share of common stock. The underwriters were Credit Suisse Securities (USA) LLC, Barclays Capital Inc., Société Générale and Pacific Crest Securities LLC. Following the sale of the units in connection with the closing of our initial public offering, the offering terminated.
46
Our net proceeds from the sale of units in this offering were approximately $71.7 million, based upon an initial public offering price of $10.00 per unit, and after deducting underwriting discounts and commissions (of approximately $5.6 million) and offering expenses (of approximately $2.5 million) payable by us. No offering expenses were paid directly or indirectly to any of our directors or officers (or their associates) or persons owning ten percent or more of any class of our equity securities or to any other affiliates. We received these proceeds at a closing held on May 14, 2013. We used and intend to use the net proceeds of our initial public offering as follows:
|
· |
approximately $44.1 million for our capital contributions relating to the construction of the initial phase of our facility under construction in Sarnia, Ontario with an expected capacity of 30,000 metric tons; and |
|
· |
the balance for working capital and other general corporate purposes, which will also include expenses and costs associated with being a public company as well as certain interest and principal payments as they come due under our government loans and our credit facility with TCP. |
The approximately $44.1 million for our capital contributions relating to the construction of the initial phase of our Sarnia facility has been reduced from the initial estimate of $63.0 million, as set forth in our final prospectus, dated May 9, 2013, filed with the SEC pursuant to Rule 424(b), as a result of our receipt of additional low-interest loans from Canadian governmental agencies discussed elsewhere in this Annual Report on Form 10-K and the related foreign exchange fluctuation on these Canadian dollar loans. Other than the reduction in our capital contributions, there has been no other material changes in the planned use of proceeds from our initial public offering from that described in our final prospectus, dated May 9, 2013, filed with the SEC pursuant to Rule 424(b).
Sales of Unregistered Securities
During the year ended December 31, 2014, we issued an aggregate of 6,930 shares of common stock pursuant to the exercise of unregistered warrants to acquire common stock, pursuant to which exercise we received an aggregate of $23,433. The issuance of the shares was exempt from registration by virtue of Section 4(a)(2) of the Securities Act of 1933, as amended.
During the year ended December 31, 2014, we issued an aggregate of 20,046 shares of common stock pursuant to the cashless exercise of unregistered warrants to acquire common stock having a weighted average exercise price of $5.74 per share. The issuance of the shares was exempt from registration by virtue of Section 4(a)(2) of the Securities Act of 1933, as amended.
Purchases of Equity Securities by the Issuer or Affiliated Purchasers
There were no repurchases of shares of common stock made during the year ended December 31, 2014.
47
The following selected consolidated financial data should be read in conjunction with “Management’s Discussion and Analysis of Financial Condition and Results of Operations”, the consolidated financial statements and related notes, and other financial information included in this Annual Report on Form 10-K.
We derived the consolidated financial data for the years ended December 31, 2014, 2013 and 2012 and as of December 31, 2014 and 2013 from our audited consolidated financial statements, which are included elsewhere in this Annual Report on Form 10-K. We derived the consolidated financial data for the year ended June 30, 2010, the six months ended December 31, 2010 and the year ended December 31, 2011, and as of December 31, 2012, 2011 and 2010 from audited financial statements which are not included in this Annual Report on Form 10-K. Historical results are not necessarily indicative of the results to be expected in future periods.
|
|
|
12 Months ended December 31, 2014 |
|
|
12 Months ended December 31, 2013 |
|
|
12 Months ended December 31, 2012 |
|
|
12 Months ended December 31, 2011 |
|
|
6 Months ended December 31, 2010 |
|
|
12 Months ended June 30, 2010 |
|
|||||||||||||||||||||
|
|
|
(in thousands, except share and per share data) |
|
||||||||||||||||||||||||||||||||||||
|
Revenues |
|
|
|
|
|
|
|
|
|
|
|
|
|
|
|
|
|
|
|
|
|
|
|
|
|||||||||||||||
|
Licensing revenue from related parties(1) |
|
$ |
— |
|
|
$ |
— |
|
|
$ |
— |
|
|
$ |
— |
|
|
$ |
75 |
|
|
$ |
966 |
|
|||||||||||||||
|
Product sales |
|
|
1,543 |
|
|
|
2,665 |
|
|
|
2,291 |
|
|
|
560 |
|
|
|
— |
|
|
|
— |
|
|||||||||||||||
|
Total revenues |
|
|
1,543 |
|
|
|
2,665 |
|
|
|
2,291 |
|
|
|
560 |
|
|
|
75 |
|
|
|
966 |
|
|||||||||||||||
|
Cost of goods sold |
|
|
6,044 |
|
|
|
2,689 |
|
|
|
1,746 |
|
|
|
837 |
|
|
|
— |
|
|
|
— |
|
|||||||||||||||
|
Gross (loss) profit |
|
|
(4,501 |
) |
|
|
(24 |
) |
|
|
545 |
|
|
|
(277 |
) |
|
|
75 |
|
|
|
966 |
|
|||||||||||||||
|
Operating expenses |
|
|
|
|
|
|
|
|
|
|
|
|
|
|
|
|
|
|
|
|
|
|
|
|
|||||||||||||||
|
General and administrative |
|
|
10,655 |
|
|
|
9,757 |
|
|
|
11,665 |
|
|
|
6,776 |
|
|
|
1,590 |
|
|
|
1,543 |
|
|||||||||||||||
|
Research and development, net(2) |
|
|
15,156 |
|
|
|
16,579 |
|
|
|
20,417 |
|
|
|
16,717 |
|
|
|
4,841 |
|
|
|
1,458 |
|
|||||||||||||||
|
Sales and marketing |
|
|
4,482 |
|
|
|
4,730 |
|
|
|
4,193 |
|
|
|
2,471 |
|
|
|
103 |
|
|
|
59 |
|
|||||||||||||||
|
Depreciation of property and equipment and amortization of intangible assets |
|
|
260 |
|
|
|
1,165 |
|
|
|
2,116 |
|
|
|
522 |
|
|
|
264 |
|
|
|
484 |
|
|||||||||||||||
|
Impairment loss and write-off of intangible assets |
|
|
— |
|
|
|
8,619 |
|
|
|
1,213 |
|
|
|
— |
|
|
|
— |
|
|
|
— |
|
|||||||||||||||
|
Foreign exchange (gain) loss |
|
|
151 |
|
|
|
306 |
|
|
|
50 |
|
|
|
99 |
|
|
|
(26 |
) |
|
|
121 |
|
|||||||||||||||
|
Operating expenses |
|
|
30,704 |
|
|
|
41,156 |
|
|
|
39,654 |
|
|
|
26,585 |
|
|
|
6,772 |
|
|
|
3,665 |
|
|||||||||||||||
|
Operating loss |
|
|
35,205 |
|
|
|
41,180 |
|
|
|
39,109 |
|
|
|
26,862 |
|
|
|
6,697 |
|
|
|
2,699 |
|
|||||||||||||||
|
Amortization of deferred financing costs and debt discounts |
|
|
292 |
|
|
|
240 |
|
|
|
100 |
|
|
|
12 |
|
|
|
2 |
|
|
|
157 |
|
|||||||||||||||
|
Financial charges (income) (3) |
|
|
11,737 |
|
|
|
(7,433 |
) |
|
|
— |
|
|
|
3,870 |
|
|
|
155 |
|
|
|
962 |
|
|||||||||||||||
|
Loss (gain) on debt extinguishment |
|
|
171 |
|
|
|
(314 |
) |
|
|
— |
|
|
|
— |
|
|
|
— |
|
|
|
— |
|
|||||||||||||||
|
Interest revenue from related parties |
|
|
— |
|
|
|
— |
|
|
|
— |
|
|
|
— |
|
|
|
(73 |
) |
|
|
(89 |
) |
|||||||||||||||
|
Equity participation in losses of equity method investments(4) |
|
|
— |
|
|
|
15 |
|
|
|
274 |
|
|
|
— |
|
|
|
1,548 |
|
|
|
4,340 |
|
|||||||||||||||
|
Other income |
|
|
(183 |
) |
|
|
— |
|
|
|
— |
|
|
|
— |
|
|
|
|
|
|
|
— |
|
|||||||||||||||
|
Gain on re-measurement of Bioamber S.A.S.(4) |
|
|
— |
|
|
|
— |
|
|
|
— |
|
|
|
— |
|
|
|
(6,216 |
) |
|
|
— |
|
|||||||||||||||
|
Loss before income taxes |
|
|
47,222 |
|
|
|
33,688 |
|
|
|
39,483 |
|
|
|
26,585 |
|
|
|
2,113 |
|
|
|
8,069 |
|
|||||||||||||||
|
Income taxes |
|
|
75 |
|
|
|
103 |
|
|
|
55 |
|
|
|
108 |
|
|
|
— |
|
|
|
— |
|
|||||||||||||||
|
Net loss |
|
$ |
47,297 |
|
|
$ |
33,791 |
|
|
$ |
39,538 |
|
|
$ |
30,852 |
|
|
$ |
2,113 |
|
|
$ |
8,069 |
|
|||||||||||||||
|
Net loss attributable to: |
|
|
|
|
|
|
|
|
|
|
|
|
|
|
|
|
|
|
|
|
|
|
|
|
|||||||||||||||
|
BioAmber Inc. shareholders |
|
$ |
46,422 |
|
|
$ |
33,218 |
|
|
$ |
39,351 |
|
|
$ |
30,621 |
|
|
$ |
2,011 |
|
|
$ |
7,992 |
|
|||||||||||||||
|
Non-controlling interest |
|
|
875 |
|
|
|
573 |
|
|
|
187 |
|
|
|
231 |
|
|
|
102 |
|
|
|
77 |
|
|||||||||||||||
|
|
|
$ |
47,297 |
|
|
$ |
33,791 |
|
|
$ |
39,538 |
|
|
$ |
30,852 |
|
|
$ |
2,113 |
|
|
$ |
8,069 |
|
|||||||||||||||
|
Net loss per share attributable to BioAmber Inc. shareholders—basic(5) |
|
$ |
2.32 |
|
|
$ |
2.13 |
|
|
$ |
3.82 |
|
|
$ |
3.89 |
|
|
$ |
0.45 |
|
|
$ |
2.75 |
|
|||||||||||||||
|
Weighted-average of common shares outstanding— basic |
|
|
20,016,180 |
|
|
|
15,590,814 |
|
|
|
10,296,633 |
|
|
|
7,864,371 |
|
|
|
4,497,258 |
|
|
|
2,905,876 |
|
|||||||||||||||
|
(1) |
Consists of licensing fees charged to Bioamber S.A.S. prior to our acquisition of control of Bioamber S.A.S. effective October 1, 2010. BioAmber S.A.S was liquidated into BioAmber Inc. on December 29, 2014. |
|
(2) |
Research and development expenses include some costs of production related to product development and are net of research and development tax credits. |
|
(3) |
Financial charges consist primarily of accreted interest on convertible notes we issued in June 2009 and November 2010 and which were subsequently converted to shares of common stock. Financial charges also include the recording of the increases in fair value of contingent consideration in connection with the acquisition of Sinoven and held in escrow until September 30, 2011. This escrow was modified on October 1, 2011 when we acquired the remaining 25% ownership of Sinoven and on March 1, 2013 pursuant to entering into a Termination and Release Agreement. For the year ended December 31, 2014 and |
48
|
December 31, 2013, financial charges (income), include interest on long-term debt, end of term charge accretion from the HTGC loan, and the recognition of gains or losses resulting from the mark-to-market adjustment required at the balance sheet date on the warrants issued in connection with the IPO completed on May 9, 2013. |
|
(4) |
Until October 1, 2010, when we acquired control of Bioamber S.A.S., we recorded our share of Bioamber S.A.S.’s losses in excess of the investment’s book value. Upon completion of our acquisition of Bioamber S.A.S., the 50% held equity interest, net of long-term accounts receivable from Bioamber S.A.S., was re-measured to its estimated fair value resulting in a gain of $6,216,000 in the six months ended December 31, 2010. BioAmber S.A.S was liquidated into BioAmber Inc. on December 29, 2014. |
|
|
|
As of December 31, 2014 |
|
|
As of December 31, 2013 |
|
|
As of December 31, 2012 |
|
|
As of December 31, 2011 |
|
|
As of December 31, 2010 |
|
|||||
|
|
|
(in thousands) |
|
|||||||||||||||||
|
Cash |
|
$ |
51,043 |
|
|
$ |
83,728 |
|
|
$ |
25,072 |
|
|
$ |
47,956 |
|
|
$ |
1,268 |
|
|
Working capital |
|
|
34,192 |
|
|
|
77,150 |
|
|
|
22,162 |
|
|
|
44,910 |
|
|
|
(2,438 |
) |
|
Total assets |
|
|
152,440 |
|
|
|
114,079 |
|
|
|
50,004 |
|
|
|
68,096 |
|
|
|
20,879 |
|
|
Long-term debt, including current portion |
|
|
37,631 |
|
|
|
29,730 |
|
|
|
2,600 |
|
|
|
255 |
|
|
|
— |
|
|
Total liabilities |
|
|
70,721 |
|
|
|
46,945 |
|
|
|
12,206 |
|
|
|
8,681 |
|
|
|
7,024 |
|
|
Accumulated deficit |
|
|
(161,466 |
) |
|
|
(115,044 |
) |
|
|
(81,826 |
) |
|
|
(42,475 |
) |
|
|
(11,854 |
) |
|
Shareholders’ equity |
|
|
57,529 |
|
|
|
67,134 |
|
|
|
37,798 |
|
|
|
59,415 |
|
|
|
13,855 |
|
49
The following discussion and analysis of our financial condition and results of operations should be read in conjunction with the financial statements and related notes appearing elsewhere in this Annual Report on Form 10-K. The following discussion contains forward-looking statements that reflect our plans, estimates, and beliefs. Our actual results could differ materially from those discussed in the forward-looking statements. Factors that could cause or contribute to these differences include those discussed below and elsewhere in this Annual Report on Form 10-K, particularly in “Risk Factors.”
Additional Information
Our investors and others should note that we announce material financial and other information using our company website (www.bio-amber.com), our investor relations website (investor.bio-amber.com), SEC filings, press releases, public conference calls and webcasts. In addition, our Annual Reports on Form 10-K, Quarterly Reports on Form 10-Q, Current Reports on Form 8-K and amendments to those reports filed or furnished pursuant to Section 13(a) or 15(d) of the Securities Exchange Act of 1934 are available free of charge through the investor relations page of our internet website as soon as reasonably practicable after we electronically file such material with, or furnish it to, the Securities and Exchange Commission. Alternatively, these reports may be accessed at the SEC’s website at www.sec.gov. Information about BioAmber, its business, and its results of operations may also be announced by posts on the following social media channels:
|
● |
BioAmber’s Twitter feed (www.twitter.com/BioAmber) |
|
● |
BioAmber’s Facebook feed (www.facebook.com/bioamber) |
|
● |
BioAmber’s LinkedIn feed (www.linkedin.com/company/bioamber-inc.) |
The information that we post on these social media channels could be deemed to be material information. As a result, we encourage investors, the media, and others interested in BioAmber to review the information that we post on these social media channels. These channels may be updated from time to time on BioAmber’s investor relations website.
Overview
We are an industrial biotechnology company producing sustainable chemicals. Our proprietary technology platform combines industrial biotechnology and chemical catalysis to convert renewable feedstocks into sustainable chemicals that are cost-competitive replacements for petroleum-derived chemicals, which are used in a wide variety of everyday products including plastics, resins, food additives and personal care products. We currently sell our first product, bio-succinic acid, to customers in a variety of chemical markets. We intend to produce bio-succinic acid that is cost-competitive with succinic acid produced from petroleum at our facility under construction in Sarnia, Ontario. We produced our bio-succinic acid in a large-scale demonstration facility using a 350,000 liter fermenter in Pomacle, France, which we believe to be among the largest bio-based chemical fermenters in the world.
We believe we can produce bio-succinic acid that is cost-competitive with succinic acid produced from oil priced as low as $35 per barrel, based on management’s estimates of production costs at our planned facility in Sarnia, Ontario and an assumed corn price of $6.50 per bushel. While we can provide no assurance that we will be able to secure corn at $6.50 per bushel given the fluctuations in corn prices, we believe this assumption is reasonable given the historic price of corn and management’s expectations as to their ability to manage the cost of corn and other inputs for our planned facility in Sarnia, Ontario. Over the past five years, the price of corn ranged from a low of $2.68 per bushel to a high of $8.44 per bushel. As of March 13, 2015, the spot price was $3.59 per bushel and the six month forward price was $3.88 per bushel. We estimate that a $1.00 increase or decrease in the per bushel price of corn would result in just a $0.054 per pound change in our variable cost of our bio-succinic acid. We expect the productivity of our yeast and on-going process improvements to further reduce our production costs. Our ability to compete on cost is not dependent on government subsidies or tariffs. We are currently building our first facility in cooperation with Mitsui in Sarnia, Ontario. We began commissioning and start-up in March 2015 and we expect this facility to be mechanically complete in the second quarter of 2015. We also intend to build and operate additional facilities over the next three to five years.
We manufactured our bio-succinic acid at a large-scale demonstration facility in Pomacle, France for over four years. We shipped commercial quantities to customers, such as shipments of one ton super sacks and container loads. We and our customers used the products produced at the facility as part of our efforts to validate and optimize our process and to continue to refine and improve our bio-succinic acid to meet our customers’ specifications. As we scale-up our manufacturing capacity and prepare to manufacture and commercialize, we expect the majority of our revenue will initially come from sales of bio-succinic acid. We also intend to leverage our proprietary technology platform and expertise in the production of bio-succinic acid to target additional high value-added products, such as bio-based 1,4 Butanediol (BDO), bioplastics, de-icing solutions and plasticizers. In addition, we are also working to expand our product portfolio to additional building block chemicals, including adipic acid and caprolactam.
50
On May 9, 2013, we raised net proceeds of $71.7 million from the initial public offering of our equity securities. In addition, on June 27, 2013, we received net proceeds of $24.2 million from a three-year term loan with Hercules Technology Growth Capital, or HTGC. On July 21, 2014, we completed the initial closing of a secondary public offering and issued 2,800,000 shares of common stock, at a public offering price of $12.00 per share, with an option to the underwriters to purchase an additional 420,000 shares of common stock at the public offering price, less underwriting discounts and commissions. This option to purchase additional shares was subsequently fully exercised, and on July 24, 2014, we completed the sale of these additional shares, bringing the gross aggregate proceeds from the second public offering to approximately $38.6 million. We received approximately $36.0 million in net proceeds from the second public offering, after deducting underwriting discounts and commissions and expenses payable by us.
As of December 31, 2014, we had raised an aggregate of $221.6 million from public offerings of our equity securities, private placements of our equity securities, and the sale of shares issued by a subsidiary and convertible notes.
Manufacturing Expansion Plan
In order to support our growth strategy, we have begun to rapidly expand our manufacturing capacity. We entered into a joint venture with Mitsui to finance, build and operate a manufacturing facility in Sarnia, Ontario through our BioAmber Sarnia subsidiary in which we own a 70% equity interest and Mitsui owns the remaining 30%. The joint venture agreement, which was entered into on November 2, 2011 and subsequently amended on January 24, 2014, also establishes our non-binding intent to build and operate a BDO and/or an additional succinic acid production facility with Mitsui, which we expect to occur by the end of 2017. As part of the amendment, Mitsui increased its maximum capital commitment to the project from $23.7 million to $45.6 million in order to maintain a 30% equity stake in the joint venture. In exchange, Mitsui obtained the right to sell us back its shares in the Sarnia joint venture under certain specific circumstances: (i) Mitsui has the right to sell its shares and we have the obligation to purchase those shares at 100% of the investment value if the cost of the Sarnia facility is greater than $140 million and we do not provide the additional funds to complete the facility, with a corresponding increase in our pro rata share of the joint venture; (ii) in the event of an occurrence of a dissolution event of the joint venture until December 31, 2020, Mitsui has the right to sell its shares and we have the obligation to purchase those shares at 100% of the investment value, with the dissolution event consisting of the Sarnia plant not being operational by January 31, 2016, cumulative losses accrued from 2016 through 2020 exceeding 75% of paid-in capital, no after-tax profit earned in any three consecutive years from 2016 onwards, and any act of insolvency, bankruptcy, or similar event, and (iii) until December 31, 2018, Mitsui in its sole discretion may sell its shares and we must purchase those shares at a 50% discount to their investment value.
For future facilities, we expect to enter into agreements with minority interest partners and we intend to partially finance these facilities with debt. We expect to fund the remaining costs of our initial phase of our facility under-construction in Sarnia, Ontario using available cash, a portion of the $71.7 million in net proceeds from the initial public offering of our equity securities, which was completed on May 9, 2013, equity from our partner Mitsui, interest free and low-interest loans, government grants and the net proceeds of approximately $36.0 million from second public offering. For future facilities, we currently expect to fund the construction of these facilities using internal cash flows, partner equity, project financing and we may also require fundraising through the capital markets.
We also expect to grow our revenue base by developing new value-added applications and derivative products. On January 22, 2014, we entered into a take-or-pay supply contract with Vinmar International Ltd., or Vinmar, to supply BDO from a planned facility of 100,000 metric ton, or MT. Under the terms of the 15-year master off-take agreement, Vinmar has committed to purchase 100% of the BDO produced in a 100,000 MT per year capacity plant that we plan to build in North America and commission in 2017. In addition to a guarantee of the purchase of the off-take from the planned facility, Vinmar plans to take an equity stake of at least 10% in the facility and assist in seeking other financing for the planned facility. BDO is a building block chemical that is used in a wide range of products, including engineering plastics for the automotive industry, polyurethanes, biodegradable plastics, and spandex. While this agreement is binding, our inability to finance and construct the BDO plant would relieve Vinmar of its obligation to purchase BDO under the terms of the take-or-pay agreement. We believe the current size of the global BDO market is approximately $4 billion. We produce BDO by combining our succinic acid technology with a catalyst technology licensed from DuPont. We believe our bio-based BDO is cost competitive with petroleum-derived BDO. To date, we have validated the high quality of our BDO with over 20 purchasers of petroleum-derived BDO.
We signed a second take-or-pay agreement on July 3, 2014 with Vinmar to supply 10,000 tons of bio-succinic acid per year for 15 years from the Sarnia plant. The take-or-pay agreement also includes an expansion to the BDO facility previously announced of an additional 70,000 tons per year of bio-succinic acid, with Vinmar off-taking 70% of the bio-succinic acid produced for 15 years. Vinmar also commits to off-take 75% of the production from a new, third bio-succinic acid plant with 200,000 MT capacity that BioAmber plans to commission in 2020.
51
Sarnia Facility
The first facility we are currently building in partnership with Mitsui is located in a bio-industrial park in Sarnia, Ontario. We began commissioning and start-up in March 2015 and we expect this facility to be mechanically complete in the second quarter of 2015. The facility is being constructed to have an initial projected capacity of 30,000 MT of bio-succinic acid and could subsequently be expanded to produce another 20,000 MT of bio-succinic acid. Completion of this initial phase of our facility under-construction in Sarnia is expected to cost approximately $125.0 million, which we plan to fund through capital contributions of $40.6 million and $17.4 million from us and from Mitsui, respectively, and an additional CAD$72.0 million ($64.2 million) in interest free and low-interest loans and governmental grants that have been committed, subject to our meeting certain milestones, by various governmental authorities in Canada. The milestones vary depending on the government grant or loan. We have received loans and grants proceeds from Canadian government agencies of CAD$33.9 million as of December 31, 2014.
Additional Facilities
Our agreement with Mitsui contemplates the potential construction and operation of an additional manufacturing facility. We have entered into a take-or-pay contract with Vinmar to purchase 100% of a planned 100,000 MT per year BDO facility in North America, to be expanded by an additional 70,000 MT per year of succinic acid, with Vinmar off-taking 70% of the bio-succinic acid produced for 15 years. In addition, Vinmar plans to invest at least 10% in the equity of the facility and will help us to secure other funding to construct the planned facility. We anticipate that Vinmar and other potential parties will be equity partners in this facility, but we may also seek low interest loans and government grants to fund the facility, which would substantially reduce our equity funding requirement. Based on current estimates and assumptions, we expect our second manufacturing facility to have a projected initial BDO capacity of 100,000 MT and bio-succinic acid capacity of 70,000 MT with construction costs of approximately $500.0 million. This facility is expected to be mechanically complete in early 2018.
Our second take-or-pay contract with Vinmar also commits to off-take 75% of the production from a third bio-succinic acid plant with 200,000 MT per year capacity that we plan to commission in 2020. As part of the BDO take-or-pay agreement, Vinmar has an option to secure 100% of the output from a fourth manufacturing facility that would produce 100,000 metric tons of BDO per year and would be commissioned in 2022 or 2023.
Our business strategy is to leverage the value of our technology by building and operating production facilities around the world. However, depending on our access to capital and third-party demand for our technology, we may also enter into technology licenses on an opportunistic basis.
Performance Drivers
We expect that the fundamental drivers of our results of operations going forward will be the following:
Commercialization of our products. We commenced recognizing revenue from sales of our existing bio-succinic acid product in 2011. Our ability to grow revenue from this product will be dependent on expanding the addressable market for succinic acid using our low-cost, bio-based alternative. We also expect to grow our revenue base by developing new value-added applications and derivative products. The supply agreement we signed with PTTMCC Biochem Company Limited, or PTTMCC Biochem, on April 18, 2014 is an example of market development in new applications, and we expect to sign additional supply agreements in other new applications such as artificial leather, plasticizers, polyurethanes, personal care products and foams and heat transfer fluids, prior to Sarnia starting production. We also plan to develop and commercialize derivatives of succinic acid, such as BDO, and to target large and established chemical markets such as adipic acid, where succinic acid can partially substitute the incumbent chemical. Our revenue for future periods will be impacted by our ability to develop new applications and the speed with which we are able to bring our succinic acid derivatives to market. To accelerate this process, we are developing our sales and marketing capability and entering into distribution and joint development agreements with strategic partners. On January 22, 2014, we entered a take-or-pay supply contract with Vinmar to supply BDO from a planned 100,000 MT facility. Under the terms of the 15-year master off-take agreement, Vinmar has committed to purchase 100% of the BDO produced in a 100,000 MT per year capacity plant that we plan to build in North America and commission in 2018. We entered into a second take-or-pay agreement with Vinmar on July 3, 2014 for an additional 70,000 MT per year of bio-succinic acid, with Vinmar off-taking 70% of the bio-succinic acid produced for 15 years. Our second take-or-pay contract withVinmar also commits them to off-take 75% of the production from a third bio-succinic acid plant with 200,000 MT per year capacity that we plan to commission in 2020.
We are also engaging in a collaborative process with our customers to test and optimize new applications and derivative products such as BDO in order to ensure that they meet specifications in each of their potential applications. We will continue to seek to establish supply agreements and distribution agreements with strategic customers as we expand our markets and product offerings after Sarnia has been commissioned. For example, we recently entered into a five year exclusive supply agreement with Xuchuan Chemicals, a global leader in polyester polyols, to supply bio-based succinic acid from our Sarnia facility to be used in manufacturing
52
cast polyurethane elastomers. Xuchuan is initially launching Polyurethane (PU) systems for cast polyurethane elastomers (CPU) made with bio-succinic acid. CPU is used in applications including automotive instruments, caster wheels, industrial and mining equipment, power tools, industrial tires, coating rolls, drive belts, mold makers and hoses. By replacing adipic acid with succinic acid, Xuchuan has produced CPUs that offer better properties: they are more abrasion/scratch resistant and more resistant to solvents. Other applications for our bio-based succinic acid include resins for shoe soles and synthetic leather.
Production capacity. Our ability to further lower our production costs and drive customer adoption of our product is dependent on our manufacturing expansion strategy. In particular, in our planned facility in Sarnia, Ontario, we expect to benefit from significantly lower operating expenses than those in the large-scale demonstration facility in Pomacle, France due to lower expected raw material, utility and other costs. For example, our 2014 costs of glucose from wheat used in the large-scale demonstration facility we operated in Pomacle, France was 110% higher than the expected costs of glucose from corn wet millers to be used in our planned facility in Sarnia, Ontario. Our 2014 cost of steam in Pomacle, France was 275% higher than the expected cost in Sarnia, Ontario. We also project direct labor costs, electricity costs and other raw material costs in Sarnia, Ontario, to be lower than in Pomacle, France. If we were to adjust the current costs of goods sold in the large-scale demonstration facility we operated in Pomacle, France for the lower expected raw material and utility costs, the economies of scale and the engineering design improvements we have incorporated into our planned facility in Sarnia, Ontario, our gross profit from products sold would increase significantly. As a result, we expect to produce bio-succinic acid that is cost-competitive with succinic acid produced from oil priced as low as $35 per barrel. We expect to further reduce costs by the transition from our E. coli-based technology to our yeast-based technology and by implementing on-going process improvements. We intend to capitalize on our first-to-market advantage by rapidly expanding our production capacity and building additional facilities. Our results will be impacted by the speed with which we execute on this strategy and the capital costs and operating expenses of each of these facilities.
Feedstock and other manufacturing input prices. We use sugars that can be derived from wheat, corn and other feedstocks. We intend to locate our facilities near readily available sources of sugars and other inputs, such as steam, electricity, hydrogen and carbon dioxide, in order to ensure reliable supply of cost-competitive feedstocks and utilities. While our process requires less sugar than most other renewable products and is therefore less vulnerable to sugar price increases relative to other bio-based processes, our margins will be affected by significant fluctuations in these required inputs.
Petroleum prices. We expect sales of our bio-based products to be impacted by the price of petroleum. In the event that petroleum prices increase, we may see increased demand for our products as chemical manufacturers seek lower-cost alternatives to petroleum-derived chemicals. Conversely, a long-term reduction in petroleum prices below $35 per barrel may result in our products being less competitive with petroleum-derived alternatives. In addition, oil prices may also impact the cost of certain feedstocks we use in our process, which may affect our margins.
Recent Developments
Vinmar Take-or-Pay Agreements
On January 22, 2014, we entered into a take-or-pay supply contract with Vinmar, to supply BDO from a planned 100,000 MT facility. Under the terms of the 15-year master off-take agreement, Vinmar has committed to purchase 100% of the BDO produced in a 100,000 MT per year capacity plant that we plan to build in North America and commission in early 2018. In addition to a guarantee of the purchase of the off-take from the planned facility, Vinmar plans to take an equity stake of at least 10% in the facility and assist in seeking other financing for the planned facility. While this agreement is binding, our inability to finance and construct the BDO plant would relieve Vinmar of its obligation to purchase BDO under the terms of the take-or-pay agreement.
On July 3, 2014, we entered into a second take-or-pay agreement with Vinmar to supply 10,000 MT per year of bio-succinic acid for 15 years from the Sarnia plant. The agreement also includes an expansion of the BDO facility previously announced that will supply 70,000 MT per year of bio-succinic acid, with Vinmar off-taking 70% of the bio-succinic acid produced for 15 years. Additionally, Vinmar also commits to off-take 75% of the production from a new, third bio-succinic acid plant with 200,000 MT per year capacity that BioAmber plans to commission in 2020.
Joint Venture with Mitsui and Co. Ltd.
On January 24, 2014, we signed an amended and restated joint venture agreement with Mitsui. The amendment contained several provisions designating each party’s rights and obligations with respect to funding, construction and operation of the 30,000 MT bio succinic acid facility in Sarnia using the yeast technology and a potential future facility. Mitsui invested an additional CAD$9.0 million of equity on January 29, 2014 in BioAmber Sarnia maintaining its 30% ownership. Certain changes made by the amendment, among others included a removal of exclusivity restrictions for constructing future facilities for succinic acid and or BDO, an increase in total cash committed to the project by Mitsui under certain conditions, the possibility for additional strategic
53
partners to participate in the Sarnia project or future projects with Mitsui and BioAmber, and made changes to both party’s rights and obligations under the buy/sell provisions of the Agreement.
On August 15, 2014, Mitsui invested an additional $16.5 million (CAD$18.0 million) of equity in BioAmber Sarnia and maintained their 30% ownership.
Loan from Agriculture Canada
On March 10, 2014, BioAmber Sarnia entered into a repayable contribution agreement in the form of a non-interest bearing loan, with the Minister of Agriculture and Agri-Food of Canada in the amount of CAD$10 million for the AgriInnovation Program. This loan provides for progressive disbursements as eligible costs are incurred for building construction, installation of equipment and start-up and commissioning of the Sarnia facility. The loan is repayable in equal, monthly installments beginning March 31, 2016 through March 31, 2025 and contains various legal and financial covenants ordinarily found in such government agency loan agreements. As of December 31, 2014, we have received $6.3 million (CAD$7.3 million).
Supply Agreements for Bio-Succinic Acid Produced at Sarnia Facility
On April 18, 2014, we entered into a three year supply agreement with PTT MCC Biochem, a joint venture between PTT Public Company Limited and Mitsubishi Chemical Corporation that was established to produce and sell polybutylene succinate, or PBS, a biodegradable plastic made from succinic acid and BDO. PTTMCC is constructing a PBS plant in Thailand that is expected to be operational in the first half of 2015 and consume approximately 14,000 tons of succinic acid per year at full capacity. This supply agreement provides that we will exclusively supply a minimum of 80% of PTTMCC’s total bio-succinic needs until the end of 2017, with approximately 50% of the total purchases under take-or-pay terms. We also entered into a second take-or-pay agreement with Vinmar on July 3, 2014, for 10,000 tons per year for 15 years from the Sarnia plant. These are two of many potential customers and applications that we are targeting for the bio-succinic acid that we plan to produce at our Sarnia facility, and we expect to enter into additional definitive supply agreements in advance of mechanical completion in the second quarter of 2015. These supply agreements reflect our ongoing efforts to expand the succinic acid addressable market into new applications such as PBS.
We have also entered into several agreements and MOUs that contemplate, but do not obligate, us to supply approximately 144,000 metric tons of bio-succinic acid, and, as we continue construction of our planned facility in Sarnia, Ontario, we are actively seeking to enter into definitive supply agreements and form new relationships with potential customers.
On October 2, 2014, we entered into a five year, exclusive supply agreement with Xuchuan Chemicals, a global leader in polyester polyols, to supply bio-based succinic acid to be used in manufacturing cast polyurethane elastomers. The contract will run from 2015 through to the end of 2019.
Comerica Bank, Export Development Canada and Farm Credit Canada Senior Secured Term Loan
On June 20, 2014, our BioAmber Sarnia joint venture signed a loan agreement with a financial consortium, comprised of Comerica Bank, Export Development Canada and Farm Credit Canada, for a senior secured loan in the principal amount of CAD$20.0 million. The loan will bear interest at a floating interest rate per annum based on the greater of (i) the Canadian prime rate and (ii) the Canadian dealer offered rate plus 1%, in either case plus an interest spread of 5%. There will be an initial interest-only period from draw down of the term loan until the first payment of principal. The loan’s principal will be repaid in 26 equal, quarterly installments beginning three months after the completion of the commissioning and start-up phase of the Sarnia plant, but at the latest on June 30, 2015. The disbursement of the loan, net of a 2.5% upfront loan fee, is subject to customary conditions, including continued progress on the construction of the Sarnia plant, which are expected to be met in March 2015. Until drawdown of the CAD$20.0 million term loan, BioAmber Sarnia will pay a 1.0% per annum commitment fee on the undrawn amount.
BioAmber Sarnia may prepay all or a portion of the loan outstanding from and after the date of the first principal repayment, without penalty. BioAmber Sarnia’s obligations under the loan are secured by (i) a security interest on all of BioAmber Sarnia’s assets and (ii) a pledge of all the shares of BioAmber Sarnia. In addition, we will provide the lenders with a guarantee representing 70% of the secured obligations under the loan, and Mitsui & Co., Ltd. will provide a guarantee representing 30% of the secured obligations under the loan that is capped at CAD$6.0 million plus all accrued interest on the secured obligations and fees and expenses. The proceeds of the loan will be used by BioAmber Sarnia to complete the ongoing construction of the Sarnia Plant and fund its startup and commissioning.
The loan agreement contains certain representations and warranties, affirmative covenants, negative covenants and conditions that are customarily required for similar financings, including in connection with the disbursement of the loan. The financial covenants require BioAmber Sarnia to maintain a minimum debt service ratio of 1.75 on a historical basis, at the end of any and each quarter during the term of the loan. The agreement also contains customary events of default (subject, in certain instances, to specified grace periods) including, but not limited to, the failure to make payments of interest or premium, if any, on, or principal under the loan, the failure to comply with certain covenants and agreements specified in the agreement, the occurrence of a material adverse effect,
54
defaults in respect of certain other indebtedness and agreements, and certain events of insolvency. If an event of default occurs, the principal, premium, if any, interest and any other monetary obligations on all the then outstanding amounts under the loan may become due and payable immediately.
Additional grant from Sustainable Development Technology Canada (SDTC)
On July 2, 2014, we announced that our BioAmber Sarnia subsidiary had secured a CAD$7.0 million increase in the initial grant of CAD$7.5 million from SDTC pursuant to a contribution agreement dated November 29, 2011. This grant, now totaling CAD$14.5 million, is and will be used to support the ongoing construction of the Sarnia Plant.
Second Public Offering
On July 21, 2014, we closed a public offering of shares of our common stock. In the Offering, we issued 2,800,000 shares of common stock, at an offering price of $12.00 per share, with an option for the underwriters to purchase an additional 420,000 shares of common stock at the same price, less underwriting discounts and commissions. The underwriters subsequently exercised this option in full, which closed on July 24, 2014. We received $36.0 million in net proceeds from the Offering, net of fees, expenses and underwriting discounts.
Repayment of HTGC loan
On December 17, 2014, we voluntarily paid off the outstanding balance and terminated our loan agreement with HTGC. The payoff amount of $22.4 million included the outstanding principal amount of $19.2 million, an end of term charge of $2.9 million, a prepayment fee of $192,000, accrued interest of $123,000, and other legal fees. In connection with such repayment, HTGC terminated its security interest in our assets which were subject to the loan agreement.
Tennenbaum Capital Partners (TCP) loan
On December 17, 2014, we entered into a Loan and Security Agreement (the “Agreement”) with funds managed by TCP. The proceeds received were used to repay in full, the Loan and Security Agreement with HTGC that was entered into on June 27, 2013, and for general corporate purposes.
Pursuant to the Agreement, TCP agreed to make a senior secured term loan of $25 million (the “Facility”), which was funded on December 18, 2014, net of a 2.0% commitment fee. The term loan is repayable over 36 months after closing at a floating interest rate per annum that is the greater of 9.50% or the 3 month LIBOR rate plus 9.27%, and is subject to an end of term charge of 8.25% based on the $25 million loaned (the “End of Term Fee”) payable on the date on which the term loan is paid or becomes due and payable in full. There will be an initial interest-only period until September 30, 2015, which may be extended for a first additional period of three months and a second additional period of six months, subject to certain conditions. At our option, we may prepay some or all of the loan balance, subject to a prepayment fee equal to 3% of the amount prepaid during the term of the Agreement (and a pro rata portion of the End of Term Fee if the prepayment is less than the full amount of the Facility).
The loan obligations are secured by a security interest on substantially all of our assets (subject to certain exceptions), including our intellectual property, but excluding certain identified licenses from third parties and our equity interest in our subsidiary, BioAmber Sarnia subject to the conditions specified in the Agreement. The security interest does not apply to any assets owned by BioAmber Sarnia, the entity that will own our Sarnia facility.
Financial Operations Overview
Revenue
Revenue comprises the fair value of the consideration received or receivable for the sale of products and services in the ordinary course of our activities and is presented net of discounts.
We expect revenue to grow as our sales and marketing efforts continue and our planned facility in Sarnia, Ontario reaches the commercial production stage during the second quarter of 2015. We currently sell products manufactured in Pomacle, France, where our access to this facility was extended through the end of 2014.
55
Cost of Goods Sold
Cost of goods sold consists of the cost to produce finished goods at the large-scale demonstration facility in Pomacle, France under a tolling arrangement that ended on December 31, 2014. For the year-ended December 31, 2014, the cost of goods sold also includes an inventory reserve due to the Pomacle production costs being higher than the market price. The costs to produce product in this facility was higher than we expect to incur in the future at Sarnia due to the higher raw material costs such as sugar and utilities, the amount of fixed costs relative to the total production capacity available to us, and the inefficiencies created by the need to stop production from time to time to allocate the capacity to other parties. Going forward, from the succinic-acid produced in Sarnia, we expect our cost of goods sold as a percent of revenues to decrease as we will transition from a demo plant production to a full scale commercial production and will benefit from efficiencies in utilizing our yeast in our fermentation process at our Sarnia facility.
Operating Expenses
Operating expenses consist of general and administrative expenses, research and development expenses, net, sales and marketing expenses, depreciation of property and equipment, amortization of intangible assets, impairment losses, write-offs of property and equipment and intangible assets and foreign exchange gains and losses.
General and Administrative Expenses
General and administrative expenses consist of personnel costs (salaries, and other personnel-related expenses, including stock-based compensation), recruitment and relocation expenses, accounting and legal fees, business travel expenses, rent and utilities for the administrative offices, web site design, press releases, membership fees, office supplies, corporate insurance programs, administration expenses related to our Sarnia facility, and other miscellaneous expenses.
We expect these expenses to increase in the future as we hire additional management and operational employees to respond to a growing revenue base and add infrastructure to support it, expand our finance and administration staff, and incur additional compliance and related costs associated with being a public company.
Research and Development Expenses, Net
Research and development expenses, net consist primarily of fees paid for contract research and internal research costs in connection with the development, expansion and enhancement of our proprietary technology platform. These costs also include personnel costs (salaries and other personnel-related expenses, including stock-based compensation), expenses incurred in our facility located in Plymouth, Minnesota, laboratory supplies, research consultant costs, patent and trademark maintenance costs, royalties, professional and consulting fees and business travel expenses. It also includes development costs for bringing our Sarnia facility in line for production.
We expect research and development expenses, including our patent maintenance expenses, to increase as we continue to invest in the deployment and implementation of our bio-succinic acid and derivative technologies in a commercial scale manufacturing facility. We expect to continue conducting our research and development in-house by utilizing our 27,000 square foot facility in Plymouth, Minnesota. Certain research and development activities that can be performed more effectively by outside consultants will be performed with their respective expertise as required.
Sales and Marketing Expenses
Sales and marketing expenses consist primarily of personnel costs (salaries, and other personnel-related expenses, including stock-based compensation), marketing services, product development costs, advertising, selling and distributor costs and feasibility study fees.
We expect to increase our sales and marketing efforts as we look to establish additional strategic alliances, grow our commercial customer base and expand our product offerings. As we transition to our commercial operations in our facility in Sarnia, Ontario, we expect to significantly increase our sales and marketing personnel and programs to support the expected expansion of our business. This may include increasing the use of distributors and other commercial partners where deemed appropriate.
Depreciation of Property and Equipment and Amortization of Intangible Assets
Depreciation of property and equipment consists primarily of the depreciation of our office furniture, research and development equipment and computer equipment and software, which is depreciated using the straight-line method over their estimated useful lives. Amortization of intangible assets consists primarily of the amortization of certain in-process research and development acquired technology, patents technology license, which are amortized using the straight-line method over their estimated useful lives. We
56
expect depreciation of property and equipment to increase significantly as our planned manufacturing facilities are put into use. As of December 31, 2014, we received $29.2 million in government grants and loans in relation to our facility in Sarnia, Ontario, of which, $14.4 million was applied as a reduction of construction in-progress. This will result in reduced depreciation expense over the useful life of the asset.
Foreign Exchange Loss
We expect to conduct operations throughout the world. Our financial position and results of operations will be affected by economic conditions in countries where we plan to operate and by changing foreign currency exchange rates. We are exposed to changes in exchange rates in Europe and Canada. The Euro and the Canadian dollar are our most significant foreign currency exchange risks. A strengthening of the Euro and the Canadian dollar against the U.S. dollar may increase our revenues and expenses since they are expressed in U.S. dollars. As we move our production to our manufacturing facility under construction in Sarnia, Ontario, we expect our foreign currency risk to continue as a significant portion of our uses of cash will be denominated in Canadian dollars while our sources of cash will be primarily in U.S. dollars. We will monitor foreign currency exposures and will look to mitigate exposures through normal business operations such as manufacturing and selling in the same currencies where practical or buying required currencies at spot where advantageous. We may use forward contracts or currency swaps to mitigate any remaining exposures.
Amortization of Deferred Financing Costs and Debt Discounts
Amortization of deferred financing costs and debt discounts consists primarily of costs from past financings that are recognized over the life of the funding instrument and will continue to increase in line with the expenses incurred to obtain future financing. Those costs are deferred and amortized on a straight-line basis over the term of the related debt. Amortization of deferred financing costs and debt discounts also includes the accretion of the debt discount on the interest free or low-interest loans received from the government agencies if the expenditures for which the loans were received have not yet been incurred.
Financial Charges (Income), Net
Financial charges (income), include interest on long-term debts, end of term accretion charge from the HTGC, interest revenue and the recognition of gains or losses resulting from the mark-to-market adjustment required at the balance sheet date on the warrants issued in connection with our initial public offering, or IPO completed on May 9, 2013.
We account for common stock warrants in accordance with applicable accounting guidance provided in ASC 815, Derivatives and Hedging—Contracts in Entity’s Own Equity, as either derivative liabilities or as equity instruments depending on the specific terms of the warrant agreement. Derivative warrant liabilities were valued using the Black-Scholes pricing model at the date of initial issuance and using the closing value as quoted on the New York Stock Exchange at each subsequent balance sheet date.
Income Taxes
We are subject to income taxes in Luxembourg, the United States and Canada. We have incurred significant losses and have not generated taxable income in these jurisdictions, with the exception of Canada. In the future, we expect to become subject to taxation based on the statutory rates in effect in the countries in which we operate and our effective tax rate could fluctuate accordingly. We have incurred net losses since our inception and have not recorded any federal, state or foreign current income tax provisions other than for unrecognized tax benefits since inception, except a recovery of income taxes in the 258 day period ended September 30, 2009. We have a full valuation allowance against our net deferred tax assets. Additionally, under the U.S. Internal Revenue Code, our net operating loss carryforwards and tax credits may be limited if a cumulative change in ownership of more than 50% is deemed to have occurred within a three year period. We have not performed a detailed analysis to determine whether an ownership change under Section 382 of the Internal Revenue Code has occurred after each of our previous issuances of shares of common stock and warrants.
Equity Participation in Losses of Equity Method Investments
Equity participation in losses of equity method investments consist primarily of our share of losses incurred by AmberWorks LLC. We recognize our 50% share of losses incurred by AmberWorks LLC, a joint venture formed on February 15, 2012.
Critical Accounting Policies and Estimates
We prepare our consolidated financial statements in accordance with accounting principles generally accepted in the United States of America. As such, management is required to make certain estimates, judgments and assumptions that it believes are reasonable based on the information available. These estimates and assumptions affect the reported amounts of assets and liabilities at the date of the financial statements and the reported amounts of revenues and expenses for the periods presented. The significant
57
estimates which management believes are the most critical to aid in fully understanding and evaluating our reported financial results include fair value determination of assets, liabilities and consideration paid or payable in connection with business acquisitions, contingent consideration, fair value of intangible assets and goodwill, useful lives of intangible assets, income taxes, stock-based compensation and the value of certain equity and debt instruments.
Our critical accounting policies are in the annual consolidated financial statements for the year ended December 31, 2014 included elsewhere in this Annual Report on Form 10-K.These are the policies we believe are the most critical to aid in fully understanding and evaluating our financial condition and results of operations.
Inventories
Inventories are stated at the lower of cost or market. Cost is determined on a first-in, first-out (FIFO) basis. Prior to the Company having any customer orders for sample product, all production and development costs were expensed as part of the Company’s research and development efforts.
Property and equipment
Property and equipment are recorded at cost and are depreciated over their estimated useful lives using the straight-line method over the following periods:
|
Furniture and Fixtures |
|
5-8 years |
|
Machinery and Equipment |
|
5-15 years |
|
Computers, Office Equipment and Peripherals |
|
3-7 years |
Costs related to repairs and maintenance of property and equipment are expensed in the period in which they are incurred. Upon sale or disposal, the Company writes off the cost of the asset and the related amount of accumulated depreciation. The resulting gain or loss is included in the consolidated statement of operations. Assets in the course of construction are classified as construction in-progress and are carried at cost, net of grants received and any recognized impairment loss. They consist of expenditures directly related to building the manufacturing facility in Sarnia, Ontario. For qualifying assets, cost includes capitalized borrowing costs.
Intangible assets
Costs incurred in obtaining patents are capitalized and amortized on a straight-line basis over their estimated useful lives of between 8 and 15 years. Our patent portfolio was acquired as part of the spin-off transaction with DNP and the acquisition of Sinoven Biopolymers Inc. and Bioamber SAS. The cost of servicing the patents is expensed as incurred.
As required by FASB ASC 805, acquired IPR&D through business combinations is accounted for as an indefinite-lived intangible asset until completion or abandonment of the associated research and development efforts. Therefore, such assets are not amortized but are tested for impairment at least annually. Once the research and development activities are completed, the assets will be amortized over the related product’s useful life. If the project is abandoned, the assets will be written off if they have no alternative future use.
We review our portfolio of patents and acquired in-process research and development every quarter taking into consideration events or circumstances that may affect its recoverable value.
Long-lived asset impairment
We assess the fair value of our long-lived assets in accordance with FASB ASC 360, Property, Plant, and Equipment. At the end of each reporting period, we evaluate whether there is objective evidence of events or changes in business conditions which suggest that an asset may be impaired. In such cases we determine the fair value based upon forecasted, undiscounted cash flows which the assets are expected to generate and the net proceeds expected from their sale. If the carrying amount exceeds the fair value of the asset, it is decreased by the difference between the two being the amount of the impairment.
Government grants
We have entered into arrangements to receive government grants and government loans from which a portion of the proceeds was recorded as grants (refer to Part II, Item 8, Note 8—Long-term debt), that relate primarily to the construction of facilities. Government grants are recognized when there is reasonable assurance that the grant will be received and that the conditions of the grant have been complied with. Government grants received in advance of complying with the conditions of the grant are deferred
58
until all conditions are met. Government grants related to property and equipment are recorded as a reduction of the cost of the asset and result in reduced depreciation expense over the useful life of the asset. Government grants that relate to expenses are recognized in the income statement as a reduction of the related expense or as a component of other income.
Stock-based compensation
We account for our stock-based compensation expense in accordance with FASB ASC 718, Compensation—Stock Compensation. Stock options are granted to employees and consultants at exercise prices equal to the estimated fair value of our stock at the grant dates. Stock options generally vest over four years and have a term of ten years. Each stock option entitles the holder to purchase one share of common stock which comes from our authorized shares. Compensation expense is recognized over the period during which an employee is required to provide services in exchange for the award, generally the vesting period.
We recognize stock-based compensation for awards to employees based on the estimated fair value of the awards granted. The fair value method requires us to estimate the fair value of stock-based awards on the date of grant using an option pricing model. We use the Black-Scholes option-pricing model to estimate the fair value of awards granted to employees and consultants, and the requisite fair value is recognized as an expense on a straight-line basis over the service period of the award.
The Black-Scholes option pricing model requires the following inputs: expected life, expected volatility, risk-free interest rate, expected dividend yield rate, exercise price and closing price of the Company’s common stock on the date of grant. Due to the Company’s limited history of grant activity, the Company calculates its expected term utilizing the “simplified method” permitted by the Securities and Exchange Commission (“SEC”), which is the average of the total contractual term of the option and its vesting period. We calculate our expected volatility rate from the historical volatilities of selected comparable public companies within its industry, due to a lack of historical information regarding the volatility of our stock price. We will continue to analyze the historical stock price volatility assumption as more historical data for its common stock becomes available. The risk-free interest rate is based on the US Treasury yield curve in effect at the time of grant for zero coupon US Treasury notes with maturities similar to the option’s expected term. The expected dividend yield was assumed to be zero, as we have not paid, nor does it anticipate paying, cash dividends on shares of its common stock. We estimate our forfeiture rate based on an analysis of our actual forfeitures and will continue to evaluate the appropriateness of the forfeiture rate based on actual forfeiture experience, analysis of employee turnover and other factors.
Warrants
We account for warrants issued to purchase our common stock in accordance with FASB ASC 815 as equity, on our consolidated balance sheet at fair value upon issuance pursuant to their characteristics. Warrants accounted for as equity and are not subject to re-measurement at each balance sheet date. Warrants recorded as a liability are marked-to-market at each balance sheet date. We estimated the fair value of these warrants at the respective issuance date utilizing the Black-Scholes pricing model. The Black-Scholes pricing model requires a number of variables that require management judgment including the estimated price of the underlying instrument, the risk-free interest rate, the expected volatility, the expected dividend yield and the expected exercise period of the warrants. Our Black-Scholes assumptions are discussed in greater detail in “Part II, Item 8, Note 13—Share-Capital.”
The liability is presented as warrants financial liability in our consolidated balance sheet, and changes in the fair value of the warrants are reflected in the consolidated statement of operations as part of financial charges (income), net.
59
Recent accounting pronouncements
See Note 2 to the Consolidated Financial Statements (Part II, Item 8) for a description of recent accounting pronouncements.
Results of Operations
The following tables set forth our results of operations for the periods presented. The period-to-period comparison of financial results is not necessarily indicative of future results.
Overview of Results of Operations for the Years Ended December 31, 2014 and 2013 (in thousands)
|
|
|
Year Ended December 31, |
|
|
Change |
|
||||||||||
|
|
|
2014 |
|
|
2013 |
|
|
|
|
|
|
|
|
|
||
|
|
|
$ |
|
|
$ |
|
|
$ |
|
|
% |
|
||||
|
|
|
(in thousands) |
|
|
|
|
|
|||||||||
|
Total revenues |
|
$ |
1,543 |
|
|
$ |
2,665 |
|
|
$ |
(1,122 |
) |
|
|
-42 |
% |
|
Cost of goods sold |
|
|
6,044 |
|
|
|
2,689 |
|
|
|
3,355 |
|
|
|
125 |
% |
|
Gross loss |
|
|
(4,501 |
) |
|
|
(24 |
) |
|
|
(4,477 |
) |
|
|
18654 |
% |
|
Operating expenses |
|
|
|
|
|
|
|
|
|
|
|
|
|
|
|
|
|
General and administrative |
|
|
10,655 |
|
|
|
9,757 |
|
|
|
898 |
|
|
|
9 |
% |
|
Research and development, net |
|
|
15,156 |
|
|
|
16,579 |
|
|
|
(1,423 |
) |
|
|
-9 |
% |
|
Sales and marketing |
|
|
4,482 |
|
|
|
4,730 |
|
|
|
(248 |
) |
|
|
-5 |
% |
|
Depreciation of property and equipment and amortization of intangible assets |
|
|
260 |
|
|
|
1,165 |
|
|
|
(905 |
) |
|
|
-78 |
% |
|
Impairment loss and write-off of property and equipment and intangible assets |
|
|
— |
|
|
|
8,619 |
|
|
|
(8,619 |
) |
|
|
-100 |
% |
|
Foreign exchange loss (gain) |
|
|
151 |
|
|
|
306 |
|
|
|
(155 |
) |
|
|
-51 |
% |
|
Operating expenses |
|
|
30,704 |
|
|
|
41,156 |
|
|
|
(10,452 |
) |
|
|
-25 |
% |
|
Operating loss |
|
|
35,205 |
|
|
|
41,180 |
|
|
|
(5,975 |
) |
|
|
-15 |
% |
|
Amortization of deferred financing costs and debt discounts |
|
|
292 |
|
|
|
240 |
|
|
|
52 |
|
|
|
22 |
% |
|
Financial charges (income), net |
|
|
11,737 |
|
|
|
(7,433 |
) |
|
|
19,170 |
|
|
|
-258 |
% |
|
Loss (gain) on debt extinguishment |
|
|
171 |
|
|
|
(314 |
) |
|
|
485 |
|
|
|
-154 |
% |
|
Equity participation in losses of equity method investments |
|
|
— |
|
|
|
15 |
|
|
|
(15 |
) |
|
|
-100 |
% |
|
Other expense (income), net |
|
|
(183 |
) |
|
|
— |
|
|
|
(183 |
) |
|
|
-100 |
% |
|
Loss before income taxes |
|
|
47,222 |
|
|
|
33,688 |
|
|
|
13,534 |
|
|
|
40 |
% |
|
Income taxes |
|
|
75 |
|
|
|
103 |
|
|
|
(28 |
) |
|
|
-27 |
% |
|
Net loss |
|
|
47,297 |
|
|
|
33,791 |
|
|
|
13,506 |
|
|
|
40 |
% |
|
Net loss attributable to: |
|
|
|
|
|
|
|
|
|
|
|
|
|
|
|
|
|
BioAmber Inc. shareholders |
|
|
46,422 |
|
|
|
33,218 |
|
|
|
13,204 |
|
|
|
40 |
% |
|
Non-controlling interest |
|
|
875 |
|
|
|
573 |
|
|
|
302 |
|
|
|
53 |
% |
|
|
|
|
47,297 |
|
|
|
33,791 |
|
|
|
13,506 |
|
|
|
40 |
% |
Product sales
Product sales decreased from $2.7 million for the year ended December 31, 2013 to $1.5 million for the year ended December 31, 2014 due to a decrease in the average selling price, partially offset by an increase in the quantity of product sold.
Supply contracts generated $709,000 and $2,035,000 for the years ended December 31, 2014 and 2013, respectively. Non-contracted sales generated $834,000 and $630,000 of these revenues for the years ended December 31, 2014 and 2013, respectively.
Cost of goods sold
Cost of goods sold increased from $2.7 million for the year ended December 31, 2013 to $6.0 million for the year ended December 31, 2014. This increase is primarily due to a non-cash charge from an inventory reserve of $2.5 million and toll-manufacturing fixed cost charges of $1.2 million recorded as cost of goods sold.
60
General and administrative expenses
General and administrative expenses increased by $0.9 million to $10.7 million for the year ended December 31, 2014 as compared to $9.8 million for the year ended December 31, 2013. The increase is primarily due to a $0.6 million increase in stock-based compensation due to stock option cancellations in the second quarter of 2014 and additional costs related to compliance and public company operations, including professional fees, filing fees, payroll and related expenses.
Research and development expenses, net
Research and development expenses, net, decreased by $1.4 million to $15.2 million for the year ended December 31, 2014 as compared to $16.6 million for the year ended December 31, 2013. This was primarily due to (i) a decrease of $0.6 million resulting from the completion of the yeast development project with Cargill in 2013 (ii) $0.7 million in reduction of expense related to our adipic acid platform, and (iii) a decrease of $0.9 million related to the streamlining of the patent portfolio which decreased the expenses for filing and maintain patents. In addition, stock-based compensation expense decreased by $0.4 million due to the accelerated vesting of Sinoven’s stockholder shares of BioAmber and immediate vesting of certain stock options granted during the second quarter of 2013 upon the completion of the IPO, which was partially offset due to the stock option cancellations in the second quarter of 2014. These reductions were also partially offset by an increase in payroll costs that resulted from hiring additional personnel for our in-house research and development and engineering development work related to our Sarnia plant under construction.
Sales and marketing expenses
Sales and marketing expenses decreased by $248,000 to $4.5 million for the year ended December 31, 2014 as compared to $4.7 million for the year ended December 31, 2013. The decrease is primarily due to a decrease in outside market study expenses and a decrease in incentive remuneration.
Depreciation of property and equipment and amortization intangible assets
Depreciation of property and equipment and amortization of intangible assets expense decreased by $905,000 to $260,000 for the year ended December 31, 2014 as compared to $1.2 million for the year ended December 31, 2013. This decrease is due to the write-off of intellectual property (patent rights and licenses, and in-process research and development) during 2013, based on E. coli-technology.
Impairment loss and write-off of property and equipment and of intangible assets
There were no impairment loss or write-off of property and equipment and intangible assets expense during the year ended December 31, 2014. During the year ended December 31, 2013, as of result of approval from our board of directors to replace the E. coli technology in our production process with our yeast technology, we recorded a total impairment charge of $8.6 million related to the write-off of intellectual property based on E. coli technology, and the write-off of construction costs incurred in connection with the plant being built in Sarnia.
Foreign Exchange loss
The foreign exchange loss decreased by $155,000 to $151,000 for the year ended December 31, 2014 as compared to $306,000 for the year ended December 31, 2013. The decrease was driven mainly by the lower Canadian dollar cash balances in 2014 as compared to 2013, partially offset by a weaker Canadian Dollar versus the U.S. dollar during 2014 as compared to 2013.
Financial charges (income), net
Financial charges (income), net comprised of a loss of $11.7 million for the year ended December 31, 2014 as compared to an income of $7.4 million for the year ended December 31, 2013. This expense increase was due to the mark-to-market adjustment change of $17.5 million on the warrants that were part of the units issued in our IPO and the increase in the interest expense and the end of the term charge on HTGC loan for a total of $3.0 million, and the issuance costs of $1.1 million related to warrants issued during our IPO in 2013.
Equity participation in losses of equity method investments
Equity participation in losses of equity method investments decreased by $15,000 to nil for the year ended December 31, 2014, due to lower losses incurred by AmberWorks LLC, a joint venture that was formed on February 15, 2012.
61
Overview of Results of Operations for the Years Ended December 31, 2013 and 2012 (in thousands)
|
|
|
Year Ended December 31, |
|
|
Change |
|
||||||||||
|
|
|
2013 |
|
|
2012 |
|
|
|
|
|
|
|
|
|
||
|
|
|
$ |
|
|
$ |
|
|
$ |
|
|
% |
|
||||
|
Total revenues |
|
|
2,665 |
|
|
|
2,291 |
|
|
|
374 |
|
|
|
16 |
% |
|
Cost of goods sold |
|
|
2,689 |
|
|
|
1,746 |
|
|
|
943 |
|
|
|
54 |
% |
|
Gross profit (loss) |
|
|
(24 |
) |
|
|
545 |
|
|
|
(569 |
) |
|
|
-104 |
% |
|
Operating expenses |
|
|
|
|
|
|
|
|
|
|
|
|
|
|
|
|
|
General and administrative |
|
|
9,757 |
|
|
|
11,665 |
|
|
|
(1,908 |
) |
|
|
-16 |
% |
|
Research and development, net |
|
|
16,579 |
|
|
|
20,417 |
|
|
|
(3,838 |
) |
|
|
-19 |
% |
|
Sales and marketing |
|
|
4,730 |
|
|
|
4,193 |
|
|
|
537 |
|
|
|
13 |
% |
|
Depreciation of property and equipment and |
|
|
1,165 |
|
|
|
2,116 |
|
|
|
(951 |
) |
|
|
-45 |
% |
|
Impairment loss and write-off of property and |
|
|
8,619 |
|
|
|
1,213 |
|
|
|
7,406 |
|
|
|
611 |
% |
|
Foreign exchange loss |
|
|
306 |
|
|
|
50 |
|
|
|
256 |
|
|
|
512 |
% |
|
Operating expenses |
|
|
41,156 |
|
|
|
39,654 |
|
|
|
1,502 |
|
|
|
4 |
% |
|
Operating loss |
|
|
41,180 |
|
|
|
39,109 |
|
|
|
2,071 |
|
|
|
5 |
% |
|
Amortization of deferred financing costs and debt |
|
|
240 |
|
|
|
100 |
|
|
|
140 |
|
|
|
140 |
% |
|
Financial charges (income), net |
|
|
(7,433 |
) |
|
— |
|
|
|
(7,433 |
) |
|
|
-100 |
% |
|
|
Gain on debt extinguishment |
|
|
(314 |
) |
|
— |
|
|
|
(314 |
) |
|
|
-100 |
% |
|
|
Equity participation in losses of equity method |
|
|
15 |
|
|
|
274 |
|
|
|
(259 |
) |
|
|
-95 |
% |
|
Loss before income taxes |
|
|
33,688 |
|
|
|
39,483 |
|
|
|
(5,795 |
) |
|
|
-15 |
% |
|
Income taxes |
|
|
103 |
|
|
|
55 |
|
|
|
48 |
|
|
|
87 |
% |
|
Net loss |
|
|
33,791 |
|
|
|
39,538 |
|
|
|
(5,747 |
) |
|
|
-15 |
% |
|
Net loss attributable to: |
|
|
|
|
|
|
|
|
|
|
|
|
|
|
|
|
|
BioAmber Inc. shareholders |
|
|
33,218 |
|
|
|
39,351 |
|
|
|
(6,133 |
) |
|
|
-16 |
% |
|
Non-controlling interest |
|
|
573 |
|
|
|
187 |
|
|
|
386 |
|
|
|
206 |
% |
|
|
|
|
33,791 |
|
|
|
39,538 |
|
|
|
(5,747 |
) |
|
|
-15 |
% |
Product sales
Product sales increased from $2.3 million for the year ended December 31, 2012 to $2.7 million for the year ended December 31, 2013 due to an increase in the quantity of product sold, partially offset by a decrease in the average selling price.
Supply contracts generated $2,035,000 and $1,953,000 for the years ended December 31, 2013 and 2012, respectively. Non-contracted sales generated $630,000 and $338,000 of these revenues for the years ended December 31, 2013 and 2012, respectively.
Cost of goods sold
Cost of goods sold increased from $1.7 million for the year ended December 31, 2012 to $2.7 million for the year ended December 31, 2013 due to an increase in the quantity of product sold, partially offset by a reduction in the production costs per unit.
General and administrative expenses
General and administrative expenses decreased by $1.9 million to $9.8 million for the year ended December 31, 2013 as compared to $11.7 million for the year ended December 31, 2012. The decrease is primarily due to a $3.1 million decrease in financing cost associated with the write-off of the 2012 deferred IPO costs. This is partially offset by an increase in professional fees and insurance costs of $1.2 million related to compliance and public company operations.
Research and development expenses, net
Research and development expenses, net, decreased by $3.8 million to $16.6 million for the year ended December 31, 2013 as compared to $20.4 million for the year ended December 31, 2012. This was primarily due to (i) the completion of the yeast development project with Cargill, (ii) a reduction of outsourced research and consulting fees, and (iii) lower stock option expense
62
resulting from the vesting of certain stock upon in the second quarter of 2013. These reductions were partially offset by an increase in payroll costs that resulted from hiring additional personnel for our in-house research and development and engineering development work related to our Sarnia plant under construction.
Sales and marketing expenses
Sales and marketing expenses increased by $537,000 to $4.7 million for the year ended December 31, 2013 as compared to $4.2 million for the year ended December 31, 2012. The increase is primarily due to an increase in incentive remuneration, including stock-based compensation expense due to new stock options being granted during the second quarter of 2013, some of which vested immediately and vesting of certain stock options upon completion of the IPO.
Depreciation of property and equipment and amortization of intangible assets
Depreciation of property and equipment and amortization of intangible assets expense decreased by $951,000 to $1.2 million for the year ended December 31, 2013 as compared to $2.1 million for the year ended December 31, 2012. This decrease is due to the write-off of intellectual property (patent rights and licenses, and in-process research and development) during the second quarter of 2013, based on E. coli-based technology.
Impairment loss and write-off of property and equipment and of intangible assets
Impairment loss and write-off of property and equipment and intangible assets expense increased by $7.4 million during the year ended December 31, 2013. During the year ended December 31, 2012, we wrote off $1.2 million of unamortized value of the Sinoven Biopolymer Inc patents and in-process research and development related to the proprietary technology for modifying polybutylene succinate as we decided to suspend development, given other market development priorities. During the year ended December 31, 2013, we recorded a total impairment charge of $8.6 million related to the write-off of intellectual property, which was based on E. coli-based technology, and the write-off of construction costs incurred in connection with the plant being built in Sarnia, resulting from the approval of our board of directors to replace the E. coli-based technology in our production process with our yeast technology.
Foreign Exchange gain (loss)
The foreign exchange loss increased by $256,000 to $306,000 for the year ended December 31, 2013 as compared to $50,000 for the year ended December 31, 2012. The increase was driven by the weakening of the Canadian Dollar versus the U.S. Dollar and the impact on Canadian Dollar cash balances being carried on the books to meet vendor obligations of the Sarnia Project. The Canadian Dollars were converted at favorable rates to the project budget and are expected to be used solely for the construction of the facility and not be converted back into U.S. Dollars.
Financial charges (income), net
Financial charges (income), net comprised of a gain of $7.4 million for the year ended December 31, 2013 as compared to nil for the year ended December 31, 2012. This gain results from the mark-to-market adjustment of the warrants that were part of the units issued in our IPO, which was completed on May 9, 2013. This is partially offset by the interest charges and the end of term charge accretion on the Hercules loan of $1.8 million, and the warrants issuance costs of $1.1 million applicable to our IPO.
Equity participation in losses of equity method investments
Equity participation in losses of equity method investments decreased by $259,000 to $15,000 for the year ended 31, 2013, as compared to $274,000 for the year ended December 31, 2012. This decrease is due to lower level of activities performed by AmberWorks LLC, a joint venture that was formed on February 15, 2012.
Liquidity and Capital Resources
From inception through December 31, 2014, we have funded our operations primarily through an aggregate of $221.6 million from public offerings of our equity securities, private placements of our equity securities, and the sale of shares issued by a subsidiary and convertible notes, CAD$33.9 million from loan and grants proceeds from various Canadian government agencies and $24.5 million from a long-term loan with TCP. In July 2014, we completed a secondary public offering of our common stock for aggregate net proceeds of $36.0 million, after underwriting discounts and commissions and expenses. In December 2014, we prepaid the outstanding HTGC loan outstanding balance and raised $24.5 million from a three year term loan with TCP.
63
The expected cash needs for the construction of our manufacturing facility in Sarnia, Ontario are $125.0 million, of which is expected to be funded by us through available cash, low-interest loans, governmental grants, and Mitsui’s capital contribution. We began commissioning and start-up of this facility in March 2015. In addition, we will require funds for our research and development programs and for general corporate purposes. Based on these funding activities, the additional equity expected from our partner Mitsui, the cash on hand at December 31, 2014, combined with the previously committed funding from grants and loans not yet drawn as of December 31, 2014, we believe that we have sufficient cash to fund its operations for at least the next twelve months.
There are certain covenants in our debt and grant agreements, which are discussed in the notes to our consolidated financial statements. We are in compliance with all of the covenants provided in each of these agreements. We expect to continue to be in compliance with these covenants in the future.
There are certain covenants in our debt and grant agreements, which are discussed in the notes to our consolidated financial statements. We are in compliance with all of covenants provided in each of these agreements. We expect to continue to be in compliance with these covenants in the future.
The following table sets forth the major sources and uses of cash for each of the periods set forth below (in thousands):
|
|
|
Year Ended December 31, |
|
|||||||||
|
|
|
2014 |
|
|
2013 |
|
|
2012 |
|
|||
|
|
|
(in thousands) |
|
|||||||||
|
Net cash used in operating activities |
|
$ |
(22,453 |
) |
|
$ |
(27,525 |
) |
|
$ |
(32,276 |
) |
|
Net cash used in investing activities |
|
|
(85,018 |
) |
|
|
(12,788 |
) |
|
|
(7,630 |
) |
|
Net cash provided by financing activities |
|
|
78,655 |
|
|
|
99,923 |
|
|
|
16,672 |
|
Operating activities
The cash from operating activities is primarily used for general and administrative expenses and research and development activities. These include expenses on research and development projects, consultancy and advisory fees from third parties, licensing and royalty expenses, payroll expenses, legal and accounting expenses and office rent and utilities.
Cash used in operating activities during the year ended December 31, 2014 of $22.5 million reflected our net loss of $47.3 million, which was adjusted for non-cash net charges, of $14.2 million and a positive change in operating assets and liabilities of $10.6 million. Non-cash expense adjustments included mainly stock-based compensation of $6.9 million and a gain on the mark-to-market accounting for warrants that were part of the units issued in our IPO of $7.2 million. The change in operating assets and liabilities is a net inflow of $10.6 million due to a decrease in current assets which offsets an increase in current liabilities.
Cash used in operating activities during the year ended December 31, 2013 of $27.5 million reflected our net loss of $33.8 million, which was adjusted for non-cash net charges, of $6.7 million and a negative change in operating assets and liabilities of $420,000. Non-cash expense adjustments included depreciation and amortization of assets of $1.2 million, stock-based compensation of $6.7 million, and the impairment loss and write-off of property and equipment and of intangible assets of $8.6 million. Non-cash gain adjustments included the gain on the mark-to-market accounting for warrants that were part of the units issued in our IPO of $10.3 million and the gain on debt extinguishment of $ 0.3 million. The change in operating assets and liabilities is a net outflow of $420,000 due to an increase in current assets which offsets an increase in current liabilities.
Cash used in operating activities during the year ended December 31, 2012 of $32.3 million reflected our net loss of $39.5 million, which was adjusted for non-cash charges of $13.0 million and a negative change in operating assets and liabilities of $5.8 million. Non-cash adjustments included depreciation and amortization of assets of $2.1 million, impairment loss and write-off of intangible assets of $1.2 million, stock-based compensation of $7.4 million, write-off of initial public offering costs of $1.8 million and equity participation in losses of equity method investments of $274,000. The change in operating assets and liabilities is a net outflow of $5.8 million due to an increase in current assets and a decrease in current liabilities.
Investing activities
Cash used in investing activities during the year ended December 31, 2014 of $85.0 million represented property and equipment purchases related to the building of our facility in Sarnia, Ontario of $85.0 million, and an increase in the restricted cash of $678,000, offset by a capital distribution from our equity investment in AmberWorks LLC of $675,000.
Cash used in investing activities during the year ended December 31, 2013 of $12.8 million represented property and equipment purchases related to the building of our facility in Sarnia, Ontario.
64
Cash used in investing activities during the year ended December 31, 2012 of $7.6 million included $1.0 million for an equity method investment and $6.6 million of property and equipment purchases related to building our planned facility in Sarnia, Ontario.
Financing activities
Cash provided by financing activities during the year ended December 31, 2014 of $78.7 million included proceeds from the completion of our second public offering of $36.2 million, a capital contribution by Mitsui maintaining its 30% equity in our BioAmber Sarnia joint venture of $24.6 million, the loan and grants proceeds from government agencies of $19.4 million and the net proceeds from the long term loan from TCP of $24.5 million, partially offset by $25.0 million from the repayment of the HTGC loan, and $1.1 million in deferred financing costs.
Cash provided by financing activities during the year ended December 31, 2013 of $99.9 million included $71.7 million net proceeds from the completion of our IPO, $24.2 million in net proceeds from the three year term loan from HTGC, $2.8 million from loans and grants for the construction of our planned facility in Sarnia, Ontario, partially offset by $140,000 of a cash consideration paid for the forfeiture of 70,000 shares by Sinoven’s selling shareholders.
Cash provided by financing activities during the year ended December 31, 2012 of $16.7 million included $10.0 million from the issuance of shares of common stock through a private placement and $6.7 million from loans and grants for the construction of our planned facility in Sarnia, Ontario.
Contractual Obligations and Commitments
Our principal commitments consist primarily of obligations under our leases for our office spaces and contractual commitments related to license agreements. The following table summarizes these contractual obligations at December 31, 2014:
|
|
|
Payment Due by Period |
|
|||||||||||||||||
|
|
|
Total |
|
|
Less than 1 Year |
|
|
1-3 Years |
|
|
3-5 Years |
|
|
More than 5 years |
|
|||||
|
|
|
(in thousands) |
|
|||||||||||||||||
|
Debt (including interest payments) |
|
$ |
50,846 |
|
|
$ |
5,279 |
|
|
$ |
27,854 |
|
|
$ |
7,132 |
|
|
$ |
10,581 |
|
|
Operating leases(1) |
|
|
1,654 |
|
|
|
383 |
|
|
|
394 |
|
|
|
378 |
|
|
|
499 |
|
|
Minimum royalty payments(2) |
|
|
9,618 |
|
|
|
563 |
|
|
|
1,176 |
|
|
|
1,472 |
|
|
|
6,407 |
|
|
Purchase commitments(3) |
|
|
19,908 |
|
|
|
1,276 |
|
|
|
4,866 |
|
|
|
5,084 |
|
|
|
8,682 |
|
|
Total |
|
$ |
82,026 |
|
|
$ |
7,501 |
|
|
$ |
34,290 |
|
|
$ |
14,066 |
|
|
$ |
26,169 |
|
|
(1) |
We lease our premises, except for the Sarnia facility, and other assets under various operating leases. |
|
(2) |
We entered into exclusive license agreements that provide for the payment of minimal annual royalties. As of December 31, 2014, we had contractual agreements with 9 partners that involve minimum annual royalties. The royalties that we owe are in return for use of proprietary tools, patents and know-how. |
|
(3) |
BioAmber Sarnia entered into a supply steam agreement and a service agreement with LANXESS Inc, which includes fixed minimum annual payments. |
Off-Balance Sheet Arrangements
As of December 31, 2014, we did not have any significant off-balance sheet arrangements, as defined in Item 303(a)(4)(ii) of Regulation S-K.
Interest Rate Risk
We had unrestricted cash totaling $51.0 million at December 31, 2014. These amounts were deposited in current and interest-bearing accounts and were held for working capital purposes. Our primary objective is to preserve our capital for the purpose constructing our planned facility in Sarnia, Ontario, Canada and funding our operations. We do not enter into investments for trading or speculative purposes. Our three-year term loan with TCP bears interest at 9.50% or the 3 month LIBOR rate plus 9.27%. If the 3 month LIBOR rate were to increase, the interest rate for the remaining term of the loan would increase.
65
Commodity Price Risk
We use glucose in our processes, which can be derived from corn, wheat and other feedstocks. Thus, our raw material is sensitive to price fluctuations in feedstock commodities. Prices of corn, wheat and other feedstocks are subject to fluctuations due to unpredictable factors such as weather, quantities planted and harvested, changes in national and global supply and demand, and government programs and policies.
Foreign Currency Risk
We currently conduct our operations in U.S. dollars, Canadian dollars and Euros, which exposes us to fluctuations in foreign currency exchange rates. The facility under construction in Sarnia, Ontario will require Canadian dollar funding as well as U.S. dollar funding. We will monitor the amounts and timing of foreign currency exposures related to the construction of the facility and will look to mitigate exposure through normal business operations such as carrying appropriate foreign currency deposits and sourcing as much funding in Canadian dollars as practicable. We may use forward contracts or currency swaps to mitigate any remaining exposure.
Once we complete our facility in Sarnia, Ontario, we expect our foreign currency risk to increase as our sources of cash will be primarily in U.S. dollars, while our uses of cash will be primarily in Canadian dollars. We will monitor foreign currency exposures and will look to mitigate exposures through normal business operations such as manufacturing and selling in the same currencies where practical.
66
Report of Independent Registered Public Accounting Firm
To the Board of Directors and Shareholders of
BioAmber Inc.
We have audited the accompanying consolidated balance sheets of BioAmber Inc. and subsidiaries (the “Company”) as at December 31, 2014 and December 31, 2013 and the related consolidated statements of operations, comprehensive loss, shareholders’ equity, and cash flows for each of the three years in the period ended December 31, 2014. These financial statements are the responsibility of the Company’s management. Our responsibility is to express an opinion on these financial statements based on our audits.
We conducted our audits in accordance with the standards of the Public Company Accounting Oversight Board (United States). Those standards require that we plan and perform the audit to obtain reasonable assurance about whether the financial statements are free of material misstatement. The Company is not required to have, nor were we engaged to perform, an audit of its internal control over financial reporting. Our audits included consideration of internal control over financial reporting as a basis for designing audit procedures that are appropriate in the circumstances, but not for the purpose of expressing an opinion on the effectiveness of the Company’s internal control over financial reporting. Accordingly, we express no such opinion. An audit also includes examining, on a test basis, evidence supporting the amounts and disclosures in the financial statements, assessing the accounting principles used and significant estimates made by management, as well as evaluating the overall financial statement presentation. We believe that our audits provide a reasonable basis for our opinion.
In our opinion, such consolidated financial statements present fairly, in all material respects, the financial position of BioAmber Inc. and subsidiaries as at December 31, 2014 and December 31, 2013 and the results of their operations and their cash flows for each of the three years in the period ended December 31, 2014, in conformity with accounting principles generally accepted in the United States of America.
/s/ Deloitte LLP1
Montreal, Canada
March 16, 2015
|
1 |
CPA auditor, CA, public accountancy permit No. A118581 |
67
BIOAMBER INC.
Consolidated Statements of Operations
|
|
|
Year Ended December 31 |
|
|||||||||
|
|
|
2014 |
|
|
2013 |
|
|
2012 |
|
|||
|
|
|
$ |
|
|
$ |
|
|
$ |
|
|||
|
Revenues |
|
|
|
|
|
|
|
|
|
|
|
|
|
Product sales |
|
|
1,543,051 |
|
|
|
2,665,237 |
|
|
|
2,291,367 |
|
|
Total revenues |
|
|
1,543,051 |
|
|
|
2,665,237 |
|
|
|
2,291,367 |
|
|
Cost of goods sold excluding depreciation and amortization (Note 17) |
|
|
6,043,792 |
|
|
|
2,689,019 |
|
|
|
1,745,926 |
|
|
Gross (loss) profit |
|
|
(4,500,741 |
) |
|
|
(23,782 |
) |
|
|
545,441 |
|
|
Operating expenses |
|
|
|
|
|
|
|
|
|
|
|
|
|
General and administrative |
|
|
10,655,053 |
|
|
|
9,757,028 |
|
|
|
11,665,751 |
|
|
Research and development, net |
|
|
15,155,608 |
|
|
|
16,579,236 |
|
|
|
20,416,878 |
|
|
Sales and marketing |
|
|
4,481,946 |
|
|
|
4,730,036 |
|
|
|
4,193,440 |
|
|
Depreciation of property and equipment and amortization of intangible assets |
|
|
260,472 |
|
|
|
1,164,582 |
|
|
|
2,115,948 |
|
|
Impairment loss and write-off of property and equipment and of intangible assets |
|
|
— |
|
|
|
8,619,405 |
|
|
|
1,212,690 |
|
|
Foreign exchange loss |
|
|
151,102 |
|
|
|
305,874 |
|
|
|
49,728 |
|
|
Operating expenses |
|
|
30,704,181 |
|
|
|
41,156,161 |
|
|
|
39,654,435 |
|
|
Operating loss |
|
|
35,204,922 |
|
|
|
41,179,943 |
|
|
|
39,108,994 |
|
|
Amortization of deferred financing costs and debt discounts |
|
|
291,659 |
|
|
|
240,463 |
|
|
|
99,933 |
|
|
Financial charges (income), net (Note 10) |
|
|
11,737,127 |
|
|
|
(7,433,109 |
) |
|
|
— |
|
|
Loss (gain) on debt extinguishment, net (Note 8) |
|
|
170,729 |
|
|
|
(314,305 |
) |
|
|
— |
|
|
Equity participation in losses of equity method investment (Note 3) |
|
|
216 |
|
|
|
15,496 |
|
|
|
274,471 |
|
|
Other income |
|
|
(183,174 |
) |
|
|
— |
|
|
|
— |
|
|
Loss before income taxes |
|
|
47,221,479 |
|
|
|
33,688,488 |
|
|
|
39,483,398 |
|
|
Income taxes (Note 14) |
|
|
75,371 |
|
|
|
102,794 |
|
|
|
55,065 |
|
|
Net loss |
|
|
47,296,850 |
|
|
|
33,791,282 |
|
|
|
39,538,463 |
|
|
Net loss attributable to: |
|
|
|
|
|
|
|
|
|
|
|
|
|
BioAmber Inc. shareholders |
|
|
46,421,960 |
|
|
|
33,217,758 |
|
|
|
39,351,050 |
|
|
Non-controlling interest |
|
|
874,890 |
|
|
|
573,524 |
|
|
|
187,413 |
|
|
|
|
|
47,296,850 |
|
|
|
33,791,282 |
|
|
|
39,538,463 |
|
|
Net loss per share attributable to BioAmber Inc. shareholders - basic |
|
$ |
2.32 |
|
|
$ |
2.13 |
|
|
$ |
3.82 |
|
|
Weighted-average of common shares outstanding - basic |
|
|
20,016,180 |
|
|
|
15,590,814 |
|
|
|
10,296,633 |
|
The accompanying notes are an integral part of the consolidated financial statements.
68
BIOAMBER INC.
Consolidated Statements of Comprehensive Loss
|
|
|
Year Ended December 31 |
|
|||||||||
|
|
|
2014 |
|
|
2013 |
|
|
2012 |
|
|||
|
|
|
$ |
|
|
$ |
|
|
$ |
|
|||
|
Net loss |
|
|
47,296,850 |
|
|
|
33,791,282 |
|
|
|
39,538,463 |
|
|
Foreign currency translation adjustment |
|
|
5,927,968 |
|
|
|
339,000 |
|
|
|
(511,889 |
) |
|
Total comprehensive loss |
|
|
53,224,818 |
|
|
|
34,130,282 |
|
|
|
39,026,574 |
|
|
Total comprehensive loss attributable to: |
|
|
|
|
|
|
|
|
|
|
|
|
|
BioAmber Inc. shareholders |
|
|
50,680,605 |
|
|
|
33,496,772 |
|
|
|
38,940,762 |
|
|
Non-controlling interest |
|
|
2,544,213 |
|
|
|
633,510 |
|
|
|
85,812 |
|
|
|
|
|
53,224,818 |
|
|
|
34,130,282 |
|
|
|
39,026,574 |
|
The accompanying notes are an integral part of the consolidated financial statements.
69
BIOAMBER INC.
Consolidated Balance Sheets
|
|
|
As of |
|
|
As of |
|
||
|
|
|
December 31, |
|
|
December 31, |
|
||
|
|
|
2014 |
|
|
2013 |
|
||
|
|
|
$ |
|
|
$ |
|
||
|
Assets |
|
|
|
|
|
|
|
|
|
Current assets |
|
|
|
|
|
|
|
|
|
Cash and Cash equivalents (Note 8 vii)) |
|
|
51,042,752 |
|
|
|
83,728,199 |
|
|
Accounts receivable |
|
|
476,851 |
|
|
|
754,987 |
|
|
Inventories (Note 4) |
|
|
1,801,826 |
|
|
|
2,415,402 |
|
|
Prepaid expenses and deposits (Note 4) |
|
|
765,539 |
|
|
|
5,131,367 |
|
|
Valued added tax, income taxes and other receivables |
|
|
3,005,153 |
|
|
|
2,262,139 |
|
|
Deferred financing costs |
|
|
— |
|
|
|
671,270 |
|
|
Total current assets |
|
|
57,092,121 |
|
|
|
94,963,364 |
|
|
Property and equipment, net (Note 5) |
|
|
88,664,899 |
|
|
|
13,554,279 |
|
|
Investment in equity method investments (Note 3) |
|
|
34,817 |
|
|
|
710,033 |
|
|
Intangible assets, net (Note 6) |
|
|
4,332,911 |
|
|
|
4,158,550 |
|
|
Goodwill |
|
|
625,364 |
|
|
|
692,788 |
|
|
Restricted cash |
|
|
646,500 |
|
|
|
— |
|
|
Deferred financing costs (Note 8) |
|
|
1,043,788 |
|
|
|
— |
|
|
Total assets |
|
|
152,440,400 |
|
|
|
114,079,014 |
|
|
|
|
|
|
|
|
|
|
|
|
Liabilities |
|
|
|
|
|
|
|
|
|
Current liabilities |
|
|
|
|
|
|
|
|
|
Accounts payable and accrued liabilities (Note 7) |
|
|
16,459,918 |
|
|
|
7,081,471 |
|
|
Income taxes payable (Note 14) |
|
|
204,096 |
|
|
|
1,120,669 |
|
|
Accounts payable Agro-industries Recherches et Développements (“ARD”) (Note 17) |
|
|
983,465 |
|
|
|
29,497 |
|
|
Deferred grants (Note 9) |
|
|
2,274,802 |
|
|
|
3,061,140 |
|
|
Short-term portion of long-term debt (Note 8) |
|
|
2,977,707 |
|
|
|
6,520,263 |
|
|
Total current liabilities |
|
|
22,899,988 |
|
|
|
17,813,040 |
|
|
Long-term debt (Note 8) |
|
|
34,653,101 |
|
|
|
23,209,629 |
|
|
Warrants financial liability (Note 13) |
|
|
13,040,000 |
|
|
|
5,840,000 |
|
|
Other long-term liabilities |
|
|
127,500 |
|
|
|
82,500 |
|
|
Total liabilities |
|
|
70,720,589 |
|
|
|
46,945,169 |
|
|
Commitments and contingencies (Note 11) |
|
|
|
|
|
|
|
|
|
Redeemable non-controlling interest (Note 12) |
|
|
24,190,412 |
|
|
|
— |
|
|
Equity |
|
|
|
|
|
|
|
|
|
Share capital |
|
|
|
|
|
|
|
|
|
Common stock: |
|
|
|
|
|
|
|
|
|
$0.01 par value per share; 250,000,000 authorized, 21,836,046 and 18,558,369 issued and outstanding at December 31, 2014 and December 31, 2013, respectively |
|
|
218,360 |
|
|
|
185,584 |
|
|
Additional paid-in capital |
|
|
220,460,559 |
|
|
|
177,275,934 |
|
|
Warrants |
|
|
2,949,018 |
|
|
|
2,964,335 |
|
|
Accumulated deficit |
|
|
(161,465,910 |
) |
|
|
(115,043,950 |
) |
|
Accumulated other comprehensive loss |
|
|
(4,632,628 |
) |
|
|
(373,983 |
) |
|
Total BioAmber Inc. shareholders’ equity |
|
|
57,529,399 |
|
|
|
65,007,920 |
|
|
Non-controlling interest (Note 12) |
|
|
— |
|
|
|
2,125,925 |
|
|
Total equity |
|
|
57,529,399 |
|
|
|
67,133,845 |
|
|
Total liabilities and equity |
|
|
152,440,400 |
|
|
|
114,079,014 |
|
The accompanying notes are an integral part of the consolidated financial statements.
70
BIOAMBER INC.
Consolidated Statements of Shareholders’ Equity
(in U.S. dollars, except for shares data)
|
|
|
Common stock |
|
|
Additional paid-in capital |
|
|
Warrants |
|
|
Accumulated deficit |
|
|
Accumulated other comprehensive loss |
|
|
Non-controlling interest |
|
|
Total shareholders' equity |
|
|||||||||||||||
|
|
|
Shares |
|
|
Par value |
|
|
|
|
|
|
Shares |
|
|
Par value |
|
|
|
|
|
|
|
|
|
|
|
|
|
|
|
|
|
||||
|
|
|
|
|
|
|
$ |
|
|
$ |
|
|
|
|
|
|
$ |
|
|
$ |
|
|
$ |
|
|
$ |
|
|
$ |
|
|||||||
|
Balance, December 31, 2011 |
|
|
9,963,765 |
|
|
|
99,638 |
|
|
|
96,375,467 |
|
|
|
1,459,290 |
|
|
|
3,075,278 |
|
|
|
(42,475,142 |
) |
|
|
(505,257 |
) |
|
|
2,845,247 |
|
|
|
59,415,231 |
|
|
Issuance of common shares, net of $ 22,254 |
|
|
351,050 |
|
|
|
3,510 |
|
|
|
9,974,146 |
|
|
|
— |
|
|
|
— |
|
|
|
— |
|
|
|
— |
|
|
|
— |
|
|
|
9,977,656 |
|
|
Release of shares held in trust |
|
|
35,000 |
|
|
|
350 |
|
|
|
(350 |
) |
|
|
— |
|
|
|
— |
|
|
|
— |
|
|
|
— |
|
|
|
— |
|
|
|
— |
|
|
Warrants expired |
|
|
— |
|
|
|
— |
|
|
|
321 |
|
|
|
(1,435 |
) |
|
|
(321 |
) |
|
|
— |
|
|
|
— |
|
|
|
— |
|
|
|
— |
|
|
Stock-based compensation ( Note 13) |
|
|
— |
|
|
|
— |
|
|
|
7,431,262 |
|
|
|
— |
|
|
|
— |
|
|
|
— |
|
|
|
— |
|
|
|
— |
|
|
|
7,431,262 |
|
|
Net loss |
|
|
— |
|
|
|
— |
|
|
|
— |
|
|
|
— |
|
|
|
— |
|
|
|
(39,351,050 |
) |
|
|
— |
|
|
|
(187,413 |
) |
|
|
(39,538,463 |
) |
|
Foreign currency translation |
|
|
— |
|
|
|
— |
|
|
|
— |
|
|
|
— |
|
|
|
— |
|
|
|
— |
|
|
|
410,288 |
|
|
|
101,601 |
|
|
|
511,889 |
|
|
Balance, December 31, 2012 |
|
|
10,349,815 |
|
|
|
103,498 |
|
|
|
113,780,846 |
|
|
|
1,457,855 |
|
|
|
3,074,957 |
|
|
|
(81,826,192 |
) |
|
|
(94,969 |
) |
|
|
2,759,435 |
|
|
|
37,797,575 |
|
|
|
|
|
|
|
|
|
|
|
|
|
|
|
|
|
|
|
|
|
|
|
|
|
|
|
|
|
|
|
|
|
|
|
|
|
|
|
|
Release of shares - Sinoven |
|
|
63,000 |
|
|
|
630 |
|
|
|
(630 |
) |
|
|
— |
|
|
|
— |
|
|
|
— |
|
|
|
— |
|
|
|
— |
|
|
|
— |
|
|
Cancelation of shares - Sinoven |
|
|
— |
|
|
|
— |
|
|
|
(140,000 |
) |
|
|
— |
|
|
|
— |
|
|
|
— |
|
|
|
— |
|
|
|
— |
|
|
|
(140,000 |
) |
|
Stock-based compensation (Note 13) |
|
|
— |
|
|
|
— |
|
|
|
6,731,539 |
|
|
|
— |
|
|
|
— |
|
|
|
— |
|
|
|
— |
|
|
|
— |
|
|
|
6,731,539 |
|
|
IPO proceeds |
|
|
8,000,000 |
|
|
|
80,000 |
|
|
|
79,920,000 |
|
|
|
— |
|
|
|
— |
|
|
|
— |
|
|
|
— |
|
|
|
— |
|
|
|
80,000,000 |
|
|
IPO costs |
|
|
— |
|
|
|
— |
|
|
|
(7,136,291 |
) |
|
|
— |
|
|
|
— |
|
|
|
— |
|
|
|
— |
|
|
|
— |
|
|
|
(7,136,291 |
) |
|
Warrants issued at IPO |
|
|
|
|
|
|
|
|
|
|
(16,148,000 |
) |
|
|
— |
|
|
|
— |
|
|
|
— |
|
|
|
— |
|
|
|
— |
|
|
|
(16,148,000 |
) |
|
Warrants exercised |
|
|
145,554 |
|
|
|
1,456 |
|
|
|
268,470 |
|
|
|
(145,554 |
) |
|
|
(110,622 |
) |
|
|
— |
|
|
|
— |
|
|
|
— |
|
|
|
159,304 |
|
|
Net loss |
|
|
— |
|
|
|
— |
|
|
|
— |
|
|
|
— |
|
|
|
— |
|
|
|
(33,217,758 |
) |
|
|
— |
|
|
|
(573,524 |
) |
|
|
(33,791,282 |
) |
|
Foreign currency translation |
|
|
— |
|
|
|
— |
|
|
|
— |
|
|
|
— |
|
|
|
— |
|
|
|
— |
|
|
|
(279,014 |
) |
|
|
(59,986 |
) |
|
|
(339,000 |
) |
|
Balance at December 31, 2013 |
|
|
18,558,369 |
|
|
|
185,584 |
|
|
|
177,275,934 |
|
|
|
1,312,301 |
|
|
|
2,964,335 |
|
|
|
(115,043,950 |
) |
|
|
(373,983 |
) |
|
|
2,125,925 |
|
|
|
67,133,845 |
|
|
|
|
|
|
|
|
|
|
|
|
|
|
|
|
|
|
|
|
|
|
|
|
|
|
|
|
|
|
|
|
|
|
|
|
|
|
|
|
Stock-based compensation (Note 13) |
|
|
— |
|
|
|
— |
|
|
|
6,949,205 |
|
|
|
— |
|
|
|
— |
|
|
|
— |
|
|
|
— |
|
|
|
— |
|
|
|
6,949,205 |
|
|
Reclassification of non-controlling interest to redeemable non-controlling interest (Note 12) |
|
|
— |
|
|
|
— |
|
|
|
— |
|
|
|
— |
|
|
|
— |
|
|
|
— |
|
|
|
— |
|
|
|
(2,125,925 |
) |
|
|
(2,125,925 |
) |
|
Issuance of shares , net of issuance costs |
|
|
3,220,000 |
|
|
|
32,200 |
|
|
|
36,027,708 |
|
|
|
— |
|
|
|
— |
|
|
|
— |
|
|
|
— |
|
|
|
— |
|
|
|
36,059,908 |
|
|
Warrants exercised/expired |
|
|
26,976 |
|
|
|
269 |
|
|
|
23,164 |
|
|
|
(63,175 |
) |
|
|
(15,317 |
) |
|
|
— |
|
|
|
— |
|
|
|
— |
|
|
|
8,116 |
|
|
Stock options exercised |
|
|
30,701 |
|
|
|
307 |
|
|
|
184,548 |
|
|
|
— |
|
|
|
— |
|
|
|
— |
|
|
|
— |
|
|
|
|
|
|
|
184,855 |
|
|
Net loss |
|
|
— |
|
|
|
— |
|
|
|
— |
|
|
|
— |
|
|
|
— |
|
|
|
(46,421,960 |
) |
|
|
— |
|
|
|
— |
|
|
|
(46,421,960 |
) |
|
Foreign currency translation |
|
|
— |
|
|
|
— |
|
|
|
— |
|
|
|
— |
|
|
|
— |
|
|
|
— |
|
|
|
(4,258,645 |
) |
|
|
— |
|
|
|
(4,258,645 |
) |
|
Balance at December 31, 2014 |
|
|
21,836,046 |
|
|
|
218,360 |
|
|
|
220,460,559 |
|
|
|
1,249,126 |
|
|
|
2,949,018 |
|
|
|
(161,465,910 |
) |
|
|
(4,632,628 |
) |
|
|
— |
|
|
|
57,529,399 |
|
The accompanying notes are an integral part of the consolidated financial statements.
71
BIOAMBER INC.
Consolidated Statements of Cash Flows
|
|
|
Year Ended December 31 |
|
|||||||||
|
|
|
2014 |
|
|
2013 |
|
|
2012 |
|
|||
|
|
|
$ |
|
|
$ |
|
|
$ |
|
|||
|
Cash flows from operating activities |
|
|
|
|
|
|
|
|
|
|
|
|
|
Net loss |
|
|
(47,296,850 |
) |
|
|
(33,791,282 |
) |
|
|
(39,538,463 |
) |
|
Adjustments to reconcile net loss to cash: |
|
|
|
|
|
|
|
|
|
|
|
|
|
Stock-based compensation |
|
|
6,949,205 |
|
|
|
6,731,539 |
|
|
|
7,431,262 |
|
|
Depreciation of property and equipment and amortization of intangible assets |
|
|
260,472 |
|
|
|
1,164,582 |
|
|
|
2,115,948 |
|
|
Impairment loss and write-off of property and equipment and of intangible assets |
|
|
— |
|
|
|
8,619,405 |
|
|
|
1,212,690 |
|
|
Amortization of deferred financing costs and debt discounts |
|
|
291,659 |
|
|
|
240,463 |
|
|
|
99,933 |
|
|
Write-off of IPO costs |
|
|
— |
|
|
|
— |
|
|
|
1,828,074 |
|
|
Equity participation in losses of equity method investments |
|
|
216 |
|
|
|
15,496 |
|
|
|
274,471 |
|
|
Other long-term liabilities |
|
|
45,000 |
|
|
|
45,000 |
|
|
|
37,500 |
|
|
Financial charges (income), net (Note 10) |
|
|
6,707,293 |
|
|
|
(9,815,293 |
) |
|
|
— |
|
|
(Gain) loss on debt extinguishment (Note 8) |
|
|
(49,724 |
) |
|
|
(314,305 |
) |
|
|
— |
|
|
Deferred income taxes |
|
|
— |
|
|
|
— |
|
|
|
55,065 |
|
|
Changes in operating assets and liabilities |
|
|
|
|
|
|
|
|
|
|
|
|
|
Change in accounts receivable |
|
|
278,136 |
|
|
|
(158,816 |
) |
|
|
(596,171 |
) |
|
Change in inventories |
|
|
1,220,113 |
|
|
|
(521,083 |
) |
|
|
(1,894,319 |
) |
|
Change in prepaid expenses and deposits |
|
|
3,517,713 |
|
|
|
(2,488,544 |
) |
|
|
(2,105,002 |
) |
|
Change in research and development tax credits receivable, value added tax, income taxes and other receivables |
|
|
(1,443,446 |
) |
|
|
(61,012 |
) |
|
|
(596,632 |
) |
|
Change in accounts payable to ARD |
|
|
819,267 |
|
|
|
(144,371 |
) |
|
|
(278,993 |
) |
|
Change in accounts payable and accrued liabilities |
|
|
6,247,971 |
|
|
|
2,953,225 |
|
|
|
(321,420 |
) |
|
Net cash used in operating activities |
|
|
(22,452,975 |
) |
|
|
(27,524,996 |
) |
|
|
(32,276,057 |
) |
|
Cash flows from investing activities |
|
|
|
|
|
|
|
|
|
|
|
|
|
Acquisition of property and equipment and intangible asset |
|
|
(85,014,063 |
) |
|
|
(12,788,350 |
) |
|
|
(6,630,073 |
) |
|
Change in restricted cash |
|
|
(678,450 |
) |
|
|
— |
|
|
|
— |
|
|
Capital redistribution from (investment in) equity method investments (Note 3) |
|
|
675,000 |
|
|
|
— |
|
|
|
(1,000,000 |
) |
|
Net cash used in investing activities |
|
|
(85,017,513 |
) |
|
|
(12,788,350 |
) |
|
|
(7,630,073 |
) |
|
|
|
|
|
|
|
|
|
|
|
|
|
|
|
Cash flows from financing activities |
|
|
|
|
|
|
|
|
|
|
|
|
|
Deferred financing costs |
|
|
(1,077,079 |
) |
|
|
(792,960 |
) |
|
|
— |
|
|
Issuance of long-term debt (Note 8) |
|
|
33,740,574 |
|
|
|
26,692,204 |
|
|
|
2,238,784 |
|
|
Repayment of long-term debt (Note 8) |
|
|
(25,000,000 |
) |
|
|
— |
|
|
|
— |
|
|
Government grants (Note 9) |
|
|
10,131,666 |
|
|
|
1,141,242 |
|
|
|
4,455,358 |
|
|
Net proceeds from issuance of common shares |
|
|
36,250,737 |
|
|
|
159,304 |
|
|
|
9,977,656 |
|
|
Proceeds from issuance of shares by a subsidiary (Note 12) |
|
|
24,608,700 |
|
|
|
— |
|
|
|
— |
|
|
Net proceeds on issuance of units (Note 13) |
|
|
— |
|
|
|
72,863,709 |
|
|
|
— |
|
|
Cancellation of shares (Note 2) |
|
|
— |
|
|
|
(140,000 |
) |
|
|
— |
|
|
Net cash provided by financing activities |
|
|
78,654,598 |
|
|
|
99,923,499 |
|
|
|
16,671,798 |
|
|
Foreign exchange impact on cash |
|
|
(3,869,557 |
) |
|
|
(954,291 |
) |
|
|
350,528 |
|
|
Increase (decrease) in cash |
|
|
(32,685,447 |
) |
|
|
58,655,862 |
|
|
|
(22,883,804 |
) |
|
Cash and cash equivalents, beginning of period |
|
|
83,728,199 |
|
|
|
25,072,337 |
|
|
|
47,956,141 |
|
|
Cash and cash equivalents, end of period |
|
|
51,042,752 |
|
|
|
83,728,199 |
|
|
|
25,072,337 |
|
|
Supplemental cash flow information: |
|
|
|
|
|
|
|
|
|
|
|
|
|
Non-cash transactions: |
|
|
|
|
|
|
|
|
|
|
|
|
|
Construction in Progress costs not yet paid |
|
|
8,856,101 |
|
|
|
2,646,963 |
|
|
|
162,226 |
|
|
Amortization of debt discounts capitalized to CIP |
|
|
814,653 |
|
|
|
300,000 |
|
|
|
— |
|
The accompanying notes are an integral part of the consolidated financial statements.
72
BIOAMBER INC.
Notes to Consolidated Financial Statements
1. Description of the business
BioAmber Inc. (the “Company” or “BioAmber”) is a bio-based chemicals company. BioAmber’s goal is to develop commercially viable, intellectual property (“IP”) protected technologies that use industrial biotechnology to produce chemical building blocks in fermentation broth, and subsequently use chemical processing to isolate and purify the building blocks from the broth and transform them into a range of value added chemicals.
The Company was incorporated in the State of Delaware in October 2008 and was established as the result of the spin-off of certain assets from Diversified Natural Products, Inc. (“DNP”). These assets consisted principally of an intellectual property portfolio, which pertained to the production of succinic acid from renewable feedstock and was used in selected applications and derivative products.
In September 2010, the Company acquired the 50% interest in its joint venture (“JV”) Bioamber S.A.S. that it did not already own. Concurrent with this acquisition, the Company changed its name from DNP Green Technology, Inc. to BioAmber Inc. and changed its fiscal year end from June 30 to December 31. Bioamber S.A.S. had been wholly owned by the Company until its liquidation in December 2014.
2. Summary of significant accounting policies
Basis of presentation
These consolidated financial statements have been prepared in conformity with generally accepted accounting principles in the United States of America (“GAAP”) and comprise the financial position and results of operations of BioAmber Inc., and all its subsidiaries, which include BioAmber Canada Inc., Sinoven Biopolymers Inc. and BioAmber Sarnia Inc. Intercompany balances and transactions have been eliminated upon consolidation. The Financial Accounting Standards Board (“FASB”) sets GAAP to ensure financial condition, results of operations and cash flows are consistently reported. References to GAAP issued by the FASB in these footnotes are to the FASB Accounting Standards Codification (“FASB ASC”).
Risk and uncertainties
BioAmber is an industrial biotechnology company producing sustainable chemicals and the Company has not commenced its planned, principal operations. The Company’s principal operations will start once commercial production begins at the Sarnia, Ontario facility, currently under construction. The Company’s activities since inception have consisted principally of raising capital for performing research and development activities, developing market related to its bio-succinic acid product and derived products, acquiring technology patents, producing and selling bio-succinic acid from a large-scale demonstration facility in Pomacle, France, and building its Sarnia facility. Ultimately, the Company believes that the attainment of profitable operations is dependent upon future events, including completion of the construction and future operation of the commercial-scale manufacturing facility in Sarnia, Ontario, further advancing its existing commercial arrangements with strategic partners to generate revenue from the sale of its products that will support the Company’s cost structure, gaining market acceptance for its bio-succinic acid, its derivatives and other building block chemicals, obtaining adequate financing to complete its development activities, and attracting and retaining qualified personnel.
Use of estimates
The preparation of financial statements in conformity with GAAP requires management to make estimates and assumptions that affect the reported amounts of assets and liabilities, the disclosure of contingent assets and liabilities at the date of the financial statements and the reported amounts of revenue and expenses during the reporting period. Actual results could differ from those estimates.
Significant areas requiring the use of significant management estimates include fair value determination of assets, liabilities, fair value of intangible assets and goodwill, useful lives of intangible assets, income taxes, stock-based compensation and fair value of certain debt and equity instruments.
Fair value of financial instruments
The Company applies FASB ASC 820, Fair Value Measurement, which defines fair value and establishes a framework for measuring fair value and making disclosures about fair value measurements. FASB ASC 820 establishes a hierarchal disclosure
73
framework which prioritizes and ranks the level of market price observability used in measuring financial instruments at fair value. Market price observability is impacted by a number of factors, including the type of financial instruments and the characteristics specific to them. Financial instruments with readily available quoted prices or for which fair value can be measured from actively quoted prices generally will have a higher degree of market price observability and a lesser degree of judgment used in measuring fair value.
There are three levels within the hierarchy that may be used to measure fair value:
|
|
|
|
|
Level 1 |
— |
A quoted price in an active market for identical assets or liabilities. |
|
|
|
|
|
Level 2 |
— |
Significant pricing inputs are observable inputs, which are inputs that reflect the assumptions market participants would use in pricing the asset or liability developed based on market data obtained from independent sources. |
|
|
|
|
|
Level 3 |
— |
Significant pricing inputs are unobservable inputs, which are inputs that reflect the Company’s own assumptions about the assumptions market participants would use in pricing the asset or liability developed based on the best information available in the circumstances. |
The fair value measurements level of an asset or liability within the fair value hierarchy is based on the lowest level of any input that is significant to the fair value measurement. Valuation techniques used should maximize the use of observable inputs and minimize the use of unobservable inputs.
The valuation methodologies described above may produce a fair value calculation that may not be indicative of future net realizable value or reflective of future fair values.
Foreign currencies
The functional currency of BioAmber Inc. and Sinoven Biopolymers Inc. (“Sinoven”) is the United States dollar, whereas for BioAmber Canada Inc. and BioAmber Sarnia Inc. the functional currency is the Canadian dollar and for Bioamber S.A.S. it was the Euro. The assets and liabilities of BioAmber Canada Inc. and BioAmber Sarnia Inc. are translated into United States dollars using period-end exchange rates, while revenues and expenses are translated at average exchange rates prevailing during the period. The assets and liabilities for BioAmber S.A.S. were translated into Unites States dollars on the date of the liquidation of BioAmber S.A.S. into BioAmber Inc. on December 29, 2014. The resulting translation adjustments are recorded as a component of accumulated other comprehensive income (loss). All foreign currency transaction gains and losses resulting from transactions denominated in foreign currencies are recorded as foreign exchange (gain) loss in the consolidated statements of operations.
Cash equivalents
The Company recognizes cash equivalents as highly liquid investments with an original maturity of three months or less at date of purchase.
Restricted Cash
Cash amounts that are restricted to withdrawal or usage are presented as restricted cash. As of December 31, 2014 and December 31, 2013, the Company had $646,500 and nil, respectively, of restricted cash held in an escrow account as a guarantee to a long-term supply agreement. See also Note 17.
Concentration of credit risk
Financial instruments that potentially subject the Company to concentrations of credit risk consist primarily of cash and accounts receivable. The Company believes it is not exposed to significant credit risk related to cash, cash equivalents and accounts receivable. As of December 31, 2014 and 2013, the Company did not have any provision for doubtful accounts.
Inventories
Inventories are stated at the lower of cost or market. Cost is determined on a first-in, first-out (FIFO) basis. Prior to the Company having any customer orders for sample product, all production and development costs were expensed as part of the Company’s research and development efforts. As a result, certain sales in 2012 of product produced in prior periods had a cost basis of zero.
74
Property and equipment
Property and equipment are recorded at cost and are amortized over their estimated useful lives using the straight-line method over the following periods:
|
|
|
|
Furniture and Fixtures |
5-8 years |
|
Machinery and Equipment |
5-15 years |
|
Computers, Office Equipment and Peripherals |
3-7 years |
Leaseholds improvements are amortized over the shorter of the related lease terms or their estimated useful lives. Costs related to repairs and maintenance of property and equipment are expensed in the period in which they are incurred. Upon sale or disposal, the Company writes off the cost of the asset and the related amount of accumulated depreciation. The resulting gain or loss is included in the consolidated statement of operations. Assets in the course of construction are classified as construction in-progress and are carried at cost, net of grants received and any recognized impairment loss. They consist of expenditures directly related to building the manufacturing facility in Sarnia, Ontario. For qualifying assets, cost includes capitalized borrowing costs.
Business combinations
The Company accounts for acquired businesses using the acquisition method of accounting in accordance with FASB ASC 805, Business Combinations. The consideration transferred for the acquisition is the fair values of the assets transferred, the liabilities incurred and the equity interest issued. The consideration transferred includes the fair value of any asset or liability resulting from a contingent consideration arrangement. Acquisition-related costs are expensed as incurred. Identifiable assets acquired and liabilities and contingent liabilities assumed in a business combination are measured initially at their fair value at the acquisition date. Any excess of the purchase price over the estimated fair values of the net assets acquired is recorded as goodwill.
Intangible assets
Computer software and license are recorded at cost and are depreciated over their estimated useful lives using the straight-line method over the following periods:
|
|
|
|
Computer Software |
2-5 years |
|
License |
2-15 years |
|
|
|
Costs incurred in obtaining patents are capitalized and amortized on a straight-line basis over their estimated useful lives of between 5 and 15 years. The Company’s patent portfolio was acquired as part of the spin-off transaction with DNP and the acquisition of Sinoven Biopolymers Inc. and BioAmber S.A.S. The cost of servicing the patents is expensed as incurred.
As required by FASB ASC 805, acquired in-process research and development (IPR&D) through business combinations is accounted for as an indefinite-lived intangible asset until completion or abandonment of the associated research and development efforts. Therefore, such assets are not amortized but are tested for impairment at least annually. Once the research and development activities are deemed to be substantially complete, the assets will be amortized over the related product’s useful life. If the project is abandoned, the assets will be written off if they have no alternative future use. The Company reviews its portfolio of patents and acquired in-process research and development taking into consideration events or circumstances that may affect its recoverable value.
To test indefinites-lives intangible assets for impairment in accordance with ASU 2012-02, FASB ASC 350-Intangibles-Goodwill and Other (Topic 350): Testing Indefinite-Lived Intangible Assets for Impairment, the Company first assesses the qualitative factors to determine whether it is more likely than not, that the asset is impaired. If the Company believes, as a result of the qualitative assessment, that it is more likely than not that fair value of an indefinite-lived intangible asset is less than its carrying amount, the quantitative impairment test is required. Otherwise, no further testing is required.
In the fourth quarter of 2012, the Company wrote off $1.2 million of unamortized value of the Sinoven patents and in-process research and development related to the proprietary technology for modifying polybutylene succinate, or mPBS. The Company carried out testing and concluded that the technology would not meet regulatory approval in the near term for its intended initial application and that alternatives would take significant incremental cost and time. As a result of this assessment, the Company decided to suspend development of mPBS, given other market development priorities. Accordingly, in the fourth quarter of 2012, the Company wrote-off the remaining unamortized value of the Sinoven patents in the amount of $398,749 and in-process research and development in the amount of $813,941.
75
During the second quarter of 2013, the Company’s board of directors approved the transition from an E. coli-based technology to its yeast-based technology to be used in the production process at its manufacturing facility in Sarnia, Ontario. FASB ASC 350 requires evaluating the remaining useful life of an intangible asset that is being amortized each reporting period to determine whether events and circumstances warrant a revision to the remaining period of amortization. The decision to remove the E. coli as the core technology from the Company’s production process required the Company to assess for potential impairment by conducting a recoverability test of this intellectual property (IP) portfolio and determining whether the carrying value of the IP is less than or equal to the fair value of the IP. The test comprised determining the fair value by discounting future cash flows from the future expected sales of succinic acid manufactured using the E. coli technology. The tests indicated that the fair market value was nominal. The non-recurring fair value measure is a level 3 fair value measure. As a consequence, the Company recognized an impairment loss on the intangible assets related to the E. coli technology, comprised of patents and IPR&D acquired as part of the spin-off transaction and the acquisition of Bioamber S.A.S. in the amount of $7.8 million during the second quarter of 2013.
Goodwill
Goodwill represents the excess purchase price over the estimated fair value of identifiable net assets acquired in business combinations. Goodwill is not amortized, but is reviewed for impairment on an annual basis, or whenever events occur or circumstances change that would more likely than not reduce the fair value of a reporting unit below its carrying amount, using a discounted cash flow model.
The Company’s goodwill is attributed to its one reporting unit. The Company has selected December 31 as the date to perform its annual impairment test. Since the Company’s IPO, the Company changed the impairment testing date from June 30 to December 31, to align its testing date with the year-end date. In testing for impairment of its goodwill, the Company may first assess qualitative factors to determine whether it is necessary to perform the two-step impairment test described below. If the Company believes, as a result of the qualitative assessment, that it is more likely than not that the fair value of the reporting unit is less than its carrying amount, the quantitative impairment test is required. Otherwise, no further testing is required. If the quantitative impairment test is required, the Company must make assumptions regarding estimated future cash flows to be derived from the reporting unit. The performance of the test involves a two-step process. The first step of the impairment test involves comparing the fair value of the reporting unit to its net book value, including goodwill.
If the net book value exceeds its fair value, then the Company performs the second step of the goodwill impairment test to determine the amount of the impairment loss. In calculating the fair value of the reporting unit’s goodwill, the fair value of the reporting unit is allocated to all of the other assets and liabilities based on their fair values. The excess of the fair value of the reporting unit over the amount assigned to its other assets and liabilities is the fair value of goodwill. An impairment loss is recognized when the carrying amount of goodwill exceeds its fair value. There was no impairment of goodwill recorded for the periods ended December 31, 2014, 2013 and 2012.
Asset retirement obligation
Management assesses the potential asset retirement obligation upon acquisition of its assets or entering into lease arrangements. If a reasonable estimate of the fair value of the liability can be made, the Company recognizes the retirement obligation. During the year ended December, 31, 2014, 2013 and 2012, the Company recorded an amount of $45,000, $45,000 and $37,500 respectively, for the cost of restoring the premises on the termination date of its leased premises in Plymouth, USA. The cumulative amount to be recognized over the 4 years-term of the lease is $180,000. The amount accrued for the year ended December 31, 2014 and December 31, 2013 are recorded in the other long-term liabilities on the consolidated balance sheet.
Long-lived asset impairment
Management assesses the fair value of its long-lived assets in accordance with FASB ASC 360, Property, Plant, and Equipment. At the end of each reporting period, it evaluates whether there is objective evidence of events or changes in business conditions which suggest that an asset may be impaired.
In such cases the Company determines the fair value based upon forecasted cash flows which the assets are expected to generate and the net proceeds expected from their sale. If the carrying amount exceeds the fair value of the assets, estimated by discounting cash flows techniques, an impairment charge is recorded. The impairment charge is determined as the difference between the fair value of the assets and their corresponding carrying value.
As a result of the Company’s board of directors approving the transition from an E. coli-based technology to yeast-based technology in the second quarter of 2013, the Company conducted an analysis of the costs capitalized in construction in-progress to determine whether such costs would still provide future benefits as part of the planned manufacturing facility in Sarnia, Ontario. The assessment conducted by the Company identified certain costs that were no longer useful for a productive process based on its yeast-
76
based technology. Accordingly, the Company recognized a write-off of construction in-progress in an amount of $834,000 during the second quarter of 2013.
Government grants
The Company has entered into arrangements to receive government grants that relate primarily to the construction of facilities. Government grants are recognized when there is reasonable assurance that the grant will be received and that the conditions of the grant have been complied with. Government grants received in advance of complying with the conditions of the grant are deferred until all conditions are met. Government grants related to property and equipment are included in the balance sheet as a reduction of the cost of the asset and result in reduced depreciation expense over the useful life of the asset. Government grants that relate to expenses are recognized in the income statement as a reduction of the related expense or as a component of other income. As of December 31, 2014, $29.2 million has been received in connection with government grants and loans, of which $14.4 million was applied as a reduction of the cost of construction in progress (see Note 5).
Warrants financial liability
The Company accounts for common stock warrants in accordance with applicable accounting guidance provided in FASB ASC 815, Derivatives and Hedging—Contracts in Entity’s Own Equity, as either derivative liabilities or as equity instruments depending on the specific terms of the warrant agreement. Derivative warrant liabilities were valued using the Black-Scholes pricing model at the date of initial issuance and are valued using the closing value as quoted on the New York Stock Exchange at each subsequent balance sheet date.
The liability is presented as warrants financial liability in the consolidated balance sheet, and changes in the fair value of the warrants are reflected in the consolidated statement of operations as part of financial charges (income), net.
Revenue recognition
Revenue comprises the fair value of the consideration received or receivable for the sale of products and services in the ordinary course of the Company’s activities. Revenue is presented net of discounts.
Revenue is recognized when persuasive evidence of an arrangement exists, the fee is determinable, collectability is reasonably assured and delivery has occurred, which for product revenue is at the time of transfer of title.
The Company’s revenues represent sales of bio-succinic acid to a limited number of customers. During the year ended December 31, 2014, 47% of our sales were to International Flavor and Fragrances, Inc, or IFF, Brenntag AG, or Brenntag and Olon Italy. During the year ended December 31, 2013, 64% of our sales were to IFF and Brenntag.
Net loss per share
The Company computes net loss per share in accordance with FASB ASC 260, Earnings per share, under which basic net loss per share attributable to common shareholders is computed by dividing net loss attributable to common shareholders by the basic weighted-average number of common shares outstanding during the period. Shares issued and reacquired during the period are weighted for the portion of the period that they were outstanding. The computation of diluted earnings per share (“EPS”) is similar to the computation of the basic EPS except that the denominator is increased to include the number of additional shares of common stock that would have been outstanding if all of the potentially dilutive shares of common stock had been issued. In addition, in computing the dilutive effect of convertible securities, the numerator is adjusted to add back any convertible preferred dividends and the after-tax amount of interest recognized in the period associated with any convertible debt. The numerator is also adjusted for any other changes in income or loss that would result from the assumed conversion of those potential shares of common stock such as profit-sharing expenses. Common equivalent shares are excluded from the diluted EPS calculation if their effect is anti-dilutive. Losses have been incurred in each period since inception; accordingly, diluted loss per share is not presented.
|
|
|
Year Ended December 31 |
|
|||||||||
|
|
|
2014 |
|
|
2013 |
|
|
2012 |
|
|||
|
Historical net loss per share: |
|
|
|
|
|
|
|
|
|
|
|
|
|
Net loss attributable to BioAmber Inc. |
|
$ |
46,421,960 |
|
|
$ |
33,217,758 |
|
|
$ |
39,351,050 |
|
|
Net loss per share attributable to BioAmber Inc. shareholders—basic |
|
$ |
2.32 |
|
|
$ |
2.13 |
|
|
$ |
3.82 |
|
|
Weighted-average common shares—basic |
|
|
20,016,180 |
|
|
|
15,590,814 |
|
|
|
10,296,633 |
|
77
Research and development expenses
In accordance with FASB ASC 730, Research and Development, research and development expenses are charged to operations in the period in which they are incurred, net of investment tax credits.
Deferred financing costs
Costs incurred to secure debt are deferred and amortized on a straight-line basis, which approximates the effective interest method, over the term of the related debt. Costs incurred in connection with the Company’s initial public offering (“IPO”) of shares were initially deferred and subsequently reclassified to share issuance costs in the statement of shareholders’ equity when the shares were issued. In 2012, it was determined at that time that the IPO would not proceed for a significant period of time, as a result the deferred costs were charged to general and administrative expenses at the date the determination was made.
Borrowing costs
Borrowing costs directly attributable to the acquisition, construction or production of qualifying assets, which are assets that necessarily take a substantial period of time to get ready for their intended use or sale, are added to the cost of those assets, until such time as the assets are substantially ready for their intended use or sale. If active development is interrupted for an extended period, capitalization is suspended. Investment income earned on the temporary investment of specific borrowings pending their expenditure on qualifying assets is deducted from the borrowing costs eligible for capitalization. All other borrowing costs are recognized in profit or loss in the period in which they are incurred.
Stock-based compensation
The Company accounts for its stock-based compensation expense in accordance with FASB ASC 718, Compensation—Stock Compensation. Stock options are granted to employees at exercise prices equal to the estimated fair value of the Company’s stock at the grant dates. Stock options vest generally over four years and have a term of ten years. Each stock option entitles the holder to purchase one share of common stock which comes from the Company’s authorized shares. Compensation expense is recognized over the period during which an employee is required to provide services in exchange for the award, generally the vesting period.
The Company recognizes stock-based compensation for awards to employees based on the estimated fair value of the awards granted. The fair value method requires the Company to estimate the fair value of stock-based awards on the date of grant using an option pricing model. The Company uses the Black-Scholes option-pricing model to estimate the fair value of awards granted to employees, and the requisite fair value is recognized as expense on a straight-line basis over the service period of the award.
The Company uses the Black-Scholes option-pricing model to estimate the fair value of awards granted to non-employees. The measurement of stock-based compensation for non-employees is subject to periodic adjustments as the underlying equity instruments vest, and the resulting change in value, if any, is recognized in the Company’s consolidated statements of operations during the period the related services are rendered.
The Black-Scholes option pricing model requires the following inputs: expected life, expected volatility, risk-free interest rate, expected dividend yield rate, exercise price and closing price of the Company’s common stock on the date of grant. Due to the Company’s limited history of grant activity, the Company calculates its expected term utilizing the “simplified method” permitted by the Securities and Exchange Commission (“SEC”), which is the average of the total contractual term of the option and its vesting period. The Company calculates its expected volatility rate from the historical volatilities of selected comparable public companies within its industry, due to a lack of historical information regarding the volatility of the Company’s stock price. The Company will continue to analyze the historical stock price volatility assumption as more historical data for its common stock becomes available. The risk-free interest rate is based on the US Treasury yield curve in effect at the time of grant for zero coupon US Treasury notes with maturities similar to the option’s expected term. The expected dividend yield was assumed to be zero, as the Company has not paid, nor does it anticipate paying, cash dividends on shares of its common stock. The Company estimates its forfeiture rate based on an analysis of its actual forfeitures and will continue to evaluate the appropriateness of the forfeiture rate based on actual forfeiture experience, analysis of employee turnover and other factors.
Environmental liabilities
The nature of the Company’s operations requires compliance with environmental laws and regulations set by the governmental authorities in the jurisdictions in which the Company operates. It will develop policies and practices for the remediation of the effects of release or disposal of materials at its locations. Any resulting environmental liabilities will be recorded when they are probable and management can reliably estimate their amount. As of December 31, 2014, and each prior balance sheet date presented, no environmental liabilities have been identified.
78
Income taxes
The Company calculates its income tax charge on the basis of the tax laws enacted at the balance sheet date in the countries where the Company and its subsidiaries operate and generate taxable income, in accordance with FASB ASC 740, Income Taxes. Management periodically evaluates positions taken in tax returns with respect to situations in which applicable tax regulation is subject to interpretation. It establishes provisions where appropriate on the basis of amounts expected to be paid to the tax authorities.
Income taxes in the consolidated statements of operations consist of federal, state and foreign jurisdictions income taxes related to the Company and its subsidiaries. Income taxes are provided for the tax effects of transactions reported in the financial statements and consist of taxes currently due plus deferred taxes related to temporary differences arising from assets and liabilities whose basis are different for financial reporting and income tax purposes.
Deferred taxes are provided using the asset and liability method whereby deferred tax assets are recognized for deductible temporary differences and net operating losses, and deferred tax liabilities are recognized for taxable temporary differences. Temporary differences are the differences between the reported amounts on the financial statements of assets and liabilities and their tax basis. Deferred tax assets and liabilities are adjusted for the effects of changes in tax laws and rates on the date of enactment. The effect of a change in tax rates on deferred tax assets and liabilities is recognized in income in the period that includes the enactment date. A valuation allowance is provided to reduce net deferred tax assets to an amount that is more likely than not to be realized. The amount of the valuation allowance is based on the Company’s best estimate of the recoverability of its deferred tax assets. In making such a determination, we consider all available positive and negative evidence, including future reversals of taxable temporary differences, projected future taxable income, tax-planning strategies and results of recent operations. If we determine that we would be able to realize our deferred tax assets in the future in excess of their net recorded amount, we would make an adjustment to the deferred tax asset valuation allowance.
The Company follows guidance for income taxes, which prescribes a recognition threshold and measurement standard for the financial statement recognition and measurement of an income tax position taken or expected to be taken in a tax return. The Company accounts for interest and penalties related to uncertain tax positions, if any, as part of tax expense unless it is associated with intercompany profits. The Company recognizes interest and penalties related to uncertain tax positions associated with intercompany profits as prepaid tax expense. This asset is amortized over the life of the assets involved in the intercompany sale.
Research and development tax credits
Bioamber S.A.S., before its liquidation in December 2014, had received government assistance in the form of research and development tax credits from the French taxation authorities, based on qualifying expenditures. These credits were not dependent on ongoing tax status or tax position and accordingly were not considered part of income taxes. The Company recorded these tax credits, as a reduction of research and development expenses, when the Company was able to reasonably estimate the amounts and it was more likely than not they would be received.
Segment reporting
Operating segments are identified as components of an enterprise about which separate discrete financial information is available for evaluation by the chief operating decision-maker in making decisions regarding resource allocation and assessing performance. To date, the Company has viewed its operations and manages its business as one segment. The chief operating decision-maker is the Chief Executive Officer.
Recent accounting pronouncements
In May 2014, the FASB issued Accounting Standards Update (ASU) No. 2014-09, "Revenue Recognition - Revenue from Contracts with Customers," which is a comprehensive revenue recognition standard that will supersede nearly all existing revenue recognition guidance under U.S. GAAP. The standard is effective for interim and annual periods beginning after December 15, 2016, and either full retrospective adoption or modified retrospective adoption is permitted. The Company is in the process of evaluating the impact of the standard.
In June 2014, the FASB issued ASU No. 2014-10,"Development Stage Entities," - Elimination of Certain Financial Reporting Requirements, including an Amendment to Variable Interest Entities Guidance in Topic 810, Consolidation, which eliminates the concept of a development stage entity (DSE) in its entirety from current accounting guidance. Amendments to the consolidation guidance may result in more DSEs being considered variable interest entities (VIEs). The new guidance is effective for fiscal years and interim periods beginning after 15 December 2014, with early adoption permitted. The Company had elected to early adopt ASU No. 2014-10 for the interim period ended September 30, 2014. The adoption of this ASU allowed the Company to remove the inception to date information and all references to development stage.
79
In August 2014, the FASB issued ASU 2014-15 “Presentation of Financial Statements— Going Concern (Subtopic 205-40) (Topic 718): Disclosure of Uncertainties about an Entity’s Ability to Continue as a Going Concern”. This ASU requires an entity to evaluate whether conditions or events, in the aggregate, raise substantial doubt about the entity's ability to continue as a going concern for one year from the date the financial statements are issued or are available to be issued. The new guidance is effective for annual periods and interim periods within those annual periods beginning after December 15, 2016. The adoption of this ASU is not expected to have an impact on the Company’s consolidated financial position, results of operations or cash flows.
3. Investment in AmberWorks LLC
In February 2010, the Company acquired 75% of the shares of common stock of Sinoven, a private company incorporated in the state of Delaware in October 2009.
On February 15, 2012, BioAmber Inc., Sinoven and NatureWorks LLC (“NW”) formed AmberWorks LLC, a joint-venture ("JV") whose activities are limited to research, development, manufacturing, licensing and sales of certain products and other related activities. Sinoven and NW share expenses and profits in proportion to their respective ownership interest percentage of 50% each. Sinoven provided AmberWorks with a non-exclusive worldwide license, granting AmberWorks the rights to use the Sinoven IP in connection with certain activities of the JV. NW provided AmberWorks with a non-exclusive worldwide license, granting AmberWorks the rights to use certain patents owned by or licensed to NW in connection with certain activities of the JV. NW also undertook to exclusively market, promote and sell the products produced by the JV. Each of Sinoven and NW made equal initial cash contributions of $1 million in order to finance the start-up operations of AmberWorks LLC.
The equity method of accounting is applied to this investment as the ownership structure prevents Sinoven from exercising a controlling influence over operating and financial policies of the business. Under this method, the equity in the net earnings or losses of AmberWorks is reflected as equity participation in losses of equity method investments in the Consolidated Statements of Operations. The effects of intercompany transactions with AmberWorks are eliminated, including the gross profit on sales to and purchases from the investment, until the time of sale to a third party customer.
On May 6, 2014, AmberWorks made a capital distribution totaling $1,350,000, to Sinoven and NatureWorks LLC, both 50% holders of the joint venture, in proportion of their respective investments in the joint venture. This distribution was in the form of cash and was recorded as a reduction of investment.
AmberWorks had revenue of nil and nil and a net loss of $431 and $30,992, for the year ended December 31, 2014 and 2013, respectively. Sinoven’s share of the net loss amounted to $216 and $15,496 for those periods.
AmberWorks had total assets of $69,634 and $1,420,066 and total liabilities of nil and $nil as of December 31, 2014 and December 31, 2013, respectively. Sinoven’s share of net assets amounted to $34,817 and $710,033 as of those periods.
4. Inventories and Prepaid expenses and deposits
The Company had $1.8 million and $2.4 million of finished goods inventory as of December 31, 2014 and December 31, 2013, respectively, net of an inventory reserve of $2.3 million and nil, as of December 31, 2014 and December 31, 2013, respectively.
The Company had $0.8 million and $5.1 million of prepaid expenses and deposits as of December 31, 2014 and December 31, 2013, respectively, which was comprised primarily of insurance payments and deposits made to secure the purchase of equipment and advances for the construction of the manufacturing facility in Sarnia, Ontario.
80
5. Property and equipment
|
|
|
Estimated |
|
|
|
|
|
|
|
|
|
|
|
Useful |
|
December 31, |
|
|
December 31, |
|
||
|
|
|
Life |
|
2014 |
|
|
2013 |
|
||
|
|
|
(years) |
|
|
|
|
|
|
|
|
|
|
|
|
|
$ |
|
|
$ |
|
||
|
Land |
|
|
|
|
290,349 |
|
|
|
316,689 |
|
|
Furniture and fixtures |
|
5 - 8 |
|
|
77,448 |
|
|
|
80,081 |
|
|
Machinery and equipment |
|
5 - 15 |
|
|
1,215,561 |
|
|
|
747,549 |
|
|
Computers, office equipment and peripherals |
|
3 - 7 |
|
|
134,248 |
|
|
|
238,143 |
|
|
Leasehold improvement |
|
10 |
|
|
12,342 |
|
|
|
— |
|
|
Construction in-progress |
|
|
|
|
101,664,351 |
|
|
|
16,784,763 |
|
|
Grants applied to construction in-progress |
|
|
|
|
(14,362,312 |
) |
|
|
(4,338,168 |
) |
|
|
|
|
|
|
89,031,987 |
|
|
|
13,829,057 |
|
|
Less: accumulated depreciation |
|
|
|
|
(367,088 |
) |
|
|
(274,778 |
) |
|
Property and equipment, net |
|
|
|
|
88,664,899 |
|
|
|
13,554,279 |
|
Depreciation expense is recorded as an operating expense in the consolidated statements of operations and amounted to $209,973, $162,614 and $80,654 for the years ended December 31, 2014, 2013 and 2012 respectively.
6. Intangible assets
|
|
|
December 31, |
|
|
December 31, |
|
||
|
|
|
2014 |
|
|
2013 |
|
||
|
|
|
$ |
|
|
$ |
|
||
|
Intellectual property, patents and licenses: |
|
|
|
|
|
|
|
|
|
Beginning balance |
|
|
4,878,813 |
|
|
|
12,644,197 |
|
|
Write-off of patents and completed IPR&D |
|
|
— |
|
|
|
(7,785,384 |
) |
|
|
|
|
4,878,813 |
|
|
|
4,878,813 |
|
|
Foreign currency translation adjustment |
|
|
(350,074 |
) |
|
|
(350,074 |
) |
|
|
|
|
4,528,739 |
|
|
|
4,528,739 |
|
|
Less: accumulated amortization |
|
|
(4,528,739 |
) |
|
|
(4,528,739 |
) |
|
Intellectual property, patents and licenses, net |
|
|
— |
|
|
|
— |
|
|
Acquired in-process research and development |
|
|
4,158,550 |
|
|
|
4,158,550 |
|
|
Computer software and licenses |
|
|
279,201 |
|
|
|
— |
|
|
Less: accumulated amortization |
|
|
(104,840 |
) |
|
|
|
|
|
Intangible assets, net |
|
|
4,332,911 |
|
|
|
4,158,550 |
|
Amortization expense is recorded as an operating expense in the consolidated statements of operations and amounted to $50,499, $1,001,968 and $2,035,294 for the years ended December 31, 2014, 2013 and 2012 respectively.
7. Accounts payable and accrued liabilities
Accounts payable and accrued liabilities consisted of the following:
|
|
|
December 31, |
|
|
December 31, |
|
||
|
|
|
2014 |
|
|
2013 |
|
||
|
|
|
$ |
|
|
$ |
|
||
|
Trade accounts payable |
|
|
13,184,825 |
|
|
|
4,020,205 |
|
|
Accrued payroll and bonus |
|
|
2,232,590 |
|
|
|
2,291,369 |
|
|
Consulting and legal fees |
|
|
614,993 |
|
|
|
203,958 |
|
|
Other |
|
|
427,510 |
|
|
|
565,939 |
|
|
Total |
|
|
16,459,918 |
|
|
|
7,081,471 |
|
81
8. Long-term debt
Project Financing
The Company entered into the following facilities to fund the construction of a manufacturing facility in Sarnia, Ontario, Canada:
|
i) |
Sustainable Jobs and Investment Fund (SJIF) |
On September 30, 2011, BioAmber Sarnia Inc. (“BioAmber Sarnia”) and the Minister of Economic Development and Trade of Ontario, Canada (Sustainable Jobs Innovation Fund) entered into an agreement pursuant to which a loan in the amount of CAD$15,000,000, or $12,929,920 when converted into U.S. dollars as of December 31, 2014, was granted to BioAmber Sarnia, according to the following principal terms:
|
· |
the loan is interest free during the first five years provided BioAmber Sarnia creates or retains an average of 31 jobs per year, calculated on an annual basis; |
|
· |
the loan will bear interest from the fifth anniversary date of its disbursement at an annual rate of 3.98% (or 5.98% if BioAmber Sarnia does not fully achieve the cumulative job target for the first five years); |
|
· |
the principal will be repayable in five annual equal installments from the sixth anniversary date of the disbursement of the loan; |
|
· |
the loan is secured by a guarantee from BioAmber Inc. and Mitsui & Co., Ltd., the non-controlling shareholder of BioAmber Sarnia, (the guarantee being limited to its percentage of ownership held in BioAmber Sarnia); and |
|
· |
secured by (i) a general security agreement representing a valid charge on BioAmber Sarnia’s present and future accounts receivable, inventory, equipment and other personal property and (ii) a valid charge against the leasehold interest on the portion of the real property located in Sarnia Ontario, Canada and leased to BioAmber Sarnia. |
During March 2013, BioAmber Sarnia received the first disbursement of CAD$929,000, or $801,234 when converted into U.S. dollars as of December 31, 2014. The loan was originally recorded at $429,388 when converted into U.S. dollars as of December 31, 2014, being the discounted amount of the future cash payments of principal and interest over the term of the loan. The discount rate used was 15%, being the interest rate a loan with similar terms and conditions would carry. The difference between the face value of the loan and the discounted amount of the loan of $371,846 when converted into U.S. dollars as of December 31, 2014 was recorded as a short term deferred grant and subsequently reclassified to reduce the cost of construction in-progress.
During July 2014, BioAmber Sarnia received the second disbursement of CAD$4,976,000, or $4,289,073 when converted into U.S. dollars as of December 31, 2014. The loan was originally recorded at $2,229,828 when converted into U.S. dollars as of December 31, 2014, being the discounted amount of the future cash payments of principal and interest over the term of the loan. The discount rate used was 12%, being the interest rate a loan with similar terms and conditions would carry. The difference between the face value of the loan and the discounted amount of the loan of $2,059,245 when converted into U.S. dollars as of December 31, 2014 was recorded as a grant classified in reduction of the cost of construction in-progress.
During November 2014, BioAmber Sarnia received the third disbursement of CAD$1,345,000, or $1,159,278 when converted into U.S. dollars as of December 31, 2014. The loan was originally recorded at $627,164 when converted into U.S. dollars as of December 31, 2014, being the discounted amount of the future cash payments of principal and interest over the term of the loan. The discount rate used was 12%, being the interest rate a loan with similar terms and conditions would carry. The difference between the face value of the loan and the discounted amount of the loan of $532,114 when converted into U.S. dollars as of December 31, 2014 was recorded as a short term deferred grant and subsequently reclassified to reduce the cost of construction in-progress.
The discounted loan is being accreted to its face value through a charge in the consolidated statement of operations using the effective interest method over the term of the loan.
|
ii) |
Sustainable Chemistry Alliance (SCA) |
In November 2011, BioAmber Sarnia entered into a loan agreement with Sustainable Chemistry Alliance in the amount of CAD$500,000, or $431,000 when converted into U.S. dollars as of December 31, 2014. The loan was interest free until November 30, 2013, and the unpaid balance of the loan subsequently bears interest at the rate of 5% per annum compounded monthly. The principal repayment will be effected by way of 20 consecutive quarterly installments of CAD$25,000 from November 2015 to November 2020.
82
The loan agreement contains various legal and financial covenants including i) third party credit facilities which cannot exceed $45 million in the aggregate as long as any principal of the loan remains outstanding, ii) the funds are to be used for research and development expenses only and iii) dividends may not be declared or paid without the consent of the lender.
In July 2014, the loan agreement was amended to increase the third party credit facilities from $45 million in the aggregate as described above, to $60 million in the aggregate.
The loan was originally recorded at $223,583, when converted into U.S. dollars as of December 31, 2014, being the discounted amount of the future cash payments of principal and interest over the term of the loan. The discount rate used was 15%, being the interest rate a loan with similar terms and conditions would carry.
The difference between the face value of the loan and the discounted amount of the loan of $207,417 was recorded as a deferred grant (see Note 9).
The discounted loan is being accreted to its face value through a charge in the consolidated statement of operations using the effective interest method over the term of the loan.
|
iii) |
Federal Economic Development Agency (FEDDEV) |
On September 30, 2011, BioAmber Sarnia and Canadian Federal Economic Development Agency entered into a contribution agreement pursuant to which a loan of up to a maximum amount of CAD $12,000,000 or $10,343,936 when converted into U.S. dollars as of December 31, 2014, was granted to BioAmber Sarnia. The loan is non-interest bearing with repayment of principal from October 2013 to October 2018 in 60 monthly installments. The repayment terms were later modified as described below.
The loan agreement contains various legal and financial covenants ordinarily found in such government agency loan agreements. In addition the following specific covenants also apply:
|
(a) |
The Company will carry appropriate amounts of liability and casualty insurance during the duration of the loan agreement |
|
(b) |
The Company will file for and obtain all necessary permits and licenses from all required jurisdictional authorities in order to build the facility |
|
(c) |
The Company will not alter the project nor project management without prior written consent of the Minister |
|
(d) |
The Company will complete the project to the Minister’s satisfaction by the completion date |
|
(e) |
The Company will not allow change of control without prior written consent of the Minister |
These covenants were met as of December 31, 2014.
During October 2012, BioAmber Sarnia received the first disbursement for CAD $3,645,000 or $3,141,971 when converted into U.S. dollars as of December 31, 2014. The loan was originally recorded at $1,920,056 when converted into U.S. dollars as of December 31, 2014, being the discounted amount of the future cash payments of principal and interest over the term of the loan. The discount rate used was 15%, being the interest rate a loan with similar terms and conditions would carry. The difference between the face value of the loan and the discounted amount of the loan of $1,221,915 when converted into U.S. dollars as of December 31, 2014 was recorded as a deferred grant and subsequently reclassified to reduce the cost of construction in progress.
During January 2013, BioAmber Sarnia received a second disbursement for CAD $221,000, or $190,501 when converted into U.S. dollars as of December 31, 2014. The loan was originally recorded at $122,225 when converted into U.S. dollars as of December 31, 2014, being the discounted amount of the future cash payments of principal and interest over the term of the loan. The discount rate used was 15%, being the interest rate a loan with similar terms and conditions would carry. The difference between the face value of the loan and the discounted amount of the loan of $68,276 when converted into U.S. dollars as of December 31, 2014 was recorded as a deferred grant and subsequently reclassified to reduce the cost of construction in progress
On March 20, 2013, BioAmber Sarnia agreed with FEDDEV to amend the repayment of principal from the period October 2013 to October 2018, to the period October 2014 to October 2019. The Company recorded the impact of the amendment in accordance with FASB ASC 470-50, Debt Modifications and Extinguishments. Accordingly, the amendment was recorded as a debt extinguishment and the issuance of new debt, with new terms. As a result, the Company recognized a gain on debt extinguishment of $314,305.
During December 2013, BioAmber Sarnia received a third disbursement for CAD $1,882,700, or $1,622,877 when converted into U.S. dollars as of December 31, 2014. The loan was originally recorded at $1,016,679 when converted into U.S. dollars as of
83
December 31, 2014, being the discounted amount of the future cash payments of principal and interest over the term of the loan. The discount rate used was 15%, being the interest rate a loan with similar terms and conditions would carry. The difference between the face value of the loan and the discounted amount of the loan of $606,198 when converted into U.S. dollars as of December 31, 2014 was recorded as a deferred grant and reclassified to reduce the cost of construction in progress.
During May 2014, the Company agreed with FEDDEV to amend the repayment of principal from the period October 2014 to October 2019, to the period from October 2015 to October 2020. The Company recorded the impact of the amendment in accordance with FASB ASC 470-50, Debt Modifications and Extinguishments. Accordingly, the amendment was recorded as a debt extinguishment and the issuance of new debt, with new terms. As a result, the Company recognized a gain on debt extinguishment of $451,450.
During June 2014, BioAmber Sarnia received a fourth disbursement for CAD$3,183,200, or $2,743,901 when converted into U.S. dollars as of December 31, 2014. The loan was originally recorded at $1,788,514 when converted into U.S. dollars as of December 31, 2014, being the discounted amount of the future cash payments of principal and interest over the term of the loan. The discount rate used was 12%, being the interest rate a loan with similar terms and conditions would carry. The difference between the face value of the loan and the discounted amount of the loan of $955,387 when converted into U.S. dollars as of December 31, 2014 was recorded as a grant and applied as reduction of the cost of construction in progress.
During October 2014, BioAmber Sarnia received a fifth disbursement for CAD$913,200, or $787,174 when converted into U.S. dollars as of December 31, 2014. The loan was originally recorded at $528,642 when converted into U.S. dollars as of December 31, 2014, being the discounted amount of the future cash payments of principal and interest over the term of the loan. The discount rate used was 12%, being the interest rate a loan with similar terms and conditions would carry. The difference between the face value of the loan and the discounted amount of the loan of $258,532 when converted into U.S. dollars as of December 31 2014 was recorded as a grant and applied as reduction of the cost of construction in progress.
During December 2014, BioAmber Sarnia received a sixth disbursement for CAD$709,500, or $611,567 when converted into U.S. dollars as of December 31, 2014. The loan was originally recorded at $418,965 when converted into U.S. dollars as of December 31, 2014, being the discounted amount of the future cash payments of principal and interest over the term of the loan. The discount rate used was 12%, being the interest rate a loan with similar terms and conditions would carry. The difference between the face value of the loan and the discounted amount of the loan of $192,602 when converted into U.S. dollars as of December 31, 2014 was recorded as a grant applied as reduction of the cost of construction in progress.
The discounted loan is being accreted to its face value through a charge in the consolidated statement of operations using the effective interest method over the term of the loan
|
iv) |
Hercules Technology Growth Capital, Inc. (“HTGC”) |
On June 27, 2013, the Company entered into a Loan and Security Agreement (the “Loan Agreement”) with HTGC. Pursuant to the Loan Agreement, HTGC agreed to make a senior secured term loan of $25 million, which was funded on June 27, 2013, net of a 2.5% loan fee. The term loan is repayable over 36 months after closing, at a floating interest rate per annum based on the greater of (a) 10% and (b) the prime rate (as reported in the Wall Street Journal) plus 6.75% and is subject to an end of term charge of 11.5% based on the $25 million loaned amount ($2,875,000). There was an initial interest-only period until January 1, 2014, to be extended until July 1, 2014 in the event that the Company received an additional equity contribution by its joint venture partner of at least $1.5 million relating to its planned Sarnia facility by December 31, 2013, which was subsequently extended to January 31, 2014 pursuant to an amendment dated December 20, 2013. On January 24, 2014, the Company received the additional equity contribution from Mitsui of CAD $9 million, and fulfilled the condition to extend the initial interest-only period until July 1, 2014.
At its option, the Company may prepay some or all of the loan balance, subject to a prepayment fee equal to 2% of the amount prepaid during the first 12 months after closing, 1% after 12 months but prior to 24 months after closing, and without prepayment fee thereafter. In addition, the Company is obligated to pay an end of term charge (as referenced above) in the amount of $2,875,000 on the date on which the term loan is paid or becomes due and payable in full, which is being accreted over the expected term of the loan.
On December 17, 2014, the Company voluntarily paid off the outstanding balance and terminated the Loan Agreement. The payoff amount of $22.4 million included the outstanding principal amount of $19.2 million, an end of term charge of $2.9 million, a prepayment fee of $192,000, accrued interest of $123,000, and other legal fees. In connection with such repayment, Hercules terminated its security interest in the assets of the Company which were subject to the Loan Agreement.
The Company used the proceeds received from Tennenbaum Capital Partners LLC loan (refer to Note 8 vii)) to repay the existing debt with HTGC. The Company recorded the impact of the loan termination in accordance with FASB ASC 470-50, Debt Modifications and Extinguishments. Accordingly, the difference between the net carrying amount of the extinguished debt and the
84
reacquisition price of the new debt was recorded as a debt extinguishment. As a result, the Company recognized a loss on debt extinguishment of $622,179 for the year ended December 31, 2014.
|
v) |
Minister of Agriculture and Agri-Food of Canada (AAFC) |
On March 10, 2014, BioAmber Sarnia entered into a repayable contribution agreement in the form of a non-interest bearing loan with the Minister of Agriculture and Agri-Food of Canada in the amount of CAD$10 million for the AgriInnovation Program. This loan provides for progressive disbursements as eligible costs are incurred for building construction, installation of equipment and start-up and commissioning of the Sarnia facility. The loan is repayable in equal, monthly installments beginning March 31, 2016 through March 31, 2025 and it contains various legal and financial covenants ordinarily found in such government agency loan agreements.
During September 2014, BioAmber Sarnia received a first disbursement for CAD$2 million or, $1,724,000 when converted in U.S. dollars as of December 31, 2014. The loan was originally recorded at $884,053 when converted into U.S. dollars as of December 31, 2014, being the discounted amount of the future cash payments of principal and interest over the term of the loan. The discount rate used was 12%, being the interest rate a loan with similar terms and conditions would carry. The difference between the face value of the loan and the discounted amount of the loan of $839,947 when converted into U.S. dollars as of December 31, 2014 was recorded as a grant applied as reduction of the cost of construction in-progress.
During November 2014, BioAmber Sarnia received a first disbursement for CAD$5,255,346 or, $4,530,108 when converted in U.S. dollars as of December 31, 2014. The loan was originally recorded at $2,369,693 when converted into U.S. dollars as of December 31, 2014, being the discounted amount of the future cash payments of principal and interest over the term of the loan. The discount rate used was 12%, being the interest rate a loan with similar terms and conditions would carry. The difference between the face value of the loan and the discounted amount of the loan of $2,160,415 when converted into U.S. dollars as of December 31, 2014 was recorded as a grant applied as reduction of the cost of construction in-progress.
|
vi) |
Comerica Bank, Export Development Canada and Farm Credit Canada |
On June 20, 2014, BioAmber Sarnia signed a loan agreement with a financial consortium, comprised of Comerica Bank, Export Development Canada and Farm Credit Canada for a senior secured loan in the principal amount of CAD$20.0 million. The loan will bear interest at a floating interest rate per annum based on the greater of (i) the Canadian prime rate and (ii) the Canadian dealer offered rate plus 1%, in either case plus an interest spread of 5%. There will be an initial interest-only period from draw down of the term loan until the first payment of principal. The loan’s principal will be repaid in 26 equal, quarterly installments beginning three months after the completion of the commissioning and start-up phase of the Sarnia plant, but at the latest on June 30, 2015. The disbursement of the loan, net of a 2.5% upfront loan fee, is subject to customary conditions, including continued progress on the construction of the Sarnia plant, which are expected to be met in or around March 2015. The 2.5% upfront fee of CAD$500,000, or $430,997 when converted into U.S. dollars as of December 31, 2014, was recorded as deferred financing costs and will be amortized over the estimated term of the loan using the effective interest method. Until drawdown of the CAD$20.0 million term loan, BioAmber Sarnia will pay a 1.0% per annum commitment fee on the undrawn amount. BioAmber Sarnia may prepay all or a portion of the loan outstanding from and after the date of the first principal repayment, without penalty.
BioAmber Sarnia’s obligations under the loan are secured by (i) a security interest on all of BioAmber Sarnia’s assets and (ii) a pledge of all the shares of BioAmber Sarnia. In addition, the Company will provide the lenders with a guarantee representing 70% of the secured obligations under the loan, and Mitsui & Co., Ltd. will provide a guarantee representing 30% of the secured obligations under the loan that is capped at CAD$6.0 million plus all accrued interest on the secured obligations and fees and expenses. The proceeds of the loan will be used by BioAmber Sarnia to complete the ongoing construction of the Sarnia Plant and fund its startup and commissioning.
The loan agreement contains certain representations and warranties, affirmative covenants, negative covenants and conditions that are customarily required for similar financings, including in connection with the disbursement of the loan. The financial covenants require BioAmber Sarnia to maintain a minimum debt service ratio of 1.75 on a historical basis, at the end of any and each quarter during the term of the loan. The agreement also contains customary events of default (subject, in certain instances, to specified grace periods) including, but not limited to, the failure to make payments of interest or premium, if any, on, or principal under the loan, the failure to comply with certain covenants and agreements specified in the agreement, the occurrence of a material adverse effect, defaults in respect of certain other indebtedness and agreements, and certain events of insolvency. If an event of default occurs, the principal, premium, if any, interest and any other monetary obligations on all the then outstanding amounts under the loan may become due and payable immediately. There is no outstanding balance as of December 31, 2014.
85
|
vii) |
Tennenbaum Capital Partners, LLC (TCP) |
On December 17, 2014, the Company entered into a Loan and Security Agreement (the “Agreement”) with funds managed by TCP. The proceeds received were used to repay in full, the Loan and Security Agreement with HTGC that was entered into on June 27, 2013, and for general corporate purposes.
Pursuant to the Agreement, TCP agreed to make a senior secured term loan of $25 million (the “Facility”), which was funded on December 18, 2014, net of a 2.0% commitment fee. The term loan is repayable over 36 months after closing at a floating interest rate per annum that is the greater of 9.50% or the 3 month LIBOR rate plus 9.27%, and is subject to an end of term charge of 8.25% based on the $25 million loaned (the “End of Term Fee”) payable on the date on which the term loan is paid or becomes due and payable in full. There will be an initial interest-only period until September 30, 2015, which may be extended for a first additional period of three months and a second additional period of six months, subject to certain conditions. At its option, the Company may prepay some or all of the loan balance, subject to a prepayment fee equal to 3% of the amount prepaid during the term of the Agreement (and a pro rata portion of the End of Term Fee if the prepayment is less than the full amount of the Facility).
The loan obligations are secured by a security interest on substantially all of the Company’s assets (subject to certain exceptions), including its intellectual property, but excluding certain identified licenses from third parties and its equity interest in its subsidiary, BioAmber Sarnia subject to the conditions specified in the Agreement. The security interest does not apply to any assets owned by BioAmber Sarnia, the entity that will own the Company’s planned Sarnia facility.
The Agreement contains certain representations and warranties, affirmative covenants, negative covenants and conditions that are customarily required for similar financings. The Agreement also contains customary events of default (subject, in certain instances, to specified grace periods) including, but not limited to, the failure to make payments of interest or premium, if any, on, or principal under the Facility, the failure to comply with certain covenants and agreements specified in the Agreement, the occurrence of a material adverse change, defaults in respect of certain other indebtedness, and certain events of insolvency. In addition, the expiration, termination or unavailability of the Company’s license agreements with Cargill, Inc. are deemed to be a default under the Agreement. The Company is required to maintain at least $12.5 million in unrestricted cash through the period ending March 31, 2016. After that period, (i) the Company must maintain the lesser of $12.5 million and the amount of the outstanding principal on the loan or (ii) BioAmber Sarnia’s trailing 6 month free cash flow shall be at least 85% of certain projections agreed to with the Lender. The Company will require its subsidiary BioAmber Sarnia to make certain cash distributions to its shareholders on a quarterly basis beginning January 1, 2016, within the terms of the BioAmber Sarnia Joint Venture Agreement unless prohibited by applicable law or the BioAmber Sarnia financing agreements, such that amounts of cash will not accumulate in BioAmber Sarnia. If any event of default occurs, the principal, premium, if any, interest and any other monetary obligations on all the then outstanding amounts under the Facility may become due and payable immediately. These covenants were met as of December 31, 2014.
As of December 31, 2014, the balance of deferred financing cost associated with this transaction was $175,000 and is being amortized over the estimated term of the loan.
86
The balance of the outstanding long term debt is as follows:
|
|
|
December 31, |
|
|
December 31, |
|
||
|
|
|
2014 |
|
|
2013 |
|
||
|
|
|
$ |
|
|
$ |
|
||
|
Sustainable Chemistry Alliance: |
|
|
|
|
|
|
|
|
|
Face value (CAD $500,000) |
|
|
431,000 |
|
|
|
470,100 |
|
|
Less: debt discount |
|
|
(207,417 |
) |
|
|
(226,234 |
) |
|
Amortization of debt discount |
|
|
97,778 |
|
|
|
83,344 |
|
|
|
|
|
321,361 |
|
|
|
327,210 |
|
|
|
|
|
|
|
|
|
|
|
|
Sustainable Jobs and Investment Fund: |
|
|
|
|
|
|
|
|
|
Face value (CAD $7,250,000) |
|
|
6,249,585 |
|
|
|
873,922 |
|
|
Less: debt discount |
|
|
(2,963,205 |
) |
|
|
(405,580 |
) |
|
Amortization of debt discount |
|
|
248,000 |
|
|
|
55,401 |
|
|
|
|
|
3,534,380 |
|
|
|
523,743 |
|
|
|
|
|
|
|
|
|
|
|
|
Federal Economic Development Agency: |
|
|
|
|
|
|
|
|
|
Face value (CAD $10,554,600) |
|
|
9,097,991 |
|
|
|
5,405,259 |
|
|
Less: debt discount |
|
|
(3,302,910 |
) |
|
|
(2,068,429 |
) |
|
Less: short-term portion of debt |
|
|
(457,255 |
) |
|
|
(270,263 |
) |
|
Gain on debt extinguishment |
|
|
(696,846 |
) |
|
|
(299,852 |
) |
|
Amortization of debt discount |
|
|
872,602 |
|
|
|
349,254 |
|
|
|
|
|
5,513,582 |
|
|
|
3,115,969 |
|
|
|
|
|
|
|
|
|
|
|
|
Hercules Technology Growth Capital, Inc: |
|
|
|
|
|
|
|
|
|
Face value |
|
|
— |
|
|
|
25,000,000 |
|
|
Less: short-term portion of debt |
|
|
— |
|
|
|
(6,250,000 |
) |
|
Less: End of term charge |
|
|
— |
|
|
|
492,707 |
|
|
|
|
|
— |
|
|
|
19,242,707 |
|
|
|
|
|
|
|
|
|
|
|
|
Minister of Agriculture and Agri-Food Canada: |
|
|
|
|
|
|
|
|
|
Face value (CAD $7,255,000) |
|
|
6,254,108 |
|
|
|
— |
|
|
Less: debt discount |
|
|
(3,000,363 |
) |
|
|
— |
|
|
Amortization of debt discount |
|
|
50,485 |
|
|
|
— |
|
|
|
|
|
3,304,230 |
|
|
|
— |
|
|
Tennenbaum Capital Partners, LLC : |
|
|
|
|
|
|
|
|
|
Face value |
|
|
25,000,000 |
|
|
|
— |
|
|
Less: debt discount |
|
|
(500,000 |
) |
|
|
|
|
|
Less: short-term portion of debt |
|
|
(2,520,452 |
) |
|
|
— |
|
|
|
|
|
21,979,548 |
|
|
|
— |
|
|
Long-term debt, net |
|
|
34,653,101 |
|
|
|
23,209,629 |
|
The principal repayments of the outstanding loans payable are as follows:
|
|
|
SCA |
|
|
SJIF |
|
|
FEDDEV |
|
|
AAFC |
|
|
TPC |
|
|
Total |
|
||||||
|
|
|
$ |
|
|
$ |
|
|
$ |
|
|
$ |
|
|
$ |
|
|
$ |
|
||||||
|
January 2015 - December 2015 |
|
|
— |
|
|
|
— |
|
|
|
457,255 |
|
|
|
— |
|
|
|
2,520,452 |
|
|
|
2,977,707 |
|
|
January 2016 - December 2016 |
|
|
86,199 |
|
|
|
— |
|
|
|
1,819,665 |
|
|
|
573,768 |
|
|
|
10,696,793 |
|
|
|
13,176,425 |
|
|
January 2017 - December 2017 |
|
|
86,199 |
|
|
|
— |
|
|
|
1,819,665 |
|
|
|
688,521 |
|
|
|
11,782,755 |
|
|
|
14,377,140 |
|
|
January 2018 - December 2018 |
|
|
86,199 |
|
|
|
— |
|
|
|
1,819,665 |
|
|
|
688,521 |
|
|
|
— |
|
|
|
2,594,385 |
|
|
January 2019 and thereafter |
|
|
172,403 |
|
|
|
6,249,585 |
|
|
|
3,181,741 |
|
|
|
4,303,298 |
|
|
|
— |
|
|
|
13,907,418 |
|
|
Total |
|
|
431,000 |
|
|
|
6,249,585 |
|
|
|
9,097,991 |
|
|
|
6,254,108 |
|
|
|
25,000,000 |
|
|
|
47,033,075 |
|
87
9. Deferred Grants
As of December 31, 2014, the Company has received the following grants:
|
a) |
Sustainable Development Technology Canada (SDTC) |
Grant from Sustainable Development Technology Canada to BioAmber Sarnia in the amount of CAD$7,500,000, or $7,051,500 when converted into U.S. dollars as of December 31, 2014, with progressive disbursements according to the terms of the agreement and milestones.
During July 2014, BioAmber Sarnia secured an additional CAD$7.0 million grant to the initial grant of CAD$7.5 million from SDTC pursuant to a contribution agreement dated November 29, 2011, to support the ongoing construction of the Sarnia plant. An amended contribution was signed on December 18, 2014, to amend the contribution from CAD$7.5 to CAD$14.5 million, and the milestones as follows:
|
I. |
Detailed Engineering Package, Construction and Procurement. The Company fulfilled this Milestone in October 2012. |
|
II a). |
Re-engineering of the Production Process and Plant Design. The Company fulfilled this Milestone in 2014. |
|
II b). Engineering Site Preparation and General Contractor Selection The Company fulfilled this Milestone in 2014. |
|
III. |
Engineering, Procurement of Equipment and Construction of the Plan, expected to be prior to March 31, 2015 |
|
IV. |
Commissioning, Start-up and Optimization of the manufacturing facility, expected to be prior to 2016. |
The grant is non-reimbursable by BioAmber Sarnia, except upon the occurrence of certain events of default defined in the agreement.
An advance on Milestone I of CAD$1,982,726, or $1,709,110 when converted into U.S. dollars as of December 31, 2014, was received in December 2011 (net of 10% holdback) and was originally recorded as deferred grant. During October 2012, Milestone I was fulfilled and as a result BioAmber Sarnia received an additional amount of CAD$3,015,000, or $2,599,116 when converted into U.S. dollars as of December 31, 2014, as an advance on Milestone II a). Accordingly, the advance on Milestone I was reclassified from deferred grants reducing the cost of construction in-progress whereas the advance in Milestone II a) was originally recorded as a deferred grant. During December 2014, following to amendment of the milestones as described above, BioAmber Sarnia received an amount of CAD$896,300, or $772,895, when converted into U.S. dollars as of December 31, 2014 for Milestone II b) and advance on Milestone III of CAD$2,398,359, or $2,067,385 when converted into U.S. dollars as of December 31, 2014. The advance on Milestone II a) was reclassified from deferred grants reducing the cost of construction in-progress, and the amount on Milestone II b) was directly applied against construction in-progress. The advance on milestone III was recorded as a deferred grant as of December 31, 2014.
|
b) |
Sustainable Chemistry Alliance (SCA) |
The loan received from the Sustainable Chemistry Alliance is to be used primarily for maintenance and operation of the Company’s facility, staff salaries and commercialization costs. As the loan bears a below market interest rate, it has been recorded at a discount and a portion of the proceeds has been recorded as a deferred grant. The expenses for which the loan was received have not yet been incurred as of December 31, 2014, but are expected to be incurred during the next year. Accordingly, the grant portion of the loan in the amount of $207,417 when converted into U.S. dollars as of December 31, 2014, has been deferred and will be reclassified as a reduction of such expenses as they are incurred in the future.
The balance of the outstanding current liability deferred grant is as follows:
|
|
|
December 31, |
|
|
December 31, |
|
||
|
|
|
2014 |
|
|
2013 |
|
||
|
|
|
$ |
|
|
$ |
|
||
|
SDTC |
|
|
2,067,385 |
|
|
|
2,834,906 |
|
|
SCA |
|
|
207,417 |
|
|
|
226,234 |
|
|
Total |
|
|
2,274,802 |
|
|
|
3,061,140 |
|
88
10. Financial charges (income)
|
|
|
Year Ended December 31 |
|
|||||||||
|
|
|
2014 |
|
|
2013 |
|
|
2012 |
|
|||
|
|
|
$ |
|
|
$ |
|
|
$ |
|
|||
|
End of term charge on long-term debt (Note 8) |
|
|
2,382,293 |
|
|
|
492,707 |
|
|
|
— |
|
|
Interest on long-term debt |
|
|
2,420,984 |
|
|
|
1,305,556 |
|
|
|
— |
|
|
Revaluation of the warrants financial liability (Note 13) |
|
|
7,200,000 |
|
|
|
(10,308,000 |
) |
|
|
— |
|
|
Issuance costs of the warrants financial liability |
|
|
— |
|
|
|
1,131,200 |
|
|
|
— |
|
|
Other interest charge (income), net |
|
|
(266,150 |
) |
|
|
(54,572 |
) |
|
|
— |
|
|
Total financial charges (income), net |
|
|
11,737,127 |
|
|
|
(7,433,109 |
) |
|
|
— |
|
11. Commitments and contingencies
Leases
The Company leases its premises and other assets under various operating leases. Future lease payments aggregate $1,655,050 as at December 31, 2014 and include the following future amounts payable on a twelve month basis:
|
|
December 31, 2014 |
|
|
|
|
$ |
|
|
|
2015 |
|
383,246 |
|
|
2016 |
|
220,906 |
|
|
2017 |
|
173,468 |
|
|
2018 |
|
177,436 |
|
|
2019 |
|
200,834 |
|
|
Thereafter |
|
499,160 |
|
Royalties
The Company has entered into exclusive license agreements that provide for the payment of royalties in the form of up-front payments, minimum annual royalties, and milestone payments. The Company has the right to convert such exclusive agreements into non-exclusive agreements without the right to sublicense and without the obligation to pay minimum royalties. As of December 31, 2014, the Company has commitments related to royalty payments as follows:
|
|
December 31, 2014 |
|
|
|
|
$ |
|
|
|
2015 |
|
562,667 |
|
|
2016 |
|
523,500 |
|
|
2017 |
|
652,667 |
|
|
2018 |
|
736,000 |
|
|
2019 |
|
736,000 |
|
|
Thereafter |
|
6,407,167 |
|
The Company has such contractual agreements with the following partners: Cargill Inc., DuPont, Michigan State University, UT-Batelle on behalf of the U.S. National Laboratories and the U.S. DOE, Celexion LLC, University of Guelph, Gene Bridges GmbH, the University of North Dakota and the National Research Council of Canada in partnership with the INRS University.
The royalties which the Company owes are in return for the use or development of proprietary tools, patents and know-how and the actual expenses incurred amounted to a total of $0.6 million, $1.2 million and $1.4 million for the years ended December 31, 2014, 2013 and 2012, respectively and are included in research and development expenses in the consolidated statements of operations.
89
Purchase Obligations
BioAmber Sarnia has entered into a steam supply agreement with LANXESS Inc, under which, BioAmber Sarnia has agreed to pay a Monthly Take or Pay fee during the term of the contract, which will vary upon the natural gas price index. BioAmber Sarnia has also entered into a service agreement with LANXESS Inc. under which minimum yearly payments are required. As of December 31, 2014, BioAmber Sarnia has commitments related to purchase obligations and service payments as follows:
|
|
December 31, 2014 |
|
|
|
|
$ |
|
|
|
2015 |
|
1,276,214 |
|
|
2016 |
|
2,323,733 |
|
|
2017 |
|
2,541,857 |
|
|
2018 |
|
2,541,857 |
|
|
2019 |
|
2,541,857 |
|
|
Thereafter |
|
8,682,382 |
|
A payment of $579,000 ($CAD 642,000) was made during the year-ended December 31, 2014 under those agreements.
Litigation
As of December 31, 2014, there were no outstanding claims or litigations.
12. Redeemable non-controlling interest
On January 24, 2014, the Company signed an amended and restated joint venture agreement (the “Amended JV Agreement”) with Mitsui & Co. Ltd. related to the Sarnia joint venture. Under the Amended JV Agreement, Mitsui invested an additional $8.1 million (CAD$9 million) on January 29, 2014 in BioAmber Sarnia to maintain its 30% ownership. The Amended JV Agreement also revised each party’s rights and obligations under the buy/sell provisions of the Agreement, including a put option exercisable at Mitsui’s sole discretion that requires the Company to purchase Mitsui’s equity for a purchase price of 50% of Mitsui’s equity in the joint venture. This option remains in effect until December 31, 2018. As a result of the Amended JV Agreement, the Company’s previously recorded non-controlling interest in BioAmber Sarnia joint venture of $2.1 million as at December 31, 2013 in shareholders’ equity on the consolidated balance sheet, was re-classified to redeemable non-controlling interest in temporary equity on the Company’s consolidated balance sheets, at the greater of the carrying value or the redemption value, in accordance with FASB ASC 480-10-S99.
On August 15, 2014, Mitsui invested an additional $16.5 million (CAD$18 million) of equity in BioAmber Sarnia maintaining its 30% ownership. As of December 31, 2014, the estimated redemption value of the redeemable non-controlling interest was $13.8 million.
The following table reflects the activity of the redeemable non-controlling interest:
|
Balance, January 1, 2014 |
|
$ |
— |
|
|
Reclassification of non-controlling interest to redeemable non-controlling interest |
|
|
2,125,925 |
|
|
Mitsui’s additional capital contribution |
|
|
24,608,700 |
|
|
Net loss attributable to redeemable non-controlling interest (NCI) |
|
|
(874,890 |
) |
|
Accumulated other comprehensive income attributable to NCI |
|
|
(1,669,323 |
) |
|
Balance, December 31, 2014 |
|
|
24,190,412 |
|
13. Share capital
On April 10, 2013, the Company’s board of directors approved a 35-for-1 forward stock split of the Company’s outstanding common stock, with a post-split par value of $0.01 per share of common stock, which became effective May 2, 2013, upon the filing of the Company’s amended and restated certificate of incorporation. All share and per share information in the accompanying consolidated financial statements and related notes have been retroactively adjusted to reflect the stock split for all periods presented.
90
Authorized
The Company was authorized to issue from the date of inception to April 13, 2011, 9,310,000 shares of common stock and 1,190,000 preferred shares, issuable in series, each with a par value of $0.01 per share.
On April 14, 2011, the Company’s board of directors resolved (i) to increase the total number of authorized shares of common stock to 17,500,000 and (ii) to eliminate the authorization for issuance of preferred shares.
On May 1, 2013, the Company’s board of directors resolved (i) to increase the total number of authorized shares of common stock to 250,000,000, and (ii) to authorize to issue 5,000,000 shares of undesignated preferred shares, which became effective May 2, 2013, upon the filing of the Company’s amended and restated certificate of incorporation.
Common stock—dividends and voting rights
Each share entitles the record holders thereof to one vote per share on all matters on which shareholders shall have the right to vote. The holders of shares shall be entitled to such dividends, if any, as may be declared thereon by the Company’s board of directors at its sole discretion.
Liquidation, dissolution and winding up rights
In the event of any voluntary or involuntary liquidation, dissolution or winding up of the Company, the holders of shares of common stock shall be entitled to receive all of the remaining assets of the Company available for distribution to its shareholders, ratably in proportion to the number of shares held by them.
Initial Public Offering
On May 9, 2013, the Company completed an initial public offering (IPO) of 8,000,000 units, each unit consisting of one share of common stock and one warrant to purchase half of one share of common stock, at a price of $10.00 per unit. Each warrant is exercisable during the period commencing on August 8, 2013 and ending on May 9, 2017 at an exercise price of $11.00 per whole share of common stock.
The Company received approximately $71.7 million in net proceeds from the IPO, net of fees, expenses and underwriting discounts of $8.3 million, of which $1.1 million was allocated to the warrants and recorded as financial charges in the Consolidated Statements of Operations.
The units began trading on the New York Stock Exchange on May 10, 2013 under the symbol BIOA.U. On June 10, 2013, the common shares began trading on the New York Stock Exchange separately under the symbol BIOA and the warrants began trading on the New York Stock Exchange separately under the symbol BIOA.WS and the trading of the units was suspended and they were de-listed.
Secondary Public Offering
On July 21, 2014, the Company completed the initial closing of a secondary public offering (the “Offering”) and issued 2,800,000 shares of common stock, at a public offering price of $12.00 per share, with an option to the underwriters to purchase an additional 420,000 shares of common stock at the public offering price, which was fully exercised on July 24, 2014, for total aggregate offering proceeds of $38.6 million. The Company received approximately 36.0 million in net proceeds from the Offering, net of fees, expenses and after underwriting discounts.
Warrants financial liability
The warrants issued upon the completion of the IPO, are exercisable during the period beginning on August 8, 2013 and ending on May 9, 2017. The warrants contain full ratchet, anti-dilution protection upon the issuance of any common stock, securities convertible into common stock, or certain other issuances at a price below the then-existing exercise price of the warrant, with certain exceptions. The exercise price of $11.00 per whole share of common stock is subject to appropriate adjustment in the event of certain stock dividends and distributions, stock splits, stock issuances or other similar events affecting the company’s common stock. At issuance, the fair value of the warrants was classified as a financial liability as a result of their characteristics, in accordance with FASB ASC 815.
91
The fair value of the warrants was determined to be $2.02 per warrant using the Black-Scholes option pricing model using the following assumptions:
|
|
|
|
Risk free interest rate |
0.54% |
|
Expected life |
4 years |
|
Volatility |
56.06% |
|
Expected dividend yield |
0% |
|
Forfeiture rate |
0% |
Accordingly, a liability of $16.1 million was recorded at the unit issuance date. On December 31, 2014, the closing value of the warrant on the New York Stock Exchange, a level 1 fair value measure, was $1.63 per warrant. As a result, the liability was revalued at the balance sheet date resulting in a financial income of $7.2 million for the year ended December 31, 2014.
Private placement—period ended December 31, 2012
On February 6, 2012, the Company completed a private placement for gross proceeds of $9,999,910, pursuant to which 351,050 shares of common stock were issued at a price per share of $28.49.
Share issue costs incurred amounted to $22,254 consisting principally of legal fees.
Stock option plan
On December 8, 2008, the Company’s board of directors approved the Company’s Employee Stock Option Plan (the “Plan”), available to certain employees, outside directors and consultants of the Company and its affiliated companies. The options under the Plan are granted for the purchase of common stock at exercise prices determined by the Company’s board of directors and generally vest two, three and four years from the date of grant and expire in 10 years. The total number of options allowable in the plan is 2,121,000, of which 974,750 were approved under the initial plan, 1,050,000 were approved by the Company’s board of directors on June 27, 2011 and 96,250 were approved by the Company’s board of directors on December 6, 2011.
On April 10, 2013, the Company’s board of directors adopted the 2013 Stock Option and Incentive Plan, or the 2013 Plan, which was subsequently approved by the stockholders on May 2, 2013. The 2013 Plan replaced the 2008 Plan, as the Company’s board of directors has determined not to make additional awards under that plan. The 2013 Plan provides flexibility to the compensation committee to use various equity-based incentive awards as compensation tools to motivate its workforce.
The Company initially reserved 2,761,922 shares of its common stock for the issuance of awards under the 2013 Plan. The 2013 Plan may also provide that the number of shares reserved and available for issuance under the plan will automatically increase each January 1, beginning in 2014, by 3% of the outstanding number of shares of common stock on the immediately preceding December 31. This number is subject to adjustment in the event of a stock split, stock dividend or other changes in the Company’s capitalization.
The 2013 Plan is administered by the Company’s board of directors or the compensation committee of the board of directors (the “Administrator”). The Administrator has full power to select, from among the individuals eligible for awards, the individuals to whom awards will be granted, to make any combination of awards to participants, and to determine the specific terms and conditions of each award, subject to the provisions of the 2013 Plan. Persons eligible to participate in the 2013 Plan are those full or part-time officers, employees, non-employee directors and other key persons (including consultants and prospective officers) of the Company and its subsidiaries as selected from time to time by the Administrator in its discretion.
The 2013 Plan permits the granting of (1) options to purchase common stock intended to qualify as incentive stock options under Section 422 of the Code and (2) options that do not so qualify. The exercise price of each option will be determined by the Administrator but may not be less than 100% of the fair market value of the common stock on the date of grant. The term of each option will be fixed by the Administrator and may not exceed ten years from the date of grant. The Administrator will determine at what time or times each option may be exercised.
The Administrator may award stock appreciation rights, restricted shares of common stock, restricted stock units and may also grant shares of common stock which are free from any restrictions under the 2013 Plan. The Administrator may grant performance share awards to any participant, which entitle the recipient to receive shares of common stock upon the achievement of certain performance goals and such other conditions as the Administrator shall determine. The Administrator may grant dividend equivalent rights to participants which entitle the recipient to receive credits for dividends that would be paid if the recipient had held specified shares of common stock.
92
The 2013 Plan provides that upon the effectiveness of a “sale event” as defined in the 2013 Plan, except as otherwise provided by the Administrator in the award agreement, all stock options and stock appreciation rights will automatically become fully exercisable and the restrictions and conditions on all other awards with time-based conditions will automatically be deemed waived, unless the parties to the sale event agree that such awards will be assumed or continued by the successor entity.
No other awards may be granted under the 2013 Plan after the date that is ten years from the date of stockholder approval.
Stock-based compensation expense was allocated as follows:
|
|
|
Year Ended December 31 |
|
|||||||||
|
|
|
2014 |
|
|
2013 |
|
|
2012 |
|
|||
|
|
|
$ |
|
|
$ |
|
|
$ |
|
|||
|
General and administrative |
|
|
2,908,233 |
|
|
|
2,258,766 |
|
|
|
2,407,921 |
|
|
Research and development |
|
|
3,006,039 |
|
|
|
3,399,366 |
|
|
|
4,349,071 |
|
|
Sales and marketing |
|
|
1,034,933 |
|
|
|
1,073,407 |
|
|
|
674,270 |
|
|
Total compensation expense |
|
|
6,949,205 |
|
|
|
6,731,539 |
|
|
|
7,431,262 |
|
The following table summarizes activity under the Plan:
|
|
|
Numbers of options |
|
|
Weighted Average Exercise Price |
|
|
Weighted Average Remaining Contractual life (Years) |
|
|
Aggregate Intrinsic Value |
|
||||
|
Outstanding at December 31, 2013 |
|
|
4,329,560 |
|
|
$ |
8.46 |
|
|
|
8.44 |
|
|
$ |
4,790,470 |
|
|
Granted |
|
|
1,091,901 |
|
|
|
10.28 |
|
|
|
|
|
|
|
|
|
|
Exercised |
|
|
(30,701 |
) |
|
|
5.88 |
|
|
|
|
|
|
|
|
|
|
Forfeited or expired |
|
|
(467,164 |
) |
|
|
21.20 |
|
|
|
|
|
|
|
|
|
|
Outstanding at December 31, 2014 |
|
|
4,923,596 |
|
|
$ |
7.67 |
|
|
|
8.00 |
|
|
$ |
7,417,034 |
|
|
Exercisable at December 31, 2014 |
|
|
2,391,535 |
|
|
$ |
6.82 |
|
|
|
6.76 |
|
|
$ |
5,406,924 |
|
On May 31, 2014, all holders of options outstanding at an exercise price of $28.49 per share agreed to cancel these options for no consideration, whereby the remaining expense associated with the unvested options in the amount of $1,852,787 was recorded as stock-based compensation expense during the second quarter 2014.
The fair value of options granted during the years ended December 31, 2014, 2013 and 2012 was determined using the Black-Scholes option pricing model and the following weighted-average assumptions:
|
|
|
|
|
|
|
|
||||||
|
|
|
Year ended December 31, |
|
|||||||||
|
|
|
2014 |
|
|
2013 |
|
|
2012 |
|
|||
|
Risk-free interest rate |
|
|
1.91 |
% |
|
|
1.98 |
% |
|
|
1.84 |
% |
|
Expected life ( in years ) |
|
6.25 |
|
|
6.72 |
|
|
10 |
|
|||
|
Volatility |
|
|
55.71 |
% |
|
|
60.37 |
% |
|
|
77.34 |
% |
|
Expected dividend yield |
|
|
0 |
% |
|
|
0 |
% |
|
|
0 |
% |
The weighted average grant date fair value of options granted during the years ended December 31, 2014, 2013 and 2012 was approximately $5.58, $4.04 and $20.44, respectively.
93
The following table summarizes information associated with outstanding and exercisable stock options at December 31, 2014:
|
|
|
|
|
Options Outstanding |
|
|
Options Exercisable |
|
||||||||||
|
Exercise prices |
|
|
Number of Options |
|
|
Weighted-Average Remaining Contractual Life inYears |
|
|
Number of Options |
|
|
Weighted-Average Remaining Contractual Life in Years |
|
|||||
|
|
1.07 |
|
|
|
420,000 |
|
|
|
4.00 |
|
|
|
420,000 |
|
|
|
4.00 |
|
|
|
4.55 |
|
|
|
20,000 |
|
|
|
8.60 |
|
|
|
7,083 |
|
|
|
8.60 |
|
|
5.74 - 5.84 |
|
|
|
521,000 |
|
|
|
5.59 |
|
|
|
510,688 |
|
|
|
5.52 |
|
|
|
6.49 - 6.98 |
|
|
|
2,030,333 |
|
|
|
8.86 |
|
|
|
671,727 |
|
|
|
8.86 |
|
|
|
|
7.95 |
|
|
|
15,000 |
|
|
|
8.85 |
|
|
|
3,750 |
|
|
|
8.85 |
|
|
9.65 - 10.55 |
|
|
|
1,845,263 |
|
|
|
8.58 |
|
|
|
773,288 |
|
|
|
7.65 |
|
|
|
11.94 - 12.55 |
|
|
|
47,000 |
|
|
|
9.24 |
|
|
|
5,000 |
|
|
|
9.06 |
|
|
|
|
14.54 |
|
|
|
25,000 |
|
|
|
9.06 |
|
|
|
— |
|
|
|
— |
|
|
$ 1.07 - 14.54 |
|
|
|
4,923,596 |
|
|
|
8.00 |
|
|
|
2,391,535 |
|
|
|
6.76 |
|
|
As of December 31, 2014, the total of unrecognized share-based compensation expense related to unvested options, is approximately $11,566,000, net of expected forfeitures, which is expected to be amortized over the remaining weighted average period of 1.7 years
Warrants
During the year ended December 31, 2014, 3,430 warrants were exercised at an exercise price of $1.43 per share, 3,500 warrants were exercised at an exercise price of $1.07 per share, and 20,046 warrants were exercised at an exercise price of $5.74.
As at December 31, 2014, the Company had the following warrants outstanding to acquire common shares:
|
Number |
|
|
Exercise price |
|
|
Expiration date |
||
|
|
334,541 |
|
|
$ |
1.07 |
|
|
February 2014 - September 2019 |
|
|
610,890 |
|
|
$ |
1.43 |
|
|
February 1, 2019 |
|
|
208,950 |
|
|
$ |
5.74 |
|
|
October 2014 - June 2019 |
|
|
94,745 |
|
|
$ |
10.55 |
|
|
April 1, 2021 |
|
|
4,000,000 |
|
|
$ |
11.00 |
|
|
May 1, 2017 |
|
|
5,249,126 |
|
|
|
|
|
|
|
14. Income taxes
The loss from continuing operations before income taxes was as follows:
|
|
|
Year Ended December 31 |
|
|||||||||
|
|
|
2014 |
|
|
2013 |
|
|
2012 |
|
|||
|
|
|
$ |
|
|
$ |
|
|
$ |
|
|||
|
United States |
|
|
(42,589,140 |
) |
|
|
(26,392,960 |
) |
|
|
(29,160,125 |
) |
|
Canada and other |
|
|
(4,632,339 |
) |
|
|
(7,295,528 |
) |
|
|
(10,323,273 |
) |
|
Loss from continuing operations before income taxes |
|
|
(47,221,479 |
) |
|
|
(33,688,488 |
) |
|
|
(39,483,398 |
) |
The income tax expense was as follows:
|
|
|
Year Ended December 31 |
|
|||||||||
|
|
|
2014 |
|
|
2013 |
|
|
2012 |
|
|||
|
|
|
$ |
|
|
$ |
|
|
$ |
|
|||
|
United States |
|
|
— |
|
|
|
— |
|
|
|
— |
|
|
Canada and other |
|
|
75,371 |
|
|
|
102,794 |
|
|
|
55,065 |
|
|
Loss from continuing operations before income taxes |
|
|
75,371 |
|
|
|
102,794 |
|
|
|
55,065 |
|
94
Differences between the statutory income tax rates and the effective income tax rates applied to the loss before income taxes consisted of the following:
|
|
|
Year Ended December 31 |
|
|||||||||
|
|
|
2014 |
|
|
2013 |
|
|
2012 |
|
|||
|
|
|
$ |
|
|
$ |
|
|
$ |
|
|||
|
Loss before income taxes |
|
|
47,221,479 |
|
|
|
33,688,488 |
|
|
|
39,483,398 |
|
|
U.S. statutory tax rates |
|
|
35 |
% |
|
|
35 |
% |
|
|
35 |
% |
|
Expected income tax recovery |
|
|
(16,527,518 |
) |
|
|
(11,790,971 |
) |
|
|
(13,819,189 |
) |
|
Impact of unrecognized tax benefits |
|
|
— |
|
|
|
47,000 |
|
|
|
3,862,000 |
|
|
Net increase in valuation allowance and other |
|
|
5,476,987 |
|
|
|
11,846,765 |
|
|
|
10,012,254 |
|
|
Loss of tax attributes due to a liquidation |
|
|
11,125,902 |
|
|
|
— |
|
|
|
— |
|
|
Provision for income taxes |
|
|
75,371 |
|
|
|
102,794 |
|
|
|
55,065 |
|
Deferred tax assets and liabilities
The tax effects of temporary differences that give rise to significant components of the deferred income tax assets and deferred income tax liabilities are presented below:
|
|
|
December 31, |
|
|
December 31, |
|
||
|
|
|
2014 |
|
|
2013 |
|
||
|
|
|
$ |
|
|
$ |
|
||
|
Deferred tax assets |
|
|
|
|
|
|
|
|
|
Net operating loss carryforwards |
|
|
37,082,504 |
|
|
|
30,848,361 |
|
|
Interest accretion |
|
|
198,068 |
|
|
|
198,068 |
|
|
Stock options |
|
|
10,510,326 |
|
|
|
7,716,746 |
|
|
Depreciable and amortizable assets |
|
|
1,177,364 |
|
|
|
428,475 |
|
|
Foreign tax credits |
|
|
924,768 |
|
|
|
849,397 |
|
|
Foreign currency differences |
|
|
385,710 |
|
|
|
324,966 |
|
|
Total gross deferred income tax assets |
|
|
50,278,740 |
|
|
|
40,366,013 |
|
|
Less: valuation allowance |
|
|
(50,278,740 |
) |
|
|
(40,366,013 |
) |
|
Total deferred income tax assets |
|
|
— |
|
|
|
— |
|
As at December 31, 2014 and December 31, 2013, the increase in the valuation allowance was primarily due to a history of losses generated. The valuation allowance is reviewed periodically and if the assessment of the “more likely than not” criterion changes, the valuation allowance is adjusted accordingly. There may also be an inability to utilize a significant amount of accumulated net operating losses and federal and state tax credit carryforwards to the extent an ownership change occurs for tax purposes.
At December 31, 2014, the Company had approximately $5.5 million and $98.2 million in net operating loss carryforwards relating to its Canadian and U.S. entities, respectively. The loss carryforwards expire at various dates through 2034. The deferred tax benefit of these loss carryforwards is ultimately subject to final determination by taxation authorities.
For the periods ended December 31, 2014, 2013 and 2012, the Company has not recorded tax benefits from the exercise of stock options.
BioAmber Inc. and its subsidiaries file income tax returns and pay income taxes in jurisdictions where it believes it is subject to tax. In jurisdictions in which BioAmber Inc. and its subsidiaries do not believe they are subject to tax and therefore do not file income tax returns, the Company can provide no certainty that tax authorities in those jurisdictions will not subject one or more tax years (since inception of BioAmber Inc. or its subsidiaries) to examination. Further, while the statute of limitations in each jurisdiction where an income tax return has been filed generally limits the examination period, as a result of loss carryforwards, the limitation period for examination generally does not expire until several years after the loss carryforwards are utilized. Other than routine audits by tax authorities for tax credits and tax refunds that the Company claims, the Company is not aware of any other material income tax examination currently in progress by any taxing jurisdiction. The Company’s major tax jurisdictions are Canada, Luxembourg and the U.S. With few exceptions, BioAmber Inc. and its subsidiaries are subject to Canadian, Luxembourgian and U.S. income tax examinations in respect of all taxation years of the Company since inception.
95
The following is a roll forward of the total amounts of unrecognized tax benefits:
|
|
|
December 31, |
|
|||||||||
|
|
|
2014 |
|
|
2013 |
|
|
2012 |
|
|||
|
|
|
$ |
|
|
$ |
|
|
$ |
|
|||
|
Unrecognized tax benefits—beginning of period |
|
|
7,667,898 |
|
|
|
7,518,104 |
|
|
|
3,601,039 |
|
|
Gross decreases—tax positions in prior periods |
|
|
(3,628,235 |
) |
|
|
— |
|
|
|
— |
|
|
Gross increases—tax positions in current periods |
|
|
- |
|
|
|
149,794 |
|
|
|
3,917,065 |
|
|
Unrecognized tax benefits—end of period |
|
|
4,039,663 |
|
|
|
7,667,898 |
|
|
|
7,518,104 |
|
As of December 31, 2014 and 2013, the balance of unrecognized tax benefits included respectively nil and $265,859, of tax benefits that, if recognized, would affect the effective tax rate. The balance of unrecognized tax benefits as of December 31, 2014 and 2013, also included respectively $4,039,663 and $7,355,039 of tax benefits that, if recognized, would result in adjustments to other tax accounts, primarily prepaid tax expense and deferred taxes.
The Company recognizes accrued interest and penalties related to unrecognized tax benefits as income tax expense unless it is associated with intercompany profits. The Company recognizes interest and penalties related to unrecognized tax benefits associated with intercompany profits as prepaid tax expense. This asset is amortized over the life of the assets involved in the intercompany sale. The Company recorded nil, $47,000 and $22,000 of interest during the year ended December 31, 2014, December 31, 2013 and 2012 respectively.
The Company’s unrecognized tax benefits largely include liabilities related to transfer pricing exposures from allocation of income between jurisdictions. The Company believes that it is reasonably possible that no increase in unrecognized tax benefits related to transfer pricing exposure liabilities may be necessary within the coming year.
15. Financial instruments
Currency risk
The Company is exposed to foreign currency risk as result of foreign-denominated transactions and balances. The Company does not hold any financial instruments that mitigate this risk.
Credit risk
The Company’s exposure to credit risk as of December 31, 2014, is equal to the carrying amount of its financial assets. As of December 31, 2014 the amounts due from three customers represented approximately 60% of the total accounts receivable. As of December 31, 2013, the amounts due from one customer represented approximately 66% of the total accounts receivable.
Interest Rate Risk
The Company’s unrestricted cash totaling $51.0 million at December 31, 2014. These amounts were deposited in current and interest-bearing accounts and were held for working capital purposes. The company’s three-year term loan with TCP bears interest at 9.50% or the 3 month LIBOR rate plus 9.27%. If the 3 month LIBOR rate were to increase, the interest rate for the remaining term of the loan would increase.
16. Fair value of financial assets and liabilities
For cash, accounts receivable and accounts payable, the carrying amount approximates fair value because of the short-term maturity of those instruments.
The carrying amount of long-term debt approximates fair value as at December 31, 2014 and December 31, 2013. The fair value of long-term debt received from government organizations was determined using Level 3 information as the Company produces an estimate of fair value based on internally developed valuation techniques which are based on a discounted cash flow methodology and incorporates all relevant observable market inputs. The interest free loans were discounted using an interest rate between 12% and 15%, a level 3 fair value measurement, representing the interest rate a loan with similar terms and conditions would carry.
The fair value of the warrants which were issued upon the completion of the IPO on May 10, 2013 was calculated using the Black-Scholes option pricing model using various assumptions described in note 13, which was a level 3 fair value measurement. As these warrants starting trading freely on the New York Stock Exchange on June 10, 2013, the closing value of these warrants, which is a level 1 measurement was used to calculate the fair value from June 10, 2013 onwards.
96
17. Related party transactions
Transactions with related parties not disclosed elsewhere were as follows:
|
|
|
December 31, |
|
|||||||||
|
|
|
2014 |
|
|
2013 |
|
|
2012 |
|
|||
|
|
|
$ |
|
|
$ |
|
|
$ |
|
|||
|
Product sales to companies under the common control of a shareholder |
|
|
— |
|
|
|
— |
|
|
|
148,993 |
|
|
Product sales to a shareholder |
|
|
119,824 |
|
|
|
424,796 |
|
|
|
— |
|
|
Toll manufacturing services provided by ARD recorded as research and development expenses |
|
|
360,805 |
|
|
|
540,785 |
|
|
|
94,000 |
|
|
Toll manufacturing services provided by ARD initially recorded as cost of goods sold |
|
|
1,156,420 |
|
|
|
— |
|
|
|
— |
|
|
Toll manufacturing services provided by ARD initially recorded as inventory |
|
|
4,518,246 |
|
|
|
3,307,839 |
|
|
|
3,032,301 |
|
|
Land purchased from Lanxess |
|
|
— |
|
|
|
— |
|
|
|
338,550 |
|
|
Services provided by Saltigo, a subsidiary of Lanxess, recorded as research and development expenses |
|
|
— |
|
|
|
— |
|
|
|
387,440 |
|
On December 7, 2012, the Company entered into a restated toll manufacturing agreement with ARD, whereby ARD granted the Company exclusive access to a demonstration plant in France to develop and produce succinic acid until June 30, 2013, and until December 2014 with guaranteed 60% of the capacity of this facility. The Company purchased 100% of the succinic acid produced by the demonstration plant from ARD. ARD remains a shareholder of the Company.
The related party transactions noted above were undertaken in the normal course of operations and were measured at the exchange amount, which is the amount of consideration established and agreed to by the parties.
18. Business segments
The Company allocates, for the purpose of geographic segment reporting, its revenue based on the location of the seller. For the purpose of geographic segment reporting, the non-current assets of the Company are allocated as follows:
|
|
|
Europe |
|
|
North America |
|
|
Consolidated |
|
|||||||||||||||
|
|
|
December 31, |
|
|
December 31, |
|
|
December 31, |
|
|
December 31, |
|
|
December 31, |
|
|
December 31, |
|
||||||
|
|
|
2014 |
|
|
2013 |
|
|
2014 |
|
|
2013 |
|
|
2014 |
|
|
2013 |
|
||||||
|
|
|
$ |
|
|
$ |
|
|
$ |
|
|
$ |
|
|
$ |
|
|
$ |
|
||||||
|
Property and equipment, net |
|
|
— |
|
|
|
3,333 |
|
|
|
88,664,899 |
|
|
|
13,550,946 |
|
|
|
88,664,899 |
|
|
|
13,554,279 |
|
|
Investment in equity method investments |
|
|
— |
|
|
|
— |
|
|
|
34,817 |
|
|
|
710,333 |
|
|
|
34,817 |
|
|
|
710,033 |
|
|
Intangible assets, net (Note 6) |
|
|
4,158,550 |
|
|
|
4,158,550 |
|
|
|
174,361 |
|
|
|
— |
|
|
|
4,332,911 |
|
|
|
4,158,550 |
|
|
Goodwill |
|
|
625,364 |
|
|
|
692,788 |
|
|
|
— |
|
|
|
— |
|
|
|
625,364 |
|
|
|
692,788 |
|
97
SUPPLEMENTARY INFORMATION
a. Selected Quarterly Financial Data (unaudited)
The following table contains quarterly financial information for 2014 and 2013. The Company believes that the following information reflects all normal recurring adjustments necessary for a fair statement of the information for the periods presented. The operating results for any quarter are not necessarily indicative of results for any future period.
|
|
|
2014 |
|
|||||||||||||||||
|
|
|
First Quarter |
|
|
Second Quarter |
|
|
Third Quarter |
|
|
Fourth Quarter |
|
|
Total |
|
|||||
|
Total revenue |
|
$ |
350,661 |
|
|
$ |
414,600 |
|
|
$ |
469,315 |
|
|
$ |
308,475 |
|
|
$ |
1,543,051 |
|
|
Total operating expenses |
|
|
7,572,016 |
|
|
|
8,541,654 |
|
|
|
7,308,783 |
|
|
$ |
7,281,728 |
|
|
|
30,704,181 |
|
|
Loss from operations |
|
|
7,501,215 |
|
|
|
10,378,155 |
|
|
|
8,287,287 |
|
|
$ |
9,038,265 |
|
|
|
35,204,922 |
|
|
Net loss |
|
|
19,952,041 |
|
|
|
14,145,140 |
|
|
|
8,466,191 |
|
|
$ |
4,733,478 |
|
|
|
47,296,850 |
|
|
Net loss per share applicable to common stockholders—basic |
|
$ |
1.07 |
|
|
$ |
0.75 |
|
|
$ |
0.39 |
|
|
$ |
0.22 |
|
|
$ |
2.32 |
|
|
|
|
2013 |
|
|||||||||||||||||
|
|
|
First Quarter |
|
|
Second Quarter |
|
|
Third Quarter |
|
|
Fourth Quarter |
|
|
Total |
|
|||||
|
Total revenue |
|
$ |
330,722 |
|
|
$ |
1,028,389 |
|
|
$ |
866,529 |
|
|
$ |
439,597 |
|
|
$ |
2,665,237 |
|
|
Total operating expenses |
|
|
10,176,341 |
|
|
|
18,706,131 |
|
|
|
6,714,036 |
|
|
$ |
8,248,672 |
|
|
$ |
43,845,180 |
|
|
Loss from operations |
|
|
9,845,619 |
|
|
|
17,677,742 |
|
|
|
5,847,507 |
|
|
$ |
7,809,075 |
|
|
$ |
41,179,943 |
|
|
Net loss |
|
|
9,615,966 |
|
|
|
7,224,683 |
|
|
|
8,966,756 |
|
|
$ |
7,983,877 |
|
|
$ |
33,791,282 |
|
|
Net loss per share applicable to common stockholders—basic |
|
$ |
0.92 |
|
|
$ |
0.47 |
|
|
$ |
0.48 |
|
|
$ |
0.42 |
|
|
$ |
2.13 |
|
98
None.
Evaluation of Disclosure Controls and Procedures
Our management, with the participation of our principal executive officer and principal financial officer, has evaluated the effectiveness of our disclosure controls and procedures (as defined in Rules 13a—15(e) and 15d—15(e) under the Securities Exchange Act of 1934, as amended (the “Exchange Act”)), as of the end of the period covered by this Annual Report on Form 10-K. Based on such evaluation, our principal executive officer and principal financial officer have concluded that as of such date, our disclosure controls and procedures were effective.
Our management, including our Chief Executive Officer and Chief Financial Officer, does not expect that our disclosure controls and procedures or our internal controls will prevent all errors and all fraud. A control system, no matter how well conceived and operated, can provide only reasonable, not absolute, assurance that the objectives of the control system are met. Because of the inherent limitations in all control systems, no evaluation of controls can provide absolute assurance that all control issues and instances of fraud, if any, within the Company have been detected. These inherent limitations include the realities that judgments in decision-making can be faulty, and that breakdowns can occur because of a simple error or mistake. Additionally, controls can be circumvented by the individual acts of some persons, by collusion of two or more people, or by management override of the control. The design of any system of controls also is based in part upon certain assumptions about the likelihood of future events, and there can be no assurance that any design will succeed in achieving its stated goals under all potential future conditions. Over time, controls may become inadequate because of changes in conditions, or the degree of compliance with the policies or procedures may deteriorate. Because of the inherent limitations in a cost-effective control system, misstatements due to error or fraud may occur and not be detected.
Management’s Annual Report on Internal Control Over Financial Reporting
Our management is responsible for establishing and maintaining adequate internal control over financial reporting as defined in Rule 13a-15(f) or 15d-15(f) of the Exchange Act. Internal control over financial reporting is a process designed to provide reasonable assurance regarding the reliability of financial reporting and the preparation of financial statements for external purposes in accordance with generally accepted accounting principles, and includes those policies and procedures that: (i) pertain to the maintenance of records that, in reasonable detail, accurately and fairly reflect the transactions and dispositions of our assets; (ii) provide reasonable assurance that transactions are recorded as necessary to permit preparation of financial statements in accordance with generally accepted accounting principles, and that our receipts and expenditures are being made only in accordance with authorizations of our management and directors; and (iii) provide reasonable assurance regarding prevention or timely detection of unauthorized acquisition, use or disposition of our assets that could have a material effect on our financial statements.
Because of its inherent limitations, internal control over financial reporting may not prevent or detect misstatements. Also, projections of any evaluation of effectiveness to future periods are subject to the risk that controls may become inadequate because of changes in conditions, or that the degree of compliance with the policies or procedures may deteriorate.
Our management, with the participation of our principal executive officer and principal financial officer, assessed the effectiveness of our internal control over financial reporting as of December 31, 2014. In making this assessment, our management used the criteria set forth in the Internal Control — Integrated Framework (1992) issued by the Committee of Sponsoring Organizations of the Treadway Commission. Based on its assessment, management concluded that our internal control over financial reporting was effective as of December 31, 2014 based on those criteria.
Changes in Internal Control over Financial Reporting
There were no changes in our internal control over financial reporting during our most recent fiscal quarter that have materially affected, or are reasonably likely to materially affect, our internal control over financial reporting.
None.
99
Incorporated by reference from the information in our Proxy Statement for our 2015 Annual Meeting of Stockholders, which we will file with the SEC within 120 days of the end of the fiscal year to which this Annual Report on Form 10-K relates.
Incorporated by reference from the information in our Proxy Statement for our 2015 Annual Meeting of Stockholders, which we will file with the SEC within 120 days of the end of the fiscal year to which this Annual Report on Form 10-K relates.
Incorporated by reference from the information in our Proxy Statement for our 2015 Annual Meeting of Stockholders, which we will file with the SEC within 120 days of the end of the fiscal year to which this Annual Report on Form 10-K relates.
Incorporated by reference from the information in our Proxy Statement for our 2015 Annual Meeting of Stockholders, which we will file with the SEC within 120 days of the end of the fiscal year to which this Annual Report on Form 10-K relates.
Incorporated by reference from the information in our Proxy Statement for our 2015 Annual Meeting of Stockholders, which we will file with the SEC within 120 days of the end of the fiscal year to which this Annual Report on Form 10-K relates.
100
(a)(1) Financial Statements.
The response to this portion of Item 15 is set forth under Item 8 above.
(a)(2) Financial Statement Schedules.
Schedule I—Condensed Parent Company Financial Statements
Report of Independent Registered Public Accounting Firm
To the Board of Directors and Shareholders of
BioAmber Inc.
We have audited the consolidated financial statements of BioAmber Inc. and subsidiaries (the “Company”) as at December 31, 2014 and 2013 and for each of the three years in the period ended December 31, 2014, and have issued our report thereon dated March 16, 2015, such consolidated financial statements and report are included elsewhere in this Form 10-K. Our audits also included the consolidated financial statement schedule of the Company listed in Item 15. This consolidated financial statement schedule is the responsibility of the Company’s management. Our responsibility is to express an opinion based on our audits. In our opinion, such consolidated financial statement schedule, when considered in relation to the basic consolidated financial statements taken as a whole, presents fairly, in all material respects, the information set forth therein.
/s/ Deloitte LLP1
Montreal, Canada
March 16, 2015
1CPA auditor, CA, public accountancy permit No. A118581
101
The condensed financial statements represent the financial information required by SEC Regulation S-X 5-04 for BioAmber Inc., which requires the inclusion of parent company only financial statements if the restricted net assets of consolidated subsidiaries exceed 25% of total consolidated net assets as of the last day of its most recent fiscal year. As of December 31, 2014, BioAmber Inc’s restricted net assets of consolidated subsidiaries were $60.7 million and exceeded 25% of its total consolidated net assets.
The following condensed parent-only financial statements of BioAmber have been prepared in accordance with Rule 12-04, Schedule I of Regulation S-X and included herein. The Parent Company's 100% investment in its subsidiaries has been recorded using the equity basis of accounting in the accompanying condensed parent-only financial statements. The condensed financial statements should be read in conjunction with the consolidated financial statements of BioAmber Inc. and subsidiaries and notes thereto.
102
Condensed Statements of Operations (Parent Company Only)
|
|
|
Year Ended December 31 |
|
|||||||||
|
|
|
2014 |
|
|
2013 |
|
|
2012 |
|
|||
|
|
|
$ |
|
|
$ |
|
|
$ |
|
|||
|
Revenues |
|
|
|
|
|
|
|
|
|
|
|
|
|
Intercompany revenue |
|
|
2,613,791 |
|
|
|
6,315,398 |
|
|
|
9,864,507 |
|
|
Operating expenses |
|
|
|
|
|
|
|
|
|
|
|
|
|
General and administrative |
|
|
11,088,191 |
|
|
|
9,826,731 |
|
|
|
8,523,267 |
|
|
Research and development, net |
|
|
11,245,482 |
|
|
|
14,865,366 |
|
|
|
20,514,273 |
|
|
Sales and marketing |
|
|
2,746,272 |
|
|
|
3,020,288 |
|
|
|
2,827,360 |
|
|
Depreciation of property and equipment and amortization of intangible assets |
|
|
216,356 |
|
|
|
363,387 |
|
|
|
509,880 |
|
|
Impairment loss and write-off of property and equipment and of intangible assets |
|
|
— |
|
|
|
2,385,295 |
|
|
|
— |
|
|
Foreign exchange loss |
|
|
447,285 |
|
|
|
251,943 |
|
|
|
116,079 |
|
|
Operating expenses |
|
|
25,743,586 |
|
|
|
30,713,010 |
|
|
|
32,490,859 |
|
|
Operating loss |
|
|
23,129,795 |
|
|
|
24,397,612 |
|
|
|
22,626,352 |
|
|
Amortization of deferred financing costs and debt discounts |
|
|
269,544 |
|
|
|
138,431 |
|
|
|
3,111,970 |
|
|
Financial charges (income), net |
|
|
11,883,901 |
|
|
|
(7,433,063 |
) |
|
|
— |
|
|
Loss on debt extinguishment, net |
|
|
622,179 |
|
|
|
— |
|
|
|
— |
|
|
Interest revenue from related parties |
|
|
(766,300) |
|
|
|
(765,396 |
) |
|
|
(699,505 |
) |
|
Equity in losses of subsidiaries |
|
|
10,852,568 |
|
|
|
16,880,174 |
|
|
|
14,312,233 |
|
|
Other charge (income), net |
|
|
430,273 |
|
|
|
— |
|
|
|
— |
|
|
Net loss |
|
|
46,421,960 |
|
|
|
33,217,758 |
|
|
|
39,351,050 |
|
|
|
|
|
|
|
|
|
|
|
|
|
|
|
|
Foreign currency translation adjustment |
|
|
2,496,674 |
|
|
|
306,798 |
|
|
|
(883,683 |
) |
|
Total comprehensive loss |
|
|
48,918,634 |
|
|
|
33,524,556 |
|
|
|
38,467,367 |
|
|
|
|
|
|
|
|
|
|
|
|
|
|
|
103
Condensed Balance Sheets (Parent Company Only)
|
|
|
As of |
|
|
As of |
|
||
|
|
|
December 31, |
|
|
December 31, |
|
||
|
|
|
2014 |
|
|
2013 |
|
||
|
|
|
$ |
|
|
$ |
|
||
|
Assets |
|
|
|
|
|
|
|
|
|
Current assets |
|
|
|
|
|
|
|
|
|
Cash |
|
|
32,836,099 |
|
|
|
69,510,236 |
|
|
Intercompany receivables |
|
|
92,851,101 |
|
|
|
75,081,687 |
|
|
Accounts receivable |
|
|
476,851 |
|
|
|
— |
|
|
Inventories |
|
|
1,801,826 |
|
|
|
— |
|
|
Prepaid expenses |
|
|
666,495 |
|
|
|
403,531 |
|
|
Valued added tax, income taxes and other receivables |
|
|
550,553 |
|
|
|
— |
|
|
Deferred financing costs |
|
|
— |
|
|
|
671,270 |
|
|
Total current assets |
|
|
129,182,925 |
|
|
|
145,666,724 |
|
|
Property and equipment, net |
|
|
545,277 |
|
|
|
700,073 |
|
|
Intangible assets, net |
|
|
33,233 |
|
|
|
— |
|
|
Deferred financing costs |
|
|
254,002 |
|
|
|
— |
|
|
Total assets |
|
|
130,015,437 |
|
|
|
146,366,797 |
|
|
|
|
|
|
|
|
|
|
|
|
Liabilities |
|
|
|
|
|
|
|
|
|
Current liabilities |
|
|
|
|
|
|
|
|
|
Accounts payable and accrued liabilities |
|
|
2,864,016 |
|
|
|
2,135,290 |
|
|
Intercompany payables |
|
|
1,728,919 |
|
|
|
411,726 |
|
|
Short-term portion of long-term debt |
|
|
2,520,452 |
|
|
|
6,250,000 |
|
|
Total current liabilities |
|
|
7,113,387 |
|
|
|
8,797,016 |
|
|
Long-term debt |
|
|
21,979,548 |
|
|
|
19,242,707 |
|
|
Warrants financial liability |
|
|
13,040,000 |
|
|
|
5,840,000 |
|
|
Other long-term liabilities |
|
|
127,500 |
|
|
|
82,500 |
|
|
Investment in subsidiaries at equity |
|
|
23,089,181 |
|
|
|
46,715,873 |
|
|
Total liabilities |
|
|
65,349,616 |
|
|
|
80,678,096 |
|
|
Commitments and contingencies |
|
|
|
|
|
|
|
|
|
Shareholders’ equity |
|
|
|
|
|
|
|
|
|
Share capital |
|
|
|
|
|
|
|
|
|
Common stock: |
|
|
|
|
|
|
|
|
|
$0.01 par value per share; 250,000,000 authorized, 21,836,046 and 18,558,369 issued and outstanding at December 31, 2014 and December 31, 2013, respectively |
|
|
218,360 |
|
|
|
185,584 |
|
|
Additional paid-in capital |
|
|
220,460,559 |
|
|
|
177,275,934 |
|
|
Warrants |
|
|
2,949,018 |
|
|
|
2,964,335 |
|
|
Accumulated deficit |
|
|
(161,465,910 |
) |
|
|
(115,043,950 |
) |
|
Accumulated other comprehensive loss |
|
|
2,503,794 |
|
|
|
306,798 |
|
|
Total shareholders’ equity |
|
|
64,665,821 |
|
|
|
65,688,701 |
|
|
Total liabilities and equity |
|
|
130,015,437 |
|
|
|
146,366,797 |
|
104
Condensed Statements of Cash Flows (Parent Only)
|
|
|
Year Ended December 31 |
|
|||||||||
|
|
|
2014 |
|
|
2013 |
|
|
2012 |
|
|||
|
|
|
$ |
|
|
$ |
|
|
$ |
|
|||
|
Cash flows from operating activities |
|
|
|
|
|
|
|
|
|
|
|
|
|
Net loss |
|
|
(46,421,960 |
) |
|
|
(33,217,758 |
) |
|
|
(39,351,050 |
) |
|
Adjustments to reconcile net loss to cash: |
|
|
|
|
|
|
|
|
|
|
|
|
|
Stock-based compensation |
|
|
6,949,205 |
|
|
|
6,731,539 |
|
|
|
7,431,262 |
|
|
Depreciation and impairment loss and write-off of property and equipment and of intangible assets |
|
|
216,356 |
|
|
|
2,748,682 |
|
|
|
509,880 |
|
|
Amortization of deferred financing costs and debt discounts |
|
|
269,544 |
|
|
|
138,431 |
|
|
|
— |
|
|
Write-off of IPO costs |
|
|
— |
|
|
|
— |
|
|
|
1,828,074 |
|
|
Equity participation in losses of equity method investments |
|
|
10,852,568 |
|
|
|
16,880,174 |
|
|
|
14,312,233 |
|
|
Other long-term liabilities |
|
|
45,000 |
|
|
|
45,000 |
|
|
|
37,500 |
|
|
Financial charges (income), net |
|
|
6,707,293 |
|
|
|
(9,815,293 |
) |
|
|
— |
|
|
loss on debt extinguishment |
|
|
401,207 |
|
|
|
— |
|
|
|
— |
|
|
Changes in operating assets and liabilities |
|
|
|
|
|
|
|
|
|
|
|
|
|
Change in account receivable |
|
|
(476,851 |
) |
|
|
— |
|
|
|
— |
|
|
Change in inventories |
|
|
(1,801,826 |
) |
|
|
— |
|
|
|
— |
|
|
Change in prepaid expenses and deposits |
|
|
(260,855 |
) |
|
|
(222,719 |
) |
|
|
(82,348 |
) |
|
Change in research and development tax credits receivable, value added tax, income taxes and other receivables |
|
|
(550,553 |
) |
|
|
23,367 |
|
|
|
(17,557 |
) |
|
Change in accounts payable from subsidiaries |
|
|
1,317,193 |
|
|
|
384,526 |
|
|
|
— |
|
|
Change in accounts payable and accrued liabilities |
|
|
728,726 |
|
|
|
(1,287,224 |
) |
|
|
(609,543 |
) |
|
Net cash used in operating activities |
|
|
(22,024,953 |
) |
|
|
(17,591,275 |
) |
|
|
(15,941,549 |
) |
|
Cash flows from investing activities |
|
|
|
|
|
|
|
|
|
|
|
|
|
Acquisition of property and equipment and intangible asset |
|
|
(94,793 |
) |
|
|
(441,281 |
) |
|
|
(413,353 |
) |
|
Change in accounts receivable from subsidiaries |
|
|
(17,796,614 |
) |
|
|
(22,244,374 |
) |
|
|
(14,921,835 |
) |
|
Capital redistribution from (investment in) equity method investments |
|
|
(32,281,790 |
) |
|
|
251,814 |
|
|
|
146,194 |
|
|
Net cash used in investing activities |
|
|
(50,145,997 |
) |
|
|
(21,897,120 |
) |
|
|
(15,188,994 |
) |
|
|
|
|
|
|
|
|
|
|
|
|
|
|
|
Cash flows from financing activities |
|
|
|
|
|
|
|
|
|
|
|
|
|
Deferred financing costs |
|
|
(253,924 |
) |
|
|
(792,960 |
) |
|
|
— |
|
|
Issuance of long-term debt |
|
|
24,500,000 |
|
|
|
25,000,000 |
|
|
|
— |
|
|
Repayment of long-term debt |
|
|
(25,000,000 |
) |
|
|
— |
|
|
|
— |
|
|
Cancellation of shares |
|
|
— |
|
|
|
(140,000 |
) |
|
|
— |
|
|
Net proceeds from issuance of common shares |
|
|
36,250,737 |
|
|
|
73,023,013 |
|
|
|
9,977,657 |
|
|
Net cash provided by financing activities |
|
|
35,496,813 |
|
|
|
97,090,053 |
|
|
|
9,977,657 |
|
|
Increase (decrease) in cash |
|
|
(36,674,137 |
) |
|
|
56,601,658 |
|
|
|
(21,152,886 |
) |
|
Cash, beginning of period |
|
|
69,510,236 |
|
|
|
11,908,578 |
|
|
|
33,061,464 |
|
|
Cash, end of period |
|
|
32,836,099 |
|
|
|
69,510,236 |
|
|
|
11,908,578 |
|
105
(a)(3) Exhibits.
See the Exhibit Index immediately following the signature page of this Annual Report on Form 10-K. The exhibits listed in the Exhibit Index below are filed or incorporated by reference as part of this Annual Report on Form 10-K.
106
Pursuant to the requirements of Section 13 or 15(d) of the Securities Exchange Act of 1934, the registrant has duly caused this report to be signed on its behalf by the undersigned, thereunto duly authorized.
|
|
|
|
BIOAMBER INC. |
|
|
|
|
|
By: |
/s/ Jean-François Huc |
|
|
Jean-François Huc |
|
|
President and Chief Executive Officer (Principal Executive Officer) |
POWER OF ATTORNEY
Each person whose individual signature appears below hereby constitutes and appoints Jean-François Huc and François Laurin, and each of them, with full power of substitution and resubstitution and full power to act without the other, as his or her true and lawful attorney-in-fact and agent to act in his or her name, place and stead and to execute in the name and on behalf of each person, individually and in each capacity stated below, and to file any and all amendments to this Annual Report on Form 10-K, and to file the same, with all exhibits thereto, and other documents in connection therewith, with the Securities and Exchange Commission, granting unto said attorneys-in-fact and agents, and each of them, full power and authority to do and perform each and every act and thing, ratifying and confirming all that said attorneys-in-fact and agents or any of them or their or his substitute or substitutes may lawfully do or cause to be done by virtue thereof.
Pursuant to the requirements of the Securities Exchange Act of 1934, this report has been signed below by the following persons on behalf of the registrant and in the capacities and on the dates indicated.
|
Name
|
Title
|
Date
|
|
/s/ Jean-François Huc
Jean-François Huc |
President, Chief Executive Officer (Principal Executive Officer) |
March 16, 2015 |
|
|
|
|
|
/s/ François Laurin
François Laurin |
Chief Financial Officer (Principal Financial and Accounting Officer) |
March 16, 2015 |
|
|
|
|
|
/s/ Raymond Land
Raymond Land |
Chairman of the Board of Directors |
March 16, 2015 |
|
|
|
|
|
/s/ Kurt Briner
Kurt Briner |
Director |
March 16, 2015 |
|
|
|
|
|
/s/ Henry P. Linsert
Henry P. Linsert |
Director |
March 16, 2015 |
|
|
|
|
|
/s/ Heinz Haller
Heinz Haller |
Director |
March 16, 2015 |
|
|
|
|
|
/s/ Ellen Richstone
Ellen Richstone |
Director |
March 16, 2015 |
|
|
|
|
|
/s/ Kenneth W. Wall
Kenneth W. Wall |
Director |
March 16, 2015 |
107
|
|
|
Incorporated by reference to:
|
||||
|
Exhibit No. |
Description |
Form or
|
SEC File No.
|
Filing Date
|
Exhibit No.
|
|
|
|
|
|
|
|
|
|
|
3.1 |
Amended and Restated Certificate of Incorporation |
S-1 |
333-177917 |
4/11/2013 |
3.1 |
|
|
|
|
|
|
|
|
|
|
3.2 |
Amended and Restated By-Laws |
S-1 |
333-177917 |
4/11/2013 |
3.2 |
|
|
|
|
|
|
|
|
|
|
4.1 |
Form of Common Stock certificate of the Registrant |
S-1 |
333-177917 |
4/11/2013 |
4.1 |
|
|
|
|
|
|
|
|
|
|
4.2 |
Amended and Restated Shareholders’ Agreement by and among the stockholders listed therein and the Registrant, dated as of April 15, 2011. |
S-1 |
333-177917 |
3/15/2012 |
4.2 |
|
|
|
|
|
|
|
|
|
|
4.3 |
First Amendment to the Amended and Restated Shareholders’ Agreement, dated as of November 4, 2011. |
S-1 |
333-177917 |
3/15/2012 |
4.3 |
|
|
|
|
|
|
|
|
|
|
4.4 |
Second Amendment to the Amended and Restated Shareholders’ Agreement, dated as of February 6, 2012. |
S-1 |
333-177917 |
3/15/2012 |
4.4 |
|
|
|
|
|
|
|
|
|
|
4.5 |
Third Amendment to the Amended and Restated Shareholders’ Agreement, dated as of May 2, 2013. |
S-1 |
333-177917 |
5/2/2013 |
4.5 |
|
|
|
|
|
|
|
|
|
|
4.6 |
Form of Common Stock Purchase Warrant. |
S-1 |
333-177917 |
5/9/2013 |
4.6 |
|
|
|
|
|
|
|
|
|
|
4.7 |
Form of Unit Certificate. |
S-1 |
333-177917 |
5/9/2013 |
4.7 |
|
|
|
|
|
|
|
|
|
|
4.8† |
2008 Stock Option and Incentive Plan of the Registrant and Forms of Award Agreements thereunder |
S-8 |
333-190622 |
8/14/2013 |
4.2 |
|
|
|
|
|
|
|
|
|
|
4.9† |
2013 Stock Option and Incentive Plan of the Registrant and Forms of Award Agreements thereunder |
S-8 |
333-190622 |
8/14/2013 |
4.3 |
|
|
|
|
|
|
|
|
|
|
10.1† |
Form of Indemnification Agreement between the Registrant and its directors and executive officers |
S-1 |
333-177917 |
4/11/2013 |
10.1 |
|
|
|
|
|
|
|
|
|
|
10.2† |
BioAmber Inc. (f/k/a DNP Green Technology, Inc.) Stock Incentive Plan, as amended, and Form of Option Certificate and Award Agreement. |
S-1 |
333-177917 |
3/15/2013 |
10.2 |
|
|
|
|
|
|
|
|
|
|
10.3† |
Employment Agreement between BioAmber Canada Inc. (f/k/a DNPGT Canada Inc.) and Jean-François Huc, dated July 1, 2009. |
S-1 |
333-177917 |
12/22/2011 |
10.3 |
|
|
|
|
|
|
|
|
|
|
10.4† |
Legacy Warrant to purchase shares of common stock dated April 17, 2009 issued by the Registrant to Dilum Dunuwila (Certificate No. LW-41). |
S-1 |
333-177917 |
12/22/2011 |
10.4 |
|
|
|
|
|
|
|
|
|
|
10.5 |
Legacy Warrant to purchase shares of common stock dated April 17, 2009 issued by the Registrant to Dilum Dunuwila (Certificate No. LW-42). |
S-1 |
333-177917 |
12/22/2011 |
10.5 |
|
|
|
|
|
|
|
|
|
|
10.6 |
Legacy Warrant to purchase shares of common stock dated April 17, 2009 issued by the Registrant to Jean-François Huc (Certificate No. LW-16). |
S-1 |
333-177917 |
12/22/2011 |
10.6 |
|
|
10.7 |
Legacy Warrant to purchase shares of common stock dated April 17, 2009 issued by the Registrant to Jean-François Huc (Certificate No. LW-17). |
S-1 |
333-177917 |
12/22/2011 |
10.7 |
|
|
|
|
|
|
|
|
|
|
10.8 |
Legacy Warrant to purchase shares of common stock dated April 17, 2009 issued by the Registrant to Roger Laurent Bernier (Certificate No. LW-38). |
S-1 |
333-177917 |
12/22/2011 |
10.8 |
|
|
|
|
Incorporated by reference to:
|
||||
|
Exhibit No. |
Description |
Form or
|
SEC File No.
|
Filing Date
|
Exhibit No.
|
|
|
|
|
|
|
|
|
|
|
10.9 |
Subscription Agreement between the Registrant and Jean-François Huc dated February 6, 2009. |
S-1 |
333-177917 |
12/22/2011 |
10.9 |
|
|
|
|
|
|
|
|
|
|
10.10 |
Warrant to purchase shares of common stock dated February 6, 2009 issued by the Registrant to Jean- François Huc. |
S-1 |
333-177917 |
12/22/2011 |
10.10 |
|
|
|
|
|
|
|
|
|
|
10.11 |
Subscription Agreement between the Registrant and Dilum Dunuwila dated February 6, 2009. |
S-1 |
333-177917 |
12/22/2011 |
10.11 |
|
|
|
|
|
|
|
|
|
|
10.12 |
Warrant to purchase shares of common stock dated February 6, 2009 issued by the Registrant to Dilum Dunuwila. |
S-1 |
333-177917 |
12/22/2011 |
10.12 |
|
|
|
|
|
|
|
|
|
|
10.13 |
Subscription Agreement between the Registrant and Kurt Briner dated February 6, 2009. |
S-1 |
333-177917 |
12/22/2011 |
10.13 |
|
|
|
|
|
|
|
|
|
|
10.14 |
Warrant to purchase shares of common stock dated February 6, 2009 issued by the Registrant to Kurt Briner. |
S-1 |
333-177917 |
12/22/2011 |
10.14 |
|
|
|
|
|
|
|
|
|
|
10.15 |
Subscription Agreement between the Registrant and Michael Hartmann dated February 6, 2009. |
S-1 |
333-177917 |
12/22/2011 |
10.15 |
|
|
|
|
|
|
|
|
|
|
10.16 |
Warrant to purchase shares of common stock dated February 6, 2009 issued by the Registrant to Michael Hartmann. |
S-1 |
333-177917 |
12/22/2011 |
10.16 |
|
|
|
|
|
|
|
|
|
|
10.17 |
Subscription Agreement between the Registrant and Roger Laurent Bernier dated February 6, 2009. |
S-1 |
333-177917 |
12/22/2011 |
10.17 |
|
|
|
|
|
|
|
|
|
|
10.18 |
Warrant to purchase shares of common stock dated February 6, 2009 issued by the Registrant to Roger Laurent Bernier. |
S-1 |
333-177917 |
12/22/2011 |
10.18 |
|
|
|
|
|
|
|
|
|
|
10.19 |
Secured Convertible Note and Warrant Purchase Agreement between the Registrant and FCPR Sofinnova Capital VI dated June 22, 2009. |
S-1 |
333-177917 |
3/15/2012 |
10.19 |
|
|
|
|
|
|
|
|
|
|
10.20 |
Common Stock Purchase Warrant to purchase shares of common stock dated June 22, 2009 issued by the Registrant to FCPR Sofinnova Capital VI. |
S-1 |
333-177917 |
12/22/2011 |
10.20 |
|
|
|
|
|
|
|
|
|
|
10.21 |
Stock Purchase Agreement between the Registrant and FCPR Sofinnova Capital VI dated September 30, 2009. |
S-1 |
333-177917 |
3/15/2012 |
10.21 |
|
|
|
|
|
|
|
|
|
|
10.22 |
Stock Purchase Agreement between the Registrant and MCVP Technology Fund I, LLC dated September 30, 2009. |
S-1 |
333-177917 |
3/15/2012 |
10.22 |
|
|
|
|
|
|
|
|
|
|
10.23 |
Convertible Note and Warrant Purchase Agreement between the Registrant and FCPR Sofinnova Capital VI dated November 23, 2010. |
S-1 |
333-177917 |
3/15/2012 |
10.23 |
|
|
|
|
|
|
|
|
|
|
10.24 |
Stock Purchase Agreement between the Registrant and the parties set forth therein dated April 15, 2011. |
S-1 |
333-177917 |
3/15/2012 |
10.24 |
|
|
|
|
|
|
|
|
|
|
10.25 |
Shares of Common Stock Purchase Warrant to purchase shares of common stock dated April 15, 2011 issued by the Registrant to FCPR Sofinnova Capital VI. |
S-1 |
333-177917 |
12/22/2011 |
10.25 |
|
|
10.26 |
Shares of Common Stock Purchase Warrant to purchase shares of common stock dated April 15, 2011 issued by the Registrant to MCVP Technology Fund I, LLC. |
S-1 |
333-177917 |
12/22/2011 |
10.26 |
|
|
|
|
|
|
|
|
|
|
|
|
Incorporated by reference to:
|
||||
|
Exhibit No. |
Description |
Form or
|
SEC File No.
|
Filing Date
|
Exhibit No.
|
|
|
10.27 |
Shares of Common Stock Purchase Warrant to purchase shares of common stock dated April 15, 2011 issued by the Registrant to Jean-François Huc. |
S-1 |
333-177917 |
12/22/2011 |
10.27 |
|
|
|
|
|
|
|
|
|
|
10.28 |
Shares of Common Stock Purchase Warrant to purchase shares of common stock dated April 15, 2011 issued by the Registrant to Michael Hartmann. |
S-1 |
333-177917 |
12/22/2011 |
10.28 |
|
|
|
|
|
|
|
|
|
|
10.29 |
Shares of Common Stock Purchase Warrant to purchase shares of common stock dated April 15, 2011 issued by the Registrant to Roger Laurent Bernier. |
S-1 |
333-177917 |
12/22/2011 |
10.29 |
|
|
|
|
|
|
|
|
|
|
10.30 |
Stock Purchase Agreement between the Registrant and the parties set forth therein dated November 4, 2011. |
S-1 |
333-177917 |
3/15/2012 |
10.30 |
|
|
|
|
|
|
|
|
|
|
10.31! |
Sole Commercial Field of Use Patent License Agreement by and among the Registrant, UT-Battelle, LLC, and UChicago Argonne, LLC, effective July 1, 2009. |
S-1 |
333-177917 |
4/1/2013 |
10.31 |
|
|
|
|
|
|
|
|
|
|
10.32 |
Exclusive Distributorship Agreement by and between Bioamber S.A.S. and Mitsui & Co., Ltd., dated April 9, 2010. |
S-1 |
333-177917 |
4/1/2013 |
10.32 |
|
|
|
|
|
|
|
|
|
|
10.33! |
Commercial License Agreement by and between Bioamber S.A.S. and Cargill Inc., dated April 15, 2010, and Amendments to Commercial License Agreement and Development Agreement, dated October 15, 2011. |
S-1 |
333-177917 |
4/10/2013 |
10.33 |
|
|
|
|
|
|
|
|
|
|
10.34! |
Development Agreement by and between Bioamber S.A.S. and Cargill Inc., dated April 15, 2010, and amendments dated July 5, 2011 and October 15, 2011. |
S-1 |
333-177917 |
4/10/2013 |
10.34 |
|
|
|
|
|
|
|
|
|
|
10.35! |
License Agreement by and between Bioamber S.A.S. and E.I. du Pont de Nemours and Company, dated June 28, 2010, as amended on February 18, 2011. |
S-1 |
333-177917 |
4/1/2013 |
10.35 |
|
|
|
|
|
|
|
|
|
|
10.36! |
Restated Toll Manufacturing Agreement, by and among the Registrant, Bioamber S.A.S. and Agro Industrie Recherches et Développements, S.A., dated as of December 7, 2012. |
S-1 |
333-177917 |
4/1/2013 |
10.36 |
|
|
|
|
|
|
|
|
|
|
10.37! |
Technology License Agreement by and between the Registrant and Celexion, LLC, dated September 25, 2010. |
S-1 |
333-177917 |
4/10/2013 |
10.37 |
|
|
|
|
|
|
|
|
|
|
10.38! |
Joint Venture Agreement by and among the Registrant, BioAmber International S.à.r.l., Mitsui & Co., Ltd. and Bluewater Biochemicals Inc., dated November 2, 2011. |
S-1 |
333-177917 |
4/1/2013 |
10.38 |
|
|
|
|
|
|
|
|
|
|
10.39 |
Amendment to the Exclusive Distributorship Agreement, by and between Bioamber S.A.S. and Mitsui & Co., Ltd., dated January 1, 2013. |
DRS |
377-00032 |
2/15/2013 |
10.39 |
|
|
|
|
|
|
|
|
|
|
10.40 |
Amendment One to the Technology License Agreement, by and between the Registrant and Celexion, LLC, dated as of March 15, 2012. |
S-1 |
333-177917 |
4/1/2013 |
10.40 |
|
|
|
|
|
|
|
|
|
|
10.41 |
Second Amendment to the Technology License Agreement, by and between the Registrant and Celexion, LLC, dated as of June 8, 2012. |
S-1 |
333-177917 |
3/15/2012 |
10.41 |
|
|
10.42 |
Joint Development Agreement between BioAmber International S.à.r.l. and Solvay S.A., dated October 25, 2011. |
S-1 |
333-177917 |
4/10/2013 |
10.42 |
|
|
|
|
|
|
|
|
|
|
10.43 |
Stock Purchase Agreement by and between the Registrant and Lanxess Corporation, dated February 6, 2012. |
S-1 |
333-177917 |
3/15/2012 |
10.43 |
|
|
|
|
|
|
|
|
|
|
|
|
Incorporated by reference to:
|
||||
|
Exhibit No. |
Description |
Form or
|
SEC File No.
|
Filing Date
|
Exhibit No.
|
|
|
10.44! |
Supply Agreement between Bioamber S.A.S. and Mitsubishi Chemical Corporation, effective July 1, 2011. |
S-1 |
333-177917 |
4/10/2013 |
10.44 |
|
|
|
|
|
|
|
|
|
|
10.45 |
Sublease Agreement between BioAmber Inc. (f/k/a DNP Green Technology Inc.) and General Electric Capital Canada, commencing August 1, 2009. |
S-1 |
333-177917 |
12/22/2011 |
10.45 |
|
|
|
|
|
|
|
|
|
|
10.46 |
Lease Agreement between the Registrant and St. Paul Fire and Marine Insurance Company, dated December 20, 2011. |
S-1 |
333-177917 |
3/15/2012 |
10.46 |
|
|
|
|
|
|
|
|
|
|
10.47 |
Renewal Agreement between Sinoven Biopolymers Inc and apbcOffices for premises located at Mirea Asset Shanghai, dated April 10, 2011. |
S-1 |
333-177917 |
12/22/2011 |
10.47 |
|
|
|
|
|
|
|
|
|
|
10.48! |
Prosperity Initiative Regional Diversification Contribution Agreement between Bluewater Biochemicals Inc. and Her Majesty the Queen in Right of Canada, effective September 16, 2011. |
S-1 |
333-177917 |
4/1/2013 |
10.48 |
|
|
|
|
|
|
|
|
|
|
10.49 |
Loan Agreement between Bluewater Biochemicals Inc. and Her Majesty the Queen in Right of the Province of Ontario, effective September 30, 2011. |
S-1 |
333-177917 |
3/15/2012 |
10.49 |
|
|
|
|
|
|
|
|
|
|
10.50! |
Restated Limited Liability Company Agreement among the Registrant, Sinoven Biopolymers Inc, NatureWorks LLC and AmberWorks LLC, effective February 15, 2012. |
S-1 |
333-177917 |
4/10/2013 |
10.50 |
|
|
|
|
|
|
|
|
|
|
10.51 |
Amending Agreement #1 to Prosperity Initiative Regional Diversification Contribution Agreement, between BioAmber Sarnia Inc. and Her Majesty The Queen In Right of Canada, dated as of March 26, 2012. |
S-1 |
333-177917 |
3/15/2013 |
10.51 |
|
|
|
|
|
|
|
|
|
|
10.52! |
Joint Development and Scale-up Agreement by and between the Registrant and Evonik Industries AG, dated April 15, 2012. |
S-1 |
333-177917 |
4/1/2013 |
10.52 |
|
|
|
|
|
|
|
|
|
|
10.53† |
Employment Agreement between the Registrant and Babette Pettersen, dated February 1, 2011. |
S-1 |
333-177917 |
3/15/2012 |
10.53 |
|
|
|
|
|
|
|
|
|
|
10.54† |
Employment Agreement between the Registrant and Kenneth W. Wall, dated October 24, 2011. |
S-1 |
333-177917 |
3/15/2013 |
10.54 |
|
|
|
|
|
|
|
|
|
|
10.55† |
Summary of compensation arrangement with Kurt Briner. |
S-1 |
333-177917 |
5/2/2013 |
10.55 |
|
|
|
|
|
|
|
|
|
|
10.56† |
Summary of compensation arrangement with Heinz Haller. |
S-1 |
333-177917 |
5/2/2013 |
10.56 |
|
|
|
|
|
|
|
|
|
|
10.57† |
Summary of compensation arrangement with Raymond Land. |
S-1 |
333-177917 |
5/2/2013 |
10.57 |
|
|
|
|
|
|
|
|
|
|
10.58! |
Technology License Agreement by and among the Registrant, Sinoven Biopolymers Inc, NatureWorks LLC and AmberWorks LLC, dated February 15, 2012. |
S-1 |
333-177917 |
4/10/2013 |
10.58 |
|
|
|
|
|
|
|
|
|
|
10.59! |
Supply Agreement by and between Bioamber S.A.S. and International Flavors & Fragrances Inc., dated January 1, 2011. |
S-1 |
333-177917 |
4/1/2013 |
10.59 |
|
|
10.60 |
Amendment to the Restated Limited Liability Company Agreement among the Registrant, Sinoven Biopolymers, Inc, NatureWorks LLC and AmberWorks LLC, dated as of August , 2012. |
DRS |
377-00032 |
2/15/2013 |
10.60 |
|
|
|
|
|
|
|
|
|
|
|
|
Incorporated by reference to:
|
||||
|
Exhibit No. |
Description |
Form or
|
SEC File No.
|
Filing Date
|
Exhibit No.
|
|
|
10.61 |
Second Amendment to the Restated Limited Liability Company Agreement among the Registrant, Sinoven Biopolymers, Inc, NatureWorks LLC and AmberWorks LLC, dated as of November 5, 2012. |
DRS |
377-00032 |
2/15/2013 |
10.61 |
|
|
|
|
|
|
|
|
|
|
10.62! |
Agreement of Purchase and Sale, by and between LANXESS Inc. and BioAmber Sarnia Inc., dated as of May 25, 2012. |
S-1 |
333-177917 |
4/1/2013 |
10.62 |
|
|
|
|
|
|
|
|
|
|
10.63 |
Memorandum of Agreement of Lease, by and between BioAmber Canada Inc. and Société en Commandite Douze-Cinquante/Twelve-Fifty, Company Limited, dated as of September 24, 2012. |
DRS |
377-00032 |
2/15/2013 |
10.63 |
|
|
|
|
|
|
|
|
|
|
10.64 |
Consent and Amendments to Loan Agreement, by and between BioAmber Sarnia Inc. and Her Majesty The Queen In Right of The Province of Ontario, dated as of September 27, 2012. |
DRS |
377-00032 |
2/15/2013 |
10.65 |
|
|
|
|
|
|
|
|
|
|
10.65 |
Second Amendment to the Executive Distributorship Agreement, by and between Bioamber S.A.S. and Mitsui & Co., dated as of April 8, 2013. |
S-1 |
333-177917 |
4/10/2013 |
10.66 |
|
|
|
|
|
|
|
|
|
|
|
|
|
|
|
|
|
|
10.66 |
Loan Agreement, dated as of June 30, 2014, among BioAmber Sarnia Inc., Comerica Bank and the other parties thereto. |
10-Q |
001-35905 |
8/12/2014 |
10.1 |
|
|
|
|
|
|
|
|
|
|
10.67* |
Loan and Security Agreement, dated as of December 17, 2014, among Tennenbaum Capital Partners, Sinoven Biopolymers Inc., BioAmber Canada Inc. and BioAmber International S.a.r.l. |
|
|
|
|
|
|
|
|
|
|
|
|
|
|
21.1* |
Subsidiaries of the Registrant |
|
|
|
|
|
|
|
|
|
|
|
|
|
|
23.1* |
Consent of Deloitte LLP, Independent Registered Public Accounting Firm |
|
|
|
|
|
|
|
|
|
|
|
|
|
|
24.1* |
Power of Attorney (included on signature page) |
|
|
|
|
|
|
|
|
|
|
|
|
|
|
31.1* |
Certification of Principal Executive Officer Pursuant to Section 302 of the Sarbanes-Oxley Act of 2002. |
|
|
|
|
|
|
|
|
|
|
|
|
|
|
31.2* |
Certification of Principal Financial Officer Pursuant to Section 302 of the Sarbanes-Oxley Act of 2002. |
|
|
|
|
|
|
|
|
|
|
|
|
|
|
32.1* |
Certification of the Principal Executive Officer and Principal Financial Officer pursuant Section 906 of the Sarbanes-Oxley Act of 2002 |
|
|
|
|
|
|
|
|
|
|
|
|
|
|
|
|
|
|
|
|
|
|
|
|
Incorporated by reference to:
|
||||
|
Exhibit No. |
Description |
Form or
|
SEC File No.
|
Filing Date
|
Exhibit No.
|
|
|
101.INS |
XBRL Instance Document. |
|
|
|
|
|
|
|
|
|
|
|
|
|
|
101.SCH |
XBRL Taxonomy Extension Schema Document. |
|
|
|
|
|
|
|
|
|
|
|
|
|
|
101.CAL |
XBRL Taxonomy Extension Calculation Linkbase Document. |
|
|
|
|
|
|
|
|
|
|
|
|
|
|
101.DEF |
XBRL Taxonomy Extension Definition Linkbase Document. |
|
|
|
|
|
|
101.LAB |
XBRL Taxonomy Extension Label Linkbase Document. |
|
|
|
|
|
|
|
|
|
|
|
|
|
|
101.PRE |
XBRL Taxonomy Extension Presentation Linkbase Document. |
|
|
|
|
|
|
* |
Filed herewith. |
|
** |
The certifications furnished in Exhibit 32.1 hereto are deemed to accompany this Annual Report on Form 10-K and will not be deemed “filed” for purposes of Section 18 of the Securities Exchange Act of 1934, as amended. Such certifications will not be deemed to be incorporated by reference into any filings under the Securities Act of 1933, as amended, or the Securities Exchange Act of 1934, as amended, except to the extent that the Registrant specifically incorporates it by reference. |
|
† |
Management contract or compensatory plan or arrangement. |
|
! |
Confidential treatment has been granted by the Securities and Exchange Commission as to certain portions. |