Attached files
| file | filename |
|---|---|
| EXCEL - IDEA: XBRL DOCUMENT - TIANYIN PHARMACEUTICAL CO., INC. | Financial_Report.xls |
| EX-32.1 - CERTIFICATION - TIANYIN PHARMACEUTICAL CO., INC. | f10q1214ex32i_tianyinpharma.htm |
| EX-31.1 - CERTIFICATION - TIANYIN PHARMACEUTICAL CO., INC. | f10q1214ex31i_tianyinpharma.htm |
| EX-32.2 - CERTIFICATION - TIANYIN PHARMACEUTICAL CO., INC. | f10q1214ex32ii_tianyinpharma.htm |
| EX-31.2 - CERTIFICATION - TIANYIN PHARMACEUTICAL CO., INC. | f10q1214ex31ii_tianyinpharma.htm |
U.S. SECURITIES AND EXCHANGE COMMISSION
WASHINGTON, D.C. 20549
FORM 10-Q
(Mark One)
☒ QUARTERLY REPORT PURSUANT TO SECTION 13 OR 15(d) OF THE SECURITIES EXCHANGE ACT OF 1934
For the quarterly period ended December 31, 2014
☐ TRANSITION REPORT PURSUANT TO SECTION 13 OR 15(d) OF THE SECURITIES EXCHANGE ACT OF 1934
For the transition period from _______________ to _______________
Commission File Number
Tianyin Pharmaceutical Co., Inc.
(Exact name of registrant as specified in its charter)
| Delaware | ||
(State or other jurisdiction of incorporation or organization) |
(IRS
Employer Identification No.) |
23rd Floor, Unionsun Yangkuo Plaza
No. 2, Block 3, Renmin Road South
Chengdu, P. R. China, 610041
+86 028 8551 6696
(Address, including zip code, and telephone number,
including area code, of Registrant’s principal executive offices)
Indicate by check mark whether the registrant (1) has filed all reports required to be filed by Section 13 or 15(d) of the Exchange Act of 1934 during the past 12 months (or for such shorter period that the registrant was required to file such reports), and (2) has been subject to such filing requirements for the past 90 days. Yes ☒ No ☐
Indicate by check mark whether the registrant has submitted electronically and posted on its corporate Web site, if any, every Interactive Data File required to be submitted and posted pursuant to Rule 405 of Regulation S-T (§232.405 of this chapter) during the preceding 12 months (or for such shorter period that the registrant was required to submit and post such files). Yes ☒ No ☐
Indicate by check mark whether the registrant is a large accelerate filer, an accelerated filer, a non-accelerated filer, or a smaller reporting company. See the definitions of “large accelerated filer,” “accelerated filer” and “smaller reporting company” in Rule 12b-2 of the Exchange Act.
| Large Accelerated Filer | ☐ | Accelerated Filer | ☐ | |
| Non-accelerated filer | ☐ (do not check if a smaller reporting company) | Smaller reporting company | ☒ |
Indicate by check mark whether the registrant is a shell company (as defined in Rule 12b-2 of the Securities Exchange Act of 1934) Yes ☐ No ☒
As of March 13, 2015, we are authorized to issue up to 50,000,000 shares of Common Stock, par value US$.001 per share of which 29,546,276 shares issued and 29,432,791 shares outstanding; and authorized to issue up to 10,000,000 shares of Series A Preferred Stock, of which -0- shares are currently issued and outstanding.
TABLE OF CONTENTS
| Page | ||
| PART I - FINANCIAL INFORMATION | ||
| Item 1. Financial Statements | ||
| Unaudited Consolidated Balance Sheets at December 31, 2014 and June 30, 2014 | 3 | |
| Unaudited Consolidated Statements of Operations for the three and six months ended December 31, 2014 and 2013 | 4 | |
| Unaudited Consolidated Statements of Comprehensive Income for the three and six months ended December 31, 2014 and 2013 | 5 | |
| Unaudited Consolidated Statements of Cash Flows for the six months ended December 31, 2014 and 2013 | 6 | |
| Unaudited Notes to Consolidated Financial Statements | 7 | |
| Item 2. Management’s Discussion and Analysis or Plan of Operation | 11 | |
| Item 3. Quantitative and Qualitative Disclosure About Market Risk | 16 | |
| Item 4. Controls and Procedures | 16 | |
| PART II – OTHER INFORMATION | 17 | |
| Item 1. Legal Proceedings | 17 | |
| Item 2. Unregistered Sales of Equity Securities And Use Of Proceeds | 17 | |
| Item 3. Defaults Upon Senior Securities | 17 | |
| Item 4. Mine Safety Disclosures | 17 | |
| Item 5. Other Information | 17 | |
| Item 6. Exhibits | 18 |
| 2 |
| Tianyin Pharmaceutical Co., Inc. | ||||||||
| Consolidated Balance Sheets | ||||||||
| (Unaudited) | ||||||||
| December 31, | June 30, | |||||||
| 2014 | 2014 | |||||||
| Assets | ||||||||
| Current assets: | ||||||||
| Cash and cash equivalents | $ | 11,619,292 | $ | 16,120,041 | ||||
| Restricted cash | 419,139 | 994,017 | ||||||
| Accounts receivable, net of allowance for doubtful accounts of $102,590 and $102,401 at December 31, 2014 and June 30, 2014, respectively | 2,273,805 | 9,074,576 | ||||||
| Inventory | 6,266,299 | 3,841,712 | ||||||
| Loan receivable | - | 1,981,280.00 | ||||||
| Deferred tax assets | 994,918 | 1,180,510 | ||||||
| Prepaid research and development expenses - current portion | 3,525,167 | - | ||||||
| Other current assets | 885,284 | 587,384 | ||||||
| Total current assets | 25,983,904 | 33,779,520 | ||||||
| Property and equipment, net | 46,490,692 | 45,378,356 | ||||||
| Intangibles, net | 27,340,736 | 27,699,733 | ||||||
| Prepaid research and development expenses | 1,057,550 | - | ||||||
| Goodwill | 211,510 | 211,120 | ||||||
| Total assets | $ | 101,084,392 | $ | 107,068,729 | ||||
| Liabilities and Equity | ||||||||
| Current liabilities: | ||||||||
| Accounts payable and accrued expenses | $ | 298,349 | $ | 1,592,459 | ||||
| Accounts payable – construction related | 821,377 | 2,238,927 | ||||||
| Short-term bank loans | 2,928,600 | 4,547,200 | ||||||
| Income tax payable | - | 35,832 | ||||||
| Other taxes payable | 61,792 | 390,490 | ||||||
| Other current liabilities | 391,104 | 522,995 | ||||||
| Total current liabilities | 4,501,222 | 9,327,903 | ||||||
| Total liabilities | 4,501,222 | 9,327,903 | ||||||
| Equity | ||||||||
| Stockholders’ equity: | ||||||||
| Preferred stock, $0.001 par value, 25,000,000 shares authorized, no shares issued and outstanding at December 31, 2014 and June 30, 2014 | - | - | ||||||
| Common stock, $0.001 par value, 50,000,000 shares authorized, 29,546,276 shares issued, 29,432,791 shares outstanding at December 31, 2014 and June 30, 2014 | 29,546 | 29,546 | ||||||
| Additional paid-in capital | 27,809,515 | 30,189,802 | ||||||
| Treasury stock, 113,485 shares at cost | (135,925 | ) | (135,925 | ) | ||||
| Statutory reserve | 7,148,893 | 6,976,412 | ||||||
| Retained earnings | 51,132,786 | 50,193,258 | ||||||
| Accumulated other comprehensive income | 10,598,355 | 10,423,712 | ||||||
| Total stockholders’ equity | 96,583,170 | 97,676,805 | ||||||
| Noncontrolling interest | - | 64,021 | ||||||
| Total equity | 96,583,170 | 97,740,826 | ||||||
| Total liabilities and equity | $ | 101,084,392 | $ | 107,068,729 | ||||
The accompanying notes are an integral part of these unaudited consolidated financial statements
| 3 |
| Tianyin Pharmaceutical Co., Inc. | ||||||||||||||||
| Consolidated Statements of Operations | ||||||||||||||||
| (Unaudited) | ||||||||||||||||
| For the Three Months Ended December 31, | For the Six Months Ended December 31, | |||||||||||||||
| 2014 | 2013 | 2014 | 2013 | |||||||||||||
| Sales | $ | 6,691,740 | $ | 13,923,166 | $ | 16,425,121 | $ | 28,671,714 | ||||||||
| Cost of sales | 3,041,483 | 7,705,869 | 7,696,946 | 16,460,902 | ||||||||||||
| Gross profit | 3,650,257 | 6,217,297 | 8,728,175 | 12,210,812 | ||||||||||||
| Operating expenses | ||||||||||||||||
| Selling expenses | 1,216,952 | 2,428,675 | 2,845,800 | 4,967,919 | ||||||||||||
| General and administrative expenses | 1,253,361 | 1,082,395 | 2,189,417 | 2,111,161 | ||||||||||||
| Research and development | 914,607 | 252,014 | 2,007,250 | 503,328 | ||||||||||||
| Total operating expenses | 3,384,920 | 3,763,084 | 7,042,467 | 7,582,408 | ||||||||||||
| Income from operations | 265,337 | 2,454,213 | 1,685,708 | 4,628,404 | ||||||||||||
| Other income (expenses): | ||||||||||||||||
| Interest income | 13,002 | 86,424 | 13,819 | 108,734 | ||||||||||||
| Interest expense | (69,819 | ) | (119,821 | ) | (158,657 | ) | (222,722 | ) | ||||||||
| Total other income (expenses) | (56,817 | ) | (33,397 | ) | (144,838 | ) | (113,988 | ) | ||||||||
| Income before provision for income taxes | 208,520 | 2,420,816 | 1,540,870 | 4,514,416 | ||||||||||||
| Provision for income taxes | 82,336 | 727,757 | 437,164 | 1,361,865 | ||||||||||||
| Net income | 126,184 | 1,693,059 | 1,103,706 | 3,152,551 | ||||||||||||
| Less: Net income (loss) attributable to noncontrolling interest | - | (50,549 | ) | (8,303 | ) | (106,180 | ) | |||||||||
| Net income attributable to Tianyin Pharmaceutical Co., Inc. | $ | 126,184 | $ | 1,743,608 | $ | 1,112,009 | $ | 3,258,731 | ||||||||
| Basic and diluted earnings per share | $ | 0.00 | $ | 0.06 | $ | 0.04 | $ | 0.11 | ||||||||
| Weighted average number of common shares outstanding: | ||||||||||||||||
| Basic and diluted | 29,432,791 | 29,382,791 | 29,432,791 | 29,382,791 | ||||||||||||
The accompanying notes are an integral part of these unaudited consolidated financial statements
| 4 |
Tianyin Pharmaceutical Co., Inc.
Consolidated Statements of Comprehensive Income
(Unaudited)
| For the Three Months Ended December 31, | For the Six Months Ended December 31, | |||||||||||||||
| 2014 | 2013 | 2014 | 2013 | |||||||||||||
| Net income | $ | 126,184 | $ | 1,693,059 | $ | 1,103,706 | $ | 3,152,551 | ||||||||
| Other comprehensive income | ||||||||||||||||
| Foreign currency translation adjustment | 173,910 | 435,429 | 174,638 | 1,048,091 | ||||||||||||
| Total other comprehensive income | 173,910 | 435,429 | 174,638 | 1,048,091 | ||||||||||||
| Total Comprehensive income | 300,094 | 2,128,488 | 1,278,344 | 4,200,642 | ||||||||||||
| Less: Comprehensive income (loss) attributable to the noncontrolling interest | - | (49,912 | ) | (8,308 | ) | (104,386 | ) | |||||||||
| Comprehensive income attributable to Tianyin Pharmaceutical Co., Inc. | $ | 300,094 | $ | 2,178,400 | $ | 1,286,652 | $ | 4,305,028 | ||||||||
The accompanying notes are an integral part of these unaudited consolidated financial statements
| 5 |
Tianyin Pharmaceutical Co., Inc.
Consolidated Statements of Cash Flows
(Unaudited)
| For the Six Months Ended December 31, | ||||||||
| 2014 | 2013 | |||||||
| Cash flows from operating activities: | ||||||||
| Net Income | $ | 1,103,706 | $ | 3,152,551 | ||||
| Adjustments to reconcile net income to net cash provided by (used in) operating activities: | ||||||||
| Depreciation and amortization | 1,285,722 | 1,297,519 | ||||||
| Deferred tax assets | 185,592 | - | ||||||
| Changes in current assets and current liabilities: | ||||||||
| Accounts receivable | 6,813,344 | (563,334 | ) | |||||
| Inventory | (2,416,004 | ) | 61,748 | |||||
| Prepaid research and development expenses | (4,579,900 | ) | - | |||||
| Other current assets | (296,633 | ) | 314,887 | |||||
| Accounts payable and accrued expenses | (1,296,255 | ) | 99,102 | |||||
| Accounts payable – construction related | (1,420,812 | ) | (2,736,906 | ) | ||||
| Income tax and other taxes payable | (365,093 | ) | (259,470 | ) | ||||
| Other current liabilities | (132,776 | ) | 18,527 | |||||
| Net cash provided by (used in) operating activities | (1,119,109 | ) | 1,384,624 | |||||
| Cash flows from investing activities: | ||||||||
| Addition of Construction in process | (1,903,684 | ) | (367,234 | ) | ||||
| Collection of loans receivable | 1,983,720 | - | ||||||
| Acquisition of non-controlling interests | (2,436,000 | ) | - | |||||
| Net cash used in investing activities | (2,355,964 | ) | (367,234 | ) | ||||
| Cash flows from financing activities: | ||||||||
| Changes in restricted cash | 576,360 | 4,558,680 | ||||||
| Repayment of short-term bank loans | (1,626,000 | ) | (1,400,166 | ) | ||||
| Net cash provided by (used in) financing activities | (1,049,640 | ) | 3,158,514 | |||||
| Effect of foreign currency translation on cash | 23,964 | 304,207 | ||||||
| Net increase (decrease) in cash and cash equivalents | (4,500,749 | ) | 4,480,111 | |||||
| Cash and cash equivalents – beginning of period | 16,120,041 | 26,827,008 | ||||||
| Cash and cash equivalents – end of period | $ | 11,619,292 | $ | 31,307,119 | ||||
| Supplemental disclosures of cash activities | ||||||||
| Cash paid for interest | $ | 150,808 | $ | 222,645 | ||||
| Cash paid for income taxes | $ | 306,992 | $ | 1,340,918 | ||||
The accompanying notes are an integral part of these unaudited consolidated financial statements
| 6 |
TIANYIN PHARMACEUTICAL CO., INC.
Notes To Consolidated Financial Statements
(Unaudited)
NOTE 1 – ORGANIZATION AND NATURE OF BUSINESS
Tianyin Pharmaceutical (the “Company” or “TPI”), was established under the laws of Delaware. The Company’s primary business is to research, manufacture and sell pharmaceutical products in China through its wholly owned subsidiaries.
The following chart describes the Company’s current corporate structure:
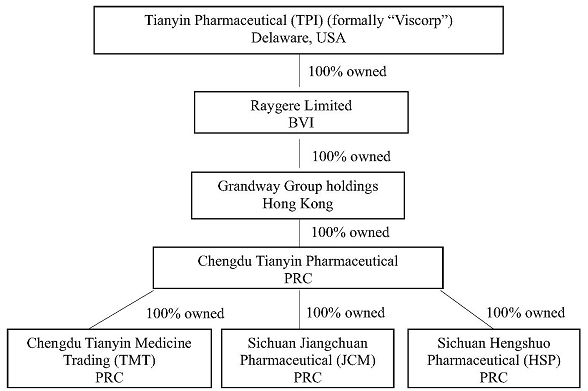
NOTE 2 – BASIS OF PRESENTATION AND CONSOLIDATION
The unaudited consolidated financial statements include the accounts of TPI and its wholly-owned subsidiaries. All inter-company transactions and balances have been eliminated in consolidation. The accompanying unaudited financial statements have been prepared in accordance with US GAAP applicable to interim financial information and the requirements of Form 10-Q and Article 8 of Regulation S-X of the Securities and Exchange Commission. Accordingly, they do not include all of the information and disclosures required by US GAAP for complete financial statements. Interim results are not necessarily indicative of results for a full year. In the opinion of management, all adjustments, which include only normal recurring adjustments, considered necessary for a fair presentation of the financial position and the results of operations and cash flows for the interim periods have been included.
These interim unaudited consolidated financial statements should be read in conjunction with the consolidated financial statements for the year ended June 30, 2014, included in the Company’s annual report on Form 10-K filed with the U.S. Securities Exchange Commission on December 9, 2014, as not all disclosures required by US GAAP for annual financial statements are presented. The interim consolidated financial statements follow the same accounting policies and methods of computations as the audited consolidated financial statements for the year ended June 30, 2014.
| 7 |
In preparing the accompanying unaudited consolidated financial statements, we evaluated the period from December 31, 2014 through the date the financial statements were issued for material subsequent events requiring recognition or disclosure. No such events were identified for this period.
The Company uses the United States dollar (“U.S. Dollar” or “US$” or “$”) for financial reporting purposes. The subsidiaries within the Company maintain their books and records in their respective functional currency, being the primary currency of the economic environment in which their operations are conducted. Assets and liabilities of a subsidiary with functional currency other than U.S. Dollar are translated into U.S. Dollars using the applicable exchange rates prevailing at the balance sheet date. Items on the statements of comprehensive income and cash flows are translated at average exchange rates during the reporting period. Equity accounts are translated at historical rates. Adjustments resulting from the translation of the Company’s financial statements are recorded as a component of accumulated other comprehensive income.
Certain amounts for prior periods have been reclassified to conform to the current period presentation.
NOTE 3 – ACQUISITION OF NON-CONTROLLING INTEREST
On September 30, 2014, the Company’s subsidiary, Chengdu Tianyin, acquired the remaining 13% of Sichuan Jiangchuan Pharmaceutical Co. Ltd (“JCM”) for RMB 15 million (approximately $2.4 million) from an unrelated individual. Total payment of RMB 15 million was made on October 8, 2014. JCM became a wholly owned subsidiary of Chengdu Tianyin on September 30, 2014.
NOTE 4 – INVENTORY
Inventory as of December 31, 2014 and June 30, 2014 consists of the following:
| December 31, 2014 | June 30, 2014 | |||||||
| Raw materials | $ | 2,450,113 | $ | 690,355 | ||||
| Packaging supplies | 1,006,334 | 387,599 | ||||||
| Work in process | 972,615 | 1,088,880 | ||||||
| Finished goods | 1,837,237 | 1,674,878 | ||||||
| $ | 6,266,299 | $ | 3,841,712 | |||||
NOTE 5 – PREPAID RESEARCH AND DEVELOPMENT EXPENSE
In July 2014, the Company’s subsidiary, Chengdu Tianyin, entered into a research and development agreement with a pharmaceutical research company, Kang Lu Biomedical Co. (KL). KL is a reputable TCM research company that specializes in the product development and CFDA application process for mTCM extracts and healthcare products. Persuant to the agreement, KL will provide research and development expanding formulation varieties from Gingko Mihuan Oral Liquid (GMOL) to Capsule formulation. The total contract price is RMB 65 million (approximately $10.5 million). The first payment of RMB 39 million (approximately $6.3 million) was paid in July 2014. The project is expected to be completed before August 2017. The total contract price will be amortized over the term of the agreement which is a period of three years on a straight line basis.
| 8 |
NOTE 6 – SHORT-TERM BANK LOANS
Short-term bank loans consist of the following:
| December 31, | June 30, | |||||||
| 2014 | 2014 | |||||||
| On October 30, 2013, the Company obtained a loan from China CITIC Bank, which matures on October 30, 2014. The interest is calculated using an annual fixed interest rate of 7.20% and paid monthly. The loan was guaranteed by the Company’s CEO, Dr. Jiang and a third party. Loan principal of $1,618,600 was repaid in October 2014, and the remaining loan principal of $2,928,600 is in default and currently being discussed with the bank for loan renewal till July 2015. | $ | 2,928,600 | $ | 4,547,200 | ||||
| Total short-term bank loans | $ | 2,928,600 | $ | 4,547,200 | ||||
NOTE 7 – INCOME TAXES
The Company's subsidiary, Raygere, is incorporated in the British Virgin Islands. Under the corporate tax laws of British Virgin Islands, it is not subject to tax on income or capital gain.
The operating subsidiaries in China are all subject to 25% income tax rate. The tax write- offs and loss profit credit could only be applied to the individual subsidiaries of TPI.
In July 2006, the FASB issued ASC 740 that clarifies the accounting for income taxes by prescribing a minimum probability threshold that a tax position must meet before a financial statement benefit is recognized. The minimum threshold is defined as a tax position that is more likely than not to be sustained upon examination by the applicable taxing authority, including resolution of any related appeals or litigation processes, based on the technical merits of the position. The Company did not recognize any benefits in the financial statements for the fiscal year ended June 30, 2014 and for the six months ended December 31, 2014.
The comparison of income tax expense at the U.S. statutory rate of 35% in 2014 and 2013, to the Company’s effective tax is as follows:
| Six months ended December 31, | ||||||||
| 2014 | 2013 | |||||||
| U.S. Statutory rate | $ | 539,305 | $ | 1,580,046 | ||||
| Tax rate difference between China and U.S. | (152,005 | ) | (450,750 | ) | ||||
| Change in valuation allowance | 49,864 | 232,569 | ||||||
| Effective tax | $ | 437,164 | $ | 1,361,865 | ||||
| The provisions for income taxes are summarized as follows: | ||||||||
| Six months ended December 31, | ||||||||
| 2014 | 2013 | |||||||
| Current | $ | 251,571 | $ | 1,361,865 | ||||
| Deferred | 135,729 | - | ||||||
| Valuation allowance | 49,864 | - | ||||||
| Total | $ | 437,164 | $ | 1,361,865 | ||||
| 9 |
NOTE 8 – RISK FACTORS
The Company's operations are carried out in the PRC. Accordingly, the Company's business, financial condition and results of operations may be adversely influenced by the political, economic and legal environments in the PRC as well as by the general state of the PRC’s economy. Specifically, the Company's business may be negatively influenced by changes in governmental policies with respect to laws and regulations, anti-inflationary measures, currency conversion and remittance abroad, and rates and methods of taxation, among other things.
NOTE 9 – RISK OF CONCENTRATIONS AND CREDIT RISK
Concentrations
In terms of individual product sales, our major product Gingko Mihuan Oral Liquid (GMOL) represented 59% or $9.6 million of total sales for the six months ended December 31, 2014, as compared to 40% or $11.4 million of total sales for the six months ended December 31, 2013. For the quarter ended December 31, 2014, GMOL sales represented 60% or $4.0 million as compared to 45% or $6.3 million for the quarter ended December 31, 2013.
For the six months ended December 31, 2014, one single customer accounted for 23% of the Company’s total sales compared with no customer with more than 10% of the Company’s sales for the six months ended December 31, 2013.
Purchases from one vendor accounted for 54% of the Company’s total purchases for the six months ended December 31, 2014 as compared to four vendors accounted for 18%, 14%, 12% and 11% respectively of the Company’s total purchases for the six months ended December 31, 2013.
Credit Risk
Financial instruments, which potentially subject the Company to credit risk consist principally of cash on deposit with financial institutions. Management believes that the financial institutions that hold the Company’s cash and cash equivalents are financially sound and minimal credit risk exists with respect to these investments. Due to the state ownership of China’s majority of financial institutions, the policies that regulate the banking industry also presents a unique risk that impacts all industrial segments in China. The traditional industries such as pharmaceutical manufacturing without exception may also be affected in terms of capital expenditure for GMP certification, raw material purchases and etc.
| 10 |
Item 2. Management’s Discussion and Analysis of Financial Condition and Results of Operations
The following discussion and analysis of financial condition and results of operations relates to the operations and financial condition reported in the financial statements of Tianyin Pharmaceutical Co., Inc. for the three and six months ended December 31, 2014 and 2013 and should be read in conjunction with such financial statements and related notes included in this report and the Company’s Annual Report on Form 10-K for the year ended June 30, 2014.
The information set forth below includes forward-looking statements. Certain factors that could cause results to differ materially from those projected in the forward-looking statements are set forth below. Readers are cautioned not to put undue reliance on forward-looking statements. The Company disclaims any intent or obligation to update publicly these forward-looking statements, whether as a result of new information, future events or otherwise.
Overview
We are engaged in the development, manufacturing, marketing and sale of patented biopharmaceutical, modernized traditional Chinese medicines (mTCM), branded generics and other pharmaceuticals in China. We currently manufacture and market a portfolio of 58 products, 24 of which are listed in the National Medical Reimbursement program including the patent protected Ginkgo Mihuan Oral Liquid (GMOL) and a series of drug candidates that target various high incidence healthcare conditions in China. Established in 1994, Chengdu Tianyin Pharmaceutical Co., Ltd (“Chengdu Tianyin”) is a pharmaceutical company that manufactures and sells mTCMs and branded generics. The current management acquired 100% of the equity interest of Chengdu Tianyin in 2003. On October 30, 2007, Grandway Groups Holdings Ltd. (“Grandway”) completed the acquisition of the 100% of the equity interest and now owns 100% of the equity interest of Chengdu Tianyin.
In June 2009, Chengdu Tianyin invested approximately $0.7 million (RMB 5 million) to establish a wholly-owned trading subsidiary, Chengdu Tianyin Medicine Trading Co., Ltd (“TMT”) for the sale and distribution of pharmaceutical products to optimize our business model through our distribution channels.
On August 21, 2009, Chengdu Tianyin, Sichuan Mingxin Pharmaceutical (“Sichuan Mingxin”) and an individual investor established Sichuan Jiangchuan Pharmaceutical Co., Ltd (“JCM”). JCM’s major business is to produce macrolide antibiotic active pharmaceutical ingredients (API). It was incorporated as a part of our strategy to establish our presence in the API industry in China. The total registered capital of JCM is approximately $3.2 million (equivalent of RMB 20 million), of which Chengdu Tianyin accounts for 87%, after increasing its stake in JCM from 77% at the inception of JCM by purchasing another 10% ownership from Sichuan Mingxin in the fiscal year 2012. On September 30, 2014, Chengdu Tianyin purchased the remaining 13% of the ownership of JCM from the individual investor for approximately $2.4 million (RMB 15 million). Consequently, JCM became a wholly owned subsidiary of Chengdu Tianyin.
On August 29, 2012, Chengdu Tianyin entered into a Share Transfer Agreement with the shareholders of Sichuan Hengshuo Pharmaceutical Co., Ltd (“Sichuan Hengshuo” or “HSP”), a pharmaceutical distribution company, to acquire 100% ownership of HSP for approximately $0.2 million (RMB 1.3 million). The purpose of the acquisition was to facilitate the relocation of Company’s manufacturing facility to Qionglai since HSP was registered at Qionglai. The share transfer was closed on November 30, 2012, pursuant to which Chengdu Tianyin now owns 100% of HSP and Guoqing Jiang, Chairman and CEO of Chengdu Tianyin has become the legal representative of HSP.
On January 16, 2015, TPI announced that the Company plans to form a strategic alliance with Buchang Pharmaceutical Co., Ltd. (“Buchang Pharma”), one of China's most elite pharmaceutical companies, to accelerate the growth of the Company, to boost its mTCM franchise focusing on its cardiovascular revenue driver Gingko Mihuan (GMOL). The strategic alliance will be established based upon the Company’s newly completed and GMP-certified Qionglai Tianyin Facility (QLF) with expanded production capacities in mTCM pre-extraction, purification and formulation manufacturing. The total registered capital for the joint venture will be RMB 200 million (approximately $33 million), of which the Company’s wholly owned subsidiary Chengdu Tianyin Pharmaceutical Co., Ltd. owns 95% and Buchang Pharma owns 5%.
Competitive Environment
The market for pharmaceutical products is highly competitive. Our operations may be affected by technological advances by competitors, industry consolidation, patents granted to competitors, competitive combination products, new products offered by our competitors, as well as new information provided by other marketed products and/or other post-market studies.
| 11 |
Development and Growth Strategy
Research and Development (R&D)
We have a proven cooperative partnership model for the R&D which is cost effective, efficient, and value adding for our organic growth. We focused on innovative products as well as modifications and improvements of existing marketed products with substantial market potential. Our R&D partners include a number of most prestigious academic institutions in China such as China Pharmaceutical University, Sichuan University-affiliated West China Center of Medical Sciences, and Shaanxi University of Chinese Medicines. The partnership-based R&D strategy supports TPI to commercialize, produce, and broaden our product pipeline and to market those products through our sales and marketing infrastructure. In July 2014, a TPI’s subsidiary, Chengdu Tianyin, entered into a research and development agreement with a pharmaceutical research company to expand formulation varieties from GMOL to Capsule formulation. The project is expected to be completed by August 2017.
R&D for additional indications of flagship product Gingko Mihuan (GMOL)
Our flagship product GMOL (CFDA certification number: H20013079; patent number: 20061007800225) contributes a significant share to our total quarterly revenue. Our R&D partnership research has been recently explored for further development of capsulation and tablets formulations for GMOL. The in-house research group at TPI together with the partnership research institutes will collaborate in developing, testing and filing for the CFDA approval application. Due to the increased stringency by CFDA approval, the time span and costs for the R&D of new products have increased significantly during recent years.
Jiangchuan Macrolide Facility (JCM)
In January 2012, the JCM for R&D, manufacturing and sale of macrolide APIs received its GMP certification designated as "CHUAN M0799," which is valid until December 31, 2015. As a result, JCM started the production of the macrolide API for TPI’s Azithromycin Dispersible Tablets (SFDA No: H20074145). The API produced by JCM supplies for TPI’s own Azithromycin Tablets as well as for both domestic and international third party sales .
In April 2014, JCM has developed a new line of Azithromycin API products that supports steady monthly export orders to South Asia. Following a series of tests on quality, purity, intermediates contents, stereochemistry, stability in comparison with the international standards of Azithromycin API, JCM has received monthly orders for manufacturing one of the major intermediates of Azithromycin, Azithromycin Amine (AA) at a competitive international price which varies on monthly basis according to market demands and foreign exchange rate. Following JCM’s application (No. 51268) for the import certificate to India via India's Central Drugs Standard Control Organization Ministry of Health & Family Welfare, JCM successfully passed the preliminary examination on December 30, 2014, and was notified on January 16, 2015 by the Directorate General Of Health Services, Office of Drug Controller General (India) Import and Registration Division regarding the application to import Azithromycin API Products and Intermediates to send in samples of Azithromycin API from three different lots for analysis. Upon request, the samples were sent to the Central Drug Testing Laboratory (CDTL) in Mumbai, India for the final approval of the import. JCM has also been negotiating with a subsidiary of a large international pharmaceutical company who sells Azithromycin tablets sale worldwide for API . In addition to JCM's certification in India, along with other international clients located at Bangladesh, Philippines and Iran on import status, JCM plans for certification process in both the European Union and the United States in order to service international clients and their subsidiaries in China. JCM’s Drug Master File (DMF) will be prepared and submitted to the appropriate regulatory authority at the intended drug market. DMF provides the regulatory authority with confidential, detailed information about facilities, processes, or articles used in the manufacturing, processing, packaging, and storing of one or more drugs. In the United States, DMFs are submitted to the Food and Drug Administration (FDA). The Main Objective of the DMF is to support regulatory requirements and to prove the quality, safety and efficacy of the medicinal product for export application. These registration and certification processes are expected to support further demand for JCM's API products in both domestic and international markets.
Tianyin Medicine Trading Distribution Business (TMT)
TMT is established to distribute products manufactured by us and other pharmaceutical companies to fuel our expanding sales network as well as to provide synergy to our existing organic product portfolio. TMT has been distributing mainly our products since its inception in 2009. Since 2010, we have signed and later extended distribution contracts with Jiangsu Lianshui Pharmaceutical (“Lianshui”) to distribute Lianshui-branded generic injection products including cough suppressant, antibiotics, anti-inflammatory medicines and other healthcare indications.
| 12 |
Pre-extraction and formulation plant development at Qionglai Facility (QLF)
In preparation for the new GMP standards stipulated by the government in early 2011, we initiated a process to optimize our manufacturing facilities and production lines in compliance with the new GMP standards. Under the guidance by provincial government, our facility is scheduled to be relocated to Qionglai County, south of Chengdu, which is designated for the pharmaceutical industry. Both the TCM pre-extraction plant and the formulation plant will be relocated to form a combined QLF, occupying an area of 80 mu (13 acres). The combined QLF, designed and constructed according to the latest GMP standards, is expected to relieve the current capacity saturation at the current facilities. The re-location cost for Phase I, which includes both the pre-extraction and formulation plant is estimated at $25 million, which is to improve the current capacity by 30-50%. In Phase II QLF, an additional $10 million may be invested to double the current capacity. QLF has successfully passed the GMP certification process (GMP certificate No.: SC20140067 valid through 2020) in early 2015.
Fiscal 2015 Guidance
The following factors, in our opinion, will influence the Company’s growth perspectives for fiscal year 2015:
| 1) | Market expansion and revenue growth of TPI’s core product portfolio led by flagship product GMOL and other major products; |
| 2) | JCM revenue at both domestic and international markets in the fiscal year 2015; |
| 3) | Generic sale stabilization and recovery along with our strategy to cope with pricing restrictions and market competition under the ongoing healthcare reform; and |
| 4) | QLF GMP relocation and smooth transition of production capacity. |
We previously forecast the organic revenue growth for TPI to range 0-5% for the fiscal year 2015 as compared with the fiscal year 2014. The management is currently monitoring the relocation progress and the manufacturing capacity and efficiency maintenance and improvement at QLF to evaluate their effect on the Company’s operating results to update the guidance if necessary while any changes will be communicated on a quarterly basis or as when appropriate.
Discussion on Operating Results
The following table shows the results of operations of our business. All references to the results of operations and financial conditions are on a consolidated basis that includes Chengdu Tianyin, TMT, JCM and HSP.
Comparison of results for the three and six months ended December 31, 2014 and 2013:
| Three Months Ended | ||||||||
| December 31, | December 31, | |||||||
| 2014 | 2013 | |||||||
| (In $ millions) | ||||||||
| Sales | 6.7 | 13.9 | ||||||
| Cost of sales | 3.0 | 7.7 | ||||||
| Gross profit | 3.7 | 6.2 | ||||||
| Income from Operation | 0.3 | 2.5 | ||||||
| Provision for income taxes | 0.1 | 0.7 | ||||||
| Net income | 0.1 | 1.7 | ||||||
| Six Months Ended | ||||||||
| December 31, | December 31, | |||||||
| 2014 | 2013 | |||||||
| (In $ millions) | ||||||||
| Sales | 16.4 | 28.7 | ||||||
| Cost of sales | 7.7 | 16.5 | ||||||
| Gross profit | 8.7 | 12.2 | ||||||
| Income from Operation | 1.7 | 4.6 | ||||||
| Provision for income taxes | 0.4 | 1.4 | ||||||
| Net income | 1.1 | 3.2 | ||||||
Sales for the quarter ended December 31, 2014 were $6.7 million as compared to $13.9 million for the quarter ended December 31, 2013. Sales for the six months ended December 31, 2014 were $16.4 million as compared to $28.7 million for the six months ended December 31, 2013. The sales decrease was a result of continuous pricing pressure and restrictive sales policies on generic products compared with the same period last year. The decrease was also a result of the relocation process of Company’s manufacturing facility from the previous Longquan location to the new QLF site.
| 13 |
Cost of Sales for the quarter ended December 31, 2014 was $3.0 million or 45% of sales, as compared to $7.7 million or 55% of sales for the quarter ended December 31, 2013. Cost of Sales for the six months ended December 31, 2014 was $7.7 million as compared to $16.5 million for the six months ended December 31, 2013. Our cost of sales primarily consists of the costs of direct raw materials (85% of the cost of goods sold) and production cost (15% of cost of goods sold). The percentage decrease in our cost of sales from the previous period was mainly attributable to a greater percentage of higher margin products and a decrease of our lower margin generic segment.
Gross Margin for the quarter ended December 31, 2014 was 55% as compared to 45% for the quarter ended December 31, 2013. Gross margin for the six months ended December 31, 2014 was 53% as compared to 43% for the six months ended December 31, 2013. As discussed above, our gross margin improved, predominately as a result of an increased higher margin products being sold during the period. We see the trend to continue for the rest of fiscal 2015.
Income from Operations was $0.3 million for the quarter ended December 31, 2014, as compared to $2.5 million for the quarter ended December 31, 2013. Income from Operations was $1.7 million for the six months ended December 31, 2014 as compared to $4.6 million for the six months ended December 31, 2013. The decrease of income from operations was mainly due to the R&D costs towards our cardiovascular portfolio centered on GMOL and the decrease of sales as a result of the relocation process discussed above.
Net Income was $0.1 million with net margin of 1.5% for the quarter ended December 31, 2014, as compared to net income of $1.7 million with net margin of 12% for the quarter ended December 31, 2013. Net income was $1.1 million with net margin of 7% for the six months ended December 31, 2014 as compared to $3.2 million with net margin of 11% for the six months ended December 31, 2013. The decrease of net margins was primarily due to the GMOL R&D costs and the decrease of sales as a result of the relocation process discussed above.
Foreign Currency Translation Adjustment. Our reporting currency is the US dollar. We have evaluated the determination of its functional currency based on the guidance in ASC Topic, “Foreign Currency Matters,” which provides that an entity’s functional currency is the currency of the primary economic environment in which the entity operates; normally, that is the currency of the environment in which an entity primarily generates and expends cash. We have conducted financings in U.S. dollars, paid operating expenses primarily in U.S. dollars, paid dividends to our shareholders of common stock and expect to receive any dividends that may be declared by our subsidiaries in U.S. dollars. Therefore, we have determined that our functional currency is the U.S. dollar based on the expense and financing indicators, in accordance with the guidance in ASC 830-10-85-5. However, the functional currency of our indirectly owned operating subsidiary in China is Renminbi (RMB). Results of operations and cash flow are translated at average exchange rates during the period, and assets and liabilities are translated at the unified exchange rate as quoted by the People’s Bank of China at the end of the period. Translation adjustments resulting from this process are included in accumulated other comprehensive income in the statement of shareholders’ equity. Transaction gains and losses that arise from exchange rate fluctuations on transactions denominated in a currency other than the functional currency are included in the results of operations as incurred.
Currency translation adjustments are included in accumulated other comprehensive income in the consolidated statement of Comprehensive Income and amounted to $174,638 and $1,048,091 for the six months ended December 31, 2014 and 2013, respectively. The balance sheet amounts with the exception of equity as of December 31, 2014 were translated at 6.1463 RMB to 1.00 US dollar as compared to 6.1425 RMB to 1.00 US dollar as of December 31, 2013. The equity accounts were stated at their historical rate. The average translation rates applied to income statement accounts for the quarters ended December 31, 2014 and 2013 were the average exchange rates during the periods.
| 14 |
Liquidity and Capital Resources
Discussion of Cash Flow ($ in millions)
| For the six months ended December 31, | ||||||||
| 2014 | 2013 | |||||||
| Cash provided by (used in) operating activities | $ | (1.1 | ) | $ | 1.4 | |||
| Cash used in investing activities | $ | (2.4 | ) | $ | (0.4 | ) | ||
| Cash provided by (used in) financing activities | $ | (1.0 | ) | $ | 3.2 | |||
Operating activities
As of December 31, 2014, we had working capital totaling $21.5 million, including cash and cash equivalents of $11.6 million. Net cash used in operating activities was $1.1 million for the six months ended December 31, 2014 as compared with net cash provided by operating activities of $1.4 million for the six months ended December 31, 2013. We believe that TPI is adequately funded to meet all of our working capital and capital expenditure needs for fiscal year 2015.
Investing activities
We had $1.9 million and $0.4 million cash used in investing activities towards QLF construction for the six months ended December 31, 2014 and 2013, respectively. $2.4 million was paid to acquire the 13% non-controlling interest of our subsidiary JCM during the six months ended December 31, 2014.
Financing Activities
Net cash used in financing activities for the six months ended December 31, 2014, totaled $1.0 million as compared to net cash provided by financing activities for the same period of 2013 of $3.2 million.
Borrowings and Credit Facilities
The short-term bank borrowings outstanding as of December 31, 2014 and 2013 were $2.9 million and $4.6 million, respectively. We paid an average interest rate of 7.20% and 6.927% per annum in 2014 and 2013, respectively. These loans were made from CITIC Bank, secured by Chengdu Tianyin's certificate of deposit and guaranteed by Guoqing Jiang, our CEO and a third party. The loans do not contain any additional financial covenants or restrictions. The borrowings have one-year terms which do not contain specific renewal terms. The short-term loan of $2.9 million is in default and currently being discussed with the bank for loan renewal till July 2015.
Changes in Equity
During the six months ended December 31, 2014, there have been no activities related to warrants exercise or option exercises. All of the Company’s remaining warrants, which were Class B Warrants issued in a financing conducted by the Company in January 2008, expired on January 31, 2015. As of the date of this filing, there are no outstanding warrants issued by the Company.
Critical Accounting Policies and Estimates
Please refer to “Management’s Discussion and Analysis of Financial Condition and Results of Operations,” in our Annual Report on Form 10-K for the year ended June 30, 2014, for disclosures regarding TPI’s critical accounting policies and estimates, as well as updates further disclosed in our interim financial statements as described in this Form 10-Q.
Off-Balance Sheet Arrangements
We do not have any off-balance sheet arrangements that have or are reasonably likely to have a current or future effect on our financial condition, changes in financial condition, revenues or expenses, results of operations, liquidity, capital expenditures or capital resources that is material to investors.
Others
While Inflation is not often expected to impact significantly on our operations, we could realize inflationary pressures that could increase our costs which we may not be able to pass onto our customers as a result of costs controls that could be affected by governmental healthcare pricing initiatives and policies.
| 15 |
Item 3. Quantitative and Qualitative Disclosure About Market Risk
Not applicable
Item 4. Controls and Procedures
(a) Evaluation of disclosure controls and procedures
We maintain disclosure controls and procedures designed to provide reasonable assurance that material information required to be disclosed by us in the reports we file or submit under the Securities Exchange Act of 1934 is recorded, processed, summarized and reported within the time periods specified in the SEC’s rules and forms, and that the information is accumulated and communicated to our management, as appropriate to allow timely decisions regarding required disclosure. We performed an evaluation, under the supervision and with the participation of our management, of the effectiveness of the design and operation of our disclosure controls and procedures as of the end of the period covered by this report. Based on this evaluation, our management has concluded as of June 30, 2014 and as of December 31, 2014, due to the existence of material weaknesses, that our disclosure controls and procedures were not effective in ensuring that information required to be disclosed in reports filed under the Securities Exchange Act of 1934, as amended, is recorded, processed, summarized and reported within the time periods specified by the Securities and Exchange Commission, and were not effective in providing reasonable assurance that information required to be disclosed by the Company in such reports is accumulated and communicated to the Company’s management, including its Chief Executive Officer, as appropriate to allow timely decisions regarding required disclosure.
We do not expect that our disclosure controls and procedures will prevent all errors and all instances of fraud. Disclosure controls and procedures, no matter how well conceived and operated, can provide only reasonable, not absolute, assurance that the objectives of the disclosure controls and procedures are met. Further, the design of disclosure controls and procedures must reflect the fact that there are resource constraints, and the benefits must be considered relative to their costs. Because of the inherent limitations in all disclosure controls and procedures, no evaluation of disclosure controls and procedures can provide absolute assurance that we have detected all our control deficiencies and instances of fraud, if any. The design of disclosure controls and procedures also is based partly on certain assumptions about the likelihood of future events, and there can be no assurance that any design will succeed in achieving its stated goals under all potential future conditions.
(b) Changes in internal control over financial reporting
There were no changes in our internal control over financial reporting (as such term is defined in Rules 13a-15(f) and 15d-15(f) under the Exchange Act) during the fiscal quarter covered by this report that has materially affected, or are reasonably likely to materially affect, our internal control over financial reporting.
| 16 |
PART II - OTHER INFORMATION
| ITEM 1. | Legal Proceedings |
From time to time, we may be involved in litigation relating to claims arising out of our operations in the normal course of business. We are not aware of any pending or threatened legal proceeding that, if determined in a manner adverse to us, could have a material adverse effect on our business and operations.
| ITEM 2. | Unregistered Sales of Equity Securities and Use of Proceeds
(a) Not applicable.
(b) Not applicable.
(c) Not applicable. |
| ITEM 3. | Defaults upon Senior Securities
(a) Not Applicable.
(b) Not Applicable. |
| ITEM 4. | Mine Safety Disclosures |
Not applicable.
| ITEM 5. | OTHER INFORMATION
(a) Not applicable.
(b) Not applicable. |
| 17 |
| ITEM 6. | EXHIBITS |
(a) The following exhibits are filed as part of this report.
| Exhibit No. | Document | |
| 3.1 | Articles of Incorporation, as amended (Incorporated by reference to Exhibit 3.1 to our Annual Report on Form 10-K filed on September 29, 2008). | |
| 3.2 | Bylaws (Incorporated by reference to Exhibit 3.2 to our Annual Report on Form 10-K filed on September 29, 2008). | |
| 31.1 | Certification of Chief Executive Officer required by Rule 13a-14/15d-14(a) under the Exchange Act (Filed herewith) | |
| 31.2 | Certification of Chief Accounting Officer required by Rule 13a-14/15d-14(a) under the Exchange Act (Filed herewith) | |
| 32.1 | Certification of Chief Executive Officer pursuant to 18 U.S.C. Section 1350, as adopted pursuant to Section 906 of the Sarbanes-Oxley Act of 2002 (Filed herewith) | |
| 32.2 | Certification of Acting Chief Accounting Officer pursuant to 18 U.S.C. Section 1350, as adopted pursuant to Section 906 of the Sarbanes-Oxley Act of 2002 (Filed herewith) | |
| 101 | Interactive Data Files (Filed herewith) | |
| 101.SCH | XBRL Taxonomy Extension Schema Document | |
| 101.SCH | XBRL Taxonomy Extension Schema Document | |
| 101.CAL | XBRL Taxonomy Extension Calculation Linkbase Document | |
| 101.LAB | XBRL Taxonomy Extension Labels Linkbase Document | |
| 101.PRE | XBRL Taxonomy Extension Presentation Linkbase Document | |
| 101.DEF | XBRL Taxonomy Extension Definition Linkbase Document |
| 18 |
SIGNATURES
Pursuant to the requirements of the Securities Exchange Act of 1934, the registrant has duly caused this Form 10-Q for the quarter ended December 31, 2014 to be signed on its behalf by the undersigned, thereunto duly authorized.
Date: March 13, 2015
| TIANYIN PHARMACEUTICAL CO., INC. | ||
| By: | /s/ Guoqing Jiang | |
| Name: | Dr. Guoqing Jiang | |
| Title : | Chairman, Chief Executive Officer, Chief Accounting Officer, Chief Financial Officer | |
19