Attached files
| file | filename |
|---|---|
| EXCEL - IDEA: XBRL DOCUMENT - LGI Homes, Inc. | Financial_Report.xls |
| EX-23.2 - EXHIBIT 23.2 - LGI Homes, Inc. | lgih123114ex232.htm |
| EX-21.1 - EXHIBIT 21.1 - LGI Homes, Inc. | lgih123114ex211.htm |
| EX-31.1 - EXHIBIT 31.1 - LGI Homes, Inc. | lgih123114ex311.htm |
| EX-31.2 - EXHIBIT 31.2 - LGI Homes, Inc. | lgih123114ex312.htm |
| EX-23.1 - EXHIBIT 23.1 - LGI Homes, Inc. | lgih123114ex231.htm |
| EX-32.2 - EXHIBIT 32.2 - LGI Homes, Inc. | lgih123114ex322.htm |
| EX-10.3 - EXHIBIT 10.3 - LGI Homes, Inc. | lgihex103firstmodification.htm |
| EX-10.4 - EXHIBIT 10.4 - LGI Homes, Inc. | lgihex104secondcommitmenta.htm |
| EX-32.1 - EXHIBIT 32.1 - LGI Homes, Inc. | lgih123114ex321.htm |
UNITED STATES
SECURITIES AND EXCHANGE COMMISSION
Washington, D.C. 20549
FORM 10-K |
Annual Report Pursuant to Section 13 or 15(d) of the Securities Exchange Act of 1934 |
For the fiscal year ended December 31, 2014
Commission file number 001-36126
LGI HOMES, INC. (Exact name of registrant as specified in its charter) | ||
Delaware | 46-3088013 | |
(State or other jurisdiction of incorporation or organization) | (I.R.S. Employer Identification No.) | |
1450 Lake Robbins Drive, Suite 430, The Woodlands, Texas | 77380 | |
(Address of principal executive offices) | (Zip code) | |
(281) 362-8998 | ||
(Registrant’s Telephone Number, Including Area Code) | ||
Securities registered pursuant to Section 12(b) of the Act:
Title of each class Common Stock ($0.01 par value) | Name of each exchange on which registered NASDAQ |
Securities registered pursuant to Section 12(g) of the Act: None
Indicate by check mark if the registrant is a well-known seasoned issuer, as defined in Rule 405 of the Securities Act. Yes ¨ No ý
Indicate by check mark if the registrant is not required to file reports pursuant to Section 13 or Section 15(d) of the Act. Yes ¨ No ý
Indicate by check mark whether the registrant (1) has filed all reports required to be filed by Section 13 or 15(d) of the Securities Exchange Act of 1934 during the preceding 12 months (or for such shorter period that the registrant was required to file such reports), and (2) has been subject to such filing requirements for the past 90 days. Yes ý No ¨
Indicate by check mark whether the registrant has submitted electronically and posted on its corporate Web site, if any, every Interactive Data File required to be submitted and posted pursuant to Rule 405 of Regulation S-T (§ 232.405 of this chapter) during the preceding 12 months (or for such shorter period that the registrant was required to submit and post such files). Yes ý No ¨
Indicate by check mark if disclosure of delinquent filers pursuant to Item 405 of Regulation S-K (§ 229.405 of this chapter) is not contained herein, and will not be contained, to the best of registrant’s knowledge, in definitive proxy or information statements incorporated by reference in Part III of this Form 10-K or any amendment to this Form 10-K. ¨
Indicate by check mark whether the registrant is a large accelerated filer, an accelerated filer, a non-accelerated filer, or a smaller reporting company. See the definitions of “large accelerated filer,” “accelerated filer” and “smaller reporting company” in Rule 12b-2 of the Exchange Act.
Large accelerated filer o | Accelerated filer x | Non-accelerated filer o | Smaller reporting company o | |||
(Do not check if a smaller reporting company) | ||||||
Indicate by check mark whether the registrant is a shell company (as defined in Rule 12b-2 of the Exchange Act). Yes ¨ No ý
As of June 30, 2014, the aggregate market value of the registrant’s common stock held by non-affiliates of the registrant was approximately $316,143,801 based on the closing price as reported on the NASDAQ Stock Market. As of March 9, 2015, there were 19,849,044 shares of the registrant’s common stock, par value $.01 per share, issued and outstanding.
DOCUMENTS INCORPORATED BY REFERENCE
Portions from the registrant’s definitive Proxy Statement for the 2015 Annual Meeting of Stockholders are incorporated herein by reference (to the extent indicated) into Part III.
TABLE OF CONTENTS
Page | ||
Item 1. | ||
Item 1A. | ||
Item 1B. | ||
Item 2. | ||
Item 3. | ||
Item 4. | ||
Item 5. | ||
Item 6. | ||
Item 7. | ||
Item 7A. | ||
Item 8. | ||
Item 9. | ||
Item 9A. | ||
Item 9B. | ||
Item 10. | ||
Item 11. | ||
Item 12. | ||
Item 13. | ||
Item 14. | ||
Item 15. | ||
2
PART I
Explanatory Note
Unless otherwise indicated or the context requires, “LGI,” the “Company,” “we,” “our” and “us” refer collectively to LGI Homes, Inc. and its subsidiaries. On November 13, 2013, we completed an initial public offering (the “IPO”) of 10,350,000 shares of our common stock. As a result of the reorganization transactions completed in connection with the IPO (the “Reorganization Transactions”), for accounting purposes, our historical results included herein present the combined assets, liabilities and results of operations of LGI Homes, Inc. since the date of its formation and LGI Homes Group, LLC, LGI Homes Corporate, LLC, LGI Homes II, LLC, LGI Homes-Sunrise Meadow, LLC, LGI Homes-Canyon Crossing, LLC, LGI Homes-Deer Creek, LLC and their direct and indirect subsidiaries prior to the IPO (collectively, our “Predecessor”). For the period subsequent to the IPO, the assets, liabilities and results of operations present the consolidated results of the Company.
Prior to the completion of the IPO, our Predecessor owned a 15% equity interest in and managed the day-to-day operations of four joint venture entities (the “LGI/GTIS Joint Ventures”). Concurrent with the IPO, LGI Homes, Inc. acquired all of the equity interests in the LGI/GTIS Joint Ventures that it did not own immediately prior to the IPO (the “GTIS Acquisitions”). Our financial statements present our Predecessor’s historical interest in the LGI/GTIS Joint Ventures using the equity method and our Predecessor’s share of the LGI/GTIS Joint Ventures’ net earnings are included in income from unconsolidated joint ventures. Effective November 13, 2013, we own all of the equity interests in the LGI/GTIS Joint Ventures and we account for them on a consolidated basis after such date.
ITEM 1. BUSINESS
General
We are one of the nation’s fastest growing public homebuilders in terms of percentage increase of home closings. We are engaged in the design, construction, marketing and sale of new homes in markets in Texas, Arizona, Florida, Georgia, New Mexico, South Carolina, North Carolina and Colorado. Our core markets include Houston, San Antonio, Dallas/Fort Worth, Austin, Phoenix, Tucson, Tampa, Orlando, Fort Myers, Atlanta, Albuquerque, Charlotte and Denver. Our management team has been in the residential land development business since the mid-1990s. Since commencing home building operations in 2003, we have constructed and closed over 8,500 homes. During the year ended December 31, 2014, we had 2,356 home closings, compared to 1,617 home closings on a proforma basis in 2013.
The following is a summary of our history:
2003 - LGI Homes began operations building homes in the Houston market
2006 - We entered the San Antonio market
2009 - We entered the Dallas/Ft. Worth market
2010 - We formed our first LGI/GTIS Joint Venture
2011
•We entered the Phoenix market and formed our Southwest Division
•We expanded our Texas Division by entering into the Austin market
2012 - An LGI/GTIS Joint Venture entered the Tampa market and we formed our Florida Division
2013
•We expanded our Florida Division by entering into the Orlando market
•We entered the Atlanta market and formed our Southeast Division
•We expanded our Southwest Division by entering the Tucson market
•LGI Homes, Inc. was formed, we completed our IPO and certain reorganization transactions in connection with
our IPO and we acquired our joint venture partners’ interests in the LGI/GTIS Joint Ventures
•We expanded our Southwest Division by entering the Albuquerque market
3
2014
•We expanded our Southeast Division by entering the Charlotte market and acquiring the homebuilding related
assets of Oakmont Home Builders, Inc. and its affiliate in that market
•We expanded our Southwest Division by entering the Denver market
•We launched our first Terrata Homes community in the San Antonio market
LGI Homes, Inc. is a Delaware corporation incorporated on July 9, 2013. Our principal executive offices are located at 1450 Lake Robbins Drive, Suite 430, The Woodlands, Texas 77380, and our telephone number is (281) 362-8998. Information on or linked to our website is not incorporated by reference into this Annual Report on Form 10-K unless expressly noted.
Business Opportunities
We believe there is a significant opportunity to continue to grow in our existing markets. Given our knowledge of and proven success in these markets, as well as the favorable demographic and economic trends forecasted for these markets, we expect to continue to grow in these markets.
We see opportunities to develop properties with multiple product lines within the same communities which we believe will enable us to grow our business by increasing the number of price points in some of our existing markets. Our current product offerings include entry-level homes sold under our LGI Homes brand, and our premium move-up homes, which are sold under our Terrata Homes brand.
During November 2014, we launched our new Terrata Homes brand at our Potranco Ranch community in San Antonio, Texas. Our Terrata Homes brand allows us to leverage our systems and process approach, including our distinguished customer centric sales system, to deliver move-in ready homes with standardized features at a higher price point, with expected sales prices at $350,000 and up for homes larger than 2,500 square feet. We closed our first Terrata Home sale during January 2015. Our second Terrata Homes community is located in Lancaster, South Carolina, 30 miles south of Charlotte, North Carolina, and is expected to open for sales in mid-2015.
We expect to continue to pursue a flexible land acquisition strategy of purchasing or optioning finished lots, if they can be acquired at attractive prices, or purchasing raw land for residential development. We generally target land acquisitions that are further away from urban centers than many other suburban communities but have access to major thoroughfares, retail districts and centers of business. These target areas that are further away from urban centers result in a better value for the homeowner through either lower price points or larger lot sizes. We consider development opportunities that meet our profit and return objectives, including opportunities which may involve the sale of home sites as a part of the product mix. We will continue to focus on entry-level home buyers, and expect our home closings in communities with higher price points or those that include the sales of home sites will be less than 10% of our annual home closings during 2015 and 2016.
We intend to continue to expand into new markets where we identify opportunities to build homes and develop communities that meet our profit and return objectives. One of the keys to our successful geographic expansion has been our unique operating model. After successfully implementing this operating model in the Houston market, we expanded into 12 additional markets, including our recent entry into the Charlotte, North Carolina and Denver, Colorado markets. In addition, during October 2014, we completed our first acquisition of another home-builder when we acquired the homebuilding related assets and liabilities of Oakmont Home Builders, Inc. and its affiliate (collectively, “Oakmont”) in Charlotte, North Carolina. We will continue to evaluate potential opportunities, including acquisitions of other homebuilders, to expand our presence in our existing markets or to expand into new markets.
Unique Operating Model
We developed our unique operating model based on our belief that there is a more effective and efficient method of constructing and selling homes. We are focused on maintaining an appropriate supply of move-in ready homes to fuel our dynamic sales force. We believe that the key competitive advantages of our operational business model include our sales and marketing expertise; recruitment, selection, training and development of our people; our disciplined land acquisition process; and our quality assurance and quality control procedures.
Our unique operating model has been refined since our inception. We believe our operating model will be effective with respect to home sales across all price points, including in our new markets. We believe that our business model can be adapted as needed, for the requirements of individual communities and new geographic markets.
4
Sales and Marketing
We utilize a well-defined sales and marketing approach to identify leads for our communities and to educate potential buyers on the process and benefits of homeownership. For many of our communities, our marketing efforts are focused on converting renters of apartments and single-family homes into homeowners.
We use extensive print and digital advertising to attract potential homebuyers. We employ sophisticated marketing techniques such as direct mail, newspaper advertisements, social media and interactive online media as well as directional signage and billboards to attract and drive potential homebuyers to our sales centers.
Our print advertising methods are extensive and have proven to be highly effective in placing potential homebuyers in front of our highly trained sales professionals. We have found direct mail to be very effective in reaching our target market and communicating our core message of value and dream fulfillment.
With respect to our communities with higher price points or that include the sale of home sites, our sales and marketing approach will be tailored to the potential purchasers of such homes and home sites and may include more involvement by real estate agents and brokers.
Across all price points, our marketing strategy calls for a balanced approach of corporate support and local expertise to attract potential homebuyers in a focused, efficient and cost-effective manner. Our proprietary customer relationship management system provides our management team with tools to continually monitor and measure the performance level of every sales professional through each phase of the sales process. Utilization of these tools allows us to assess the cost effectiveness of a particular advertising campaign and the strengths and weaknesses of every member of our sales team.
Our marketing efforts are generally designed to encourage the prospective homebuyer to call our sales offices to schedule an appointment and our primary objective is to establish direct communication between the prospective homebuyer and the salesperson. Our professional salespeople are well-trained to determine specific needs and wants of the potential homebuyer and to provide the potential homebuyer with all information required to make a buying decision.
Our sales offices are open approximately 12 hours per day, 360 days per year, and generally staffed by three to five sales professionals and supported by an independent on-site loan officer. Our commission-based sales professionals provide potential homebuyers with a comprehensive and thorough understanding of the steps required to achieve homeownership. Throughout the sales process, our sales professionals learn about the current housing situation of the potential homebuyers and seek to understand their individual needs while also educating them on the value we provide through superior quality and affordable prices.
We provide information regarding floor plans and pricing, credit and income qualifications and conduct tours of our homes based on the potential homebuyer’s budget. In addition, we provide each potential homebuyer with a comprehensive introduction to the community and the surrounding area, providing them with detailed information regarding utilities, schools, homeowners association dues and restrictions, local entertainment and nearby dining and shopping options. We provide our potential homebuyers with a clear understanding of who we are by sharing our history, vision and values. As a result of our transparent approach, potential homebuyers receive all this information before making a buying decision, which we believe eliminates confusion during the home buying process and sets clear expectations. In addition, the potential home buyers benefit from the availability of move-in ready homes by seeing the completed or near-completed home that they will own.
Recruitment, Training and Development
We focus on identifying and attracting the best talent and providing them with world-class training and continuous development. We directly invest in our sales professionals by conducting an intensive 100-day introductory training program consisting of 30 days of initial in-depth, in-house education about our time-proven selling strategies, which includes a two-week intensive training program at our headquarters, and an additional 70 days of secondary training at the local division. Our continued commitment to our sales personnel is reflected in the ongoing weekly training sessions held in each of our sales offices coupled with quarterly regional training events. We also work closely with our subcontractors and construction managers, training them using a comprehensive construction manual that outlines the most efficient way to build an LGI home. Many of our subcontractors have worked on our homes since we commenced homebuilding operations in 2003, and therefore, are familiar with our business model.
5
Homebuilding Operations
Our homebuilding operations are organized and managed by divisions:
Texas | Southwest | Southeast | Florida | |||
Houston, TX | Phoenix, AZ | Atlanta, GA | Tampa, FL | |||
Dallas/Ft. Worth, TX | Tucson, AZ | Charlotte, NC | Orlando, FL | |||
San Antonio, TX | Albuquerque, NM | Fort Myers, FL | ||||
Austin, TX | Denver, CO | |||||
Our four divisions are aggregated into one reporting segment. See Note 15 “Segment Information” to our consolidated financial statements included in Part II. Item 8 of this Annual Report on Form 10-K.
Our even-flow, or continuous, construction methodology enables us to build and maintain an inventory of move-in ready homes that are available for immediate sale. We offer a set number of floor plans in each community with standardized features that commonly include upgrades such as granite countertops, appliances and ceramic tile flooring. Our homes are designed to meet the preferences of our target market of potential homebuyers and enable cost efficient and effective construction processes. We have developed a collection of home designs, which can be modified for local conditions and market preferences, and implemented across multiple communities to maximize efficiency. We maintained an average home completion time of approximately 45 to 60 days during 2014 and 2013; the homes closed during 2014 ranged from 1,100 to 3,000 square feet with prices ranging from the $110,000's to the $250,000's.
We believe in 2015 and beyond, we will continue to focus on our target market of entry level homebuyers. Our entry level homes are priced to the upper $200,000s. We expect that sales of our Terrata Homes brand will represent less than 10% of our home closings through 2016. We expect to continue to utilize our even flow construction methodology in communities with homes at all of our price points and will maintain our focus on marketing complete or move-in ready homes with standardized features.
We employ experienced construction management professionals to perform the tasks of general contractors throughout home construction in each of our communities. Our employees provide the purchasing, construction management and quality assurance for the homes we build, while third-party subcontractors provide the material and labor components of our homes. In each of our markets, we employ construction managers with local market knowledge and expertise. Additionally, our construction managers monitor our compliance with zoning and other regulations, production schedules, and quality standards for their projects.
We endeavor to obtain favorable pricing from subcontractors through long-term relationships and consistent workflow. As we have expanded into new markets outside of Texas, the employees that we have hired in those markets have brought long-term relationships with several subcontracting firms. We have expanded upon existing relationships with subcontracting firms also located in Texas. A number of our trade partners have subcontracted on our projects since we commenced homebuilding operations in 2003. We purchase some components and materials centrally to leverage our purchasing power to achieve volume discounts, a practice that often reduces costs and ensures timely deliveries. We typically do not store significant inventories of construction materials, except for work in progress materials for homes under construction. Consistency of trades is an integral part of our homebuilding operations that also leads us to reduced warranty costs. We believe in building long lasting relationships with our trade partners in order to provide consistent, quality and timely deliveries across our markets. We also work closely with our construction managers and subcontractors and train them using a comprehensive construction manual that outlines the most efficient way to build an LGI home. We believe our emphasis on developing and educating our employees and subcontractors is a key differentiator relative to our peers.
Throughout our homebuilding operations, we utilize a paperless purchase order system to conduct business with our subcontractors. Our master build schedule allows our trade partners to receive their specific task from our electronic system and plan several weeks in advance before starting their work. This means of communication allows our subcontractors to schedule their crews efficiently, thereby allowing for better pricing and better quality of work. Typically, our contractors are paid every two weeks, which contributes to the strength of our business relationships with them.
Land Acquisition Policies and Development
We continue to be an active and opportunistic acquirer of land for residential development in our markets. We source land from a wide range of landowners, brokers, lenders and other land development companies. We generally acquire finished lots and raw land in affordable locations that are further away from urban centers than many other suburban communities but have access to major thoroughfares, retail districts and centers of business. We conduct thorough due diligence on each of our potential land
6
acquisitions, and we look at numerous opportunities before finding one that meets our requirements. We test the market and speak with potential homebuyers before committing to purchase land. We also maintain a pipeline of desirable land positions for replacement communities and new communities. We increased our active communities from 25 as of December 31, 2013 to 39 as of December 31, 2014. We also increased our lot inventory from 14,895 owned or controlled lots as of December 31, 2013 to 19,883 owned or controlled lots as of December 31, 2014.
Our allocation of capital for land investment is performed at the corporate level with a disciplined approach to portfolio management. Our Acquisitions Committee meets periodically and consists of our Chief Executive Officer, Chief Financial Officer, Chief Operating Officer, and Executive Vice President of Acquisitions. Annually, our divisions prepare a strategic plan for their respective geographic areas. Supply and demand are analyzed to ensure land investment is targeted appropriately. The long-term plan is compared on an ongoing basis to evolving realities in the marketplace and is then adjusted to the extent necessary.
We have also purchased larger tracts of land across our markets which will provide us with more opportunities to build homes with multiple price points in our communities. We believe that our land development expertise will allow us to meet our growth and profit objectives with respect to opportunities in which we are the developer. These opportunities may involve the sale of home sites as a part of the project.
We have strong relationships with the land brokerage community in all of our markets. We believe that in the brokerage community, we have a reputation for knowing our business, having the capital to close deals, and making accurate and timely decisions that benefit both the buyer and seller. For these reasons, we believe that brokers routinely notify us when desirable tracts of land are available for purchase.
In our land acquisition process, projects of interest are evaluated at the division level using an extensive due diligence checklist which includes assessing the permitting and regulatory requirements, environmental considerations, local market conditions, and anticipated floor plans, pricing, and financial returns. We also determine the number of residents in the market and rental households that are within driving distance to the proposed project and conduct test marketing which includes mailings to prospective homebuyers to get their feedback on our potential land acquisition. By testing the market before entering it and acquiring land in it, we are able to assess the level of interest in the location and amenities, determine the cost of rent in the area, and assess the size of the market opportunity. The amount of information that we are able to ascertain about potential home buyers, including renters, allows us to better identify the opportunity to sell move-in ready homes.
The table below shows (i) home closings by division for the year ended December 31, 2014 and (ii) our owned or controlled lots by division as of December 31, 2014.
Year Ended December 31, 2014 | As of December 31, 2014 | |||||||
Division | Home Closings | Owned (1) | Controlled | Total | ||||
Texas | 1,575 | 10,923 | 1,774 | 12,697 | ||||
Southwest | 273 | 1,320 | 454 | 1,774 | ||||
Florida | 255 | 696 | 863 | 1,559 | ||||
Southeast | 253 | 3,023 | 830 | 3,853 | ||||
Total | 2,356 | 15,962 | 3,921 | 19,883 | ||||
(1) | Of the 15,962 owned lots as of December 31, 2014, 10,809 were raw/under development lots and 5,153 were finished lots. |
Homes in Inventory
When entering a new community, we build a sufficient number of move-in ready homes to meet our budgets. We base future home starts on closings. As homes are closed, we start more homes to maintain our inventory. As of December 31, 2014, we had a total of 453 completed homes and 578 homes in progress.
7
The following is a summary of our homes in inventory by division as of December 31, 2014 (dollar values in thousands):
Division | Homes in Inventory (1) | Inventory Value (1) | |||||
Texas | 450 | $ | 48,749 | ||||
Southwest | 210 | 20,906 | |||||
Southeast | 223 | 22,787 | |||||
Florida | 148 | 18,698 | |||||
Total | 1,031 | $ | 111,140 | ||||
(1) | Includes homes in progress and completed homes; excludes sales offices. |
Backlog
See discussion included in “Management's Discussion and Analysis of Financial Condition and Results of Operations─
Backlog.”
Raw Materials
When constructing homes, we use various materials and components. We generally contract for our materials and labor at a fixed price for the anticipated construction period of our homes. This allows us to mitigate the risks associated with increases in building materials and labor costs between the time construction begins on a home and the time it is closed. Typically, the raw materials and most of the components used in our business are readily available in the United States. In addition, the majority of our raw materials is supplied to us by our subcontractors, and is included in the price of our contract with such contractors. Most of the raw materials necessary for our subcontractors are standard items carried by major suppliers. Substantially all of our construction work is done by third party subcontractors, most of whom are non-unionized. We continue to monitor the supply markets to achieve the best prices available. Typically, the price changes that most significantly influence our operations are price increases in commodities and lumber.
Seasonality
The homebuilding industry generally exhibits seasonality. We have historically experienced, and in the future expect to continue to experience, variability in our results on a quarterly basis. See discussion included in “Management’s Discussion and Analysis of Financial Condition and Results of Operations─Seasonality.”
Government Regulation and Environmental Matters
We are subject to numerous local, state, federal and other statutes, ordinances, rules and regulations concerning zoning, development, building design, construction and similar matters which impose restrictive zoning and density requirements, the result of which is to limit the number of homes that can be built within the boundaries of a particular area. Projects that are not entitled may be subjected to periodic delays, changes in use, less intensive development or elimination of development in certain specific areas due to government regulations. We may also be subject to periodic delays or may be precluded entirely from developing in certain communities due to building moratoriums or “slow-growth” or “no-growth” initiatives that could be implemented in the future. Local governments also have broad discretion regarding the imposition of development fees for projects in their jurisdiction. Projects for which we have received land use and development entitlements or approvals may still require a variety of other governmental approvals and permits during the development process and can also be impacted adversely by unforeseen health, safety and welfare issues, which can further delay these projects or prevent their development.
We are also subject to a variety of local, state, federal and other statutes, ordinances, rules and regulations concerning the environment. The particular environmental laws which apply to any given homebuilding site vary according to multiple factors, including the site’s location, its environmental conditions and the present and former uses of the site, as well as adjoining properties. Environmental laws and conditions may result in delays, may cause us to incur substantial compliance and other costs, and can prohibit or severely restrict homebuilding activity in environmentally sensitive regions or areas. In addition, in those cases where an endangered or threatened species is involved, environmental rules and regulations can result in the restriction or elimination of development in identified environmentally sensitive areas. From time to time, the United States Environmental Protection Agency (the “EPA”) and similar federal or state agencies review homebuilders’ compliance with environmental laws and may levy fines and penalties for failure to strictly comply with applicable environmental laws or impose additional requirements for future compliance as a result of past failures. Any such actions taken with respect to us may increase our costs. Further, we expect
8
that increasingly stringent requirements may be imposed on homebuilders in the future. Environmental regulations can also have an adverse impact on the availability and price of certain raw materials such as lumber.
Under various environmental laws, current or former owners of real estate, as well as certain other categories of parties, may be required to investigate and clean up hazardous or toxic substances or petroleum product releases, and may be held liable to a governmental entity or to third parties for related damages, including for bodily injury, and for investigation and clean-up costs incurred by such parties in connection with the contamination. A mitigation system may be installed during the construction of a home if a cleanup does not remove all contaminants of concern or to address a naturally occurring condition such as methane. Some homebuyers may not want to purchase a home with a mitigation system.
Competition
The U.S. homebuilding industry is highly competitive. We compete in each of our markets with numerous other national, regional and local homebuilders for homebuyers, desirable properties, raw materials and skilled labor. We also compete with sales of existing homes and with the rental housing market. Our homes compete on the basis of quality, price, design, mortgage financing terms and location. We have begun to see some consolidation among national homebuilders in the United States and expect that this trend will continue.
In order to maximize our sales volumes, profitability and product strategy, we strive to understand our competition and their pricing, product and sales volume strategies and results.
Employees
As of December 31, 2014, we employed 390 people of whom 58 were located at our corporate headquarters, 250 were on-site sales and support personnel and 82 were involved with construction. None of our employees are covered by collective bargaining agreements. We believe we have good relations with our employees.
Available Information
We make available, as soon as reasonably practicable, on our website, www.lgihomes.com, all of our reports required to be filed with the Securities and Exchange Commission (“SEC”). These reports can be found on the “Investor Relations” page of our website under “SEC Filings” and include our annual and quarterly reports on Form 10-K and 10-Q (including related filings in XBRL format), current reports on Form 8-K, beneficial ownership reports on Forms 3, 4, and 5, proxy statements and amendments to such reports. Our SEC filings are also available to the public on the SEC’s website at www.sec.gov, and the public may read and copy any document we file at the SEC’s public reference room located at 100 F Street NE, Washington, D.C. 20549. Further information on the operation of the public reference room can be obtained by calling the SEC at 1-800-SEC-0330. In addition to our SEC filings, our corporate governance documents, including our Code of Business Conduct and Ethics, are available on the “Investor Relations” page of our website under “Corporate Governance.” Our stockholders may also obtain these documents in paper format free of charge upon request made to our Investor Relations department.
Executive Officers
The following table sets forth information regarding our executive officers as of March 9, 2015:
Name | Age | Position | ||
Eric Lipar | 44 | Chief Executive Officer and Chairman of the Board | ||
Michael Snider | 43 | President and Chief Operating Officer | ||
Charles Merdian | 45 | Chief Financial Officer, Secretary and Treasurer | ||
Jack Lipar | 46 | Executive Vice President of Acquisitions | ||
Margaret Britton | 52 | Chief Administrative Officer | ||
Rachel Eaton | 33 | Executive Vice President and Chief Marketing Officer | ||
Eric Lipar. Mr. Lipar is our Chief Executive Officer and serves as Chairman of our Board of Directors. He has served as our Chief Executive Officer since 2009, as a director since June 2013 and as Chairman of the Board since July 2013. Previously, Mr. Lipar served as our President from 2003 until 2009. Mr. Lipar has been in the residential land development business since the
9
mid-1990s and is one of our founders. He has overseen land acquisition, development and the sales of over 8,500 homes since our inception. Mr. Lipar currently serves on the Residential Neighborhood Development Council for the Urban Land Institute.
Michael Snider. Mr. Snider has served as our President since 2009, and Chief Operating Officer since July 2013. He oversees all aspects of our sales, construction, and product development. Since joining LGI in 2004 as Homebuilding Manager, Mr. Snider also served as Executive Vice President of Homebuilding (2005-2009) and President (2009-June 2013). Prior to joining us, Mr. Snider served as a Project Manager for Tadian Homes, a homebuilder based in Troy, Michigan.
Charles Merdian. Mr. Merdian serves as our Chief Financial Officer, Secretary and Treasurer. He was elected Secretary and Treasurer in 2013. Prior to becoming our Chief Financial Officer in 2010, Mr. Merdian was our Controller from 2004 through 2010. Prior to joining us in 2004, Mr. Merdian served as Accounting and Finance Manager for The Woodlands Operating Company where he specialized in accounting and financial analysis of real estate ventures, focusing primarily on residential and commercial developments. Prior to The Woodlands Operating Company, Mr. Merdian served as an accounting manager working at the Williamson-Dickie Manufacturing Co. and as a senior auditor for Coopers & Lybrand, L.L.P. Mr. Merdian has worked in residential real estate and homebuilding finance since 1999. Mr. Merdian is a Certified Public Accountant and is a member of the Texas Society of Certified Public Accountants.
Jack Lipar. Mr. Lipar has served as our Executive Vice President of Acquisitions since March 2013. He previously served as Vice President of Acquisitions from December 2010 through February 2013, and Acquisitions Manager from 2006 to December 2010. Mr. Lipar oversees land acquisitions and development for LGI. Prior to joining us, Mr. Lipar worked at HP Pelzer, an auto parts manufacturing company based in Germany, as the Vice President of Purchasing and Director of Operations. Mr. Lipar was also the General Manager and a member of the Board of Directors at Alliance Interiors, an affiliate of HP Pelzer. Prior to HP Pelzer, Mr. Lipar was a worldwide Purchasing Manager for Cooper Standard, one of the world’s leading manufacturers of automotive parts.
Margaret Britton. Mrs. Britton has served as our Chief Administrative Officer since August 2013. She is responsible for various corporate areas, including governance, risk and compliance matters. From 2008 to 2012, Mrs. Britton was a Director at Deloitte Financial Advisory Services, LLP, where she provided advisory services and was a leader in their national environmental consulting practice. She worked as a consultant from 2003 to 2007 and, as such, among other things, assisted two multinational energy companies with the implementation and oversight of their Sarbanes-Oxley Act requirements. Prior to 2002, Mrs. Britton was an assurance partner at Arthur Andersen LLP. Mrs. Britton is a Certified Public Accountant and a member of the Board of Directors for the Girl Scouts of San Jacinto Council.
Rachel Eaton. Mrs. Eaton serves as our Chief Marketing Officer and is responsible for the overall growth and direction of our marketing initiatives, brand image and social media. Prior to becoming our Chief Marketing Officer in June 2013, Mrs. Eaton served as our Vice President of Marketing and Administration from May 2012 through May 2013, Director of Marketing & Special Events from 2007 to May 2012, Executive Assistant from 2004 to 2007. Mrs. Eaton joined the Company in 2003.
Board of Directors of LGI Homes, Inc.
Mr. Eric Lipar - Chief Executive Officer of LGI Homes, Inc. and serves as Chairman of our Board of Directors.
Mr. Ryan Edone - Chief Financial Officer of Petroleum Wholesale L.P., a distributor of branded and wholesale motor fuel products and operator of retail convenience stores/travel centers.
Mr. Bryan Sansbury - Chief Operating Officer of Aon Hewitt, a global human capital and management consulting firm, and serves as our Lead Independent Director.
Mr. Duncan Gage - Former President and CEO of Giant Cement Holdings, Inc. and currently managing his personal investments.
Mr. Steven Smith - Managing Partner of the Washington, D.C. office of Ober, Kaler, Grimes & Shriver, a law firm.
Mr. Robert Vahradian - Senior Managing Director of GTIS Partners, LP, a global real estate investment firm.
10
ITEM 1A. RISK FACTORS
Discussion of our business and operations included in this Annual Report on Form 10-K should be read together with the risk factors set forth below. They describe various risks and uncertainties we are or may become subject to, many of which are difficult to predict or beyond our control. These risks and uncertainties, together with other factors described elsewhere in this report, have the potential to affect our business, financial condition, results of operations, cash flows, strategies or prospects in a material and adverse manner.
Risks Related to Our Business
Continued or additional tightening of mortgage lending standards and mortgage financing requirements and rising interest rates could adversely affect the availability of mortgage loans for potential purchasers of our homes and thereby reduce our sales.
Almost all purchasers of our homes finance their acquisition through lenders that provide mortgage financing. According to the Federal Home Loan Mortgage Corporation (“Freddie Mac”), the 30-year average mortgage rate was approximately 4.25% in March 2014 and is expected to increase during 2015. If mortgage interest rates increase, the ability of prospective homebuyers to finance home purchases may be adversely affected, and, as a result, our operating results may be significantly negatively impacted. Our homebuilding activities are dependent upon the availability of mortgage financing to homebuyers. The availability of mortgage financing continues to be constrained, due in part to regulatory changes and lower risk appetite by lenders. Lenders continue to require increased levels of financial documentation, and may require larger down payments and more restrictive income to debt ratios. First-time homebuyers are generally more affected by the availability of mortgage financing than other potential homebuyers. These homebuyers are a key source of demand for our new homes. A limited availability of home mortgage financing may adversely affect the volume and sales price of our home sales.
The federal government has a significant role in supporting mortgage lending through its conservatorship of Federal National Mortgage Association (“Fannie Mae”) and Freddie Mac, both of which purchase or insure mortgage loans and mortgage loan-backed securities, and its insurance of mortgage loans through or in connection with the Federal Housing Administration (“FHA”), the Veterans Administration (“VA”) and the U.S. Department of Agriculture (“USDA”). FHA and USDA backing of mortgage loans has been particularly important to the mortgage finance industry and to our business. If either the FHA or USDA raised their down payment requirements, our business could be materially affected. The USDA rural development program provides for zero down payment and 100% financing for homebuyers in qualifying areas. As of December 31, 2014, the USDA program is available in all our markets and is available to approximately 64% of our active communities. If the USDA program was discontinued or if funding was decreased, then our business could be adversely affected. In addition, if the USDA changed its determination of areas that are eligible to qualify for the program, it could have an adverse effect on our business. In addition, changes in governmental regulation with respect to mortgage lenders could adversely affect demand for housing.
The availability and affordability of mortgage loans, including interest rates for such loans, could also be adversely affected by a scaling back or termination of the federal government’s mortgage loan-related programs or policies. Because Fannie Mae-, Freddie Mac-, FHA-, USDA- and VA-backed mortgage loans have been an important factor in marketing and selling many of our homes, any limitations or restrictions in the availability of, or higher consumer costs for, such government-backed financing could reduce our business, prospects, liquidity, financial condition and results of operations could be materially and adversely affected. The elimination or curtailment of state bonds utilized by us could materially and adversely affect our business, prospects, liquidity, financial condition and results of operations.
Our long-term growth depends in part upon our ability to acquire finished lots and land parcels suitable for residential homebuilding at reasonable prices.
Our long-term growth depends in large part on the price at which we are able to obtain suitable finished lots and land parcels to develop to support our homebuilding operation. Our ability to acquire finished lots and land parcels for new single-family homes and other projects may be adversely affected by changes in the general availability of land parcels, the willingness of land sellers to sell land parcels at reasonable prices, competition for available land parcels, availability of financing to acquire land parcels, zoning, regulations that limit housing density, the ability to obtain building permits, environmental requirements and other market conditions and regulatory requirements. If suitable lots or land at reasonable prices become less available, the number of homes we may be able to build and sell could be reduced, and the cost of land could be increased substantially, which could adversely impact us. As competition for suitable land increases, the cost of undeveloped lots and the cost of developing owned land could rise and the availability of suitable land at acceptable prices may decline, which could adversely impact us. The availability of suitable land assets could also affect the success of our land acquisition strategy, which may impact our ability to increase the number of our active communities, grow our revenue and margins, and achieve or maintain profitability. Additionally, developing
11
undeveloped land is capital intensive and time consuming and we may develop land based upon forecasts and assumptions that prove to be inaccurate, resulting in projects that are not economically viable.
Risks associated with our land and lot inventories could adversely affect our business or financial results.
Risks inherent in controlling, purchasing, holding and developing land for new home construction are substantial. The risks inherent in purchasing and developing land parcels increase as consumer demand for housing decreases and the holding period increases. As a result, we may buy and develop land parcels on which homes cannot be profitably built and sold. In certain circumstances, a grant of entitlements or development agreement with respect to a particular parcel of land may include restrictions on the transfer of such entitlements to a buyer of such land, which would negatively impact the price of such entitled land by restricting our ability to sell it for its full entitled value. In addition, inventory carrying costs can be significant and can result in reduced margins or losses in a poorly performing community or market. Developing land and constructing homes takes a significant amount of time and requires a substantial cash investment. In Texas, land development is a key part of our operations and we expect to expand our development activities in our other markets as well. The time and investment required for development may adversely impact our business. We have substantial real estate inventories which regularly remain on our balance sheet for significant periods of time, during which time we are exposed to the risk of adverse market developments, prior to their sale. Our business model is based on building homes before a sales contract is executed and a customer deposit is received. Because interest and other expenses are capitalized only during construction, we recognize interest and maintenance expense on unsold completed homes inventory. As of December 31, 2014, we had 453 completed homes in inventory and 578 homes in progress in inventory. In the event there is a downturn in housing sales in our markets, our inventory of completed homes could increase, leading to additional financing costs and lower margins, which could have a material adverse effect on our financial results and operations. In the event of significant changes in economic or market conditions, we may have to sell homes at significantly lower margins or at a loss, if we are able to sell them at all. Additionally, deteriorating market conditions could cause us to record significant inventory impairment charges. The recording of a significant inventory impairment could negatively affect our reported earnings per share and negatively impact the market perception of our business.
Because real estate investments are relatively illiquid, our ability to promptly sell one or more properties for reasonable prices in response to changing economic, financial and investment conditions may be limited and we may be forced to hold non-income producing properties for extended periods of time.
Real estate investments are relatively difficult to sell quickly. As a result, our ability to promptly sell one or more properties in response to changing economic, financial and investment conditions is limited and we may be forced to hold non-income producing assets for an extended period of time. We cannot predict whether we will be able to sell any property for the price or on the terms that we set or whether any price or other terms offered by a prospective purchaser would be acceptable to us. We also cannot predict the length of time needed to find a willing purchaser and to close the sale of a property.
Labor and raw material shortages and price fluctuations could delay or increase the cost of home construction, which could materially and adversely affect us.
The residential construction industry experiences serious labor and raw material shortages from time to time, including shortages in qualified tradespeople, and supplies of insulation, drywall, cement, steel and lumber. These labor and raw material shortages can be more severe during periods of strong demand for housing or during periods following natural disasters that have a significant impact on existing residential and commercial structures. Our markets may exhibit a reduced level of skilled labor relative to increased homebuilding demand in these markets. Labor and raw material shortages and any resulting price increases could cause delays in and increase our costs of home construction, which in turn could have a material adverse effect on our business, prospects, liquidity, financial condition and results of operations.
Our business and results of operations are dependent on the availability and skill of subcontractors.
We engage subcontractors to perform the construction of our homes, and in many cases, to select and obtain the raw materials. Accordingly, the timing and quality of our construction depend on the availability and skill of our subcontractors. While we anticipate being able to obtain sufficient materials and reliable subcontractors and believe that our relationships with subcontractors are good, we do not have long-term contractual commitments with any subcontractors, and we can provide no assurance that skilled subcontractors will continue to be available at reasonable rates and in our markets. The inability to contract with skilled subcontractors at reasonable rates on a timely basis could have a material adverse effect on our business, prospects, liquidity, financial condition and results of operations.
Despite our quality control efforts, we may discover that our subcontractors have engaged in improper construction practices or have installed defective materials in our homes. When we discover these issues, we utilize our subcontractors to repair the
12
homes in accordance with our new home warranty and as required by law. The adverse costs of satisfying our warranty and other legal obligations in these instances may be significant and we may be unable to recover the costs of warranty-related repairs from subcontractors, suppliers and insurers, which could have a material impact on our business, prospects, liquidity, financial condition and results of operations.
Any limitation on, or reduction or elimination of, tax benefits associated with homeownership would have an adverse effect upon the demand for homes, which could be material to our business.
Changes in federal income tax laws may affect demand for new homes. Current tax laws generally permit significant expenses associated with homeownership, primarily mortgage interest expense and real estate taxes, to be deducted for the purpose of calculating an individual’s federal and, in many cases, state taxable income. Proposals have been publicly discussed to limit mortgage interest deductions and to limit the exclusion of gain from the sale of a principal residence. For instance, under the American Taxpayer Relief Act of 2012, which was signed into law in January 2013, the federal government enacted higher income tax rates and limits on the value of tax deductions for certain high-income individuals and households. If the federal government or a state government changes or further changes its income tax laws, as some lawmakers have proposed, by eliminating, limiting or substantially reducing these income tax benefits without offsetting provisions, the after-tax cost of owning a new home would increase for many of our potential homebuyers. Enactment of any such proposal may have an adverse effect on the homebuilding industry in general, as the loss or reduction of homeowner tax deductions could decrease the demand for new homes.
The recent growth in the housing market may not continue at the same rate, and any decline in the growth rate in our served housing markets or for the homebuilding industry may materially and adversely affect our business and financial condition.
Although the housing markets in the geographic areas in which we operate are currently stronger than they have been in recent years, we cannot predict whether and to what extent this will continue, particularly if interest rates for mortgage loans rise. Other factors which might impact growth in the homebuilding industry include uncertainty in domestic and international financial, credit and consumer lending markets amid slow growth or recessionary conditions in various regions or industries around the world; tight lending standards and practices for mortgage loans that limit consumers’ ability to qualify for mortgage financing to purchase a home, including increased minimum credit score requirements, credit risk/mortgage loan insurance premiums and/or other fees and required down payment amounts, more conservative appraisals, higher loan-to-value ratios and extensive buyer income and asset documentation requirements, or Federal Reserve policy changes. Given these factors, we can provide no assurance that present housing market trends will continue, whether overall or in our markets.
If there is limited economic growth or declines in employment and consumer income and/or tightening of mortgage lending standards and practices in the geographic areas in which we operate or if interest rates for mortgage loans rise, there could likely be a corresponding adverse effect on our business, prospects, liquidity, financial condition and results of operations, including, but not limited to, the number of homes we sell, our average selling prices, the amount of revenues or profits we generate, and the effect may be material.
If we are unable to develop our communities successfully or within expected time-frames, our results of operations could be adversely affected.
Before a community generates any revenue, time and material expenditures are required to acquire land, obtain development approvals and construct significant portions of project infrastructure, amenities and sales facilities. It can take several years from the time we acquire control of an undeveloped property to the time we make our first home sale on the site. Delays in the development of communities expose us to the risk of changes in market conditions for homes. A decline in our ability to develop and market one of our new undeveloped communities successfully and to generate positive cash flow from these operations in a timely manner could have a material adverse effect on our business and results of operations and on our ability to service our debt and to meet our working capital requirements.
Third-party lenders may not complete mortgage loan originations for our homebuyers in a timely manner or at all, which can lead to cancellations and a lower backlog of orders, or to significant delays in our closing homes sales and recognizing revenues from those homes.
Our homebuyers may obtain mortgage financing for their home purchases from any lender or other provider of their choice. If, due to credit or consumer lending market conditions, reduced liquidity, increased risk retention or minimum capital level obligations and/or regulatory restrictions related to the Dodd-Frank Act or other laws, or other factors or business decisions, these lenders refuse or are unable to provide mortgage loans to our homebuyers, or increase the costs to borrowers to obtain such loans,
13
the number of homes we close and our business, prospects, liquidity, financial condition and results of operations may be materially adversely affected. Additional rules regarding loan estimates, closing disclosures and fees are scheduled to be implemented in August 2015. The effect of these rules on our business, prospects and results of operations have yet to be determined, and these rules could affect the availability and cost of mortgage credit.
We may be unable to obtain suitable bonding for the development of our housing projects.
We are often required to provide bonds to governmental authorities and others to ensure the completion of our projects. As a result of market conditions, some surety providers have been reluctant to issue new bonds and providers may require credit enhancements (such as cash deposits or letters of credit) in order to maintain existing bonds or to issue new bonds. If we are unable to obtain required bonds in the future for our projects, or if we are required to provide credit enhancements with respect to our current or future bonds, our business, prospects, liquidity, financial condition and results of operations could be materially and adversely affected.
We may incur a variety of costs to engage in future growth or expansion of our operations and the anticipated benefits may never be realized.
We intend to grow our operations in existing markets, and we may expand into new markets or acquire other home builders. We may be unable to achieve the anticipated benefits of any such growth or expansion, including through acquisition, the anticipated benefits may take longer to realize than expected or we may incur greater costs than expected in attempting to achieve the anticipated benefits. In such cases, we will likely need to employ additional personnel or consultants that are knowledgeable of such markets. There can be no assurance that we will be able to employ or retain the necessary personnel, to successfully implement a disciplined management process and culture with local management, or that our expansion operations will be successful. This could disrupt our ongoing operations and divert management resources that would otherwise focus on developing our existing business, or that we will be able to successfully integrate any acquired homebuilder. Accordingly, any such expansion could expose us to significant risks, beyond those associated with operating our existing business, and may adversely affect our business, prospects, liquidity, financial condition and results of operations.
The homebuilding industry is highly competitive and, if our competitors are more successful or offer better value to our customers, our business could decline.
We operate in a very competitive environment which is characterized by competition from a number of other homebuilders and land developers in each market in which we operate. Additionally, there are relatively low barriers to entry into our business. We compete with large national and regional homebuilding companies, many of which have greater financial and operational resources than us, and with smaller local homebuilders and land developers, some of which may have lower administrative costs than us. We may be at a competitive disadvantage with regard to certain of our large national and regional homebuilding competitors whose operations are more geographically diversified than ours, as these competitors may be better able to withstand any future regional downturn in the housing market. Furthermore, we generally have a lower market share in each of our markets as compared to many of our competitors. Many of our competitors may also have longer operating histories and longstanding relationships with subcontractors and suppliers in the markets in which we operate. This may give our competitors an advantage in marketing their products, securing materials and labor at lower prices and allowing their homes to be delivered to customers more quickly and at more favorable prices. We compete for, among other things, homebuyers, desirable land parcels, financing, raw materials and skilled management and labor resources. Our competitors may independently develop land and construct homes that are substantially similar to our products.
Increased competition could hurt our business, as it could prevent us from acquiring attractive land parcels on which to build homes or make such acquisitions more expensive, hinder our market share expansion and cause us to increase our selling incentives and reduce our prices. An oversupply of homes available for sale or discounting of home prices could adversely affect pricing for homes in the markets in which we operate. Oversupply and price discounting have periodically adversely affected certain markets, and it is possible that our markets will be adversely affected by these factors in the future.
If we are unable to compete effectively in our markets, our business could decline disproportionately to our competitors, and our results of operations and financial condition could be adversely affected. We can provide no assurance that we will be able to continue to compete successfully in any of our markets. Our inability to continue to compete successfully in any of our markets could have a material adverse effect on our business, prospects, liquidity, financial condition or results of operations.
14
We cannot make any assurances that our growth or expansion strategies will be successful or not expose us to additional risks.
We have primarily focused on internal growth in recent years by increasing our investments in land, lot and home inventories in our existing homebuilding markets. We have also expanded our business through selected investments in new geographic markets and by diversifying our products in certain markets. Investments in land, lots and home inventories can expose us to risks of economic loss and inventory impairments if housing conditions weaken or we are unsuccessful in implementing our growth strategies.
We may develop communities in which we build townhomes or other multi-family homes in addition to single-family homes, sell acreage home sites as a part of the development, or develop commercial properties that may be complementary to our communities. We might acquire another homebuilder or developer in order to accomplish our growth or expansion strategies. We can give no assurance that we will be able to successfully identify, acquire or implement these new strategies in the future. Accordingly, any such expansion, including through acquisition, could expose us to significant risks, beyond those associated with operating our existing business, and may materially adversely affect our business, prospects, liquidity, financial condition and results of operations.
New and existing laws and regulations or other governmental actions, including with respect to zoning and entitlement, may increase our expenses, limit the number of homes that we can build or delay completion of our projects.
We are subject to numerous local, state, federal and other statutes, ordinances, rules and regulations concerning zoning, development, building design, construction and similar matters which impose restrictive zoning and density requirements, the result of which is to limit the number of homes that can be built within the boundaries of a particular area. We may encounter issues with entitlement, not identify all entitlement requirements during the pre-development review of a project site, or encounter zoning changes that impact our operations. Projects that are not entitled may be subjected to periodic delays, changes in use, less intensive development or elimination of development in certain specific areas due to government regulations. We may also be subject to periodic delays or may be precluded entirely from developing in certain communities due to building moratoriums or zoning changes. Such moratoriums generally relate to insufficient water supplies, sewage facilities, delays in utility hook-ups, or inadequate road capacity within specific market areas or subdivisions. Local governments also have broad discretion regarding the imposition of development fees for projects in their jurisdiction. Projects for which we have received land use and development entitlements or approvals may still require a variety of other governmental approvals and permits during the development process and can also be impacted adversely by unforeseen health, safety and welfare issues, which can further delay these projects or prevent their development. As a result, home sales could be delayed, could decline and costs could increase, which could have a material adverse effect on our business, prospects, liquidity, financial condition and results of operations.
We are subject to environmental laws and regulations, which may increase our costs, result in liabilities, limit the areas in which we can build homes and delay completion of our projects.
We are subject to a variety of local, state, federal and other laws, statutes, ordinances, rules and regulations concerning the environment, hazardous materials, the discharge of pollutants and human health and safety. The particular environmental requirements which apply to any given site vary according to multiple factors, including the site’s location, its environmental conditions, the current and former uses of the site, the presence or absence of endangered plants or animals or sensitive habitats, and conditions at nearby properties. We may not identify all of these concerns during any pre-acquisition or pre-development review of project sites. Environmental requirements and conditions may result in delays, may cause us to incur substantial compliance and other costs, and can prohibit or severely restrict development and homebuilding activity in environmentally sensitive regions or in areas contaminated by others before we commence development. We are also subject to third-party challenges, such as by environmental groups or neighborhood associations, under environmental laws and regulations to the permits and other approvals for our projects and operations. Sometimes regulators from different governmental agencies do not concur on development, remedial standards or property use restrictions for a project, and the resulting delays or additional costs can be material for a given project.
From time to time, the EPA and similar federal, state or local agencies review land developers’ and homebuilders’ compliance with environmental laws and may levy fines and penalties or other enforcement actions for failure to strictly comply with applicable environmental laws, including those applicable to control storm water discharges during construction, or impose additional requirements for future compliance as a result of past failures. Any such actions taken with respect to us may increase our costs and result in project delays. We expect that increasingly stringent requirements will be imposed on land developers and homebuilders in the future. We cannot assure you that environmental, health and safety laws will not change or become more stringent in the future in a manner that could have a material adverse effect on our business.
15
Environmental regulations can also have an adverse impact on the availability and price of certain raw materials, such as lumber.
There is a variety of new legislation being enacted, or considered for enactment at the federal, state and local level relating to energy and climate change. This legislation relates to items such as carbon dioxide emissions control and building codes that impose energy efficiency standards. New building code requirements that impose stricter energy efficiency standards could significantly increase our cost to construct homes. As climate change concerns continue to grow, legislation and regulations of this nature are expected to continue and become more costly to comply with. Similarly, energy-related initiatives affect a wide variety of companies throughout the U.S. and because our operations are heavily dependent on significant amounts of raw materials, such as lumber, steel, and concrete, they could have an indirect adverse impact on our operations and profitability to the extent the manufacturers and suppliers of our materials are burdened with expensive cap and trade and similar energy related regulations.
Ownership, leasing or occupation of land and the use of hazardous materials carries potential environmental risks and liabilities.
We are subject to a variety of local, state and federal statutes, rules and regulations concerning land use and the protection of health and the environment, including those governing discharge of pollutants to soil, water and air, including asbestos, the handling of hazardous materials and the cleanup of contaminated sites. We may be liable for the costs of removal, investigation or remediation of man-made or natural hazardous or toxic substances located on, under or in a property currently or formerly owned, leased or occupied by us, whether or not we caused or knew of the pollution.
The particular impact and requirements of environmental laws that apply to any given community vary greatly according to the site, its environmental conditions and the present and former uses of the site. We expect that increasingly stringent requirements may be imposed on land developers and homebuilders in the future. Environmental laws may result in delays, cause us to implement time consuming and expensive compliance programs and prohibit or severely restrict development in certain environmentally sensitive regions or areas, such as wetlands. Concerns could arise due to post-acquisition changes in laws or agency policies, or the interpretation thereof.
Furthermore, we could incur substantial costs, including cleanup costs, fines, penalties and other sanctions and damages from third-party claims for property damage or personal injury, as a result of our failure to comply with, or liabilities under, applicable environmental laws and regulations. In addition, we are subject to third-party challenges, such as by environmental groups or neighborhood associations, under environmental laws and regulations to the permits and other approvals required for our projects and operations. These matters could adversely affect our business, prospects, liquidity, financial condition and results of operations.
As a homebuilding and land development business with a wide variety of historic ownership, development, homebuilding and construction activities, we could be liable for future claims for damages as a result of the past or present use of hazardous materials, including building materials or fixtures known or suspected to be hazardous or to contain hazardous materials or due to use of building materials or fixtures which are associated with elevated mold. Any such claims may adversely affect our business, prospects, financial condition and results of operations. Insurance coverage for such claims may be limited or nonexistent.
Difficulties with appraisal valuations in relation to the proposed sales price of our homes could force us to reduce the price of our homes for sale.
Each of our home sales may require an appraisal of the home value before closing. These appraisals are professional judgments of the market value of the property and are based on a variety of market factors. If our internal valuations of the market and pricing do not line up with the appraisal valuations and appraisals are not at or near the agreed upon sales price, we may be forced to reduce the sales price of the home to complete the sale. These appraisal issues could have a material adverse effect on our business and results of operations.
Because of the seasonal nature of our business, our quarterly operating results fluctuate.
As discussed under “Management’s Discussion and Analysis of Financial Condition and Results of Operations—Seasonality,” we have historically experienced, and in the future expect to continue to experience, variability in our results on a quarterly basis. We close more homes in our second, third and fourth quarters. Thus, our revenue may fluctuate on a quarterly basis and we may have higher capital requirements in our second, third and fourth quarters. Accordingly, there is a risk that we will invest significant amounts of capital in the acquisition and development of land and construction of homes that we do not sell at anticipated pricing levels or within anticipated time frames. If, due to market conditions, construction delays or other causes, we do not complete home sales at anticipated pricing levels or within anticipated time frames, our business, prospects, liquidity,
16
financial condition and results of operations would be adversely affected. We expect this seasonal pattern to continue over the long term but we can make no assurances as to the degree to which our historical seasonal patterns will occur in the future.
Adverse weather and geological conditions may increase costs, cause project delays and reduce consumer demand for housing, all of which could materially and adversely affect us.
As a homebuilder and land developer, we are subject to the risks associated with numerous weather-related and geologic events. These weather-related and geologic events include but are not limited to hurricanes, tornados, droughts, floods, brushfires, wildfires, landslides, soil subsidence and earthquakes and other natural disasters. The occurrence of any of these events could damage our land parcels and projects, cause delays in completion of our projects, reduce consumer demand for housing, and cause shortages and price increases in labor or raw materials, any of which could affect our sales and profitability. In addition to directly damaging our land or projects, many of these natural events could damage roads and highways providing access to those assets or affect the desirability of our land or projects, thereby adversely affecting our ability to market homes or sell land in those areas and possibly increasing the costs of homebuilding completion.
There are some risks of loss for which we may be unable to purchase insurance coverage. For example, losses associated with hurricanes, landslides, earthquakes and other weather-related and geologic events may not be insurable and other losses, such as those arising from terrorism, may not be economically insurable. A sizeable uninsured loss could materially and adversely affect our business, prospects, liquidity, financial condition and results of operations.
Our geographic concentration could materially and adversely affect us if the homebuilding industry in our current markets should experience a decline.
Our business strategy is focused on the acquisition of suitable land and the design, construction and sale of primarily single-family homes in residential subdivisions, including planned communities, in Texas, Arizona, Florida, Georgia, New Mexico, Colorado, North Carolina and South Carolina. Because our operations are currently concentrated in these areas, a prolonged economic downturn in the future in one or more of these areas or a particular industry that is fundamental to one of these areas, particularly within Texas, could have a material adverse effect on our business, prospects, liquidity, financial condition and results of operations, and a disproportionately greater impact on us than other homebuilders with more diversified operations. To the extent the oil and gas industries, which can be very volatile, are negatively impacted by declining commodity prices, climate change, legislation or other factors, a result could be a reduction in employment, or other negative economic consequences, which in turn could adversely impact our home sales and activities in Texas and certain of our other markets.
Moreover, certain insurance companies doing business in Florida and Texas have restricted, curtailed or suspended the issuance of homeowners’ insurance policies on single-family homes. This has both reduced the availability of hurricane and other types of natural disaster insurance in Florida and Texas, in general, and increased the cost of such insurance to prospective purchasers of homes in Florida and Texas. Mortgage financing for a new home is conditioned, among other things, on the availability of adequate homeowners’ insurance. There can be no assurance that homeowners’ insurance will be available or affordable to prospective purchasers of our homes offered for sale in the Florida and Texas markets. Long-term restrictions on, or unavailability of, homeowners’ insurance in the Florida and Texas markets could have an adverse effect on the homebuilding industry in that market in general, and on our business within that market in particular. Additionally, the availability of permits for new homes in new and existing developments has been adversely affected by the significantly limited capacity of the schools, roads, and other infrastructure in that market.
If adverse conditions in these markets develop in the future, it could have a material adverse effect on our business, prospects, liquidity, financial condition and results of operations. Furthermore, if buyer demand for new homes in these markets decreases, home prices could decline, which would have a material adverse effect on our business.
Difficulty in obtaining sufficient capital could result in an inability to acquire land for our developments or increased costs and delays in the completion of development projects, increase home construction costs or delay home construction entirely.
The homebuilding and land development industry is capital-intensive and requires significant up-front expenditures to acquire land parcels and begin development. In addition, if housing markets are not favorable or permitting or development takes longer than anticipated, we may be required to hold our investments in land for extended periods of time. If internally generated funds are not sufficient, we may seek additional capital in the form of equity or debt financing from a variety of potential sources, including additional bank financings and/or securities offerings. The availability of borrowed funds, especially for land acquisition and construction financing, may be constrained regionally or nationally, and the lending community may require increased amounts of equity to be invested in a project by borrowers in connection with both new loans and the extension of existing loans. The credit and capital markets continue to experience volatility. If we are required to seek additional financing to fund our operations,
17
continued volatility in these markets may restrict our flexibility to access such financing. If we are not successful in obtaining sufficient funding for our planned capital and other expenditures, we may be unable to acquire additional land for development and/or to develop new housing. Additionally, if we cannot obtain additional financing to fund the purchase of land under our purchase or option contracts, we may incur contractual penalties, fees and increased expenses from the write-off of due diligence and pre-acquisition costs. Any difficulty in obtaining sufficient capital for planned development expenditures could also cause project delays and any such delay could result in cost increases. Any one or more of the foregoing events could have a material adverse effect on our business, prospects, liquidity, financial condition and results of operations.
Our industry is cyclical and adverse changes in general and local economic conditions could reduce the demand for homes and, as a result, could have a material adverse effect on us.
Our business can be substantially affected by adverse changes in general economic or business conditions that are outside of our control, including changes in short-term and long-term interest rates; employment levels and job and personal income growth; housing demand from population growth, household formation and other demographic changes, among other factors; availability and pricing of mortgage financing for homebuyers; consumer confidence generally and the confidence of potential homebuyers in particular; financial system and credit market stability; private party and government mortgage loan programs (including changes in FHA, USDA, VA, Fannie Mae and Freddie Mac conforming mortgage loan limits, credit risk/mortgage loan insurance premiums and/or other fees, down payment requirements and underwriting standards), and federal and state regulation, oversight and legal action regarding lending, appraisal, foreclosure and short sale practices; federal and state personal income tax rates and provisions, including provisions for the deduction of mortgage loan interest payments, real estate taxes and other expenses; supply of and prices for available new or resale homes (including lender-owned homes) and other housing alternatives, such as apartments, single-family rentals and other rental housing; homebuyer interest in our current or new product designs and new home community locations, and general consumer interest in purchasing a home compared to choosing other housing alternatives; and real estate taxes. Adverse changes in these conditions may affect our business nationally or may be more prevalent or concentrated in particular submarkets in which we operate. Inclement weather, natural disasters (such as earthquakes, hurricanes, tornadoes, floods, droughts and fires), and other environmental conditions can delay the delivery of our homes and/or increase our costs. Civil unrest or acts of terrorism can also have a negative effect on our business.
The potential difficulties described above can cause demand and prices for our homes to fall or cause us to take longer and incur more costs to develop the land and build our homes. We may not be able to recover these increased costs by raising prices because of market conditions. The potential difficulties could also lead some homebuyers to cancel or refuse to honor their home purchase contracts altogether.
Inflation could adversely affect our business and financial results.
Inflation could adversely affect our business and financial results by increasing the costs of land, raw materials and labor needed to operate our business. If our markets have an oversupply of homes relative to demand, we may be unable to offset any such increases in costs with corresponding higher sales prices for our homes. Inflation may also accompany higher interests rates, which could adversely impact potential customers’ ability to obtain financing on favorable terms, thereby further decreasing demand. If we are unable to raise the prices of our homes to offset the increasing costs of our operations, our margins could decrease. Furthermore, if we need to lower the price of our homes to meet demand, the value of our land inventory may decrease. Inflation may also raise our costs of capital and decrease our purchasing power, making it more difficult to maintain sufficient funds to operate our business.
Interest rate changes may adversely affect us.
We currently do not hedge against interest rate fluctuations. We may obtain in the future one or more forms of interest rate protection in the form of swap agreements, interest rate cap contracts or similar agreements to hedge against the possible negative effects of interest rate fluctuations. However, we cannot assure you that any hedging will adequately relieve the adverse effects of interest rate increases or that counterparties under these agreements will honor their obligations thereunder. In addition, we may be subject to risks of default by hedging counterparties. Adverse economic conditions could also cause the terms on which we borrow to be unfavorable. We could be required to liquidate one or more of our assets at times which may not permit us to receive an attractive return on our assets in order to meet our debt service obligations.
We are subject to warranty and liability claims arising in the ordinary course of business that can be significant.
As a homebuilder, we are subject to construction defect, product liability and home warranty claims, including moisture intrusion and related claims, arising in the ordinary course of business. We maintain, and require our subcontractors to maintain, general liability insurance (including construction defect and bodily injury coverage) and workers’ compensation insurance and
18
generally seek to require our subcontractors to indemnify us for liabilities arising from their work. While these insurance policies, subject to deductibles and other coverage limits, and indemnities protect us against a portion of our risk of loss from claims related to our homebuilding activities, we cannot provide assurance that these insurance policies and indemnities will be adequate to address all our home warranty, product liability and construction defect claims in the future, or that any potential inadequacies will not have an adverse effect on our financial statements. Additionally, the coverage offered by and the availability of general liability insurance for construction defects are currently limited and costly. We cannot provide assurance that coverage will not be further restricted, increasing our risks and financial exposure to claims, and/or become more costly.
We may suffer uninsured losses or suffer material losses in excess of insurance limits.
We could suffer physical damage to property and liabilities resulting in losses that may not be fully recoverable by insurance. Insurance against certain types of risks, such as terrorism, earthquakes or floods or personal injury claims, may be unavailable, available in amounts that are less than the full market value or replacement cost of investment or underlying assets or subject to a large deductible. In addition, there can be no assurance certain types of risks which are currently insurable will continue to be insurable on an economically feasible basis. Should an uninsured loss or a loss in excess of insured limits occur or be subject to deductibles, we could sustain financial loss or lose capital invested in the affected property as well as anticipated future income from that property. Furthermore, we could be liable to repair damage or meet liabilities caused by risks that are uninsured or subject to deductibles. We may be liable for any debt or other financial obligations related to affected property. Material losses or liabilities in excess of insurance proceeds may occur in the future.
If the market value of our land inventory decreases, our results of operations could be adversely affected by impairments and write-downs.
The market value of our land and housing inventories depends on market conditions. We acquire land for expansion into new markets and for replacement of land inventory and expansion within our current markets. There is an inherent risk that the value of the land owned by us may decline after purchase. The valuation of property is inherently subjective and based on the individual characteristics of each property. We may have acquired options on or bought and developed land at a cost we will not be able to recover fully or on which we cannot build and sell homes profitably. In addition, our deposits for lots controlled under purchase, option or similar contracts may be put at risk.
Factors such as changes in regulatory requirements and applicable laws (including in relation to building regulations, taxation and planning), political conditions, the condition of financial markets, both local and national economic conditions, the financial condition of customers, potentially adverse tax consequences, and interest and inflation rate fluctuations subject valuations to uncertainty. Moreover, our valuations are made on the basis of assumptions that may not prove to reflect economic or demographic reality.
If housing demand fails to meet our expectations when we acquired our inventory, our profitability may be adversely affected and we may not be able to recover our costs when we build and sell houses. We regularly review the value of our land holdings and continue to review our holdings on a periodic basis. Material write-downs and impairments in the value of our inventory may be required, and we may in the future sell land or homes at a loss, which could adversely affect our results of operations and financial condition.
Fluctuations in real estate values may require us to write-down the book value of our real estate assets.
The homebuilding and land development industries are subject to significant variability and fluctuations in real estate values. As a result, we may be required to write-down the book value of our real estate assets in accordance with U.S. GAAP, and some of those write-downs could be material. Any material write-downs of assets could have a material adverse effect on our business, prospects, liquidity, financial condition and results of operations.
Acts of war or terrorism may seriously harm our business.
Acts of war, any outbreak or escalation of hostilities between the United States and any foreign power or acts of terrorism may cause disruption to the U.S. economy, or the local economies of the markets in which we operate, cause shortages of building materials, increase costs associated with obtaining building materials, result in building code changes that could increase costs of construction, result in uninsured losses, affect job growth and consumer confidence, or cause economic changes that we cannot anticipate, all of which could reduce demand for our homes and adversely impact our business, prospects, liquidity, financial condition and results of operations.
19
A major health and safety incident relating to our business could be costly in terms of potential liabilities and reputational damage.
Building sites are inherently dangerous, and operating in the homebuilding and land development industry poses certain inherent health and safety risks. Due to health and safety regulatory requirements and the number of projects we work on, health and safety performance is critical to the success of all areas of our business.
Any failure in health and safety performance may result in penalties for non-compliance with relevant regulatory requirements or litigation, and a failure that results in a major or significant health and safety incident is likely to be costly in terms of potential liabilities incurred as a result. Such a failure could generate significant negative publicity and have a corresponding impact on our reputation and our relationships with relevant regulatory agencies, governmental authorities and local communities, which in turn could have a material adverse effect on our business, prospects, liquidity, financial condition and results of operations.
We may become subject to litigation, which could materially and adversely affect us.
In the future, we may become subject to litigation or enforcement actions, including claims relating to our operations, securities offerings and otherwise in the ordinary course of business. Some of these claims may result in significant defense costs and potentially significant judgments against us, some of which are not, or cannot be, insured against. We cannot be certain of the ultimate outcomes of any claims that may arise in the future. Resolution of these types of matters against us may result in our having to pay significant fines, judgments, or settlements, which, if uninsured, or if the fines, judgments and settlements exceed insured levels, could adversely impact our earnings and cash flows, thereby materially and adversely affecting us. Certain litigation or the resolution of certain litigation may affect the availability or cost of some of our insurance coverage, which could materially and adversely impact us, expose us to increased risks that would be uninsured, and materially and adversely impact our ability to attract directors and officers.
Poor relations with the residents of our communities could negatively impact sales, which could cause our revenue or results of operations to decline.
Residents of communities we develop rely on us to resolve issues or disputes that may arise in connection with the operation or development of their communities. Efforts made by us to resolve these issues or disputes could be deemed unsatisfactory by the affected residents and subsequent actions by these residents could adversely affect our sales or our reputation. In addition, we could be required to make material expenditures related to the settlement of such issues or disputes or to modify our community development plans, which could adversely affect our results of operations.
An information systems interruption or breach in security could adversely affect us.
We rely on accounting, financial and operational management information systems to conduct our operations. Any disruption in these systems could adversely affect our ability to conduct our business. Furthermore, any security breach of information systems or data could result in a violation of applicable privacy and other laws, significant legal and financial exposure, damage to our reputation, and a loss of confidence in our security measures, which could harm our business.
Termination of the employment agreement with our Chief Executive Officer could be costly and prevent a change in control of our company.
The employment agreement with our Chief Executive Officer, Eric Lipar, provides that if his employment with us terminates under certain circumstances, we may be required to pay him a significant amount of severance compensation, thereby making it costly to terminate his employment. Furthermore, these provisions could delay or prevent a transaction or a change in control of our company that might involve a premium paid for shares of our common stock or otherwise be in the best interests of our stockholders, which could adversely affect the market price of our common stock.
Any future government shutdowns or slowdowns may materially adversely affect our business or financial results.
The U.S. federal government shutdown in the first part of October 2013 which impacted FHA and the USDA, among other federal agencies, and their backing of mortgage loans, negatively affected our closings in October 2013. Any future government shutdowns or slowdowns may materially adversely affect our business or financial results. We can make no assurances that potential closings affected by any such shutdown or slowdown will occur after the shutdown or slowdown has ended.
20
Negative publicity could adversely affect our reputation as well as our business, financial results and stock price.
Unfavorable media related to our industry, company, brands, marketing, personnel, operations, business performance, or prospects may affect our stock price and the performance of our business, regardless of its accuracy or inaccuracy. The speed at which negative publicity can be disseminated has increased dramatically with the capabilities of electronic communication, including social media outlets, websites, blogs, or newsletters. Our success in maintaining, extending and expanding our brand image depends on our ability to adapt to this rapidly changing media environment. Adverse publicity or negative commentary from any media outlets could damage our reputation and reduce the demand for our homes, which would adversely affect our business.
Risks Related to Our Organization and Structure
We depend on key management personnel and other experienced employees.
Our success depends to a significant degree upon the contributions of certain key management personnel including, but not limited to, Eric Lipar, our Chief Executive Officer and Chairman of our board. Although we have entered into an employment agreement with Mr. Lipar, there is no guarantee that Mr. Lipar will remain employed by us. If any of our key management personnel were to cease employment with us, our operating results could suffer. Our ability to retain our key management personnel or to attract suitable replacements should any members of our management team leave is dependent on the competitive nature of the employment market. The loss of services from key management personnel or a limitation in their availability could materially and adversely impact our business, prospects, liquidity, financial condition and results of operations. Further, such a loss could be negatively perceived in the capital markets. We have not obtained key man life insurance that would provide us with proceeds in the event of death or disability of any of our key management personnel.
Experienced employees in the homebuilding, land acquisition, development, and construction industries are fundamental to our ability to generate, obtain and manage opportunities. In particular, local knowledge and relationships are critical to our ability to source attractive land acquisition opportunities. Experienced employees working in the homebuilding, development and construction industries are highly sought after. Failure to attract and retain such personnel or to ensure that their experience and knowledge is not lost when they leave the business through retirement, redundancy or otherwise may adversely affect the standards of our service and may have an adverse impact on our business, prospects, liquidity, financial condition and results of operations. The loss of any of our key personnel could adversely impact our business, prospects, financial condition and results of operations.
We may change our operational policies, investment guidelines and our business and growth strategies without stockholder consent, which may subject us to different and more significant risks in the future.
Our board of directors will determine our operational policies, investment guidelines and our business and growth strategies. Our board of directors may make changes to, or approve transactions that deviate from, those policies, guidelines and strategies without a vote of, or notice to, our stockholders. This could result in us conducting operational matters, making investments or pursuing different business or growth strategies than those contemplated in this Annual Report. Under any of these circumstances, we may expose ourselves to different and more significant risks in the future, which could have a material adverse effect on our business, prospects, liquidity, financial condition and results of operations.
Changes in accounting rules, assumptions and/or judgments could materially and adversely affect us.
Accounting rules and interpretations for certain aspects of our financial reporting, including those relating to our goodwill and other intangibles, operations are highly complex and involve significant assumptions and judgment. These complexities could lead to a delay in the preparation and dissemination of our financial statements. Furthermore, changes in accounting rules and interpretations or in our accounting assumptions and/or judgments, such as asset impairments, could significantly impact our financial statements. In some cases, we could be required to apply a new or revised standard retroactively, resulting in restating prior period financial statements. Any of these circumstances could have a material adverse effect on our business, prospects, liquidity, financial condition and results of operations.
We expect to use leverage in executing our business strategy, which may adversely affect the return on our assets.
We expect to employ prudent levels of leverage to finance the acquisition and development of our lots and construction of our homes. Our existing indebtedness is recourse to us and we anticipate that future indebtedness will likewise be recourse. As of December 31, 2014, we had a $200.0 million revolving credit facility (the "Credit Facility") to finance our construction and development activities. As of December 31, 2014, we had outstanding borrowings of $139.4 million under the Credit Facility and we could borrow an additional $60.6 million under the Credit Facility. As of December 31, 2014, borrowings under the Credit
21
Facility bore interest at a rate of 3.75% per annum. In November 2014, the Company issued $85.0 million aggregate principal amount of its 4.25% Convertible Notes due 2019 (the "Convertible Notes").
Our board of directors will consider a number of factors when evaluating our level of indebtedness and when making decisions regarding the incurrence of new indebtedness, including the purchase price of assets to be acquired with debt financing, if any, the estimated market value of our assets and the ability of particular assets, and our company as a whole, to generate cash flow to cover the expected debt service. As a means of sustaining our long-term financial health and limiting our exposure to unforeseen dislocations in the debt and financing markets, we currently expect to remain conservatively capitalized. However, our certificate of incorporation does not contain a limitation on the amount of indebtedness we may incur and our board of directors may change our target debt levels at any time without the approval of our stockholders.
Incurring substantial indebtedness could subject us to many risks that, if realized, would adversely affect us, including the risk that:
• | our cash flow from operations may be insufficient to make required payments of principal of and interest on the debt which is likely to result in acceleration of such indebtedness; |
• | our indebtedness may increase our vulnerability to adverse economic and industry conditions with no assurance that our profitability will increase with higher financing cost; |
• | we may be required to dedicate a portion of our cash flow from operations to payments on our indebtedness, thereby reducing funds available for operations and capital expenditures, future investment opportunities or other purposes; and |
• | the terms of any refinancing may not be as favorable as the terms of the indebtedness being refinanced. |
If we do not have sufficient funds to repay our indebtedness at maturity, it may be necessary to refinance the indebtedness through additional debt or additional equity financings. If, at the time of any refinancing, prevailing interest rates or other factors result in higher interest rates on refinancings, increases in interest expense could adversely affect our cash flows and results of operations. If we are unable to refinance our indebtedness on acceptable terms, we may be forced to dispose of our assets on disadvantageous terms, potentially resulting in losses. To the extent we cannot meet any future debt service obligations, we will risk losing some or all of our assets that may be pledged to secure our obligations to foreclosure. Unsecured debt agreements may contain specific cross-default provisions with respect to specified other indebtedness, giving the unsecured lenders the right to declare a default if we are in default under other indebtedness in some circumstances. Defaults under the Credit Facility and our other debt agreements, if any, could have a material adverse effect on our business, prospects, liquidity, financial condition and results of operations.
Access to financing sources may not be available on favorable terms, or at all, especially in light of current market conditions, which could adversely affect our ability to maximize our returns.
Our access to additional third-party sources of financing will depend, in part, on:
• | general market conditions; |
• | the market’s perception of our growth potential; |
• | with respect to acquisition and/or development financing, the market’s perception of the value of the land parcels to be acquired and/or developed; |
• | our current debt levels; |
• | our current and expected future earnings; |
• | our cash flow; and |
• | the market price per share of our common stock. |
Since the global recession in 2008, domestic financial markets have, from time to time, experienced unusual volatility, uncertainty and a tightening of liquidity in both the high yield debt and equity capital markets. Credit spreads for major sources of capital widened significantly during the U.S. credit crisis as investors demanded a higher risk premium. Given such possible volatility and weakness in the capital and credit markets, potential lenders may be unwilling or unable to provide us with financing that is attractive to us or may charge us prohibitively high fees in order to obtain financing. Consequently, our ability to access the credit market in order to attract financing on reasonable terms may be adversely affected. Investment returns on our assets and our ability to make acquisitions could be adversely affected by our inability to secure additional financing on reasonable terms, if at all.
Depending on market conditions at the relevant time, we may have to rely more heavily on additional equity financings or on less efficient forms of debt financing that require a larger portion of our cash flow from operations, thereby reducing funds available for our operations, future business opportunities and other purposes. We may not have access to such equity or debt capital on favorable terms at the desired times, or at all.
22
Our current financing arrangements contain, and our future financing arrangements likely will contain, restrictive provisions.
Our current financing arrangements contain, and the financing arrangements we enter into in the future likely will contain, provisions that limit our ability to do certain things. In particular, the Credit Facility requires us to maintain a minimum EBITDA to debt service ratio of 4.0 to 1.0, debt-to-capitalization ratio not to exceed 0.60 to 1.0, a tangible net worth of not less than $145.0 million plus 100% of the net proceeds of any issuances of stock or other equity interests of us or any of our subsidiaries (an “Obligated Party”) (other than to another Obligated Party) after April 2014, plus 50% of the amount of our net income, on a consolidated basis (but without deduction for any net loss), for each fiscal quarter ending after April 2014. The Credit Facility also requires us to maintain a leverage ratio of not more than 1.75 to 1.0. We are required under the Credit Facility to maintain liquidity in excess of $40.0 million effective December 31, 2014. The Credit Facility requires of us to not suffer net losses in more than two consecutive calendar quarters. In addition, the Credit Facility contains various covenants that, among other restrictions, limit the amount of additional debt and related party transactions.
If we fail to meet or satisfy any of these provisions, we would be in default under the Credit Facility and our lender could elect to declare outstanding amounts due and payable, terminate their commitments, require the posting of additional collateral and enforce their respective interests against existing collateral. A default also could limit significantly our financing alternatives, which could cause us to curtail our investment activities and/or dispose of assets when we otherwise would not choose to do so. In addition, future indebtedness may contain financial covenants limiting our ability to, for example, incur additional indebtedness, make certain investments, reduce liquidity below certain levels and pay dividends to our stockholders, and otherwise affect our operating policies. If we default on one or more of our debt agreements, it could have a material adverse effect on our business, prospects, liquidity, financial condition and results of operations.
In addition, upon the occurrence of a “Fundamental Change” (as defined in the indenture governing the Convertible Notes), subject to certain conditions, the Convertible Notes include terms that allow a holder of the Convertible Notes to require to purchase all or a portion of such holder's Convertible Notes for cash at a price equal to 100% of the principal amount of the Convertible Notes to be purchased, plus any then accrued, but unpaid, interest.
Interest expense on debt we incur may limit our cash available to fund our growth strategies.
As of December 31, 2014, we had a $200.0 million secured revolving credit facility. As of December 31, 2014, we had outstanding borrowings of $139.4 million under the Credit Facility and we could borrow an additional $60.6 million under the Credit Facility. As of December 31, 2014, borrowings under the Credit Facility bore interest at a rate of 3.75% per annum. During November 2014, the Company issued $85.0 million aggregate principal amount of its 4.25% Convertible Notes due 2019. If our operations do not generate sufficient cash from operations at levels currently anticipated, we may seek additional capital in the form of debt financing. Our current indebtedness includes, and any additional indebtedness we subsequently incur may have, a floating rate of interest. Higher interest rates could increase debt service requirements on our current floating rate indebtedness and on any floating rate indebtedness we subsequently incur, and could reduce funds available for operations, future business opportunities or other purposes. If we need to repay existing indebtedness during periods of rising interest rates, we could be required to refinance our then-existing indebtedness on unfavorable terms or liquidate one or more of our assets to repay such indebtedness at times which may not permit realization of the maximum return on such assets and could result in a loss. The occurrence of either such event or both could materially and adversely affect our cash flows and results of operations.
We are a holding company, and we are accordingly dependent upon distributions from our subsidiaries to pay dividends, if any, taxes and other expenses.
We are a holding company and will have no material assets other than our ownership of membership interests or limited partnership interests in our subsidiaries. We have no independent means of generating revenue. We intend to cause our subsidiaries to make distributions to their members or partners in an amount sufficient to cover all applicable taxes payable and dividends, if any, declared by us. Future financing arrangements may contain negative covenants, limiting the ability of our subsidiaries to declare or pay dividends or make distributions. To the extent that we need funds, and our subsidiaries are restricted from making such dividends or distributions under applicable law or regulations, or otherwise unable to provide such funds, for example, due to restrictions in future financing arrangements that limit the ability of our operating subsidiaries to distribute funds, our liquidity and financial condition could be materially harmed.
The obligations associated with being a public company will require significant resources and management attention.
As a public company with listed equity securities, we must comply with laws, regulations and requirements, including the requirements of the Securities Exchange Act of 1934, as amended, or the Exchange Act, certain corporate governance provisions of the Sarbanes-Oxley Act, related regulations of the SEC and requirements of the NASDAQ Global Select Market. The Exchange
23
Act requires that we file annual, quarterly and current reports with respect to our business and financial condition. The Sarbanes-Oxley Act requires, among other things, that we establish and maintain effective internal controls and procedures for financial reporting.
Section 404 of the Sarbanes-Oxley Act requires our management and independent auditors to report annually on the effectiveness of our internal control over financial reporting. However, we are an “emerging growth company,” as defined in the JOBS Act, and, so for as long as we continue to be an emerging growth company, we intend to take advantage of certain exemptions from various reporting requirements applicable to other public companies but not to emerging growth companies, including, but not limited to, not being required to comply with the auditor attestation requirements of Section 404.
Once we are no longer an emerging growth company or, if prior to such date, we opt to no longer take advantage of the applicable exemption, we will be required to include an opinion from our independent auditors on the effectiveness of our internal control over financial reporting.
These reporting and other obligations place significant demands on our management, administrative, operational and accounting resources and cause us to incur significant expenses. We may need to upgrade our systems or create new systems, implement additional financial and management controls, reporting systems and procedures, create or outsource an internal audit function, and hire additional accounting and finance staff. If we are unable to accomplish these objectives in a timely and effective fashion, our ability to comply with the financial reporting requirements and other rules that apply to reporting companies could be impaired. Any failure to maintain effective internal control over financial reporting could have a material adverse effect on our business, prospects, liquidity, financial condition and results of operations.
We are an “emerging growth company,” and, as a result of the reduced disclosure and governance requirements applicable to emerging growth companies, our common stock may be less attractive to investors.
We are an “emerging growth company,” as defined in the JOBS Act, and we are eligible to take advantage of certain exemptions from various reporting requirements applicable to other public companies but not to emerging growth companies, including, but not limited to, a requirement to present only two years of audited financial statements, an exemption from the auditor attestation requirement of Section 404 of the Sarbanes-Oxley Act, reduced disclosure about executive compensation arrangements pursuant to the rules applicable to smaller reporting companies and no requirement to seek non-binding advisory votes on executive compensation or golden parachute arrangements. We have elected to adopt these reduced disclosure requirements. We could be an emerging growth company until the last day of the fiscal year following the fifth anniversary of the completion of our IPO, although a variety of circumstances could cause us to lose that status earlier. We cannot predict if investors will find our common stock less attractive as a result of our taking advantage of these exemptions. If some investors find our common stock less attractive as a result of our choices, there may be a less active trading market for our common stock and our stock price may be more volatile.
In addition, Section 107 of the JOBS Act provides that an emerging growth company can take advantage of the extended transition period provided in Section 7(a)(2)(B) of the Securities Act of 1933, as amended, or the Securities Act, for complying with new or revised financial accounting standards. An emerging growth company can therefore delay the adoption of certain accounting standards until those standards would otherwise apply to private companies. However, we have determined to opt out of such extended transition period and, as a result, we will comply with new or revised financial accounting standards on the relevant dates on which adoption of such standards is required for non-emerging growth companies. Section 107 of the JOBS Act provides that our decision to opt out of the extended transition period for complying with new or revised financial accounting standards is irrevocable.
If we fail to implement and maintain an effective system of internal controls, we may not be able to accurately determine our financial results or prevent fraud. As a result, our stockholders could lose confidence in our financial results, which could materially and adversely affect us.
Effective internal controls are necessary for us to provide reliable financial reports and effectively prevent fraud. We may in the future discover areas of our internal controls that need improvement. We cannot be certain that we will be successful in maintaining adequate internal control over our financial reporting and financial processes. Furthermore, as we grow our business, our internal controls will become more complex, and we will require significantly more resources to ensure our internal controls remain effective. Additionally, the existence of any material weakness or significant deficiency would require management to devote significant time and incur significant expense to remediate any such material weakness or significant deficiency and management may not be able to remediate any such material weakness or significant deficiency in a timely manner. The existence of any material weakness in our internal control over financial reporting could also result in errors in our financial statements that could require us to restate our financial statements, cause us to fail to meet our reporting obligations and cause stockholders to lose confidence in our reported financial information, all of which could materially and adversely affect us.
24
Any joint venture investments that we make could be adversely affected by our lack of sole decision making authority, our reliance on the financial condition of our joint venture partners and disputes between us and our joint venture partners.
We may co-invest in the future with third parties through partnerships, joint ventures or other entities, acquiring non-controlling interests in or sharing responsibility for managing the affairs of a land acquisition and/or a development. In this event, we would not be in a position to exercise sole decision-making authority regarding the acquisition and/or development, and our investment may be illiquid due to our lack of control. Investments in partnerships, joint ventures, or other entities may, under certain circumstances, involve risks not present were a third party not involved, including the possibility that our joint venture partners might become bankrupt, fail to fund their share of required capital contributions, make poor business decisions or block or delay necessary decisions. Our joint venture partners may have economic or other business interests or goals which are inconsistent with our business interests or goals, and may be in a position to take actions contrary to our policies or objectives. Such investments may also have the potential risk of impasses on decisions, such as a sale, because neither we nor our joint venture partners would have full control over the land acquisition or development. Disputes between us and our joint venture partners may result in litigation or arbitration that would increase our expenses and prevent our officers and/or directors from focusing their time and effort on our business. In addition, we may in certain circumstances be liable for the actions of our joint venture partners.
Cautionary Statement about Forward-Looking Statements
From time to time we make statements concerning our expectations, beliefs, plans, objectives, goals, strategies, future events or performance and underlying assumptions and other statements that are not historical facts. These statements are “forward-looking statements” within the meaning of the Private Securities Litigation Reform Act of 1995. Actual results may differ materially from those expressed or implied by these statements. You can generally identify our forward-looking statements by the words “anticipate,” “believe,” “continue,” “could,” “estimate,” “expect,” “forecast,” “goal,” “intend,” “may,” “objective,” “plan,” “potential,” “predict,” “projection,” “should,” “will” or other similar words.
We have based our forward-looking statements on our management’s beliefs and assumptions based on information available to our management at the time the statements are made. We caution you that assumptions, beliefs, expectations, intentions and projections about future events may and often do vary materially from actual results. Therefore, we cannot assure you that actual results will not differ materially from those expressed or implied by our forward-looking statements.
The following are some of the factors that could cause actual results to differ materially from those expressed or implied in forward-looking statements:
• | adverse economic changes either nationally or in the markets in which we operate, including increases in unemployment, volatility of mortgage interest rates and inflation; |
• | a slowdown in the homebuilding industry; |
• | volatility in the credit markets and broader financial markets; |
• | the cyclical and seasonal nature of our business; |
• | our future operating results and financial condition; |
• | our business operations; |
• | changes in our business and investment strategy; |
• | our ability to successfully expand into new markets; |
• | our ability to successfully extend our business model to building homes with higher price points, developing larger communities with, multi-unit products and selling acreage home sites; |
• | our ability to identify potential acquisition candidates and close such acquisitions; |
• | our ability to successfully integrate any acquisitions with our existing operations; |
• | availability of land to acquire and our ability to acquire such land on favorable terms or at all; |
• | availability, terms and deployment of capital; |
• | decisions of the lender group of the Credit Facility; |
• | decline in the market value of our land portfolio; |
• | continued or increased disruption in the terms or availability of mortgage financing or the number of foreclosures in our markets; |
• | shortages of or increased prices for labor, land or raw materials used in housing construction; |
• | delays in land development or home construction resulting from natural disasters, adverse weather conditions or other events outside our control; |
• | uninsured losses in excess of insurance limits; |
• | the cost and availability of insurance and surety bonds; |
• | changes in, liabilities under, or the failure or inability to comply with, governmental laws and regulations; |
• | the timing of receipt of regulatory approvals and the opening of projects; |
25
• | the degree and nature of our competition; |
• | increases in taxes or government fees; |
• | an inability to develop our projects successfully or within expected timeframes; |
• | the success of our operations in recently opened new markets and our ability to expand into additional new markets; |
• | poor relations with the residents of our projects; |
• | future litigation, arbitration or other claims; |
• | availability of qualified personnel and third party contractors and our ability to retain our key personnel; |
• | our leverage and future debt service obligations; |
• | the impact on our business of any future government shutdown similar to the one that occurred in October 2013; |
• | other risks and uncertainties inherent in our business; and |
• | other factors we discuss under the section entitled “Management's Discussion and Analysis of Financial Condition and Results of Operations.” |
You should not place undue reliance on forward-looking statements. Each forward-looking statement speaks only as of the date of the particular statement. We expressly disclaim any intent, obligation or undertaking to update or revise any forward-looking statements to reflect any change in our expectations with regard thereto or any change in events, conditions or circumstances on which any such statements are based. All subsequent written and oral forward-looking statements attributable to us or persons acting on our behalf are expressly qualified in their entirety by the cautionary statements contained in this Annual Report on Form 10-K.
ITEM 1B. UNRESOLVED STAFF COMMENTS
None.
ITEM 2. PROPERTIES
We lease approximately 15,600 square feet in The Woodlands, Texas for our corporate headquarters; this lease expires in 2018. In addition, we lease divisional offices in Arizona, Florida, Georgia and North Carolina. We lease approximately 1,800 square feet in Arizona and this lease expires in 2018. We lease approximately 6,600 square feet in Florida for a divisional office and an information center, and these leases expire in 2019 and 2017, respectively. We lease approximately 1,900 square feet in Georgia and this lease expires in 2019. We lease approximately 8,600 square feet in North Carolina for a divisional office and two information centers, and all of these leases expire in 2015. See “Business—Land Acquisition Policies and Development” for a summary of the other property which we owned or controlled as of December 31, 2014.
ITEM 3. LEGAL PROCEEDINGS
In the ordinary course of doing business, we are subject to claims or proceedings from time to time relating to the purchase, development, and sale of real estate. Management believes that these claims include usual obligations incurred by real estate developers in the normal course of business. In the opinion of management, these matters will not have a material effect on our financial position, results of operations or cash flows.
We have provided unsecured environmental indemnities to certain lenders and other contractual counterparties. In each case, we have performed due diligence on the potential environmental risks including obtaining an independent environmental review from outside environmental consultants. These indemnities obligate us to reimburse the guaranteed parties for damages related to environmental matters. There is no term or damage limitation on these indemnities; however, if an environmental matter arises, we may have recourse against other previous owners. Management is not aware of any environmental claims or occurrences and has recorded no reserves for environmental matters.
ITEM 4. MINE SAFETY DISCLOSURES
Not applicable.
26
PART II
ITEM 5. MARKET FOR REGISTRANT’S COMMON EQUITY, RELATED STOCKHOLDER MATTERS AND ISSUER PURCHASES OF EQUITY SECURITIES
Our common stock is listed on the NASDAQ Stock Market (NASDAQ) under the symbol “LGIH.” The following table sets forth, for the periods indicated, the range of high and low sales prices for our common stock, as reported by the NASDAQ.
High | Low | |||||||
2013 | ||||||||
Fourth quarter (beginning November 7, 2013) | $ | 18.85 | $ | 12.01 | ||||
2014 | ||||||||
1st Quarter | $ | 20.75 | $ | 15.76 | ||||
2nd Quarter | $ | 19.30 | $ | 13.80 | ||||
3rd Quarter | $ | 22.21 | $ | 17.85 | ||||
4th Quarter | $ | 19.72 | $ | 13.50 | ||||
As of March 9, 2015, the closing price of our common stock on the NASDAQ was $13.43, and we had 90 stockholders of record, including Cede & Co. as nominee of The Depository Trust Company.
Initial Public Offering
On November 13, 2013, we completed an IPO of 10,350,000 shares of our common stock, which was conducted pursuant to our Registration Statement on Form S-1 (File No. 333-190853), as amended, that was declared effective on November 6, 2013. The IPO provided us with net proceeds of $102.6 million. During November 2013, we used $36.9 million of the net proceeds from the IPO for the cash portion of the purchase price to acquire all of the joint venture interests of our joint venture partners in the LGI/GTIS Joint Ventures. The remaining proceeds were used for working capital and general corporate purposes, including the acquisition of land, development lots and construction of homes.
Purchases of Equity Securities
In November 2014, in connection with the issuance of the Convertible Notes, we purchased 1.0 million shares of our common stock at $16.55 per share.
Dividends
We currently intend to retain our future earnings, if any, to finance the development and expansion of our business and, therefore, do not intend to pay cash dividends on our common stock for the foreseeable future. Any future determination to pay dividends will be at the discretion of our board of directors and will depend on our financial condition, results of operations, capital requirements, restrictions contained in any of our financing arrangements and such other factors as our board of directors may deem relevant. We have not previously declared or paid any cash dividends on our common stock.
Equity Compensation Plans
The table below sets forth the information as of December 31, 2014 for our equity compensation plan:
Plan Category | Number of securities to be issued upon exercise of outstanding options, warrants and rights | Weighted-average exercise price of outstanding options, warrants and rights | Number of securities remaining available for future issuance under equity compensation plans | |||||||
Equity compensation plan approved by security holders | 165,692 | $ | — | 1,748,713 | ||||||
A total of 2,000,000 of the Company’s common shares have been reserved for issuance under the LGI Homes, Inc. 2013 Equity Incentive Plan. There were 102,786 restricted stock units (RSUs) outstanding at December 31 2014, that were issued at a
27
$0.00 exercise price. At December 31, 2014, there were 62,906 performance-based restricted stock units (“PSUs”) outstanding that have been granted to certain members of management at a $0.00 exercise price. The number of shares of Company common stock underlying the PSUs that will be issued to the recipient may range from 0% to 200% of the base award depending on actual performance metrics as compared to the target performance metrics. See Note 12 "Stock Based Compensation" in the accompanying consolidated financial statements for a description of the plan.
Stock Performance Graph
This chart compares the cumulative total return on our common stock with that of the Standard & Poor's 500 Companies Stock Index (the “S&P 500 Index”) and the Standard & Poor's Homebuilders Select Industry Index (the “S&P Homebuilders Index”). The chart assumes $100.00 was invested at the close of market on November 7, 2013, the first day shares of our common stock traded on the NASDAQ Global Select Market, which was the day after we priced our initial public offering, in shares of our common stock, the S&P 500 Index and the S&P Homebuilders Index, and assumes the reinvestment of any dividends. The stock price performance on the following graph is not necessarily indicative of future stock price performance.
Comparison of Cumulative Total Return among LGI Homes, Inc. Common Stock, the S&P 500 Index, and the S&P Homebuilders Index for the year ended December 31, 2014 and from November 7, 2013 to December 31, 2013
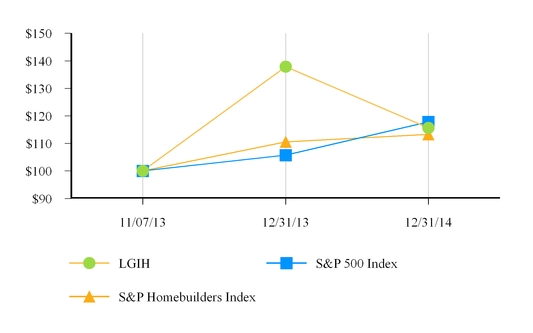
11/7/2013 | 12/31/2013 | 12/31/2014 | |||
LGIH | $100.00 | $137.91 | $115.66 | ||
S&P 500 Index | $100.00 | $105.79 | $117.84 | ||
S&P Homebuilders Index | $100.00 | $110.54 | $113.33 | ||
28
ITEM 6. SELECTED FINANCIAL DATA
The following table presents our selected historical financial and operating data as of the dates and for the periods indicated.
The selected historical balance sheet and statement of operations information presented as of December 31, 2014 and 2013 and for the years ended December 31, 2014, 2013, 2012 and 2011 are derived from our audited historical consolidated financial statements. The following table should be read together with, and is qualified in its entirety by reference to, our historical consolidated financial statements and the accompanying notes included elsewhere in this Annual Report. The table should also be read together with “Management’s Discussion and Analysis of Financial Condition and Results of Operations.” For discussion of pro forma financial information for the years ended December 31, 2013 and 2012, please see “Management's Discussion and Analysis of Financial Condition and Results of Operations—Pro Forma Financial Information” and “Management's Discussion and Analysis of Financial Condition and Results of Operations—Supplemental Management's Discussion and Analysis”.
Year Ended December 31, | ||||||||||||||||
2014 | 2013 | 2012 | 2011 | |||||||||||||
(dollars in thousands, except share data and average home sales price) | ||||||||||||||||
Statement of Operations Data: | ||||||||||||||||
Revenues: | ||||||||||||||||
Home sales | $ | 383,268 | $ | 160,067 | $ | 73,820 | $ | 49,270 | ||||||||
Management and warranty fees | — | 2,729 | 2,401 | 1,186 | ||||||||||||
Total revenues | 383,268 | 162,796 | 76,221 | 50,456 | ||||||||||||
Expenses: | ||||||||||||||||
Cost of sales | 280,481 | 121,326 | 54,531 | 36,700 | ||||||||||||
Selling expenses | 36,672 | 15,769 | 7,269 | 4,884 | ||||||||||||
General and administrative | 23,744 | 13,604 | 6,096 | 5,126 | ||||||||||||
Income from unconsolidated joint ventures | — | (4,287 | ) | (1,526 | ) | (715 | ) | |||||||||
Operating income | 42,371 | 16,384 | 9,851 | 4,461 | ||||||||||||
Interest expense, net | — | 51 | 1 | 28 | ||||||||||||
Gain on remeasurement of interests in LGI/GTIS Joint Ventures | — | (6,446 | ) | — | — | |||||||||||
Other income, net | (708 | ) | (24 | ) | (173 | ) | (204 | ) | ||||||||
Net income before income taxes | 43,079 | 22,803 | 10,023 | 4,637 | ||||||||||||
Income tax provision | 14,868 | 1,066 | 155 | 125 | ||||||||||||
Net income | 28,211 | 21,737 | 9,868 | 4,512 | ||||||||||||
(Income) loss attributable to non-controlling interests | — | 590 | (163 | ) | (1,162 | ) | ||||||||||
Net income attributable to owners | $ | 28,211 | $ | 22,327 | $ | 9,705 | $ | 3,350 | ||||||||
Basic earnings per share (1) | $ | 1.37 | $ | 0.34 | ||||||||||||
Diluted earnings per share (1) | $ | 1.33 | $ | 0.34 | ||||||||||||
Other Financial and Operating Data: | ||||||||||||||||
Active communities at end of year | 39 | 25 | 10 | 5 | ||||||||||||
Home closings | 2,356 | 1,062 | 536 | 376 | ||||||||||||
Average sales price of homes closed (in whole dollars) | $ | 162,677 | $ | 150,722 | $ | 137,724 | $ | 131,037 | ||||||||
Gross margin (2) | $ | 102,787 | $ | 38,741 | $ | 19,289 | $ | 12,570 | ||||||||
Gross margin % (3) | 26.8 | % | 24.2 | % | 26.1 | % | 25.5 | % | ||||||||
Adjusted gross margin (4) | $ | 108,111 | $ | 43,371 | $ | 20,236 | $ | 14,033 | ||||||||
Adjusted gross margin % (3)(4) | 28.2 | % | 27.1 | % | 27.4 | % | 28.5 | % | ||||||||
Adjusted EBITDA (5) | $ | 48,357 | $ | 21,309 | $ | 10,983 | $ | 6,005 | ||||||||
Adjusted EBITDA margin % (3)(5) | 12.6 | % | 13.3 | % | 14.9 | % | 12.2 | % | ||||||||
29
December 31, | ||||||||||||||||
2014 | 2013 | 2012 | 2011 | |||||||||||||
Balance Sheet Data (as of end of year): | (in thousands) | |||||||||||||||
Cash and cash equivalents | $ | 31,370 | $ | 54,069 | $ | 7,069 | $ | 5,106 | ||||||||
Real estate inventory | $ | 367,908 | $ | 141,983 | $ | 28,489 | $ | 12,526 | ||||||||
Goodwill and intangibles, net | $ | 12,481 | $ | 12,728 | $ | — | $ | — | ||||||||
Total assets | $ | 438,127 | $ | 221,010 | $ | 45,556 | $ | 23,513 | ||||||||
Notes payable | $ | 2,685 | $ | — | $ | 14,969 | $ | 6,415 | ||||||||
Total liabilities | $ | 255,628 | $ | 56,636 | $ | 20,345 | $ | 8,878 | ||||||||
Total equity | $ | 182,499 | $ | 164,374 | $ | 25,211 | $ | 14,635 | ||||||||
(1) | Earnings per share is presented for the year ended December 31, 2014 and the period from November 13, 2013 (date of closing of IPO) to December 31, 2013. See Note 11-“Equity” to our consolidated financial statements included in Part II, Item 8 of this Annual Report of this Form 10-K for calculation of earnings per share. |
(2) | Gross margin is home sales revenues less cost of sales. |
(3) | Calculated as a percentage of home sales revenues. |
(4) | Adjusted gross margin is a non-GAAP financial measure used by management as a supplemental measure in evaluating operating performance. We define adjusted gross margin as gross margin less capitalized interest and adjustments resulting from the application of purchase accounting included in the cost of sales. Our management believes this information is useful because it isolates the impact that capitalized interest and purchase accounting adjustments have on gross margin. However, because adjusted gross margin information excludes capitalized interest and purchase accounting adjustment, which have real economic effects and could impact our results, the utility of adjusted gross margin information as a measure of our operating performance may be limited. In addition, other companies may not calculate adjusted gross margin information in the same manner that we do. Accordingly, adjusted gross margin information should be considered only as a supplement to gross margin information as a measure of our performance. Please see “Management's Discussion and Analysis of Financial Condition and Results of Operations—Non-GAAP Measures—Adjusted Gross Margin” for a reconciliation of adjusted gross margin to gross margin, which is the GAAP financial measure that our management believes to be most directly comparable. |
(5) | Adjusted EBITDA is a non-GAAP financial measure used by management as a supplemental measure in evaluating operating performance. We define adjusted EBITDA as net income before (i) interest expense, (ii) income taxes, (iii) depreciation and amortization, (iv) capitalized interest charged to the cost of sales, (v) other income, net and (vi) adjustments resulting from the application of purchase accounting. Our management believes that the presentation of adjusted EBITDA provides useful information to investors regarding our results of operations because it assists both investors and management in analyzing and benchmarking the performance and value of our business. Adjusted EBITDA provides an indicator of general economic performance that is not affected by fluctuations in interest rates or effective tax rates, levels of depreciation or amortization and items considered to be non-recurring. Accordingly, our management believes that this measurement is useful for comparing general operating performance from period to period. Other companies may define adjusted EBITDA differently and, as a result, our measure of adjusted EBITDA may not be directly comparable to adjusted EBITDA of other companies. Although we use adjusted EBITDA as a financial measure to assess the performance of our business, the use of adjusted EBITDA is limited because it does not include certain costs, such as interest and taxes, necessary to operate our business. Adjusted EBITDA should be considered in addition to, and not as a substitute for, net income in accordance with GAAP as a measure of performance. Our presentation of adjusted EBITDA should not be construed as an indication that our future results will be unaffected by unusual or nonrecurring items. Our adjusted EBITDA is limited as an analytical tool, and you should not consider it in isolation or as a substitute for analysis of our results as reported under GAAP. Please see “Management's Discussion and Analysis of Financial Condition and Results of Operations—Non-GAAP Measures—Adjusted EBITDA” for a reconciliation of adjusted EBITDA to net income, which is the GAAP financial measure that our management believes to be most directly comparable. |
30
ITEM 7. MANAGEMENT’S DISCUSSION AND ANALYSIS OF FINANCIAL CONDITION AND RESULTS OF OPERATIONS
For purposes of this Management’s Discussion and Analysis of Financial Condition and Results of Operation, references to “we,” “our,” “us” or similar terms when used in a historical context refer to LGI Homes, Inc. and its subsidiaries. See Note 1 “Organization and Business—Initial Public Offering and Reorganization Transactions” and Note 2 “Acquisitions” to our consolidated financial statements included in Part II, Item 8 of this Annual Report on Form 10-K for more information regarding the reorganization transactions, the initial public offering and our acquisitions of our joint venture partners' interests in the LGI/GTIS Joint Ventures.
Key Results
Key financial results as of and for the year ended December 31, 2014, as compared to the year ended December 31, 2013, were as follows:
• | Homes closed increased 121.8% to 2,356 homes from 1,062 homes with an increase in the average sales price of our homes of 7.9% to $162,677. On a pro forma basis, homes closed increased 45.7% to 2,356 homes from 1,617 homes with an increase in the average sales price of our homes of 9.2% to $162,677. |
• | Home sales revenues increased 139.4% to $383.3 million from $160.1 million and on a pro forma basis, revenues increased 59.1% from $241.0 million. |
• | Gross margin as a percentage of home sales revenues increased to 26.8% from 24.2%. On a pro forma basis, gross margin as a percentage of home sales revenues increased to 26.8% from 25.4%. |
• | Adjusted gross margin as a percentage of home sales revenues increased to 28.2% from 27.1%. On a pro forma basis, adjusted gross margin as a percentage of home sales revenues increased to 28.2% from 27.3%. |
• | Net income before income taxes increased 88.9% to $43.1 million from $22.8 million and increased 87.9% on a pro forma basis. |
• | Adjusted EBITDA margin as a percentage of home sales revenues decreased to 12.6% from 13.3%. On a pro forma basis, adjusted EBITDA margin as a percentage of home sales revenues increased to 12.6% from 11.8%. |
• | Active communities at the end of 2014 increased from 25 to 39. Reflected in this increase are an additional 5 active communities in our Southeast division, an additional 4 in our Southwest division, another 3 in our Florida division, and 2 in our Texas division. |
• | Total owned and controlled lots increased 33.5% to 19,883 lots at December 31, 2014 from 14,895 lots at December 31, 2013. |
Recent Developments
During November 2014, we launched our new Terrata Homes brand at our Potranco Ranch community in San Antonio, Texas. Our Terrata Homes brand allows us to leverage our systems and process approach, including our world class customer centric sales system, to deliver move-in ready homes with standardized features at a higher price point, with expected sales prices at $350,000 and up for homes larger than 2,500 square feet. We closed our first Terrata Home sale during January 2015. Our second Terrata Homes community is located in Lancaster, South Carolina, 30 miles south of Charlotte, North Carolina, and is expected to open for sales in mid-2015.
In November 2014, we issued $85.0 million aggregate principal amount of our 4.25% Convertible Notes due 2019 (the “Convertible Notes”). The Convertible Notes mature on November 15, 2019 and bear interest at a rate of 4.25%, payable semiannually each year, beginning on May 15, 2015. Prior to May 15, 2019, the Convertible Notes will be convertible only upon satisfaction of any of the specified conversion events. On or after May 15, 2019, note holders can convert their Convertible Notes at any time at their option.
As issued, the conversion of the Convertible Notes may only be settled in stock. Upon receipt of stockholder approval of the flexible settlement provisions of the Convertible Notes, the Convertible Notes will be convertible into cash, shares of common stock, or a combination thereof, at our election. We have sole discretion to request stockholder approval for the flexible settlement feature, however there can be no assurance that the stockholders will approve the flexible settlement feature. The initial conversion rate is 46.4792 shares of our common stock for each $1,000 principal amount the Convertible Notes, which represents an initial conversion price of approximately $21.52 per share of our common stock. The conversion rate is subject to adjustments upon the occurrence of certain specified events.
Notes payable in our accompanying consolidated financial statements include $76.5 million which is the fair value of the $85.0 million aggregate principal amount of Convertible Notes issued; the fair value was determined using a discount rate of 6.6%
31
based on the rate of return investors would require for a similar liability, and reflects an $8.5 million discount. $5.5 million of the remaining proceeds was recorded to additional paid-in capital to reflect the equity component of the Convertible Notes and $3.0 million was recorded as a deferred tax liability. The carrying amount of the Convertible Notes is being accreted over the term to maturity. The net proceeds from the offering were approximately $82.0 million. Of the $3.0 million of debt issuance costs, $2.7 million were allocated to the liability component and the remaining $0.3 million was allocated as an offset to the equity component of the Convertible Notes.
Concurrent with the issuance of the Convertible Notes, we used approximately $16.6 million of the net proceeds to repurchase 1.0 million shares of our common stock.
On October 2, 2014, we acquired certain real estate assets owned by Oakmont in Charlotte, North Carolina for a purchase price of approximately $17.3 million, consisting of approximately $15.2 million, in cash and an earnout to be paid based on home closings through December 31, 2017.
32
Results of Operations
The following table sets forth our results of operations for the periods indicated:
Year Ended December 31, | ||||||||||||
2014 | 2013 | 2012 | ||||||||||
(dollars in thousands, except share data and average home sales price) | ||||||||||||
Statement of Income Data: | ||||||||||||
Revenues: | ||||||||||||
Home sales | $ | 383,268 | $ | 160,067 | $ | 73,820 | ||||||
Management and warranty fees | — | 2,729 | 2,401 | |||||||||
Total revenues | 383,268 | 162,796 | 76,221 | |||||||||
Expenses: | ||||||||||||
Cost of sales | 280,481 | 121,326 | 54,531 | |||||||||
Selling expenses | 36,672 | 15,769 | 7,269 | |||||||||
General and administrative | 23,744 | 13,604 | 6,096 | |||||||||
Income from unconsolidated joint ventures | — | (4,287 | ) | (1,526 | ) | |||||||
Operating income | 42,371 | 16,384 | 9,851 | |||||||||
Interest expense, net | — | 51 | 1 | |||||||||
Gain on remeasurement of interests in LGI/GTIS Joint Ventures | — | (6,446 | ) | — | ||||||||
Other income, net | (708 | ) | (24 | ) | (173 | ) | ||||||
Net income before income taxes | 43,079 | 22,803 | 10,023 | |||||||||
Income tax provision | 14,868 | 1,066 | 155 | |||||||||
Net income | 28,211 | 21,737 | 9,868 | |||||||||
(Income) loss attributable to non-controlling interests | — | 590 | (163 | ) | ||||||||
Net income attributable to owners | $ | 28,211 | $ | 22,327 | $ | 9,705 | ||||||
Basic earnings per share (1) | $ | 1.37 | $ | 0.34 | ||||||||
Diluted earnings per share (1) | $ | 1.33 | $ | 0.34 | ||||||||
Other Financial and Operating Data: | ||||||||||||
Active communities at end of year | 39 | 25 | 10 | |||||||||
Home closings | 2,356 | 1,062 | 536 | |||||||||
Average sales price of homes closed (in whole dollars) | $ | 162,677 | $ | 150,722 | $ | 137,724 | ||||||
Gross margin (2) | $ | 102,787 | $ | 38,741 | $ | 19,289 | ||||||
Gross margin % (3) | 26.8 | % | 24.2 | % | 26.1 | % | ||||||
Adjusted gross margin (4) | $ | 108,111 | $ | 43,371 | $ | 20,236 | ||||||
Adjusted gross margin % (3)(4) | 28.2 | % | 27.1 | % | 27.4 | % | ||||||
Adjusted EBITDA (5) | $ | 48,357 | $ | 21,309 | $ | 10,983 | ||||||
Adjusted EBITDA margin %(3)(5) | 12.6 | % | 13.3 | % | 14.9 | % | ||||||
(1) | Earnings per share is presented for the year ended December 31, 2014 and the period from November 13, 2013 (date of closing of IPO) to December 31, 2013. See Note 11-“Equity” to our consolidated financial statements included in Part II, Item 8 of this Annual Report for calculation of earnings per share. |
(2) | Gross margin is home sales revenues less cost of sales. |
(3) | Calculated as a percentage of home sales revenues. |
(4) | Adjusted gross margin is a non-GAAP financial measure used by management as a supplemental measure in evaluating operating performance. We define adjusted gross margin as gross margin less capitalized interest and adjustments resulting from the application of purchase accounting included in the cost of sales. Our management believes this information is useful because it isolates the impact |
33
that capitalized interest and purchase accounting adjustments have on gross margin. However, because adjusted gross margin information excludes capitalized interest and purchase accounting adjustment, which have real economic effects and could impact our results, the utility of adjusted gross margin information as a measure of our operating performance may be limited. In addition, other companies may not calculate adjusted gross margin information in the same manner that we do. Accordingly, adjusted gross margin information should be considered only as a supplement to gross margin information as a measure of our performance. Please see “—Non-GAAP Measures—Adjusted Gross Margin” for a reconciliation of adjusted gross margin to gross margin, which is the GAAP financial measure that our management believes to be most directly comparable.
(5) | Adjusted EBITDA is a non-GAAP financial measure used by management as a supplemental measure in evaluating operating performance. We define adjusted EBITDA as net income before (i) interest expense, (ii) income taxes, (iii) depreciation and amortization, (iv) capitalized interest charged to the cost of sales, (v) other income, net and (vi) adjustments resulting from the application of purchase accounting. Our management believes that the presentation of adjusted EBITDA provides useful information to investors regarding our results of operations because it assists both investors and management in analyzing and benchmarking the performance and value of our business. Adjusted EBITDA provides an indicator of general economic performance that is not affected by fluctuations in interest rates or effective tax rates, levels of depreciation or amortization and items considered to be non-recurring. Accordingly, our management believes that this measurement is useful for comparing general operating performance from period to period. Other companies may define adjusted EBITDA differently and, as a result, our measure of adjusted EBITDA may not be directly comparable to adjusted EBITDA of other companies. Although we use adjusted EBITDA as a financial measure to assess the performance of our business, the use of adjusted EBITDA is limited because it does not include certain costs, such as interest and taxes, necessary to operate our business. Adjusted EBITDA should be considered in addition to, and not as a substitute for, net income in accordance with GAAP as a measure of performance. Our presentation of adjusted EBITDA should not be construed as an indication that our future results will be unaffected by unusual or nonrecurring items. Our adjusted EBITDA is limited as an analytical tool, and you should not consider it in isolation or as a substitute for analysis of our results as reported under GAAP. Please see “—Non-GAAP Measures—Adjusted EBITDA” for a reconciliation of adjusted EBITDA to net income, which is the GAAP financial measure that our management believes to be most directly comparable. |
34
Year Ended December 31, 2014 Compared to Year Ended December 31, 2013
Homes Sales. Our home sales revenues and closings by division for the year ended December 31, 2014 and 2013 were as follows (dollars in thousands):
Year Ended December 31, | ||||||||||||||
2014 | 2013 | |||||||||||||
Revenues | Closings | Revenues | Closings | |||||||||||
Texas | $ | 255,355 | 1,575 | $ | 133,831 | 892 | ||||||||
Southwest | 45,725 | 273 | 18,214 | 118 | ||||||||||
Florida | 43,374 | 255 | 6,171 | 40 | ||||||||||
Southeast | 38,814 | 253 | 1,851 | 12 | ||||||||||
Total home sales | $ | 383,268 | 2,356 | $ | 160,067 | 1,062 | ||||||||
Home sales revenues for the year ended December 31, 2014 were $383.3 million, an increase of $223.2 million, or 139.4%, from $160.1 million for the year ended December 31, 2013. The increase in home sales revenues is primarily due to a 121.8% increase in homes closed and an increase in the average selling price per home during the year ended December 31, 2014 as compared to the year ended December 31, 2013. We closed 2,356 homes during the year ended December 31, 2014, as compared to 1,062 homes closed during the year ended December 31, 2013. This increase in home closings was largely due to more active communities in 2014 and the GTIS acquisition that was completed in November 2013. The average selling price per home closed during the year ended December 31, 2014 was $162,677, an increase of $11,955, or 7.9%, from the average selling price per home of $150,722 for the year ended December 31, 2013. This increase in the average selling price per home was primarily due to changes in product mix and a generally favorable pricing environment.
Management and Warranty Fees. Management and warranty fees for the year ended December 31, 2013 were $2.7 million. Management and warranty fees were received from the LGI/GTIS Joint Ventures through November 2013 when the Company acquired the joint venture interests that it did not own prior to such date. Total home closings on a combined basis for the LGI/GTIS Joint Ventures were 555 for the period January 1, 2013 to November 13, 2013. There were no management and warranty fees for the year ended December 31, 2014 as the LGI/GTIS Joint Ventures have been consolidated since the GTIS Acquisitions.
Cost of Sales and Gross Margin (home sales revenues less cost of sales). Cost of sales increased for the year ended December 31, 2014 to $280.5 million, an increase of $159.2 million, or 131.2%, from $121.3 million for the year ended December 31, 2013. This increase is primarily due to a 121.8% increase in homes closed during 2014 as compared to 2013. Gross margin for the year ended December 31, 2014 was $102.8 million, an increase of $64.0 million, or 165.3%, from $38.7 million for the year ended December 31, 2013. Gross margin as a percentage of home sales revenues was 26.8% for the year ended December 31, 2014 and 24.2% for the year ended December 31, 2013. The increase in gross margin as a percentage of home sales revenues reflects the higher average homes sales prices offset by increased construction costs and higher lot costs for the year ended December 31, 2014 as compared to the year ended December 31, 2013.
Selling Expenses. Selling expenses as a percentage of home sales revenues were 9.6% and 9.9% for the years ended December 31, 2014 and 2013, respectively. The decrease of selling expenses as a percentage of home sales revenues was primarily due to the operating leverage realized from our salaried sales personnel during the year ended December 31, 2014 compared to the year ended December 31, 2013. Selling expenses for the year ended December 31, 2014 were $36.7 million, an increase of $20.9 million, or 132.6%, from $15.8 million for the year ended December 31, 2013. Sales commissions increased to $14.7 million for the year ended December 31, 2014 from $6.0 million during that same period in the prior year largely due to a 121.8% increase in homes closed during the year ended December 31, 2014 as compared to the year ended December 31, 2013. Advertising and direct mail costs increased to $8.6 million during the year ended December 31, 2014 from $3.3 million for the same period in the prior year primarily due to the increase in the number of active communities in 2014 as compared to 2013.
General and Administrative. General and administrative expenses as a percentage of home sales revenues were 6.2% and 8.5% for the years ended December 31, 2014 and 2013, respectively. The decrease in general and administrative expenses as a percentage of home sales revenues reflects leverage realized from the increase in home sales revenues in 2014 and less accounting and professional expenses incurred during 2014 as compared to those incurred in 2013 in connection with the Reorganization Transactions and financial reporting for the IPO. General and administrative expenses for the year ended December 31, 2014 were $23.7 million, an increase of $10.1 million, or 74.5%, from $13.6 million for the year ended December 31, 2013. The increase in the amount of general and administrative expenses during the year ended December 31, 2014 as compared to the year ended
35
December 31, 2013 is primarily attributable to additional employees added to support the increased number of active communities and the higher number of home closings.
Income from unconsolidated joint ventures. Our share of income from the LGI/GTIS Joint Ventures for the year ended December 31, 2013 was $4.3 million. We acquired our joint venture partner's interests in the LGI/GTIS Joint Ventures on November 13, 2013 in the GTIS Acquisitions.
Gain on remeasurement of interests in LGI/GTIS Joint Ventures. A gain of $6.4 million was recognized by the Company for the year ended December 31, 2013 on the remeasurement of our Predecessor's equity interests in the LGI/GTIS Joint Ventures in connection with the GTIS Acquisitions.
Other Income. Other income, net of other expenses was $0.7 million for the year ended December 31, 2014, an increase of $0.7 million from $0.02 million for the year ended December 31, 2013. The increase in other income reflects the gain realized from the sale of land not directly associated with our core homebuilding operations.
(Income) loss attributable to non-controlling interests. The loss attributable to non-controlling interests for the year ended December 31, 2013 was $0.6 million. During the year ended December 31, 2013, the losses are related to the initial operations of LGI Fund III Holdings, LLC formed in March 2013.
Operating Income and Net Income. Operating income for the year ended December 31, 2014 was $42.4 million, an increase of $26.0 million, or 158.6%, from $16.4 million for the year ended December 31, 2013. Net income for the year ended December 31, 2014 was $28.2 million, an increase of $6.5 million, or 30.0%, from $21.7 million for the year ended December 31, 2013. The increases are primarily attributed to a 121.8% increase in homes closed during 2014 as compared to 2013, and offset by the (i) $6.4 million gain on remeasurement of our interests in the LGI/GTIS Joint Ventures in connection with the GTIS Acquisitions recorded in 2013, (ii) $4.3 million of our share of income from the LGI/GTIS Joint Ventures in 2013, and (iii) increase in income tax expense reported in 2014.
Year Ended December 31, 2013 Compared to the Year Ended December 31, 2012
Homes Sales. Our home sales revenues and closings by division for the year ended December 31, 2013 and 2012 were as follows (dollars in thousands):
Year Ended December 31, 2013 | Year Ended December 31, 2012 | |||||||||||||
Revenue | Closings | Revenue | Closings | |||||||||||
Texas | $ | 133,831 | 892 | $ | 58,741 | 433 | ||||||||
Southwest | 18,214 | 118 | 15,079 | 103 | ||||||||||
Florida | 6,171 | 40 | — | — | ||||||||||
Southeast | 1,851 | 12 | — | — | ||||||||||
Total home sales | $ | 160,067 | 1,062 | $ | 73,820 | 536 | ||||||||
Home sales revenues for the year ended December 31, 2013 were $160.1 million, an increase of $86.2 million, or 116.8%, from $73.8 million for the year ended December 31, 2012. Home sales revenues represented approximately 98.3% and 96.8% of our total revenues for the year ended December 31, 2013 and 2012, respectively. The increase in home sales revenues is primarily due to a 98.1% increase in homes closed and an increase in the average selling price per home during the year ended December 31, 2013 as compared to the year ended December 31, 2012. The average selling price per home closed during the year ended December 31, 2013 was $150,722, an increase of $12,998, or 9.4%, from the average selling price per home of $137,724 for the year ended December 31, 2012. We closed 1,062 homes during the year ended December 31, 2013, as compared to 536 homes closed during the year ended December 31, 2012.
Management and Warranty Fees. Management and warranty fees for the year ended December 31, 2013 were $2.7 million, as compared to $2.4 million for the year ended December 31, 2012. The increase in management and warranty fees is primarily attributable to an increase in the number of active communities and the geographic expansion of the LGI/GTIS Joint Ventures’ operations during 2013. Total home closings on a combined basis for the LGI/GTIS Joint Ventures were 686 and 526 for the years ended December 31, 2013 and 2012, respectively.
36
Cost of Sales and Gross Margin (home sales revenues less cost of sales). Cost of sales increased for the year ended December 31, 2013 to $121.3 million, an increase of $66.8 million, or 122.5%, from $54.5 million for the year ended December 31, 2012. This increase is primarily due to a 98.1%, increase in homes closed during 2013 as compared to 2012. Gross margin for the year ended December 31, 2013 was $38.7 million, an increase of $19.5 million, or 100.8%, from $19.3 million for the year ended December 31, 2012. Gross margin as a percentage of home sales revenues was 24.2% for the year ended December 31, 2013 and 26.1% for the year ended December 31, 2012. The decrease in gross margin as a percentage of home sales revenues reflects an increase in construction costs and higher developed lot costs for 2013 as compared to 2012; these construction and developed lot costs were partially offset by higher average homes sales prices, investments in new markets, and the transition between communities within existing markets.
Selling Expenses. Selling expenses as a percentage of home sales revenues were 9.9% and 9.8% for the years ended December 31, 2013 and 2012, respectively. The increase of selling expenses as a percentage of home sales revenues was primarily due to startup expenses related to new community openings, outside commissions, and direct mail and internet marketing. Selling expenses for the year ended December 31, 2013 were $15.8 million, an increase of $8.5 million, or 116.9%, from $7.3 million for the year ended December 31, 2012. This increase is primarily due to a 98.1%, increase in homes closed during 2013 as compared to 2012 and the increase in the number of active communities for 2013 as compared to 2012. Sales commissions increased to $5.3 million from $2.3 million and advertising and direct mail costs increased to $3.3 million from $1.8 million for the year ended December 31, 2013 as compared to the year ended December 31, 2012, respectively.
General and Administrative. General and administrative expenses for the year ended December 31, 2013 were $13.6 million, an increase of $7.5 million, or 123.2%, from $6.1 million for the year ended December 31, 2012. The increase in general and administrative expenses is partially due to the higher number of home closings and active communities in 2013 as compared to 2012. As a result of the increased number of active communities, we hired more employees and acquired additional office space. In addition, approximately $3.2 million of the $7.5 million increase during 2013 was attributable to accounting and professional fees and expenses incurred in connection with the Reorganization Transactions and financial reporting for the IPO.
Income from unconsolidated joint ventures. Our share of income from the LGI/GTIS Joint Ventures for the year ended December 31, 2013 was $4.3 million, as compared to $1.5 million for the year ended December 31, 2012. The increase is primarily attributed to our priority return determined based on cumulative cash distributions as provided for in the joint venture agreements. During the year ended December 31, 2013, three of the LGI/GTI Joint Ventures paid sufficient cumulative cash distributions to the members of the respective joint ventures such that $2.7 million in priority returns were received.
Gain on remeasurement of interests in LGI/GTIS Joint Ventures. A gain of $6.4 million was recognized by the Company for the year ended December 31, 2013 on the remeasurement of our Predecessor's equity interests in the LGI/GTIS Joint Ventures in connection with the GTIS Acquisitions.
(Income) loss attributable to non-controlling interests. The loss attributable to non-controlling interests for the year ended December 31, 2013 was $0.6 million, as compared to $0.2 million of income attributable to non-controlling interests for the year ended December 31, 2012. During the year ended December 31, 2013, the losses are related to the initial operations of LGI Fund III Holdings, LLC formed in March 2013. During the year ended December 31, 2012, we recognized final project income related to the LGI Homes Sterling Lakes, LLC project which was closed out during 2012.
Operating Income and Net Income. Operating income for the year ended December 31, 2013 was $16.4 million, an increase of $6.5 million, or 66.3%, from $9.9 million for the year ended December 31, 2012. Net income for the year ended December 31, 2013 was $21.7 million, an increase of $11.9 million, or 120.3%, from $9.9 million for the year ended December 31, 2012. The increases are primarily attributed to (i) the $6.4 million gain on remeasurement of our interests in the LGI/GTIS Joint Ventures in connection with the GTIS Acquisitions, (ii) $2.7 million in promoted earnings recognized from the LGI/GTIS Joint Ventures, and (iii) a 98.1% increase in homes closed during 2013 as compared to 2012.
.
37
Unaudited Pro Forma Financial Information
The following unaudited pro forma statements of operations have been developed by applying pro forma adjustments to our audited statements of operations for the years ended December 31, 2013 and 2012 and audited financial statements of the LGI/GTIS Joint Ventures. The unaudited pro forma statements of operations for the year ended December 31, 2013 and 2012 give effect to the GTIS Acquisitions as if they had occurred on January 1, 2012.
The pro forma adjustments are based upon certain assumptions that we believe are reasonable under the circumstances. The pro forma financial data is presented for informational purposes only. The pro forma financial data does not purport to represent what our results of operations would have been had the GTIS Acquisitions actually occurred on the date indicated and does not purport to project our results of operations for any future period. The pro forma financial statements should be read in conjunction with the information contained in other sections of this Annual Report including “Selected Financial Data,” in our historical audited financial statements and related notes thereto, and other sections of this “Management’s Discussion and Analysis of Financial Condition and Results of Operations” appearing elsewhere in this Annual Report. All pro forma adjustments and their underlying assumptions are described more fully in the notes to our pro forma statements of operations.
The unaudited pro forma financial information has been prepared to give effect to the GTIS Acquisitions in accordance with ASC Topic 805, "Business Combinations", ("ASC 805"). A fair value step-up adjustment of approximately $7.4 million was recorded to the real estate inventory and certain lot option contracts in connection with the GTIS Acquisitions. The pro forma adjustments do not reflect cost of sales related to the step-up adjustment since the step-up does not have a continuing impact on our results of operations due to the short-term impact on our financial performance.
All pro forma adjustments and their underlying assumptions are described more fully in the notes to the pro forma statements of operations.
38
Unaudited Pro Forma Statement of Operations
for the Year Ended December 31, 2013
LGI Homes, Inc. | LGI/GTIS Joint Ventures (1) | Adjustments | LGI Homes, Inc. Pro Forma | |||||||||||||
(dollars in thousands) | ||||||||||||||||
Revenues: | ||||||||||||||||
Home sales | $ | 160,067 | $ | 80,896 | $ | — | $ | 240,963 | ||||||||
Management and warranty fees | 2,729 | — | (2,729 | ) | (c) | — | ||||||||||
Total revenues | 162,796 | 80,896 | (2,729 | ) | 240,963 | |||||||||||
Expenses: | ||||||||||||||||
Cost of sales | 121,326 | 58,718 | (213 | ) | (c) | 179,831 | ||||||||||
Selling expenses | 15,769 | 7,279 | — | 23,048 | ||||||||||||
General and administrative | 13,604 | 3,906 | (2,300 | ) | (b)(c) | 15,210 | ||||||||||
Income from unconsolidated LGI/GTIS Joint Ventures | (4,287 | ) | — | 4,287 | (a) | — | ||||||||||
Operating income | 16,384 | 10,993 | (4,503 | ) | 22,874 | |||||||||||
Interest expense | 51 | — | — | 51 | ||||||||||||
Gain on remeasurement of interest in LGI/GTIS Joint Ventures | (6,446 | ) | — | 6,446 | (d) | — | ||||||||||
Other income, net | (24 | ) | (75 | ) | — | (99 | ) | |||||||||
Net income before income taxes | 22,803 | 11,068 | (10,949 | ) | 22,922 | |||||||||||
Income tax provision | 1,066 | 194 | — | 1,260 | ||||||||||||
Net income | 21,737 | 10,874 | (10,949 | ) | 21,662 | |||||||||||
Loss attributable to non-controlling interests | 590 | — | — | 590 | ||||||||||||
Net income attributable to owners | $ | 22,327 | $ | 10,874 | $ | (10,949 | ) | $ | 22,252 | |||||||
(1) | This column is a combination of the financial statements of LGI-GTIS Holdings, LLC, LGI-GTIS Holdings II, LLC, LGI-GTIS Holdings III, LLC and LGI-GTIS Holdings IV, LLC, for the period January 1, 2013 through November 13, 2013. |
Notes to Unaudited Pro Forma Statement of Operations for Year Ended December 31, 2013
(a) Eliminates our Predecessor’s equity in the income of the LGI/GTIS Joint Ventures.
(b) Reflects amortization of the $0.7 million marketing related intangible asset (i.e., trade name rights) recorded in the GTIS Acquisitions. The trade name rights have an estimated useful life of three years based upon the timing of the majority of the forecasted revenues to be earned over the remaining development cycle of the LGI/GTIS Joint Ventures’ communities. Amortization is recorded on a straight-line basis. Pro forma amortization expense was $0.2 million for the year ended December 31, 2013.
(c) Reflects the elimination of $2.7 million of management and warranty fees our Predecessor charged to the LGI/GTIS Joint Ventures during the period pursuant to certain management services agreements. The applicable management services agreements were terminated in connection with the GTIS Acquisitions. The corresponding charges of $2.5 million and $0.2 million were recorded to general and administrative expense and cost of sales, respectively, by the LGI/GTIS Joint Ventures.
(d) Represents the elimination of gain on remeasurement of our Predecessor's equity interests in the LGI/GTIS Joint Ventures in connection with the GTIS Acquisitions. The gain on remeasurement represents the Predecessor's equity interests at fair value less the carrying value of Predecessor's equity interest using the equity method of accounting.
39
Unaudited Pro Forma Statement of Operations
for the Year Ended December 31, 2012
LGI Homes, Inc. | LGI/GTIS Joint Ventures (1) | Adjustments | LGI Homes, Inc. Pro Forma | |||||||||||||
(dollars in thousands) | ||||||||||||||||
Revenues: | ||||||||||||||||
Home sales | $ | 73,820 | $ | 69,558 | $ | — | $ | 143,378 | ||||||||
Management and warranty fees | 2,401 | — | (2,401 | ) | (c) | — | ||||||||||
Total revenues | 76,221 | 69,558 | (2,401 | ) | 143,378 | |||||||||||
Expenses: | ||||||||||||||||
Cost of sales | 54,531 | 49,830 | (132 | ) | (c) | 104,229 | ||||||||||
Selling expenses | 7,269 | 6,101 | — | 13,370 | ||||||||||||
General and administrative | 6,096 | 3,306 | (2,023 | ) | (b)(c) | 7,379 | ||||||||||
Income from unconsolidated LGI/GTIS Joint Ventures | (1,526 | ) | — | 1,526 | (a) | — | ||||||||||
Operating income | 9,851 | 10,321 | (1,772 | ) | 18,400 | |||||||||||
Interest expense | 1 | — | — | 1 | ||||||||||||
Other income, net | (173 | ) | (42 | ) | — | (215 | ) | |||||||||
Net income before income taxes | 10,023 | 10,363 | (1,772 | ) | 18,614 | |||||||||||
Income tax provision | 155 | 187 | — | 342 | ||||||||||||
Net income | 9,868 | 10,176 | (1,772 | ) | 18,272 | |||||||||||
Income attributable to non-controlling interests | (163 | ) | — | — | (163 | ) | ||||||||||
Net income attributable to owners | $ | 9,705 | $ | 10,176 | $ | (1,772 | ) | $ | 18,109 | |||||||
(1) | This column is a combination of the financial statements of LGI-GTIS Holdings, LLC, LGI-GTIS Holdings II, LLC, LGI-GTIS Holdings III, LLC and LGI-GTIS Holdings IV, LLC,. |
Notes to Unaudited Pro Forma Statement of Operations for Year Ended December 31, 2012
(a) Eliminates our Predecessor’s equity in the income of the LGI/GTIS Joint Ventures.
(b) Reflects amortization of the $0.7 million marketing related intangible asset (i.e., trade name rights) recorded in the GTIS Acquisitions. The trade name rights have an estimated useful life of three years based upon the timing of the majority of the forecasted revenues to be earned over the remaining development cycle of the LGI/GTIS Joint Ventures’ communities. Amortization is recorded on a straight-line basis. Pro forma amortization expense was $0.2 million for the year ended December 31, 2012.
(c) Reflects the elimination of $2.4 million of management and warranty fees our Predecessor charged to the LGI/GTIS Joint Ventures during the period pursuant to certain management services agreements. The applicable management services agreements were terminated in connection with the GTIS Acquisitions. The corresponding charges of $2.3 million and $0.1 million were recorded to general and administrative expense and cost of sales, respectively, by the LGI/GTIS Joint Ventures.
40
Supplemental Management's Discussion and Analysis
Year Ended December 31, 2014 Compared to Pro Forma Year Ended December 31, 2013
Pro forma Homes Sales. Our home sales revenues and closings by division for the year ended December 31, 2014 and pro forma home sales revenues and closings by division for the year ended December 31, 2013 were as follows (dollars in thousands, except average sales price):
Pro Forma | ||||||||||||||
Year Ended December 31, 2014 | Year Ended December 31, 2013 | |||||||||||||
Revenues | Closings | Revenues | Closings | |||||||||||
Texas | $ | 255,355 | 1,575 | $ | 201,121 | 1,358 | ||||||||
Southwest | 45,725 | 273 | 26,191 | 170 | ||||||||||
Florida | 43,374 | 255 | 11,800 | 77 | ||||||||||
Southeast | 38,814 | 253 | 1,851 | 12 | ||||||||||
Total home sales | $ | 383,268 | 2,356 | $ | 240,963 | 1,617 | ||||||||
Other Financial and Operating Data: | 2014 | 2013 | ||||||
Active communities at end of period | 39 | 25 | ||||||
Average sales price of homes closed | $ | 162,677 | $ | 149,018 | ||||
Gross margin (1) | $ | 102,787 | $ | 61,132 | ||||
Gross margin % (2) | 26.8 | % | 25.4 | % | ||||
(1) | Gross margin is home sales revenues less cost of sales. |
(2) | Calculated as a percentage of home sales revenues. |
Home sales revenues for the year ended December 31, 2014 were $383.3 million, an increase of $142.3 million, or 59.1%, from pro forma home sales revenues of $241.0 million for the year ended December 31, 2013. The increase in home sales revenues is primarily due to a 45.7% increase in homes closed and an increase in the average home sales price per home during the year ended December 31, 2014 as compared to year ended December 31, 2013, on a pro forma basis. We closed 2,356 homes during the year ended December 31, 2014, an increase of 739 homes closed, or 45.7%, over the 1,617 homes closed on a pro forma basis for the year ended December 31, 2013. This increase was primarily due to more active communities in 2014. The average home sales price for the year ended December 31, 2014 was $162,677, an increase of $13,659, or 9.2%, from the pro forma average home sales price of $149,018 for year ended December 31, 2013. This increase was primarily due to changes in product mix and a generally favorable pricing environment.
Pro forma Cost of Sales and Gross Margin (pro forma home sales revenues less pro forma cost of sales). Cost of sales for the year ended December 31, 2014 was $280.5 million, an increase of $100.7 million, or 56.0%, from pro forma cost of sales of $179.8 million for the year ended December 31, 2013. This increase is primarily due to a 739-unit, or 45.7%, increase in homes closed for the year ended December 31, 2014 as compared to homes closed on a pro forma basis for the year ended December 31, 2013. Gross margin for the year ended December 31, 2014 was $102.8 million, an increase of $41.7 million, or 68.1%, from pro forma gross margin of $61.1 million for the year ended December 31, 2013. Gross margin as a percentage of home sales revenues was 26.8% for the year ended December 31, 2014 as compared to 25.4% for the year ended December 31, 2013, on a pro forma basis. The increase in gross margin as a percentage of home sales revenues reflects the higher average home sales prices for the year ended December 31, 2014 as compared to the year ended December 31, 2013, on a pro forma basis partially offset by increased construction costs and higher lot costs.
Pro forma Selling Expenses. Selling expenses as a percentage of home sales revenues were 9.6% in each of the years ended December 31, 2014 and 2013 (on a pro forma basis). Selling expenses for the year ended December 31, 2014 were $36.7 million, an increase of $13.6 million, or 59.1%, from pro forma selling expenses of $23.0 million for the year ended December 31, 2013. This increase is largely due to the higher number of home closings and the growth in active communities for the year ended December 31, 2014 as compared to the year ended December 31, 2013 on a pro forma basis. Sales commissions increased to $14.7 million from $8.0 million and advertising and direct mail costs increased to $8.6 million for the year ended December 31, 2014 from $4.9 million for the year ended December 31, 2013, on a pro forma basis.
41
Pro forma General and Administrative. General and administrative expenses as a percentage of home sales revenues were 6.2% for the year ended December 31, 2014 and pro forma general and administrative expenses as a percentage of pro forma home sales revenues were 6.3% for the year ended December 31, 2013. The decrease in general and administrative expenses as a percentage of home sales revenues reflects leverage from the increase in home sales revenues during 2014 and less accounting and professional fees during 2014 as compared to those incurred in 2013 in connection with the Reorganization Transactions and financial reporting for the IPO. General and administrative expenses for the year ended December 31, 2014 were $23.7 million, an increase of $8.5 million, or 56.1%, from pro forma general and administrative expenses of $15.2 million for the year ended December 31, 2013. The increase in the amount of general and administrative expenses for the year ended December 31, 2014 as compared to the pro forma amount for the year ended December 31, 2013 is primarily due to the higher number of home closings and active communities for 2014 as compared to 2013, on a pro forma basis. As a result of the increased number of active communities, we hired more employees during 2014.
Pro forma Operating Income and Pro forma Net Income. Operating income for the year ended December 31, 2014 was $42.4 million, an increase of $19.5 million, or 85.2%, from pro forma operating income of $22.9 million for the year ended December 31, 2013. Net income for the year ended December 31, 2014 was $28.2 million, an increase of $6.5 million, or 30.2%, from pro forma net income of $21.7 million for the year ended December 31, 2013. The increase in net income is primarily attributed to a 739-unit increase in homes closed and the increase in average home sales prices during the year 2014 as compared to 2013, on a pro forma basis, net of the increase in income tax expense recorded in the year ended December 31, 2014, and increased expenses associated with new communities.
Pro Forma Year Ended December 31, 2013 Compared to Pro Forma Year Ended December 31, 2012
Pro forma Homes Sales. Our pro forma home sales revenues and closings by division for the year ended December 31, 2013 and 2012, were as follows (dollars in thousands, unless otherwise stated):
Pro Forma Year Ended December 31, | ||||||||||||||
2013 | 2012 | |||||||||||||
Revenues | Closings | Revenues | Closings | |||||||||||
Texas | $ | 201,121 | 1,358 | $ | 128,299 | 959 | ||||||||
Southwest | 26,191 | 170 | 15,079 | 103 | ||||||||||
Florida | 11,800 | 77 | — | — | ||||||||||
Southeast | 1,851 | 12 | — | — | ||||||||||
Total home sales | $ | 240,963 | 1,617 | $ | 143,378 | 1,062 | ||||||||
Other Operating Financial Data | 2013 | 2012 | |||||||||
Active communities at end of period | 25 | 15 | |||||||||
Average sales price of homes closed (in whole dollars) | $ | 149,018 | $ | 135,008 | |||||||
Gross margin (1) | $ | 61,132 | $ | 39,149 | |||||||
Gross margin % (2) | 25.4 | % | 27.3 | % | |||||||
(1) | Gross margin is home sales revenue less cost of sales. |
(2) | Calculated as a percentage of home sales revenue. |
Pro forma home sales revenues for the year ended December 31, 2013 was $241.0 million, an increase of $97.6 million, or 68.1%, from $143.4 million for the year ended December 31, 2012. The increase in pro forma home sales revenues is primarily due to a 52.3% increase in pro forma homes closed and an increase in the pro forma average home sales price per home during 2013 as compared to 2012. We closed 1,617 homes during 2013, as compared to 1,062 homes closed during 2012. The pro forma average home sales price for 2013 was $149,018, an increase of $14,010, or 10.4%, from the pro forma average home sales price of $135,008 for 2012.
Pro forma Cost of Sales and Gross Margin (pro forma home sales revenue less pro forma cost of sales). Pro forma cost of sales for the year ended December 31, 2013 was 179.8 million, an increase of $75.6 million, or 72.5%, from $104.2 million for the year ended December 31, 2012. This increase is primarily due to a 555-unit, or 52.3%, increase in pro forma homes closed for the year ended December 31, 2013 as compared to the year ended December 31, 2012. In addition, pro forma costs of sales
42
for the year ended December 31, 2013, include $3.5 million related to the fair value step-up adjustment for real estate inventory sold in 2013 after the GTIS Acquisitions. Pro forma gross margin for 2013 was $61.1 million, an increase of $22.0 million, or 56.2%, from $39.1 million for 2012. Pro forma gross margin as a percentage of home sales revenues was 25.4% for 2013 as compared to 27.3% for 2012. The decrease in pro forma gross margin as a percentage of home sales revenues reflects the higher average home sales prices offset by increased construction costs, higher developed lot costs, investments in new markets, and the transition between communities within existing markets.
Pro forma Selling Expenses. Pro forma selling expenses as a percentage of pro forma home sales revenues were 9.6% and 9.3% for the years ended December 31, 2013 and 2012, respectively. The increase of pro forma selling expenses as a percentage of pro forma home sales revenue was primarily due to startup expenses related to new community openings, outside commissions, and direct mail and internet marketing. Pro forma selling expenses for 2013 were $23.0 million, an increase of $9.7 million, or 72.4%, from $13.4 million for 2012. This increase is largely due to the higher number of pro forma home closings and the growth in active communities for the year ended December 31, 2013 as compared to the year ended December 31, 2012. Pro forma sales commissions increased to $8.0 million from $4.7 million and pro forma advertising and direct mail costs were $4.9 million for the year ended December 31, 2013 as compared to $3.3 million for the year ended December 31, 2012, respectively.
Pro forma General and Administrative. Pro forma general and administrative expenses as a percentage of pro forma home sales revenues were 6.3% and 5.1% for the years ended December 31, 2013 and 2012, respectively. Pro forma general and administrative expenses for 2013 were $15.2 million, an increase of $7.8 million, or 106.1%, from $7.4 million for 2012. The increase in pro forma general and administrative expenses is partially due to the higher number of pro forma home closings and active communities for 2013 as compared to 2012. As a result of the increased number of active communities, we hired more employees and acquired additional office space. In addition, approximately $3.2 million of the $7.8 million increase during 2013, was attributable to accounting and professional fees and expenses incurred in connection with the Reorganization Transactions and financial reporting for the IPO.
Pro forma Operating Income and Pro forma Net Income. Pro forma operating income for the year ended December 31, 2013 was $22.9 million, an increase of $4.5 million, or 24.3%, from $18.4 million for the year ended December 31, 2012. Net income for the year ended December 31, 2013 was $21.7 million, an increase of $3.4 million, or 18.6%, from $18.3 million for the year ended December 31, 2012. The increase is primarily attributed to a 555-unit increase in pro forma homes closed during 2013 as compared to 2012, net of increased expenses associated with new communities and additional professional service fees and expenses incurred in connection with the Reorganization Transactions and financial reporting for the IPO.
Non-GAAP Measures
In addition to the results reported in accordance with U.S. GAAP, we have provided information in this Annual Report on Form 10-K relating to “adjusted gross margin,” and “adjusted EBITDA.”
Adjusted gross margin
Adjusted gross margin is a non-GAAP financial measure used by management as a supplemental measure in evaluating operating performance. We define adjusted gross margin as gross margin less capitalized interest and adjustments resulting from the application of purchase accounting included in the cost of sales. Our management believes this information is useful because it isolates the impact that capitalized interest and purchase accounting adjustments have on gross margin. However, because adjusted gross margin information excludes capitalized interest and purchase accounting adjustment, which have real economic effects and could impact our results, the utility of adjusted gross margin information as a measure of our operating performance may be limited. In addition, other companies may not calculate adjusted gross margin information in the same manner that we do. Accordingly, adjusted gross margin information should be considered only as a supplement to gross margin information as a measure of our performance.
The following table reconciles adjusted gross margin to gross margin, which is the GAAP financial measure that our management believes to be most directly comparable (dollars in thousands):
43
Pro Forma | ||||||||||||||||||||
Year Ended December 31, | Year Ended December 31, | |||||||||||||||||||
2014 | 2013 | 2012 | 2013 | 2012 | ||||||||||||||||
Home sales | $ | 383,268 | $ | 160,067 | $ | 73,820 | $ | 240,963 | $ | 143,378 | ||||||||||
Cost of sales | 280,481 | 121,326 | 54,531 | 179,831 | 104,229 | |||||||||||||||
Gross margin | 102,787 | 38,741 | 19,289 | 61,132 | 39,149 | |||||||||||||||
Purchase accounting adjustments (a) | 3,620 | 3,526 | — | 3,526 | — | |||||||||||||||
Capitalized interest charged to cost of sales | 1,704 | 1,104 | 947 | 1,104 | 947 | |||||||||||||||
Adjusted gross margin | $ | 108,111 | $ | 43,371 | $ | 20,236 | $ | 65,762 | $ | 40,096 | ||||||||||
Gross margin % (b) | 26.8 | % | 24.2 | % | 26.1 | % | 25.4 | % | 27.3 | % | ||||||||||
Adjusted gross margin % (b) | 28.2 | % | 27.1 | % | 27.4 | % | 27.3 | % | 28.0 | % | ||||||||||
(a) | Adjustments result from the application of purchase accounting for the GTIS Acquisitions and the acquisition of Oakmont (collectively the "Acquisitions") and represent the amount of the fair value step-up adjustments included in cost of sales for real estate inventory sold after the acquisition dates. |
(b) | Calculated as a percentage of home sales revenues. |
Adjusted EBITDA
Adjusted EBITDA is a non-GAAP financial measure used by management as a supplemental measure in evaluating operating performance. We define adjusted EBITDA as net income before (i) interest expense, (ii) income taxes, (iii) depreciation and amortization, (iv) capitalized interest charged to cost of sales, (v) other income, net and (vi) adjustments resulting from the application of purchase accounting. Our management believes that the presentation of adjusted EBITDA provides useful information to investors regarding our results of operations because it assists both investors and management in analyzing and benchmarking the performance and value of our business. Adjusted EBITDA provides an indicator of general economic performance that is not affected by fluctuations in interest rates or effective tax rates, levels of depreciation or amortization and items considered to be non-recurring. Accordingly, our management believes that this measurement is useful for comparing general operating performance from period to period. Other companies may define adjusted EBITDA differently and, as a result, our measure of adjusted EBITDA may not be directly comparable to adjusted EBITDA of other companies. Although we use adjusted EBITDA as a financial measure to assess the performance of our business, the use of adjusted EBITDA is limited because it does not include certain material costs, such as interest and taxes, necessary to operate our business. Adjusted EBITDA should be considered in addition to, and not as a substitute for, net income in accordance with GAAP as a measure of performance. Our presentation of adjusted EBITDA should not be construed as an indication that our future results will be unaffected by unusual or nonrecurring items. Our adjusted EBITDA is limited as an analytical tool, and you should not consider it in isolation or as a substitute for analysis of our results as reported under GAAP. Some of these limitations are:
• | it does not reflect every cash expenditure, future requirements for capital expenditures or contractual commitments, including for the purchase of land; |
• | it does not reflect the interest expense or the cash requirements necessary to service interest or principal payments on our debt; |
• | although depreciation and amortization are non-cash charges, the assets being depreciated and amortized will often have to be replaced or require improvements in the future, and adjusted EBITDA does not reflect any cash requirements for such replacements or improvements; |
• | it is not adjusted for all non-cash income or expense items that are reflected in our statements of cash flows; |
• | it does not reflect the impact of earnings or charges resulting from matters we consider not to be indicative of our ongoing operations; and |
• | other companies in our industry may calculate it differently than we do, limiting its usefulness as a comparative measure. |
44
Because of these limitations, our adjusted EBITDA should not be considered a measure of discretionary cash available to us to invest in the growth of our business or as a measure of cash that will be available to us to meet our obligations. We compensate for these limitations by using our adjusted EBITDA along with other comparative tools, together with GAAP measurements, to assist in the evaluation of operating performance. These GAAP measurements include operating income, net income and cash flow data. We have significant uses of cash flows, including capital expenditures, interest payments and other non-recurring charges, which are not reflected in our adjusted EBITDA.
Adjusted EBITDA is not intended as an alternative to net income as an indicator of our operating performance, as an alternative to any other measure of performance in conformity with GAAP or as an alternative to cash flows as a measure of liquidity. You should therefore not place undue reliance on our adjusted EBITDA calculated using this measure. Our GAAP-based measures can be found in our consolidated financial statements and related notes included elsewhere in this Annual Report.
The following table reconciles adjusted EBITDA to net income, which is the GAAP financial measure that our management believes to be most directly comparable (dollars in thousands):
Pro Forma | ||||||||||||||||||||
Year Ended December 31, | Year Ended December 31, | |||||||||||||||||||
2014 | 2013 | 2012 | 2013 | 2012 | ||||||||||||||||
Net income | $ | 28,211 | $ | 21,737 | $ | 9,868 | $ | 21,662 | $ | 18,272 | ||||||||||
Interest expense | — | 51 | 1 | 51 | 1 | |||||||||||||||
Income taxes | 14,868 | 1,066 | 155 | 1,260 | 342 | |||||||||||||||
Depreciation and amortization | 662 | 295 | 185 | 820 | 745 | |||||||||||||||
Capitalized interest charged to cost of sales | 1,704 | 1,104 | 947 | 1,104 | 947 | |||||||||||||||
Purchase accounting adjustments (a) | 3,620 | 3,526 | — | 3,526 | — | |||||||||||||||
Gain on remeasurement of interest in LGI/GTIS Joint Ventures (b) | — | (6,446 | ) | — | — | — | ||||||||||||||
Other income, net | (708 | ) | (24 | ) | (173 | ) | (99 | ) | (215 | ) | ||||||||||
Adjusted EBITDA | $ | 48,357 | $ | 21,309 | $ | 10,983 | $ | 28,324 | $ | 20,092 | ||||||||||
Adjusted EBITDA margin % (c) | 12.6 | % | 13.3 | % | 14.9 | % | 11.8 | % | 14.0 | % | ||||||||||
(a) | Adjustments result from the application of purchase accounting for the Acquisitions and represent the amount of the fair value step-up adjustments included in cost of sales for real estate inventory sold after the acquisition dates. |
(b) | This adjustment results from the non-recurring gain recognized by us on the remeasurement of the Predecessor’s equity interest in the LGI/GTIS Joint Ventures in connection with the GTIS Acquisitions. |
(c) | Calculated as a percentage of home sales revenues. |
Backlog
We sell our homes under standard purchase contracts, which generally require a homebuyer to pay a deposit at the time of signing the purchase contract. The amount of the required deposit is minimal (generally $1,000 or less). The deposits are refundable if the homebuyer is unable to obtain mortgage financing. We permit our homebuyers to cancel the purchase contract and obtain a refund of their deposit in the event mortgage financing cannot be obtained within a certain period of time, as specified in their purchase contract. Typically our homebuyers provide documentation regarding their ability to obtain mortgage financing within 14 days after the purchase contract is signed. If we determine that the homebuyer is not qualified to obtain mortgage financing or is not otherwise financially able to purchase the home, we will terminate the purchase contract. If a purchase contract has not been cancelled or terminated within 14 days after the purchase contract has been signed, then the homebuyer has met the preliminary criteria to obtain mortgage financing. Only purchase contracts that are signed by homebuyers who have met the preliminary criteria to obtain mortgage financing are included in new (gross) orders.
Our “backlog” consists of homes that are under a purchase contract that are signed by homebuyers who have met the preliminary criteria to obtain mortgage financing but have not yet closed. Since our business model is based on building move-in ready homes before a purchase contract is signed, the majority of our homes in backlog are complete. Ending backlog represents
45
the number of homes in backlog from the previous period plus the number of net orders (new orders for homes less cancellations) generated during the current period minus the number of homes closed during the current period. Our backlog at any given time will be affected by cancellations, the number of our active communities, and the timing of home closings. Homes in backlog are generally closed within one to two months, although we may experience cancellations of purchase contracts at any time prior to closing. It is important to note that net orders, backlog and cancellation metrics are operational, rather than accounting data, and should be used only as a general gauge to evaluate performance. Backlog may be impacted by customer cancellations for various reasons that are beyond our control, and in light of our minimal required deposit, there is little negative impact to the potential homebuyer from the cancellation of the purchase contract. As of the dates set forth below, our net orders, cancellation rate, and ending backlog homes and value were as follows (dollars in thousands):
Backlog Data | Year Ended December 31, | |||||||||||
2014 | 2013 | 2012 | ||||||||||
Net orders (1) | 2,259 | 1,080 | 563 | |||||||||
Cancellation rate (2) | 31.3 | % | 23.5 | % | 26.6 | % | ||||||
Ending backlog – homes (3) | 152 | 190 | 67 | |||||||||
Ending backlog – value (3) | $ | 27,067 | $ | 30,095 | $ | 9,822 | ||||||
(1) | Net orders are new (gross) orders for the purchase of homes during the period, as well as home sale contracts acquired in the Oakmont Acquisition, less cancellations of existing purchase contracts during the period. |
(2) | Cancellation rate for a period is the total number of purchase contracts cancelled during the period divided by the total new (gross) orders for the purchase of homes during the period. |
(3) | Ending backlog consists of homes at the end of the period that are under a purchase contract that have met our preliminary financing criteria but have not yet closed. Ending backlog is valued at the contract amount. |
Land Acquisition Policies and Development
See discussion included in “Business—Land Acquisition Policies and Development.”
Homes in Inventory
See discussion included in “Business—Homes in Inventory.”
Raw Materials
See discussion included in “Business—Raw Materials.”
Seasonality
In all of our regions, we have historically experienced similar variability in our results of operations and in capital requirements from quarter to quarter due to the seasonal nature of the homebuilding industry. We generally close more homes in our second, third and fourth quarters. Thus, our revenue may fluctuate on a quarterly basis and we may have higher capital requirements in our second, third and fourth quarters in order to maintain our inventory levels. Our revenue and capital requirements are generally similar across our second, third and fourth quarters.
As a result of seasonal activity, our quarterly results of operation and financial position at the end of a particular quarter, especially the first quarter, are not necessarily representative of the results we expect at year end. We expect this seasonal pattern to continue in the long term.
Liquidity and Capital Resources
Overview
As of December 31, 2014, we had $31.4 million of cash and cash equivalents. Cash flows for each of our active communities depend on the status of the development cycle and can differ substantially from reported earnings. Early stages of development or expansion require significant cash outlays for land acquisitions, land development, plats, vertical development, construction of sales offices, general landscaping and other amenities. Because these costs are a component of our inventory and are not recognized in our statement of operations until a home closes, we incur significant cash outflows prior to recognition of revenues. In the later
46
stages of an active community, cash inflows may significantly exceed revenues reported for financial statement purposes, as the costs associated with home and land construction were previously incurred.
Our principal uses of capital are operating expenses, land and lot purchases, lot development, home construction, interest costs on our indebtedness and the payment of various liabilities. In addition, we may purchase land, lots, homes under construction or other assets as part of a business combination.
We generally rely on our ability to finance our operations by generating operating cash flows, borrowing under our secured revolving credit facility and/or utilizing the proceeds from the issuance of the Convertible Notes. As needed, we will consider accessing the debt and equity capital markets as part of our ongoing strategy. We also rely on our ability to obtain performance, payment and completion surety bonds as well as letters of credit to finance our projects.
We believe that we will be able to fund our current and foreseeable liquidity needs for at least the next twelve months with our cash on hand, cash generated from operations, and cash expected to be available from our secured revolving credit facility, including any future modifications.
Secured Revolving Credit Facility
In April 2014, we entered into a credit agreement with a syndication of lenders and Texas Capital Bank, National Association, as administrative agent and letter of credit issuer (the “Credit Agreement”). The Credit Agreement provides for a $135.0 million senior secured revolving credit facility, which can be increased by our request, to $200.0 million, subject to the terms and provisions of the Credit Agreement. On July 31, 2014, amounts available to us under the Credit Agreement were increased by $40.0 million to $175.0 million, and on September 30, 2014, amounts available to us under the Credit Agreement were increased from $175.0 million to $200.0 million, in each case, in accordance with the accordion feature of the Credit Agreement.
The Credit Agreement matures on April 28, 2017. Borrowings under the credit facility are limited to the borrowing base, which is based on the loan value of the pool of collateral in which the lenders have a security interest. We may add houses, vacant lots, land, and acquisition and development projects to the pool of collateral through April 28, 2015. The loan value of speculative houses, pre-sold houses, model houses, vacant lots, land, and acquisition and development projects is adjusted based on formulas with respect to each of those categories of collateral; the loan value of the collateral decreases based on the amount of time such collateral is in the borrowing base. Subsequent to this date and through April 28, 2016, advances will continue to be made for assets previously included in the pool of collateral as they move into higher funding categories. Pre-sold homes may remain in the borrowing base for up to one year. Speculative homes may remain in the borrowing base for up to 18 months. Vacant lots, land and acquisition and development projects may remain in the borrowing base for up to three years. At December 31, 2014, the borrowing base was $200.0 million, of which $139.4 million was outstanding and the remaining $60.6 million was available to borrow.
The Credit Agreement contains various financial covenants including a minimum EBITDA to debt service payments ratio; a debt to capitalization ratio; a leverage ratio; liquidity ratio; ratio of value of all land, lots, and acquisition and development projects to net worth; and a net worth ratio. In addition, the Credit Agreement contains various covenants that, among other restrictions, limit the amount of our additional debt.
On September 30, 2014, certain provisions of the Credit Agreement were modified and supplemented. The modification of the Credit Agreement increased each of the Combined Acquisition and Development (“A&D”) and Entitled Land Subfacility, the Combined A&D, Entitled Land and Lot Inventory Subfacility, and the Entitled Land Subfacility, modified certain of the Credit Agreement financial covenants, which are generally tested on a quarterly basis, and allowed up to $85.0 million of unsecured subordinated indebtedness. In addition, the debt to capitalization ratio, leverage ratio, EBITDA ratio and liquidity rate required were also modified. Our secured revolving credit facility requires us to maintain a minimum EBITDA to debt service ratio of 4.0 to 1.0, debt-to-capitalization ratio not to exceed 0.60 to 1.0 and a tangible net worth of not less than $145.0 million plus 100% of the net proceeds of any issuances of stock or other equity interests of ours or any of our subsidiaries (an “Obligated Party”) (other than to another Obligated Party) after April 2014, plus 50% of the amount of our net income, on a consolidated basis (but without deduction for any net loss), for each fiscal quarter ending after April 2014. The credit facility also requires us to maintain a leverage ratio of not more than 1.75 to 1.0 and to maintain liquidity in excess of $40.0 million effective December 31, 2014. At December 31, 2014, we were in compliance with all of the covenants contained in the Credit Agreement.
Convertible Notes
In November 2014, we issued $85.0 million aggregate principal amount of our 4.25% Convertible Notes due 2019. The Convertible Notes mature on November 15, 2019 and bear interest at a rate of 4.25%, payable semiannually each year, beginning on May 15, 2015. Prior to May 15, 2019, the Convertible Notes will be convertible only upon satisfaction of any of the specified conversion events. On or after May 15, 2019, note holders can convert their Convertible Notes at any time at their option.
47
As issued, the conversion of the Convertible Notes may only be settled in stock. Upon receipt of stockholder approval of the flexible settlement provisions of the Convertible Notes, the Convertible Notes will be convertible into cash, shares of common stock, or a combination thereof, at our election. We have sole discretion to request stockholder approval for the flexible settlement feature, however there can be no assurance that the stockholders will approve the flexible settlement feature. The initial conversion rate is 46.4792 shares of our common stock for each $1,000 principal amount the Convertible Notes, which represents an initial conversion price of approximately $21.52 per share of our common stock. The conversion rate is subject to adjustments upon the occurrence of certain specified events.
Notes payable in our accompanying consolidated financial statements include $76.5 million which is the fair value of the $85.0 million aggregate principal amount of Convertible Notes issued; the fair value was determined using a discount rate of 6.6% based on the rate of return investors would require for a similar liability, and reflects an $8.5 million discount. $5.5 million of the remaining proceeds was recorded to additional paid-in capital to reflect the equity component of the Convertible Notes and $3.0 million was recorded as a deferred tax liability. The carrying amount of the Convertible Notes is being accreted over the term to maturity. The net proceeds from the offering were approximately $82.0 million. Of the $3.0 million of debt issuance costs, $2.7 million were allocated to the liability component and the remaining $0.3 million was allocated as an offset to the equity component of the Convertible Notes.
Concurrent with the issuance of the Convertible Notes, we utilized, approximately $16.6 million of the net proceeds from the sale of the Convertible Notes to repurchase 1.0 million shares of our common stock to be held as treasury stock. The remaining net proceeds from issuance of the Convertible Notes have been used for the purchase of land and lots and general corporate purposes, including repayment of borrowings under our secured revolving credit facility.
Letters of Credit, Surety Bonds and Financial Guarantees
We are often required to provide letters of credit and surety bonds to secure our performance under construction contracts, development agreements and other arrangements. The amount of such obligations outstanding at any time varies in accordance with our pending development activities. In the event any such bonds or letters of credit are drawn upon, we would be obligated to reimburse the issuer of such bonds or letters of credit.
Under these letters of credit, surety bonds and financial guarantees, we are committed to perform certain development and construction activities and provide certain guarantees in the normal course of business. Outstanding letters of credit, surety bonds and financial guarantees under these arrangements, totaled $7.7 million as of December 31, 2014. Although significant development and construction activities have been completed related to the improvements at these sites, the letters of credit and surety bonds are not generally released until all development and construction activities are completed. We do not believe that it is probable that any outstanding letters of credit or surety bonds, letters of credit or financial guarantees as of December 31, 2014 will be drawn upon.
Cash Flows
Year Ended December 31, 2014 compared to Year Ended December 31, 2013
Net cash used in operating activities during the year ended December 31, 2014 was $173.2 million as compared to $54.5 million during the year ended December 31, 2013. The $118.7 million increase in net cash used in operating activities was primarily attributable to a $123.8 million net increase in real estate inventory for the year ended December 31, 2014 as compared to the year ended December 31, 2013. We made land and finished lot purchases in all of our divisions with the majority of purchases in Texas. Net cash used in operating activities is partially offset by an $6.5 million increase in net income in 2014.
Net cash used in investing activities during the year ended December 31, 2014 was $16.4 million as compared to $31.3 million used in investing activities during the year ended December 31, 2013. Net cash used of $15.2 million was associated with the Oakmont acquisition during the year ended December 31, 2014 as compared to net cash payment of $30.1 million during the year ended December 31, 2013 associated with the GTIS Acquisitions.
Net cash provided by financing activities totaled $166.9 million during the year ended December 31, 2014 as compared to $132.7 million during the year ended December 2013. The $34.1 million increase in net cash provided by financing activities is primarily due to the (i) $83.0 million increase in net borrowings from our secured credit facility in the year ended December 31, 2014 as compared to the year ended December 31, 2013; (ii) the issuance of $85.0 million aggregate principal amount of Convertible Notes, which are offset by approximately $16.6 million of the net proceeds from the sale of the Convertible Notes to repurchase 1.0 million shares of our common stock. Net cash provided by financing activities in 2013 included $113.9 million of net proceeds
48
received from the sale of the Company’s common stock in the IPO, net of $11.2 million of underwriting discounts and commissions and offering related expenses.
Year Ended December 31, 2013 compared to Year Ended December 31, 2012
Net cash used in operating activities during the year ended December 31, 2013 was $54.5 million as compared to $4.7 million during the year ended December 31, 2012. The $49.8 million increase in net cash used in operating activities was primarily attributable to a $58.6 million net increase in land and finished lots inventory for the year ended December 31, 2013 as compared to the year ended December 31, 2012. We made land and finished lot purchases in all of our divisions with the majority of purchases in Texas. The net cash used in operating activities is also offset by an $11.9 million increase in net income.
Net cash used in investing activities was $31.3 million during the year ended December 31, 2013 as compared to $2.6 million used in investing activities during the same period in 2012. The increase in cash used in investing activities is primarily the result of the net cash payment of $30.1 million associated with the GTIS Acquisitions.
Net cash provided by financing activities totaled $132.7 million during the year ended December 31, 2013 as compared to $9.3 million during the same period in 2012. The increase in net cash provided by financing activities is primarily due to $113.9 million of proceeds received from the sale of stock in the IPO, net of $11.2 million of underwriting discounts and commissions and offering related expenses, $15.8 million of contributions received from non-controlling interests, and a $20.9 million net increase in outstanding notes payable.
Off-Balance Sheet Arrangements
In the ordinary course of business, we enter into land option contracts in order to procure lots for the construction of our homes. We are subject to customary obligations associated with entering into contracts for the purchase of land and improved lots. These purchase contracts typically require cash deposits and the purchase of properties under these contracts is generally contingent upon satisfaction of certain requirements by the sellers, including obtaining applicable property and development entitlements. We also utilize option contracts with land sellers as a method of acquiring lots and land in staged takedowns, to help us manage the financial and market risk associated with land holdings, and to minimize the use of funds from our corporate financing sources. Option contracts generally require a non-refundable deposit for the right to acquire lots over a specified period of time at pre-determined prices. We generally have the right at our discretion to terminate our obligations under both purchase contracts and option contracts by forfeiting our cash deposit with no further financial obligations to the land seller. In addition, our deposit may also be refundable if the land seller does not satisfy all conditions precedent in the respective contract. As of December 31, 2014, we had $9.6 million of cash deposits pertaining to land option contracts and purchase contracts for 3,921 lots with an aggregate purchase price of $86.3 million. Approximately $7.4 million of the cash deposits as of December 31, 2014 are related to purchase contracts to deliver finished lots and these deposits are refundable under certain circumstances and secured by indemnity mortgages on the related property.
Our utilization of land option contracts is dependent on, among other things, the availability of land, sellers willing to enter into option takedown arrangements, the availability of capital to financial intermediaries to finance the development of optioned lots, general housing conditions, and local market dynamics. Options may be more difficult to procure from land sellers in strong housing markets and are more prevalent in certain markets.
Inflation
Our business can be adversely impacted by inflation, primarily from higher land, financing, labor, material and construction costs. In addition, inflation can lead to higher mortgage rates, which can significantly affect the affordability of mortgage financing to home buyers.
Contractual Obligations Table
The following is a summary of our contractual obligations as of December 31, 2014 and the effect such obligations are expected to have on our liquidity and cash flows in future periods.
49
Payments due by period (dollars in thousands) | ||||||||||||||||||||
Contractual Obligations | Total | Less than 1 year | 1-3 years | 3-5 years | More than 5 years | |||||||||||||||
Borrowings: | ||||||||||||||||||||
Credit Facility (a) | $ | 139,404 | $ | 67,949 | $ | 71,455 | $ | — | $ | — | ||||||||||
Convertible Notes (b) | 85,000 | — | — | 85,000 | — | |||||||||||||||
Inventory related obligations(c) | 7,275 | 189 | 405 | 445 | 6,236 | |||||||||||||||
Interest and fees (d) | 35,574 | 10,203 | 13,937 | 7,894 | 3,540 | |||||||||||||||
Consulting agreements (e) | 198 | 115 | 83 | — | — | |||||||||||||||
Operating leases | 2,207 | 605 | 1,206 | 396 | — | |||||||||||||||
Total | $ | 269,658 | $ | 79,061 | $ | 87,086 | $ | 93,735 | $ | 9,776 | ||||||||||
(a) | Represents borrowings under our $200.0 million credit facility which are limited to the borrowing base, and is based on the loan value of the pool of collateral in which the lenders have a security interest. The Credit Facility matures on April 28, 2017. The Company may add houses, vacant lots, land, and acquisition and development projects to its pool of collateral through April 28, 2015. The loan value of speculative houses, pre-sold houses, model houses, vacant lots, land, and acquisition and development projects is adjusted based on formulas with respect to each of those categories of collateral; the loan value of the collateral decreases based on the amount of time such collateral is in the borrowing base. See Note 9 “Notes Payable” to our consolidated financial statements included in Part II Item 8 of this Annual Report on Form 10-K for additional information regarding our long-term debt. |
(b) | Represents $85.0 million aggregate principal amount of our 4.25% Convertible Notes due 2019. The Convertible Notes mature on November 15, 2019. See Note 9 “Notes Payable” to our consolidated financial statements included in Part II Item 8 of this Annual Report on Form 10-K for additional information regarding our long-term debt. |
(c) | The Company owns lots in certain communities that have Community Development Districts (“CDD”) or similar utility and infrastructure development special assessment programs that allocate a fixed amount of debt service associated with development activities to each lot. Such obligations represent a non-cash cost of the lots. |
(d) | Interest on our credit facility accrues at defined variable rates based on LIBOR with a floor rate of 3.75% as of December 31, 2014. Fees on the Credit Facility are approximately $1.1 million per year. Interest on our Convertible Notes accrues at a fixed rate of 4.25% per year and is payable semiannually beginning on May 15, 2015 through November 15, 2019. Inventory related obligations for infrastructure development attached to the land are subject to a fixed interest rate generally ranging from 5.00% to 7.21%, typically payable over a 30 year period, and are ultimately assumed by the homebuyer when home sales are closed. |
(e) | We have two consulting agreements that require (a) monthly installments of $10,000 through February 15, 2015 and (b) monthly installments of $8,333 through October 2016. These are non-interest bearing obligations. |
In connection with the Oakmont acquisition, we recorded an earnout obligation on the acquisition date of approximately $2.2 million which was determined based on the forecasted number of home closings. The actual amount of the earnout may be more or less than the estimated amount and will be based on the actual number of homes closed from the acquired assets and the timing of the home closings from the acquisition date through December 31, 2017. We have not included this obligation in the table above.
Critical Accounting Policies
Discussed below are accounting policies that we believe are critical because of the significance of the activity to which they relate or because they require the use of significant judgment in their application.
Revenue Recognition
Home Sales. In accordance with ASC Topic 360—20, Real Estate Sales, revenues from home sales are recorded at the time each home sale is closed, title and possession are transferred to the buyer, and the Company has no significant continuing involvement with the home. Home sales proceeds are generally received from the title company within a few days from closing. Home sales are reported net of sales discounts and incentives granted to homebuyers, which are primarily seller-paid closing costs. The profit we record on each home sale is based on the calculation of cost of sales, which is dependent on our allocation of costs, as described in more detail in “—Real Estate Inventory and Cost of Home Sales” below.
Real Estate Inventory and Cost of Home Sales
50
Inventory consists of land, land under development, finished lots, sales offices, homes in progress and completed homes. Inventory is stated at cost unless the carrying amount is determined not to be recoverable, in which case inventory is written down to fair value.
Pre-acquisition costs, land, development and other project costs, including interest and property taxes, incurred during development and home construction, and net of expected reimbursements of development costs, are capitalized to real estate inventory. Pre-acquisition costs, land development and other common costs that benefit the entire community, including field construction supervision and related direct overhead, are allocated to individual lots or homes, as appropriate, on a pro rata basis which we believe approximates the costs that would be determined using an allocation method based on relative sales values since the individual lots or homes within a community are similar in value.
Changes to estimated total development costs subsequent to initial home closings in a community are allocated to the remaining unsold homes in the community on a prospective basis. Home construction costs and related carrying charges are allocated to the cost of individual homes using the specific identification method and are capitalized as they are incurred. Capitalized interest, property taxes, and other carrying costs are generally capitalized to real estate inventory from the point development begins to the point construction is completed. Costs associated with homes sold are charged to cost of sales simultaneously with revenue recognition.
Impairment of Real Estate Inventories. In accordance with ASC Topic 360, Property, Plant, and Equipment, real estate inventory is evaluated for indicators of impairment by each community during each reporting period. In conducting our review for indicators of impairment on a community level, we evaluate, among other things, the margins on homes that have been delivered, communities with slow moving inventory, projected margins on future home sales over the life of the community, and the estimated fair value of the land. We pay particular attention to communities in which inventory is moving at a slower than anticipated absorption pace and communities whose average sales prices and/or margins are trending downward and are anticipated to continue to trend downward. Due largely to the relatively short development and construction periods for our communities and our growth, we have not experienced circumstances during 2014, 2013 and 2012, that are indicators of impairment. Our future sales and margins may be impacted by our inability to realize continued growth, increased cost associated with holding and developing land, local economic factors, pressure on home sales prices, and insufficient access to labor and materials at reasonable costs. For individual communities with indicators of impairment, we perform additional analysis to estimate the community’s undiscounted future cash flows. If the estimated undiscounted future cash flows are greater than the carrying value of the asset, no impairment adjustment is required. If the undiscounted cash flows are less than the asset’s carrying value, the asset is impaired and is written down to its fair value. We estimate the fair value of communities using a discounted cash flow model; changes to the expected cash flows may lead to changes in the outcome of our impairment analysis.
The life cycle of a community generally ranges from three to five years, commencing with the acquisition of land, continuing through the land development phase, and concluding with the construction, sale, and delivery of homes. A constructed home is used as the community sales office during the life of the community and then sold. Actual individual community lives will vary based on the size of the community, the sales absorption rate, and whether we purchased the property as raw land or finished lots.
Impairment of land and land under development. For raw land, land under development and completed lots that our management anticipates will be utilized for future homebuilding activities, the recoverability of assets is measured by comparing the carrying amount of the assets to future undiscounted cash flows expected to be generated by the assets based on home sales, consistent with the evaluation of operating communities discussed above. As of December 31, 2014, we had not identified any raw land, land under development or completed lots that management intends to market for sale to a third party.
Pre-acquisition costs and controlled lots not owned. We enter into land deposit and option agreements in the ordinary course of business in order to secure land for the construction of homes in the future. Pursuant to these land option agreements, we typically provide a deposit to the seller as consideration for the right to purchase land at different times in the future, usually at predetermined prices. We do not have title to the property and our obligations with respect to the option contracts are generally limited to the forfeiture of the related nonrefundable cash deposits.
To the extent that any deposits are nonrefundable and the associated land acquisition process is terminated or no longer determined probable, the deposit and any related pre-acquisition costs (e.g. due diligence costs) are charged to other income, net. We review the likelihood of the acquisition of contracted lots in conjunction with our periodic real estate impairment analysis.
Warranty Reserves
We typically provide homebuyers with a one-year warranty on the house and a ten-year limited warranty for major defects in structural elements. Estimated future direct warranty costs are accrued and charged to cost of sales in connection with our home
51
sales. In addition, prior to November 13, 2013, for each home sold by the LGI/GTIS Joint Ventures, we were obligated to fund the warranty costs of the LGI/GTIS Joint Ventures under the respective management services agreements and we collected a warranty fee of $250 from the LGI/GTIS Joint Ventures.
Our warranty liability is based upon historical warranty cost experience on a per house basis established based on (i) trends in historical warranty payment levels, (ii) the historical range of amounts paid per house, (iii) any warranty expenditures not considered to be normal and recurring and is adjusted as appropriate to reflect qualitative risks associated with the types of homes built, the geographic areas in which they are built, and potential impacts of our expansion. Our analysis also considers improvements in quality control and construction techniques expected to impact future warranty expenditures and the expertise of our personnel. Our warranty reserves are reviewed quarterly to assess the reasonableness and adequacy and we make adjustments to the balance of the pre-existing reserves, as needed, to reflect changes in trends and historical data as information becomes available.
Business Combinations
We account for businesses we acquire in accordance with ASC 805. Under the purchase method of accounting, the assets acquired and liabilities assumed are recorded at their estimated fair values. Any excess of the purchase consideration over the net fair values of tangible and identified intangible assets acquired less liabilities assumed is recorded as goodwill. Our reported income from an acquired company includes the operations of the acquired company from the effective date of acquisition. Contingent consideration is recorded at fair value at the acquisition date; in subsequent periods any change in the fair value of the contingent consideration is recognized in the income statement as cost of sales.
Goodwill
We record goodwill associated with our acquisitions of businesses when the consideration paid exceeds the fair value of the net tangible and identifiable intangible assets acquired. We evaluate our goodwill balances for potential impairment on an annual basis. The current guidance allows an entity to assess qualitatively whether it is necessary to perform step one of a prescribed two-step annual goodwill impairment test. If an entity believes, as a result of its qualitative assessment, that it is more likely than not that the fair value of a reporting unit exceeds its carrying amount, the two-step goodwill impairment test is not required.
Taxes
We utilize the liability method of accounting for income taxes. Under the liability method, deferred tax assets and liabilities are recognized using enacted tax rates for the effect of temporary differences between the book and tax bases of recorded assets and liabilities. Deferred tax assets are reduced by a valuation allowance if it is more likely than not that some portion or all of the net deferred tax assets will not be realized. Our ability to realize deferred tax assets is assessed throughout the year and a valuation allowance is established, if required. We recognize the impact of a tax position only if it is more likely than not to be sustained upon examination based on the technical merits of the position. We recognize potential interest and penalties related to uncertain tax positions in income tax expense, as applicable.
Implications of Being an Emerging Growth Company
We are an “emerging growth company,” as defined in the Jumpstart Our Business Startups Act of 2012, or the JOBS Act. Thus, we are not required to provide more than two years of audited financial statements, selected financial data and related Management’s Discussion and Analysis of Financial Condition and Results of Operations in this Annual Report. For as long as we are an emerging growth company, unlike other public companies, we will not be required to:
• | provide an attestation and report from our auditors on management’s assessment of the effectiveness of our system of internal control over financial reporting pursuant to Section 404(b) of the Sarbanes-Oxley Act; |
• | comply with certain new requirements adopted by the PCAOB; |
• | comply with certain new audit rules adopted by the PCAOB after April 5, 2012, unless the SEC determines otherwise; |
• | provide disclosures regarding executive compensation required of larger public companies; and |
• | obtain stockholder approval of any golden parachute payments not previously approved. |
We intend to take advantage of all of these exemptions.
We will cease to be an emerging growth company when any of the following conditions apply:
• | we have $1.0 billion or more in annual revenues; |
52
• | at least $700 million in market value of our common stock are held by non-affiliates; |
• | we issue more than $1.0 billion of non-convertible debt over a three-year period; or |
• | the last day of the fiscal year following the fifth anniversary of our initial public offering has passed. |
In addition, an emerging growth company can delay its adoption of certain accounting standards until those standards would otherwise apply to private companies. However, we have chosen to “opt out” of such extended transition period, and as a result, we will comply with any new or revised accounting standards on the relevant dates on which non-emerging growth companies must adopt such standards. Section 107 of the JOBS Act provides that our decision to opt out of the extended transition period for complying with new or revised accounting standards is irrevocable.
ITEM 7A. QUANTITATIVE AND QUALITATIVE DISCLOSURES ABOUT MARKET RISK
Our operations are interest rate sensitive. As overall housing demand is adversely affected by increases in interest rates, a significant increase in mortgage interest rates may negatively affect the ability of homebuyers to secure adequate financing. Higher interest rates could adversely affect our revenues, gross margin and net income. We do not enter into, or intend to enter into, derivative financial instruments for trading or speculative purposes.
Quantitative and Qualitative Disclosures About Interest Rate Risk
We utilize both fixed-rate debt ($85.0 million aggregate principal amount of our 4.25% Convertible Notes) and variable-rate debt, (our $200.0 million secured revolving credit facility) as part of financing our operations. As issued, the conversion of our fixed-rate Convertible Notes can only be settled in shares of our common stock, and are not subject to interest rate risk and should not have a significant impact. We do not have the obligation to prepay our fixed-rate debt related to inventory obligations prior to maturity, and, as a result, interest rate risk and changes in fair market value should not have a significant impact on our fixed-rate debt until, and if, we are required to refinance it. We are exposed to market risks related to fluctuations in interest rates on our outstanding variable rate indebtedness. We did not utilize swaps, forward or option contracts on interest rates or commodities, or other types of derivative financial instruments as of or during the year ended December 31, 2014. We have not entered into and currently do not hold derivatives for trading or speculative purposes, but we may do so in the future. Many of the statements contained in this section are forward looking and should be read in conjunction with our disclosures under the heading “Cautionary Statement about Forward-Looking Statements” in Item 1A. Risk Factors.
As of December 31, 2014, we had $139.4 million of variable rate indebtedness outstanding under our revolving credit facility. All of the outstanding borrowings under our credit facility is at variable rates based on LIBOR, or subject to an interest rate floor. The interest rate for our variable rate indebtedness as of December 31, 2014 was 3.75%. A hypothetical 100 basis point increase in the average interest rate on our variable rate indebtedness would increase our annual interest expense based on the current outstanding balance by approximately $1.4 million.
Based on the current interest rate management policies we have in place with respect to our outstanding indebtedness, we do not believe that the future interest rate risks related to our existing indebtedness will have a material adverse impact on our financial position, results of operations or liquidity.
53
ITEM 8. FINANCIAL STATEMENTS AND SUPPLEMENTARY DATA
REPORT OF INDEPENDENT REGISTERED PUBLIC ACCOUNTING FIRM
The Board of Directors and Shareholders of LGI Homes, Inc.
We have audited the accompanying consolidated balance sheets of LGI Homes, Inc. as of December 31, 2014 and 2013, and the related consolidated statements of operations, equity, and cash flows for each of the three years in the period ended December 31, 2014. These financial statements are the responsibility of the Company’s management. Our responsibility is to express an opinion on these financial statements based on our audits. With respect to the period from January 1, 2013 through November 13, 2013 and for the year ended December 31, 2012, we did not audit the financial statements of: LGI - GTIS Holdings, LLC; LGI - GTIS Holdings II, LLC; LGI - GTIS Holdings III, LLC; and LGI- GTIS Holdings IV, LLC (collectively GTIS Entities), which entities are limited liability companies in which the Company had equity interests. In the consolidated financial statements, the Company’s combined investment in the GTIS Entities is stated at $4,446,302 as of December 31, 2012, and the Company’s equity in the net income of the GTIS Entities is stated at $4,286,639 for the period from January 1, 2013 through November 13, 2013 and $1,526,464 for the year ended December 31, 2012. Those statements were audited by other auditors whose reports have been furnished to us, and our opinion, insofar as it relates to the amounts included for the GTIS Entities, is based solely on the reports of the other auditors.
We conducted our audits in accordance with the standards of the Public Company Accounting Oversight Board (United States). Those standards require that we plan and perform the audit to obtain reasonable assurance about whether the financial statements are free of material misstatement. We were not engaged to perform an audit of the Company’s internal control over financial reporting. Our audits included consideration of internal control over financial reporting as a basis for designing audit procedures that are appropriate in the circumstances, but not for the purpose of expressing an opinion on the effectiveness of the Company’s internal control over financial reporting. Accordingly, we express no such opinion. An audit also includes examining, on a test basis, evidence supporting the amounts and disclosures in the financial statements, assessing the accounting principles used and significant estimates made by management, and evaluating the overall financial statement presentation. We believe that our audits and the reports of other auditors provide a reasonable basis for our opinion.
In our opinion, based on our audits and the reports of other auditors, the financial statements referred to above present fairly, in all material respects, the consolidated financial position of LGI Homes, Inc. at December 31, 2014 and 2013, and the consolidated results of its operations and its cash flows for each of the three years in the period ended December 31, 2014, in conformity with U.S. generally accepted accounting principles.
/s/ Ernst & Young LLP
Houston, Texas
March 12, 2015
54
REPORT OF INDEPENDENT REGISTERED PUBLIC ACCOUNTING FIRM
The Board of Directors and Shareholders
LGI-GTIS Holdings, LLC and Subsidiaries
We have audited the accompanying consolidated balance sheets of LGI-GTIS Holdings, LLC and Subsidiaries (the “Company”) as of November 13, 2013 and December 31, 2012, and the related consolidated statements of operations, members’ equity, and cash flows for the period from January 1, 2013 through November 13, 2013 and the year ended December 31, 2012. These consolidated financial statements are the responsibility of the Company’s management. Our responsibility is to express an opinion on these consolidated financial statements based on our audits.
We conducted our audits in accordance with the standards of the Public Company Accounting Oversight Board (United States). Those standards require that we plan and perform the audits to obtain reasonable assurance about whether the consolidated financial statements are free of material misstatement. We were not engaged to perform an audit of the Company’s internal controls over financial reporting. An audit includes consideration of internal control over financial reporting as a basis for designing audit procedures that are appropriate in the circumstances, but not for the purpose of expressing an opinion on the effectiveness of the Company’s internal control over financial reporting. Accordingly, we express no such opinion. An audit includes examining, on a test basis, evidence supporting the amounts and disclosures in the consolidated financial statements. An audit also includes assessing the accounting principles used and significant estimates made by management, as well as evaluating the overall consolidated financial statement presentation. We believe that our audits provide a reasonable basis for our opinion.
In our opinion, the consolidated financial statements referred to above present fairly, in all material respects, the consolidated financial position of LGI-GTIS Holdings, LLC and Subsidiaries at November 13, 2013 and December 31, 2012, and the results of their operations and their cash flows for the period from January 1, 2013 through November 13, 2013 and the year ended December 31, 2012, in conformity with U.S. generally accepted accounting principles.
/s/ Armanino LLP
San Ramon, California
March 31, 2014
55
REPORT OF INDEPENDENT REGISTERED PUBLIC ACCOUNTING FIRM
The Board of Directors and Shareholders
LGI-GTIS Holdings II, LLC and Subsidiaries
We have audited the accompanying consolidated balance sheets of LGI-GTIS Holdings II, LLC and Subsidiaries (the Company) as of November 13, 2013 and December 31, 2012, and the related consolidated statements of operations, members’ equity, and cash flows for the period from January 1, 2013 through November 13, 2013 and the year ended December 31, 2012. These consolidated financial statements are the responsibility of the Company’s management. Our responsibility is to express an opinion on these consolidated financial statements based on our audits.
We conducted our audits in accordance with the standards of the Public Company Accounting Oversight Board (United States). Those standards require that we plan and perform the audits to obtain reasonable assurance about whether the consolidated financial statements are free of material misstatement. We were not engaged to perform an audit of the Company’s internal controls over financial reporting. An audit includes consideration of internal control over financial reporting as a basis for designing audit procedures that are appropriate in the circumstances, but not for the purpose of expressing an opinion on the effectiveness of the Company’s internal control over financial reporting. Accordingly, we express no such opinion. An audit includes examining, on a test basis, evidence supporting the amounts and disclosures in the financial statement. An audit also includes assessing the accounting principles used and significant estimated made by management, as well as evaluating the overall consolidated financial statement presentation. We believe that our audits provide a reasonable basis for our opinion.
In our opinion, the consolidated financial statements referred to above present fairly, in all material respects, the consolidated financial position of LGI-GTIS Holdings II, LLC and Subsidiaries at November 13, 2013 and December 31, 2012, and the results of their operations and their cash flows for the period from January 1, 2013 through November 13, 2013 and the year ended December 31, 2012, in conformity with U.S. generally accepted accounting principles.
/s/ Armanino LLP
San Ramon, California
March 31, 2014
56
REPORT OF INDEPENDENT REGISTERED PUBLIC ACCOUNTING FIRM
The Board of Directors and Shareholders
LGI-GTIS Holdings III, LLC and Subsidiaries
We have audited the accompanying consolidated balance sheets of LGI-GTIS Holdings III, LLC and Subsidiaries (the Company) as of November 13, 2013 and December 31, 2012, and the related consolidated statements of operations, members’ equity, and cash flows for the period from January 1, 2013 through November 13, 2013 and the year ended December 31, 2012. These consolidated financial statements are the responsibility of the Company’s management. Our responsibility is to express an opinion on these consolidated financial statements based on our audits.
We conducted our audits in accordance with the standards of the Public Company Accounting Oversight Board (United States). Those standards require that we plan and perform the audits to obtain reasonable assurance about whether the consolidated financial statements are free of material misstatement. We were not engaged to perform an audit of the Company’s internal controls over financial reporting. An audit includes consideration of internal control over financial reporting as a basis for designing audit procedures that are appropriate in the circumstances, but not for the purpose of expressing an opinion on the effectiveness of the Company’s internal control over financial reporting. Accordingly, we express no such opinion. An audit includes examining, on a test basis, evidence supporting the amounts and disclosures in the consolidated financial statements. An audit also includes assessing the accounting principles used and significant estimates made by management, as well as evaluating the overall consolidated financial statement presentation. We believe that our audits provide a reasonable basis for our opinion.
In our opinion, the consolidated financial statements referred to above present fairly, in all material respects, the financial position of LGI-GTIS Holdings Ill, LLC and Subsidiaries at November 13, 2013 and December 31, 2012, and the results of their operations and their cash flows for the the period from January 1, 2013 through November 13, 2013 and the year ended December 31, 2012, in conformity with U.S. generally accepted accounting principles.
/s/ Armanino LLP
San Ramon, California
March 31, 2014
57
REPORT OF INDEPENDENT REGISTERED PUBLIC ACCOUNTING FIRM
The Board of Directors and Shareholders
LGI-GTIS Holdings IV, LLC and Subsidiaries
We have audited the accompanying consolidated balance sheets of LGI-GTIS Holdings IV, LLC and Subsidiaries (the “Company”) as of November 13, 2013 and December 31, 2012, and the related consolidated statements of operations, members’ equity, and cash flows for the period from January 1, 2013 through November 13, 2013 and the period from October 31, 2012 (Inception) through December 31, 2012. These consolidated financial statements are the responsibility of the Company’s management. Our responsibility is to express an opinion on these consolidated financial statements based on our audit.
We conducted our audit in accordance with the standards of the Public Company Accounting Oversight Board (United States). Those standards require that we plan and perform the audits to obtain reasonable assurance about whether the consolidated financial statements are free of material misstatement. We were not engaged to perform an audit of the Company’s internal controls over financial reporting. An audit includes consideration of internal control over financial reporting as a basis for designing audit procedures that are appropriate in the circumstances, but not for the purpose of expressing an opinion on the effectiveness of the Company’s internal control over financial reporting. Accordingly, we express no such opinion. An audit includes examining, on a test basis, evidence supporting the amounts and disclosures in the consolidated financial statements. An audit also includes assessing the accounting principles used and significant estimates made by management, as well as evaluating the overall consolidated financial statement presentation. We believe that our audit provides a reasonable basis for our opinion.
In our opinion, the consolidated financial statements referred to above present fairly, in all material respects, the financial position of LGI-GTIS Holdings IV, LLC and Subsidiaries at November 13, 2013 and December 31, 2012, and the results of their operations and their cash flows for the period from January 1, 2013 through November 13, 2013 and the period from October 31, 2012 (Inception) through December 31, 2012, in conformity with U.S. generally accepted accounting principles.
/s/ Armanino LLP
San Ramon, California
March 31, 2014
58
LGI HOMES, INC.
CONSOLIDATED BALANCE SHEETS
(In thousands, except share data)
December 31, | ||||||||
2014 | 2013 | |||||||
ASSETS | ||||||||
Cash and cash equivalents | $ | 31,370 | $ | 54,069 | ||||
Accounts receivable | 7,365 | 5,402 | ||||||
Real estate inventory | 367,908 | 141,983 | ||||||
Pre-acquisition costs and deposits | 9,878 | 3,703 | ||||||
Deferred tax assets, net | — | 288 | ||||||
Property and equipment, net | 1,610 | 845 | ||||||
Other assets | 7,515 | 1,992 | ||||||
Goodwill and intangible assets, net | 12,481 | 12,728 | ||||||
Total assets | $ | 438,127 | $ | 221,010 | ||||
LIABILITIES AND EQUITY | ||||||||
Accounts payable | $ | 15,479 | $ | 14,001 | ||||
Accrued expenses and other liabilities | 21,365 | 7,100 | ||||||
Deferred tax liabilities, net | 2,685 | — | ||||||
Notes payable | 216,099 | 35,535 | ||||||
Total liabilities | 255,628 | 56,636 | ||||||
COMMITMENTS AND CONTINGENCIES (Note 14) | ||||||||
EQUITY | ||||||||
Common stock, par value $0.01, 250,000,000 shares authorized, 20,849,044 shares issued and 19,849,044 shares outstanding as of December 31, 2014 and 20,763,449 shares issued and outstanding as of December 31, 2013 | 208 | 208 | ||||||
Additional paid-in capital | 163,520 | 157,056 | ||||||
Retained earnings | 35,321 | 7,110 | ||||||
Treasury stock, at cost: 1,000,000 shares at December 31, 2014 | (16,550 | ) | — | |||||
Total equity | 182,499 | 164,374 | ||||||
Total liabilities and equity | $ | 438,127 | $ | 221,010 | ||||
See accompanying notes to the consolidated financial statements.
59
LGI HOMES, INC.
CONSOLIDATED STATEMENTS OF OPERATIONS
(In thousands, except share and per share data)
For the Year Ended December 31, | ||||||||||||
2014 | 2013 | 2012 | ||||||||||
Revenues: | ||||||||||||
Home sales | $ | 383,268 | $ | 160,067 | $ | 73,820 | ||||||
Management and warranty fees | — | 2,729 | 2,401 | |||||||||
Total revenues | 383,268 | 162,796 | 76,221 | |||||||||
Cost of sales | 280,481 | 121,326 | 54,531 | |||||||||
Selling expenses | 36,672 | 15,769 | 7,269 | |||||||||
General and administrative | 23,744 | 13,604 | 6,096 | |||||||||
Income from unconsolidated LGI/GTIS Joint Ventures | — | (4,287 | ) | (1,526 | ) | |||||||
Operating income | 42,371 | 16,384 | 9,851 | |||||||||
Interest expense, net | — | 51 | 1 | |||||||||
Gain on remeasurement of interests in LGI/GTIS Joint Ventures | — | (6,446 | ) | — | ||||||||
Other income, net | (708 | ) | (24 | ) | (173 | ) | ||||||
Net income before income taxes | 43,079 | 22,803 | 10,023 | |||||||||
Income tax provision | 14,868 | 1,066 | 155 | |||||||||
Net income | 28,211 | 21,737 | 9,868 | |||||||||
(Income) loss attributable to non-controlling interests | — | 590 | (163 | ) | ||||||||
Net income attributable to owners | $ | 28,211 | $ | 22,327 | $ | 9,705 | ||||||
Earnings per share: | ||||||||||||
Basic | $ | 1.37 | $ | 0.34 | (1) | |||||||
Diluted | $ | 1.33 | $ | 0.34 | (1) | |||||||
Weighted average shares outstanding: | ||||||||||||
Basic | 20,666,758 | 20,763,449 | (1) | |||||||||
Diluted | 21,202,967 | 20,834,124 | (1) | |||||||||
(1) For the year ended December 31, 2013 earnings per share and weighted average shares outstanding are presented for the period from November 13, 2013 (post Reorganization Transactions and date of closing of IPO) to December 31, 2013. See Note 11 - Equity for calculation of earnings per share.
See accompanying notes to the consolidated financial statements.
60
LGI HOMES, INC.
CONSOLIDATED STATEMENTS OF EQUITY
(In thousands, except share data)
Common Stock | Additional Paid-In Capital | Retained Earnings | Treasury Stock | Total Owners’ Equity | Non- Controlling Interests | Total Equity | ||||||||||||||||||||||||
Shares | Amount | |||||||||||||||||||||||||||||
BALANCE—December 31, 2011 | — | $ | — | $ | — | $ | — | $ | — | $ | 12,991 | $ | 1,644 | $ | 14,635 | |||||||||||||||
Net income | — | — | — | — | — | 9,705 | 163 | 9,868 | ||||||||||||||||||||||
Contributions | — | — | — | — | — | 6,650 | — | 6,650 | ||||||||||||||||||||||
Distributions | — | — | — | — | — | (4,135 | ) | (1,807 | ) | (5,942 | ) | |||||||||||||||||||
BALANCE—December 31, 2012 | — | $ | — | $ | — | $ | — | $ | — | $ | 25,211 | $ | — | $ | 25,211 | |||||||||||||||
Net income (loss) before Reorganization Transactions (Note 1) | — | — | — | — | — | 15,217 | (590 | ) | 14,627 | |||||||||||||||||||||
Contributions | — | — | — | — | — | 2,535 | 15,797 | 18,332 | ||||||||||||||||||||||
Distributions | — | — | — | — | — | (9,111 | ) | — | (9,111 | ) | ||||||||||||||||||||
Issuance of shares in connection with formation of LGI Homes, Inc., July 9, 2013 | 1,000 | — | 1 | — | — | — | — | 1 | ||||||||||||||||||||||
Issuance of shares in connection with Reorganization Transactions | 10,003,358 | 100 | 48,959 | — | — | (33,852 | ) | (15,207 | ) | — | ||||||||||||||||||||
Issuance of restricted stock units in settlement of accrued bonuses | — | — | 1,026 | — | — | — | — | 1,026 | ||||||||||||||||||||||
Compensation expense for equity awards | — | — | 43 | — | — | — | — | 43 | ||||||||||||||||||||||
Issuance of shares in Initial public offering, net of underwriting fees and offering expenses of $11,216 | 10,350,000 | 104 | 102,531 | — | — | — | — | 102,635 | ||||||||||||||||||||||
Issuance of shares for GTIS Acquisitions | 409,091 | 4 | 4,496 | — | — | — | — | 4,500 | ||||||||||||||||||||||
Net income post Reorganization Transactions | — | — | — | 7,110 | — | — | — | 7,110 | ||||||||||||||||||||||
BALANCE—December 31, 2013 | 20,763,449 | $ | 208 | $ | 157,056 | $ | 7,110 | $ | — | $ | — | $ | — | $ | 164,374 | |||||||||||||||
Net income | — | — | — | 28,211 | — | — | — | 28,211 | ||||||||||||||||||||||
Issuance of restricted stock units in settlement of accrued bonuses | — | — | 642 | — | — | — | — | 642 | ||||||||||||||||||||||
Compensation expense for equity awards | — | — | 862 | — | — | — | — | 862 | ||||||||||||||||||||||
Tax benefit from stock-based compensation | — | — | 356 | — | — | — | — | 356 | ||||||||||||||||||||||
Stock issued under employee incentive plans, net of shares withheld for employee taxes | 85,595 | — | (596 | ) | — | — | — | — | (596 | ) | ||||||||||||||||||||
Issuance of Convertible Notes, equity portion, net of issuance costs of $297 and tax effect of $2,971 | — | — | 5,200 | — | — | — | — | 5,200 | ||||||||||||||||||||||
Repurchase of stock | — | — | — | — | (16,550 | ) | — | — | (16,550 | ) | ||||||||||||||||||||
BALANCE—December 31, 2014 | 20,849,044 | $ | 208 | $ | 163,520 | $ | 35,321 | $ | (16,550 | ) | $ | — | $ | — | $ | 182,499 | ||||||||||||||
See accompanying notes to the consolidated financial statements.
61
LGI HOMES, INC.
CONSOLIDATED STATEMENTS OF CASH FLOWS
(In thousands)
For the Year Ended December 31, | ||||||||||||
2014 | 2013 | 2012 | ||||||||||
Cash flows from operating activities: | ||||||||||||
Net income | $ | 28,211 | $ | 21,737 | $ | 9,868 | ||||||
Adjustments to reconcile net income to net cash provided by (used in) operating activities: | ||||||||||||
Income from unconsolidated LGI/GTIS Joint Ventures | — | (4,287 | ) | (1,526 | ) | |||||||
Distributions from unconsolidated LGI/GTIS Joint Ventures | — | 4,414 | 1,545 | |||||||||
Gain on remeasurement of interests in LGI/GTIS Joint Ventures | — | (6,446 | ) | — | ||||||||
Depreciation and amortization | 825 | 292 | 185 | |||||||||
Gain on settlement of participation fee obligation | — | (9 | ) | — | ||||||||
Loss on disposal of assets | 14 | 56 | — | |||||||||
Settlement of accrued bonuses with restricted stock units | — | 1,026 | — | |||||||||
Excess tax benefits from stock based compensation | (356 | ) | — | — | ||||||||
Compensation expense for equity awards | 862 | 43 | — | |||||||||
Deferred income taxes | 1 | (288 | ) | — | ||||||||
Changes in assets and liabilities: | ||||||||||||
Accounts receivable | (1,963 | ) | (3,871 | ) | (205 | ) | ||||||
Real estate inventory | (198,357 | ) | (74,595 | ) | (15,963 | ) | ||||||
Pre-acquisition costs and deposits | (6,066 | ) | (2,705 | ) | (426 | ) | ||||||
Other assets | (617 | ) | 286 | (946 | ) | |||||||
Accounts payable | 1,480 | 5,827 | 1,670 | |||||||||
Accrued expenses and other liabilities | 2,752 | 4,031 | 1,145 | |||||||||
Net cash used in operating activities | (173,214 | ) | (54,489 | ) | (4,653 | ) | ||||||
Cash flows from investing activities: | ||||||||||||
Payment for business acquisitions, net of cash acquired | (15,169 | ) | (30,139 | ) | — | |||||||
Purchases of property and equipment | (1,195 | ) | (685 | ) | (435 | ) | ||||||
Capital investments in unconsolidated LGI/GTIS Joint Ventures | — | (928 | ) | (2,244 | ) | |||||||
Capital distributions from unconsolidated LGI/GTIS Joint Ventures | — | 458 | 33 | |||||||||
Proceeds from disposal of assets | — | 35 | 1 | |||||||||
Net cash used in investing activities | (16,364 | ) | (31,259 | ) | (2,645 | ) | ||||||
Cash flows from financing activities: | ||||||||||||
Proceeds from credit facilities | 147,400 | 72,932 | 46,364 | |||||||||
Payments on credit facilities | (43,531 | ) | (52,042 | ) | (37,810 | ) | ||||||
Issuance of convertible notes | 85,000 | — | — | |||||||||
Loan issuance costs | (5,200 | ) | — | — | ||||||||
Taxes paid on issuance of stock | (596 | ) | — | — | ||||||||
Stock repurchases | (16,550 | ) | — | — | ||||||||
Excess tax benefits from stock based compensation | 356 | — | — | |||||||||
Contributions from owners | — | 2,535 | 6,650 | |||||||||
Distributions to owners | — | (9,111 | ) | (4,135 | ) | |||||||
Proceeds from sale of stock, net of offering expenses | — | 102,636 | — | |||||||||
Contributions from non-controlling interests | — | 15,797 | — | |||||||||
Distributions to non-controlling interests | — | — | (1,807 | ) | ||||||||
Net cash provided by financing activities | 166,879 | 132,747 | 9,262 | |||||||||
Net increase (decrease) in cash and cash equivalents | (22,699 | ) | 46,999 | 1,964 | ||||||||
Cash and cash equivalents, beginning of year | 54,069 | 7,070 | 5,106 | |||||||||
Cash and cash equivalents, end of year | $ | 31,370 | $ | 54,069 | $ | 7,070 | ||||||
See accompanying notes to the consolidated financial statements.
62
LGI HOMES, INC.
NOTES TO THE CONSOLIDATED FINANCIAL STATEMENTS
1. ORGANIZATION AND BUSINESS
Organization and Description of the Business
LGI Homes, Inc. a Delaware corporation (the “Company”), was organized on July 9, 2013 as a holding company for the purposes of facilitating the initial public offering (the “IPO”) of its common stock in November 2013.
The Company's principal business is the development of communities and the design, construction and sale of homes. At December 31, 2014, the Company had operations in Texas, Arizona, Florida, Georgia, New Mexico, Colorado, North Carolina and South Carolina.
Initial Public Offering and Reorganization Transactions
On November 13, 2013, the Company completed the IPO and received net proceeds of $102.6 million. In conjunction with the IPO, the Company completed the reorganization of LGI Homes Group, LLC and LGI Homes Corporate, LLC and their consolidated subsidiaries and variable interest entities, as well as LGI Homes II, LLC, LGI Homes - Sunrise Meadow, LLC, LGI Homes - Canyon Crossing, LLC, and LGI Homes - Deer Creek, LLC, (collectively, the “Predecessor”) into LGI Homes, Inc. (the “Reorganization Transactions”).
Immediate family members, a father and son (the “Family Principals”), individually or jointly owned more than 50% of the voting ownership interest of each entity comprising the Predecessor. The Predecessor entities and the Company were under common management, operated in the same business, and were controlled by the Family Principals immediately before and after the Reorganization Transactions. Following the reorganization, the entities that comprised the Predecessor are wholly-owned subsidiaries of the Company. The Reorganization Transactions were accounted for at the transaction date as a consolidation of entities under common control. In addition, since the Predecessor controlled LGI Fund III Holdings, LLC before and after the IPO, the Company accounted for the acquisition of the non-controlling interests as an equity transaction. The accompanying consolidated financial statements present the historical financial statements of the Predecessor as though they were owned by LGI Homes, Inc. prior to the Reorganization Transactions.
2. ACQUISITIONS
Oakmont Acquisition
On October 2, 2014, the Company acquired certain home building assets and liabilities of Oakmont Home Builders, Inc. (“Oakmont”) and certain land positions of EST Properties, LLC, an affiliate of Oakmont (the “Oakmont Acquisition”). As a result of the Oakmont Acquisition, the Company established an immediate presence in residential homebuilding in the Charlotte, North Carolina, market acquiring 150 homes under construction and more than 1,000 owned and controlled lots. The total purchase price for the Oakmont Acquisition is approximately $17.3 million, consisting of approximately $15.2 million, in cash and a contingent earnout based on home closings through December 31, 2017. The fair value of the earnout at the acquisition date is estimated to be approximately $2.2 million.
The acquisition was accounted for in accordance with ASC Topic 805, “Business Combinations”, (“ASC 805”), and the acquired assets and assumed liabilities have been recorded at their estimated fair values at the acquisition date as noted below (amounts in thousands):
Purchase Consideration: | Total | |||
Cash paid for net assets | $ | 15,169 | ||
Contingent consideration (earnout) | 2,162 | |||
Total consideration | $ | 17,331 | ||
Assets acquired and liabilities assumed: | ||||
Real estate inventory | $ | 20,227 | ||
Pre-acquisition costs, deposits and other assets | 177 | |||
Total Assets | $ | 20,404 | ||
Accounts payable and accrued liabilities | (2,682 | ) | ||
Customer deposits | (391 | ) | ||
Total Liabilities | (3,073 | ) | ||
Net assets acquired | $ | 17,331 | ||
63
Preacquisition costs and deposits, accounts payable and accrued liabilities, and customer deposits are stated at historical carrying values given the short-term nature of these assets and liabilities. Real estate inventory was adjusted to reflect fair value. There were no significant intangible assets acquired in connection with the Oakmont Acquisition.
The Company determined the estimated fair values of the real estate inventory with the assistance of appraisals performed by independent third-party specialists, discounted cash flow analyses and estimates by management. The fair value of the earnout on the acquisition date of approximately $2.2 million was determined based on the forecasted number of home closings adjusted to reflect probability weighted absorption scenarios and a 10% discount rate. The actual amount of the earnout may be more or less than the $2.6 million undiscounted amount estimated and will be based on the actual number of homes closed from the acquired assets and the timing of the home closings. The maximum potential earnout has been estimated to be approximately $3.1 million based on the expected absorption rate for the acquired assets, including the timing of land development activities. The earnout liability is included in other liabilities on the consolidated balance sheet and will be subject to adjustment based on revisions to the forecasted absorption rate and the actual number of homes closed during the earnout period.
Significant assumptions included in our estimates of the fair value of the assets acquired and the earnout include future development costs and the timing of the completion of development activities, absorption rates, mix of products sold in each community, and the discount rate. Based on the estimated purchase consideration, management believes that the purchase price for the Oakmont Acquisition was at market value and there was no excess of purchase price over the net fair value of assets acquired and liabilities assumed.
The Company has expensed approximately $0.7 million of acquisition related costs for legal and due diligence services; these costs are included in the general and administrative expenses in the accompanying consolidated statements of operations.
During the quarter ended December 31, 2014, the Company closed 71 homes attributable to the Oakmont Acquisition resulting in a $284,000 earnout obligation payable during the first quarter of 2015.
LGI/GTIS Joint Venture Partners' Interests
Concurrent with the IPO, the Company acquired from GTIS Partners, LP and its affiliated entities (''GTIS'') all of GTIS’ equity interests in four unconsolidated joint ventures with the Predecessor, namely LGI-JV Holdings, LLC (formerly LGI-GTIS Holdings, LLC), LGI-JV Holdings II, LLC (formerly LGI-GTIS Holdings II, LLC), LGI-JV Holdings III, LLC (formerly LGI-GTIS Holdings III, LLC) and LGI-JV Holdings IV, LLC (formerly LGI-GTIS Holdings IV, LLC) (collectively, the “LGI/GTIS Joint Ventures”), in exchange for aggregate consideration of $41.3 million, consisting of cash of approximately $36.8 million and 409,091 shares of the Company’s common stock valued at $4.5 million on the IPO date (the “GTIS Acquisitions”). As discussed at Note 6, the LGI/GTIS Joint Ventures were historically accounted for as unconsolidated joint ventures under the equity method of accounting. As a result of the GTIS Acquisitions, the Company began consolidating the entities. As required by ASC 805, the acquired assets and assumed liabilities have been accounted for at fair value and the Predecessor’s historical interests in the joint ventures have been remeasured at fair value.
In connection with the purchase accounting, the Company recorded a gain of $6.4 million on the re-measurement of the Predecessor’s equity interest in the LGI/GTIS Joint Ventures and $12.7 million of goodwill and other intangibles. In addition, there was a $7.9 million step-up adjustment to record the acquisition date real estate inventory and lot option contracts at fair value. Approximately $2.9 million and $3.5 million of the $7.9 million fair value step-up adjustment is included in cost of sales for the years ended December 31, 2014 and 2013, respectively, related to real estate inventory and lot option contracts at November 13, 2013 that were sold during the respective periods. As of December 31, 2014, a total of $6.4 million of the step-up adjustment has been amortized to cost of sales.
In connection with the GTIS Acquisitions, certain rights to the LGI Homes trade name were reacquired. The fair value of this intangible asset was calculated based upon the forecasted revenues of the LGI/GTIS Joint Ventures using a relief-from-royalty valuation model. The intangible asset was valued at $0.7 million and is being amortized on a straight line basis over 3 years. Amortization expense related to the intangible was approximately $0.2 million and $31,000 for the years ended December 31, 2014 and 2013, respectively. Amortization expense for the remaining balance will be approximately $0.2 million and $0.2 million in 2015 and 2016, respectively.
The supplemental pro forma information presented below (in thousands) presents the home sales revenues, cost of sales, and net income before income taxes of the Company for 2013 and 2012 as if the GTIS Acquisitions date had been completed on January 1, 2012.
The pro forma adjustments are based upon available information and certain assumptions that we believe are reasonable under the circumstances. The pro forma consolidated financial data is presented for informational purposes only. The pro forma consolidated financial data does not purport to represent what our results of operations would have been had the GTIS Acquisitions actually occurred on January 1, 2012 and does not purport to project our results of operations for any future period.
64
For the Year Ended December 31, | ||||||||
Unaudited Pro Forma Financial Information | 2013 | 2012 | ||||||
Home sales revenues | $ | 240,963 | $ | 143,378 | ||||
Cost of sales | $ | 179,831 | $ | 104,229 | ||||
Net income before income taxes | $ | 22,922 | $ | 18,614 | ||||
The pro forma results have been adjusted to reflect the elimination of the Predecessor's equity in earnings of the LGI/GTIS Joint Ventures. The pro forma results also reflect $0.2 million each year for the amortization expense related to the marketing intangible asset. The pro forma financial information excludes the impact of the gain on re-measurement and the incremental impact of the fair value step-up adjustment of real estate inventory and lot option contracts as these are considered to be non-recurring items.
3. SUMMARY OF SIGNIFICANT ACCOUNTING POLICIES
Basis of Presentation
The consolidated financial statements have been prepared in accordance with U.S. Generally Accepted Accounting Principles (“GAAP”) and include the accounts of LGI Homes, Inc. and all of its subsidiaries subsequent to November 13, 2013, the closing date for the Reorganization Transactions and the IPO. All intercompany balances and transactions have been eliminated in consolidation.
For the periods prior to the Reorganization Transactions, the accompanying consolidated financial statements include the accounts of LGI Homes, Inc. and the results of operations since the date of its formation, July 9, 2013, and the Predecessor's historical combined accounts and results of operations for January 1, 2012 to November 13, 2013. All intercompany balances and transactions have been eliminated in consolidation and all intracompany balances and transactions have been eliminated in combination.
Use of Estimates
The preparation of financial statements in conformity with GAAP requires management to make estimates and assumptions that affect the reported amounts of assets and liabilities and disclosure of contingent assets and liabilities at the date of the financial statements and the reported amounts of revenues and expenses during the reporting period. Actual results could differ from those estimates, and these differences could have a significant impact on the financial statements. The significant accounting estimates include real estate inventory and cost of sales, impairment of real estate inventory and property and equipment, warranty reserves, earnout contingent consideration, the fair value of the convertible debt, and loss contingencies.
Cash and Cash Equivalents and Concentration of Credit Risk
Cash and cash equivalents are defined as cash on hand, demand deposits with financial institutions, and short-term liquid investments with an initial maturity date of less than three months. The Company’s cash in demand deposit accounts may exceed federally insured limits and could be negatively impacted if the underlying financial institutions fail or are subject to other adverse conditions in the financial markets. To date, the Company has experienced no loss or diminished access to cash in their demand deposit accounts.
Accounts Receivable
Accounts receivable consist primarily of proceeds due from title companies for sales closed prior to period end and are generally collected within a few days from closing.
Real Estate Inventory
Inventory consists of land, land under development, finished lots, sales offices, homes in progress, and completed homes. Inventory is stated at cost unless the carrying amount is determined not to be recoverable, in which case the affected inventory is written down to fair value.
65
Land, development and other project costs, including interest and property taxes incurred during development and home construction and net of expected reimbursements of development costs, are capitalized to real estate inventory. Land development and other common costs that benefit the entire community, including field construction supervision and related direct overhead, are allocated to individual lots or homes, as appropriate. The costs of lots are transferred to homes in progress when home construction begins. Home construction costs and related carrying charges are allocated to the cost of individual homes using the specific identification method. Costs that are not specifically identifiable to a home are allocated on a pro rata basis using either the lot size or relative sales value. Inventory costs for completed homes are expensed to cost of sales as homes are sold. Changes to estimated total development costs subsequent to initial home closings in a community are generally allocated to the remaining unsold lots and homes in the community on a pro rata basis.
The life cycle of a community generally ranges from two to five years, commencing with the acquisition of land, continuing through the land development phase, and concluding with the construction and sale of homes. A constructed home is used as the community sales office during the life of the community and then sold. Actual individual community lives will vary based on the size of the community, the sales absorption rate, and whether the property was purchased as raw land or finished lots.
In accordance with the ASC Topic 360, Property, Plant, and Equipment, real estate inventory is evaluated for indicators of impairment by each community during each reporting period. In conducting its review for indicators of impairment on a community level, management evaluates, among other things, the margins on homes that have been sold, communities with slow moving inventory, projected margins on future home sales over the life of the community, and the estimated fair value of the land. For individual communities with indicators of impairment, additional analysis is performed to estimate the community’s undiscounted future cash flows. If the estimated undiscounted future cash flows are greater than the carrying value of the community group of assets, no impairment adjustment is required. If the undiscounted cash flows are less than the community’s carrying value, the asset group is impaired and is written down to its fair value. The Company estimates the fair value of communities using a discounted cash flow model. As of December 31, 2014 and 2013, the real estate inventory is stated at cost; there were no inventory impairment charges recorded during the years ended December 31, 2014, 2013 and 2012.
Capitalized Interest
Interest and other financing costs are capitalized as cost of inventory during community development and home construction activities, in accordance with ASC Topic 835, Interest and expensed in cost of sales as homes in the community are sold. To the extent the debt exceeds qualified assets, a portion of the interest incurred is expensed.
Pre-Acquisition Costs and Deposits
Amounts paid for land options, deposits on land purchase contracts, and other pre-acquisition costs are capitalized and classified as deposits to purchase. Upon execution of the purchase, these deposits are applied to the acquisition price of the land and recorded as a cost component of the land in real estate inventory. To the extent that any deposits are nonrefundable and the associated land acquisition process is terminated or no longer determined probable, the deposit and related pre-acquisition costs are charged to general and administrative expense. Management reviews the likelihood of the acquisition of contracted lots in conjunction with its periodic real estate impairment analysis.
Under ASC Topic 810, Consolidation (“ASC 810”), a nonrefundable deposit paid to an entity is deemed to be a variable interest that will absorb some or all of the entity's expected losses if they occur. Non-refundable land purchase and lot option deposits generally represent the Company's maximum exposure if it elects not to purchase the optioned property. In some instances, the Company may also expend funds for due diligence, development and construction activities with respect to optioned land prior to close. Such costs are classified as preacquisition costs, which the Company would have to absorb should the option not be exercised. Therefore, whenever the Company enters into a land option or purchase contract with an entity and makes a nonrefundable deposit, it may have a variable interest in a variable interest entity (“VIE”). In accordance with ASC 810, the Company performs ongoing reassessments of whether it is the primary beneficiary of a VIE and would consolidate the VIE if the Company is deemed to be the primary beneficiary. As of December 31, 2014 and December 31, 2013, the Company was not deemed to be the primary beneficiary for any VIEs associated with non-refundable land deposit and option contracts.
Deferred Loan Costs
Deferred loan costs represent debt issuance costs and, depending on the nature and purpose of the loan, are capitalized to real estate inventory or amortized to interest expense using the straight-line method which approximates the effective interest method.
66
Property and Equipment
Property, equipment and leasehold improvements are stated at cost, less accumulated depreciation. Depreciation expense is recorded in general and administrative expenses. Upon sale or retirement, the costs and related accumulated depreciation are eliminated from the respective accounts and any resulting gain or loss is included in other income, net. Depreciation is generally computed using the straight-line method over the estimated useful lives of the assets, ranging from 2 to 5 years for property and equipment. Leasehold improvements are depreciated over the shorter of the asset life or the term of the lease. Maintenance and repair costs are expensed as incurred.
Impairments of long-lived assets are determined periodically when indicators of impairment are present. If such indicators are present, the determination of the amount of impairment is based on judgments as to the future undiscounted operating cash flows to be generated from these assets throughout the remaining estimated useful lives. If these undiscounted cash flows are less than the carrying amount of the related asset, impairment is recognized for the excess of the carrying value over its fair value. There were no impairments of property, equipment and leasehold improvements recorded during the years ended December 31, 2014, 2013 and 2012.
Investments in Joint Ventures and Unconsolidated Variable Interest Entities (VIEs)
The Predecessor functioned as the managing member of several joint ventures conducting homebuilding activities; these joint ventures became wholly-owned subsidiaries of the Company as a result of the Reorganization Transactions and the GTIS Acquisitions.
In accordance with ASC 810, management had assessed whether these entities were VIEs. The Predecessor had variable interests in the joint venture arrangements that it managed, and these joint ventures were determined to be VIEs because the members of the joint ventures, as a group, had insufficient equity at risk without further capital contributions. The Predecessor’s rights as well as the rights held by the other joint venture members had been evaluated to determine the primary beneficiary of the VIE, including the extent of substantive participating rights and control of activities that most significantly affected its economic performance. Such activities included, but were not limited to, the ability to determine the budget and scope of land development work, if any; the ability to control financing decisions for the VIE; and the ability to acquire additional land into the VIE. If the Predecessor was not able to control the significant decisions, the Predecessor was not considered the primary beneficiary of the VIE. If the Predecessor was determined to be the primary beneficiary of the VIE, the entity was consolidated in the Predecessor's financial statements.
The Predecessor had investments in four joint ventures where the Predecessor and the other joint venture members were deemed to have joint control and the Predecessor was not the primary beneficiary since all major decisions required both parties’ consent. Accordingly, the Predecessor’s interests in these joint ventures were accounted for using the equity method and its share of the joint ventures’ net earnings was included in income from unconsolidated joint ventures and investments in unconsolidated joint ventures. Distributions received were credited against the related investment in the joint venture.
In addition, the Predecessor had interests in two VIE’s (LGI Homes – Sterling Lakes, LLC and LGI Fund III Holdings, LLC) where it had been determined that the Predecessor was the primary beneficiary. In addition to the Predecessor serving as the managing member of these entities, the Family Principals of the Predecessor also held the general partner controlling interests in the non-managing members of the VIEs. As a result, the Predecessor combined with the Family Principals’ related party interests had the power to direct all significant activities of the VIEs, and had exposure to the risks and rewards of the VIEs, based on the division of income and loss pursuant to the joint venture agreement and the Predecessor’s ownership in the joint ventures. These two VIEs are consolidated in the accompanying consolidated financial statements.
Management evaluated the Company’s investments in unconsolidated entities for indicators of impairment during each reporting period. No impairment charges were recorded related to investments in unconsolidated entities during the periods presented.
Goodwill and Intangible Assets
The excess of the purchase price of a business acquisition over the net fair value of assets acquired and liabilities assumed is capitalized as goodwill in accordance with ASC 805. Goodwill and intangible assets that do not have finite lives are not amortized, but are assessed for impairment at least annually or more frequently if certain impairment indicators are present. The Company recorded $12.0 million of goodwill related to the GTIS Acquisitions. No goodwill impairment charges were recorded in 2014 and 2013.
67
The cost of a marketing intangible asset acquired valued at $0.7 million related to the GTIS Acquisitions is being amortized over its estimated useful life of 3 years. When certain events or changes in operating conditions occur, the estimated future undiscounted cash flows associated with the asset are compared to the asset’s carrying amount to determine if an impairment of such asset is necessary. For intangible assets that are amortized, a review is performed of their estimated useful lives to evaluate whether events and circumstances warrant a revision to the remaining useful life. No impairment charges were recorded in 2014 and 2013 associated with the marketing intangible asset.
Warranty Reserves
Future direct warranty costs are accrued and charged to cost of sales in the period when the related home is sold. The Company’s warranty liability is based upon historical warranty cost experience and is adjusted as appropriate to reflect qualitative risks associated with the types of homes built, the geographic areas in which they are built, and potential impacts of the Company's continued expansion.
Warranty reserves are reviewed quarterly to assess the reasonableness and adequacy and to make adjustments to the balance of the pre-existing reserves, as needed, to reflect changes in trends and historical data as information becomes available.
Customer Deposits
Customer deposits are received upon signing a purchase contract and are generally $1,000 or less. Deposits are generally refundable if the customer is unable to obtain financing. Forfeited buyer deposits related to home sales are recognized in other income in the period in which it is determined that the buyer will not complete the purchase of the property and the deposit is nonrefundable to the buyer.
Home Sales
In accordance with ASC Topic 360—20, Real Estate Sales, revenues from home sales are recorded at the time each home sale is closed, title and possession are transferred to the buyer, and the Company has no significant continuing involvement with the home. Home sales proceeds are generally received from the title company within a few days after closing. Home sales are reported net of sales discounts and incentives granted to home buyers, which are primarily seller-paid closing costs.
Cost of Sales
As discussed under Real Estate Inventory above, cost of sales for homes closed include the construction costs of each home and allocable land acquisition and land development costs, capitalized interest, and other related common costs (both incurred and estimated to be incurred).
Selling and Commission Costs
Sales commissions are paid and expensed based on homes sold. Other selling costs are expensed in the period incurred.
Advertising Costs
Advertising and direct mail costs are expensed as incurred. Advertising and direct mail costs were $8.6 million, $3.3 million and $1.8 million for the years ended December 31, 2014, 2013, and 2012, respectively.
Income Taxes
LGI Homes, Inc. is a taxable entity. Prior to the Reorganization Transactions, the Predecessor consisted of limited liability companies and limited partnerships, all of which were treated as partnerships for income tax purposes and federal income taxes on taxable income or losses realized by the Predecessor were the obligation of the individual members or partners. As a result of the Reorganization Transactions, the Predecessor entities are subject to federal and state income taxes. The accompanying financial statements include a provision for income taxes based on the period when the Company’s operations are taxable.
The Company utilizes the liability method of accounting for income taxes. Under the liability method, deferred tax assets and liabilities are recognized using enacted tax rates for the effect of temporary differences between the book and tax bases of recorded assets and liabilities. Deferred tax assets are reduced by a valuation allowance if it is more likely than not that some portion or all of the net deferred tax assets will not be realized. The Company’s ability to realize deferred tax assets is assessed
68
throughout the year and a valuation allowance is established, if required. The Company recognizes the impact of a tax position only if it is more likely than not to be sustained upon examination based on the technical merits of the position. The Company recognizes potential interest and penalties related to uncertain tax positions in income tax expense.
The Company files income tax returns in the U.S. federal jurisdiction and in various states and does not have any unrecognized tax benefits. The Company is not presently under exam for income tax by any taxing jurisdiction, and no longer remains subject to exam for years before 2011 (2010 for Texas).
Prior to the Reorganization Transactions, the Predecessor was subject to certain state taxes and fees, including the Texas margin tax, where applicable. There were no significant deferred income taxes related to state income taxes for the year ended December 31, 2012.
Earnings Per Share
Basic earnings per share is based on the weighted average number of shares of common stock outstanding. Diluted earnings per share is based on the weighted average number of shares of common stock and dilutive securities outstanding. Diluted earnings per share gives effect to all dilutive potential shares outstanding during the period using the treasury stock method and for the Company's 4.25% Convertible Notes due 2019 (the “Convertible Notes”) using the if-converted method. Diluted earnings per share excludes all dilutive potential shares of common stock if their effect is antidilutive.
Stock-Based Compensation
Compensation costs for non-performance-based restricted stock awards are measured using the closing price of our common stock on the date of grant and are expensed on a straight-line basis over the vesting period of the award. Compensation costs for performance-based restricted stock awards are also measured using the closing price of the Company's common stock on the date of grant but are expensed in accordance with ASC 718-10-25-20, Compensation - Stock Compensation, which requires an assessment of probability of attainment of the performance target. Once the performance target outcome is determined to be probable, the year-to-date expense is recorded and the remaining expense is recorded on a straight-line basis through the end of the award's vesting period.
Fair Value Measurement of Financial Instruments
ASC Topic 820, Fair Value Measurements (“ASC 820”), defines fair value as “the price that would be received to sell an asset or paid to transfer a liability in an orderly transaction between market participants at the measurement date” within an entity’s principal market, if any. The principal market is the market in which the reporting entity would sell the asset or transfer the liability with the greatest volume and level of activity, regardless of whether it is the market in which the entity will ultimately transact for a particular asset or liability or if a different market is potentially more advantageous. Accordingly, this exit price concept may result in a fair value that differs from the transaction price or market price of the asset or liability.
ASC 820 provides a framework for measuring fair value under GAAP, expands disclosures about fair value measurements, and establishes a fair value hierarchy, which requires an entity to maximize the use of observable inputs and minimize the use of unobservable inputs when measuring fair value. The three levels of the fair value hierarchy are summarized as follows:
Level 1 - Fair value is based on quoted prices in active markets for identical assets or liabilities.
Level 2 - Fair value is determined using significant observable inputs, generally either quoted prices in active markets for similar assets or liabilities, or quoted prices in markets that are not active.
Level 3 - Fair value is determined using one or more significant inputs that are unobservable in active markets at the measurement date, such as a pricing model, discounted cash flow, or similar technique.
The Company utilizes fair value measurements to account for certain items and account balances within its consolidated financial statements. Fair value measurements may also be utilized on a nonrecurring basis, such as for the impairment of long-lived assets. The fair value of financial instruments, including cash and cash equivalents, accounts receivable and credit facility, approximate their carrying amounts due to the short term nature of these instruments. As of December 31, 2014, the secured credit facility has a floating interest rate, which increases or decreases with market interest rates, and is subject to an interest rate floor.
As described in Note 2, the assets and liabilities acquired in the Oakmont Acquisition and the GTIS Acquisitions were recorded at fair value determined based on Level 2 or Level 3 assumptions and valuation inputs. In addition the Predecessor’s historical interests in the LGI/GTIS Joint Ventures were adjusted to fair value determined using Level 3 unobservable assumptions and valuation inputs. The Convertible Notes, discussed in Note 9, have been recorded at estimated fair value determined using Level 2 measurements. No significant changes occurred and the recorded value at December 31, 2014 approximates fair value.
69
Recently Issued Accounting Pronouncements
In August 2014, the FASB issued ASU No. 2014-15, Presentation of Financial Statements - Going Concern (Subtopic 205-40): Disclosure of Uncertainties about an Entity’s Ability to Continue as a Going Concern (“ASU 2014-15”), which requires management to evaluate, at each reporting period, whether there are conditions or events that raise substantial doubt about the entity’s ability to continue as a going concern within one year after the date the financial statements are issued and provide related disclosures. This ASU applies to all entities and is effective for periods ending after December 15, 2016. The adoption of ASU 2014-15 is not expected to have a material effect on the Company's consolidated financial statements or disclosures.
In June 2014, the FASB issued ASU No. 2014-12, Accounting for Share-Based Payments When the Terms of an Award Provide That a Performance Target Could Be Achieved after the Requisite Service Period (“ASU 2014-12”). ASU 2014-12 requires that a performance target that affects vesting and that could be achieved after the requisite service period be treated as a performance condition. A reporting entity should apply existing guidance in Accounting Standards Codification Topic No. 718, “Compensation - Stock Compensation” (“ASC Topic 718”), as it relates to awards with performance conditions that affect vesting to account for such awards. ASU 2014-12 is effective for periods beginning after December 15, 2015. The adoption of ASU 2014-12 is not expected to have a material effect on the Company’s consolidated financial statements or disclosures.
In May 2014, the FASB issued ASU No. 2014-09, Revenue from Contracts with Customers (“ASU 2014-09”), which provides guidance for revenue recognition. ASU 2014-09 affects any entity that either enters into contracts with customers to transfer goods or services or enters into contracts for the transfer of nonfinancial assets and supersedes the revenue recognition requirements in Topic 605, “Revenue Recognition,” and most industry-specific guidance. This ASU also supersedes some cost guidance included in Subtopic 605-35, “Revenue Recognition-Construction-Type and Production-Type Contracts.” ASU 2014-09’s core principle is that a company will recognize revenue when it transfers promised goods or services to customers in an amount that reflects the consideration to which a company expects to be entitled in exchange for those goods or services. In doing so, companies will need to use more judgment and make more estimates than under today’s guidance, including identifying performance obligations in the contract, estimating the amount of variable consideration to include in the transaction price and allocating the transaction price to each separate performance obligation. ASU 2014-09 is effective for the Company beginning January 1, 2017 and, at that time, the Company may adopt the new standard under the full retrospective approach or the modified retrospective approach. Early adoption of this ASU is not permitted. The Company is currently evaluating the method and impact the adoption of ASU 2014-09 will have on the Company's consolidated financial statements and disclosures.
4. REAL ESTATE INVENTORY
The Company's real estate inventory consists of the following (in thousands):
December 31, | ||||||||
2014 | 2013 | |||||||
Land, land under development, and finished lots | $ | 244,658 | $ | 82,006 | ||||
Sales offices | 12,110 | 3,784 | ||||||
Homes in progress | 50,675 | 27,723 | ||||||
Completed homes | 60,465 | 28,470 | ||||||
Total real estate inventory | $ | 367,908 | $ | 141,983 | ||||
Interest and financing costs incurred under the Company's debt obligations, as more fully discussed in Note 9, are capitalized to qualifying real estate projects under development and homes under construction.
70
5. PROPERTY AND EQUIPMENT
Property and equipment consist of the following (in thousands):
December 31, | ||||||||||
Asset Life | 2014 | 2013 | ||||||||
(years) | ||||||||||
Computer equipment | 2-5 | $ | 738 | $ | 499 | |||||
Machinery and equipment | 5 | 52 | 169 | |||||||
Furniture and fixtures | 2-5 | 1,557 | 745 | |||||||
Leasehold improvements | various | 230 | 108 | |||||||
Total property and equipment | 2,577 | 1,521 | ||||||||
Less: Accumulated depreciation | (967 | ) | (676 | ) | ||||||
Property and equipment, net | $ | 1,610 | $ | 845 | ||||||
Depreciation expense incurred for the years ended December 31, 2014, 2013 and 2012 was $0.4 million, $0.3 million and $0.2 million, respectively.
Equipment was sold to the LGI/GTIS Joint Ventures at net book value of approximately $0.03 million during the year ended December 31, 2013. A non-cash settlement of vehicle notes payable in the amount of $0.3 million was recorded for a trade or assumption by the purchaser during the year ended December 31, 2013.
6. | INVESTMENTS IN JOINT VENTURES, VARIABLE INTEREST ENTITIES AND NON-CONTROLLING INTERESTS |
Unconsolidated Joint Ventures
Prior to the GTIS Acquisitions, the Predecessor's interests in four joint ventures LGI/GTIS Joint Ventures, were accounted for using the equity method of accounting since the Predecessor was not deemed to be the primary beneficiary of these variable interest entities.
The LGI/GTIS Joint Ventures were each engaged in homebuilding and land development activities. GTIS Partners, LP and affiliated entities (collectively “GTIS”) were joint venture members in these entities. Management of each of the LGI/GTIS Joint Ventures was vested in the members, being the Predecessor and GTIS. The Predecessor was considered the managing member of these entities. The managing member had the responsibility and authority to operate the LGI/GTIS Joint Ventures on a day-to-day basis subject to the operating budget and business plan, which was approved by both members. The Predecessor used its sales, development and operations teams to support operations and had significant influence even though the respective joint venture members had been deemed to have joint control under ASC Topic 810. All major decisions required both members’ consent. Major decisions included, but were not limited to: the acquisition or disposition of a project; capital contributions; and changes, and updates or amendments to the operating budget or business plan. Generally, the LGI/GTIS Joint Ventures did not obtain construction financing from outside lenders, but financed their activities primarily through equity contributions from each of the joint venture members.
Profits were allocated to the members of the LGI/GTIS Joint Ventures based on the predetermined formulas specified in the joint venture agreements for the allocation of distributable cash. The GTIS member and the Predecessor were allocated 85% and 15% of the profits, respectively, (the “Sharing Percentages”) until such time as the members received cash distributions equal to their initial capital investment plus, generally, a 15% internal rate of return (“First Tier Return”). Subsequent allocations of distributable cash and profits included a priority allocation of approximately 20% to 40% to the Predecessor, depending on the amount of cash distributions achieved over the life of the joint venture.
Since the internal rates of return necessary to receive a higher proportion of distributions were calculated over the life of each LGI/GTIS Joint Venture and both the timing and amount of future contributions and distributions would affect the Predecessor’s share of distributions, there was no certainty that the Predecessor would receive greater than 15% of the LGI/GTIS Joint Ventures’ distributions. Therefore, the Predecessor recorded its investments in the LGI/GTIS Joint Ventures at 15% of each venture’s capital balance and recognized the incremental amounts due to the Predecessor as a result of reaching the higher distribution tiers only when received.
71
During the period ended November 13, 2013, LGI-GTIS Holdings, LLC, LGI-GTIS Holdings II, LLC and LGI-GTIS Holdings III, LLC achieved the Third-Tier Return resulting in the priority allocations to the Predecessor of up to approximately 40%. As of November 13, 2013, LGI-GTIS Holdings IV, LLC had not achieved the First-Tier Return. During the period ended November 13, 2013, the Predecessor recognized $2.7 million in priority distributions from the LGI/GTIS Joint Ventures. The LGI/GTIS Joint Ventures were acquired on November 13, 2013 and as such there were no further distributions or contributions.
Summarized condensed combined financial information of the LGI/GTIS Joint Ventures accounted for using the equity method is presented below for the period through the date of the GTIS Acquisitions (in thousands):
November 13, | ||||
Balance Sheets | 2013 | |||
Assets: | ||||
Cash and cash equivalents | $ | 6,710 | ||
Total real estate inventory | 30,989 | |||
Other assets | 951 | |||
Total assets | $ | 38,650 | ||
Liabilities and members’ equity: | ||||
Liabilities | $ | 6,723 | ||
Members’ equity: | ||||
Predecessor | 4,789 | |||
GTIS members | 27,138 | |||
Total members’ equity | 31,927 | |||
Total liabilities and members’ equity | $ | 38,650 | ||
Period Ended November 13, | Year Ended December 31, | |||||||
Statements of Operations | 2013 | 2012 | ||||||
Home sales | $ | 80,896 | $ | 69,558 | ||||
Cost of sales | $ | 58,718 | $ | 49,751 | ||||
Net earnings of unconsolidated entities | $ | 10,873 | $ | 10,176 | ||||
Predecessor's share in net earnings of unconsolidated entities | $ | 4,287 | $ | 1,526 | ||||
Consolidated Joint Ventures
Two consolidated joint ventures, engaged in homebuilding and land development activities, were determined to be VIEs and the Predecessor was deemed to be the primary beneficiary under ASC Topic 810. LGI Fund III Holdings, LLC was formed March 31, 2013, and LGI Homes Group, LLC was the managing member; this entity became a wholly-owned subsidiary of the Company on November 13, 2013, as a result of the Company’s acquisition of the non-controlling interests in the joint venture as part of the Reorganization Transactions (See Note 1). LGI Homes-Sterling Lakes, LLC was formed in 2010, and LGI Homes Corporate, LLC was the managing member. LGI Homes-Sterling Lakes, LLC had income attributable to non-controlling interests of $0.2 million for the year ended December 31, 2012, and was closed out prior to December 31, 2012.
Historically, profits were allocated to the members of the consolidated joint ventures based on the predetermined formulas specified in the joint venture agreements for the allocation of distributable cash. The non-managing members and the Predecessor were allocated 85% and 15% of the profits, respectively, (the “Sharing Percentages”) until such time as the members received cash distributions equal to their initial capital investment plus, generally, a 15% internal rate of return (“First Tier Return”). Subsequent allocations of distributable cash and profits included a priority allocation of approximately 20% to 40% to the Predecessor’s member, depending on the amount of cash distributions achieved over the life of the joint venture.
72
7. OTHER ASSETS
Other assets consist of the following (in thousands):
December 31, | ||||||||
2014 | 2013 | |||||||
Deferred loan costs | $ | 3,732 | $ | — | ||||
Prepaid insurance | 1,176 | 1,205 | ||||||
Prepaid expenses | 1,497 | 292 | ||||||
Security deposits | 1,110 | 468 | ||||||
Other assets | — | 27 | ||||||
Total other assets | $ | 7,515 | $ | 1,992 | ||||
8. ACCRUED EXPENSES AND OTHER LIABILITIES
Accrued and other current liabilities consist of the following (in thousands):
December 31, | ||||||||
2014 | 2013 | |||||||
Inventory related obligations | $ | 7,275 | $ | — | ||||
Retentions payable | 2,696 | 867 | ||||||
Accrued compensation, bonuses and benefits | 2,434 | 2,693 | ||||||
Earnout liability | 2,196 | — | ||||||
Taxes payable | 1,448 | 1,554 | ||||||
Warranty reserve | 900 | 630 | ||||||
Other | 4,416 | 1,356 | ||||||
Total accrued expenses and other liabilities | $ | 21,365 | $ | 7,100 | ||||
Inventory Related Obligations
The Company owns lots in certain communities that have Community Development Districts (“CDD”) or similar utility and infrastructure development special assessment programs that allocate a fixed amount of debt service associated with development activities to each lot. This obligation for infrastructure development is attached to the land, is typically payable over a 30 year period, and is ultimately assumed by the homebuyer when home sales are closed. Such obligations represent a non-cash cost of the lots.
At December 31, 2014, the Company had CDD and other utility development obligations of approximately $7.3 million. Approximately $2.7 million of CDD and other utility development costs and the related increase to finished lots should have been recognized in the Company's balance sheets as of December 31, 2013; the Company believes these obligations are not significant to its consolidated balance sheet as of December 31, 2013.
Estimated Warranty Reserve
The Company typically provides homebuyers with a one-year warranty on the house and a ten-year limited warranty for major defects in structural elements such as framing components and foundation systems. The Predecessor provided similar warranty services for homes sold by the LGI/GTIS Joint Ventures prior to the GTIS Acquisitions (see Note 13).
73
Changes to the Company's warranty accrual are as follows (in thousands):
December 31, | ||||||||||||
2014 | 2013 | 2012 | ||||||||||
Warranty reserves, beginning of year | $ | 630 | $ | 450 | $ | 275 | ||||||
Warranty provision | 1,179 | 764 | 409 | |||||||||
Warranty reserve acquired in GTIS Acquisitions | — | 30 | — | |||||||||
Warranty expenditures | (909 | ) | (614 | ) | (234 | ) | ||||||
Warranty reserves, end of year | $ | 900 | $ | 630 | $ | 450 | ||||||
9. NOTES PAYABLE
Secured Revolving Credit Agreement
In April 2014, the Company entered into a credit agreement with a syndication of lenders and Texas Capital Bank, National Association, as administrative agent and letter of credit issuer (the “Credit Agreement”). The Credit Agreement provides for a $135.0 million senior secured revolving credit facility, which was increased upon the Company's request, to $200.0 million. On July 31, 2014, amounts available to the Company under the Credit Agreement were increased by $40.0 million to $175.0 million, and on September 30, 2014, amounts available to the Company under the Credit Agreement were increased from $175.0 million to $200.0 million, in each case, in accordance with the accordion feature of the Credit Agreement.
The Credit Agreement matures on April 28, 2017. Borrowings under the Credit Agreement are limited to the borrowing base, which is based on the loan value of the pool of collateral in which the lenders have a security interest. The Company may add houses, vacant lots, land, and acquisition and development projects to the pool of collateral through April 28, 2015. The loan value of speculative houses, pre-sold houses, model houses, vacant lots, land, and acquisition and development projects is adjusted based on formulas with respect to each of those categories of collateral; the loan value of the collateral decreases based on the amount of time such collateral is in the borrowing base. Subsequent to this date and through April 28, 2016, advances will continue to be made for assets previously included in the pool of collateral as they move into higher funding categories. Pre-sold homes may remain in the borrowing base for up to one year. Speculative homes may remain in the borrowing base for up to 18 months. Vacant lots, land and acquisition and development projects may remain in the borrowing base for up to three years. As of December 31, 2014, the borrowing base was $200.0 million, of which $139.4 million was outstanding and the remaining $60.6 million was available to borrow.
The Credit Agreement contains various financial covenants including a minimum EBITDA to debt service payments ratio; a debt to capitalization ratio; a leverage ratio; liquidity ratio; ratio of value of all land, lots, and acquisition and development projects to net worth; and a net worth ratio. In addition, the Credit Agreement contains various covenants that, among other restrictions, limit the amount of the Company's additional debt.
On September 30, 2014, certain provisions of the Credit Agreement were modified and supplemented. The modification of the Credit Agreement increased each of the Combined Acquisition and Development (“A&D”) and Entitled Land Subfacility, the Combined A&D, Entitled Land and Lot Inventory Subfacility, and the Entitled Land Subfacility; modified certain of the Credit Agreement financial covenants, which are generally tested on a quarterly basis; and allowed the Company to incur up to $85.0 million of unsecured subordinated indebtedness. In addition, the debt to capitalization ratio, leverage ratio, EBITDA ratio and liquidity rate were also modified. At December 31, 2014, the Company was in compliance with all of the covenants contained in the Credit Agreement.
Convertible Notes
In November 2014, the Company issued $85.0 million aggregate principal amount of its 4.25% Convertible Notes due 2019. The Convertible Notes mature on November 15, 2019 and bear interest at a rate of 4.25%, payable semiannually each year, beginning on May 15, 2015. Prior to May 15, 2019, the Convertible Notes will be convertible only upon satisfaction of any of the specified conversion events. On or after May 15, 2019, note holders can convert their Convertible Notes at any time at their option.
As issued, the conversion of the Convertible Notes may only be settled in shares of the Company's common stock. Upon receipt of stockholder approval of the flexible settlement provisions of the Convertible Notes, the Convertible Notes will be convertible into cash, shares of common stock, or a combination thereof, at the Company's election. The Company has sole discretion to request stockholder approval for the flexible settlement feature, however there can be no assurance that the stockholders will approve the flexible settlement feature. The initial conversion rate of the Convertible Notes is 46.4792 shares of Company
74
common stock for each $1,000 principal amount of Convertible Notes, which represents an initial conversion price of approximately $21.52 per share of Company common stock. The conversion rate is subject to adjustments upon the occurrence of specific events.
ASC Topic 470-20, Debt with Cash Conversion and Other Options, requires the issuer of convertible debt that may be settled wholly or partially in shares or cash upon conversion, such as the Convertible Notes, to separately account for the liability (debt) and equity (additional paid-in capital) components in a manner reflective of the issuers’ nonconvertible debt borrowing rate. Notes payable in our accompanying consolidated financial statements include $76.5 million which is the fair value of the $85.0 million aggregate principal amount of Convertible Notes issued; the fair value was determined using a discount rate of 6.6% based on the rate of return investors would require for a similar liability without the equity component, and reflects an $8.5 million discount. $5.5 million of the remaining proceeds was recorded to additional paid-in capital to reflect the equity component of the Convertible Notes and $3.0 million was recorded as a deferred tax liability. The carrying amount of the Convertible Notes is being accreted over the term to maturity. The net proceeds from the offering were approximately $82.0 million; of the $3.0 million of debt issuance costs, $2.7 million were allocated to the liability component and the remaining $0.3 million was allocated as an offset to the equity component of the Convertible Notes. As of December 31, 2014, the Company incurred approximately $0.2 million discount accretion, $0.4 million of coupon interest, and $0.1 million of debt issuance cost amortization. Interest and amortization of Convertible Notes discount and issuance costs are capitalized as cost of inventory: see Capitalized Interest table below.
Concurrent with the issuance of the Convertible Notes, the Company utilized, approximately $16.6 million of the net proceeds from the sale of the Convertible Notes to repurchase 1.0 million shares of Company common stock to be held as treasury stock. The remaining net proceeds from issuance of the Convertible Notes have been used for the purchase of land and lots and general corporate purposes, including repayment of borrowings under the Company’s secured revolving credit facility.
Notes payable consist of the following (in thousands):
December 31, | ||||||||
2014 | 2013 | |||||||
LGI Homes, Inc.—Notes payable to Texas Capital Bank, National Association and a syndication of lenders under the Credit Agreement ($200.0 million line at December 31, 2014) maturing through April 28, 2017; interest paid monthly at LIBOR plus 2.75%, with a LIBOR floor of 1.00%; collateralized by the Company and its subsidiaries' land, development and home construction costs (carrying value of $335.4 million at December 31, 2014) | $ | 139,404 | $ | — | ||||
LGI Homes, Inc.— 4.25% Convertible Notes due November 15, 2019; interest paid semi-annually at 4.25%; net of approximately $8.3 million in unamortized discount | 76,695 | — | ||||||
LGI Homes Group, LLC—Notes payable to Texas Capital Bank, National Association under a credit facility ($35 million line at December 31, 2013) expiring June 30, 2015; interest at LIBOR plus 3.0%, with a LIBOR floor of 1.00%; collateralized by borrower's land, development and home construction costs (carrying value of $106.1 million at December 31, 2013); guaranteed by a Family Principal, the managing member, and non-managing members as joint and several guarantors at December 31, 2013; the credit facility was paid in full in April 2014 | — | 34,078 | ||||||
LGI Homes—Sunrise Meadow, LLC—Notes payable to Texas Capital Bank, National Association under a credit facility ($2.0 million at December 31, 2013) expiring December 31, 2013; interest at LIBOR plus 3.9%, with a LIBOR floor of 0.10%; collateralized by borrower's land, development and home construction costs (carrying value of $5.1 million at December 31, 2013); guaranteed by a Family Principal; the credit facility was paid in full in April 2014 | — | 1,457 | ||||||
Total notes payable | $ | 216,099 | $ | 35,535 | ||||
At December 31, 2014 and December 31, 2013, LIBOR was 0.25% and 0.24%, respectively. Based on the terms of the variable rate notes payable, the interest rates as of December 31, 2014 and December 31, 2013, were based on the interest rate floor terms.
75
As of December 31, 2014, the annual aggregate maturities of our notes payable during each of the next five fiscal years are as follows (amounts in thousands):
Amount | ||||
2015 | $ | 67,949 | ||
2016 | 35,594 | |||
2017 | 35,861 | |||
2018 | — | |||
2019 | 85,000 | |||
Total notes payable | 224,404 | |||
Less: Convertible Notes discount | (8,305 | ) | ||
Net notes payable | $ | 216,099 | ||
Capitalized Interest
Interest activity, including other financing costs, for notes payable for the periods presented is as follows (in thousands):
Year Ended December 31, | ||||||||||||
2014 | 2013 | 2012 | ||||||||||
Interest incurred | $ | 6,026 | $ | 1,378 | $ | 824 | ||||||
Less: Amounts capitalized | (6,026 | ) | (1,327 | ) | (823 | ) | ||||||
Interest expense | $ | — | $ | 51 | $ | 1 | ||||||
Cash paid for interest | $ | 4,109 | $ | 1,220 | $ | 790 | ||||||
Included in interest incurred was $1.1 million amortization of deferred financing costs of and $0.2 million amortization of Convertible Notes discount for the year ended December 31, 2014.
10. INCOME TAXES
All Company operations are domestic. The provision for income taxes consisted of the following (in thousands):
Year ended December 31, | ||||||||||||
2014 | 2013 | 2012 | ||||||||||
Current: | ||||||||||||
Federal | $ | 13,266 | $ | 841 | $ | — | ||||||
State | 1,606 | 513 | 155 | |||||||||
Current tax provision | 14,872 | 1,354 | 155 | |||||||||
Deferred: | ||||||||||||
Federal | — | (265 | ) | — | ||||||||
State | (4 | ) | (23 | ) | — | |||||||
Deferred tax benefit | (4 | ) | (288 | ) | — | |||||||
Total income tax provision | $ | 14,868 | $ | 1,066 | $ | 155 | ||||||
Income taxes paid were $15.2 million, $0.1 million and $0.2 million for the years ended December 31, 2014, 2013, and 2012, respectively.
Prior to the Reorganization Transactions, the Predecessor consisted of limited liability companies and limited partnerships, all of which were treated as partnerships for income tax purposes. However, as a result of the Reorganization Transactions, the Predecessor entities are subsidiaries of the Company, thereby becoming subject to federal and certain state taxes beginning
76
November 13, 2013. As a result of this tax status change, the Company recorded a net deferred tax liability and a one-time non-cash charge of $0.2 million included in the income tax provision in 2013. In addition, the remeasurement of the Predecessor’s historical interests in the LGI/GTIS Joint Ventures generated approximately $4.8 million of excess book goodwill primarily attributable to the Predecessor’s carryover basis in the joint ventures’ assets and liabilities that is not deductible for federal income tax purposes. This excess goodwill is not amortizable for tax purposes.
A reconciliation of the provision for income taxes for 2014 and 2013 and the amount computed by applying the statutory federal income tax rate of 35% to income before provision for income taxes for the years ended December 31, 2014 and 2013, and the period subsequent to the Reorganization Transactions, November 13, 2013 to December 31, 2013 follows (in thousands):
Year Ended December 31, | November 13, 2013 - December 31, 2013 | ||||||||||||||||||||
2014 | 2013 | ||||||||||||||||||||
Tax at federal statutory rate | $ | 15,078 | 35.0 | % | $ | 7,981 | 35.0 | % | $ | 2,725 | 35.0 | % | |||||||||
State income taxes (net of federal benefit) | 1,037 | 2.4 | 439 | 1.9 | 48 | 0.6 | |||||||||||||||
Domestic production activity deduction | (1,294 | ) | (3.0 | ) | (88 | ) | (0.4 | ) | (88 | ) | (1.1 | ) | |||||||||
Non deductible expenses and other | 47 | 0.1 | 1 | 0.1 | 1 | 0.1 | |||||||||||||||
Change in tax status of entity - deferred taxes | — | — | 245 | 1.1 | 246 | 3.2 | |||||||||||||||
Non-taxable - gain on remeasurement | — | — | (2,256 | ) | (9.9 | ) | (2,256 | ) | (29.0 | ) | |||||||||||
Income attributable to partnerships - nontaxable | — | — | (5,256 | ) | (23.1 | ) | — | — | |||||||||||||
Tax at effective rate | $ | 14,868 | 34.5 | % | $ | 1,066 | 4.7 | % | $ | 676 | 8.8 | % | |||||||||
The components of net deferred tax assets and liabilities at December 31, 2014 and December 31, 2013, are as follows (in thousands):
December 31 | ||||||||
2014 | 2013 | |||||||
Deferred tax assets: | ||||||||
Accruals and reserves | $ | 913 | $ | 470 | ||||
Inventory | 527 | — | ||||||
Compensation related to RSUs | 373 | 395 | ||||||
Deferred loan costs | 108 | — | ||||||
Deferred Rent | 43 | — | ||||||
Total deferred tax assets | 1,964 | 865 | ||||||
Deferred tax liabilities: | ||||||||
Discount on Convertible Notes | (3,079 | ) | — | |||||
Prepaids | (1,018 | ) | — | |||||
Tax depreciation in excess of book depreciation | (350 | ) | (223 | ) | ||||
Goodwill and other assets amortized for tax | (202 | ) | (96 | ) | ||||
Inventory | — | (258 | ) | |||||
Total deferred tax liability | $ | (4,649 | ) | $ | (577 | ) | ||
Total net deferred tax asset (liability) | $ | (2,685 | ) | $ | 288 | |||
11. EQUITY
The Company is authorized to issue 250,000,000 shares of common stock, par value $0.01 per share, and 5,000,000 shares of preferred stock, par value $0.01 per share. On November 21, 2014, the Company purchased 1.0 million shares of the Company’s common stock at $16.55 per share; the repurchased shares are held as treasury stock. At December 31, 2014 the Company had 20,849,044 shares of common stock issued and 19,849,044 shares of common stock outstanding. At December 31, 2013 the Company had 20,763,449 shares of common stock issued and outstanding. As of December 31, 2014 and 2013, no shares of preferred stock were issued or outstanding.
77
Earnings Per Share
The following table sets forth the computation of basic and diluted earnings per share for the year ended December 31, 2014 and from November 13, 2013 to December 31, 2013. Earnings per share is not computed for the period prior to the closing date of the IPO because the Predecessor consisted of limited liability companies and limited partnerships and LGI Homes, Inc. did not have operations.
For the year Ended December 31, 2014 | For the Period from November 13, 2013 - December 31, 2013 | |||||||
Numerator: | ||||||||
Numerator for basic earnings per share (in thousands) | $ | 28,211 | $ | 7,110 | ||||
Effect of dilutive securities: | ||||||||
Interest expense associated with Convertible Notes, net of taxes(1) | 7 | — | ||||||
Numerator for diluted earnings per share | 28,218 | 7,110 | ||||||
Denominator: | ||||||||
Basic weighted average shares outstanding | 20,666,758 | 20,763,449 | ||||||
Effect of dilutive securities: | ||||||||
Convertible debt(1) | 432,957 | — | ||||||
Restricted stock units | 103,252 | 70,675 | ||||||
Diluted weighted average shares outstanding | 21,202,967 | 20,834,124 | ||||||
Basic earnings per share | $ | 1.37 | $ | 0.34 | ||||
Diluted earnings per share | $ | 1.33 | $ | 0.34 | ||||
(1) | In accordance with ASC 260-10, Earnings Per Share, the Company calculated the dilutive effect of convertible securities using the “if-converted” method. Reflects the shares impact based on the conversion rate and period outstanding and the interest expense reflected in net income attributable to the Convertible Notes. |
3,022 non-vested restricted stock units were excluded from the computation of diluted earnings per share for the year ended December 31, 2014, because their effect was antidilutive. There were no antidilutive securities for the year ended December 31, 2013.
Predecessor's Owners' Equity
The following table reflects the activity and balances in the owners’ equity of the Predecessor prior to the Reorganization Transactions (in thousands):
LGI Homes Group, LLC Members’ Capital | LGI Homes Corporate, LLC Members’ Capital | LGI Homes- Deer Creek, LLC Members’ Capital | Other Partnerships’ Capital | Total Owners’ Equity | ||||||||||||||||
BALANCE—DECEMBER 31, 2011 | $ | 4,113 | $ | 3,175 | $ | 957 | $ | 4,746 | $ | 12,991 | ||||||||||
Net income | 6,445 | 2,258 | 803 | 199 | 9,705 | |||||||||||||||
Contributions | 6,650 | — | — | — | 6,650 | |||||||||||||||
Distributions | (53 | ) | (2,002 | ) | (1,760 | ) | (320 | ) | (4,135 | ) | ||||||||||
BALANCE—DECEMBER 31, 2012 | $ | 17,155 | $ | 3,431 | $ | — | $ | 4,625 | $ | 25,211 | ||||||||||
Net income | 11,892 | 1,884 | — | 1,441 | 15,217 | |||||||||||||||
Contributions | — | 2,500 | — | 35 | 2,535 | |||||||||||||||
Distributions | (6,969 | ) | (1,469 | ) | — | (673 | ) | (9,111 | ) | |||||||||||
BALANCE—NOVEMBER 13, 2013 | $ | 22,078 | $ | 6,346 | $ | — | $ | 5,428 | $ | 33,852 | ||||||||||
LGI Homes Group, LLC is a Texas limited liability company formed in March 2011. EDSS Holdings, LP, a limited partnership wholly-owned by the Family Principals, owned 50.125% of LGI Homes Group, LLC, and LGI Investment Fund II, LP,
78
owned the remaining 49.875%. LGI Investment Fund II, LP was formed as a Texas limited partnership in June 2011. LGI Fund II GP, LLC was the 1% general partner. LGI Fund II GP, LLC is wholly-owned by Eric Lipar. The limited partners were various investors.
In March 2013, LGI Homes Group, LLC formed LGI Fund III Holdings, LLC (a joint venture consolidated in the accompanying financial statements) with LGI Investment Fund III, LP (see Note 6). LGI Homes Group, LLC was the managing member. The LGI Investment Fund III, LP was formed as a Texas limited partnership in February 2013. LGI Fund III GP, LLC was the 1% general partner. LGI Fund III GP, LLC is wholly-owned by Eric Lipar. The limited partners were various investors. In accordance with the terms of the formation of LGI Investment Fund III, LP, the limited partnership exchanged its 85% ownership in LGI Fund III Holdings, LLC for approximately 1.5 times the investment amount upon completion of the IPO and as part of the Reorganization Transactions.
LGI Homes Corporate, LLC is a Texas limited liability company formed in March 2010 and was wholly-owned and managed by the Family Principals prior to the Reorganization Transactions.
LGI Homes—Deer Creek, LLC is a Texas limited liability company formed in June 2009 and was wholly-owned and managed by the Family Principals prior to the Reorganization Transactions.
The Other Partnerships included in the accompanying consolidated financial statements and aggregated in the above table are:
• | LGI Homes II, LLC, formerly LGI Homes, Ltd. and JTM Housing, Ltd., was formed as a Texas limited partnership in December 2002, renamed as LGI Homes, Ltd. in October 2004 and LGI Homes II, LLC in November 2013. LGI GP, LLC, a wholly-owned Texas limited liability company formed in 2002 as a wholly-owned subsidiary of LGI Holdings, LLC, was the 1% general partner of LGI Homes II, LLC. The limited partner was 99% owned by the Family Principals prior to the Reorganization Transactions. |
• | LGI Homes - Sunrise Meadow, LLC, formerly LGI Homes - Sunrise Meadow, Ltd. was formed as a Texas limited partnership in February 2005 and renamed as LGI Homes - Sunrise Meadow, LLC in November 2013. LGI GP, LLC, was the 1% general partner. The entity was wholly-owned and managed by the Family Principals prior to the Reorganization Transactions. |
• | LGI Homes - Canyon Crossing, LLC, formerly LGI Homes - Canyon Crossing, Ltd. was formed as a Texas limited partnership in May 2005 and renamed as LGI Homes - Canyon Crossing, LLC in November 2013. LGI GP, LLC, was the 1% general partner. The entity was wholly-owned and managed by the Family Principals prior to the Reorganization Transactions. |
12. STOCK-BASED COMPENSATION
2013 Stock Incentive Plan
As approved by the Company's stockholders, the Company adopted the LGI Homes, Inc. 2013 Equity Incentive Plan (the “2013 Incentive Plan”) to reward, retain and attract key personnel. At December 31, 2014, 2,000,000 shares of the Company's common stock had been reserved for issuance pursuant to the 2013 Incentive Plan.
Non-performance Based Restricted Stock Units
The following table summarizes the activity of the Company's restricted stock units (“RSUs”):
Shares | Weighted Average Grant Date Fair Value | ||||||
Balance at January 1, 2013 | — | $ | — | ||||
Granted | 140,222 | $ | 11.00 | ||||
Balance at December 31, 2013 | 140,222 | $ | 11.00 | ||||
Granted | 82,441 | $ | 16.52 | ||||
Vested | (116,543 | ) | $ | 11.00 | |||
Forfeited | (3,334 | ) | $ | 11.00 | |||
Balance at December 31, 2014 | 102,786 | $ | 15.43 | ||||
79
In March 2014, the Company issued 37,307 RSUs to certain officers in settlement of approximately $0.6 million of bonuses that were earned under the 2013 performance-based cash bonus plan and accrued at December 31, 2013. The RSUs have a one-year vesting period and will be settled in shares of the Company's common stock. The weighted average fair value on the grant date was $17.20.
In addition, during the year ended December 31, 2014, the Company issued 45,134 RSUs to certain employees, executives and non-employee directors which vest over periods ranging from one to three years. The RSUs will be settled in shares of the Company’s common stock. The fair value of the RSUs was determined to be equal to the number of shares of the Company's common stock to be issued pursuant to the RSUs, multiplied by the closing price of the Company's common stock on the date the RSUs were awarded. The weighted average fair value on the grant dates was $15.97 for the year ended December 31, 2014. The Company recognized $0.5 million and $42,814 of stock-based compensation expense related to outstanding RSUs grants for the years ended December 31, 2014 and 2013, respectively. At December 31, 2014, the Company had unrecognized compensation cost of $0.6 million related to unvested RSUs, which is expected to be recognized over a weighted average period of 1.6 years.
Performance Based Restricted Stock Units
In February 2014, the Compensation Committee approved a target of 62,906 performance-based restricted stock units (“Performance-Based RSUs”) for certain members of senior management of the Company. The Performance-Based RSUs provide for shares of the Company's common stock to be issued based on the attainment of certain performance metrics of the Company over the three year period, January 1, 2014 to December 31, 2016. The number of shares of the Company's common stock that may be issued to the recipients for the Performance-Based RSUs range from 0% to 200% of the target amount depending on actual results as compared to the target performance metrics. The Performance-Based RSUs vest upon the determination date for the actual results at the end of the three-year period and require the recipients continue to be employed by the Company through the determination date. The Performance-Based RSUs will be settled in shares of the Company's common stock.
The fair value of the Performance-Based RSUs was determined to be equal to the number of shares of the Company’s common stock to be issued based on the target amount multiplied by the closing price of the Company’s common stock of $17.09 on the date the Performance-Based RSU awards were approved by the Compensation Committee. As of December 31, 2014, the target amount represents management's best estimate of the number of shares of the Company's common stock expected to be issued at the end of the three-year performance cycle. The Company recognized $0.3 million of total stock-based compensation expense related to outstanding Performance-Based RSUs grants for the year ended December 31, 2014. At December 31, 2014, the Company had unrecognized compensation cost of $0.8 million, based on the target amount, related to unvested Performance-Based RSUs, which is expected to be recognized over a weighted average period of 1.5 years.
13. RELATED PARTY TRANSACTIONS
From time to time, the Company may engage in transactions with entities that are affiliated with the Company. Transactions with related parties are in the normal course of operations.
Consulting Fees
Concurrent with the IPO, the Company entered into a three-year consulting agreement with a Family Principal for $100,000 per year payable on a monthly basis. Consulting fees were approximately $100,000 and $17,000 for the years ended December 31, 2014 and 2013, respectively.
Management and Warranty Fees
The Predecessor had a Management Services Agreement with each of the LGI/GTIS Joint Ventures. The Predecessor provided administration, supervision, marketing, and various other services for the joint ventures. The Predecessor charged the joint ventures a management fee of approximately 3% of home sale revenues and 3% of construction costs for the development of land, as applicable. The management and construction fees were in addition to direct costs charged to the joint ventures. Management fees earned under the agreements were $2.6 million and $2.3 million for the years ended December 31, 2013 and 2012, respectively.
The Predecessor collected a warranty fee of $250 from the LGI/GTIS Joint Ventures upon the closing of the sale of each home and provided a Home Builder’s Limited Warranty to the buyer of each home. The Predecessor was responsible for the performance and discharge of any warranty claims asserted against the joint ventures or the GTIS member. Warranty fees earned were $0.1 million for each of the years ended December 31, 2013 and 2012.
80
Profit Sharing Plan
The Company’s employees are eligible to participate in a 401(k) savings plan established by LGI Holdings, LLC, a sister company in an unrelated business. Employees are eligible to participate after completing ninety days of service and having attained the age of 21. Salary deferrals are allowed in amounts up to 100% of an eligible employee’s salary, not to exceed the maximum allowed by law. A discretionary match may be made by the Company of up to 100% of the first 3% of an eligible employee’s deferral, not to exceed $3,000. For each of the years ended December 31, 2014, 2013 and 2012, the Company's matching contributions were $0.3 million, $0.1 million and $0.1 million, respectively.
Riverchase Acquisition
On July 11, 2014, the Company acquired approximately 1,902 acres of land located in Lancaster County, South Carolina, from an entity owned and managed by a Family Principal, for an aggregate purchase price of approximately $15.4 million, based on a third party appraisal.
14. COMMITMENTS AND CONTINGENCIES
Contingencies
In the ordinary course of doing business, the Company becomes subject to claims or proceedings from time to time relating to the purchase, development, and sale of real estate. Management believes that these claims include usual obligations incurred by real estate developers in the normal course of business. In the opinion of management, these matters will not have a material effect on the Company’s combined financial position, results of operations or cash flows.
The Company has provided unsecured environmental indemnities to certain lenders and other counterparties. In each case, the Company has performed due diligence on the potential environmental risks including obtaining an independent environmental review from outside environmental consultants. These indemnities obligate the Company to reimburse the guaranteed parties for damages related to environmental matters. There is no term or damage limitation on these indemnities; however, if an environmental matter arises, the Company may have recourse against other previous owners. Management is not aware of any environmental claims or occurrences and has recorded no reserves for environmental matters at December 31, 2014 and 2013.
Land Deposits
The Company has land purchase option contracts, generally through cash deposits, for the right to purchase land or lots at a future point in time with predetermined terms. The Company does not have title to the property and obligations with respect to the option contracts which are generally limited to the forfeiture of the related nonrefundable cash deposits. The following is a summary of the Company's land purchase deposits and option contracts included in pre-acquisition costs and deposits (in thousands, except for lot count):
December 31, | ||||||||
2014 | 2013 | |||||||
Land deposits and option payments | $ | 9,591 | $ | 2,977 | ||||
Commitments under the land purchase option and deposit agreements if the purchases are consummated | $ | 86,277 | $ | 111,115 | ||||
Lots under land options and land purchase contracts | 3,921 | 8,214 | ||||||
As of December 31, 2014, approximately $7.4 million of the deposits are related to purchase contracts to deliver finished lots and these deposits are refundable under certain circumstances and secured by indemnity mortgages on the related property.
Leasing Arrangements
The Company leases office facilities and certain equipment under non-cancellable operating lease agreements. Rent escalation provisions are accounted for using the straight-line method. Rent expense includes common area maintenance costs. Rent expense totaled $0.7 million, $0.3 million and $0.2 million for the years ended December 31, 2014, 2013 and 2012, respectively.
81
Future minimum lease payments under non-cancellable operating lease agreements are as follows at December 31, 2014 (in thousands):
2015 | $ | 605 | |
2016 | 590 | ||
2017 | 616 | ||
2018 | 382 | ||
2019 | 14 | ||
Thereafter | — | ||
Total | $ | 2,207 | |
Bonding and Letters of Credit
The Company has outstanding performance and surety bonds and letters of credit of $7.7 million, $0.4 million and $0.2 million at December 31, 2014, 2013 and 2012, respectively, related to the Company’s obligations for site improvements at various projects. Certain surety bonds are guaranteed by one of the Family Principals. Management does not believe that draws upon these bonds, if any, will have a material effect on the Company’s consolidated financial position, results of operations, or cash flows.
15. SEGMENT INFORMATION
The Company operates one principal homebuilding business which is organized and reports by division. The Company has four operating segments at December 31, 2014: the Texas division, the Southwest division, the Southeast division and the Florida division. The Texas division is the largest division and it comprised approximately 66.6%, 83.6% and 79.4% of total home sales revenues for the year ended December 31, 2014, 2013 and 2012, respectively.
In accordance with ASC Topic 280, Segment Reporting, operating segments are defined as components of an enterprise for which separate financial information is available that is evaluated regularly by the chief operating decision-maker (“CODM”) in deciding how to allocate resources and in assessing performance. The CODM primarily evaluates performance based on the number of homes sold, gross margin and net income.
The operating segments qualify for aggregation as one reporting segment. In determining the reportable segment, the Company concluded that all operating segments have similar economic and other characteristics, including similar home floor plans, average selling prices, gross margin percentage, production construction processes, suppliers, subcontractors, regulatory environments, customer type, and underlying demand and supply. Each operating segment follows the same accounting policies as the Company. The Company has no inter-segment sales, as all sales are to external customers.
16. SELECTED QUARTERLY FINANCIAL DATA (UNAUDITED)
Quarterly results are as follows (in thousands, except per share data):
First Quarter 2014 | Second Quarter 2014 | Third Quarter 2014 | Fourth Quarter 2014 | |||||||||||||
Total home sales revenues | $ | 75,919 | $ | 106,412 | $ | 92,516 | $ | 108,420 | ||||||||
Gross margin | 19,530 | 28,396 | 25,260 | 29,601 | ||||||||||||
Income before income taxes | 7,067 | 13,904 | 10,534 | 11,574 | ||||||||||||
Net income | 4,594 | 9,037 | 7,046 | 7,534 | ||||||||||||
Basic earnings per share | 0.22 | 0.44 | 0.34 | 0.37 | ||||||||||||
Diluted earnings per share(1) | 0.22 | 0.44 | 0.34 | 0.34 | ||||||||||||
82
First Quarter 2013 | Second Quarter 2013 | Third Quarter 2013 | Fourth Quarter 2013 | |||||||||||||
Total home sales revenues | $ | 21,479 | $ | 36,519 | $ | 37,035 | $ | 65,034 | ||||||||
Gross margin | 5,662 | 10,194 | 9,952 | 12,934 | ||||||||||||
Income before income taxes | 2,497 | 5,102 | 5,287 | 9,917 | ||||||||||||
Net income | 2,450 | 5,013 | 5,150 | 9,124 | ||||||||||||
Net income attributable to owners | 2,450 | 5,158 | 5,588 | 9,131 | ||||||||||||
Basic and diluted earnings per share (2) | — | — | — | 0.34 | ||||||||||||
(1) Diluted earnings per share for the fourth quarter reflects the effect of the Convertible Notes using the “if converted” method.
(2) Earnings per share is presented for the period from November 13, 2013 (post Reorganization Transactions and date of closing of IPO) to December 31, 2013. See Note 11 - Equity for calculation of earnings per share.
83
ITEM 9. CHANGES IN AND DISAGREEMENTS WITH ACCOUNTANTS ON ACCOUNTING AND FINANCIAL DISCLOSURE
None.
ITEM 9A. CONTROLS AND PROCEDURES
Disclosure Controls and Procedures
Under the supervision and with the participation of our Chief Executive Officer and Chief Financial Officer, management has evaluated the effectiveness of the design and operation of our disclosure controls and procedures (as defined in Rules 13a-15(e) or 15d-15(e) of the Securities Exchange Act of 1934) as of December 31, 2014. Based upon that evaluation, our Chief Executive Officer and Chief Financial Officer concluded that, our disclosure controls and procedures are effective to ensure information is recorded, processed, summarized and reported within the periods specified in the Securities and Exchange Commission’s rules and forms and is accumulated and communicated to our management, including our Chief Executive Officer and Chief Financial Officer, as appropriate to allow timely decisions regarding required disclosure.
Our management, including our Chief Executive Officer and Chief Financial Officer, does not expect that our disclosure controls and procedures will prevent all errors and all fraud. A control system, no matter how well conceived and operated, can provide only reasonable, not absolute, assurance that the objectives of the control system are met. Further, the design of a control system must reflect the fact that there are resource constraints, and the benefits of controls must be considered relative to their costs. Because of the inherent limitations in all control systems, no evaluation of controls can provide absolute assurance that all control issues and instances of fraud, if any, have been detected. These inherent limitations include the realities that judgments in decision-making can be faulty and that breakdowns can occur because of simple error and mistake. Additionally, controls can be circumvented by the individual acts of some persons, by collusion of two or more people or by management override of controls.
The design of any system of controls also is based in part upon certain assumptions about the likelihood of future events, and there can be no assurance that any design will succeed in achieving its stated goals under all potential future conditions. Over time, a control may become inadequate because of changes in conditions or because the degree of compliance with the policies or procedures may deteriorate. Because of the inherent limitations in a cost-effective control system, misstatements due to error or fraud may occur and may not be detected.
Management’s Assessment on Internal Control Over Financial Reporting
Our management is responsible for establishing and maintaining adequate internal control over financial reporting, as such term is defined in Rule 13a-15(f) under the Exchange Act. Under the supervision and with the participation of senior management, including our Chief Executive Officer and Chief Financial Officer, we evaluated the effectiveness of our internal control over financial reporting based on the framework in Internal Control-Integrated Framework issued by the Committee of Sponsoring Organizations of the Treadway Commission in 2013. Based on the evaluation under that framework and applicable SEC rules, our management concluded that our internal control over financial reporting was effective as of December 31, 2014.
Changes in Internal Controls
No change in our internal control over financial reporting as such term is defined in Exchange Act Rule 13a-15(f) occurred during the year ended December 31, 2014 that has materially affected, or is reasonably likely to materially affect, our internal control over financial reporting.
ITEM 9B. OTHER INFORMATION
None.
84
PART III
ITEM 10. DIRECTORS AND EXECUTIVE OFFICERS
The information called for by Item 10, to the extent not set forth in “Business—Executive Officers” in Item 1, will be set forth in the definitive proxy statement relating to the 2015 annual meeting of stockholders of LGI Homes, Inc. pursuant to SEC Regulation 14A. Such definitive proxy statement relates to a meeting of stockholders involving the election of directors and the portions thereof called for by Item 10 are incorporated herein by reference pursuant to Instruction G to Form 10-K.
ITEM 11. EXECUTIVE COMPENSATION
The information called for by Item 11 will be set forth in the definitive proxy statement relating to the 2015 annual meeting of stockholders of LGI Homes, Inc. pursuant to SEC Regulation 14A. Such definitive proxy statement relates to a meeting of stockholders involving the election of directors and the portions thereof called for by Item 11 are incorporated herein by reference pursuant to Instruction G to Form 10-K.
ITEM 12. SECURITY OWNERSHIP OF CERTAIN BENEFICIAL OWNERS AND MANAGEMENT AND RELATED STOCKHOLDER MATTERS
The information called for by Item 12 will be set forth in the definitive proxy statement relating to the 2015 annual meeting of stockholders of LGI Homes, Inc. pursuant to SEC Regulation 14A. Such definitive proxy statement relates to a meeting of stockholders involving the election of directors and the portions thereof called for by Item 12 are incorporated herein by reference pursuant to Instruction G to Form 10-K.
ITEM 13. CERTAIN RELATIONSHIPS, RELATED TRANSACTIONS AND DIRECTOR INDEPENDENCE
The information called for by Item 13 will be set forth in the definitive proxy statement relating to the 2015 annual meeting of stockholders of LGI Homes, Inc. pursuant to SEC Regulation 14A. Such definitive proxy statement relates to a meeting of stockholders involving the election of directors and the portions thereof called for by Item 13 are incorporated herein by reference pursuant to Instruction G to Form 10-K.
ITEM 14. PRINCIPAL ACCOUNTING FEES AND SERVICES
The information called for by Item 14 will be set forth in the definitive proxy statement relating to the 2015 annual meeting of stockholders of LGI Homes, Inc. pursuant to SEC Regulation 14A. Such definitive proxy statement relates to a meeting of stockholders involving the election of directors and the portions thereof called for by Item 14 are incorporated herein by reference pursuant to Instruction G to Form 10-K.
85
PART IV
ITEM 15. EXHIBITS AND FINANCIAL STATEMENTS SCHEDULES
(1) | The following Consolidated Financial Statements as set forth in Item 8 of this report are filed herein. |
Consolidated Financial Statements |
Report of Independent Registered Public Accounting Firm |
Consolidated Balance Sheets as of December 31, 2014 and 2013 |
Consolidated Statements of Operations for the years ended December 31, 2014, 2013 and 2012 |
Consolidated Statements of Equity from January 1, 2012 to December 31, 2014 |
Consolidated Statements of Cash Flows for the years ended December 31, 2014, 2013 and 2012 |
Notes to the Consolidated Financial Statements for the years ended December 31, 2014, 2013 and 2012 |
(2) | Financial Statement Schedules | |
All schedules are omitted because the required information is not present, in amounts sufficient to require submission of the schedule, or because the required information is included in the financial statements and related notes thereto.
(3) | Exhibits | |
The exhibits filed or furnished as part of this annual report on Form 10-K are listed in the Index to Exhibits immediately preceding those exhibits, which Index is incorporated in this Item by reference.
86
SIGNATURES
Pursuant to the requirements of the Section 13 or 15(d) of the Securities Exchange Act of 1934, the registrant has duly caused this report to be signed on its behalf by the undersigned, thereunto duly authorized.
LGI Homes, Inc. | ||
Date: | March 12, 2015 | /s/ Eric Lipar |
Eric Lipar | ||
Chief Executive Officer and Chairman of the Board | ||
March 12, 2015 | /s/ Charles Merdian | |
Charles Merdian | ||
Chief Financial Officer, Secretary and Treasurer | ||
Pursuant to the requirements of the Securities Exchange Act of 1934, this report has been signed below by the following persons on behalf of the registrant and in the capacities and on the dates indicated.
Signature | Title | Date | ||
/s/ Eric Lipar | Chief Executive Officer and Chairman of the Board | March 12, 2015 | ||
Eric T. Lipar | (Principal Executive Officer) | |||
/s/ Charles Merdian | Chief Financial Officer, Secretary and Treasurer | March 12, 2015 | ||
Charles Merdian | (Principal Financial and Accounting Officer) | |||
/s/ Duncan Gage | Director | March 12, 2015 | ||
Duncan Gage | ||||
/s/ Bryan Sansbury | Director | March 12, 2015 | ||
Bryan Sansbury | ||||
/s/ Steven Smith | Director | March 12, 2015 | ||
Steven Smith | ||||
/s/ Robert Vaharadian | Director | March 12, 2015 | ||
Robert Vaharadian | ||||
/s/ Ryan Edone | Director | March 12, 2015 | ||
Ryan Edone | ||||
EXHIBIT INDEX
Exhibit No. | Description | |
3.1 | Certificate of Incorporation of LGI Homes, Inc. (incorporated by reference to Exhibit 3.1 to the Registration Statement on Form S-1 (File No. 333-190853) of LGI Homes, Inc. filed on August 28, 2013). | |
3.2 | Bylaws of LGI Homes, Inc. (incorporated by reference to Exhibit 3.2 to the Registration Statement on Form S-1 (File No. 333-190853) of LGI Homes, Inc. filed on August 28, 2013). | |
4.1 | Indenture dated as of November 21, 2014, by and between LGI Homes, Inc. and Wilmington Trust, National Association, as trustee, governing LGI Homes, Inc.'s 4.25% Convertible Notes due 2019, including a form of note (incorporated by reference to Exhibit 4.01 to the Current Report on Form 8-K (File No. 1-36126) of LGI Homes, Inc. filed on November 26, 2014). | |
10.1 | Credit Agreement, dated as of April 28, 2014, by and among LGI Homes, Inc. and each of its subsidiaries, the lenders from time to time party thereto and Texas Capital Bank, National Association, as administrative agent and letter of credit issuer (incorporated by reference to Exhibit 10.1 to the Current Report on Form 8-K (File No. 1-36126) of LGI Homes, Inc. filed on May 2, 2014). | |
10.2 | Commitment Increase Agreement, dated as of July 31, 2014, by and among LGI Homes, Inc., its subsidiaries listed therein, Woodforest National Bank, Fifth Third Bank and Texas Capital Bank, National Association, as administrative agent (incorporated by reference to Exhibit 10.1 to the Current Report on Form 8-K (File No. 1-36126) of LGI Homes, Inc. filed on August 6, 2014). | |
10.3* | First Modification Agreement, dated as of September 30, 2014, by and among LGI Homes, Inc., its subsidiaries listed therein, the lenders from time to time party thereto and Texas Capital Bank, National Association, as administrative agent. | |
10.4* | Second Commitment Increase Agreement, dated as of September 30, 2014, by and among LGI Homes, Inc., its subsidiaries listed therein, Wells Fargo Bank, National Association and Texas Capital Bank, National Association, as administrative agent. | |
10.5 | Employment Agreement, dated as of August 23, 2013, between LGI Homes, Inc. and Eric Lipar (incorporated by reference to Exhibit 10.1 to the Registration Statement on Form S-1 (File No. 333-190853) of LGI Homes, Inc. filed on August 28, 2013). | |
10.6 | LGI Homes, Inc. 2013 Equity Incentive Plan (incorporated by reference to Exhibit 10.2 to Amendment No. 1 to the Registration Statement on Form S-1 (File No. 333-190853) of LGI Homes, Inc. filed on September 20, 2013). | |
21.1* | List of Subsidiaries of LGI Homes, Inc. | |
23.1* | Consent of Independent Registered Public Accounting Firm | |
23.2* | Consent of Independent Registered Public Accounting Firm | |
31.1* | CEO Certification, Pursuant to Section 302 of the Sarbanes-Oxley Act of 2002 | |
31.2* | CFO Certification, Pursuant to Section 302 of the Sarbanes-Oxley Act of 2002 | |
32.1* | Certification Pursuant to 18 U.S.C. Section 1350, as adopted Pursuant to Section 906 of the Sarbanes-Oxley Act of 2002 | |
32.2* | Certification Pursuant to 18 U.S.C. Section 1350, as adopted Pursuant to Section 906 of the Sarbanes-Oxley Act of 2002 | |
101.INS† | XBRL Instance Document. | |
101.SCH† | XBRL Taxonomy Extension Schema Document. | |
101.CAL† | XBRL Taxonomy Extension Calculation Linkbase Document. | |
101.DEF† | XBRL Taxonomy Extension Definition Linkbase Document. | |
101.LAB† | XBRL Taxonomy Extension Label Linkbase Document. | |
101.PRE† | XBRL Taxonomy Extension Presentation Linkbase Document. | |
* | Filed herewith. |
† | XBRL information is deemed not filed or a part of a registration statement or Annual Report for purposes of Sections 11 and 12 of the Securities Act of 1933, as amended, is deemed not filed for purposes of Section 18 of the Securities Exchange Act of 1934, as amended, and otherwise is not subject to liability under such sections. |