Attached files
| file | filename |
|---|---|
| EX-31.1 - EX-31.1 - Installed Building Products, Inc. | d846579dex311.htm |
| EX-23.1 - EX-23.1 - Installed Building Products, Inc. | d846579dex231.htm |
| EX-10.22 - EX-10.22 - Installed Building Products, Inc. | d846579dex1022.htm |
| EXCEL - IDEA: XBRL DOCUMENT - Installed Building Products, Inc. | Financial_Report.xls |
| EX-31.2 - EX-31.2 - Installed Building Products, Inc. | d846579dex312.htm |
| EX-32.2 - EX-32.2 - Installed Building Products, Inc. | d846579dex322.htm |
| EX-21.1 - EX-21.1 - Installed Building Products, Inc. | d846579dex211.htm |
| EX-32.1 - EX-32.1 - Installed Building Products, Inc. | d846579dex321.htm |
Table of Contents
UNITED STATES
SECURITIES AND EXCHANGE COMMISSION
Washington, D.C. 20549
FORM 10-K
| x | ANNUAL REPORT PURSUANT TO SECTION 13 OR 15(d) OF THE SECURITIES EXCHANGE ACT OF 1934 |
For the Fiscal Year Ended December 31, 2014
OR
| ¨ | TRANSITION REPORT PURSUANT TO SECTION 13 OR 15(d) OF THE SECURITIES EXCHANGE ACT OF 1934 |
For the Transition Period From To
Commission File Number: 001-36307
Installed Building Products, Inc.
(Exact name of registrant as specified in its charter)
| Delaware | 45-3707650 | |
| (State or other jurisdiction of incorporation or organization) |
(I.R.S. Employer Identification No.) | |
| 495 South High Street, Suite 50 Columbus, Ohio |
43215 | |
| (Address of principal executive offices) | (Zip Code) | |
(614) 221-3399
(Registrant’s telephone number, including area code)
Securities registered pursuant to Section 12(b) of the Act:
| Title of each class |
Name of each exchange on which registered | |
| Common Stock, $0.01 par value per share | The New York Stock Exchange |
Securities registered pursuant to Section 12(g) of the Act: None
Indicate by check mark if the registrant is a well-known seasoned issuer, as defined in Rule 405 of the Securities Act. Yes ¨ No x
Indicate by check mark if the registrant is not required to file reports pursuant to Section 13 or Section 15(d) of the Act. Yes ¨ No x
Indicate by check mark whether the registrant (1) has filed all reports required to be filed by Section 13 or 15(d) of the Securities Exchange Act of 1934 during the preceding 12 months (or for such shorter period that the registrant was required to file such reports), and (2) has been subject to such filing requirements for the past 90 days. Yes x No ¨
Indicate by check mark whether the registrant has submitted electronically and posted on its corporate Web site, if any, every Interactive Data File required to be submitted and posted pursuant to Rule 405 of Regulation S-T (Section 229.405 of this chapter) during the preceding 12 months (or for such shorter period that the registrant was required to submit and post such files). Yes x No ¨
Indicate by check mark if disclosure of delinquent filers pursuant to Item 405 of Regulation S-K is not contained herein, and will not be contained, to the best of registrant’s knowledge, in definitive proxy or information statements incorporated by reference in Part III of this Form 10-K or any amendment to this Form 10-K. x
Indicate by a check mark whether the registrant is a large accelerated filer, an accelerated filer, a non-accelerated filer, or a smaller reporting company. See definition of “large accelerated filer,” “accelerated filer” and “smaller reporting company” in Rule 12b-2 of the Exchange Act. (Check one):
| Large accelerated filer | ¨ | Accelerated filer | ¨ | |||
| Non-accelerated filer | x (Do not check if a smaller reporting company) | Smaller reporting company | ¨ | |||
Indicate by check mark whether the registrant is a shell company (as defined in Rule 12b-2 of the Exchange Act). Yes ¨ No x
The aggregate market value of the voting and non-voting common equity held by non-affiliates computed by reference to the price at which the common equity was last sold on June 30, 2014, was $246,179,565.
On March 4, 2015 the registrant had 31,547,415 shares of common stock, par value $0.01 per share, outstanding.
DOCUMENTS INCORPORATED BY REFERENCE
Portions of the registrant’s Definitive Proxy Statement relating to the 2015 Annual Meeting of Stockholders are incorporated by reference into Part III of this Annual Report on Form 10-K where indicated. Such Definitive Proxy Statement will be filed with the Securities and Exchange Commission within 120 days after the end of the registrant’s fiscal year ended December 31, 2014.
Table of Contents
i
Table of Contents
Information Regarding Forward-Looking Statements
This Form 10-K includes forward-looking statements within the meaning of U.S. federal securities laws, which involve risks and uncertainties. These forward-looking statements can be identified by the use of forward-looking terminology, including the terms “believe,” “estimate,” “project,” “aim,” “anticipate,” “expect,” “seek,” “predict,” “contemplate,” “continue,” “possible,” “intend,” “may,” “plan,” “forecast,” “future,” “might,” “could,” “would” or “should” or, in each case, their negative, or other variations or comparable terminology. These forward-looking statements include all matters that are not historical facts. They appear in a number of places throughout this Form 10-K and include statements regarding our intentions, beliefs or current expectations concerning, among other things, our results of operations, financial condition, liquidity, prospects, growth strategies, the industry in which we operate and potential acquisitions. We derive many of our forward-looking statements from our operating budgets and forecasts, which are based upon many detailed assumptions. While we believe that our assumptions are reasonable, we caution that it is very difficult to predict the impact of known factors, and, of course, it is impossible for us to anticipate all factors that could affect our actual results. All forward-looking statements are based upon information available to us on the date of this Form 10-K.
Important factors that could cause our results to vary from expectations include, but are not limited to:
| • | our dependence on the residential construction industry, the economy and the credit markets; |
| • | uncertainty regarding the housing recovery; |
| • | declines in the economy or expectations regarding the housing recovery that could lead to significant impairment charges; |
| • | the cyclical and seasonal nature of our business; |
| • | our exposure to severe weather conditions; |
| • | the highly fragmented and competitive nature of our industry; |
| • | product shortages or the loss of key suppliers; |
| • | changes in the costs and availability of products; |
| • | inability to successfully acquire and integrate other businesses; |
| • | our exposure to claims arising from our acquired operations; |
| • | our reliance on key personnel; |
| • | our ability to attract, train and retain qualified employees while controlling labor costs; |
| • | our exposure to product liability, workmanship warranty, casualty, construction defect and other claims and legal proceedings; |
| • | changes in, or failure to comply with, federal, state, local and other regulations; |
| • | disruptions in our information technology systems; |
| • | our ability to implement and maintain effective internal control over financial reporting; and |
| • | additional factors discussed under Item 1, Business; Item 1A, Risk Factors; and Item 7, Management’s Discussion and Analysis of Financial Condition and Results of Operations, of this Form 10-K. |
Should one or more of these factors materialize, or should any of our assumptions prove incorrect, our actual results may vary in material respects from those projected in these forward-looking statements. Any forward-looking statement made by us in this Form 10-K speaks only as of the date of this Form 10-K. Factors or events that could cause our actual results to differ may emerge from time to time, and it is not possible for us to predict all of them. We undertake no obligation to publicly update any forward-looking statement, whether as a result of new information, future developments, or otherwise, except as may be required by any applicable securities laws.
ii
Table of Contents
| Item 1. | Business |
OUR COMPANY
We are the second largest new residential insulation installer in the United States based on our internal estimates, with a national platform consisting of over 100 locations accessing customers in all 48 continental states and the District of Columbia. We believe we have the number one or two market position for new single-family insulation installation in more than half of the markets in which we operate, based on permits issued in those markets. We also install complementary building products, including garage doors, rain gutters, shower doors, closet shelving and mirrors, which provide cross-selling opportunities to supplement our insulation installation business.
We manage all aspects of the installation process for our customers, from our direct purchase and receipt of materials from national manufacturers, to our timely supply of materials to job sites and quality installation. Installation of insulation is a critical phase in the construction process, as certain interior work cannot begin until the insulation phase passes inspection. We benefit from our national scale, long-standing supplier relationships and a broad customer base that includes production and custom homebuilders, multi-family and commercial contractors, and homeowners.
Our business began in 1977 with one location in Columbus, Ohio. In the late 1990s, we began our acquisition strategy with the goal of creating a national platform. Since 1999, we have successfully completed and integrated over 90 acquisitions, which has allowed us to generate significant scale and to diversify our product offering while expanding into some of the most attractive housing markets in the United States. Over the past several years, our net revenue has increased at a faster rate than our operating expenses, resulting in an improved cost structure and a more efficient and scalable operating model to improve our financial performance and returns on invested capital. We believe we are well positioned to continue to grow our business through the ongoing housing recovery, organic growth and acquisitions. For a further discussion of our industry and trends affecting our industry, please refer to Item 7, Management’s Discussion and Analysis of Financial Condition, Key Factors Affecting our Operating Results, in this Form 10-K.
OUR OPERATIONS
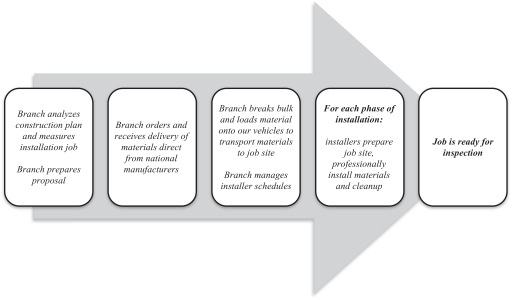
We manage all aspects of the installation process for our customers, from our direct purchase and receipt of materials from national manufacturers, to our timely supply of materials to job sites and quality installation:
| • | In each of our markets, our branch management and staff foster close working relationships with local customers. |
| • | Our branch management hires and trains installers with a focus on quality, safety and timely installation. |
| • | Our branch sales staff analyzes construction plans, measures the installation jobs to prepare customer proposals that comply with local building codes and energy efficiency standards and meet customer requirements. |
| • | Our branches order and receive delivery of materials directly from national manufacturers. |
| • | Our branches break bulk and load required materials onto our vehicles for each job, and manage installer schedules to ensure timely installation that meets our customers’ scheduling requirements. |
| • | For each phase of product installation, our installers prepare the job site, professionally install the materials to pass inspection, clean-up when the installation is complete and return unused materials to the branch. |
1
Table of Contents
Our Installation Process
Our customers generally select their building products installer based on quality and timeliness of service, knowledge of local building codes, pricing, relationships and reputation in the market. For these reasons, we emphasize the importance of developing and maintaining customer relationships at the local level and rely heavily on the knowledge and experience of our branch management and staff.
Once we are selected for an installation job, our branch staff coordinates with our customer to ensure that the job is completed in a quality manner and within the customer’s production schedule. Throughout the construction process, our branch sales and supervisory staff and installation teams, typically consisting of a senior installer and one or two other installers, make frequent site visits to ensure timely and proper installation and to provide general service support. We believe a high level of service is valued by our customers and generates customer loyalty. There are typically three phases to complete an insulation installation: (i) basement insulation installation; (ii) installation of insulation in the exterior walls and air sealing of the structure; and (iii) insulation for the ceiling and attic. We also assist the builders with coordinating inspection. In addition to visiting a job site during each of these three phases, we will return to a building site when we are selected to install other products such as garage doors, rain gutters, shower doors, closet shelving or mirrors. We believe that our ability to consistently complete our installations within a customer’s production schedule is recognized by our customers and is a key component of our high level of service.
Insulation
Overview
We are the second largest new residential insulation installer in the United States based on our internal estimates. Insulation installation comprised approximately 76% of our net revenue for the year ended December 31, 2014. We handle every stage of the installation process, including material procurement, project scheduling and logistics, multi-phase professional installation and field quality inspection.
Insulation Materials
We offer a wide range of insulation materials, including:
| • | Fiberglass Insulation – Fiberglass insulation is made of fibrous glass that is held together by a thermoset resin creating insulating air pockets. It typically contains an average of 50% recycled |
2
Table of Contents
| content. It is primarily available in two forms: batts (also referred to as blankets) and loosefill (also referred to as blown in). Fiberglass is the most widely used residential insulation material in the United States. Installations of fiberglass insulation accounted for approximately 85% of our insulation sales for the year ended December 31, 2014. |
| • | Spray Foam Insulation – Spray foam insulation is applied at a job site by mixing two chemical components together in specialized application equipment. It is generally polyurethane foam. While typically having the highest insulating value per inch and sealing effectiveness of all insulation materials that we offer, it is also typically the most expensive on an installed basis. Spray foam insulation accounted for approximately 12% of our insulation sales for the year ended December 31, 2014. |
| • | Cellulose Insulation – Cellulose insulation is made primarily of paper and cardboard and has a very high recycled content. Cellulose is only available in loosefill form and is blown into the structure with specialized equipment. Cellulose insulation accounted for approximately 3% of our insulation sales for the year ended December 31, 2014. |
Insulation Installation Applications
Local building codes typically require insulation to be installed in multiple areas of a structure. Each of these areas is frequently referred to as a phase of the insulation installation process and requires a separate trip to the job site by our installers at different points in the construction of a structure. Building practice and the inspection process differ geographically and call for our involvement at different times during the construction process. We provide installation of insulation and sealant materials in all areas of a structure, which could include:
| • | Basement and Crawl Space – These spaces can often account for the second most energy loss in a structure. |
| • | Building Envelope – We insulate the exterior walls of both residential and commercial structures by applying insulation on the wall or between the studs. |
| • | Attic – We insulate the attics of new and existing residential structures. The attic is the area where the most energy may be lost in a home. |
| • | Acoustical – Many builder or architect specifications call for acoustical insulation for sound reduction purposes in both residential and commercial structures. This product is generally installed in the interior walls to minimize sound transmission. |
| • | In each of these applications, we typically use fiberglass batts, except in attic installations where we typically install loosefill fiberglass. |
Garage Doors
We install and service garage doors and openers in certain of our locations for residential and commercial new construction builders, homeowners and commercial customers. We offer a variety of options from some of the best-known garage door brands. We offer steel, aluminum, wood and vinyl garage doors as well as opener systems. Unlike the other products we install, the garage door business has an ongoing aftermarket service component. Garage door installations and service comprised approximately 7% of our net revenue for the year ended December 31, 2014.
Shower Doors, Shelving and Mirrors
Some of our locations install a variety of shower enclosures, ranging from basic sliding door designs to complex custom designs. We have the ability to meet our customers’ diverse needs by customizing shower enclosures by size and style according to their specifications, such as framing, hardware and glass options. We design and
3
Table of Contents
install closet shelving systems in select markets utilizing some of the highest quality products available from national brands. We also offer standard and custom designed mirrors for our customers. Shower doors, closet shelving and mirror installations comprised approximately 6% of our net revenue for the year ended December 31, 2014.
Rain Gutters
Some of our locations install a wide range of rain gutters, which direct water from a home’s roof away from the structure and foundation. Rain gutters are typically constructed from aluminum or copper and are available in a wide variety of colors, shapes and widths. They are generally fabricated and assembled on the job site using specialized equipment. The installation of rain gutters comprised approximately 6% of our net revenue for the year ended December 31, 2014.
Other Building Products
Some of our locations install other complementary building products, none of which is an individually significant percentage of net revenue. Installation of other building products comprised approximately 5% of our net revenue for the year ended December 31, 2014.
Sales and Marketing
We seek to attract and retain customers through exceptional customer service, superior installation quality, broad service offerings and competitive pricing. Our strategy is centered on building and maintaining these strong customer relationships. We also capitalize on cross-selling opportunities from existing customer relationships and identifying situations where customers may benefit from more than one of our installation service offerings. By executing this strategy, we believe we can continue to generate incremental sales volumes with new and existing customers.
Experienced sales and service professionals are important to our customer growth and increasing our profitability. Retaining and motivating local employees has been an important component of our acquisition and operating strategies. As of December 31, 2014, we employed approximately 300 sales professionals and our sales force has spent an average of almost a decade with our operations. The local sales staff, which is generally led by the branch manager, is responsible for maintaining relationships with our customers. These local teams work diligently to increase sales by supporting our existing customers with excellent service and value while also pursuing new customers with competitive offerings. In addition to the efforts of our sales staff, we market our product and service offerings on the internet, in the local yellow pages and through advertisements in trade journals. We primarily conduct our marketing using local trademarks and trade names.
Quality Control and Safety
Our quality control process starts with the initial proposal. Our sales staff and managers are knowledgeable about our service offerings and scope of work. They are trained on manufacturers’ guidelines as well as state and local building codes. Our quality control programs emphasize onsite inspections, training by manufacturers and various certification programs.
We consider risk management and safety to be a core business objective. Significant staffing, funding and other resources are allocated to our management that directly impact quality and safety for our employees and our customers. Our branch managers are held accountable for the safety of employees and quality of workmanship at their locations. We provide our employees with on-going training and development programs necessary to generate best in class work quality and safety performance.
4
Table of Contents
CUSTOMERS
We serve a broad group of national, regional and local homebuilders, multi-family and commercial builders, individual homeowners and repair and remodeling contractors. Our top ten customers, which are a combination of national and regional builders, accounted for approximately 14% of net revenue for the year ended December 31, 2014. No single customer accounted for more than 3% of net revenue during the year ended December 31, 2014.
BACKLOG
Due to our customers’ strict demand for timely installation of our products, our installation jobs are scheduled and completed within a short timeframe. We do not consider backlog material to our business.
SUPPLIERS
We have long-term relationships with many of our suppliers and have not experienced any significant disruption in the supply of any of the primary materials we purchase and install. As one of the largest purchasers of fiberglass and spray foam insulation in the United States, we maintain particularly strong relationships with the largest manufacturers of these insulation products. The proximity of certain of our branch locations to insulation manufacturers’ facilities provides additional mutual benefits, including opportunities for cost savings and joint planning regarding future production. We also maintain good relationships with suppliers of the non-insulation products we install. We believe that the pricing, terms and rebates we receive from our suppliers, as well as supply assurance, are favorable. We have found that using multiple suppliers helps to ensure a stable source of materials and favorable purchasing terms as suppliers compete to gain and maintain our business. In addition, our national purchasing volumes provide leverage with suppliers. We continue to pursue additional procurement cost savings and purchasing synergies.
SEASONALITY
We tend to have higher sales during the second half of the year as our homebuilder customers complete construction of homes placed under contract for sale in the traditionally stronger spring selling season. In addition, some of our larger branches operate in states impacted by winter weather and, as such, experience a slowdown in construction activity during the first quarter of the calendar year. This winter slowdown contributes to traditionally lower sales in our first quarter.
The composition and level of our working capital typically change during periods of increasing sales as we carry more inventory and receivables, although this is generally offset in part by higher trade payables to our suppliers. Working capital levels typically increase in the summer and fall seasons due to higher sales during the peak of residential construction activity. The subsequent collection of receivables and reduction in inventory levels during the winter months has typically positively impacted cash flow. In the past, from time to time, we have utilized our borrowing availability under our credit facilities to cover short-term working capital needs.
COMPETITION
We believe that competition in our industry is based on quality and timeliness of service, knowledge of local building codes, pricing, relationships and reputation in the market. We are the second largest new residential installer of insulation in the United States based on our internal estimates. The building products installation industry is fragmented. The markets for our non-insulation installation services are even more fragmented than the markets for insulation installation services. Our competitors include two other large national contractors, several large regional contractors and numerous local contractors. We expect to continue to effectively compete in our local markets given our long standing customer relationships, access to capital, tenure and quality of local staff, quality installation reputation and competitive pricing.
5
Table of Contents
EMPLOYEES
As of December 31, 2014, we had approximately 3,600 employees, consisting of approximately 2,580 installers, 300 sales professionals, 180 production personnel and 540 administrative and management personnel. Fewer than 15 of our employees are covered under collective bargaining agreements. We have never experienced a work stoppage or strike and we believe that we have good relations with our employees.
INFORMATION TECHNOLOGY
JobCORE is our web-enabled internal software technology. The system is designed to operate our business in a highly efficient manner and manage our operations. In addition, we integrate jobCORE into our acquired operations. The jobCORE software provides in-depth operational and financial performance data from individual branches to the corporate office. JobCORE provides us, our branch managers and our salespeople with an important operational tool for monitoring branch level performance. It assists management in assessing important business questions, including customer analysis, sales staff analysis, branch analysis and other operating activities.
INTELLECTUAL PROPERTY
We possess intellectual property rights, including trademarks, trade names and know-how and other proprietary rights that are important to our business. In particular, we maintain registered trademarks and trade names, some of which are the trademarks and trade names under which many of our local branches operate. While we do not believe our business is dependent on any one of our trademarks or trade names, we believe that our trademarks and trade names are important to the development and conduct of our business as well as to the local marketing of our services. We also maintain domain name registration for each of our local branch websites. We make efforts to protect our intellectual property rights, however, the actions taken by us may be inadequate to prevent others from using similar intellectual property. In addition, third parties may assert claims against our use of intellectual property and we may be unable to successfully resolve such claims.
ENVIRONMENTAL AND REGULATORY MATTERS
We are subject to various federal, state and local government regulations applicable in the jurisdictions in which we operate, including laws and regulations relating to our relationships with our employees, public health and safety, work place safety, transportation, zoning and fire codes. We strive to operate in accordance with applicable laws, codes and regulations.
Our transportation operations are subject to the regulatory jurisdiction of the Department of Transportation, or DOT, which has broad administrative powers. We are also subject to safety requirements governing interstate operations prescribed by the DOT. Vehicle dimension and weight and driver hours of service also are subject to both federal and state regulation. Our operations are also subject to the regulatory jurisdiction of the U.S. Department of Labor’s Occupational Safety and Health Administration, or OSHA, which has broad administrative powers regarding workplace and jobsite safety.
Our operations and properties are also subject to federal, state and local laws and regulations relating to the use, storage, handling, generation, transportation, treatment, emission, release, discharge and disposal of hazardous or toxic materials, substances, wastes and petroleum products and the investigation, remediation, removal and monitoring of the presence or release of such materials, substances, wastes and petroleum products, including at currently or formerly owned or occupied premises and off-site disposal locations. We have not previously incurred material costs to comply with environmental laws and regulations. However, we could be subject to material costs, liabilities or claims relating to environmental compliance in the future, especially in the event of changes in existing laws and regulations or in their interpretation or enforcement.
6
Table of Contents
As the nature of our business involves the use or handling of certain potentially hazardous or toxic substances, including spray foam applications and lead-based paint, we may be held liable for claims alleging injury or damage resulting from the release of or exposure to such substances, as well as claims relating to the presence of mold, fungal growth and moisture intrusion alleged in connection with our business activities. In addition, as owners and lessees of real property, we may be held liable for, among other things, releases of hazardous or toxic substances or petroleum products on, at, under or emanating from currently or formerly owned or operated properties, or any off-site disposal locations, or for any known or newly discovered environmental conditions at or relating to any of our properties, including those arising from activities conducted by previous occupants or at adjoining properties, without regard to whether we knew of or were responsible for such release. We may be required to investigate, remove, remediate or monitor the presence or release of such hazardous or toxic substances or petroleum products and may be held liable by a governmental entity for fines and penalties or to any third parties for damages, including for bodily injury, property damage and natural resource damage in connection with the presence or release of hazardous or toxic substances or petroleum products.
To date, costs to comply with applicable laws and regulations relating to pollution or the protection of human health and safety, the environment and natural resources have not had a material adverse effect on our financial condition or operating results, and we do not anticipate incurring material expenditures to comply with environmental laws and regulations in the current fiscal year.
In conjunction with our lease agreements and other transactions, we often provide reasonable and customary indemnifications relating to various matters, including environmental issues. To date, we have not had to pay a material amount pursuant to any such indemnification obligations.
In addition, our suppliers are subject to various laws and regulations, including in particular, environmental laws and regulations.
CORPORATE AND AVAILABLE INFORMATION
Installed Building Products, Inc. is a Delaware corporation formed on October 28, 2011. Installed Building Products, Inc. is a holding company that derives all of its operating income from its subsidiaries. Our principal executive offices are located at 495 South High Street, Suite 50, Columbus, Ohio 43215. Our main telephone number is (614) 221-3399. We completed our initial public offering in February 2014 and our common stock is listed on the New York Stock Exchange under the symbol “IBP.” Unless the context requires otherwise, the terms “IBP,” “the company,” “we,” “us” and “our” in this Form 10-K refer to Installed Building Products, Inc. and its subsidiaries.
Our corporate website is located at www.installedbuildingproducts.com, and our investor relations website is located at http://investors.installedbuildingproducts.com. Copies of our Form 10-K, Quarterly Reports on Form 10-Q, Current Reports on Form 8-K, and amendments to these reports filed or furnished pursuant to Section 13(a) or 15(d) of the Securities Exchange Act of 1934, as amended, or the Exchange Act, are available, free of charge, on our investor relations website as soon as reasonably practicable after we file such material electronically with or furnish it to the Securities and Exchange Commission, or the SEC. The SEC also maintains a website that contains our SEC filings. The address of the site is www.sec.gov. Further, a copy of this Form 10-K is located at the SEC’s Public Reference Room at 100 F Street, NE, Washington, D.C. 20549. Information on the operation of the Public Reference Room can be obtained by calling the SEC at 1-800-SEC-0330.
We webcast our earnings calls and certain events we participate in or host with members of the investment community on our investor relations website. Additionally, we provide notifications of news or announcements regarding our financial performance, including SEC filings, investor events, and press and earnings releases as part of our investor relations website. We have used, and intend to continue to use, our investor relations website as means of disclosing material non-public information and for complying with disclosure obligations under Regulation FD. Further corporate governance information, including our certificate of incorporation, bylaws,
7
Table of Contents
governance guidelines, board committee charters, and code of business conduct and ethics, is also available on our investor relations website under the heading “Corporate Governance.” The contents of our websites are not intended to be incorporated by reference into this Form 10-K or in any other report or document we file with the SEC, and any references to our websites are intended to be inactive textual references only.
| Item 1A. | Risk Factors |
There are a number of business risks and uncertainties that could affect our business. These risks and uncertainties could cause our actual results to differ from past performance or expected results. We consider the following risks and uncertainties to be most relevant to our business activities. Additional risks and uncertainties not presently known to us, or that we currently believe to be immaterial, also may adversely impact our business, financial condition and results of operations. We urge investors to consider carefully the risk factors described below in evaluating the information contained in this report.
RISKS RELATED TO OUR BUSINESS
Our business is dependent on the U.S. residential construction industry, economy, credit markets and other important factors, many of which are beyond our control.
We are highly dependent on the level of new home construction, which in turn is dependent upon a number of factors, including interest rates, consumer confidence, employment rates, foreclosure rates, housing inventory levels, housing demand and the health of the economy and mortgage markets. Unfavorable changes in demographics, credit markets, political conditions, consumer confidence, household formation, housing affordability or housing inventory levels, or a weakening of the national economy or of any regional or local economy in which we operate, could adversely affect consumer spending, result in decreased demand for homes and adversely affect our business. Additional headwinds may come from the efforts and proposals of lawmakers to reduce the debt of the federal government and/or solve state budget shortfalls through tax increases and/or spending cuts, and financial markets’ and businesses’ reactions to those efforts and proposals, which could impair economic growth.
The housing market recovery faces significant challenges.
While some of the challenges facing the housing market first showed signs of moderating in 2012, several remain, and these challenges could return and/or intensify to limit the extent of any recovery of or future improvement in housing market conditions. These challenges include (i) weak general economic and employment growth that, among other things, limits consumer incomes, consumer confidence and demand for homes; (ii) elevated levels of mortgage loan delinquencies, defaults and foreclosures that could add to an inventory of lender-owned homes that may be sold in competition with new and resale homes at low distressed prices or that generate short sales activity at such price levels; (iii) a significant number of homeowners whose outstanding principal balance on their mortgage loan exceeds the market value of their home, which undermines their ability to purchase another home that they otherwise might desire and be able to afford; (iv) volatility and uncertainty in U.S. financial, credit and consumer lending markets amid slow growth or recessionary conditions; and (v) tight lending standards and practices for mortgage loans that limit consumers’ ability to qualify for mortgage financing to purchase a home, including increased minimum credit score requirements, credit risk/mortgage loan insurance premiums and/or other fees and required down payment amounts, more conservative appraisals, higher loan-to-value ratios and extensive buyer income and asset documentation requirements. Given these factors, the present housing recovery may not continue or gain further momentum or return to the historic levels and mix of single-family and multi-family new home construction activity, which could adversely affect our business, financial condition, results of operations and cash flows.
The present housing recovery is relative to the historically low levels of home sales and residential new construction activity experienced during the recent housing downturn. Even with the upturn, which first showed
8
Table of Contents
signs of moderating in 2012, new home construction remains well below, and may not return to, the peak levels reached shortly before the housing downturn began in 2006. In addition, we operate in certain markets where new home construction lags the housing recovery. If the present new home construction recovery stalls or does not continue at the same pace, or any or all of the negative factors described above persist or worsen, there would likely be a corresponding adverse effect on the new home construction market, which would have a material adverse effect on our business and our consolidated financial statements, including, but not limited to, the amount of revenues we generate and our ability to operate profitably.
A decline in the economy and a deterioration in expectations regarding the housing recovery could result in our taking additional significant non-cash impairment charges, which could negatively affect our earnings and reduce stockholders’ equity.
Annually, we assess qualitative factors to determine if it is more likely than not that the fair value of a reporting unit is less than its carrying amount. This assessment had led to impairment of goodwill in years prior to 2012. We did not record any goodwill impairment charges in 2014, 2013, or 2012; however, a decline in the expectation of our future performance or deterioration in expectations regarding the timing and the extent of the recovery of new home construction and home improvement may cause us to recognize additional non-cash, pre-tax impairment charges for goodwill and other indefinite-lived intangible assets or other long-lived assets, which are not determinable at this time. In addition, as a result of our acquisition strategy, we have recorded additional goodwill and may incur impairment charges in connection with prior and future acquisitions. If the value of goodwill or other intangible assets is impaired, our earnings and stockholders’ equity would be adversely affected. In addition, if future acquisitions are not successful, we may record additional unexpected impairment charges.
Our business is cyclical and significantly affected by changes in general and local economic conditions.
Demand for our services is cyclical and highly sensitive to general and local economic conditions over which we have no control, including changes in:
| • | the number of new home and commercial building construction starts; |
| • | short- and long -term interest rates; |
| • | inflation; |
| • | employment levels and job and personal income growth; |
| • | housing demand from population growth, household formation and other demographic changes; |
| • | availability and pricing of mortgage financing for homebuyers and commercial financing for developers of multi-family homes and subcontractors; |
| • | consumer confidence generally and the confidence of potential homebuyers in particular; |
| • | U.S. and global financial system and credit market stability; |
| • | private party and government mortgage loan programs and federal and state regulation, oversight and legal action regarding lending, appraisal, foreclosure and short sale practices; |
| • | federal and state personal income tax rates and provisions, including provisions for the deduction of mortgage loan interest payments, real estate taxes and other expenses; and |
| • | federal, state and local energy efficiency programs, regulations, codes and standards. |
Adverse changes in these conditions may affect our business generally or may be more prevalent or concentrated in particular markets in which we operate. Any deterioration in economic conditions or continuation of uncertain economic conditions could have a material adverse effect on our business, financial condition, results of operations and prospects.
9
Table of Contents
Our business may be affected by severe weather conditions and is seasonal.
Severe weather conditions, such as unusually prolonged cold conditions, rain, blizzards or hurricanes, could accelerate, delay or halt construction or installation activity. The impact of these types of events on our business may adversely impact our net revenue, cash flows from operations and results of operations. If net revenue were to fall substantially below what we would normally expect during certain periods, our financial results for those periods would be adversely impacted.
We tend to have higher sales during the second half of the year as our homebuilder customers complete construction of homes placed under contract for sale in the traditionally stronger spring selling season. In addition, some of our larger branches operate in states impacted by winter weather and, as such, experience a slowdown in construction activity during the first quarter of the calendar year. This winter slowdown contributes to traditionally lower sales in our first quarter.
Our industry is highly fragmented and competitive, and increased competitive pressure may adversely affect our business, financial condition, results of operations and cash flows.
The building products installation industry is highly fragmented and competitive. We face significant competition from other national, regional and local companies. Any of these competitors may (i) foresee the course of market development more accurately than we do; (ii) offer services that are deemed superior to ours; (iii) install building products at a lower cost; (iv) develop stronger relationships with homebuilders and suppliers; (v) adapt more quickly to new technologies, new installation techniques or evolving customer requirements; or (vi) have access to financing on more favorable terms than we can obtain in the market. As a result, we may not be able to compete successfully with them. If we are unable to compete effectively, our business, financial condition, results of operations and cash flows may be adversely affected.
In the event that increased demand leads to higher prices for the products we install, due to the fragmented and competitive nature of our industry, we may have limited, if any, ability to pass on price increases in a timely manner or at all. In the past, we have generally been able to pass on these increases to our customers over time.
Product shortages or the loss of key suppliers could affect our business, financial condition, results of operations and cash flows.
Our ability to offer a wide variety of products to our customers is dependent upon our ability to obtain adequate product supply from manufacturers. We do not typically enter into long-term agreements with our suppliers but have done so from time to time. See Note 11, Commitments and Contingencies, Supply Contract Commitments, to our audited consolidated financial statements included in this Form 10-K for additional information regarding commitments and contingencies. Generally, our products are available from various sources and in sufficient quantities. However, the loss of, or a substantial decrease in the availability of, products from our suppliers or the loss of key supplier arrangements could adversely impact our business, financial condition, results of operations and cash flows. In prior downturns in the housing industry, manufacturers have reduced capacity by closing plants and production lines within plants. Even if such capacity reductions are not permanent, there may be a delay in manufacturers’ ability to increase capacity in times of rising demand. If the demand for products from manufacturers and other suppliers exceeds the available supply, we may be unable to source additional products in sufficient quantity or quality in a timely manner and the prices for the products that we install could rise. These developments could affect our ability to take advantage of market opportunities and limit our growth prospects. Our three largest suppliers in aggregate accounted for approximately 47% of our material purchases for the year ended December 31, 2014. We continually evaluate our supplier relationships and at any given time may move some or all of our purchases from one or more of our suppliers. There can be no assurance that any such action would have its intended effect.
10
Table of Contents
Failure by our suppliers to continue to provide us with products on commercially favorable terms, or at all, could put pressure on our operating margins or have a material adverse effect on our financial condition, operating results and/or cash flows. Our inability to source materials in a timely manner could also damage our relationships with our customers.
Changes in the costs of the products we install can decrease our profit margins.
The principal building products that we install have been subject to price changes in the past, some of which have been significant. Our results of operations for individual quarters can be and have been hurt by a delay between the time building product cost increases are implemented and the time we are able to increase prices for our products, if at all. Our supplier purchase prices often depend on volume requirements. If we do not meet these volume requirements, our costs could increase and our margins may be adversely affected. In addition, while we have been able to achieve cost savings through volume purchasing and our relationships with suppliers, we may not be able to continue to receive advantageous pricing for the products that we install, which could have a material adverse effect on our financial condition, results of operations and cash flows.
We may be unable to successfully acquire and integrate other businesses.
We may be unable to continue to grow our business through acquisitions. We may not be able to continue to identify suitable acquisition candidates and may face increased competition for these acquisition candidates. In addition, acquired businesses may not perform in accordance with expectations, and our business judgments concerning the value, strengths and weaknesses of acquired businesses may not prove to be correct. We may also be unable to achieve expected improvements or achievements in businesses that we acquire. At any given time, including currently, we may be evaluating or in discussions with one or more acquisition candidates, including entering into non-binding letters of intent. Future acquisitions may result in the incurrence of debt and contingent liabilities, legal liabilities, goodwill impairments, increased interest expense and amortization expense and significant integration costs.
Acquisitions involve a number of special risks, including:
| • | our inability to manage acquired businesses or control integration costs and other costs relating to acquisitions; |
| • | potential adverse short-term effects on operating results from increased costs or otherwise; |
| • | diversion of management’s attention; |
| • | failure to retain existing key personnel of the acquired business and recruit qualified new employees at the location; |
| • | failure to successfully implement infrastructure, logistics and systems integration; |
| • | potential impairment of goodwill; |
| • | risks associated with the internal controls of acquired companies; |
| • | exposure to legal claims for activities of the acquired business prior to acquisition and inability to realize on any indemnification claims, including with respect to environmental and immigration claims; |
| • | the risks inherent in the systems of the acquired business and risks associated with unanticipated events or liabilities; and |
| • | our inability to obtain financing necessary to complete acquisitions on attractive terms or at all. |
Our strategy could be impeded if we do not identify, or face increased competition for, suitable acquisition candidates and our business, financial condition, results of operations and cash flows could be adversely affected if any of the foregoing factors were to occur.
11
Table of Contents
We may be subject to claims arising from the operations of our various businesses for periods prior to the dates we acquired them.
We have consummated over 90 acquisitions. We may be subject to claims or liabilities arising from the ownership or operation of acquired businesses for the periods prior to our acquisition of them, including environmental, employee-related and other liabilities and claims not covered by insurance. These claims or liabilities could be significant. Our ability to seek indemnification from the former owners of our acquired businesses for these claims or liabilities may be limited by various factors, including the specific time, monetary or other limitations contained in the respective acquisition agreements and the financial ability of the former owners to satisfy our indemnification claims. In addition, insurance companies may be unwilling to cover claims that have arisen from acquired businesses or locations, or claims may exceed the coverage limits that our acquired businesses had in effect prior to the date of acquisition. If we are unable to successfully obtain insurance coverage of third-party claims or enforce our indemnification rights against the former owners, or if the former owners are unable to satisfy their obligations for any reason, including because of their current financial position, we could be held liable for the costs or obligations associated with such claims or liabilities, which could adversely affect our financial condition and results of operations.
Our success depends on our key personnel.
Our business results depend largely upon the continued contributions of our Chief Executive Officer and other members of our management team. We do not have employment agreements with any of our executive officers, other than Jeff Edwards, the Chairman of our Board and our Chief Executive Officer and President. Although our employment agreement, dated November 1, 2013, with Mr. Edwards provides for a three-year term, he is permitted under the agreement to resign his employment at any time with only 30 days’ prior written notice to us. Also, while his employment agreement requires Mr. Edwards to devote the amount of time necessary to conduct our business and affairs, he is also permitted to engage in other business activities that do not create a conflict of interest or substantially interfere with his service to us, including non-competitive operational activities for his real estate development business. See “Compensation of Our Executive Officers and Directors – Compensation of Our Executive Officers - Employment Agreement with Jeff Edwards.” Although we maintain key person life insurance on Mr. Edwards, if he no longer serves in (or serves in some lesser capacity than) his current role, or if we lose other members of our management team, our business, financial condition and results of operations, as well as the market price of our securities, could be adversely affected.
Our business results also depend upon our branch managers and sales personnel, including those of companies recently acquired. While we customarily sign non-competition agreements, typically lasting two years post- employment, with our branch managers and sales personnel in order to maintain key customer relationships in our markets, such agreements do not protect us fully against competition from former employees.
We are dependent on attracting, training and retaining qualified employees while controlling labor costs.
We must attract, train and retain a large number of qualified employees while controlling related labor costs. We compete with other businesses for these employees. Tighter labor markets, due to a recovering housing market or otherwise, may make it more difficult for us to hire and retain installers and control labor costs. Our ability to control labor costs is subject to numerous external factors, including competitive wage rates and health and other insurance costs. In addition, changes in the federal or state minimum wage or living wage requirements or changes in other workplace regulations could adversely affect our ability to meet our financial targets.
Higher health care costs and labor costs could adversely affect our business.
With the passage in 2010 of the U.S. Patient Protection and Affordable Care Act, or the Affordable Care Act, we are required to provide affordable coverage, as defined in the Affordable Care Act, to all employees, or otherwise be subject to a payment per employee based on the affordability criteria therein. Many of these requirements will
12
Table of Contents
be phased in over a period of time, some having already become effective this past year with others set to become effective in 2015. We anticipate that as these requirements continue to become effective, we could experience higher health care and labor costs in the future. Additionally, some states and localities have passed state and local laws mandating the provision of certain levels of health benefits by some employers. Increased health care and insurance costs could have an adverse effect on our business, financial condition and results of operations. In addition changes in federal or state workplace regulations could adversely affect our ability to meet our financial targets.
Changes in employment laws may adversely affect our business.
Various federal and state labor laws govern the relationship with our employees and impact operating costs. These laws include:
| • | employee classification as exempt or non-exempt for overtime and other purposes; |
| • | minimum wage requirements; |
| • | unemployment tax rates; |
| • | workers’ compensation rates; |
| • | immigration status; |
| • | mandatory health benefits; |
| • | paid leaves of absence, including paid sick leave; |
| • | tax reporting; and |
| • | other wage and benefit requirements. |
Significant additional government-imposed increases in the preceding areas could have a material adverse effect on our business, financial condition and results of operations.
In addition, various states in which we operate are considering or have already adopted new immigration laws or enforcement programs, and the U.S. Congress and Department of Homeland Security from time to time consider and may implement changes to federal immigration laws, regulations or enforcement programs as well. Some of these changes may increase our obligations for compliance and oversight, which could subject us to additional costs and make our hiring process more cumbersome, or reduce the availability of potential employees. Although we verify the employment eligibility status of all our employees, including through participation in the “E-Verify” program where required, some of our employees may, without our knowledge, be unauthorized workers. However, use of the “E-Verify” program does not guarantee that we will properly identify all applicants who are ineligible for employment. Unauthorized workers are subject to deportation and may subject us to fines or penalties, and if any of our workers are found to be unauthorized we could experience adverse publicity that negatively impacts our brand and may make it more difficult to hire and keep qualified employees. Termination of a significant number of employees who were unauthorized employees may disrupt our operations, cause temporary increases in our labor costs as we train new employees and result in additional adverse publicity. We could also become subject to fines, penalties and other costs related to claims that we did not fully comply with all recordkeeping obligations of federal and state immigration compliance laws. These factors could have a material adverse effect on our business, financial condition and results of operations.
We may be subject to periodic litigation and regulatory proceedings, including Fair Labor Standards Act and state wage and hour class action lawsuits, which may adversely affect our business and financial performance.
From time to time, we may be involved in lawsuits and regulatory actions, including class action lawsuits that are brought or threatened against us for alleged violations of the Fair Labor Standards Act, or the FLSA, and state
13
Table of Contents
wage and hour laws. See Note 11, Commitments and Contingencies, to our audited consolidated financial statements for the year ended December 31, 2014 included in Item 8 of Part II of this Form 10-K for additional information regarding commitments and contingencies.
The nature of our business exposes us to product liability, workmanship warranty, casualty, construction defect, breach of contract and other claims and legal proceedings.
We are subject to product liability, workmanship warranty, casualty, construction defect, breach of contract and other claims relating to the products we install that, if adversely determined, could adversely affect our financial condition, results of operations and cash flows. We rely on manufacturers and other suppliers to provide us with most of the products we install. Because we do not have direct control over the quality of such products manufactured or supplied by such third-party suppliers, we are exposed to risks relating to the quality of such products. In addition, we are exposed to potential claims arising from the conduct of our employees, and homebuilders and other subcontractors, for which we may be contractually liable. Certain types of insulation, particularly spray foam applications, require our employees to handle potentially hazardous or toxic substances. While our employees who handle these and other potentially hazardous or toxic materials, including lead-based paint, receive specialized training and wear protective clothing, there is still a risk that they, or others, may be exposed to these substances. Exposure to these substances could result in significant injury to our employees and others, including site occupants, and damage to our property or the property of others, including natural resource damage. Our personnel and others at our work sites are also at risk for other workplace-related injuries, including slips and falls.
We have in the past been, and may in the future be, subject to fines, penalties and other liabilities in connection with any such injury or damage. Although we currently maintain what we believe to be suitable and adequate insurance in excess of our self-insured amounts, we may be unable to maintain such insurance on acceptable terms or such insurance may not provide adequate protection against potential liabilities.
Product liability, workmanship warranty, casualty, negligence, construction defect, breach of contract and other claims can be expensive to defend and can divert the attention of management and other personnel for significant periods of time, regardless of the ultimate outcome. In addition, lawsuits relating to construction defects typically have statutes of limitations that can run as long as ten years. Claims of this nature could also have a negative impact on customer confidence in us and our services. In addition, we are subject to various claims and lawsuits incidental to the conduct of our business in the ordinary course. Current or future claims could have a material adverse effect on our reputation, business, financial condition and results of operations. We may also be unable to obtain performance and licensing bonds on commercially reasonable terms or at all in the future. Surety companies issue bonds on a project-by-project basis and can decline to issue bonds at any time. Our inability to obtain such bonds would materially and adversely affect our business, financial condition, results of operations and cash flows. For additional information, see Note 11, Commitments and Contingencies, to our audited consolidated financial statements for the year ended December 31, 2014 included in Item 8 of Part II of this Form 10-K.
Federal, state, local and other laws and regulations could impose substantial costs and/or restrictions on our operations that would reduce our net income.
We are subject to various federal, state, local and other laws and regulations, including, among other things, worker and workplace health and safety regulations promulgated by the DOT and employment regulations promulgated by the U.S. Equal Employment Opportunity Commission. More burdensome regulatory requirements in these or other areas may increase our expenses and adversely affect our business, financial condition, results of operations and cash flows. Moreover, failure to comply with the regulatory requirements applicable to our business could expose us to substantial fines and penalties that could adversely affect our business, financial condition, results of operations and cash flows.
14
Table of Contents
Our transportation operations, upon which we depend to transport materials from our locations to job sites, are subject to the regulatory jurisdiction of the DOT. The DOT has broad administrative powers with respect to our transportation operations. More restrictive limitations on vehicle weight and size, trailer length and configuration or driver hours of service would increase our costs, which, if we are unable to pass these cost increases on to our customers, may increase our expenses and adversely affect our financial condition, operating results and/or cash flows. If we fail to comply adequately with DOT regulations or regulations become more stringent, we could experience increased inspections, regulatory authorities could take remedial action including imposing fines or shutting down our operations and we could be subject to increased audit and compliance costs. We organize our transportation operations as a separate legal entity in certain states, including in Ohio and Indiana, in order to take advantage of sales tax exemptions relating to vehicle operating costs. If legislation is enacted that modifies or eliminates these exemptions, our costs may increase. If any of these events were to occur, our financial condition, results of operations and cash flows may be adversely affected.
In addition, the residential construction industry is subject to various federal, state and local statutes, ordinances, rules and regulations concerning zoning, building design and safety, construction, contractors’ licensing, energy conservation and similar matters, including regulations that impose restrictive zoning and density requirements on the residential new construction industry or that limit the number of homes that can be built within the boundaries of a particular area. Regulatory restrictions and industry standards may require us to alter our installation processes and our sourcing and otherwise increase our operating expenses and limit the availability of suitable building lots for our customers, any of which could negatively affect our business, financial condition and results of operations.
We are subject to environmental regulation and potential exposure to environmental liabilities.
We are subject to various federal, state, and local environmental laws and regulations. Although we believe that we operate our business, including each of our locations, in material compliance with applicable laws and regulations and maintain all material permits required under such laws and regulations to operate our business, we may be held liable or incur fines or penalties in connection with such requirements. As the nature of our business involves the use or handling of certain potentially hazardous or toxic substances, including spray foam applications and lead-based paint, we may be held liable for claims alleging injury or damage resulting from the release of or exposure to such substances. In addition, as owners and lessees of real property, we may be held liable for, among other things, hazardous or toxic substances, including asbestos or petroleum products on, at, under or emanating from currently or formerly owned or operated properties, or any off-site disposal locations, or for any known or newly discovered environmental conditions at or relating to any of our properties, including those arising from activities conducted by previous occupants or at adjoining properties, without regard to whether we knew of or were responsible for such release. We may be required to investigate, remove, remediate or monitor the presence or release of such hazardous or toxic substances or petroleum products. We may also be held liable to a governmental entity for fines and penalties or to third parties for damages, including for bodily injury, property damage and natural resource damage in connection with the presence or release of hazardous or toxic substances or petroleum products. In addition, expenditures may be required in the future as a result of releases of, or exposure to, hazardous or toxic substances or petroleum products, the discovery of currently unknown environmental conditions or changes in environmental laws and regulations or their interpretation or enforcement and in certain instances, such expenditures may be material.
Increases in union organizing activity and work stoppages could delay or reduce availability of products that we install and increase our costs.
Less than one percent of our employees are currently covered by collective bargaining or other similar labor agreements. However, if a larger number of our employees were to unionize, including in the wake of any future legislation that makes it easier for employees to unionize, our business could be negatively affected. Any inability by us to negotiate collective bargaining arrangements could cause strikes or other work stoppages, and new contracts could result in increased operating costs. If any such strikes or other work stoppages occur, or if other employees become represented by a union, we could experience a disruption of our operations and higher labor costs.
15
Table of Contents
In addition, certain of our suppliers have unionized work forces and certain of our products are transported by unionized truckers. Strikes, work stoppages or slowdowns could result in slowdowns or closures of facilities where the products that we install are manufactured or could affect the ability of our suppliers to deliver such products to us. Any interruption in the production or delivery of these products could delay or reduce availability of these products and increase our costs.
Increases in fuel costs could adversely affect our results of operations.
The price of oil has fluctuated over the last few years, creating volatility in our fuel costs. We do not currently hedge our fuel costs. Increases in fuel costs can negatively impact our cost to deliver our products to our customers and thus increase our cost of sales. If we are unable to increase the selling price of our products to our customers to cover any increases in fuel costs, net income may be adversely affected.
We may be adversely affected by disruptions in our information technology systems.
Our operations are dependent upon our information technology systems, including our web-enabled internal software technology, jobCORE. The jobCORE software provides in-depth operational and financial performance data from individual branch locations to the corporate office. We rely upon such information technology systems to manage customer orders on a timely basis, to coordinate our sales and installation activities across locations and to manage invoicing. A substantial disruption in our information technology systems for any prolonged time period (arising from, for example, system capacity limits from unexpected increases in our volume of business, outages, computer viruses, unauthorized access or delays in our service) could result in delays in receiving inventory and supplies or installing our products on a timely basis for our customers, which could adversely affect our reputation and customer relationships. Our systems might be damaged or interrupted by natural or man-made events or by computer viruses, physical or electronic break-ins, or similar disruptions affecting the Internet and our disaster recovery plan may be ineffective at mitigating the effects of these risks. Such delays, problems or costs could have a material adverse effect on our financial condition, results of operations and cash flows.
Because we operate our business through highly dispersed locations across the United States, our operations may be materially adversely affected by inconsistent practices and the operating results of individual branches may vary.
We operate our business through a network of highly dispersed locations throughout the United States, supported by corporate executives and services in our headquarters, with local branch management retaining responsibility for day-to-day operations and adherence to applicable local laws. Our operating structure can make it difficult for us to coordinate procedures across our operations in a timely manner or at all. In addition, our branches may require significant oversight and coordination from headquarters to support their growth. Inconsistent implementation of corporate strategy and policies at the local level could materially and adversely affect our overall profitability, business, results of operations, financial condition and prospects.
In addition, the operating results of an individual branch may differ from that of another branch for a variety of reasons, including market size, management practices, competitive landscape, regulatory requirements and local economic conditions. As a result, certain of our branches may experience higher or lower levels of growth than other branches. Growth of the company is occurring at different rates across our branches and, accordingly, could have a disproportionate effect on the future growth of the company as a whole. Therefore, our overall financial performance and results of operations may not be indicative of the performance and results of operations of any individual branch.
16
Table of Contents
Restrictions in our credit agreement, or any other indebtedness we may incur in the future, could adversely affect our business, financial condition, results of operations, ability to make distributions to stockholders and the value of our common stock.
Our credit agreement, or any future credit facility or other indebtedness we enter into, may limit our ability to, among other things:
| • | incur or guarantee additional debt; |
| • | make distributions or dividends on or redeem or repurchase shares of common stock; |
| • | make certain investments and acquisitions; |
| • | make capital expenditures; |
| • | incur certain liens or permit them to exist; |
| • | enter into certain types of transactions with affiliates; |
| • | acquire, merge or consolidate with another company; and |
| • | transfer, sell or otherwise dispose of all or substantially all of our assets. |
Our credit agreement contains, and any future credit facility or other debt instruments we may enter into will also likely contain, covenants requiring us to maintain certain financial ratios and meet certain tests, such as a fixed charge coverage ratio and a leverage ratio. See Item 7, Management’s Discussion and Analysis of Financial Condition and Results of Operations, Liquidity and Capital Resources, Revolving Credit Facility. Our ability to comply with those financial ratios and tests can be affected by events beyond our control, and we may not be able to comply with those ratios and tests when required to do so under the applicable debt instruments.
The provisions of our credit agreement or other debt instruments may affect our ability to obtain future financing and pursue attractive business opportunities and our flexibility in planning for, and reacting to, changes in business conditions. In addition, a failure to comply with the provisions of our credit agreement, any future credit facility or other debt instruments could result in a default or an event of default that could enable our lenders or other debt holders to declare the outstanding principal of that debt, together with accrued and unpaid interest, to be immediately due and payable. If the payment of our debt is accelerated, our assets may be insufficient to repay such debt in full, and our stockholders could experience a partial or total loss of their investment.
We could manage working capital in ways that may affect our cash flow from operations.
Since we aim to continuously manage our working capital, we could manage our payments to suppliers differently in the future. Changes in how we manage our payments to suppliers could change our cash flow from operations and change our working capital as a percentage of sales. In addition, we have two supply contracts with minimum purchase requirements based on quantity rather than a specific market rate. These obligations may cause us to purchase materials earlier than we otherwise would and increase our working capital requirements. There is no guarantee that our working capital as a percentage of sales will not continue to increase in the future.
RISKS RELATED TO OWNERSHIP OF OUR COMMON STOCK
The price of our common stock may fluctuate substantially, and your investment may decline in value.
The market price of our common stock may be significantly affected by factors, such as:
| • | market conditions affecting the residential construction and building products industries; |
| • | quarterly variations in our results of operations; |
| • | changes in government regulations; |
17
Table of Contents
| • | the announcement of acquisitions by us or our competitors; |
| • | changes in general economic and political conditions; |
| • | volatility in the financial markets; |
| • | results of our operations and the operations of others in our industry; |
| • | changes in interest rates; |
| • | threatened or actual litigation and government investigations; |
| • | the addition or departure of key personnel; |
| • | actions taken by our stockholders, including the sale or disposition of their shares of our common stock; |
| • | differences between our actual financial and operating results and those expected by investors and analysts and changes in analysts’ recommendations or projections. |
These and other factors may lower the market price of our common stock, regardless of our actual operating performance.
Furthermore, in recent years the stock market has experienced significant price and volume fluctuations. This volatility has had a significant impact on the market price of securities issued by many companies, including companies in our industry. The changes frequently appear to occur without regard to the operating performance of the affected companies. Hence, the price of our common stock could fluctuate based upon factors that have little or nothing to do with us, and these fluctuations could materially reduce the price of our common stock and materially affect the value of your investment.
The obligations associated with being a public company require significant resources and management attention.
We completed our initial public offering in February 2014. As a public company, we face increased legal, accounting, administrative and other costs and expenses that we did not incur as a private company, particularly after we are no longer an emerging growth company. We are subject to the reporting requirements of the Securities Exchange Act of 1934, as amended, or the Exchange Act, which requires that we file annual, quarterly and current reports with respect to our business and financial condition and proxy and other information statements, and the rules and regulations implemented by the SEC, the Sarbanes-Oxley Act, the Dodd-Frank Act, the Public Company Accounting Oversight Board and the NYSE each of which imposes additional reporting and other obligations on public companies. As a public company, we are required to:
| • | prepare and distribute periodic reports, proxy statements and other stockholder communications in compliance with the federal securities laws and the NYSE rules; |
| • | expand the roles and duties of our board of directors and committees thereof; |
| • | maintain an internal audit function; |
| • | institute more comprehensive financial reporting and disclosure compliance functions; |
| • | involve and retain to a greater degree outside counsel and accountants in the activities listed above; |
| • | enhance our investor relations function; |
| • | establish new internal policies, including those relating to trading in our securities and disclosure controls and procedures; |
| • | retain additional personnel; |
18
Table of Contents
| • | comply with NYSE listing standards; and |
| • | comply with the Sarbanes-Oxley Act. |
We expect these rules and regulations and changes in laws, regulations and standards relating to corporate governance and public disclosure, which have created uncertainty for public companies, to increase legal and financial compliance costs and make some activities more time consuming and costly. These laws, regulations and standards are subject to varying interpretations, in many cases due to their lack of specificity, and, as a result, their application in practice may evolve over time as new guidance is provided by regulatory and governing bodies. This could result in continuing uncertainty regarding compliance matters and higher costs necessitated by ongoing revisions to disclosure and governance practices. Our investment in compliance with existing and evolving regulatory requirements will result in increased administrative expenses and a diversion of management’s time and attention from revenue-generating activities to compliance activities, which could have a material adverse effect on our business, financial condition, results of operations and cash flows.
These increased costs may lessen our ability to expand our business and achieve our strategic objectives. We also expect that it will be expensive to maintain director and officer liability insurance, and we may be required to accept reduced policy limits and coverage or incur substantially higher costs to obtain the same or similar coverage. As a result, it may be more difficult for us to attract and retain qualified persons to serve on our board of directors or as executive officers. Furthermore, if we are unable to satisfy our obligations as a public company, we could be subject to delisting of our common stock, fines, sanctions and other regulatory action and civil litigation.
If we are unable to implement and maintain effective internal control over financial reporting in the future, the accuracy and timeliness of our financial reporting may be adversely affected.
Although we were not required to and did not engage our independent registered public accounting firm to conduct an audit of our internal control over financial reporting, in connection with the audits of our consolidated financial statements as of and for the years ended December 31, 2013 and 2012, our independent registered public accounting firm informed us that they identified a material weakness relating to our internal control over financial reporting under standards established by the PCAOB. The PCAOB defines a material weakness as a deficiency, or a combination of deficiencies, in internal control over financial reporting such that there is a reasonable possibility that a material misstatement of the company’s annual or interim financial statements will not be prevented or detected on a timely basis.
We developed a plan and implemented a number of actions to remediate this material weakness. After implementing new internal controls and procedures, we concluded that we have remediated the previously identified material weakness as of December 31, 2014. Additional information about our remediation efforts and internal control over financial reporting are described in Item 9A. Controls and Procedures in this Form 10-K.
Although we believe we have addressed the previously identified material weakness, the measures we have taken may not be effective, and we may not be able to implement and maintain effective internal control over financial reporting in the future. In addition, other material weaknesses or deficiencies may be identified in the future. Once we cease to be an emerging growth company and once we become an accelerated filer or a large accelerated filer, as of each fiscal year end thereafter, our independent registered public accounting firm will be required to evaluate and report on our internal controls over financial reporting. If we are unable to correct material weaknesses or deficiencies in internal controls in a timely manner, our ability to record, process, summarize and report financial information accurately and within the time periods specified in the rules and forms of the SEC, may be adversely affected. This failure could negatively affect the market price and trading liquidity of our common stock, cause investors to lose confidence in our reported financial information, subject us to civil and criminal investigations and penalties, and generally materially and adversely impact our business and financial condition.
19
Table of Contents
We are an emerging growth company and, as a result of the reduced disclosure and governance requirements applicable to emerging growth companies, our common stock may be less attractive to investors.
We are an emerging growth company, as defined in the JOBS Act, and we are eligible to take advantage of certain exemptions from various reporting requirements applicable to other public companies. Those exemptions include, but are not limited to, an exemption from the auditor attestation requirement of Section 404 of the Sarbanes-Oxley Act, reduced disclosure about executive compensation arrangements pursuant to the rules applicable to smaller reporting companies and no requirement to seek non-binding advisory votes on executive compensation or golden parachute arrangements. We have elected to adopt these reduced disclosure requirements. We may take advantage of these provisions until we are no longer an emerging growth company. We will remain an emerging growth company until the earlier of (1) the last day of the fiscal year (a) following the fifth anniversary of the first sale of our common stock pursuant to an effective registration statement, or February 12, 2019; (b) in which we have total annual gross revenue of at least $1.0 billion or (c) in which we are deemed to be a large accelerated filer, which means the market value of our common stock that is held by non-affiliates exceeds $700 million as of the prior June 30th, and (2) the date on which we have issued more than $1.0 billion in non-convertible debt during the prior three-year period. We cannot predict if investors will find our common stock less attractive as a result of our taking advantage of these exemptions. If some investors find our common stock less attractive as a result of our choices, there may be a less active trading market for our common stock and our stock price may be more volatile.
Future sales of our common stock, or the perception in the public markets that these sales may occur, may depress our stock price.
The market price of our common stock could decline significantly as a result of sales of a large number of shares of our common stock. These sales, or the perception that these sales might occur, could depress the market price of our common stock or make it more difficult for us to sell equity securities in the future at a time and at a price that we deem appropriate.
We have 31,539,087 shares of common stock outstanding as of December 31, 2014. The shares of common stock are freely tradable, except for any shares of common stock that may be held or acquired by our directors, executive officers and other affiliates, the sale of which will be restricted under the Securities Act of 1933, as amended, or the Securities Act. As of December 31, 2014, 2,976,510 of the 3,000,000 shares of common stock authorized for issuance under the 2014 Omnibus Incentive Plan were available for issuance. These shares will become eligible for sale in the public market in the future, subject to certain legal and contractual limitations.
Moreover, pursuant to a registration rights agreement among us and certain of our current stockholders, certain of our stockholders have the right to require us to register under the Securities Act. See “Certain Relationships and Related-Party Transactions-Registration Rights Agreement.” If our existing stockholders sell substantial amounts of our common stock in the public market, or if the public perceives that such sales could occur, this could have an adverse impact on the market price of our common stock, even if there is no relationship between such sales and the performance of our business.
Also, in the future, we may issue shares of our common stock in connection with investments or acquisitions. The amount of shares of our common stock issued in connection with an investment or acquisition could constitute a material portion of our then-outstanding shares of our common stock.
Jeff Edwards has significant ownership of our common stock and may have interests that conflict with those of our other stockholders.
As of December 31, 2014, Jeff Edwards beneficially owns approximately 27.4% of our common stock. So long as Jeff Edwards continues to hold, directly or indirectly, shares of common stock representing a significant
20
Table of Contents
percentage of the voting power of our common stock, he will be able to exercise control over all matters requiring stockholder approval, including the election of directors, amendment of our amended and restated certificate of incorporation and approval of significant corporate transactions, and will have significant influence over our management and policies. This concentration of voting power may have the effect of delaying or preventing a change in control of us or discouraging others from making tender offers for our shares of common stock, which could prevent stockholders from receiving a premium for their shares of common stock. These actions may be taken even if other stockholders oppose them. The interests of Jeff Edwards may not always coincide with the interests of other stockholders, and he may act in a manner that advances his best interests and not necessarily those of our other stockholders. In addition, under our amended and restated certificate of incorporation, Jeff Edwards is permitted to pursue corporate opportunities for himself, rather than for us.
Certain of our stockholders that are controlled by Jeff Edwards have pledged shares of our common stock as collateral for loans, which may cause Jeff Edwards’ interests to conflict with the interests of our other stockholders and may adversely affect the trading price of our common stock.
Certain of our stockholders, PJAM IBP Holdings, LLC, and Installed Building Systems, Inc., which are controlled by Jeff Edwards, or the Edwards Stockholders, have pledged shares of our common stock as collateral for loans. In 2014 and 2015 through the date of this filing, the Edwards Stockholders pledged 6,655,500 shares and 875,000 shares, respectively, of our common stock as collateral for loans. We are not a party to these loans, which are full recourse against the Edwards Stockholders and are secured, in part, by pledges of a portion of our common stock currently beneficially owned by Jeff Edwards and the Edwards Stockholders. The terms of these loans were negotiated directly between Jeff Edwards and members of his family and the respective lending institutions.
These pledges of shares of our common stock may cause Jeff Edwards’ interests to not always coincide with the interests of other stockholders, and he may act in a manner that advances his best interests and not necessarily those of our other stockholders. The occurrence of certain events under these loan agreements could result in the future sales of such shares and significantly reduce Jeff Edwards’ ownership in us. Such sales could adversely affect the market and trading price of our common stock. In addition, if the value of our common stock declines, the lending institutions may require additional collateral for the loans, which could cause the Edwards Stockholders to pledge additional shares of our common stock. We can give no assurances that the Edwards Stockholders will not pledge additional shares of our common stock in the future, whether as a result of lender calls requiring additional collateral or their entry into new loans that require them to pledge shares of our common stock.
In addition, our directors, executive officers and other stockholders may pledge shares of our common stock in the future. Depending on the occurrence of certain events relating to the obligations for which these pledges may serve as collateral, our directors, executive officers or other stockholders may experience a foreclosure or margin call that could result in the sale of such pledged shares of our common stock, in the open market or otherwise. Such sales could adversely affect the market and trading price of our common stock
Capped call transactions that were entered into by parties affiliated with Jeff Edwards may affect the value of our common stock.
In June 2014, IBP Holding Company and Installed Building Systems, Inc., both entities that are controlled by Jeff Edwards, entered into capped call option transactions with respect to approximately 1.1 million shares of our common stock with an affiliate of one of the underwriters of our initial public offering and June 2014 secondary public offering, or the option counterparty. The transactions are expected to result in future cash payments to the parties to the extent the price of our common stock upon expiration of the options is greater than the strike price of the options, subject to a cap.
21
Table of Contents
In connection with establishing its initial hedge of any capped call transactions, the option counterparty (or one of its affiliates) purchased shares of our common stock.
In addition, the option counterparty (or one of its affiliates) may modify its hedge position by entering into or unwinding various derivatives with respect to our common stock and/or purchasing or selling common stock or other securities of ours in secondary market transactions from time to time. This activity could also cause or mitigate an increase or decrease in the market price of our common stock. We cannot predict what effect the capped call transactions could have on the price of our common stock.
Provisions of our charter documents and Delaware law could delay, discourage or prevent an acquisition of us, even if the acquisition would be beneficial to our stockholders, and could make it more difficult for our stockholders to change our management.
Our amended and restated certificate of incorporation and bylaws may discourage, delay or prevent a merger, acquisition or other change in control that stockholders may consider favorable, including transactions in which stockholders might otherwise receive a premium for their shares of our common stock. In addition, these provisions may frustrate or prevent any attempt by our stockholders to replace or remove our current management by making it more difficult to replace or remove members of our board of directors. These provisions include the following:
| • | a classified board of directors with three-year staggered terms; |
| • | no cumulative voting in the election of directors, which limits the ability of minority stockholders to elect director candidates; |
| • | the exclusive right of our board of directors to fill a vacancy created by the expansion of the board of directors or the resignation, death or removal of a director, which prevents stockholders from being able to fill vacancies on our board of directors; |
| • | the ability of our board of directors to authorize the issuance of shares of preferred stock and to determine the price and other terms of those shares, including preferences and voting rights, without stockholder approval, which could be used to significantly dilute the ownership of the holders of our stock or a hostile acquirer; |
| • | a prohibition on stockholder action by written consent, which forces stockholder action to be taken at an annual or special meeting of our stockholders; |
| • | a requirement that a special meeting of stockholders may be called only by the chairman of our board of directors, our Chief Executive Officer or upon a resolution approved by a majority of the total number of directors that we would have if there were no vacancies, and not by our stockholders; and |
| • | advance notice procedures that stockholders must comply with in order to nominate candidates to our board of directors or to propose matters to be acted upon at a stockholders’ meeting, which may discourage or deter a potential acquirer from conducting a solicitation of proxies to elect the acquirer’s own slate of directors or otherwise attempting to obtain control of us. |
In addition, we are subject to Section 203 of the Delaware General Corporation Law, which generally prohibits a Delaware corporation from engaging in any of a broad range of business combinations with a stockholder owning 15% or more of such corporation’s outstanding voting stock for a period of three years following the date on which such stockholder became an “interested” stockholder. This provision could have the effect of delaying or preventing a change of control, whether or not it is desired by or beneficial to our stockholders. Any delay or prevention of a change of control transaction or changes in our board of directors and management could deter potential acquirers or prevent the completion of a transaction in which our stockholders could receive a substantial premium over the then-current market price for their shares of our common stock.
22
Table of Contents
We do not expect to pay any dividends in the foreseeable future.
We intend to retain our future earnings, if any, in order to reinvest in the development and growth of our business and, therefore, do not intend to pay dividends on our common stock for the foreseeable future. Any future determination to pay dividends will be at the discretion of our board of directors and will depend on our financial condition, results of operations, capital requirements, the limits imposed by the terms of our credit agreement, or any then-existing debt instruments, and such other factors as our board of directors deems relevant. Accordingly, investors in our common stock may need to sell their shares to realize a return on their investment in our common stock, and investors may not be able to sell their shares at or above the prices paid for them.
If securities analysts do not publish favorable reports about us or if we, or our industry, are the subject of unfavorable commentary, the price of our common stock could decline.
The trading price for our common stock depends in part on the research and reports about us that are published by analysts in the financial industry. Analysts could issue negative commentary about us or our industry, or they could downgrade our common stock. We may also not receive sufficient research coverage or visibility in the market. Any of these factors could result in the decline of the trading price of our common stock, causing investors in our common stock to lose all or a portion of their investment.
| Item 1B. | Unresolved Staff Comments |
None.
| Item 2. | Properties |
Real Property
We lease office and warehouse space in 33 states, including our corporate office in Columbus, Ohio. Our properties range in size from approximately 144 square feet to approximately 90,000 square feet. Our leases are typically short term in duration with customary extensions at our option. We also own two adjoining properties in Mars, Pennsylvania. We believe suitable alternative space is available in all of our markets. The table below summarizes our locations, as of December 31, 2014. All locations are leased unless otherwise indicated.
| * | Includes two owned properties and one leased property in Mars, Pennsylvania. |
23
Table of Contents
Our Fleet
As of December 31, 2014, our fleet consisted of 2,085 total vehicles that we either lease or own, including 1,790 installation vehicles which our installers use to deliver and install products from our local locations to job sites and approximately 295 other vehicles that are utilized by our sales staff and branch managers.
| Item 3. | Legal Proceedings |
A class action lawsuit was filed in February 2013 and an amended complaint was filed in May 2013 in the Superior Court of King County, Washington, involving Installed Building Products II, LLC, one of our subsidiaries, alleging violations of Washington State wage and hour laws for failure to pay prevailing and minimum wage and overtime wages. The plaintiffs were former insulation installers for Installed Building Products II, LLC in Washington who sought to represent all similarly situated workers. They sought all unpaid wages, along with litigation costs and fees.
A lawsuit was filed in July 2013 in federal court in the Middle District of Tennessee against one of our subsidiaries, TCI d/b/a Installed Building Products of Nashville, alleging unpaid overtime and failure to pay lawful wages under federal law and Tennessee common law and in unjust enrichment and in breach of an alleged contract. The named plaintiffs were former insulation installers in Nashville. The plaintiffs sought to have this case certified as a collective action under the Federal Fair Labor Standards Act and as a class action under Tennessee law. They sought reimbursement of the overtime wages for all time worked over forty hours each week, as well as liquidated damages and litigation costs and fees.
Both lawsuits were settled in January 2014 for a total cost of $1.4 million, $0.2 million of which we paid during the year ended December 31, 2013 and $1.2 million of which we paid during the year ended December 31, 2014. We recorded the $1.4 million charge in Administrative and Other operating expenses in our Consolidated Statement of Operations during the year ended December 31, 2013 and therefore recorded no related expense for the year ended December 31, 2014.
In addition, we are involved in various claims and lawsuits incidental to the conduct of our business in the ordinary course. We carry insurance coverage in excess of our self-insured coverage, which we believe to be reasonable under the circumstances, although insurance may or may not cover any or all of our liabilities in respect of claims and lawsuits. We do not believe that the ultimate resolution of these matters individually or in the aggregate will have a material adverse effect on our consolidated financial position, results of operations or cash flows.
| Item 4. | Mine Safety Disclosures |
Not applicable.
| Item 5. | Market for Registrant’s Common Equity, Related Stockholder Matters and Issuer Purchases of Equity Securities |
Market Information for Common Stock
Our common stock began trading on the New York Stock Exchange under the symbol “IBP” on February 13, 2014. Prior to that date, there was no public trading market for our common stock. Since that date, our stock has traded at the following high and low trade prices per quarter during 2014:
| Q1 | Q2 | Q3 | Q4 | |||||||||||||
| High |
$ | 15.09 | $ | 14.71 | $ | 14.58 | $ | 18.89 | ||||||||
| Low |
$ | 12.03 | $ | 11.75 | $ | 10.82 | $ | 13.77 | ||||||||
24
Table of Contents
Holders of Record
As of March 4, 2015, there were 38 holders of record of our common stock, one of which was Cede & Co., which is the holder of shares held through the Depository Trust Company.
Dividend Policy
During the years ended 2014, 2013 and 2012, we did not declare or pay any cash dividends on our capital stock. We currently do not anticipate paying dividends for the foreseeable future. Any future determination relating to dividends will be made at the discretion of our board of directors and will depend on a number of factors, including our future earnings, capital requirements, financial condition, future prospects, contractual restrictions, legal requirements and other factors our board of directors may deem relevant.
Stock Repurchase
On December 11, 2014, our board of directors authorized and we purchased 300,000 shares of our common stock from Cetus Capital II, LLC, a related party, for a purchase price of approximately $5.3 million, or $17.61 per share, which was the last reported price of our common stock on December 11, 2014. The shares have not been retired, but are held in treasury stock at December 31, 2014.
Stock Performance Graph
The table below compares the cumulative total shareholder return on our common stock with the cumulative total return of (i) the Russell 2000 Index (“Russell 2000 Index”) and (ii) the Standard & Poor’s Industrials Index (“S&P Industrials Index”) from February 13, 2014 (the first day our stock was traded in the public market) through December 31, 2014. The graph assumes investments of $100 on February 13, 2014 in our common stock and in each of the two indices and the reinvestment of dividends.
Securities Authorized for Issuance Under Equity Compensation Plans
In connection with our initial public offering, our board of directors adopted and established and our stockholders approved our 2014 Omnibus Incentive Plan in January 2014. The aggregate number of shares of our common stock which may be issued under our 2014 Omnibus Incentive Plan or used for reference purposes or with respect to which awards may be granted may not exceed 3,000,000 shares. As of December 31, 2014, 2,976,510
25
Table of Contents
of the shares of common stock authorized for issuance were available for issuance under the 2014 Omnibus Incentive Plan. The 2014 Omnibus Incentive Plan replaced an existing equity incentive plan, which was previously adopted by our board of directors and stockholders. At the time of adoption of the 2014 Omnibus Incentive Plan, there were no options outstanding under the previously existing equity incentive plan.
Unregistered Sales of Equity Securities
During the period covered by this Form 10-K, we have not issued securities without registration under the Securities Act.
| Item 6. | Selected Financial Data |
The following tables set forth selected historical consolidated financial data that should be read in conjunction with Item 7, Management’s Discussion and Analysis of Financial Condition and Results of Operations, and our consolidated financial statements and notes thereto included in Part II, Item 8, Financial Statements and Supplementary Data, of this Form 10-K. The consolidated statements of operations data for the years ended December 31, 2014, 2013, 2012 and 2011 and the consolidated balance sheet data as of December 31, 2014, 2013, 2012 and 2011 are derived from our audited consolidated financial statements. The selected historical consolidated financial data in this section is not intended to replace our historical consolidated financial statements and the related notes thereto. Our historical results are not necessarily indicative of future results.
| Years ended December 31, | ||||||||||||||||
| 2014 | 2013 | 2012 | 2011 | |||||||||||||
| Statement of operations information: (in millions, except per share amounts) |
||||||||||||||||
| Net revenue |
$ | 518.0 | $ | 431.9 | $ | 301.3 | $ | 238.4 | ||||||||
| Cost of sales |
377.9 | 322.2 | 227.3 | 181.2 | ||||||||||||
|
|
|
|
|
|
|
|
|
|||||||||
| Gross profit |
140.1 | 109.7 | 74.0 | 57.2 | ||||||||||||
| Operating expenses |
||||||||||||||||
| Selling |
31.0 | 25.5 | 19.8 | 18.4 | ||||||||||||
| Administrative (1)(2) |
83.5 | 71.1 | 56.1 | 55.9 | ||||||||||||
|
|
|
|
|
|
|
|
|
|||||||||
| Operating income (loss) |
25.6 | 13.1 | (1.9 | ) | (17.1 | ) | ||||||||||
| Other expense (income) |
3.0 | 2.2 | 1.8 | (11.4 | ) | |||||||||||
|
|
|
|
|
|
|
|
|
|||||||||
| Income (loss) before income taxes |
22.6 | 10.9 | (3.7 | ) | (5.7 | ) | ||||||||||
| Income tax provision |
8.6 | 4.3 | 0.6 | 1.5 | ||||||||||||
|
|
|
|
|
|
|
|
|
|||||||||
| Net income (loss) from continuing operations |
14.0 | 6.6 | (4.3 | ) | (7.2 | ) | ||||||||||
| Discontinued Operations |
||||||||||||||||
| Loss (income) from discontinued operations, net of tax |
0.1 | 0.6 | (2.4 | ) | 1.8 | |||||||||||
|
|
|
|
|
|
|
|
|
|||||||||
| Net income (loss) |
$ | 13.9 | $ | 6.0 | $ | (1.9 | ) | $ | (9.0 | ) | ||||||
|
|
|
|
|
|
|
|
|
|||||||||
| Accretion charges on redeemable preferred stock |
(19.9 | ) | (6.2 | ) | (5.5 | ) | (0.8 | ) | ||||||||
| Accretion charges on Pre-Recapitalization Preferred Units |
— | — | — | (1.6 | ) | |||||||||||
| Gain on Extinguishment of Pre-Recapitalization Preferred Units |
— | — | — | 85.0 | ||||||||||||
|
|
|
|
|
|
|
|
|
|||||||||
| Net (loss) income attributable to common stockholders |
$ | (6.0 | ) | $ | (0.2 | ) | $ | (7.4 | ) | $ | 73.6 | |||||
|
|
|
|
|
|
|
|
|
|||||||||
| (Loss) income per share attributable to common stockholders (basis and diluted) |
$ | (0.20 | ) | $ | (0.01 | ) | $ | (0.37 | ) | $ | 3.78 | |||||
|
|
|
|
|
|
|
|
|
|||||||||
26
Table of Contents
| Years ended December 31, | ||||||||||||||||
| 2014 | 2013 | 2012 | 2011 | |||||||||||||
| Balance sheet data: (in millions) |
||||||||||||||||
| Cash |
$ | 10.8 | $ | 4.1 | $ | 3.9 | $ | 2.5 | ||||||||
| Total current assets |
119.3 | 95.5 | 75.8 | 56.6 | ||||||||||||
| Property and equipment, net |
39.4 | 29.5 | 17.9 | 8.2 | ||||||||||||
| Total assets |
234.2 | 191.1 | 160.8 | 127.5 | ||||||||||||
| Total funded debt (3) |
53.7 | 50.1 | 30.1 | 21.3 | ||||||||||||
| Mezzanine equity (4) |
— | 136.8 | 66.9 | 59.6 | ||||||||||||
| Total stockholders’ equity (deficit) |
91.9 | (71.4 | ) | (7.5 | ) | (9.6 | ) | |||||||||
| Total mezzanine equity and stockholders’ equity |
91.9 | 65.4 | 59.4 | 50.0 | ||||||||||||
| (1) | In years prior to 2012, IBP Management Holdings, LLC and IBP Investment Holdings, LLC issued awards of their equity interests to certain of our employees. Certain of these employees were granted rights to put such equity awards during a limited period to Jeff Edwards, our Chairman, Chief Executive Officer and President. Accounting guidance requires that the compensation associated with these equity awards be pushed down to us and recorded as non-cash compensation expense. The non-cash compensation expense associated with the equity awards approximated $0.8 million and $4.7 million for the years ended December 31, 2011 and 2012, respectively, and is included in administrative expenses. There were no charges for the years ended December 31, 2014 or 2013. |
| (2) | For the year ended December 31, 2011, management fees of $4.7 million, included in Administrative expenses, represented amounts charged to us by IBP Holding Company, a related party, under agreements originally entered into in March 2004 and October 2007, which were terminated as a result of our Recapitalization. The associated expenses were transferred to us and IBP Holding Company personnel became our employees in January 2012. For the year ended December 31, 2012, management fees were paid to Littlejohn Managers, LLC ($1.1 million), Jeff Edwards ($2.7 million) and TCI Holdings, LLC ($0.5 million) pursuant to an agreement dated December 18, 2012, which was terminated on November 22, 2013. No similar fees were charged during 2014 or 2013, and we do not expect to incur management fees going forward. |
Prior to November 1, 2013, Jeff Edwards served as a consultant and non-employee officer to us. As such he did not receive a salary or bonus for 2012 or 2011. The costs of Jeff Edwards’ services were paid through the management agreements discussed above. Jeff Edwards did not receive any compensation in 2013 prior to November 1, 2013. In anticipation of our common stock offering and with a view towards operating as a public company, we entered into an employment agreement with Jeff Edwards on November 1, 2013 that will pay Mr. Edwards a minimum annual base salary of $600,000 and provide him an opportunity to participate in the Company’s annual incentive and benefit programs. Compensation paid by us to Mr. Edwards on or after November 1, 2013 will be recorded as an administrative expense in our consolidated statement of operations. As a result of the foregoing, our performance for the years ended December 31, 2014 and 2013 will not be comparable in this respect to our operations in prior or subsequent periods and may not be indicative of future results.
| (3) | Total funded debt consists of current and long-term portions of long-term debt and capital lease obligations. |
| (4) | Consists of Redeemable Preferred Stock and Redeemable Common Stock. This treatment is no longer required as of the date of our initial public offering in February 2014. |
| Item 7. | Management’s Discussion and Analysis of Financial Condition and Results of Operations |
You should read the following in conjunction with the consolidated financial statements and related notes thereto included in Item 8, Financial Statements and Supplemental Data, in this Form 10-K. This discussion contains forward-looking statements reflecting current expectations that involve risks and uncertainties. Actual results and the timing of events may differ materially from those contained in these forward-looking statements due to a number of factors, including those discussed in the section captioned “Risk Factors” and elsewhere in this Form 10-K. Share numbers presented in this Form 10-K give effect to our 19.5-for-one stock split of our common stock that occurred on February 10, 2014.
27
Table of Contents
GENERAL
We are the second largest new residential insulation installer in the United States based on our internal estimates, with a national platform consisting of over 100 locations serving customers in all 48 continental states and the District of Columbia. We also install complementary building products, including garage doors, rain gutters, shower doors, closet shelving and mirrors. Substantially all of our net revenue comes from service-based installation of these products in the residential new construction, repair and remodel and commercial construction end markets.
EXECUTIVE OVERVIEW
A large portion of our revenue comes from the U.S. residential new construction market, which is in turn dependent upon a number of economic factors, including demographic trends, interest rates, consumer confidence, employment rates, housing inventory levels, foreclosure rates, the health of the economy and availability of mortgage financing.
During 2014, the construction of new homes increased in most of our markets, contributing significantly to our 19.9% increase in net revenue to $518.0 million during the year ended December 31, 2014 compared to $431.9 million in the same period in 2013. Also contributing to the increase in net revenue were the strategic acquisitions of three companies in 2014 and two companies during 2013. These acquisitions resulted in a $15.4 million, or 3.6%, net revenue increase in 2014 as compared to 2013.
We believe our business is well positioned to continue to profitably grow during the housing recovery due to our strong balance sheet, liquidity and our continuing acquisition strategy. We may continue to adjust our strategies based on housing demand and our performance in each of our markets. Nevertheless, the pace of the housing recovery and our future results could be negatively affected by weakening economic conditions and decreases in housing demand and affordability as well as increases in interest rates and tightening of mortgage lending practices.
KEY FACTORS AFFECTING OUR OPERATING RESULTS
Conditions in the U.S. residential new construction industry and U.S. economy.
The housing downturn that began in 2006 caused many builders to significantly decrease their production of housing units because of lower demand and excess inventory. Due to the lower levels in housing starts and construction activity, we experienced pressure on both our gross and operating margins until the housing recovery began in 2012.
We believe there are several trends that should drive long-term growth in the housing market. These trends include housing affordability, an aging housing stock, population growth and growth in household formation. These positive trends are reflected in Blue Chip’s January 10, 2015 consensus forecast, which projects housing starts to increase to approximately 1.2 million in 2015 and approximately 1.3 million in 2016. We expect that our net revenue, gross profit, and operating income will benefit from this growth. In addition, we continue to experience improved operating efficiencies resulting from certain costs, such as administrative wages and benefits, facility costs and other operating and administrative costs, increasing at a lower rate than the rate at which net revenue increases. Operating expenses as a percentage of net revenue were 22.1%, 22.4% and 25.2% for the years ended December 31, 2014, 2013 and 2012, respectively. Excluding non-cash stock compensation expense of $4.7 million incurred in 2012, operating expenses as a percentage of net revenue were 23.6% for the year ended December 31, 2012.
28
Table of Contents
Trends in the construction industry
Our operating results may vary according to the amount and type of products we install and the mix of our end markets among new single-family, multi-family and commercial builders and owners of existing homes. The NAHB forecasts a higher rate of growth in single-family new home construction compared to that for multi-family new home construction. We expect to benefit from this shift in mix because our net revenue per single-family completion is higher than our net revenue per multi-family completion. As the housing market recovery continues, we expect to benefit not only from the increased participation of large homebuilders in the early stages of the recovery, but also as custom builders and individual lot owners build more in the later stages of the U.S. housing recovery. We maintain an attractive mix of business among all types of homebuilders. Our net revenue derived from the ten largest homebuilders in the United States increased from approximately 7.5% in the year ended December 31, 2010 to approximately 14.3% in the year ended December 31, 2014. We are also particularly well positioned with custom home builders, given our geography and market share position with these customers, to benefit from the later stages of the recovery cycle. In addition to providing services to the residential new construction and repair and remodel end markets, we provide services to the commercial construction end market, which represented approximately 10.8%, 11.0% and 13.8% of our total net revenue for the years ended December 31, 2014, 2013 and 2012, respectively. The McGraw Hill 2014 Dodge Construction Outlook (third quarter update) forecasts a 19% year-over-year increase in square footage for commercial construction in 2015. We also expect to see an increase in repair and remodel activity as the housing market recovery progresses.
Material costs
We purchase the materials that we install primarily from manufacturers. We believe that, as a result of our national scale and long-standing relationships with many of our suppliers, we expect to continue to have access to an adequate supply of these materials at favorable prices to keep up with the growing demand for our products as the housing market recovers. Prices for our products have generally been subject to cyclical market fluctuations and track the strength of the U.S. residential new construction market. In the event that increased demand leads to higher prices for the products we install, due to the fragmented and competitive nature of our industry, we may have limited, if any, ability to pass on price increases in a timely manner or at all. In the past, we have generally been able to pass on these increases to our customers over time.
Labor costs
Our business is labor intensive. As of December 31, 2014, we had approximately 3,600 employees, most of whom work as installers on local construction sites. As the housing market continues to recover, we expect that labor markets will tighten as the demand increases for installers. Tight labor markets may make it more difficult for us to hire and retain installers and could increase our labor costs. We expect to be required to spend more on training as we hire additional installers to support our growing business. We offer a comprehensive benefits package, which many of our local competitors are not able to provide, which will increase our costs as we hire additional personnel. Our workers’ compensation costs also continue to increase as we increase our coverage for additional personnel. With the passage in 2010 of the U.S. Patient Protection and Affordable Care Act, or the Affordable Care Act, we are required to provide affordable coverage, as defined in the Affordable Care Act, to all employees, or otherwise be subject to a payment per employee based on the affordability criteria therein. In the fourth quarter of 2013, we recognized additional labor costs related to our settlement of two lawsuits in the states of Washington and Tennessee. See Item 3, Legal Proceedings, in this Form 10-K for additional information.
Other factors
We expect our selling and administrative expenses to continue to increase in absolute dollars as our business grows, which could impact our future operating profitability. Included in this amount is additional compensation expense for Jeff Edwards, our Chief Executive Officer, who, prior to November 1, 2013, did not receive any base salary compensation.
29
Table of Contents
ACQUISITIONS
Since 1999, our acquisition strategy has allowed us to generate significant scale, diversify our product offering and expand into many of the largest housing markets in the United States. We have pursued and expect to continue to pursue both geographic expansion and tuck-in acquisitions in existing markets. We expect to target acquisition candidates that meet our criteria, which include a strong local reputation and high-quality management and labor force. Our acquisition strategy is also focused on using our national buying power, value-enhancing technology and proven operating platform to achieve operating efficiencies in our acquisitions.
During 2014 and 2013, we completed three and two acquisitions, respectively, all of which qualify as business combination as defined by Accounting Standards Codification 805, “Business Combinations.” Our 2014 acquisitions expanded our presence in Minnesota, Wisconsin, North Dakota and the New York Tri-State region and marked our entry into the state of Idaho. Our 2013 acquisitions expanded our presence in Florida and Virginia. See Note 12, Business Combinations, to our audited consolidated financial statements in Item 8 of Part II of this Form 10-K for additional information concerning these business combinations.
Direct acquisition and integration costs for the years ended December 31, 2014, 2013 and 2012 were not material and were expensed as incurred. We have in the past been, and may in the future be, subject to post-closing payment obligations under contracts we enter into with businesses we acquire.
SEASONALITY
We tend to have higher sales during the second half of the year as our homebuilder customers complete construction of homes placed under contract for sale in the traditionally stronger spring selling season. In addition, some of our larger branches operate in states impacted by winter weather and as such experience a slowdown in construction activity during the first quarter of the calendar year. This winter slowdown contributes to traditionally lower sales in our first quarter.
The composition and level of our working capital typically changes during periods of increasing sales as we carry more inventory and receivables, although this is generally offset in part by higher trade payables to our suppliers. Working capital levels typically increase in the summer and fall seasons due to higher sales during the peak of residential construction activity. The subsequent collection of receivables and reduction in inventory levels during the winter months has typically impacted cash flow positively. In the past, from time to time, we have utilized our borrowing availability under our credit facilities to cover short-term working capital needs.
COMPONENTS OF RESULTS OF OPERATIONS
Net Revenue. Net revenue is derived from installation of products sold to our customers. Revenue from the sale and installation of products to customers are recognized at the time installation is complete. We track and analyze net revenue by the number of completed jobs.
Cost of Sales. Our cost of sales is comprised of the costs of materials and labor to purchase and install our products for our customers. Also included in our cost of sales are the cost of safety and other supplies, workers compensation insurance and certain costs to manage our warehouses, as well as the following vehicle-related expenses: fuel, repairs and maintenance, depreciation, lease expense, insurance, licensing and titling.
Selling Expenses. Selling expenses primarily include wages and commissions for our sales staff, advertising and bad debt expense.
Administrative Expenses. Administrative expenses include wages and benefits for branch management and administrative personnel, corporate office personnel, non-cash stock compensation when applicable, facility costs, office supplies, telecommunications, legal, accounting and general liability insurance costs. For periods
30
Table of Contents
after November 1, 2013, the costs of Jeff Edwards’ services to us are paid through an employment agreement and included in administrative expenses. Prior to such date, Mr. Edwards was compensated through management agreements and such amounts were recorded in management fees. As a result, our performance for certain periods presented may not be comparable in this respect.
Management Fees. For the year ended December 31, 2012, management fees were paid to Littlejohn Managers, LLC ($1.1 million), Jeff Edwards ($2.7 million) and TCI Holdings, LLC ($0.5 million) pursuant to an agreement dated December 18, 2012, which was terminated on November 22, 2013. No similar fees were charged during 2013, and we do not expect to incur management fees going forward. Prior to November 1, 2013, Jeff Edwards served as a consultant and non-employee officer to us. As such, he did not receive salary or bonus for 2012 or for the period from January 1, 2013 to October 31, 2013. The costs of Jeff Edwards’ services were paid through the management agreements discussed above. For periods after November 1, 2013, Mr. Edwards’ compensation is included in administrative expenses.
Amortization Expense. Amortization expense represents the decline in value over time of definite-lived intangible assets such as trademarks, trade names, customer lists and non-competition agreements obtained as a result of past acquisitions.
Other Operating Expense (Income). Other operating expense (income) includes wage expense recognized as part of the lawsuits in Tennessee and Washington state in 2013 and a net gain from insurance proceeds and an impairment of intangible assets (which is the difference between the carrying value and the fair value of the assets impaired) in 2012. See Item 3, Legal Proceedings, in this Form 10-K for additional information of the 2013 lawsuits.
Interest Expense, Net. Interest expense, net relates primarily to our interest expense on capital leases, our revolving lines of credit and our term loan.
Other Expense (Income), Net. Other expense (income), net includes the profit or loss of minor activities not fundamental to ongoing operations.
Income Taxes. Income taxes are recorded using the asset and liability method of accounting for income taxes. Under the asset and liability method, deferred tax assets and liabilities are recognized for the deferred tax consequences attributable to temporary differences between the financial statement carrying amounts of existing assets and liabilities and their respective tax basis. Deferred tax assets and liabilities are measured using enacted tax rates expected to apply to taxable income in the years in which those differences are expected to be recovered or settled.
Discontinued Operations. (Income) loss from discontinued operations represents the after tax gain or loss on the sale or closure of operations of our business and the after tax effect of the discontinued operations for all periods presented.
Accretion charges on Redeemable Preferred Stock. Accretion charges on Redeemable Preferred Stock represents the change in carrying value of such shares during the period as they are accreted from the initial carrying value at the date of issuance to the redemption value at the earliest redemption date. The Redeemable Preferred Stock was redeemed in full on February 19, 2014 in connection with our initial public offering.
31
Table of Contents
Annual Results of Operations
The following table sets forth our operating results for the periods indicated (in millions):
| Years ended December 31, | ||||||||||||
| 2014 | 2013 | 2012 | ||||||||||
| Net revenue |
$ | 518.0 | $ | 431.9 | $ | 301.3 | ||||||
| Cost of sales |
377.9 | 322.2 | 227.3 | |||||||||
|
|
|
|
|
|
|
|||||||
| Gross profit |
140.1 | 109.7 | 74.0 | |||||||||
| Operating expenses |
||||||||||||
| Selling |
31.0 | 25.5 | 19.8 | |||||||||
| Administrative and other |
83.5 | 71.1 | 56.1 | |||||||||
|
|
|
|
|
|
|
|||||||
| Operating income (loss) |
25.6 | 13.1 | (1.9 | ) | ||||||||
| Other expense |
3.0 | 2.2 | 1.8 | |||||||||
|
|
|
|
|
|
|
|||||||
| Income (loss) before income taxes |
22.6 | 10.9 | (3.7 | ) | ||||||||
| Income tax provision |
8.6 | 4.3 | 0.6 | |||||||||
|
|
|
|
|
|
|
|||||||
| Net income (loss) from continuing operations |
14.0 | 6.6 | (4.3 | ) | ||||||||
| Discontinued operations |
||||||||||||
| Loss (income) from discontinued operations, net of income taxes |
0.1 | 0.6 | (2.4 | ) | ||||||||
|
|
|
|
|
|
|
|||||||
| Net income (loss) |
$ | 13.9 | $ | 6.0 | $ | (1.9 | ) | |||||
|
|
|
|
|
|
|
|||||||
| Accretion charges on redeemable preferred stock |
(19.9 | ) | (6.2 | ) | (5.5 | ) | ||||||
|
|
|
|
|
|
|
|||||||
| Net loss attributable to common stockholders |
$ | (6.0 | ) | $ | (0.2 | ) | $ | (7.4 | ) | |||
|
|
|
|
|
|
|
|||||||
Year Ended December 31, 2014 Compared to the Year Ended December 31, 2013
Net revenue
For the year ended December 31, 2014, net revenue increased $86.1 million, or 19.9%, to $518.0 million from $431.9 million during the year ended December 31, 2013. The increase in net revenue included revenue from acquisitions of approximately $15.4 million. Approximately $52.1 million was predominantly attributable to organic growth in the volume of completed jobs in all of our end markets. The remaining increase in net revenue of approximately $18.6 million resulted from a variety of factors including customer and product mix, market pricing variations and insulation volumes driven by building code requirements. Of these, no one factor was more significant than any other.
Cost of sales
For the year ended December 31, 2014, cost of sales increased $55.7 million, or 17.3%, to $377.9 million from $322.2 million during the year ended December 31, 2013. The increase in cost of sales included increases from
acquired businesses of approximately $11.0 million. Approximately $37.9 million was predominantly attributable to organic growth in the volume of completed jobs in the residential new construction end market. Depreciation expense increased $3.6 million as a result of increased investment in vehicles and equipment to support our growth. Additionally, cost of sales increased $3.2 million as a result of a variety of factors including customer and product mix, market pricing variations and insulation volumes driven by building code requirements. Of these items, no one was more significant than the other.
Gross profit
For the year ended December 31, 2014, gross profit increased $30.4 million to $140.1 million from $109.7 million during the year ended December 31, 2013. As a percentage of net revenue, gross profit increased to
32
Table of Contents
27.0% for the year ended December 31, 2014 from 25.4% for the year ended December 31, 2013 primarily from operating efficiencies gained with higher sales levels in most cost of sales categories, especially material and labor costs, as well as an improvement in our customer and product mix and lower fuel costs.
Operating expenses
Selling
For the year ended December 31, 2014, selling expenses increased $5.5 million, or 21.3%, to $31.0 million from $25.5 million for the year ended December 31, 2013. This increase was due to increases in commissions and wages and benefits of $4.6 million to support higher sales, as well as an increase in bad debt expense of $0.9 million. Selling expenses increased 0.1% as a percentage of net revenue for the year ended December 31, 2014 as compared to the year ended December 31, 2013, as a result of increases in commissions to support more profitable sales growth.
Operating expenses other than selling
For the year ended December 31, 2014, operating expenses other than selling increased $12.4 million, or 17.5%, to $83.5 million from $71.1 million for the year ended December 31, 2013. The increase in operating expenses other than selling was primarily due to increased wages and benefits costs of $7.2 million to support our growth, increased accounting and legal fees primarily associated with our status as a public company of $2.1 million (including secondary public offering costs of $0.8 million), increased facility costs of $1.4 million, increased technology costs of $0.5 million, and net changes in several other administrative expenses of approximately $1.2 million to support our growth.
Other expense
For the year ended December 31, 2014, other expense was $3.0 million, compared to $2.2 million for the year ended December 31, 2013. This increase of $0.8 million is primarily reflected in interest expense and includes an increase of $0.7 million in interest associated with capital lease obligations as well as a write-off of capitalized loan costs associated with our old credit agreement of $0.2 million, offset by a decrease of $0.1 million attributable to a lower interest rate on our term loan compared to the interest rate on our previous debt arrangements.
Income tax provision
For the year ended December 31, 2014, we recorded an income tax provision of $8.6 million on our income from continuing operations before income taxes of $22.6 million, or an effective tax rate of 38.1%. This rate was favorably impacted by deductions related to domestic production activities and a benefit for a cancelled put option related to our Redeemable Preferred Stock. See Note 6, Fair Value Measurements, “Assets and Liabilities Measured at Fair Value on a Recurring Basis,” for more information on the put option. The favorability was offset by a non-deductible permanent item related to our secondary offering during the second quarter, an increase in our valuation allowance for separate tax filing entities, and an increase in the state income tax rate.
For the year ended December 31, 2013, we recorded an income tax provision of $4.2 million on our income from continuing operations before income taxes of $10.9 million, or an effective tax rate of 39.0%. The provision was primarily driven by the impact of IRC Section 199 deductions and a change in the deferred tax asset valuation allowance.
Loss (income) from discontinued operations, net of income taxes
For the year ended December 31, 2014, we had loss from discontinued operations of $48 thousand compared to a loss from discontinued operations of $0.6 million for the year ended December 31, 2013. We did not discontinue
33
Table of Contents
any operations during the year ended December 31, 2014 and all expenses incurred during that period relate to operations discontinued in prior periods. During the year ended December 31, 2013, we elected to discontinue operations in certain underperforming markets.
Year Ended December 31, 2013 Compared to the Year Ended December 31, 2012
Net revenue
For the year ended December 31, 2013, net revenue increased $130.6 million, or 43.4%, to $431.9 million from $301.3 million during the year ended December 31, 2012. The increase in net revenue included revenue from acquisitions of approximately $41.5 million. Approximately $72.6 million was predominantly attributable to organic growth in the number of completed jobs in all of our end markets. The remaining increase in net revenue of approximately $16.5 million resulted from a variety of factors including customer and product mix, market pricing variations and insulation volumes driven by building code requirements. Of these, no one factor was more significant than any other.
Cost of sales
For the year ended December 31, 2013, cost of sales increased $95.0 million, or 41.8%, to $322.2 million from $227.2 million during the year ended December 31, 2012. The increase in cost of sales included increases from acquired businesses of approximately $31.8 million. Approximately $53.8 million was predominantly attributable to organic growth in the number of completed jobs in the residential new construction end market. Additionally, cost of sales increased $8.6 million as a result of a variety of factors including customer and product mix, market pricing variations and insulation volumes driven by building code requirements. Of these items, no one was more significant than the other. Depreciation expense increased $3.7 million as a result of increased investment in vehicles and equipment to support our growth. This increase was partially offset by improved leverage of our branch cost structures that resulted in cost of sales improvement of approximately $2.9 million.
Gross profit
For the year ended December 31, 2013, gross profit increased $35.7 million to $109.7 million from $74.0 million during the year ended December 31, 2012. As a percentage of net revenue, gross profit increased to 25.4% for the year ended December 31, 2013 from 24.6% for the year ended December 31, 2012 primarily from operating efficiencies gained with higher sales levels in most cost of sales categories, especially labor costs, as well as an improvement in our customer and product mix and lower auto and truck repair costs as we update our fleet to support our growing net revenue.
Operating expenses
Selling
For the year ended December 31, 2013, selling expenses increased $5.7 million, or 28.8%, to $25.5 million from $19.8 million for the year ended December 31, 2012. This increase was due to increases in wages and commissions of $1.2 million and $3.9 million, respectively, to support higher sales as well as an increase in bad debt expense of $0.6 million. Selling expenses declined by 0.7% as a percentage of net revenue for the year ended December 31, 2013 as compared to the year ended December 31, 2012, as a result of wages and advertising expense comprising a lower percentage of revenue.
Operating expenses other than selling
For the year ended December 31, 2013, operating expenses other than selling increased $15.0 million, or 26.7%, to $71.1 million from $56.1 million for the year ended December 31, 2012. During the year ended December 31,
34
Table of Contents
2012, we recorded a $4.7 million non-cash compensation charge. There was no similar charge in 2013. See the “Share-Based Compensation” caption of Note 2, Significant Accounting Policies, for more information. Excluding non-cash compensation, operating expenses other than selling increased $19.7 million, or 38.1%, which was due to increased wages and benefits costs of $8.8 million, increased facility costs of $1.4 million, increased other administrative expenses of $5.4 million, and changes in other expenses of approximately $4.1 million as follows:
| • | $4.3 million decrease in management fee expenses. For the year ended December 31, 2012, management fees were paid to Littlejohn Managers, LLC ($1.1 million), Jeff Edwards ($2.7 million) and TCI Holdings, LLC ($0.5 million) pursuant to an agreement dated December 18, 2012, which was terminated on November 22, 2013. No similar fees were charged during 2013, and we do not expect to incur management fees going forward. Prior to November 1, 2013, Jeff Edwards served as a consultant and non-employee officer to us. As such, he did not receive salary or bonus for 2012. The costs of Jeff Edwards’ services were paid through the management agreements. |
| • | $7.0 million increase in expense due to a net gain on a litigation settlement of $7.0 million recognized in 2012 due to the settlement of a class action lawsuit in which we were one of the plaintiffs. The lawsuit related to excess material prices being charged by certain manufacturers. The final gain related to this settlement was recognized in 2013 and totaled $31 thousand. |
| • | $1.4 million increase in various other expenses, including a $1.0 million gain in 2012 from insurance claims for a fire that occurred at one of our branches and a $0.9 million expense in 2013 associated with the settlement of two class action lawsuits related to under-payment of wages in Tennessee and Washington state (see Note 11, Commitments and Contingencies, for more details on these lawsuits), offset by a $0.4 million expense in 2012 related to impairment of tradenames for one of our branches where we discontinued the use of its previous operating tradename and an additional $0.1 million miscellaneous expense in 2012. |
Other expense
For the year ended December 31, 2013, other expense was $2.2 million, compared to $1.8 million for the year ended December 31, 2012. This increase of $0.4 million is reflected in interest expense and is a result of higher average outstanding borrowings under our revolving credit facility to support the revenue growth.
Income tax provision
In 2013, we recorded an income tax provision of $4.2 million on our income from continuing operations before income taxes of $10.9 million, or an effective tax rate of 39.0%. The provision was primarily driven by the impact of IRC Section 199 deductions and a change in the Deferred Tax Asset Valuation Allowance. In 2012, we recorded an income tax provision of $0.6 million on our loss from continuing operations of $3.7 million, or an effective rate of (14.8%). The 2012 provision was primarily driven by the impact of non-deductible stock compensation recorded in 2012, and to a lesser extent an increase of our valuation allowance on net operating losses.
Loss (income) from discontinued operations, net of income taxes
For the year ended December 31, 2013, we had loss from discontinued operations of $0.6 million compared to income from discontinued operations of $2.4 million for the year ended December 31, 2012. During the year ended December 31, 2012, we discontinued an operation that was used for regrinding materials to produce loosefill insulation. Substantially all materials subject to regrinding in this operation were provided by a single supplier. The contract under which the materials were obtained was terminated during 2012. As a result, the associated operation was discontinued. A gain of $4.5 million was recorded as a result of the cancelled contract. During 2013, we elected to discontinue operations in certain underperforming markets.
35
Table of Contents
Liquidity and Capital Resources
Our primary capital requirements are to fund working capital needs, operating expenses, acquisitions and capital expenditures and meet required interest payments. Our capital resources primarily consist of cash and borrowings under our credit agreement and capital equipment leases and loans.
The residential construction industry, and therefore our business, experienced a significant downturn that started in 2006. However, beginning in 2012, we saw the first meaningful increase in housing completions since the downturn began. While we have experienced improved profitability and liquidity through 2014, we have invested significantly in working capital due to our increased sales, supported primarily by our credit agreement. Additionally, we have utilized capitalized leases and loans to finance an increase in the number of our vehicles.
As of December 31, 2014, we had $10.8 million in cash and $65.2 million of unused borrowing capacity under our credit agreement.
We believe that our cash flows from operations, combined with our current cash levels and available borrowing capacity, will be adequate to support our ongoing operations and to fund our debt service requirements, capital expenditures and working capital for at least the next 12 months.
Historical cash flow information
Working capital
We carefully manage our working capital and operating expenses. As of December 31, 2014 and 2013, our working capital was 8.2% and 7.2% of net revenue, respectively. While we continue to look for opportunities to reduce our working capital as a percentage of net revenue, we may decide in the future to negotiate additional discounted payment terms with our vendors, which could lead to increased working capital as a percentage of net revenue.
Working capital was $42.7 million and $31.1 million as of December 31, 2014 and 2013, respectively.
The increase in accounts receivable, net of $13.5 million as of December 31, 2014 as compared to December 31, 2013 and the increase of $12.0 million as of December 31, 2013 as compared to December 31, 2012, is primarily a result of higher net revenue and is also driven by acquisitions in 2014 and 2013. Days sales outstanding as of December 31, 2014 and 2013 were comparable at approximately 50.9 and 49.3 days, respectively. The fluctuation in days sales outstanding is impacted by increases or decreases in accounts as seasonality and the housing market cycle impacts collection rates.
The increase in inventory, net, of $4.2 million as of December 31, 2014 as compared to December 31, 2013 and $3.0 million as of December 31, 2013 as compared to December 31, 2012, is primarily a result of the increased net revenue and is also driven by acquisitions in 2014 and 2013. Inventory turns as of December 31, 2014 and 2013 were comparable at approximately 9.8 and 10.1 respectively.
Deferred expenses related to the initial public offering completed in February 2014 totaled $5.2 million as of December 31, 2013. These charges, as well as an additional $3.5 million incurred in 2014, were netted against proceeds from the offering. As a result, there was no deferred offering expense balance as of December 31, 2014. See Note 1, Organization, to our audited consolidated financial statements included in this Form 10-K for more information on our initial public offering.
Other current assets increased $4.5 million as of December 31, 2014 as compared to December 31, 2013 primarily due to a change in the timing of general liability and workers’ compensation insurance payments as well as an increase in premiums and coverage resulting in an increase in insurance reserves of approximately $2.1 million and an increase in rebates receivable of $1.6 million resulting from our increased purchasing
36
Table of Contents
activities necessary to support our increased net revenue. This increase is also driven by acquisitions in 2014 and 2013. Other current assets increased $0.2 million as of December 31, 2013 as compared to December 31, 2012.
Accounts payable, net increased $5.9 million as of December 31, 2014 as compared to December 31, 2013 and $4.2 million as of December 31, 2013 as compared to December 31, 2012, primarily as a result of changes in the volume of inventory purchases due to higher net revenue leading up to each balance sheet date and is also driven by acquisitions in 2014 and 2013.
Accrued and other current liabilities increased $2.9 million as of December 31, 2014 as compared to December 31, 2013 primarily due to increased wages and benefits of $2.4 million to support our growing business and is also driven by acquisitions in 2014. Accrued and other current liabilities increased $3.4 million as of December 31, 2013 as compared to December 31, 2012 primarily due to increases in operating expenses required to support the increasing level of net revenue.
Cash flow from operating activities
Net cash provided by operating activities of $19.6 million, $4.2 million and $4.6 million for the years ended December 31, 2014, 2013 and 2012, respectively, consisted primarily of net income adjusted for non-cash and certain other items. Included in the net cash provided in 2014 was $12.2 million of depreciation and amortization expense on our growing base of property, plant and equipment to support our growth as well as other changes in working capital, most notably $4.6 million of additional accounts payable offset by $10.7 million of additional accounts receivable, both resulting from the increase in net revenue. Included in the net cash provided in 2013 was $8.4 million of depreciation and amortization expense on our growing base of property, plant and equipment to support our growth as well as other changes in working capital, most notably $3.9 million of additional accounts payable offset by $12.8 million of additional accounts receivable, both resulting from the increase in net revenue. Included in the net cash provided in 2012 was $4.7 million of noncash stock compensation associated with equity awards, $4.6 million of depreciation and amortization expense on our growing base of property, plant and equipment to support our growth, and other changes in working capital, most notably $2.0 million of additional accounts payable offset by $6.9 million of additional accounts receivable, both resulting from the increase in net revenue.
Cash flows from investing activities
Net cash used in investing activities was $16.1 million, $2.5 million and $2.7 million for the years ended December 31, 2014, 2013 and 2012, respectively. In 2014 we made cash payments, net of cash acquired, of $12.4 million to acquire businesses and $6.2 million to purchase property, plant, and equipment, primarily to expand our fleet to support our growing business. In 2013 we made cash payments of $2.7 million to purchase property, plant, and equipment, primarily to expand our fleet and $1.2 million to acquire businesses. In 2012 we made cash payments of $2.9 million to purchase property, plant, and equipment, primarily to expand our fleet.
Cash flows from financing activities
Net cash provided by financing activities was $3.2 million for the year ended December 31, 2014 compared to net cash used in financing activities of $1.5 million and $0.5 million for the years ended December 31, 2013 and 2012, respectively. Net cash provided in 2014 was primarily the result of net proceeds from our initial and secondary public offerings of $87.6 million and $14.4 million, respectively, in addition to $25.0 million of proceeds from our credit agreement. Cash provided from these activities was offset by the redemption of our Redeemable Preferred Stock of $75.7 million, net payments on our previous credit agreement of $27.3 million, vehicle capital lease principle payments of $9.4 million, the repurchase of common stock of $5.3 million, and cash payments for offering costs related to our IPO and secondary public offerings of $4.4 million. Net cash used in 2013 was primarily the result of vehicle capital lease principle payments to support our growing business of $6.6 million and cash payments for offering costs related to our IPO of $4.4 million, offset by proceeds from our
37
Table of Contents
previous credit agreement of $10.0 million. Net cash used in 2012 was primarily the result of vehicle capital lease principle payments to support our growing business of $3.0 million offset by a $2.5 million capital contribution from stockholders.
Capital expenditures
Capital expenditures vary depending on prevailing business factors, including current and anticipated market conditions. Total capital expenditures were $6.2 million, $2.7 million and $2.9 million for the years ended December 31, 2014, 2013 and 2012, respectively, and primarily related to purchases of vehicles and various equipment to support our operations and increased net revenue. We expect to continue to support any increases in 2015 net revenue through further capital expenditures.
Credit and Security Agreement
On July 8, 2014, we entered into a Credit Agreement (the “Credit Agreement”) with a bank group with an aggregate commitment of $100 million and a maturity date of July 7, 2019 (the “Maturity Date”). Upon entry into the Credit Agreement, our previous credit agreement, as amended, with an aggregate commitment of $50 million, was terminated. All of the obligations under the Credit Agreement are guaranteed by our existing and future direct and indirect material domestic subsidiaries, other than Suburban Insulation, Inc. (the “Guarantors”).
The Credit Agreement provides for a $75 million revolving credit facility (“LOC”) and a $25 million term loan (“Term Loan”) secured by all of our assets except certain vehicles secured by capital leases and loans. We can also borrow swingline loans up to $5.0 million and obtain letters of credit of up to $10.0 million; any outstanding letters of credit and swingline loans under the Credit Agreement reduce our borrowing capacity. At December 31, 2014, we had $9.8 million of outstanding letters of credit and $24.7 million outstanding on the Term Loan. See Note 5, Long-Term Debt, for more information on our Credit Agreement.
The Credit Agreement contains financial covenants requiring us to maintain 1) a leverage ratio of debt to earnings, as adjusted for certain items and as defined by the Credit Agreement, of no greater than 3.50 to 1.00 and decreasing over time to 2.75 to 1.00 by March 31, 2016, and 2) a fixed charge coverage ratio, as adjusted for certain items, of no less than 1.10 to 1.00. The Credit Agreement also contains various restrictive non-financial covenants and a provision requiring that, upon an event of default (as defined by the Credit Agreement), amounts outstanding under the LOC and Term Loan would bear interest at the rate as determined above plus 2%. In addition, all representations and warranties in the Credit Agreement must be true in all material respects on the date of each borrowing. Based on the limitations of the debt to earnings ratio covenant in the Credit Agreement, at December 31, 2014, we had the ability to fully draw the LOC less the outstanding letters of credit. At December 31, 2014 and 2013, we were in compliance with all financial covenants of our Credit Agreement. In December 2014, we entered into a First Amendment Agreement (the “First Amendment”) to the Credit Agreement, which, among others things, amends the definition of consolidated fixed charges to exclude certain share repurchase transactions, up to a specified limit, from the calculation of the fixed charge coverage ratio under the Credit Agreement.
In October 2014, we entered into a Master Loan and Security Agreement (“Master Loan Agreement”) with a new lender to provide financing up to $5.0 million for the purpose of purchasing vehicles and equipment used in the normal course of business. Vehicles and equipment purchased under this Master Loan Agreement serve as collateral for each note controlled by this financing arrangement. Each financing arrangement under this Master Loan Agreement will serve as a separate note and obligation. Regular payments are due under each note at the time the obligation occurs. The specific terms of each note are based on specific criteria, including the type of vehicle or equipment, the length of the term of the note, and the market interest rates at the time. There is no termination date of this Master Loan Arrangement. The principal balance outstanding thereunder at December 31, 2014, was $1.3 million.
38
Table of Contents
Letters of Credit and Bonds
We use letters of credit to secure our performance under our general liability and workers compensation insurance programs. Our workers compensation insurance program is considered a high deductible program whereby we are responsible for the cost of claims under $0.75 million. If we do not pay these claims, our insurance carriers are required to make these payments to the claimants on our behalf. Our general liability insurance program has a self-insured retention (“SIR”) of $0.35 million whereby we are responsible for all claims below the SIR, and the insurance company only has liability above the SIR. As of December 31, 2014, we had $9.8 million of outstanding letters of credit and $0.3 million in cash securing our performance under these insurance programs. We occasionally use performance bonds to ensure completion of our work on certain larger customer contracts that can span multiple accounting periods. As of December 31, 2014, we had approximately 16 performance bonds outstanding, totaling $1.7 million. Performance bonds generally do not have stated expiration dates; rather, we are released from the bonds as the contractual performance is completed. As of December 31, 2014, we had approximately 216 permit and license bonds outstanding, totaling $3.8 million. Permit and license bonds are typically issued for one year and are required by certain municipalities when we obtain licenses and permits to perform work in their jurisdictions.
Capped Call Agreement
Certain of our stockholders entered into a capped call agreement with the underwriters of our secondary public offering in June 2014. We are not a party to the agreement. This agreement provides that these stockholders have the option to call a total of approximately 1.1 million shares at a capped price. The option can be exercised within specific dates based on the then price of the underlying shares. This has the effect of permitting these stockholders to receive additional benefit on the shares sold in the secondary offering up to a predetermined price. This agreement is between the stockholders party thereto and the underwriters of the secondary offering and does not represent compensation to the stockholders for services rendered and the price paid for the option represents fair value of that transaction. Accordingly, we have not recorded any expense related to this transaction.
Contractual Obligations
In the table below, we set forth our enforceable and legally binding obligations as of December 31, 2014. Some of the amounts included in the table are based on management’s estimates and assumptions about these obligations, including their duration, the possibility of renewal, anticipated actions by third parties and other factors. Because these estimates and assumptions are necessarily subjective, our actual payments may vary from those reflected in the table. In addition, our unrecognized tax benefits under ASC 740, “Income Taxes,” have been excluded from the contractual obligations table because of the inherent uncertainty and the inability to reasonable estimate the timing of cash outflows.
| Payments due by period | ||||||||||||||||||||
| (in millions) | Total | Less than 1 year |
1-3 years | 3-5 years | More than 5 years |
|||||||||||||||
| Long-term debt obligations (1) |
$ | 28.6 | $ | 2.3 | $ | 5.2 | $ | 21.1 | $ | — | ||||||||||
| Capital lease obligations (2) |
30.0 | 10.8 | 14.0 | 5.2 | — | |||||||||||||||
| Operating lease obligations (3) |
19.0 | 6.3 | 8.3 | 2.3 | 2.1 | |||||||||||||||
| Purchase obligations (4) |
102.0 | 73.2 | 28.8 | — | — | |||||||||||||||
| (1) | Long-term debt obligations include principal and interest payments on our Term Loan. We will pay quarterly principal payments of $0.3 million starting on December 31, 2014, with the quarterly payment amount increasing to $0.5 million from September 30, 2016 through June 30, 2018, and further increasing to $0.6 million from September 30, 2018 through June 30, 2019. The remaining balance is due on the Maturity Date of July 7, 2019. Also included are principal and interest payments for vehicles and equipment |
39
Table of Contents
| purchased under our Master Loan Agreement. Regular payments are due under each note at the time the obligation occurs. Long-term debt obligations also include principal and interest payments on various notes payable, maturing through December 2016. |
| (2) | We maintain a fleet of production vehicles under a capital lease structure. The leases expire on various dates through May 2020. We anticipate continuing the leasing of production vehicles to include new vehicles to support the increasing number of installation jobs in our business as well as to replace aging vehicles. Capital lease obligations, as disclosed above, include estimated interest expense payments. In determining expected interest expense payments, we utilize the current market rate. |
| (3) | We lease certain locations, vehicles and equipment under operating lease agreements, including, but not limited to, corporate offices, branch locations and various office and operating equipment. In some instances, these location lease agreements exist with related parties. See Note 10, Related Party Transactions, of our audited consolidated financial statements included in Item 8 of Part II of this Form 10-K for further information. |
| (4) | We entered into two supply contracts with minimum purchase requirements based on quantity without a specific rate applied. The amounts in the above table represent our best estimate as to the prices that will be payable for the minimum volume of purchases that must be made under the contracts. We exceeded our minimum requirements under these and other similar agreements in 2014 and 2013. Similar commitments existed in 2012 and were fully met. |
Off-Balance Sheet Arrangements
As of December 31, 2014 and 2013, other than operating leases and purchase obligations described above, letters of credit issued under our revolving credit facility and performance and license bonds, we had no material off-balance sheet arrangements with unconsolidated entities.
Critical Accounting Policies and Estimates
Management’s discussion and analysis of our financial condition and results of operations is based upon our consolidated financial statements, which have been prepared in accordance with accounting principles generally accepted in the United States. The preparation of our consolidated financial statements requires us to make estimates and assumptions that affect the reported amounts of assets, liabilities, revenues and expenses and related disclosure of contingent assets and liabilities. Certain accounting policies involve judgments and uncertainties to such an extent that there is a reasonable likelihood that materially different amounts could have been reported using different assumptions or under different conditions. We evaluate our estimates and assumptions on a regular basis. We base our estimates on historical experience and various other assumptions that are believed to be reasonable under the circumstances, the results of which form the basis for making judgments about the carrying values of our assets and liabilities that are not readily apparent from other sources. Actual results may differ from these estimates and assumptions used in preparation of our consolidated financial statements. We provide discussion of our more significant accounting policies, estimates and judgments used in preparation of our consolidated financial statements below.
Revenue Recognition
Revenue from the sale and installation of products is recognized when all of the following have occurred: (i) persuasive evidence of an arrangement exists; (ii) delivery has occurred or services have been rendered; (iii) the price is fixed or determinable; and (iv) the ability to collect is reasonably assured. Revenue from the sale and installation of products is recognized net of adjustments and discounts and at the time the installation is complete.
Goodwill
Goodwill results from business combinations and represents the excess of the purchase price over the fair value of acquired tangible assets and liabilities and identifiable intangible assets.
40
Table of Contents
Goodwill is assigned to and tested for impairment at a reporting unit level. We have one operating segment and our branches meet the definition of components as they are businesses for which discrete financial information is available and whose operating results are reviewed by management. In accordance with the guidance outlined in Accounting Standards Codification, or ASC, 350-20, our components qualify to be aggregated into one reporting unit for goodwill impairment testing purposes.
Annually, or if conditions indicate an earlier review is necessary, we assess qualitative factors (“step zero analysis”) to determine if it is more likely than not that the fair value of the reporting unit is less than its carrying amount and if it is necessary to perform the quantitative two-step goodwill impairment test.
At October 1, 2014, our measurement date, we performed a step zero analysis that weighted all evidence of potential impairment, whether positive or negative. We determined there was no indicator for potential impairment. There was no goodwill impairment in 2014, 2013 or 2012. The estimated fair value of the reporting unit was substantially in excess of the carrying value at October 1, 2014.
When a step one analysis is needed because step zero cannot provide convincing evidence that there is no potential impairment, the estimate of the reporting unit’s fair value is determined by weighting a discounted cash flow model and a market-related model. The estimate of the reporting unit’s fair value involves significant unobservable inputs (Level 3). These Level 3 inputs are primarily our forecasts utilized in the discounted cash flow model and our determination of the weight applied to each of the aforementioned models. Our forecasts include current and projected future levels of cash flow based on management’s plans, business trends, prospects, market and economic conditions and market-participant considerations. Our forecasts are based upon the best information available at the measurement date; however, actual results may vary from the forecasts and thus the forecasts represent a Level 3 input. We take our forecasts and apply a discount rate commensurate with our capital structure and the cost of capital of comparable market participants, giving appropriate consideration to the prevailing borrowing rates within our industry, to arrive at our discounted cash flow model. We elected to weight the discounted cash flow model and market related model, placing more weight on the discounted cash flow model. We believe the discounted cash flow approach more appropriately captures the specific growth and risk profile of the reporting unit, whereas the market approach requires a qualitative assessment of the reporting unit’s risk profile and growth prospects compared to reasonably similar publicly-traded companies. In periods where both models produce significantly equivalent results we may elect to use the results of the discounted cash flow model only.
If the estimated fair value of the reporting unit is less than the carrying value, a second step is performed to determine the amount of the potential goodwill impairment. If impaired, goodwill is written down to its estimated implied fair value.
Taxes
We account for income taxes using the asset and liability method. Under this method, the amount of taxes currently payable or refundable are accrued and deferred tax assets and liabilities are recognized for the estimated future tax consequences of temporary differences that currently exist between the tax basis and financial reporting basis of our assets and liabilities.
Valuation allowances are established against deferred tax assets when it is more likely than not that the realization of those deferred tax assets will not occur. In evaluating our ability to recover our deferred tax assets within the jurisdiction from which they arise, we consider all available positive and negative evidence, including scheduled reversals of deferred tax liabilities, the ability to produce future taxable income, tax planning strategies available and recent financial operations. In projecting future taxable income, we begin with historical results adjusted for the results of discontinued operations and changes in accounting policies and incorporate assumptions, including the amount of future federal and state pretax operating income, the reversal of temporary differences and the implementation of feasible and prudent tax planning strategies.
41
Table of Contents
Deferred tax assets and liabilities are measured using the enacted tax rates in effect in the years when those temporary differences are expected to reverse. The effect on deferred taxes from a change in tax rate is recognized through continuing operations in the period that includes the enactment date of the change.
A tax benefit from an uncertain tax position may be recognized when it is more likely than not that the position will be sustained upon examination, including resolutions of any related appeals or litigation processes, based on the technical merits. We recognize tax liabilities for uncertain tax positions and adjust these liabilities when our judgment changes as a result of the evaluation of new information not previously available.
Our income tax expense, deferred tax assets and liabilities and reserves for unrecognized tax benefits reflect management’s best assessment of estimated future taxes to be paid. We are subject to income taxes in the United States which includes numerous state and local jurisdictions. Significant judgments and estimates are required in determining the income tax expense.
Share-based compensation
We estimate the value of share-based awards on the date granted and each subsequent balance sheet date for liability awards. On various dates in 2010 and 2011, agreements (“Employee Puts”) were entered into between Jeff Edwards (our Chairman, President and Chief Executive Officer and majority stockholder of IBP through indirect holding companies), as an individual, and certain IBP employees, which allowed the employees to sell their ownership in the Company, at a fixed price, to Jeff Edwards. The Employee Puts are deemed to be liability-classified instruments that are directly associated with the awards. As such, both the awards and the Employee Puts are accounted for as liability-classified instruments as of the issuance date of the Employee Put. During the period for which the Employee Puts are exercisable, both the Employee Puts and the associated awards are remeasured to fair value each reporting period. In the absence of a publicly traded market, the fair market value of the put options and underlying shares are estimated primarily using discounted cash flow and, secondarily, other market-related models using current industry trends. In determining the estimated future cash flow, we consider and apply certain estimates and judgments, including current and projected future levels of income based on management’s plans, business trends, prospects and market and economic conditions and market-participant considerations. The adjustment to the carrying value is based upon an equity rate of return for a public company in our industry with similar financial trends and characteristics. The determined fair value of our common stock is used to determine the value of the membership interest units based on their ownership interest. The membership interest units and related put options are recorded at fair value as compensation expense. Effective November 30, 2013, the Employee Puts between Jeff Edwards and employees were terminated.
Recent Accounting Pronouncements
Recently Adopted Accounting Pronouncements
In November 2014, the FASB issued ASU 2014-17, “Business Combinations (Topic 805).” This ASU establishes guidance about whether and at what threshold an acquired entity that is a business or nonprofit activity can apply pushdown accounting in its separate financial statements. We have concluded that this ASU has not and will not have a material impact on our consolidated financial statements.
Recently Issued Accounting Pronouncements Not Yet Adopted
In April 2014, the FASB issued ASU 2014-08, “Presentation of Financial Statements (Topic 205) and Property, Plant, and Equipment (Topic 360): Reporting Discontinued Operations and Disclosures of Disposals of Components of an Entity.” The amendments in this update change the requirements for reporting discontinued operations in Subtopic 205-20. We are still evaluating whether this ASU will have a material impact on our consolidated financial statements.
42
Table of Contents
In May 2014, the FASB issued ASU 2014-09, “Revenue from Contracts with Customers (Topic 606).” ASU 2014-09 sets forth a new revenue recognition model that requires identifying the contract, identifying the performance obligations, determining the transaction price, allocating the transaction price to performance obligations and recognizing the revenue upon satisfaction of performance obligations. We are still evaluating whether this ASU will have a material impact on our consolidated financial statements.
IMPLICATIONS OF BEING AN EMERGING GROWTH COMPANY
We qualify as an “emerging growth company” as defined in the Jumpstart our Business Startups Act of 2012, or the JOBS Act. An emerging growth company may take advantage of specified reduced reporting and other requirements that are otherwise applicable generally to public companies. These provisions include:
| • | an exemption from the auditor attestation requirement in the assessment of internal control over financial reporting pursuant to the Sarbanes-Oxley Act of 2002, or the Sarbanes-Oxley Act; |
| • | reduced disclosure about executive compensation arrangements; and |
| • | no requirement to seek non-binding advisory votes on executive compensation or golden parachute arrangements. |
We have elected to adopt these reduced disclosure requirements and may take advantage of the provisions listed above until we are no longer an emerging growth company. We will remain an emerging growth company until the earlier of (1) the last day of the fiscal year (a) following the fifth anniversary of the completion of our common stock offering, (b) in which we have total annual gross revenue of at least $1.0 billion or (c) in which we are deemed to be a large accelerated filer, which means the market value of our common stock that is held by non-affiliates exceeds $700 million as of the prior June 30th, and (2) the date on which we have issued more than $1.0 billion in non-convertible debt during the prior three-year period. We may choose to take advantage of some but not all of these reduced disclosure requirements.
The JOBS Act also permits emerging growth companies to take advantage of an extended transition period to comply with new or revised accounting standards applicable to public companies. We chose to “opt out” of this provision and, as a result, we will comply with new or revised accounting standards as required when they are adopted. This decision to opt out of the extended transition period is irrevocable.
| Item 7A. | Quantitative and Qualitative Disclosures about Market Risk |
We are exposed to market risks related to fluctuations in interest rates on our outstanding variable rate debt. As of December 31, 2014, we had $24.7 million outstanding under our Term Loan, $1.3 million outstanding under our Master Loan Agreement, and $4.4 million outstanding under various capital leases subject to variable interest rates. A hypothetical one percentage point increase (decrease) in interest rates on our variable rate debt would increase (decrease) our annual interest expense by approximately $0.3 million.
For variable rate debt, interest rate changes generally do not affect the fair value of the debt instrument, but do impact future earnings and cash flows, assuming other factors are held constant. We did not utilize swaps, forward or option contracts on interest rates or commodities, or other types of derivative financial instruments during 2014 or 2013. We have not entered into and currently do not hold derivatives for trading or speculative purposes.
INFLATION
Our performance is dependent to a significant extent upon the levels of U.S. residential new construction spending, which is affected by factors such as interest rates, inflation, consumer confidence and unemployment. We do not believe that inflation has had a material impact on our business, financial condition or results of operations during the past two fiscal years.
| Item 8. | Financial Statements and Supplementary Data |
43
Table of Contents
Management’s Report on Internal Control Over Financial Reporting
Our management is responsible for establishing and maintaining adequate internal control over financial reporting. Our internal control over financial reporting is a process designed to provide reasonable assurance regarding the reliability of financial reporting and the preparation of financial statements for external purposes in accordance with accounting principles generally accepted in the United States of America.
Management assessed the effectiveness of our internal control over financial reporting as of December 31, 2014 using the criteria set forth by the Committee of Sponsoring Organizations of the Treadway Commission (COSO) in “Internal Control – Integrated Framework (2013).” Based on this assessment, management has determined that our internal control over financial reporting was effective as of December 31, 2014.
44
Table of Contents
REPORT OF INDEPENDENT REGISTERED PUBLIC ACCOUNTING FIRM
To the Board of Directors and Stockholders of
Installed Building Products, Inc.
Columbus, Ohio
We have audited the accompanying consolidated balance sheets of Installed Building Products, Inc. and subsidiaries (the “Company”) as of December 31, 2014 and 2013 and the related consolidated statements of operations, stockholders’ equity (deficit) and redeemable instruments and cash flows for each of the three years in the period ended December 31, 2014. These consolidated financial statements are the responsibility of the Company’s management. Our responsibility is to express an opinion on the financial statements based on our audits.
We conducted our audits in accordance with the standards of the Public Company Accounting Oversight Board (United States). Those standards require that we plan and perform the audit to obtain reasonable assurance about whether the financial statements are free of material misstatement. The Company is not required to have, nor were we engaged to perform, an audit of its internal control over financial reporting. Our audits included consideration of internal control over financial reporting as a basis for designing audit procedures that are appropriate in the circumstances, but not for the purpose of expressing an opinion on the effectiveness of the Company’s internal control over financial reporting. Accordingly, we express no such opinion. An audit also includes examining, on a test basis, evidence supporting the amounts and disclosures in the financial statements, assessing the accounting principles used and significant estimates made by management, as well as evaluating the overall consolidated financial statement presentation. We believe that our audits provide a reasonable basis for our opinion.
In our opinion, such consolidated financial statements present fairly, in all material respects, the financial position of Installed Building Products, Inc. and subsidiaries as of December 31, 2014 and 2013, and the results of their operations and their cash flows for each of the three years in the period ended December 31, 2014, in conformity with accounting principles generally accepted in the United States of America.
/s/ Deloitte & Touche LLP
Columbus, OH
March 13, 2015
45
Table of Contents
INSTALLED BUILDING PRODUCTS, INC.
CONSOLIDATED BALANCE SHEETS
(in thousands, except share amounts)
| As of December 31, | ||||||||
| 2014 | 2013 | |||||||
| ASSETS |
||||||||
| Current assets |
||||||||
| Cash |
$ | 10,761 | $ | 4,065 | ||||
| Restricted cash |
— | 1,708 | ||||||
| Accounts receivable (less allowance for doubtful accounts of $2,661 and $1,738 at December 31, 2014 and 2013, respectively) |
72,280 | 58,826 | ||||||
| Inventories |
23,971 | 19,731 | ||||||
| Deferred offering costs |
— | 5,156 | ||||||
| Other current assets |
12,276 | 6,026 | ||||||
|
|
|
|
|
|||||
| Total current assets |
119,288 | 95,512 | ||||||
| Property and equipment, net |
39,370 | 29,475 | ||||||
| Non-current assets |
||||||||
| Goodwill |
53,393 | 49,328 | ||||||
| Intangibles, net |
17,718 | 13,400 | ||||||
| Other non-current assets |
4,393 | 3,355 | ||||||
|
|
|
|
|
|||||
| Total non-current assets |
75,504 | 66,083 | ||||||
|
|
|
|
|
|||||
| Total assets |
$ | 234,162 | $ | 191,070 | ||||
|
|
|
|
|
|||||
| LIABILITIES, REDEEMABLE INSTRUMENTS AND STOCKHOLDERS’ EQUITY (DEFICIT) |
||||||||
| Current liabilities |
||||||||
| Current maturities of long-term debt |
$ | 1,786 | $ | 255 | ||||
| Current maturities of capital lease obligations |
9,374 | 7,663 | ||||||
| Accounts payable |
46,584 | 40,653 | ||||||
| Accrued compensation |
11,311 | 8,942 | ||||||
| Other current liabilities |
7,501 | 6,930 | ||||||
|
|
|
|
|
|||||
| Total current liabilities |
76,556 | 64,443 | ||||||
| Long-term debt |
25,070 | 27,771 | ||||||
| Capital lease obligations, less current maturities |
17,508 | 14,370 | ||||||
| Put option—Redeemable Preferred Stock |
— | 490 | ||||||
| Deferred income taxes |
9,746 | 9,571 | ||||||
| Other long-term liabilities |
13,408 | 9,006 | ||||||
|
|
|
|
|
|||||
| Total liabilities |
142,288 | 125,651 | ||||||
| Commitments and contingencies (Note 11) |
||||||||
| Redeemable Preferred Stock; $0.01 par value: 0 and 1,000 authorized, issued and outstanding at December 31, 2014 and 2013, respectively |
— | 55,838 | ||||||
| Redeemable Common Stock; $0.01 par value: 0 and 5,850,000 authorized, issued and outstanding at December 31, 2014 and 2013, respectively |
— | 81,010 | ||||||
| Stockholders’ equity (deficit) |
||||||||
| Preferred Stock; $0.01 par value: 5,000,000 and 0 authorized, 0 and 0 shares issued and outstanding at December 31, 2014 and 2013, respectively |
— | — | ||||||
| Common Stock; $0.01 par value: 100,000,000 and 27,200,862 authorized, 31,839,087 and 16,183,901 issued and 31,539,087 and 16,183,901 shares outstanding at December 31, 2014 and 2013, respectively (Note 7) |
319 | 162 | ||||||
| Additional paid in capital |
154,497 | — | ||||||
| Accumulated deficit |
(57,659 | ) | (71,591 | ) | ||||
| Treasury Stock; at cost: 300,000 and 0 shares, respectively |
(5,283 | ) | — | |||||
|
|
|
|
|
|||||
| Total stockholders’ equity (deficit) |
91,874 | (71,429 | ) | |||||
|
|
|
|
|
|||||
| Total liabilities, redeemable instruments and stockholders’ equity (deficit) |
$ | 234,162 | $ | 191,070 | ||||
|
|
|
|
|
|||||
See accompanying notes to consolidated financial statements
46
Table of Contents
INSTALLED BUILDING PRODUCTS, INC.
CONSOLIDATED STATEMENTS OF OPERATIONS
(in thousands, except share and per share amounts)
| Years ended December 31, | ||||||||||||
| 2014 | 2013 | 2012 | ||||||||||
| Net revenue |
$ | 518,020 | $ | 431,929 | $ | 301,253 | ||||||
| Cost of sales |
377,968 | 322,241 | 227,210 | |||||||||
|
|
|
|
|
|
|
|||||||
| Gross profit |
140,052 | 109,688 | 74,043 | |||||||||
| Operating expenses |
||||||||||||
| Selling |
30,951 | 25,509 | 19,807 | |||||||||
| Administrative |
80,678 | 67,194 | 56,333 | |||||||||
| Management fees, related parties |
— | — | 4,300 | |||||||||
| Gain on litigation settlement |
— | (31 | ) | (6,975 | ) | |||||||
| Amortization |
2,837 | 3,057 | 3,082 | |||||||||
| Other |
— | 881 | (608 | ) | ||||||||
|
|
|
|
|
|
|
|||||||
| Operating income (loss) |
25,586 | 13,078 | (1,896 | ) | ||||||||
| Other expense (income) |
||||||||||||
| Interest expense |
3,166 | 2,257 | 1,979 | |||||||||
| Other |
(167 | ) | (33 | ) | (136 | ) | ||||||
|
|
|
|
|
|
|
|||||||
| 2,999 | 2,224 | 1,843 | ||||||||||
|
|
|
|
|
|
|
|||||||
| Income (loss) before income taxes |
22,587 | 10,854 | (3,739 | ) | ||||||||
| Income tax provision |
8,607 | 4,216 | 555 | |||||||||
|
|
|
|
|
|
|
|||||||
| Net income (loss) from continuing operations |
13,980 | 6,638 | (4,294 | ) | ||||||||
|
|
|
|
|
|
|
|||||||
| Discontinued operations |
||||||||||||
| Loss (income) from discontinued operations |
78 | 960 | (3,835 | ) | ||||||||
| Income tax (benefit) provision |
(30 | ) | (362 | ) | 1,447 | |||||||
|
|
|
|
|
|
|
|||||||
| Loss (income) from discontinued operations, net of income taxes |
48 | 598 | (2,388 | ) | ||||||||
|
|
|
|
|
|
|
|||||||
| Net income (loss) |
$ | 13,932 | $ | 6,040 | $ | (1,906 | ) | |||||
|
|
|
|
|
|
|
|||||||
| Accretion charges on redeemable preferred stock |
(19,897 | ) | (6,223 | ) | (5,529 | ) | ||||||
|
|
|
|
|
|
|
|||||||
| Net loss attributable to common stockholders |
$ | (5,965 | ) | $ | (183 | ) | $ | (7,435 | ) | |||
|
|
|
|
|
|
|
|||||||
| Weighted average shares outstanding (basic and diluted) |
30,106,862 | 22,033,901 | 20,351,552 | |||||||||
| Net (loss) income per share (basic and diluted) |
||||||||||||
| (Loss) income per share from continuing operations attributable to common stockholders (basic and diluted) |
$ | (0.20 | ) | $ | 0.02 | $ | (0.49 | ) | ||||
| (Loss) income per share from discontinued operations attributable to common stockholders (basic and diluted) |
— | (0.03 | ) | 0.12 | ||||||||
|
|
|
|
|
|
|
|||||||
| Loss per share attributable to common stockholders (basic and diluted) |
$ | (0.20 | ) | $ | (0.01 | ) | $ | (0.37 | ) | |||
|
|
|
|
|
|
|
|||||||
See accompanying notes to consolidated financial statements
47
Table of Contents
INSTALLED BUILDING PRODUCTS, INC.
CONSOLIDATED STATEMENTS OF STOCKHOLDERS’ EQUITY (DEFICIT) AND REDEEMABLE INSTRUMENTS
(in thousands, except share amounts)
| Common Stock | Additional Paid In Capital |
Accumulated Deficit |
Treasury Shares | Stockholder’ Equity (Deficit) |
Redeemable | |||||||||||||||||||||||||||||||||||||||
| Preferrd Stock | Common Stock | |||||||||||||||||||||||||||||||||||||||||||
| Shares | Amount | Shares | Amount | Shares | Amount | Shares | Amount | |||||||||||||||||||||||||||||||||||||
| BALANCE—January 1, 2012 |
13,649,993 | $ | 137 | $ | — | $ | (9,697 | ) | $ | (9,560 | ) | 1,000 | $ | 44,086 | 5,850,000 | $ | 15,501 | |||||||||||||||||||||||||||
| Issuance of common stock |
2,533,908 | 25 | 4,075 | 4,100 | ||||||||||||||||||||||||||||||||||||||||
| Capital contributions from stockholders |
2,500 | 2,500 | ||||||||||||||||||||||||||||||||||||||||||
| Stock-based compensation |
4,658 | 4,658 | ||||||||||||||||||||||||||||||||||||||||||
| Net loss |
(1,906 | ) | (1,906 | ) | ||||||||||||||||||||||||||||||||||||||||
| Accretion of Redeemable Preferred to Redemption Value |
(5,529 | ) | (5,529 | ) | 5,529 | |||||||||||||||||||||||||||||||||||||||
| Adjustments to Redeemable Common Stock fair value measurement |
(1,745 | ) | (1,745 | ) | 1,745 | |||||||||||||||||||||||||||||||||||||||
|
|
|
|
|
|
|
|
|
|
|
|
|
|
|
|
|
|
|
|
|
|
|
|||||||||||||||||||||||
| BALANCE—January 1, 2013 |
16,183,901 | 162 | 3,959 | (11,603 | ) | — | — | (7,482 | ) | 1,000 | 49,615 | 5,850,000 | 17,246 | |||||||||||||||||||||||||||||||
|
|
|
|
|
|
|
|
|
|
|
|
|
|
|
|
|
|
|
|
|
|
|
|||||||||||||||||||||||
| Net income |
6,040 | 6,040 | ||||||||||||||||||||||||||||||||||||||||||
| Accretion of Redeemable Preferred to Redemption Value |
(3,959 | ) | (2,264 | ) | (6,223 | ) | 6,223 | |||||||||||||||||||||||||||||||||||||
| Adjustments to Redeemable Common Stock fair value measurement |
(63,764 | ) | (63,764 | ) | 63,764 | |||||||||||||||||||||||||||||||||||||||
|
|
|
|
|
|
|
|
|
|
|
|
|
|
|
|
|
|
|
|
|
|
|
|||||||||||||||||||||||
| BALANCE—January 1, 2014 |
16,183,901 | 162 | — | (71,591 | ) | — | — | (71,429 | ) | 1,000 | 55,838 | 5,850,000 | 81,010 | |||||||||||||||||||||||||||||||
|
|
|
|
|
|
|
|
|
|
|
|
|
|
|
|
|
|
|
|
|
|
|
|||||||||||||||||||||||
| Net income |
13,932 | 13,932 | ||||||||||||||||||||||||||||||||||||||||||
| Initial Public Offering (IPO) |
8,567,500 | 86 | 78,863 | 78,949 | ||||||||||||||||||||||||||||||||||||||||
| Secondary Public Offering |
1,214,196 | 12 | 14,280 | 14,292 | ||||||||||||||||||||||||||||||||||||||||
| Redemption of Redeemable Preferred Stock |
(1,000 | ) | (75,735 | ) | ||||||||||||||||||||||||||||||||||||||||
| Termination of Redemption Feature Upon IPO |
5,850,000 | 58 | 89,309 | 89,367 | (5,850,000 | ) | (89,367 | ) | ||||||||||||||||||||||||||||||||||||
| Accretion of Redeemable Preferred to Redemption Value |
(19,897 | ) | (19,897 | ) | 19,897 | |||||||||||||||||||||||||||||||||||||||
| Adjustments to Redeemable Common Stock fair value measurement |
(8,357 | ) | (8,357 | ) | 8,357 | |||||||||||||||||||||||||||||||||||||||
| Share-Based Compensation issued to Directors |
23,490 | 1 | 299 | 300 | ||||||||||||||||||||||||||||||||||||||||
| Common Stock Repurchase |
(300,000 | ) | (5,283 | ) | (5,283 | ) | ||||||||||||||||||||||||||||||||||||||
|
|
|
|
|
|
|
|
|
|
|
|
|
|
|
|
|
|
|
|
|
|
|
|||||||||||||||||||||||
| BALANCE—December 31, 2014 |
31,839,087 | $ | 319 | $ | 154,497 | $ | (57,659 | ) | (300,000 | ) | $ | (5,283 | ) | $ | 91,874 | — | $ | — | — | $ | — | |||||||||||||||||||||||
|
|
|
|
|
|
|
|
|
|
|
|
|
|
|
|
|
|
|
|
|
|
|
|||||||||||||||||||||||
See accompanying notes to consolidated financial statements
48
Table of Contents
INSTALLED BUILDING PRODUCTS, INC.
CONSOLIDATED STATEMENTS OF CASH FLOWS
(in thousands)
| Years ended December 31, | ||||||||||||
| 2014 | 2013 | 2012 | ||||||||||
| Cash flows from operating activities |
||||||||||||
| Net income (loss) |
$ | 13,932 | $ | 6,040 | $ | (1,906 | ) | |||||
| Adjustments to reconcile net income (loss) to net cash |
||||||||||||
| Depreciation and amortization of property and equipment |
12,174 | 8,374 | 4,637 | |||||||||
| Amortization of intangibles |
2,837 | 3,057 | 3,082 | |||||||||
| Amortization of deferred financing costs |
159 | 175 | 175 | |||||||||
| Provision for doubtful accounts |
1,900 | 1,038 | 482 | |||||||||
| Write-off of debt issuance costs |
233 | — | — | |||||||||
| Gain on sale of property and equipment |
(460 | ) | (372 | ) | (1,280 | ) | ||||||
| Noncash stock compensation |
300 | — | 4,658 | |||||||||
| Deferred income taxes |
(378 | ) | (1,782 | ) | (767 | ) | ||||||
| Other |
(490 | ) | (292 | ) | 210 | |||||||
| Changes in assets and liabilities, excluding effects of acquisitions |
||||||||||||
| Accounts receivable |
(10,688 | ) | (12,777 | ) | (6,858 | ) | ||||||
| Inventories |
(2,925 | ) | (2,945 | ) | (1,845 | ) | ||||||
| Other assets |
(5,121 | ) | (2,270 | ) | (1,948 | ) | ||||||
| Accounts payable |
4,585 | 3,902 | 2,013 | |||||||||
| Income taxes payable |
(1,678 | ) | (2,602 | ) | 2,339 | |||||||
| Other liabilities |
5,222 | 4,678 | 1,602 | |||||||||
|
|
|
|
|
|
|
|||||||
| Net cash provided by operating activities |
19,602 | 4,224 | 4,594 | |||||||||
|
|
|
|
|
|
|
|||||||
| Cash flows from investing activities |
||||||||||||
| Restricted cash |
1,708 | 95 | — | |||||||||
| Purchases of property and equipment |
(6,176 | ) | (2,665 | ) | (2,929 | ) | ||||||
| Acquisitions of businesses, net of cash acquired of $53, $0 and $375 in 2014, 2013 and 2012, respectively |
(12,364 | ) | (1,181 | ) | (823 | ) | ||||||
| Proceeds from sale of property and equipment |
689 | 1,240 | 176 | |||||||||
| Proceeds from insurance |
— | — | 833 | |||||||||
|
|
|
|
|
|
|
|||||||
| Net cash used in investing activities |
(16,143 | ) | (2,511 | ) | (2,743 | ) | ||||||
|
|
|
|
|
|
|
|||||||
| Cash flows from financing activities |
||||||||||||
| Proceeds from initial public offering of common stock, net of costs |
87,645 | — | — | |||||||||
| Proceeds from secondary public offering of common stock, net of costs |
14,418 | — | — | |||||||||
| Redemption of Redeemable Preferred Stock |
(75,735 | ) | — | — | ||||||||
| (Payments) proceeds from revolving lines of credit, net |
(27,269 | ) | 10,038 | 486 | ||||||||
| Proceeds from term loan |
25,000 | — | — | |||||||||
| Debt issuance costs |
(714 | ) | — | — | ||||||||
| Principal payments on long term debt |
(1,081 | ) | (513 | ) | (511 | ) | ||||||
| Principal payments on capital lease obligations |
(9,364 | ) | (6,625 | ) | (2,956 | ) | ||||||
| Payments for deferred initial public offering costs |
(4,254 | ) | (4,446 | ) | — | |||||||
| Payments for deferred secondary public offering costs |
(126 | ) | ||||||||||
| Repurchase of common stock |
(5,283 | ) | — | — | ||||||||
| Capital contributions |
— | — | 2,500 | |||||||||
|
|
|
|
|
|
|
|||||||
| Net cash provided by (used in) financing activities |
3,237 | (1,546 | ) | (481 | ) | |||||||
|
|
|
|
|
|
|
|||||||
| Net change in cash |
6,696 | 167 | 1,370 | |||||||||
| Cash at beginning of year |
4,065 | 3,898 | 2,528 | |||||||||
|
|
|
|
|
|
|
|||||||
| Cash at end of year |
$ | 10,761 | $ | 4,065 | $ | 3,898 | ||||||
|
|
|
|
|
|
|
|||||||
| Supplemental disclosures of cash flow information |
||||||||||||
| Net cash paid during the year for: |
||||||||||||
| Interest |
$ | 2,669 | $ | 2,038 | $ | 1,893 | ||||||
| Income taxes, net of refunds |
9,134 | 8,254 | 378 | |||||||||
| Supplemental disclosure of noncash investing and financing activities |
||||||||||||
| Vehicles capitalized under capital leases and related lease obligations |
14,583 | 17,123 | 11,090 | |||||||||
| Common stock issued for acquisition of business |
— | — | 4,100 | |||||||||
| Seller obligations in connection with acquisition of businesses |
3,544 | 300 | 571 | |||||||||
| Notes payable issued for acquisition of assets |
— | — | 115 | |||||||||
|
Unpaid offering costs |
— | 710 | — | |||||||||
See accompanying notes to consolidated financial statements
49
Table of Contents
INSTALLED BUILDING PRODUCTS, INC.
NOTES TO CONSOLIDATED FINANCIAL STATEMENTS
(in thousands, except share amounts)
NOTE 1 – ORGANIZATION
Installed Building Products, Inc. (“IBP”), a Delaware corporation formed on October 28, 2011, and its wholly owned subsidiaries (collectively referred to as the “Company” and “we”, “us” and “our”), primarily install insulation, garage doors, rain gutters, shower doors, closet shelving and mirrors, and other products for residential and commercial builders located in the continental United States. IBP operates in over 100 locations within the continental United States and its corporate office is located in Columbus, Ohio.
We have one operating segment and a single reportable segment. Substantially all of our sales come from service based installation of various products in the existing and new residential and commercial construction end markets. Each of our branches has the capacity to serve all of our end markets. The following table sets forth the annual percentage of our net revenue by end market:
| December 31, |
||||||||||||
| 2014 | 2013 | 2012 | ||||||||||
| Existing and new residential construction |
89 | % | 89 | % | 86 | % | ||||||
| Commercial construction |
11 | 11 | 14 | |||||||||
|
|
|
|
|
|
|
|||||||
| 100 | % | 100 | % | 100 | % | |||||||
The following is a summary of the annual percentage of installation net revenue by product category:
| Years ended December 31, | ||||||||||||
| 2014 | 2013 | 2012 | ||||||||||
| Insulation |
76 | % | 74 | % | 74 | % | ||||||
| Garage doors |
7 | 8 | 8 | |||||||||
| Shower doors, shelving and mirrors |
6 | 6 | 6 | |||||||||
| Rain gutters |
6 | 6 | 6 | |||||||||
| Other building products |
5 | 6 | 6 | |||||||||
|
|
|
|
|
|
|
|||||||
| 100 | % | 100 | % | 100 | % | |||||||
2014 Initial Public Offering (“IPO”)
On February 10, 2014, in anticipation of our IPO, we executed a 19.5-for-one stock split of our common stock which was originally a total of 1,129,944 shares of common stock issued and outstanding. The effect of the stock split on outstanding shares and earnings per share has been retroactively applied to all periods presented. Following the split we had 22,033,901 stock-split adjusted shares of common stock issued and outstanding.
On February 19, 2014, we completed an IPO of our common stock, which resulted in the sale of 8,567,500 shares. We received total proceeds from the IPO of $94,242 based upon the price of $11.00 per share. We used $6,597 of the proceeds from our IPO to pay underwriting fees, $75,735 to redeem our Redeemable Preferred Stock and $11,910 to pay down our revolving credit facility. The common stock is listed on The New York Stock Exchange under the symbol “IBP.”
2014 Secondary Public Offering
On June 17, 2014, we completed a secondary offering of an aggregate of 9,314,196 shares of our common stock at a public offering price of $12.50 per share. The total offering size reflects 8,100,000 shares of common stock offered on behalf of certain selling stockholders (the “Selling Stockholders”) and 1,214,196 shares that were
50
Table of Contents
INSTALLED BUILDING PRODUCTS, INC.
NOTES TO CONSOLIDATED FINANCIAL STATEMENTS
(in thousands, except share amounts)
offered and sold by us pursuant to the exercise of the underwriters’ option to purchase additional shares. We did not receive any proceeds from the sale of shares by the Selling Stockholders. However, we received $14,418, after deducting underwriting discounts but before estimated offering expenses payable by us, from the exercise of the underwriters’ option to purchase additional shares.
NOTE 2 – SIGNIFICANT ACCOUNTING POLICIES
Basis of Presentation and Principles of Consolidation
We prepare our consolidated financial statements in accordance with accounting principles generally accepted in the United States of America (“U.S. GAAP”). The accompanying consolidated financial statements include all wholly owned subsidiaries and majority owned subsidiaries. The non-controlling interest relating to a majority owned subsidiary is not significant for presentation. All intercompany accounts and transactions have been eliminated.
Use of Estimates
Preparation of the consolidated financial statements in conformity with U.S. GAAP requires management to make estimates and assumptions that affect the reported amounts of assets and liabilities and disclosure of contingent assets and liabilities at the date of the financial statements and the reported amounts of revenues and expenses during the reporting period. Significant estimates include the allowance for doubtful accounts, valuation allowance on deferred tax assets, valuation of the reporting unit, intangible assets and other long-lived assets, share based compensation, reserves for general liability, and workers’ compensation and medical insurance. Management believes the accounting estimates are appropriate and reasonably determined; however, due to the inherent uncertainties in making these estimates, actual amounts could differ from such estimates.
Cash and Cash Equivalents
We consider all highly-liquid investments purchased with original term to maturity of three months or less to be cash equivalents. All such items referenced herein are classified as cash and we have no items classified as cash equivalents as of the years ended December 31, 2014 or 2013. Substantially all cash is held in two banks at December 31, 2014. The banks provide FDIC coverage of $250 per depositor.
Restricted Cash
Restricted cash consists of deposits held by our insurance carrier for general liability and workers’ compensation reserves. Restricted cash is not considered cash and cash equivalents for purposes of the statements of cash flows. Classification between current and long-term is dependent upon the timing of the intended use of each particular reserve.
Revenue Recognition
Revenue from the sale and installation of products is recognized when all of the following have occurred: (i) persuasive evidence of an arrangement exists; (ii) delivery has occurred or services have been rendered; (iii) the price is fixed or determinable; and (iv) the ability to collect is reasonably assured. Revenue from the sale and installation of products is recognized net of adjustments and discounts and at the time the installation is complete.
51
Table of Contents
INSTALLED BUILDING PRODUCTS, INC.
NOTES TO CONSOLIDATED FINANCIAL STATEMENTS
(in thousands, except share amounts)
Business Combinations
The purchase price for business combinations is allocated to the estimated fair values of acquired tangible and intangible assets, including goodwill, and assumed liabilities, where applicable. Additionally, we recognize customer relationships, trademarks and trade names, and non-competition agreements as identifiable intangible assets. These assets are recorded at fair value as of the transaction date. The fair value of these intangibles is determined primarily using the income approach and using current industry information which involves significant unobservable inputs (Level 3 inputs). These inputs include projected sales, margin, and tax rate.
Accounts Receivable
We account for trade receivables based on amounts billed to customers. Past due receivables are determined based on contractual terms. We do not accrue interest on any of our trade receivables.
Allowance for Doubtful Accounts
We maintain an allowance for doubtful accounts for estimated losses resulting from the failure of customers to make required payments. The allowance is determined by management based on our historical losses, specific customer circumstances, and general economic conditions. We analyze aged accounts receivable and generally increase the allowance as receivables age. Management reviews accounts receivable and records an allowance for specific customers based on current circumstances and charges off the receivable against the allowance when all attempts to collect the receivable have failed. This analysis is performed regularly and the allowance is adjusted accordingly.
| Allowance for doubtful accounts receivable |
||||
| January 1, 2012 |
$ | 1,571 | ||
| Charged to costs and expenses |
482 | |||
| Charged to other accounts (1) |
563 | |||
| Deductions (2) |
(1,204 | ) | ||
|
|
|
|||
| December 31, 2012 |
1,412 | |||
| Charged to costs and expenses |
1,038 | |||
| Charged to other accounts (1) |
479 | |||
| Deductions (2) |
(1,191 | ) | ||
|
|
|
|||
| December 31, 2013 |
1,738 | |||
|
|
|
|||
| Charged to costs and expenses |
1,900 | |||
| Charged to other accounts (1) |
292 | |||
| Deductions (2) |
(1,269 | ) | ||
|
|
|
|||
| December 31, 2014 |
$ | 2,661 | ||
|
|
|
|||
| (1) | Recovery of receivables previously written off as bad debt |
| (2) | Write-off of uncollectible accounts receivable |
Deferred Offering Costs
Included on the Consolidated Balance Sheet at December 31, 2013 are deferred expenses related to our February 19, 2014 Initial Public Offering totaling $5,156. See Note 1, Organization, for further details of our
52
Table of Contents
INSTALLED BUILDING PRODUCTS, INC.
NOTES TO CONSOLIDATED FINANCIAL STATEMENTS
(in thousands, except share amounts)
Initial Public Offering. These deferred expenses were charged against equity upon the completion of the IPO in accordance with U.S. GAAP. As of December 31, 2014, we charged total offering costs of $8,700 against equity related to our IPO and $126 related to our secondary public offering.
Concentration of Credit Risk
Credit risk is our risk of financial loss from the non-performance of a contractual obligation on the part of our counterparty. Such risk arises principally from our receivables from customers and cash and bank balances. Substantially all of our trade accounts receivable are from entities engaged in residential and commercial construction. We perform periodic credit evaluations of our customers’ financial condition. The general credit risk of our counterparties is not considered to be significant. In addition, no individual customer made up more than 3.0% of net revenue for the years ended December 31, 2014, 2013 and 2012.
Inventories
Inventories consist of insulation, garage doors, rain gutters, shower doors, mirrors, closet shelving and other products. We install these products but do not manufacture them. We value inventory at the lower of cost or market with cost determined using the first-in, first-out (“FIFO”) method. As of December 31, 2014 and 2013, all inventory was finished goods.
Property and Equipment
Property and equipment are stated at cost, less accumulated depreciation. We provide for depreciation and amortization of property and equipment using the straight-line method, over the expected useful lives of the assets. Expected useful lives of property and equipment vary but generally are the shorter of lease life or five years for vehicles and leasehold improvements, three to five years for furniture, fixtures and equipment and 30 years for buildings.
Major renewals and improvements are capitalized. Maintenance, repairs and minor renewals are expensed as incurred. When assets are retired or otherwise disposed of, the related cost and accumulated depreciation are removed from the accounts and any resulting gain or loss is recorded.
Goodwill
Goodwill results from business combinations and represents the excess of the purchase price over the fair value of acquired tangible assets and liabilities and identifiable intangible assets. Annually, on October 1, or if conditions indicate an earlier review is necessary, we assess qualitative factors to determine if it is more likely than not that the fair value of a reporting unit is less than its carrying amount and if it is necessary to perform the quantitative two-step goodwill impairment test. If we perform the quantitative test, we compare the carrying value of the reporting unit to an estimate of the reporting unit’s fair value to identify potential impairment. The estimate of the reporting unit’s fair value is determined by weighting a discounted cash flow model and a market- related model using current industry information that involve significant unobservable inputs (Level 3 inputs). In determining the estimated future cash flow, we consider and apply certain estimates and judgments, including current and projected future levels of income based on management’s plans, business trends, prospects and market and economic conditions and market-participant considerations. If the estimated fair value of the reporting unit is less than the carrying value, a second step is performed to determine the amount of the potential goodwill impairment. If impaired, goodwill is written down to its estimated implied fair value.
53
Table of Contents
INSTALLED BUILDING PRODUCTS, INC.
NOTES TO CONSOLIDATED FINANCIAL STATEMENTS
(in thousands, except share amounts)
Impairment of Other Intangible and Long-Lived Assets
Other intangible assets consist of customer relationships, non-competition agreements and business trademarks and trade names. Amortization of finite lived intangible assets is recorded to reflect the pattern of economic benefits based on projected revenues over their respective estimated useful lives (customer relationships—10 to 15 years, non-competition agreements—two to five years and business trademarks and trade names—eight to 15 years). We do not have any indefinite-lived intangible assets other than goodwill.
We review long-lived assets whenever events or changes in circumstances indicate that the carrying value of an asset may not be recoverable. An impairment loss is recognized when estimated future cash flows expected to result from the use of an asset and its eventual disposition are less than its carrying amount. When impairment is identified, the carrying amount of the asset is reduced to its estimated fair value. Assets to be disposed of are recorded at the lower of net book value or fair market value less cost to sell at the date management commits to a plan of disposal. There was no impairment loss for the years ended December 31, 2014 and December 31, 2013. An intangible asset impairment related to continuing operations of $352 is included in other operating expenses for the year ended December 31, 2012.
Other Liabilities
Our workers’ compensation insurance is primarily under a high-deductible insurance policy and our general liability insurance is under a self-insured retention program (“SIR”). We are insured for covered claims above the deductible and SIR. The liabilities represent our best estimate of our costs, using generally accepted actuarial reserving methods, of the ultimate obligations for reported claims plus those incurred but not reported for all claims incurred through December 31, 2014 and 2013. We establish case reserves for reported claims using case-basis evaluation of the underlying claims data and we update as information becomes known. We regularly monitor the potential for changes in estimates, evaluate our insurance accruals and adjust our recorded provisions.
The assumptions underlying the ultimate costs of existing claim losses are subject to a high degree of unpredictability, which can affect the liability recorded for such claims. For example, variability in inflation rates of health care costs inherent in workers’ compensation claims can affect the ultimate costs. Similarly, changes in legal trends and interpretations, as well as a change in the nature and method of how claims are settled can affect ultimate costs. Our estimates of liabilities incurred do not anticipate significant changes in historical trends for these variables, and any changes could have a considerable effect on future claim costs and currently recorded liabilities.
Advertising Costs
Advertising costs are expensed as incurred. Advertising expense was approximately $1,553, $1,610 and $1,694 for the years ended December 31, 2014, 2013 and 2012, respectively, and is included in selling expense on the Consolidated Statements of Operations.
Other Operating Expenses
A net gain on litigation settlement of $31 and $6,975 was recognized in 2013 and 2012, respectively, due to the settlement of a class action lawsuit in which we were one of the plaintiffs. The lawsuit related to excess material prices being charged by certain manufacturers and was settled in 2012.
54
Table of Contents
INSTALLED BUILDING PRODUCTS, INC.
NOTES TO CONSOLIDATED FINANCIAL STATEMENTS
(in thousands, except share amounts)
Also included in other operating expenses in 2012 is a $960 gain from insurance proceeds related to the replacement of property and equipment and business interruption due to a fire at a single location in 2011.
We recorded $1,407 of settlement expenses in 2013 related to two lawsuits against us of which approximately $881 of these settlement expenses is included in other operating expenses in 2013. The remaining expense is included in Administrative Operating Expenses. See Note 11, Commitments and Contingencies, for further information about these lawsuits.
Deferred Financing Costs
Deferred financing costs totaling $643 and $321, net are amortized over the term of the related debt on a straight-line basis which approximates the effective interest method and are included in other non-current assets on the Consolidated Balance Sheets as of December 31, 2014 and 2013, respectively. The related amortization expense of these costs was $159, $175 and $175 and is included in interest expense on the Consolidated Statements of Operations for the years ended December 31, 2014, 2013 and 2012, respectively. We also wrote off the remaining loan costs associated with our previous credit agreement upon securing our credit agreement. These costs of $233 are included in interest expense on the Consolidated Statements of Operations for the year ended December 31, 2014. See Note 5, Long-Term Debt, for more information on our credit agreement.
Share-Based Compensation
In a previous period, two of our stockholders issued membership interests in their equity to certain of our employees (the “Awards”). Certain of these employees were granted Employee Puts.
When the employees received the Awards, the then fair value of the Awards less any consideration in exchange for the Awards was recorded as compensation expense. In accordance with the terms of the Awards, they were deemed equity-classified instruments as there is no service or vesting period associated with these Awards and all compensation expense was recognized upon issuance.
Upon issuance of the Employee Puts, the then fair value of the Employee Puts received was recorded as compensation expense over the service period, if applicable. The Employee Puts are deemed to be liability-classified instruments that are directly associated with the Awards. As such, both the Awards and the Employee Puts are accounted for as liability-classified instruments as of the issuance date of the Employee Put. During the period for which the Employee Puts are exercisable, both the Employee Puts and the associated Awards are re-measured to fair value each reporting period.
It was assumed that Employee Puts will be exercised at the greater of the fixed price or fair market value. In the absence of a publicly traded market, the fair market value of the Employee Puts and underlying units are estimated primarily using discounted cash flow and, secondarily, using other market-related models that factor in current industry trends. In determining the estimated future cash flow, we consider and apply certain estimates and judgments, including current and projected future levels of income based on management’s plans, business trends, prospects and market and economic conditions and market-participant considerations. The adjustment to the carrying fair value is based upon an equity rate of return for a public company in our industry with similar financial trends and characteristics. The fair value of our common stock is used to determine the value of the Employee Puts based on their ownership interest.
Because the awards were granted by a related party as compensation to our employees, the compensation associated with the awards and the related puts was pushed down by the related parties to IBP and recorded as
55
Table of Contents
INSTALLED BUILDING PRODUCTS, INC.
NOTES TO CONSOLIDATED FINANCIAL STATEMENTS
(in thousands, except share amounts)
non-cash compensation expense. This expense totaled $4,658 in 2012 and is included in administrative expenses on our Consolidated Statement of Operations. We recognized no similar expense in 2014 or 2013.
Effective November 30, 2013, the Employee Puts between Jeffrey Edwards and our other executive officers were terminated. As of December 31, 2014, all remaining puts between Jeffrey Edwards and employees remained unexercised and expired.
Self-Insurance Liabilities
We use a combination of insurance and self-insurance for a number of risks, including, but not limited to, workers’ compensation, general liability, vehicle liability, property and our obligation for employee-related health care benefits. Liabilities relating to these claims associated with these risks are estimated by considering historical claims experience, including frequency, severity, demographic factors, and other actuarial assumptions. In estimating our liability for such claims, we periodically analyze our historical trends, including loss development, and apply appropriate loss development factors to the incurred costs associated with the claims with the assistance of external actuarial consultants.
Income Taxes
We account for income taxes using the asset and liability method. Under this method, the amount of taxes currently payable or refundable are accrued and deferred tax assets and liabilities are recognized for the estimated future tax consequences of temporary differences that currently exist between the tax basis and financial reporting basis of our assets and liabilities.
Valuation allowances are established against deferred tax assets when it is more likely than not that the realization of those deferred tax assets will not occur. In evaluating our ability to recover our deferred tax assets within the jurisdiction from which they arise, we consider all available positive and negative evidence, including scheduled reversals of deferred tax liabilities, the ability to produce future taxable income, tax planning strategies available and recent financial operations. In projecting future taxable income, we begin with historical results adjusted for the results of discontinued operations and changes in accounting policies and incorporate assumptions including the amount of future federal and state pretax operating income, the reversal of temporary differences, and the implementation of feasible and prudent tax planning strategies. These assumptions require significant judgment about the forecasts of future taxable income and are consistent with the plans and estimates we use to manage the underlying businesses.
Deferred tax assets and liabilities are measured using the enacted tax rates in effect in the years when those temporary differences are expected to reverse. The effect on deferred taxes from a change in tax rate is recognized through continuing operations in the period that includes the enactment date of the change. Changes in tax laws and rates could also affect recorded deferred tax assets and liabilities in the future. Management is not aware of any such changes that would have a material effect on our results of operations, cash flows, or financial position.
A tax benefit from an uncertain tax position may be recognized when it is more likely than not that the position will be sustained upon examination, including resolutions of any related appeals or litigation processes, based on the technical merits. Income tax positions must meet a more likely than not recognition threshold to be recognized.
56
Table of Contents
INSTALLED BUILDING PRODUCTS, INC.
NOTES TO CONSOLIDATED FINANCIAL STATEMENTS
(in thousands, except share amounts)
We recognize tax liabilities for uncertain tax positions and adjust these liabilities when our judgment changes as a result of the evaluation of new information not previously available. Liabilities related to uncertain tax positions are recorded in other current liabilities and other long-term liabilities on the Consolidated Balance Sheets. Due to the complexity of some of these uncertainties, the ultimate resolution may result in a payment that is materially different from the current estimate of the tax liabilities. These differences will be reflected as increases or decreases to income tax expense and the effective tax rate in the period in which the new information becomes available. Interest and penalties related to unrecognized tax benefits are recognized within income tax expense in the Consolidated Statements of Operations. Accrued interest and penalties are recognized in accrued expenses on the Consolidated Balance Sheets.
Our income tax expense, deferred tax assets and liabilities and reserves for unrecognized tax benefits reflect management’s best assessment of estimated future taxes to be paid. We are subject to income taxes in the United States which includes numerous state and local jurisdictions. Significant judgments and estimates are required in determining the income tax expense, deferred tax assets and liabilities and the reserve for unrecognized tax benefits.
Discontinued Operations
We continually review each of our markets in order to refine our overall investment strategy and to optimize capital and resource allocations in an effort to enhance our financial position and to increase Company value. This review entails an evaluation of both external market factors and our position in each market and over time has resulted in the decision to discontinue certain locations. Customers of discontinued locations will not be served by other locations. There were no material assets or liabilities related to our discontinued operations as of December 31, 2014 or 2013. Discontinued operations were not segregated in the Consolidated Statements of Cash Flows.
Estimated Fair Value of Financial Instruments
Accounts receivable, accounts payable, and accrued liabilities as of December 31, 2014 and 2013 approximate their fair value due to the short-term maturities of these financial instruments. The carrying amounts of the long-term debt under the revolving lines of credit and Term Loan approximate their fair values as of December 31, 2014 and 2013 due to the short term maturities of the underlying variable rate LIBOR agreements. This represents a Level 2 fair value measurement.
Recently Adopted Accounting Pronouncements
In November 2014, the FASB issued ASU 2014-17, “Business Combinations (Topic 805).” Current U.S. GAAP offers limited guidance for determining whether and at what threshold an acquiree (acquired entity) can reflect the acquirer’s accounting and reporting basis (pushdown accounting) in its separate financial statements. This ASU establishes guidance about whether and at what threshold an acquired entity that is a business or nonprofit activity can apply pushdown accounting in its separate financial statements. This ASU is effective on November 18, 2014 and applicable to future business combinations. We have concluded that this ASU has not and will not have a material impact on our consolidated financial statements.
Recently Issued Accounting Pronouncements Not Yet Adopted
In April 2014, the FASB issued ASU 2014-08, “Presentation of Financial Statements (Topic 205) and Property, Plant, and Equipment (Topic 360): Reporting Discontinued Operations and Disclosures of Disposals of
57
Table of Contents
INSTALLED BUILDING PRODUCTS, INC.
NOTES TO CONSOLIDATED FINANCIAL STATEMENTS
(in thousands, except share amounts)
Components of an Entity.” The amendments in this update change the requirements for reporting discontinued operations in Subtopic 205-20. A discontinued operation may include a component of an entity or a group of components of an entity, or a business or nonprofit activity. A disposal of a component of an entity or a group of components of an entity is required to be reported in discontinued operations if the disposal represents a strategic shift that has (or will have) a major effect on an entity’s operations and financial results. This ASU is effective prospectively for fiscal years, and interim periods within those years, beginning on or after December 15, 2014. We are still evaluating whether this ASU will have a material impact on our consolidated financial statements.
In May 2014, the FASB issued ASU 2014-09, “Revenue from Contracts with Customers (Topic 606).” Per the ASU, an entity should recognize revenue to depict the transfer of promised goods or services to customers in an amount that reflects the consideration to which the entity expects to be entitled in exchange for those goods or services. ASU 2014-09 sets forth a new revenue recognition model that requires identifying the contract, identifying the performance obligations, determining the transaction price, allocating the transaction price to performance obligations and recognizing the revenue upon satisfaction of performance obligations. This ASU is effective for fiscal years, and interim periods within those years, beginning after December 15, 2016, with earlier adoption not permitted. The provisions can be adopted either retrospectively to each prior reporting period presented or as a cumulative-effect adjustment as of the date of adoption. We are still evaluating whether this ASU will have a material impact on our consolidated financial statements.
NOTE 3 – PROPERTY AND EQUIPMENT
Property and equipment consisted of the following:
| As of December 31, 2014 |
As of December 31, 2013 |
|||||||
| Land |
$ | 66 | $ | 66 | ||||
| Buildings |
218 | 218 | ||||||
| Leasehold improvements |
4,028 | 3,640 | ||||||
| Furniture, fixtures and equipment |
17,814 | 15,720 | ||||||
| Vehicles and equipment |
75,731 | 61,971 | ||||||
|
|
|
|
|
|||||
| 97,857 | 81,615 | |||||||
| Less: accumulated deprecation and amortization |
(58,487 | ) | (52,140 | ) | ||||
|
|
|
|
|
|||||
| $ | 39,370 | $ | 29,475 | |||||
|
|
|
|
|
|||||
Property and equipment as of December 31, 2014 and 2013 of $37,014 and $37,360, respectively, were fully depreciated but still being utilized in our business. Depreciation and amortization expense during the years ended December 31, 2014, 2013 and 2012 was $12,174, $8,374 and $4,637, respectively.
58
Table of Contents
INSTALLED BUILDING PRODUCTS, INC.
NOTES TO CONSOLIDATED FINANCIAL STATEMENTS
(in thousands, except share amounts)
NOTE 4 – GOODWILL AND INTANGIBLES
Goodwill
The change in carrying amount of goodwill was as follows:
| Goodwill (Gross) |
Accumulated Impairment Losses |
Goodwill (Net) |
||||||||||
| January 1, 2013 |
$ | 119,150 | $ | (70,004 | ) | $ | 49,146 | |||||
| Business combinations |
182 | — | 182 | |||||||||
|
|
|
|
|
|
|
|||||||
| December 31, 2013 |
119,332 | (70,004 | ) | 49,328 | ||||||||
| Business combinations |
4,065 | — | 4,065 | |||||||||
|
|
|
|
|
|
|
|||||||
| December 31, 2014 |
$ | 123,397 | $ | (70,004 | ) | $ | 53,393 | |||||
|
|
|
|
|
|
|
|||||||
At October 1, 2014, our measurement date, we performed a step zero analysis that weighted all evidence of potential impairment, whether positive or negative. We determined there was no indicator for potential impairment. No impairment of goodwill was recognized for the years ended December 31, 2014, 2013 and 2012. See Note 12, Business Combinations, for more information on goodwill increases from business combinations.
Intangibles, net
The following table provides the gross carrying amount and accumulated amortization for each major class of intangibles:
| As of December 31, 2014 | As of December 31, 2013 | |||||||||||||||||||||||
| Gross Carrying Amount |
Accumulated Amortization |
Net Book Value |
Gross Carrying Amount |
Accumulated Amortization |
Net Book Value |
|||||||||||||||||||
| Amortized intangibles: |
||||||||||||||||||||||||
| Customer relationships |
$ | 26,119 | $ | 16,151 | $ | 9,968 | $ | 21,412 | $ | 14,403 | $ | 7,009 | ||||||||||||
| Covenants not-to-compete |
883 | 202 | 681 | 356 | 160 | 196 | ||||||||||||||||||
| Trademarks and tradenames |
13,681 | 6,612 | 7,069 | 11,882 | 5,687 | 6,195 | ||||||||||||||||||
|
|
|
|
|
|
|
|
|
|
|
|
|
|||||||||||||
| $ | 40,683 | $ | 22,965 | $ | 17,718 | $ | 33,650 | $ | 20,250 | $ | 13,400 | |||||||||||||
|
|
|
|
|
|
|
|
|
|
|
|
|
|||||||||||||
There was no intangible asset impairment loss for the years ended December 31, 2014 and 2013. An intangible asset impairment related to continuing operations of $352 for impaired customer relationships and trademarks and trade names relating to certain branch name changes is included in other operating expenses on the Consolidated Statement of Operations for the year ended December 31, 2012.
The gross carrying amount of intangibles increased $7,033 and $645 during the years ended December 31, 2014 and 2013, respectively. Intangibles associated with acquisitions accounted for $7,111 and $1,332 of the increases during the years ended December 31, 2014 and 2013, respectively, with the remaining changes due to other factors. See Note 12, Business Combinations, for more information. Amortization expense on intangible assets
59
Table of Contents
INSTALLED BUILDING PRODUCTS, INC.
NOTES TO CONSOLIDATED FINANCIAL STATEMENTS
(in thousands, except share amounts)
totaled $2,837, $3,057 and $3,082 during the years ended December 31, 2014, 2013 and 2012, respectively. Remaining estimated aggregate annual amortization expense is as follows:
| 2015 |
$ | 3,066 | ||
| 2016 |
2,707 | |||
| 2017 |
2,117 | |||
| 2018 |
1,907 | |||
| 2019 |
1,612 | |||
| Thereafter |
6,309 |
NOTE 5 – LONG-TERM DEBT
| As of December 31, | ||||||||
| 2014 | 2013 | |||||||
| Revolving Line of Credit |
$ | — | $ | 27,269 | ||||
| Term Loan due July 7, 2019 |
24,688 | — | ||||||
| Vehicle and equipment notes payable |
1,346 | — | ||||||
| Various notes payable, maturing through December 2016; payable in various monthly installments, including interest rates ranging from 0.0% to 10.0% |
822 | 757 | ||||||
|
|
|
|
|
|||||
| 26,856 | 28,026 | |||||||
| Less: current maturities |
(1,786 | ) | (255 | ) | ||||
|
|
|
|
|
|||||
| Long-term debt, less current maturities |
$ | 25,070 | $ | 27,771 | ||||
|
|
|
|
|
|||||
On July 8, 2014, we entered into a Credit Agreement (the “Credit Agreement”) with a bank group with an aggregate commitment of $100,000 and a maturity date of July 7, 2019 (the “Maturity Date”). Upon entry into the Credit Agreement, our previous credit agreement, as amended, with an aggregate commitment of $50,000, was terminated.
The Credit Agreement provides for a $75,000 revolving credit facility (“LOC”) and a $25,000 term loan (“Term Loan”) secured by all of our assets except certain vehicles secured by capital leases and loans. We can also borrow swingline loans up to $5,000 and obtain letters of credit of up to $10,000; any outstanding letters of credit and swingline loans under the Credit Agreement reduce our borrowing capacity. At December 31, 2014, we had $9,815 of outstanding letters of credit and no outstanding swingline loans.
We had $24,688 outstanding under the Term Loan and no outstanding borrowings under the LOC as of December 31, 2014. We had $24,500 outstanding on the line of credit under the previous Credit Agreement at 1-month LIBOR including margin (2.25%) and $2,769 outstanding on the previous line of credit at the Alternate Base Rate including margin (4.25%) as of December 31, 2013.
The LOC and Term Loan bear interest at either 1) the Eurodollar rate (“LIBOR”) or 2) the Base Rate (which approximates Prime Rate), plus a margin based on the type of rate applied and the value (represented as a ratio) of our total debt to earnings. The Term Loan amortizes in quarterly principal payments of $313 starting on December 31, 2014, with the quarterly payment amount increasing to $469 from September 30, 2016 through June 30, 2018, and further increasing to $625 from September 30, 2018 through June 30, 2019. Any outstanding principal balance on the Term Loan is due on the Maturity Date.
60
Table of Contents
INSTALLED BUILDING PRODUCTS, INC.
NOTES TO CONSOLIDATED FINANCIAL STATEMENTS
(in thousands, except share amounts)
The Credit Agreement contains financial covenants requiring us to maintain 1) a leverage ratio of debt to earnings, as adjusted for certain items and as defined by the Credit Agreement, of no greater than 3.50 to 1.00 and decreasing over time to 2.75 to 1.00 by March 31, 2016, and 2) a fixed charge coverage ratio, as adjusted for certain items, of no less than 1.10 to 1.00. The Credit Agreement also contains various restrictive non-financial covenants and a provision requiring that, upon an event of default (as defined by the Credit Agreement), amounts outstanding under the LOC and Term Loan would bear interest at the rate as determined above plus 2%. In addition, all representations and warranties in the Credit Agreement must be true in all material respects on the date of each borrowing. Based on the limitations of the debt to total earnings ratio covenant in the Credit Agreement, at December 31, 2014, we had the ability to fully draw the LOC less the outstanding letters of credit. In December 2014, we entered into a First Amendment Agreement (the “First Amendment”) to the Credit Agreement, which, among others things, amends the definition of consolidated fixed charges to exclude certain share repurchase transactions, up to a specified limit, from the calculation of the fixed charge coverage ratio under the Credit Agreement.
In October 2014, we entered into a Master Loan and Security Agreement (“Master Loan Agreement”) with a new lender to provide financing up to $5,000 for the purpose of purchasing vehicles and equipment used in the normal course of business. Vehicles and equipment purchased under this Master Loan Agreement serve as collateral for each note controlled by this financing arrangement. Each financing arrangement under this Master Loan Agreement will serve as a separate note and obligation. Regular payments are due under each note beginning when each obligation occurs. The specific terms of each note are based on specific criteria, including the type of vehicle or equipment, the length of the term of the note, and the market interest rates at the time. There is no termination date of this Master Loan Arrangement. The balance outstanding thereunder at December 31, 2014, was $1,346.
NOTE 6 – FAIR VALUE MEASUREMENTS
Fair Values
Fair value is the price that would be received for an asset or paid to transfer a liability (an exit price) in the principal or most advantageous market for the asset or liability in an orderly transaction between market participants on the measurement date.
The standard establishes a fair value hierarchy that requires an entity to maximize the use of observable inputs and minimize the use of unobservable inputs when measuring fair value. The standard describes three levels of inputs that may be used to measure fair value:
Level 1: Quoted prices (unadjusted) for identical assets or liabilities in active markets that the entity has the ability to access as of the measurement date.
Level 2: Significant other observable inputs other than Level 1 prices such as quoted prices for similar assets or liabilities; quoted prices in markets that are not active; or other inputs that are observable or can be corroborated by observable market data.
Level 3: Significant unobservable inputs that reflect a reporting entity’s own assumptions about the assumptions that market participants would use in pricing an asset or liability.
Assets and Liabilities Measured at Fair Value on a Recurring Basis
In many cases, a valuation technique used to measure fair value includes inputs from multiple levels of the fair value hierarchy. The lowest level of significant input determines the placement of the entire fair value measurement in the hierarchy. During the periods presented, there were no transfers between fair value hierarchical levels.
61
Table of Contents
INSTALLED BUILDING PRODUCTS, INC.
NOTES TO CONSOLIDATED FINANCIAL STATEMENTS
(in thousands, except share amounts)
Our Redeemable Preferred Stock was redeemed in February 2014 with proceeds from our IPO, eliminating the associated put option. In addition, the redeemable feature of our Redeemable Common Stock was terminated upon the IPO. See Note 1, Organization, “2014 Initial Public Offering,” for further information.
| Balance as of December 31, 2013 |
Quoted prices in active markets Level 1 |
Significant other observable inputs Level 2 |
Significant unobservable inputs Level 3 |
|||||||||||||
| Put option—Redeemable Preferred Stock |
$ | 490 | $ | — | $ | — | $ | 490 | ||||||||
| Redeemable Common Stock |
81,010 | — | — | 81,010 | ||||||||||||
|
|
|
|
|
|
|
|
|
|||||||||
| Total items measured at fair value on arecurring basis |
$ | 81,500 | $ | — | $ | — | $ | 81,500 | ||||||||
|
|
|
|
|
|
|
|
|
|||||||||
The following is a general description of the valuation methodologies used for liabilities and mezzanine equity (which includes preferred redeemable and common stock) items measured at fair value:
Put option—Redeemable Preferred Stock—We identified a certain embedded feature in the Redeemable Preferred Stock that was required to be bifurcated and accounted for as a derivative. The identified put option allowed Redeemable Preferred stockholders to put their shares upon a change in control. The estimated fair value of the put option on Redeemable Preferred Stock was determined using our estimates of the probability of a change in control during each period the option is outstanding in combination with the accreted fair value of the Redeemable Preferred Stock during the option period. Those resulting probabilities were then calculated at net present value. An increase in the probability of the change in control would have increased the fair value of the embedded derivative. We have not entered into and currently do not hold derivatives for trading or speculative purposes.
Redeemable Common Stock—The estimated fair value of the redeemable feature of certain shares of our outstanding common stock was determined using a combination of discounted cash flows and market multiple approach modeling. The fair value was estimated using this method to mark the Redeemable Common Stock to market at each period end. The weighted average cost of capital (“WACC”) used to estimate fair value was approximately 18% as of December 31, 2013.
Changes in the fair value of recurring fair value measurements using significant unobservable inputs (Level 3) for the years ended December 31, 2014 and 2013 were as follows (in thousands):
| Balance as of January 1, 2013 |
$ | 18,028 | ||
| Adjustments to fair value measurement impacting the Statement of Stockholders’ Deficit and Redeemable Instruments |
63,764 | |||
| Adjustments to fair value measurement impacting the Statement of Operations |
(292 | ) | ||
|
|
|
|||
| Balance as of January 1, 2014 |
81,500 | |||
| Adjustments to fair value measurement impacting the Statement of Stockholders’ Deficit and Redeemable Instruments |
8,357 | |||
| Adjustments to fair value measurement impacting the Statement of Operations |
(490 | ) | ||
| Termination of Redemption Feature on common stock and put option |
(89,367 | ) | ||
|
|
|
|||
| Balance as of December 31, 2014 |
$ | — | ||
|
|
|
62
Table of Contents
INSTALLED BUILDING PRODUCTS, INC.
NOTES TO CONSOLIDATED FINANCIAL STATEMENTS
(in thousands, except share amounts)
The unrealized gain related to the put option liabilities is recorded within other expense (income) on the Consolidated Statements of Operations.
Assets Measured at Fair Value on a Nonrecurring Basis
Certain assets are measured at fair value on a nonrecurring basis in periods subsequent to initial recognition. Assets measured at fair value on a nonrecurring basis as of December 31, 2014 and 2013 are categorized based on the lowest level of significant input to the valuation. The assets were measured at fair value as our impairment assessment indicated a carrying value for each of the assets in excess of the asset’s estimated fair value. Discounted cash flows, a Level 3 input, were utilized in determining estimated fair values. There is no impairment loss for the years ended December 31, 2014 and 2013. An intangible asset impairment related to continuing operations of $352 is included in net income attributable to common stockholders for the year ended December 31, 2012. See the “Impairment of Long-Lived Assets” caption of Note 2, Significant Accounting Policies, for more information.
NOTE 7 – STOCKHOLDERS’ EQUITY (DEFICIT) AND REDEEMABLE INSTRUMENTS
In anticipation of our IPO, we amended our Certificate of Incorporation on February 10, 2014 to, among other things, authorize additional shares of common and preferred stock. On February 25, 2014, we further amended our Certificate of Incorporation to delete references to the Redeemable Preferred Stock, all of which was redeemed with proceeds from our IPO and subsequently retired and cancelled.
In December 2014, we entered into a share repurchase agreement with Cetus Capital II, LLC, a related party, for the purchase of 300,000 shares of our common stock for an aggregate purchase price of $5,283, or $17.61 per share, which was the last reported sales price of the company’s common stock on December 11, 2014. The effect of these treasury shares reducing the number of common shares outstanding is reflected in our earnings per share calculation. For additional information on the related party relationship, see Note 10, Related Party Transactions.
As of December 31, 2014, we had 5,000,000 shares of preferred stock authorized with no shares issued or outstanding, 100,000,000 shares of common stock authorized, 31,839,087 shares of common stock issued and 31,539,087 shares of common stock outstanding, all with par value of $0.01, and 300,000 shares of treasury stock at cost.
NOTE 8 – EMPLOYEE BENEFITS
We participate in multiple healthcare plans, of which, our primary plan is partially self-funded with an insurance company paying benefits in excess of stop loss limits per individual. Our healthcare benefit expense (net of employee contributions) was approximately $8,119, $7,954 and $5,744 for the years ended December 31, 2014, 2013 and 2012, respectively for all plans. An accrual for estimated healthcare claims incurred but not reported (“IBNR”) is included within accrued compensation on the Consolidated Balance Sheets and was $1,089 and $913 as of December 31, 2014 and 2013, respectively.
We participate in multiple workers’ compensation plans. Under these plans, we use a high deductible program to cover losses above the deductible amount on a per claim basis. We accrue for the estimated losses occurring from both asserted and un-asserted claims. Workers’ compensation liability for premiums is included in other current liabilities on the Consolidated Balance Sheets. Insurance claims and reserves include accruals of estimated settlements for known claims, as well as accruals of actuarial estimates of IBNR. In estimating these reserves, historical loss experience and judgments about the expected levels of costs per claim are considered. These
63
Table of Contents
INSTALLED BUILDING PRODUCTS, INC.
NOTES TO CONSOLIDATED FINANCIAL STATEMENTS
(in thousands, except share amounts)
claims are accounted for based on actuarial estimates of the undiscounted claims, including those claims incurred but not reported. We believe the use of actuarial methods to account for these liabilities provides a consistent and effective way to measure these highly judgmental accruals.
Workers’ compensation expense totaled $9,814, $5,910 and $4,043 for the years ended December 31, 2014, 2013 and 2012, respectively. As of December 31, 2014 and 2013, respectively, workers’ compensation known claims and IBNR reserves totaled $8,256 and $5,920 and are included in both other current and other long-term liabilities on the accompanying Consolidated Balance Sheets. Other current and other long-term liabilities also include $5,133 and $4,278 of accrued general liability insurance reserves as of December 31, 2014 and 2013, respectively. We also had an insurance receivable for claims that exceeded the stop loss limit included in other long-term assets on the face of the Consolidated Balance Sheets. That receivable offsets an equal liability included within the reserve amount noted above and totaled $2,963 and $2,055 as of December 31, 2014 and 2013, respectively.
We also participate in various profit-sharing and 401(k) plans. Certain plans provide that eligible employees can defer a portion of their wages into the trust, subject to current Internal Revenue Code rules and limitations. We provide a matching contribution of wages deferred by employees and can also make discretionary contributions to each plan. Certain plans allow for discretionary employer contributions only. These plans cover substantially all our eligible employees. During the years ended December 31, 2014, 2013 and 2012, we recognized 401(k) plan expenses of $702, $695 and $529, respectively, which is included in administrative expenses on the accompanying Consolidated Statements of Operations.
Directors
We periodically grant shares of restricted stock to members of our Board of Directors. Accordingly, we record compensation expense within administrative expenses on the Consolidated Statements of Operations at the time of the grant.
In June 2014, we granted 23,490 shares of restricted stock at a price of $12.77 per share (which represents market price on the grant date) to non-employee members of our Board of Directors. These shares effectively vested on the grant date since there is no service required period associated with these awards. The lack of a vesting or service period may not apply to any future share grants under our 2014 Omnibus Incentive Plan. Accordingly, we recorded $300 in compensation expense within administrative expenses on the Consolidated Statements of Operations for the year ended December 31, 2014. Since all shares effectively vested immediately, there is no unearned compensation expense related to non-vested share-based compensation recorded on our Consolidated Balance Sheet as of December 31, 2014. No restricted stock had been granted prior to June 2014 and accordingly, no shares were granted and no compensation expense was recorded for the years ended December 31, 2013 or 2012, and no vested or nonvested restricted stock awards existed as of those dates.
The weighted-average grant-date fair value is the same as the issue price for all shares since all of the shares vested at the grant date. All shares are fully vested and no shares were forfeited during the year ended December 31, 2014. As of December 31, 2014, 2,976,510 of the 100,000,000 shares of common stock authorized for issuance were available for issuance under the 2014 Omnibus Incentive Plan.
Employees
No restricted stock awards have been granted to employees as of December 31, 2014.
64
Table of Contents
INSTALLED BUILDING PRODUCTS, INC.
NOTES TO CONSOLIDATED FINANCIAL STATEMENTS
(in thousands, except share amounts)
NOTE 9 – INCOME TAXES
The provision for income taxes from continuing operations is comprised of:
| Years ended December 31, | ||||||||||||
| 2014 | 2013 | 2012 | ||||||||||
| Current: |
||||||||||||
| Federal |
$ | 7,616 | $ | 5,289 | $ | 1,213 | ||||||
| State |
1,369 | 677 | 194 | |||||||||
|
|
|
|
|
|
|
|||||||
| 8,985 | 5,966 | 1,407 | ||||||||||
| Deferred: |
||||||||||||
| Federal |
(676 | ) | (1,554 | ) | (794 | ) | ||||||
| State |
298 | (196 | ) | (58 | ) | |||||||
|
|
|
|
|
|
|
|||||||
| (378 | ) | (1,750 | ) | (852 | ) | |||||||
|
|
|
|
|
|
|
|||||||
| Total tax expense |
$ | 8,607 | $ | 4,216 | $ | 555 | ||||||
|
|
|
|
|
|
|
|||||||
The reconciliation between our effective tax rate on net income (loss) from continuing operations and the federal statutory rate is as follows:
| Years ended December 31, | ||||||||||||||||||||||||
| 2014 | 2013 | 2012 | ||||||||||||||||||||||
| Income tax at federal statutory rate |
$ | 7,905 | 35.0 | % | $ | 3,799 | 35.0 | % | $ | (1,309 | ) | 35.0 | % | |||||||||||
| Stock Compensation |
— | 0.0 | % | (97 | ) | (0.9 | %) | 1,581 | (42.3 | %) | ||||||||||||||
| Section 199 Deduction |
(694 | ) | (3.1 | %) | (454 | ) | (4.2 | %) | (268 | ) | 7.2 | % | ||||||||||||
| Other permanent items |
(272 | ) | (1.2 | %) | 7 | 0.1 | % | 262 | (7.0 | %) | ||||||||||||||
| Change in valuation allowance |
585 | 2.6 | % | 647 | 6.0 | % | 214 | (5.7 | %) | |||||||||||||||
| Interest and penalties on uncertain tax positions |
— | 0.0 | % | — | 0.0 | % | 56 | (1.5 | %) | |||||||||||||||
| State income taxes, net of federal benefit |
1,083 | 4.8 | % | 314 | 2.9 | % | 19 | (0.5 | %) | |||||||||||||||
|
|
|
|
|
|
|
|||||||||||||||||||
| Total tax expense |
$ | 8,607 | 38.1 | % | $ | 4,216 | 38.9 | % | $ | 555 | (14.8 | %) | ||||||||||||
|
|
|
|
|
|
|
|||||||||||||||||||
65
Table of Contents
INSTALLED BUILDING PRODUCTS, INC.
NOTES TO CONSOLIDATED FINANCIAL STATEMENTS
(in thousands, except share amounts)
Components of the net deferred tax asset or liability are as follows:
| At December 31, | At December 31, | |||||||
| 2014 | 2013 | |||||||
| Deferred Tax Assets |
||||||||
| Current |
||||||||
| Accruals, prepaid items and allowances |
$ | 208 | $ | 86 | ||||
| Inventories |
75 | 55 | ||||||
|
|
|
|
|
|||||
| Current deferred tax assets |
283 | 141 | ||||||
| Long-term |
||||||||
| Property and equipment |
1 | 1 | ||||||
| Net operating loss carryforwards |
1,925 | 1,297 | ||||||
|
|
|
|
|
|||||
| Long-term deferred tax assets |
1,926 | 1,298 | ||||||
|
|
|
|
|
|||||
| Total deferred tax assets |
2,209 | 1,439 | ||||||
| Less: Valuation allowance |
(1,506 | ) | (885 | ) | ||||
|
|
|
|
|
|||||
| Net deferred tax assets |
703 | 554 | ||||||
| Deferred Tax Liabilities |
||||||||
| Current |
||||||||
| Accruals, prepaid items and allowances |
(26 | ) | (29 | ) | ||||
| Other |
(59 | ) | (67 | ) | ||||
|
|
|
|
|
|||||
| Current deferred tax liabilities |
(85 | ) | (96 | ) | ||||
| Long-term |
||||||||
| Property and equipment |
(327 | ) | (86 | ) | ||||
| Intangibles |
(783 | ) | (374 | ) | ||||
| Investment in partnership |
(9,206 | ) | (9,554 | ) | ||||
|
|
|
|
|
|||||
| Long-term deferred tax liabilities |
(10,316 | ) | (10,014 | ) | ||||
|
|
|
|
|
|||||
| Total deferred tax liabilities |
(10,401 | ) | (10,110 | ) | ||||
|
|
|
|
|
|||||
| Net deferred tax liabilities |
$ | (9,698 | ) | $ | (9,556 | ) | ||
|
|
|
|
|
|||||
As of December 31, 2014, we have federal and state income tax net operating loss (NOL) carryforwards of $1,925, the earliest of which expires in 2030.
Valuation Allowance
We assess the available positive and negative evidence to estimate if sufficient future taxable income will be generated to utilize the existing deferred tax assets on a jurisdiction and by tax filing entity basis. A significant piece of objective negative evidence evaluated is cumulative losses incurred over the most recent three year period. Such objective evidence limits the ability to consider other subjective positive evidence such as our projections for future growth.
Based on this evaluation, a valuation allowance has been recorded as of December 31, 2014 and 2013 for the net deferred tax assets recorded on certain of our wholly owned subsidiaries. Such deferred tax assets relate
66
Table of Contents
INSTALLED BUILDING PRODUCTS, INC.
NOTES TO CONSOLIDATED FINANCIAL STATEMENTS
(in thousands, except share amounts)
primarily to net operating losses that are not more likely than not realizable. However, the amount of the deferred tax asset considered realizable could be adjusted if estimate of future taxable income during the carryforward period change, or if objective negative evidence in the form of cumulative losses is no longer present. Additional weight may be given to subjective evidence such as our projections for growth in this situation.
Uncertain Tax Positions
We are subject to taxation in the United States and various state jurisdictions. As of December 31, 2014, our tax years for 2011 through 2013 are subject to examination by the tax authorities. A rollforward of the gross unrecognized tax benefits is as follows:
| Unrecognized tax benefit, January 1, 2013 |
$ | 1,365 | ||
| Increase as a result of tax positions taken during the period |
891 | |||
| Decrease as a result of tax positions taken during the period |
(945 | ) | ||
|
|
|
|||
| Unrecognized tax benefit, December 31, 2013 |
1,311 | |||
| Increase as a result of tax positions taken during the period |
2,545 | |||
| Decrease as a result of tax positions taken during the period |
(1,039 | ) | ||
|
|
|
|||
| Unrecognized tax benefit, December 31, 2014 |
$ | 2,817 | ||
|
|
|
The amount of unrecognized tax benefits at December 31, 2014 that would affect the effective tax rate is $1,755. Interest expense and penalties accrued related to uncertain tax positions for the year ended December 31, 2014 are $215.
We expect a decrease to the amount of unrecognized tax benefits (exclusive of penalties and interest) within the next twelve months ranging from zero up to $1,669. This decrease relates to temporary items.
Determining uncertain tax positions and the related estimated amounts requires judgment and carries estimation risk. If future tax law changes or interpretations should come to light, or additional information should become known, our conclusions regarding unrecognized tax benefits may change.
NOTE 10 – RELATED PARTY TRANSACTIONS
In December 2012, we entered into a management services and fee agreement and made a payment of $4,300 for management fees to certain related parties for management services. Pursuant to this agreement, the board of directors annually determined whether a management fee would be paid as well as the amount of that fee. The agreement was terminated on October 22, 2013, and no such fees were paid in 2013.
We sell installation services to other companies related through common or affiliated ownership. We also purchase services and materials and pay rent to companies with common or related ownership. See Note 11, Commitments and Contingencies, for future minimum lease payments to be paid to these related parties.
67
Table of Contents
INSTALLED BUILDING PRODUCTS, INC.
NOTES TO CONSOLIDATED FINANCIAL STATEMENTS
(in thousands, except share amounts)
For the years ended December 31, 2014, 2013 and 2012, the amount of sales to common or related parties as well as the purchases from and rent expense paid to these common or related parties are as follows:
| Years ended December 31, | ||||||||||||
| 2014 | 2013 | 2012 | ||||||||||
| Sales |
$ | 6,026 | $ | 1,188 | $ | 1,689 | ||||||
| Purchases |
3,100 | 10,292 | 3,668 | |||||||||
| Rent |
600 | 671 | 288 | |||||||||
During the second quarter of 2014, we appointed a new member to our Board of Directors who is also the CEO of M/I Homes, Inc. (NYSE: MHO), one of our customers. As a result, we have included all sales to this customer in 2014 in the above table. We paid this director fees of $50 in the form of restricted stock awards and $25 in the form of cash compensation during the year ended December 31, 2014. See Note 8, Employee Benefits, Share-Based Compensation, for further information.
At December 31, 2014 and 2013, we had related party balances of $1,255 and $475, respectively, included in accounts receivable on our Consolidated Balance Sheets. Also at December 31, 2014, we had related party balances of $3 and $539, respectively, included in accounts payable on our Consolidated Balance Sheets. Included in these balances are trade amounts associated with various entities qualifying as related parties to us. M/I Homes, Inc. accounted for $627 of the total accounts receivable, related party balance as of December 31, 2014.
In December 2014, we entered into a share repurchase agreement with Cetus Capital II, LLC (“Cetus”) for the purchase of 300,000 shares of our common stock for an aggregate purchase price of $5,283. A member of our Board of Directors is affiliated with Cetus, thus classifying this as a transaction with a related party. See Note 7, Stockholder’s Equity (Deficit) and Redeemable Instruments, for more information on the share repurchase.
As a result of our acquisition of TCI Contracting, LLC (“TCI”) in 2012, one of our existing suppliers became classified as a related party until a change in ownership of the supplier resulted in an end to such classification during 2014. Prior to not being classified as a related party to us, purchases made from this supplier during the years ended December 31, 2014, 2013 and 2012 were $2,556, $10,126 and $743, respectively, and are included in total related party purchases in the preceding table.
One of our major stockholders guaranteed certain reimbursement obligations of ours under certain performance and licensing bonds issued by sureties on behalf of us in the ordinary course of business. These bonds have been replaced with bonds that do not require any guarantee. These obligations were not direct guarantees of us and were terminated as of January 2014.
The Company maintains a receivable from IBP Holding Company, Inc., related to us through direct control by Jeff Edwards, in the amount of approximately $600 as of December 31, 2014 and 2013. The receivable represents amounts owed to us for wages and related expenses paid by the Company during 2011 to former employees of IBP Holding Company, Inc. and is included in other current assets on the accompanying Consolidated Balance Sheets. We have received $215 of this receivable as of the date of filing of this Annual Report on Form 10-K.
68
Table of Contents
INSTALLED BUILDING PRODUCTS, INC.
NOTES TO CONSOLIDATED FINANCIAL STATEMENTS
(in thousands, except share amounts)
NOTE 11 – COMMITMENTS AND CONTINGENCIES
Leases
We are obligated under capital leases covering vehicles and certain equipment. Total assets relating to capital leases were $65,238 and $54,004 as of December 31, 2014 and 2013, respectively, and a total of $20,499 and $22,160 were fully depreciated as of December 31, 2014 and 2013, respectively. The vehicles and equipment leases generally have terms ranging from four to six years. The net book value of assets under capital leases was $28,754 and $23,623 as of December 31, 2014 and 2013, respectively, net of accumulated depreciation of $36,484 and $30,382, respectively. Amortization of assets held under capital leases is included with depreciation expense on the Consolidated Statements of Operations.
We also have several noncancellable operating leases, primarily for buildings, improvements, equipment, and certain vehicles. These leases generally contain renewal options for periods ranging from one to five years and require us to pay all executory costs such as property taxes, maintenance and insurance.
Future minimum lease payments under noncancellable operating leases (with initial or remaining lease terms in excess of one year) and future minimum capital lease payments as of December 31, 2014 are as follows:
| Capital Leases | Operating Leases | |||||||||||||||
| Related Party | Other | Total Operating | ||||||||||||||
| 2015 |
$ | 11,151 | $ | 434 | $ | 5,880 | $ | 6,314 | ||||||||
| 2016 |
8,747 | 356 | 4,794 | 5,150 | ||||||||||||
| 2017 |
5,768 | 150 | 2,994 | 3,144 | ||||||||||||
| 2018 |
3,334 | 83 | 1,236 | 1,319 | ||||||||||||
| 2019 |
1,869 | — | 951 | 951 | ||||||||||||
| Thereafter |
33 | — | 2,120 | 2,120 | ||||||||||||
|
|
|
|
|
|
|
|
|
|||||||||
| 30,902 | $ | 1,023 | $ | 17,975 | $ | 18,998 | ||||||||||
|
|
|
|
|
|
|
|||||||||||
| Less: Amounts representing executory costs |
(874 | ) | ||||||||||||||
| Less: Amounts representing interest |
(3,146 | ) | ||||||||||||||
|
|
|
|||||||||||||||
| Total obligation under capital leases |
26,882 | |||||||||||||||
| Less: Current portion of capital leases |
(9,374 | ) | ||||||||||||||
|
|
|
|||||||||||||||
| Long term capital lease obligation |
$ | 17,508 | ||||||||||||||
|
|
|
|||||||||||||||
Total rent expense under these operating leases for the years ended December 31, 2014, 2013 and 2012 was $7,871, $7,171 and $6,343, respectively, which is included in the Consolidated Statements of Operations as follows:
| Years ended December 31, | ||||||||||||
| 2014 | 2013 | 2012 | ||||||||||
| Cost of Sales |
$ | 733 | $ | 573 | $ | 435 | ||||||
| Selling |
34 | 32 | 113 | |||||||||
| Administrative |
7,104 | 6,566 | 5,795 | |||||||||
|
|
|
|
|
|
|
|||||||
| Total |
$ | 7,871 | $ | 7,171 | $ | 6,343 | ||||||
|
|
|
|
|
|
|
|||||||
69
Table of Contents
INSTALLED BUILDING PRODUCTS, INC.
NOTES TO CONSOLIDATED FINANCIAL STATEMENTS
(in thousands, except share amounts)
Supply Contract Commitments
As of December 31, 2014, we had two product supply contracts, one extending through December 31, 2015 and one extending through August 31, 2017. Our obligations for both contracts are based on quantity without a specific rate applied and therefore are not quantifiable. We expect our quantity purchases to exceed the minimum quantity commitments for all years covered by the contracts. Actual purchases made under the contracts for the years ended December 31, 2014 and 2013 were $53,084 and $25,884, respectively.
Other Commitments and Contingencies
A class action lawsuit was filed in February 2013 and an amended complaint was filed in May 2013 in the Superior Court of King County, Washington, involving Installed Building Products II, LLC, one of our subsidiaries, alleging violations of Washington State wage and hour laws for failure to pay prevailing and minimum wage and overtime wages. The plaintiffs were former insulation installers for Installed Building Products II, LLC in Washington who sought to represent all similarly situated workers. They sought all unpaid wages, along with litigation costs and fees.
A lawsuit was filed in July 2013 in federal court in the Middle District of Tennessee against one of our subsidiaries, TCI d/b/a Installed Building Products of Nashville, alleging unpaid overtime and failure to pay lawful wages under federal law and Tennessee common law and in unjust enrichment and in breach of an alleged contract. The named plaintiffs were former insulation installers in Nashville. The plaintiffs sought to have this case certified as a collective action under the Federal Fair Labor Standards Act and as a class action under Tennessee law. They sought reimbursement of the overtime wages for all time worked over forty hours each week, as well as liquidated damages and litigation costs and fees.
We recorded $1,407 of settlement expenses in the year ended December 31, 2013. Both lawsuits were settled in January 2014 and approved by the court by April 2014. Approximately $1,200 of this cost was recorded as an accrued expense included in other current liabilities on our Consolidated Balance Sheet as of December 31, 2013. All remaining expenses were paid during the year ended December 31, 2014 and therefore no accrued expense remained as of December 31 2014.
From time to time, various claims and litigation are asserted or commenced against us principally arising from contractual matters and personnel and employment disputes. In determining loss contingencies, management considers the likelihood of loss as well as the ability to reasonably estimate the amount of such loss or liability. An estimated loss is recorded when it is considered probable that such a liability has been incurred and when the amount of loss can be reasonably estimated. It is not certain that we will prevail in these matters. However, we do not believe that the ultimate outcome of any pending matters will have a material adverse effect on our consolidated financial position, results of operations or cash flows.
NOTE 12 – BUSINESS COMBINATIONS
As part of our ongoing strategy to increase market share in certain markets, we completed three business combinations during the year ended December 31, 2014, two business combinations during the year ended December 31, 2013 and two during the year ended December 31, 2012. The goodwill to be recognized in conjunction with these business combinations is attributable to expected synergies. Goodwill resulting from each acquisition is not expected to be deductible for tax purposes.
70
Table of Contents
INSTALLED BUILDING PRODUCTS, INC.
NOTES TO CONSOLIDATED FINANCIAL STATEMENTS
(in thousands, except share amounts)
2014
On March 24, 2014, we acquired 100% of the common stock of U.S. Insulation Corp. (“U.S. Insulation”), on August 11, 2014, we acquired 100% of the common stock of Marv’s Insulation, Inc. (“Marv’s Insulation”) and on November 10, 2014, we acquired substantially all of the assets of Installed Building Systems (“IBS”). The purchase price of our 2014 acquisitions, in aggregate, consisted of cash of $12,417 and seller obligations of $3,544. Purchase consideration related to 2014 business combinations is deemed to be preliminary in accordance with generally accepted accounting principles which allow for adjustments to acquired assets and liabilities for up to one year from the acquisition date. Revenue and net income, in aggregate, of these three entities since their dates of acquisition included in our Consolidated Statement of Operations for the year ended December 31, 2014 were $13,492 and $938, respectively.
2013
On March 16, 2013, we acquired 100% of the membership interests of Ace Insulation Contractors, Inc. (“Ace”) and on November 1, 2013 we acquired 100% of the membership interest of KMB Contracting Services, Inc. (“KMB”). The purchase price of our 2013 acquisitions consisted of cash of $1,181 and a seller obligation for $380. We combined Ace and KMB with existing branches upon acquisition and as such, we are unable to differentiate the results of operations between Ace, KMB, and the existing branches for the years ended December 31, 2014 and December 31, 2013.
2012
On August 31, 2012, we acquired 100% of the outstanding membership interest of TCI and 87.5% of the issued and outstanding capital stock of a subsidiary of TCI. Simultaneous with the purchase of TCI, we purchased the remaining 12.5% of issued and outstanding capital stock of the subsidiary for $571, which was paid in the form of a seller note. The purchase price consisted of 11.5% (or 2,533,908 shares, which is the number of shares after a 19.5-for-one stock split) of IBP common stock, which was valued at $4,100 at the date of the transaction. See Note 1, Organization, “2014 Initial Public Offering (IPO),” for further information on the stock split.
On November 16, 2012, we acquired 100% of the membership interest of Accurate Building Products Inc. The purchase price consisted of cash of $1,198 and a note for $80. Revenue and net loss for the two entities acquired in 2012 since their dates of acquisition in our Consolidated Statement of Operations for the year ended December 31, 2012 were $14,097 and $1,018, respectively.
71
Table of Contents
INSTALLED BUILDING PRODUCTS, INC.
NOTES TO CONSOLIDATED FINANCIAL STATEMENTS
(in thousands, except share amounts)
The estimated fair values of the assets acquired and liabilities assumed for the acquisitions approximated the following:
| 2014 | 2013 | 2012 | ||||||||||
| Cash |
$ | 53 | $ | — | $ | 375 | ||||||
| Accounts receivable |
4,666 | 213 | 5,486 | |||||||||
| Inventory |
1,315 | 68 | 2,548 | |||||||||
| Note receivable |
— | — | 171 | |||||||||
| Other current assets |
195 | 37 | 291 | |||||||||
| Property and equipment |
1,576 | 338 | 468 | |||||||||
| Intangibles |
7,111 | 1,332 | 5,513 | |||||||||
| Goodwill |
4,065 | 182 | 834 | |||||||||
| Accounts payable and accrued expenses |
(2,505 | ) | (609 | ) | (7,852 | ) | ||||||
| Deferred tax liability |
(515 | ) | — | (1,387 | ) | |||||||
| Long-term debt |
— | — | (498 | ) | ||||||||
|
|
|
|
|
|
|
|||||||
| Total purchase price |
$ | 15,961 | $ | 1,561 | $ | 5,949 | ||||||
|
|
|
|
|
|
|
|||||||
| Fair value of common stock issued |
$ | — | $ | — | $ | 4,100 | ||||||
| Seller obligations |
3,544 | 380 | 651 | |||||||||
| Cash paid |
12,417 | 1,181 | 1,198 | |||||||||
|
|
|
|
|
|
|
|||||||
| Total purchase price |
$ | 15,961 | $ | 1,561 | $ | 5,949 | ||||||
|
|
|
|
|
|
|
|||||||
Estimates of acquired intangible assets related to the acquisitions are as follows:
| 2014 | 2013 | 2012 | ||||||||||||||||||||||
| Acquired intangibles assets |
Estimated Fair Value |
Weighted Average Estimated Useful Life (yrs) |
Estimated Fair Value |
Weighted Average Estimated Useful Life (yrs) |
Estimated Fair Value |
Weighted Average Estimated Useful Life (yrs) |
||||||||||||||||||
| Customer relationships |
$ | 4,708 | 14 | $ | 972 | 10 | $ | 3,241 | 10 | |||||||||||||||
| Trademarks and trade names |
1,799 | 15 | 338 | 15 | 2,067 | 9 | ||||||||||||||||||
| Non-competition agreements |
604 | 5 | 22 | 5 | 205 | 3 | ||||||||||||||||||
Pro Forma Information (unaudited)
The unaudited pro forma information has been prepared as if the 2014 acquisitions had taken place on January 1, 2013, and the 2013 acquisitions had taken place on January 1, 2012. The unaudited pro forma information is not necessarily indicative of the results that we would have achieved had the transactions actually taken place on January 1, 2013 and 2012, and the unaudited pro forma information does not purport to be indicative of future financial operating results.
| Pro Forma for the years ended December 31, | ||||||||||||
| 2014 | 2013 | 2012 | ||||||||||
| Net revenue |
$ | 537,336 | $ | 459,195 | $ | 334,885 | ||||||
| Net income (loss) |
16,097 | 6,811 | (3,499 | ) | ||||||||
| Net (loss) income attributable to common stockholders |
(3,800 | ) | 588 | (9,028 | ) | |||||||
| Net (loss) income per share attributable to |
(0.13 | ) | 0.03 | (0.41 | ) | |||||||
72
Table of Contents
INSTALLED BUILDING PRODUCTS, INC.
NOTES TO CONSOLIDATED FINANCIAL STATEMENTS
(in thousands, except share amounts)
Unaudited pro forma net income (loss) has been calculated after adjusting our consolidated results to reflect additional intangible asset amortization expense of $435, $614 and $567 for the years ended December 31, 2014, 2013 and 2012, respectively.
NOTE 13 – DISCONTINUED OPERATIONS
During the year ended December 31, 2014, we did not discontinue operations in any of our markets. During the year ended December 31, 2013, we made the decision to close our branches in Oklahoma City, Oklahoma and Williston, North Dakota along with our distribution facility in Hebron, Ohio. During the year ended December 31, 2012, we made the decision to close our branches in Erie, Pennsylvania and Knoxville, Tennessee. We have presented the operations of these closed branches as discontinued operations in the Consolidated Statements of Operations for the years ended December 31, 2014, 2013 and 2012.
All closures made during the years ended December 31, 2013 and 2012 were made in order to optimize capital and resource allocations and enhance our financial position. We have no continuing involvement with or cash flows from the closed branches. Further, the customers associated with closed branches and other discontinued operations will not be served by other branches. A summary of operations we discontinued in these markets for the years ended December 31, 2014, 2013 and 2012 is as follows:
| Years ended December 31, | ||||||||||||
| 2014 | 2013 | 2012 | ||||||||||
| Net revenue |
$ | — | $ | 765 | $ | 4,020 | ||||||
| (Loss) income from discontinued operations, before income taxes |
(78 | ) | (960 | ) | 3,835 | |||||||
| Income tax benefit (expense) |
30 | 362 | (1,447 | ) | ||||||||
|
|
|
|
|
|
|
|||||||
| (Loss) income from discontinued operations, after tax |
$ | (48 | ) | $ | (598 | ) | $ | 2,388 | ||||
|
|
|
|
|
|
|
|||||||
For the year ended December 31, 2012, pre-tax net income from discontinued operations includes a gain of $4,500 relating to a payment received for a cancelled vendor contract at one of our closed operations.
NOTE 14 – (LOSS) INCOME PER COMMON SHARE
Basic net (loss) income per share is calculated by dividing net loss attributable to common stockholders by the weighted average shares outstanding during the period, without consideration for common stock equivalents.
Diluted net (loss) income per share is calculated by adjusting weighted average shares outstanding for the dilutive effect of common share equivalents outstanding for the period, determined using the treasury stock method. There were no common stock equivalents with a dilutive effect during the years ended December 31, 2014, 2013 and 2012 and therefore, basic and diluted net (loss) income per share were the same for all periods presented. Loss attributable to common stockholders includes the accretion of Redeemable Preferred Stock in 2014, 2013 and 2012.
NOTE 15 – SUBSEQUENT EVENTS
On February 12, 2015, we entered into a Master Equipment Lease Agreement (“Master Equipment Agreement”) with a lender to provide financing up to $4,000 for the purpose of purchasing or leasing vehicles and related service equipment used in the normal course of business. Vehicles and equipment purchased or leased under this Master Equipment Agreement serve as collateral for each note controlled by this financing arrangement. Each
73
Table of Contents
INSTALLED BUILDING PRODUCTS, INC.
NOTES TO CONSOLIDATED FINANCIAL STATEMENTS
(in thousands, except share amounts)
financing arrangement under this Master Equipment Agreement will serve as a separate note and obligation. Regular payments are due under each note at the time the obligation occurs for a period of 60 consecutive months. There was no balance outstanding thereunder at December 31, 2014.
On March 12, 2015, we acquired 100% of the stock and membership interests of nine branch locations, collectively referred to as BDI Insulation, for total consideration of approximately $36,000, subject to finalization of a working capital adjustment. The initial accounting for the business combination was not complete at the time the financial statements were issued due to the timing of the acquisition and the filing of our Annual Report on Form 10-K. As a result, disclosures required under ASC 805-10-50-2(h), Business Combinations, cannot be made at this time.
NOTE 16 – QUARTERLY FINANCIAL INFORMATION (UNAUDITED)
Summarized unaudited quarterly financial results for 2014 and 2013 is as follows:
| 2014 |
||||||||||||||||||||
| March 31 (a) | June 30 | September 30 | December 31 | Total Year | ||||||||||||||||
| Net revenue |
$ | 105,946 | $ | 126,348 | $ | 140,456 | $ | 145,270 | $ | 518,020 | ||||||||||
| Gross profit |
26,405 | 34,809 | 39,628 | 39,210 | 140,052 | |||||||||||||||
| Income from continuing operations |
401 | 2,327 | 6,196 | 5,056 | 13,980 | |||||||||||||||
| Net income |
373 | 2,307 | 6,196 | 5,056 | 13,932 | |||||||||||||||
| Net (loss) income attributable to common stockholders |
(19,524 | ) | 2,307 | 6,196 | 5,056 | (5,965 | ) | |||||||||||||
| Net (loss) income per share (basic and diluted): (Loss) income per share from continuing operations attributable to common stockholders |
$ | (0.75 | ) | $ | 0.08 | $ | 0.19 | $ | 0.16 | $ | (0.20 | ) | ||||||||
| (Loss) income per share attributable to common stockholders |
$ | (0.76 | ) | $ | 0.07 | $ | 0.19 | $ | 0.16 | $ | (0.20 | ) | ||||||||
| 2013 |
||||||||||||||||||||
| March 31 | June 30 | September 30 | December 31 | Total Year | ||||||||||||||||
| Net revenue |
$ | 91,962 | $ | 104,686 | $ | 115,951 | $ | 119,330 | $ | 431,929 | ||||||||||
| Gross profit |
22,274 | 26,255 | 29,949 | 31,210 | 109,688 | |||||||||||||||
| (Loss) income from continuing operations |
(243 | ) | 1,436 | 3,068 | 2,377 | 6,638 | ||||||||||||||
| Net (loss) income |
(530 | ) | 1,226 | 2,967 | 2,377 | 6,040 | ||||||||||||||
| Net (loss) income attributable to |
(2,017 | ) | (306 | ) | 1,389 | 751 | (183 | ) | ||||||||||||
| Net (loss) income per share (basic and diluted): (Loss) income per share from continuing operations attributable to common stockholder |
$ | (0.08 | ) | $ | — | $ | 0.07 | $ | 0.03 | $ | 0.02 | |||||||||
| (Loss) income per share attributable to common stockholders |
$ | (0.09 | ) | $ | (0.01 | ) | $ | 0.07 | $ | 0.03 | $ | (0.01 | ) | |||||||
| (a) | Net loss attributable to common stockholders for the quarter ended March 31, 2014 included $19,897 of accretion of Redeemable Preferred Stock to its redemption value at the time of our IPO. Prior to the redemption, we accounted for the difference between the carrying amount of the Redeemable Preferred Stock and the redemption amount by increasing the carrying amount for the periodic accretion which reduces net income to arrive at net loss attributable to common stockholders. |
74
Table of Contents
Earnings-per-share amounts are computed independently each quarter for net (loss) income from continuing operations, net (loss) income from discontinued operations and net loss attributable to common stockholders. As a result, the sum of each quarter’s per-share amount may not equal the total per-share amount for the respective year, and the sum of per-share amounts from continuing operations and discontinued operations may not equal the total per-share amounts for net loss attributable to common stockholders for the respective quarters.
| Item 9. | Changes in and Disagreements with Accountants on Accounting and Financial Disclosure |
Not applicable.
| Item 9A. | Controls and Procedures |
(a) Evaluation of Disclosure Controls and Procedures
We conducted an evaluation of our disclosure controls and procedures as of December 31, 2014 with the participation of the Chief Executive Officer (“CEO”) and Chief Financial Officer (“CFO”) as required by Exchange Act Rules 13a-15(e) and 15d-15(e). Based on that evaluation, our CEO and CFO concluded that our disclosure controls and procedures were effective as of December 31, 2014.
(b) Management’s Report on Internal Control over Financial Reporting
Management’s report on our internal control over financial reporting (as such term is defined in Rules 13a-15(f) and 15d-15(f) under the Exchange Act) is included in this Form 10-K under Item 8. Financial Statements and Supplementary Data, under the heading, “Management’s Report on Internal Control over Financial Reporting” and is incorporated herein by reference.
Although we were not required to and did not engage our independent registered public accounting firm to conduct an audit of our internal control over financial reporting in connection with the audits of our consolidated financial statements as of and for the years ended December 31, 2013 and 2012, our independent registered public accounting firm informed us that they identified a material weakness and significant deficiencies relating to our internal control over financial reporting under standards established by the PCAOB. The PCAOB defines a material weakness as a deficiency, or a combination of deficiencies in internal control over financial reporting such that there is a reasonable possibility that a material misstatement of the Company’s annual or interim financial statements will not be prevented or detected on a timely basis. The material weakness identified by our independent registered public accounting firms related to adjustments made in connection with their audits to our financial statements in the areas of income taxes, self-insurance reserves, stock-based compensation, accounts payable, discontinued operations, derivative accounting and lease accounting, and results primarily from insufficient personnel within our organization possessing an appropriate level of knowledge, experience and training with regard to complex transactions and technical accounting matters, particularly as they relate to public companies.
Throughout 2014, we implemented numerous improvements to internal controls over financial reporting to address the material weakness and significant deficiencies. These improvements included, but are not limited to, the following:
| • | Income taxes - we analyze certain tax provision calculations more frequently during the year and have retained additional personnel with expertise in this area, allowing for additional levels of review; |
| • | Self-insurance reserves - we have instituted a more thorough monthly review of our incurred but not reported (IBNR) reserve and hired an external actuarial firm to perform a semi-annual actuarial analysis of our insurance reserves; |
| • | Stock-based compensation - we have instituted policies and procedures by which the compensation committee of our board of directors, in coordination with management, has and will review and approve all future equity awards; |
75
Table of Contents
| • | Accounts payable, discontinued operations and lease accounting - we have revised our accounting policies and instituted additional monthly and quarterly review procedures; and |
| • | Derivative accounting - we have engaged an external accounting firm to assist us in identifying and properly accounting for derivative features when derivatives may exist. |
In addition, (i) we hired a Chief Accounting Officer, a Manager of Financial Reporting, an Accounts Payable Manager, and a Senior Tax Accountant, all of whom have public company financial experience; (ii) our Director of Internal Audit has created a structured Internal Audit function; (iii) we instituted a Sarbanes-Oxley Act compliance program that has strengthened our internal control over financial reporting; and (iv) we reorganized our audit committee to oversee all areas of internal audit and internal controls and maintain communication with independent auditors. In addition, under the direction of the audit committee of our board of directors, we have and will continue to develop and implement policies and procedures to improve the overall effectiveness of internal control over financial reporting. As we continue to evaluate and work to improve internal control over financial reporting, management may determine to take additional measures to address control deficiencies or determine to modify the remediation plan described above.
Based on the aforementioned evaluation of our disclosure controls and procedures as of December 31, 2014, with the participation of our CEO and CFO, including the remediation actions noted above, management concluded that the material weakness and significant deficiencies have been remediated and internal control over financial reporting was effective at December 31, 2014.
| (c) | Changes in Internal Control over Financial Reporting |
Other than the remediation efforts described above, there were no changes in our internal control over financial reporting identified in management’s evaluation pursuant to Rules 13a-15(d) or 15d-15(d) of the Exchange Act during the quarter ended December 31, 2014 that materially affected, or are reasonably likely to materially affect, our internal control over financial reporting.
| Item 9B. | Other Information |
Not Applicable.
| Item 10. | Directors, Executive Officers and Corporate Governance |
The information required by this item will be set forth under the headings “Election of Directors,” “Executive Officers,” “Corporate Governance” and “Section 16(a) Beneficial Ownership Reporting Compliance” in our definitive proxy statement for the 2015 Annual Meeting of Stockholders (“2015 Proxy Statement”) to be filed with the SEC within 120 days of the fiscal year ended December 31, 2014 and is incorporated herein by reference.
Our board of directors has adopted a code of business conduct and ethics that applies to all of our employees, officers and directors, including our Chief Executive Officer, Chief Financial Officer and other executive and senior financial officers. The full text of our code of business conduct and ethics is posted on the investor relations page on our website which is located at http://investors.installedbuildingproducts.com. We will post any amendments to our code of business conduct and ethics, or waivers of its requirements, on our website.
76
Table of Contents
| Item 11. | Executive Compensation |
The information required by this item will be set forth under the headings “Compensation of our Executive Officers and Directors” and “Compensation Committee Interlocks and Insider Participation” in our 2015 Proxy Statement and is incorporated herein by reference.
| Item 12. | Security Ownership of Certain Beneficial Owners and Management and Related Stockholder Matters |
The information required by this item will be set forth under the heading “Security Ownership of Certain Beneficial Owners and Management” in our 2015 Proxy Statement and is incorporated herein by reference.
| Item 13. | Certain Relationships and Related Transactions, and Director Independence |
The information required by this item will be set forth under the headings “Certain Relationships and Related Transactions” and “Corporate Governance” in our 2015 Proxy Statement and is incorporated herein by reference.
| Item 14. | Principal Accounting Fees and Services |
The information required by this item will be set forth under the heading “Independent Registered Public Accounting Firm Fees and Pre-Approval Policies and Procedures” in our 2015 Proxy Statement and is incorporated herein by reference.
| Item 15. | Exhibits and Financial Statement Schedule |
(a) The following documents are filed as a part of this Form 10-K:
| 1. | Financial Statements: The Consolidated Financial Statements, the Notes to Consolidated Financial Statements, and the Reports of Independent Registered Public Accounting Firm for Installed Building Products, Inc. are presented in Item 8, Financial Statements and Supplementary Data, of this Form 10-K. |
| 2. | Financial Schedules: All financial statement schedules have been omitted because they are inapplicable, not required, or shown in the consolidated financial statements and notes in Item 8, Financial Statements and Supplementary Data, of this Form 10-K. |
| 3. | Exhibits: A list of the exhibits required to be filed as part of this report is set forth in the Index to Exhibits and is incorporated by reference. |
(b) See Index to Exhibits.
77
Table of Contents
Pursuant to the requirements of Section 13 or 15(d) of the Securities Exchange Act of 1934, the registrant has duly caused this report to be signed on its behalf by the undersigned, thereunto duly authorized.
Date: March 13, 2015
| INSTALLED BUILDING PRODUCTS INC. | ||
| /s/ Jeffrey W. Edwards | ||
| By: | Jeffrey W. Edwards President and Chief Executive Officer | |
Pursuant to the requirements of the Securities Exchange Act of 1934, this report has been signed below by the following persons on behalf of the registrant and in the capacities and on the dates indicated.
| Signature |
Title |
Date | ||
| /s/ Jeffrey W. Edwards Jeffrey W. Edwards |
President, Chief Executive Officer and Chairman of the Board of Directors (Principal Executive Officer) |
March 13, 2015 | ||
| /s/ Michael T. Miller Michael T. Miller |
Executive Vice President, Chief Financial Officer and Director (Principal Financial Officer) |
March 13, 2015 | ||
| /s/ Todd R. Fry Todd R. Fry |
Chief Accounting Officer (Principal Accounting Officer) |
March 13, 2015 | ||
| /s/ Margot L. Carter Margot L. Carter |
Director | March 13, 2015 | ||
| /s/ Lawrence A. Hilsheimer Lawrence A. Hilsheimer |
Director | March 13, 2015 | ||
| /s/ Janet E. Jackson Janet E. Jackson |
Director | March 13, 2015 | ||
| /s/ J. Michael Nixon J. Michael Nixon |
Director | March 13, 2015 | ||
| /s/ Steven G. Raich Steven G. Raich |
Director | March 13, 2015 | ||
| /s/ Robert H. Schottenstein Robert H. Schottenstein |
Director | March 13, 2015 | ||
| /s/ Michael H. Thomas Michael H. Thomas |
Director | March 13, 2015 | ||
78
Table of Contents
INDEX TO EXHIBITS
Filed or Furnished With this Form 10-K for the Year Ended December 31, 2014
| Incorporation by Reference |
||||||||||||
| Exhibit |
Description |
Form |
File No. |
Exhibit(s) |
Filing Date |
Filed or | ||||||
| 3.1 | Second Amended and Restated Certificate of Incorporation of Installed Building Products, Inc. | 8-K | 001-36307 | 3.1 | 02/25/2014 | |||||||
| 3.2 | Amended and Restated Bylaws of Installed Building Products, Inc. | S-1 Amend. No. 2 | 333-193247 | 3.4 | 02/03/2014 | |||||||
| 4.1 | Form of Common Stock Certificate of Installed Building Products, Inc. | S-1 Amend. No. 1 | 333-193247 | 4.1 | 01/27/2014 | |||||||
| 4.2 | Rights Agreement, dated as of November 4, 2011, by and among OCM IBP Holdings, Inc., CCIB Holdco, Inc. and Cetus Capital II, LLC. | S-1 | 333-193247 | 4.2 | 01/09/2014 | |||||||
| 4.3 | Recapitalization and Exchange Agreement by and between CCIB Holdco, Inc. and Cetus Capital II, LLC, dated as of November 4, 2011. | S-1 Amend. No. 1 | 333-193247 | 4.7 | 01/27/2014 | |||||||
| 4.4 | Registration Rights Agreement dated as of November 6, 2013 by and among Installed Building Products, Inc., Cetus Capital II, LLC, IBP Investment Holdings, LLC, IBP Management Holdings, LLC and TCI Holdings, LLC. | S-1 | 333-193247 | 4.3 | 01/09/2014 | |||||||
| 4.5 | Amendment No. 1 to the Recapitalization and Exchange Agreement, dated as of January 27, 2014. | S-1 Amend. No. 1 | 333-193247 | 4.8 | 01/27/2014 | |||||||
| 10.1 | Contribution and Exchange Agreement, dated as of November 4, 2011, by and among CCIB Holdco, Inc., IBHL A Holding Company, Inc., IBHL B Holding Company, Inc. and IBP Holdings, LLC. | S-1 | 333-193247 | 10.12 | 01/09/2014 | |||||||
| 10.2 | Membership Interest Purchase Agreement, dated as of August 31, 2012, by and among Installed Building Products, LLC, CCIB Holdco, Inc., and GNV Holdings, LLC (now known as TCI Holdings, LLC). | S-1 | 333-193247 | 10.13 | 01/09/2014 | |||||||
79
Table of Contents
| Incorporation by Reference |
||||||||||||
| Exhibit |
Description |
Form |
File No. |
Exhibit(s) |
Filing Date |
Filed or | ||||||
| 10.3 | Management Services and Fee Agreement, dated as of December 18, 2012, among Littlejohn Managers, LLC, Jeff Edwards, IBP Holding Company, GNV Holdings, LLC (now known as TCI Holdings, LLC) and CCIB Holdco, Inc.# | S-1 | 333-193247 | 10.14 | 01/09/2014 | |||||||
| 10.4 | Termination of Management Services and Fee Agreement, dated November 22, 2013.# | S-1 | 333-193247 | 10.5 | 01/09/2014 | |||||||
| 10.5 | Loan and Security Agreement with Bank of America, N.A., dated as of November 4, 2011. | S-1 | 333-193247 | 10.2 | 01/09/2014 | |||||||
| 10.6 | First Amendment to Loan and Security Agreement with Bank of America, N.A., dated as of April 20, 2012. | S-1 | 333-193247 | 10.3 | 01/09/2014 | |||||||
| 10.7 | Second Amendment to Loan and Security Agreement with Bank of America, N.A., dated as of August 31, 2012. | S-1 | 333-193247 | 10.4 | 01/09/2014 | |||||||
| 10.8 | Third Amendment to Loan and Security Agreement with Bank of America, N.A., dated as of October 22, 2012. | S-1 | 333-193247 | 10.5 | 01/09/2014 | |||||||
| 10.9 | Fourth Amendment to Loan and Security Agreement with Bank of America, N.A., dated as of December 21, 2012. | S-1 | 333-193247 | 10.6 | 01/09/2014 | |||||||
| 10.10 | Fifth Amendment to Loan and Security Agreement with Bank of America, N.A., dated as of July 30, 2013. | S-1 | 333-193247 | 10.7 | 01/09/2014 | |||||||
| 10.11 | Sixth Amendment to Loan and Security Agreement with Bank of America, N.A., dated as of January 27, 2014. | S-1 Amend. No. 2 | 333-193247 | 10.22 | 02/03/2014 | |||||||
| 10.12 | Form of Indemnification Agreement for directors and officers.# | S-1 Amend. No. 1 | 333-193247 | 10.1 | 01/27/2014 | |||||||
| 10.13 | Employment Agreement, dated as of November 1, 2013, by and between Installed Building Products, Inc. and Jeff Edwards.# | S-1 | 333-193247 | 10.20 | 01/09/2014 | |||||||
| 10.14 | Installed Building Products, Inc. 2014 Omnibus Incentive Plan.# | S-1 Amend. No. 1 | 333-193247 | 10.21 | 01/27/2014 | |||||||
80
Table of Contents
| Incorporation by Reference |
||||||||||||
| Exhibit |
Description |
Form |
File No. |
Exhibit(s) |
Filing Date |
Filed or | ||||||
| 10.15 | Credit and Security Agreement dated, July 8, 2014, by and between Installed Building Products, Inc. and the lenders party thereto, and KeyBank National Association, as lead arranger, sole book runner, administrative agent, swing line lender and issuing lender. | 8-K | 001-36307 | 10.1 | 7/10/2014 | |||||||
| 10.16 | Pledge Agreement, dated July 8, 2014, by Installed Building Products, Inc. in favor of KeyBank National Association, as administrative agent, under the Credit and Security Agreement dated July 8, 2014. | 8-K | 001-36307 | 10.2 | 7/10/2014 | |||||||
| 10.17 | Security Agreement, dated July 8, 2014, by each domestic subsidiary as defined in the Credit and Security Agreement dated July 8, 2014, in favor of KeyBank National Association, as administrative agent, under the Credit and Security Agreement dated July 8, 2014. | 8-K | 001-36307 | 10.3 | 7/10/2014 | |||||||
| 10.18 | Share Repurchase Agreement, dated December 11, 2014, by and between Installed Building Products, Inc. and Cetus Capital II, LLC. | 8-K | 001-36307 | 10.1 | 12/12/2014 | |||||||
| 10.19 | First Amendment Agreement, dated December 10, 2014, to the Credit and Security Agreement dated July 8, 2014, by and among Installed Building Products, Inc., the lenders party thereto, and KeyBank National Association, as lead arranger, sole book runner, administrative agent, swing line lender and issuing lender. | 8-K | 001-36307 | 10.1 | 12/16/2014 | |||||||
| 10.20 | Form of Restricted Stock Agreement.# | 10-Q | 001-36307 | 10.1 | 5/14/2014 | |||||||
| 10.21 | Form of Performance Share Award Agreement.# | 10-Q | 001-36307 | 10.4 | 8/13/2014 | |||||||
| 10.22 | Form of Restricted Stock Agreement for Employees.# | X | ||||||||||
| 21.1 | List of Subsidiaries of Installed Building Products, Inc. | X | ||||||||||
| 23.1 | Consent of Deloitte & Touche LLP. | X | ||||||||||
| 31.1 | CEO Certification pursuant to Exchange Act Rule 13a-14(a), as adopted pursuant to Section 302 of the Sarbanes-Oxley Act of 2002. | X | ||||||||||
81
Table of Contents
| Incorporation by Reference |
||||||||||||
| Exhibit |
Description |
Form |
File No. |
Exhibit(s) |
Filing Date |
Filed or | ||||||
| 31.2 | CFO Certification pursuant to Exchange Act Rule 13a-14(a), as adopted pursuant to Section 302 of the Sarbanes-Oxley Act of 2002. | X | ||||||||||
| 32.1 | CEO Certification pursuant to 18 U.S.C. Section 1350, as adopted pursuant to Section 906 of the Sarbanes-Oxley Act of 2002. | X | ||||||||||
| 32.2 | CFO Certification pursuant to 18 U.S.C. Section 1350, as adopted pursuant to Section 906 of the Sarbanes-Oxley Act of 2002. | X | ||||||||||
| 101 | Interactive Data File | X | ||||||||||
| # | Indicates management contract or compensatory plan. |
82