Attached files
| file | filename |
|---|---|
| EX-21.1 - EX-21.1 - CYNOSURE INC | d849220dex211.htm |
| EX-32.2 - EX-32.2 - CYNOSURE INC | d849220dex322.htm |
| EX-23.1 - EX-23.1 - CYNOSURE INC | d849220dex231.htm |
| EX-31.2 - EX-31.2 - CYNOSURE INC | d849220dex312.htm |
| EX-31.1 - EX-31.1 - CYNOSURE INC | d849220dex311.htm |
| EX-32.1 - EX-32.1 - CYNOSURE INC | d849220dex321.htm |
| EX-10.21 - EX-10.21 - CYNOSURE INC | d849220dex1021.htm |
| EX-10.10 - EX-10.10 - CYNOSURE INC | d849220dex1010.htm |
| EXCEL - IDEA: XBRL DOCUMENT - CYNOSURE INC | Financial_Report.xls |
| EX-10.16 - EX-10.16 - CYNOSURE INC | d849220dex1016.htm |
Table of Contents
UNITED STATES
SECURITIES AND EXCHANGE COMMISSION
Washington, D.C. 20549
Form 10-K
(Mark One)
| x | ANNUAL REPORT PURSUANT TO SECTION 13 OR 15(d) OF THE SECURITIES EXCHANGE ACT OF 1934 |
For the fiscal year ended December 31, 2014
OR
| ¨ | TRANSITION REPORT PURSUANT TO SECTION 13 OR 15(d) OF THE SECURITIES EXCHANGE ACT OF 1934 |
For the transition period from to
Commission file number 000-51623
Cynosure, Inc.
(Exact name of registrant as specified in its charter)
| Delaware | 04-3125110 | |
| (State or other jurisdiction of incorporation or organization) |
(I.R.S. Employer Identification No.) | |
| 5 Carlisle Road Westford, MA |
01886 | |
| (Address of principal executive offices) | (Zip Code) |
Registrant’s telephone number, including area code
(978) 256-4200
Securities registered pursuant to Section 12(b) of the Act:
| Title of each class |
Name of each exchange on which registered | |
| Class A Common Stock, $0.001 par value | The Nasdaq Global Market |
Securities registered pursuant to Section 12(g) of the Act:
None
Indicate by check mark if the registrant is a well-known seasoned issuer, as defined in Rule 405 of the Securities Act. Yes ¨ No x
Indicate by check mark if the registrant is not required to file reports pursuant to Section 13 or Section 15(d) of the Act. Yes ¨ No x
Indicate by check mark whether the registrant (1) has filed all reports required to be filed by Section 13 or 15(d) of the Securities Exchange Act of 1934 during the preceding 12 months (or for such shorter period that the registrant was required to file such reports), and (2) has been subject to such filing requirements for the past 90 days. Yes x No ¨
Indicate by check mark whether the registrant has submitted electronically and posted on its corporate website, if any, every Interactive Data File required to be submitted and posted pursuant to Rule 405 of Regulation S-T (§232.405 of this chapter) during the preceding 12 months (or for such shorter period that the registrant was required to submit and post such files). x Yes ¨ No
Indicate by check mark if disclosure of delinquent filers pursuant to Item 405 of Regulation S-K (§229.405) is not contained herein, and will not be contained, to the best of registrant’s knowledge, in definitive proxy or information statements incorporated by reference in Part III of this Form 10-K or any amendment to this Form 10-K. x
Indicate by check mark whether the registrant is a large accelerated filer, an accelerated filer, a non-accelerated filer, or a smaller reporting company. See definitions of “large accelerated filer,” “accelerated filer” and “smaller reporting company” in Rule 12b-2 of the Exchange Act. (Check one):
| Large accelerated filer ¨ | Accelerated filer | x | Non-accelerated filer | ¨ | Smaller reporting company | ¨ | ||||||
| (Do not check if a smaller reporting company) | ||||||||||||
Indicate by check mark whether the registrant is a shell company (as defined in Rule 12b-2 of the Exchange Act). Yes ¨ No x
Aggregate market value of the voting and non-voting common equity held by non-affiliates of the registrant, based on the last sale price for such stock on June 30, 2014: $464,892,455.
The number of shares outstanding of the registrant’s Class A common stock, as of March 9, 2015 was 21,732,279.
Portions of the registrant’s definitive Proxy Statement for its 2015 Annual Meeting of Stockholders are incorporated by reference into Part III of this Annual Report on Form 10-K.
Table of Contents
| PART I | ||||||
| Item 1. |
4 | |||||
| Item 1A. |
26 | |||||
| Item 1B. |
40 | |||||
| Item 2. |
40 | |||||
| Item 3. |
40 | |||||
| Item 4. |
44 | |||||
| PART II | ||||||
| Item 5. |
45 | |||||
| Item 6. |
47 | |||||
| Item 7. |
Management’s Discussion and Analysis of Financial Condition and Results of Operations |
49 | ||||
| Item 7A. |
66 | |||||
| Item 8. |
67 | |||||
| Item 9. |
Changes in and Disagreements With Accountants on Accounting and Financial Disclosure |
67 | ||||
| Item 9A. |
67 | |||||
| Item 9B. |
70 | |||||
| PART III | ||||||
| Item 10. |
71 | |||||
| Item 11. |
71 | |||||
| Item 12. |
Security Ownership of Certain Beneficial Owners and Management and Related Stockholder Matters |
71 | ||||
| Item 13. |
Certain Relationships and Related Transactions, and Director Independence |
71 | ||||
| Item 14. |
71 | |||||
| PART IV | ||||||
| Item 15. |
72 | |||||
| 73 | ||||||
2
Table of Contents
FORWARD-LOOKING STATEMENTS
This Annual Report on Form 10-K, which we refer to as this Annual Report, contains forward-looking statements that involve substantial risks and uncertainties. All statements, other than statements of historical facts, included in this Annual Report regarding our strategy, future operations, future financial position, future revenues, projected costs, prospects, plans, objectives of management and expected market growth are forward-looking statements. The words “anticipate,” “believe,” “estimate,” “expect,” “intend,” “may,” “plan,” “predict,” “project,” “will,” “would” and similar expressions are intended to identify forward-looking statements, although not all forward-looking statements contain these identifying words. These forward-looking statements include, among other things, statements about:
| • | our ability to identify and penetrate new markets for our products and technology; |
| • | our strategy of growing through acquisitions; |
| • | our ability to innovate, develop and commercialize new products; |
| • | our ability to obtain and maintain regulatory clearances; |
| • | our sales and marketing capabilities and strategy in the United States and internationally; |
| • | our intellectual property portfolio; and |
| • | our estimates regarding expenses, future revenues, capital requirements and needs for additional financing. |
We may not actually achieve the plans, intentions or expectations disclosed in our forward-looking statements, and you should not place undue reliance on our forward-looking statements. Actual results or events could differ materially from the plans, intentions and expectations disclosed in the forward-looking statements we make. We have included important factors in the cautionary statements included in this Annual Report, particularly in Item 1A of this Annual Report, and in our other public filings with the Securities and Exchange Commission, or the SEC, that could cause actual results or events to differ materially from the forward-looking statements that we make.
You should read this Annual Report and the documents that we have filed as exhibits to this Annual Report completely and with the understanding that our actual future results may be materially different from what we expect. It is routine for internal projections and expectations to change as the year or each quarter in the year progresses, and therefore it should be clearly understood that the internal projections and beliefs upon which we base our expectations are made as of the date of this Annual Report and may change prior to the end of each quarter or the year. While we may elect to update forward-looking statements at some point in the future, we do not undertake any obligation to update any forward-looking statements whether as a result of new information, future events or otherwise, except as required by law.
3
Table of Contents
PART I
| Item 1. | Business |
Overview
We develop and market aesthetic treatment systems that enable plastic surgeons, dermatologists and other medical practitioners to perform non-invasive and minimally invasive procedures to remove hair, treat vascular and benign pigmented lesions, remove multi-colored tattoos, revitalize the skin, liquefy and remove unwanted fat through laser lipolysis, reduce cellulite, clear nails infected by toe fungus, ablate sweat glands and improve vaginal health. We also market radiofrequency, or RF, energy sourced medical devices for precision surgical applications such as facial plastic and general surgery; gynecology; ear, nose; and throat procedures; ophthalmology; oral and maxillofacial surgery; podiatry and proctology. We sell our products through a direct sales force in the United States, Canada, Mexico, France, Morocco, Germany, Spain, the United Kingdom, Australia, China, Japan and Korea and through international distributors in approximately 120 other countries.
Our product portfolio utilizes a broad range of energy sources including Alexandrite, diode, Nd: YAG, pulse dye, Q-switched lasers, intense pulsed light and RF technology. We offer single energy source systems as well as workstations that incorporate two or more different types of lasers or pulsed light technologies. We offer multiple technologies and system alternatives at a variety of price points depending primarily on the number and type of energy sources included in the system. Our products are designed to be easily upgradeable to add additional energy sources and handpieces, which provide our customers with technological flexibility as they expand their practices.
We have a two-pronged business strategy: launching innovative new products and technologies for high-growth aesthetic applications developed through internal research and development and expanding our product offerings through acquisitions of complementary businesses and significant partnerships. Recent key innovations and acquisitions and significant partnerships have included:
| • | Picosecond Technology Platform. In 2013, we commenced commercialization of our PicoSure® system, our picosecond laser technology platform for the treatment of tattoos and benign pigmented lesions. The PicoSure system is the first commercially available picosecond Alexandrite aesthetic laser platform. Picosecond lasers deliver pulses that are measured in trillionths of a second, in contrast with nanosecond technology, such as our MedLite® and RevLite™ products, which deliver pulses in billionths of a second. We received U.S. Food and Drug Administration, or FDA, clearance to market the PicoSure laser in November 2012. In October 2013, we launched the PicoSure FOCUS Lens Array which microscopically concentrates the PicoSure laser pulse to a precise depth and exposes less than 10% of the skin to areas of high fluence while the surrounding skin is exposed to low background fluence. We received marketing authorization for our PicoSure system in Canada in July 2013, in Australia in November 2013, and in Korea and Taiwan in January 2014. In July 2014, we received FDA clearance to market PicoSure for the treatment of acne scars. In September 2014, we received FDA clearance to market PicoSure with PicoSure FOCUS Lens Array for the treatment of wrinkles. In February 2015, we received FDA clearance to market the 532 nm wavelength for PicoSure designed to more effectively treat red, yellow and orange tattoo ink colors, which we will offer as an upgrade to our current PicoSure customer base. |
| • | Establishment of Minimally Invasive Product Line. Since 2006, we have offered the SmartLipo® workstation, a minimally invasive aesthetic treatment system. |
| • | The SmartLipo system was the first FDA-cleared laser lipolysis system for use in a minimally invasive procedure for the removal of unwanted fat. Since the launch of the SmartLipo system, we have introduced two new workstations: the SmartLipo MPX workstation, which added a second wavelength laser, and the SmartLipo Triplex workstation, which added a third wavelength laser. The MPX or MultiPlex™ technology enables the energy from two lasers to be blended during |
4
Table of Contents
| delivery by quickly following a pulse of energy from one laser with a pulse of energy from another laser. We have provided further innovation in this area with the introduction of the SmartSense™ and ThermaGuide™, our proprietary intelligent delivery systems. In 2013, we launched PrecisionTx™ technology for minimally invasive removal of fat in small areas such as the neck and jawline as well as ablation of axillary sweat glands. |
| • | In 2012, we received FDA clearance in the United States to sell and market our Cellulaze® system, the world’s first FDA-cleared minimally invasive aesthetic laser device for the treatment of cellulite. In 2014, we received additional international clearances for our Cellulaze system in Argentina, Mexico and Taiwan. |
| • | Ellman Acquisition. In September 2014, we diversified our technology base by acquiring substantially all of the assets of Ellman International, Inc., which we refer to as Ellman, a leading provider of advanced RF technology for precision surgical and aesthetic procedures. Ellman also offers a line of aesthetic lasers. |
| • | Palomar Acquisition. In June 2013, we acquired Palomar Medical Technologies, Inc., which we refer to as Palomar. The Palomar acquisition complemented and broadened our product lineup adding the Icon® aesthetic system, which provides a comprehensive suite of the most popular treatments from hair removal to wrinkle reduction to scar and stretch mark treatment, the StarLux® laser and pulsed light system for hair removal, skin resurfacing and skin rejuvenation, and the Vectus® diode laser for high volume hair removal. |
| • | Elemé Acquisition. In 2011, we expanded our body shaping treatment platform by acquiring substantially all of the assets of Elemé Medical, including the non-invasive SmoothShapes® XV system. |
| • | ConBio Acquisition. In 2011, we also acquired substantially all of the assets of HOYA ConBio’s aesthetic laser business, including the MedLite C6 and RevLite systems for the treatment of wrinkles, acne scars, multi-color tattoos and vascular lesions, and overall skin rejuvenation. |
| • | Significant Partnerships. We have entered into several distribution arrangements expanding and complementing our product portfolio, including the following: |
| • | MonaLisa Touch. In November 2014, we entered into an exclusive distribution agreement with El.En. S.p.A., or El.En., to market and distribute the MonaLisa Touch product line in North America, a carbon dioxide laser for the treatment of vaginal atrophy, a condition that affects primarily postmenopausal women, breast cancer survivors and women who have undergone hysterectomies. The device received marketing clearance from the FDA in September 2014. |
| • | Home Use Device. In 2012, we received FDA clearance in the United States to market an at-home device for the treatment of wrinkles developed by us in partnership with Unilever. Unilever is expanding the retail distribution for the product in North America and Europe. |
| • | In 2011, we expanded into the onychomycosis market by acquiring worldwide exclusive rights from NuvoLase to distribute the PinPointe™ FootLaser™, which uses laser light to kill the fungus that lies in and under the nail that causes onychomycosis without damaging the nail or the surrounding skin. In February 2014, we changed our distribution rights from exclusive to non-exclusive for the PinPointe FootLaser. |
We offer the following flagship products (we use the term “flagship products” to refer to our leading products for a particular application):
| • | our Elite product line for hair removal and treatment of facial and leg veins and pigmentations; |
| • | our SmartLipo product line for LaserBodySculpting for the removal of unwanted fat; |
| • | our Cellulaze product line for the treatment of cellulite; |
| • | our Affirm/SmartSkin product line for anti-aging applications, including treatments for wrinkles, skin texture, skin discoloration and skin tightening; |
5
Table of Contents
| • | our Cynergy product line for the treatment of vascular lesions; |
| • | our Accolade, MedLite C6 and RevLite product lines for the removal of benign pigmented lesions, as well as multi-colored tattoos; |
| • | our PicoSure product line for the treatment of tattoos, benign pigmented lesions, acne scars, fine lines and wrinkles; |
| • | our Icon aesthetic system for hair removal, wrinkle reduction and scar and stretch mark treatment; |
| • | our Vectus diode laser for high volume hair removal. |
We have established ourselves as a leading provider of laser and light-based energy systems used for aesthetic treatment procedures. We plan to continue to enhance our existing product offerings and increase the leverage of our global distribution network through both internal research and development and the acquisition of complementary businesses, products or technologies, which may include small and substantial acquisitions, as well as joint ventures and other collaborative projects. We believe we have a disciplined acquisition strategy that focuses on complementary product offerings, integrated distribution networks, return on investment and other strategic benefits, and at any time we may be evaluating or in various stages of discussions with potential acquisition candidates. We also have a comprehensive post-acquisition strategic plan to facilitate the integration of companies and product lines that we may acquire.
Corporate Information
We were incorporated under the laws of the State of Delaware in July 1991. Our principal executive offices are located at 5 Carlisle Road, Westford, Massachusetts 01886, and our telephone number is (978) 256-4200. We are subject to the informational requirements of the Securities Exchange Act of 1934, as amended, and accordingly, file reports, proxy statements and other information with the SEC. Such reports, proxy statements and other information can be read and copied at the public reference facilities maintained by the SEC at the Public Reference Room, 100 F Street, NE, Room 1580, Washington, D.C. 20549. Information regarding the operation of the Public Reference Room may be obtained by calling the SEC at 1-800-SEC-0330. The SEC maintains a website (http://www.sec.gov) that contains material regarding issuers that file electronically with the SEC.
Our website address is www.cynosure.com and is included herein as an inactive textual reference only. The information on our website is not a part of this Annual Report. We make available free of charge on our website our Annual Reports on Form 10-K, Quarterly Reports on Form 10-Q, Current Reports on Form 8-K and amendments to those reports filed or furnished pursuant to Section 13(a) or 15(d) of the Securities Exchange Act of 1934, as amended, as soon as reasonably practicable after we electronically file such material with, or furnish it to, the SEC.
Industry
Aesthetic Market Opportunity
Medical Insight, an independent industry research and analysis firm, estimated that in 2014 total sales of products in the global aesthetic market exceeded $6 billion. Medical Insight believes that total sales of products in the global aesthetic market will increase 12.1% annually through 2019.
Key factors affecting growth rates in the markets for aesthetic treatment procedures and aesthetic laser equipment include:
| • | improvements in overall economic conditions and an expanding physician base; |
| • | the aging population of industrialized countries and the amount of discretionary income of the “baby boomer” demographic segment; |
6
Table of Contents
| • | greater anticipated growth in Asian markets; |
| • | the desire of many individuals to improve their appearance; |
| • | the development of technology that allows for safe and effective aesthetic treatment procedures as well as advances in treatable conditions; |
| • | the impact of managed care and reimbursement on physician economics, which has motivated physicians to establish or seek to expand their elective aesthetic practices with procedures that are paid for directly by patients; and |
| • | reductions in cost per procedure, which has attracted a broader base of clients and patients for aesthetic treatment procedures. |
Non-Traditional Physician Customers
Aesthetic treatment procedures that use lasers and other light-based equipment have traditionally been performed by dermatologists and plastic surgeons. Based on published membership information from professional medical organizations, there are approximately 19,000 dermatologists and plastic surgeons in the United States. A broader group of physicians in the United States, including primary care physicians, obstetricians and gynecologists, have incorporated aesthetic treatment procedures into their practices. These non-traditional physician customers are largely motivated to offer aesthetic procedures by the potential for a reliable revenue stream that is unaffected by managed care and government payor reimbursement economics. We believe that there are approximately 100,000 of these potential non-traditional physician customers in the United States and Canada, representing a significant market opportunity to be addressed by suppliers of lasers and other light-based aesthetic equipment. Some physicians are electing to open medical spas, often adjacent to their conventional office space, where they perform aesthetic procedures in an environment designed to feel less like a health care facility.
The Structure of Skin and Conditions that Affect Appearance
The human skin consists of several layers. The epidermis is the outer layer and contains the cells that determine pigmentation, or skin color. The dermis is a thicker inner layer that contains hair follicles and large and small blood vessels. Beneath the dermis is a layer that contains subdermal fat. The dermis is composed of mostly collagen, which provides strength and flexibility to the skin.
The appearance of the skin may change over time due to a variety of factors, including age, sun damage, circulatory changes, deterioration of collagen and the human body’s diminished ability to repair and renew itself. These changes include:
| • | unwanted hair growth; |
| • | uneven pigmentation; |
| • | wrinkles; |
| • | blood vessels and veins that are visible at the skin’s surface; |
| • | the appearance of cellulite and fat deposits; and |
| • | scarring. |
Changes to the skin caused by pigmentation are called pigmented lesions and are the result of the accumulation of excess melanin, the substance that gives skin its color. Pigmented lesions are characterized by the brown color of melanin and include freckles, solar lentigines, also known as sun spots or age spots, and café au lait birthmarks. Changes to the skin caused by abnormally large or numerous blood vessels located under the surface of the skin are called vascular lesions. Vascular lesions are characterized by blood vessels that are visible
7
Table of Contents
through the skin or that result in a red appearance of the skin. Vascular lesions may be superficial and shallow in the skin or deep in the skin. Shallow vascular lesions include small spider veins, port wine birthmarks, facial veins and rosacea, a chronic skin condition that causes rosy coloration and acne-like pimples on the face. Deep vascular lesions include large spider veins and leg veins.
People with undesirable skin conditions, unwanted hair growth or tattoos often seek aesthetic treatments, including treatments using non-invasive or minimally-invasive laser and light-based technologies.
Laser and Light-Based Aesthetic Treatments
A laser is a device that creates and amplifies a coherent beam of light generally of one wavelength or a narrow band of wavelengths. Lasers have been used for medical and aesthetic applications since the 1960s. Intense pulsed light technology was introduced in the 1990s and uses flashlamps, rather than lasers, to generate incoherent light of multiple wavelengths, often referred to as a broadband of wavelengths. Both lasers and intense pulsed light devices can emit high energy light over varying pulse durations or time intervals.
By producing intense bursts of concentrated light, lasers and other light-based technologies selectively target melanin in hair follicles and pigmented lesions, hemoglobin in blood vessels and vascular lesions, water surrounding collagen in or below the dermis, ink in tattoos or fat tissue below the dermis. When the target absorbs sufficient energy, it becomes heated and/or mechanically disrupted to cause a biological reaction useful for treatment. The degree to which energy is absorbed in the skin depends upon the skin structure targeted—e.g., hair follicle or blood vessel—and the skin type—e.g., light or dark. Different types of lasers and other light-based technologies are needed to effectively treat the spectrum of skin types and conditions. As a result, an active aesthetic practice may require multiple laser or other light-based systems in order to offer treatments to its entire client base.
Different types of lasers are currently used for a wide range of aesthetic treatments. Each type of laser operates at its own wavelength, measured in nanometers, which corresponds to a particular emission and color in the light spectrum. The most common lasers used for non-invasive aesthetic treatments are:
| • | Pulse dye lasers—may produce light of various wavelengths; our pulse dye laser produces an orange light that functions at a shallow penetration depth. |
| • | Alexandrite lasers—produce a near infrared invisible light that functions with high power at a deep penetration depth. |
| • | CO2 lasers—produce infrared invisible light that creates a deep ablation region. |
| • | Diode lasers—may produce light of various wavelengths; our diode lasers produce near infrared invisible light that functions at a deep penetration depth. |
| • | Erbium: glass lasers—produce a near infrared invisible light that functions at a deep penetration depth. |
| • | Er:YAG lasers—produce a near infrared invisible light that creates a shallow ablation region. |
| • | Nd:YAG lasers—produce a near infrared invisible light that functions over a wide range of penetration depths or when frequency doubled produce a green light that functions at a shallow penetration depth. |
In addition to selecting the appropriate wavelength for a particular application, laser and other light-based treatments require an appropriate balance among three other parameters to optimize safety and effectiveness for aesthetic treatments:
| • | energy level—the amount of light emitted to heat the target; |
| • | pulse duration—the time interval over which the energy is delivered; and |
| • | spot size—the diameter of the energy beam. |
8
Table of Contents
As a result of the wide variety of aesthetic treatments, patient skin types and users of technology, customer purchasing objectives for aesthetic treatment systems are diverse. We believe that as aesthetic spas and non-traditional physician customers play increasingly important roles as purchasers of aesthetic treatment systems, the market for these products will become even more diverse. Specifically, we expect that owners of different types of aesthetic treatment practices will place different emphases on various system attributes, such as breadth of treatment applications, return on investment, upgradeability and price. Accordingly, we believe that there is significant market opportunity for a company that tailors its product offerings to meet the needs of a wide range of market segments.
Our Solution
We offer tailored customer solutions to address the market for non-invasive and minimally invasive light-based aesthetic treatment applications, as well as RF energy based surgical and aesthetic applications. These solutions include non-invasive and minimally invasive procedures to remove hair, treat vascular and benign pigmented lesions, remove multi-colored tattoos, revitalize the skin, liquefy and remove unwanted fat through laser lipolysis, reduce cellulite, clear nails infected by toe fungus, ablate sweat glands and improve vaginal health. We believe our laser and other light-based and RF systems are reliable, user friendly and easily incorporated into both physician practices and medi-spas. We complement our product offerings with comprehensive and responsive service offerings, including assistance with training, aesthetic practice development consultation and product maintenance.
We believe that the following factors enhance our market position:
| • | Broad Technology Base. Our light based products are based on a broad range of technologies and incorporate different types of lasers, such as Alexandrite, pulse dye, CO2, Erbium: glass, Er:YAG, Nd:YAG and diode, as well as intense pulsed light devices. We believe we are one of a few companies that currently offer aesthetic treatment systems using Alexandrite and pulse dye lasers, which are particularly well suited for some applications and skin types. The following table provides information regarding the principal energy sources used in laser and other light-based aesthetic treatments that we offer and the primary application of each of these energy sources. |
| Energy Source |
Type of Light/Wavelength |
Principal Applications | ||
| Pulse Dye Laser |
Visible light (Orange)(585/595 nm) |
Vascular lesions, including shallow and deep lesions | ||
| Alexandrite Laser |
Near infrared invisible light (755 nm) Long pulse (millisecond)
Short pulse (nanosecond)
Ultra short pulse (picosecond) |
Hair removal, particularly for light skin types Tattoo and benign pigmented lesions removal Tattoo and benign pigmented lesions removal | ||
|
CO2 Laser |
Infrared invisible light (10.6µm) |
Skin resurfacing Treatment of wrinkles and textural irregularities Vaginal health | ||
| Diode Laser |
Near infrared invisible light (800/805/924/940/975/980 nm) |
Hair removal, particularly for light skin types Vascular lesions, particularly shallow lesions Temporary reduction in the appearance of cellulite Treatment of fat | ||
9
Table of Contents
| Energy Source |
Type of Light/Wavelength |
Principal Applications | ||
| Erbium: glass laser |
Near infrared invisible light (1540 nm) |
Skin resurfacing Treatment of surgical scars, acne scars and stretch marks | ||
| Er:YAG lasers |
Near infrared invisible light (2940 nm) |
Skin resurfacing Treatment of wrinkles and textural irregularities | ||
| Nd:YAG Laser |
Near infrared invisible light (1064/1320/1440 nm) Visible light (green)(532 nm) |
Hair removal, particularly for medium and dark skin types Vascular lesions, particularly deep lesions Treatment of fat and cellulite Tattoo and benign pigmented lesions removal | ||
| Intense Pulsed Light |
Visible/Near infrared invisible light (400-950 nm) |
Hair removal, all skin types Vascular lesions, particularly shallow lesions and benign pigmented lesions | ||
| Multiple Energy Source Workstations |
Multiple | Multiple | ||
| (incorporating two or more energy sources) |
||||
| • | Expansive Portfolio of Aesthetic Treatment Systems. We offer a variety of individual workstations tailored to specific high volume cosmetic applications to enable our customers to select the aesthetic treatment system best suited to their practice, business or clinical need. Our product portfolio includes single energy source systems as well as workstations that incorporate two or more different types of lasers or light-based technologies. By offering multiple technologies and system alternatives at a variety of price points, we seek to provide customers with tailored solutions that meet the specific needs of their practices while providing significant flexibility in their level of investment. |
| • | Additional Energy Sourced Systems. The Ellman acquisition in September 2014 complemented and broadened our product line with the addition of multiple RF generators and single use electrodes for aesthetic and multi-specialty surgical indications such as facial plastic and general surgery, gynecology, ear, nose, and throat procedures, ophthalmology, oral and maxillofacial surgery, podiatry and proctology. |
| • | Upgrade Paths Within Product Families. We design our products to facilitate upgrading within product families. These upgrade paths provide our customers with the opportunity to add additional energy sources and handpieces, which provides our customers with technological flexibility as they expand their practices. |
| • | Global Presence. We have offered our products in international markets for over 20 years, with approximately 48% of our product revenue generated from product sales outside of North America in 2014. We target international markets through a direct sales force in Canada, Mexico, France, Morocco, Germany, Spain, the United Kingdom, Australia, China, Japan and Korea and through international distributors in approximately 120 other countries. |
| • | Strong Reputation Established Over 20-Year History. We have been in the business of developing and marketing aesthetic treatment systems for over 20 years. As a result of this history, we believe the Cynosure brand name is associated with a tradition of technological leadership. |
10
Table of Contents
Our Business Strategy
Our goal is to become the worldwide leader in providing non-invasive and minimally invasive aesthetic treatment systems. The key elements of our two-pronged business strategy to achieve this goal are to:
| • | Launch Innovative New Products and Technologies into High-Growth Aesthetic Applications. Our research and development team builds on our existing broad range of laser and light-based technologies to develop new solutions and products to target unmet needs in significant aesthetic treatment markets. Innovation continues to be a strong contributor to our strength. |
| • | In the first quarter of 2013, we launched our PicoSure system for the removal of tattoos and benign pigmented lesions. The PicoSure system, which is based on years of research and development effort and expense, is the first commercially available picosecond Alexandrite aesthetic laser platform on the market. In October 2013, we launched the PicoSure FOCUS Lens Array which microscopically concentrates the PicoSure laser pulse to a precise depth and exposes less than 10% of the skin to areas of high fluence while the surrounding skin is exposed to a low background fluence. We received marketing authorization for our PicoSure system in Canada in July 2013, in Australia in November 2013, and in Korea and Taiwan in January 2014. In July 2014, we received FDA clearance to market PicoSure for the treatment of acne scars. In September 2014, we received FDA clearance to market PicoSure with PicoSure FOCUS Lens Array for the treatment of wrinkles. In February 2015, we received FDA clearance to market the 532 nm wavelength for PicoSure designed to more effectively treat red, yellow and orange tattoo ink colors, which we will offer as an upgrade to our current PicoSure customer base. |
| • | In 2006, we expanded beyond our legacy non-invasive products by offering a minimally invasive aesthetic treatment system, the SmartLipo system. The SmartLipo system was the first FDA-cleared laser lipolysis system for use in a minimally invasive procedure for the removal of unwanted fat. Since the launch of the SmartLipo system in 2006, we have introduced two new workstations: the SmartLipo MPX workstation in 2008 and the SmartLipo Triplex workstation in 2009. We have provided further innovation in this area with the introduction of MultiPlex technology, which enables the energy from two lasers to be blended during delivery by quickly following a pulse of energy from one laser with a pulse of energy from another laser, and also introduced SmartSense and ThermaGuide, our proprietary intelligent delivery systems. In 2011, we launched our Cellulaze Workstation, the world’s first aesthetic laser device for the treatment of cellulite, into the European community. In 2012, we received FDA clearance to sell and market the Cellulaze workstation in the United States. In 2013, we launched the PrecisionTx technology for minimally invasive removal of fat in small areas such as the neck and jawline as well as ablation of axillary sweat glands. |
| • | Expand Product Offerings Through Strategic Acquisitions and Significant Partnerships. We have enhanced our product offerings through acquisition of complementary businesses, products and technologies and intend to continue to do so. Such acquisitions may include small and substantial acquisitions, as well as joint ventures and other collaborative projects. |
| • | Ellman Acquisition. In September 2014, we acquired substantially all of the assets of Ellman, a leading provider of advanced RF technology for precision surgical and aesthetic procedures diversifying our laser aesthetic base business. Ellman also offers a line of aesthetic lasers. |
| • | In June 2013, we acquired Palomar, which complemented and broadened our product lineup with the addition of the Icon Aesthetic System, the StarLux laser and pulsed light system and the Vectus diode laser. The Icon Aesthetic System provides a comprehensive suite of the most popular treatments from hair removal to wrinkle reduction to scar and stretch mark treatment, and the Vectus diode laser is a dedicated solution for high-volume hair removal. |
| • | In 2011, we expanded our body shaping treatment platform by acquiring substantially all of the assets of Elemé Medical and introducing SmoothShapes XV. |
11
Table of Contents
| • | In 2011, we expanded our product portfolio by acquiring substantially all of the assets of HOYA ConBio’s aesthetic laser business including the MedLite C6 and RevLite systems. |
| • | In November 2014, we entered into an exclusive distribution agreement with El.En. to market and distribute the MonaLisa Touch product line in North America, a carbon dioxide laser for the treatment of vaginal atrophy, a condition that affects primarily postmenopausal women, breast cancer survivors and women who have undergone hysterectomies. |
| • | In October 2011, we acquired worldwide exclusive rights from NuvoLase to distribute the PinPointe FootLaser for the treatment of onychomycosis, and in February 2014, we changed our distribution rights from exclusive to non-exclusive. |
| • | Develop Home Use Applications for our Technology. In 2009, we entered into a cooperative development agreement with Unilever to develop and commercialize light-based devices for the emerging home use personal care market. In July 2012, we received FDA clearance to sell and market the product in the United States. Unilever is expanding the retail distribution for the product in North America and Europe. |
| • | Offer a Full Range of Tailored Aesthetic Solutions. We believe that we have one of the broadest product portfolios in the industry, with multiple product offerings incorporating a range of laser and light sources at various price points across many aesthetic applications. Our approach is designed to allow our customers to select products that best suit their client base, practice size and the types of treatments that they wish to offer. This allows us to address the needs of the traditional physician customer market as well as the growing non-traditional physician customer market. Many of our newer products can be upgraded to systems with greater functionality as our customers’ practices expand. |
| • | Provide Comprehensive, Ongoing Customer Service. We support our customers with a worldwide service organization that includes 43 field service professionals in North America and 66 field service professionals outside of North America. Field service engineers install our products and respond rapidly to service calls to minimize disruption to our customers’ businesses. Most of our new products are modular in design to enable quick and efficient service and support. We maintain our service infrastructure with training and inventory hubs in Europe and the Asia/Pacific region. |
| • | Generate Additional Revenue from Existing Customer Base. We believe that there are opportunities for us to generate additional revenue from existing customers who are already familiar with our products for increasing treatment volumes or new treatment applications. We also expect that customers purchasing our new modular products will be candidates for technology upgrades to enhance the capabilities of their systems. In addition, several of our products contain consumable parts, and we generate additional revenue on sales of these consumable parts to our existing customers. As we continue to grow our service organization, we are seeking to increase the percentage of our customers that enter into service contracts, which would provide additional recurring customer revenue. |
Products
We offer a broad portfolio of light based aesthetic treatment systems that address a wide variety of applications.
12
Table of Contents
The following table provides information concerning our flagship products and their applications. We use the flagship designation for our products that are our leading products for a particular application.
| Hair Removal |
Vascular Lesions |
Skin Rejuve- nation(1) |
Benign Pigmented Lesions |
Treat Cellulite |
Scars | Tattoo Removal |
Anti- Aging |
LaserBody Sculpting for the Removal of Unwanted Fat | ||||||||||
| Flagship Products: |
||||||||||||||||||
| Elite Family |
Flagship | X | X | X | ||||||||||||||
| SmartLipo Family |
Flagship | |||||||||||||||||
| Cellulaze |
Flagship | |||||||||||||||||
| Affirm/SmartSkin |
Flagship | |||||||||||||||||
| Cynergy |
X | Flagship | X | X | ||||||||||||||
| Accolade |
X | X | X | |||||||||||||||
| MedLite C6 /RevLite |
X | X | X | X | ||||||||||||||
| PicoSure |
Flagship | Flagship | ||||||||||||||||
| Icon |
X | X | Flagship | X | Flagship | Flagship | ||||||||||||
| Vectus |
Flagship |
| (1) | We consider skin rejuvenation to be the treatment of shallow vascular lesions and benign pigmented lesions to rejuvenate the skin’s appearance. |
System Components
Each of our systems consists of a control console and one or more handpieces. The systems acquired from Ellman consist of RF-based control consoles where energy is transferred through a handpiece or electrode. Our control consoles are each comprised of a graphical user interface, control system software and high voltage electronics. Depending on the system, the laser or other light source may be within the control console or the handpiece. The graphical user interface allows the practitioner to set the appropriate laser or flashlamp parameters, such as energy and pulse duration, to meet the requirements of a particular application for each particular patient. The control system software communicates the operator’s instructions from the graphical user interface to the system’s components and manages system performance and calibration. For systems having multiple light sources within the control system, the graphical user interface allows the practitioner to change sources with the press of a button. For systems having light sources within handpieces, the graphical user interface automatically detects the connection of each handpiece and provides the appropriate display to the user.
The handpieces are used to deliver the light energy from the laser or other light source to the treatment area. For systems having the laser within the control console, the handpieces deliver the laser energy through a maneuverable optical fiber to the treatment area. For systems having the laser or flashlamp within the handpiece, the light energy is shaped through optical components before being delivered to the treatment area.
Many of our products use consumable parts. The Affirm system uses a consumable micro lens array tip to deliver the laser energy to the treatment area. We currently offer three different micro lens array tips for the Affirm system, which cover a variety of treatment areas. Similarly, the PicoSure FOCUS Lens Array is a consumable micro lens array tip, which delivers the laser energy to the treatment area. The SmartLipo and Cellulaze systems and PrecisionTx technology use consumable laser fibers to deliver the laser energy directly to the treatment area. The surgical systems acquired from Ellman use consumable surgical electrodes and accessories.
For many applications, practitioners use cooling to protect the skin. The cooling system may be a separate system or integrated into the laser or intense pulsed light system itself. When not integrated, we offer our customers the SmartCool treatment cooling system, which we purchase from a third party supplier and sell as a private label product under the SmartCool brand. The SmartCool product has nine variable settings and allows
13
Table of Contents
the practitioner to provide a continuous flow of chilled air before, during and after treatment to cool and comfort the patient’s skin. The SmartCool handpiece, which is specially designed for use with our laser systems, interlocks with the laser handpiece. In contrast to some competitive cooling systems, there are no disposable supplies required to use our integrated cooling systems or our SmartCool system.
Applications
Practitioners use our products to perform a variety of non-invasive procedures to remove hair, treat vascular and benign pigmented lesions, remove multi-colored tattoos, revitalize the skin, liquefy and remove unwanted fat through laser lipolysis, reduce cellulite, clear nails infected by toe fungus, ablate sweat glands and improve vaginal health. Practitioners also use our products to perform minimally invasive procedures for the removal of unwanted fat and the treatment of cellulite. The applications of our products are described below.
LaserBodySculpting ™ for the Removal of Unwanted Fat. The SmartLipo system was the first laser lipolysis system to offer a minimally invasive procedure for the removal of unwanted fat. LaserBodySculpting procedures with the SmartLipo, system enables physicians to remove localized deposits of fat by inserting a small cannula, or metal tube, containing a laser fiber under the skin in direct contact with the treatment area. The laser energy causes the fat cells to rupture and melt. In addition, the laser energy promotes collagen shrinkage and causes a tissue tightening effect. LaserBodySculpting is a minimally invasive procedure; therefore, it can be performed under local anesthesia with minimal trauma in comparison to alternative liposuction procedures. We launched the SmartLipo system in 2006, and in 2008, we introduced SmartLipo MPX system, which added a second wavelength in a new platform and included our patented MultiPlex technology which enables the energy from two lasers to be blended during delivery by quickly following a pulse of energy from one laser with a pulse of energy from another laser, and also introduced SmartSense and ThermaGuide, our proprietary intelligent delivery systems. In late 2009, we introduced SmartLipo Triplex system which included a third wavelength. In 2013, we launched the PrecisionTx technology for minimally invasive removal of fat in small areas such as the neck and jawline as well as ablation of axillary sweat glands.
Cellulite. Cellulite is a deposit of fat that causes a dimple or other uneven appearance of the skin, typically around the thighs, hips and buttocks, more commonly found in women than men. According to published reports, an estimated 85% of women have some degree of cellulite. In 2011, we introduced our Cellulaze Cellulite Laser Workstation into the European community, and in 2012, we received FDA clearance to sell and market the product in the United States. The Cellulaze system is the world’s first minimally invasive surgical device designed to reduce cellulite by restoring the normal structure of the skin and underlying connective tissue. In the Cellulaze procedure, which is performed under a local anesthetic, the physician inserts a small cannula under the skin. Our SideLight 3D side-firing technology directs controlled, laser thermal energy to the treatment zones. The laser is designed to diminish the lumpy pockets of fat, release the areas of skin depression and increase the elasticity and thickness of the skin. Patients require just one treatment. Like the SmartLipo systems, the Cellulaze system incorporates the ThermaGuide intelligent delivery system which allows the physician to accurately monitor temperature and determine the treatment doses that will provide safe and more effective tissue tightening through tissue coagulation and maintain an even, controlled flow of laser energy. The SmoothShapes XV system treats cellulite through a proprietary process known as Photomology, which combines laser and light energy with mechanical manipulation (vacuum and massage) to produce tighter, smoother-looking skin. The system is FDA cleared for marketing in the United States and CE marked for sale in the European Union. The device is also marketed outside the United States for circumferential reduction.
Hair Removal. In a typical laser or pulsed light hair removal treatment the practitioner selects appropriate laser or pulsed light parameters based on the patient’s skin and hair types. If the system does not have integrated contact cooling in the handpiece, the practitioner often pre-cools the treatment area with cold air from the Zimmer SmartCool system. Next, the practitioner applies the handpiece to the target area. If the handpiece has integrated contact cooling, the skin is pre-cooled upon contact with the handpiece. The handpiece delivers laser or pulsed light energy to the skin and it is selectively absorbed by the target melanin in the hair follicle,
14
Table of Contents
destroying the hair follicle without harming the surrounding skin. We commercialized our first laser system for hair removal in 1997 and our first intense pulsed light system for hair removal and removal of pigmented lesions in 2001. Since then, we have launched several workstations including multiple light sources for the treatment of hair removal and various other skin conditions. Today, these systems include the Elite MPX and Icon systems. In 2012, we introduced the Vectus diode laser system for dedicated, high-volume hair removal. The Elite MPX workstation and Vectus system are our flagship products for hair removal. The Elite MPX workstation features a built-in Zimmer SmartCool skin cooling system which is integrated into a single compact model saving office space and reducing treatment time. Our Elite MPX and Apogee Elite products include two energy sources in one laser system: an Alexandrite laser, which is best suited for patients with light skin types, and an Nd:YAG laser, which is best suited for hair removal for patients with medium and dark skin types or tanned skin. The practitioner can switch between these two energy sources simply by pushing a button on the system console. Our Elite MPX allows the practitioner to blend the two energy sources for a customized treatment protocol. The Icon system provides multiple intense pulsed light handpieces for hair removal with integrated contact cooling, including the MaxR™ handpiece with large spot size and MaxRs™ handpiece with small spot size for use on all skin types and the MaxYs™ handpiece for hair removal on lighter skin types and removal of pigmented lesions. The Vectus laser features the largest spot size and most uniform beam profile available today and integrated contact cooling allowing providers to provide high-volume hair removal on a wide range of skin and hair types. The Apogee 5500 and Acclaim 7000 systems can also be used for hair removal.
Treatment of Tattoos. In 2012, we received FDA clearance to market our PicoSure system, a picosecond laser technology platform, in the United States for removal of tattoos and benign pigmented lesions. We commenced commercialization of the PicoSure system in early 2013. Picosecond lasers deliver pulses that are measured in trillionths of a second in contrast with nanosecond technology, such as our MedLite and RevLite products, which deliver pulses in billionths of a second. The ultra-short pulses of the PicoSure laser provide both photothermal and photomechanical action. In clinical studies that we have conducted, the shorter pulse duration of the picosecond laser achieved increased efficiency in removing tattoo pigment, which we believe results in fewer treatments and better overall treatment outcomes than current laser technology. In October 2013, we launched the PicoSure FOCUS Lens Array for use with the PicoSure system to microscopically concentrate the PicoSure laser pulse to a precise depth and expose less than 10% of the skin to areas of high fluence while the surrounding skin is exposed to a low background fluence. In February 2015, we received FDA clearance to market the 532 nm wavelength for PicoSure designed to more effectively treat red, yellow and orange tattoo ink colors, which we will offer as an upgrade to our current PicoSure customer base. The MedLite and RevLite systems provide frequency-doubled q-switched Nd:YAG laser energy for tattoo removal and can be used with the MultiLite Dye handpieces to provide 585 nm (yellow) and 650 nm (red) laser energy for full-color tattoo removal. The Accolade system provides high-powered, q-switched Alexandrite laser energy for the removal of tattoos.
Anti-Aging. We believe the marketplace has moved to a less invasive approach for treating the indications of aging, including the treatment of wrinkles, pigmentation, redness and overall skin rejuvenation. Anti-aging treatments were historically performed by physicians who could only target one condition and one skin layer during each treatment. Previously, patients often faced longer, more painful procedures that penetrated deep into the dermal layers and could potentially damage healthy skin. Our PicoSure and Icon, Affirm, SmartSkin, Elite, MedLite and RevLite systems provide a non-ablative and micro-ablative treatment approach for wrinkles, skin texture, skin discoloration and skin tightening through tissue coagulation.
Treatment of Benign Pigmented Lesions. Given that the pigment associated with pigmented lesions is generally located close to the skin surface, practitioners generally do not pre-cool the target area. To treat pigmented lesions, the practitioners apply laser or intense pulsed light energy to the treatment area to damage or destroy the lesion. The lesion will then form a scab that sloughs off over time to reveal clearer skin beneath. Our PicoSure system delivers picosecond pulses of Alexandrite laser energy to remove benign pigmented lesions using both photothermal and photomechanical action. The PicoSure system may be used with the PicoSure FOCUS Lens Array to microscopically concentrate the PicoSure laser pulse to a precise depth and exposes less
15
Table of Contents
than 10% of the skin to areas of high fluence while the surrounding skin is exposed to low background fluence. Our MedLite and RevLite laser systems provide frequency-doubled Q-Switched Nd:YAG laser energy for removal of pigmented lesions. The MedLite provides a true flat-top beam profile for consistent results. The Icon system provides the LuxYs and LuxG pulsed light handpieces for the removal of pigmented lesions and the 1540 fractional laser for the removal of melasma. The broadband light of the LuxYs handpiece is optimally filtered to treat darker pigmented lesions. The Elite and Apogee systems provide 755 nm Alexandrite laser energy for the treatment of pigmented lesions while the Accolade system provides q-switched Alexandrite laser energy for the treatment of pigmented lesions. The Affirm system provides dual wavelengths of 1320 nm and 1440 nm for the treatment of pigmented lesions.
Treatment of Vascular Lesions. To treat vascular lesions, the practitioner generally first pre-cools the target area, with the system handpiece or an external cooling system, and then uses the system handpiece to deliver laser or intense pulsed light energy to the treatment area to damage or destroy the blood vessels. One or more treatments may be required depending upon the type of lesion. Our flagship Icon system provides the MaxG™ intense pulsed light handpiece with Dynamic Spectrum Shifting™ and dual-band filters for more uniform heating across the entire diameter of larger vessels. For leg veins, the Icon system provides the Lux 1064+™ laser handpiece. The Acclaim and Elite family of systems also provide 1064 nm laser energy for treatment of vascular lesions, both facial and leg veins.
Our Cynergy system is also used for the treatment of vascular lesions. The Cynergy system combines a pulse dye laser, which is best suited for treating shallow vascular lesions, such as port wine birthmarks, facial veins and rosacea, and an Nd:YAG laser, which is best suited for treating large or deep veins, such as leg veins. The practitioner can switch between these two energy sources simply by pressing a button on the system console. The Cynergy system also includes our patented MultiPlex technology that enables the energy from the two lasers to be blended during delivery by quickly following a pulse of energy from the pulse dye laser with a pulse of energy from the Nd:YAG laser. In addition to the Cynergy system, certain of our other systems can be used for the treatment of vascular lesions.
Treatment of Scars. Our PicoSure, Icon, MedLite, RevLite and SmartSkin systems use short pulses of micro-fine laser light to reach deeply into the skin’s sub-layers, treating the support structure. The body’s natural healing process sweeps away older, damaged tissue and rebuilds it with fresh, new collagen and elastin to remove or reduce the appearance of the scar.
Axillary Gland Ablation. Historically, topical antiperspirants or oral medications have been recommended as the best treatment available. Our PrecisionTx technology provides minimally invasive laser ablation of the axillary glands (glands in the armpit area).
Treatment of Onychomycosis. Onychomycosis is a condition marked by the growth of fungus under the nail. Fungi feed on keratin, the protein that makes up the hard surface of the toenails. The infected nail often turns darker in color, and debris may accumulate under the nail. As the infection continues, the nail either may crumble gradually and fall off or thicken. Our PinPointe FootLaser uses laser light to kill the fungus that lives in and under the nail without causing damage to the nail or the surrounding skin. The treatment typically takes 20 minutes with no downtime.
Vaginal Health. Vaginal atrophy is a condition marked by the deterioration of the vaginal walls associated with the loss of estrogen due to aging, hormonal treatments for breast cancer, and other conditions affecting primarily postmenopausal women, breast cancer survivors and women who have undergone hysterectomies. The MonaLisa Touch delivers short CO2 ablative laser pulses to the vaginal wall, decreasing vaginal atrophy symptoms such as vaginal dryness, soreness and itching as well as painful urination and intercourse. The MonaLisa Touch system is designed to stimulate and promote the regeneration of collagen fibers and the restoration of hydration and elasticity within the vaginal mucosa. The procedure, which can be administered in a doctor’s office, requires no anesthesia and has been performed on thousands of patients worldwide.
16
Table of Contents
Sales and Marketing
We sell our aesthetic treatment systems to the traditional physician customer base of dermatologists and plastic surgeons as well as to non-traditional physician customers who are providing aesthetic services using laser and light-based technology. Non-traditional physician customers can include primary care physicians, obstetricians and gynecologists.
We target potential customers through office visits, trade shows and trade journals. We also conduct clinical workshops and webinars featuring recognized expert panelists and opinion leaders to promote existing and new treatment techniques using our products. We believe that these workshops and webinars enhance customer loyalty and provide us with new sales opportunities. We also use direct mail programs to target specific segments of the market that we seek to access, such as members of medical societies and attendees at meetings sponsored by medical societies or associations. We actively maintain a public relations program to promote coverage of our products on daytime television shows in the United States and Europe and we are active on popular social media outlets. In addition, our products are featured in several publications around the world.
We do not provide financing to our customers to purchase our products. If a potential customer requests financing, we refer the customer to third party financing sources.
Physician Sales
We sell our products to physicians in North America through a direct sales force. Outside of North America, we sell our products to physicians through a direct sales force in France, Morocco, Germany, Spain, the United Kingdom, Australia, China, Japan and Korea and through independent distributors in approximately 120 other countries.
We conduct our own international sales and service operations through wholly-owned subsidiaries in Mexico, France, Morocco, Germany, Spain, the United Kingdom, the Netherlands, Australia, China, Japan and Korea. We seek distributors in international markets where we do not believe that a direct sales presence is warranted or feasible. In those markets, we select distributors that have extensive knowledge of our industry and their local markets. Our distributors sell, install and service our products. We require our distributors to invest in service training and equipment, to stock and supply maintenance and service parts for our systems, to attend exhibitions and industry meetings and, in some instances, to commit to minimum sales amounts to gain or retain exclusivity. We have written distribution agreements with most of our third party distributors. Generally, the written agreements with our distributors have terms of between one and two years.
See Note 7 to our consolidated financial statements included in this Annual Report for revenues by geographic region.
Service and Support
We support our customers with a range of services, including installation and product training, business and practice development consulting and product service and maintenance. In North America, our field service organization has 43 field service professionals. Outside of North America, we employ 66 field service professionals.
In connection with direct sales of our aesthetic treatment systems, we arrange for the installation of the system and initial product training. The installation is conducted by our field service engineers. The costs of installation and initial training for North American purchasers are all included in the purchase price of our systems. We also offer for an additional charge a more comprehensive package of services from pre-qualified third party consultants. Our training and additional services are particularly appealing to the non-traditional physician customer and aesthetic spa segments of the market, which have less familiarity with the business aspects of laser and light-based aesthetic treatments than dermatologists and cosmetic surgeons.
17
Table of Contents
Within North America, we strive to respond to all service calls within 24 hours to minimize disruption of our customers’ businesses. We have designed our products in a modular fashion to enable quick and efficient service and support. Specifically, we build these products with several separate components that can easily be removed and replaced when the product is being serviced. We provide initial warranties on our products to cover parts and service, and we offer extended warranty packages that vary by type of product and level of service desired. Our base warranty typically covers parts and service for one year. We offer extended warranty arrangements through service plans. We believe that we have a significant opportunity to increase our recurring customer revenues by increasing the percentage of our customers that enter into service contracts for our systems.
Research and Development
Our research and development team consists of 101 employees, including five physicists, with a broad base of experience in lasers and optoelectronics. Our research and development team works closely with opinion leaders and customers, both individually and through our sponsored seminars, to understand unmet needs and emerging applications in the field of aesthetic skin treatments and to innovate and develop new products and improvements to our existing products. They also conduct and coordinate clinical trials of our products. Our research and development team builds on the significant base of patented and proprietary intellectual property that we have developed in the fields of laser and other light-based technologies since our inception in 1991. From time to time, we may enter into collaborative research and development agreements to enhance our technology and develop new products.
Manufacturing and Raw Materials
We manufacture most of our products. In November 2014, we signed an exclusive agreement with El.En. to market and distribute in North America the MonaLisa Touch system. We expect to launch the product in the United States in the first quarter of 2015 through a specialty surgical sales force. We also sell and market the PinPointe FootLaser system under our distribution agreement with NuvoLase, Inc. We manufacture our products with components and subassemblies purchased from third party suppliers. Accordingly, our manufacturing operations consist principally of assembly and testing of our systems and integration of our proprietary optics and software.
We design our products so that they are built in a modular fashion. This approach enables us to manufacture and service our products more efficiently. We purchase many of our components and subassemblies from third party manufacturers on an outsourced basis. We use one third party to assemble and test many of the components and subassemblies for our Accolade, Cynergy, Elite MPX and PicoSure product families, as well as complete manufacturing and test of our Elite family and SmoothShapes XV products. We have transferred the manufacturing and test of the Icon and Vectus systems previously manufactured by Palomar to these same third party manufacturers.
We depend on El.En. for the SLT II laser system that we integrate with our own proprietary software and delivery systems into our SmartLipo Triplex and Cellulaze systems and PrecisionTx technology. We use Alexandrite rods in the lasers for our Elite and PicoSure systems. We depend exclusively on Northrop Grumman SYNOPTICS to supply the Alexandrite rods to us, and we are aware of no alternative supplier of Alexandrite rods meeting our quality standards. We use gaussian mirrors and polarizers to manufacture our RevLite and MedLite C6 systems, for which we depend exclusively on Channel Islands Opto-Mechanical Engineering and JDS Uniphase Corporation, respectively. We offer our SmartCool cooling systems for use with our laser aesthetic treatment systems, and we depend exclusively on Zimmer Elektromedizin GmbH to supply SmartCool systems to us. We use diode laser bars from Coherent to manufacture our Vectus Laser. Although alternative suppliers exist for the diode laser bars, they could take months to qualify and implement.
We do not have long-term contracts with our third party manufacturers or sole source suppliers. We generally purchase components and subassemblies as well as our other supplies on a purchase order basis. If for
18
Table of Contents
any reason, our third party manufacturers or sole source suppliers are not willing or able to provide us with components, subassemblies or supplies in a timely fashion, or at all, our ability to manufacture and sell many of our products could be impaired. To date, we have been able to obtain adequate outsourced manufacturing services and supplies of components from our third party manufacturers and suppliers in a timely manner. We believe that over time alternative component and subassembly manufacturers and suppliers can be identified if our current third party manufacturers and suppliers fail to fulfill our requirements.
Backlog
We generally do not maintain a significant backlog. As a result, we do not believe that our backlog at any particular time is indicative of future sales levels.
El.En. Commercial Relationship
We have two distribution agreements with El.En. Under the first distribution agreement, we purchase from El.En. its SmartLipo MPX system and its proprietary SLT II laser system. The SLT II laser system is an essential component of our SmartLipo Triplex and Cellulaze systems and PrecisionTx technology, which also incorporate our proprietary software and delivery systems. We have exclusive worldwide rights under this agreement to sell the SmartLipo MPX system and our products containing the SLT II laser system. Under the second distribution agreement with El.En., we purchase from El.En. its MonaLisa Touch laser system.
The prices at which we purchase the these laser systems from El.En. is specified in the agreements; however, they may be changed by El.En. at its discretion upon 30 days’ notice. El.En. is required to provide us with training for the products we distribute under these agreements, as well as marketing and other sales support for such products as we and El.En. may agree. We are required to use commercially reasonable efforts to sell and promote our systems containing these laser systems, and we are responsible for obtaining and maintaining regulatory approvals for such products. The first distribution agreement has an initial term that expires in October 2019, and the second distribution agreement has an initial term that expires in November 2021. Each agreement automatically renews for additional one-year terms unless either party provides notice of termination at least six months prior to the expiration of the initial term or any subsequent renewal term. We or El.En. may terminate these agreements at any time based upon material uncured breaches by, or the insolvency of, the other party. In addition, El.En. may terminate each agreement if we do not meet annual minimum purchase obligations specified in the agreement and we may terminate if El.En. rejects a purchase order that is in line with our forecast.
Patents, Proprietary Technology and Trademarks
Our success depends in part on our ability to obtain and maintain proprietary protection for our products, technology and know-how, to operate without infringing the proprietary rights of others and to prevent others from infringing our proprietary rights. Our policy is to seek to protect our proprietary position by, among other methods, filing United States and foreign patent applications related to our proprietary technology, inventions and improvements that are important to the development of our business. We also rely on a trademarks, trade secret and copyright laws and contractual restrictions to protect our proprietary technology. These legal protections afford only limited protection for our technology.
As of December 31, 2014, we were the sole owner of over 80 United States patents, as well as many United States pending applications and foreign patents and pending applications. We are also joint owners with El.En. of certain patents and pending applications. We are also licensed non-exclusively to certain patents owned by third parties and we have granted exclusive and non-exclusive licenses to third parties to certain of our patents, pending applications and know how. The term of individual patents depends upon the legal term for patents in the countries in which they are obtained. In most countries, including the United States, the patent term is 20 years from the earliest filing date of a non-provisional patent application.
19
Table of Contents
Our Palomar subsidiary is presently the exclusive licensee of certain hair removal patents owned by Massachusetts General Hospital or MGH. Palomar has granted royalty bearing, non-exclusive sublicenses to those patents to third parties, including to us in 2006. We pay a royalty to MGH for sales of our hair removal products. Palomar is also the non-exclusive licensee of several other United States patents as well as corresponding foreign patents and pending applications owned by MGH, and Palomar is the joint owner with MGH and, in some cases, the exclusive licensee, of other United States patents as well as corresponding United States pending applications and foreign patents and pending applications. These patents expired in the United States on February 1, 2015 and their foreign counterparts will expire in several foreign jurisdictions on January 31, 2016. Palomar has also granted non-exclusive rights to other parties to other patents and received non-exclusive licenses to patents owned by other parties.
The patent positions of companies like ours are generally uncertain and involve complex legal and factual questions. Our ability to maintain and solidify our proprietary position for our technology will depend on our success in obtaining effective patent claims and enforcing those claims once granted.
We do not know whether any of our patent applications or those patent applications that we license will result in the issuance of any patents. Our issued patents and those that may be issued in the future, or those licensed to us, may be challenged, invalidated or circumvented, which could limit our ability to stop competitors from marketing related products or shorten the term of patent protection that we may have for our products. In addition, the rights granted under any issued patents may not provide us with competitive advantages against competitors with similar technology. Furthermore, our competitors may independently develop similar technologies or duplicate any technology developed by us.
We seek to limit disclosure of our intellectual property by requiring employees, consultants and any third party with access to our proprietary information to execute confidentiality agreements with us and often agreements that include assignment of rights provisions to us. These agreements may be breached, and we may not have adequate remedies for any breach. In addition, our intellectual property may otherwise become known or be independently discovered by competitors. To the extent that our employees, consultants or contractors use intellectual property owned by others in their work for us, disputes may arise as to the rights in related or resulting know-how and inventions. Due to rapid changes in technology, we believe that factors such as the technological and creative skills of our personnel, new product developments and enhancements to existing products are as important as the various legal protections of our technology to establishing and maintaining a leadership position.
Despite our efforts to protect our proprietary rights, unauthorized parties may attempt to copy aspects of our products or to obtain and use information that we regard as proprietary. Policing unauthorized use of our technology is difficult. Litigation may be necessary to enforce intellectual property rights, to protect our trade secrets, to determine the validity and scope of the proprietary rights of others or to defend against claims of infringement or invalidity. Any such resulting litigation, even if we are ultimately successful, could result in substantial costs and diversion of resources and could have a material adverse effect on our business, operating results and financial condition. There can be no assurance that our means of protecting proprietary rights will be adequate or that our competitors will not independently develop similar technology. Any failure by us to meaningfully protect our proprietary rights could have a material adverse effect on our business, operating results, and financial condition.
We use registered and common law trademarks on nearly all of our products and believe that having distinctive marks is an important factor in marketing our products. We have also registered some of our marks in a number of foreign countries. In addition, El.En. has registered the SmartLipo® mark in the United States. Although we have a foreign trademark registration program for selected marks, we may not be able to register or use such marks in each foreign country in which we seek registration.
Our management believes that none of our current products infringe upon valid claims of patents owned by third parties of which we are aware. However, there have been claims made against us and there can be no
20
Table of Contents
assurance that third parties will not make further claims of infringement with respect to our current or future products. Any such claims, with or without merit, could be time-consuming to defend, result in costly litigation, divert our attention and resources, cause product shipment delays or require us to enter into royalty or licensing agreements. Such royalty or licensing agreements, if required, may not be available on terms acceptable to us or at all. A successful claim of intellectual property infringement against us and our failure or inability to license the infringed technology or develop or license technology with comparable functionality could have a material adverse effect on our business, financial condition and operating results. (For more information about our patent litigation, see “Item 3. Legal Proceedings” included in this Annual Report)
Competition
Our industry is subject to intense competition. Our products compete against laser and other energy-based products offered by public companies, such as Cutera, Lumenis, Syneron Medical and ZELTIQ Aesthetics, as well as several smaller specialized private companies, such as Alma Lasers (acquired in May 2013 by Shanghai Fosun Pharmaceutical). Some of these competitors have greater financial and human resources than we do and have established reputations, as well as worldwide distribution channels and sales and marketing capabilities that are larger and more established than ours. Additional competitors may enter the market, and we are likely to compete with new companies in the future. Our products also compete against non-light-based medical products, such as BOTOX® and collagen injections, and surgical and non-surgical aesthetic procedures, such as face lifts, chemical peels, abdominoplasty, liposuction, microdermabrasion, sclerotherapy and electrolysis.
Competition among providers of aesthetic laser and other light-based products is characterized by significant research and development efforts and rapid technological progress. There are few barriers that would prevent new entrants or existing competitors from developing products that would compete directly with ours. There are many companies, both public and private, that are developing innovative devices that use both light-based and alternative technologies for aesthetic and medical applications. Accordingly, our success depends in part on developing and commercializing new and innovative applications of laser and other light-based technology and identifying new markets for and applications of existing products and technology.
To compete effectively, we have to demonstrate that our products are attractive alternatives to other devices and treatments by differentiating our products on the basis of performance, reputation, quality of customer support and price. Breadth of product offering is also important. We believe that we perform favorably with respect to each of these factors. However, we have encountered and expect to continue to encounter potential customers who, due to pre-existing relationships with our competitors, are committed to, or prefer the products offered by these competitors. Potential customers also may decide not to purchase our products, or to delay such purchases, based on a decision to recoup the cost of expensive products that they may have already purchased from our competitors. In addition, we expect that competitive pressures may result in price reductions and reduced margins over time for our products.
Government Regulation
Our products are medical devices subject to extensive and rigorous regulation by the FDA, as well as other regulatory bodies. The FDA and other U.S. and foreign governmental agencies regulate, among other things, the following activities associated with medical devices: design, development and manufacturing; testing and clinical trials; labeling; product safety; marketing, sales and distribution; pre-market clearance and approval; recordkeeping; advertising and promotion; registration and listing; recalls and field safety corrective actions; post-market surveillance and medical device reporting; post-market approval studies; and import and export.
FDA’s Regulation of Manufacturing
The FDA requires that we manufacture our products in accordance with its Quality System Regulation, or QSR. The QSR covers the methods and documentation of the design, testing, control, manufacturing, labeling, quality assurance, packaging, storage and shipping of our products. The FDA enforces the QSR through periodic announced and unannounced inspections. Our last such inspection was in November 2014.
21
Table of Contents
Our failure to maintain compliance with the QSR requirements could result in, among other things, the shutdown of, or restrictions on, our manufacturing operations and the recall or seizure of our products, which would have a material adverse effect on our business. In the event that one of our suppliers fails to maintain compliance with our quality requirements, we may have to qualify a new supplier and could experience manufacturing delays as a result.
FDA’s Premarket Clearance and Approval Requirements
Unless an exemption applies, each medical device we wish to distribute commercially in the United States requires either prior 510(k) clearance or premarket approval from the FDA. The FDA classifies medical devices into one of three classes. Devices deemed to pose lower risks are placed in either class I or II, which requires the manufacturer to submit to the FDA a premarket notification requesting permission to distribute the device commercially. This process is generally known as 510(k) clearance. The FDA exempts some low risk devices from premarket notification requirements and the requirement of compliance with certain provisions of the QSR. Devices deemed to pose the greatest risk, such as certain life sustaining, life-supporting or implantable devices, or devices deemed not substantially equivalent to a legally marketed device, are categorized in class III. Class III devices generally cannot be commercially marketed in the United States without prior approval of a premarket approval application, or PMA, although there is a small category of class III devices that are eligible for 510(k) clearance. In rare cases, devices that are not eligible for 510(k) clearance but nevertheless do not pose significant risks may be classified as class I or class II and proceed to market via the FDA’s de novo classification process, which is an alternative to 510(k) clearance or PMA approval. All of our current products are class II devices. Both premarket notifications and premarket approval applications when submitted to the FDA must be accompanied by a user fee, unless exempt.
510(k) Clearance
When a 510(k) clearance is required, we must submit a premarket notification to the FDA demonstrating that our proposed device is substantially equivalent to a previously cleared 510(k) device or a device that was in commercial distribution before May 28, 1976 for which the FDA has not yet called for the submission of premarket approval applications, or premarket approval or a device that otherwise has been classified or reclassified into class I or II. The FDA’s 510(k) clearance process often takes from 3 to 12 months. The FDA may require us to withdraw an application if they cannot make a determination that the device is substantially equivalent according to the regulations. In such situations, we may re-submit the 510(k) application with additional data for reconsideration or we may determine not to commercialize the device or the new indication for use.
Historically, all of our products have qualified for clearance under 510(k) procedures.
Premarket Approval
If a device cannot be cleared through the 510(k) process or otherwise classified into class I or class II, the sponsor must submit a PMA. The sponsor must support the PMA with extensive data, including but not limited to, technical, preclinical, clinical trials, manufacturing and labeling to demonstrate to the FDA’s satisfaction the safety and effectiveness of the device. No device that we have developed has required premarket approval, nor do we currently expect that any future device or indication will require premarket approval.
Product Modifications
After a device receives 510(k) clearance, a modification that could affect its safety or effectiveness, or that would constitute a change in its intended use, will likely require a new clearance or approval. The FDA requires each manufacturer to make this determination initially, but the FDA can review any such decision and can disagree with a manufacturer’s determination. We have modified aspects of various products since receiving
22
Table of Contents
regulatory clearance and believe that new 510(k) clearances are not required for these modifications. The FDA’s position on when a device modification triggers the need to submit a new 510(k) has been evolving in recent years, and it is therefore difficult to predict whether the FDA will disagree with us. If the FDA disagrees with our determination not to seek a new 510(k) clearance, the FDA may retroactively require us to seek 510(k) clearance or premarket approval. The FDA could also require us, among other things, to cease marketing and distributing the modified device, and to recall any sold devices, until 510(k) clearance or premarket approval is obtained. Also, in these circumstances, we may be subject to significant regulatory fines or penalties.
Clinical Trials
We perform clinical trials to provide data to support the FDA clearance process for our products and for use in our sales and marketing efforts. Human clinical studies are generally required in connection with approval of class III devices and may be required for clearance of class I and II devices. When FDA clearance or approval of a device requires human clinical trials, and if the device presents a “significant risk,” as defined by the FDA, to human health, the FDA requires the device sponsor to file an investigational device exemption, or IDE, application with the FDA and obtain IDE approval prior to commencing the human clinical trials. The sponsor must support the IDE application with appropriate data, such as animal and laboratory testing results, showing that it is safe to test the device in humans and that the testing protocol is scientifically sound. Clinical trials, including clinical trials that do not require prior IDE approval, must be conducted in accordance with the FDA’s IDE and other regulations, including, among other things, informed consent, monitoring and recordkeeping requirements. The sponsor also must obtain approval from the institutional review board overseeing the clinical trial.
While we believe that a majority of our devices present only “non-significant” risks and, therefore, do not require IDE submission to the FDA, we have sought IDE approvals for certain study protocols in the past. Future clinical trials of our products may also require that we submit and obtain approval of an IDE from the FDA prior to commencing clinical trials. The FDA, and the institutional review board at each institution at which a clinical trial is being performed, may suspend or terminate a clinical trial at any time for various reasons, including a belief that the subjects are being exposed to an unacceptable health risk.
Our clinical trials may not generate favorable data to support any PMA or 510(k) clearance, and we may not be able to obtain such approvals or clearances on a timely basis, or at all. Delays in receipt of or failure to receive such approvals or clearances or failure to comply with existing or future regulatory requirements would have a material adverse effect on our business, financial condition and results of operations. Even if granted, the approvals or clearances may include significant limitations on the intended use and indications for use for which our products may be marketed.
Clinical studies conducted on 510(k) cleared devices, when used or investigated in accordance with the labeling reviewed by the FDA, are exempt from most of the FDA’s IDE requirements.
Pervasive and Continuing Regulation
After a device is placed on the market, numerous regulatory requirements apply. These include:
| • | establishment of registration and device listing; |
| • | the QSR, which requires manufacturers, including third-party manufacturers, to follow stringent design, testing, control, documentation and other quality assurance procedures during all aspects of the manufacturing process; |
| • | labeling regulations and FDA prohibitions against the promotion of products for uncleared, unapproved or “off-label” uses, and other requirements related to promotional activities; |
| • | medical device reporting regulations, which require that manufacturers report to the FDA if their device may have caused or contributed to a death or serious injury or malfunctioned in a way that would likely cause or contribute to a death or serious injury if the malfunction were to recur; |
23
Table of Contents
| • | corrections and removal reporting regulations, which require that manufacturers report to the FDA field corrections and product recalls or removals if undertaken to reduce a risk to health posed by the device or to remedy a violation of the Federal Food, Drug, and Cosmetic Act that may present a risk to health; and |
| • | post-market surveillance regulations, which apply when necessary to protect the public health or to provide additional safety and effectiveness data for the device. |
The FDA may require us to maintain a system for tracking our products through the chain of distribution to the patient level. The FDA has broad post-market and regulatory enforcement powers. We are subject to unannounced inspections by the FDA to determine our compliance with the QSR and other regulations. These inspections may include the manufacturing facilities of our subcontractors. Thus, we must continue to spend time, money and effort to maintain compliance. The FDA inspected our Westford, Massachusetts manufacturing facility in November 2014, and we believe that we are in substantial compliance with the QSR.
We are also regulated under the Radiation Control for Health and Safety Act, which requires laser products to comply with performance standards, including design and operation requirements. The law also requires manufacturers to certify in product labeling and in reports to the FDA that their products comply with all such standards. The law and applicable federal regulations also require laser manufacturers to file new product and annual reports, maintain manufacturing, testing and sales records, and report product defects. Various warning labels must be affixed and certain protective devices installed, depending on the class of the product.
Failure to comply with applicable regulatory requirements can result in enforcement action by the FDA, which may include any of the following sanctions:
| • | untitled letters, warning letters, fines, injunctions, consent decrees and civil penalties; |
| • | repair, replacement, refunds, recall or seizure of our products; |
| • | operating restrictions, partial suspension or total shutdown of production; |
| • | refusing or delaying our requests for 510(k) clearance or premarket approval of new products or new intended uses; |
| • | withdrawing 510(k) clearance or premarket approvals that are already granted; and |
| • | criminal prosecution. |
The FDA also has the authority to require us to repair, replace or refund the cost of any medical device that we have manufactured or distributed. If any of these events were to occur, they could have a material adverse effect on our business.
We are also subject to a wide range of federal, state and local laws and regulations, including those related to the environment, health and safety, land use and quality assurance. We believe that compliance with these laws and regulations as currently in effect will not have a material adverse effect on our capital expenditures, earnings and competitive and financial position.
In 2013, most of the products and systems that we sell became subject to an excise tax on sales of certain medical devices in the United States after December 31, 2012 by the manufacturer, producer or importer in an amount equal to 2.3% of the sale price. Under the law, additional charges, including warranties, may be deemed to be included in the sale price for purposes of determining the amount of the excise tax.
Sunshine Act
The Patient Protection and Affordable Care Act includes reporting and disclosure requirements, commonly referred to as the “Sunshine Act”, for manufacturers of drugs, biological, medical devices and medical supplies
24
Table of Contents
with regard to payments or other transfers of value made to certain physicians and teaching hospitals. The final rules implementing the Sunshine Act are complex, ambiguous, and broad in scope. Sales related to the Ellman surgical product line are subject to the reporting requirements under the Sunshine Act. We believe that sales related to our aesthetic product lines fall under a reporting exception under such act and, accordingly, reporting related to those sales is not required.
International
International sales of medical devices are subject to foreign governmental regulations, which vary substantially from country to country. The time required to obtain clearance or approval by a foreign country may be longer or shorter than that required for FDA clearance or approval, and the requirements may be different.
The primary regulatory environment in Europe is that of the European Union, which consists of 28 countries encompassing most of the major countries in Europe. The European Union has adopted numerous directives, and European Standardization Committees have promulgated voluntary standards, regulating the design, manufacture, clinical trials, labeling and adverse event reporting for medical devices. Devices that comply with the requirements of a relevant directive will be entitled to bear CE conformity marking, indicating that the device conforms to the essential requirements of the applicable directives and, accordingly, can be commercially distributed throughout the member states of the European Union and the member states of the European Free Trade Association, including Switzerland.
The method of assessing conformity varies depending on the type and class of the product, but normally involves a combination of self-assessment by the manufacturer and a third party assessment by a Notified Body, an independent and neutral institution appointed by a country to conduct the conformity assessment. This third party assessment may consist of an audit of the manufacturer’s quality system and specific testing of the manufacturer’s device. An assessment by a Notified Body in one member state of the European Union or the European Free Trade Association is required in order for a manufacturer to distribute the product commercially throughout these countries. ISO 9001 and ISO 13845 certification are voluntary harmonized standards. Compliance establishes the presumption of conformity with the quality management system and compliance with the requirements of the Medical Device Directive permits our Notified Body to issue the CE mark for our products. In 2003, we received our certification for ISO 13485, which replaced our EN 46001 certification.
Employees
As of December 31, 2014, we had 755 employees, including 282 employees in sales and marketing functions, 101 employees in research, development and engineering functions, 277 employees in manufacturing and service functions and 95 employees in general and administrative functions. We believe that our future success will depend in part on our continued ability to attract, hire and retain qualified personnel. None of our employees are represented by a labor union, and we believe our employee relations are good.
25
Table of Contents
| Item 1A. | Risk Factors |
The following important factors, among others, could cause our business, financial condition, results of operations and cash flows to be materially adversely affected. This section contains forward-looking statements. Please refer to the explanation of the qualifications and limitations on forward-looking statements beginning on page 3.
Risks Related to Our Business and Industry
We have incurred net losses in prior periods.
Although we were profitable in 2014 and 2012, we incurred losses in 2013, 2011 and 2010. If we are unable to maintain profitability, the market value of our stock may decline, and an investor could lose all or a part of their investment.
If there is not sufficient consumer demand for the procedures performed with our products, practitioner demand for our products could decline, which would adversely affect our operating results.
The aesthetic laser and light-based treatment system industry in which we operate is particularly vulnerable to economic trends. Most procedures performed using our aesthetic treatment systems are elective procedures that are not reimbursable through government or private health insurance. The cost of these elective procedures must be borne by the patient. As a result, the decision to undergo a procedure that utilizes our products may be influenced by the cost.
Consumer demand, and therefore our business, is sensitive to a number of factors that affect consumer spending, including political and macroeconomic conditions, health of credit markets, disposable consumer income levels, consumer debt levels, interest rates, consumer confidence and other factors. For example, consumer demand for the procedures performed with our products, and practitioner demand for our products, decreased dramatically during 2009 as a result of turmoil in the financial markets, which contributed to a significant decrease in our total product revenues during that year. If there is not sufficient consumer demand for the procedures performed with our products, practitioner demand for our products would decline, and our business would suffer.
Our financial results may fluctuate from quarter to quarter, which makes our results difficult to predict and could cause our results to fall short of expectations.
Our financial results may fluctuate as a result of a number of factors, many of which are outside of our control. For these reasons, comparing our financial results on a period-to-period basis may not be meaningful, and you should not rely on our past results as an indication of our future performance. Our future quarterly and annual expenses as a percentage of our revenues may be significantly different from those we have recorded in the past or which we expect for the future. Our financial results in some quarters may fall below our expectations or the expectations of market analysts or investors. Any of these events could cause our stock price to fall. Each of the risk factors listed in this “Risk Factors” section, and the following factors, may adversely affect our financial results:
| • | our inability to introduce new products to the market in a timely fashion, or at all; |
| • | our inability to quickly address and resolve reliability issues in our products and/or meet warranty and service obligations to our customers; |
| • | continued availability of attractive equipment leasing terms for our customers, which may be negatively influenced by interest rate increases or lack of available credit; |
| • | increases in the length of our sales cycle; and |
| • | reductions in the efficiency of our manufacturing processes. |
26
Table of Contents
In addition, we may be subject to seasonal fluctuations in our results of operations, because our customers may be more likely to make equipment purchasing decisions near year-end, and because practitioners may be less likely to make purchasing decisions in the summer months.
Our competitors may prevent us from achieving further market penetration or improving operating results.
Competition in the aesthetic device industry is intense. Our products compete against products offered by public companies, such as Cutera, Lumenis, Syneron Medical, and ZELTIQ Aesthetics, as well as several smaller specialized private companies, such as Alma Lasers (acquired in May 2013 by Shanghai Fosun Pharmaceutical (Group) Ltd.). Some of these competitors have greater financial and human resources than we do and have established reputations, as well as worldwide distribution channels and sales and marketing capabilities that are larger and more established than ours. Additional competitors may enter the market, and we are likely to compete with new companies in the future.
We also face competition against non-light-based medical products, such as BOTOX® and collagen injections, and surgical and non-surgical aesthetic procedures, such as face lifts, chemical peels, abdominoplasty, liposuction, microdermabrasion, sclerotherapy and electrolysis. We may also face competition from manufacturers of pharmaceutical and other products that have not yet been developed. As a result of competition with these companies, products and procedures, we could experience loss of market share and decreasing revenue as well as reduced prices and profit margins, any of which would harm our business and operating results.
As a result of competition with our competitor companies, products and procedures, we could experience loss of market share and decreasing revenue as well as reduced prices and profit margins, any of which would harm our business and operating results.
Our ability to compete effectively depends upon our ability to distinguish our company and our products from our competitors and their products. Factors affecting our competitive position include:
| • | product performance, reliability and design; |
| • | ability to sell products tailored to meet the applications needs of clients and patients; |
| • | quality of customer support; |
| • | product pricing; |
| • | product safety; |
| • | sales, marketing and distribution capabilities; |
| • | success and timing of new product development and introductions; and |
| • | intellectual property protection. |
We face exposure to credit risk of customers.
In the event of deterioration of general business conditions or the availability of credit, the financial strength and stability of our customers and potential customers may deteriorate over time, which may cause them to cancel or delay their purchase of our products. In addition, we may be subject to increased risk of non-payment of our accounts receivables. We may also be adversely affected by bankruptcies or other business failures of our customers and potential customers. A significant delay in the collection of funds or a reduction of funds collected may impact our liquidity or result in bad debts.
27
Table of Contents
If we do not continue to develop and commercialize new products and identify new markets for our products and technology, we may not remain competitive, and our revenues and operating results could suffer.
The aesthetic laser and light-based treatment system industry is subject to continuous technological development and product innovation. If we do not continue to innovate and develop new products and applications, our competitive position will likely deteriorate as other companies successfully design and commercialize new products and applications. Accordingly, our success depends in part on developing or acquiring new and innovative applications of laser and other light-based technology and identifying new markets for and applications of existing products and technology. If we are unable to develop and commercialize new products, identify and acquire complementary businesses, products or technologies, and identify new markets for our products and technology, our product and technology offerings could become obsolete and our revenues and operating results could be adversely affected.
To remain competitive, we must:
| • | develop or acquire new technologies that either add to or significantly improve our current products; |
| • | convince our target practitioner customers that our new products or product upgrades would be attractive revenue-generating additions to their practices; |
| • | sell our products to non-traditional customers, including primary care physicians, gynecologists and other specialists; |
| • | identify new markets and emerging technological trends in our target markets and react effectively to technological changes; |
| • | preserve goodwill and brand value with customers; and |
| • | maintain effective sales and marketing strategies. |
If our new products do not gain market acceptance, our revenues and operating results could suffer, and our newer generation product sales could cause earlier generation product sales to suffer.
The commercial success of the products and technology we develop will depend upon the acceptance of these products by providers of aesthetic procedures and their patients and clients, and in the case of our home-use system, consumers. It is difficult for us to predict how successful recently introduced products, or products we are currently developing, will be over the long term. If the products we develop do not gain market acceptance or meet customer expectations, our revenues and operating results could suffer.
We expect that many of the products we develop will be based upon new technologies or new applications of existing technologies. It may be difficult for us to achieve market acceptance of some of our products, particularly the first products that we introduce to the market based on new technologies or new applications of existing technologies.
As we introduce new technologies to the market, our earlier generation product sales could suffer, which may result in write-offs of those earlier generation products. For example, in 2009, we recorded a $2.1 million charge to cost of product revenues related to the write-down of an earlier generation product. The write-down resulted, in part, from customers adopting our newer generation products more quickly than we anticipated, coupled with the downturn in the overall aesthetic laser market.
If demand for our aesthetic treatment systems by physician customers does not increase, our revenues will suffer and our business will be harmed.
We market our aesthetic treatment systems to physicians and other practitioners. In addition, through our development agreement with Unilever, we began to address the home-use aesthetic laser market in the second half of 2014. We believe, and our growth expectations assume, that we and other companies selling lasers and
28
Table of Contents
other light-based aesthetic treatment systems have not fully penetrated these markets and that we will continue to receive a significant percentage of our revenues from selling to these markets. If our expectations as to the size of these markets and our ability to sell our products to participants in these markets are not correct, our revenues will suffer and our business will be harmed.
We sell our products and services through subsidiaries and distributors in numerous international markets. Our operating results may suffer if we are unable to manage our international operations effectively.
We sell our products and services through subsidiaries and distributors in approximately 120 foreign countries, and we therefore are subject to risks associated with having international operations. We derived 48%, 48%, and 49% of our product revenues from sales outside North America for the years ended December 31, 2014, 2013, and 2012, respectively.
Our international sales are subject to a number of risks, including:
| • | foreign certification and regulatory requirements; |
| • | difficulties in staffing and managing our foreign operations; |
| • | import and export controls; and |
| • | political and economic instability. |
If we are unsuccessful at managing these risks, our results of operations may be adversely affected.
We may incur foreign currency translation charges as a result of changes in currency exchange rates, which could cause our operating results to suffer.
The U.S. dollar is our functional currency. Although we sell our products and services through subsidiaries and distributors in approximately 120 foreign countries, approximately 47% of our revenues outside of North America for the year ended December 31, 2014, and 51% of our revenues outside of North America for the year ended December 31, 2013, were denominated in or linked to the U.S. dollar. Substantially all of our remaining revenues and all of our operating costs outside of North America are recognized in euros, British pounds, Moroccan dirham, Japanese yen, Chinese yuan, South Korean won and Australian dollars. We have not historically engaged in hedging activities relating to our non-U.S. dollar operations. Fluctuations in exchange rates between the currencies in which such revenues are realized or costs are incurred and the U.S. dollar may have a material adverse effect on our results of operations and financial condition.
We may not receive revenues from our current research and development efforts for several years, if at all.
Investment in product development often involves a long payback cycle and risks associated with new technology. For example, our PicoSure laser system, which we launched in 2013, was in development for several years. We have made and expect to continue making significant investments in research and development and related product opportunities. Accelerated product introductions and short product life cycles require high levels of expenditures for research and development that could adversely affect our operating results if not offset by revenue increases. We believe that we must continue to dedicate a significant amount of resources to our research and development efforts to maintain our competitive position. However, we may not generate anticipated revenues from these investments for several years, if at all.
Because we do not require training for users of our non-invasive products, and we sell these products to non-physicians, there exists an increased potential for misuse of these products, which could harm our reputation and our business.
Federal regulations allow us to sell our products to or on the order of practitioners licensed by law to use or order the use of a prescription device. The definition of “licensed practitioners” varies from state to state. As a
29
Table of Contents
result, our products may be purchased or operated by physicians with varying levels of training and, in many states, by non-physicians, including nurse practitioners, chiropractors and technicians. Outside the United States, many jurisdictions do not require specific qualifications or training for purchasers or operators of our products. We do not supervise the procedures performed with our products, nor can we require that direct medical supervision occur. We and our distributors offer product training sessions, but neither we nor our distributors require purchasers or operators of our non-invasive products to attend training sessions. The lack of required training and the purchase and use of our non-invasive products by non-physicians may result in product misuse and adverse treatment outcomes, which could harm our reputation and expose us to costly product liability litigation.
We may be unable to attract and retain management and other personnel we need to succeed.
Our success depends on the services of our senior management and other key research and development, manufacturing, sales and marketing employees. The loss of the services of one or more of these employees could have a material adverse effect on our business. We consider retaining Michael R. Davin, our chief executive officer, key to our efforts to develop, sell and market our products and remain competitive. We have entered into an employment agreement with Mr. Davin; however, the employment agreement is terminable by him on short notice and may not ensure his continued service with our company. Our future success will depend in large part upon our ability to attract, retain and motivate highly skilled employees. We cannot be certain that we will be able to do so.
We may seek to acquire companies or technologies that could disrupt our ongoing business, divert the attention of our management and employees and adversely affect our results of operations.
We may, from time to time, evaluate potential strategic acquisitions of other complementary businesses, products or technologies, as well as consider joint ventures and other collaborative projects. We may not be able to identify suitable future acquisition candidates, consummate acquisitions on favorable terms or complete otherwise favorable acquisitions because of antitrust or other regulatory concerns. We cannot assure you that the acquisitions we have completed, including our September 2014 acquisition of substantially all of the assets of Ellman, or any future acquisitions that we may make, will enhance our products or strengthen our competitive position. In particular, we may encounter difficulties assimilating or integrating the acquired businesses, technologies, products, personnel or operations of the acquired companies, and in retaining and motivating key personnel from these businesses. The integration of these businesses may not result in the realization of the full benefits of synergies, cost savings, innovation and operational efficiencies that may be possible from this integration and these benefits may not be achieved within a reasonable period of time.
Our stock price has fluctuated substantially, and we expect it will continue to do so.
Our Class A common stock price has fluctuated substantially in recent years. From January 1, 2012 through December 31, 2014, our Class A common stock has traded as high as $31.48 per share and as low as $11.64 per share. The stock market in general has experienced extreme volatility that has often been unrelated to the operating performance of particular companies. The market price for our Class A common stock may be influenced by many factors, including:
| • | the success of competitive products or technologies; |
| • | regulatory developments in the United States and foreign countries; |
| • | developments or disputes concerning patents or other proprietary rights; |
| • | the recruitment or departure of key personnel; |
| • | variations in our financial results or those of companies that are perceived to be similar to us; |
| • | market conditions in our industry and issuance of new or changed securities analysts’ reports or recommendations; and |
30
Table of Contents
| • | general economic, industry and market conditions. |
In addition, if the stock market in general experiences a loss of investor confidence, the trading price of our Class A common stock could decline for reasons unrelated to our business, financial condition or results of operations.
The shelf registration statement on Form S-3 that was declared effective on October 26, 2012, which we refer to as the shelf registration statement, permits us and El.En. to offer and sell shares of our common stock in one or more offerings, which could adversely affect our stock price. A decline in our stock price could result in the loss of all or a part of our stockholders’ investments.
Our common stock could be further diluted by the conversion of outstanding options and restricted stock units.
In the past, we have issued and still have outstanding convertible securities in the form of options and restricted stock units. We may continue to issue options, restricted stock units, and other equity rights as compensation for services and incentive compensation for our employees, directors and consultants or others who provide services to us. We have a substantial number of shares of common stock reserved for issuance upon the conversion and exercise of these securities. Such a conversion would dilute our stockholders and could adversely affect the market price of our common stock.
We may not be able to successfully collect licensing royalties.
Portions of our revenues consist of royalties from sub-licensing patents, including patents licensed to us on an exclusive basis by MGH. These patents expired in the United States on February 1, 2015 and their foreign counterparts will expire in several foreign jurisdictions on January 31, 2016. If we are unable to collect our licensing royalties, our revenues will decline. In addition, though we receive royalty revenues on other patents, our revenues will decline as a result of the expiration of the MGH patents because we will no longer receive any royalties from such patents.
We face risks associated with product warranties.
We could incur substantial costs as a result of product failures for which we are responsible under warranty obligations.
If we are unable to protect our information technology infrastructure against service interruptions, data corruption, cyber-based attacks or network security breaches, our reputation, business and operating results may suffer.
We rely on information technology networks and systems, including the Internet, to process and transmit sensitive electronic information and to manage or support a variety of business processes and activities, including procurement and supply chain, manufacturing, distribution, and invoicing and collection of payments for our products. We use enterprise information technology systems to record, process, and summarize financial information and results of operations for internal reporting purposes and to comply with regulatory financial reporting, legal, and tax requirements. Our information technology systems, some of which are managed by third parties, are susceptible to damage, disruptions or shutdowns due to failures during the process of upgrading or replacing software, databases or components thereof, power outages, hardware failures, computer viruses, attacks by computer hackers, telecommunication failures, user errors or catastrophic events. If our information technology systems suffer severe damage, disruption or shutdown and we are unable to effectively resolve the issues in a timely manner, our reputation, business and operating results may suffer.
31
Table of Contents
Risks Related to Our Reliance on Third Parties
If we fail to obtain key components of our products from our sole source or limited source suppliers or service providers, our ability to manufacture and sell our products would be impaired and our business could be materially harmed.
We depend on sole or limited suppliers of certain components and systems that are critical to the products that we manufacture and sell, and to which the significant majority of our revenues are attributable. We depend on a single contract manufacturer in the United States for the subassembly of certain products that we manufacture and sell, and for the manufacturing of certain products that we sell, and to which a significant portion of our revenues are attributable to these products. We depend on El.En. for the SLT II laser system that we integrate with our own proprietary software and delivery systems into our SmartLipo Triplex, Cellulaze systems and PrecisionTx. We also depend on El.En. for the MonaLisa Touch laser system (for further information regarding our distribution agreements with El.En. please see the discussion on page 15). We use Alexandrite rods to manufacture the lasers for our Elite and PicoSure products and Nd:YAG rods to manufacture the lasers for our RevLite / MedLite C6 products. We depend exclusively on Northrop Grumman SYNOPTICS to supply both the Alexandrite and Nd:YAG rods to us, and we are aware of no alternative supplier of Alexandrite rods meeting our quality standards. We use gaussian mirrors and polarizers to manufacture our RevLite / MedLite C6 product lines, for which we depend exclusively on Channel Islands Opto-Mechanical Engineering and JDS Uniphase Corporation, respectively. We offer our SmartCool treatment cooling systems for use with our laser aesthetic treatment systems, and we depend exclusively on Zimmer Elektromedizin GmbH to supply SmartCool systems to us. In addition, one third party supplier assembles and tests many of the components and subassemblies for our Elite, Cynergy, SmoothShapes XV and Accolade product families. We use diode laser subassemblies from IPG Photonics to manufacture our Aspire® body sculpting system with SlimLipo handpiece, and we use diode laser bars from Coherent to manufacture our Vectus Laser. Although alternative suppliers exist for the diode laser subassemblies and diode laser bars, they could take months to qualify and implement.
Other than with El.En., we do not have long-term arrangements with any of our suppliers or our contract manufacturer for the supply of these components or systems or with the assembly and test service provider referenced above, but instead purchase from them on a purchase order basis. Northrop Grumman SYNOPTICS, Channel Islands Opto-Mechanical Engineering, JDS Uniphase, Zimmer Elektromedizin, IPG Photonics and Coherent are not required, and may not be able or willing, to meet our future requirements at current prices, or at all.
Under our agreements with El.En. and our purchase order arrangements with our other suppliers and service providers, we are vulnerable to supply shortages and cessations and price fluctuations with respect to these critical components and systems and services. Such shortages or cessations could occur either as a result of breach by El.En. or us of our distribution agreements, or as a result of other types of business decisions made by El.En. or other suppliers and service providers. Any extended interruption in our supplies of these components or systems or in the assembly and test services could materially harm our business.
We rely on third party distributors to market, sell and service a significant portion of our products. If these distributors do not commit the necessary resources to effectively market, sell and service our products or if our relationships with these distributors are disrupted, our business and operating results may be harmed.
In the United States, Canada, Mexico, France, Morocco, Germany, Spain, the United Kingdom, Australia, China, Japan and Korea, we sell our products through our internal sales organization. Outside of these markets, we sell our products through third party distributors. Our home-use laser system for the treatment of wrinkles, which launched in the United States in the second quarter of 2014, is sold by Unilever. Our sales and marketing success in these other markets depends on these distributors, in particular their sales and service expertise and relationships with the customers in the marketplace. Sales of our aesthetic treatment systems by third party distributors represented 21%, 25% and 25% of our product revenue in 2014, 2013, and 2012, respectively.
32
Table of Contents
We do not control our distributors or Unilever, and these parties may not be successful in marketing our products. These parties may fail to commit the necessary resources to market and sell our products to the level of our expectations. Currently, we have written distributor agreements in place with most of our third party distributors and a distribution and licensing agreement in place with Unilever. We cannot be sure that our distributors or Unilever will agree with our interpretation of the terms of the agreements or that we will receive payments under the agreements. The third party distributors with which we do not have written distributor agreements may also disagree with the terms of our relationship. Our distributors and Unilever may terminate their relationships with us and stop selling and servicing our products with little or no notice. If current or future third party distributors or other parties that sell our products do not perform adequately, or if we fail to maintain our existing relationships with these parties or fail to recruit and retain distributors in particular geographic areas, our revenue from international sales may be adversely affected and our operating results could suffer. If Unilever fails to successfully sell the home-use product or we fail to maintain our relationship with Unilever, this could have an adverse effect on our business, results of operations and financial condition.
Risks Related to Our Relationship with El.En. and Our Corporate Structure
El.En. and its subsidiaries market and sell products that compete with our products, and any increased competition from El.En. could have a material adverse effect on our business.
El.En. is a leading laser manufacturer in Europe and a leading light-based medical device manufacturer worldwide. El.En. and its subsidiaries develop and produce laser systems with scientific, industrial, commercial and medical applications. Under exclusive distribution agreements with El.En., we purchase from El.En. its proprietary SmartLipo MPX system and its SLT II laser system. The SLT II laser system is an essential component of our SmartLipo Triplex and Cellulaze systems, which also incorporate our proprietary software and delivery systems. We also depend on El.En. for the MonaLisa Touch laser system (for further information regarding our distribution agreements with El.En. please see the discussion on page 15).
El.En. markets, sells, promotes and licenses other products that compete with our products, both in North America and elsewhere throughout the world, and our agreements with El.En. do not prevent El.En. from competing with us by selling products that we purchased in the past from El.En., including earlier generation SmartLipo systems. In the event that the applicable agreement terminates, El.En. would be able to compete with us worldwide with the SmartLipo MPX system, with products containing the SLT II laser system and with the MonaLisa Touch product line. Our business could be materially and adversely affected by increased competition from El.En.
Provisions in our corporate charter documents and under Delaware law may delay or prevent attempts by our stockholders to change our management and hinder efforts to acquire a controlling interest in us.
Provisions of our certificate of incorporation and bylaws may discourage, delay or prevent a merger, acquisition or other change in control that stockholders may consider favorable, including transactions in which our stockholders might otherwise receive a premium for their shares. These provisions may also prevent or frustrate attempts by our stockholders to replace or remove our management. These provisions include:
| • | the classification of the members of our board of directors; |
| • | limitations on the removal of our directors; |
| • | advance notice requirements for stockholder proposals and nominations; |
| • | the inability of stockholders to act by written consent or to call special meetings; and |
| • | the ability of our board of directors to designate the terms of and issue new series of preferred stock without stockholder approval, which could be used to institute a “poison pill” that would work to dilute the stock ownership of a potential hostile acquirer, effectively preventing acquisitions that have not been approved by our board of directors. |
33
Table of Contents
The affirmative vote of the holders of at least 75% of our shares of capital stock entitled to vote is necessary to amend or repeal the above provisions of our certificate of incorporation. In addition, absent approval of our board of directors, our bylaws may only be amended or repealed by the affirmative vote of the holders of at least 75% of the voting power of our shares of capital stock entitled to vote. In addition, Section 203 of the Delaware General Corporation Law prohibits a publicly held Delaware corporation from engaging in a business combination with an interested stockholder, generally a person which together with its affiliates owns or within the last three years has owned 15% of our voting stock, for a period of three years after the date of the transaction in which the person became an interested stockholder, unless the business combination is approved in a prescribed manner. Accordingly, Section 203 may discourage, delay or prevent a change in control of our company.
Risks Related to Intellectual Property
If we infringe or are alleged to infringe intellectual property rights of third parties, our business could be adversely affected.
Our products may infringe or be claimed to infringe patents or patent applications under which we do not hold licenses or other rights. Third parties may own or control these patents and patent applications in the United States and abroad. These third parties could bring claims against us that would cause us to incur substantial expenses and, if successfully asserted against us, could cause us to pay substantial damages. Further, if a patent infringement suit were brought against us, we could be forced to stop or delay manufacturing or sales of the product that is the subject of the suit.
As a result of patent infringement claims, or in order to avoid potential claims, we may choose or be required to seek a license from the third party and be required to pay license fees or royalties or both, as we did in a 2006 patent license agreement with Palomar. Such licenses may not be available on acceptable terms, or at all. Even if we were able to obtain a license, the rights may be nonexclusive, which could result in our competitors gaining access to the same intellectual property. Ultimately, we could be forced to cease some aspect of our business operations if, as a result of actual or threatened patent infringement claims, we are unable to enter into licenses on acceptable terms. This could harm our business significantly.
There has been substantial litigation and other proceedings regarding patent and other intellectual property rights in our industry. In addition to infringement claims against us, we may become a party to other types of patent litigation and other proceedings, including reexamination proceedings, inter partes or post-grant review or interference proceedings declared by the U.S. Patent and Trademark Office and opposition proceedings in the European Patent Office, regarding intellectual property rights with respect to our products and technology. The cost to us of any patent litigation or other proceeding, even if resolved in our favor, could be substantial. Some of our competitors may be able to sustain the costs of such litigation or proceedings more effectively than we can because of their greater financial resources. Uncertainties resulting from the initiation and continuation of patent litigation or other proceedings could have a material adverse effect on our ability to compete in the marketplace. Patent litigation and other proceedings may also absorb significant management time.
If we are unable to obtain or maintain intellectual property rights relating to our technology and products, the commercial value of our technology and products will be adversely affected and our competitive position could be harmed.
Our success and ability to compete depends in part upon our ability to obtain protection in the United States and other countries for our products by establishing and maintaining intellectual property rights relating to or incorporated into our technology and products. We own numerous patents and patent applications in the United States and corresponding patents and patent applications in many foreign jurisdictions. We do not know how successful we would be in any instance in which we asserted our patents against suspected infringers. Our pending and future patent applications may not issue as patents or, if issued, may not issue in a form that would be advantageous to us. Even if issued, our patents may be challenged, narrowed, invalidated or circumvented,
34
Table of Contents
which could limit our ability to stop competitors from marketing similar products or limit the length of term of patent protection we may have for our products. Changes in either patent laws or in interpretations of patent laws in the United States and other countries may diminish the value of our intellectual property or narrow the scope of our patent protection.
If we are unable to protect the confidentiality of our proprietary information and know-how, the value of our technology and products could be adversely affected.
In addition to patented technology, we rely upon unpatented proprietary technology, processes and know-how. We generally seek to protect this information in part by confidentiality agreements with our employees, consultants and third parties. These agreements may be breached, and we may not have adequate remedies for any such breach. In addition, our trade secrets may otherwise become known or be independently developed by competitors.
Risks Related to Government Regulation
If we fail to obtain and maintain necessary FDA clearances for our products and indications or if clearances for future products and indications are delayed or not issued, our business would be harmed.
Our products are classified as medical devices and are subject to extensive regulation by the FDA and other federal, state and local authorities. These regulations relate to manufacturing, labeling, sale, promotion, distribution, importing and exporting and shipping of our products. In the United States, before we can market a new medical device, or a new use of, or claim for, an existing product, we must first receive either 510(k) clearance or premarket approval from the FDA, unless an exemption applies. Both of these processes can be expensive and lengthy and entail significant user fees, unless exempt. The FDA’s 510(k) clearance process often takes from three to 12 months. The FDA may require us to withdraw an application if they cannot make a determination that the device is substantially equivalent according to the regulations. In such situations, we may re-submit the 510(k) application with additional data for reconsideration or we may determine not to commercialize the device or the new indication for use. The process of obtaining premarket approval is much more costly and uncertain than the 510(k) clearance process. It generally takes from one to three years, or even longer, from the time the premarket approval application is submitted to the FDA until an approval is obtained.
In order to obtain premarket approval and, in some cases, a 510(k) clearance, a product sponsor must conduct well controlled clinical trials designed to test the safety and effectiveness of the product. Conducting clinical trials generally entails a long, expensive and uncertain process that is subject to delays and failure at any stage. The data obtained from clinical trials may be inadequate to support approval or clearance of a submission. In addition, the occurrence of unexpected findings in connection with clinical trials may prevent or delay obtaining approval or clearance. If we conduct clinical trials, they may be delayed or halted, or be inadequate to support approval or clearance, for numerous reasons, including:
| • | the FDA, other regulatory authorities or an institutional review board may place a clinical trial on hold; |
| • | patients may not enroll in clinical trials, or patient follow-up may not occur, at the rate we expect; |
| • | patients may not comply with trial protocols; |
| • | institutional review boards and third party clinical investigators may delay or reject our trial protocol; |
| • | third party clinical investigators may decline to participate in a trial or may not perform a trial on our anticipated schedule or consistent with the clinical trial protocol, good clinical practices, or other FDA requirements; |
| • | third party organizations may not perform data collection and analysis in a timely or accurate manner; |
| • | regulatory inspections of our clinical trials or manufacturing facilities may, among other things, require us to undertake corrective action or suspend or terminate our clinical trials, or invalidate our clinical trials; |
35
Table of Contents
| • | changes in governmental regulations or administrative actions; and |
| • | the interim or final results of the clinical trials may be inconclusive or unfavorable as to safety or effectiveness. |
Medical devices may be marketed only for the indications for which they are approved or cleared. The FDA may not approve or clear indications that are necessary or desirable for successful commercialization. Indeed, the FDA may refuse our requests for 510(k) clearance or premarket approval of new products, new intended uses or modifications to existing products. Our clearances can be revoked if safety or effectiveness problems develop.
After clearance or approval of our products, we are subject to continuing regulation by the FDA, and if we fail to comply with FDA regulations, our business could suffer.
Even after clearance or approval of a product, we are subject to continuing regulation by the FDA, including the requirements that our facility be registered and our devices listed with the agency. We are subject to Medical Device Reporting regulations, which require us to report to the FDA if our products may have caused or contributed to a death or serious injury or malfunction in a way that would likely cause or contribute to a death or serious injury if the malfunction were to recur. We must report corrections and removals to the FDA where the correction or removal was initiated to reduce a risk to health posed by the device or to remedy a violation of the Federal Food, Drug, and Cosmetic Act caused by the device that may present a risk to health, and maintain records of other corrections or removals. The FDA closely regulates promotion and advertising and our promotional and advertising activities could come under scrutiny. If the FDA objects to our promotional and advertising activities or finds that we failed to submit reports under the Medical Device Reporting regulations, for example, the FDA may allege our activities resulted in violations.
The FDA and state authorities have broad enforcement powers. Our failure to comply with applicable regulatory requirements could result in enforcement action by the FDA or state agencies, which may include any of the following sanctions:
| • | untitled letters, warning letters, fines, injunctions, consent decrees and civil penalties; |
| • | repair, replacement, refunds, recall or seizure of our products; |
| • | operating restrictions or partial suspension or total shutdown of production; |
| • | refusing or delaying our requests for 510(k) clearance or premarket approval of new products or new intended uses; |
| • | withdrawing 510(k) clearance or premarket approvals that have already been granted; and |
| • | criminal prosecution. |
If any of these events were to occur, they could harm our business.
Federal regulatory reforms may adversely affect our ability to sell our products profitably.
From time to time, legislation is drafted and introduced in Congress that could significantly change the statutory provisions governing the clearance or approval, manufacture and marketing of a device. In addition, FDA regulations and guidance are often revised or reinterpreted by the agency in ways that may significantly affect our business and our products. For example, the FDA had proposed changing its standards for determining when a medical device modification must receive premarket clearance or approval. Although Congress objected to these revised standards, it is possible that the FDA will seek to implement these or similar changes in the future.
In addition, most of the products and systems that we sell became subject in 2013 to a new excise tax on sales of certain medical devices in the United States after December 31, 2012 by the manufacturer, producer or
36
Table of Contents
importer in an amount equal to 2.3% of the sale price. Under the law, additional charges, including warranties, may be deemed to be included in the sale price for purposes of determining the amount of the excise tax. We believe this excise tax could harm our sales and reduce our profitability.
The Patient Protection and Affordable Care Act includes reporting and disclosure requirements, commonly referred to as the “Sunshine Act”, for manufacturers of drugs, biological, medical devices and medical supplies with regard to payments or other transfers of value made to certain physicians and teaching hospitals. The final rules implementing the Sunshine Act are complex, ambiguous, and broad in scope. Sales related to the Ellman surgical product line are subject to the reporting requirements under the Sunshine Act. We believe that sales related to our aesthetic product lines fall under a reporting exception under this law and, accordingly, reporting related to those sales is not required.
Our compliance with applicable legal and regulatory requirements is, and will continue to be, costly and time consuming. It is impossible to predict whether other legislative changes will be enacted or government regulations, guidance or interpretations changed, and what the impact of such changes, if any, may be. If we are found to be in violation of any of this or any other law, we may be subject to penalties, including fines.
We have modified some of our products without FDA clearance. The FDA could retroactively determine that the modifications were improper and require us to stop marketing and recall the modified products.
Any modifications to one of our FDA-cleared devices that could significantly affect its safety or effectiveness, or that would constitute a major change in its intended use, requires a new 510(k) clearance or a premarket approval. We may be required to submit extensive pre-clinical and clinical data depending on the nature of the changes. We may not be able to obtain additional 510(k) clearances or premarket approvals for modifications to, or additional indications for, our existing products in a timely fashion, or at all. Delays in obtaining future clearances or approvals would adversely affect our ability to introduce new or enhanced products in a timely manner, which in turn would harm our revenue and operating results. We have made modifications to our devices in the past and may make additional modifications in the future that we believe do not or will not require additional clearances or approvals. If the FDA disagrees, and requires new clearances or approvals for the modifications, we may be required to recall and to stop marketing the modified devices, which could harm our operating results and require us to redesign, among other things, our products.
If we fail to comply with the FDA’s Quality System Regulation and laser performance standards, our manufacturing operations could be halted, and our business would suffer.
We are currently required to demonstrate and maintain compliance with the FDA’s Quality Systems Regulation. The QSR is a complex regulatory scheme that covers the methods and documentation of the design, testing, control, manufacturing, labeling, quality assurance, packaging, storage and shipping of our products. Because our products involve the use of lasers, our products also are covered by a performance standard for lasers set forth in FDA regulations. The laser performance standard imposes specific record keeping, reporting, product testing and product labeling requirements. These requirements include affixing warning labels to laser products as well as incorporating certain safety features in the design of laser products. The FDA enforces the QSR and laser performance standards through periodic unannounced inspections. We have been, and anticipate in the future being, subject to such inspections. Our failure to comply with the QSR or to take satisfactory corrective action in response to an adverse QSR inspection or our failure to comply with applicable laser performance standards could result in enforcement actions, including a public warning letter, a shutdown of or restrictions on our manufacturing operations, delays in approving or clearing a product, refusal to permit the import or export of our products, a recall or seizure of our products, fines, injunctions, civil or criminal penalties, or other sanctions, such as those described in the preceding paragraphs, any of which could cause our business and operating results to suffer.
37
Table of Contents
If we fail to comply with state laws and regulations, or if state laws or regulations change, our business could suffer.
In addition to FDA regulations, most of our products are also subject to state regulations relating to their sale and use. These regulations are complex and vary from state to state, which complicates monitoring compliance. In addition, these regulations are in many instances in flux. For example, federal regulations allow our prescription products to be sold to or on the order of “licensed practitioners,” that is, practitioners licensed by law to use or order the use of a prescription device. Licensed practitioners are defined on a state-by-state basis. As a result, some states permit non-physicians to purchase and operate our products, while other states do not. Additionally, a state could change its regulations at any time to prohibit sales to particular types of customers. We believe that, to date, we have sold our prescription products only to licensed practitioners. However, our failure to comply with state laws or regulations and changes in state laws or regulations may adversely affect our business.
We, or our distributors, may be unable to obtain or maintain international regulatory qualifications or approvals for our current or future products and indications, which could harm our business.
Sales of our products outside the United States are subject to foreign regulatory requirements that vary widely from country to country. In many countries, our third party distributors are responsible for obtaining and maintaining regulatory approvals for our products. We do not control our third party distributors, and they may not be successful in obtaining or maintaining these regulatory approvals. In addition, the FDA regulates exports of medical devices from the United States.
Complying with international regulatory requirements can be an expensive and time consuming process, and approval is not certain. The time required to obtain foreign clearances or approvals may be longer than that required for FDA clearance or approval, and requirements for such clearances or approvals may differ significantly from FDA requirements. Foreign regulatory authorities may not clear or approve our products for the same indications cleared or approved by the FDA. The foreign regulatory approval process may include all of the risks associated with obtaining FDA clearance or approval in addition to other risks. Although we or our distributors have obtained regulatory approvals in the European Union and other countries outside the United States for many of our products, we or our distributors may be unable to maintain regulatory qualifications, clearances or approvals in these countries or obtain qualifications, clearances or approvals in other countries. If we are not successful in doing so, our business will be harmed. We may also incur significant costs in attempting to obtain and in maintaining foreign regulatory clearances, approvals or qualifications. Foreign regulatory agencies, as well as the FDA, periodically inspect manufacturing facilities both in the United States and abroad. If we experience delays in receiving necessary qualifications, clearances or approvals to market our products outside the United States, or if we fail to receive those qualifications, clearances or approvals, or if we fail to comply with other foreign regulatory requirements, we and our distributors may be unable to market our products or enhancements in international markets effectively, or at all. Additionally, the imposition of new requirements may significantly affect our business and our products. We may not be able to adjust to such new requirements.
Risks Related to Litigation
Product liability and business liability suits could be brought against us due to defective design, material or workmanship or due to misuse of our products. These lawsuits could be expensive and time consuming and result in substantial damages to us and increases in our insurance rates.
If our products are defectively designed, manufactured or labeled, contain defective components or are misused, we may become subject to substantial and costly litigation by our customers or their patients or clients. Misusing our products or failing to adhere to operating guidelines for our products can cause severe burns or other significant damage to the eyes, skin or other tissue. If our products fail to function properly, we may be required to conduct product recalls and our customers may lose the ability to treat their patients or clients
38
Table of Contents
resulting in a loss of business for our customers. We are routinely involved in claims related to the use of our products. Product liability and business liability claims could divert management’s attention from our core business, be expensive to defend and result in sizable damage awards against us. Our current insurance coverage may not apply or may not be sufficient to cover these claims, and the coverage we have is subject to deductibles for which we are responsible. Moreover, in the future, we may not be able to obtain insurance in amount or scope sufficient to provide us with adequate coverage against potential liabilities. Any product liability or other claims brought against us, with or without merit, could increase our product liability insurance rates or prevent us from securing continuing coverage, could harm our reputation in the industry and reduce product sales. We would need to pay any losses in excess of our insurance coverage out of cash reserves, harming our financial condition and adversely affecting our operating results.
We may incur substantial expenses if our past practices are shown to have violated the Telephone Consumer Protection Act.
We previously used facsimiles to disseminate information about our clinical workshops to large numbers of customers and potential customers. These facsimiles were transmitted by third parties retained by us, and were sent to recipients whose facsimile numbers were supplied by us as well as other recipients whose facsimile numbers we purchased from other sources. In May 2005, we stopped sending unsolicited facsimiles to customers and potential customers.
Under the federal Telephone Consumer Protection Act, or TCPA, recipients of unsolicited facsimile “advertisements” may be entitled to damages of up to $500 per facsimile for inadvertent violations and up to $1,500 per facsimile for knowing or willful violations. Recipients of unsolicited facsimile advertisements may seek enforcement of the TCPA in state courts. The TCPA also permits states to initiate a civil action in a federal district court to enforce the TCPA against a party who engages in a pattern or practice of violations of the TCPA. In addition, complaints may be filed with the Federal Communications Commission, which has the power to assess penalties against parties for violations of the TCPA.
In 2005, a plaintiff, individually and as putative representative of a purported class, filed a complaint against us under the TCPA in Massachusetts Superior Court in Middlesex County seeking monetary damages, injunctive relief, costs and attorneys’ fees. The complaint alleged that we violated the TCPA by sending unsolicited advertisements by facsimile to the plaintiff and other recipients without the prior express invitation or permission of the recipients. Based on discovery in this matter, the plaintiff alleges that approximately three million facsimiles were sent on our behalf by a third party to approximately 100,000 individuals. In January 2012, the court denied the class certification motion. In November 2012, the court issued the final judgment and awarded the plaintiff $6,000 in damages and awarded us $3,495 in costs. The plaintiff appealed this decision and oral argument on the appeal was heard in October 2013 before the Commonwealth of Massachusetts Appeals Court. In March 2014, the appeals court affirmed the lower court’s ruling, and in April 2014 plaintiff filed a request for further appellate review by the Supreme Judicial Court. On May 6, 2014, the Supreme Judicial Court issued a Notice of Denial of Application for Further Appellate Review. No further appeals are possible in Massachusetts. In addition, in July 2012, the plaintiff filed a new purported class action, based on the same operative facts and asserting the same claims as in the Massachusetts action, in federal court in the Eastern District of New York. In February 2013 that court granted our motion to dismiss the plaintiff’s claims. In March 2013, the plaintiff drafted a motion seeking reconsideration of the court’s judgment and vacation of the court’s order of dismissal. In April 2013, we drafted a response opposing the plaintiff’s motion. On August 14, 2013, plaintiff filed its motion with the court, although the deadline had been April 26, 2013. We filed a letter with the court objecting to this untimely motion and requesting sanctions. On February 6, 2014, the court denied plaintiff’s motion and denied our request for sanctions. On March 6, 2014, plaintiff filed an appeal of the court’s judgment entered on March 5, 2013. On July 23, 2014, the Second Circuit notified the parties that it will not hear oral arguments and will decide the case based on the briefs.
We are vigorously defending these lawsuits. However, litigation is subject to numerous uncertainties and we are unable to predict the ultimate outcome of this or any other matter. Moreover, the amount of any potential
39
Table of Contents
liability in connection with this lawsuit will depend, to a large extent, on whether a class in a class action lawsuit is certified and, if one is certified, on the scope of the class, neither of which we can predict at this time.
These and any future lawsuits that we may face regarding these issues could materially and adversely affect our results of operations, cash flows and financial condition, cause us to incur significant expenses and divert the attention of our management and key personnel from our business operations.
Employment related lawsuits could be brought against us for improper termination of employment, sexual harassment, hostile work environment and other claims. These lawsuits could be expensive and time consuming and result in substantial damages to us and increases in our insurance rates.
If we terminate employment for improper reasons or fail to provide an appropriate work environment or it is alleged that we did so, we may become subject to substantial and costly litigation by our former and current employees. We are routinely involved in claims related to improper termination and other claims. Such claims could divert management’s attention from our core business, be expensive to defend and result in sizable damage awards against us. Our current insurance coverage may not apply or may not be sufficient to cover these claims, and the coverage we have is subject to deductibles for which we are responsible. Moreover, in the future, we may not be able to obtain insurance in amount or scope sufficient to provide us with adequate coverage against potential liabilities. Any employment related claims brought against us, with or without merit, could increase our employment law insurance rates or prevent us from securing continuing coverage, could harm our reputation in the industry and reduce product sales. We would need to pay any losses in excess of our insurance coverage out of cash reserves, harming our financial condition and adversely affecting our operating results.
| Item 1B. | Unresolved Staff Comments |
None.
| Item 2. | Properties |
We lease a 144,500 square foot facility in Westford, Massachusetts which houses our executive offices and our manufacturing, research and development and warehouse operations. The lease on this facility expires in May 2027. In addition, we lease an aggregate of approximately 68,000 square feet of space at 17 other locations in Europe and the Asia/Pacific region, which we use for sales and service purposes.
| Item 3. | Legal Proceedings |
Telephone Consumer Protection Act Litigation
In 2005, a plaintiff, individually and as putative representative of a purported class, filed a complaint against us under the federal Telephone Consumer Protection Act (TCPA) in Massachusetts Superior Court in Middlesex County, captioned Weitzner v. Cynosure, Inc., No. MICV2005-01778 (Superior Court, Middlesex County), seeking monetary damages, injunctive relief, costs and attorneys’ fees. The complaint alleges that we violated the TCPA by sending unsolicited advertisements by facsimile to the plaintiff and other recipients without the prior express invitation or permission of the recipients. Under the TCPA, recipients of unsolicited facsimile advertisements are entitled to damages of up to $500 per facsimile for inadvertent violations and up to $1,500 per facsimile for knowing or willful violations. Based on discovery in this matter, the plaintiff alleges that approximately three million facsimiles were sent on our behalf by a third party to approximately 100,000 individuals. In January 2012, the court denied the class certification motion. In November 2012, the court issued the final judgment and awarded the plaintiff $6,000 in damages and awarded us $3,495 in costs. The plaintiff appealed this decision, and oral argument on the appeal was held in October 2013 before the Commonwealth of Massachusetts Appeals Court. In March 2014, the appeals court affirmed the lower court’s ruling, and in April 2014 the plaintiff filed a request for further appellate review by the Supreme Judicial Court. On May 6, 2014, the Supreme Judicial Court issued a Notice of Denial of Application for Further Appellate Review. No further
40
Table of Contents
appeals are possible in Massachusetts. In addition, in July 2012, the plaintiff filed a new purported class action, based on the same operative facts and asserting the same claims as in the Massachusetts action, in federal court in the Eastern District of New York, captioned Weitzner, et al. v. Cynosure, Inc., No. 1:12-cv-03668-MKB-RLM (U.S District Court, Eastern District of New York). In February 2013, that court granted our motion to dismiss the plaintiff’s claims. In March 2013, the plaintiff drafted a motion seeking reconsideration of the court’s judgment and vacation of the court’s order of dismissal. In April 2013, we drafted a response opposing the plaintiff’s motion. In August 2013, plaintiff filed its motion with the court, although the deadline had been April 2013. We filed a letter with the court objecting to this untimely motion and requesting sanctions. In February 2014, the court denied plaintiff’s motion and denied our request for sanctions. On March 6, 2014, plaintiff filed an appeal of the court’s judgment entered on March 5, 2013. On July 23, 2014, the Second Circuit notified the parties that it will not hear oral arguments and will decide the case based on the briefs.
Merger Litigation
On March 21, 2013, a putative stockholder class action complaint, captioned Edgar Calin v. Palomar Medical Technologies, Inc., et al., No. 13-1051 BLS1 (Superior Court, Suffolk County), was filed against Palomar, its board of directors, us and Commander Acquisition, LLC, a Delaware limited liability company and our wholly-owned subsidiary (Commander), in Massachusetts Superior Court in Suffolk County. On April 9, 2013, a second putative stockholder class action complaint, captioned Vladimir Gusinsky Living Trust v. Palomar Medical Technologies, Inc., et al., No. 13-1328 BLS1 (Superior Court, Suffolk County), was filed against Palomar, its board of directors and us in Massachusetts Superior Court in Suffolk County. On April 12, 2013, a third putative stockholder class action complaint, captioned Albert Saffer v. Palomar Medical Technologies, Inc. et al., No. 13-1385 BLS1 (Superior Court, Suffolk County), was filed against Palomar, its board of directors, us and Commander in Massachusetts Superior Court in Suffolk County, which we refer to collectively with Edgar Calin and Vladimir Gusinsky Living Trust as the Massachusetts State Actions. On April 23, 2013, each of the plaintiffs in the foregoing suits filed an amended complaint. Each amended complaint alleges that members of the Palomar board of directors breached their fiduciary duties in connection with the approval of the merger contemplated by the agreement and plan of merger, dated as of March 17, 2013, by and among Palomar, us and Commander, and that we and, with respect to the Calin and Saffer suits, Commander, aided and abetted the alleged breach of fiduciary duties. Each amended complaint alleges that the Palomar directors breached their fiduciary duties in connection with the proposed transaction by, among other things, conducting a flawed sale process and failing to maximize stockholder value and obtain the best financial and other terms, and that the registration statement filed by us is materially deficient. Each of these plaintiffs seeks injunctive and other equitable relief, including enjoining the defendants from consummating the merger, in addition to other unspecified damages, fees and costs. The plaintiffs in the Massachusetts State Actions moved to expedite the proceedings on May 1, 2013 and moved to consolidate the actions on May 1, 2013. On May 13, 2013, each of the defendants in the Massachusetts State Actions filed an opposition to expedite, an opposition to consolidate and a cross motion to stay its respective action. On May 16, 2013, each of the plaintiffs filed oppositions to defendants’ cross motion to stay. On May 17, 2013, the Massachusetts Superior Court issued an order denying plaintiffs’ motion for expedited proceedings and granting defendants’ cross motion to stay the Massachusetts State Actions.
On April 19, 2013, a fourth putative stockholder class action complaint, captioned Gary Drabek v. Palomar Medical Technologies, Inc. et al., No. 8491, (Del. Ch.) was filed against Palomar, its board of directors, us and Commander in Delaware Chancery Court. On May 1, 2013, a fifth putative stockholder class action complaint, captioned Daniel Moore v. Palomar Medical Technologies, Inc. et al., No. 8516, (Del. Ch.) was filed against Palomar, its board of directors, us and Commander in Delaware Chancery Court. Each of the foregoing lawsuits alleges that members of the Palomar board of directors breached their fiduciary duties in connection with the approval of the merger and that we and Commander aided and abetted the alleged breach of fiduciary duties. Each complaint alleges that the Palomar directors breached their fiduciary duties in connection with the proposed transaction by, among other things, conducting a flawed sale process and failing to maximize stockholder value and obtain the best financial and other terms, and that the registration statement filed by us is materially deficient. Each of these plaintiffs seeks injunctive and other equitable relief, including enjoining the defendants from consummating the merger, in addition to other unspecified damages, fees and costs. The plaintiff in the
41
Table of Contents
Drabek action moved to expedite the proceedings on April 29, 2013, and the plaintiff in the Moore action moved to expedite and moved for a preliminary injunction on May 3, 2013. On May 7, 2013, the plaintiffs in the Drabek and Moore actions jointly submitted a proposed order of consolidation to consolidate the class actions as In re Palomar Medical Technologies Shareholder Litigation, C.A. No. 8491-VCP, which order was granted by the court on the same day.
On May 28, 2013, a sixth putative stockholder class action complaint, captioned Melvin Lax v. Palomar Medical Technologies, Inc., et al., No. 13-11276 (D. Mass.) (Massachusetts Federal Action), was filed against Palomar, its board of directors, us, and Commander in the U.S. District Court for the District of Massachusetts. The lawsuit alleges that members of the Palomar board of directors breached their fiduciary duties in connection with the approval of the merger, that we and Commander aided and abetted the alleged breach of fiduciary duties, and that the defendants violated Section 14(a) of the Securities Exchange Act of 1934 and Rule 14a-9 promulgated thereunder by issuing a materially misleading Proxy Statement. Plaintiff seeks injunctive and other equitable relief, including enjoining the defendants from consummating the merger, in addition to other unspecified damages, fees and costs. On August 5, 2013, the parties filed a stipulation and joint motion to stay proceedings.
On June 7, 2013, Palomar entered into a memorandum of understanding, which we refer to as the Delaware Memorandum of Understanding, with the Delaware plaintiffs regarding the settlement of the Delaware putative stockholder class actions and, on June 10, 2013, Palomar filed with the SEC a Current Report on Form 8-K to supplement the Proxy Statement pursuant to the terms of the Delaware Memorandum of Understanding.
On June 14, 2013, Palomar entered into a memorandum of understanding, which we refer to as the Massachusetts Memorandum of Understanding, with the Massachusetts plaintiffs, pursuant to which the plaintiffs in the Massachusetts state and federal actions agreed to be bound by the terms of the Delaware Memorandum of Understanding and on June 14, 2013, Palomar filed with the SEC a Current Report on Form 8-K to supplement the Proxy Statement pursuant to the terms of the Massachusetts Memorandum of Understanding.
The Delaware Memorandum of Understanding and the Massachusetts Memorandum of Understanding contemplate that the parties will enter into a stipulation of settlement. On May 1, 2014, we, Palomar and the Delaware plaintiffs entered into a stipulation of settlement. The stipulation of settlement was filed with the Court of Chancery of the State of Delaware and the court approved the form of notice for mailing to the former stockholders of Palomar. Following notice, the court scheduled a hearing for July 21, 2014 at which the Court of Chancery of the State of Delaware considered the fairness, reasonableness and adequacy of the settlement and approved the settlement, resolved and released all claims that were or could have been brought challenging any aspect of the proposed merger, the merger agreement, and any disclosure made in connection therewith (but excluding claims for appraisal under Section 262 of the Delaware General Corporation Law), and dismissed the Delaware actions with prejudice. The court also awarded the plaintiffs’ counsel attorneys’ fees and expenses in the amount of $420,000 to be paid by Palomar or its successor. As Palomar’s successor, we paid through our insurance company the attorneys’ fees and expenses awarded by the Court of Chancery of the State of Delaware. In addition, also on May 1, 2014, we, Palomar and the Massachusetts plaintiffs filed a joint stipulation seeking dismissal of the Massachusetts State Actions, and the court dismissed the Massachusetts State Actions with prejudice on May 7, 2014. Finally, on July 16, 2014, the parties to the Massachusetts Federal Action informed the court that if the Court of Chancery of the State of Delaware approved the settlement during the July 21, 2014 hearing, the plaintiff would dismiss the Massachusetts Federal Action with prejudice and we will pay the plaintiff an additional amount for his attorneys’ fees and expenses through our insurance company. The Massachusetts Federal Action was dismissed on August 22, 2014.
Asclepion Laser Technologies GmbH, Italian Litigation
In October 2010, Palomar was served with an International Summons for a lawsuit filed in September 2010 by Asclepion Laser Technologies GmbH, or Asclepion, in the Court of Rome in Italy. In this suit, Asclepion
42
Table of Contents
asked the Italian court to declare that Asclepion’s MeDioStar and RubyStar products do not infringe either the Italian or German portions of EP 0 806 913 B1 or EP 1 230 900 B1, which are the first two issued European patents corresponding to U.S. Patent Nos. 5,595,568 and 5,735,844, which are exclusively licensed to Palomar by Massachusetts General Hospital (MGH). We filed a request with the Italian Supreme Court challenging the international jurisdiction of the Italian courts for deciding infringement of the non-Italian parts of the European patents. A hearing was held in May 2013, and in a development contrary to settled Italian case law, the Italian Supreme Court ruled that the Italian courts have jurisdiction over the Italian as well as the German portions of the European patent. Asclepion has resumed its case before the Court of Rome. In March 2014, we, Palomar and MGH entered into a comprehensive settlement agreement with Asclepion which ended the patent disputes between the companies, including this patent dispute, which terminated on April 24, 2014, the Asclepion Laser Technologies GmbH, German Litigation described below, which terminated on March 21, 2014, and pending opposition proceedings before the European Patent Office. This settlement agreement includes a Non-exclusive Patent License Agreement under which Asclepion is granted a non-exclusive, worldwide, fully paid-up license to U.S. Patent Nos. 5,735,844 and 5,595,568 and foreign counterparts, for professional hair removal products and we and Palomar are granted a non-exclusive, worldwide, royalty-free license to certain Asclepion patents. As part of the agreement, Asclepion will make two payments to us for the paid-up license. The first payment was made in March 2014 and the second payment is to be made on the earlier of March 17, 2015 or five business days following an initial public offering by Asclepion or a change of control of Asclepion. MGH will receive 40% of the first and second payments from Asclepion, after deducting our related outside legal costs.
Asclepion Laser Technologies GmbH, German Litigation
In October 2010, prior to being served the International Summons for the above described lawsuit in Italy (see Asclepion Laser Technologies GmbH, Italian Litigation), Palomar commenced an action for patent infringement against Asclepion in the District Court of Düsseldorf, Germany seeking both monetary damages and injunctive relief. The complaint alleged that Asclepion’s MeDioStar and RubyStar products infringe European Patent Number EP 0 806 913, which is the first issued European patent corresponding to U.S. Patent Nos. 5,595,568 and 5,735,844, which are exclusively licensed to Palomar by MGH. This proceeding was stayed by mutual agreement of the parties in January 2011 pending the outcome of Asclepion Laser Technologies GmbH, Italian Litigation and a final decision in opposition proceedings rendered by the European Patent Office, in which Asclepion filed an intervention in December 2010. In March 2014, we, Palomar and MGH entered into a comprehensive settlement agreement with Asclepion which ended the patent disputes between the companies, including this patent dispute, which terminated on March 21, 2014, the Asclepion Laser Technologies GmbH, Italian Litigation described above, which terminated on April 24, 2014, and the pending opposition proceedings before the European Patent Office. This settlement agreement includes a Non-exclusive Patent License Agreement under which Asclepion is granted a non-exclusive, worldwide, fully paid-up license to U.S. Patent Nos. 5,735,844 and 5,595,568 and foreign counterparts, for professional hair removal products and we and Palomar are granted a non-exclusive, worldwide, royalty-free license to certain Asclepion patents. As part of the agreement, Asclepion will make two payments to us for the paid-up license. The first payment was made in March 2014 and the second payment is to be made on the earlier of March 17, 2015 or five business days following an initial public offering by Asclepion or a change of control of Asclepion. MGH will receive 40% of the first and second payments from Asclepion, after deducting our related outside legal costs.
Cirrex Systems LLC
In May 2014, Cirrex Systems LLC, or Cirrex, commenced an action for alleged patent infringement against us in the U.S. District Court for the District of Delaware seeking both monetary damages and injunctive relief. The complaint alleges that our SideLaze800 and SideLaze3D fibers used with our Cellulaze™ laser workstation and PrecisionTx™ laser infringe U.S. Patent Nos. 5,953,477 and 6,144,791. Cirrex is seeking to enjoin us from manufacturing, using or selling these products in the United States if we are found to infringe the patents and to obtain compensatory damages, interest and other relief. On July 21, 2014, we answered the complaint, denying that our products infringe the asserted patents and asserting that the patents are invalid and unenforceable. We
43
Table of Contents
will defend the action vigorously and believe that we have meritorious defenses. However, litigation is unpredictable and we may not prevail in successfully defending or asserting our position. If we do not prevail, we may be ordered to pay damages for past sales and an ongoing royalty for future sales of products found to infringe in the United States. We could also be ordered to stop manufacturing and selling any products in the United States that are found to infringe.
In addition to the matters discussed above, from time to time, we are subject to various claims, lawsuits, disputes with third parties, investigations and pending actions involving various allegations against us incident to the operation of its business, principally product liability. Each of these other matters is subject to various uncertainties, and it is possible that some of these other matters may be resolved unfavorably to us. We establish accruals for losses that management deems to be probable and subject to reasonable estimate. We believe that the ultimate outcome of these other matters will not have a material adverse impact on our consolidated financial position, results of operations or cash flows.
| Item 4. | Mine Safety Disclosures |
None.
44
Table of Contents
PART II
| Item 5. | Market for Registrant’s Common Equity, Related Stockholder Matters and Issuer Purchases of Equity Securities |
Market Price of and Dividends on Our Common Stock and Related Stockholder Matters.
Our Class A common stock trades on The Nasdaq Global Market under the symbol “CYNO.” The following table sets forth, for the periods indicated, the high and low sales prices of our Class A common stock on The Nasdaq Global Market.
| High | Low | |||||||
| Fiscal Year Ended December 31, 2013 |
||||||||
| First quarter |
$ | 30.20 | $ | 23.87 | ||||
| Second quarter |
$ | 27.90 | $ | 23.01 | ||||
| Third quarter |
$ | 29.35 | $ | 21.59 | ||||
| Fourth quarter |
$ | 26.86 | $ | 21.09 | ||||
| Fiscal Year Ended December 31, 2014 |
||||||||
| First quarter |
$ | 31.48 | $ | 25.35 | ||||
| Second quarter |
$ | 29.75 | $ | 19.00 | ||||
| Third quarter |
$ | 23.85 | $ | 18.63 | ||||
| Fourth quarter |
$ | 29.98 | $ | 19.04 | ||||
On March 9, 2015, the closing price per share of our Class A common stock was $29.94, as reported on The Nasdaq Global Market. The number of record holders of our Class A common stock as of March 9, 2015 was 574.
On October 29, 2013, we announced that our board of directors authorized the repurchase of up to $25 million of our Class A common stock, from time to time, on the open market or in privately negotiated transactions under a stock repurchase program. On April 30, 2014, our board of directors approved an increase of $10 million to the stock repurchase program. The program will terminate upon the purchase of $35 million in common stock or expiration of the program on November 1, 2015. During the year ended December 31, 2014, we repurchased 742,179 shares of our common stock at an aggregate cost of $15.6 million and at a weighted average price of $20.96 per share under this program. As of December 31, 2014, approximately $4.1 million remains available to repurchase shares under the program. As of December 31, 2014, we have repurchased an aggregate of 1,395,480 shares under this program at an aggregate cost of $30.9 million.
We did not repurchase any shares of our common stock during the quarter ended December 31, 2014.
We have never paid or declared any cash dividends on our common stock. We currently intend to retain our earnings, if any, to finance the growth and development of our business. Payment of future dividends, if any, will be at the discretion of our board of directors.
At December 31, 2014, our total cash, cash equivalents and short and long-term marketable securities balance was $133.4 million. We did not sell any unregistered securities during the period covered by this Annual Report.
The graph below shows the cumulative total stockholder return of an investment of $100 (and the reinvestment of any dividends thereafter) on December 31, 2009 (the last trading day for the year ended December 31, 2009) in our Class A common stock, the Nasdaq U.S. Index and the Nasdaq Medical Devices, Instruments, Supplies, Manufacturers and Distributors Index. Our stock price performance shown in the graph below is not indicative of future stock price performance.
45
Table of Contents
The following performance graph and related information shall not be deemed to be “soliciting material” or “filed” for purposes of Section 18 of the Securities Exchange Act of 1934, as amended (Exchange Act), nor shall such information be incorporated by reference into any future filing under the Securities Act of 1933, as amended, or Exchange Act, except to the extent that we specifically incorporate it by reference into such filing.
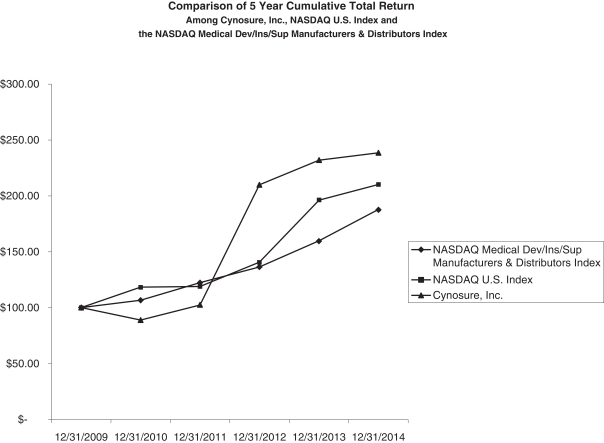
| Name |
12/31/2009 | 12/31/2010 | 12/31/2011 | 12/31/2012 | 12/31/2013 | 12/31/2014 | ||||||||||||||||||
| NASDAQ Medical Dev/Ins/Sup Manufacturers & Distributors Index |
$ | 100.00 | $ | 106.64 | $ | 122.52 | $ | 136.39 | $ | 159.83 | $ | 188.03 | ||||||||||||
| NASDAQ U.S. Index |
$ | 100.00 | $ | 118.43 | $ | 119.06 | $ | 140.85 | $ | 196.13 | $ | 210.10 | ||||||||||||
| Cynosure, Inc. |
$ | 100.00 | $ | 89.03 | $ | 102.35 | $ | 209.83 | $ | 231.85 | $ | 238.64 | ||||||||||||
46
Table of Contents
| Item 6. | Selected Consolidated Financial Data |
The following selected consolidated financial data should be read in conjunction with our consolidated financial statements and the related notes which are included elsewhere in this Annual Report and the “Management’s Discussion and Analysis of Financial Condition and Results of Operations” section of this Annual Report. The consolidated statement of operations data for the years ended December 31, 2014, 2013 and 2012 and the consolidated balance sheet data as of December 31, 2014 and 2013 are derived from our audited consolidated financial statements, which are included elsewhere in this Annual Report. The consolidated statement of operations data for the years ended December 31, 2011 and 2010 and the consolidated balance sheet data as of December 31, 2012, 2011 and 2010 are derived from our audited consolidated financial statements, which are not included in this Annual Report. Our historical results for any prior period are not necessarily indicative of results to be expected for any future period.
On June 24, 2013, we acquired Palomar. Certain adjustments related to Palomar’s opening balance sheet were finalized during the first half of 2014, after the December 31, 2013 financial statements were issued. The adjustments were based on facts that existed at the acquisition date and were finalized using information that came available during the first half of 2014. Under ASC 805, Business Combinations, an acquirer is required to recognize adjustments to provisional amounts during the measurement period as they are identified, and to recognize such adjustments retrospectively – as if the accounting from the business combination had been completed at the acquisition date. As a result, the carrying amount of inventory acquired in the acquisition of Palomar was retrospectively decreased by $3.8 million on June 24, 2013, and the carrying amounts of the deferred tax liability and accounts payable acquired in the acquisition of Palomar were retrospectively increased by $0.2 million and $0.1 million, respectively, on June 24, 2013, with corresponding increases to goodwill. The carrying amount of accrued expenses acquired in the acquisition of Palomar was retrospectively decreased by $23,000 on June 24, 2013, with a corresponding decrease to goodwill. The December 31, 2013 consolidated balance sheet within this Annual Report has been updated to disclose these recast values.
| Year Ended December 31, | ||||||||||||||||||||
| 2014 | 2013 | 2012 | 2011 | 2010 | ||||||||||||||||
| (In thousands, except per share data) | ||||||||||||||||||||
| Consolidated Statement of Operations Data: |
||||||||||||||||||||
| Revenues |
$ | 292,369 | $ | 226,010 | $ | 153,493 | $ | 110,602 | $ | 81,775 | ||||||||||
|
|
|
|
|
|
|
|
|
|
|
|||||||||||
| Cost of revenues |
127,131 | 95,730 | 64,567 | 48,294 | 35,388 | |||||||||||||||
|
|
|
|
|
|
|
|
|
|
|
|||||||||||
| Gross profit |
165,238 | 130,280 | 88,926 | 62,308 | 46,387 | |||||||||||||||
| Operating expenses: |
||||||||||||||||||||
| Sales and marketing |
88,564 | 65,211 | 48,220 | 39,142 | 32,818 | |||||||||||||||
| Research and development |
22,033 | 17,473 | 12,972 | 10,079 | 7,300 | |||||||||||||||
| Amortization of intangible assets acquired |
2,961 | 2,114 | 1,368 | 854 | — | |||||||||||||||
| General and administrative |
30,420 | 51,309 | 14,233 | 14,255 | 11,312 | |||||||||||||||
|
|
|
|
|
|
|
|
|
|
|
|||||||||||
| Total operating expenses |
143,978 | 136,107 | 76,793 | 64,330 | 51,430 | |||||||||||||||
|
|
|
|
|
|
|
|
|
|
|
|||||||||||
| Income (loss) from operations |
21,260 | (5,827 | ) | 12,133 | (2,022 | ) | (5,043 | ) | ||||||||||||
| Interest (expense) income, net |
(1,446 | ) | (23 | ) | 60 | 126 | 163 | |||||||||||||
| Other (expense) income, net |
(1,476 | ) | 313 | 532 | (202 | ) | (224 | ) | ||||||||||||
|
|
|
|
|
|
|
|
|
|
|
|||||||||||
| Income (loss) before (benefit) provision for income taxes |
18,338 | (5,537 | ) | 12,725 | (2,098 | ) | (5,104 | ) | ||||||||||||
| (Benefit) provision for income taxes |
(13,000 | ) | (3,890 | ) | 1,764 | 807 | 442 | |||||||||||||
|
|
|
|
|
|
|
|
|
|
|
|||||||||||
| Net income (loss) |
$ | 31,338 | $ | (1,647 | ) | $ | 10,961 | $ | (2,905 | ) | $ | (5,546 | ) | |||||||
|
|
|
|
|
|
|
|
|
|
|
|||||||||||
| Basic net income (loss) per share |
$ | 1.44 | $ | (0.09 | ) | $ | 0.83 | $ | (0.23 | ) | $ | (0.44 | ) | |||||||
|
|
|
|
|
|
|
|
|
|
|
|||||||||||
| Diluted net income (loss) per share |
$ | 1.41 | $ | (0.09 | ) | $ | 0.79 | $ | (0.23 | ) | $ | (0.44 | ) | |||||||
|
|
|
|
|
|
|
|
|
|
|
|||||||||||
| Basic weighted average common shares outstanding |
21,824 | 19,325 | 13,189 | 12,585 | 12,666 | |||||||||||||||
|
|
|
|
|
|
|
|
|
|
|
|||||||||||
| Diluted weighted average common shares outstanding |
22,195 | 19,325 | 13,792 | 12,585 | 12,666 | |||||||||||||||
|
|
|
|
|
|
|
|
|
|
|
|||||||||||
47
Table of Contents
| 2014 | (Recast) 2013 |
2012 | 2011 | 2010 | ||||||||||||||||
| Consolidated Balance Sheet Data: |
||||||||||||||||||||
| Cash, cash equivalents, marketable securities, investments and related financial instruments |
$ | 133,375 | $ | 129,092 | $ | 146,745 | $ | 73,668 | $ | 96,826 | ||||||||||
| Working capital |
161,495 | 161,702 | 149,398 | 82,638 | 99,687 | |||||||||||||||
| Total assets |
457,724 | 414,701 | 234,569 | 151,580 | 141,812 | |||||||||||||||
| Capital lease obligation, net of current portion |
16,088 | 14,957 | 432 | 494 | 40 | |||||||||||||||
| Retained earnings (accumulated deficit) |
39,974 | 8,636 | 10,283 | (678 | ) | 2,227 | ||||||||||||||
| Total stockholders’ equity |
358,112 | 328,352 | 197,507 | 119,627 | 120,300 | |||||||||||||||
48
Table of Contents
| Item 7. | Management’s Discussion and Analysis of Financial Condition and Results of Operations |
You should read the following discussion and analysis of our financial condition and results of operations together with our financial statements and the related notes and other financial data included elsewhere in this Annual Report. Some of the information contained in this discussion and analysis or set forth elsewhere in this Annual Report, including information with respect to our plans and strategy for our business, includes forward-looking statements that involve risks and uncertainties. You should review Item 1A of this Annual Report for a discussion of important factors that could cause actual results to differ materially from the results described in or implied by the forward-looking statements contained in the following discussion and analysis.
Company Overview
We develop and market aesthetic treatment systems that enable plastic surgeons, dermatologists and other medical practitioners to perform non-invasive and minimally invasive procedures to remove hair, treat vascular and benign pigmented lesions, remove multi-colored tattoos, revitalize the skin, liquefy and remove unwanted fat through laser lipolysis, reduce cellulite, clear nails infected by toe fungus, ablate sweat glands and improve vaginal health. We also market radiofrequency energy sourced medical devices for precision surgical applications such as facial plastic and general surgery, gynecology, ear, nose, and throat procedures, ophthalmology, oral and maxillofacial surgery, podiatry and proctology. We have developed in conjunction with our development agreement with Unilever a laser treatment system for the home use market.
Our product portfolio is composed of a broad range of energy sources including Alexandrite, diode, Nd: YAG, picosecond, pulse dye, Q-switched lasers, intense pulsed light and radiofrequency technology. We offer single energy source systems as well as workstations that incorporate two or more different types of lasers or pulsed light technologies. We offer multiple technologies and system alternatives at a variety of price points depending primarily on the number and type of energy sources included in the system. Our products are designed to be easily upgradeable to add additional energy sources and handpieces, which provide our customers with technological flexibility as they expand their practices.
We focus our development and marketing efforts on offering leading, or flagship, products for the following high volume applications:
| • | our Elite product line for hair removal and treatment of facial and leg veins and pigmentations; |
| • | our SmartLipo product line for LaserBodySculptingS for the removal of unwanted fat; |
| • | our Cellulaze product line for the treatment of cellulite; |
| • | our Affirm/SmartSkin product line for anti-aging applications, including treatments for wrinkles, skin texture, skin discoloration and skin tightening; |
| • | our Cynergy product line for the treatment of vascular lesions; |
| • | our Accolade, MedLite C6 and RevLite product lines for the removal of benign pigmented lesions, as well as multi-colored tattoos; |
| • | our PicoSure product line for the treatment of tattoos, benign pigmented lesions, acne scars, fine lines and wrinkles; |
| • | our Icon Aesthetic System for hair removal, wrinkle reduction and scar and stretch mark treatment; and |
| • | our Vectus diode laser for high volume hair removal. |
On September 5, 2014, we acquired substantially all of the assets of Ellman for $13.2 million in cash. In addition, we assumed certain of its contractual and current liabilities.
The Ellman acquisition complements our platform with radiofrequency energy sources and accessory products for aesthetic and surgical indications. Ellman’s product line encompasses multiple radio frequency
49
Table of Contents
generators and single-use electrodes for aesthetic and multi-specialty surgical indications such as facial plastic and general surgery, gynecology, ear, nose and throat procedures, ophthalmology, oral and maxillofacial surgery, podiatry and proctology. Ellman’s proprietary high frequency, low-temperature RF technology is optimized for achieving surgical precision and controlled hemostasis. The main products which have been added to our portfolio as a result of the acquisition include:
| • | the Surgitron® radiowave platform technology line of RF surgical generators; |
| • | the Pelleve® wrinkle reduction system for skin tightening and non-ablative skin rejuvenation; and |
| • | the PelleFirm™ RF body treatment system for skin tightening and reduction in the appearance of cellulite. |
A key element of our business strategy is to launch innovative new products and technologies into high-growth aesthetic applications. Our research and development team builds on our existing broad range of laser, light-based technologies and other energies to develop new solutions and products to target unmet needs in significant aesthetic treatment markets. Innovation continues to be a strong contributor to our strength.
In November 2014, we signed an exclusive agreement with El.En. S.p.A. to market and distribute in North America the MonaLisa Touch™, a carbon dioxide laser for the treatment of vaginal atrophy, a condition that affects primarily postmenopausal women, breast cancer survivors and women who have undergone hysterectomies. We expect to launch the product in the United States in the first quarter of 2015 through a specialty surgical sales force.
In March 2013, we commenced commercialization of our PicoSure® system, our picosecond laser technology platform for the treatment of tattoos and benign pigmented lesions. The PicoSure system is the first commercially available picosecond Alexandrite aesthetic laser platform. Picosecond lasers deliver pulses that are measured in trillionths of a second, in contrast with nanosecond technology, such as our MedLite® and RevLite™ products, which deliver pulses in billionths of a second. U.S. Food and Drug Administration (FDA) clearance to market the PicoSure laser was received in November 2012. In October 2013, we launched the PicoSure FOCUS Lens Array which microscopically concentrates the PicoSure laser pulse to a precise depth and exposes less than 10% of the skin to areas of high fluence while the surrounding skin is exposed to a low background fluence. We received marketing authorization for our PicoSure system in Canada in July 2013, in Australia in November 2013, and in Korea and Taiwan in January 2014. In July 2014, we received FDA clearance to market PicoSure for the treatment of acne scars. In September 2014, we received FDA clearance to market PicoSure with PicoSure FOCUS Lens Array for the treatment of wrinkles. In February 2015, we received FDA clearance to market the 532 nm wavelength for PicoSure designed to more effectively treat red, yellow and orange tattoo ink colors, which we will offer as an upgrade to our current PicoSure customer base.
Revenues
We generate revenues primarily from sales of our products and parts and accessories and from services, including product warranty revenues, and royalty payments received from our licensees. During the year ended December 31, 2014, we derived approximately 81% of our revenues from sales of our products and 19% of our revenues from parts, accessories, service and royalty revenues. During the year ended December 31, 2013, we derived approximately 83% of our revenues from the sale of products and 17% of our revenues from parts, accessories, service and royalty revenues. Generally, we recognize revenues from the sales of our products upon delivery to our customers, revenues from service contracts and extended product warranties ratably over the coverage period and revenues from service in the period in which the service occurs.
We recognize royalty revenues when we can reliably estimate such amounts and collectability is reasonably assured. As such, we recognize royalty revenues in the quarter reported to us by our licensees, which is generally one quarter following the quarter in which sales by our licensees occurred. Royalty revenues also include amounts due from settlements with licensees for back-owed royalties from prior periods. These settlement amounts are considered revenue, when collectability is reasonably assured, because they constitute our ongoing major or central operations.
50
Table of Contents
In December 2013, we completed a comprehensive settlement agreement with Tria Beauty, Inc. (Tria) which ended the patent infringement litigation between Tria and Palomar. Under the agreement, we are entitled to receive $10.0 million plus future royalty payments. We will pay approximately $2.0 million of this revenue to MGH under an exclusive license agreement between Palomar and MGH, which will be recorded as cost of revenues within our consolidated statement of operations. We recognized $3.0 million and $4.0 million of this revenue in the years ended December 31, 2014 and 2013, respectively, which is recorded as royalty revenues within our consolidated statement of operations. We recognized $0.8 million and $1.0 million in cost of revenues in the years ended December 31, 2014 and 2013, respectively, related to this revenue.
We sell our products globally under the Cynosure, Palomar, ConBio and Ellman brand names through a direct sales force in the United States, Canada, Mexico, France, Morocco, Germany, Spain, the United Kingdom, Australia, China, Japan and Korea, and use distributors to sell our products in other countries where we do not have a direct presence. During the year ended December 31, 2014 and 2013, we derived 46% and 48% of our total revenues, respectively, from sales outside North America. As of December 31, 2014, including expansion from our Ellman acquisition, we had 104 sales employees covering North America and 72 sales employees in France, Morocco, Germany, Spain, the United Kingdom, Australia, China, Japan and Korea. We utilize a global distribution network covering approximately 120 countries.
The following table provides revenue data by geographical region for the years ended December 31, 2014, 2013 and 2012:
| Percentage of Revenues | ||||||||||||
| Year Ended December 31, | ||||||||||||
| 2014 | 2013 | 2012 | ||||||||||
| Region |
||||||||||||
| North America |
54 | % | 52 | % | 49 | % | ||||||
| Europe |
17 | 17 | 19 | |||||||||
| Asia/Pacific |
22 | 23 | 26 | |||||||||
| Other |
7 | 8 | 6 | |||||||||
|
|
|
|
|
|
|
|||||||
| Total |
100 | % | 100 | % | 100 | % | ||||||
|
|
|
|
|
|
|
|||||||
See Note 7 to our consolidated financial statements included in this Annual Report for revenues and asset data by geographic region.
Cost of Revenues
Our cost of revenues consists primarily of material, labor and manufacturing overhead expenses and includes the cost of components and subassemblies supplied by third party suppliers. Cost of revenues also includes royalties incurred on certain products sold by us and our licensees, costs incurred in connection with our efforts to litigate or settle additional third-party license agreements, amortization expense related to developed technology and patents intangible assets, service and warranty expenses, as well as salaries and personnel-related expenses, including stock-based compensation, for our operations management team, purchasing and quality control.
Sales and Marketing Expenses
Our sales and marketing expenses consist primarily of salaries, commissions and other personnel-related expenses, including stock-based compensation, for employees engaged in sales, marketing and support of our products, trade show, promotional and public relations expenses and management and administration expenses in support of sales and marketing. We expect our sales and marketing expenses to increase in absolute dollars as compared to 2014 but remain consistent as a percentage of revenues in 2015.
51
Table of Contents
Research and Development Expenses
Our research and development expenses consist of salaries and other personnel-related expenses, including stock-based compensation, for employees primarily engaged in research, development and engineering activities, materials used and other overhead expenses incurred in connection with the design and development of our products and, from time to time, expenses associated with collaborative research and development agreements that we may enter into. We expense all of our research and development costs as incurred. We expect our research and development expenditures to increase in absolute dollars as compared to 2014 but remain consistent as a percentage of revenues in 2015.
Amortization of Intangible Assets Acquired
Amortization of intangible assets acquired consists of amortization expense related to customer relationships and trade name intangible assets.
General and Administrative Expenses
Our general and administrative expenses consist primarily of salaries and other personnel-related expenses, including stock-based compensation for executives, accounting and administrative personnel, acquisition related expenses, professional fees and other general corporate expenses. We expect our general and administrative expenses to decrease in absolute dollars as compared to 2014 and decrease as a percentage of revenues in 2015, due to an anticipated reduction in acquisition-related costs.
Interest Expense, net
Interest expense, net consists primarily of interest charges on capital lease obligations, and interest earned on our short and long-term marketable securities consisting of state and municipal bonds, U.S. government agencies and treasuries, corporate obligations and commercial paper. We expect interest expense to remain consistent in 2015 as compared to 2014.
Other (Expense) Income, net
Other (expense) income, net consists primarily of foreign currency remeasurement gains or losses and other miscellaneous income and expense items.
Benefit for Income Taxes
As of December 31, 2014, we released substantially all of the valuation allowance on the net deferred tax assets in the United States. Additionally, we released the valuation allowance against the net deferred tax assets of Cynosure Japan, Palomar Australia, and Palomar Spain. A full valuation allowance is maintained on the net deferred tax assets of our subsidiary in Mexico as well as Palomar Japan and Palomar Germany.
Valuation allowances are provided if, based on the weight of available evidence, it is more-likely-than-not that some portion or all of the deferred tax assets will not be realized. We consider several sources of taxable income in making our valuation allowance assessments including taxable income in carryback years, future reversals of existing taxable temporary differences, tax planning strategies and forecasted future income. We will continue to monitor the need for valuation allowances in each jurisdiction, and may adjust our positions in the future based on actual results.
We account for uncertain tax positions following the provisions of ASC 740. ASC 740 clarifies the accounting for income taxes, by prescribing a minimum recognition threshold a tax position is required to meet before being recognized in the financial statements. ASC 740 also provides guidance on derecognition, measurement, classification, interest and penalties, accounting in interim periods, disclosure and transition.
52
Table of Contents
Results of Operations
Year Ended December 31, 2014 and 2013
The following table contains selected statement of operations data, which serves as the basis of the discussion of our results of operations for the years ended December 31, 2014 and 2013:
| Year Ended December 31, 2014 |
Year Ended December 31, 2013 |
Change 2013 to 2014 |
||||||||||||||||||||||
| Amount | As a % of Total Revenues |
Amount | As a % of Total Revenues |
$ Change | % Change | |||||||||||||||||||
| (Dollars in thousands) | ||||||||||||||||||||||||
| Product revenues |
$ | 236,878 | 81 | % | $ | 188,271 | 83 | % | $ | 48,607 | 26 | % | ||||||||||||
| Parts, accessories, service and royalty revenues |
55,491 | 19 | 37,739 | 17 | 17,752 | 47 | ||||||||||||||||||
|
|
|
|
|
|
|
|
|
|
|
|
|
|||||||||||||
| Total revenues |
292,369 | 100 | 226,010 | 100 | 66,359 | 29 | ||||||||||||||||||
| Cost of revenues |
127,131 | 43 | 95,730 | 42 | 31,401 | 33 | ||||||||||||||||||
|
|
|
|
|
|
|
|
|
|
|
|
|
|||||||||||||
| Gross profit |
165,238 | 57 | 130,280 | 58 | 34,958 | 27 | ||||||||||||||||||
| Operating expenses: |
||||||||||||||||||||||||
| Sales and marketing |
88,564 | 30 | 65,211 | 29 | 23,353 | 36 | ||||||||||||||||||
| Research and development |
22,033 | 8 | 17,473 | 8 | 4,560 | 26 | ||||||||||||||||||
| Amortization of intangible assets acquired |
2,961 | 1 | 2,114 | 1 | 847 | 40 | ||||||||||||||||||
| General and administrative |
30,420 | 11 | 51,309 | 22 | (20,889 | ) | (41 | ) | ||||||||||||||||
|
|
|
|
|
|
|
|
|
|
|
|
|
|||||||||||||
| Total operating expenses |
143,978 | 50 | 136,107 | 60 | 7,871 | 6 | ||||||||||||||||||
|
|
|
|
|
|
|
|
|
|
|
|
|
|||||||||||||
| Income (loss) from operations |
21,260 | 7 | (5,827 | ) | (2 | ) | 27,087 | 465 | ||||||||||||||||
| Interest expense, net |
(1,446 | ) | — | (23 | ) | — | (1,423 | ) | (6,187 | ) | ||||||||||||||
| Other (expense) income, net |
(1,476 | ) | (1 | ) | 313 | — | (1,789 | ) | (572 | ) | ||||||||||||||
|
|
|
|
|
|
|
|
|
|
|
|
|
|||||||||||||
| Income (loss) before benefit for income taxes |
18,338 | 6 | (5,537 | ) | (2 | ) | 23,875 | 431 | ||||||||||||||||
| Benefit for income taxes |
(13,000 | ) | (5 | ) | (3,890 | ) | (1 | ) | (9,110 | ) | (234 | ) | ||||||||||||
|
|
|
|
|
|
|
|
|
|
|
|
|
|||||||||||||
| Net income (loss) |
$ | 31,338 | 11 | % | $ | (1,647 | ) | (1 | )% | $ | 32,985 | 2,003 | % | |||||||||||
|
|
|
|
|
|
|
|
|
|
|
|
|
|||||||||||||
Revenues
Total revenues for the year ended December 31, 2014 increased by $66.4 million, or 29%, to $292.4 million, as compared to the year ended December 31, 2013 revenues of $226.0 million (in thousands, except for percentages):
| Year Ended December 31, |
$ Change | % Change | ||||||||||||||
| 2014 | 2013 | |||||||||||||||
| Product sales in North America |
$ | 123,403 | $ | 97,022 | $ | 26,381 | 27 | % | ||||||||
| Product sales outside North America |
113,475 | 91,249 | 22,226 | 24 | ||||||||||||
| Parts, accessories, service and royalty sales |
55,491 | 37,739 | 17,752 | 47 | ||||||||||||
|
|
|
|
|
|
|
|
|
|||||||||
| Total Revenues |
$ | 292,369 | $ | 226,010 | $ | 66,359 | 29 | % | ||||||||
|
|
|
|
|
|
|
|
|
|||||||||
The increase in total revenues was attributable to a number of factors:
| • | Revenues from the sale of products in North America increased by approximately $26.4 million, or 27%, from the 2013 period, primarily due to an increase in the number of units sold attributable to the 2014 period, which contained a full year of sales of the Icon and Vectus systems acquired through the |
53
Table of Contents
| Palomar acquisition, as well as an increase in the number of units sold of our PicoSure system. The 2013 period contained sales of the Vectus and Icon systems for just the period following the June 24, 2013 Palomar acquisition date. In addition, our newly acquired Ellman business contributed approximately $4.4 million in North America product revenues for the period following the September 5, 2014 acquisition. |
| • | Revenues from the sales of products outside of North America increased by approximately $22.2 million, or 24%, from the 2013 period, primarily due to an increase in the number of units sold attributable to the 2014 period, which contained a full year of sales of the Icon and Vectus systems acquired through the Palomar acquisition, as well as an increase in the number of units sold of our PicoSure system. Our newly acquired Ellman business contributed $3.9 million in product revenues outside of North America for the period following the September 5, 2014 acquisition date. |
| • | Revenues from the sale of parts, accessories, services and royalties increased by approximately $17.8 million, or 47%, from the 2013 period, primarily due to a full year of parts, accessories, service and royalties revenues attributable to the Palomar business. |
Cost of Revenues
| Year Ended December 31, |
$ Change | % Change | ||||||||||||||
| 2014 | 2013 | |||||||||||||||
| Cost of revenues (dollars in thousands) |
$ | 127,131 | $ | 95,730 | $ | 31,401 | 33 | % | ||||||||
| Cost of revenues (as a percentage of total revenues) |
43 | % | 42 | % | ||||||||||||
Total cost of revenues increased $31.4 million, or 33%, to $127.1 million in 2014, as compared to $95.7 million in 2013. The increase was primarily associated with our 29% increase in total revenues in 2014 compared to 2013, along with an increase of $4.7 million in amortization expense on intangible assets acquired classified as a component of cost of revenues. Total cost of revenues increased slightly as a percentage of total revenues, to 43% for the year ended December 31, 2014, from 42% for the year ended December 31, 2013, primarily due to the aforementioned increase of $4.7 million in amortization expense.
Sales and Marketing
| Year Ended December 31, |
$ Change | % Change | ||||||||||||||
| 2014 | 2013 | |||||||||||||||
| Sales and marketing (dollars in thousands) |
$ | 88,564 | $ | 65,211 | $ | 23,353 | 36 | % | ||||||||
| Sales and marketing (as a percentage of total revenues) |
30 | % | 29 | % | ||||||||||||
Sales and marketing expenses increased $23.4 million, or 36%, to $88.6 million in 2014, as compared to $65.2 million in 2013. The increase was primarily due to a full year of sales and marketing expenses attributable to the integration of the Palomar sales and marketing team included in the 2014 period, increases in the number of our sales employees and an increase in commission expense due to increased product revenues. Our total sales and marketing expenses for the 2014 period increased as a percentage of total revenues as compared to the 2013 period due primarily to the additional costs of incorporating the acquired Ellman organization as well as initial marketing costs associated with MonaLisa Touch.
Research and Development
| Year Ended December 31, |
$ Change | % Change | ||||||||||||||
| 2014 | 2013 | |||||||||||||||
| Research and development (dollars in thousands) |
$ | 22,033 | $ | 17,473 | $ | 4,560 | 26 | % | ||||||||
| Research and development (as a percentage of total revenues) |
8 | % | 8 | % | ||||||||||||
54
Table of Contents
Research and development expenses increased $4.6 million, or 26%, to $22.0 million in 2014, as compared to $17.5 million in 2013. The increase was primarily due to a full year of research and development expenses attributable to the integration of the Palomar research and development team included in the 2014 period. Our total research and development expenses as a percentage of total revenues remained consistent for the years ended December 31, 2014 and 2013.
Amortization of Intangible Assets Acquired
| Year Ended December 31, |
$ Change | % Change | ||||||||||||||
| 2014 | 2013 | |||||||||||||||
| Amortization of intangible assets acquired (dollars in thousands) |
$ | 2,961 | $ | 2,114 | $ | 847 | 40 | % | ||||||||
| Amortization of intangible assets acquired (as a percentage of total revenues) |
1 | % | 1 | % | ||||||||||||
Amortization of intangible assets acquired increased $0.8 million, or 40%, to $3.0 million in 2014, as compared to $2.1 million in 2013. The increase resulted from a full year of amortization expense for the identifiable intangible assets from the Palomar acquisition, as well as amortization expense for the identifiable intangible assets from the Ellman acquisition, included in the 2014 period. Amortization of intangible assets acquired as a percentage of total revenues remained consistent for the years ended December 31, 2014 and 2013.
General and Administrative
| Year Ended December 31, |
$ Change | % Change | ||||||||||||||
| 2014 | 2013 | |||||||||||||||
| General and administrative (dollars in thousands) |
$ | 30,420 | $ | 51,309 | $ | (20,889 | ) | (41 | )% | |||||||
| General and administrative (as a percentage of total revenues) |
11 | % | 22 | % | ||||||||||||
General and administrative expenses decreased $20.9 million, or 41%, to $30.4 million in 2014, as compared to $51.3 million in 2013. The decrease is primarily due to $26.9 million less in costs associated with acquisitions during the 2014 period as compared to the 2013 period, as compensation expense in connection with the change of control severance arrangements and other acquisition-related charges for Palomar came to an end. Excluding acquisition costs, our total general and administrative expenses as a percentage of total revenues remained consistent for the years ended December 31, 2014 and 2013, and increased in dollars due to a full year of expenses attributable to the integration of the Palomar acquisition and the 2014 Ellman acquisition.
Interest Expense, net
| Year Ended December 31, |
$ Change | % Change | ||||||||||||||
| 2014 | 2013 | |||||||||||||||
| Interest expense, net (dollars in thousands) |
$ | (1,446 | ) | $ | (23 | ) | $ | (1,423 | ) | (6,187 | )% | |||||
The change in interest expense, net was primarily due to interest charges of $1.5 million during the year ended December 31, 2014 associated with the capital lease of our U.S. operating facility. In the fourth quarter of 2013, we amended our lease agreement in Westford, Massachusetts, extending the term and the rentable space. We are treating the portion of the lease attributable to buildings as a capital lease and incurring interest charges accordingly.
Other (Expense) Income, net
| Year Ended December 31, |
$ Change | % Change | ||||||||||||||
| 2014 | 2013 | |||||||||||||||
| Other (expense) income, net (dollars in thousands) |
$ | (1,476 | ) | $ | 313 | $ | (1,789 | ) | (572 | )% | ||||||
55
Table of Contents
The change in other (expense) income, net was primarily a result of net foreign currency remeasurement losses in the year ended December 31, 2014, as compared to net foreign currency remeasurement gains in the year ended December 31, 2013. During the second half of 2014, the U.S. dollar strengthened against foreign currencies, primarily against the euro and British pound.
Benefit for Income Taxes
| Year Ended December 31, |
$ Change | % Change | ||||||||||||||
| 2014 | 2013 | |||||||||||||||
| Benefit for income taxes (dollars in thousands) |
$ | (13,000 | ) | $ | (3,890 | ) | $ | (9,110 | ) | (234 | )% | |||||
| Benefit as a percentage of income (loss) before benefit for income taxes |
(71 | )% | 70 | % | ||||||||||||
The benefit for income taxes results from a combination of the activities of our U.S. entities and foreign subsidiaries. In 2014, we recorded an income tax benefit of $13.0 million representing an effective rate of (71)%. In 2013, we recorded an income tax benefit of $3.9 million, representing an effective tax rate of 70%. The year-over-year increase in our tax benefit is primarily attributable to a tax benefit of $19.0 million for the release of substantially all of the valuation allowance maintained against our net U.S. deferred tax asset. In addition, we recorded a tax benefit of $0.9 million related to the release of valuation allowances against the net deferred tax assets of Cynosure Japan, Palomar Australia and Palomar Spain. In 2013 we recorded a tax benefit of $5.6 million for the release of a portion of the valuation allowance maintained against our U.S. deferred tax assets due to taxable temporary differences recorded as a result of the Palomar acquisition which were available as a source of income to realize the benefit of certain pre-existing Cynosure deferred tax assets. The increase in the tax benefit associated with the release of valuation allowance year-over-year is partially offset by additional tax expense being recorded on the operating profits of our domestic and foreign subsidiaries year-over-year.
Year Ended December 31, 2013 and 2012
The following table contains selected statement of operations data, which serves as the basis of the discussion of our results of operations for the years ended December 31, 2013 and 2012:
| Year Ended December 31, 2013 |
Year Ended December 31, 2012 |
Change 2012 to 2013 |
||||||||||||||||||||||
| Amount | As a % of Total Revenues |
Amount | As a % of Total Revenues |
$ Change | % Change | |||||||||||||||||||
| (Dollars in thousands) | ||||||||||||||||||||||||
| Product revenues |
$ | 188,271 | 83 | % | $ | 128,513 | 84 | % | $ | 59,758 | 46 | % | ||||||||||||
| Parts, accessories, service and royalty revenues |
37,739 | 17 | 24,980 | 16 | 12,759 | 51 | ||||||||||||||||||
|
|
|
|
|
|
|
|
|
|
|
|
|
|||||||||||||
| Total revenues |
226,010 | 100 | 153,493 | 100 | 72,517 | 47 | ||||||||||||||||||
| Cost of revenues |
95,730 | 42 | 64,567 | 42 | 31,163 | 48 | ||||||||||||||||||
|
|
|
|
|
|
|
|
|
|
|
|
|
|||||||||||||
| Gross profit |
130,280 | 58 | 88,926 | 58 | 41,354 | 47 | ||||||||||||||||||
| Operating expenses: |
||||||||||||||||||||||||
| Sales and marketing |
65,211 | 29 | 48,220 | 31 | 16,991 | 35 | ||||||||||||||||||
| Research and development |
17,473 | 8 | 12,972 | 8 | 4,501 | 35 | ||||||||||||||||||
| Amortization of intangible assets acquired |
2,114 | 1 | 1,368 | 1 | 746 | 55 | ||||||||||||||||||
| General and administrative |
51,309 | 22 | 14,233 | 10 | 37,076 | 260 | ||||||||||||||||||
|
|
|
|
|
|
|
|
|
|
|
|
|
|||||||||||||
| Total operating expenses |
136,107 | 60 | 76,793 | 50 | 59,314 | 77 | ||||||||||||||||||
|
|
|
|
|
|
|
|
|
|
|
|
|
|||||||||||||
| (Loss) income from operations |
(5,827 | ) | (2 | ) | 12,133 | 8 | (17,960 | ) | (148 | ) | ||||||||||||||
| Interest (expense) income, net |
(23 | ) | — | 60 | — | (83 | ) | (138 | ) | |||||||||||||||
| Other income, net |
313 | — | 532 | — | (219 | ) | (41 | ) | ||||||||||||||||
|
|
|
|
|
|
|
|
|
|
|
|
|
|||||||||||||
56
Table of Contents
| Year Ended December 31, 2013 |
Year Ended December 31, 2012 |
Change 2012 to 2013 |
||||||||||||||||||||||
| Amount | As a % of Total Revenues |
Amount | As a % of Total Revenues |
$ Change | % Change | |||||||||||||||||||
| (Dollars in thousands) | ||||||||||||||||||||||||
| (Loss) income before (benefit) provision for income taxes |
(5,537 | ) | (2 | ) | 12,725 | 8 | (18,262 | ) | (144 | ) | ||||||||||||||
| (Benefit) provision for income taxes |
(3,890 | ) | (1 | ) | 1,764 | 1 | (5,654 | ) | (321 | ) | ||||||||||||||
|
|
|
|
|
|
|
|
|
|
|
|
|
|||||||||||||
| Net (loss) income |
$ | (1,647 | ) | (1 | )% | $ | 10,961 | 7 | % | $ | (12,608 | ) | (115 | )% | ||||||||||
|
|
|
|
|
|
|
|
|
|
|
|
|
|||||||||||||
Revenues
Total revenue for the year ended December 31, 2013 increased by $72.5 million, or 47%, to $226.0 million, as compared to the year ended December 31, 2012 revenues of $153.5 million (in thousands, except for percentages):
| Year Ended December 31, |
$ Change | % Change | ||||||||||||||
| 2013 | 2012 | |||||||||||||||
| Product sales in North America |
$ | 97,022 | $ | 64,910 | $ | 32,112 | 49 | % | ||||||||
| Product sales outside North America |
91,249 | 63,603 | 27,646 | 43 | ||||||||||||
| Parts, accessories, service and royalty sales |
37,739 | 24,980 | 12,759 | 51 | ||||||||||||
|
|
|
|
|
|
|
|
|
|||||||||
| Total Revenues |
$ | 226,010 | $ | 153,493 | $ | 72,517 | 47 | % | ||||||||
|
|
|
|
|
|
|
|
|
|||||||||
The increase in revenue was attributable to a number of factors:
| • | Revenues from the sale of products in North America increased by approximately $32.1 million, or 49%, from the 2012 period, primarily due to an increase in average selling prices and number of units sold attributable to the introduction of additional products, including PicoSure, Vectus and Icon. |
| • | Revenues from the sales of products outside of North America increased by approximately $27.6 million, or 43%, from the 2012 period, primarily due to an increase in average selling prices and number of units sold attributable to the introduction of additional products, including PicoSure, Elite Plus, Vectus and Icon. |
| • | Revenues from the sale of parts, accessories, services and royalties increased by approximately $12.8 million, or 51%, from the 2012 period, primarily due to an increase in revenues generated from performing service on laser systems, including our newly acquired Palomar product lines. Royalty revenues, attributable to the Palomar business, contributed $5.4 million for the year ended December 31, 2013, which includes a $4.0 million settlement with Tria in the fourth quarter of 2013. |
Cost of Revenues
| Year Ended December 31, |
$ Change | % Change | ||||||||||||||
| 2013 | 2012 | |||||||||||||||
| Cost of revenues (dollars in thousands) |
$ | 95,730 | $ | 64,567 | $ | 31,163 | 48 | % | ||||||||
| Cost of revenues (as a percentage of total revenues) |
42 | % | 42 | % | ||||||||||||
Total cost of revenues increased $31.2 million, or 48%, to $95.7 million in 2013, as compared to $64.6 million in 2012. The increase was primarily associated with the 47% increase in total revenues. Cost of revenues includes approximately $1.0 million in costs incurred in connection with the settlement of the patent infringement litigation against Tria, along with a purchase accounting charge of $2.4 million associated with the
57
Table of Contents
step up in fair value of finished goods inventory acquired through our acquisition of Palomar and sold during the period. Our total cost of revenues as a percentage of total revenues remained consistent at 42% for the years ended December 31, 2013 and 2012.
Sales and Marketing
| Year Ended December 31, |
$ Change | % Change | ||||||||||||||
| 2013 | 2012 | |||||||||||||||
| Sales and marketing (dollars in thousands) |
$ | 65,211 | $ | 48,220 | $ | 16,991 | 35 | % | ||||||||
| Sales and marketing (as a percentage of total revenues) |
29 | % | 31 | % | ||||||||||||
Sales and marketing expenses increased $17.0 million, or 35% for the year ended December 31, 2013, as compared with the year ended December 31, 2012. This increase was primarily due to sales and marketing expenses of $7.7 million attributable to the integration of the Palomar sales and marketing team for the year ended December 31, 2013. The increase also included commission expense of $3.8 million due to increased product revenues, personnel costs of $3.4 million due to an increase in the number of our sales employees, and $1.4 million due to increased workshops, trade shows and other promotional efforts. Sales and marketing expenses for the year ended December 31, 2013 decreased as a percentage of total revenues to 29%, due to increased revenue and continued operating leverage.
Research and Development
| Year Ended December 31, |
$ Change | % Change | ||||||||||||||
| 2013 | 2012 | |||||||||||||||
| Research and development (dollars in thousands) |
$ | 17,473 | $ | 12,972 | $ | 4,501 | 35 | % | ||||||||
| Research and development (as a percentage of total revenues) |
8 | % | 8 | % | ||||||||||||
Research and development expenses increased $4.5 million, or 35% for the year ended December 31, 2013 as compared with the year ended December 31, 2012. This increase was primarily due to research and development expenses of $3.6 million attributable to the integration of the Palomar research and development team for the year ended December 31, 2013, as well as an increase of $0.6 million in personnel and professional services costs associated with the development of new products.
Amortization of Intangible Assets Acquired
| Year Ended December 31, |
$ Change | % Change | ||||||||||||||
| 2013 | 2012 | |||||||||||||||
| Amortization of intangible assets acquired (dollars in thousands) |
$ | 2,114 | $ | 1,368 | $ | 746 | 55 | % | ||||||||
| Amortization of intangible assets acquired (as a percentage of total revenues) |
1 | % | 1 | % | ||||||||||||
Amortization of intangible assets acquired increased $0.7 million, or 55%, for the year ended December 31, 2013, as compared with the year ended December 31, 2012. The increase resulted from an increase in amortization expense for the identifiable intangible assets from the Palomar acquisition for the year ended December 31, 2013.
General and Administrative
| Year Ended December 31, |
$ Change | % Change | ||||||||||||||
| 2013 | 2012 | |||||||||||||||
| General and administrative (dollars in thousands) |
$ | 51,309 | $ | 14,233 | $ | 37,076 | 260 | % | ||||||||
| General and administrative (as a percentage of total revenues) |
22 | % | 10 | % | ||||||||||||
58
Table of Contents
General and administrative expenses increased $37.1 million, or 260%, for the year ended December 31, 2013, as compared with the year ended December 31, 2012. The increase is primarily due to $31.7 million in costs associated with the acquisition of Palomar during the year ended December 31, 2013, including $24.2 million in compensation expense in connection with change of control severance arrangements, $2.6 million in employee termination payments and $1.9 million in professional services fees. Excluding acquisition costs, general and administrative expenses increased due to increased headcount associated with our Palomar acquisition. We expect to incur approximately $1.5 million in general and administrative expenses related to the Palomar acquisition in the first half of 2014.
Interest (Expense) Income, net
| Year Ended December 31, |
$ Change | % Change | ||||||||||||||
| 2013 | 2012 | |||||||||||||||
| Interest (expense) income, net (dollars in thousands) |
$ | (23 | ) | $ | 60 | $ | (83 | ) | (138 | )% | ||||||
The increase in interest (expense) income, net was primarily due to increased interest charges associated with the capital lease of our U.S. operating facility. In the fourth quarter of 2013, we amended our lease agreement in Westford, Massachusetts, extending the term and the rentable space. We are treating the buildings portion of the lease as a capital lease and incurring interest charges accordingly. We expect interest charges to approximate $1.5 million in 2014.
Other Income, net
| Year Ended December 31, |
$ Change | % Change | ||||||||||||||
| 2013 | 2012 | |||||||||||||||
| Other income, net (dollars in thousands) |
$ | 313 | $ | 532 | $ | (219 | ) | (41 | )% | |||||||
The decrease in other income, net was primarily a result of selling certain equipment under capital lease agreements during 2012, which generated income. Net foreign currency remeasurement gains remained consistent for the years ended December 31, 2013 and 2012.
(Benefit) Provision for Income Taxes
| Year Ended December 31, |
$ Change | % Change | ||||||||||||||
| 2013 | 2012 | |||||||||||||||
| (Benefit) Provision for income taxes (dollars in thousands) |
$ | (3,890 | ) | $ | 1,764 | $ | (5,654 | ) | (321 | )% | ||||||
| (Benefit) Provision as a percentage of (loss) income before (benefit) provision for income taxes |
70 | % | 14 | % | ||||||||||||
The (benefit) provision for income taxes results from a combination of the activities of our U.S. entities and foreign subsidiaries. In 2013, we recorded an income tax benefit of $3.9 million, representing an effective tax rate of 70%. The increase in our effective tax rate and tax benefit is primarily attributable to a discrete benefit of $5.6 million for the release of a portion of the domestic valuation allowance due to taxable temporary differences as a result of the Palomar acquisition which are available as a source of income to realize the benefit of certain pre-existing Cynosure deferred tax assets. Excluding this item, the tax provision for the year ended December 31, 2013 would have been $1.7 million, which is primarily attributable to the tax provision on the earnings generated by our foreign and domestic operations. As of December 31, 2013, we have a partial valuation allowance on the net deferred tax assets in the United States as we have benefitted from our U.S. deferred tax assets to the extent we have taxable income in a carryback year and existing taxable temporary differences. A full valuation allowance is maintained on the net deferred tax assets of our subsidiaries in Japan, Mexico, and Australia, as well as Palomar Spain and Palomar Germany.
59
Table of Contents
Liquidity and Capital Resources
We require cash to pay our operating expenses, make capital expenditures, fund acquisitions and pay our long-term liabilities. We have funded our operations through cash generated from our operations and proceeds from public offerings of our Class A common stock.
Our cash, cash equivalents and marketable securities balance increased by $4.3 million as of December 31, 2014 from December 31, 2013. At December 31, 2014, our cash, cash equivalents and short and long-term marketable securities were $133.4 million. Our cash and cash equivalents of $75.1 million are highly liquid investments with maturities of 90 days or less at date of purchase and consist of cash in operating accounts and investments in money market funds. Our short-term marketable securities of $32.1 million consist of investments in various state and municipal governments, U.S. government agencies and treasuries, and corporate obligations and commercial paper, all of which mature by December 15, 2015. Our long-term marketable securities of $26.2 million consist of investments in various state and municipal governments, U.S. government agencies and treasuries, all of which mature by December 19, 2016.
Our future capital requirements depend on a number of factors, including the rate of market acceptance of our current and future products, the resources we devote to developing and supporting our products and continued progress of our research and development of new products. During the year ended December 31, 2014, we purchased $15.8 million of property and equipment, which includes $9.3 million for the expansion and improvement of our corporate location. During the year ended December 31, 2013, we purchased $3.5 million of property and equipment. During the year ended December 31, 2014 and 2013, we transferred $4.1 million and $6.2 million, respectively, of demonstration equipment to fixed assets. We expect that our capital expenditures during the next 12 months will decrease compared with the 2014 period, as we have completed the integration of Palomar and the expansion and improvement of our corporate location.
On October 29, 2013, we announced that our board of directors authorized the repurchase of up to $25 million of our Class A common stock, from time to time, on the open market or in privately negotiated transactions under a stock repurchase program. On April 30, 2014, our board of directors approved an increase of $10 million to the stock repurchase program. The program will terminate upon the purchase of $35 million in common stock or expiration of the program on November 1, 2015. During the year ended December 31, 2014, we repurchased 742,179 shares of our common stock at an aggregate cost of $15.6 million and at a weighted average price of $20.96 per share under this program. As of December 31, 2014, approximately $4.1 million remains available to repurchase shares under the program. As of December 31, 2014, we have repurchased an aggregate of 1,395,480 shares under this program at an aggregate cost of $30.9 million.
We believe that our current cash, cash equivalents and short and long-term marketable securities, as well as cash generated from operations, will be sufficient to meet our anticipated cash needs for working capital and capital expenditures for the foreseeable future.
Cash Flows
Net cash provided by operating activities was $42.1 million for the year ended December 31, 2014, and resulted primarily from the net income for the period of $31.3 million and $24.9 million in depreciation and amortization and stock-based compensation expense offset by $15.8 million in changes in deferred income taxes. Net changes in working capital items decreased cash from operating activities by approximately $1.8 million, primarily related to increases in inventory and accounts receivable, partially offset by increases to accounts payable and accrued expenses. Net cash used in investing activities was $53.7 million for the year ended December 31, 2014, which consisted primarily of $56.9 million in purchases of marketable securities, $15.8 million in additions of fixed assets and $13.2 million in cash paid for the Ellman acquisition, partially offset by $32.4 million in proceeds from the sales and maturities of marketable securities. Net cash used in financing activities during the year ended December 31, 2014 was $7.0 million, primarily relating to $15.6 million in repurchases of common stock offset by $8.2 million in proceeds from stock option exercises.
60
Table of Contents
Net cash provided by operating activities was $3.4 million for the year ended December 31, 2013, and resulted primarily from $12.8 million in depreciation and amortization and stock-based compensation expense, offset by $5.3 million in changes in deferred income taxes. Net changes in working capital items decreased cash from operating activities by approximately $4.6 million primarily related to increases in inventory and accounts receivable offset by increases to accrued expenses. Net cash provided by investing activities was $17.2 million for the year ended December 31, 2013, which consisted primarily of $84.1 million in proceeds from the sales and maturities of marketable securities and $25.2 million in proceeds from the sale of fixed assets, offset by the cash paid for the Palomar acquisition, net of cash received, of $65.0 million. Net cash used in financing activities during the year ended December 31, 2013 was $13.0 million, primarily relating to $15.4 million in repurchases of common stock offset by $2.7 million in proceeds from stock option exercises.
Net cash provided by operating activities was $14.6 million for the year ended December 31, 2012, and resulted primarily from the net income for the period of $11.0 million, increased by $9.7 million in depreciation and amortization and stock-based compensation expense and by $1.1 million in net accretion of marketable securities and changes in deferred income taxes. Net changes in working capital items decreased cash from operating activities by $7.2 million primarily related to increases in inventory and accounts receivable. Net cash used in investing activities was $27.5 million for the year ended December 31, 2012, which consisted primarily of $69.9 million in purchases of marketable securities and $3.1 million in fixed asset purchases, offset by $45.4 million in proceeds from the sale and maturities of securities and a $0.1 million decrease in other assets. Net cash provided by financing activities during the year ended December 31, 2012 was $63.3 million, primarily relating to $55.3 million in net proceeds to us from our November 2012 public offering, along with $7.2 million in proceeds from stock option exercises.
Contractual Obligations
Our significant outstanding contractual obligations relate to our capital leases from our facilities leases, including the buildings portion of our U.S. operating facility, and equipment financings. Our leases are non-cancellable and typically contain renewal options. Certain leases contain rent escalation clauses for which we recognize the expense on a straight-line basis. We have summarized in the table below our fixed contractual cash obligations as of December 31, 2014.
| Total | Less Than One Year |
One to Three Years |
Three to Five Years |
More than Five Years |
||||||||||||||||
| (In thousands) | ||||||||||||||||||||
| Capital lease obligations, including interest |
$ | 30,130 | $ | 164 | $ | 4,766 | $ | 5,033 | $ | 20,167 | ||||||||||
| Operating leases |
12,040 | 2,073 | 3,914 | 3,306 | 2,747 | |||||||||||||||
|
|
|
|
|
|
|
|
|
|
|
|||||||||||
| Total contractual obligations |
$ | 42,170 | $ | 2,237 | $ | 8,680 | $ | 8,339 | $ | 22,914 | ||||||||||
|
|
|
|
|
|
|
|
|
|
|
|||||||||||
Off Balance Sheet Arrangements
Since inception, we have not engaged in any off balance sheet financing activities.
Critical Accounting Policies and Estimates
The discussion and analysis of our financial condition and results of operations set forth above are based on our financial statements, which have been prepared in accordance with U.S. generally accepted accounting principles (U.S. GAAP). The preparation of these financial statements requires us to make estimates and judgments that affect the reported amounts of assets, liabilities, revenues and expenses. On an ongoing basis, we evaluate our estimates and judgments, including those described below. We base our estimates on historical experience and on various assumptions that we believe to be reasonable under the circumstances. These estimates and assumptions form the basis for making judgments about the carrying values of assets and liabilities, and the reported amounts of revenues and expenses, that are not readily apparent from other sources. Actual results may differ from these estimates under different assumptions or conditions.
61
Table of Contents
We believe the following critical accounting policies require significant judgment and estimates by us in the preparation of our financial statements.
Revenue Recognition and Deferred Revenue
In accordance with the Revenue Recognition Topic Accounting Standards Codification, or ASC, 605-10-S99, we recognize revenue from sales of aesthetic treatment systems and parts and accessories when each of the following four criteria are met:
| • | delivery has occurred; |
| • | there is persuasive evidence of an agreement; |
| • | the fee is fixed or determinable; and |
| • | collection is reasonably assured. |
Revenue from the sale of service contracts is deferred and recognized on a straight-line basis over the contract period as services are provided.
We defer, until earned, payments that we receive in advance of product delivery or performance of services. When we enter into arrangements with multiple elements, which may include sales of products together with service contracts and warranties, we allocate revenue among the elements based on each element’s relative fair value in accordance with the principles of Accounting Standards Update, or ASU, 2009-13, Revenue Recognition Topic—Multiple Element Arrangements. This allocation requires us to make estimates of fair value for each element.
We recognize royalty revenues when we can reliably estimate such amounts and collectability is reasonably assured. As such, we recognize royalty revenues in the quarter reported to us by our licensees, or one quarter following the quarter in which sales by our licensees occurred. Royalty revenues also include amounts due from settlements with licensees for back-owed royalties from prior periods. These settlement amounts are considered revenue, when collectability is reasonably assured, because they constitute our ongoing major or central operations.
In December 2013, we completed a comprehensive settlement agreement with Tria which ended the patent infringement litigation between Tria and Palomar. Under the agreement, we are entitled to receive $10.0 million plus future royalty payments. We will pay approximately $2.0 million of this revenue to MGH under an exclusive license agreement between Palomar and MGH, which will be recorded as cost of revenues within our consolidated statement of operations. We recognized $3.0 million and $4.0 million of this revenue in the years ended December 31, 2014 and 2013, respectively, which is recorded as royalty revenues within our consolidated statement of operations. We recognized $0.8 million and $1.0 million in cost of revenues in the years ended December 31, 2014 and 2013, respectively, related to this revenue.
Cost of Revenues
Our cost of revenues consists primarily of material, labor and manufacturing overhead expenses and includes the cost of components and subassemblies supplied by third party suppliers. Cost of revenues also includes royalties incurred on certain products sold by us and our licensees, costs incurred in connection with our efforts to litigate or settle additional third-party license agreements, amortization expense related to developed technology and patents intangible assets, service and warranty expenses, as well as salaries and personnel-related expenses, including stock-based compensation, for our operations management team, purchasing and quality control.
62
Table of Contents
Concentration of Credit Risk
The Financial Accounting Standards Board, or FASB, requires disclosure of any significant off-balance-sheet and credit risk concentrations. Financial instruments that subject us to credit risk consist primarily of cash and cash equivalents, short and long-term marketable securities and accounts receivable. We place cash and cash equivalents and short and long-term marketable securities in established financial institutions. We have no significant off-balance-sheet risk or concentration of credit risk, such as foreign exchange contracts, options contracts, or other foreign hedging arrangements. Our accounts receivable balance, net of allowance for doubtful accounts, was $42.5 million as of December 31, 2014, compared with $36.6 million as of December 31, 2013. The allowance for doubtful accounts was $2.9 million as of December 31, 2014, compared to $1.8 million as of December 31, 2013. We maintain an allowance for doubtful accounts based upon the aging of our receivable balances, known collectability issues and our historical experience with losses. We work to mitigate bad debt exposure through our credit evaluation policies, reasonably short payment terms and geographical dispersion of sales. Our revenues include export sales to foreign companies located principally in Europe, the Asia/Pacific region and the Middle East. We obtain letters of credit for foreign sales that we consider to be at risk.
Inventories and Allowance for Excess and Obsolescence
We state all inventories at the lower of cost or market value, determined on a first-in, first-out method. We monitor standard costs on a monthly basis and update them annually and as necessary to reflect changes in raw material costs and labor and overhead rates. Our inventory balance was $59.3 million as of December 31, 2014, compared to $50.3 million as of December 31, 2013. The increase in inventory relates to increased purchases to meet increased revenue requirements with the inclusion of acquired products and the launch of new products.
We provide inventory allowances when conditions indicate that the selling price could be less than cost due to physical deterioration, usage, obsolescence, reductions in estimated future demand and reductions in selling prices. We balance the need to maintain strategic inventory levels with the risk of obsolescence due to changing technology and customer demand levels. Unfavorable changes in market conditions may result in a need for additional inventory reserves that could adversely impact our gross margins. Conversely, favorable changes in demand could result in higher gross margins when we sell products. Our inventory allowance was $5.2 million as of December 31, 2014, compared to $2.9 million as of December 31, 2013, as we finalized purchase accounting adjustments related to acquired Palomar inventory during the first half of 2014.
Intangible Assets
We capitalize and include in intangible assets the costs of developed technology and patents, customer relationships, trade names and business licenses. Intangible assets are recorded at fair value and stated net of accumulated amortization and impairments. We amortize our intangible assets that have finite lives using either the straight-line or accelerated method, based on the useful life of the asset over which it is expected to be consumed utilizing expected undiscounted future cash flows. Amortization is recorded over the estimated useful lives ranging from five to 23 years. We evaluate the realizability of our definite lived intangible assets whenever events or changes in circumstances or business conditions indicate that the carrying value of these assets may not be recoverable based on expectations of future undiscounted cash flows for each asset group. If the carrying value of an asset or asset group exceeds its undiscounted cash flows, we estimate the fair value of the assets, generally utilizing a discounted cash flow analysis based on the present value of estimated future cash flows to be generated by the assets using a risk-adjusted discount rate. To estimate the fair value of the assets, we use market participant assumptions pursuant to ASC 820, Fair Value Measurements. If the estimate of an intangible asset’s remaining useful life is changed, we will amortize the remaining carrying value of the intangible asset prospectively over the revised useful life.
Goodwill
Goodwill represents the excess of the purchase price over the fair value of assets acquired and liabilities assumed in a business combination. We do not amortize our goodwill, but instead test for impairment at least
63
Table of Contents
annually and more frequently whenever events or changes in circumstances indicate that the fair value of the asset may be less than its carrying value of the asset. Our annual test for impairment occurs on the first day of our fourth quarter.
We have adopted ASU 2011-08 Intangibles—Goodwill and Other, an amendment to ASC 350, which updates how an entity will evaluate its goodwill for impairment. The guidance provides entities an option to perform a “qualitative” assessment to determine whether further impairment testing is necessary. If further testing is required, the test for impairment continues with the two step process. The first step compares the carrying amount of the reporting unit to its estimated fair value (Step 1). To the extent that the carrying value of the reporting unit exceeds its estimated fair value, a second step is performed, wherein the reporting unit’s carrying value is compared to the implied fair value (Step 2). To the extent that the carrying value exceeds the implied fair value, impairment exists and must be recognized.
We have concluded that Cynosure, Inc. represents one reporting unit for goodwill impairment testing and we have performed a qualitative assessment on that reporting unit. As a result of our assessment, we determined that goodwill is not impaired as of December 31, 2014.
Product Warranty Costs and Provisions
We typically provide a one-year parts and labor warranty on end-user sales of our aesthetic treatment systems. Distributor sales generally include a warranty on parts only. We estimate and provide for future costs for initial product warranties at the time revenue is recognized. We base product warranty costs on related material costs, technical support labor costs and overhead. We provide for the estimated cost of product warranties by considering historical material, labor and overhead expenses and applying the experience rates to the outstanding warranty period for products sold. As we sell new products to our customers, we must exercise considerable judgment in estimating the expected failure rates and warranty costs. If actual product failure rates, material usage, service delivery costs or overhead costs differ from our estimates, we would be required to revise our estimated warranty liability.
Fair Value of Financial Instruments
ASC 820, Fair Value Measurements Topic, defines fair value, establishes a framework for measuring fair value under U.S. GAAP and enhances disclosures about fair value measurements. Fair value is defined as the exchange price that would be received for an asset or paid to transfer a liability (an exit price) in the principal or most advantageous market for the asset or liability in an orderly transaction between market participants on the measurement date. Valuation techniques used to measure fair value must maximize the use of observable inputs and minimize the use of unobservable inputs. The standard describes the following fair value hierarchy based on three levels of inputs, of which the first two are considered observable and the last unobservable, that may be used to measure fair value:
| • | Level 1—Quoted prices in active markets for identical assets or liabilities. |
| • | Level 2—Inputs other than Level 1 that are observable, either directly or indirectly, such as quoted prices for similar assets or liabilities; quoted prices in markets that are not active; or other inputs that are observable or can be corroborated by observable markets data for substantially the full term of the assets or liabilities. |
| • | Level 3—Unobservable inputs that are supported by little or no market activity and that are significant to the fair value of the assets or liabilities. |
64
Table of Contents
Capital Lease Obligations
On November 18, 2013, we entered into a Fifth Amendment to the lease dated January 31, 2005 (the Lease) related to our headquarters located at 5 Carlisle Road, Westford, Massachusetts, which we refer to as the Lease Amendment. Pursuant to the Lease Amendment, the term of the Lease has been extended to May 2027 (with two five-year extension options) and the leased premises have been expanded to include additional space at the current location as well as space in the adjacent building, 3 Carlisle Road, Westford, Massachusetts. Under the terms of the Lease Amendment, the base rent under the Lease will be abated for a 21-month period beginning in May 2014, and we will have rights to lease additional space at 3 Carlisle Road.
ASC 840, Leases, establishes the framework for accounting for the Lease Amendment. In accordance with ASC 840, we are accounting for the land portion of the leased premises as an operating lease. The buildings at 5 Carlisle Road and 3 Carlisle Road have met the criteria for capital lease accounting under ASC 840-10-25-1, and thus we are accounting for the buildings portion of the leased premises as capital leases and incurring interest charges accordingly. The expansion of the leased premises, as well as improvements to the leased premises, are recorded on the balance sheet as leasehold improvements within property, plant and equipment. Assets under capital leases and leasehold improvements related to the Lease Amendment are amortized using the straight-line method over the respective lease term.
Stock-Based Compensation
We follow the fair value recognition provisions of ASC 718, Stock Compensation Topic. This guidance requires share-based payments to employees, including grants of employee stock options and restricted stock units, or RSUs, to be recognized in the statement of operations based on their fair values at the date of grant. ASC 718 requires companies to utilize an estimated forfeiture rate when calculating the expense for the period. Accordingly, we review our actual forfeiture rates periodically and align our stock compensation expense with the options and RSUs that are vesting.
We use the Black-Scholes option pricing model to estimate the fair value of stock options. This option-pricing model requires the input of various subjective assumptions, including the option’s expected life and the price volatility of the underlying stock. Our estimated expected stock price volatility is based on our own historic volatility. We believe this is more reflective and a better indicator of the expected future volatility, than using an average of a comparable market index or of a comparable company in the same industry. Our expected term of options granted during the year ended December 31, 2014 represents the weighted average period of time that options granted are expected to be outstanding giving consideration to vesting schedules and our historical exercise patterns. The risk-free rate for the expected term of the option is based on the U.S. Treasury yield curve in effect at the time of grant. The dividend yield of zero is based on the fact that we have never paid cash dividends and have no present intention to pay cash dividends.
We account for transactions in which services are received from non-employees in exchange for equity instruments based on the fair value of such services received or of the equity instruments issued, whichever is more reliably measured, in accordance with ASC 718 and the Equity Topic, ASC 505.
Income Taxes
We provide for income taxes in accordance with ASC 740, Accounting for Income Taxes. ASC 740 recognizes tax assets and liabilities for the cumulative effect of all temporary differences between the financial statement carrying amounts and the tax basis of assets and liabilities, and are measured using the enacted tax rates that will be in effect when these differences are expected to reverse. Valuation allowances are provided if, based on the weight of available evidence, it is more likely than not that some portion or all of the deferred tax assets will not be realized. We consider several sources of taxable income in making our valuation allowance assessments including taxable income in carryback years, future reversals of existing taxable temporary differences, tax planning strategies and forecasted future income.
65
Table of Contents
We account for uncertain tax positions following the provisions of ASC 740. ASC 740 clarifies the accounting for income taxes, by prescribing a minimum recognition threshold a tax position is required to meet before being recognized in the financial statements. ASC 740 also provides guidance on derecognition, measurement, classification, interest and penalties, accounting in interim periods, disclosure and transition.
Recent Accounting Pronouncements
In May 2014, the FASB issued guidance codified in ASC 606, Revenue Recognition—Revenue from Contracts with Customers, which amends the guidance in ASC 605, Revenue Recognition. This new revenue standard creates a single source of revenue guidance for all companies in all industries and is more principles-based than the current revenue guidance. The new guidance must be adopted using either a full retrospective approach for all periods presented in the period of adoption or a modified retrospective approach. ASC 606 is effective for interim and annual periods beginning after December 15, 2016. We are currently evaluating the impact of the provisions of ASC 606.
| Item 7A. | Quantitative and Qualitative Disclosures About Market Risk |
The following discussion about our market risk disclosures involves forward-looking statements. Actual results could differ materially from those projected in the forward-looking statements. We are exposed to market risk related to changes in interest rates and foreign currency exchange rates. We do not use derivative financial instruments.
Interest Rate Sensitivity. We maintain an investment portfolio consisting mainly of money market funds, state and municipal government obligations, U.S. government agencies and treasuries and corporate obligations and commercial paper. The securities, other than money market funds, are classified as available-for-sale and consequently are recorded on the balance sheet at fair value with unrealized gains and losses reported as a separate component of accumulated other comprehensive loss. All investments mature by December 19, 2016. These available-for-sale securities are subject to interest rate risk and will fall in value if market interest rates increase, which could result in a realized loss if we are forced to sell an investment before its scheduled maturity. We currently have the ability and intent to hold our fixed income investments until maturity. We do not utilize derivative financial instruments to manage our interest rate risks.
The following table provides information about our investment portfolio in available-for-sale debt securities. For investment securities, the table presents principal cash flows (in thousands) and weighted average interest rates by expected maturity dates.
| December 31, 2014 | Future Maturities in 2015 |
Future Maturities in 2016 |
||||||||||
| Investments (at fair value) |
$ | 58,231 | $ | 32,042 | $ | 26,189 | ||||||
| Weighted average interest rate |
0.30 | % | 0.24 | % | 0.37 | % | ||||||
Foreign Currency Exchange. A significant portion of our operations is conducted through operations in countries other than the United States. Revenues from our international operations that were recorded in U.S. dollars represented approximately 47% of our total international revenues during the year ended December 31, 2014. Substantially all of the remaining 53% were sales in euros, British pounds, Moroccan dirham, Japanese yen, Chinese yuan, South Korean won and Australian dollars. Since we conduct our business in U.S. dollars, our main exposure, if any, results from changes in the exchange rate between these currencies and the U.S. dollar. Our functional currency is the U.S. dollar. Our policy is to reduce exposure to exchange rate fluctuations by having most of our assets and liabilities, as well as most of our revenues and expenditures, in U.S. dollars, or U.S. dollar linked. We have not historically engaged in hedging activities relating to our non-U.S. dollar operations. We sell inventory to our subsidiaries in U.S. dollars. These amounts are recorded at our local subsidiaries in local currency rates in effect on the transaction date. Therefore, we may be exposed to exchange
66
Table of Contents
rate fluctuations that occur while the debt is outstanding which we recognize as unrealized gains and losses in our statements of operations. Upon settlement of these debts, we may record realized foreign exchange gains and losses in our statements of operations. We may incur negative foreign currency translation charges as a result of changes in currency exchange rates.
| Item 8. | Financial Statements and Supplementary Data |
All financial statements and schedules required to be filed hereunder are included beginning on page F-1 and are incorporated in this Annual Report by reference.
| Item 9. | Changes in and Disagreements with Accountants on Accounting and Financial Disclosure |
None.
| Item 9A. | Controls and Procedures |
Evaluation of Disclosure Controls and Procedures
Our management, with the participation of our chief executive officer and chief financial officer (our principal executive and principal financial officers, respectively), evaluated the effectiveness of our disclosure controls and procedures as of December 31, 2014. The term “disclosure controls and procedures,” as defined in Rules 13a-15(e) and 15d-15(e) under the Exchange Act, means controls and other procedures of a company that are designed to ensure that information required to be disclosed by a company in the reports that it files or submits under the Exchange Act is recorded, processed, summarized and reported, within the time periods specified in the SEC’s rules and forms. Disclosure controls and procedures include, without limitation, controls and procedures designed to ensure that information required to be disclosed by a company in the reports that it files or submits under the Exchange Act is accumulated and communicated to the company’s management, including its principal executive and principal financial officers, as appropriate to allow timely decisions regarding required disclosure. Management recognizes that any controls and procedures, no matter how well designed and operated, can provide only reasonable assurance of achieving their objectives and management necessarily applies its judgment in evaluating the cost-benefit relationship of possible controls and procedures. Based on the evaluation of our disclosure controls and procedures as of December 31, 2014, our chief executive officer and chief financial officer concluded that, as of such date, our disclosure controls and procedures were effective at the reasonable assurance level.
Changes in Internal Control over Financial Reporting
We acquired substantially all of the assets of Ellman on September 5, 2014. We are in the process of integrating the acquired operations into our overall internal control over financial reporting process and have extended our oversight and monitoring processes that support our internal control over financial reporting to include the acquired operations. There was no change in our internal control over financial reporting (as defined in Rules 13a-15(f) and 15d-15(f) under the Exchange Act) that occurred during the fourth quarter of the year ended December 31, 2014 that has materially affected, or is reasonably likely to materially affect, our internal control over financial reporting.
Management’s Annual Report on Internal Control over Financial Reporting
Management is responsible for establishing and maintaining adequate internal control over financial reporting as defined in Rule 13a-15(f) and 15d-15(f) under the Exchange Act. Internal control over financial reporting is designed to provide reasonable assurance regarding the reliability of financial reporting and the preparation of financial statements for external purposes in accordance with U.S. GAAP. Internal control over financial reporting includes those policies and procedures that: 1) pertain to the maintenance of records that, in reasonable detail, accurately and fairly reflect the transactions and dispositions of the assets of the company; 2)
67
Table of Contents
provide reasonable assurance that transactions are recorded as necessary to permit preparation of financial statements in accordance with U.S. GAAP, and that receipts and expenditures of the company are being made only in accordance with authorizations of management and directors of the company; and 3) provide reasonable assurance regarding prevention or timely detection of unauthorized acquisition, use or disposition of the company’s assets that could have a material effect on the financial statements.
Because of its inherent limitations, a system of internal control over financial reporting can provide only reasonable assurance and may not prevent or detect misstatements. Projections of any evaluation of effectiveness to future periods are subject to the risk that controls may become inadequate because of changes in conditions, or that the degree of compliance with the policies or procedures may deteriorate. Management assessed the effectiveness of our internal control over financial reporting as of December 31, 2014. In making its assessment, management used the criteria set forth in Internal Control–Integrated Framework (2013) issued by the Committee of Sponsoring Organizations (COSO) of the Treadway Commission (2013 framework). A “material weakness” is a control deficiency (within the meaning of Public Company Accounting Oversight Board Auditing Standard No. 5), or combination of control deficiencies, that result in there being more than a remote likelihood that a material misstatement of the annual or interim financial statements will not be prevented or detected on a timely basis by employees in the normal course of their assigned functions. Our assessment did not include an assessment of the internal controls of Ellman International, Inc. of which we acquired substantially all of the assets in September 2014, which is included in our 2014 consolidated financial statements and which constituted 2% and 1% of total and net assets, respectively, as of December 31, 2014 and 4% and 7% of revenues and net income, respectively, for the year then ended. Based on management’s assessment, management determined that we maintained effective internal control over financial reporting as of December 31, 2014 based on the COSO criteria.
Our internal control over financial reporting as of December 31, 2014 has been audited by Ernst & Young LLP, an independent registered public accounting firm, as stated in its report below.
68
Table of Contents
Report of Independent Registered Public Accounting Firm
The Board of Directors and Stockholders of
Cynosure, Inc.:
We have audited Cynosure, Inc.’s internal control over financial reporting as of December 31, 2014, based on criteria established in Internal Control—Integrated Framework issued by the Committee of Sponsoring Organizations of the Treadway Commission (2013 framework) (the COSO criteria). Cynosure Inc.’s management is responsible for maintaining effective internal control over financial reporting, and for its assessment of the effectiveness of internal control over financial reporting included in the accompanying Management’s Report on Internal Control over Financial Reporting. Our responsibility is to express an opinion on the company’s internal control over financial reporting based on our audit.
We conducted our audit in accordance with the standards of the Public Company Accounting Oversight Board (United States). Those standards require that we plan and perform the audit to obtain reasonable assurance about whether effective internal control over financial reporting was maintained in all material respects. Our audit included obtaining an understanding of internal control over financial reporting, assessing the risk that a material weakness exists, testing and evaluating the design and operating effectiveness of internal control based on the assessed risk, and performing such other procedures as we considered necessary in the circumstances. We believe that our audit provides a reasonable basis for our opinion.
A company’s internal control over financial reporting is a process designed to provide reasonable assurance regarding the reliability of financial reporting and the preparation of financial statements for external purposes in accordance with generally accepted accounting principles. A company’s internal control over financial reporting includes those policies and procedures that (1) pertain to the maintenance of records that, in reasonable detail, accurately and fairly reflect the transactions and dispositions of the assets of the company; (2) provide reasonable assurance that transactions are recorded as necessary to permit preparation of financial statements in accordance with generally accepted accounting principles, and that receipts and expenditures of the company are being made only in accordance with authorizations of management and directors of the company; and (3) provide reasonable assurance regarding prevention or timely detection of unauthorized acquisition, use, or disposition of the company’s assets that could have a material effect on the financial statements.
Because of its inherent limitations, internal control over financial reporting may not prevent or detect misstatements. Also, projections of any evaluation of effectiveness to future periods are subject to the risk that controls may become inadequate because of changes in conditions, or that the degree of compliance with the policies or procedures may deteriorate.
As indicated in the accompanying Management’s Annual Report on Internal Control Over Financial Reporting, management’s assessment of and conclusion on the effectiveness of internal control over financial reporting did not include the internal controls of Ellman International, Inc., which is included in the 2014 consolidated financial statements of Cynosure, Inc. and constituted 2% and 1% of total and net assets, respectively, as of December 31, 2014 and 4% and 7% of revenues and net income, respectively, for the year then ended. Our audit of internal control over financial reporting of Cynosure, Inc. also did not include an evaluation of the internal control over financial reporting of Ellman International, Inc.
In our opinion, Cynosure, Inc. maintained, in all material respects, effective internal control over financial reporting as of December 31, 2014, based on the COSO criteria.
We also have audited, in accordance with the standards of the Public Company Accounting Oversight Board (United States), the consolidated balance sheets of Cynosure, Inc. as of December 31, 2014 and 2013, and the related consolidated statements of operations, comprehensive income, stockholders’ equity, and cash flows for each of the three years in the period ended December 31, 2014 and our report dated March 13, 2015 expressed an unqualified opinion thereon.
/s/ Ernst & Young LLP
Boston, Massachusetts
March 13, 2015
69
Table of Contents
| Item 9B. | Other Information |
None.
70
Table of Contents
PART III
| Item 10. | Directors, Executive Officers and Corporate Governance |
The information required by this item with respect to our directors and executive officers will be contained in our 2015 Proxy Statement under the caption “INFORMATION ABOUT OUR DIRECTORS, OFFICERS AND 5% STOCKHOLDERS” and is incorporated in this Annual Report by reference.
The information required by this item with respect to Section 16(a) beneficial ownership reporting compliance will be contained in our 2015 Proxy Statement under the caption “SECTION 16(a) BENEFICIAL OWNERSHIP REPORTING COMPLIANCE” and is incorporated in this Annual Report by reference.
The information required by this item with respect to corporate governance matters will be contained in our 2015 Proxy Statement under the caption “CORPORATE GOVERNANCE” and is incorporated in this Annual Report by reference.
Code of Ethics
We have adopted a code of business conduct and ethics that applies to our directors and officers (including our principal executive officer, principal financial officer, principal accounting officer or controller, or persons performing similar functions) as well as our employees. Copies of our code of conduct are available without charge upon written request directed to Corporate Secretary, Cynosure, Inc., 5 Carlisle Road, Westford, Massachusetts 01886.
| Item 11. | Executive Compensation |
The information required by this item will be contained in our 2015 Proxy Statement under the captions “DIRECTOR COMPENSATION,” “COMPENSATION DISCUSSION AND ANALYSIS” and “EXECUTIVE COMPENSATION” and is incorporated in this Annual Report by reference.
| Item 12. | Security Ownership of Certain Beneficial Owners and Management and Related Stockholder Matters |
The information required by this item with regard to security ownership of certain beneficial owners and management will be contained in our 2015 Proxy Statement under the caption “INFORMATION ABOUT OUR DIRECTORS, OFFICERS AND 5% STOCKHOLDERS—Security Ownership of Certain Beneficial Owners and Management” and is incorporated in this Annual Report by reference.
The information required by this item with regard to securities authorized for issuance under equity compensation plans will be contained in our 2015 Proxy Statement under the caption “EXECUTIVE COMPENSATION—Securities Authorized for Issuance under our Equity Compensation Plans” and is incorporated in this Annual Report by reference.
| Item 13. | Certain Relationships and Related Transactions, and Director Independence |
The information required by this item will be contained in our 2015 Proxy Statement under the captions “RELATED-PERSON TRANSACTIONS” and “CORPORATE GOVERNANCE” and is incorporated in this Annual Report by reference.
| Item 14. | Principal Accountant Fees and Services |
The information required by this item will be contained in our 2015 Proxy Statement under the caption “PROPOSAL 3—RATIFICATION OF THE SELECTION OF INDEPENDENT REGISTERED PUBLIC ACCOUNTING FIRM” and is incorporated in this Annual Report by reference.
71
Table of Contents
PART IV
| Item 15. | Exhibits and Financial Statement Schedules |
| (a) |
1. Financial Statements. The financial statements and notes thereto annexed to this Annual Report begin on page F-1. | |
| 2. Financial Statement Schedules. All other supplemental schedules are omitted because of the absence of conditions under which they are required or because the required information is given in the financial statements or notes thereto. | ||
| 3. Exhibits. The Exhibit Index annexed to this Annual Report, and immediately preceding the exhibits, is incorporated by reference. | ||
72
Table of Contents
Pursuant to the requirements of Section 13 or 15(d) of the Securities Exchange Act of 1934, the registrant has duly caused this report to be signed on its behalf by the undersigned, thereunto duly authorized.
| CYNOSURE, INC. | ||
| By: |
/s/ MICHAEL R. DAVIN | |
| Michael R. Davin | ||
| Chief Executive Officer and Chairman of the Board of Directors | ||
| Date: March 13, 2015 | ||
Pursuant to the requirements of the Securities Act of 1934, this report has been signed below by the following persons on behalf of the registrant and in the capacities and on the dates indicated.
| Signature |
Title |
Date | ||
| /s/ MICHAEL R. DAVIN Michael R. Davin |
Chief Executive Officer and Chairman of the Board of Directors (Principal Executive Officer) |
March 13, 2015 | ||
| /s/ TIMOTHY W. BAKER Timothy W. Baker |
President, Chief Financial Officer and Treasurer (Principal Financial Officer and Principal Accounting Officer) |
March 13, 2015 | ||
| /s/ BRIAN M. BAREFOOT Brian M. Barefoot |
Director |
March 13, 2015 | ||
| /s/ ETTORE V. BIAGIONI Ettore V. Biagioni |
Director |
March 13, 2015 | ||
| /s/ WILLIAM O. FLANNERY William Flannery |
Director |
March 13, 2015 | ||
| /s/ MARINA HATSOPOULOS Marina Hatsopoulos |
Director |
March 13, 2015 | ||
| /s/ THOMAS H. ROBINSON Thomas H. Robinson |
Director |
March 13, 2015 | ||
73
Table of Contents
CYNOSURE, INC.
INDEX TO FINANCIAL STATEMENTS
| Consolidated Financial Statements of Cynosure, Inc. |
||||
| F-2 | ||||
| F-3 | ||||
| F-4 | ||||
| F-5 | ||||
| F-6 | ||||
| F-7 | ||||
| F-8 |
F-1
Table of Contents
REPORT OF INDEPENDENT REGISTERED PUBLIC ACCOUNTING FIRM
The Board of Directors and Stockholders
Cynosure, Inc.:
We have audited the accompanying consolidated balance sheets of Cynosure, Inc. as of December 31, 2014 and 2013, and the related consolidated statements of operations, comprehensive income (loss), stockholders’ equity, and cash flows for each of the three years in the period ended December 31, 2014. These financial statements are the responsibility of the Company’s management. Our responsibility is to express an opinion on these financial statements based on our audits.
We conducted our audits in accordance with the standards of the Public Company Accounting Oversight Board (United States). Those standards require that we plan and perform the audit to obtain reasonable assurance about whether the financial statements are free of material misstatement. An audit includes examining, on a test basis, evidence supporting the amounts and disclosures in the financial statements. An audit also includes assessing the accounting principles used and significant estimates made by management, as well as evaluating the overall financial statement presentation. We believe that our audits provide a reasonable basis for our opinion.
In our opinion, the financial statements referred to above present fairly, in all material respects, the consolidated financial position of Cynosure, Inc. at December 31, 2014 and 2013, and the consolidated results of its operations and its cash flows for each of the three years in the period ended December 31, 2014, in conformity with U.S. generally accepted accounting principles.
We also have audited, in accordance with the standards of the Public Company Accounting Oversight Board (United States), Cynosure, Inc.’s internal control over financial reporting as of December 31, 2014, based on criteria established in Internal Control-Integrated Framework issued by the Committee of Sponsoring Organizations of the Treadway Commission (2013 framework) and our report dated March 13, 2015 expressed an unqualified opinion thereon.
/s/ Ernst & Young LLP
Boston, Massachusetts
March 13, 2015
F-2
Table of Contents
CONSOLIDATED BALANCE SHEETS
(In thousands, except per share data)
| December 31, | ||||||||
| 2014 | (Recast) 2013 |
|||||||
| ASSETS | ||||||||
| Current assets: |
||||||||
| Cash and cash equivalents |
$ | 75,131 | $ | 93,655 | ||||
| Short-term marketable securities |
32,055 | 26,633 | ||||||
| Accounts receivable, net of allowance of $2,949 and $1,803 in 2014 and 2013, respectively |
42,524 | 36,587 | ||||||
| Inventories |
59,318 | 50,251 | ||||||
| Prepaid expenses and other current assets |
9,629 | 6,891 | ||||||
| Deferred income taxes |
17,228 | 9,341 | ||||||
|
|
|
|
|
|||||
| Total current assets |
235,885 | 223,358 | ||||||
| Property and equipment, net |
34,256 | 26,445 | ||||||
| Long-term marketable securities |
26,189 | 8,804 | ||||||
| Goodwill |
105,764 | 99,237 | ||||||
| Intangibles, net |
53,583 | 55,179 | ||||||
| Other assets |
2,047 | 1,678 | ||||||
|
|
|
|
|
|||||
| Total assets |
$ | 457,724 | $ | 414,701 | ||||
|
|
|
|
|
|||||
| LIABILITIES AND STOCKHOLDERS’ EQUITY | ||||||||
| Current liabilities: |
||||||||
| Accounts payable |
$ | 20,856 | $ | 13,985 | ||||
| Amounts due to related party |
— | 1,268 | ||||||
| Accrued expenses |
42,426 | 36,954 | ||||||
| Deferred revenue |
10,971 | 9,163 | ||||||
| Capital lease obligations |
137 | 286 | ||||||
|
|
|
|
|
|||||
| Total current liabilities |
74,390 | 61,656 | ||||||
| Capital lease obligations, net of current portion |
16,088 | 14,957 | ||||||
| Deferred revenue, net of current portion |
809 | 1,010 | ||||||
| Other noncurrent liabilities |
8,325 | 8,726 | ||||||
| Commitments and Contingencies (Note 13) |
||||||||
| Stockholders’ equity: |
||||||||
| Preferred stock, $0.001 par value Authorized—5,000 shares as of December 31, 2014 and 2013 Issued—no shares as of December 31, 2014 and 2013 |
— | — | ||||||
| Class A and Class B common stock, $0.001 par value Authorized—70,000 shares as of December 31, 2014 and 2013 |
||||||||
| Issued—23,253 Class A shares and no Class B shares at December 31, 2014 Issued—22,633 Class A shares and no Class B shares at December 31, 2013 |
23 | 23 | ||||||
| Additional paid-in capital |
355,082 | 338,742 | ||||||
| Retained earnings |
39,974 | 8,636 | ||||||
| Accumulated other comprehensive loss |
(3,863 | ) | (1,499 | ) | ||||
| Treasury stock, 1,628 Class A shares, at cost, at December 31, 2014; 886 Class A shares, at cost, at December 31, 2013 |
(33,104 | ) | (17,550 | ) | ||||
|
|
|
|
|
|||||
| Total stockholders’ equity |
358,112 | 328,352 | ||||||
|
|
|
|
|
|||||
| Total liabilities and stockholders’ equity |
$ | 457,724 | $ | 414,701 | ||||
|
|
|
|
|
|||||
The accompanying notes are an integral part of these consolidated financial statements.
F-3
Table of Contents
CONSOLIDATED STATEMENTS OF OPERATIONS
(In thousands, except per share data)
| Year Ended December 31, | ||||||||||||
| 2014 | 2013 | 2012 | ||||||||||
| Product revenues |
$ | 236,878 | $ | 188,271 | $ | 128,513 | ||||||
| Parts, accessories, service and royalty revenues |
55,491 | 37,739 | 24,980 | |||||||||
|
|
|
|
|
|
|
|||||||
| Total revenues |
292,369 | 226,010 | 153,493 | |||||||||
| Cost of revenues |
127,131 | 95,730 | 64,567 | |||||||||
|
|
|
|
|
|
|
|||||||
| Gross profit |
165,238 | 130,280 | 88,926 | |||||||||
| Operating expenses: |
||||||||||||
| Sales and marketing |
88,564 | 65,211 | 48,220 | |||||||||
| Research and development |
22,033 | 17,473 | 12,972 | |||||||||
| Amortization of intangible assets acquired |
2,961 | 2,114 | 1,368 | |||||||||
| General and administrative |
30,420 | 51,309 | 14,233 | |||||||||
|
|
|
|
|
|
|
|||||||
| Total operating expenses |
143,978 | 136,107 | 76,793 | |||||||||
|
|
|
|
|
|
|
|||||||
| Income (loss) from operations |
21,260 | (5,827 | ) | 12,133 | ||||||||
| Interest (expense) income, net |
(1,446 | ) | (23 | ) | 60 | |||||||
| Other (expense) income, net |
(1,476 | ) | 313 | 532 | ||||||||
|
|
|
|
|
|
|
|||||||
| Income (loss) before (benefit) provision for income taxes |
18,338 | (5,537 | ) | 12,725 | ||||||||
| (Benefit) provision for income taxes |
(13,000 | ) | (3,890 | ) | 1,764 | |||||||
|
|
|
|
|
|
|
|||||||
| Net income (loss) |
$ | 31,338 | $ | (1,647 | ) | $ | 10,961 | |||||
|
|
|
|
|
|
|
|||||||
| Basic net income (loss) per share |
$ | 1.44 | $ | (0.09 | ) | $ | 0.83 | |||||
|
|
|
|
|
|
|
|||||||
| Diluted net income (loss) per share |
$ | 1.41 | $ | (0.09 | ) | $ | 0.79 | |||||
|
|
|
|
|
|
|
|||||||
| Basic weighted average common shares outstanding |
21,824 | 19,325 | 13,189 | |||||||||
|
|
|
|
|
|
|
|||||||
| Diluted weighted average common shares outstanding |
22,195 | 19,325 | 13,792 | |||||||||
|
|
|
|
|
|
|
|||||||
The accompanying notes are an integral part of these consolidated financial statements.
F-4
Table of Contents
CONSOLIDATED STATEMENTS OF COMPREHENSIVE INCOME (LOSS)
(In thousands)
| Year Ended December 31, | ||||||||||||
| 2014 | 2013 | 2012 | ||||||||||
| Net income (loss) |
$ | 31,338 | $ | (1,647 | ) | $ | 10,961 | |||||
|
|
|
|
|
|
|
|||||||
| Other comprehensive (loss) income components: |
||||||||||||
| Cumulative translation adjustment |
(2,318 | ) | 77 | 452 | ||||||||
| Unrealized (loss) gain on marketable securities, net of taxes |
(46 | ) | 23 | (10 | ) | |||||||
|
|
|
|
|
|
|
|||||||
| Total other comprehensive (loss) income |
(2,364 | ) | 100 | 442 | ||||||||
|
|
|
|
|
|
|
|||||||
| Comprehensive income (loss) |
$ | 28,974 | $ | (1,547 | ) | $ | 11,403 | |||||
|
|
|
|
|
|
|
|||||||
The accompanying notes are an integral part of these consolidated financial statements.
F-5
Table of Contents
CONSOLIDATED STATEMENTS OF STOCKHOLDERS’ EQUITY
(In thousands)
| Class A and B Common Stock |
Additional Paid-In Capital |
Retained Earnings (Accumulated Deficit) |
Accumulated Other Comprehensive Loss |
Class A and
B Treasury Stock |
Total Stockholders’ Equity |
|||||||||||||||||||||||||||
| Shares | $0.001 Par Value |
Shares | Cost | |||||||||||||||||||||||||||||
| Balance at December 31, 2011 |
12,803 | $ | 13 | $ | 124,506 | $ | (678 | ) | $ | (2,041 | ) | (233 | ) | $ | (2,173 | ) | $ | 119,627 | ||||||||||||||
|
|
|
|
|
|
|
|
|
|
|
|
|
|
|
|
|
|||||||||||||||||
| Stock-based compensation expense |
— | — | 2,913 | — | — | — | — | 2,913 | ||||||||||||||||||||||||
| Exercise of stock options |
759 | 1 | 7,157 | — | — | — | — | 7,158 | ||||||||||||||||||||||||
| Tax benefit from stock-based compensation expense in excess of book deductions |
— | — | 1,153 | — | — | — | — | 1,153 | ||||||||||||||||||||||||
| Public offering of common stock |
2,840 | 3 | 55,250 | — | — | — | — | 55,253 | ||||||||||||||||||||||||
| Net income |
— | — | — | 10,961 | — | — | — | 10,961 | ||||||||||||||||||||||||
| Cumulative translation adjustment |
— | — | — | — | 452 | — | — | 452 | ||||||||||||||||||||||||
| Unrealized loss on marketable securities, net of taxes |
— | — | — | — | (10 | ) | — | — | (10 | ) | ||||||||||||||||||||||
|
|
|
|
|
|
|
|
|
|
|
|
|
|
|
|
|
|||||||||||||||||
| Balance at December 31, 2012 |
16,402 | $ | 17 | $ | 190,979 | $ | 10,283 | $ | (1,599 | ) | (233 | ) | $ | (2,173 | ) | $ | 197,507 | |||||||||||||||
|
|
|
|
|
|
|
|
|
|
|
|
|
|
|
|
|
|||||||||||||||||
| Stock-based compensation expense |
— | — | 3,694 | — | — | — | — | 3,694 | ||||||||||||||||||||||||
| Exercise of stock options |
203 | — | 2,721 | — | — | — | — | 2,721 | ||||||||||||||||||||||||
| Tax benefit from stock-based compensation expense in excess of book deductions |
— | — | 563 | — | — | — | — | 563 | ||||||||||||||||||||||||
| Repurchase of common stock |
— | — | — | — | — | (653 | ) | (15,377 | ) | (15,377 | ) | |||||||||||||||||||||
| Issuance of common stock associated with acquisition of Palomar |
6,028 | 6 | 141,353 | — | — | — | — | 141,359 | ||||||||||||||||||||||||
| Equity issuance costs associated with acquisition of Palomar |
— | — | (568 | ) | — | — | — | — | (568 | ) | ||||||||||||||||||||||
| Net loss |
— | — | — | (1,647 | ) | — | — | — | (1,647 | ) | ||||||||||||||||||||||
| Cumulative translation adjustment |
— | — | — | — | 77 | — | — | 77 | ||||||||||||||||||||||||
| Unrealized gain on marketable securities, net of taxes |
— | — | — | — | 23 | — | — | 23 | ||||||||||||||||||||||||
|
|
|
|
|
|
|
|
|
|
|
|
|
|
|
|
|
|||||||||||||||||
| Balance at December 31, 2013 |
22,633 | $ | 23 | $ | 338,742 | $ | 8,636 | $ | (1,499 | ) | (886 | ) | $ | (17,550 | ) | $ | 328,352 | |||||||||||||||
|
|
|
|
|
|
|
|
|
|
|
|
|
|
|
|
|
|||||||||||||||||
| Stock-based compensation expense |
— | — | 7,114 | — | — | — | — | 7,114 | ||||||||||||||||||||||||
| Exercise of stock options and vesting of restricted stock units |
620 | — | 8,153 | — | — | — | — | 8,153 | ||||||||||||||||||||||||
| Tax benefit from stock-based compensation expense in excess of book deductions |
— | — | 1,073 | — | — | — | — | 1,073 | ||||||||||||||||||||||||
| Repurchase of common stock |
— | — | — | — | — | (742 | ) | (15,554 | ) | (15,554 | ) | |||||||||||||||||||||
| Net income |
— | — | — | 31,338 | — | — | — | 31,338 | ||||||||||||||||||||||||
| Cumulative translation adjustment |
— | — | — | — | (2,318 | ) | — | — | (2,318 | ) | ||||||||||||||||||||||
| Unrealized loss on marketable securities, net of taxes |
— | — | — | — | (46 | ) | — | — | (46 | ) | ||||||||||||||||||||||
|
|
|
|
|
|
|
|
|
|
|
|
|
|
|
|
|
|||||||||||||||||
| Balance at December 31, 2014 |
23,253 | $ | 23 | $ | 355,082 | $ | 39,974 | $ | (3,863 | ) | (1,628 | ) | $ | (33,104 | ) | $ | 358,112 | |||||||||||||||
|
|
|
|
|
|
|
|
|
|
|
|
|
|
|
|
|
|||||||||||||||||
The accompanying notes are an integral part of these consolidated financial statements.
F-6
Table of Contents
CONSOLIDATED STATEMENTS OF CASH FLOWS
(In thousands)
| Year Ended December 31, | ||||||||||||
| 2014 | 2013 | 2012 | ||||||||||
| Operating activities: |
||||||||||||
| Net income (loss) |
$ | 31,338 | $ | (1,647 | ) | $ | 10,961 | |||||
| Reconciliation of net income (loss) to net cash from operating activities: |
||||||||||||
| Depreciation and amortization |
17,546 | 9,103 | 6,870 | |||||||||
| Impairment loss on assets held for sale |
— | 607 | — | |||||||||
| Stock-based compensation |
7,113 | 3,688 | 2,910 | |||||||||
| Loss (gain) on disposal of fixed assets |
217 | 100 | (19 | ) | ||||||||
| Noncash interest expense on capital lease obligations |
1,495 | — | — | |||||||||
| Noncash interest expense on license transfer agreement |
67 | — | — | |||||||||
| Deferred income taxes |
(15,786 | ) | (5,284 | ) | (352 | ) | ||||||
| Net accretion of marketable securities |
1,675 | 1,448 | 1,480 | |||||||||
| Changes in operating assets and liabilities, excluding effect of business combinations: |
||||||||||||
| Accounts receivable |
(4,864 | ) | (9,132 | ) | (4,861 | ) | ||||||
| Inventories |
(8,257 | ) | (5,591 | ) | (6,183 | ) | ||||||
| Net book value of demonstration inventory sold |
963 | 604 | 884 | |||||||||
| Prepaid expenses and other current assets |
1,183 | 540 | (980 | ) | ||||||||
| Accounts payable |
4,432 | (1,724 | ) | (151 | ) | |||||||
| Due to related party |
1,282 | (628 | ) | 347 | ||||||||
| Tax benefit from stock option exercises |
(1,073 | ) | (565 | ) | (1,178 | ) | ||||||
| Accrued expenses |
3,331 | 11,145 | 4,704 | |||||||||
| Deferred revenue |
1,402 | 816 | (135 | ) | ||||||||
| Other noncurrent liabilities |
42 | (102 | ) | 319 | ||||||||
|
|
|
|
|
|
|
|||||||
| Net cash from operating activities |
42,106 | 3,378 | 14,616 | |||||||||
| Investing activities: |
||||||||||||
| Purchases of property and equipment |
(15,819 | ) | (3,457 | ) | (3,116 | ) | ||||||
| Proceeds from the sale of property and equipment |
41 | 25,206 | — | |||||||||
| Proceeds from the sales and maturities of marketable securities |
32,400 | 84,054 | 45,400 | |||||||||
| Purchases of marketable securities |
(56,948 | ) | (23,088 | ) | (69,878 | ) | ||||||
| Cash paid for acquisitions, net of cash received |
(13,235 | ) | (64,978 | ) | — | |||||||
| (Increase) decrease in other assets |
(117 | ) | (519 | ) | 110 | |||||||
|
|
|
|
|
|
|
|||||||
| Net cash (used in) from investing activities |
(53,678 | ) | 17,218 | (27,484 | ) | |||||||
| Financing activities: |
||||||||||||
| Excess tax benefit on options exercised |
1,073 | 565 | 1,178 | |||||||||
| Repurchases of common stock |
(15,554 | ) | (15,377 | ) | — | |||||||
| Proceeds from public offering of common stock |
— | — | 55,253 | |||||||||
| Proceeds from stock option exercises |
8,153 | 2,721 | 7,158 | |||||||||
| Acquisition-related equity issuance costs |
— | (568 | ) | — | ||||||||
| Payments on capital lease obligation |
(688 | ) | (320 | ) | (305 | ) | ||||||
|
|
|
|
|
|
|
|||||||
| Net cash (used in) from financing activities |
(7,016 | ) | (12,979 | ) | 63,284 | |||||||
| Effect of exchange rate changes on cash and cash equivalents |
64 | (19 | ) | (53 | ) | |||||||
|
|
|
|
|
|
|
|||||||
| Net (decrease) increase in cash and cash equivalents |
(18,524 | ) | 7,598 | 50,363 | ||||||||
| Cash and cash equivalents, beginning of year |
93,655 | 86,057 | 35,694 | |||||||||
|
|
|
|
|
|
|
|||||||
| Cash and cash equivalents, end of year |
$ | 75,131 | $ | 93,655 | $ | 86,057 | ||||||
|
|
|
|
|
|
|
|||||||
| Supplemental cash flow information: |
||||||||||||
| Cash paid for interest |
$ | 19 | $ | 25 | $ | 42 | ||||||
|
|
|
|
|
|
|
|||||||
| Cash paid for income taxes |
$ | 2,899 | $ | 1,030 | $ | 1,767 | ||||||
|
|
|
|
|
|
|
|||||||
| Supplemental noncash investing and financing activities: |
||||||||||||
| Transfer of demonstration equipment from inventory to fixed assets |
$ | 4,135 | $ | 6,190 | $ | 2,988 | ||||||
|
|
|
|
|
|
|
|||||||
| Assets acquired under capital lease |
$ | 239 | $ | 14,828 | $ | 351 | ||||||
|
|
|
|
|
|
|
|||||||
| Fair value of shares issued in acquisition |
$ | — | $ | 141,359 | $ | — | ||||||
|
|
|
|
|
|
|
|||||||
The accompanying notes are an integral part of these consolidated financial statements.
F-7
Table of Contents
NOTES TO CONSOLIDATED FINANCIAL STATEMENTS
1. Nature of the Business
Cynosure, Inc. (“Cynosure” or “the Company”) develops and markets aesthetic treatment systems that enable plastic surgeons, dermatologists and other medical practitioners to perform non-invasive and minimally invasive procedures to remove hair, treat vascular and benign pigmented lesions, remove multi-colored tattoos, revitalize the skin, liquefy and remove unwanted fat through laser lipolysis, reduce cellulite, clear nails infected by toe fungus, ablate sweat glands and improve vaginal health. Cynosure also markets radiofrequency energy sourced medical devices for precision surgical applications such as facial plastic and general surgery, gynecology, ear, nose, and throat procedures, ophthalmology, oral and maxillofacial surgery, podiatry and proctology. Cynosure sells its products through a direct sales force in the United States, Canada, Mexico, France, Morocco, Germany, Spain, the United Kingdom, Australia, China, Japan and Korea and through international distributors in approximately 120 other countries. Cynosure is a Delaware corporation, incorporated on July 10, 1991, located in Westford, Massachusetts.
2. Summary of Significant Accounting Policies
Significant accounting policies followed in the preparation of these consolidated financial statements are as follows:
Management Estimates
The preparation of financial statements in conformity with accounting principles generally accepted in the United States (“U.S. GAAP”) requires management to make estimates and assumptions that affect the reported amounts of assets, liabilities, revenues and expenses, and the related disclosures at the date of the financial statements and during the reporting period. Components particularly subject to estimation include the allowance for doubtful accounts, inventory reserves, intangible assets, impairment analysis of goodwill and intangibles, deferred tax assets, liabilities and valuation allowances, fair value of stock options and investments and accrued warranties. On an ongoing basis, management evaluates its estimates. Actual results could differ from these estimates.
Principles of Consolidation
The accompanying consolidated financial statements include the accounts of Cynosure, Inc. and its wholly owned subsidiaries: Cynosure Securities Corporation, Palomar Medical Products, LLC, Cynosure Mexico, Cynosure Langen GmbH, Cynosure Hamburg GmbH, S.A.R.L. Cynosure France, Cynosure Maroc SARL, Cynosure UK LTD, Cynosure Spain S.L., Cynosure B.V., Cynosure K.K., Suzhou Cynosure Medical Devices Company Ltd., Cynosure Korea Limited, Cynosure Pty Ltd., and Palomar Japan K.K. All intercompany balances and transactions have been eliminated.
Reclassification
Certain amounts in prior years’ financial statements have been reclassified to conform to the current year’s presentation within the consolidated statements of operations.
Cash, Cash Equivalents, Short and Long-Term Marketable Securities
Cynosure considers all short-term, highly liquid investments with original maturities at the time of purchase of 90 days or less to be cash equivalents. Cynosure accounts for short and long-term marketable securities as available-for-sale in accordance with Accounting Standards Codification (“ASC”) 320, Investments—Debt and Equity Securities Topic. Under ASC 320, securities purchased to be held for indefinite periods of time and not intended at the time of purchase to be held until maturity are classified as available-for-sale securities. ASC 320
F-8
Table of Contents
requires Cynosure to recognize all marketable securities on the consolidated balance sheets at fair value. Cynosure’s marketable securities are stated at fair value based on quoted market prices. Adjustments to the fair value of marketable securities that are classified as available-for-sale are recorded as increases or decreases, net of income taxes, within accumulated other comprehensive loss in shareholders’ equity. The amortized cost of marketable debt securities is adjusted for amortization of premiums and discounts to maturity computed under the effective interest method. The cost of securities sold is determined by the specific identification method. Cynosure continually evaluates whether any marketable securities have been impaired and, if so, whether such impairment is temporary or other than temporary.
Fair Value of Financial Instruments
Cynosure’s financial instruments consist of cash, cash equivalents, short and long-term marketable securities, accounts receivable and capital leases. Cynosure’s estimate of fair value for financial instruments, other than marketable securities, which are carried at fair value, approximates their carrying value at December 31, 2014 and 2013.
ASC 820, Fair Value Measurement Topic, applies to all financial assets and financial liabilities that are being measured and reported on a fair value basis, establishes a framework for measuring fair value of assets and liabilities and expands disclosures about fair value measurements.
Concentration of Credit Risk
Financial instruments that subject Cynosure to credit risk consist primarily of cash and cash equivalents, short and long-term marketable securities and accounts receivable. Cynosure places cash and cash equivalents and short and long-term marketable securities in established financial institutions. Cynosure has no significant off-balance-sheet risk or concentration of credit risk, such as foreign exchange contracts, options contracts, or other foreign hedging arrangements. Cynosure’s accounts receivable balance, net of allowance for doubtful accounts, was $42.5 million as of December 31, 2014, compared with $36.6 million as of December 31, 2013. The allowance for doubtful accounts as of December 31, 2014 and 2013 was $2.9 million and $1.8 million, respectively. Cynosure maintains an allowance for doubtful accounts based upon the aging of its receivable balances, known collectibility issues and Cynosure’s historical experience with losses. Cynosure works to mitigate bad debt exposure through its credit evaluation policies, reasonably short payment terms and geographical dispersion of sales. Losses from bad debt have historically been within management’s estimates. Cynosure’s revenue includes export sales to foreign companies located principally in Europe, the Asia/Pacific region and the Middle East. Cynosure obtains letters of credit for foreign sales that the Company considers to be at risk.
No customer accounted for 10% or greater of revenue during 2014, 2013 or 2012. No customer accounted for 10% or greater of accounts receivable as of December 31, 2014 or 2013. Accounts receivable allowance activity consisted of the following for the years ended December 31:
| 2014 | 2013 | 2012 | ||||||||||
| (In thousands) | ||||||||||||
| Balance at beginning of year |
$ | 1,803 | $ | 2,043 | $ | 1,872 | ||||||
| Additions |
2,373 | 1,058 | 591 | |||||||||
| Deductions |
(1,227 | ) | (1,298 | ) | (420 | ) | ||||||
|
|
|
|
|
|
|
|||||||
| Balance at end of year |
$ | 2,949 | $ | 1,803 | $ | 2,043 | ||||||
|
|
|
|
|
|
|
|||||||
F-9
Table of Contents
Inventory
Cynosure states all inventories at the lower of cost or market, determined on a first-in, first-out method. Inventory includes material, labor and overhead and consists of the following:
| December 31, | ||||||||
| 2014 | 2013 (recast) | |||||||
| (In thousands) | ||||||||
| Raw materials |
$ | 16,875 | $ | 16,900 | ||||
| Work in process |
3,526 | 2,316 | ||||||
| Finished goods |
38,917 | 31,035 | ||||||
|
|
|
|
|
|||||
| $ | 59,318 | $ | 50,251 | |||||
|
|
|
|
|
|||||
Included in finished goods are lasers used for demonstration purposes. Cynosure’s policy is to include demonstration lasers as inventory for a period of up to one year after being used by the sales force at which time the demonstration lasers are either sold or transferred to fixed assets at the lower of cost or market and depreciated over their estimated useful life of three years. Similar to any other finished goods in inventory, Cynosure accounts for such demonstration inventory in accordance with the policy for excess and obsolescence review of Cynosure’s entire inventory.
Cynosure’s excess and obsolescence reserve policy is to establish inventory reserves when conditions exist that suggest that inventory may be in excess of anticipated demand or is obsolete based upon assumptions about future demand for products and market conditions. Cynosure regularly evaluates the ability to realize the value of inventory based on a combination of factors including the following: historical usage rates, forecasted sales or usage, product end of life dates, estimated current and future market values and new product introductions.
Cynosure purchases raw material components as well as certain finished goods from sole source suppliers. A delay in the production capabilities of these vendors could cause a delay in Cynosure’s manufacturing, and a possible loss of revenues, which would adversely affect operating results.
Property and Equipment
Property and equipment are recorded at cost less accumulated depreciation. Depreciation is computed using the straight-line method over the estimated useful lives of the assets. Assets under capital leases and leasehold improvements are amortized using the straight-line method over the shorter of the estimated useful life of the asset or the respective lease term. Included in property and equipment are certain lasers that are used for demonstration purposes. Maintenance and repairs are charged to expense as incurred. Cynosure continually evaluates whether events or circumstances have occurred that indicate that the estimated remaining useful life of its long-lived assets may warrant revision or that the carrying value of these assets may be impaired. Cynosure evaluates the realizability of its long-lived assets based on profitability and cash flow expectations for the related asset. Any write-downs are treated as permanent reductions in the carrying amount of the assets. Based on this evaluation, Cynosure believes that, as of each of the balance sheet dates presented, none of Cynosure’s long-lived assets were impaired.
Intangible Assets
Cynosure capitalizes and includes in intangible assets the costs of developed technology and patents, customer relationships, trade names and business licenses. Intangible assets are recorded at fair value and stated net of accumulated amortization and impairments. Cynosure amortizes its intangible assets that have finite lives using either the straight-line or accelerated method, based on the useful life of the asset over which it is expected to be consumed utilizing expected undiscounted future cash flows. Amortization is recorded over the estimated useful lives ranging from five to 23 years. Cynosure evaluates the realizability of its definite lived intangible
F-10
Table of Contents
assets whenever events or changes in circumstances or business conditions indicate that the carrying value of these assets may not be recoverable based on expectations of future undiscounted cash flows for each asset group. If the carrying value of an asset or asset group exceeds its undiscounted cash flows, Cynosure estimates the fair value of the assets, generally utilizing a discounted cash flow analysis based on the present value of estimated future cash flows to be generated by the assets using a risk-adjusted discount rate. To estimate the fair value of the assets, Cynosure uses market participant assumptions pursuant to ASC 820, Fair Value Measurements. If the estimate of an intangible asset’s remaining useful life is changed, Cynosure will amortize the remaining carrying value of the intangible asset prospectively over the revised useful life.
Goodwill
Goodwill represents the excess of the purchase price over the fair value of assets acquired and liabilities assumed in a business combination. Cynosure does not amortize its goodwill, but instead tests for impairment at least annually and more frequently whenever events or changes in circumstances indicate that the fair value of the asset may be less than its carrying value of the asset. Cynosure’s annual test for impairment occurs on the first day of its fourth quarter.
Cynosure has adopted Accounting Standards Update (“ASU”) 2011-08 Intangibles—Goodwill and Other, an amendment to ASC 350, which updates how an entity will evaluate its goodwill for impairment. The guidance provides entities an option to perform a “qualitative” assessment to determine whether further impairment testing is necessary. If further testing is required, the test for impairment continues with the two step process. The first step compares the carrying amount of the reporting unit to its estimated fair value (Step 1). To the extent that the carrying value of the reporting unit exceeds its estimated fair value, a second step is performed, wherein the reporting unit’s carrying value is compared to the implied fair value (Step 2). To the extent that the carrying value exceeds the implied fair value, impairment exists and must be recognized.
Cynosure has one reporting unit for goodwill impairment testing and has performed a qualitative assessment on that reporting unit. As a result of this assessment, the Company determined that goodwill is not impaired as of December 31, 2014 and 2013.
Revenue Recognition and Deferred Revenue
Cynosure generates revenue from the sale of non-invasive and minimally invasive light-based aesthetic treatment applications, as well as radiofrequency energy based surgical and aesthetic applications. Cynosure offers service and warranty contracts in connection with these sales.
Cynosure recognizes revenue from sales of aesthetic treatment systems and parts and accessories in accordance with the Revenue Recognition Topic ASC 605-10-S99. Cynosure recognizes revenue from sales of its treatment systems and parts and accessories upon delivery, provided there are no uncertainties regarding customer acceptance, there is persuasive evidence of an arrangement, the fee is fixed or determinable, and collectibility of the related receivable is reasonably assured. Revenues from the sales of service and warranty contracts are deferred and recognized on a straight-line basis over the contract period as services are provided. Payments received by Cynosure in advance of product delivery or performance of services are deferred until earned.
Cynosure recognizes royalty revenues when it can reliably estimate such amounts and collectability is reasonably assured. As such, Cynosure recognizes royalty revenues in the quarter reported to the Company by its licensees, or one quarter following the quarter in which sales by Cynosure’s licensees occurred. Royalty revenues also include amounts due from settlements with licensees for back-owed royalties from prior periods. These settlement amounts are considered revenue, when collectability is reasonably assured, because they constitute Cynosure’s ongoing major or central operations.
F-11
Table of Contents
In December 2013, Cynosure completed a comprehensive settlement agreement with Tria Beauty, Inc. (“Tria”) which ended the patent infringement litigation between Tria and Palomar Medical Technologies, Inc. (“Palomar”). Under the agreement, Cynosure is entitled to receive $10.0 million plus future royalty payments. Cynosure will pay approximately $2.0 million of this revenue to Massachusetts General Hospital (“MGH”) under an exclusive license agreement between Palomar and MGH, which will be recorded as cost of revenues within Cynosure’s consolidated statement of operations. Cynosure recognized $3.0 million and $4.0 million of this revenue in the years ended December 31, 2014 and 2013, respectively which is recorded as royalty revenues within Cynosure’s consolidated statement of operations. Cynosure recognized $0.8 million and $1.0 million in cost of revenues in the years ended December 31, 2014 and 2013, respectively, related to this revenue.
Multiple-element arrangements are evaluated in accordance with the principles of ASU 2009-13, Revenue Recognition Topic—Multiple Element Arrangements and Cynosure allocates revenue among the elements based upon each element’s relative fair value.
In accordance with the provisions of ASC 605-45, Revenue Recognitions Topic—Principal Agent Considerations, Cynosure records shipping and handling costs billed to its customers as a component of revenue, and the underlying expense as a component of cost of revenue. Shipping and handling costs included as a component of revenue totaled approximately $1.0 million, $0.6 million, and $0.4 million for the years ended December 31, 2014, 2013 and 2012, respectively. Shipping and handling costs included as a component of cost of revenue totaled $1.1 million, $0.6 million and $0.5 million for the years ended December 31, 2014, 2013 and 2012, respectively.
Cynosure collects sales tax from its customers on product sales for which the customer is not tax exempt and remits such taxes to the appropriate governmental authorities. Cynosure presents its sales taxes on a net basis; therefore, these taxes are excluded from revenues. Cynosure records medical device costs billed to its customers as a component of revenue and the underlying expense as a component of cost of revenue.
Cost of Revenues
Cynosure’s cost of revenues consist primarily of material, labor and manufacturing overhead expenses and includes the cost of components and subassemblies supplied by third party suppliers. Cost of revenues also includes royalties incurred on certain products sold by Cynosure and its licensees, costs incurred in connection with Cynosure’s efforts to litigate or settle additional third-party license agreements, amortization expense related to developed technology and patents intangible assets, service and warranty expenses, as well as salaries and personnel-related expenses, including stock-based compensation, for Cynosure’s operations management team, purchasing and quality control.
Product Warranty Costs
Cynosure typically provides a one-year parts and labor warranty on end-user sales of lasers. Distributor sales generally include a one-year warranty on parts only. Estimated future costs for initial product warranties are provided for at the time of revenue recognition. The following table sets forth activity in the accrued warranty account, which is a component of accrued expenses in the consolidated balance sheets:
| Years Ended December 31, | ||||||||||||
| 2014 | 2013 | 2012 | ||||||||||
| (In thousands) | ||||||||||||
| Balance at beginning of year |
$ | 6,651 | $ | 3,415 | $ | 3,171 | ||||||
| Warranty provision related to new sales |
15,104 | 9,114 | 4,641 | |||||||||
| Warranty provision assumed from acquisitions |
— | 1,422 | — | |||||||||
| Costs incurred |
(13,637 | ) | (7,300 | ) | (4,397 | ) | ||||||
|
|
|
|
|
|
|
|||||||
| Balance at end of year |
$ | 8,118 | $ | 6,651 | $ | 3,415 | ||||||
|
|
|
|
|
|
|
|||||||
F-12
Table of Contents
Research and Development
Research and development costs consist of salaries and other personnel-related expenses, including stock-based compensation, of employees primarily engaged in research, development and engineering activities and materials used and other overhead expenses incurred in connection with the design and development of Cynosure’s products and from time to time expenses associated with collaborative research agreements that the Company may enter into. These costs are expensed as incurred.
Advertising Costs
Cynosure expenses advertising costs as incurred. Advertising costs totaled $1.2 million, $1.1 million and $0.6 million for the years ended December 31, 2014, 2013 and 2012, respectively.
Foreign Currency Translation
The financial statements of Cynosure’s foreign subsidiaries are translated from local currency into U.S. dollars using the current exchange rate at the balance sheet date for assets and liabilities, and the average exchange rate prevailing during the period for revenue and expenses. The functional currency for Cynosure’s foreign subsidiaries is considered to be the local currency for each entity and, accordingly, translation adjustments for these subsidiaries are included in accumulated other comprehensive loss within stockholders’ equity. Certain intercompany and third party foreign currency-denominated transactions generated foreign currency remeasurement (losses) gains of approximately $(1.6 million), $0.3 million and $0.4 million during 2014, 2013 and 2012, respectively, which are included in other (expense) income, net, in the consolidated statements of operations.
Accumulated Other Comprehensive Loss
Changes to accumulated other comprehensive loss during the year ended December 31, 2014 were as follows (in thousands):
| Unrealized Loss on Marketable Securities, net of taxes |
Translation Adjustment |
Accumulated Other Comprehensive Loss |
||||||||||
| Balance—December 31, 2013 |
$ | 36 | $ | (1,535 | ) | $ | (1,499 | ) | ||||
| Current period other comprehensive loss |
(46 | ) | (2,318 | ) | (2,364 | ) | ||||||
|
|
|
|
|
|
|
|||||||
| Balance—December 31, 2014 |
$ | (10 | ) | $ | (3,853 | ) | $ | (3,863 | ) | |||
Stock-Based Compensation
Cynosure follows the fair value recognition provisions of ASC 718, Stock Compensation Topic. This guidance requires share-based payments to employees, including grants of employee stock options and restricted stock units (“RSUs”), to be recognized in the statement of operations based on their fair values at the date of grant. Cynosure expenses the fair value of share-based payments over the service period. ASC 718 requires companies to utilize an estimated forfeiture rate when calculating the expense for the period. Accordingly, Cynosure reviews its actual forfeiture rates and periodically aligns its stock compensation expense with the share-based payments that are vesting. Cynosure recorded stock-based compensation expense of $7.1 million, $3.7 million and $2.9 million for the years ended December 31, 2014, 2013 and 2012, respectively. As of both December 31, 2014 and 2013, Cynosure had $23,000 of stock-based compensation expense capitalized as a part of inventory.
F-13
Table of Contents
Total stock-based compensation expense was recorded to cost of revenues and operating expenses based upon the functional responsibilities of the individual holding the respective share-based payments, as follows:
| Years Ended December 31, | ||||||||||||
| 2014 | 2013 | 2012 | ||||||||||
| (In thousands) | ||||||||||||
| Cost of revenues |
$ | 292 | $ | 174 | $ | 127 | ||||||
| Sales and marketing |
1,934 | 1,090 | 857 | |||||||||
| Research and development |
1,007 | 594 | 495 | |||||||||
| General and administrative |
3,880 | 1,830 | 1,431 | |||||||||
|
|
|
|
|
|
|
|||||||
| Total stock-based compensation expense |
$ | 7,113 | $ | 3,688 | $ | 2,910 | ||||||
|
|
|
|
|
|
|
|||||||
As of December 31, 2014, there was $10.1 million of unrecognized compensation expense related to non-vested share awards that is expected to be recognized on a straight-line basis over a weighted average period of 1.6 years. Cash received from option exercises was $8.2 million, $2.7 million and $7.2 million during the years ended December 31, 2014, 2013 and 2012, respectively.
Cynosure granted 854,180, 617,510 and 405,790 stock options during the years ended December 31, 2014, 2013 and 2012, respectively. Cynosure uses the Black-Scholes option pricing model to determine the weighted average fair value of options. The weighted average fair value of the options granted during the years ended December 31, 2014, 2013 and 2012 was $10.50, $10.25 and $9.23, respectively, using the following assumptions:
| Years Ended December 31, | ||||||
| 2014 | 2013 | 2012 | ||||
| Risk-free interest rate |
1.41% - 1.80% | 0.33% - 1.49% | 0.61% - 0.86% | |||
| Expected dividend yield |
— | — | — | |||
| Expected term |
4.6 years | 2 years - 4.8 years | 5.8 years | |||
| Expected volatility |
43% - 44% | 44% - 56% | 56% - 57% | |||
Option-pricing models require the input of various subjective assumptions, including the option’s expected life and the price volatility of the underlying stock. Cynosure’s estimated expected stock price volatility is based on its own historical volatility for the 2014, 2013 and 2012 periods. Cynosure’s expected term of options granted during the years ended December 31, 2014 and 2013 represents the weighted average period of time that options granted are expected to be outstanding giving consideration to vesting schedules and Cynosure’s historical exercise patterns. Cynosure’s expected term of options granted during the year ended December 31, 2012 was derived from the simplified method described in ASC 718-10-S99. The risk-free rate for the expected term of the option is based on the U.S. Treasury yield curve in effect at the time of grant. The dividend yield of zero is based on the fact that Cynosure has never paid cash dividends and has no present intention to pay cash dividends.
Cynosure granted 44,840 RSUs during the year ended December 31, 2014 to employees at a fair market value of its common stock on the date of grant and which vest annually over a three-year period. Cynosure is recognizing related compensation expense on a straight-line basis over the three-year period.
Cynosure granted 43,500 RSUs during the year ended December 31, 2014 to non-employee directors at a fair market value of its common stock on the date of grant and which vest quarterly over a one-year period. Cynosure is recognizing related compensation expense on a straight-line basis over the one-year period.
Interest (Expense) Income, net
Interest (expense) income consists primarily of interest charges on capital lease obligations, and interest earned on Cynosure’s short and long-term marketable securities consisting of state and municipal bonds, U.S. government agencies and treasuries, corporate obligations and commercial paper. Cynosure expects interest expense to remain consistent in 2015 as compared to 2014.
F-14
Table of Contents
Income Taxes
Cynosure provides for income taxes in accordance with ASC 740, Accounting for Income Taxes. ASC 740 recognizes tax assets and liabilities for the cumulative effect of all temporary differences between the financial statement carrying amounts and the tax basis of assets and liabilities, and are measured using the enacted tax rates that will be in effect when these differences are expected to reverse. Valuation allowances are provided if, based on the weight of available evidence, it is more likely than not that some portion or all of the deferred tax assets will not be realized. Cynosure considers several sources of taxable income in making its valuation allowance assessments including taxable income in carryback years, future reversals of existing taxable temporary differences, tax planning strategies and forecasted future income.
Cynosure accounts for uncertain tax positions following the provisions of ASC 740. ASC 740 clarifies the accounting for income taxes, by prescribing a minimum recognition threshold a tax position is required to meet before being recognized in the financial statements. ASC 740 also provides guidance on derecognition, measurement, classification, interest and penalties, accounting in interim periods, disclosure and transition.
Net Income (Loss) per Share
Basic net income (loss) per share is determined by dividing net income (loss) by the weighted average common shares outstanding during the period. Diluted net income (loss) per share is determined by dividing net income (loss) by the diluted weighted average shares outstanding during the period. Diluted weighted average shares reflect the dilutive effect, if any, of common stock options and RSUs based on the treasury stock method. For the years ended December 31, 2014, 2013 and 2012, there were no outstanding Class B shares, and Cynosure may not issue Class B shares in the future.
The reconciliation of basic and diluted weighted average shares outstanding for the years ended December 31, 2014, 2013 and 2012 is as follows (in thousands, except per share data):
| Years Ended December 31, | ||||||||||||
| 2014 | 2013 | 2012 | ||||||||||
| Net income (loss) |
$ | 31,338 | $ | (1,647 | ) | $ | 10,961 | |||||
|
|
|
|
|
|
|
|||||||
| Basic weighted average common shares outstanding |
21,824 | 19,325 | 13,189 | |||||||||
| Weighted average common stock equivalents |
371 | — | 603 | |||||||||
|
|
|
|
|
|
|
|||||||
| Diluted weighted average common shares outstanding |
22,195 | 19,325 | 13,792 | |||||||||
|
|
|
|
|
|
|
|||||||
| Basic net income (loss) per share |
$ | 1.44 | $ | (0.09 | ) | $ | 0.83 | |||||
|
|
|
|
|
|
|
|||||||
| Diluted net income (loss) per share |
$ | 1.41 | $ | (0.09 | ) | $ | 0.79 | |||||
|
|
|
|
|
|
|
|||||||
For the year ended December 31, 2014, approximately 0.5 million shares of Cynosure’s Class A common stock issuable pursuant to options and RSUs were excluded from the calculation of diluted weighted average common shares outstanding as their effect was antidilutive.
For the year ended December 31, 2013, the number of basic and diluted weighted average shares outstanding was the same because any increase in the number of shares of common stock equivalents for that period would be antidilutive based on the net loss for the period. During the year ended December 31, 2013, outstanding options to purchase 1.3 million shares were excluded from the computation of diluted earnings per share because their inclusion would have been antidilutive.
For the year ended December 31, 2012, options to purchase approximately 0.7 million shares of Cynosure’s Class A common stock were excluded from the calculation of diluted weighted average common shares outstanding as their effect was antidilutive.
F-15
Table of Contents
Recent Accounting Pronouncements
In May 2014, the Financial Accounting Standards Board issued guidance codified in ASC 606, Revenue Recognition—Revenue from Contracts with Customers, which amends the guidance in ASC 605, Revenue Recognition. This new revenue standard creates a single source of revenue guidance for all companies in all industries and is more principles-based than the current revenue guidance. The new guidance must be adopted using either a full retrospective approach for all periods presented in the period of adoption or a modified retrospective approach. ASC 606 is effective for interim and annual periods beginning after December 15, 2016. Cynosure is currently evaluating the impact of the provisions of ASC 606.
3. Fair Value
U.S. GAAP establishes a framework for measuring fair value under generally accepted accounting principles and enhances disclosures about fair value measurements. Fair value is defined as the exchange price that would be received for an asset or paid to transfer a liability (an exit price) in the principal or most advantageous market for the asset or liability in an orderly transaction between market participants on the measurement date. Valuation techniques used to measure fair value must maximize the use of observable inputs and minimize the use of unobservable inputs. The standard describes the following fair value hierarchy based on three levels of inputs, of which the first two are considered observable and the last unobservable, that may be used to measure fair value:
| • | Level 1—Quoted prices in active markets for identical assets or liabilities. |
| • | Level 2—Inputs other than Level 1 that are observable, either directly or indirectly, such as quoted prices for similar assets or liabilities; quoted prices in markets that are not active; or other inputs that are observable or can be corroborated by observable markets data for substantially the full term of the assets or liabilities. |
| • | Level 3—Unobservable inputs that are supported by little or no market activity and that are significant to the fair value of the assets or liabilities. |
The following table represents Cynosure’s fair value hierarchy for its financial assets (cash equivalents and marketable securities) measured at fair value as of December 31, 2014 (in thousands):
| Level 1 | Level 2 | Level 3 | Total | |||||||||||||
| Money market funds(1) |
$ | 1,753 | $ | — | $ | — | $ | 1,753 | ||||||||
| State and municipal bonds |
— | 47,744 | — | 47,744 | ||||||||||||
| Treasuries and government agencies |
— | 8,486 | — | 8,486 | ||||||||||||
| Corporate obligations and commercial paper |
— | 2,001 | — | 2,001 | ||||||||||||
| Equity securities |
13 | — | — | 13 | ||||||||||||
|
|
|
|
|
|
|
|
|
|||||||||
| Total |
$ | 1,766 | $ | 58,231 | $ | — | $ | 59,997 | ||||||||
|
|
|
|
|
|
|
|
|
|||||||||
| (1) | Included in cash and cash equivalents at December 31, 2014. |
The following table represents Cynosure’s fair value hierarchy for its financial assets (cash equivalents and marketable securities) measured at fair value as of December 31, 2013 (in thousands):
| Level 1 | Level 2 | Level 3 | Total | |||||||||||||
| Money market funds(1) |
$ | 5,185 | $ | — | $ | — | $ | 5,185 | ||||||||
| State and municipal bonds(2) |
— | 18,133 | — | 18,133 | ||||||||||||
| Treasuries and government agencies |
— | 15,028 | — | 15,028 | ||||||||||||
| Corporate obligations and commercial paper |
— | 3,020 | — | 3,020 | ||||||||||||
| Equity securities |
49 | — | — | 49 | ||||||||||||
|
|
|
|
|
|
|
|
|
|||||||||
| Total |
$ | 5,234 | $ | 36,181 | $ | — | $ | 41,415 | ||||||||
|
|
|
|
|
|
|
|
|
|||||||||
F-16
Table of Contents
| (1) | Included in cash and cash equivalents at December 31, 2013. |
| (2) | $0.8 million included in cash and cash equivalents at December 31, 2013. |
4. Short and Long-Term Marketable Securities
Cynosure’s available-for-sale securities at December 31, 2014 consist of approximately $58.2 million in investments in debt securities consisting of state and municipal bonds, treasuries and government agencies, corporate obligations and commercial paper and approximately $13,000 in equity securities. All investments in available-for-sale securities are recorded at fair market value, with any unrealized gains and losses reported as a separate component of accumulated other comprehensive loss. As of December 31, 2014, Cynosure’s marketable securities consist of the following (in thousands):
| Market Value |
Amortized Cost |
Unrealized Gains |
Unrealized Losses |
|||||||||||||
| Available-for-Sale Securities: |
||||||||||||||||
| Short-term marketable securities: |
||||||||||||||||
| State and municipal bonds |
$ | 26,041 | $ | 26,033 | $ | 8 | $ | — | ||||||||
| Treasuries and government agencies |
4,000 | 4,000 | — | — | ||||||||||||
| Corporate obligations and commercial paper |
2,001 | 2,001 | — | — | ||||||||||||
| Equity securities |
13 | 18 | — | (5 | ) | |||||||||||
|
|
|
|
|
|
|
|
|
|||||||||
| Total short-term marketable securities |
$ | 32,055 | $ | 32,052 | $ | 8 | $ | (5 | ) | |||||||
|
|
|
|
|
|
|
|
|
|||||||||
| Long-term marketable securities: |
||||||||||||||||
| State and municipal bonds |
$ | 21,703 | $ | 21,721 | $ | 2 | $ | (20 | ) | |||||||
| Treasuries and government agencies |
4,486 | 4,500 | — | (14 | ) | |||||||||||
|
|
|
|
|
|
|
|
|
|||||||||
| Total long-term marketable securities |
$ | 26,189 | $ | 26,221 | $ | 2 | $ | (34 | ) | |||||||
|
|
|
|
|
|
|
|
|
|||||||||
| Total available-for-sale securities |
$ | 58,244 | $ | 58,273 | $ | 10 | $ | (39 | ) | |||||||
|
|
|
|
|
|
|
|
|
|||||||||
| Total marketable securities |
$ | 58,244 | ||||||||||||||
|
|
|
|||||||||||||||
As of December 31, 2013, Cynosure’s marketable securities consist of the following (in thousands):
| Market Value |
Amortized Cost |
Unrealized Gains |
Unrealized Losses |
|||||||||||||
| Available-for-Sale Securities: |
||||||||||||||||
| Cash equivalents: |
||||||||||||||||
| State and municipal bonds |
$ | 793 | $ | 793 | $ | — | $ | — | ||||||||
|
|
|
|
|
|
|
|
|
|||||||||
| Total cash equivalents |
$ | 793 | $ | 793 | $ | — | $ | — | ||||||||
|
|
|
|
|
|
|
|
|
|||||||||
| Short-term marketable securities: |
||||||||||||||||
| State and municipal bonds |
$ | 10,552 | $ | 10,551 | $ | 1 | $ | — | ||||||||
| Treasuries and government agencies |
15,028 | 15,018 | 10 | — | ||||||||||||
| Corporate obligations and commercial paper |
1,004 | 1,004 | — | — | ||||||||||||
| Equity securities |
49 | 8 | 41 | — | ||||||||||||
|
|
|
|
|
|
|
|
|
|||||||||
| Total short-term marketable securities |
$ | 26,633 | $ | 26,581 | $ | 52 | $ | — | ||||||||
|
|
|
|
|
|
|
|
|
|||||||||
| Long-term marketable securities: |
||||||||||||||||
| State and municipal bonds |
$ | 6,788 | $ | 6,787 | $ | 1 | $ | — | ||||||||
| Corporate obligations and commercial paper |
2,016 | 2,015 | 1 | — | ||||||||||||
|
|
|
|
|
|
|
|
|
|||||||||
| Total long-term marketable securities |
$ | 8,804 | $ | 8,802 | $ | 2 | $ | — | ||||||||
|
|
|
|
|
|
|
|
|
|||||||||
| Total available-for-sale securities |
$ | 36,230 | $ | 36,176 | $ | 54 | $ | — | ||||||||
|
|
|
|
|
|
|
|
|
|||||||||
| Total marketable securities |
$ | 35,437 | ||||||||||||||
|
|
|
|||||||||||||||
F-17
Table of Contents
As of December 31, 2014, Cynosure’s available-for-sale debt securities mature as follows (in thousands):
| Maturities | ||||||||||||||||
| Total | Less Than One Year | One to Five Years | More than five years | |||||||||||||
| State and municipal bonds |
$ | 47,744 | $ | 26,041 | $ | 21,703 | $ | — | ||||||||
| Treasuries and government agencies |
8,486 | 4,000 | 4,486 | — | ||||||||||||
| Corporate obligations and commercial paper |
2,001 | 2,001 | — | — | ||||||||||||
|
|
|
|
|
|
|
|
|
|||||||||
| Total available-for-sale debt securities |
$ | 58,231 | $ | 32,042 | $ | 26,189 | $ | — | ||||||||
|
|
|
|
|
|
|
|
|
|||||||||
5. Acquisition
Ellman International, Inc.
On September 5, 2014, Cynosure acquired substantially all of the assets of Ellman International, Inc. (“Ellman”) for $13.2 million in cash. In addition, Cynosure assumed current liabilities associated with normal working capital and certain contractual liabilities. The purchase price was based primarily on the net working capital on the date of purchase plus an amount to retire all of Ellman’s long term debt on the date of sale. Cynosure also assumed a license transfer agreement as part of the purchase valued at $4.2 million, which is classified as a liability. The acquisition complements Cynosure’s aesthetic treatment platform with radiofrequency energy sources and accessory products. The acquisition of Ellman was considered a business acquisition for accounting purposes.
Cynosure retained an independent valuation firm to assess the fair value of the assets acquired and liabilities assumed. Pro forma financial information was filed with the SEC within the applicable time period. Cynosure has allocated the purchase price to the net tangible and intangible assets based on their estimated fair values as of September 5, 2014. During the fourth quarter of 2014, Cynosure completed its fair value procedures on the intangible assets, fixed assets and the license transfer agreement acquired in the acquisition of Ellman. As such, the fair value of the accounts receivable, inventory, prepaid and other assets acquired, along with the accounts payable, accrued expenses and deferred revenue assumed presented in the table below are provisional and will be finalized in a later period once the fair value procedures are completed. Goodwill represents the excess of purchase price over the fair value of the net assets acquired. During the fourth quarter of 2014, Cynosure revised its estimates of the assets acquired and liabilities assumed in regards to the acquisition of Ellman, and as a result, increased goodwill from $5.9 million at September 30, 2014 to $6.6 million at December 31, 2014. Inventory decreased by $0.7 million, due primarily to adjustments to the inventory reserve and the reclassification of demonstration equipment to fixed assets, per Cynosure policy.
The following table summarizes the estimated fair value as of September 5, 2014 of the net assets acquired (in thousands):
| Purchase price: |
||||
| Cash paid |
$ | 13,235 | ||
|
|
|
|||
| Total |
$ | 13,235 | ||
|
|
|
|||
| Assets (liabilities) acquired: |
||||
| Accounts receivable |
2,147 | |||
| Inventory |
3,682 | |||
| Prepaid and other assets |
488 | |||
| Fixed assets |
612 | |||
| Intangible assets |
6,800 | |||
| Goodwill |
6,598 | |||
| Accounts payable |
(9 | ) | ||
| Accrued expenses |
(2,469 | ) | ||
| Deferred revenue |
(454 | ) | ||
| License transfer agreement |
(4,160 | ) | ||
|
|
|
|||
| Total |
$ | 13,235 | ||
|
|
|
F-18
Table of Contents
Revenue related to Ellman’s operations was $11.5 million for the period following the September 5, 2014 acquisition date, and is included in Cynosure’s consolidated statements of operations for the year ended December 31, 2014. As a result of the integration of the operations of Ellman into Cynosure’s operations, disclosures of earnings included in the accompanying consolidated statement of operations since the acquisition date is not practicable.
The following unaudited pro forma condensed consolidated operating results for the years ended December 31, 2014 and 2013 summarize the combined results of operations for Cynosure and Ellman. The unaudited pro forma condensed consolidated operating results includes the business combination accounting effects as if the acquisition had been completed as of January 1, 2013 (for both the 2014 and 2013 period results) after giving effect to certain adjustments. These pro forma financial statements are for informational purposes only and are not necessarily indicative of the operating results that would have occurred if the transaction had occurred on such date. No effect has been given for synergies, if any, that may be realized through the acquisition.
| Year Ended December 31, |
||||||||
| 2014 | 2013 | |||||||
| Revenue (unaudited, in thousands) |
$ | 308,980 | $ | 255,077 | ||||
| Pre-tax income (loss) (unaudited, in thousands) |
$ | 17,978 | $ | (12,261 | ) | |||
The unaudited consolidated pro forma financial information above includes significant, non-recurring adjustments made to account for certain costs which would have been incurred if the acquisition had been completed on January 1, 2013, including $0.3 million associated with the step up in fair value of finished goods inventory acquired through the acquisition.
During the year ended December 31, 2014, Cynosure incurred $0.7 million in general and administrative costs associated with the acquisition of Ellman.
Palomar Medical Technologies, Inc.
On June 24, 2013, Cynosure acquired Palomar. Certain adjustments related to Palomar’s opening balance sheet were finalized during the first half of 2014, after the December 31, 2013 financial statements were issued. The adjustments were based on facts that existed at the acquisition date and were finalized using information that came available during the first half of 2014. Under ASC 805, Business Combinations, an acquirer is required to recognize adjustments to provisional amounts during the measurement period as they are identified, and to recognize such adjustments retrospectively—as if the accounting from the business combination had been completed at the acquisition date. As a result, the carrying amount of inventory acquired in the acquisition of Palomar was retrospectively decreased by $3.8 million on June 24, 2013, and the carrying amounts of the deferred tax liability and accounts payable acquired in the acquisition of Palomar were retrospectively increased by $0.2 million and $0.1 million, respectively, on June 24, 2013, with corresponding increases to goodwill. The carrying amount of accrued expenses acquired in the acquisition of Palomar was retrospectively decreased by $23,000 on June 24, 2013, with a corresponding decrease to goodwill. The December 31, 2013 consolidated balance sheet within this Annual Report has been updated to disclose these recast values.
6. Goodwill and Other Intangible Assets
Changes to goodwill during the year ended December 31, 2014 were as follows (in thousands):
| Balance—December 31, 2013 (recast) |
$ | 99,237 | ||
| Ellman acquisition |
6,598 | |||
| Translation adjustment |
(71 | ) | ||
|
|
|
|||
| Balance—December 31, 2014 |
$ | 105,764 | ||
|
|
|
F-19
Table of Contents
Other intangible assets consist of the following at December 31, 2014 and December 31, 2013 (in thousands):
| Developed Technology & Patents |
Business Licenses |
Customer Relationships |
Trade Names |
Other | Total | |||||||||||||||||||
| December 31, 2014 |
||||||||||||||||||||||||
| Cost |
$ | 29,240 | $ | 384 | $ | 19,718 | $ | 18,390 | $ | 1,338 | $ | 69,070 | ||||||||||||
| Translation adjustment |
— | 34 | 2 | — | 2 | 38 | ||||||||||||||||||
| Accumulated amortization |
(7,840 | ) | (252 | ) | (5,818 | ) | (1,607 | ) | (8 | ) | (15,525 | ) | ||||||||||||
|
|
|
|
|
|
|
|
|
|
|
|
|
|||||||||||||
| Balance, December 31, 2014 |
$ | 21,400 | $ | 166 | $ | 13,902 | $ | 16,783 | $ | 1,332 | $ | 53,583 | ||||||||||||
|
|
|
|
|
|
|
|
|
|
|
|
|
|||||||||||||
| December 31, 2013 |
||||||||||||||||||||||||
| Cost |
$ | 27,510 | $ | 384 | $ | 15,833 | $ | 16,930 | $ | 1,338 | $ | 61,995 | ||||||||||||
| Translation adjustment |
— | 40 | 26 | — | 4 | 70 | ||||||||||||||||||
| Accumulated amortization |
(2,216 | ) | (239 | ) | (3,662 | ) | (761 | ) | (8 | ) | (6,886 | ) | ||||||||||||
|
|
|
|
|
|
|
|
|
|
|
|
|
|||||||||||||
| Balance, December 31, 2013 |
$ | 25,294 | $ | 185 | $ | 12,197 | $ | 16,169 | $ | 1,334 | $ | 55,179 | ||||||||||||
|
|
|
|
|
|
|
|
|
|
|
|
|
|||||||||||||
Cynosure acquired $6.8 million of identifiable intangible assets in the Ellman acquisition, of which $1.7 million was assigned to technology patents, $3.6 million was assigned to customer relationships and $1.5 million was assigned to trademarks. The technology patents are being amortized on an economic patterned basis over a 7.0 year weighted-average amortization period and the customer relationships and trademarks are being amortized on a straight-line basis over a 15.0 year weighted-average amortization period. In total, the weighted-average amortization period for these intangible assets is 13.0 years.
Amortization expense related to developed technology and patents is classified as a component of cost of revenues. Amortization expense related to customer relationships and trade names is classified as a component of amortization of intangible assets acquired. Amortization expense related to business licenses and other is classified as a component of general and administrative expenses. For the year ended December 31, 2014, Cynosure recognized $0.1 million in amortization expense, classified as a component of amortization of intangible assets acquired, and $0.1 million in amortization expense, classified as a component of cost of revenues, related to the identifiable intangible assets from the Ellman acquisition.
Amortization expense for the years ended December 31, 2014, 2013 and 2012 was $8.6 million, $3.1 million and $1.9 million, respectively. Cynosure has approximately $1.3 million of indefinite-life intangible assets that are included in other intangible assets in the table above. As of December 31, 2014, amortization expense on existing definite-lived intangible assets for the next five years and beyond is as follows (table in thousands):
| 2015 |
$ | 9,223 | ||
| 2016 |
8,434 | |||
| 2017 |
6,444 | |||
| 2018 |
4,928 | |||
| 2019 |
3,189 | |||
| 2020 and Thereafter |
20,405 | |||
|
|
|
|||
| Total |
$ | 52,623 | ||
|
|
|
7. Segment and Geographic Information
In accordance with ASC 280, Segment Reporting Topic, operating segments are identified as components of an enterprise about which separate discrete financial information is available for evaluation by the chief
F-20
Table of Contents
operating decision maker, or decision-making group, in making decisions how to allocate resources and assess performance. Cynosure’s chief decision-maker, as defined under ASC 280, is a combination of the Chief Executive Officer and the Chief Financial Officer. Cynosure views its operations and manages its business as one segment, aesthetic treatment products and services.
The following table represents total revenue by geographic destination:
| Year Ended December 31, | ||||||||||||
| 2014 | 2013 | 2012 | ||||||||||
| (In thousands) | ||||||||||||
| United States |
$ | 148,803 | $ | 111,179 | $ | 72,704 | ||||||
| Europe |
50,513 | 39,529 | 28,808 | |||||||||
| Asia/Pacific |
64,651 | 52,574 | 39,991 | |||||||||
| Other |
28,402 | 22,728 | 11,990 | |||||||||
|
|
|
|
|
|
|
|||||||
| $ | 292,369 | $ | 226,010 | $ | 153,493 | |||||||
|
|
|
|
|
|
|
|||||||
Total assets by geographic area are as follows:
| December 31, | ||||||||
| 2014 | 2013 | |||||||
| (In thousands) | ||||||||
| United States |
$ | 420,513 | $ | 380,383 | ||||
| Europe |
23,235 | 21,741 | ||||||
| Asia/Pacific |
19,182 | 16,437 | ||||||
| Eliminations |
(5,206 | ) | (3,860 | ) | ||||
|
|
|
|
|
|||||
| $ | 457,724 | $ | 414,701 | |||||
|
|
|
|
|
|||||
Long-lived assets (property and equipment only) by geographic area are as follows:
| December 31, | ||||||||
| 2014 | 2013 | |||||||
| (In thousands) | ||||||||
| United States |
$ | 30,912 | $ | 24,004 | ||||
| Europe |
1,656 | 1,326 | ||||||
| Asia/Pacific |
1,688 | 1,115 | ||||||
|
|
|
|
|
|||||
| $ | 34,256 | $ | 26,445 | |||||
|
|
|
|
|
|||||
No individual country within Europe or Asia/Pacific represented greater than 10% of total revenue, total assets or total long-lived assets for any period presented.
F-21
Table of Contents
8. Balance Sheet Accounts
Property and Equipment
Property and equipment consists of the following at December 31:
| Estimated Useful Life (Years) |
2014 Cost |
2013 Cost |
||||||||||
| (In thousands) | ||||||||||||
| Equipment |
3-5 | $ | 9,834 | $ | 7,835 | |||||||
| Furniture and fixtures |
3-5 | 3,008 | 2,698 | |||||||||
| Computer equipment and software |
3 | 5,095 | 5,047 | |||||||||
| Leased equipment |
3-4 | 1,625 | 1,660 | |||||||||
| Leased buildings |
14 | 13,327 | 13,327 | |||||||||
| Leasehold improvements |
5 | 12,611 | 2,898 | |||||||||
| Demonstration equipment |
3 | 20,246 | 24,094 | |||||||||
| Construction in-progress |
42 | 495 | ||||||||||
|
|
|
|
|
|||||||||
| 65,788 | 58,054 | |||||||||||
| Less: Accumulated depreciation and amortization |
(31,532 | ) | (31,609 | ) | ||||||||
|
|
|
|
|
|||||||||
| $ | 34,256 | $ | 26,445 | |||||||||
|
|
|
|
|
|||||||||
Depreciation expense relating to property and equipment was $8.9 million, $6.0 million and $5.0 million for the years ended December 31, 2014, 2013 and 2012, respectively. As of December 31, 2014 and 2013, the cost of assets recorded under capitalized leases was approximately $15.0 million and $15.0 million, respectively, and the related accumulated amortization was approximately $2.4 million and $1.2 million, respectively. Amortization expense of assets recorded under capitalized leases is included as a component of depreciation expense.
Accrued Expenses
Accrued expenses consist of the following at December 31:
| 2014 | 2013 | |||||||
| (In thousands) | ||||||||
| Accrued payroll and payroll taxes |
$ | 7,390 | $ | 9,547 | ||||
| Accrued employee benefits |
1,688 | 2,093 | ||||||
| Accrued warranty costs |
8,118 | 6,651 | ||||||
| Accrued commissions |
6,457 | 5,243 | ||||||
| Accrued income, value-added and sales taxes |
5,730 | 3,319 | ||||||
| Accrued royalties |
3,937 | 2,459 | ||||||
| Accrued other |
9,106 | 7,642 | ||||||
|
|
|
|
|
|||||
| $ | 42,426 | $ | 36,954 | |||||
|
|
|
|
|
|||||
Other Noncurrent Liabilities
Other noncurrent liabilities consist of the following at December 31:
| 2014 | 2013 | |||||||
| (In thousands) | ||||||||
| Noncurrent deferred rent |
$ | 181 | $ | 2 | ||||
| Noncurrent deferred tax liability |
1,347 | 8,673 | ||||||
| Noncurrent income tax reserve |
— | 51 | ||||||
| Noncurrent tenant improvement allowances |
2,743 | — | ||||||
| License transfer agreement(1) |
4,054 | — | ||||||
|
|
|
|
|
|||||
| $ | 8,325 | $ | 8,726 | |||||
|
|
|
|
|
|||||
F-22
Table of Contents
| (1) | On July 31, 2014, prior to Cynosure’s acquisition of Ellman, Ellman agreed to a binding license settlement with its previous owners. Ellman agreed to pay a future fixed payment commitment of $0.3 million in January 2015 and 2016 and $0.4 million each year from December 31, 2016 to December 31, 2028. Cynosure assumed this commitment, which is referred to as a license transfer agreement, as part of its purchase of substantially all of the assets of Ellman. The license transfer agreement was valued at $4.2 million as of the September 5, 2014 acquisition date using an interest rate of 4.75%. The current portion of $0.1 million is included within accrued expenses and the remainder of $4.1 million is classified as a component of other noncurrent liabilities within Cynosure’s December 31, 2014 consolidated balance sheet. |
9. Stockholders’ Equity
Common Stock Authorized
Cynosure has a dual-class capital structure consisting of $0.001 par value Class A common stock and Class B common stock. Cynosure has authorized 61,500,000 shares of $0.001 par value Class A common stock and 8,500,000 shares of $0.001 par value Class B common stock.
As of December 31, 2014, there were 23,253,065 shares of Class A common stock and no shares of Class B common stock issued.
The rights, preferences and privileges of Class A common stock are as follows:
Voting Rights
The holders of Class A common stock will be entitled to one vote per share with respect to each matter presented to Cynosure stockholders on which the holders of common stock are entitled to vote.
Conversion
Cynosure’s Class A common stock is not convertible into any other shares of Cynosure’s capital stock.
Dividends
Subject to preferences that may apply to any shares of preferred stock outstanding at the time, the holders of Class A common stock shall be entitled to share equally, on a per share basis, in any dividends that Cynosure’s board of directors may determine to issue from time to time.
Liquidation Rights
In the event of Cynosure’s liquidation or dissolution, the holders of Class A common stock shall be entitled to share equally, on a per share basis, in all assets remaining after the payment of all debts and other liabilities and subject to the prior rights of any outstanding preferred stock.
Preferred Stock
Cynosure has authorized 5,000,000 shares of $0.001 par value preferred stock. The Board of Directors has full authority to issue this stock and to fix the voting powers, preference rights, qualifications, limitations, or restrictions thereof, including dividend rights, conversion rights, redemption privileges and liquidation preferences and the number of shares constituting any series or designation of such series.
F-23
Table of Contents
Treasury Stock
On October 29, 2013, Cynosure announced that its board of directors authorized the repurchase of up to $25 million of its Class A common stock, from time to time, on the open market or in privately negotiated transactions under a stock repurchase program. On April 30, 2014, Cynosure’s board of directors approved an increase of $10 million to the stock repurchase program. The program will terminate upon the purchase of $35 million in common stock or expiration of the program on November 1, 2015. During the year ended December 31, 2014, Cynosure repurchased 742,179 shares of its common stock at an aggregate cost of $15.6 million and at a weighted average price of $20.96 per share under this program. As of December 31, 2014, approximately $4.1 million remains available to repurchase shares under the program. As of December 31, 2014, Cynosure has repurchased an aggregate of 1,395,480 shares under this program at an aggregate cost of $30.9 million.
10. Stock-Based Compensation
2004 Stock Option Plan
In October 2004, the Board of Directors adopted and the stockholders approved the 2004 Stock Option Plan (“the 2004 Plan”). The 2004 Plan provided for the grant of incentive stock options (“ISOs”), as well as nonstatutory options. The Board of Directors administers the 2004 Plan and had sole discretion to grant options to purchase shares of Cynosure’s common stock.
The Board of Directors determines the term of each option, option price, number of shares for which each option is granted, whether restrictions would be imposed on the shares subject to options and the rate at which each option is exercisable. The exercise price for options granted is determined by the Board of Directors, except that for ISOs, the exercise price could not be less than the fair market value per share of the underlying common stock on the date granted (110% of fair market value for ISOs granted to holders of more than 10% of the voting stock of Cynosure). The term of the options is set forth in the applicable option agreement, except that in the case of ISOs, the option term cannot exceed ten years. Options granted under the 2004 Plan vested either (i) over a 48-month period at the rate of 25% after the first year and 6.25% each quarter thereafter until fully vested or (ii) over a vesting period determined by the Board of Directors. As of December 31, 2014, there were no shares available for future grant under the 2004 Plan.
2005 Stock Incentive Plan
In August 2005, the Board of Directors adopted the 2005 Stock Incentive Plan (“the 2005 Plan”), which was approved by Cynosure’s stockholders in December 2005. The 2005 Plan provided for the grant of ISOs, as well as nonstatutory options and RSUs. The Board of Directors administers the 2005 Plan and has sole discretion to grant options to purchase shares of Cynosure’s common stock and RSUs.
The Board of Directors determines the term of each option and RSU, option price, number of shares for which each option and RSU is granted, whether restrictions would be imposed on the shares subject to options and the rate at which each option is exercisable. The exercise price for options granted is determined by the Board of Directors, except that for ISOs, the exercise price could not be less than the fair market value per share of the underlying common stock on the date granted (110% of fair market value for ISOs granted to holders of more than 10% of the voting stock of Cynosure). The term of the options and RSUs is set forth in the applicable option agreement, except that in the case of ISOs, the option term cannot exceed ten years. At December 31, 2014 the number of shares of Class A common stock reserved for issuance under the 2005 Plan is 5,588,369 shares. Options granted under the Plan vest either (i) over a 36-month period at the rate of 8.33% each quarter until fully vested or (ii) over a vesting period determined by the Board of Directors. RSUs granted to employees under the 2005 Plan vest over a 36-month period at the rate of 33% each year until fully vested, and RSUs granted to non-employee directors under the 2005 Plan vest over a 12-month period at the rate of 25% each quarter until fully vested. As of December 31, 2014, there were 1,417,338 shares available for future grant under the 2005 Plan.
F-24
Table of Contents
Stock Options
Stock option activity under the 2004 Plan and the 2005 Plan is as follows:
| Number of Options |
Exercise Price Range |
Weighted- Average Exercise Price |
Weighted- Average Remaining Contractual Life |
Aggregate Intrinsic Value (in thousands) |
||||||||||||||||
| Vested |
1,596,565 | $ | 3.00 - $36.94 | 16.93 | $ | 16,061 | ||||||||||||||
| Unvested |
707,301 | 9.56 - 28.68 | 23.06 | 2,985 | ||||||||||||||||
|
|
|
|
|
|||||||||||||||||
| Outstanding, December 31, 2013 |
2,303,866 | $ | 3.00 - $36.94 | $ | 18.81 | 6.51 years | $ | 19,046 | ||||||||||||
| Granted |
854,180 | 18.94 - 31.22 | 27.50 | 1,234 | ||||||||||||||||
| Exercised |
(587,359 | ) | 3.00 - 28.68 | 13.88 | 9,116 | |||||||||||||||
| Forfeited |
(82,199 | ) | 10.15 - 29.40 | 27.73 | 91 | |||||||||||||||
|
|
|
|
|
|||||||||||||||||
| Outstanding, December 31, 2014 |
2,488,488 | $ | 4.50 - $36.94 | $ | 22.66 | 6.78 years | $ | 13,713 | ||||||||||||
|
|
|
|
|
|
|
|||||||||||||||
| Vested |
1,704,455 | 4.50 - 36.94 | 20.62 | 5.78 years | 12,417 | |||||||||||||||
| Unvested |
784,033 | 11.76 - 31.22 | 27.09 | 8.96 years | 1,296 | |||||||||||||||
|
|
|
|
|
|
|
|||||||||||||||
| Vested or expected to vest, December 31, 2014 |
2,451,983 | $ | 4.50 - $36.94 | $ | 22.58 | 6.75 years | $ | 13,670 | ||||||||||||
|
|
|
|
|
|
|
|||||||||||||||
| Exercisable, December 31, 2014 |
1,704,455 | $ | 4.50 - $36.94 | $ | 20.62 | 5.78 years | $ | 12,417 | ||||||||||||
Restricted Stock Units
RSU activity under the 2005 Plan is as follows:
| Number of RSUs |
Grant Date Fair Value Range |
Weighted- Average Grant Date Fair Value |
Weighted- Average Remaining Contractual Life |
Aggregate Intrinsic Value (in thousands) |
||||||||||||||||
| Outstanding, December 31, 2013 |
— | $ | — | $ | — | — | $ | — | ||||||||||||
| Granted |
88,340 | 21.11 - 29.40 | 25.32 | 2,422 | ||||||||||||||||
| Exercised |
(32,957 | ) | 21.11 - 29.40 | 23.93 | 811 | |||||||||||||||
| Forfeited |
— | — | — | — | ||||||||||||||||
|
|
|
|
|
|||||||||||||||||
| Outstanding, December 31, 2014 |
55,383 | $ | 21.11 - $29.40 | $ | 26.14 | 9.22 years | $ | 1,518 | ||||||||||||
|
|
|
|
|
|
|
|||||||||||||||
| Vested |
— | — | — | — | — | |||||||||||||||
| Unvested |
55,383 | 21.11 - 29.40 | 26.14 | 9.22 years | 1,518 | |||||||||||||||
|
|
|
|
|
|
|
|||||||||||||||
| Vested or expected to vest, December 31, 2014 |
53,700 | $ | 21.11 - $29.40 | $ | 26.04 | 9.22 years | $ | 1,472 | ||||||||||||
|
|
|
|
|
|
|
|||||||||||||||
| Exercisable, December 31, 2014 |
— | $ | — | $ | — | — | $ | — | ||||||||||||
F-25
Table of Contents
The following table summarizes the RSU grant and unrecognized compensation expense for the year ended December 2014. RSUs granted during the year ended December 31, 2014 to employees vest annually over a three-year period; Cynosure is recognizing related compensation expense on a straight-line basis over the three-year period. RSUs granted during the year ended December 31, 2014 to non-employee directors vest quarterly over a one-year period; Cynosure is recognizing related compensation expense on a straight-line basis over the one-year period.
| Number of RSUs Granted |
Unrecognized Stock-based Compensation at December 31, 2014 (in thousands) |
Weighted Average Period for Recognition of Unrecognized Compensation |
||||||||||
| As of December 31, 2014 |
88,340 | $ | 1,278 | 1.3 years | ||||||||
|
|
|
|
|
|
|
|||||||
11. Income Taxes
Income (loss) before income tax (benefit) provision consists of the following:
| 2014 | 2013 | 2012 | ||||||||||
| (In thousands) | ||||||||||||
| Domestic |
$ | 15,424 | $ | (8,633 | ) | $ | 10,344 | |||||
| Foreign |
2,914 | 3,096 | 2,381 | |||||||||
|
|
|
|
|
|
|
|||||||
| Total |
$ | 18,338 | $ | (5,537 | ) | $ | 12,725 | |||||
|
|
|
|
|
|
|
|||||||
The (benefit) provision for income taxes consists of:
| 2014 | 2013 | 2012 | ||||||||||
| (In thousands) | ||||||||||||
| Current: |
||||||||||||
| Federal |
$ | 734 | $ | 732 | $ | 1,382 | ||||||
| State |
577 | 214 | 128 | |||||||||
| Foreign |
1,306 | 890 | 606 | |||||||||
|
|
|
|
|
|
|
|||||||
| Total current |
2,617 | 1,836 | 2,116 | |||||||||
| Deferred: |
||||||||||||
| Federal |
(13,032 | ) | (5,406 | ) | 152 | |||||||
| State |
(1,398 | ) | (304 | ) | — | |||||||
| Foreign |
(1,187 | ) | (16 | ) | (504 | ) | ||||||
|
|
|
|
|
|
|
|||||||
| Total deferred |
(15,617 | ) | (5,726 | ) | (352 | ) | ||||||
|
|
|
|
|
|
|
|||||||
| $ | (13,000 | ) | $ | (3,890 | ) | $ | 1,764 | |||||
|
|
|
|
|
|
|
|||||||
F-26
Table of Contents
A reconciliation of the federal statutory rate to Cynosure’s effective tax rate is as follows for the years ended December 31:
| 2014 | 2013 | 2012 | ||||||||||
| Income tax provision at federal statutory rate: |
35.0 | % | 35.0 | % | 35.0 | % | ||||||
| Increase (decrease) in tax resulting from - |
||||||||||||
| State taxes, net of federal benefit |
0.8 | (3.1 | ) | 0.7 | ||||||||
| Nondeductible expenses |
7.2 | (11.9 | ) | 2.1 | ||||||||
| Tax-exempt interest income |
(0.2 | ) | 0.5 | (0.3 | ) | |||||||
| Effect of foreign taxes |
(0.6 | ) | 2.7 | (1.8 | ) | |||||||
| Stock-based compensation |
0.1 | (0.1 | ) | (0.9 | ) | |||||||
| Research and development credit |
(2.7 | ) | 25.8 | — | ||||||||
| Change in uncertain tax positions |
(0.3 | ) | 4.8 | 2.5 | ||||||||
| Change in valuation allowance |
(108.8 | ) | 162.0 | (20.5 | ) | |||||||
| Change in control payments |
1.6 | (128.8 | ) | — | ||||||||
| Transaction costs |
— | (13.6 | ) | — | ||||||||
| Other |
(3.0 | ) | (3.1 | ) | (2.9 | ) | ||||||
|
|
|
|
|
|
|
|||||||
| Effective income tax rate |
(70.9 | )% | 70.2 | % | 13.9 | % | ||||||
|
|
|
|
|
|
|
|||||||
In 2014, Cynosure recorded an income tax benefit of $13.0 million, representing an effective tax rate of (71)%. The difference between the statutory tax rate and the effective tax rate was primarily attributable to a tax benefit of $19.0 million for the release of substantially all of the valuation allowance maintained against the net U.S. deferred tax asset. In addition, Cynosure recorded a tax benefit of $0.9 million related to the release of valuation allowances against the net deferred tax assets of Cynosure Japan, Palomar Australia and Palomar Spain. Excluding the valuation allowance releases, the tax provision for the year ended December 31, 2014 would have been $6.9 million. Other factors resulting in differences between the statutory tax rate and effective tax rate are the jurisdictional mix of earnings, valuation allowance maintained against certain foreign deferred tax assets, non-deductible expenses and tax credits.
Cynosure considered several sources of taxable income in making its valuation allowance assessments including taxable income in carryback years, future reversals of existing taxable temporary differences, tax planning strategies and forecasted future income. The U.S. consolidated tax group was profitable in 2014 and 2012 (and its book loss in 2013 was driven by costs associated with the acquisition of Palomar, a significant portion of which were permanently non-deductible for tax purposes). Cynosure is in a significant cumulative three year book income position in the U.S. with projections of strong future profitability. Cynosure Japan, Palomar Australia and Palomar Spain are all in cumulative book income positions with projected future profitability.
F-27
Table of Contents
Significant components of Cynosure’s deferred tax assets and liabilities as of December 31, 2014 and 2013 are as follows:
| 2014 | 2013 | |||||||
| (In thousands) | ||||||||
| Deferred tax assets: |
||||||||
| Accrued expenses and reserves |
$ | 7,917 | $ | 9,747 | ||||
| Domestic net operating loss & tax credit carry-forwards |
15,873 | 19,925 | ||||||
| Foreign net operating loss carry-forwards |
2,011 | 2,022 | ||||||
| Stock-based compensation |
6,829 | 6,020 | ||||||
| Capital leases |
5,955 | 5,472 | ||||||
| Other deferred tax assets |
2,368 | 1,636 | ||||||
|
|
|
|
|
|||||
| Gross deferred tax assets |
$ | 40,953 | $ | 44,822 | ||||
| Valuation allowance |
(977 | ) | (19,186 | ) | ||||
|
|
|
|
|
|||||
| Total deferred tax assets (after valuation allowance) |
$ | 39,976 | $ | 25,636 | ||||
| Long-term deferred tax liabilities: |
||||||||
| Intangible assets |
$ | (15,358 | ) | $ | (18,227 | ) | ||
| Fixed assets |
(7,135 | ) | (5,463 | ) | ||||
| Other deferred tax liabilities |
(847 | ) | (534 | ) | ||||
|
|
|
|
|
|||||
| Total long-term deferred tax liabilities |
$ | (23,340 | ) | $ | (24,224 | ) | ||
| Net deferred tax assets |
$ | 16,636 | $ | 1,412 | ||||
|
|
|
|
|
|||||
Cynosure’s valuation allowance decreased by a net amount of $18.2 million during 2014. The valuation allowance increased from 2013 as a result of the impact of final purchase accounting entries related to the Palomar acquisition and current year losses in jurisdictions in which Cynosure maintains a full valuation allowance. The valuation allowance decreased by $19.0 million as a result of the release of substantially all of the valuation allowance maintained against its net U.S. deferred tax asset. In addition, the valuation allowance decreased by $0.9 million related to the release of valuation allowances against the net deferred tax assets of Cynosure Japan, Palomar Australia and Palomar Spain. As of December 31, 2014, a full valuation allowance is maintained on the net deferred tax assets of its subsidiary in Mexico as well as Palomar Japan and Palomar Germany.
At December 31, 2014, Cynosure has domestic federal net operating loss carryforwards of approximately $29.8 million, state net operating loss carryforwards of $0.5 million, federal tax credit carryforwards of $6.9 million and state tax credit carryforwards of $2.1 million that are available to reduce future taxable income. Utilization of the net operating losses and tax credits acquired as a result of the Palomar acquisition are subject to an annual limitation due to the ownership change limitations set forth under Internal Revenue Code Sections 381, 382 and 383. At December 31, 2014, none of the federal net operating loss carryforwards, $0.2 million of the state net operating loss carryforwards, $2.0 million of the federal tax credit carryforwards and $0.1 million of the state tax credit carryforwards relate to excess stock based compensation tax benefits for which the benefit will be recorded to additional paid-in capital when recognized. The federal and state net operating losses begin to expire in 2021 and 2018, respectively. The federal and state tax credits begin to expire in 2018 and 2016, respectively.
At December 31, 2014, Cynosure has foreign net operating losses of approximately $6.0 million in Germany, Mexico, Japan, France and Spain that are available to reduce future income. Foreign net operating losses in Germany and France do not expire. Mexican and Japanese net operating losses will begin to expire in 2019. Spanish net operating losses will begin to expire in 2029. Income taxes have not been provided on the undistributed earnings of foreign subsidiaries of approximately $14.0 million, because such earnings are considered to be indefinitely reinvested in the business. The accumulated earnings in the foreign subsidiaries are primarily utilized to fund working capital requirements as Cynosure’s subsidiaries continue to expand their operations, to service existing obligations and to fund future foreign acquisitions. Cynosure does not believe it is practicable to estimate the amount of income taxes payable on the earnings that are indefinitely reinvested in foreign operations.
F-28
Table of Contents
ASC 740 clarifies the accounting for uncertainty in income taxes recognized in an enterprise’s financial statements by prescribing a minimum recognition threshold and measurement of a tax position taken or expected to be taken in a tax return.
The aggregate changes in gross unrecognized tax benefits during the years ended December 31, 2014, 2013 and 2012 were as follows (in thousands):
| 2014 | 2013 | 2012 | ||||||||||
| Balance at beginning of year |
$ | 1,701 | $ | 586 | $ | — | ||||||
| Increases for tax positions taken during current period |
— | 76 | 398 | |||||||||
| Increases for tax positions taken in prior periods |
— | — | 188 | |||||||||
| Increases for acquired tax positions taken in prior periods |
— | 1,625 | — | |||||||||
| Decreases for acquired tax positions within measurement window |
(815 | ) | — | — | ||||||||
| Decreases for tax positions taken in prior periods |
(76 | ) | (398 | ) | — | |||||||
| Decreases for lapse in statutes |
— | (188 | ) | — | ||||||||
|
|
|
|
|
|
|
|||||||
| Balance at end of year |
$ | 810 | $ | 1,701 | $ | 586 | ||||||
|
|
|
|
|
|
|
|||||||
At December 31, 2014, Cynosure had gross tax-effected unrecognized tax benefits of $0.8 million of which the entire amount, if recognized, would favorably impact the effective tax rate. At December 31, 2013, Cynosure had gross tax-effected unrecognized tax benefits of $1.7 million of which $0.1 million, if recognized, would favorably impact the effective tax rate. At December 31, 2013, Cynosure had gross tax-affected unrecognized tax benefits of $0.6 million of which $0.3 million, if recognized, would favorably impact the effective tax rate. Cynosure classifies interest and penalties related to income taxes as a component of its provision for income taxes, and the amount of interest and penalties recorded as of December 31, 2014 and 2013 in the statements of operations and balance sheet was immaterial. Cynosure does not expect any material changes in the amounts of unrecognized tax benefits over the next 12 months.
Cynosure files income tax returns in the U.S. federal jurisdiction, and in various state and foreign jurisdictions. Cynosure is no longer subject to U.S. federal tax examinations for years prior to 2011. With few exceptions, Cynosure is no longer subject to U.S. state and local income tax examinations by tax authorities for years before 2010. Additionally, certain non-U.S. jurisdictions are no longer subject for income tax examinations by tax authorities for years before 2010.
12. 401(k) Plan
Cynosure sponsors the Cynosure 401(k) defined contribution plan. Participation in the plan is available to all employees of Cynosure who meet certain eligibility requirements. The 401(k) is qualified under Section 401(k) of the Internal Revenue Code, and is subject to contribution limitations as set annually by the Internal Revenue Service. Employer matching contributions are at Cynosure’s discretion. Cynosure’s contributions to this plan totaled approximately $0.9 million, $0.6 million and $0.4 million for the years ended December 31, 2014, 2013 and 2012, respectively.
13. Commitments and Contingencies
Lease Commitments
Cynosure leases the land portion of its U.S. operating facility and certain foreign facilities under noncancelable operating lease agreements expiring through May 2027. These leases are non-cancellable and typically contain renewal options. Certain leases contain rent escalation clauses for which Cynosure recognizes the expense on a straight-line basis. Rent expense for the years ended December 31, 2014, 2013 and 2012 was approximately $3.2 million, $2.4 million and $2.1 million, respectively.
F-29
Table of Contents
Cynosure leases the buildings portion of its U.S. operating facility and certain equipment and vehicles under capital lease agreements with payments due through May 2027. Commitments under Cynosure’s lease arrangements are as follows (in thousands):
| Operating Leases |
Capital Leases |
|||||||
| 2015 |
$ | 2,073 | $ | 164 | ||||
| 2016 |
1,966 | 2,194 | ||||||
| 2017 |
1,948 | 2,572 | ||||||
| 2018 |
1,895 | 2,520 | ||||||
| 2019 |
1,411 | 2,514 | ||||||
| Thereafter |
2,747 | 20,166 | ||||||
|
|
|
|
|
|||||
| Total minimum lease payments |
$ | 12,040 | $ | 30,130 | ||||
|
|
|
|||||||
| Less amount representing interest |
(13,905 | ) | ||||||
|
|
|
|||||||
| Present value of obligations under capital leases |
$ | 16,225 | ||||||
| Current portion of capital lease obligations |
137 | |||||||
|
|
|
|||||||
| Capital lease obligations, net of current portion |
$ | 16,088 | ||||||
|
|
|
|||||||
Contingencies
Cynosure continually assessed litigation to determine if an unfavorable outcome would lead to a probable loss or reasonably possible loss, which could be estimated. In accordance with the FASB’s guidance on accounting for contingencies, Cynosure accrues for all direct costs associated with the estimated resolution of contingencies at the earliest date at which it is deemed probable that a liability has been incurred and the amount of such liability can be reasonably estimated. If the estimate of a probable loss is a range and no amount within the range is more likely, Cynosure accrues the minimum amount of the range. In cases where Cynosure believes that a reasonably possible loss exists, Cynosure discloses the facts and circumstances of the litigation, including an estimable range, if possible. In management’s opinion, Cynosure is not currently involved in any legal proceedings, which, individually or in the aggregate, could have a material effect on Cynosure’s financial statements. Cynosure believes that contingent losses associated with any current litigation were remote as of December 31, 2014 and at the time of the filing, and as such, Cynosure has not recorded or disclosed any material loss contingencies.
14. Summary Selected Quarterly Financial Data (Unaudited)
The following table sets forth certain unaudited consolidated quarterly statement of operations data for the eight quarters ended December 31, 2014. This information is unaudited, but in the opinion of management, it has been prepared on the same basis as the audited consolidated financial statements and all necessary adjustments, consisting only of normal recurring adjustments, have been included in the amounts stated below to state fairly the unaudited consolidated quarterly results of operations. The results of operations for any quarter are not necessarily indicative of the results of operations for any future period.
| Quarter Ended | ||||||||||||||||
| March 31, 2014 |
June 30, 2014 |
Sept. 30, 2014 |
Dec. 31, 2014 |
|||||||||||||
| (In thousands, except per share data) | ||||||||||||||||
| Revenues |
$ | 62,004 | $ | 72,573 | $ | 71,530 | $ | 86,262 | ||||||||
| Gross profit |
$ | 35,395 | $ | 40,693 | $ | 40,298 | $ | 48,852 | ||||||||
| Income from operations |
$ | 1,346 | $ | 6,398 | $ | 5,250 | $ | 8,266 | ||||||||
| Net income(1) |
$ | 689 | $ | 4,575 | $ | 3,074 | $ | 23,000 | ||||||||
| Basic net income per share(1) |
$ | 0.03 | $ | 0.21 | $ | 0.14 | $ | 1.06 | ||||||||
| Diluted net income per share(1) |
$ | 0.03 | $ | 0.20 | $ | 0.14 | $ | 1.05 | ||||||||
F-30
Table of Contents
| (1) | Net income and basic and diluted net income per share data for the quarter ended December 31, 2014 include an income tax benefit of $19.9 million resulting from the release of substantially all of the valuation allowance maintained against Cynosure’s net U.S. deferred tax asset. |
| Quarter Ended | ||||||||||||||||
| March 31, 2013 |
June 30, 2013 |
Sept. 30, 2013 |
Dec. 31, 2013 |
|||||||||||||
| (In thousands, except per share data) | ||||||||||||||||
| Revenues |
$ | 40,690 | $ | 50,091 | $ | 60,692 | $ | 74,537 | ||||||||
| Gross profit |
$ | 23,687 | $ | 27,787 | $ | 34,134 | $ | 44,672 | ||||||||
| Income (loss) from operations |
$ | 1,988 | $ | (14,639 | ) | $ | (1,426 | ) | $ | 8,250 | ||||||
| Net income (loss) |
$ | 1,239 | $ | (8,954 | ) | $ | (1,281 | ) | $ | 7,349 | ||||||
| Basic net income (loss) per share |
$ | 0.08 | $ | (0.54 | ) | $ | (0.06 | ) | $ | 0.33 | ||||||
| Diluted net income (loss) per share |
$ | 0.07 | $ | (0.54 | ) | $ | (0.06 | ) | $ | 0.33 | ||||||
F-31
Table of Contents
EXHIBIT INDEX
| Exhibit Number |
Description | |
| 2.1 | Amended and Restated Agreement and Plan of Merger, dated as of May 15, 2013, among the Company, Commander Acquisition, LLC and Palomar Medical Technologies, Inc. (Incorporated by reference to the exhibits to the Company’s Current Report on Form 8-K filed May 16, 2013) | |
| 2.2 | Asset Purchase Agreement, dated as of September 5, 2014, among the Company, Ellman International, Inc., Ellman Holdings, Inc., and Ellman Holding Corporation (Incorporated by reference to the exhibits to the Company’s Current Report on Form 8-K filed September 8, 2014) | |
| 3.1 | Restated Certificate of Incorporation of the Company (Incorporated by reference to the exhibits to the Company’s Registration Statement on Form S-1 filed August 11, 2005 (333-127463)) | |
| 3.2 | Amended and Restated Bylaws of the Company (Incorporated by reference to the exhibits to the Company’s Registration Statement on Form S-1 filed August 11, 2005 (333-127463)) | |
| 4.1 | Specimen certificate evidencing shares of Class A common stock (Incorporated by reference to the exhibits to Amendment No. 1 of the Company’s Registration Statement on Form S-1 filed November 3, 2005 (333-127463)) | |
| 10.1* | 2004 Stock Option Plan, as amended (Incorporated by reference to the exhibits to the Company’s Registration Statement on Form S-1 filed August 11, 2005 (333-127463)) | |
| 10.2* | Amended and Restated 2005 Stock Incentive Plan (Incorporated by reference to the exhibits to the Company’s Quarterly Report on Form 10-Q filed August 9, 2013) | |
| 10.3* | Employment Agreement, dated December 15, 2008, between the Company and Michael Davin (Incorporated by reference to the exhibits to the Company’s Current Report on Form 8-K filed December 19, 2008) | |
| 10.4* | First Amendment to Employment Agreement, dated December 20, 2010, between the Company and Michael Davin (Incorporated by reference to the exhibits to the Company’s Current Report on Form 8-K filed December 21, 2010) | |
| 10.5* | Employment Agreement, dated December 15, 2008, between the Company and Douglas Delaney (Incorporated by reference to the exhibits to the Company’s Current Report on Form 8-K filed December 19, 2008) | |
| 10.6† | Distribution Agreement, effective as of October 26, 2012, between the Company and El.En. S.p.A. (Incorporated by reference to the exhibits to the Company’s Annual Report on Form 10-K filed March 8, 2013) | |
| 10.7 | Lease, dated January 31, 2005, between Glenborough Fund V, Limited Partnership and the Company, as amended (Incorporated by reference to the exhibits to the Company’s Annual Report on Form 10-K filed March 7, 2012) | |
| 10.8 | Non-Exclusive Patent License, dated November 6, 2006, between Palomar Medical Technologies, Inc. and the Company (Incorporated by reference to the exhibits to the Company’s Current Report on Form 8-K filed November 7, 2006) | |
| 10.9* | Employment Agreement, dated December 15, 2008, between the Company and Timothy W. Baker (Incorporated by reference to the exhibits to the Company’s Current Report on Form 8-K filed December 19, 2008) | |
| 10.10* | Second Amendment to Employment Agreement, entered into as of July 20, 2011, by and between the Company and Michael R. Davin | |
| 10.11* | Third Amendment to Employment Agreement, entered into as of November 5, 2013, by and between the Company and Michael R. Davin (Incorporated by reference to the exhibits to the Company’s Quarterly Report on Form 10-Q filed November 12, 2013) | |
Table of Contents
| Exhibit Number |
Description | |
| 10.12* | First Amendment to Employment Agreement, entered into as of November 5, 2013, by and between the Company and Timothy W. Baker (Incorporated by reference to the exhibits to the Company’s Quarterly Report on Form 10-Q filed November 12, 2013) | |
| 10.13* | First Amendment to Employment Agreement, entered into as of November 7, 2013, by and between the Company and Douglas J. Delaney (Incorporated by reference to the exhibits to the Company’s Quarterly Report on Form 10-Q filed November 12, 2013) | |
| 10.14* | Employment Agreement, dated March 17, 2003, between the Company and Joseph P. Caruso (Incorporated by reference to the exhibits to the Company’s Current Report on Form 8-K filed March 18, 2013) | |
| 10.15 | Purchase and Sale Agreement, dated November 25, 2013, Palomar Medical Technologies, LLC and Network Drive Owner, LLC (Incorporated by reference to the exhibits to the Company’s Current Report on Form 8-K filed December 2, 2013) | |
| 10.16 | Fourth Amendment to the Lease, dated December 20, 2012, between the Company and Glenborough Westford Center, LLC | |
| 10.17 | Fifth Amendment to Lease, dated November 18, 2013, between the Company and Glenborough Westford Center, LLC (Incorporated by reference to the exhibits to the Company’s Current Report on Form 8-K filed November 22, 2013) | |
| 10.18 | Separation Agreement, effective September 6, 2013, between the Company and Palomar Medical Technologies, LLC and Joseph P. Caruso (Incorporated by reference to the exhibits to the Company’s Annual Report on Form 10-K filed March 17, 2014) | |
| 10.19* | Form of Nonstatutory Stock Option Agreement under 2005 Stock Incentive Plan (Incorporated by reference to Exhibit 10.1 to the Company’s Quarterly Report on Form 10-Q filed August 3, 2006) | |
| 10.20* | Form of Incentive Stock Option Agreement under 2005 Stock Incentive Plan (Incorporated by reference to Exhibit 10.2 to the Company’s Quarterly Report on Form 10-Q filed August 3, 2006) | |
| 10.21* | Form of Restricted Stock Unit Agreement under 2005 Stock Incentive Plan | |
| 21.1 | Subsidiaries of the Company | |
| 23.1 | Consent of Ernst & Young LLP | |
| 31.1 | Certification of the Principal Executive Officer | |
| 31.2 | Certification of the Principal Financial Officer | |
| 32.1 | Certification of the Principal Executive Officer Pursuant to Section 906 of the Sarbanes-Oxley Act of 2002 | |
| 32.2 | Certification of the Principal Financial Officer Pursuant to Section 906 of the Sarbanes-Oxley Act of 2002 | |
| 101 | The following materials from the Cynosure, Inc. Annual Report on Form 10-K for the year ended December 30, 2014, formatted in XBRL (eXtensible Business Reporting Language): (i) Consolidated Balance Sheets at December 31, 2014 and December 31, 2013, (ii) Consolidated Statements of Operations for the years ended December 31, 2014, 2013 and 2012, (iii) Consolidated Statements of Comprehensive Income (Loss) for the years ended December 31, 2014, 2013 and 2012, (iv) Consolidated Statements of Stockholders’ Equity for the years ended December 31, 2014, 2013 and 2012, (v) Consolidated Statements of Cash Flows for the years ended December 31, 2014, 2013 and 2012, and (vi) Notes to Consolidated Financial Statements. | |
| * | Management contract or compensation plan or arrangement required to be filed as an exhibit pursuant to Item 15(b) of Form 10-K. |
| † | Confidential treatment requested as to certain portions, which portions have been omitted and filed separately with the Securities and Exchange Commission. |